Embed Size (px)
Citation preview
ELSEVIER Journal of Wind Engineering
and Industrial Aerodynamics 53 (1994) 315-330
~ O F
Active simulation of time histories of strong wind gust in a wind tunnel
Hirosh i K o b a y a s h i a, Akih ide H a t a n a k a b'*, T o s h i o U e d a c
i Department of Civil Engineering, Ritsumeikan University, Noiityo 1916, Kasatsu, Shiga 525, Japan
b Technology Headquarters, Nichizo Tech Inc., Sakurajima 1-2-23, Konohanaku, Osaka 554, Japan c Steel Structures & Construction Machinery Headquarters, Hitachi Zosen Corp., Osaka 554, Japan
Received l0 January 1993; accepted in revised form 26 January 1994
Abstract
This paper describes an active simulating procedure of the time history of wind velocity in a wind tunnel. The simulated time histories of the wind velocity by this technique fitted well the target ones. The wind gust observed at the site was simulated. The step changing wind gusts which wind velocity changes in a short time were generated. The simulated time histories of wind velocity were repeatedly reproduced. The advantages of active simulation are summarized.
Notation
f Iu, Iw
Lu, Lw
s(f) u(t)
r
u(t), w(t)
Subscript u, w X, y, Z
frequency (Hz) turbulence intensity of horizontal and vertical velocity, respectively integral scale of horizontal and vertical velocity, respectively, calculated from the auto correlation coefficient one-sided power spectral density of wind velocity ( = 0 + u(t)) time histories of horizontal wind velocity mean wind velocity time series of horizontal and vertical fluctuating velocity
horizontal and vertical component of wind velocity, respectively orthogonal coordinates, the longitudinal axis x lies in the windward direction, y and z are the lateral and vertical axes
* Corresponding author.
0167-6105/94/$07.00 © 1994 Elsevier Science B.V. All rights reserved SSDI 0167-6105(94)00003-V
316 H. Kobayashi et al./J. Wind Eng. Ind. Aerodyn. 53 (1994) 315 330
1. Introduction
Wind tunnel tests of large flexible bridges are usually carried out in a smooth flow. However, a prototype bridge is exposed to a turbulent wind at the site. Turbulent wind causes a gust response and also affects self-excited aerodynamic responses which are seen in a smooth flow. In order to examine the safety and the serviceability of large flexible bridges more rationally, wind tunnel tests should be carried out in a turbulent flow similar to natural wind. For that reason the turbulent flow should be accurately simulated in a wind tunnel.
The wind tunnel generation of wind gusts has been traditionally carried out by passive techniques such as boundary layer and grid turbulence. Boundary layer turbu- lence is produced by roughness blocks and spires, which are placed at the upstream of the test section. Wind velocity profile and turbulence, which are observed in a natural wind, are simulated by this technique. Such flow is mainly used in three-dimensional wind tunnel tests [1]. However, simulation of a scaled boundary layer flow, similar to that of the natural wind, requires a large wind tunnel with a long test section. In a small wind tunnel with a short test section, we typically use a two-dimensional model and grid turbulence [2]. However, typical grid turbulence has a too small length scale, compared with the scale of a typical two-dimensional model. Active generation techniques will overcome the disadvantage of passive techniques [3-6]. The results show that the active techniques can simulate large scale turbulence in a short test section and that the turbulence parameters can be arbitrarily controlled.
Aerodynamic responses of a prototype at the site are suitably estimated through a taut-strip model [7] or a full model [8] test in a scaled boundary layer turbulence.
A prediction of three-dimensional responses of the prototype at the site through only a two-dimensional model test is an alternative method. A two-dimensional model test (sectional model test) is very easy and convenient in comparison with a full model test. Aerodynamic force coefficients, aerodynamic admittance [9] and flutter derivatives [10] of a bridge deck section are usually measured through two-dimen- sional model tests. Various analytical procedures for predicting aerodynamic re- sponses of a prototype at the site by using aerodynamic forces, which are measured through a two-dimensional model test, are proposed [11,12].
In view of the above, the authors have tried to simulate a wind gust in a two- dimensional wind tunnel by using an active gust generator, consisting of arrays of plates and airfoils. This device provided a large scale turbulence compared with passive techniques. The measured spectra of the wind gust fitted well the given spectra [ 13,14]. Also, turbulent properties of the simulated wind velocity were nearly the same within the test section [15].
This paper describes an active simulation of given time histories of wind velocity and discusses the results of simulated wind velocities.
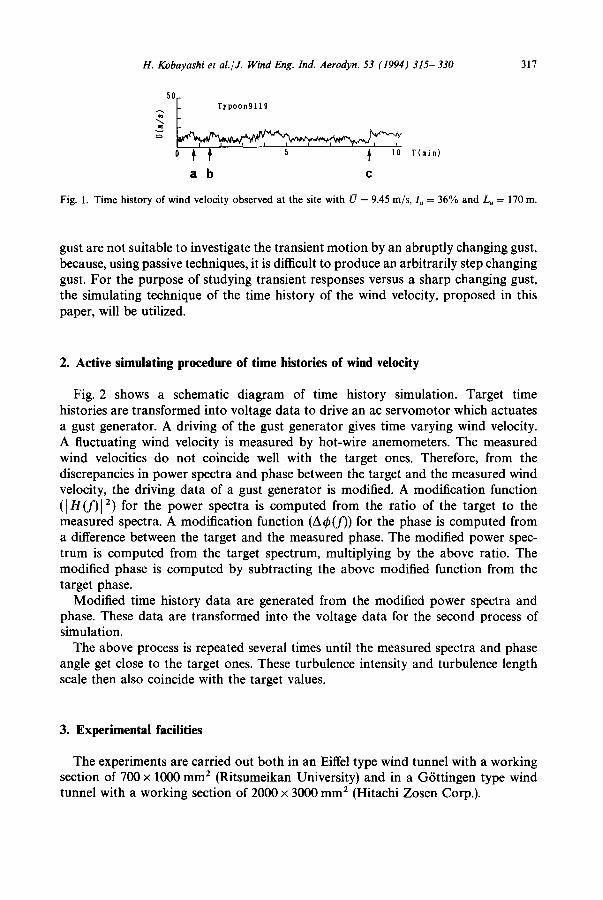
Gust responses of a prototype as well as the wind velocity at the site are usually treated as a stationary random process. However sharp changes of wind velocity in a short time are frequently observed (see Figs. la- lc) . The sharp changing gust causes a transient aerodynamic force to a bridge model [16]. The force cannot be well described by a quasi-steady, statistical method. Passive generation techniques of wind
H. Kobayashi et al./J. Wind Eng. Ind. Aerodyn. 53 (1994) 315-330 317
5O I rypoon911S
a b c
Fig. 1. Time history of wind velocity observed at the site with U = 9.45 m/s, Iu = 36% and Lu = 170 m.
gust are not suitable to investigate the transient motion by an abruptly changing gust, because, using passive techniques, it is difficult to produce an arbitrarily step changing gust. For the purpose of studying transient responses versus a sharp changing gust, the simulating technique of the time history of the wind velocity, proposed in this paper, will be utilized.
2. Active simulating procedure of time histories of wind velocity
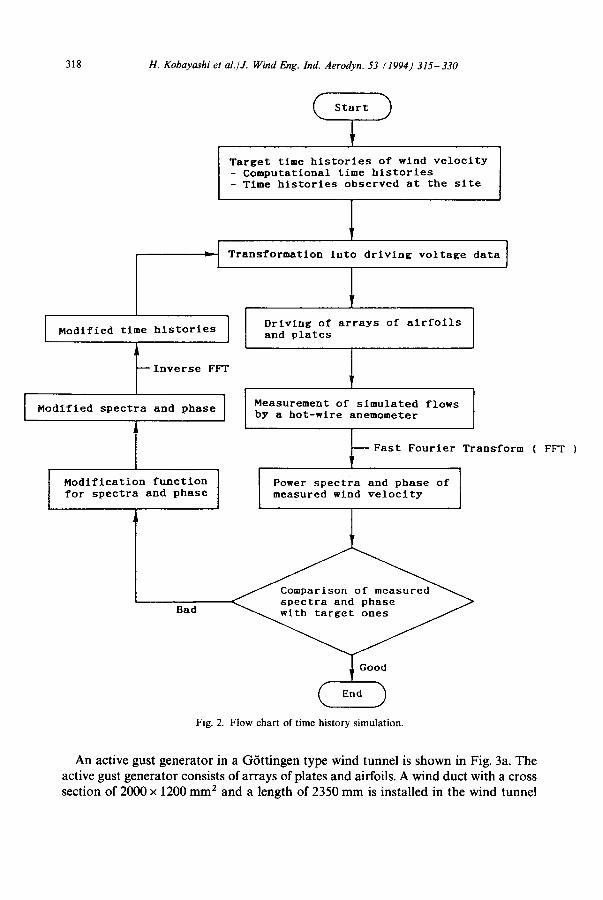
Fig. 2 shows a schematic diagram of time history simulation. Target time histories are transformed into voltage data to drive an ac servomotor which actuates a gust generator. A driving of the gust generator gives time varying wind velocity. A fluctuating wind velocity is measured by hot-wire anemometers. The measured wind velocities do not coincide well with the target ones. Therefore, from the discrepancies in power spectra and phase between the target and the measured wind velocity, the driving data of a gust generator is modified. A modification function ( [ /~1 z) for the power spectra is computed from the ratio of the target to the measured spectra. A modification function (A~b(f)) for the phase is computed from a difference between the target and the measured phase. The modified power spec- trum is computed from the target spectrum, multiplying by the above ratio. The modified phase is computed by subtracting the above modified function from the target phase.
Modified time history data are generated from the modified power spectra and phase. These data are transformed into the voltage data for the second process of simulation.
The above process is repeated several times until the measured spectra and phase angle get close to the target ones. These turbulence intensity and turbulence length scale then also coincide with the target values.
3. Experimental facilities
The experiments are carried out both in an Eiffel type wind tunnel with a working section of 700 x 1000 mm 2 (Ritsumeikan University) and in a Grttingen type wind tunnel with a working section of 2000 x 3000 mm 2 (Hitachi Zosen Corp.).
318 H. Kobayashi et al./J. Wind Eng. Ind. Aerodyn. 53 (1994) 315-330
Transformation into driving voltage data ]
Modi f i ed t ime histories
~ I n v e r s e FFT
Modi f i ed s p e c t r a and phase I
I M o d i f i c a t i o n f u n c t i o n f o r s p e c t r a and phase
B a d
S t a r t
Target time histories of wind velocity - Computational time histories - Time histories observed at the site
I
Driving of arrays of airfoils and plates
I easurement of simulated flows by a hot-wlre anemometer
~Fast Fourier Transform ( FFT )
Power spectra and phase of measured wind velocity
Fig. 2. Flow chart of time history simulation.
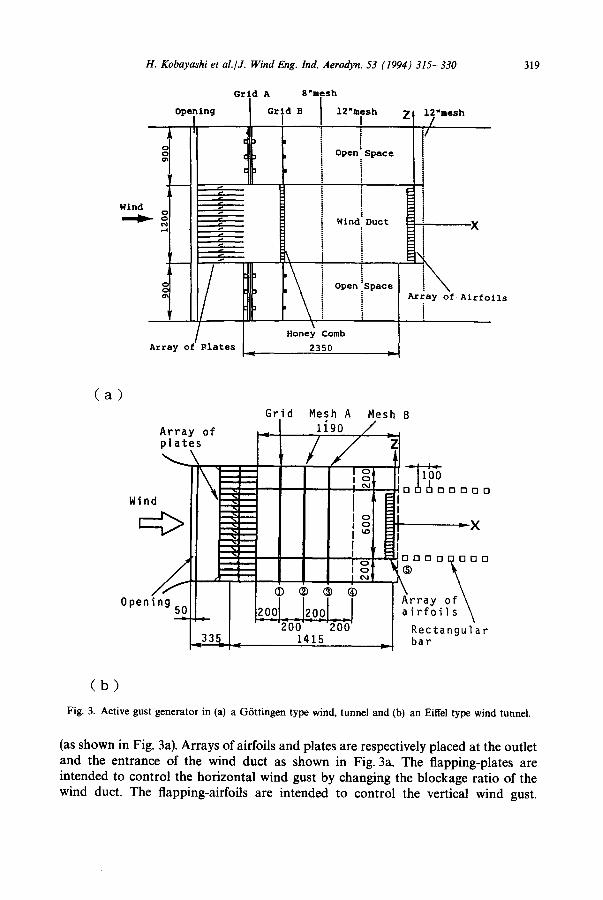
An active gust generator in a G6ttingen type wind tunnel is shown in Fig. 3a. The active gust generator consists of arrays of plates and airfoils. A wind duct with a cross section of 2000 x 1200 mm 2 and a length of 2350 mm is installed in the wind tunnel
H. Kobayashi et al./J. Wind Eng. Ind. Aerodyn. 53 (1994) 315-330 319
w i n d
O p e n i n g
II i
¢. o o ,-4 ~
Array of Plates
Grid A Grid B
I 3 | 2 | c=
8"mash 12"mesh
' i i , i Open' Space
i i i i "
l i Wind Duct i !
, i Open " S p a c e
! i
H o n e y Comb 2350
Z 12"mesh ¢ I ] i
7
t t
\ Array of Airfoils
i i
( a )
Array of p lates
Op i g~33E
i #
Grid Mesh A ,~ l igo /
z00] zoo] . =--,~o~.;1~.~o o]
Mesh B
! ~ O O G G
" X
i OOO~OO
Array of \ a i r f o i l s \
Rectangular bar
( b )
Fig. 3. Active gust generator in (a) a G6ttingen type wind, tunnel and (b) an Eiffel type wind tunnel.
(as shown in Fig. 3a). Arrays of airfoils and plates are respectively placed at the outlet and the entrance of the wind duct as shown in Fig. 3a. The flapping-plates are intended to control the horizontal wind gust by changing the blockage ratio of the wind duct. The flapping-airfoils are intended to control the vertical wind gust.
320 H. Kobayashi et al./J. Wind Eng. Ind. Aerodyn. 53 (1994) 315- 330
To reduce the turbulence by the vortices separated from the plates, honey comb (cell size: 19 mm) and meshes, which have 8 and 12 inch space dimension, are installed between arrays of airfoils and plates. These meshes have circular cross section.
Natural wind has a phase lag of wind velocity between two along-wind points [-17]. The blockage in a closed wind tunnel test section causes simultaneous changes of wind speed at all the locations, thus the phase lag of wind velocity is not obtained in a closed test section. To produce a phase lag in the wind tunnel, a fluctuating flow, generated by the driving of plates, is ejected as an open jet from the outlet of the wind duct. Open spaces above and below the wind duct are provided in order to improve the turbulence properties.
Grids A, B and meshes are also installed in the open spaces. Grid A is for the blockage ratio in the open spaces above and below the wind duct. Grid B and the meshes are intended to reduce the turbulence by grid A.
Fig. 3b shows an active gust generator in an Eiffel type wind tunnel. It is similar to the gust generator shown in Fig. 3a.
Arrays of airfoils and plates are driven by ac servomotors controlled by a micro- computer. The fluctuating vertical and horizontal components of the flow are meas- ured by hot-wire anemometers.
4. Experimental results
4.1. Simulation of time histories of wind velocity
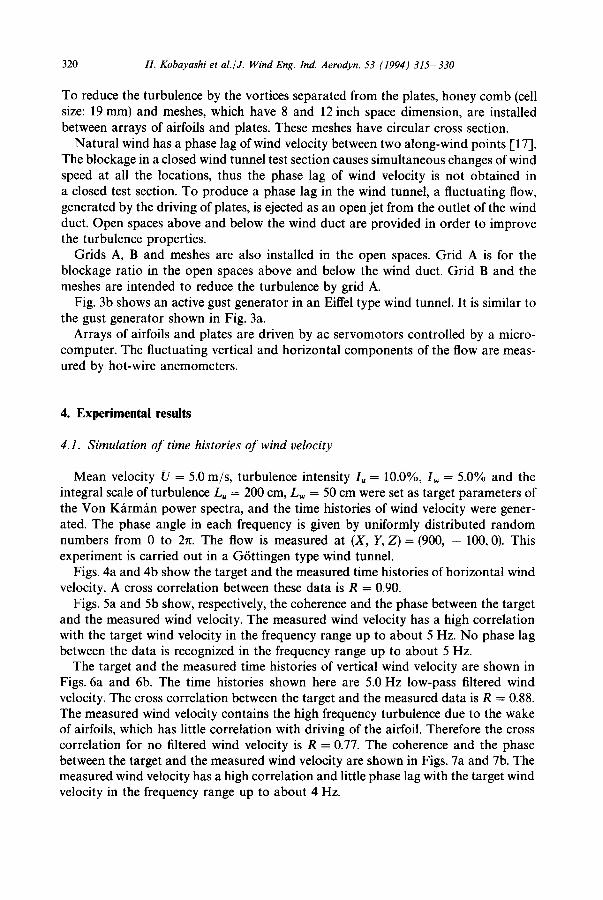
Mean velocity U = 5.0 m/s, turbulence intensity Iu = 10.0%, lw = 5.0% and the integral scale of turbulence Lu = 200 cm, Lw = 50 cm were set as target parameters of the Von Kfirm~in power spectra, and the time histories of wind velocity were gener- ated. The phase angle in each frequency is given by uniformly distributed random numbers from 0 to 2n. The flow is measured at (X, Y, Z ) = (900, - 100, 0). This experiment is carried out in a G6ttingen type wind tunnel.
Figs. 4a and 4b show the target and the measured time histories of horizontal wind velocity. A cross correlation between these data is R = 0.90.
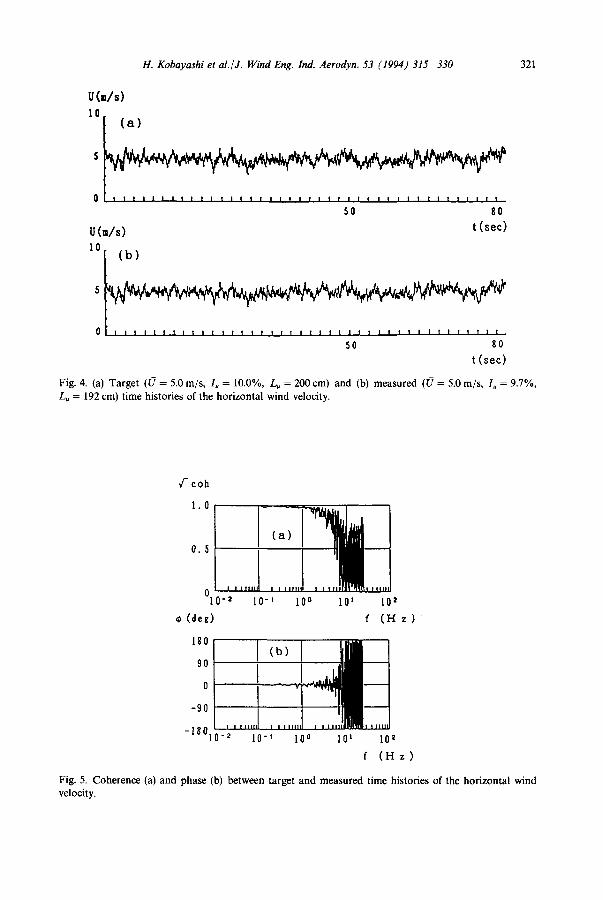
Figs. 5a and 5b show, respectively, the coherence and the phase between the target and the measured wind velocity. The measured wind velocity has a high correlation with the target wind velocity in the frequency range up to about 5 Hz. No phase lag between the data is recognized in the frequency range up to about 5 Hz.
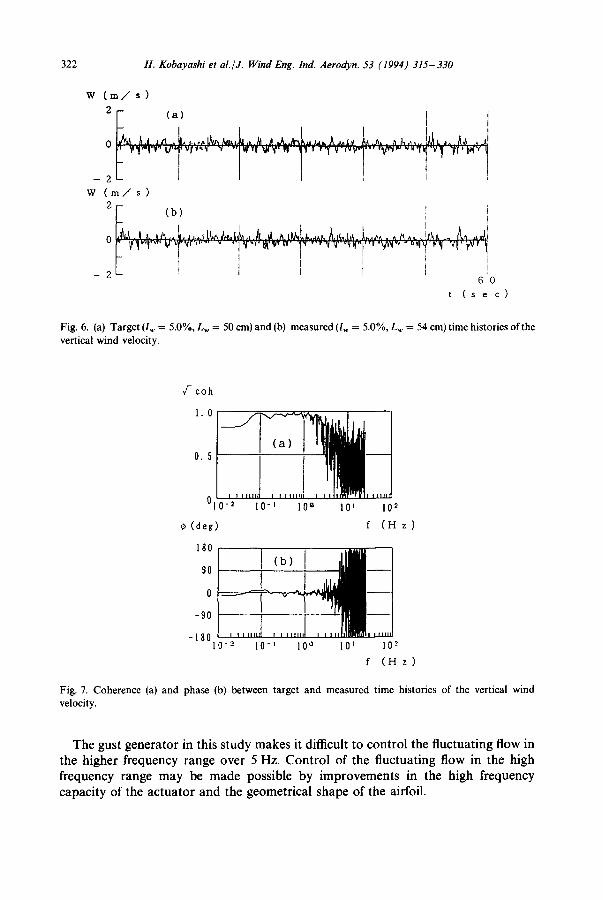
The target and the measured time histories of vertical wind velocity are shown in Figs. 6a and 6b. The time histories shown here are 5.0 Hz low-pass filtered wind velocity. The cross correlation between the target and the measured data is R = 0.88. The measured wind velocity contains the high frequency turbulence due to the wake of airfoils, which has little correlation with driving of the airfoil. Therefore the cross correlation for no filtered wind velocity is R = 0.77. The coherence and the phase between the target and the measured wind velocity are shown in Figs. 7a and 7b. The measured wind velocity has a high correlation and little phase lag with the target wind velocity in the frequency range up to about 4 Hz.
H. Kobayashi et al./J. Wind Eng. Ind. Aerodyn. 53 (1994) 315-330 321
u (m/s) lO
$
0 50 80
U (m/s) t (sec)
10[(b)
SO 80
t (sec)
Fig. 4. (a) Target ([7 = 5.0 m/s, I, = I0.0%, Lu = 200 cm) and (b) measurcd (U = 5.0 m/s, I, = 9.7%, Lu = 192 cm) timc histories of the horizontal wind velocity.
~-coh
1 .0
0 .5
I I I l f l l l l I
010-z I0" I0 ° 10 t I0
(deg)
1$0
90
0
-80
- l ~ 0
f ( H z )
I 0-2 10-1 10 o 101 10 ~
f (Hz)
Fig. 5. Coherence (a) and phase (b) between target and measured time histories of the horizontal wind velocity.
322 H. Kobayashi et al./J. Wind Eng. lnd. Aerodyn. 53 (1994) 315-330
w ( m / s )
- z i I I W ( m / s )
2 1 (b) i I I i
o ~I _~ ,.. , , . , , . . ++, ,,.,i,.,,,~,,.I,i,,, , .h .,£ .^.t~L+++.,.,,, ~,,.,,.+t,~..~,.,,,,,. ,, ^ , , , _ . !J+,, . . . . A . . . . . . ~i I p'j"+v'" v-+..,,r., . . . . . . . i ,+,,. ~.,+,, o,. I+ ,.,++ '+""+++"l'" "¢"+" -,,,vw'~,"+ ",',+ , 7,+ ,
- 2 I I ~ 6 0
t ( s e e )
Fig. 6. (a) Target (lw = 5.0%, Lw = 50 cm) and (b) measured (lw = 5.0%, L+ = 54 cm) time histories of the vertical wind velocity.
~ - c o h
0" I ~ 1
O (deg ) f ( H z )
180
-90
I -180 10-~' lO-I lO o 101 10 -~
f ( H z )
Fig. 7. Coherence (a) and phase (b) between target and measured time histories of the vertical wind velocity.
The gust generator in this study makes it difficult to control the fluctuating flow in the higher frequency range over 5 Hz. Control of the fluctuating flow in the high frequency range may be made possible by improvements in the high frequency capacity of the actuator and the geometrical shape of the airfoil.
H. Kobayashi et al./J. Wind Eng. Ind. Aerodyn. 53 (1994) 315-330 323
1.0
o " 0.8
0.6
0
,--,--,--,--,--,--,--,--,--,--,--,
--O-- Horizontal Comp.
--~-- Vertical Comp.
Vertical Comp.
(5Hz Low-Pass Filter)
1 1 1 1 1 f l l l l l l J $ I0
Trial Number
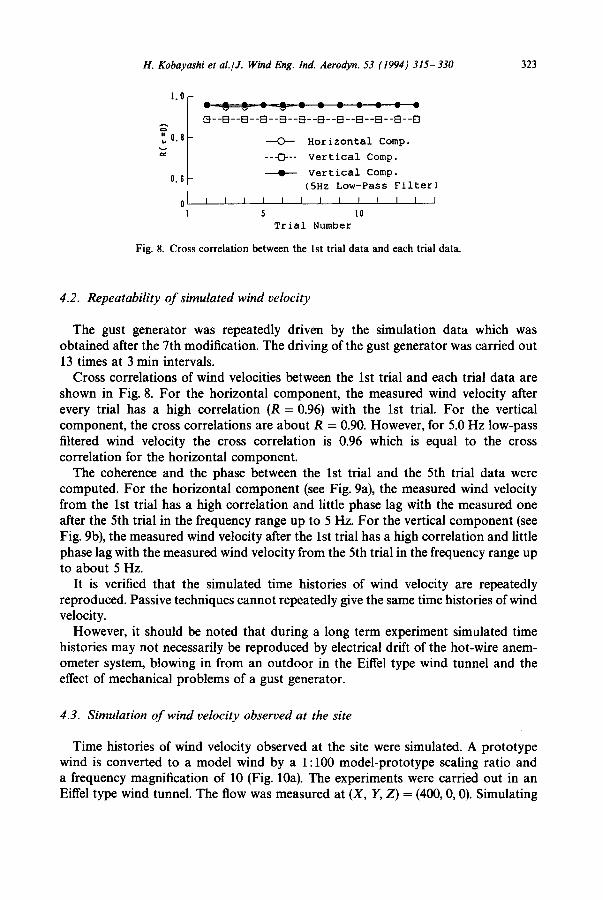
Fig. 8. Cross correlation between the 1st trial data and each trial data.
4.2. Repeatability of simulated wind velocity
The gust generator was repeatedly driven by the simulation data which was obtained after the 7th modification. The driving of the gust generator was carried out 13 times at 3 min intervals.
Cross correlations of wind velocities between the 1st trial and each trial data are shown in Fig. 8. For the horizontal component, the measured wind velocity after every trial has a high correlation (R = 0.96) with the 1st trial. For the vertical component, the cross correlations are about R = 0.90. However, for 5.0 Hz low-pass filtered wind velocity the cross correlation is 0.96 which is equal to the cross correlation for the horizontal component.
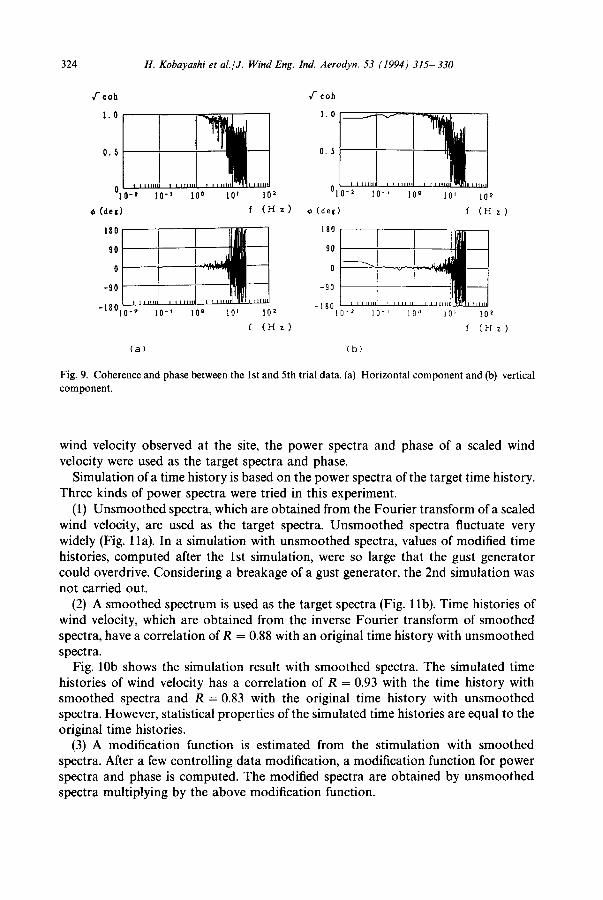
The coherence and the phase between the 1st trial and the 5th trial data were computed. For the horizontal component (see Fig. 9a), the measured wind velocity from the 1st trial has a high correlation and little phase lag with the measured one after the 5th trial in the frequency range up to 5 Hz. For the vertical component (see Fig. 9b), the measured wind velocity after the 1st trial has a high correlation and little phase lag with the measured wind velocity from the 5th trial in the frequency range up to about 5 Hz.
It is verified that the simulated time histories of wind velocity are repeatedly reproduced. Passive techniques cannot repeatedly give the same time histories of wind velocity.
However, it should be noted that during a long term experiment simulated time histories may not necessarily be reproduced by electrical drift of the hot-wire anem- ometer system, blowing in from an outdoor in the Eiffel type wind tunnel and the effect of mechanical problems of a gust generator.
4.3. Simulation of wind velocity observed at the site
Time histories of wind velocity observed at the site were simulated. A prototype wind is converted to a model wind by a 1:100 model-prototype scaling ratio and a frequency magnification of 10 (Fig. 10a). The experiments were carried out in an Eiffel type wind tunnel. The flow was measured at (X, Y, Z) = (400, 0, 0). Simulating
324 H. Kobayashi et al./J. Wind Eng. Ind. Aerodyn. 53 (1994) 315-330
• /= ¢oh
' . . . . . . . . . . . . . . .
1 10 "~ 10 ° l0 t l0 s
¢,(det) f (H z)
:] , -90 ,,,,]
-1 g01[0-121 10 a 10 ~ 10 ~
f ( H z )
v f" cob
1 . 0 .~.- - .~--
0 . 5
I I I l l l l l f I I I I I I I I I t i l l / I i l t l l
0l 0--' 10-~ I0O 10 ~ l0 t
(deg) f ( H z )
,,o I i ll i I
° ' ; 1 1 1 .... -90
- 1 8 0 , ~ m . I l
10"-' 10 -~ 10 ° 10 ~ 10 ~
f ( H z )
( a ) ( b )
Fig. 9. Coherence and phase between the 1st and 5th trial data. (a) Horizontal component and (b) vertical component.
wind velocity observed at the site, the power spectra and phase of a scaled wind velocity were used as the target spectra and phase.
Simulation of a time history is based on the power spectra of the target time history. Three kinds of power spectra were tried in this experiment.
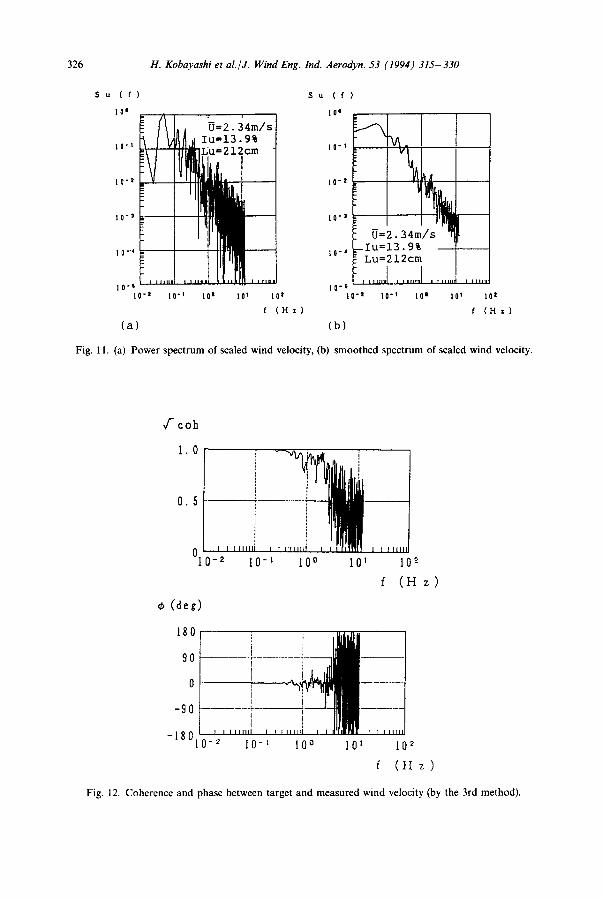
(1) Unsmoothed spectra, which are obtained from the Fourier transform of a scaled wind velocity, are used as the target spectra. Unsmoothed spectra fluctuate very widely (Fig. 1 la). In a simulation with unsmoothed spectra, values of modified time histories, computed after the 1st simulation, were so large that the gust generator could overdrive. Considering a breakage of a gust generator, the 2nd simulation was not carried out.
(2) A smoothed spectrum is used as the target spectra (Fig. 11b). Time histories of wind velocity, which are obtained from the inverse Fourier transform of smoothed spectra, have a correlation of R = 0.88 with an original time history with unsmoothed spectra.
Fig. 10b shows the simulation result with smoothed spectra. The simulated time histories of wind velocity has a correlation of R = 0.93 with the time history with smoothed spectra and R- -0 .83 with the original time history with unsmoothed spectra. However, statistical properties of the simulated time histories are equal to the original time histories.
(3) A modification function is estimated from the stimulation with smoothed spectra. After a few controlling data modification, a modification function for power spectra and phase is computed. The modified spectra are obtained by unsmoothed spectra multiplying by the above modification function.
H. Kobayashi et al./J. Wind Eng. Ind. Aerodyn. 53 (1994) 315-330 325
v
( a )
i !
E v
( b )
t t
51 c°)! i i t
o ! . l i !
80 T ( s e c )
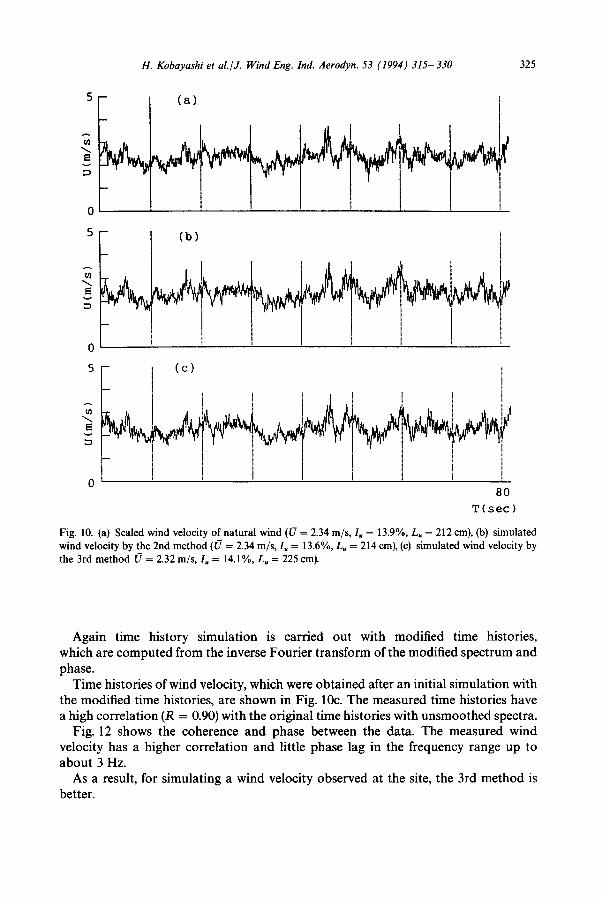
Fig. 10. (a) Scaled wind velocity of natural wind ([7 = 2.34 m/s, I, = 13.9%, Lu = 212 cm), (b) simulated wind velocity by the 2nd method ([7 = 2.34 m/s, lu = 13.6%, Lu = 214 cm), (c) simulated wind velocity by the 3rd method [7 = 2.32 m/s, I~ = 14.1%, L, = 225 cm).
Again t ime h is tory s imula t ion is carr ied out with modif ied t ime histories, which are c o m p u t e d f rom the inverse Fou r i e r t r ans form of the modi f ied spec t rum and phase.
T ime his tor ies of wind velocity, which were ob ta ined after an init ial s imula t ion with the modi f ied t ime histories, are shown in Fig. 10c. The measured t ime histories have a high cor re la t ion (R = 0.90) with the or ig inal t ime histories with u n s m o o t h e d spectra.
Fig. 12 shows the coherence and phase between the data . The measu red wind veloci ty has a h igher cor re la t ion and litt le phase lag in the f requency range up to a b o u t 3 Hz.
As a result, for s imula t ing a wind veloci ty observed at the site, the 3rd m e t h o d is better .
326 H. Kobayashi et al./J. Wind Eng. lnd. Aerodyn. 53 (1994) 315-330
S u C r ) S u ( f )
IO' IO I
~,, ~:~.~4m/~ fl i~.ll Iu:13.9% NI]LIu n 2 = Vltl[iit,l,.
II1"~ ....... , ........ , . . . . . . . . . .
IO*i 10 | 101 10 i
f (Hz)
lO-I
l O - I
1 0 - 3
I 0 * q
1 0 - 1
IO-i
iO-z
l O - S
% ,
f I I l l l l
l O * i i O - S 1 0 - 2 l O - I 10 2
I U=2.3 4in[/sl'[l!
- Iu=13.9% Lu=212cm
........ I ........ 1 .........
lO*t 10 a 101
(a) (b) f (Hz)
Fig. 11. (a) Power spectrum of scaled wind velocity, (b) smoothed spectrum of scaled wind velocity.
f ' c o h
1 .0
O . 5 - -
(deg)
f I I f l l l r l
[1-2 I I II11111 I
10 - I 10 ° 101 1 ~
f ( H z )
180
90
0
-00
-180
.. . . . - x ~ l ~
0 - 2 I0-1 10 0 l0 t l0 s
f ( H z )
Fig. 12. Coherence and phase between target and measured wind velocity (by the 3rd method).
H. Kobayashi et al./J. Wind Eng. Ind. Aerodyn. 53 (1994) 315- 330 327
O=3"96m/s'lu=l'9~
o ~ i
2
I I I "-1 . . . . . . l I t 2 3 1 2 3
t ( s e e } t (see)
(a) (b)
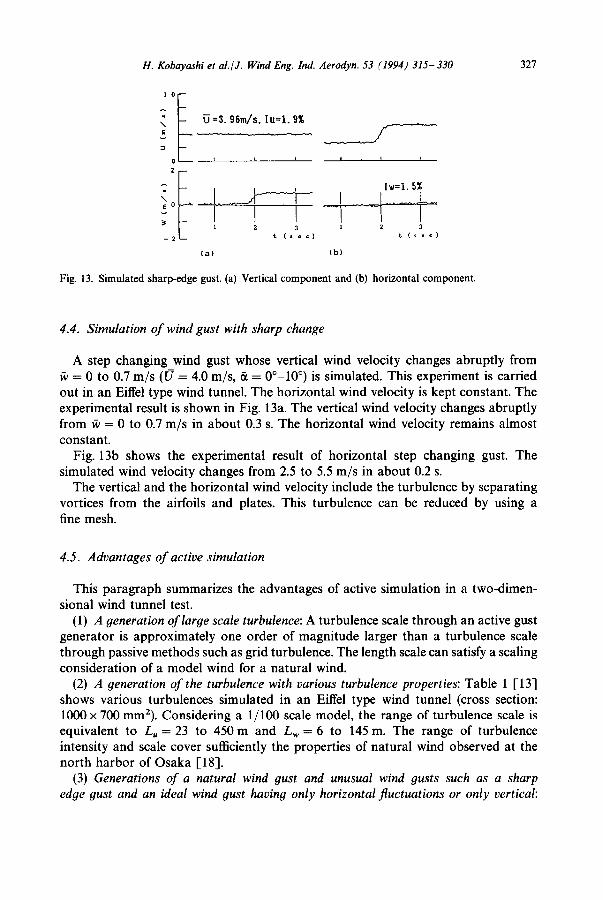
Fig. 13. Simulated sharp-edge gust. (a) Vertical component and (b) horizontal component.
4.4. Simulation o f wind gust with sharp change
A step changing wind gust whose vertical wind velocity changes abruptly from ¢v = 0 to 0.7 m/s (t.7 = 4.0 m/s, ~ = 0°-10 °) is simulated. This experiment is carried out in an Eiffel type wind tunnel. The horizontal wind velocity is kept constant. The experimental result is shown in Fig. 13a. The vertical wind velocity changes abruptly from ~ = 0 to 0.7 m/s in about 0.3 s. The horizontal wind velocity remains almost constant.
Fig. 13b shows the experimental result of horizontal step changing gust. The simulated wind velocity changes from 2.5 to 5.5 m/s in about 0.2 s.
The vertical and the horizontal wind velocity include the turbulence by separating vortices from the airfoils and plates. This turbulence can be reduced by using a fine mesh.
4.5. Advantages of active simulation
This paragraph summarizes the advantages of active simulation in a two-dimen- sional wind tunnel test.
(1) A generation of large scale turbulence: A turbulence scale through an active gust generator is approximately one order of magnitude larger than a turbulence scale through passive methods such as grid turbulence. The length scale can satisfy a scaling consideration of a model wind for a natural wind.
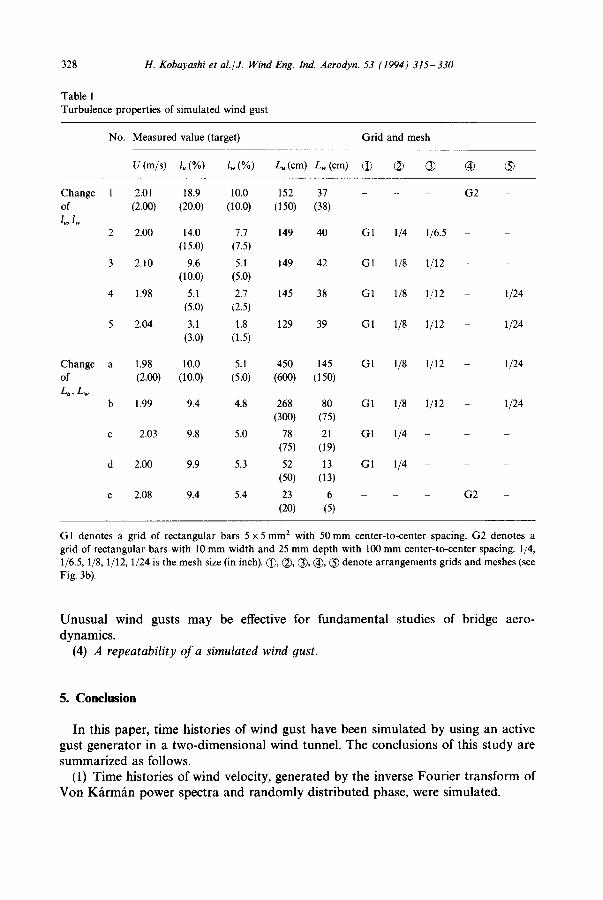
(2) A generation of the turbulence with various turbulence properties: Table 1 [13] shows various turbulences simulated in an Eiffel type wind tunnel (cross section: 1000 x 700 mm2). Considering a 1/100 scale model, the range of turbulence scale is equivalent to L, = 23 to 450 m and Lw = 6 to 145 m. The range of turbulence intensity and scale cover sufficiently the properties of natural wind observed at the north harbor of Osaka [18].
(3) Generations of a natural wind gust and unusual wind gusts such as a sharp edge gust and an ideal wind gust having only horizontal fluctuations or only vertical:
328 H. Kobayashi et al./J. Wind Eng. Ind. Aerodyn. 53 (1994) 315-330
Table 1 Turbulence properties of simulated wind gust
No. Measured value (target) Grid and mesh
U (m/s) l,~ (%) lw (%) L. (cm) Lw (cm) (i) (~) Q) ® ®
Change 1 2.01 18.9 10.0 152 37 - - of (2.00) (20.0) (10.0) (150) (38) /u, lw
2 2.00 14.0 7.7 149 40 G1 1/4 1/6.5 (15.0) (7.5)
3 2.10 9.6 5.1 149 42 G1 1/8 1/12 (10.0) (5.0)
4 1.98 5.1 2.7 145 38 G1 1/8 1/12 (5.0) (2.5)
5 2.04 3.1 1.8 129 39 GI 1/8 1/12 (3.0) (1.5)
Change a 1.98 10.0 5.1 450 145 G1 1/8 1/12 of (2.00) (10.0) (5.0) (600) (150) Lu, Lw
b 1.99 9.4 4.8 268 80 GI 1/8 1/12 (300) (75)
c 2.03 9.8 5.0 78 21 G1 1/4 (75) (19)
d 2.00 9.9 5.3 52 13 G1 1/4 - (50) (13)
e 2.08 9.4 5.4 23 6 - - - (20) (5)
G2
G2
1/24
1/24
1/24
1/24
G1 denotes a grid of rectangular bars 5 x 5 mm 2 with 50 mm center-to-center spacing. G2 denotes a grid of rectangular bars with 10 mm width and 25 mm depth with 100 mm center-to-center spacing. 1/4, 1/6.5, 1/8, 1/12, 1/24 is the mesh size (in inch). (i), (~), O, @, (~) denote arrangements grids and meshes (see Fig. 3b).
U n u s u a l w ind gusts m a y be effective for f u n d a m e n t a l
dynamics .
(4) A repeatability of a simulated wind 9ust.
s tudies o f b r idge ae ro -
5. Conc lus ion
In this paper , t ime h i s to r ies o f w ind gus t h a v e been s imu la t ed by us ing an ac t ive
gus t g e n e r a t o r in a t w o - d i m e n s i o n a l w i n d tunnel . T h e conc lu s ions o f this s tudy are
s u m m a r i z e d as follows.
(1) T i m e h is tor ies o f w ind veloci ty , g e n e r a t e d by the inverse F o u r i e r t r a n s f o r m of
V o n Kf i rmf in p o w e r spec t ra a n d r a n d o m l y d i s t r i bu t ed phase , were s imula ted .
H. Kobayashi et al./J. Wind Eng. Ind. Aerodyn. 53 (1994) 315- 330 329
(2) A repeatably simulated wind velocity was confirmed. (3) The wind velocity observed at the site could be simulated except for a very high
frequency component. (4) A sharp changing gust, whose wind velocity changes abruptly in a short time,
was simulated. (5) The gust generator used in this study was difficult to control for the fluctuating
flows in the high frequency range. A control of a fluctuating flow in the higher frequency range may be possible by improvements in the high frequency capacity of the actuator and the geometrical shape of the airfoil.
(6) Advantages of active simulation in a two-dimensional wind tunnel test were summarized.
References
[1] R.L. Wardlaw, H. Tanaka and H. Utsunomiya, Wind tunnel experiments on the effects of turbulence on the aerodynamic behavior of bridge road decks, in: Proc. 6th Int. Conf. on Wind Engineering, Australia, March 1983.
[2] W.H. Lin, Forced and self-excited responses of bluff structure in a turbulent wind, Doctoral Dissertation, Princeton University, December 1976, Ch. 5.
[3] B. Bienkiewicz, J.E. Cermak and J.A. Peterka, A new technique of modeling atmospheric turbulence for wind-tunnel tests of bridge models, in: Proc. 4th US National Conf. on Wind Engineering Research, University of Washington, Seattle, 1981, pp. 113-116.
[4] B. Bienkiewicz, J.E. Cermak, J.A. Peterka and R.H. Scanlan, Active modeling of large-scale turbu- lence, in: Proc. 6th Int. Conf. on Wind Engineering, Australia, March 1983.
[5] S. Saito et al., Study on a generating procedure of fluctuating flows (No. 1 random fluctuating flow), in: Proc. 38th Annual Conf. of the Japan Society of Civil Engineers, 1983 [in Japanese].
[6] K.R. Cooper, An active turbulence generator for the wind tunnel simulation of the large-scale turbulence required for section-model bridge testing, in: Canada-Japan Workshop on Bridge aerody- namics, Ottawa, 1989.
[7] H. Tanaka and A.G. Davenprot, Wind-induced response of Golden Gate Bridge, in: Proc. ASCE, Vol. 109, No. EM1, 1983.
[8] Y. Fujino, M. Iwamoto, M. Ito and Y. Hikami, Wind tunnel experiments using 3D models and response prediction for a long-span bridge, in: Proc. 8th Int. Conf. on Wind Engineering, J. Wind Eng. Ind. Aerodyn. 42 (1992) 1333.
[9] J. Xie, M.G. Savage and H. Tanaka, Identification of aerodynamic admittance based on sectional model tests, in: Proc. Canada-Japan Workshop on Bridge Aerodynamics (1989) pp. 203-215.
[10] R.H. Scanlan and J.J. Tomko, Airfoil and bridge deck flutter derivatives, in: Proc. ASCE, Vol. 97, No. EM6 (1971) pp. 1717-1737.
[11] A.G. Davenport, Buffeting of a suspension bridge by strong winds, in: Proc. ASCE, Vol. 88, No. ST3 (1962) pp. 233-267.
[12] R.H. Scanlan and R.H. Gade, Motion of suspension bridge spans under gusty wind, in: Proc. ASCE, Vol. 103, No. ST9 (1977) pp. 1867-1883.
1-13] A. Hatanaka and H. Kobayashi, Active simulation of wind gust for two-dimensional wind tunnel, in: Proc. JSCE, No. 432/1-16 (1991) pp. 88-97 [in Japanese].
[14] H. Kobayashi and A. Hatanaka, Active generation of wind gust in two-dimensional wind tunnel, in: Proc. 8th Int. Conf. on Wind engineering, London, Canada, 1992.
[15] A. Hatanaka, Effects of turbulent flows on an aerodynamic instability of stiffening girder of suspended-span bridge, Doctoral Dissertation, Ritsumeikan University, 1993, Ch. 2 [in Japanese].

330 H. Kobayashi et al./J. Wind Eng. Ind. Aerodyn. 53 (1994) 315-330
[16] M. Kitagawa, N. Shiraishi and M. Matsumoto, Fundamental study on transient properties of lift force in an unsteady flow, in: Proc. 37th Annual Conf. of the Japan Society of Civil Engineering, 1982 [-in Japanese].
[17] Y. Iwatani, Some features of spatial structures of the surface layer turbulence in the high wind condition, J. Meteorogical Soc. Japan 55, No. 1 (1977).
[18] S. Komatsu, Investigation for characteristics of strong wind at Osaka North Harbor, Department of Civil Engineering, Osaka University, 1986 [in Japanese].