Embed Size (px)
Citation preview
ACTIVE SENSOR ALGORITHM APPROACH TO OPTMIZE NITROGEN RATE
FERTILIZATION IN COTTON PRODUCTION
Jonnas De Marchi(1), Ziany Neiva Brandão(2), Thiago Martins Machado(1), Luciano Shozo
Shiratsuchi*(3)
(1) Universidade Federal de Mato Grosso. [email protected]
(2) Embrapa Algodão. Research and Development. [email protected]
(3) Louisiana State University AgCenter, School of Plant, Environmental and Soil Sciences.
*Corresponding author
Abstract: Variable nitrogen(N) rate fertilization based on remote sensing is challenging for
cotton production fields, but active crop canopy sensors (ACS) appear as an alternative to
make this practical on farm since they can be used at night as well. The crop spatial
variability in inherent in crop production in general, and not on-the-go solutions can be
used with this type of active sensing technologies. Thus, the purpose of this study was to
investigate the potential of two vegetation indices to identify the N requirement variability
for cotton plants and to develop prototype algorithms for topdressing nitrogen variable rate on
commercial and experimental areas, using the N-sufficiency methodology based on virtual
reference. The concept of virtual reference is to use a histogram to characterize the vegetation
index of properly fertilized plants without establishing an N-rich plot as a reference strip. The
experiment was conducted in strips with four different N rates (0, 45, 90 and 180 kgN ha-1)
during the 2015, 2016, 2017 and 2018 crop seasons in partnership with large cotton producers
in Mato Grosso and also in experimental area of Embrapa Agrosilvopastoral. Two algorithms
for variable rate nitrogen fertilization for cotton were developed, namely: 1) N
recommendation algorithm for cotton in commercial production system: N rate (kg.N ha-1) = -
234.79 ISN2 + 49,879 ISN + 195.15; R² = 0.97; and 2) for cotton grown in experimental area:
N dose (kgN ha-1) = -174.73 ISN2 - 107.21 ISN + 306.78; R² = 0.94.
Keywords: precision agriculture, active crop canopy sensors, proximal remote sensing,
variable rate fertilization
Preprints (www.preprints.org) | NOT PEER-REVIEWED | Posted: 12 October 2021 doi:10.20944/preprints202110.0183.v1
© 2021 by the author(s). Distributed under a Creative Commons CC BY license.
Introduction
Nitrogen fertilization management is a challenge for different agricultural crops,
specially because it is a nutrient with complex dynamics in the soil, related to several loss
mechanisms (denitrification, volatilization, runoff, leaching, etc.) and so, a potential cause of
environmental impacts. Nitrogen Use Efficiency (NUE), badly reach 60% for most cultures,
like cotton and grains (ANTILLE & MOODY, 2021; CANTARELLA, 2007). NUE value can
vary between seasons and fertilizer application form, to specific cropping systems, as shown
in BELL et al. (2014) and CONNELLAN&DEUTSCHENBAUR (2016) for sugarcane.
Currently practices on nitrogen management to cotton production systems in Brazil
generally include remarkable amounts of N, generally applied through uniform rates at early
phenological stages when the plant is not absorbing the nutrient causing lower efficiency of
use of nitrogen fertilization. Considering that the expenses with fertilizers correspond to, on
average, about 22% of the total cotton production costs (ANSELMO et al., 2011), nitrogen
fertilization in cotton should be carried out cautiously, since its proper use can lead to higher
profitability and less impact in the Environment.
Moreover, precision farming techniques have been explored to increase efficiency of
the agricultural inputs, the use of ACS for an accurately and helpful information to crop
management with high spatial resolution, allowing precise detection and adjustments of N
fertilization on heterogeneous fields still scarce.
The basics of ACS is the fact that spectral properties (reflectance and transmittance) of
the crop canopy are affected by the availability of chlorophyll accumulation in plant leaves,
directly related with nitrogen (N) content (BLACKMER et al., 1996; TARPLEY et al., 2000;
SHIRATSUCHI et al., 2014).
One of the main advantage of these sensors is the possibility to use embedded in
agricultural machines capable of on-the-go or real-time N, considering the spatial and
temporal variability of the N requirement, avoiding losses and, consequently, increasing
profitability. But there is no practical algorithms generated for cotton production in major
states in Brazil such as MT, BA and GO.
In recent years, several researchers have been dedicated to the spectral bands study to
suggest high sensitivity vegetation indices (VIs) for estimate N content in crops. The main
goal of these studies is to manage properly N supply with fitted algorithms, specially due to
saturation presented in some vegetation indices (VIs), such as the normalized difference
vegetation index (NDVI), whose occurrence is affected by high level of chlorophyll contents
Preprints (www.preprints.org) | NOT PEER-REVIEWED | Posted: 12 October 2021 doi:10.20944/preprints202110.0183.v1
presented in canopy, generally perceived as high values of the leaf area index (LAI)
(GITELSON et al., 1996; HABOUDANE et al., 2004). High LAI values promotes high near-
infrared response, the red band is not so responsive, causing NDVI insensitivity to changes in
chlorophyll content for very high N rates. As a plant intrinsic characteristic, cotton keep on
high biomass accumulation rate in early stages, being prone to NDVI saturation when the
crop is sensed to be fertilized using these ACS.
Commercial sensors have been used in Brazil with algorithms developed in other
countries such as the USA, Australia or Europe, requiring the local calibration of these
formulations or even a new one to be build up for cotton growing conditions in the Brazilian
“Cerrados”. Most of the algorithms adjusted for Brazil use laboratory calibration procedures
that require a lot of effort or are based on unrepresentative locations, in addition to being
identified to the crop conditions (variety and phenology) in which they were calibrated.
Several factors can affect vigor and demand for N in the crop, such as genetic differences
between cultivars, different phenological stages, climate, base fertilization and cultural
practices, making it necessary to study practical methodologies that mitigate these effects.
In Brazil, there is a great lack of methodologies based on active canopy sensors to direct the
application of N at variable rates in cotton production systems in both approaches (map-based
or on-the-go).
Based on this context, the present work aimed to investigate the sensitivity of two
vegetation indices to identify the N requirement variability, as well as to develop a first
prototype algorithm.
Material and Methods
The experiment was conducted in four growing seasons, since 2015 up to 2018.
During 2015 season, the experiment was conducted on farm with cooperating producers
located at Lucas do Rio Verde, Sinop, Campo Verde and Sapezal regions, and in the 2016,
2017 and 2018 seasons at Embrapa, in an experimental area located in Sinop - MT
(55º35'42"W ; 11º52'30"S, WGS84).
Before setting up the experiments, typical cotton producers were selected in Mato
Grosso (MT) state of Brazil. The main criteria for selection was the adoption of no tillage
system in succession with cotton, particularly those producers using the soybean crop as the
first crop and cotton in succession, because this is the predominant used in cotton production
in MT.
Preprints (www.preprints.org) | NOT PEER-REVIEWED | Posted: 12 October 2021 doi:10.20944/preprints202110.0183.v1
The region climate, according to Köppen-Geiger classification, is Aw's tropical,
characterized by high temperature, with average of 25ºC, and well distributed rainfall at
summer and fall. The average rainfall on crop season is 880mm. In general, the soil is
classified as Dystrophic Red-Yellow Latosol, with a predominantly clayey texture (SANTOS
et al, 2013).
On the experimental fields conducted in commercial farms, each plot consisted of long
strips, considering fertilizer applicator width by the field length that varied from field to field.
In all experimental plots, the cotton sowing was performed between January 14 and February
18, 2015, with the FM 975 WS variety suing 0.75 m row spacing. The starter/base
fertilization at planting or close was made using 500 kg ha-1 of 08-20-20 formula. It was used
potassium fertilization (140 kg K ha-1), divided into two applications, with potassium chloride
as a source. The treatments consisted of four N doses (0, 45, 90 and 180 kg N ha-1) replicated
3 times and randomized in transect. Nitrogen was applied into two side-dress applications,
between 30 and 45 days after plant emergence (DAE), using urea granule fertilizer.
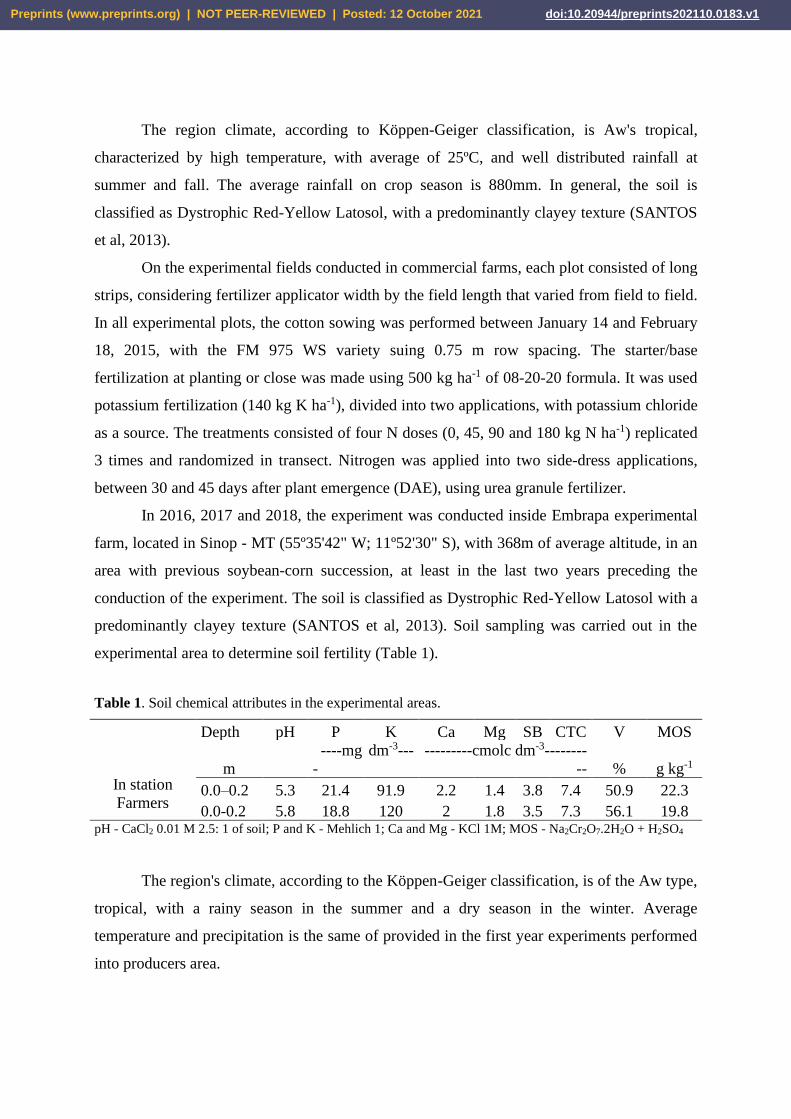
In 2016, 2017 and 2018, the experiment was conducted inside Embrapa experimental
farm, located in Sinop - MT (55º35'42" W; 11º52'30" S), with 368m of average altitude, in an
area with previous soybean-corn succession, at least in the last two years preceding the
conduction of the experiment. The soil is classified as Dystrophic Red-Yellow Latosol with a
predominantly clayey texture (SANTOS et al, 2013). Soil sampling was carried out in the
experimental area to determine soil fertility (Table 1).
Table 1. Soil chemical attributes in the experimental areas.
In station
Farmers
Depth pH P K Ca Mg SB CTC V MOS
m
----mg dm-3---
-
---------cmolc dm-3--------
-- % g kg-1
0.0–0.2 5.3 21.4 91.9 2.2 1.4 3.8 7.4 50.9 22.3
0.0-0.2 5.8 18.8 120 2 1.8 3.5 7.3 56.1 19.8 pH - CaCl2 0.01 M 2.5: 1 of soil; P and K - Mehlich 1; Ca and Mg - KCl 1M; MOS - Na2Cr2O7.2H2O + H2SO4
The region's climate, according to the Köppen-Geiger classification, is of the Aw type,
tropical, with a rainy season in the summer and a dry season in the winter. Average
temperature and precipitation is the same of provided in the first year experiments performed
into producers area.
Preprints (www.preprints.org) | NOT PEER-REVIEWED | Posted: 12 October 2021 doi:10.20944/preprints202110.0183.v1
The experiment was carried out in experimental plots, where each plot consists of long
strips with six rows of plants, spaced at 0.90 m, and 60 m long (324 m2). The two central rows
were considered as a useful area for the evaluations, discarding the other lateral rows as
buffer, to reduce the effect of fertilizer dispersion at the time of application.
The sowing was carried out on January 14, 2016, February 20, 2017 and February 17,
2018, using the varieties BRS369RF, IMA 5675 BG2RF and FM 940 GLT, respectively, in a
spacing of 0.9 m with a 08-20-20 formula in 2016 as base fertilization with 450 kg ha-1, and
350 kg ha-1 of 04-30-16 formula for the other years. Potassium fertilization (140 kg K ha-1)
was broadcast uniformly in side-dress, divided into two applications, at 30 and 45 DAE, using
potassium chloride as a source. The treatments consisted of four N rates (0, 45, 90, 180 kg N
ha-1) with four randomized replicates, totaling 16 plots. Nitrogen was applied in top dressing,
divided in two applications, between 30 and 45 DAE, using urea fertilizer as source.
Diseases and pest control was carried out in accordance with Embrapa standards, as
described by EMBRAPA (2001), uniformly in all treatments.
To evaluate the canopy reflectance, it was used an active sensor Crop Circle, model
ACS-430 (Holland Scientific®, Lincoln, NE, USA). The target reflectance is captured by three
photodetectors, in the electromagnetic spectrum regions: 670, 730 and 780, corresponding to
Red, Red-edge, and NIR (near infrared band), respectively. The device field of view is 32 by
6 degrees, with a recommended working height between 0.25 and 2.0 m in relation to the
target, equivalent to a sensed range of 0.5 and 1 m, respectively.
Reflectance readings were carried out after the first N application, at 35 DAE (2015)
for partner experiments and at 36 DAE (2016), 32 DAE (2017) and 37 DAE (2018) for
experimental plots in Embrapa, corresponding to phenological stage V5. The sensor was used
as a handheld device, walking between rows at constant speed (0.75 ms-1) and height about
0.6 m from the canopy, recording data at a frequency of 1 Hz, being considered readings
average as the real value of each plot.
To evaluate the cotton yield, the harvest was made manually in both cultivation
systems, considering as useful area the two central rows with 3m of length per plot.
Nitrogen application algorithms developed in this work use the methodology
suggested by Schepers et al., 1992, called the sufficiency index (SI). This methodology
normalizes the vegetation index (VI) sensed by an average VI derived from a reference plot
considered non-limiting for N. usually called N rich strip.
Many studies have reported that the SI is better than the absolute reading value of any
sensor for assessing N status in crops, as this concept integrates into the sensor readings the
Preprints (www.preprints.org) | NOT PEER-REVIEWED | Posted: 12 October 2021 doi:10.20944/preprints202110.0183.v1
effects of climate, soil, hybrids, canopy structure (plant development stages and leaf
architecture), for different crops (PETERSON et al., 1993; HUSSAIN et al., 2000;
DEBAEKE et al., 2006; HOLLAND & SCHEPERS, 2010; ZHU et al., 2011).
The normalization process consists of dividing the sensor readings by the N-rich
average, resulting in a quotient called SI (Eq. 1), which is mathematically described as:
𝑆𝐼 =𝑉𝐼𝑠𝑒𝑛𝑠𝑜𝑟
𝑉𝐼𝑟𝑒𝑓𝑒𝑟𝑒𝑛𝑐𝑒 Eq. 1
where, SI is the sufficiency index (0 ≤ SI ≤ 1), VIsensor is the real-time measured vegetation
index, and VIreference is the vegetation index on the N rich area.
In fact, the SI calculation can be applied to any VI or crop parameter evaluated, allowing the
comparison between different VIs or parameters.This concept is used extensively with yield
monitor data, called normalized yield. In this work, the potential of two VIs was investigated
without N requirement variability identification for cotton. They are: (i) normalized difference
vegetation index (NDVI) developed by Rouse et al., (1974), mathematically described as:
𝑁𝐷𝑉𝐼 = ρ𝑁𝐼𝑅−ρ𝑅𝐸𝐷
ρ𝑁𝐼𝑅+ρ𝑅𝐸𝐷 Eq. 2
where, NDVI is the normalized difference vegetation index (-1 ≤ NDVI ≤ 1), NIR is the near
infrared reflectance at 780 nm and RED is the red reflectance (670 nm); and (ii ) chlorophyll
vegetation index using the Red Edge (CIRE) developed by Gitelson et al., (2003, 2005),
described as:
𝐶𝐼𝑅𝐸 = [ρ𝑁𝐼𝑅
ρ𝑅𝑒𝑑𝐸𝑑𝑔𝑒− 1] Eq. 3
where, CIRE is the chlorophyll index using the Red Edge (0 ≤ CIRE ≤ 2), NIR is the near
infrared reflectance (780 nm) and Red Edge is the reflectance in the transition region between
RED and NIR, given by CropCircle® at 730 nm. The criteria for choosing these VIs was
guided from pioneering studies by Gitelson et al., (1996) that showed the advantages using
the red edge band to create vegetation indices. Currently, NDVI is one of the most used VIs
worldwide to monitor and analyze, as well as, mapping physiological and biophysical crops
characteristics. In spite of NDVI intensive use, several authors have reported NDVI
Preprints (www.preprints.org) | NOT PEER-REVIEWED | Posted: 12 October 2021 doi:10.20944/preprints202110.0183.v1
limitations due to readings saturation for huge canopy coverage, in other words, when the leaf
area index (LAI) of the crop exceeds a certain limit (Gitelson, 2004).
Virtual reference approach proposed by Holland & Schepers (2013) was used for the
inference of the N-rich VI index. This technique uses a sensor algorithm designed for making
in season N recommendations from active crop canopy sensor data. The procedure is to divide
measured values of optical sensors by those measured in a well-fertilized plot without N
limitations. This algorithm is sensitive to local conditions because it references a satisfactorily
fertilized part of the field at the time of sensing to calculate a Nitrogen Sufficiency Index
(NSI), and consequently uses different strategies on establishing a field reference.
That index is developed cooperatively with producers, which have an opportunity to
incorporate their experiences by suggesting an optimum N rate. This concept assumes that in
a histogram that the frequency of sensor readings in a population of plants that did not receive
N input. At the time of sensing and in-season N application, a representative field transect is
scanned. The histogram is automatically generated and the 95th percentile vegetative index
value is extracted as the reference (Holland and Schepers 2013). This value corresponding to
95% of the cumulative frequency of VI data.
The authors explain that the virtual reference approach is easier to implement,
considering practical adoption, since you do not need to implement N rich strip in the field
being prone to place a N rich strip on the wrong zone in the field introducing bias in the NSI.
This approach can be applied in two different ways. The first, based on previous
mapping of the spatial variability using sensors on board of self-propelled vehicles or
motorcycles, called "drive-first", generating the histogram and later the reference VI. In the
other way, called "drive-and-apply", the sensor is embedded in machinery capable of real-
time variable rate application, generating and continuously updating the histogram from
readings collected in real-time while the machine in moving.
Again, all on farm precision experimentation conducted used the methodology
proposed by Schepers et al., (1992), which normalizes the sensed VI by an average VI derived
from a N rich plot, and the virtual reference methodology proposed by Holland & Schepers
(2013) was used for N rich average inference.
All data were submitted to descriptive statistical analysis, adjusting quadratic
regression models for the variables of interest.
Preprints (www.preprints.org) | NOT PEER-REVIEWED | Posted: 12 October 2021 doi:10.20944/preprints202110.0183.v1
Results and discussion
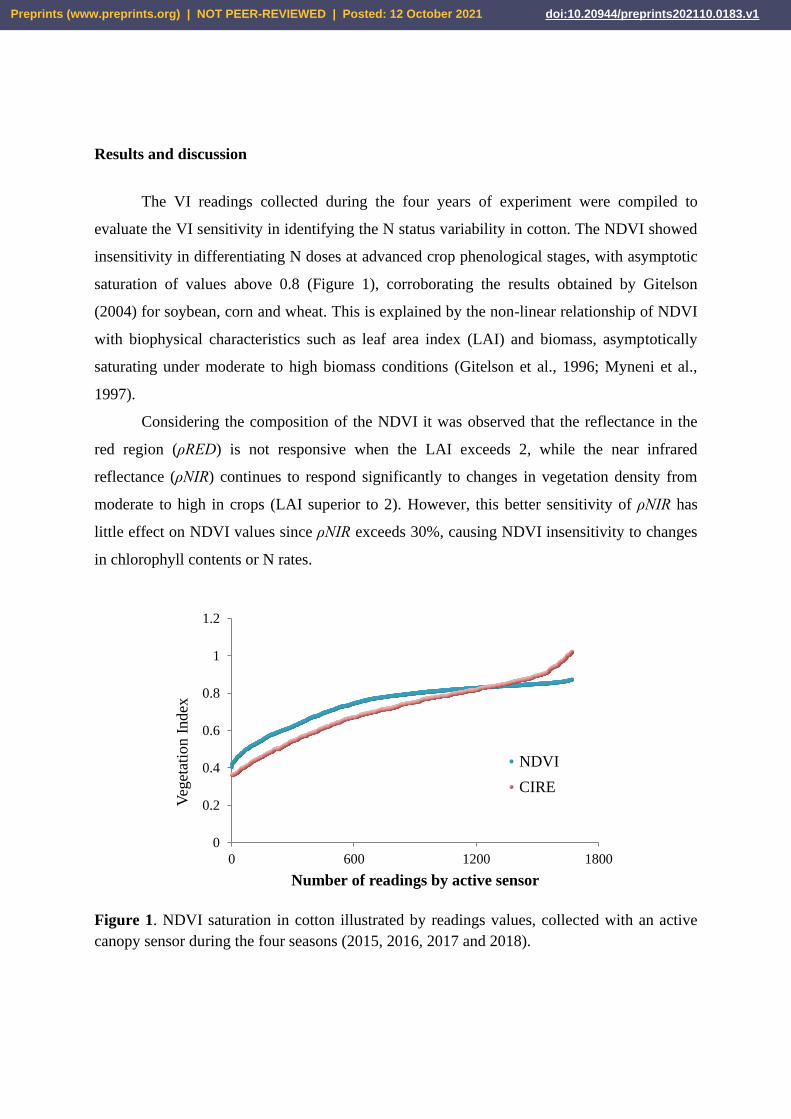
The VI readings collected during the four years of experiment were compiled to
evaluate the VI sensitivity in identifying the N status variability in cotton. The NDVI showed
insensitivity in differentiating N doses at advanced crop phenological stages, with asymptotic
saturation of values above 0.8 (Figure 1), corroborating the results obtained by Gitelson
(2004) for soybean, corn and wheat. This is explained by the non-linear relationship of NDVI
with biophysical characteristics such as leaf area index (LAI) and biomass, asymptotically
saturating under moderate to high biomass conditions (Gitelson et al., 1996; Myneni et al.,
1997).
Considering the composition of the NDVI it was observed that the reflectance in the
red region (ρRED) is not responsive when the LAI exceeds 2, while the near infrared
reflectance (ρNIR) continues to respond significantly to changes in vegetation density from
moderate to high in crops (LAI superior to 2). However, this better sensitivity of ρNIR has
little effect on NDVI values since ρNIR exceeds 30%, causing NDVI insensitivity to changes
in chlorophyll contents or N rates.
Figure 1. NDVI saturation in cotton illustrated by readings values, collected with an active
canopy sensor during the four seasons (2015, 2016, 2017 and 2018).
0
0.2
0.4
0.6
0.8
1
1.2
0 600 1200 1800
Veg
etat
ion I
ndex
Number of readings by active sensor
NDVI
CIRE
Preprints (www.preprints.org) | NOT PEER-REVIEWED | Posted: 12 October 2021 doi:10.20944/preprints202110.0183.v1
The chlorophyll index based on the Red Edge band (CIRE) was responsive to
differentiate chlorophyll contents or N rates throughout the majority of crop development
when N is being absorbed, as it does not present saturation of readings under conditions of
high LAI or biomass, being the most suitable for evaluating the nutritional status of N in
cotton (Figure 1) for variable rate purposes. For this reason, the algorithms proposed in this
work were based on the CIRE vegetation index.
Sensor readings were carried out in different commercial plots, under different
management conditions, different varieties, plant height, disease pressure, soil types, looking
for maximum variability in readings under real cotton production conditions in 2015. From all
data, 50% of the sensor readings were used to generate the algorithm and the other 50% were
used for the validation of the proposed algorithm.
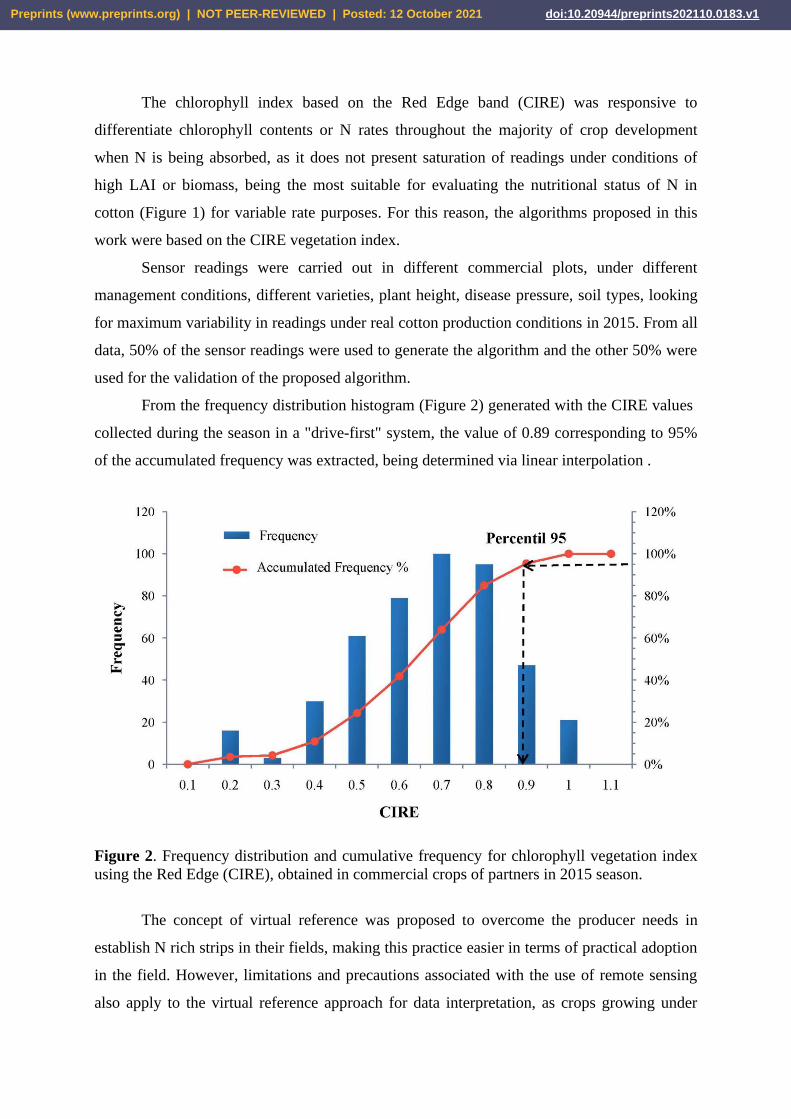
From the frequency distribution histogram (Figure 2) generated with the CIRE values
collected during the season in a "drive-first" system, the value of 0.89 corresponding to 95%
of the accumulated frequency was extracted, being determined via linear interpolation .
Figure 2. Frequency distribution and cumulative frequency for chlorophyll vegetation index
using the Red Edge (CIRE), obtained in commercial crops of partners in 2015 season.
The concept of virtual reference was proposed to overcome the producer needs in
establish N rich strips in their fields, making this practice easier in terms of practical adoption
in the field. However, limitations and precautions associated with the use of remote sensing
also apply to the virtual reference approach for data interpretation, as crops growing under
Preprints (www.preprints.org) | NOT PEER-REVIEWED | Posted: 12 October 2021 doi:10.20944/preprints202110.0183.v1
conditions of inherent environmental or water stress have effects on canopy reflectance, not
reflecting actual status of N. In addition, the virtual reference of an area where other factors
are not satisfactory, such as lack of other nutrients and water, weed infestation, pesticide
phytotoxicity, the value corresponding to non N deficiency can be masked and fertilizer rates
can be overapplied.
The virtual reference value extracted from the histogram was used to normalize the
sensor readings, thus transforming the values into SI, now treated as a nitrogen sufficiency
index (NSI). For example: a sensed CIRE value of 0.85 divided by 0 .89 (virtual reference)
results in an NSI of 0.95.
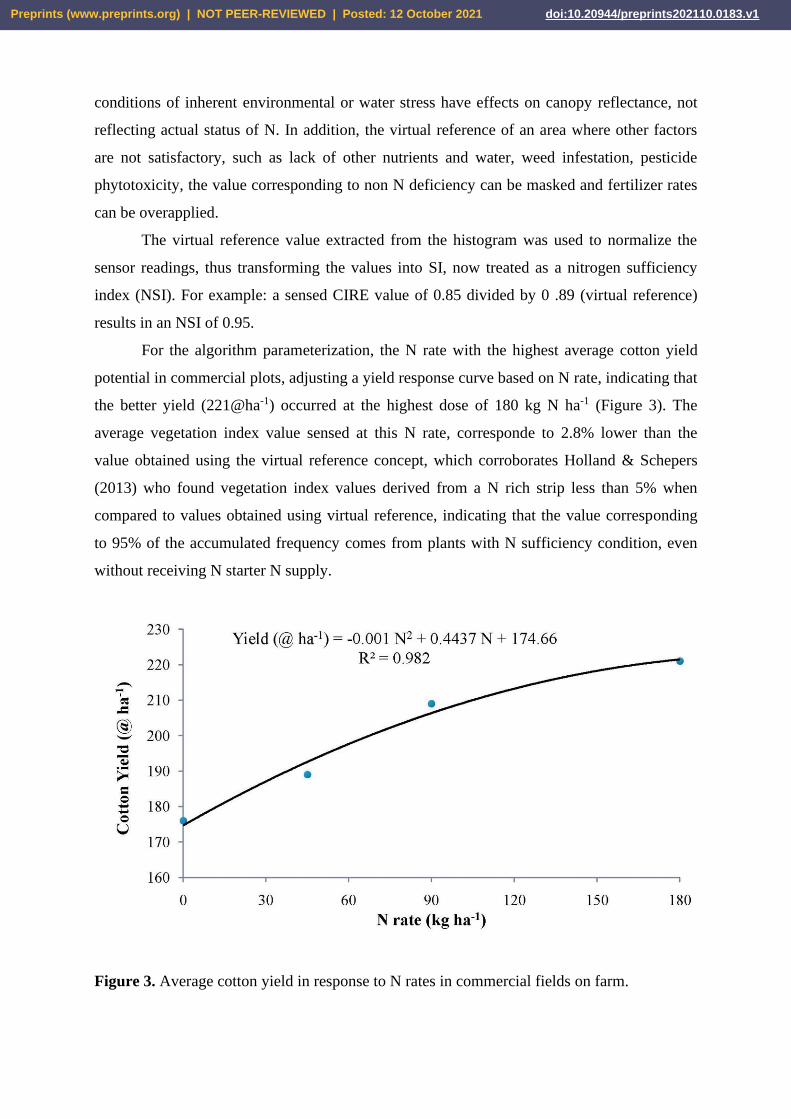
For the algorithm parameterization, the N rate with the highest average cotton yield
potential in commercial plots, adjusting a yield response curve based on N rate, indicating that
the better yield (221@ha-1) occurred at the highest dose of 180 kg N ha-1 (Figure 3). The
average vegetation index value sensed at this N rate, corresponde to 2.8% lower than the
value obtained using the virtual reference concept, which corroborates Holland & Schepers
(2013) who found vegetation index values derived from a N rich strip less than 5% when
compared to values obtained using virtual reference, indicating that the value corresponding
to 95% of the accumulated frequency comes from plants with N sufficiency condition, even
without receiving N starter N supply.
Figure 3. Average cotton yield in response to N rates in commercial fields on farm.
Preprints (www.preprints.org) | NOT PEER-REVIEWED | Posted: 12 October 2021 doi:10.20944/preprints202110.0183.v1
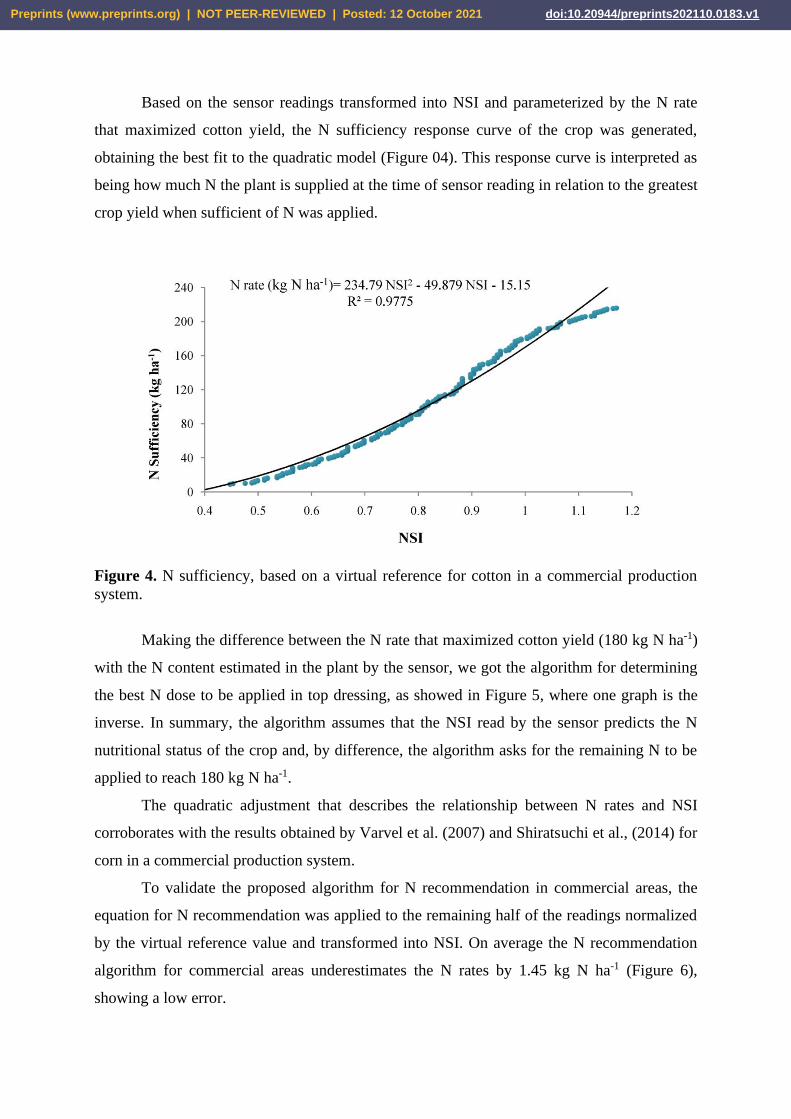
Based on the sensor readings transformed into NSI and parameterized by the N rate
that maximized cotton yield, the N sufficiency response curve of the crop was generated,
obtaining the best fit to the quadratic model (Figure 04). This response curve is interpreted as
being how much N the plant is supplied at the time of sensor reading in relation to the greatest
crop yield when sufficient of N was applied.
Figure 4. N sufficiency, based on a virtual reference for cotton in a commercial production
system.
Making the difference between the N rate that maximized cotton yield (180 kg N ha-1)
with the N content estimated in the plant by the sensor, we got the algorithm for determining
the best N dose to be applied in top dressing, as showed in Figure 5, where one graph is the
inverse. In summary, the algorithm assumes that the NSI read by the sensor predicts the N
nutritional status of the crop and, by difference, the algorithm asks for the remaining N to be
applied to reach 180 kg N ha-1.
The quadratic adjustment that describes the relationship between N rates and NSI
corroborates with the results obtained by Varvel et al. (2007) and Shiratsuchi et al., (2014) for
corn in a commercial production system.
To validate the proposed algorithm for N recommendation in commercial areas, the
equation for N recommendation was applied to the remaining half of the readings normalized
by the virtual reference value and transformed into NSI. On average the N recommendation
algorithm for commercial areas underestimates the N rates by 1.45 kg N ha-1 (Figure 6),
showing a low error.
Preprints (www.preprints.org) | NOT PEER-REVIEWED | Posted: 12 October 2021 doi:10.20944/preprints202110.0183.v1
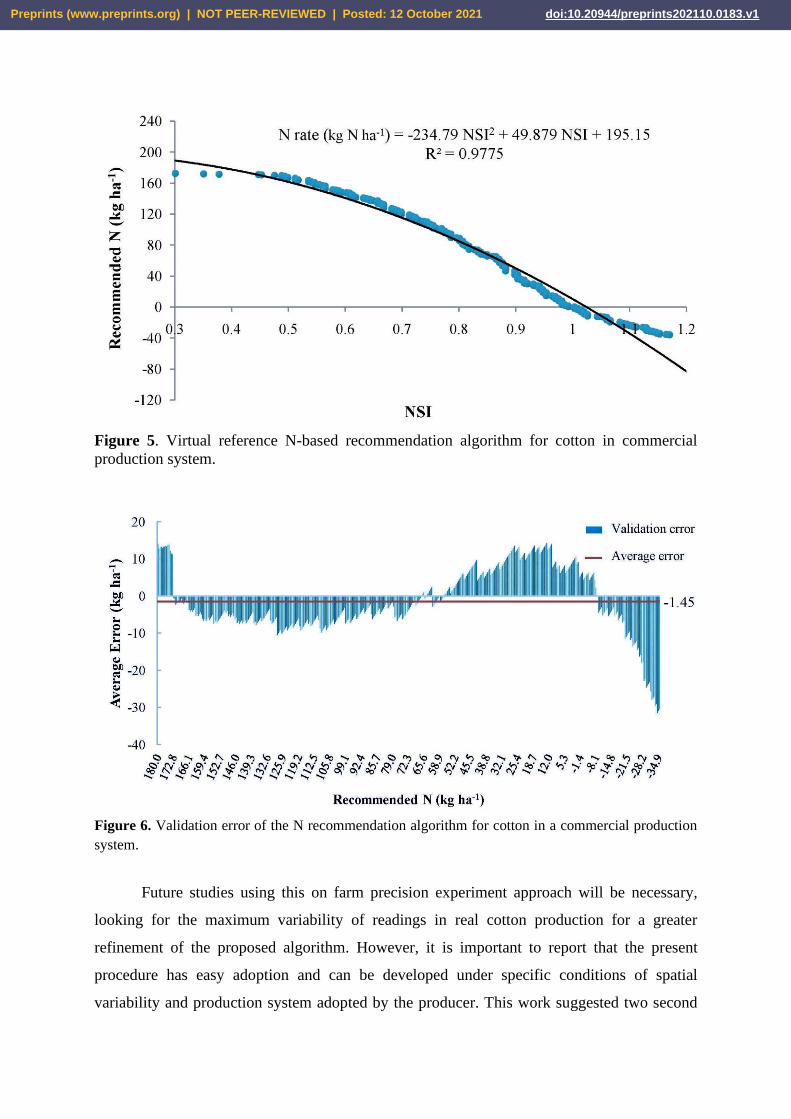
Figure 5. Virtual reference N-based recommendation algorithm for cotton in commercial
production system.
Figure 6. Validation error of the N recommendation algorithm for cotton in a commercial production
system.
Future studies using this on farm precision experiment approach will be necessary,
looking for the maximum variability of readings in real cotton production for a greater
refinement of the proposed algorithm. However, it is important to report that the present
procedure has easy adoption and can be developed under specific conditions of spatial
variability and production system adopted by the producer. This work suggested two second
Preprints (www.preprints.org) | NOT PEER-REVIEWED | Posted: 12 October 2021 doi:10.20944/preprints202110.0183.v1
degree equations, but is important to keep in mind that there is no universal formula for all
environment conditions, and so it is important to have a simple formulation that can be
translated and implemented by consultants or producers.
The methodology proposed from Schepers et al., (1992) was also used for the
algorithm generation in experimental fields in Embrapa experimental farm, with data
normalization and the approach to determine the N-rich strip sensor average proposed by
Holland & Schepers (2013).
Sensor readings collected at advanced phenological stages during the 3 years of the
experiment were used to ensure the effect of N rates, where the highest standard deviations
were found after 100 days after emergence (DAE), with 120 being chosen DAE due to a
stabilization of the deviations. Calibration and validation used 50% data split as the
commercial fields.
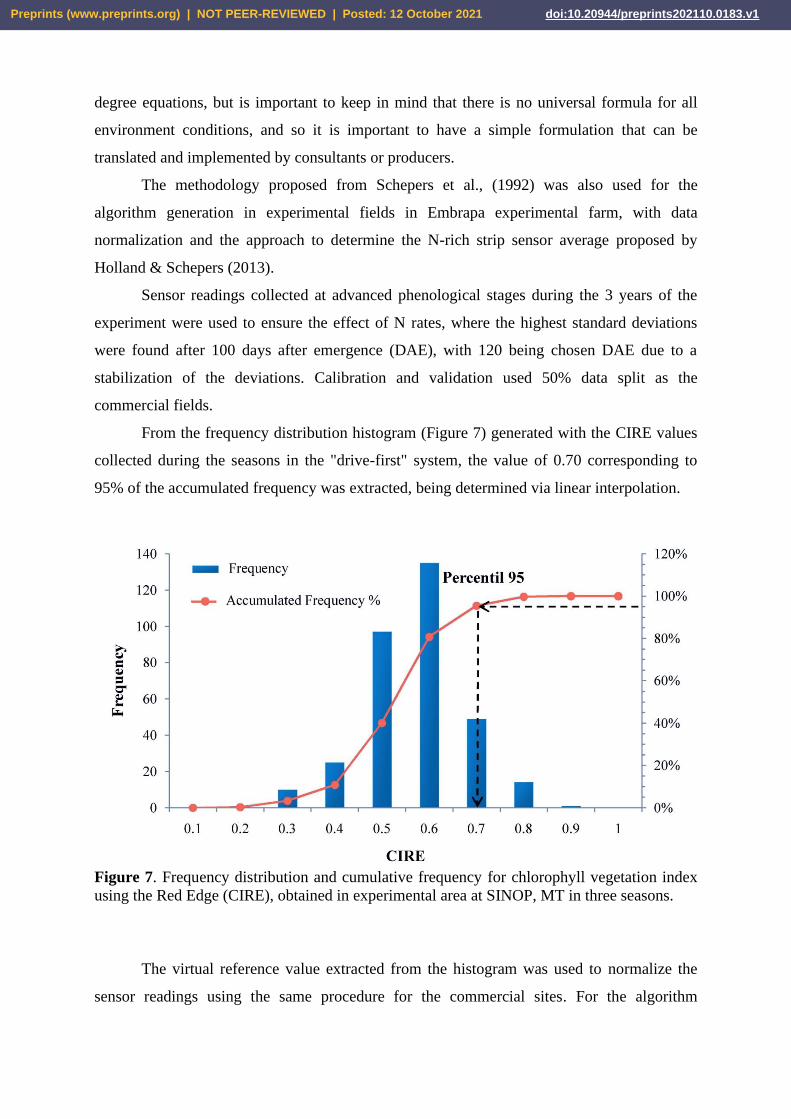
From the frequency distribution histogram (Figure 7) generated with the CIRE values
collected during the seasons in the "drive-first" system, the value of 0.70 corresponding to
95% of the accumulated frequency was extracted, being determined via linear interpolation.
Figure 7. Frequency distribution and cumulative frequency for chlorophyll vegetation index
using the Red Edge (CIRE), obtained in experimental area at SINOP, MT in three seasons.
The virtual reference value extracted from the histogram was used to normalize the
sensor readings using the same procedure for the commercial sites. For the algorithm
Preprints (www.preprints.org) | NOT PEER-REVIEWED | Posted: 12 October 2021 doi:10.20944/preprints202110.0183.v1
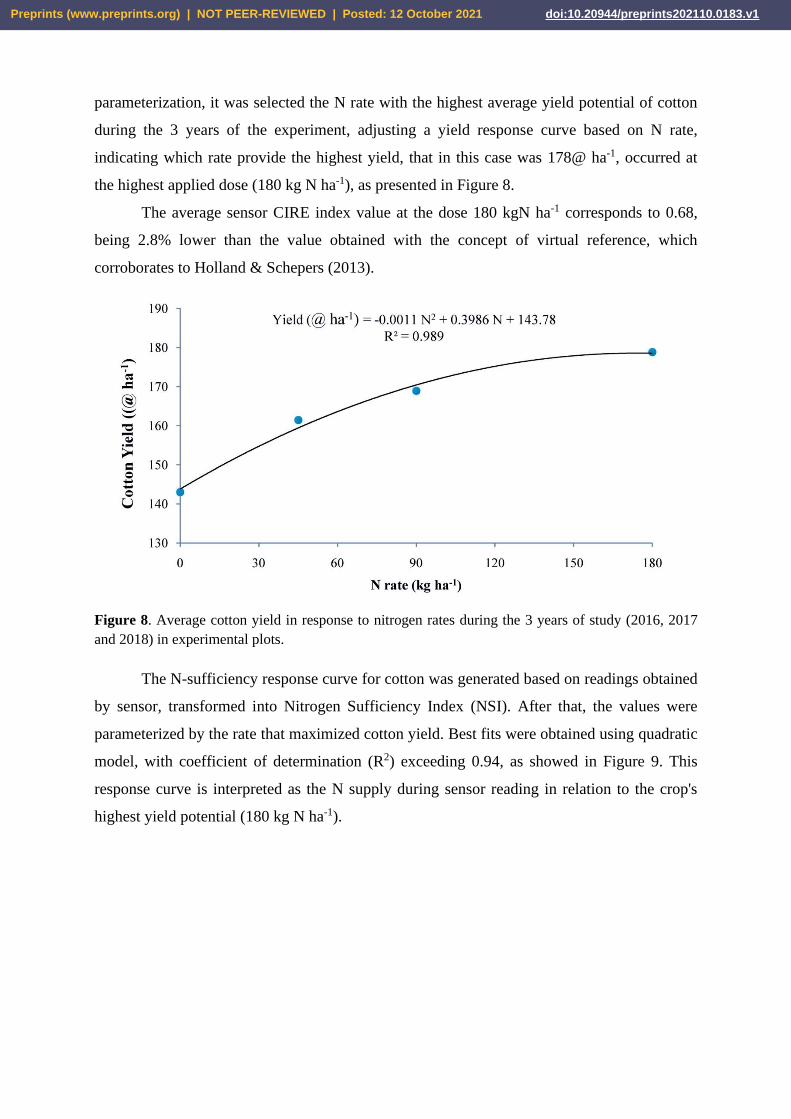
parameterization, it was selected the N rate with the highest average yield potential of cotton
during the 3 years of the experiment, adjusting a yield response curve based on N rate,
indicating which rate provide the highest yield, that in this case was 178@ ha-1, occurred at
the highest applied dose (180 kg N ha-1), as presented in Figure 8.
The average sensor CIRE index value at the dose 180 kgN ha-1 corresponds to 0.68,
being 2.8% lower than the value obtained with the concept of virtual reference, which
corroborates to Holland & Schepers (2013).
Figure 8. Average cotton yield in response to nitrogen rates during the 3 years of study (2016, 2017
and 2018) in experimental plots.
The N-sufficiency response curve for cotton was generated based on readings obtained
by sensor, transformed into Nitrogen Sufficiency Index (NSI). After that, the values were
parameterized by the rate that maximized cotton yield. Best fits were obtained using quadratic
model, with coefficient of determination (R2) exceeding 0.94, as showed in Figure 9. This
response curve is interpreted as the N supply during sensor reading in relation to the crop's
highest yield potential (180 kg N ha-1).
Preprints (www.preprints.org) | NOT PEER-REVIEWED | Posted: 12 October 2021 doi:10.20944/preprints202110.0183.v1
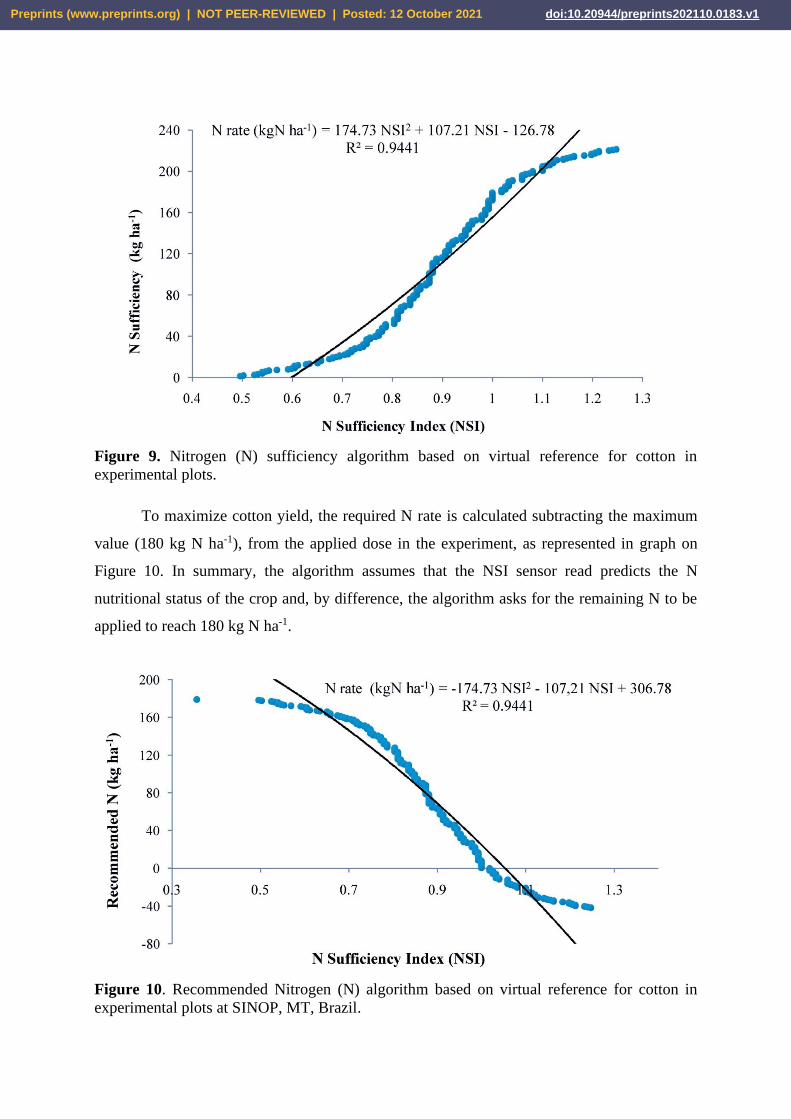
Figure 9. Nitrogen (N) sufficiency algorithm based on virtual reference for cotton in
experimental plots.
To maximize cotton yield, the required N rate is calculated subtracting the maximum
value (180 kg N ha-1), from the applied dose in the experiment, as represented in graph on
Figure 10. In summary, the algorithm assumes that the NSI sensor read predicts the N
nutritional status of the crop and, by difference, the algorithm asks for the remaining N to be
applied to reach 180 kg N ha-1.
Figure 10. Recommended Nitrogen (N) algorithm based on virtual reference for cotton in
experimental plots at SINOP, MT, Brazil.
Preprints (www.preprints.org) | NOT PEER-REVIEWED | Posted: 12 October 2021 doi:10.20944/preprints202110.0183.v1
It should be noted that one of the great advantages of this approach in relation to the
N-rich strip mounted in the field is the irrelevance of prior field knowledge of the spatial and
temporal variability, integrating the effects of climate, soil and culture into the sensor reading.
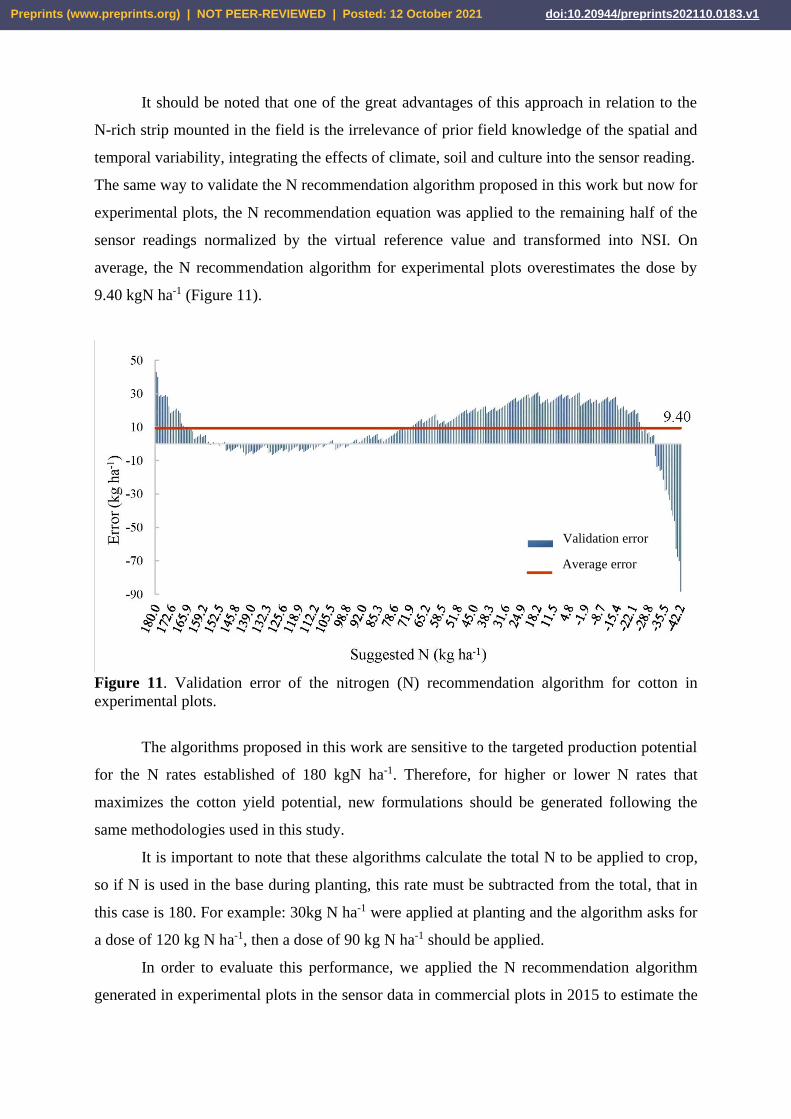
The same way to validate the N recommendation algorithm proposed in this work but now for
experimental plots, the N recommendation equation was applied to the remaining half of the
sensor readings normalized by the virtual reference value and transformed into NSI. On
average, the N recommendation algorithm for experimental plots overestimates the dose by
9.40 kgN ha-1 (Figure 11).
Figure 11. Validation error of the nitrogen (N) recommendation algorithm for cotton in
experimental plots.
The algorithms proposed in this work are sensitive to the targeted production potential
for the N rates established of 180 kgN ha-1. Therefore, for higher or lower N rates that
maximizes the cotton yield potential, new formulations should be generated following the
same methodologies used in this study.
It is important to note that these algorithms calculate the total N to be applied to crop,
so if N is used in the base during planting, this rate must be subtracted from the total, that in
this case is 180. For example: 30kg N ha-1 were applied at planting and the algorithm asks for
a dose of 120 kg N ha-1, then a dose of 90 kg N ha-1 should be applied.
In order to evaluate this performance, we applied the N recommendation algorithm
generated in experimental plots in the sensor data in commercial plots in 2015 to estimate the
Validation error
Average error
Preprints (www.preprints.org) | NOT PEER-REVIEWED | Posted: 12 October 2021 doi:10.20944/preprints202110.0183.v1
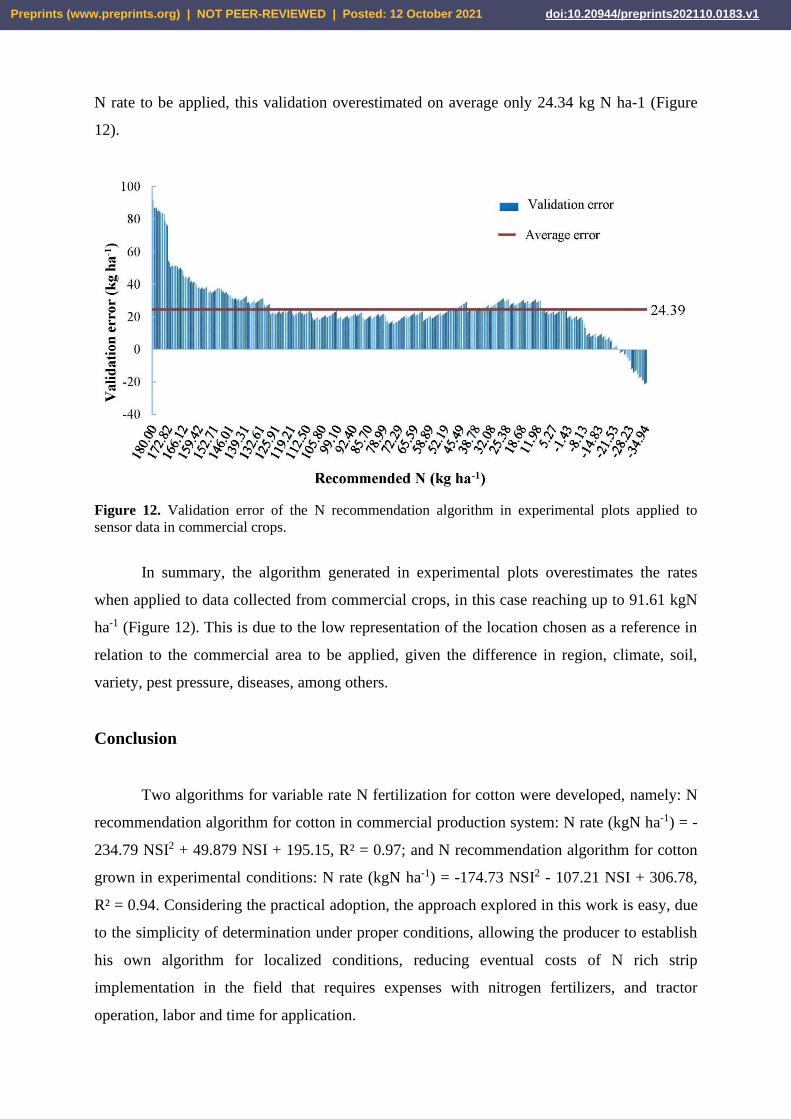
N rate to be applied, this validation overestimated on average only 24.34 kg N ha-1 (Figure
12).
Figure 12. Validation error of the N recommendation algorithm in experimental plots applied to
sensor data in commercial crops.
In summary, the algorithm generated in experimental plots overestimates the rates
when applied to data collected from commercial crops, in this case reaching up to 91.61 kgN
ha-1 (Figure 12). This is due to the low representation of the location chosen as a reference in
relation to the commercial area to be applied, given the difference in region, climate, soil,
variety, pest pressure, diseases, among others.
Conclusion
Two algorithms for variable rate N fertilization for cotton were developed, namely: N
recommendation algorithm for cotton in commercial production system: N rate (kgN ha-1) = -
234.79 NSI2 + 49.879 NSI + 195.15, R² = 0.97; and N recommendation algorithm for cotton
grown in experimental conditions: N rate (kgN ha-1) = -174.73 NSI2 - 107.21 NSI + 306.78,
R² = 0.94. Considering the practical adoption, the approach explored in this work is easy, due
to the simplicity of determination under proper conditions, allowing the producer to establish
his own algorithm for localized conditions, reducing eventual costs of N rich strip
implementation in the field that requires expenses with nitrogen fertilizers, and tractor
operation, labor and time for application.
Preprints (www.preprints.org) | NOT PEER-REVIEWED | Posted: 12 October 2021 doi:10.20944/preprints202110.0183.v1
In this study, a large discrepancy was noticed between data collected in small plots
established in an experimental station compared to data obtained on commercial farms,
generating very different formulations regarding the N rates to be applied in real time or map-
based by sensors. Therefore, the direct use of the formulations obtained in this work in either
of the two approaches can result in under- or over-estimation of the appropriate rates.
Therefore, it is necessary to generate an own algorithm for each farm condition. Despite the
fact that errors can be high when a experimental equation is used on producers conditions, this
error will be much smaller than to use imported algorithms from other countries.
Although it is not possible to control all the variables that interfere with the cotton
demand for N, the main conclusion is that the use of large plots associated with the virtual
reference approach proved to be a much more practical method, facilitating the adoption by
the producers, with easy equation adjustment because of the large number of samples and
ease extrapolation for different conditions on the farm. And the common sense to use the
equation generated from farmers sites and not the equation generated from experimental
station. Take home message is to use virtual reference approach and generate the simple
equation in your farm condition avoiding the use of “one size fits all magic formulations”.
Acknowledgements
The authors would like to thank Brazilian Agricultural Research Corporation
(Embrapa); Federal University of Mato Grosso (UFMT) and producers for financial support
and constant interest on this subject that is needed for adoption of proximal remote sensing on
cotton production. This paper is part of the master thesis of Jonnas De Marchi that is the first
author that expended long hours scanning fields and supporting our team when Dr. Luciano
Shiratsuchi was a researcher at Embrapa.
References
ANSELMO, J. L.; HOLANDA, H. V.; KANEKO, F. H.; ALVES, L. A.; LOURENÇO, P. H. F. N.;
LEAL, A. J. F.; RICIERI, A. D.Estimativa do custo de produção do algodão em caroço, na região dos
chapadões - Safra 2010/11. In: CONGRESSOBRASILEIRO DO ALGODÃO, 8.; COTTON EXPO,
1., 2011, São Paulo. Evolução da cadeia para construção de um setor forte: Anais. Campina Grande,
PB: Embrapa Algodão, 2011. p 1774 -1781.
ANTILLE, D. L.; MOODY, P. W. Nitrogen use efficiency indicators for the Australian cotton, grains,
sugar, dairy and horticulture industries. Environmental and Sustainability Indicators, v.10, p 02-10,
2021. DOI: https://doi.org/10.1016/j.indic.2020.100099.
Preprints (www.preprints.org) | NOT PEER-REVIEWED | Posted: 12 October 2021 doi:10.20944/preprints202110.0183.v1
BELL, M.J.; MOODY, P.; SALTER, B.; CONNELLAN, J.; GARSIDE, A.L., Agronomy and
physiology of nitrogen use in Australian sugarcane crops. In: Bell, M.J. (Ed.). A Review of Nitrogen
Use Efficiency in Sugarcane. Sugar Research Australia, Indooroopilly, QLD, Australia, p. 75–109.
2014.
BLACKMER, T. M.; SCHEPERS. J. S.; VARVEL, G. E.; WALTER-SHEA, E. A. Nitrogen
deficiency detection using reflected shortwave radiation from irrigated corn canopies. Agronomy
Journal, Madison, v. 88, p. 1-5, 1996.
CANTARELLA, H. Nitrogênio. In: NOVAIS, R. F.; ALVAREZ, V. H.; BARROS, N. F.; FONTES,
R. L. F.; CANTARUTTI, R. B.; NEVES, J. C. L. (Ed).Fertilidade do solo. Viçosa: SBCS, 2007. p.
375-470.
CONNELLAN, J.F.; DEUTSCHENBAUR, J. Nitrogen Accumulation in Biomass and its
Partitioning in Sugarcane Grown in the Burdekin. Proceedings of the Australian Society of Sugar
Cane Technology, v.38, p.72-80. 2016
DEBAEKE, P.; ROUET, P.; JUSTES, E. Relationship between the normalized SPAD index and the
nitrogen nutrition index: Application to durum wheat. Journal Plant Nutrition. 29:75-92, 2006.
EMBRAPA – Empresa Brasileira de Pesquisa Agropecuária. Algodão: Tecnologia de produção.
Dourados: EmbrapaAgropecuária Oeste, 2001. 296p.
GITELSON, A. A. Wide Dynamic Range Vegetation Index for Remote Quantification of Crop
Biophysical Characteristics. Journal of plant physiology, Vol. 161, 165-173. 2004.
GITELSON, A. A.; GRITZ, U.; MERZLYAK, M. N. Relationships between leaf chlorophyll content
and spectral reflectance and algorithms for no-destructive chlorophyll assessment in higher plant
leaves. Journal of plant physiology, 160, 271-282. 2003.
GITELSON, A. A.; KAUFMAN, Y.; MERZLYAK, M. N. Use of green channel in remote sensing of
global vegetation from EOS-MODIS. Remote Sensing of Environment, v. 58, p. 289-298,
1996.http://dx.doi.org/10.1016/S0034-4257(96)00072-7.
GITELSON, A. A.;MERZLVAK, M. N.; LICHTENTHALER, H.K.. Detection of red edge position
and chlorophyll content by reflectance measurements near 700 nm. JournalofPlantPhysiology, 148(3-
4), 501-508. 1996.
GITELSON, A. A.; VINA, A.; CIGANDA, V.; RUNDQUIST, D. C.; ARKEBAUER, T.J. Remote
estimation of canopy chlorophyll content in crops. Geophysical Research Letters32: 4-7. 2005.
HABOUDANE, D.; MILLER, J. R.; PATTEY E.; ZARCO-TEJADA, P. J.; STRACHAN, I. B.
Hyperspectral vegetation indices and novel algorithms for predicting green LAI of crop canopies:
Preprints (www.preprints.org) | NOT PEER-REVIEWED | Posted: 12 October 2021 doi:10.20944/preprints202110.0183.v1
Modeling and validation in the context of precision agriculture. Remote Sensing of Environment, v.
90, p. 337-352, 2004. http://dx.doi.org/10.1016/j.rse.2003.12.013
HOLLAND, K. H. Sensor-based chemical management for agricultural landscapes. U.S. Patent
#7,723,660. Issue May 25, 2009.
HOLLAND, K. H; SCHEPERS, J. S. Derivation of a variable rate nitrogen application model for in-
season fertilization of corn. Agronomy Journal. 102; 1415-1424, 2010.
HOLLAND, K. H.; SCHEPPERS, J. S. Use of a virtual reference concept to interpret active crop
canopy sensor data. Precision Agriculture, v. 14, p. 71-85, 2013.
HUSSAIN, F.; BRONSON, K. F.; YADVINDER, S.; BIJAY, S.; PENG, S. Use of chlorophyll meter
sufficiency indices for nitrogen management of irrigated rice in Asia. Agronomy Journal. 92:875-879,
2000.
KITCHEN, N. R.; SUDDUTH, K. A.; DRUMMOND, S. T. Is a nitrogen-rich reference needed for
canopy sensor-based corn nitrogen applications?. In: INTERNATIONAL CONFERENCE ON
PRECISION AGRICULTURE, 10., 2010, Denver. Proceedings... Monticello: ISPA, 2010. 1 CD-
ROM.
MYNENI, R. B.; NEMANI, R. R.; RUNNING, S. W. Estimation of global leaf area index and
absorbed PAR using radiative transfer models. IEEE Trans. Geosci. Remote Sensing. 33: 1380-1393.
1997.
PETERSON, T.A.; BLACKMER, T. M.; FRANCIS, D. D.; SCHEPERS, J. S. Using a chlorophyll
meter to improve N management. NebGuide G93-1171-A. University of Nebraska Ext., Lincoln,
1993.
RAUN, W. R.; SOLIE, J. B.; MAY, J.; ZHANG, H.; KELLY, J.; TAYLOR, R. K.; ARNALL, D. B.;
MONASTERIO, I. O. Nitrogen rich strips for wheat, corn and other crops. Publications E-1022.
Stillwater: Oklahoma State University Extension. 2010.
RAUN, W. R.; SOLIE, J. B.; TAYLOR, R. K.; ARNALL, D. B.; MACK, C. J.; EDMONDS, D. E.
Ramp calibration strip technology for determining midseason nitrogen rates in corn and wheat.
Agronomy Journal, Madison, v. 100, n. 4, p. 1088-1093, 2008.
ROSOLEM, C. A. Problemas em nutrição mineral, calagem e adubação do algodoeiro. Informações
Agronômicas, Piracicaba-SP, n. 95, 2001. 17 p. (Encarte Técnico).
ROUSE, J. W.; HAAS, R. H.; SCHELL, J. A.; DEERING, D. W.; HARLAN, J. C. Monitoring the
vernal advancement and retrogradation (green wave effect) of natural vegetation, Texas: Texas A&M
University, 1974. (Type III final. NASA/GSFC).
Preprints (www.preprints.org) | NOT PEER-REVIEWED | Posted: 12 October 2021 doi:10.20944/preprints202110.0183.v1
SANTOS, H. G.; JACOMINE, P. K. T.; ANJOS, L. H. C.; OLIVEIRA, V. A.; LUMBRERAS, J. F.;
COELHO, M. R.; ALMEIDA, J. A.; CUNHA, T. J. F.; OLIVEIRA, J. B. Sistema brasileiro de
classificação de solos. 3ª.ed. rev. Brasília, DF: Embrapa, 2013.
SCHEPERS, J. S.; FRANCIS, D. D.; VIGIL, M.; BELOW, F. E. Camparison of corn leaf nitrogen
concentration and chlorophyll meter readings. Communications in Soil Science and Plant Analysis.
v. 23, n. 17-20, p. 2173-2187, 1992.
SHIRATSUCHI, L. S.; BRANDAO, Z. N.; VICENTE, L. E.; VICTORIA, D. de C.; DUCATI, J. R.;
OLIVEIRA, R. P. de; VILELA, M. de F. Sensoriamento Remoto: conceitos básicos e aplicações na
Agricultura de Precisão.. In: BERNARDI, A. C. de C.; NAIME, J. de M.; RESENDE, A. V. de;
BASSOI, L. H.; INAMASU, R. Y. (Ed.). Agricultura de precisão: resultados de um novo olhar.
Brasília, DF: Embrapa, 2014.
SHIRATSUCHI, L. S.; VALE, W. G.; MALACARNE, T. J.; SCHUCK, C. M.; SILVA, R. G.;
JUNIOR, O. L. O. Algoritmos para aplicações de doses de variáveis de nitrogênio em tempo real para
produção de milho safra e safrinha no Cerrado. In: BERNARDI, A. C. C.; NAIME, J. M.; RESENDE,
A. V.; BASSOI, L. H.; INAMASU, R. Y. Agricultura de precisão: um novo olhar. Brasília, DF:
Embrapa, 2014. p. 226-232.
TARPLEY, L.; REDDY, K. R.; SASSENRATH-COLE, G. F. Reflectance indices with precision and
acurracy in prediction cotton leaf nitrogen concentration. Crop Science,
Madison, v. 1. n. 40, p. 1814-1819, 2000.
VARVEL, G. E.; WILHELM, W. W.; SHANAHAN, J. F.; SCHEPERS, J. S. Nitrogen fertilizer
applications for corn based on sufficiency index calculations. Agronomy Journal, 99, 701-706, 2007.
ZHU, J.; TREMBLAY, N.; LIANG, Y. Corn Nitrogen Status Indicator Less Affected by Soil Water
Content. Agronomy Journal. 103, 809, 2011.
Preprints (www.preprints.org) | NOT PEER-REVIEWED | Posted: 12 October 2021 doi:10.20944/preprints202110.0183.v1