Embed Size (px)
Citation preview

ACTIVE SCREEN PLASMA SURFACE MODIFICATION OF POLYMERIC MATERIALS FOR BIOMEDICAL APPLICATIONS
By Xin Fu
School of Metallurgy and Materials
College of Engineering and Physical Sciences The University of Birmingham
A thesis submitted to the University of Birmingham
for the degree of
DOCTOR OF PHILOSOPHY
January 2012
University of Birmingham Research Archive
e-theses repository This unpublished thesis/dissertation is copyright of the author and/or third parties. The intellectual property rights of the author or third parties in respect of this work are as defined by The Copyright Designs and Patents Act 1988 or as modified by any successor legislation. Any use made of information contained in this thesis/dissertation must be in accordance with that legislation and must be properly acknowledged. Further distribution or reproduction in any format is prohibited without the permission of the copyright holder.

I
Synopsis
Polymeric materials are important engineering materials and have been used in many
industrial sectors. They are being used increasingly in biomedical applications because of
their wide range of properties, relative ease of forming into a desired shape and relatively low
cost. For example, polymeric biomaterials have been used for the direct replacement of hard
and soft tissues and as biodegradable scaffolds for tissue engineering.
However, their surface properties such as surface hardness, wear resistance and
biocompatibility need reinforcement for demanding engineering and biomedical applications.
For instance, the hydrophobicity of a polymer surface, which results in poor cell attachment
and proliferation rate, has limited its biocompatibility in biomedical applications. Therefore,
polymeric materials must undergo surface modification to improve their hydrophilicity, cell
adhesion, and biocompatibility via either introducing functional groups onto their surface or
changing surface morphologies and surface energy.
Surface modification of polymers has long been known in polymer chemistry but has
not yet been widely applied to biomaterials. Widely used surface modification techniques
include coating, oxidation by low temperature plasma and surfactant addition, some of which
are no longer used because of their high cost or environmental concerns. Among them,
plasma treatment has received a great deal of attention for its numerous advantages, especially
its ability to uniformly modify the surface without affecting the bulk properties.
As non-conductive materials, polymers are unable to be treated in DC plasma directly.
However, a newly developed active screen plasma technology has great potential to treat non-
conductive materials such as polymers to improve their surface properties since this is a low-
temperature, low-cost and environmentally friendly process.
II
In this project, three kinds of polymeric materials: ultra high molecular weight
polyethylene (UHMWPE), polyurethane and polycaprolactone, were surface-modified using
newly developed active screen plasma nitriding technology. The change in surface
topography was investigated by profilometry, atomic force microscopy (AFM) and scanning
electron microscopy (SEM); the chemical composition and bonding structure of the plasma
modified surface was characterized by X-ray photoelectron spectroscopy (XPS), Fourier
transform infrared spectroscopy (FTIR) and Raman spectroscopy; the wettability of the
modified surface was evaluated by contact angle and surface energy measurement; the
biocompatibility of the surface treated UHMWPE samples was evaluated in vitro using
MC3T3-E1 osteoblast-like cells.
The results demonstrated that it is feasible to conduct plasma surface modification of
polymeric materials using the newly developed active-screen plasma technology without
causing any arcing etching, significant sputtering or other surface damage.
Changes in chemical composition and structure have been found on all three
polymeric surfaces following active screen plasma surface treatments. Crosslinking or/and
new functional groups are formed on the topmost surface layer after the treatment.
Along with changes in surface morphologies and structural, the wettability of the
surface of all three polymeric materials can also be effectively improved by the active screen
plasma nitriding treatments.
Active-screen plasma nitriding technique is an effective and practical method to
effectively improve osteoblast cell adhesion and spreading on the all surfaces of three
polymeric materials.

III
Acknowledgement
First of all, I would like to express my gratitude to my supervisors Prof. Hanshan
Dong and Dr. Mike J. Jenkins, for their invaluable supervisions in this study and the sharing
of their knowledge and experience in the area.
Thanks are especially due to Dr. Rachel L. Sammons for much kind help to me during
cell culture testing, Dr. Imre Bertóti for performing XPS tests and many helpful suggestions;
Dr. Jian Chen for help in performing nanoindentation tests and Dr. Dan Reed for help in
performing Raman tests.
Thanks are due to Dr. X. Y. Li and all the members in the Birmingham Surface
Engineering Group and other members in the School of Metallurgy and Materials, for their
assistance and discussions.
I also wish to express my gratitude to the School of Metallurgy and Materials at the
University of Birmingham and also to the Dorothy Hodgkin Postgraduate Awards (DHPA)
scheme for financial support for this study.
Finally, I wish to express my deepest gratitude to my family (especially my husband
and my son) and friends for their patience, help and encouragement throughout this
projectover the years.

IV
Publications
(Related to PhD study)
Fu X, Jenkins MJ, Bertoti I, Dong H.
Active screen plasma surface modification of polyurethane.
Presentation at Euromat 2009 Conference, Glasgow, Sept 2009.
Xin Fu, Rachel L. Sammons, Imre Bertoti, Mike J. Jenkins, Hanshan Dong.
Active screen plasma surface modification of polycaprolactone to improve cell
attachment.
Journal of Biomedical Materials Research, Part B-Applied Biomaterials. 2012; 100B(2):
314-320.
Xin Fu, Mike J. Jenkins1, Imre Bertoti, Hanshan Dong.
Characterization of Active Screen Plasma Modified Polyurethane Surfaces.
Surface & Coatings Technology (Submitted and on revision)
Xin Fu, Rachel L. Sammons, Mike J. Jenkins, Hanshan Dong
Effect of treatment temperature on surface characteristics and osteoblast cell attachment
of plasma modified UHMWPE.
Journal of Biomedical Materials Research, Part B-Applied Biomaterials. (Submitted)

V
List of Tables
Table 2.1 Typical Properties of HDPE and UHMWPE
Table 2.2 Comparison of low pressure plasma and active screen plasma
Table 2.3 Three primary modes of AFM
Table 2.4 Typical C1s binding energy (EB) for organic samples*
Table 2.5 Typical O1s binding energy (EB) for organic samples*
Table 3.1 Typical physical properties of TECAFINE PE10
Table 3.2 Typical physical properties of TUFSET rigid polyurethane
Table 3.3 Typical physical and chemical properties of polycaprolactone
Table 3.4 Active screen plasma nitriding treatment conditions of UHMWPE
Table 3.5 Active screen plasma nitriding treatment conditions of PU
Table 3.6 Active screen plasma nitriding treatment conditions of PCL
Table 4.1 Calculated results of 2θ and d values from XRD patterns of UHMWPE
Table 4.2 The crystallinity of UHMWPE before and after plasma treatment
Table 4.3 Surface roughness results of UHMWPE before and after plasma treatment
Table 4.4 Nano-indentation results of UHMWPE
Table 4.5 Wear factors of the untreated and ASPN treated UHMWPE samples (pin-on-disc, 5.89N)
Table 4.6 Reciprocating wear test profile area and friction coefficient of UHMWPE before and after plasma treatment (1000cycles, 3.92N)
Table 4.7 Wear area (nm2) of UHMWPE at different cycles and loads
Table 4.8 Contact angle results of UHMWPE
Table 4.9 Contact angle results with two liquids and surface energy of UHMWPE
Table 5.1 Main description of FTIR data of PU and ratio of absorbance value before and after plasma treatment
Table 5.2 Composition of untreated and ASPN treated PU samples
VI
Table 5.3 Surface roughness results of PU before and after plasma treatment
Table 5.4 Nano-indentation results of PU
Table 5.5 Improvement of wear resistance of PU samples before and after plasma treatment (Pin-on-disc, 9.81N)
Table 5.6 Wear area of PU before and after plasma treatment(Reciprocating, 10000 cycles)
Table 5.7 Contact angle results with two liquids and surface energy of PU
Table 6.1 Main XRD peak data of untreated and treated PCL
Table 6.2 Composition of untreated and ASPN treated PCL samples
Table 6.3 Surface roughness results of PCL before and after plasma treatment
Table 6.4 Contact angle results with two liquids and surface energy of PCL
Table 7.1 The main FTIR data of PU before and after ASPN treatment
Table 7.2 Changes in the infrared spectra of PU samples are associated with hydrogen bonding before and after ASPN treatment
Table 7.3 Changes observed in the spectra of PU samples with increasing treatment temperature and time are associated with the C=O stretching modes at 1730 cm−1 and 1705 cm−1.
Table 7.4 The main FTIR data of PCL before and after ASPN treatment
Table 7.5 The main Raman data of PCL before and after ASPN treatment
Table 7.6 Surface statistical parameters of UHMWPE for untreated and treated samples from AFM images
Table 7.7 Changes observed in the FTIR spectra of UHMWPE samples with increasing treatment temperature

VII
Figure Captions
Figure 2.1 Schematic of the chemical structure of ethylene and polyethylene
Figure 2.2 Generalized polyurethane reaction
Figure 2.3 Schematic of the chemical structure of polycaprolactone
Figure 2.4 Equilibrium contact angle θ
Figure 2.5 Active screen plasma system for surface modification of polymer a) Schematic diagram; b) Photo of plasma furnace
Figure 2.6 Schematic of structure of a vinyl polymer
Figure 2.7 A schematic representation of indentation load - displacement curves
Figure 2.8 A schematic representation of a section through an indentation
Figure 2.9 The arithmetic average roughness profile
Figure 2.10 Schematic illustration of the operation of AFM
Figure 2.11 Atomic force curves for interaction of two atoms
Figure 2.12 A schematic illustration of ATR-FTIR
Figure 3.1 Schematic of nano-indentation machine
Figure 3.2 Schematic of pin-on-disc machine and test configuration
Figure 4.1 DSC curve of UHMWPE
Figure 4.2 XRD pattern of untreated UHMWPE
Figure 4.3 XRD patterns of UHMWPE after ASPN treated at different temperatures
Figure 4.4 XRD patterns of UHMWPE after ASPN treated at different time
Figure 4.5 FTIR spectra of UHMWPE
Figure 4.6 FTIR spectra of UHMWPE from 1000 to 900 cm-1 wavenumbers
Figure 4.7 Crystal field splitting results in doublets at 730 and 720 cm−1
Figure 4.8 Crystal field splitting results in doublets at 1473 and 1460 cm−1
Figure 4.9 The AFM image of untreated UHMWPE
VIII
Figure 4.10 The AFM images of plasma treated UHMWPE at 130 ºC a) PE130-0.5h; b) PE130-1h; c) PE130-2h; d) PE130-5h
Figure 4.11 The AFM images of plasma treated UHMWPE at 100 ºC a) PE100-0.5h; b) PE100-1h; c) PE100-2h; d) PE100-5h
Figure 4.12 The AFM images of plasma treated UHMWPE at 80 ºC a) PE80-0.5h; b) PE80-1h; c) PE80-2h; d) PE80-5h
Figure 4.13 The AFM images of plasma treated UHMWPE at 60 ºC a) PE60-0.5h; b) PE60-1h; c) PE60-2h; d) PE60-5h
Figure 4.14 SEM image of untreated UHMWPE
Figure 4.15 SEM images of plasma treated UHMWPE at 60 ºC
Figure 4.16 SEM images of plasma treated UHMWPE at 80 ºC
Figure 4.17 SEM images of plasma treated UHMWPE at 100 ºC
Figure 4.18 SEM images of plasma treated UHMWPE at 130 ºC
Figure 4.19 Hardness of UHMWPE before and after plasma treatment
Figure 4.20 Modulus of UHMWPE before and after plasma treatment
Figure 4.21 H/E values of UHMWPE before and after plasma treatment
Figure 4.22 Morphology of wear (a) Untreated, (b) ASPN treatment
Figure 4.23 Wear profile of UHMWPE (a) untreated, (b) ASPN treated
Figure 4.24 Improvement of UHMWPE wear resistance (pin on disc) after plasma treatment
Figure 4.25 Wear area of UHMWPE at different loads before and after plasma treatment (Reciprocating, 2000cycles)
Figure 4.26 Scanning electron micrographs of cells attachment onto untreated UHMWPE(a. ×100; b.×4000; c.×8000)
Figure 4.27 Scanning electron micrographs of cells attachment onto ASPN treated UHMWPE at 80 ºC for 0.5 h (a. ×100; b.×3000; c.×4500)
Figure 4.28 Scanning electron micrographs of cells attachment onto ASPN treated UHMWPE at 100 ºC for 0.5 h (a. ×100; b.×4000; c.×2500)
Figure 4.29 Scanning electron micrographs of cells attachment onto ASPN treated UHMWPE at 130ºC for 0.5h (a. ×100; b.×4000; c.×5000)
IX
Figure 4.30 Four stages of osteoblast cells on surface of UHMWPE ASPN treated at 80 and 100 C. 1. Adhesion; 2. Filopodial growth; 3. Cytoplasmic webbing; 4. Flat cell.
Figure 4.31 Cell density on UHMWPE surface after attachment for 1h
Figure 5.1 DSC curves of polyurethane at different heating rate
Figure 5.2 Relation between glass transition temperature Tg and heating rate
Figure 5.3 XRD patterns of PU samples
Figure 5.4 FTIR spectra of PU
Figure 5.5 XPS spectra of polyurethane before and after plasma treatment a) C1s lines; b) O1s lines; c) N1s lines
Figure 5.6 C1s peaks fit of polyurethane a) untreated; b) treated.
Figure 5.7 O1s peaks fit of polyurethane a) untreated; b) treated.
Figure 5.8 N1s peaks fit of polyurethane a) untreated; b) treated.
Figure 5.9 Ra before and after plasma treatment (a) Plasma treated at 60C; (b) Plasma treated at 80C; (c) Plasma treated at 100C; (d) Plasma treated at 130C
Figure 5.10 The AFM image of untreated PU
Figure 5.11 The AFM images of plasma treated PU at 60C a) PU60-05h; b) PU60-1h; c) PU60-2h; d) PU60-5h
Figure 5.12 The AFM images of plasma treated PU at 80C a) PU80-05h; b) PU80-1h; c) PU80-2h; d) PU80-5h
Figure 5.13 The AFM images of plasma treated PU at 100C a) PU100-05h; b) PU100-1h; c) PU100-2h; d) PU100-5h
Figure 5.14 The AFM images of plasma treated PU at 130C a) PU130-05h; b) PU130-1h; c) PU130-2h; d) PU130-5h
Figure 5.15 SEM image of untreated polyurethane
Figure 5.16 SEM images of plasma treated PU at 60 C a) PU60-05h; b) PU60-1h; c) PU60-2h; d) PU60-5h
Figure 5.17 SEM images of plasma treated PU at 80 C a) PU80-05h; b) PU80-1h; c) PU80-2h; d) PU80-5h
X
Figure 5.18 SEM images of plasma treated PU at 100 C a) PU100-05h; b) PU100-1h; c) PU100-2h; d) PU100-5h
Figure 5.19 SEM images of plasma treated PU at 130 C a) PU130-05h; b) PU130-1h; c) PU130-2h; d) PU130-5h
Figure 5.20 Hardness of PU before and after plasma treatment
Figure 5.21 Modulus of PU before and after plasma treatment
Figure 5.22 Pin-on-disc wear track morphologies of polyurethane samples (a)Untreated; (b) Treated at 80 C,1 h; (c) Treated at 130 C,1 h
Figure 5.23 Improvement of wear resistance of PU samples before and after plasma treatment (Pin-on-disc, 9.81 N)
Figure 5.24 Reciprocating wear area of PU samples at different loads (10000cycles)
Figure 5.25 SEM micrographs of cells culture for 3days to untreated PU (a 100x, b 1000x)
Figure 5.26 SEM micrographs of cells culture for 3days to plasma treated PU at 80 ºC for 0.5 h (a 100x, b 1000x)
Figure 5.27 SEM micrographs of cells culture for 3days to plasma treated PU at 80 ºC for 5 h (a 100x, b 1000x)
Figure 5.28 SEM micrographs of cells culture for 3days to plasma treated PU at 100 ºC for 0.5 h (a 100x, b 1000x)
Figure 5.29 SEM micrographs of cells culture for 3days to plasma treated PU at 130 ºC for 0.5 h (a 100x, b 1000x)
Figure 5.30 MTT results of PU after 7days cell culture
Figure 6.1 DSC curve of polycaprolactone
Figure 6.2 The XRD results of PCL before and after plasma treatment
Figure 6.3 FTIR spectra of PCL 4000-500 cm-1 region
Figure 6.4 FTIR spectra of PCL 3500-3100 cm-1 region
Figure 6.5 C1s spectra of PCL before and after plasma treatment
Figure 6.6 O1s spectra of PCL before and after plasma treatment
Figure 6.7 Raman spectra of PCL
XI
Figure 6.8 The AFM image of untreated PCL
Figure 6.9 The AFM image of plasma treated PCL
Figure 6.10 SEM image of untreated PCL
Figure 6.11 SEM image of plasma treated PCL
Figure 6.12 Scanning electron micrographs of cells attachment onto untreated PCL (a. low magnification; b. high magnification)
Figure 6.13 Scanning electron micrographs of cells attachment onto ASPN treated PCL (a. low magnification; b. high magnification)
Figure 6.14 Cell density on surface after attachment for 1h
Figure 6.15 Scanning electron micrograph of cell culture for 3days onto untreated PCL
Figure 6.16 Scanning electron micrograph of cell culture for 3days onto treated PCL
Figure 6.17 MTT results of PCL after 7days cell culture
Figure 6.18 Degradation results of PCL films before and after plasma treatment
Figure 6.19 SEM images of degradation of untreated samples for different time (0h, 2h, 4h, 7h, 17h, 19h)
Figure 6.20 SEM images of degradation of plasma treated samples for different time (0h, 2h, 4h, 17h, 24h, 29h)
Figure 7.1 FTIR spectra of UHMWPE before and after plasma treatment at 1500-700 cm-1 region
Figure 7.2 AFM images of untreated UHMWPE sample (a) Height, (b) Deflection
Figure 7.3 AFM image of thermal treated PU sample at 130 °C for 2h
Figure 7.4 The relationship between nano-hardness and crystallinity before and after plasma treatment
Figure 7.5 The relationship between modulus and crystallinity before and after plasma treatment
Figure 7.6 Schematic of pin-on-disc wear characteristics on UHMWPE surface treated for 0.5h
Figure 7.7 Schematic of pin-on-disc wear characteristics on UHMWPE surface treated for 5h

XII
Figure 7.8 Schematic of reciprocating wear characteristics on UHMWPE treated surfaces
Figure 7.9 The percentage of the pore area on the surface of each sample of polyurethane after plasma treatment
i
Table of Contents 1 INTRODUCTION ......................................................................................................................... 1
1.1 BACKGROUND ................................................................................................................................. 1
1.2 AIM OF PROJECT .............................................................................................................................. 3
1.3 STRUCTURE OF THE THESIS ................................................................................................................. 4
2 LITERATURE REVIEW ................................................................................................................. 5
2.1 POLYMERIC MATERIALS ..................................................................................................................... 5
2.1.1 Ultra high molecular weight polyethylene (UHMWPE) ..................................................... 5
2.1.1.1 Structure and properties ..............................................................................................................5
2.1.1.2 Applications and problems...........................................................................................................6
2.1.2 Polyurethane (PU) rigid form............................................................................................. 7
2.1.2.1 Structure and properties ..............................................................................................................7
2.1.2.2 Applications and problems...........................................................................................................8
2.1.3 Polycaprolactone (PCL) ...................................................................................................... 9
2.1.3.1 Structure and properties ..............................................................................................................9
2.1.3.2 Applications and problems...........................................................................................................9
2.2 SURFACE PROPERTIES OF POLYMERIC MATERIALS .................................................................................. 10
2.2.1 Friction and wear ............................................................................................................. 10
2.2.1.1 Friction .......................................................................................................................................10
2.2.1.2 Wear...........................................................................................................................................12
2.2.2 Wettability ....................................................................................................................... 14
2.2.3 Contact angle and the Young equation ........................................................................... 14
2.2.4 Surface energy ................................................................................................................. 15
2.2.5 Biocompatibility............................................................................................................... 16
2.2.5.1 Concept of biocompatibility .......................................................................................................16
2.2.5.2 Biocompatibility assessment through cell culture .....................................................................17
2.2.6 Degradation .................................................................................................................... 18
2.2.7 Biomedical applications of polymeric materials .............................................................. 18
2.3 SURFACE MODIFICATION OF POLYMERIC MATERIALS .............................................................................. 19
2.3.1 Conventional surface modification techniques ............................................................... 19
2.3.1.1 Chemical modifications ..............................................................................................................19
2.3.1.2 Physical modifications ................................................................................................................20
2.3.1.3 Plasma treatment .......................................................................................................................21
2.3.1.4 Definition of plasma ...................................................................................................................21
2.3.1.5 Plasma based technology ...........................................................................................................21
2.3.2 Active screen plasma technology .................................................................................... 25
2.3.2.1 Fundamentals of active screen plasma technology ...................................................................25
2.3.2.2 Advantages of active screen plasma technology .......................................................................25
2.3.2.3 Comparisons of low-pressure plasma and active screen plasma technology ............................26
ii
2.3.2.4 Active screen plasma surface modification of polymers ............................................................27
2.3.2.5 Research status of ASP treatment of polymers ..........................................................................29
2.4 CHARACTERIZATION METHODS.......................................................................................................... 30
2.4.1 Differential scanning calorimetry (DSC) .......................................................................... 30
2.4.2 Nano-indentation ............................................................................................................ 31
2.4.3 Surface roughness measurement .................................................................................... 32
2.4.4 Atomic force microscopy (AFM) ...................................................................................... 32
2.4.5 Scan electronic microscopy (SEM) ................................................................................... 34
2.4.6 X-ray photoelectron spectroscopy (XPS) .......................................................................... 35
2.4.7 Fourier transform infrared spectroscopy (FTIR)............................................................... 37
2.4.8 X-ray diffraction (XRD) ..................................................................................................... 38
3 EXPERIMENTAL METHOD .........................................................................................................40
3.1 MATERIALS AND ACTIVE SCREEN PLASMA TREATMENT ........................................................................... 40
3.1.1 Materials and sample preparation .................................................................................. 40
3.1.2 Active screen plasma surface treatment ......................................................................... 41
3.1.2.1 Equipments details .....................................................................................................................41
3.1.2.2 Treatment conditions .................................................................................................................42
3.2 GENERAL MATERIALS CHARACTERISATION ........................................................................................... 42
3.2.1 Structure and composition .............................................................................................. 42
3.2.1.1 Differential scanning calorimetry (DSC) .....................................................................................42
3.2.1.2 X-ray diffraction (XRD) ...............................................................................................................43
3.2.1.3 Fourier transform infrared spectroscopy (FTIR) .........................................................................44
3.2.1.4 Raman spectroscopy ..................................................................................................................45
3.2.1.5 X-ray photoelectron spectroscopy (XPS) ....................................................................................45
3.2.2 Surface morphology ........................................................................................................ 46
3.2.2.1 Surface roughness test ...............................................................................................................46
3.2.2.2 Optical microscopy .....................................................................................................................46
3.2.2.3 Scanning electron microscopy (SEM) .........................................................................................46
3.2.2.4 Atomic force microscope (AFM) ................................................................................................47
3.2.3 Mechanical property assessment .................................................................................... 47
3.2.3.1 Nano-scale mechanical properties .............................................................................................47
3.2.3.2 Tribological properties ...............................................................................................................48
3.2.4 Contact angle and surface energy measurement ............................................................ 49
3.2.5 Biocompatibility assessment ........................................................................................... 50
3.2.5.1 Cell attachment ..........................................................................................................................50
3.2.5.2 Cell proliferation and cell metabolic activity ..............................................................................51
3.2.6 Self-degradation assessment .......................................................................................... 51
4 ULTRA HIGH MOLECULAR WEIGHT POLYETHYLENE (UHMWPE) RESULTS .................................53
4.1 DSC ............................................................................................................................................ 53
iii
4.2 XRD............................................................................................................................................ 53
4.3 FTIR ........................................................................................................................................... 55
4.4 SURFACE ROUGHNESS ..................................................................................................................... 56
4.5 AFM ........................................................................................................................................... 57
4.6 SEM ........................................................................................................................................... 58
4.7 NANO-HARDNESS AND MODULUS...................................................................................................... 58
4.8 WEAR RESISTANCE ......................................................................................................................... 59
4.9 CONTACT ANGLE AND SURFACE ENERGY .............................................................................................. 62
4.10 BIOCOMPATIBILITY .................................................................................................................... 62
5 POLYURETHANE (PU) RESULTS .................................................................................................64
5.1 DSC ............................................................................................................................................ 64
5.2 XRD............................................................................................................................................ 64
5.3 FTIR ........................................................................................................................................... 65
5.4 XPS ............................................................................................................................................ 66
5.5 SURFACE ROUGHNESS ..................................................................................................................... 68
5.6 AFM ........................................................................................................................................... 69
5.7 SEM ........................................................................................................................................... 69
5.8 NANO-HARDNESS AND MODULUS...................................................................................................... 70
5.9 WEAR RESISTANCE ......................................................................................................................... 70
5.10 CONTACT ANGLE AND SURFACE ENERGY ......................................................................................... 72
5.11 BIOCOMPATIBILITY .................................................................................................................... 73
6 POLYCAPROLACTONE (PCL) RESULTS........................................................................................74
6.1 DSC ............................................................................................................................................ 74
6.2 XRD............................................................................................................................................ 74
6.3 FTIR ........................................................................................................................................... 75
6.4 XPS ............................................................................................................................................ 76
6.5 RAMAN SPECTRA ........................................................................................................................... 77
6.6 SURFACE TOPOGRAPHY ................................................................................................................... 78
6.7 CONTACT ANGLE AND SURFACE ENERGY .............................................................................................. 78
6.8 BIOCOMPATIBILITY ......................................................................................................................... 79
6.9 DEGRADABILITY ............................................................................................................................. 80
7 GENERAL DISCUSSION ..............................................................................................................82
7.1 EFFECT ON SURFACE CHEMISTRY ....................................................................................................... 82
7.1.1 UHMWPE ......................................................................................................................... 82
7.1.2 PU .................................................................................................................................... 85
7.1.3 PCL ................................................................................................................................... 89
7.2 EFFECT ON SURFACE PHYSICS ............................................................................................................ 92

iv
7.2.1 Changes in surface topography ....................................................................................... 92
7.2.1.1 PU ...............................................................................................................................................92
7.2.1.2 PCL .............................................................................................................................................95
7.2.2 Changes in surface energy and wettability ..................................................................... 96
7.2.2.1 UHMWPE ...................................................................................................................................96
7.2.2.2 PU ...............................................................................................................................................97
7.2.2.3 PCL ...........................................................................................................................................101
7.3 EFFECT ON MECHANICAL PROPERTIES ............................................................................................... 101
7.3.1 Surface nano-hardness (H) and modulus (E) ................................................................. 101
7.3.1.1 UHMWPE .................................................................................................................................101
7.3.1.2 PU .............................................................................................................................................102
7.3.2 Changes in friction behaviour and wear resistance ....................................................... 104
7.3.2.1 UHMWPE .................................................................................................................................104
7.3.2.2 PU .............................................................................................................................................106
7.4 IMPROVEMENT OF CELL BIOCOMPATIBILITY ....................................................................................... 108
7.4.1 UHMWPE ....................................................................................................................... 108
7.4.2 PU .................................................................................................................................. 111
7.4.3 PCL ................................................................................................................................. 113
7.5 EFFECT ON SELF-DEGRADABILITY ..................................................................................................... 113
8 CONCLUSIONS ........................................................................................................................ 115
8.1 UHMWPE ................................................................................................................................ 115
8.2 POLYURETHANE (PU) ................................................................................................................... 115
8.3 POLYCAPROLACTONE (PCL) ........................................................................................................... 116
8.4 GENERAL CONCLUSIONS: ............................................................................................................... 117
9 FUTURE WORK ....................................................................................................................... 118
10 REFERENCES ........................................................................................................................... 120

1
1 Introduction
1.1 Background
Polymeric materials are important engineering materials and have been used in many
industrial sectors and they are being used increasingly in biomedical applications because of
their wide range of properties, relative ease of forming into a desired shape and relatively low
cost. For example, polymeric biomaterials have been used for the direct replacement of hard
and soft tissues and as biodegradable scaffolds for tissue engineering.
However, their surface properties such as surface hardness, wear resistance [1-3] and
biocompatibility [4-8] need enhancement for demanding engineering and biomedical
applications. For instance, the hydrophobicity of a polymer surface, which results in poor cell
attachment and proliferation rate, has limited its biocompatibility in biomedical applications.
Therefore, polymeric materials must undergo surface modification to improve their
hydrophilicity, cell adhesion, and biocompatibility via either introduction of functional groups
onto their surface [9, 10] or changing surface morphology and surface energy[11].
Surface engineering has been proved to be promising technology to improve the
surface properties of many materials. For instance, an effective approach for developing a
clinically applicable polymeric biomaterial is to modify the surface of the material which
already has proved biofunctionality and desirable bulk properties.
Surface modification of polymers has long been known in polymer chemistry but has
not yet widely applied to biomaterials. For longer than half a century, polymeric materials
used in industry have been subjected to surface modification. Widely used surface
modification techniques include coating, oxidation by low temperature plasma and surfactant

2
addition, some of which are no longer used because of their high cost or environmental
concerns. For the medical purpose, addition and blending technologies are not recommended
since the additives will leach out and cause potential cytotoxicity.
Surface modification of polymeric materials through covalent bonding without
causing any bulk deterioration is most desirable for biomaterials. Consequently, there has
been ever-growing interest in using surface engineering technology to change the surface
composition and topography, thus improving the tribological and mechanical properties,
wettability and biocompatibility [12-14] of polymeric materials.
A polymer surface can be modified by many surface modification techniques, such as
wet chemical treatment, plasma treatment, ion beam, ion implantation, laser treatment,
coating, alkaline hydrolysis [15-21]. Among them, plasma treatment has received a great deal
of attention for its numerous advantages, especially its ability to uniformly modify the surface
without affecting the bulk properties. The effects of using plasma techniques such as ion
implantation [22-24], plasma ion implantation [25, 26] or plasma immersion ion implantation
[3, 27] to modify the surface of polymeric materials have all been investigated.
In recent years, surface modification by cold plasma has become popular for wide
industrial applications. Apart from increasing concern about environmental pollution
problems, plasma treatment has received a great deal of attention for its numerous advantages,
especially its ability to uniformly modify the surface without affecting the bulk properties.
Typically, the depth of modification is 5-50 nm [28]. However, the direct current (DC) plasma
requires electrically conductive electrodes because an insulator would charge up and
terminate the discharge [29]. As non-conductive materials, polymers are unable to be treated
in DC plasma directly.
3
To alleviate the problem, an alternating current (AC) power source with high
frequencies has been used. However, these plasma treatments cannot avoid some
shortcomings. Firstly, the process parameters are extremely complex and highly system-
dependent. It is almost impossible to duplicate other research based on the descriptions
published in the papers. Secondly, a significant limitation is the need to use high vacuum,
which is often between 0.01-100 Pa, to achieve adequate plasma conditions [30]. This
requirement increases the cost of operation. Thirdly, charging and arcing cannot be avoided
during plasma treatment and may result in surface damage.
Therefore, the newly developed active screen plasma technology [31, 32], a low-
temperature, low-cost and environmentally friendly plasma process, has - great potential to
treat such non-conductive materials as polymers to improve their surface properties, which
forms the theme of this PhD project. According to their structure and possible response to
active species in plasma, polymeric materials can be divided into two groups [13] those which
would form cross-linking (group I) and those which would cause chain scission (group II). So
three typical polymers including UHMWPE (group I), PU (group II) and PCL (groupI or II)
are used as substrate materials. Ultra high molecular weight polyethylene (UHMWPE) has
been used in orthopedics as a bearing material in artificial joints because of its high impact
strength, low friction coefficient, and good chemical resistance [33, 34]. Polyurethane is used
for catheters and various orthopedic devices and instruments [35-37]. Polycaprolactone (PCL),
a biodegradable polyester, has attracted growing interest for its biomedical applications in
tissue engineering over the last few decades [38-44].
1.2 Aim of project
The proposed research seeks to realize the potential of active screen plasma
technology for the surface modification of polymeric materials to improve the hardness and
4
wear resistance of polymer tribo-surfaces and to improve the biocompatibility of polymer bio-
surface. The specific scientific and technologicial objectives of the research are:
To improve the hardness, wear resistance of polymer tribo-surfaces for such
articulating surfaces as joint prostheses, gear and bearings in functional devices.
To explore the possibility of a generating functional polymer surface with desired
surface texture and roughness, tailored surface wettability and improved cell
biocompatibility.
To characterise the structure, composition, nano-mechanical properties and wear
resistance of active screen plasma modified polymers.
To investigate the mechanisms involved in active screen plasma surface
modification of polymeric materials, thus advancing scientific understanding
1.3 Structure of the thesis
To achieve the above four objectives, systematic research activities have been
conducted including active-screen plasma modification of three polymers (UHMWPE, PU
and PCL), characterisation of modified surfaces using a range of modern surface techniques
and evaluation of surface mechanical and biological properties.
In this thesis, the fundamentals and surface properties of polymeric material,the state-
of-the art of surface modification of polymers and surface characterisation methods are first
reviewed in Chpater 2, followed by the experimental methods (Chapter 3). The experimental
results and their interpretation for UHMWPE, PU and PCL are reported in Chapters 4, 5 and 6
respectively and a general discussion is given in Chapter 7 to compare the response of these
three polymers to active-screen plasma modification. Finally, conclusions from this research
and the suggestions for future work are presented in Chapters 8 and 9, respectively.
5
2 Literature Review
2.1 Polymeric materials
Polymer literally means many parts. Chemically, polymers are long-chain molecules
of very high molecular weight, often measured in the hundreds of thousands. For this reason,
the term ―macromolecules‖ is frequently used when referring to polymeric materials.
Polymeric materials have been widely used across most industrial sectors owing to their
excellent physical, chemical and biological properties, coupled with relatively low cost,
providing cost-effective solutions. During the past two decades significant advances have
been made in the development of polymeric biomaterials for biomedical applications.
Polymeric biomaterials, such as ultra high molecular weight polyethylene (UHMWPE),
polyurethane(PU) and polycaprolactone(PCL), have been used also for the direct replacement
of hard and soft tissues and as biodegradable scaffolds for tissue engineering [34, 45, 46].
2.1.1 Ultra high molecular weight polyethylene (UHMWPE)
2.1.1.1 Structure and properties
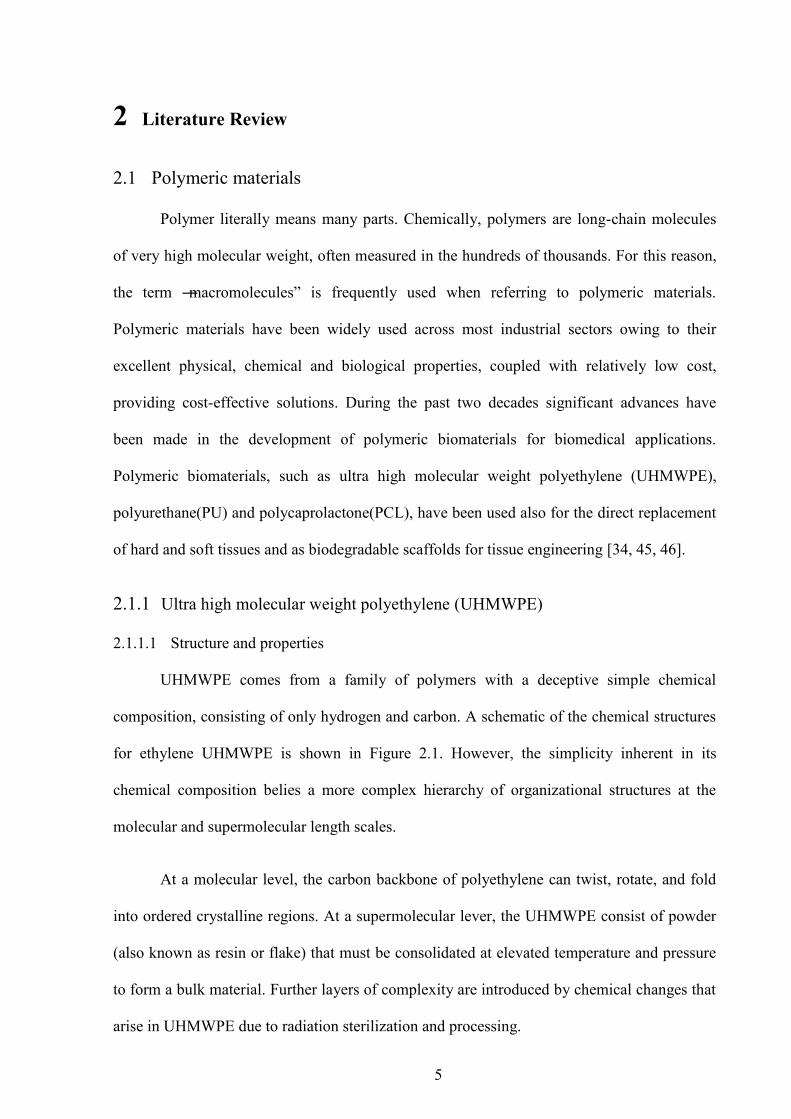
UHMWPE comes from a family of polymers with a deceptive simple chemical
composition, consisting of only hydrogen and carbon. A schematic of the chemical structures
for ethylene UHMWPE is shown in Figure 2.1. However, the simplicity inherent in its
chemical composition belies a more complex hierarchy of organizational structures at the
molecular and supermolecular length scales.
At a molecular level, the carbon backbone of polyethylene can twist, rotate, and fold
into ordered crystalline regions. At a supermolecular lever, the UHMWPE consist of powder
(also known as resin or flake) that must be consolidated at elevated temperature and pressure
to form a bulk material. Further layers of complexity are introduced by chemical changes that
arise in UHMWPE due to radiation sterilization and processing.
6
There are many kinds of polyethylene, such as low density polyethylene (LDPE), high
density polyethylene (HDPE) and UHMWPE. LDPE and HDPE are linear polymers each
with a molecular weight of less than 50,000 g/mol and up to 200,000 g/mol. In comparison,
UHMWPE has a viscosity average molecular weight of up to 6 million g/mol.
In UHMWPE, the glass transition and the melting temperature occur at around -160°C
and 137 °C respectively. Most bulk UHMWPEs are approximately 50-55 % crystalline.
UHMWPE has a higher ultimate strength and impact strength than other polyehylenes.
Therefore, UHMWPE is significantly more abrasion resistant and wear resistant from a
clinical perspective. Table 2.1 summarizes the physical and mechanical properties of HDPE
and UHMWPE [34].
2.1.1.2 Applications and problems
Since the 1950s, UHMWPE has been widely exploited for industrial applications,
including textile machinery, coal chutes, dump trucks, as well as bumps and siding for ships
and harbours. More than 90 % of the UHMWPE produced in the world is used by industry.
Since 1962, UHMWPE has been used in orthopedics as a bearing material in artificial
joints. Each year, about 1.4 million joint replacement procedures are performed around the
world [34]. However, the low surface hardness and poor wear resistance of polymers
frequently limit their applications in both industrial and biomedical areas when contact and
wear are involved. For example, both clinical and laboratory research has revealed that the
wear and the resultant wear debris of UHMWPE is one of the major causes of premature
failure of total joint replacement. It has been reported that ion implantation can improve the
surface properties by tailoring the surface morphologies of polymers [3, 47-49]. However,
conventional ion implantation is a line-of-sight process, so it is difficult in practice to
uniformly treat three-dimensional objects (such as sockets in artificial hip joints).
7
2.1.2 Polyurethane (PU) rigid form
2.1.2.1 Structure and properties
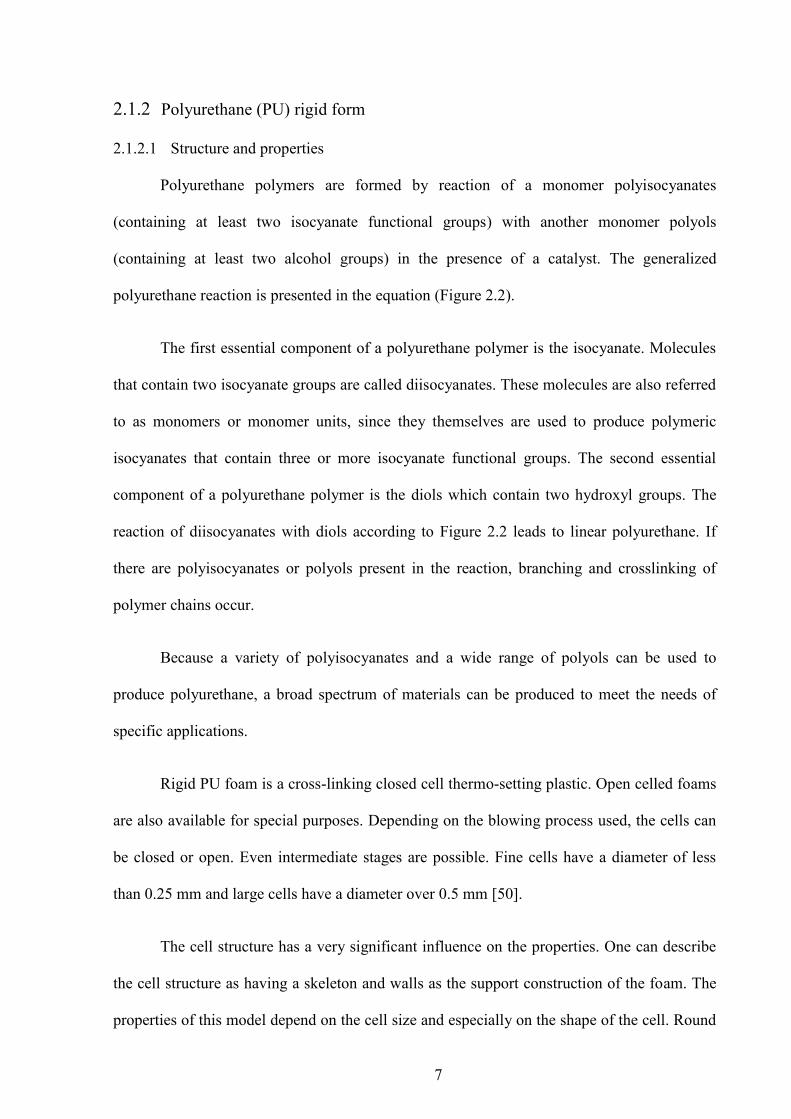
Polyurethane polymers are formed by reaction of a monomer polyisocyanates
(containing at least two isocyanate functional groups) with another monomer polyols
(containing at least two alcohol groups) in the presence of a catalyst. The generalized
polyurethane reaction is presented in the equation (Figure 2.2).
The first essential component of a polyurethane polymer is the isocyanate. Molecules
that contain two isocyanate groups are called diisocyanates. These molecules are also referred
to as monomers or monomer units, since they themselves are used to produce polymeric
isocyanates that contain three or more isocyanate functional groups. The second essential
component of a polyurethane polymer is the diols which contain two hydroxyl groups. The
reaction of diisocyanates with diols according to Figure 2.2 leads to linear polyurethane. If
there are polyisocyanates or polyols present in the reaction, branching and crosslinking of
polymer chains occur.
Because a variety of polyisocyanates and a wide range of polyols can be used to
produce polyurethane, a broad spectrum of materials can be produced to meet the needs of
specific applications.
Rigid PU foam is a cross-linking closed cell thermo-setting plastic. Open celled foams
are also available for special purposes. Depending on the blowing process used, the cells can
be closed or open. Even intermediate stages are possible. Fine cells have a diameter of less
than 0.25 mm and large cells have a diameter over 0.5 mm [50].
The cell structure has a very significant influence on the properties. One can describe
the cell structure as having a skeleton and walls as the support construction of the foam. The
properties of this model depend on the cell size and especially on the shape of the cell. Round

8
cells exhibit same properties in all directions; ellipsoid cells show anisotropic different
properties.
The properties of PU foams can be modified within wide limits dependent on the raw
materials used. This is also true for the area of PU rigid foams. The density, flowability,
strength, thermal stability, combustibility and other properties can be adjusted to suit the
requirements for a given application. Both polyols and isocyanates have major impacts on the
properties of the foams. PU rigid form has low thermal conductivity. The mechanical
properties are dependent on the density, the cell structure and manufacturing process.
2.1.2.2 Applications and problems
PU rigid form has been used industry as a insulation material, or a structural material
or as a combination of both because of the low thermal conductivity and good mechanical
properties.
Due to their good biocompatibility as well as mechanical properties, polyurethanes are
commonly used in a number of medical applications including catheter and general purpose
tubing, hospital bedding, surgical drapes, wound dressings, as well as in a variety of injection
molded devices. While traditionally PUs have been widely used for their excellent mechanical
properties and moderately good blood compatibility, they have also been singled out as being
problematic in terms of their long-term in vivo biostability in tissues. Preliminary
investigation by Li et al [51-53] has achieved some success in improving the wettability,
anticoagulability and anticalcific behaviour of polyurethane through oxygen and silicon ion
implantation.

9
2.1.3 Polycaprolactone (PCL)
2.1.3.1 Structure and properties
Polycaprolactone (PCL) (Figure 2.3) is a synthetic semicrystalline (about 50% of
crystallinity) [54], linear resorbable aliphatic polyester and is of great interest as it can be
obtained by the ring opened polymerization (ROP) of a monomeric unit ―ε-caprolactone‖
which is relatively cheap. Polycaprolactone is thermoplastic polymer with hydrolytically
labile aliphatic ester linkages in their backbone. Being aliphatic polyester with reasonably
short aliphatic chains between ester bonds, PCL can hydrolytic or enzymatic degrade over the
time frame required for most of the biomedical applications.
The PCL is very easy to process as it is soluble in a wide range of organic solvents,
has a low melting point (55-60 °C ) and relative low glass transition temperature (-60 °C )
[45]. Therefore, it is always in a rubbery state at room temperature. PCL has high thermal
stability because it has a higher decomposition temperature (Td) of 350 °C than most other
aliphatic polyesters (Td between 235 to 255 °C ) [55]. The polymer undergoes hydrolytic
degradation because of the presence of hydrolytically labile aliphatic ester linkages; however,
the rate of degradation is rather slow (Degradation generally undergoes 2-3 years to complete).
Due to its biodegradability, non-toxicity and biocompatibility, PCL has also been extensively
investigated as drug delivery devices [56]and scaffolds for tissue engineering [9, 57].
2.1.3.2 Applications and problems
Polycaprolactone(PCL) are versatile low-melting point biodegradable polymers
currently used in implanted devices for drug-delivery, e.g., for contraceptives and as
antibiotic-impregnated beads for control of infection in orthopaedic surgery. Modified
polycaprolactones have considerable future potential as biomaterials, e.g. as scaffods for bone
and cartilage repair [38]. However, PCL has poor hydrophilicity, which results in poor cell
attachment and proliferation rate. It has been shown that the initial surface properties of PCL
10
structures obtained by casting are not ideal for cellular culturing, with concurrent low cellular
development in vitro [11]. It has been also found that the surface morphologies and surface
energy of such polymers will greatly influence cellular adhesion, proliferation and phenotype
[9, 11]. Therefore, plasma treatment could modify the rate of resorption of polycaprolactones
in the body for a great variety of clinical applications.
2.2 Surface properties of polymeric materials
2.2.1 Friction and wear
Friction and wear are in fact very complicated phenomena, which depend on both bulk
and surface properties. Friction and wear processes are inevitable when two surfaces undergo
sliding or rolling under load. Friction is a serious cause of energy dissipation, and wear is a
major cause of material wastage [58].
2.2.1.1 Friction
Friction is the resistance to relative motion of contacting bodies. The degree of friction
is expressed as a coefficient of friction μ, which is the ratio of the force FT required to initiate
or sustain relative motion to the normal force FN that presses the two surfaces together.
Friction experienced during sliding conditions is known as sliding friction, and friction
experienced during rolling conditions is known as rolling friction [59].
a. Sliding friction
The sliding between sliding surfaces is due to the various combined effects of
adhesion between the flat surfaces, ploughing by wear particles and hard surface asperities,
and asperity deformation. The relative contribution of these components depends on the
specific material used, the surface topography, the conditions of sliding interface, and the
environment [60].
11
The following factors mainly contribute to the friction in sliding contact: adhesion,
ploughing, deformation and elastic hysteresis [60-62].
The adhesion component of friction is due to the formation and rupture of interfacial
bonds. These bonds are the results of interfacial interatomic forces that depend on the degree
of interpenetration of asperities and the surface composition. If sliding is to take place, the
fiction force is needed to shear the weakest tangential plane at the areas of real (actual)
contact.
If one of the sliding surfaces is harder than the other, the asperities of the harder
surface may penetrate and plough into the softer surface. Ploughing into the softer surface
also may occur as a result of impacted wear particles. In tangential motion, the ploughing
resistance is an addition to the friction force. In addition to the material properties, the
geometric properties of the asperities or the wear debris may significantly influence the
ploughing component of friction [60-62].
When the asperities of two sliding surfaces come into contact with each other, they
have to deform in such a way that the resulting displacement field is compatible with the
sliding direction and that the sum of the vertical components of surface traction at the
contacting asperities are equal to FN, the normal load. Plastic deformation is always
accompanied by a loss of energy, and it is this energy dissipation that accounts for the major
part of friction. Most of the energy required in elastic deformation is recoverable, and elastic
energy losses are therefore negligible compared with the energy losses associated with plastic
deformation.
When viscoelastic surfaces with high hysteresis loss (i.e., high internal damping) slide
against each other, external work must be done by tangential component of surface friction to
overcome the cycle energy loss due to the hysteresis loss. This is known as friction due to
12
elastic hysteresis and is generally significant in the sliding of viscoelastic materials, e.g.
polymers [59].
Friction force also can arise when the wear debris is viscoelastic or plastic substance
that sticks to the sliding interface and undergoes repeated deformation resulting in
consumption of energy.
b. Rolling friction
Rolling friction, although in general much smaller ( coefficient of friction is typically
5×10⁻³ to 10-5 ) than sliding friction (coefficient of friction is usually 10-1) [60], is also a very
complex phenomenon because of its dependence on so many factors, such as a varying
amounts of sliding ( or commonly referred to as slip) during rolling and energy losses during
mixed elastic and plastic deformation.
2.2.1.2 Wear
Wear is a process of removal of material from one or both of two solid surfaces in
solid-state contact. It occurs when solid surfaces are in sliding or rolling motion relative to
each other. Similar to friction, the wear behaviour of a material is also a very complicated
phenomenon in which various mechanisms and factors are involved.
The main types of wear are classified into several categories, based on quite distinct
and independent phenomena, as follows: abrasive wear, adhesive wear, fatigue wear, and
corrosive wear, etc [60].
a. Abrasive wear
Abrasive wear is caused by either hard asperities on counterface or hard particles
(third body) between the articulating surfaces [63].

13
The surface roughness values of the counterfaces are the determining factors for the
wear of a given polymer. Abrasive wear can be calculated by multiplying breaking strength
and elongation resistance. Any measure enhancing the strength without diminishing the
toughness is expected to improve abrasive wear resistance of polymeric materials.
b. Adhesive wear
Adhesive wear is associated with the intermolecular forces, including the attractive
Van der Waals and the repulsive electrostatic force. When most polymers slide over clean,
hard, smooth counterfaces, the interfacial shear strength of the adhesive junction is observed
to be greater than that of a polymer. The contact ruptures within the polymer as sliding
continues, owing to its soft or low strength nature. As a result, polymer is transferred to the
harder counterface and subsequently removed as wear debris. Any measure that can
effectively reduce polymer transfer (such as enhancing lubrication or cross-linking reaction)
would be expected to improve the adhesive resistance of a polymer [59].
c. Fatigue wear
Fatigue wear results from the formation of cracks associated with predominantly
elastic deformation over a number of contact cycles in the form of pitting, cracking, spalling
and delamination.
Fatigue wear occurs only when the counterface is smooth and adhesive action is
almost eliminated. If the counterface is relatively rough, the rate of removal of polymer by
abrasive and adhesive actions may be so high that the surface does not have time to develop
surface distress associated with fatigue [60].
14
Typical surface features of micro-fatigue (such as in UHMWPE acetabular cups) are
regular and irregular arrays of surface ripples and bumps. The rate of fatigue wear is usually
lower than that of either adhesive wear or abrasive wear [34].
d. Corrosive wear
The wear due to abrasive, adhesive and fatigue can be explained in terms of stress
interactions and deformation properties of the mating surfaces, but in corrosive wear, the
dynamic interaction between environment and mating material surfaces plays a significant
role [64].
This interaction gives rise to a cycle stepwise process: in the first step, the contacting
surfaces react with the environment, and reaction products are formed on the surface; in the
second step, attrition of the reaction products occurs as a result of crack formation and/or
abrasion in the contact interactions of the materials.
This process results in increased reactivity of the asperities because of increased
temperature and changes in the mechanical properties of the asperities.
2.2.2 Wettability
Wettability can be defined as the ability of a fluid to cover a solid surface. It varies
with both the completeness of the monolayer and its degree of order. Wettability also varies
with the polarity of the monolayer surface functional groups. Besides, surface contamination
and surface roughness can also modify the wettability [65].
2.2.3 Contact angle and the Young equation
An easily feasible and widely used method to determine the hydrophobicity degree is
the measurement of the contact angles. The degree of hydrophobicity provides information

15
about the wettability of a material. A high degree of hydrophobicity is synonymous for a low
wettability and vice versa.
As shown in Figure 2.4, a drop of liquid that is put on a solid surface will modify its
shape under the pressure of the different surface/interfacial tensions until reaching equilibrium.
Contact angle data can be obtain with low price instruments and with simple techniques.
Contact angle measurement is the most common method of solid surface tension
measurement. In 1805, Thomas Young described the three-phase equilibrium shown in
equation (2.2-1) and illustrated in Figure 2.4 [66].
γsg –γsl = γlg cosθ (Equation 2.2-1)
where γij is the interface tension between phases i and j, subscripts s, l and g refer to
solid, liquid and gas respectively and θ is the (Young) contact angle.
Wetting can be describe as the contact angle between a liquid and a solid is zero or so
close to zero that the liquid spreads easily over the solid surface. On the other hand, non-
wetting is that the contact angle is bigger than 90º, so that the liquid tends to ball-up and run
off the surface easily.
2.2.4 Surface energy
Surface energy, (gamma), is used interchangeably with the terms "surface free
energy" and "surface tension". The surface energies of liquids are readily determined by
measuring the surface tension.
Surface tension can be thought of as the energy required creating a unit area of an
interface. According Young equation, in order to promote wetting, both the liquid surface
tension and the solid-liquid interface tension should be decreased [67, 68].

16
If the energy required to create the solid-liquid (sl) interface is greater than that
required for creation of a solid-gas (sg) interface, then the critical angle will be greater than
90°. In other words, the liquid will ―bead up‖ on the surface to minimize the solid-liquid
interfacial area.
2.2.5 Biocompatibility
2.2.5.1 Concept of biocompatibility
Williams proposed the definition of biocompatibility, which is the ability of a material
to perform with an appropriate host response in a specific application [69].
The concept of biocompatibility is too general in theory rather than practical process.
The biocompatibility of an artificial material in the body is extremely complicated, involving
processes traditionally belonging to medical science, surface science, materials science, and
molecular biotechnology. For example, if the material surface has a very sharp edge or is
cationically charged, the cells and tissues in contact with it will be damaged physically or
chemically. One can say in these cases that the biomaterial is lacking in biocompatibility.
The biocompatibility of polymeric material relies on various parameters. Some of the
inherent properties of polymer can have an effect on their biocompatibility, which are
characteristics of the bulk material and those of the surface, such as (1) shape, (2) size, (3)
surface chemistry and roughness, (4) design, (5) morphology and porosity, (6) composition,
(7) surface energy and water absorption (8) hydrophilicity/hydrophobicity, (9) contact
duration and (10) degradation [4, 70-75].
Biocompatibility can be divided into two categories which are concerned with the
characteristics of bulk property of the biomaterial and with those of surface property.
Particularly, interfacial biocompatibility is closely related to the events occurring at the
interface between the biomaterial and the living cell or tissue [14]. One purpose of surface
17
modification is to improve this kind of biocompatibility for the biomaterial which is not toxic
and possesses good bulk and surface biocompatibility.
2.2.5.2 Biocompatibility assessment through cell culture
Cell culture is the process that cells removed from animal tissue will continue to grow
if supplied with sufficient nutrients and growth factors[76]. Cytocompatibility may be
evaluated in cell culture.
a. Cell number measurement
The most straightforward way for cell number measurement such as cell adhesion and
proliferation is to count the cell number after the cells are attached on substrate materials.
Many colorimetric methods have been developed for cell number measurement. Among them,
the MTT (Methylthiazoletetrazolium) method which is based on cell‘s metabolic viability test
is widely employed. MTT can be reduced by the dehydrogenase enzymes in cell plasma to
form a purple colored product. The total amount of the purple colored product can be
quantified by optical absorption, giving the total reduction ability of the dehydrogenase
enzymes in the cell population [77].
b. Cell imaging
Cell morphology and distribution on biomaterials is an important issue in tissue
engineering because it is often closely related to morphogenesis of the multicellular
organisms. The changes in cell morphology during adhesion and flattening on to the substrate
material surfaces in vitro can be studied with a scanning electron microscope (SEM) [78]or
atomic force microscopy (AFM) [77, 79-81].
18
2.2.6 Degradation
The study of degradation of polymers is important in understanding their usability,
recycling and reducing their impact on the environment [40, 45, 82-93]. The process of
‗degradation‘ describes the chain scission process during which polymer chains are cleaved to
form oligomers and finally to form monomers. There are different types of polymer
degradation such as photo-, thermal-, bio-, mechanical and oxidative and catalytic degradation
[45, 91, 92, 94-97].
All biodegradable polymers contain hydrolysable bonds. Their most important
degradation mechanism is, therefore, chemical degradation via hydrolysis or enzyme-
catalysed hydrolysis. The latter effect is often referred to as biodegradation, meaning that the
degradation is mediated at least partially by a biological system [45, 86]. Depending on the
mode of degradation, polymeric biomaterials can be further classified into hydrolytically
degradable polymers and enzymatically degradable polymers.
The main mechanism of in vivo degradation of polymers is hydrolytic degradation in
which enzymes may also play a role. For both synthetic and natural biodegradable materials,
particularly synthetic polymers, passive hydrolysis is the most important mode of degradation.
The main factors that have effects on the rate and the extent of degradation reaction include:
the type of chemical bond, molecular weight, crystallinity, glass transition temperature,
geometrical factors, pH, copolymer composition and water uptake etc [88]. Chemical and
physical changes go along with the degradation of biodegradable polymers so that in vivo
degradation is a highly complex phenomenon.
2.2.7 Biomedical applications of polymeric materials
Both nondegradable and biodegradable polymers have been widely employed in
biomedical applications. Although biomedical applications of natural polymers can be dated

19
back thousands of years, the synthetic biodegradable polymers with some of their medical
uses started only in the latter half of 1960s [98]. The main fields of biomedical applications of
polymeric materials include: orthopaedic implants (such as joint replacement, teeth), drug
delivery vehicles, regenerative medicine and tissue engineering etc.
An important trend in biomaterials research and development has been the
modification of synthetic polymers, which potentially exhibit improved biocompatibility, and
could enhance healing and regeneration of tissues. Particularly, surface properties of
biodegradable polymeric materials are important in biomedical applications, may be readily
modified physically, chemically, or biochemically. In addition, the effects of polymer surface
properties on the polymer-living system interface should be better understood. Many of the
current polymers need to be improved by surface modification techniques in order to produce
biomaterials with better performance in biomedical applications.
The better performances are determined by interactivity of the material with the
host[99]. Specific biomaterials characteristics (such as identified in Section 2.2.5.1) control
specific host responses (such as protein adsorption and desorption characteristics, endothelial
proliferation, osteoblast/osteoclast responses, etc.) and that refinement of the former should
lead to improvement of the latter and the production of better biocompatibility-based
performance.
2.3 Surface modification of polymeric materials
2.3.1 Conventional surface modification techniques
2.3.1.1 Chemical modifications
Chemical modification is mainly based on direct chemical reaction with given
chemical reagents. The main chemical modifications include wet treatment and surface
grafting.

20
Wet treatments were the first surface modification techniques used to modify the
chemical composition of polymer surface by direct chemical reaction with a given solution in
order to improve surface properties of polymers. The chemical solutions employed in the
treatment are usually acid solutions, organic solutions or other specific solutions, for example,
some acid solutions were used to oxidize polymer surface [100].
Surface grafting was a technique of chemical modification of the surface by the
covalent bonding of suitable macromolecular chains to the sample surface. The fundamental
steps are creation of reactive groups on the substrate surface and diffusion of monomer onto
the substrate [66].
2.3.1.2 Physical modifications
Physical modifications can be divided into two categories, one involved with high
energy media applied on the surface layer, the other with depositing a layer on top of the
surface. The main physical modifications include flame treatment, corona treatment, ultra
violet (UV) treatments, X-ray and γ-ray treatments as well as plasma treatment [101-104].
Flame treatment can generate high energy by the high temperature include radicals,
ions and molecules in excited state. This method is widely applied to introduce oxygen-
containing functions at polyolefin surface.
Corona treatment exploit the corona effect to form excited species(ions, radicals,
electrons, molecules in excited states) in surface modification at atmospheric pressure and
relatively low temperature.
UV treatments involve active photons which are usually energetic species with low
wavelength to activate many chemical reactions on surfaces.
21
Both X-ray and γ-ray treatments are high energy photon treatment which induces the
formation of radical sites at surfaces and involves mainly crosslinking of polymeric coatings
on surfaces.
2.3.1.3 Plasma treatment
Plasma-surface modification is an effective and economical surface treatment
technique for many materials and has been widely investigated for polymer surface
modification to obtain desired surface properties. Plasma and ion beam techniques are
particularly attractive owing to their flexibility and environmentally friendly nature compared
with conventional techniques. Consequently, there has been ever-growing interest in using
surface engineering technology to change the surface composition and morphology, and thus
to improve the wettability, surface mechanical properties and wear resistance of polymeric
materials [13, 22]. The possibilities of using such plasma techniques as ion implantation [23,
25], plasma ion implantation [26] or plasma immersion ion implantation [3, 27] to modify the
surface of polymeric materials have all been investigated. However, little work has been
conducted to modify the surface properties of polymeric materials by active-screen plasma.
2.3.1.4 Definition of plasma
There are many definitions of the term plasma, according to the various disciplines
generation of plasma being analogous to the transitions that occur when energy supplied to a
material causes solids to melt liquids to become gases. Sufficient additional energy supplied
to a gas creates plasma. Typically, a plasma is composed of a large concentration of highly
excited atomic, molecular, ionic, and radical species [58, 105].
2.3.1.5 Plasma based technology
Plasma can be obtained when gases are excited to high energetic states. In laboratory
conditions, the methods usually used are radio frequency (RF), microwave or electrons from a
22
hot filament discharge and direct current (DC) plasma. Plasma is a highly unusual and
reactive chemical environmental in which ionized and excited species can change the surface
properties of normally inert materials by introducing different functional groups into the
polymer surface layer. It is possible to manipulate these groups and surface properties of
polymer by carefully choosing the working gas or gases like argon, oxygen, nitrogen,
hydrogen, fluorine, carbon dioxide and water vapour [28, 29, 106, 107].
Plasma-based techniques combining the advantages of conventional plasma and ion
beam technologies are effective methods for surface modification of various materials.
a. Ion beam surface modification
It has been reported that ion implantation can improve the surface properties by
tailoring the surface morphologies of polymer [108-110]. However, conventional ion
implantation is a line-of sight process, so it is difficult to uniformly treat three-dimensional
objects (such as sockets in artificial hip joints).
A hybrid technology, plasma-enhanced ion implantation, has been developed recently,
which can help to address the problems with conventional ion implantation of components
with complex shapes [111]. This process does not utilize a light-of-sight ion gun, as in
conventional ion implantation, but rather a plasma which is biased periodically to bombard
the surface with ions from the plasma around the specimen. For instance, PI3 with nitrogen
has been successfully used to improve the wear resistance of UHMWPE by a factor of three
[112]. A recent comparison study has revealed that when implanted to the same dose, the PI3
treated UHMWPE showed a deeper and less brittle modified layer and thus a higher load
bearing capacity than the ion implanted one [113].
There are, however, problems inherent to the application of PI3 to non-conductive
polymeric materials such as the transfer of high-voltage bias to the polymer and surface

23
charging or arcing. Attempts to address these problems include using conductive substrate
holders, covering the surface not to be treated with conductive metal foils or by applying a
sacrificial conductive surface layer [114]. Although these approaches can, to some extent,
address the non-conductive problem for laboratory research, such procedures impose
difficulties (e.g., low efficiency, high cost and contamination) for the surface treatment of
polymeric materials on a industrial scale.
b. Low-pressure plasma surface modifacation
Low-pressure plasma surface modification can be used to modify the surface layer of
polymers without altering their bulk properties. A DC glow discharge plasma requires the use
of electrically conductive electrodes and therefore is not suitable for the surface modification
of most non-conductive polymers. A RF plasma can address such problem since it can be
initiated and sustained by external electrodes outside the reactor vessel. Although the
mechanism involved in the plasma surface modification of polymers are still open to debate,
the potential the interaction between plasma and polymer surface may include functional
group introduction, cross-linking, etching and backbone session. While the generation of
surface functional groups and cross-linking are desirable for most applications, excessive
etching and backbone scission lead to surface damage and the formation of a weakened
surface layer, which sometimes is referred to as surface degradation. Therefore, the efficacy
of plasma surface modification depends on the combined contribution of all these reactions.
It has been found that surface degradation is unavoidable in direct plasma modification
of polymers, in which samples are directly immersed in the plasma, and that the relative
importance of desirable surface modification and degradation depends not only on the nature
of polymers but also on the type of plasma. Therefore, how to minimize the degradation
reaction is crucial for maximizing the efficacy of plasma surface modification of polymeric

24
materials. Inagaki et al. [115-117] have reported that the degradation effect can be reduced by
‗remote plasma treatment‘, in which polymer samples to be treated are placed away from the
plasma zone. They claimed that the bombardment of ions and electrons cause degradation and
radicals in the plasma contribute to desirable surface modification. Therefore, in the remote
plasma treatment there are the predominant species for surface modification since radicals
have a much longer lifetime than electrons and ions.
Although their laboratory research demonstrated the important of remote plasma, it
should be pointed out that it is not a simple process to scale up such a laboratory experimental
set-up to a large production reactor. In addition, their work to date has been limited to
fluoropolymers and the mechanisms involved in the remote plasma surface modification of
polymers are far from being understood.
Limitations of low-pressure plasma surface modification
In recent years, surface modification by cold plasma is becoming popular in many
industrial applications. Apart from increasing concern about environmental pollution
problems, plasma treatment has received a great deal of attention for its numerous advantages,
especially its ability to uniformly modify the surface without affecting the bulk properties.
Typically, the depth of modification is 5-50 nm [28]. However, the direct current (DC) plasma
requires electrically conductive electrodes because an insulator would charge up and
terminate the discharge [29]. As non-conductive materials, polymers are unable to be treated
in DC plasma directly. To alleviate the problem, an alternating current (AC) power source
with high frequencies has been used. In general, the plasma power supply outputs a high
frequency voltage with a peak value from 5 to 40 kV and the power between 5 and 600 W
[107, 118-124]. This means that a more sophisticated, expensive oscillator and amplifier of
the power supply and other facilities are required. Owing to achievements in electronic
25
technology, the frequencies may be changed from radio frequency (RF, 100 kHz to 100 MHz)
to microwave (MW, above 1 GHz) [125]. Due to the complication of the plasma system, the
plasma process is extremely complex and highly system-dependent. It is almost impossible to
duplicate other research based on the descriptions published in the papers. Another significant
limitation is the need to use high vacuum, which is often between 0.01-100 Pa, to achieve
adequate plasma conditions [30]. This requirement increases the cost of operation. In addition,
charging and arcing cannot be avoided during plasma treatment and may result in surface
damage.
2.3.2 Active screen plasma technology
2.3.2.1 Fundamentals of active screen plasma technology
Recently, an innovate active screen plasma (ASP) technology(Figure 2.5)has been
developed based on the DC glow discharge technology and the principle of post-discharge
plasma [31, 32]. The entire workload is surrounded by a large screen, on which a high voltage
cathodic potencial is applied and the plasma forms. The worktable and the samples to be
treated are placed at floating potencial. The plasma formed on the screen contains a mixture
of ions, eletrons and other active species, which are then encouraged to flow through the
screen and over the workload by a specially designed gas flow.
Therefore, it may be possible to treat such non-conductive materials as polymers using
this newly developed active screen plasma technology.
2.3.2.2 Advantages of active screen plasma technology
The new ASP technology has been gradually adopted by industrial sector due to its
several distinct advantages [31, 126-128].
In a standard plasma furnace, the plasma surrounding the samples is used to heat them
up directly. Therefore, it is impossible to ensure that the temperature is the same at the outside
26
of the load as in the centre, where it will tend to be higher. In active screen plasma equipment,
the active screen is designed to surround the entire workload, and all parts are heated by
radiation from plasma on the screen. The temperature can be controlled very closely by
adjusting the current provided to the screen. Therefore, a uniform temperature distribution
around the components during treatment is produced, assisted by the direction of gas flow.
The parts bath continuously in a gentle flow of the active plasma species.
As the cathodic potential is applied to the metal screen, and not to the parts to be
treated, many damage effects to components, such as arcing, edge effects and hollow-cathode
damage, are completely avoided. Some arcing or hollow-cathode effects may well occur, but
this would happen on the active grid, where it will do no harm to the parts being treated.
Active screen plasma technology is usually reliable, reproducible, non-line-of-sight,
relatively inexpensive, and applicable to different sample geometries as well as different
materials such as metals, polymers, ceramics, and composites.
As an economical and effective materials processing, active screen plasma processing
can provide changes of a variety of surface characteristics, for example, chemical, tribological,
electrical, optical, biological, and mechanical and can be applied to industrial production
relatively easily.
2.3.2.3 Comparisons of low-pressure plasma and active screen plasma technology
The newly developed active screen plasma technology [31, 32] has great potential for
treatment of non-conductive materials such as polymers. In active screen plasma equipment,
an active screen is designed to surround the entire working table and all samples are heated by
radiation from a plasma on the screen. As the cathodic potential is applied to the metal screen,
and not to the samples to be treated, many damaging effects to work materials, such as arcing,
edge effects and hollow-cathode damage, are completely avoided. This provides a flexible,
27
low-temperature, low-cost and environmentally friendly process that allows tailoring of the
surface properties of the material to suit a specific need. From a technical point of view, the
sample to be treated by active screen plasma is in contact with active species from all around
the sample surface so that there is no restriction to the appearance of sample. The sample and
the working table are placed in a floating potential so that electrical conductivity of the
sample is not a necessary condition. From an economical point of view, active screen plasma
treatment operates with much lower voltage (under 500V), lower vacuum (100-500 Pa) and
similar low power (100-600 W) (Table 2.2) so that will effective reduce the cost of operating
and equipment. From a practical point of view, active screen plasma system is much simple
and effective than that of high frequency plasma so that will improve practical applicability
and produce reliable and effective results in industry application.
2.3.2.4 Active screen plasma surface modification of polymers
a) Plasma/ion interaction with polymer
(1) Cross-linking
Cross-linking of a polymer is defined as the linking of two or more molecular chains
by means of chemical (covalent) bonds. Cross-linking can be achieved by chemical or by
radiochemical reactions. However, chemical cross-linking is not used to process polymers for
medical applications because it usually generate hazardous chemical waste [129]. Essentially,
radiation affects materials by the deposition of high-density energy. Energetic ions are slowed
down in materials by momentum transfer to target atoms (nuclear stopping). The electronic
excitation or removal of valence electrons (ionization) can result in the formation of free
radicals that may readily cross-link the polymer chains, thereby, increasing the molecular
weight, hardness and wear resistance. Continued cross-linking causes the surface region to
become a three-dimensional network, which becomes an insoluble gel [130].
28
(2) Chain scission
Plasma/ion beam irradiation leads to irreversible changes in polymers. When energetic
ions are slowed down in materials by exciting the electronic system of the target (electronic
stopping), the displacement of the target atoms by energetic collisions can cause permanent
damage in a polymer mainly in the form of chain scission by displacing atoms from polymer
chains. If a bond that makes up part of the backbond of the molecule (such as C-C in
UHMWPE) breaks, this main chain scission result in degradation, with products of a lower
average molecular weight [131].
(3) Structure effect
A general empirical rule that irradiation deduce changes in polymer (cross-linking or
chain scission) is concern with the structure of polymers [13]. It follows that when the
structure of a vinyl polymer (Figure 2.6) is such that each carbon atom of the main chain
carries at least one hydrogen atom (or either R1or R2 is hydrogen), the polymer cross-linking
and thus belongs to group I. Alternatively, if a tetrasubstituted carbon atom is present in the
monomer unit (or neither R1 or R2 is hydrogen), the polymer degrades and belongs to group II.
This may be due to the fact that the carbon bond in the main chain is weakened by the
presence of the tetrasubstituted carbon atom since it causes a defect in the molecule by a steric
repulsion effect.
b) General principle of plasma modification of polymer
The plasma contains free electrons as well as other metastable particles that break
covalent chemical bones upon collision with the surfaces of polymers placed in the plasma
environment, thus creating free radicals on the polymer surface. The free radicals then
undergo additional reactions, depending on the gases present in the plasma or subsequent
29
exposure to gases in the atmosphere. The result is that these gas radical reactions form a
surface that is potentially very different from that of the starting bulk polymer. Because the
process is conducted in a reactor under very controlled conditions, the end result is very
reproducible.
Four mechanisms contribute to improvement in the adhesion of two components and
the adhesion of coatings [28, 29, 132, 133]:
Removal of surface contaminants and weakly bound polymer layers
Enhancement of wettability through incorporation of polar groups that facilitate
spontaneous spreading of adhesive or matrix resin
Formation of functional groups on the surface that permit covalent bounding
Aims of surface modification of polymers
2.3.2.5 Research status of ASP treatment of polymers
Supported by Advantage West Midlands (AWM), a Regional Authority Technology
Program, an industrial scale active screen plasma unit has recently been introduced into
Birmingham Surface Engineering Research Group, which is the first one installed in any
higher education organization on world-wide. Initial experimental observations made by the
Group have revealed that UHMWPE can be surface hardened by active screen plasma
technology. However the mechanism in improving surface properties has not been
investigated. Although a feasibility study of ASP treatment of PU has been conducted by an
undergraduate student in his final year project, systematic work needs to be conducted. With
regarding to PCL, no work has been conducted to modify its surface properties using the ASP
technology.

30
Characterization methods
2.3.3 Differential scanning calorimetry (DSC)
Differential scanning calorimetry or DSC is a thermoanalytical technique. The basic
principle underlying this technique is that, when the sample undergoes a physical
transformation such as phase transitions, more or less heat will need to flow to it than the
reference to maintain both at the same temperature. During a DSC analysis, the difference in
the amount of heat to increase the temperature between a sample and reference is recorded as
a function of temperature. The result of a DSC experiment is a curve of heat flow versus
temperature or versus time.
DSC is used widely for examining polymers to check a number of characteristic
properties, such as two major thermal transitions: the glass transition temperature (Tg), the
melt temperature(Tm). The glass transition is the temperature below which the polymer chains
behave like a brittle glass. Below Tg, the polymer chains cannot have enough thermal energy
to slide past one another. As we raise the temperature above Tg, the amorphous regions within
the polymer gain increase mobility. The transition appears as a step in the baseline of the
recorded DSC signal. This is due to the sample undergoing a change in heat capacity; no
formal phase change occurs. As the temperature increases, the smaller crystallites in the
polymer begin to melt, the sample eventually reaches its melting temperature (Tm). The
melting behavior of semicrystalline polymers is typically measured using DSC. The melting
process results in an endothermic peak in the DSC curve. The ability to determine transition
temperatures and enthalpies makes DSC an invaluable tool in producing phase diagrams for
various chemical systems. As the temperature of a semicrystalline polymer is raised above the
melt temperature, it may undergo a flow transition and become liquid.
31
2.3.4 Nano-indentation
Determining surface hardness and modulus of polymeric materials, from indentation
tests requires ultra-low-load indentation. However, the contact area is very difficult to
measure directly at such ultra-low-indentation.
Nanoindentation provides an effective technique to measure the local mechanical
properties at the microscale and nanoscale [134]. The two mechanical properties, the modulus
(E), and the hardness (H), are measured most frequently using load and depth sensing
indentation techniques. In a commonly used method data are obtained from one complete
cycle of loading and unloading. The method relies on the assumption that the contact area is a
constant during the initial unloading stages.
Figure 2.7 shows a schematic representation of load versus indenter displacement data
for an indentation experiment [135, 136]. In the Figure 2.7, Pmax is the peak indentation load;
hmax is the indenter displacement at peak load; hf is the final depth of the contact impression
after unloading.
Figure 2.8 shows a cross section of an indentation and identifies the parameters used
in analysis [135]. The analysis begins by Equations (2.4-1) and (2.4-2).
E
(Equation 2.4-1)
H
(Equation 2.4-2)
where A is the contact area and S is the measured stiffness. At peak load, the load is
Pmax. The contact area at peak load can be computed from the relation
A = F (hc) (Equation 2.4-3)
32
where hc is the vertical distance along which contact is made (hereafter called the
contact depth).
The contact depth hc can be determined by
hc = hmax-hs (Equation 2.4-4)
where hs is the displacement of the surface at the perimeter of the contact. At peak
load, the displacement is hmax.
hs =
h-hf) (Equation 2.4-5)
2.3.5 Surface roughness measurement
Surface roughness, often shortened to roughness, is a measure of surface topography.
Each of the roughness parameters is calculated using a formula for describing the surface.
There are many different roughness parameters in use, but Ra is by far the most common. Ra
is the arithmetic average of the roughness profile.
A section of standard length is sampled from the mean line on the roughness chart
(Figure 2.9). The mean line is laid on a Cartesian coordinate system wherein the mean line
runs in the direction of the x-axis and magnification is the y-axis. The value obtained with the
formula on the right is expressed in micrometer (μm) when y=f(x).
In the present research, a simply high performance stylus surface profilometer is used
to determine the surface roughness and an AFM-style three dimensional topographic image of
a surface.
2.3.6 Atomic force microscopy (AFM)
The atomic force microscope (AFM) was developed in 1986 by Binning, Quate, and
Gerber as a collaboration between IBM and Stanford University. AFM is a powerful tool to
33
study the surface topography of insulators, conductors, and semiconductors [79, 137, 138].
AFM measures surfaces in three dimensions. The roughness over a scanned surface area
(referring to the total distance the probe scanned) can be obtained.
In AFM, a cantilever is place parallel to the surface. The cantilever has a sharp, force-
sensing tip at its end, and it is this that interacts with the surface. As the interaction force
between the cantilever tip and the surface varies, deflections are produced in the cantilever.
These deflections may be measured and used to compile a topographic image of the surface.
The process is illustrated in Figure 2.10.
Atomic force microscopes have been designed which can monitor interactions due to a
range of forces between a tip and the sample surface. There are two principal modes of
interaction between tip and the surface: attractive and repulsive, which are in the range 10-9-
10-6 N. Figure 2.11 shows the relationship of atomic interaction and separation between the
tip and the surface, where F is the atomic interaction force between the tip and the surface, r is
the atomic separation between the tip and the surface.
There are three primary modes of AFM: contact mode AFM, non-contact mode AFM
and tapping mode AFM. The comparisons among three modes are listed in Table 2.3.
In the present research, AFM was carried out in contact mode to compile a
topographic image of the sample surface. Contact mode AFM operates by scanning a tip
attached to the end of a cantilever across the sample surface while monitoring the change in
cantilever deflection with a split photodiode detector. By maintaining a constant cantilever
deflection, the force between the tip and the sample remains constant. The force is calculated
from Hooke's Law: F = –kx, where F is force, k is spring constant and x is cantilever
deflection. The distance the scanner moves vertically at each (x,y) data point is stored by the
computer to form the topographic image of the sample surface.

34
2.3.7 Scan electronic microscopy (SEM)
A scanning electron microscope (SEM) is a type of electron microscope that images a
sample by scanning it with a high-energy beam of electrons in a raster scan pattern.
When a sample is bombarded with electrons, it emits secondary electrons and X-rays.
The intensity of the secondary electrons is detected to generate a high resolution surface
image. Non-conducting polymers must be sputter-coated with gold or platinum prior to
analysis. SEM is one of the more widely available tools in surface analysis and it is often used
to measure surface topography [139-141].
SEM can produce very high-resolution images of a sample surface, revealing details
about less than 1 to 5 nm in size. Due to the very narrow electron beam, SEM micrographs
have a large depth of field yielding a characteristic three-dimensional appearance useful for
understanding the surface structure of a sample. Therefore, resolution, magnification and
depth of field are important elements of SEM.
a. Resolution
The resolution of SEM is controlled by the electron beam diameter. It is clear that in
order to resolve two features, the smaller the electron beam diameter, the better resolution
effect can be achieved. But the increase of resolution has a limit because of defects of
condenser and objective lenses (their function is to focus the beam to a spot), such as
spherical aberration and chromatic aberration. In addition, if the electron beam diameter is too
small, then the signal will be weaker, and may be noisy.
b. Magnification
35
The magnification of SEM is concern with the resolution of screen display. The
minimum size of beam spot which may be obtained on a high quality cathode tube is
typically ~0.1mm (100 μm). The magnification is given by
M=100/d (Equation 2.4-6)
where M is the magnification of SEM, d is beam spot diameter (μm).
c. Depth of field
Apart from its good spatial resolution, one of the most important aspects of the
scanning electron microscope is its large depth of field. The important consequence of the
large depth of field of the SEM means providing a method of examining roughness or fracture
surfaces at high resolution. The depth of field h is given by
h = 0.2Dw/AM (mm) (Equation 2.4-7)
where A is objective aperture diameter, Dw is working distance, M is magnification.
2.3.8 X-ray photoelectron spectroscopy (XPS)
XPS determines the atomic composition of a solid‘s top several nanometers.
A surface irradiated by a photon source (X-ray) of sufficiently high energy will emit
electrons. The x-ray photon transfers its energy to a core-level electron imparting enough
energy for the electron to leave the atom. The basic physics of this process can be described
by the Einstein equation [66]:
EB = hν - EK (Equation 2.4-8)
36
where EB is the binding energy of the electron in the atom (a function of the type of
atom and its environmental), hν is the energy of X-ray source (a known value), and EK is the
kinetic energy of the emitted electron measured in the XPS spectrometer.
Binding energy will vary with the type of atom and the addition of other atoms bound
to that atom. The variations in binding energy that provide us with chemical information are
associated with covalent and ionic bonds between atoms. These changes in binding energy are
called chemical shifts.
The EB of an emitted photoelectron is simply the energy difference between the (n-1)-
electron final state and the n-electron initial state:
EB = Ef(n-1)-Ei(n) (Equation 2.4-9)
To covalent character polymers, it is usually assumed that initial state effects are
responsible for the observed chemical shifts. So that, if the energy of the atom‘s initial state is
changed, for example, by formation of chemical bonds with other atoms, then the EB of
electron in that atom will change.
In polymer surface modification, it is of interest to identify the presence of specific
functional groups. Because XPS analysis is limited to the top few nanometers of the surface,
samples must be handled carefully as even minor surface contamination is pronounced in the
resulting spectrum.
Table 2.4 and Table 2.5 list typical C1s and O1s EB values for functional groups present
in polymers [66].

37
2.3.9 Fourier transform infrared spectroscopy (FTIR)
Infrared (IR) spectroscopy is a technique based on the vibrations of the atoms of a
molecule. An infrared spectrum is commonly obtained by passing infrared radiation through a
sample and determining what fraction of the incident radiation is absorbed at a particular
energy because of vibration the atoms or molecules. The energy at which any peak in an
absorption spectrum appears corresponds to the frequency of a vibration of a part of a sample
molecule [66].
Fourier transform infrared spectroscopy (FTIR) is used to study the surface of the
sample in terms of its separate chemical structures. The mathematical operation of
transforming a signal which varies with path length to a spectrum in which intensity varies
with wavelength is known as Fourier transformation. The advantage that FTIR method brings
as compared to a dispersive instrument is that the signal level at the detector is always higher
and this automatically improves the signal-to-noise ratio at any point in the spectrum.
Many samples are opaque to IR radiation and thus cannot be studied in transmission
mode. Reflectance methods are particularly useful and have found wide application in surface
analysis [142].
The method used in my study was attenuated total reflectance (ATR) FTIR (Figure
2.12), employing a crystal in contact with the sample surface to measure reflected infrared
beams of different wavelengths. FTIR-ATR is a widely used technique in polymer research
for investigation of the chemical composition and structure near surface. In practice, the IR
radiation enters the prism and is incident on the surfaces of the prism at angles greater than
the critical angle. If the geometry of the experiment is arranged correctly, then multiple
internal reflection occurs. The detection region is within 103 nm beneath the surface
depending on the refractive index different between the crystal and the polymer surface [142].
38
The information is obtained by passing the evanescent wave of the infrared radiation through
a sample and determining which fraction of the incident radiation is absorbed at a particular
frequency (or wavenumber) in the IR spectrum.
2.3.10 X-ray diffraction (XRD)
X-ray diffraction (XRD) provides important structural information for polymers.
Useful XRD analysis data is obtained from crystalline, semi-crystalline, amorphous polymeric
materials. For ordinary synthetic polymer, the non-uniformity of the molecules makes it
impossible to form perfect single crystals. As a result, amorphous and crystalline phases are
present in a real polymer, and these entities have complex organization [143, 144].
The structure of semi-crystalline polymer substance consisting of two phases,
amorphous and crystalline as well as their fine texture, has a strong effect on physical and
mechanical properties of polymer. A detailed knowledge of the characteristics and
distribution of soft (amorphous) and hard (crystalline) domains and the interactions between
these domains is necessary.
X-ray diffraction (XRD) has long been successfully used to study various aspects of
these structures in semicrystalline polymers. The fraction of the material that is crystalline, the
crystallinity or crystalline index, is an important parameter. X-ray diffraction (XRD) is a
definitive technique for estimating the degree of crystallinity in polymers.
Relative crystallinity (crystalline index, CI) can be determined from a wide-angle X-
ray diffraction (WAXD) scan by comparing the areas under the crystalline peaks to the total
area under the scattering curve.
Polymer structural information obtained by XRD includes: polymer crystallinity,
orientation of polymers (crystalline and amorphous), crystalline microstructure, non-
39
crystalline periodicity and size, phase identification and quantification, crystal structure
variations (e.g. by lattice parameters), dynamic studies, in-situ studies at process
temperatures, , nano-scale analysis and research using XRD, etc [143].

40
3 Experimental method
3.1 Materials and active screen plasma treatment
3.1.1 Materials and sample preparation
UHMWPE samples were manufactured by Ensinger Ltd Company, UK [145]. The
commercial name of the product is TECAFINE PE10. It is a semi-crystalline, thermoplastic
engineering material rod with a diameter of 30 mm and opaque colour. The main
characteristics of the product are high toughness, good wear/abrasion resistance, and very
good low temperature properties.
The typical physical properties of TECAFINE PE10 are listed in Table 3.1. The data
sheet of TECAFINE PE10 is in appendix 1.
PU samples were purchased from TUFNOL Limited Company, UK [146]. The
commercial name of the product is TUFSET rigid polyurethane. It is a thermosetting plastic
material rod with a diameter of 30 mm and pale blue colour. It has good resistance to
chemicals, weather and UV radiation; excellent electrical and mechanical properties as well as
low water absorption.
The typical physical properties of TUFSET rigid polyurethane are listed in Table 3.2.
The data sheet of TUFSET rigid polyurethane is in appendix 2.
Disc samples of UHMWPE and PU with a thickness of 6mm were cut from the as-
received rods. The surface to be treated was wet ground with silicon carbide paper down to
2400.
Polycaprolactone row material was purchased from Sigma-Aldrich Company Ltd., UK.
It is a biodegradable polymer with an appearance of white or off-white colour pellet.

41
The typical physical and chemical properties of polycaprolactone are listed in Table
3.3. The data sheet of polycaprolactone is in appendix 3.
Thin films of PCL are often used in biomaterials research to determine the effect of
surface topography and chemical modifications on cell growth. The PCL film was
manufactured from chloroform solvent system by a solvent casting technique [147]. PCL
pellets (Aldrich, Mn = 80 K) were dissolved in chloroform and cast over glass sheets. The
solvent was removed by a slow evaporation. Films were further dried in vacuum at room
temperature for 48h.
3.1.2 Active screen plasma surface treatment
3.1.2.1 Equipments details
An active screen plasma treatment was performed in a conventional direct current (DC)
plasma nitriding furnace (40kW Klöckner Ionon). The active screen was made of 0.7 mm
thick perforated AISI 304 steel mesh with holes of 8 mm diameter throughout it, the overall
dimension of the mesh was was 130 mm in height and 120 mm in diameter; and the sample-
to-mesh distance was kept at around 15 mm. The AISI 304 mesh was subjected to the full
cathodic potential, whilst the worktable was electrically insulated with ceramic spacers, thus
leaving the specimens at floating potential (equipment details can be found elsewhere [148]).
Figure 2.5 shows the schematic diagram of the active screen plasma system.
The active screen plasma nitriding procedures were similar to the normal DC plasma
nitriding. It started with evacuating the chamber, back filled with treatment gases (nitrogen
and hydrogen) to the demand treatment pressure. When an electrical potential (0.2-0.3 kV)
was applied, plasma generated between the anodic furnace wall and the cathodic mesh,
providing the active species for the possible nitriding treatment. The entire working table was
surrounded by the large screen (cathodic mesh), on which a high voltage cathodic potencial

42
was applied and the plasma forms. The plasma formed on the screen contained a mixture of
ions, electrons and other active species, which were then encouraged to flow through the
screen and over the working table by a floating potential. Therefore, it is possible to treat such
non-conductive materials as polymers on the working table using this newly developed active
screen plasma technology.
3.1.2.2 Treatment conditions
A series of active screen plasma nitriding treatments were carried out with nitrogen
(25%) and hydrogen (75%) at different temperatures below the melting temperature of the
individual polymer. The chosen gases were selected based on the aim of incorporating new
nitrogen functionalities which were suggested to be good promoters for cell attachment [149,
150]. The ratio of gases was selected based on previous work in this group [127]. The
function of high concentration of hydrogen is the removal of surface oxides and cleaning of
surface [151, 152]. Treatment temperatures were measured by a thermocouple inserted into a
hole of 3mm diameter from the side wall to the centre of a dummy sample, which was also
placed on the working table in a symmetrical position to the samples to be treated. The
voltage applied on the screen during treatment was between 200 and 300 V. The treatment
pressure was 2 mbar. The effects of treatment temperature and time variations were also
investigated. The treatment conditions are listed in Table 3.4, Table 3.5and Table 3.6.
3.2 General materials characterisation
3.2.1 Structure and composition
3.2.1.1 Differential scanning calorimetry (DSC)

43
DSC tests were carried out using PERKIN-ELMER DSC7 differential scanning
calorimeter. The normal operating temperature range was from room temperature to 170 °C
with a heating rate of 10 ºC/min, 20 ºC/min and 40 ºC/min, respectively. The samples of 5 mg
- 10 mg were heated in aluminium pans with nitrogen as a purge gas.
3.2.1.2 X-ray diffraction (XRD)
XRD is a non-destructive technique. Significance information of structure can be
obtained from peaks in XRD pattern, including peak position, peak shape and peak width as
well as peak intensity, to identify crystalline phases and orientation and determine structural
properties: d-spacings and lattice parameters, residual strain, particle or grain size, phase
composition, etc.
Diffraction occurs only when Bragg‘s Law is satisfied condition for constructive
interference from planes with spacing d [143]:
2dsinθ = nλ (Equation 3.2-1)
where d is interplanar spacing, 2θ is diffraction angle, λ is the wavelength of the
incident X-ray beam, n is integer.
The crystallite size (L) can be estimated from the breadth of the diffraction peak using
the Scherrer equation [144]
(Equation 3.2-2)
where , 2θ and B (2θ) represent the wavelength, the diffraction angle and the width
(in radian) at the half maximum intensity.

44
The peak intensities were used to estimate the percent crystallinity. The change in the
relative intensity and the shift of angular position can be explained by a change in lattice
spacing [153].
The crystal structures of materials were characterized by X-ray diffraction (XRD)
using a Philips X‘pert MPD X-ray diffractometer with Cu-Kα radiation (wavelength is 0.154
nm) generated at 40 kV and 40 mA. The thin film samples of PCL were scanned from 0 to 70°
and the plate samples of UHMWPE and PU were scanned from 5 to 100° with a step size of
0.02° and a scan step time of 1 s.
3.2.1.3 Fourier transform infrared spectroscopy (FTIR)
Fourier transform infrared spectroscopy (FTIR) is used to study the surface of the
sample in terms of its separate chemical structures. The method used was attenuated total
reflectance (ATR) FTIR, employing a crystal in contact with the sample surface to measure
reflected infrared beams of different wavelengths. The wavelengths corresponding to different
chemical bonds can be determined according to a baseline. Untreated and ASP treated
samples were measured in order to determine if the chemical structure of the surface has been
altered as a result of plasma surface modification. A Nicolet Magna-IR 860 spectrometer
fitted with a golden gate diamond anvil optical unit (It is the most versatile infrared sampling
system. And its outstanding sensitivity is achieved using high pressure contact against a
solid.), DTGS KBr detector and KBr beamsplitter, was used for FTIR characterization. The
golden gate setup provides reliability and accuracy of results because it ensures, with its
ratchet torque action, constant load is applied to each sample. The analysis range was from
wave numbers 4000 to 700 cm–1. Analyses were done at 100 scans with a resolution of 4 cm-1.
45
3.2.1.4 Raman spectroscopy
Raman technique has been applied to the study of a wide range of materials, including
most solid surface. Raman spectroscopy is commonly used in chemistry, since vibrational
information is specific to the chemical bonds and symmetry of molecules. It is
complementary to infrared spectroscopy in that it is sensitive to those vibrational modes
which are either not observed via IR or give rise to only weak IR absorption bands. Especially,
Raman spectroscopy is suitable for the study of back bone structure of polymers.
Raman spectra were collected using a Renishaw InVia reflex Raman microscope. A
785 nm laser was focused using a long working distance 20× objective onto the sample with a
spot diameter of approximately 50 μm and beam power of 20 mW. The analysis range was
from wave numbers 4500 to 500 cm–1.
3.2.1.5 X-ray photoelectron spectroscopy (XPS)
The change in chemical composition and structure on the surface after plasma
treatment is characterized by X-ray photoelectron spectroscopy (XPS). XPS test was
performed by a Kratos XSAM 800 spectrometer using Mg Kα1,2(1253.6 eV) radiation and
fixed analyzer transmission mode (80 and 40 eV pass energies for survey and detailed spectra,
respectively). Data processing was performed by using the Kratos VISION 2000 program.
The overview spectra were taken between 50 and 1300 eV with an energy step of 0.5 eV,
while the detailed spectra of the peaks of interest (C ls, O ls and N 1s) were recorded with
an energy step of 0.1 eV.
Peak-envelops of the detailed spectra were fitted with minimum number of
component-peaks of Gauss-Lorentz (3:2) shape representing the chemical states of the given
element. The half-widths of the components were restricted to 1.7-1.9 eV, corresponding to

46
the resolution of the applied instrument setting. The chemical shifts were determined with an
accuracy of ±0.2 eV.
3.2.2 Surface morphology
3.2.2.1 Surface roughness test
Surface roughness Ra was measured by using surface roughness measuring instrument
SE1700. The length used for measurement that the stylus traversed on the examined surface
was 2.5 mm with a drive speed of 0.5 mm/s. All tests were repeated five times to improve the
reproducibility of the results.
3.2.2.2 Optical microscopy
Optical microscopy is a convenient method for of observing the surface of polymer. It
is very easy to use and the surface of polymer can be observed directly under an optical
microscope without any special preparation.
An optical microscope (Leitz DMRX from Leica Microsystems, Germany) was used
to observe and analyse the surface morphologies of the untreated and plasma surface treated
surfaces to study the effect of ASPN surface modification on the surface morphologies.
However, no optical microscopy could be achieved which was better than that of
scanning electron microscopy (SEM).
3.2.2.3 Scanning electron microscopy (SEM)
SEM is utilized to observe samples surface morphology. It is easy to prepare sample
specimens. SEM provides us a important means of examining the surfaces at high resolution
and large depth of field.
All polymer specimens were gold-metallized by sputter coating for 3 min and the
thickness of sputtered Au was between 10 and 12 nm. Surface topography was observed at 5-
47
20 kV with a Philips XL-30 scanning electron microscope or Oxford JEOL 7000 scanning
electron microscope.
3.2.2.4 Atomic force microscope (AFM)
AFM was used to study the effect of the ASPN surface modification on the surface
morphologies and roughness. The cantilever of the AFM has a sharp, force-sensing tip at its
end, and it is this that interacts with the surface. As the interaction force between the
cantilever tip and the surface varies, deflections are produced in the cantilever. These
deflections may be measured, and used to compile a topographic image of the surface.
AFM Dimension 3100 was used in contact mode to study the effect of ASPN surface
treatment on surface morphology. Contact mode imaging was performed using a silicon
nitride cantilever (nominal force constant 0.12 Nm-1). Scans were acquired at room
temperature in air at a tip velocity of 10.0 m.s-1. All tests were repeated over approximately
three sample areas to assess the reproducibility of the results.
3.2.3 Mechanical property assessment
3.2.3.1 Nano-scale mechanical properties
Nano-scale mechanical properties in terms of nanohardness and modulus were carried
out by an instrumented nano-indentation (Nano Test 600). A computer controlled Nano Test
600 machine (Micro Materials Ltd., UK), as shown in Figure 3.1, was used to evaluate the
surface hardness (H) and modulus (E) of the untreated and ASPN treated UHMWPE and PU
samples using a Berkovich indenter.
The indentation tests were carried out normal to the surface. Testing was performed
with continuous loading at a rate of 0.025 mNs-1 until a maximum load of 0.5 mN, then the
load was kept constant for 60 s and then fully unloaded. A totals of 49 points were tested on
each sample for the determination of the H and E values.

48
3.2.3.2 Tribological properties
The tribological properties (wear resistance and coefficient of friction) of surface
modified polymers were investigated employing a pin-on-disc tribometer for rotating
movement wear testing and a TE79 Multi-Axis Tribometer for reciprocating movement wear
testing in unlubricated conditions, respectively.
a. Pin-on-disc wear tests
The pin-on-disc were tests were conducted sliding against a hardened 8mm stainless
steel ball under a load of 6-10N at a rotational speed is 66 rpm for 4h. The wear loss was
quantified by measuring the profile of wear track. Five areas were measured from one wear
track and the average value was calculated.
In the test the sample is placed and secured inside a sample holder. The sample is
rotated against a stationary stainless steel ball (8 mm in diameter) under non-lubricated
conditions. The set up of the experiment can be seen in Figure 3.2. Once a wear profile had
been established on the surface of the samples, it was then necessary to measure the profile in
order to establish the wear rate experienced by each sample.
The following equation was used to calculate the wear factor.
The surface roughness measurement machine was used to obtain the wear volume.
The wear factor, defined as
k = V/LS (Equation 3.2-3)
where, V is the wear volume which is measured in mm3, L is the normal load which is
measured in Newtons (N), and S is the total distance of sliding which is measured in meters
(m), wear factor k, which is measured in mm3m-1N-1, was used to rank the wear performance
of each material. Details of the calculation of the wear factor can be found in a previous

49
publication [3, 154]. The higher the wear resistance is the lower the wear factor. The wear
volume loss was calculated by integrating the area across the wear profile measured by the
stylus profilometer, and then multiplying the circumference length of the track.
The wear resistance R, defined as the reciprocal of the wear factor, was used to
quantify the effect of the plasma on the wear performance.
R = LS/V (Equation 3.2-4)
b. Reciprocating movement wear tests
Reciprocating movement wear tests were conducted sliding against a hardened 8 mm
stainless steel ball under different loads from 1.98 N to 19.8 N at a speed of 10 mms-1 for
1000-20000 cycles. Reciprocating movement was carried out along one track in the X
direction. The sample was then rotated by 90º to carry out reciprocating movement in the Y
direction.
3.2.4 Contact angle and surface energy measurement
Contact angles were measured using a KRÜSS GmbH EASYDROP Contact Angle
Measuring System by the sessile drop method under distilled water, glycerol and ethylene
glycol. The tests were performed at ambient humidity and temperature and five drop
measurements were taken on each specimen to yield a statistical average.
The surface free energies were calculated according to Owens-Wendt method, which
use two liquids and compute two components: decomposes solid into dispersive and polar
components. Owens and Wends took the equation for the surface energy [155]:
(Equation 3.2-5)
as their basis and combined it with the Young equation

50
(Equation 3.2-6)
The combining rule equation is the geometric mean model calculating surface energy
(Equation 3.2-7)
where s and l refers to the solid and liquid, respectively; σD is the dispersive
component, and σP is the polar component of the surface energy; and θ is the contact angle.
Measuring contact angles of drops of two liquids with known values of and
, enables us
to obtain a set of two equations. To solve the equation system, it is possible to calculate the
polar ( ) and disperse (
) fractions of the surface energy of the solid. The surface energy
of the solid is calculated as:
(Equation3.2-8)
3.2.5 Biocompatibility assessment
Biocompatibility of the prepared UHMWPE samples was evaluated by in vitro cell
culture testing with mouse MC3T3-E1 osteoblast-like cells as a test model.
3.2.5.1 Cell attachment
Cells were cultured in McCoy‘s 5A medium with 10 % foetal calf serum, 2.5 % Hepes
and 1% Penicillin/Streptomycin. Polymer samples were sterilized with 70 % ethanol for 10
min and placed in the wells of 24-well tissue culture plates. Cell suspensions were obtained
by culturing the cells in 75 ml flasks until confluent; the cells were then detached from the
flask using trypsin-EDTA, centrifuged and resuspended in the same medium at a density of
5×10⁴ cells ml-1. 0.1 ml of this cell suspension was pipetted onto each sample and the cultures
were incubated in a 5% CO2 atmosphere incubator at 37 °C to allow cell attachment and
proliferation [113].

51
After 1h, 3days and 7days respectively, the test materials were taken out. The attached
cells on the test materials were washed three times in PBS and fixed in 0.1M sodium
cacodylate buffer (pH=7.3) containing 2.5% glutaraldehyde. Samples were then dehydrated in
ethanol and finally dried in hexamethyldisilisane. The numbers and morphology of the
attached cells on the UHMWPE sample surfaces was examined by scanning electron
microscopy (Philips XL-30) after gold sputter coating [78].
3.2.5.2 Cell proliferation and cell metabolic activity
As metabolically active cells reduce a tetrazolium salt (MTT), cellular activity, the
ability of live cells, was measured by MTT assay [15, 156].
MTT is a yellow tetrazolium salt that is cleaved to water-insoluble purple formazan by
viable cells via cell metabolism. After solution of the formazan, the amount of dye can be
quantified with a spectrophoto meter.
MTT assay shows how well the cells are metabolising.
3.2.6 Self-degradation assessment
Self-degradation of PCL films (untreated and plasma treated) was carried out in
phosphate buffered saline (PBS) solution [157]. Lipase from Pseudomonas cepacia was used
as a catalyst in order to complete the experiments in a reasonable time, because PCL can take
up to 1- 2 years to degrade appreciably [158, 159].
The degradation solution mixture was prepared as follows. Lipase from Pseudomonas
cepacia (Grade 62309, ~50 units/mg; Sigma, BioChemika, UK) was dissolved in 0.025 M
PBS (Sigma, BioChemika, UK) at a concentration of 7 mg ml-1.
52
PCL film samples with thickness about 0.7 mm were put into test tubes with a
diameter of 25 mm to which 5.0ml solution mixture was added and then labelled, sealed and
placed in a water bath at 37 ºC for certain time.
The samples were removed, washed with distilled water and touch-dried with a tissue
towel to a constant mass and weighed. The degradation rate is expressed as percentage mass
loss:
Mass loss %=(W0-W1)/W0×100 % (Equation 3.2-9)
where, W0 and W1 are mass of PCL films before and after the degradation test,
respectively.
53
4 Ultra high molecular weight polyethylene (UHMWPE) results
4.1 DSC
DSC was used to measure the melting temperature and enthalpy of fusion of untreated
UHMWPE and Figure 4.1 shows the DSC curves obtained. It can be seen that as the
temperature increased the heat flow increased first linearly before a peak appeared indicating
that the UHMWPE sample eventually reached its melting temperature (Tm). The melting
process resulted in the endothermic peak in the DSC curve. As shown in the curve, the
melting point of UHMWPE is 130.3 ± 0.3 ºC with an onset temperature of 79.8 ±0.4ºC.
The degree of crystallinity was calculated to be 50 % ±2 % according to the equation
below:
Crystallinity % = (△Hsample/△HUHMWPE) × 100 (Equation 4.1-1)
where △H is an enthalpy of fusion value and the fusion enthalpy of the fully
crystalline UHMWPE is taken as △HUHMWPE = 290 J g−1 [160].
4.2 XRD
In order to study the changes in crystal structures of UHMWPE induced by plasma
treatment, XRD was carried out in the range of 2θ angles from 5° to 100° for active screen
plasma treated samples and also for untreated samples for comparison. The XRD pattern of
untreated UHMWPE is shown in Figure 4.2, and the effect of plasma treatment temperature
and time is depicted Figures 4.3 and 4.4, respectively.
According to Figure 4.2, there are two main peaks at two-theta values of 21.66° and
23.98° corresponding to (110) and (200) peaks for the crystalline component of untreated
54
UHMWPE. There is also a wide halo at 19.8° corresponding to the amorphous component of
the untreated material.
According to Figure 4.3, comparing to the ratio of peak intensity (I110/I200), the ratio
increased as treatment temperature increased (I110/I200 for untreated sample, PE80-05h and
PE130-05h are 1.8324, 4.1177 and 4.2507, respectively), which indicated crystals along (200)
plane transferred into those along the (110) plane. According to Figure 4.4, after ASPN
treatment, the intensity of (110) peak increased while the (200) peak decreased, which
indicates the increase of crystallinity at (110) and decrease of crystallinity at (200) compared
to the untreated sample. In addition, it is noticed that the peaks of treated samples shifted to
low angles following the increase of time (2-5 h) and temperature (100-130 °C ) of active
screen plasma treatment. It is considered due to production of inner compressive stress after
treatment. The width of peaks at (110) increased, while those at (200) decreased. Table 4.1
shows the calculated results of 2 and d (d represents interplanar spacing) values from XRD
patterns of UHMWPE.
Under identical experimental conditions, the angle of diffraction 2θ for X-rays
diffracted by a set of crystal planes depends on the interplanar spacing d. To satisfy Bragg‘s
Law, 2θ must change as d changes, e.g., 2θ decreases as d increases. It can be seen from
Table 4.1 that plasma treatment can induce the changes in angle of diffraction 2θ and
interplanar spacing d, which reflect the differences in the internal crystal structure. However,
when plasma treatment performed at lower temperature (T≤ 80 °C ) or shorter time (t≤ 1 h),
the changes both in 2θ and d are very limited. Only when plasma treatment performed at
higher temperature (T≥ 100 °C ) and longer time (t≥ 2 h), the changes in 2θ and d are obvious
55
shown that 2θ moved to lower angle and d value increased. This implies that lattice strain
occurs and effects on diffraction peak position shifting to lower angle after plasma treatment.
Wide-angle X-ray diffraction is another technique for the determination of degrees of
crystallinity. The degrees of crystallinity can be calculated by quantitative decomposition of
the diffraction pattern into its crystalline and noncrystalline components. In practice, the
degree of crystallinity was calculated from the ratio of the area of crystalline peaks to the total
area under the scattering curve:
Crystallinity % =
× 100 (Equation 4.2-1)
where Ac is the area of crystalline peak, Aa is the area of amorphous halo.
As evidenced in Figures 4.3 and 4.4, some changes in crystal crystallinity occurred
during active screen plasma nitriding of UHMWPE. Table 4.2 shows the crystallinity of
UHMWPE before and after plasma treatment (calculated from XRD pattern using Jade 6.0
XRD analysis software). It can be seen from Table 4.2 that crystallinity increased as treatment
temperature or time increased.
4.3 FTIR
Fourier transform infrared spectroscopy (FTIR) was used to study the changes in
chemical structures of plasma treated UHMWPE surfaces. FTIR spectra of UHMWPE are
shown in Figures 4.5-4.8.
In Figure 4.5, for untreated UHMWPE, absorbance peaks at 2930 cm-1 and 2850 cm-1
are ascribed to the methylene (-CH2-CH2-) C-H asymmetric and symmetric stretching
vibration, absorbance peak at 1460 cm-1 is ascribed to the methylene (-CH2-CH2-) C-H
bending vibration, and absorbance peak at 720 cm-1 is ascribed to (CH2)n rocking band[161].
After ASPN treatment, all the peaks above that show the main characteristic bands associated

56
with aliphatic hydrocarbons are still in the spectra with a little new peak appearing. The
enlarged part from 1000 to 900 wavenumbers is shown in Figure 4.6. It can be seen that an
absorbance peak at 965 cm-1 (ascribed to the transvinylene group, -CH=CH-) and a peak at
910 cm-1 (ascribed to the terminal vinyl group, -CH=CH2) [34] were generated during the
ASPN treatment of UHMWPE.
For UHPMWE, crystal field splitting results in doublets at 730 and 720 cm−1 (CH2
rocking) and 1475 and 1460 cm−1 (CH2 bending) in infrared spectra (Figures 4.7 and 4.8)
[161].
There are three bands in the region between 735 and 715 cm-1, two are associated with
the crystalline fraction which appear near 730 and 720 cm-1 and are narrow than the third
band which represents the amorphous fraction near 723 cm-1.
The bands between 1480 and 1420 cm-1 due to methylene scissoring modes also
include three bands. Two are narrow and belong to crystalline fraction which appear at 1473
and 1460 cm-1. The boarder band near 1467 cm-1 is characteristic of the amorphous or
conformationally disordered structure.
The amorphous band is highly asymmetric which makes band fitting more difficult
and less accurate. For this reason, rocking bands in the 735-715 cm-1 region have been
preferred to be used for determination of crystallinity.
4.4 Surface roughness
For each sample specimen, surface roughness was measured before and after plasma
treatment to compared the effect on surface roughness induced by plasma treatment at
different treatment conditions. Detailed surface roughness information can be found in Table
4.3.

57
Comparing the surface roughness data of the ASPN treated and untreated UHMWPE
samples, it is clear that all the ASPN treatments increased the surface roughness of UHMWPE.
It is noted that except for the 2 h treated sample, the surface roughness of all other ASPN
treated samples increased with the treatment temperature especially when treated at 100 C or
above. When treated at 130 C, the surface roughness increased rapidly with the treatment
time.
4.5 AFM
An atomic force microscope (AFM) Dimension 3100 was used to study the effect of
ASPN surface treatment on surface topography. The AFM images of UHMWPE were
obtained in contact mode in air. Figures 4.9 –4.13 show the topographical measurements of
the untreated and treated UHMWPE surface obtained by AFM.
Active screen plasma nitriding can modify the surface topography of UHMWPE.
Comparison of the surface topography of the ASPN treated and untreated UHMWPE samples
revealed evidence of changes in surface topography following the active screen plasma
treatment. The surface of the untreated UHMWPE sample appears to be unorganised uneven
topography (Figure 4.9). After ASPN treatment, highly ordered cylindrical topography on the
surface is clearly visible running across the entire AFM images (Figures 4.10 and 4.11). With
the increase of treatment temperature and time, especially when treated at higher temperature
(100 C and above) or for longer time (2 h and above), highly grooved surface topography is
much clearer than those of treatment at lower temperature (80 C and below) or shorter time
(1h and below). According to surface roughness combining with AFM results, as treatment
temperature and time increased, the changes in both surface topography and average surface
roughness increased.

58
Such topographical changes could be attributed cross-linking, alignment of molecule
chain and changes in crystal structure by interaction between the plasma species and the
polymer surfaces and elevating temperature during plasma treatment.
4.6 SEM
Scanning electron microscopy (SEM) was utilized to observe and verify the changes in
sample surface topography. SEM images of plasma treated and untreated UHMWPE are
shown in Figures 4.14- 4.18.
Figure 4.14 shows that untreated UHMWPE presents bright strips with dark borders
randomly embedded in a ridged structure. A series of SEM measurements (Figures 4.15-4.18)
were performed after ASPN treatment. They demonstrated that the ribbons form as the
increase of treatment temperature and time, especially when treatment temperature increase
up to 100 C and above or treatment time increase up to 2 h and above. SEM images give
good agreement with the AFM results.
4.7 Nano-hardness and modulus
Hardness and modulus were determined directly by instrumented indentation
techniques from indentation load and displacement measurements on the surface of
UHMWPE materials.
Nano-hardness (H) and modulus (E) of the untreated and ASPN treated UHMWPE
samples were measured and the results are shown in Table 4.4 and Figures 4.19-4.21.
It can be seen that both surface hardness and modulus of UHMWPE increased after
plasma treatment. The effects of treatment temperature on H and E are the same. As the
treatment performed at 130C (no matter how long the treatment time is), both H and E
increased to the highest compared with other samples. The effects of treatment time on H and
59
E are different. H of samples treated for 0.5 h showed more increase than other samples for
the same treatment temperature. E increased following the increase of treatment time for all
samples as the treatment performed at 60 and 130C. As the treatment performed at 80 C, E
of samples treated for the 0.5 h showed the highest value; while the treatment performed at
100 C, E of samples treated both for 0.5 h and 1 h showed the higher value.
4.8 Wear resistance
The important biomedical application of UHMWPE is the primary bearing material in
total joint replacements. Modification of the surface of UHMWPE is essential for improving
the wear resistance of the materials, such as, orthopedic implants. In order to predict the
clinical wear performance of new materials researchers have designed various wear test
apparatus of artificial hip for predicting the in vivo wear rate, mainly including four types:
pin-on-plate, pin-on-disc, hip simulator, and ring-on-disc [162-166]. In this study, the
unidirectional pin-on-disc wear and the reciprocating pin-on-plate wear were performed on
both untreated and plasma treated UHMWPE surfaces.
a) Pin-on-disc wear test results
Wear behaviour of a series of UHMWPE samples (untreated and treated at 60-100C)
were studied by pin-on-disc wear tests. Consideration of the significant increase in surface
roughness when treatment performed at 130 C, there is no potential for application of these
samples. Therefore, the samples treated at 130 C were not selected for pin-on-disc wear test.
Optical microscopy was used to examine the specimen surfaces topography and the
wear tracks before and after testing and Figures 4.22 show wear track topography for the
untreated and ASPN treated UHMWPE (PE100-2h).

60
After wear test, it was found that a well-defined wear track was produced on the
untreated UHMWPE sample surface, as shown in Figure 4.22a. The track was rough with
many abrasive grooves, especially at the edge of wear track, and there were many trails of
pulls and smears in the direction of sliding which signifies the occurrence of abrasive wear. In
contrast, the wear track on the plasma nitrided sample (Figure 4.22b) was found to be very
superficial. The edge between the wear track and the unworn surface was not clear, and the
wear track was much narrow than that of untreated sample, suggesting less wear occurred on
the nitrided surface.
The typical wear track profiles generated as shown in Figure 4.23 allow a visual
representation of the cross section of the wear tracks. Quantitative wear factor was calculated
based on the cross-sectional wear track profiles (see Chapter 3) and the results are
summarised in Table 4.5.
As can be seen from the Figure 4.24 and Table 4.5, ASPN surface treatment at
different conditions has different effects on the wear of UHMWPE. There is a marked
improvement in the wear factor in certain treated samples and the most effective treatments
are those carried out at 80 C, 2 mbar for 2 h with an improvement by about 40 %.
From the wear results above, it seems that active screen plasma nitriding offers the
possibility to improve the wear resistance of polymers although the effect is highly dependent
on the treatment conditions. The results also indicate a strong correlation between wear
behaviour and microstructure changes (e.g., cross-linking, crystallinity, nano-hardness and
modulus, etc.) induced by plasma treatment.
b) Reciprocating pin-on-plate wear test results

61
According to nano-hardness and modulus results, the samples treated for 0.5 h can
obtain high nano-hardness and modulus values which will be beneficial for wear resistance.
For samples treated for 0.5 h, wear resistance all decreased. Therefore, a series of samples
treated for 0.5 h at different temperature were chosen to perform reciprocating pin-on-plate
wear test to investigate if any changes in wear resistance by different wear test apparatus.
Wear properties of untreated and ASPN treated UHMWPE were studied with a computerized
reciprocating pin-on-plate sliding wear apparatus at room temperature under unlubricated
conditions in air.
Table 4.6 shows UHMWPE wear test (1000 cycles, 3.92 N) profile area and friction
coefficient accordingly before and after plasma treatment. According to Table 4.6, the wear
areas of the sample treated at 100 C for 0.5h decreased comparing with untreated sample (PE)
which indicated an increase of wear resistance in reciprocating wear test. While, the sample
PE80-0.5h still showed the lower wear resistance which agrees with the pin-on-disc results.
However, the friction coefficient of all treated samples greatly increased. This could be the
reason for the decrease in wear resistance.
Furthermore, wear tests at longer distance and higher loads were performed to
investigate the changes in the wear resistance. Table 4.7 and Figure 4.25 show wear area of
UHMWPE at different loads (2000cycles). According to Table 4.7, with an increase of wear
distance or loads, wear areas of treated samples are bigger than that of untreated sample. It is
higher friction coefficient results in a greater wear area. When wear distance increased to
10000 cycles and loads increased to 9.81 N, wear area of all samples are almost same. It
indicates the wear was conducted on bulk and the bulk wear performance is not influenced by
plasma treatments.
62
4.9 Contact angle and surface energy
Static contact angle measurements of distilled water were performed to investigate the
changes in hydrophilicity of UHMWPE surface after ASPN treatment and the results are
listed in Table 4.8. According to Table 4.8, it can be seen that contact angles of all samples
decrease or remain unchanged after ASPN treatment. This means that the hydrophilicity
increased after ASPN treatment. As the treatment temperature increase, contact angles
increase. Furthermore, a group of samples (treated at different temperature for 0.5 h) were
chosen to investigate the surface properties in terms of surface free energy of the UHMWPE
samples, as characterized by static contact angle measurements, and the results are reported in
Table 4.9. This also shows the results of contact angle measurements of two liquids (distilled
water and Ethylene glycol). From the results, it can seen that after plasma treatment at 80
C/0.5 h, water tensile drop contact angle decreases from 79.9º to 68.3º, which indicates
increased wettability of the plasma treated surface; while surface energy increases from 26.96
mN m-1 to 34.06 mN m-1. When treatment temperature increased to 130 C/0.5 h, surface
energy (28.10 mN m-1) further decreased as compared to those of treated at 80 C/0.5 h,
though it increased as compared to those of untreated samples.
4.10 Biocompatibility
The SEM micrographs (Figures 4.26-4.29) show both morphology and numbers of
attached cells on different substrates.
The numbers of cells attached on untreated UHMWPE (Figure 4.26a) surface were
much lower than on 80 C/0.5 h and 100 C/0.5 h ASPN treated UHMWPE (Figures 4.27a-
4.28a). In addition, on the untreated surface, adhered cells were round or ovoid in shape
(Figures 4.26b-4.26c), the cell edges did not appear attached and filopodial growth was
minimal. According to the four stage classification of cell attachment [78], the cells were

63
mostly in Stage1 to Stage2. However, cells on the ASPN treated surface consisted of a small
part of spherical appearance and a large part of flattened appearance with small peripheral
filopodia and ruffled edges (Figures 4.27 b,c-4.28 b,c). The cells were more in Stage 2 to
Stage 4 with large percentages at Stages 3 or 4. Figure 4.30 presents four stages of cells
attaching on surface of UHMWPE ASPN treated at 80 C and 100 C.
However, for the UHMWPE sample treated at 130 ºC, the numbers of cells attached
on the surface were lower than those on 80 C/0.5 h and 100 C/0.5 h ASPN treated
UHMWPE but still increased comparing to those on untreated samples. The appearance of
cells appeared progressively blebs and bigger size (Figures 4.29 b,c)
Three samples were used for cell attachment assessments for each condition (untreated
and plasma treated). Cell density for all conditions (untreated and plasma treated) was
compared by counting the average number of cells from 15 fields (i.e. 5 fields on each
sample). The average and standard deviation are shown in Figure 4.31.
According to Figure 4.31, each mean of the two samples treated by plasma when
compared with that of the untreated sample is significantly different (t test, two tailed, p =
<0.01). Clearly, significantly more cells attached to the plasma treated UHMWPE surface
than to the untreated UHMWPE surface.
Therefore, the comparative study indicates that osteoblast cell adhesion and spreading
are better on the ASPN treated at 80-100 ºC UHMWPE surface than on the untreated surface.

64
5 Polyurethane (PU) results
5.1 DSC
DSC was carried out on untreated PU sample to study its glass transition temperature.
In the test the temperature of PU sample increased from room temperature to 150-170 ºC with
a heating rate of 10 ºC min-1, 20 ºC min-1 and 40 ºC min-1, respectively. Figure 5.1 shows
DSC curves of polyurethane at three different heating rates. Glass transitions may occur as the
temperature of an amorphous solid is increased. These transitions appear as a step in the
baseline of the recorded DSC signal. This is due to the sample undergoing a change in heat
capacity; no formal phase change occurs. As Tg depends on heating history and is subject to
thermal lag, extrapolation to zero heating rate yields an accurate value for Tg, which is 112.5
ºC at 0 heating rate. Figure 5.2 shows the relation between glass transition temperature Tg and
heating rate.
5.2 XRD
XRD was carried out on active screen plasma treated samples and also on untreated
samples for comparison. The XRD results of PU before and after plasma treatment are shown
in Figure 5.3.
As evidenced in Figure 5.3, the diffraction profiles show an amorphous broad shoulder,
diffused diffraction maximum at 2θ = 20°. It is likely that some soft segment-hard segment
phase mixing could occur in the system disturbing the soft segment crystallization [167]. This
may account for the broader diffraction. The two patterns are very similar, which means no
significant changes in crystal structure and degree of crystallinity during active screen plasma
nitriding of PU.

65
5.3 FTIR
FTIR tests were carried out to study the change of surface functional groups during
active screen plasma treatment, and the FTIR spectra of PU are shown in Figure 5.4.
On inspection of the higher wavenumber end of the spectrum, absorbance peak at
3300 cm-1 can be attributed to N-H stretching (hydrogen bonded) vibration, while the broad
shoulder which appears at around 3450 cm-1 is due to non-hydrogen-bonded N–H bonds [161].
There are also absorbance peaks at 2930 cm-1 and 2850 cm-1, due to C-H stretching vibration.
Furthermore, there are important information given between 1800 cm-1 and 1000 cm-1. The
strong absorbance band at 1700 cm-1 is ascribed to C=O stretching in hydrogen-bonded
urethane, while, the broad shoulder of the peak at 1730 cm-1 is indicative of C=O stretching in
non-hydrogen-bonded urethane [161]. The absorbance peak at 1305 cm-1 is ascribed to C-O
stretching, the absorbance peak at 1600 cm-1 is ascribe to N-H bending vibration, the
absorbance peak at 1520 cm-1 is due to coupling of N–H bending and C–N stretching, and the
absorbance peak at 1218 cm-1is ascribe to C-N stretching band [161].
After ASPN treatment, all absorbance peaks decreased. Although variations in the
peak intensity depend on operation of each test, the ratio of absorbance values of treated PUs
compare with those of untreated PU at the same wavenumber (Atreated/Auntreated) provides a
suitable approach to know the changes of each components. If the ratios (Atreated/Auntreated) at
different wavenumber are all the same, it implies that there is no changes of each components
after plasma treatment. If a ratio is smaller than others at specified wavenumber, the amounts
of the component decrease after plasma treatment. If larger, the amounts of the component
increase or a new component forms after plasma treatment.
The main description of FTIR data and the ratio of the absorbance value of treated
sample compared with untreated sample at each wavenumber are listed in Table 5.1.
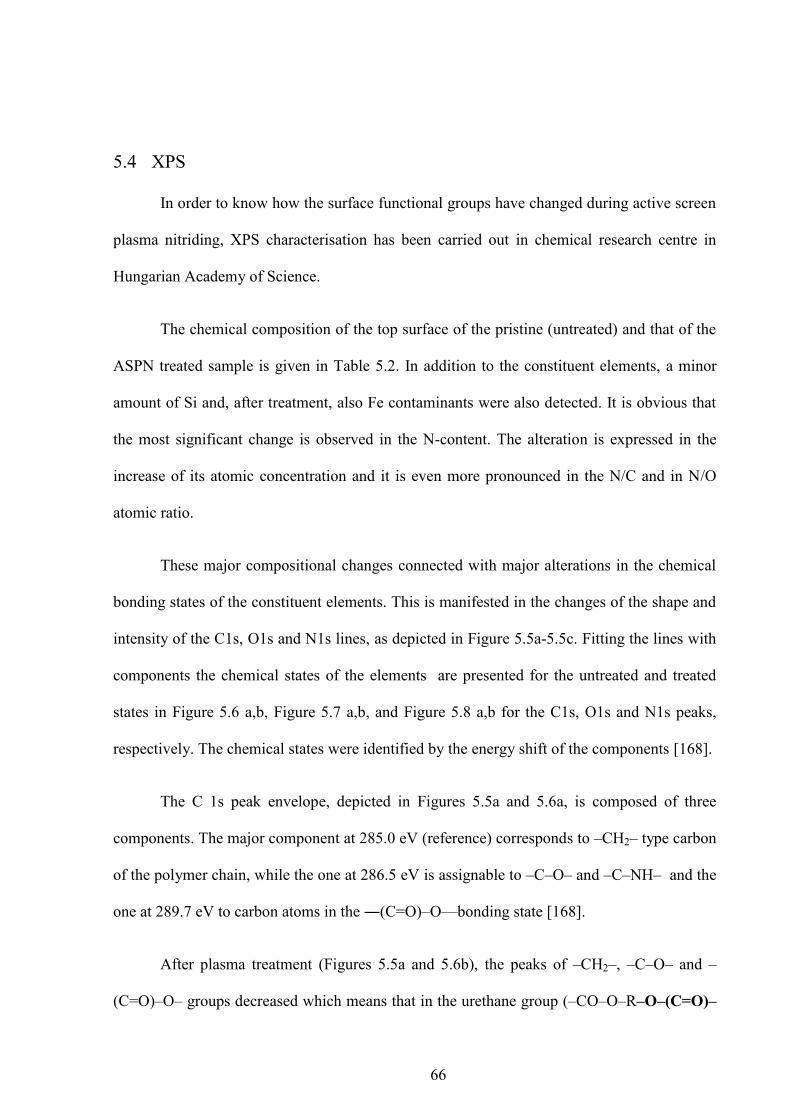
66
5.4 XPS
In order to know how the surface functional groups have changed during active screen
plasma nitriding, XPS characterisation has been carried out in chemical research centre in
Hungarian Academy of Science.
The chemical composition of the top surface of the pristine (untreated) and that of the
ASPN treated sample is given in Table 5.2. In addition to the constituent elements, a minor
amount of Si and, after treatment, also Fe contaminants were also detected. It is obvious that
the most significant change is observed in the N-content. The alteration is expressed in the
increase of its atomic concentration and it is even more pronounced in the N/C and in N/O
atomic ratio.
These major compositional changes connected with major alterations in the chemical
bonding states of the constituent elements. This is manifested in the changes of the shape and
intensity of the C1s, O1s and N1s lines, as depicted in Figure 5.5a-5.5c. Fitting the lines with
components the chemical states of the elements are presented for the untreated and treated
states in Figure 5.6 a,b, Figure 5.7 a,b, and Figure 5.8 a,b for the C1s, O1s and N1s peaks,
respectively. The chemical states were identified by the energy shift of the components [168].
The C 1s peak envelope, depicted in Figures 5.5a and 5.6a, is composed of three
components. The major component at 285.0 eV (reference) corresponds to –CH2– type carbon
of the polymer chain, while the one at 286.5 eV is assignable to –C–O– and –C–NH– and the
one at 289.7 eV to carbon atoms in the ―(C=O)–O—bonding state [168].
After plasma treatment (Figures 5.5a and 5.6b), the peaks of –CH2–, –C–O– and –
(C=O)–O– groups decreased which means that in the urethane group (–CO–O–R–O–(C=O)–
67
NH–R‘–NH–), the part of carboxyl groups (―(C=O)—O―) were broken and transformed to
another, more probably, to HO—C groups.
In the O 1s spectra, shown in Figure 5.5b and 5.7a,b, the intensity of the peak at 533.2
eV, assigned to the C—O―C group [168] decreases significantly, while that at 532 eV
increased. This increase could not be connected with the increase of the amount of –(C=O)–
O–, because its decrease was clearly determined by the diminishing intensity of the 289.7 eV
component of the C 1s line (Figure 5.5a). As a consequence, we attributed this increase (in
accordance with the IR results) to the development of HO–C groups, because chemical shift
of oxygen in the –OH groups may fall to this energy range. These self-consistent changes of
the C 1s and O 1s lines indicate that the carboxyl groups are decomposed and hydroxyl
groups are developed after plasma treatment.
The third component, appeared at 530.7 eV in the O 1s spectrum after treatment
(Figure 5.7 b), corresponds to O atoms bonded to the oxidized FeOOH type contamination
which came from the stainless steel mesh.
The most significant change was observed from the comparison of the N1s spectra
(Figures 5.5 c and 5.8 a,b) recorded before and after plasma treatment. The large increase of
the intensity of the N1s spectrum can be related partly to the relative stability of the C-NH-C
bonds [169] at such treatment and partly to the preferential surface enhancement and
aggregation of the N-containing groups due to the nitriding effect of the ASP treatment. In the
light of the increased N-content the overall decrease of the carbon signal, even that of the –
(CH2)n– polymer chain, can be easily understood.
As concerning the chemical state of nitrogen, the following observations could be
made. In the untreated sample, as expected, the narrow N 1s line is at 400.4 eV, i.e. the
nitrogen is in one single chemical state in the urethane (-OOC-NH-C-) group. As it was

68
expressed above, these groups are partly decomposed, and new species appeared: at 399.7 eV
C-N-C and C≡N states developed and the low energy peak at 398.7 eV assignable to the –
C=N– groups, multiply detected in and reported for the plasma deposited carbon-nitride (CNx)
coatings [170]. And another reason could probably be attributed to N2 is being released from
the polymer as bubbles to the surface.
5.5 Surface roughness
The surface roughness was measured before and after plasma treatments in order to
study the plasma treatment effect. For each PU sample specimen, surface roughness was
measured before and after plasma treatment to compare effects on surface roughness induced
by plasma treatment at different treatment conditions. Detailed surface roughness information
can be found in Table 5.3 and Figure 5.9.
All the results are also shown in these four bar charts (Figure 5.9). The blue bar is for
untreated sample, while the red bar is for plasma treated sample.
From the results, it can be seen that for most samples after plasma treatment, their
surface roughness changed little. When plasma treatments were performed under 80 C, the
increases of surface roughness are all under 15% no matter for how long the treatment was
performed. When plasma treatment was performed at 100 C, the increases of surface
roughness are all under 18% after treatment for 0.5 or 1h; the surface roughness increased by
30% and 87% after treatment for 2 or 5h, respectively. When plasma treatment is performed
at 130 C for 0.5 and 1h, the increase of surface roughness are still under 30% (by 11% and
27%, respectively). Only at 130 C, after treatment for 2 or 5 h, does surface roughness
increase significantly (increased by 683% and 253%, respectively). It is because 130C is
beyond Tg (112C) of PU, the polymer chains undergo a large change in mobility and produce
69
surface deformation at treatment performed at this temperature. The significant increase in
surface roughness is probably due to surface deformation by thermal stress.
5.6 AFM
The AFM images of untreated and plasma treated PU were obtained in contact mode
in air. Figures 5.10 –5.14 show the topographical measurements of the untreated and treated
PU surface obtained by AFM.
According AFM images, the surface of untreated polyurethane presents a closed cell
structure. After plasma treatments, cracks and pores can be formed on the surfaces. As the
treatment temperature increases, the depth of cracks and pores also increase accordingly. See
Section 7.2.1.1.
5.7 SEM
Surface morphology was characterised by SEM (Figures 5.15- 5.19).
From the SEM and AFM images, it can be seen that untreated polyurethane (Figure
5.10 and Figure 5.15) has a closed cell structure with only a small portion of open cells. The
percentage of the pore area on the surface is only about 4.9% (calculated according Figure
5.10 by Image J 1.44 analysis software).
Treatment temperature and time play an important role in determining changes in
surface topography. When plasma treatment is performed at relatively low temperatures
(≤100C) for not more than 1 hour, small cracks and pores can be formed on the surface; in
contrast, higher proportion of larger, more rounded pores can also be found on the surface
when plasma treatment performed at high temperature (130C) for longer time (≥2 h).

70
For example, after plasma treatment at 80 C for 0.5h, (Figure 5.17a and 5.12a), there
are some small cracks and pores on the surface and no separate cells can be observed. The
percentage of the pore area on the surface increased to about 9.2% (calculated according
Figure 5.17a by Image J 1.44 analysis software). However, after plasma treatment 130 C for
0.5h (Figure 5.19a and 5.14a), many cells are broken and there are some small pores at the
bottom of the broken cells; in addition, more larger and round pores can also be found on the
surface. The percentage of the pore area on the surface increased at about 24.2% (calculated
according Figure 5.19a by Image J 1.44 analysis software).
5.8 Nano-hardness and modulus
Nano-hardness (H) and modulus (E) of the untreated and ASPN treated PU samples
were measured and the results are shown in Table 5.4 and Figures 5.20-5.21.
According to Table 5.4 and Figures 5.20-5.21, the nano-hardness of PU surface
increased after plasma treatment and modulus of plasma treated PU surface almost maintained
the same values compared with untreated sample (except for PU80-0.5h). As a result, the
value of H/E increased with the increase of treatment temperature and time.
5.9 Wear resistance
a) Pin-on-disc wear tests results
Pin-on-disc wear track topography for the untreated and ASPN treated polyurethane
are shown in Figure 5.22.
According to Figure 5.22, the difference of wear tracks between untreated and treated
samples is clear. After plasma treatment at 80C for 1h, the wear track of the sample is more
superficial and the track width is also found to be slightly smaller than that on untreated

71
sample. While, after plasma treatment at 130C for 1h, the wear track of the sample is rougher
and the track width is slightly wider than that on untreated sample.
The improvement of wear resistance is shown in Table 5.5 and Figure 5.23.
As can be seen from Figure 5.23, ASPN surface treatment has an interesting effect on
polyurethane samples. Plasma treatment at 80-100 C for half hour or 1h, wear resistance
improved. As treatment temperature and time increased, the wear resistance decreased. It
seems that active screen plasma nitriding offers the possibility to improve the wear resistance
of polyurethane although the effect is highly dependent on the treatment conditions.
b) Reciprocating movement wear tests results
According to the results of pin-on disc wear results, the samples treated by plasma for
0.5h at different temperature were chosen to perform reciprocating movement wear tests. For
each sample, reciprocating movement wear tests were carried out with 10000 cycles under
different loads (9.81N, 19.62N), respectively. Reciprocating movement wear areas of PU
before and after plasma treatment are listed in Table 5.6.
According to Table 5.6, when reciprocating movement wear tests were carried out
with 10000cycles and under 9.81N loads, the wear area of the samples plasma treated at 80C
for 0.5h decreased to a different extent.
For the sample PU80-0.5h and untreated sample (PU0), wear tests were carried out at
10000cycles under different loads (9.81N, 13.73N, 19.62N) to compare the effect of loads in
wear tests. The wear areas of untreated (PU0) and plasma treated PU (PU80-0.5h) at different
loads (10000cycles) are shown in Figure 5.24. According to Figure 5.24, the wear areas
increase as loads increase. When load is 9.81N, wear areas of plasma treated samples are
72
smaller than those of untreated samples; when load increases to 13.73N, wear areas of plasma
treated samples are bigger than those of untreated samples.
5.10 Contact angle and surface energy
The surface properties in terms of surface free energy of polyurethane samples, as
characterization by static contact angle, are reported in Table 5.7 which also represents the
results of contact angle of two liquids (distilled water and glycerol), with different polarity.
It is clear from the results that surface free energies of plasma treated samples for 0.5h
and 1h are higher than that of untreated samples. When treatment time increased to 2h and 5h
or decrease to 10min, surface free energies decreased. The increase in surface energy could be
mainly attributed to the increase of polar part of the surface energy. In general, high energy
surfaces are hydrophilic, it induce the increase of hydrophilicity of the surface.
On the other hand, it must be noted that contact angles of two liquids on plasma
treated samples increased compared with untreated sample. However, the relation between
θWater and θGlycerol changed from θWater>θGlycerol for the untreated material to θWater<θGlycerol
for the plasma treated one. This is because plasma treatment induced the rearrangement of the
whole polymer chain and formed a special layer on surface. This region exposed
polymethylene chains (R and R’ parts in –CO–O–R–O–CO–NH–R’–NH–) to the water
droplet, thus yielding a moderate shielding effect and producing a higher than expected
contact angle. Clearly, an important difference exists between hydrophilic surfaces and low
contact angle surfaces: the former can adsorb some water or moisture from surroundings.
Their surface and subsurface zone could be extensively hydrated, yet the water contact angle
can be similar to that of hydrophobic polymers[66].
73
5.11 Biocompatibility
a) Cell Culture for 3Days on PU surface
The scanning electron micrographs (Figure 5.25-5.29) clearly show both morphology
and proliferation of cells are different, depending on the substrate condition. All plasma
treated PU samples show better cell proliferation.
b) Cell proliferation
Figure 5.30 shows the MTT assay result after cell culture for 7days. According to
Figure 5.30, the MTT results increased for all plasma-treated PU samples. When the treatment
temperature is 80C, as treatment time increases from 0.5h to 5h, the MTT value decreases.
When the treatment time is 0.5h, as treatment temperature increases from 80C to 130C, the
MTT value increases first, then decreases. Among them, the MTT value of PU100-0.5h is the
highest.
74
6 Polycaprolactone (PCL) results
6.1 DSC
DSC was carried out to identify the melting point of untreated polycaprolactone (PCL).
During the test, the temperature of the PCL sample increased from room temperature to 80ºC
at a heating rate of 10 ºC min-1, and the measured DSC curve is shown in Figure 6.1.
It can be seen from Figure 6.1 that as the temperature increases from room
temperature to around 60 ºC, a peak appears in the DSC curve. This indicates that the PCL
sample eventually reached its melting temperature (Tm) and the melting process results in the
endothermic peak in the DSC curve. The melting temperature of the PCL sample was
determined to be 59.9 ºC ± 0.1 ºC from the original data of the DSC curve.
6.2 XRD
In order to study the effect of active screen plasma treatment on the structure of PCL,
XRD was conducted on active screen plasma treated samples as well as on untreated samples
for comparison. The XRD charts of PCL before and after plasma treatment are shown in
Figure 6.2 and the quantitative results are summarised in Table 6.1.
According to Figure 6.2, PCL is a semi-crystalline material with an amorphous halo at
around 20.5° and three crystal peaks at 21.4, 22.0 and 23.7°. After plasma treatment the
crystal peaks increased their intensities and shifted to the right slightly. It is considered due to
production of inner tensile stress after treatment.
As can be seen from XRD patterns, the crystal peaks increased and shifted to higher
angle position (right) slightly by plasma treatment. Comparison of full width at half maxima
75
(FWHM) of the original crystalline peaks of the virgin sample with those of the plasma
treated one (Table 6.1), decrease in FWHM value suggests that smaller lamellas (crystallites)
are developing into bigger ones, and the increase in peak height and area suggests an increase
of crystallinity.
The reasons are analysed below. When the semicrystalline polycaprolactone is treated
by ASPN, the long molecular chains of the amorphous regions may be broken at different
places, leaving a free smaller chain which immediately comes to a stable position by
collecting its whole length to create new crystallites or lamellas; whereas the crystalline
region lamellas may be rearranged by plasma treatment. This indicates that crystallites or
lamellas are growing into bigger ones. The shifting in the diffraction peak position of the
samples towards higher angle is because of developing the tensile microstrain of PCL
crystallites due to presence of active screen plasma.
6.3 FTIR
In order to study the change of surface functional groups during plasma treatment,
FTIR measurements were carried out on both plasma treated and untreated PCL films. The
typical FTIR spectra of PCL films before and after plasma treatment are shown in Figures 6.3
and 6.4.
The infrared spectra of PCL (Figure 6.3) exhibit absorption bands from 4000 to 500
cm-1 associated with their characteristic groups. The bands at 2944 and 2865 cm−1 are
characteristic of C-H stretching vibration. The strong absorbance band at 1721 cm-1 is
ascribed to C=O stretching. The 1160 cm−1 band is due to the presence of a C–O–C group,
while the 1238 cm−1 band is due to a C–C–O group in the structure. The spectra also show a
band at 960 cm−1 due to C–CH3 stretching [161].
76
After plasma treatment, the intensity of almost all peaks decreased marginally except
for the band between 3500 cm-1 to 3100 cm-1. According to Figure 6.4, a wide absorbance
peak at about 3260 cm-1 (ascribed to the hydroxyl group, -OH) [161] was generated in PCL by
the ASPN treatment.
It is known that during plasma treatment of polymers chain scission, crosslinking and
the formation of hydroxyl groups are the most common reactions. Firstly, PCL is a
crosslinkable polymer because it can produce insoluble gel when exposed to gamma rays [94,
171, 172]. The principle of the crosslinking process induced by plasma should be similar to
that of an irradiation process. Secondly, new hydroxyl groups were formed by obtaining
energy from plasma, followed by detachment of a hydrogen molecule in plasma.
6.4 XPS
XPS measurements were carried out to characterise changes in the composition and
chemical structure of the surface during ASPN treatment. The chemical composition of the
top surface of the untreated and that of the ASPN treated sample is given in Table 6.2. The
composition of the as-prepared PCL film was as follows: C=75.7 at%, O=24.3 at%. After
treatment it became C=77.5 at%, O=21.4 at% and N=1.1 at%, which indicate some oxygen
loss and build-up of a small amount of nitrogen. The C 1s peak envelope, depicted in Figure
6.5, is composed of three components of approximate 1:1:4 atomic ratios, as expected. The
major component at 285.0 eV (reference) correspond to –CH2– type carbon, of the polymer
chain, while the one at 286.5 eV assignable to –C–O– and the one at 288.9 eV to carbon
atoms in the ―(C=O)—O― bonding state [168]. In the C 1s XPS spectra (Figure 6.5), it can
be seen that after plasma treatment, the intensity of this latter component at 288.9 eV decrease
which indicates that part of the ―(C=O)—O― groups were broken and transformed to
another, more probably, to HO—C groups. In line with this, a new C 1s component appeared
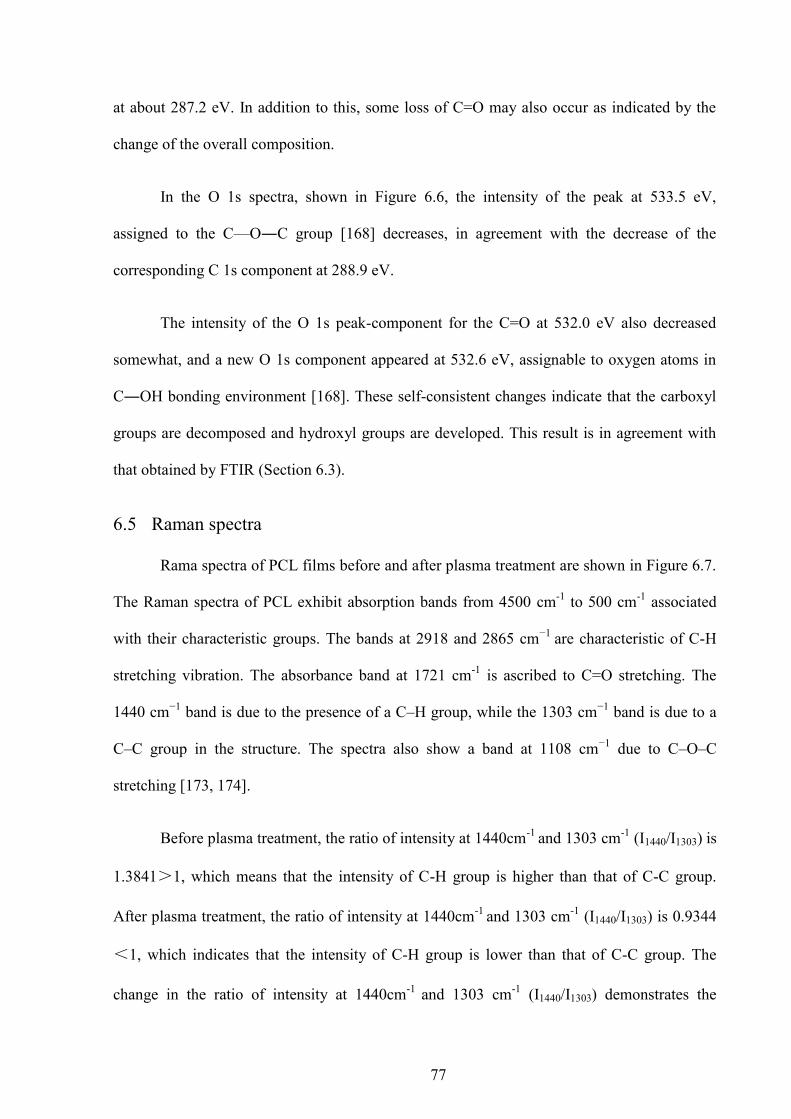
77
at about 287.2 eV. In addition to this, some loss of C=O may also occur as indicated by the
change of the overall composition.
In the O 1s spectra, shown in Figure 6.6, the intensity of the peak at 533.5 eV,
assigned to the C—O―C group [168] decreases, in agreement with the decrease of the
corresponding C 1s component at 288.9 eV.
The intensity of the O 1s peak-component for the C=O at 532.0 eV also decreased
somewhat, and a new O 1s component appeared at 532.6 eV, assignable to oxygen atoms in
C―OH bonding environment [168]. These self-consistent changes indicate that the carboxyl
groups are decomposed and hydroxyl groups are developed. This result is in agreement with
that obtained by FTIR (Section 6.3).
6.5 Raman spectra
Rama spectra of PCL films before and after plasma treatment are shown in Figure 6.7.
The Raman spectra of PCL exhibit absorption bands from 4500 cm-1 to 500 cm-1 associated
with their characteristic groups. The bands at 2918 and 2865 cm−1 are characteristic of C-H
stretching vibration. The absorbance band at 1721 cm-1 is ascribed to C=O stretching. The
1440 cm−1 band is due to the presence of a C–H group, while the 1303 cm−1 band is due to a
C–C group in the structure. The spectra also show a band at 1108 cm−1 due to C–O–C
stretching [173, 174].
Before plasma treatment, the ratio of intensity at 1440cm-1 and 1303 cm-1 (I1440/I1303) is
1.3841>1, which means that the intensity of C-H group is higher than that of C-C group.
After plasma treatment, the ratio of intensity at 1440cm-1 and 1303 cm-1 (I1440/I1303) is 0.9344
<1, which indicates that the intensity of C-H group is lower than that of C-C group. The
change in the ratio of intensity at 1440cm-1 and 1303 cm-1 (I1440/I1303) demonstrates the

78
increase of C-C group after plasma treatment, which could be an indication of crosslinking of
PCL chains on PCL surface after plasma treatment.
6.6 Surface topography
Surface roughness of PCL sample specimen was measured before and after plasma
treatment to study the effect on surface roughness induced by plasma treatment. It can be seen
from Table 6.3 that there is no significant change in surface roughness following active-
screen plasma treatment.
Typical AFM images of PCL were obtained in contact mode in air. Figures 6.8 and 6.9
show respectively the topographical measurement results of the untreated and treated PCL
surface obtained by AFM. It can be seen that no significant difference in surface topography
could be observed for the plasma treated and untreated surfaces.
Figures 6.10 and 6.11 show the typical surface topography of the untreated and plasma
treated PCL surfaces obtained by SEM. No appreciable difference in SEM surface topography
could be found, which is in line with the results of AFM and profilometer measurements.
Clearly, short-time active screen plasma treatment did not cause any appreciable change in the
surface topography of PCL films.
6.7 Contact angle and surface energy
The surface free energy of plasma treated and untreated PCL samples were studied by
measuring the static contact angle of two different liquids (distilled water and ethylene glycol).
The measured contact angle of these two liquids with different polarities on both plasma
treated and untreated are given in Table 6.4. Based on the method described in Chapter 3, the
surface energy was calculated and the results are also shown in Table 6.4.

79
It is clear from the results that the surface free energy of the plasma treated samples is
higher than that of the untreated samples. The contact angles of these two liquids on the
surface of the plasma treated samples all decreased compared with the untreated samples. It
can be seen from Table 6.4 that after plasma treatment, water tensile drop contact angle
decreased from 75.1º to 71.0º, which indicates increased wettability of the plasma treated
surface; correspondingly, the surface energy increased by 3.11 mN/m (from 28.76 to 31.87
mN/m). Among them, the polar part increased 2.8 mN/m (from 19.16 to 21.96 mN/m), which
accounts for 90% of the increased surface energy.
6.8 Biocompatibility
a. Cell attachment for 1h
The SEM micrographs in Figures 6.12 and 6.13 clearly show that both topography and
numbers of attached cells are different, depending on the substrates.
The number of cells attached to the untreated PCL film surface (Figure 6.12) is much
lower than that attached to ASPN treated PCL (Figure 6.13). In addition, on the untreated
surface, adherent cells were round or ovoid in shape, the cell edges did not appear attached
and filopodial growth was minimal (Figure 6.12). According to Rajaraman‘s four stages of
cell attachment [78], the cells on the untreated surfaces were more in Stage 1. On the other
hand, however, cells on the ASPN treated surface had a spherical and flattened appearance
with peripheral filopodia (Figure 6.13). The cells were in Stage1 to Stage 3 with large
percentages at Stages 2 or 3.
Three samples were used for cell attachment assessments for each condition (untreated
and plasma treated). Cell density for both conditions (untreated and plasma treated) was
compared by counting the average number of cells from 15 fields (i.e. 5 fields on each
sample). The average and standard deviation are shown in Figure 6.14. According to Figure
80
6.14, the mean of the two samples were significantly different (t test, two tailed, p = 4.14×10⁻⁷
<0.001). Clearly, significantly more cells attached to the plasma treated PCL surface than to
the untreated PCL surface.
b. Cell proliferation
Figures 6.15 and 6.16 show typical SEM micrographs of cell culture for 3 days onto
untreated and plasma treated PCL, respectively. As can be seen from Figures 6.15 and 6.16,
MC3T3 cells on plasma treated PCL surface exhibit higher cell numbers and cover more
surface area when compared with those on untreated PCL surface. It is clear that an increase
in the cell proliferation was observed over the entire culture period (3 days).
c) Cell metabolic activity
One of the objectives of this study was to determine if plasma treatment affected
cellular activity. To test this premise, the ability of live, metabolically active cells to reduce a
tetrazolium salt, MTT, was measured.
MTT assay results after 7 days cell culture for untreated and plasma treated PCL
surfaces are compared in Figure 6.17. It can be seen that after plasma treatment, the MTT
value increased from 0.26 to 0.36 representing an increase of 38.5%. The results demonstrate
that the activity of MC3T3 cells is higher when grown on plasma treated PCL surface than on
untreated surfaces over a 7-day period.
6.9 Degradability
In order to study the effect of plasma surface treatment on the degradation of PCL, the
mass lose of both untreated and plasma treated PCL in PBS solution containing lipase from
Pseudomonas cepacia as a function time was recorded in Figure 6.18.
81
It can be seen that both the untreated and treated PCL films finally disappeared. The
untreated PCL film was totally degraded within 24 h when it was in PBS solution containing
lipase from Pseudomonas cepacia. In the first 17 h, the degradation rate was faster. With the
plasma treated PCL film, degradation was completed within 36 h. In the first 29 h, the
degradation rate was faster.
Figures 6.19 and 6.20 show respectively the SEM images of untreated and treated PCL
films as a function of immersion time after enzymatic degradation. Before the degradation
tests, the appearance of both untreated and treated PCL films was almost the same. During
degradation of untreated PCL film, the roughness of the surface and the depth of holes
increased with time. After degradation for 19 h, holes were produced in both the surface and
the bulk body and the sample became highly porous.
From comparison of Figure 6.19 and Figure 6.20, it is clear that the topography of the
plasma treated PCL film is quite different from that of the untreated PCL film. During
degradation of plasma treated PCL film, as mass loss increases, the films become thinner
without obvious large holes occurring on the surface. After degradation for 24 h, the plasma
treated PCL film starts to be broken. This could be attributed to the crosslinking of the
topmost surface layer of the PCL film after plasma treatment. It also shows that plasma
treated PCL is degradable but needs a longer time to completely degrade.

82
7 General discussion
7.1 Effect on surface chemistry
The surface chemistry of a polymer is of importance in many of the applications.
Therefore, detailed examination of the surface chemistry of plasma treated UHMWPE, PU
and PCL has been conducted using FTIR, XPS and Raman.
7.1.1 UHMWPE
Infrared spectroscopic methods allow the surface chemical structure and composition
in the order of microns to be characterized. FTIR spectra of UHMWPE are shown in Figure
4.5.
For untreated UHMWPE, absorbance peaks at 2930 cm-1 and 2850 cm-1 are ascribed
to the methylene (CH2-CH2) C-H asymmetric and symmetric stretching vibration, absorbance
peak at 1460 cm-1 is ascribed to the methylene (CH2-CH2) C-H bending vibration, absorbance
peak at 720 cm-1 is ascribed to (CH2)n rocking band. After ASPN treatment, all the peaks
above that show the main characteristic bands associated with aliphatic hydrocarbons are still
in spectra with a very small new peak appearing.
In Figure 4.5, it can be seen that an absorbance peak at 965 cm-1 (ascribed to the
transvinylene group, -CH=CH-) and a peak at 910 cm-1 (ascribed to the terminal vinyl group,
-CH=CH2) are generated in UHMWPE after ASPN treatment. During plasma treatment of
UHMWPE, chain scission, crosslinking, and the formation of transvinylene units are the most
common reactions. The principle of the process should be similar to that of an irradiation
process [175, 176]. Transvinylene unsaturations are formed by obtaining energy from plasma,
followed by detachment of a hydrogen molecule and, to a lesser extent, by the recombination
of two adjacent alkyl free radicals residing on the same chain. Transvinylene groups appear in

83
polyethylene as a plasma modification product during exposure to plasma environment with a
yield related to the number of crosslinks formed [177]. The presence of a terminal vinyl group
usually means that the polymer chain has broken, which will leave behind a vinyl group on
each end [34].
Despite the fact that UHMWPE is the simplest polymer in terms of its structural repeat
unit, it produces some complex infrared bands. The spectra of UHMWPEs are complicated
because of the phenomenon of crystal field splitting. As PE has a small repeat unit which
packs efficiently, an ethylene unit of one chain will be in close proximity to a unit in the
adjacent part of the chain and there is an interaction between these units. Such an interaction
results in the doubling of the normal modes, as one interacts with and perturbs the other unit.
For UHPMWE, crystal field splitting results in doublets at 734 and 720 cm−1 (CH2 rocking)
and 1475 and 1460 cm−1 (CH2 bending) in infrared spectra (Figure 7.1).
Considering of crosslinking reactions are governed by radical reactions and large
amount of free radicals in plasma, as well as same new functional groups (transvinylene group
and terminal vinyl group) produced, the mechanism of plasma induced cross-linking is very
similar to that of irradiation method [34, 176-178]. The mechanism of cross-linking in
UHMWPE under interaction of high-energy excited species can be visualized by following
scheme:

84
1. ASPN:
-(CH2-CH2)n- -(CH2-CH2)n-CH* + *HC-(CH2-CH2)n-
-(CH2-CH2)n-CH*-(CH2-CH2)n- + *H
-(CH2-CH2)n-CH=HC-(CH2-CH2)n-
-(CH2-CH2)n-CH=CH2-
2. Cross-linking:
2(CH2-CH2)n-CH*-(CH2-CH2)n (CH2-CH2)n-CH-(CH2-CH)n
(CH2-CH2)n-CH-(CH2-CH)n
-(CH2-CH2)n-CH=CH2 + -(CH2-CH2)n-CH*-(CH2-CH2)n-
CH-CH2-CH*-(CH2-CH2)n-
-(CH2-CH2)n-CH-(CH2-CH)n-
During ASPN treatment, samples are placed in plasma environment at elevated
uniform temperature. The plasma is composed of a large concentration of highly excited
atomic, molecular, ionic, and radical species. The free radicals as well as other metastable
particles that break covalent chemical bones upon collision with the surfaces of polymers
placed in the plasma environment, thus creating free radicals on the polymer surface. Their
interaction with UHMWPE leads, through a complex energy transfer, to the scission of C-C
and C-H bonds, giving H radicals and primary and secondary macroradicals. These
Excited species: electrons, ions, atoms, molecules, free radicals, metastables
Energy
85
macroradicals are dispersed throughout both the crystalline and the amorphous phases of the
polymer. The free radicals then undergo additional reactions, including chain scission,
crosslinking, and the formation of transvinylene unites. The trans-vinylene groups appearing
in UHMWPE are related to the number of crosslinks formed [177]. And the concentration of
the trans-vinylene unites can be readily measured by infrared spectroscopy using the
characteristic absorbance at wavenumber 965 cm-1 on the IR-spectrum of plasma treated
UHMWPE. Figure 4.6 shows the IR-spectra of untreated and ASPN treated UHMWPE,
demonstrating a characteristic absorbance of the trans-vinylene vibration after ASPN
treatment. The amorphous phase in UHMWPE consists of randomly oriented and entangled
polymer chains from neighboring molecules. Although radicals induced by plasma spread
randomly throughout the polymer, the reactivity of alkyl radical is much higher in the
amorphous region than in crystalline region due to chain mobility in the amorphous region
[34, 178, 179]. Therefore, the crosslinks form preferentially in the amorphous region and the
interfacial regions. The radicals in the crystalline regions migrate along the straight crystalline
stems within the lattice without reacting. The reaction then occurs in the interfacial or
amorphous regions [180].
7.1.2 PU
In order to know how the surface functional groups change on PU after ASPN
treatment, FTIR and XPS tests have been carried out.
FTIR spectra of PU are shown in Figure 5.4.
For untreated PU, on inspection of the higher wavenumber end of the spectrum,
absorbance peak at 3300 cm-1 can be attributed to N-H stretching (hydrogen bonded) vibration,
while the broad shoulder which appears at around 3450 cm−1 is due to non-hydrogen-bonded
N–H bonds. There are also absorbance peaks at 2930 cm-1 and 2850 cm-1, due to C-H
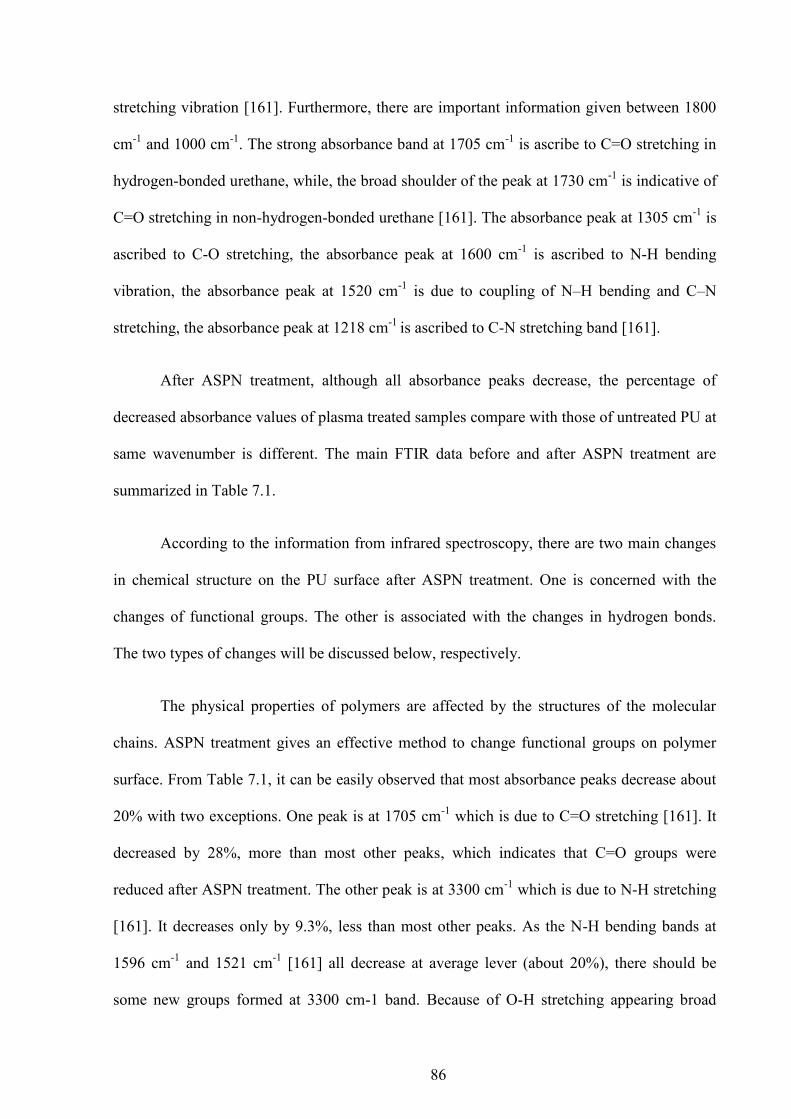
86
stretching vibration [161]. Furthermore, there are important information given between 1800
cm-1 and 1000 cm-1. The strong absorbance band at 1705 cm-1 is ascribe to C=O stretching in
hydrogen-bonded urethane, while, the broad shoulder of the peak at 1730 cm-1 is indicative of
C=O stretching in non-hydrogen-bonded urethane [161]. The absorbance peak at 1305 cm-1 is
ascribed to C-O stretching, the absorbance peak at 1600 cm-1 is ascribed to N-H bending
vibration, the absorbance peak at 1520 cm-1 is due to coupling of N–H bending and C–N
stretching, the absorbance peak at 1218 cm-1 is ascribed to C-N stretching band [161].
After ASPN treatment, although all absorbance peaks decrease, the percentage of
decreased absorbance values of plasma treated samples compare with those of untreated PU at
same wavenumber is different. The main FTIR data before and after ASPN treatment are
summarized in Table 7.1.
According to the information from infrared spectroscopy, there are two main changes
in chemical structure on the PU surface after ASPN treatment. One is concerned with the
changes of functional groups. The other is associated with the changes in hydrogen bonds.
The two types of changes will be discussed below, respectively.
The physical properties of polymers are affected by the structures of the molecular
chains. ASPN treatment gives an effective method to change functional groups on polymer
surface. From Table 7.1, it can be easily observed that most absorbance peaks decrease about
20% with two exceptions. One peak is at 1705 cm-1 which is due to C=O stretching [161]. It
decreased by 28%, more than most other peaks, which indicates that C=O groups were
reduced after ASPN treatment. The other peak is at 3300 cm-1 which is due to N-H stretching
[161]. It decreases only by 9.3%, less than most other peaks. As the N-H bending bands at
1596 cm-1 and 1521 cm-1 [161] all decrease at average lever (about 20%), there should be
some new groups formed at 3300 cm-1 band. Because of O-H stretching appearing broad

87
band at 3300cm-1 [161], it can be identified that new O-H groups form after ASPN treatment.
From the analysis above, a conclusion can be drawn that ASPN treatment results in broken
C=OO groups and new O-H groups formed on the surface top layer.
Hydrogen bonding is defined as the attraction that occurs between a highly
electronegative atom carrying a non-bonded electron pair (such as fluorine, oxygen or
nitrogen) and a hydrogen atom, itself bonded to a small highly electronegative atom.
Hydrogen bonding is also an issue for polyurethanes (PUs), which have the general structure,
–CO–O–R–O–CO–NH–R‘–NH–. PUs are extensively hydrogen bonded, with the proton
donor being the N–H group of the urethane linkage. The hydrogen-bond acceptor may be in
either the hard segment (the carbonyl of the urethane group) or in the soft segment (an ester
carbonyl or ester oxygen). In the infrared spectra of PU, the ratio of the absorbances of C=O
stretching (non-hydrogen bonded urethane) at 1730 cm-1 and C=O stretching (hydrogen
bonded urethane) at 1705 cm-1 may be employed as a measure of changes in hydrogen
bonding by plasma treatment. The main changes of FTIR data at 1730 cm-1 and 1705 cm-1
before and after ASPN treatment are listed in Table 7.2. Effects of treatment temperature and
time on changes observed in the spectra are shown in Table 7.3
From Table 7.2, after ASPN treatment, the absorbance value of C=O stretching
(hydrogen bonded urethane) at 1705 cm-1 decreased to 72.0%, while the absorbance value of
C=O stretching (non-hydrogen bonded urethane) at 1730 cm-1 decreased to 75.6%. According
to Table 7.3, before ASPN the ratio of A1730/A1705 is 84.2%, while after ASPN the ratio of
A1730/A1705 (PU100-2h) increases to 88.4%. These data indicate hydrogen bonding decreases
after ASPN treatment.
Hydrogen bonding plays a fundamental role in the structural and physical properties of
PU and is the most significant type of intermolecular interaction that influences the infrared
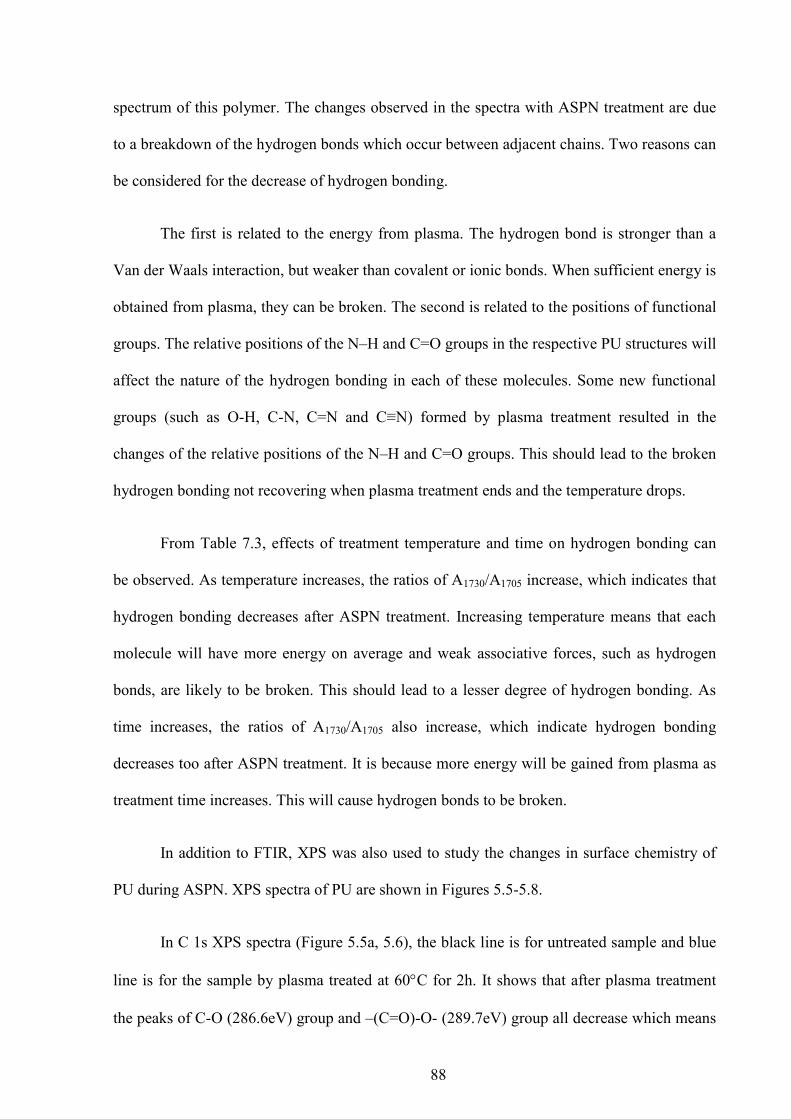
88
spectrum of this polymer. The changes observed in the spectra with ASPN treatment are due
to a breakdown of the hydrogen bonds which occur between adjacent chains. Two reasons can
be considered for the decrease of hydrogen bonding.
The first is related to the energy from plasma. The hydrogen bond is stronger than a
Van der Waals interaction, but weaker than covalent or ionic bonds. When sufficient energy is
obtained from plasma, they can be broken. The second is related to the positions of functional
groups. The relative positions of the N–H and C=O groups in the respective PU structures will
affect the nature of the hydrogen bonding in each of these molecules. Some new functional
groups (such as O-H, C-N, C=N and C≡N) formed by plasma treatment resulted in the
changes of the relative positions of the N–H and C=O groups. This should lead to the broken
hydrogen bonding not recovering when plasma treatment ends and the temperature drops.
From Table 7.3, effects of treatment temperature and time on hydrogen bonding can
be observed. As temperature increases, the ratios of A1730/A1705 increase, which indicates that
hydrogen bonding decreases after ASPN treatment. Increasing temperature means that each
molecule will have more energy on average and weak associative forces, such as hydrogen
bonds, are likely to be broken. This should lead to a lesser degree of hydrogen bonding. As
time increases, the ratios of A1730/A1705 also increase, which indicate hydrogen bonding
decreases too after ASPN treatment. It is because more energy will be gained from plasma as
treatment time increases. This will cause hydrogen bonds to be broken.
In addition to FTIR, XPS was also used to study the changes in surface chemistry of
PU during ASPN. XPS spectra of PU are shown in Figures 5.5-5.8.
In C 1s XPS spectra (Figure 5.5a, 5.6), the black line is for untreated sample and blue
line is for the sample by plasma treated at 60C for 2h. It shows that after plasma treatment
the peaks of C-O (286.6eV) group and –(C=O)-O- (289.7eV) group all decrease which means

89
in urethane group (>HC)-NH-C=OO-(CH<), the carboxyl group is broken and changed to
other group. While the peak of C-C (285eV) group also diminish which indicate C-C bonds
are broken. In O 1s spectra (Figure 5.5b, 5.7), the intensity of the peak at 533.2 eV, assigned
to the C—O―C group [168] decreases significantly, while that at 532 eV increased. This
increase could not be connected with the increase of the amount of –(C=O)–O–, because its
decrease was clearly determined by the diminishing intensity of the 289.7 eV component of
the C 1s line (Figure 5.5a). As a consequence, we attributed this increase (in accordance with
the IR results) to the development of HO–C groups, because chemical shift of oxygen in the –
OH groups may fall to this energy range. These self-consistent changes of the C 1s and O 1s
lines indicate that the carboxyl groups are decomposed and hydroxyl groups are developed
after plasma treatment. N1s spectra (Figure 5.5c, 5.8) show the peaks of the C-NH (399.7eV)
group and C=N (398.7eV) group all increase which indicates that new C-NH bonds , C=N
and C≡N bonds are developed.
It is obvious that the main characteristic of the polyurethane chemical group, the
(>HC)-NH-C=OO-(CH<) is destroyed or transformed to other types of bonds. The addition
introduced by the treatment nitrogen will form new types of bonds preferably with the
remaining carbon as indicated above. When new functional groups appeared: at 399.7 eV C-
N-C and C≡N states developed and the low energy peak at 398.7 eV assignable to the –C=N–
groups, multiply detected in and reported for the plasma deposited carbon-nitride (CNx)
coatings [170], the polymer chains are rearranged, cross-linking and three-dimensional (C-N,
C=N and C≡N) networks possibly develop. In addition, the hydrophilicity of the surface has
increased because hydroxyl group has increased on the surface.
7.1.3 PCL
In order to know how the surface functional groups change on PCL after ASPN
treatment, FTIR, Raman and XPS tests have been carried out.

90
FTIR spectra of PCL films before and after plasma treatment are shown in Figures 6.3
and 6.4.
For untreated PCL, the structure of PCL is –(–O–(CH2)5–CO–)n–. On inspection of
the higher wavenumber of the spectrum, absorbance peaks are observed at 2944 cm-1 and
2860cm-1, due to aliphatic symmetric and asymmetric C–H stretching, respectively. There is
also a strong band at 1721 cm−1 is indicative of C=O stretching. There is a band due to CH2
bending occur in the 1365 cm−1. The absorbance at 1238 cm−1and 1160 cm-1 are characteristic
of C–C–O stretching and C–O–C bending, respectively, and the absorbance at 960 cm−1 is
characteristic of C-CH3 bending. The infrared assignments for this spectrum are listed in
Table 7.4.
According to Figure 6.4, it can be seen that a wide absorbance peak at about 3260 cm-1
(ascribed to the hydroxyl group, -OH) was generated in PCL after ASPN treatment. The ratios
of the peak intensity at 3260 cm-1 to 3440 cm-1 were 1.43 (treated) and 0.33(untreated),
respectively. The ratio (A3260/A3440) of treated sample (1.43) is much higher than that of
untreated sample (0.33), implying the increase of hydroxyl groups after plasma surface
modification. During plasma treatment of PCL films, the formation of hydroxyl groups is the
most common reactions. New hydroxyl groups are formed by obtaining energy from the
plasma, followed by detachment of a hydrogen molecule from (or to) the plasma.
XPS measurements were carried out to characterise changes in the composition and
chemical structure of the surface during ASPN treatment. The composition of the as-prepared
PCL film was as follows: C=75.7 at%, O=24.3 at%. After treatment it became C=77.5 at%,
O=21.4 at% and N=1.1 at%, which indicate some oxygen loss and build-up of a small amount
of nitrogen. The C 1s peak envelope, depicted in Figure 6.5, is composed of three components
of approx. 1:1:4 atomic ratios, as expected. The major component at 285.0eV (reference)

91
correspond to –CH2– type carbon, of the polymer chain, while the one at 286.5 eV assignable
to –C–O– and the one at 288.9 eV to carbon atoms in the ―(C=O)—O― bonding state [168].
In the C 1s XPS spectra (Figure 6.5), it can be seen that after plasma treatment, the intensity
of this latter component at 288.9 eV decreases which indicates that part of the ―(C=O)—O―
groups were broken and transformed to another, more probably, to HO—C groups. In line
with this, a new C 1s component appeared at about 287.2 eV. In addition to this, some loss of
C=O may also occur as indicated by the change of the overall composition.
In the O 1s spectra, shown in Figure 6.6, it can be seen that the carboxyl groups are
decomposed and hydroxyl groups are developed. This result is in agreement with that
obtained by FTIR.
Raman spectra of PCL are shown in Figure 6.7. Raman spectrometer is also a
powerful tool to characterize functionalized polymers. In Raman spectra, there is a band at
2921 cm-1 which is indicative of C-H stretching, bands at 1721 cm-1 and 1440 cm-1due to
C=O stretching and CH2 bending. They are very similar to FTIR spectra of PCL. But
specially, at about 1300 cm-1 a strong vibration can be observed which is indicative of C-C
backbone vibration. The Raman assignments for PCL spectra are listed in Table 7.5.
From Table 7.5, it can be easily observe that the ratio of most absorbance peaks after
ASPN treatment to those before treatment decrease to about 30%. Only the peak at 1303cm-1
is different. It decreases only to 47%, which means there are more C-C groups than most
other groups after ASPN treatment. Therefore, crosslinking can be confirmed forming at the
topmost surface layer of the PCL film after plasma treatment.
From the data and results of FTIR, XPS and Raman spectra aforementioned, we can
conclude that during plasma treatment of PCL films, chain scission, crosslinking, and the
formation of hydroxyl groups are the most common reactions. Firstly, PCL is a crosslinkable
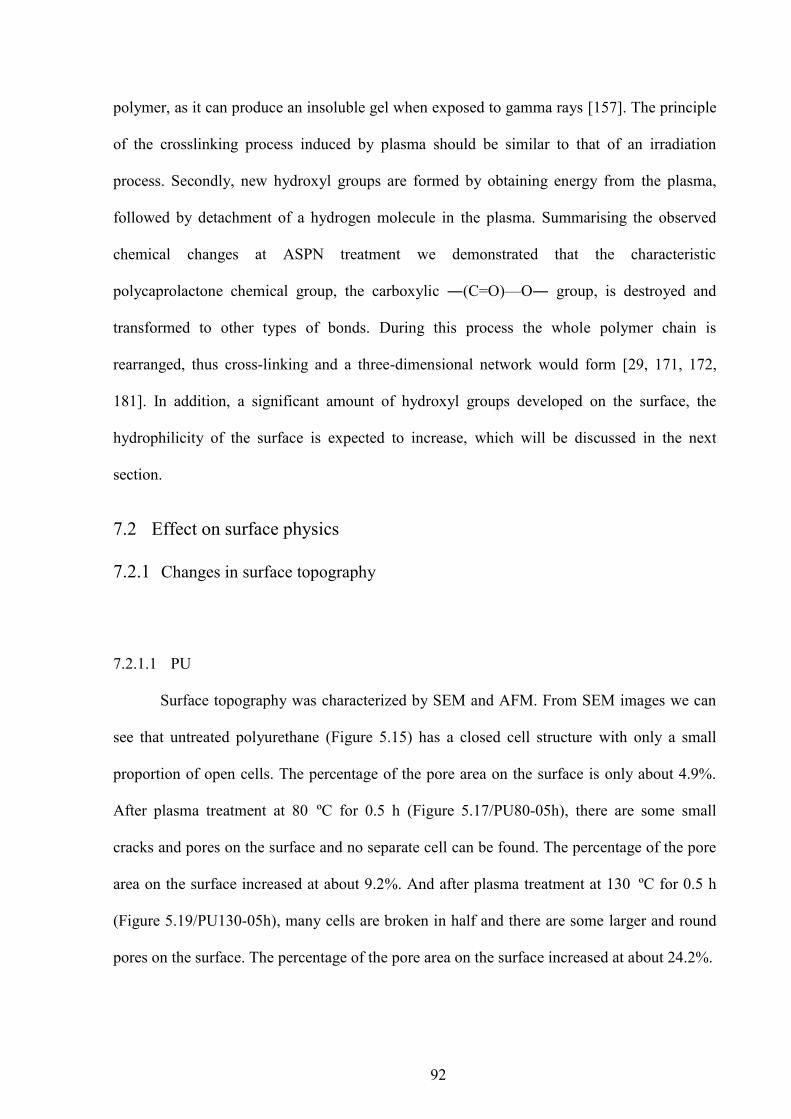
92
polymer, as it can produce an insoluble gel when exposed to gamma rays [157]. The principle
of the crosslinking process induced by plasma should be similar to that of an irradiation
process. Secondly, new hydroxyl groups are formed by obtaining energy from the plasma,
followed by detachment of a hydrogen molecule in the plasma. Summarising the observed
chemical changes at ASPN treatment we demonstrated that the characteristic
polycaprolactone chemical group, the carboxylic ―(C=O)—O― group, is destroyed and
transformed to other types of bonds. During this process the whole polymer chain is
rearranged, thus cross-linking and a three-dimensional network would form [29, 171, 172,
181]. In addition, a significant amount of hydroxyl groups developed on the surface, the
hydrophilicity of the surface is expected to increase, which will be discussed in the next
section.
7.2 Effect on surface physics
7.2.1 Changes in surface topography
7.2.1.1 PU
Surface topography was characterized by SEM and AFM. From SEM images we can
see that untreated polyurethane (Figure 5.15) has a closed cell structure with only a small
proportion of open cells. The percentage of the pore area on the surface is only about 4.9%.
After plasma treatment at 80 ºC for 0.5 h (Figure 5.17/PU80-05h), there are some small
cracks and pores on the surface and no separate cell can be found. The percentage of the pore
area on the surface increased at about 9.2%. And after plasma treatment at 130 ºC for 0.5 h
(Figure 5.19/PU130-05h), many cells are broken in half and there are some larger and round
pores on the surface. The percentage of the pore area on the surface increased at about 24.2%.

93
The changes of surface topography can be confirmed by AFM measurement. AFM
results (Figures 5.10, 5.12/PU80-05h and 5.14/PU130-05h) are almost as the same as those of
SEM. And after treatment at 130 ºC for 1 h, the AFM 3D image (Figure 5.14/PU130-1h)
shows the broken cells very clearly.
Clearly, a porous surface system with pores and cracks formed on PU surface. The
formation of these pores may be attributed to the interaction between the active species and
the PU surface although the mechanism is still under investigation.
In order to identify the changes in surface topography produced by thermal treatment
or by plasma treatment, an experiment was designed; two samples were put in plasma furnace
and the surface of one sample was covered with foil. Therefore, during the experiment
process, there will no plasma on to the surface of this sample, while the temperature and other
conditions are the same with the other sample. After treatment at 130ºC for 2 h, the two
samples were subjected to AFM measurement. From AFM images (Figure 7.2) it is noticed
that after thermal treatment, there are many small and unregulated cracks formed on the
surface. Only the plasma treated sample shows broken cells and bigger and round pores.
Therefore, it can be confirmed that the changes in surface topography are produced by plasma
treatment.
The shape, size and distribution of pores on the PU surfaces varied with the plasma
treatments conditions. Two reasons can be considered on the changes observed in surface
topography. The first is related to the energy from plasma. Formation of bigger and round
pores needs higher energy which can only be offered by plasma treatment. The second is
related to the mobility of PU molecular chain. It is known from the DSC results (Section 5.1)
that the glass transition point Tg of the PU material is 112.5 C. When treated at 130 C
(above the Tg), the molecular chains of PU become more mobile relative to each other and

94
hence pores could be easily formed under the action of the active species from plasma. Either
insufficient energy or lower temperature will result in small and unregulated pores and cracks
surface topography.
The different treatment conditions such as temperature and time all have effects on the
changes in surface topography.
In ASPN treatment different temperature can adversely affect surface topography. If a
lower temperature (such as 80 C) is used for treatment, the result is the formation of surface
small cracks and pores. If a higher temperature (such as 130 C) is used for treatment, the
result is the formation of large, spherical pores. In addition, large, spherical pores can only
formed when temperature is at 130 C. When temperature is below 100 C, large, spherical
cells cannot be formed even after a long duration of treatment. The reason of this is thought of
concern with glass transfer point of PU material. As our test in DSC, the glass transfer point
Tg of PU material is 112.5 C. If treatment temperature rises up Tg, the molecular chains of
PU become mobile relative to each other. This is the key factor of result in the difference of
surface topography at 130 C and below 100 C.
The treatment time also affects the surface morphorlogy. When treatments carried out
at same temperature (either at 80, 100 or 130 C), the percentage of cracks and pores on
surfaces are increasing clear as treatment time increase. i.e. After ASPN treatment for 5 h,
cracks and pores are much clearer than those of treatment for 0.5 h.
Most probably, during plasma treatment, electrons, ions and other active species
bombarded on the surface can effectively change the surface physical structure from a close
cell structure into porous open structure. The changes in surface topography following plasma
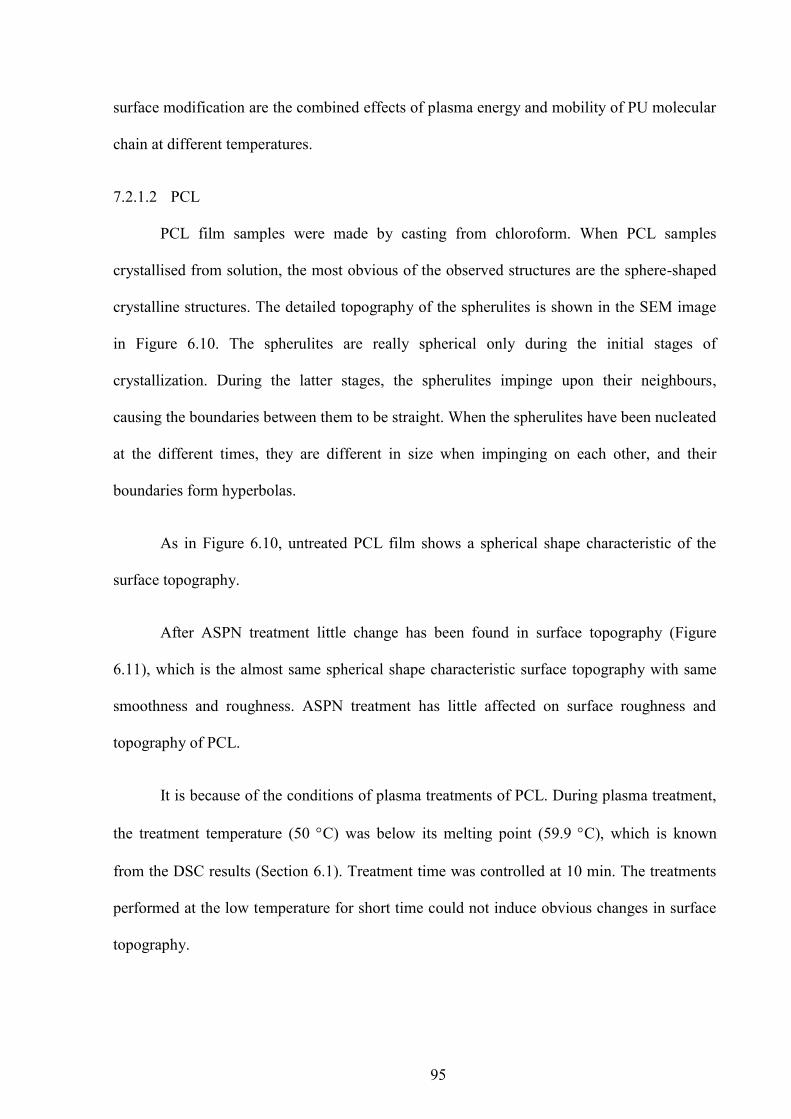
95
surface modification are the combined effects of plasma energy and mobility of PU molecular
chain at different temperatures.
7.2.1.2 PCL
PCL film samples were made by casting from chloroform. When PCL samples
crystallised from solution, the most obvious of the observed structures are the sphere-shaped
crystalline structures. The detailed topography of the spherulites is shown in the SEM image
in Figure 6.10. The spherulites are really spherical only during the initial stages of
crystallization. During the latter stages, the spherulites impinge upon their neighbours,
causing the boundaries between them to be straight. When the spherulites have been nucleated
at the different times, they are different in size when impinging on each other, and their
boundaries form hyperbolas.
As in Figure 6.10, untreated PCL film shows a spherical shape characteristic of the
surface topography.
After ASPN treatment little change has been found in surface topography (Figure
6.11), which is the almost same spherical shape characteristic surface topography with same
smoothness and roughness. ASPN treatment has little affected on surface roughness and
topography of PCL.
It is because of the conditions of plasma treatments of PCL. During plasma treatment,
the treatment temperature (50 C) was below its melting point (59.9 C), which is known
from the DSC results (Section 6.1). Treatment time was controlled at 10 min. The treatments
performed at the low temperature for short time could not induce obvious changes in surface
topography.
96
7.2.2 Changes in surface energy and wettability
From the previous discussion it is clear that ASPN treatment could effectively tailor
surface morphologies and/or chemical nature of the polymeric materials studied. The main
factors that normally affect surface free energy of polymeric materials include surface
topography and/or surface chemistry. With regards to surface topography, two important
physical features affecting surface energy are surface roughness and surface heterogeneity.
From surface chemistry side, it is important to consider how the functional groups on the top
surface of polymers are changed by ASPN treatment.
7.2.2.1 UHMWPE
a. Effect of surface topography on surface energy
According to surface roughness results (Table 4.3), surface roughness increase as
temperature increase and the increase is apparently only when temperature is at 130 ºC.
Treatment time has no obvious effects on surface roughness. In principle, an increase of
surface roughness can result in the increase of surface energy. But according to surface energy
results (Table 4.9), surface energy decrease as treated temperature increase, which means the
increase of surface roughness does not enough to cause the increase of surface energy.
Therefore, the change of surface energy after ASPN treatment does not result from the change
of surface roughness.
b. Effect of functional groups on surface energy
As previous discussion, surface energy is also related to surface chemistry. In general,
increase of surface free energy of polymer involves an increase of the surface amount of
groups which are generally called polar. The introduction of surface hydrophilic groups leads
necessarily to an increase of the surface free energy over that of the parent polymer. Before
ASPN treatment, UHMWPE consists of its structural repeat unit of–(–CH2–CH2–)n–to form
97
backbone main chain. After ASPN treatment, the transvinylene groups (-CH=CH-) are
introduced in the surface structure. Comparing with saturated hydrocarbon (–CH2–CH2–) n,
the transvinylene group (-CH=CH-) is hydrophilic group which results in the increase of
surface free energy. Evidence can be found from FTIR data (Table 7.6). In addition,
according to Table 4.9, surface energy increased more after ASPN treatment at 80 ºC than that
of treatment at 130 ºC. This is because plasma treatment at high temperature (melting point)
induced the rearrangement of whole polymer chain and formed a disordered layer on surface.
This disordered region exposed polymethylene chains to the water droplet, thus yielding a
moderate shielding effect and producing a higher than expected contact angle [66].
In this study, plasma treatment introduces trans-vinylene groups into the molecular
chain and makes the normally saturated chain contain unsaturated bonds which cause the
surface to be more hydrophilic. According to Table 4.8, the water tensile drop contact angle
decreases for almost all plasma treated samples, such as, from 79.9º (untreated) to 68.3º
(treated at 80 °C for 0.5 h) and 77.7º (treated at 130 °C for 0.5 h). The contact angle results
indicate that the wettability of the plasma treated surface increases. The exception is the
sample of PE130-5h which remains almost the same contact angle value as the untreated
sample. The reason is as stated above, as yielding a moderate shielding effect.
7.2.2.2 PU
a. Effect of surface topography on surface energy
According to surface roughness results (Table 5.3), it can be seen that after plasma
treatment at lower temperature or for shorter time, surface roughness changed little (not more
than 30%). Only at 100 ºC, after treatment for 5 h, surface roughness increased by 87%; at
130 ºC, after treatment for 2 or 5 h, surface roughness increased by 683% and 253%. This is
because of surface deformation by thermal stress. But according to the surface energy results
98
(Table 5.7), when treated for shorter time (0.5-1 hour), surface energy increased, while
treatment carried out for longer time (2-5 hours), surface energy decreased. It is indicative
that the effect of surface roughness on the change of surface energy is very limited.
Surface topography changed from closed cell structure into open cell structure after
plasma treatment. It is indicative that a porous system with pores and cracks formed on PU
surface. The shape, size and distribution of pores on the surfaces are different when plasma
treatments perform at different conditions. According to surface energy results (Table 5.7),
samples for which surface energy increases the most are PU100-1h (increase by 137%) and
PU80-1h (increase by 42%). The two samples have almost same surface topography character
which is smaller pores or cracks formed on surface after plasma treatment. In these cases,
water occupies the smaller pores and dead-end pores, and exists as a film covering the
surfaces of the larger pores of the surface. Therefore, water exists as a continuous phase
throughout the porous surface. While, samples for which surface energy decreases the most
are PU80-5h (decrease by 35%) and PU130-5h (decrease by 31%). The two samples have
almost same surface topography character which is larger pores or cracks formed on surface
after plasma treatment. In these cases, instead of penetrating the pores and cracks on the
surface, water is generally in center of the pores and loses continuity and becomes isolated in
the large pores. Therefore, water will not adsorb on surface and form a nonwetting spherical
drop resting on the surface.
b. Effect of functional groups on surface energy
As previous discussion, the changes of surface functional groups induced by plasma
are very complicated, including rearrangement of whole polymer chain, development of
cross-linking and three-dimensional (C-N) network and introduction of new functional groups,
etc. Hydrophilic groups –OH are introduced into the PU chain after plasma treatment. It leads

99
to an increase of the surface free energy over the surface of PU. Meanwhile, decrease of
carboxyl group results in decrease of surface free energy.
c. Effect of hydrogen bonding on surface energy
Polyurethanes which have the general structure -CO–O–R–O–CO–NH–R‘–NH– are
suitable to form hydrogen bonding between adjacent chains. Therefore, significant
contributions to surface energy can arise from hydrogen bounding. According to Table 7.3,
the decrease of hydrogen bonding after plasma treatment carried out at low temperature or for
short time is limited. But the decrease is apparently when treatment carried out at high
temperature or for a long time. In principle, the decrease of hydrogen bonding can result in
the decrease of surface energy. Table 5.7 shows that surface energy decreases as plasma
treatment temperature or time increase.
d. The Change in surface wettability
After plasma treatment for short time (0.5-1 hour), the surface energy of PU increased
(Table 5.7), which indicated surface wettabillity increased.
Firstly, the introduction of surface hydrophilic groups leads necessarily to an increase
of the surface free energy over that of the parent polymer. According to XPS and FTIR results,
the hydroxyl group increased on the plasma treated surfaces, which increased the
hydrophilicity of the plasma treated surface. Secondly, breakdown of the intermolecular
hydrogen bonds which occur between adjacent chains increase the chance of the molecules
forming hydrogen bonds with water.
On the other hand, it must be noted that contact angles of two liquids on plasma
treated samples increased compared with untreated sample. However, the relation between
θWater and θGlycerol changed from θWater>θGlycerol for the untreated material to θWater<θGlycerol

100
for the plasma treated sample. This is because plasma treatment induced the rearrangement of
the whole polymer chain and formed a special layer on surface. This region exposed
polymethylene chains (R and R’ parts in –CO–O–R–O–CO–NH–R’–NH–) to the water
droplet, thus yielding a moderate shielding effect and producing a higher than expected
contact angle. Clearly, an important difference exists between hydrophilic surfaces and low
contact angle surfaces: the former can adsorb some water or moisture from surroundings.
Their surface and subsurface zone could be extensively hydrated, yet the water contact angle
can be similar to that of hydrophobic polymers [66].
In addition, in general terms, wetting can be divided into contact angle and capillary
action phenomena. The former involves smooth or moderately rough surfaces. On the other
hand, on porous surfaces, capillary action sums to contact angles in the mechanism of wetting.
In summary, plasma surface modified polyurethane for short time (0.5-1 hour) has
high energy surface and thus is hydrophilic; moreover, its surface has a porous, open structure
which makes it vulnerable to capillary penetration.
After plasma treatment for longer times (2-5 hours), the surface energy of PU
decreased (Table 5.7), which indicated surface wettabillity decreased.
Although introduction of hydrophilic groups could increase the surface energy, the
factors which can effect on surface energy are complicated, including the changes in surface
topography, atomic bonds, hydrogen bonds, etc. Longer duration plasma treatments not only
result in larger pores or cracks but also produce atomic bond breakages (degradations) and
hydrogen bond breakages. The combination of multi factors finally lead to the decrease of
surface energy as well as wettability.
101
7.2.2.3 PCL
According to surface roughness results (Table 6.3) and AFM (Figures 6.8 and 6.9),
SEM (Figures 6.10 and 6.11) results, ASPN treatment has little affected on surface roughness
and topography of PCL. Therefore, the effect of surface roughness and surface topography on
the change of surface energy should be very limited.
During plasma treatment of PCL films, the formation of hydroxyl groups is the most
common reactions, which have been identified by XPS (Figures 6.5 and 6.6) and FTIR
(Figure 6.4) tests. The introduction of hydrophilic hydroxyl group leads to increase of surface
energy.
According to contact angle and surface energy results (Table 6.4), it is clear that the
surface free energies of the plasma treated samples are higher than those of the untreated
samples. The contact angles of the two liquids of the plasma treated samples both decreased
compared with the untreated samples after plasma treatment. In general, high energy surfaces
are hydrophilic. From a chemical composition point of view, the introduction of surface
hydrophilic groups on the material surface leads to an increase in the surface free energy over
that of the parent polymer. According to the XPS and FTIR results, the amount of hydroxyl
groups increases on the top-most surface layer after plasma treatment, accompanied by an
increase of hydrophilicity of the surface. A high degree of hydrophilicity is synonymous with
good wettability.
7.3 Effect on mechanical properties
7.3.1 Surface nano-hardness (H) and modulus (E)
7.3.1.1 UHMWPE
The mechanical properties of UHMWPE in terms of surface nano-hardness (H) and
modulus (E) are highly dependent on its surface topography and microstructure, which are

102
characterized by degree of crystallinity, crystalline lamellae size and distribution, and degree
of crosslinking etc [1, 2, 164, 184, 185].
a. Changes in nano-hardness (H) and modulus (E)
According to Table 4.4 and Figures 4.19-4.20, the nano-hardness and modulus of
UHMWPE surface increase as treatment temperature increases. Especially, after plasma
treatment at 130 °C , nano-hardness and modulus rise even more sharply than other samples
including untreated and plasma treated at 60-100 °C .
b. Effect factors on nano-hardness (H) and modulus (E)
The modulus (E) of a sample is a measure of its rigidity, the higher the modulus, the
stiffer the sample. For the most isotropic samples, the modulus (E) increases almost linearly
with the degree of crystallinity and orientation [186]. The contact stiffness of surface (nano-
hardness), which is related to modulus, is correctly larger for the samples with higher degree
of crystallinity. Figures 7.3 and 7.4 show the relationship between nano-hardness, modulus
and crystallinity before and after plasma treatment.
The mechanical properties of UHMWPE are also determined by the number and
nature of connections within the amorphous regions, including the degree of mechanical
entanglements and crosslinkings [185]. As discussed in 7.1.1, plasma treatment induces the
crosslinkings to form preferentially in the amorphous region and the interfacial regions. With
increasing degree of crosslinking of the UHMWPE, the nano-hardness and modulus of
UHMWPE surface increase after plasma treatment.
7.3.1.2 PU
Polyurethane rigid forms used in this study are highly crosslinked hard thermosetting
plastics. According XRD results, they are amorphous polymers.
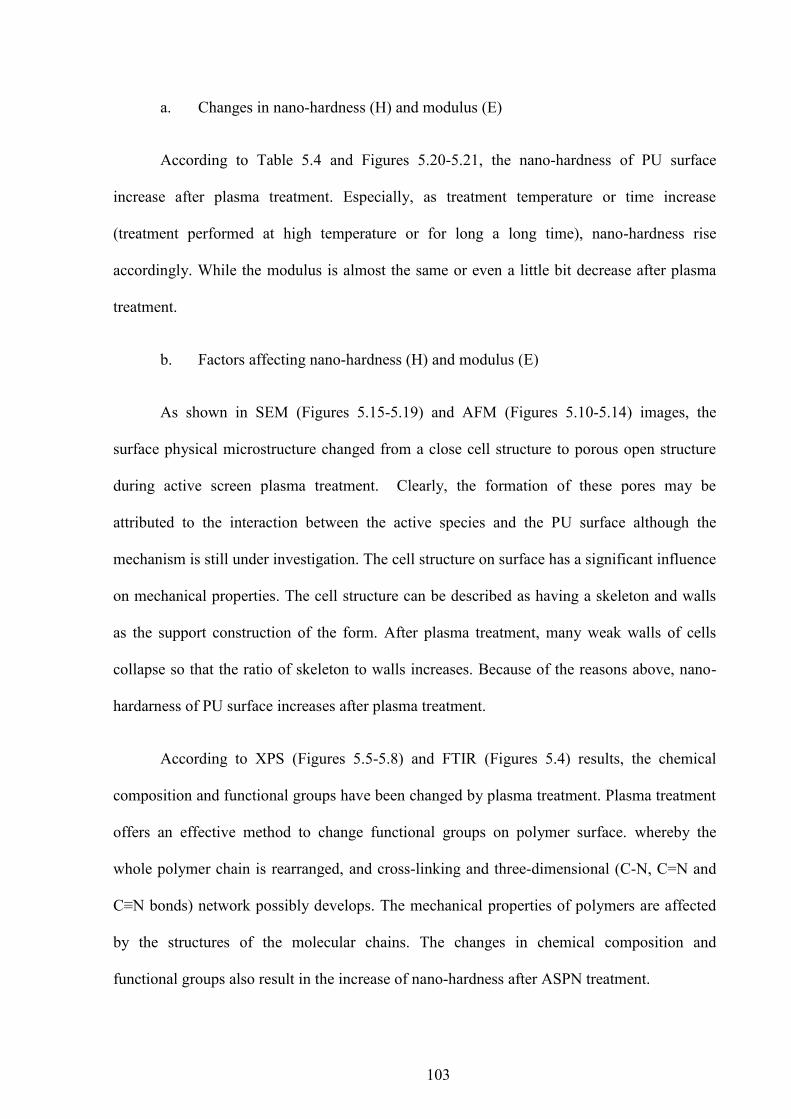
103
a. Changes in nano-hardness (H) and modulus (E)
According to Table 5.4 and Figures 5.20-5.21, the nano-hardness of PU surface
increase after plasma treatment. Especially, as treatment temperature or time increase
(treatment performed at high temperature or for long a long time), nano-hardness rise
accordingly. While the modulus is almost the same or even a little bit decrease after plasma
treatment.
b. Factors affecting nano-hardness (H) and modulus (E)
As shown in SEM (Figures 5.15-5.19) and AFM (Figures 5.10-5.14) images, the
surface physical microstructure changed from a close cell structure to porous open structure
during active screen plasma treatment. Clearly, the formation of these pores may be
attributed to the interaction between the active species and the PU surface although the
mechanism is still under investigation. The cell structure on surface has a significant influence
on mechanical properties. The cell structure can be described as having a skeleton and walls
as the support construction of the form. After plasma treatment, many weak walls of cells
collapse so that the ratio of skeleton to walls increases. Because of the reasons above, nano-
hardarness of PU surface increases after plasma treatment.
According to XPS (Figures 5.5-5.8) and FTIR (Figures 5.4) results, the chemical
composition and functional groups have been changed by plasma treatment. Plasma treatment
offers an effective method to change functional groups on polymer surface. whereby the
whole polymer chain is rearranged, and cross-linking and three-dimensional (C-N, C=N and
C≡N bonds) network possibly develops. The mechanical properties of polymers are affected
by the structures of the molecular chains. The changes in chemical composition and
functional groups also result in the increase of nano-hardness after ASPN treatment.

104
7.3.2 Changes in friction behaviour and wear resistance
7.3.2.1 UHMWPE
a. Friction behaviour
The experimental results (Table 4.6) in Section 4.8 indicate that plasma treatment has
significant influence on the wear and friction behavior of plasma treated UHMWPE against
stainless steel balls. The friction coefficients of plasma treated UHMWPE are higher (0.14-
0.19) than those of the untreated material (0.05).
The interfacial adhesion and ploughing constitute the friction force of UHMWPE
polymer against stainless steel ball. The ploughing force is controlled by the shear strength of
UHMWPE surfaces, which is a main fraction of the friction coefficients. The adhesion force
is influenced by the effective modulus, in which they have inversely proportional relationship
[187]. Therefore, friction coefficient mainly depends on the effective modulus and the shear
strength of the polymer. When the stainless steel ball is rubbing on the UHMWPE surface,
hardened surface of the plasma treated UHMWPE will lead to the increase of the ploughing
force against the hard asperity on the stainless steel surface. Meanwhile, the surface modulus
of UHMWPE increases along with the surface nano-hardness enhancement (Table 4.4). For
this reason, the increment in effective modulus may reduce the adhesive force of stainless
steel ball on treated UHMWPE surface. Consequently, the summation of the ploughing and
adhesion forces will result in the high friction coefficients for treated UHMWPE.
b. Pin-on-disc wear characteristics
As has been shown in Table 4.5 and Figure 4.24, it is interestingly found that the wear
rates of plasma treated UHMWPE for short time (0.5 h) increase but decrease with the
increase of treatment time (1-2 h). Then with the treatment time increases further to 5h, the
wear rate increases again.

105
When treated for short time (0.5 h), the modified layer on the surface is very thin and
hard. During wear, the surface layer was separated from the matrix when the shear force
applied exceeded the fatigue limit of UHMWPE, thus produced a higher wear mass loss [188].
When adhered debris of sheared polymer is smeared across worn surface, it leads to increase
of wear rate (Figure 7.5).
With the increase of treatment time (1-2 h), the modified layer on the surface becomes
thicker and more stable. In plasma modified surface structure, stacked lamellae are
interwoven together with crosslinking amorphous regions to form a grid.
In crystalline regions, stacked lamellae align in order. These lamellae are embedded
within amorphous regions and may communicate with surrounding lamellae by tie molecules
which lie partly in one crystallite and partly in another. This kind of structure can improve
wear resisitance by preventing lamellae from interlamellar slip and lamellar separation.
Additionally, the wear resistance of UHMWPE increases significantly as the degree of
crosslinking increases [189, 190]. In amorphous regions and interfacial regions plasma
induced crosslinking of molecular chains form a crosslinking network. Crosslinking of
supermolecular structure have been suggested to reduce abrasive wear by improving the
resistance of the polymer molecules to plastic deformation [1, 164]. The evidence of reduction
of abrasive wear can also be found in this study (Figure 4.22). Moreover, hard lamellar
crystals forming on plasma modified surface layer results in the increase of nanohardness and
modulus which are beneficial to the improvement of wear resistance by producing high-
strength and high-modulus.
With the increase of treatment time, the wear resistance decreases. It is considered to
lead to surface degradation after long time treatment. Particularly, when treatment performed
at 100 °C for 5h, the wear resistance dramatically decreased. The reasons can be consider of
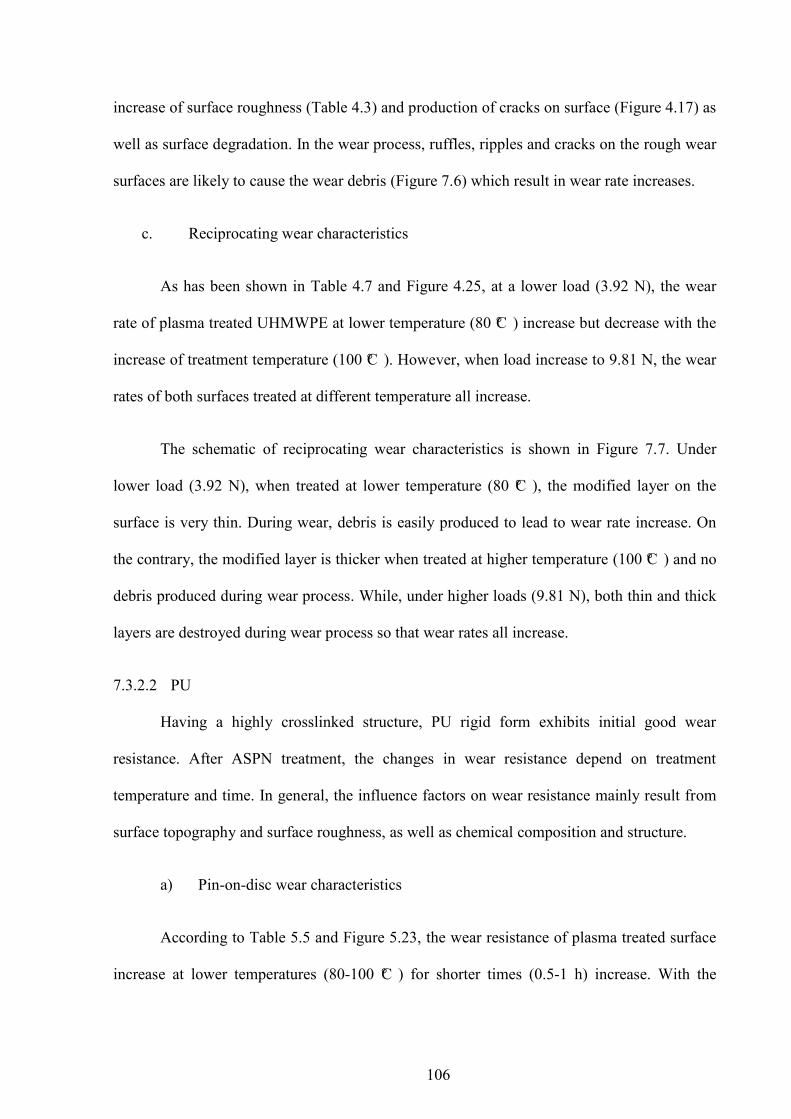
106
increase of surface roughness (Table 4.3) and production of cracks on surface (Figure 4.17) as
well as surface degradation. In the wear process, ruffles, ripples and cracks on the rough wear
surfaces are likely to cause the wear debris (Figure 7.6) which result in wear rate increases.
c. Reciprocating wear characteristics
As has been shown in Table 4.7 and Figure 4.25, at a lower load (3.92 N), the wear
rate of plasma treated UHMWPE at lower temperature (80 °C ) increase but decrease with the
increase of treatment temperature (100 °C ). However, when load increase to 9.81 N, the wear
rates of both surfaces treated at different temperature all increase.
The schematic of reciprocating wear characteristics is shown in Figure 7.7. Under
lower load (3.92 N), when treated at lower temperature (80 °C ), the modified layer on the
surface is very thin. During wear, debris is easily produced to lead to wear rate increase. On
the contrary, the modified layer is thicker when treated at higher temperature (100 °C ) and no
debris produced during wear process. While, under higher loads (9.81 N), both thin and thick
layers are destroyed during wear process so that wear rates all increase.
7.3.2.2 PU
Having a highly crosslinked structure, PU rigid form exhibits initial good wear
resistance. After ASPN treatment, the changes in wear resistance depend on treatment
temperature and time. In general, the influence factors on wear resistance mainly result from
surface topography and surface roughness, as well as chemical composition and structure.
a) Pin-on-disc wear characteristics
According to Table 5.5 and Figure 5.23, the wear resistance of plasma treated surface
increase at lower temperatures (80-100 °C ) for shorter times (0.5-1 h) increase. With the

107
treatment temperature and time increase, wear resistance of the plasma treated surface
decreases.
Firstly, from the view of surface topography, during plasma treatment, active species
with high energy strike on the polyurethane sample surface, some thin walls of cells are
removed to form open cells. In fact, these thin walls are easy to wear into particulate wear
debris which can increase wear rate. In addition, collapse of some thin walls of cells results in
increase of nanohardness on the surface. Therefore, wear resistance increase due to decrease
of wear debris and increase of surface hardness. However, as treatment temperature and time
increase, more and more walls are broken and these broken cells are very easy worn away
which result in decreased wear resistance. Secondly, from the view of surface roughness, after
plasma treatment at 130C for long time, surface roughness increase dramatically, which
result in a decrease in wear resistance.
Plasma treatment causes whole polymer chain rearrangement which results in the
changes in chemical composition and structure on the surface. On the one hand, cross-linking
and three dimension network (C-N, C=N and C≡N bonds) formed on the surface, which result
in the improvement of wear resistance; on the other hand, some bonds broken making chain
scission occur, which results in the decrease of wear resistance. In addition, the breakdown of
hydrogen bonds results in the decrease of intermolecular interaction, which is another reason
for the decrease of wear resistance.
b) Reciprocating wear characteristics
According to Table 5.6 and Figure 5.24, under low load (9.81 N), wear rate of plasma
treated surface decreases. With load increase (13.73 N, 19.62 N), wear rates of plasma treated
surfaces decrease. It is because the plasma modified layer remained intact under lower load

108
which was helpful to reduce wear rate. While, under higher loads, the plasma modified layer
was destroyed to make wear rate increase.
7.4 Improvement of cell biocompatibility
7.4.1 UHMWPE
From the results of the study (Section 4.10), it is obvious that active screen plasma
nitriding offers the possibility to improve the osteoblast cell biocompatibility of UHMWPE.
Particularly, on the surface of UHMWPE treated at 80-100 °C , large numbers of osteoblast
cell adhesion and spreading in four stages (Figure 4.30) can be easily seen. While, on
untreated surface only a few numbers of osteoblast cell in stage 1 can be observed (Figure
4.26a). Osteoblasts are anchorage-dependent cells, and their ability to attach to the surface is
determined by physical and chemical properties of substrate surface. Therefore, the
improvement results from changes of surface roughness, surface topography and chemical
composition, as well as surface wettability and surface energy tailored by ASPN technology.
a. Effect of surface roughness
The surface topography of a material affects cells through contact guidance, a
phenomenon which has also been described with osteoblastic cells. In this study, although cell
attachment and spreading all improved on plasma treated surface, the 80 °C treated surfaces
showed the best cell attachment results (Figure 4.31).
Although the surface topography and roughness of all samples have been changed
after ASPN treatment, the changes are within a very limited range on the 80 °C treated
surfaces; while on the surface treated at 130 °C , the changes are much more significant.
Stacked lamellae lead to grooves morphologies Cell alignment has been shown to be
inversely influenced by the spacing of the grooves [70, 71, 191]. Besides, according to
previous research [192-194], cell spreading and continuous cell layer formation on smooth
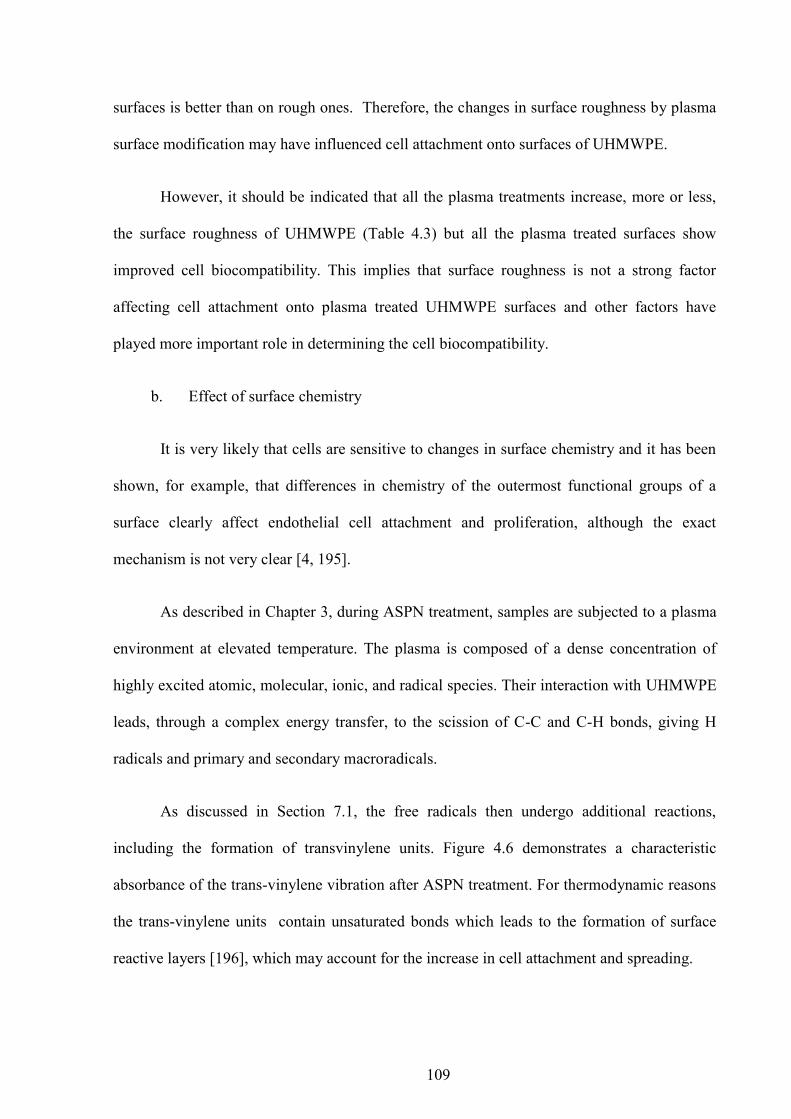
109
surfaces is better than on rough ones. Therefore, the changes in surface roughness by plasma
surface modification may have influenced cell attachment onto surfaces of UHMWPE.
However, it should be indicated that all the plasma treatments increase, more or less,
the surface roughness of UHMWPE (Table 4.3) but all the plasma treated surfaces show
improved cell biocompatibility. This implies that surface roughness is not a strong factor
affecting cell attachment onto plasma treated UHMWPE surfaces and other factors have
played more important role in determining the cell biocompatibility.
b. Effect of surface chemistry
It is very likely that cells are sensitive to changes in surface chemistry and it has been
shown, for example, that differences in chemistry of the outermost functional groups of a
surface clearly affect endothelial cell attachment and proliferation, although the exact
mechanism is not very clear [4, 195].
As described in Chapter 3, during ASPN treatment, samples are subjected to a plasma
environment at elevated temperature. The plasma is composed of a dense concentration of
highly excited atomic, molecular, ionic, and radical species. Their interaction with UHMWPE
leads, through a complex energy transfer, to the scission of C-C and C-H bonds, giving H
radicals and primary and secondary macroradicals.
As discussed in Section 7.1, the free radicals then undergo additional reactions,
including the formation of transvinylene units. Figure 4.6 demonstrates a characteristic
absorbance of the trans-vinylene vibration after ASPN treatment. For thermodynamic reasons
the trans-vinylene units contain unsaturated bonds which leads to the formation of surface
reactive layers [196], which may account for the increase in cell attachment and spreading.
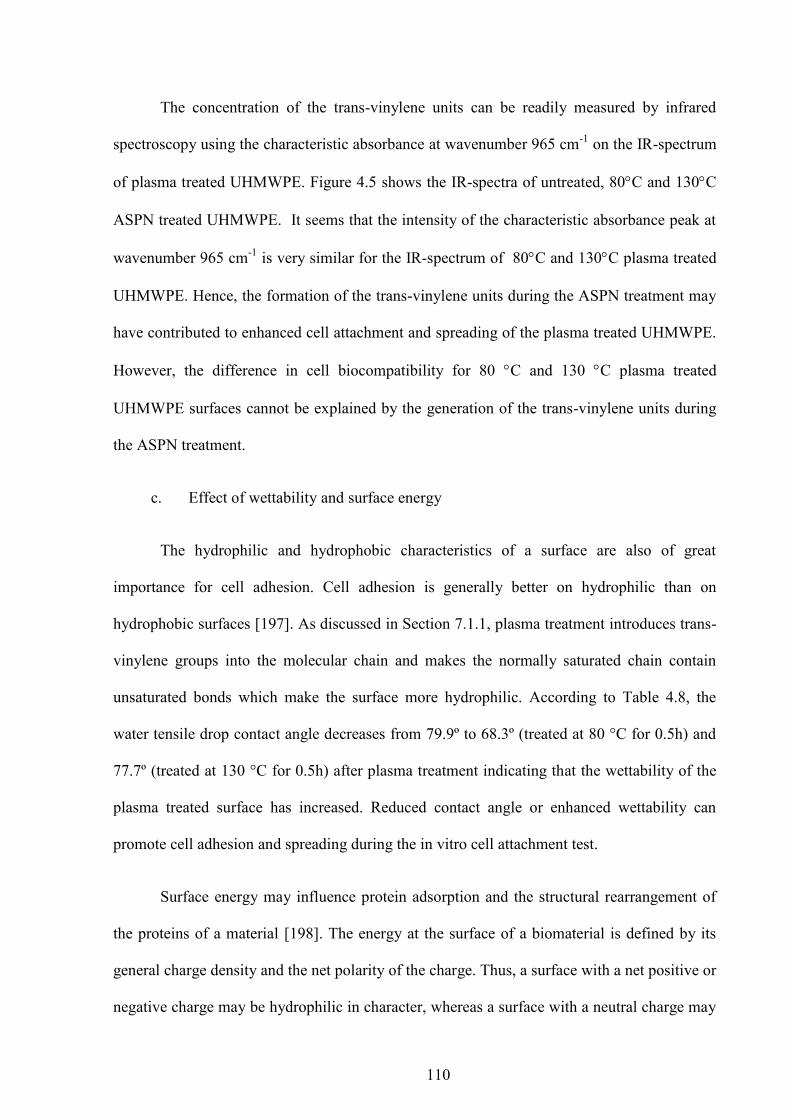
110
The concentration of the trans-vinylene units can be readily measured by infrared
spectroscopy using the characteristic absorbance at wavenumber 965 cm-1 on the IR-spectrum
of plasma treated UHMWPE. Figure 4.5 shows the IR-spectra of untreated, 80C and 130C
ASPN treated UHMWPE. It seems that the intensity of the characteristic absorbance peak at
wavenumber 965 cm-1 is very similar for the IR-spectrum of 80C and 130C plasma treated
UHMWPE. Hence, the formation of the trans-vinylene units during the ASPN treatment may
have contributed to enhanced cell attachment and spreading of the plasma treated UHMWPE.
However, the difference in cell biocompatibility for 80 C and 130 C plasma treated
UHMWPE surfaces cannot be explained by the generation of the trans-vinylene units during
the ASPN treatment.
c. Effect of wettability and surface energy
The hydrophilic and hydrophobic characteristics of a surface are also of great
importance for cell adhesion. Cell adhesion is generally better on hydrophilic than on
hydrophobic surfaces [197]. As discussed in Section 7.1.1, plasma treatment introduces trans-
vinylene groups into the molecular chain and makes the normally saturated chain contain
unsaturated bonds which make the surface more hydrophilic. According to Table 4.8, the
water tensile drop contact angle decreases from 79.9º to 68.3º (treated at 80 °C for 0.5h) and
77.7º (treated at 130 °C for 0.5h) after plasma treatment indicating that the wettability of the
plasma treated surface has increased. Reduced contact angle or enhanced wettability can
promote cell adhesion and spreading during the in vitro cell attachment test.
Surface energy may influence protein adsorption and the structural rearrangement of
the proteins of a material [198]. The energy at the surface of a biomaterial is defined by its
general charge density and the net polarity of the charge. Thus, a surface with a net positive or
negative charge may be hydrophilic in character, whereas a surface with a neutral charge may
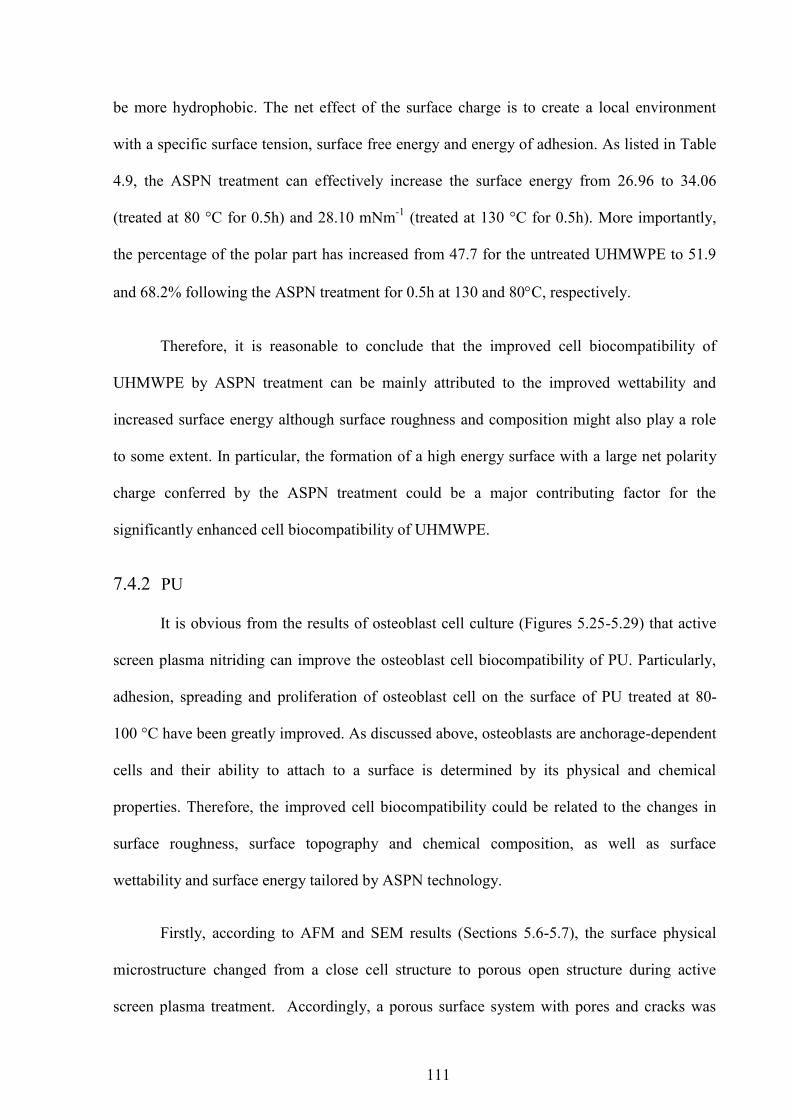
111
be more hydrophobic. The net effect of the surface charge is to create a local environment
with a specific surface tension, surface free energy and energy of adhesion. As listed in Table
4.9, the ASPN treatment can effectively increase the surface energy from 26.96 to 34.06
(treated at 80 °C for 0.5h) and 28.10 mNm-1 (treated at 130 °C for 0.5h). More importantly,
the percentage of the polar part has increased from 47.7 for the untreated UHMWPE to 51.9
and 68.2% following the ASPN treatment for 0.5h at 130 and 80C, respectively.
Therefore, it is reasonable to conclude that the improved cell biocompatibility of
UHMWPE by ASPN treatment can be mainly attributed to the improved wettability and
increased surface energy although surface roughness and composition might also play a role
to some extent. In particular, the formation of a high energy surface with a large net polarity
charge conferred by the ASPN treatment could be a major contributing factor for the
significantly enhanced cell biocompatibility of UHMWPE.
7.4.2 PU
It is obvious from the results of osteoblast cell culture (Figures 5.25-5.29) that active
screen plasma nitriding can improve the osteoblast cell biocompatibility of PU. Particularly,
adhesion, spreading and proliferation of osteoblast cell on the surface of PU treated at 80-
100 °C have been greatly improved. As discussed above, osteoblasts are anchorage-dependent
cells and their ability to attach to a surface is determined by its physical and chemical
properties. Therefore, the improved cell biocompatibility could be related to the changes in
surface roughness, surface topography and chemical composition, as well as surface
wettability and surface energy tailored by ASPN technology.
Firstly, according to AFM and SEM results (Sections 5.6-5.7), the surface physical
microstructure changed from a close cell structure to porous open structure during active
screen plasma treatment. Accordingly, a porous surface system with pores and cracks was
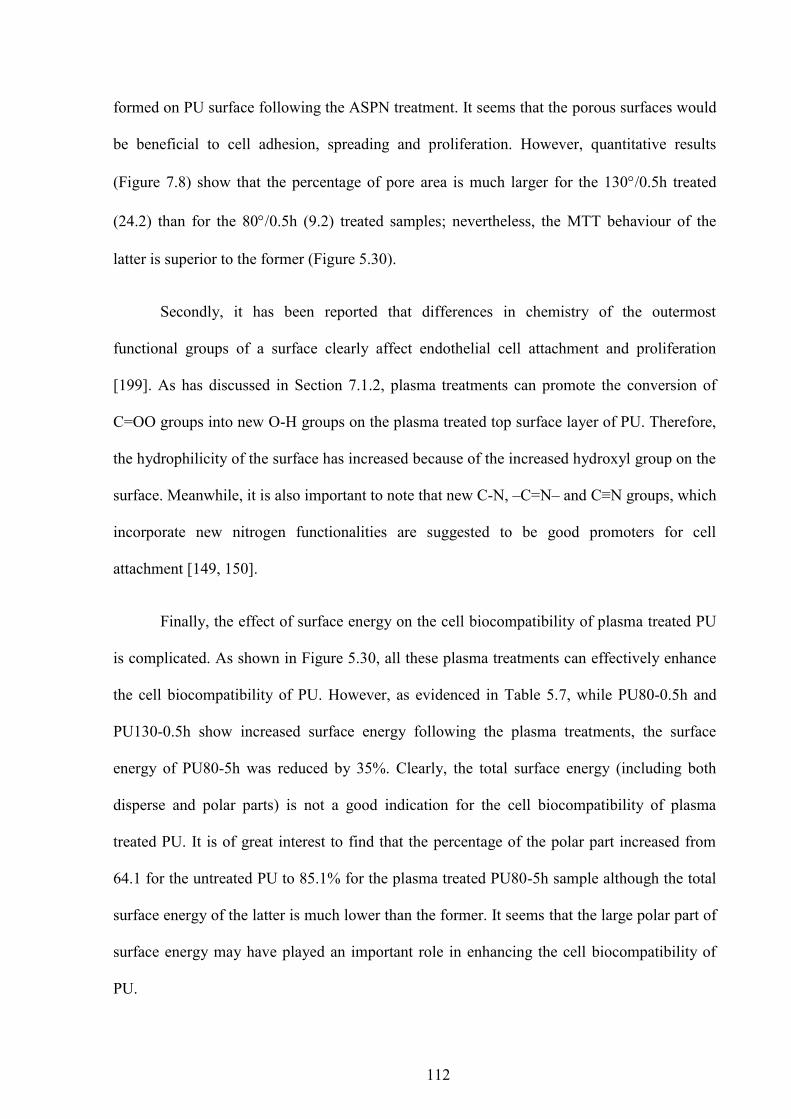
112
formed on PU surface following the ASPN treatment. It seems that the porous surfaces would
be beneficial to cell adhesion, spreading and proliferation. However, quantitative results
(Figure 7.8) show that the percentage of pore area is much larger for the 130/0.5h treated
(24.2) than for the 80/0.5h (9.2) treated samples; nevertheless, the MTT behaviour of the
latter is superior to the former (Figure 5.30).
Secondly, it has been reported that differences in chemistry of the outermost
functional groups of a surface clearly affect endothelial cell attachment and proliferation
[199]. As has discussed in Section 7.1.2, plasma treatments can promote the conversion of
C=OO groups into new O-H groups on the plasma treated top surface layer of PU. Therefore,
the hydrophilicity of the surface has increased because of the increased hydroxyl group on the
surface. Meanwhile, it is also important to note that new C-N, –C=N– and C≡N groups, which
incorporate new nitrogen functionalities are suggested to be good promoters for cell
attachment [149, 150].
Finally, the effect of surface energy on the cell biocompatibility of plasma treated PU
is complicated. As shown in Figure 5.30, all these plasma treatments can effectively enhance
the cell biocompatibility of PU. However, as evidenced in Table 5.7, while PU80-0.5h and
PU130-0.5h show increased surface energy following the plasma treatments, the surface
energy of PU80-5h was reduced by 35%. Clearly, the total surface energy (including both
disperse and polar parts) is not a good indication for the cell biocompatibility of plasma
treated PU. It is of great interest to find that the percentage of the polar part increased from
64.1 for the untreated PU to 85.1% for the plasma treated PU80-5h sample although the total
surface energy of the latter is much lower than the former. It seems that the large polar part of
surface energy may have played an important role in enhancing the cell biocompatibility of
PU.

113
7.4.3 PCL
Cell attachment is the first phase of cell/material interaction and the quality of this
phase will influence the cells ability to proliferate and to differentiate on contact with the
material [200, 201]. Using an in vitro study, cell attachment can be determined by the cell
topography and cell numbers. Figures 6.12-6.17 show that osteoblast cell adhesion and
spreading are much better not only by cell topography but also by cell numbers on the ASPN
treated PCL surface than on the untreated surface.
Osteoblasts are anchorage-dependent cells, and their ability to attach to the surface is
related to the physical and chemical properties of substrate surface. As discussed in Section
7.2, no appreciable changes in surface roughness could be detected after ASPN treatment.
Therefore, the improved cell attachment cannot be attributed to surface roughness but to other
factors. As shown in Table 6.4, the contact angle of water and ethylene glycol on PCL is
reduced by plasma treatment, thus leading to improved wettability. The calculated surface
energy and the percentage of the polar part are increased accordingly. The plasma treated
surface become more hydrophilic because of the decomposition of the carboxyl groups and
the development of hydroxyl groups (Section 7.1.3). It is known that cell adhesion is
generally better on hydrophilic surfaces [197]. Therefore, the improved cell compatibility of
the plasma treated PCL can be mainly attributed to the changes in surface chemistry and
improved surface wettability.
7.5 Effect on degradability
It is well known that PCL is a biodegradable polymer and the study of degradation of
plasma treated PCL is an important issue for its application in the medical fields. In this study,
enzymatic degradation rate of PCL confirmed to be reduced after active screen plasma
treatment.
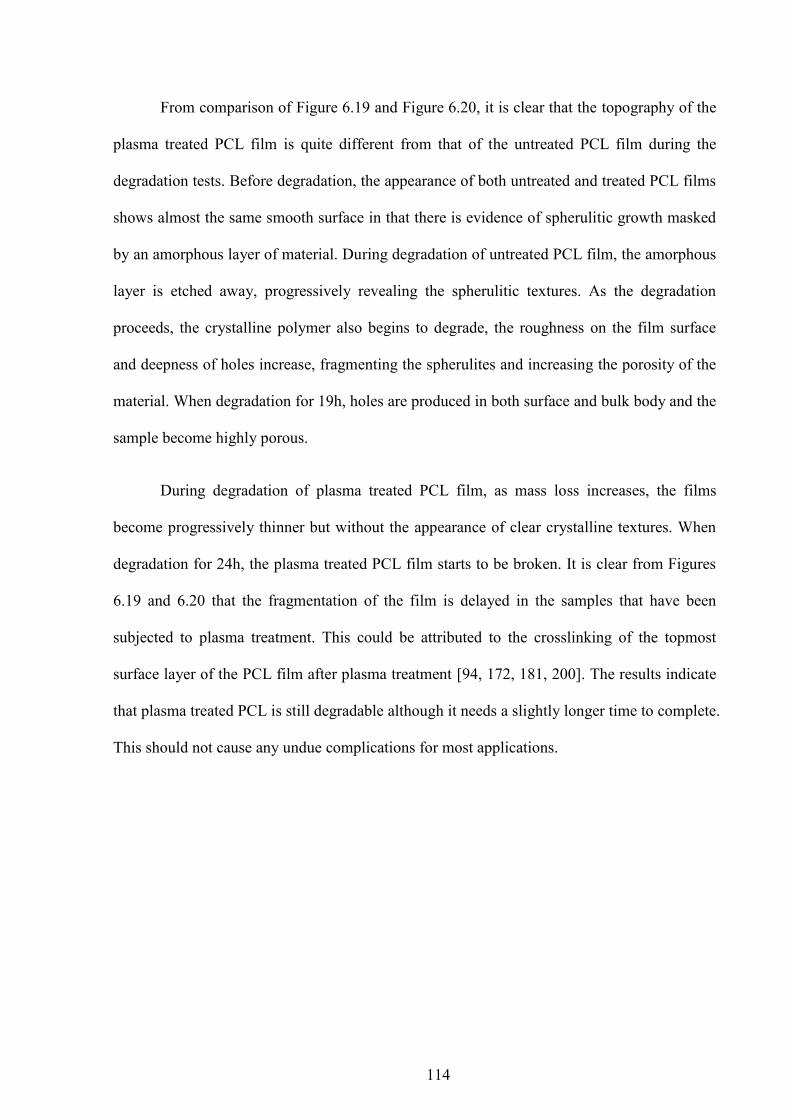
114
From comparison of Figure 6.19 and Figure 6.20, it is clear that the topography of the
plasma treated PCL film is quite different from that of the untreated PCL film during the
degradation tests. Before degradation, the appearance of both untreated and treated PCL films
shows almost the same smooth surface in that there is evidence of spherulitic growth masked
by an amorphous layer of material. During degradation of untreated PCL film, the amorphous
layer is etched away, progressively revealing the spherulitic textures. As the degradation
proceeds, the crystalline polymer also begins to degrade, the roughness on the film surface
and deepness of holes increase, fragmenting the spherulites and increasing the porosity of the
material. When degradation for 19h, holes are produced in both surface and bulk body and the
sample become highly porous.
During degradation of plasma treated PCL film, as mass loss increases, the films
become progressively thinner but without the appearance of clear crystalline textures. When
degradation for 24h, the plasma treated PCL film starts to be broken. It is clear from Figures
6.19 and 6.20 that the fragmentation of the film is delayed in the samples that have been
subjected to plasma treatment. This could be attributed to the crosslinking of the topmost
surface layer of the PCL film after plasma treatment [94, 172, 181, 200]. The results indicate
that plasma treated PCL is still degradable although it needs a slightly longer time to complete.
This should not cause any undue complications for most applications.

115
8 Conclusions
Based on the experimental results and the discussion presented in the last chapter, the
following conclusions can be drawn:
8.1 UHMWPE
1. An absorbance peak at 965 cm-1 (ascribed to the transvinylene group, -CH=CH-)
and a peak at 910 cm-1 (ascribed to the terminal vinyl group, -CH=CH2) are
generated in the surface UHMWPE after active-screen nitrogen plasma treatment.
2. Active-screen plasma nitriding can change the crystallinity and structure of
UHMWPE. In crystalline regions, the molecular chains rearrange along the (110)
plane into the stacked lamellae by plasma induced chain scission. In amorphous
and interfacial regions, the crosslinks form preferentially by free radical reactions
induced by plasma treatment.
3. The morphological and structural changes as well as the improvement of wear
properties under certain treatment conditions could be attributed to production of
cross-linking, rearrangement of molecule chains and high degree of orientation
induced by the active-screen plasma treatment.
4. Active-screen plasma nitriding technique is an effective and practical method to
effectively improve osteoblast cell adhesion and spreading on the UHMWPE
surface mainly due to the modified surface chemistry and improved wettability.
8.2 Polyurethane (PU)
5. Active-screen plasma surface modification can effectively alter the surface
morphologies of polyurethane from a closed cell structure into porous because of
the interaction between the active species and the PU surface.

116
6. It is clear from the FTIR results that the active screen nitrogen plasma treatment
has resulted in partial transfer of C=OO groups into new O-H groups in the
plasma treated surface top layer.
7. It can be concluded from XPS study that during the active screen nitrogen plasma
treatment, the most characteristic polyurethane chemical group, the (>HC)-NH-
C=OO-(CH<) group in the surface of PU is destroyed; the carboxyl group (C=OO)
has transformed to hydroxyl group (-OH).
8. The wettability of the surface of polyurethane has been improved by the active
screen nitrogen plasma treatment. The improvement in hydrophilicity of plasma
treated PU surfaces could be attributed to the introduction of surface hydrophilic
groups and a porous, open surface structure resulting from the active screen
plasma treatment.
8.3 Polycaprolactone (PCL)
9. Changes in chemical composition and structure have been found on a
polycaprolactone surface following active screen plasma surface treatment.
Crosslinking and new hydroxyl groups are formed on the topmost surface layer
after the treatment.
10. The hydrophilicity of polycaprolactone can also be improved by the active screen
nitrogen plasma treatment mainly due to the plasma treatment induced change in
surface chemistry (e.g. formation of new hydroxyl group) and increased surface
free energy.
11. The osteoblast cell adhesion and spreading on PCL can be significantly improved
by active-screen nitrogen plasma surface modification probably due to improved
hydrophilicity of the treated surfaces.
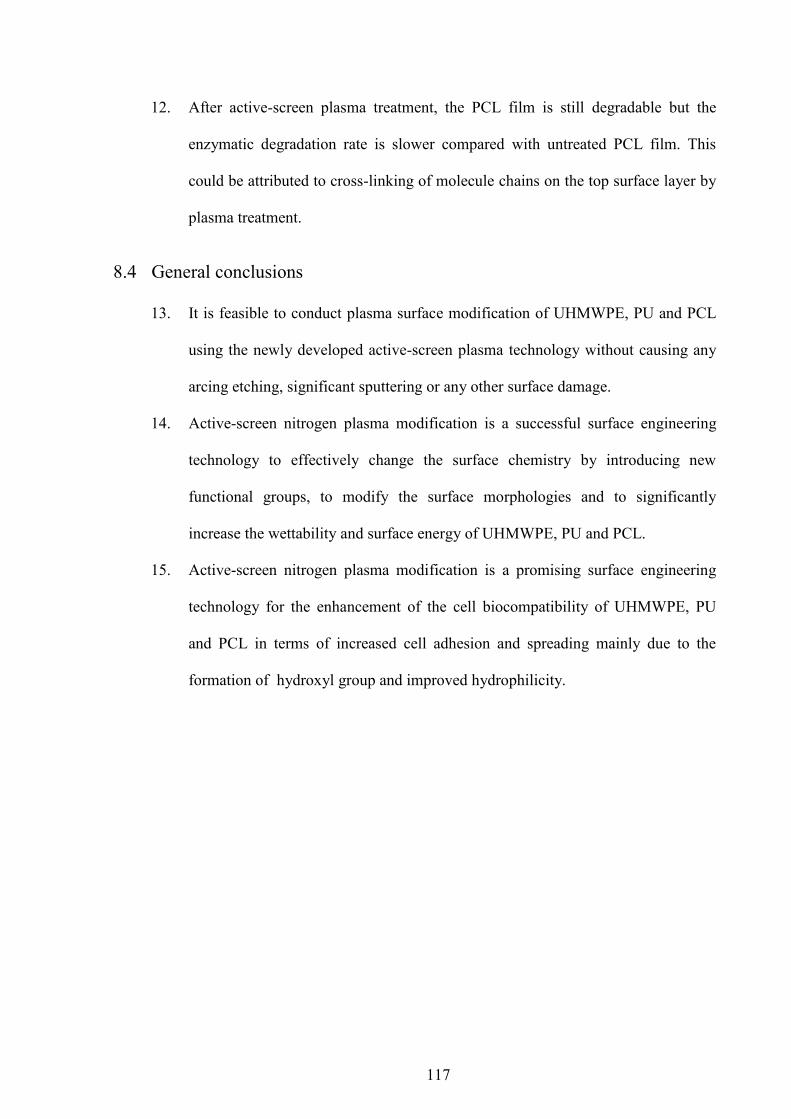
117
12. After active-screen plasma treatment, the PCL film is still degradable but the
enzymatic degradation rate is slower compared with untreated PCL film. This
could be attributed to cross-linking of molecule chains on the top surface layer by
plasma treatment.
8.4 General conclusions
13. It is feasible to conduct plasma surface modification of UHMWPE, PU and PCL
using the newly developed active-screen plasma technology without causing any
arcing etching, significant sputtering or any other surface damage.
14. Active-screen nitrogen plasma modification is a successful surface engineering
technology to effectively change the surface chemistry by introducing new
functional groups, to modify the surface morphologies and to significantly
increase the wettability and surface energy of UHMWPE, PU and PCL.
15. Active-screen nitrogen plasma modification is a promising surface engineering
technology for the enhancement of the cell biocompatibility of UHMWPE, PU
and PCL in terms of increased cell adhesion and spreading mainly due to the
formation of hydroxyl group and improved hydrophilicity.
118
9 Future work
Some significant observations have been made in the development of novel active
screen plasma surface modification of polymers. However, this technology is still at its early
stage and future research is needed. To this end, the following future work has been suggested.
Firstly, surface reactions induced by active screen plasma are very complicated.
Evidences obtained on the mechanisms of reactions between plasma and polymer surface are
limited by techniques currently available. It is important to investigate the mechanisms
involved when new plasma diagnostic technologies are available in future. For example, laser
diagnostic measurements provide three-dimensional in situ measurement of concentration
gradients for reactive ions in the plasma, velocities and temperatures. It is possible to do
experimental and theoretical research in three main areas: plasma generation and transport;
calculation of particle energy in plasma; plasma-surface interaction.
Secondly, very promising results have been achieved in this study using active screen
nitrogen plasma. Therefore, it is interesting to investigate the feasibility of using other gases
(for example Ar, CH4, etc.) to treat these biomedical polymers.
Thirdly, from the point of view of biomedical applications, it is very important to
investigate the long-term effect of active screen plasma treatment on the biocompatibility of
polymers.
It is well-known that cell lines are sensitive to the physical and chemical
characteristics of the materials with which they interact and that different cell lines have
different response to the same biomaterials surfaces. It is important to investigate different
cell lines adhesion and proliferation characteristics of active screen plasma modified polymers
119
It should be possible to investigate long-term maintenance for in vitro testing of
cultured polymers under different culture conditions (e.g., compare conventional static
cultures with and without serum supplementation to a serum-free perfusion culture) over an
extended period of time (e.g.,15, 30, 60,100 days).
Apart from cell biocompatibility, protein adsorption and desorption characteristics as
well as blood adhesion, activation and aggregation could also be researched.

120
10 References
1. McKellop H, Shen FW, Lu B, Campbell P, Salovey R. Development of an extremely wear-resistant ultra high molecular weight polyethylene for total hip replacements. Journal of Orthopaedic Research, 1999; 17(2): 157-167.
2. Muratoglu OK, Bragdon CR, O'Connor DO, Jasty M, Harris WH. A novel method of cross-linking ultra-high-molecular-weight polyethylene to improve wear, reduce oxidation, and retain mechanical properties - Recipient of the 1999 HAP Paul Award. Journal of Arthroplasty, 2001; 16(2): 149-160.
3. Shi W, Li XY, Dong H. Improved wear resistance of ultra-high molecular weight polyethylene by plasma immersion ion implantation. Wear, 2001; 250: 544-552.
4. Kaklamani G, Mehrban N, Chen J, Bowen J, Dong H, Grover L, Stamboulis A. Effect of plasma surface modification on the biocompatibility of UHMWPE. Biomedical Materials, 2010; 5(5).
5. Oztarhan A, Urkac ES, Kaya N, Yenigul M, Tihminlioglu F, Ezdesir A, Zimmerman R, Budak S, Muntele C, Chhay B, Ila D, Oks E, Nikolaev A, Tek Z, Eltem R. Modification of surface morphology of UHMWPE for biomedical implants. in: Ila DBJKNCPK, Editor. Ion-Beam-Based Nanofabrication. 2007. 91-100.
6. Hutmacher DW, Schantz T, Zein I, Ng KW, Teoh SH, Tan KC. Mechanical properties and cell cultural response of polycaprolactone scaffolds designed and fabricated via fused deposition modeling. Journal of Biomedical Materials Research, 2001; 55(2): 203-216.
7. Xu FJ, Wang ZH, Yang WT. Surface functionalization of polycaprolactone films via surface-initiated atom transfer radical polymerization for covalently coupling cell-adhesive biomolecules. Biomaterials, 2010; 31(12): 3139-3147.
8. Hsu SH, Tseng HJ, Fang ZK. Polyurethane blended with polylactides for improved cell adhesion and reduced platelet activation. Artificial Organs, 1999; 23(10): 958-961.
9. Cheng ZY, Teoh SH. Surface modification of ultra thin poly (epsilon-caprolactone) films using acrylic acid and collagen. Biomaterials, 2004; 25(11): 1991-2001.
10. Lindberg T, Wirsen A, Albertsson AC. Graft polymerisation of acrylamide onto PCL film by electron beam pre-irradiation in air or argon. Morphology in the final grafted state. Polymer, 2000; 41(11): 4099-4111.
11. Yang F, Wolke JGC, Jansen JA. Biomimetic calcium phosphate coating on electrospun poly (epsilon-caprolactone) scaffolds for bone tissue engineering. Chemical Engineering Journal, 2008; 137(1): 154-161.
12. Bazaka K, Jacob MV, Crawford RJ, Ivanova EP. Plasma-assisted surface modification of organic biopolymers to prevent bacterial attachment. Acta Biomaterialia, 2011; 7(5): 2015-2028.
13. Dong H, Bell T. State-of-the-art overview: ion beam surface modification of polymers towards improving tribological properties. Surface & Coatings Technology, 1999; 111(1): 29-40.
14. Ikada Y. Surface modification of polymers for medical applications. Biomaterials, 1994; 15(10): 725-736.
15. Dubas ST, Kittitheeranun P, Rangkupan R, Sanchavanakit N, Potiyaraj P. Coating of Polyelectrolyte Multilayer Thin Films on Nanofibrous Scaffolds to Improve Cell Adhesion. Journal of Applied Polymer Science, 2009; 114(3): 1574-1579.
16. Ghasemi-Mobarakeh L, Prabhakaran MP, Morshed M, Nasr-Esfahani MH, Ramakrishna S. Bio-functionalized PCL nanofibrous scaffolds for nerve tissue

121
engineering. Materials Science & Engineering C-Materials for Biological Applications, 2010; 30(8): 1129-1136.
17. Lee H-U, Jeong Y-S, Jeong S-Y, Park S-Y, Bae J-S, Kim H-G, Cho C-R. Role of reactive gas in atmospheric plasma for cell attachment and proliferation on biocompatible poly epsilon-caprolactone film. Applied Surface Science, 2008; 254(18): 5700-5705.
18. Manso M, Valsesia A, Lejeune M, Gilliland D, Ceccone G, Rossi F. Tailoring surface properties of biomedical polymers by implantation of Ar and He ions. Acta Biomaterialia, 2005; 1(4): 431-440.
19. Raucci MG, D'Anto V, Guarino V, Sardella E, Zeppetelli S, Favia P, Ambrosio L. Biomineralized porous composite scaffolds prepared by chemical synthesis for bone tissue regeneration. Acta Biomaterialia, 2010; 6(10): 4090-4099.
20. Satriano C, Carnazza S, Guglielmino S, Marletta G. Surface free energy and cell attachment onto ion-beam irradiated polymer surfaces. Nuclear Instruments & Methods in Physics Research Section B-Beam Interactions with Materials and Atoms, 2003; 208: 287-293.
21. Tiaw KS, Goh SW, Hong M, Wang Z, Lan B, Teoh SH. Laser surface modification of poly(epsilon-caprolactone) (PCL) membrane for tissue engineering applications. Biomaterials, 2005; 26(7): 763-769.
22. Guzman L, Celva R, Miotello A, Voltolini E, Ferrari F, Adami M. Polymer surface modification by ion implantation and reactive deposition of transparent films. Surface & Coatings Technology, 1998; 104: 375-379.
23. Toth A, Bell T, Bertoti I, Mohai M, Zelei B. Surface modification of polyethylene by low keV ion beams. Nuclear Instruments & Methods in Physics Research Section B-Beam Interactions with Materials and Atoms, 1999; 148(1-4): 1131-1135.
24. Toth A, Bertoti I, Szilagyi E, Dong H, Bell T, Juhasz A, Nagy PM. Surface characterization of ultrahigh molecular weight polyethylene after nitrogen ion implantation. Surface and Interface Analysis, 2000; 30(1): 434-438.
25. Ikeda D, Ogawa M, Hara Y, Nishimura Y, Odusanya O, Azuma K, Matsuda S, Yatsuzuka M, Murakami A. Effect of nitrogen plasma-based ion implantation on joint prosthetic material. Surface & Coatings Technology, 2002; 156(1-3): 301-305.
26. Matossian JN, Wei RH. Challenges and progress toward a 250 kV, 100 kW plasma ion implantation facility. Surface & Coatings Technology, 1996; 85(1-2): 111-119.
27. Dong H, Bell T, Blawert C, Mordike BL. Plasma immersion ion implantation of UHMWPE. Journal of Materials Science Letters, 2000; 19(13): 1147-1149.
28. Arefi F, Andre V, Montazerrahmati P, Amouroux J. Plasma polymerization and surface-treatment of polymers. Pure and Applied Chemistry, 1992; 64(5): 715-723.
29. Chan CM, Ko TM, Hiraoka H. Polymer surface modification by plasmas and photons. Surface Science Reports, 1996; 24(1-2): 3-54.
30. Biederman H. RF sputtering of polymers and its potential application. Vacuum, 2000; 59(2-3): 594-599.
31. Georges J. TC plasma nitriding. Heat Treatment of Metals, 2001; 28(2): 33-37. 32. Georges J, Cleugh D. Active screen plasma nitriding. in: Bell T, Akamatsu K, Editors.
Stainless Steel 2000—Thermochemical Surface Engineering of Stainless Steel. The Institute of Materials, UK. 2001. 377–387.
33. Khorasani MT, Zaghiyan M, Mirzadeh H. Ultra high molecular weight polyethylene and polydimethylsiloxane blend as acetabular cup material. Colloids and Surfaces B-Biointerfaces, 2005; 41(2-3): 169-174.
34. Kurtz SM. The UHMWPE Handbook: Ultra-High Molecular Weight Polyethylene in Total Joint Replacement. Elsevier Academic Press, San Diego, California. 2004.
122
35. Mackay TG, Bernacca GM, Fisher AC, Hindle CS, Wheatley DJ. In vitro function and durability assessment of a novel polyurethane heart valve prosthesis. Artificial Organs, 1996; 20(9): 1017-1025.
36. Phillips RE, Smith MC, Thoma RJ. Biomedical applications of polyurethanes: implications of failure mechanisms. Journal of Biomaterials Applications, 1988; 3(2): 207-27.
37. Stokes K, Cobian K. Polyether polyurethanes for implantable pacemaker leads. Biomaterials, 1982; 3(4): 225-231.
38. Choong C, Triffitt JT, Cui ZF. Polycaprolactone scaffolds for bone tissue engineering - Effects of a calcium phosphate coating layer on osteogenic cells. Food and Bioproducts Processing, 2004; 82(C2): 117-125.
39. Gabriel M, Amerongen GPV, Van Hinsbergh VWM, Amerongen AVV, Zentner A. Direct grafting of RGD-motif-containing peptide on the surface of polycaprolactone films. Journal of Biomaterials Science-Polymer Edition, 2006; 17(5): 567-577.
40. Jeong SI, Kim BS, Kang SW, Kwon JH, Lee YM, Kim SH, Kim YH. In vivo biocompatibilty and degradation behavior of elastic poly(L-lactide-co-epsilon-caprolactone) scaffolds. Biomaterials, 2004; 25(28): 5939-5946.
41. Leong DT, Khor WM, Chew FT, Lim TC, Hutmacher DW. Characterization of osteogenically induced adipose tissue-derived precursor cells in 2-dimensional and 3-dimensional environments. Cells Tissues Organs, 2006; 182(1): 1-11.
42. Lowry KJ, Hamson KR, Bear L, Peng YB, Calaluce R, Evans ML, Anglen JO, Allen WC. Polycaprolactone/glass bioabsorbable implant in a rabbit humerus fracture model. Journal of Biomedical Materials Research, 1997; 36(4): 536-541.
43. Marletta G, Ciapetti G, Satriano C, Perut F, Salerno M, Baldini N. Improved osteogenic differentiation of human marrow stromal cells cultured on ion-induced chemically structured poly-epsilon-caprolactone. Biomaterials, 2007; 28(6): 1132-1140.
44. Ng KW, Hutmacher DW, Schantz J-T, Ng CS, Too H-P, Lim TC, Phan TT, Teoh SH. Evaluation of ultra-thin poly(epsilon-caprolactone) films for tissue-engineered skin. Tissue Engineering, 2001; 7(4): 441-455.
45. Nair LS, Laurencin CT. Biodegradable polymers as biomaterials. Progress in Polymer Science, 2007; 32(8-9): 762-798.
46. Sidouni FZ, Nurdin N, Chabrecek P, Lohmann D, Vogt J, Xanthopoulos N, Mathieu HJ, Francois P, Vaudaux P, Descouts P. Surface properties of a specifically modified high-grade medical polyurethane. Surface Science, 2001; 491(3): 355-369.
47. Bertoti I, Mohai M, Toth A, Ujvari T. Nitrogen-PBII modification of ultra-high molecular weight polyethylene: Composition, structure and nanomechanical properties. Surface & Coatings Technology, 2007; 201(15): 6839-6842.
48. Kondyurin A, Karmanov V, Guenzel R. Plasma immersion ion implantation of polyethylene. Vacuum, 2001; 64(2): 105-111.
49. Shi W, Dong H. Surface modification of UHMWPE by nitrogen implantation. Contributions of Surface Engineering to Modern Manufacturing and Remanufacturing, ed. Zhang S, Zhou ZR, Liu JJ, Zhu MH. 2002. 379-383.
50. Oertel G, ed. Polyurethane Handbook. Carl Hanser Verlag: Munich. 1985. 51. Li DJ, Cui FZ, Feng QL, Zhao J. Oxygen ion beam and plasma induced blood
compatibility of polyetherurethane. Chinese Physics Letters, 1997; 14(7): 531-534. 52. Li DJ, Zhao J. The structure of biomedical behavior of ion-bombarded and plasma-
polymerized segmented polyurethane. Applied Surface Science, 1994; 78(2): 195-201. 53. Li DJ, Zhao J. Surface biomedical effects of plasma on polyetherurethane. Journal of
Adhesion Science and Technology, 1995; 9(9): 1249-1261.
123
54. Chrissafis K, Antoniadis G, Paraskevopoulos KM, Vassiliou A, Bikiaris DN. Comparative study of the effect of different nanoparticles on the mechanical properties and thermal degradation mechanism of in situ prepared poly(e-caprolactone) nanocomposites. Composites Science and Technology, 2007; 67: 2165–2174.
55. Engelberg I, Kohn J. Physicomechanical properties of degradable polymers used in medical applications - a comparative-study. Biomaterials, 1991; 12(3): 292-304.
56. Pitt CG, Schinder A. Capronor-A biodegradable delivery system for levonorgestrel. in: Zatachini GL, Editor. Long-acting contraceptive systems. Harpen and Row, Philadelphia. 1984. 63-84.
57. Khor HL, Ng KW, Schantz JT, Phan TT, Lim TC, Teoh SH, Hutmacher DW. Poly(epsilon-caprolactone) films as a potential substrate for tissue engineering an epidermal equivalent. Materials Science & Engineering C-Biomimetic and Supramolecular Systems, 2002; 20(1-2): 71-75.
58. Clark DT, Feast WJ, eds. Polymer Surfaces. John Wiley & Sons: Chichester. 1978. 59. Brisoe BJ, Tabor D. Friction and wear of polymers. in: Clark DT, Feast WJ, Editors.
Polymer surfaces. John Wiley & Sons, Chichester. 1978. 1-20. 60. Bhushan B, Gupta BK. Handbook of tribology: materials, coatings and surface
treatment. Krieger Publishing Company, New York. 1991. 61. Bowden FP, Tabor D. Friction and lubrication of solids. Clarendon Press, Oxford.
1964. 62. Buckley DH. Surface effects in adhesion, friction, wear and lubrication. Elsevier,
Amsterdam. 1981. 63. Khruschov MM. Principles of abrasive wear. Wear, 1974; 6: 353-365. 64. Fischer TE. Tribochemistry. Ann Rev Mater Sci, 1988; 18: 303-323. 65. Schrader ME, Loed D, eds. Modern approach to wettability: theory and application.
Marcel Dekker: New York. 1982. 66. Garbassi F, Morra M, Occhiello E. Polymer Surfaces: from Physical to Technology.
John Wiley and Sons, Chichester. 1998. 67. Awaja F, Gilbert M, Kelly G, Fox B, Pigram PJ. Adhesion of polymers. Progress in
Polymer Science, 2009; 34(9): 948-968. 68. Tavana H, Neumann AW. Recent progress in the determination of solid surface
tensions from contact angles. Advances in Colloid and Interface Science, 2007; 132(1): 1-32.
69. Williams DF. The Williams Dictionary of Biomaterials. Liverpool University Press, Liverpool. 1999.
70. Chesmel KD, Black J. Cellular-responses to chemical and morphologic aspects of biomaterial surfaces .1. a novel in-vitro model system. Journal of Biomedical Materials Research, 1995; 29(9): 1089-1099.
71. Chesmel KD, Clark CC, Brighton CT, Black J. Cellular-responses to chemical and morphologic aspects of biomaterial surfaces .2. the biosynthetic and migratory response of bone cell-populations. Journal of Biomedical Materials Research, 1995; 29(9): 1101-1110.
72. Dabagh M, Abdekhodaie MJ, Khorasani MT. Effects of polydimethylsiloxane grafting on the calcification, physical properties, and biocompatibility of polyurethane in a heart valve. Journal of Applied Polymer Science, 2005; 98(2): 758-766.
73. Ishihara K. New polymeric biomaterials: Phospholipid polymers with a biocompatible surface. Frontiers of Medical and Biological Engineering, 2000; 10(2): 83-95.
74. Vasita R, Shanmugam K, Katti DS. Improved biomaterials for tissue engineering applications: Surface modification of polymers. Current Topics in Medicinal Chemistry, 2008; 8(4): 341-353.
124
75. Zhang YZ, Venugopal J, Huang ZM, Lim CT, Ramakrishna S. Characterization of the surface biocompatibility of the electrospun PCL-collagen nanofibers using fibroblasts. Biomacromolecules, 2005; 6(5): 2583-2589.
76. Butler M. Animal cell culture and technology: the basics. Oxford University Press, Oxford. 1996.
77. Ma Z, Mao Z, Gao C. Surface modification and property analysis of biomedical polymers used for tissue engineering. Colloids and Surfaces B-Biointerfaces, 2007; 60(2): 137-157.
78. Rajaraman.R, Rounds DE, Yen SPS, Rembaum A. Scanning electron-microscope study of cell adhesion and spreading in vitro. Experimental Cell Research, 1974; 88(2): 327-339.
79. Dvorak JA. The application of atomic force microscopy to the study of living vertebrate cells in culture. Methods, 2003; 29(1): 86-96.
80. Dvorak JA, Nagao E. Kinetic analysis of the mitotic cycle of living vertebrate cells by atomic force microscopy. Experimental Cell Research, 1998; 242(1): 69-74.
81. Nagao E, Dvorak JA. An integrated approach to the study of living cells by atomic force microscopy. Journal of Microscopy-Oxford, 1998; 191: 8-19.
82. Armani DK, Liu C. Mircofabrication technology for polycaprolactone, a biodegradable polymer. Journal of Micromechanics and Microengineering, 2000; 10(1): 80-84.
83. Cannizzaro SM, Padera RF, Langer R, Rogers RA, Black FE, Davies MC, Tendler SJB, Shakesheff KM. A novel biotinylated degradable polymer for cell-interactive applications. Biotechnology and Bioengineering, 1998; 58(5): 529-535.
84. Chrissafis K, Paraskevopoulos KM, Tsiaoussis I, Bikiaris D. Comparative Study of the Effect of Different Nanoparticles on the Mechanical Properties, Permeability, and Thermal Degradation Mechanism of HDPE. Journal of Applied Polymer Science, 2009; 114(3): 1606-1618.
85. Gopferich A. Polymer degradation and erosion: Mechanisms and applications. European Journal of Pharmaceutics and Biopharmaceutics, 1996; 42(1): 1-11.
86. Gopferich A. Mechanisms of polymer degradation and erosion. Biomaterials, 1996; 17(2): 103-114.
87. Gopferich A, Tessmar J. Polyanhydride degradation and erosion. Advanced Drug Delivery Reviews, 2002; 54(7): 911-931.
88. Piskin E. Biodegradable polymers as biomaterials. Journal of Biomaterials Science-Polymer Edition, 1994; 6(9): 775-795.
89. Santerre JP, Woodhouse K, Laroche G, Labow RS. Understanding the biodegradation of polyurethanes: From classical implants to tissue engineering materials. Biomaterials, 2005; 26(35): 7457-7470.
90. Shimao M. Biodegradation of plastics. Current Opinion in Biotechnology, 2001; 12(3): 242-247.
91. Sivalingam G, Chattopadhyay S, Madras G. Enzymatic degradation of poly (epsilon-caprolactone), poly (vinyl acetate) and their blends by lipases. Chemical Engineering Science, 2003; 58(13): 2911-2919.
92. Sivalingam G, Madras G. Thermal degradation of poly (epsilon-caprolactone). Polymer Degradation and Stability, 2003; 80(1): 11-16.
93. Sun H, Mei L, Song C, Cui X, Wang P. The in vivo degradation, absorption and excretion of PCL-based implant. Biomaterials, 2006; 27(9): 1735-1740.
94. Darwis D, Mitomo H, Enjoji T, Yoshi F, Makuuchi K. Enzymatic degradation of radiation crosslinked poly(epsilon-caprolactone). Polymer Degradation and Stability, 1998; 62(2): 259-265.

125
95. Sivalingam G, Madras G. Oxidative degradation of poly (vinyl acetate) and poly (epsilon-caprolactone) and their mixtures in solution. Chemical Engineering Science, 2004; 59(7): 1577-1587.
96. Sivalingam G, Vijayalakshmi SP, Madras G. Enzymatic and thermal degradation of poly(epsilon-caprolactone), poly(D,L-lactide), and their blends. Industrial & Engineering Chemistry Research, 2004; 43(24): 7702-7709.
97. Tsuji H, Ono T, Saeki T, Daimon H, Fujie K. Hydrolytic degradation of poly(epsilon-caprolactone) in the melt. Polymer Degradation and Stability, 2005; 89(2): 336-343.
98. Barbucci R, ed. Integrated biomaterial science. Kluwer Academic/Plenum Publishers: New York. 2002.
99. Williams D. Tissue Engineering. Academic Press, Amsterdam. 2008. 100. Goddard JM, Hotchkiss JH. Polymer surface modification for the attachment of
bioactive compounds. Progress in Polymer Science, 2007; 32(7): 698-725. 101. Morent R, De Geyter N, Desmet T, Dubruel P, Leys C. Plasma Surface Modification
of Biodegradable Polymers: A Review. Plasma Processes and Polymers, 2011; 8(3): 171-190.
102. Farris S, Pozzoli S, Biagioni P, Duo L, Mancinelli S, Piergiovanni L. The fundamentals of flame treatment for the surface activation of polyolefin polymers - A review. Polymer, 2010; 51(16): 3591-3605.
103. Tuominen M, Lahti J, Kuusipalo J. Effects of flame and corona treatment on extrusion coated paper properties. Tappi Journal, 2011; 10(10): 29-37.
104. Lippert T. Interaction of photons with polymers: From surface modification to ablation. Plasma Processes and Polymers, 2005; 2(7): 525-546.
105. Sturrock PA. Plasma Physics: An Introduction to the Theory of Astrophysical, Geophysical & Laboratory Plasmas. Cambridge University Press. 1994.
106. Hegemann D, Brunner H, Oehr C. Plasma treatment of polymers for surface and adhesion improvement. Nuclear Instruments & Methods in Physics Research Section B-Beam Interactions with Materials and Atoms, 2003; 208: 281-286.
107. Kuzuya M, Sawa T, Mouri M, Kondo SI, Takai O. Plasma technique for the fabrication of a durable functional surface on organic polymers. Surface & Coatings Technology, 2003; 169: 587-591.
108. Dong H. Surface modification of ultra-high molecular weight polyethylene for joint prosthesis and sports applications. in Proc. of the 4th Inter. Conf. on surf. Eng. 2004. Beijing: Science Press.
109. Sammons RL, Elhaj AJ, Marquis PM. Novel culture procedure permitting the synthesis of proteins by rat calvarial cells cultured on hydroxyapatite particles to be quantified. Biomaterials, 1994; 15(7): 536-542.
110. Sharpe JR, Sammons RL, Marquis PM. Effect of pH on protein adsorption to hydroxyapatite and tricalcium phosphate ceramics. Biomaterials, 1997; 18(6): 471-476.
111. Bland R, Sammons RL, Sheppard MC, Williams GR. Thyroid hormone, vitamin D and retinoid receptor expression and signalling in primary cultures of rat osteoblastic and immortalised osteosarcoma cells. Journal of Endocrinology, 1997; 154(1): 63-74.
112. Lumbikanonda N, Sammons R. Bone cell attachment to dental implants of different surface characteristics. International Journal of Oral and Maxillofacial Implants, 2001; 16(5): 627-636.
113. Sammons RL, Lumbikanonda N, Gross M, Cantzler P. Comparison of osteoblast spreading on microstructured dental implant surfaces and cell behaviour in an explant model of osseointegration. Clinical Oral Implants Research, 2005; 16(6): 657-666.
114. Murdoch FE, Sammons RL, Chapple ILC. Isolation and characterization of subgingival staphylococci from periodontitis patients and controls. Oral Diseases, 2004; 10(3): 155-162.
126
115. Inagaki N, Narushim K, Ejima S, Ikeda Y, Lim SK, Park YW, Miyazaki K. Hydrophobic recovery of plasma-modified film surfaces of ethylene-co-tetrafluoroethylene co-polymer. Journal of Adhesion Science and Technology, 2003; 17(11): 1457-1475.
116. Inagaki N, Narushima K, Tsutsui Y, Ohyama Y. Surface modification and degradation of poly(lactic acid) films by Ar-plasma. Journal of Adhesion Science and Technology, 2002; 16(8): 1041-1054.
117. Inagaki N, Tasaka S, Shimada S. Comparative studies on surface modification of poly(ethylene terephthalate) by remote and direct argon plasmas. Journal of Applied Polymer Science, 2001; 79(5): 808-815.
118. Brown NMD, Cui NY, McKinley A. A study of the topography of a glassy carbon surface following low-power radio-frequency oxygen plasma treatment. Applied Surface Science, 1998; 133(3): 157-165.
119. Caro JC, Lappan U, Simon F, Pleul D, Lunkwitz K. On the low-pressure plasma treatment of PTFE (polytetrafluoroethylene) with SO2 as process gas. European Polymer Journal, 1999; 35(6): 1149-1152.
120. Liu C, Brown NMD, Meenan BJ. Dielectric barrier discharge (DBD) processing of PMMA surface: Optimization of operational parameters. Surface & Coatings Technology, 2006; 201(6): 2341-2350.
121. Liu CZ, Cui NY, Brown NMD, Meenan BJ. Effects of DBD plasma operating parameters on the polymer surface modification. Surface & Coatings Technology, 2004; 185(2-3): 311-320.
122. Safinia L, Datan N, Hohse M, Mantalaris A, Bismarck A. Towards a methodology for the effective surface modification of porous polymer scaffolds. Biomaterials, 2005; 26(36): 7537-7547.
123. Setsuhara Y, Cho K, Takenaka K, Ebe A, Shiratani M, Sekine M, Hori M, Ikenaga E, Kondo H, Nakatsuka O, Zaima S. Plasma surface treatment of polymers with inductivity-coupled RF plasmas driven by low-inductance antenna units. Thin Solid Films, 2009; 518(3): 1006-1011.
124. Vesel A, Mozetic M, Strnad S. Improvement of adhesion of fucoidan on polyethylene terephthalate surface using gas plasma treatments. Vacuum, 2011; 85(12): 1083-1086.
125. Li RZ, Ye L, Mai YW. Application of plasma technologies in fibre-reinforced polymer composites: A review of recent developments. Composites Part a-Applied Science and Manufacturing, 1997; 28(1): 73-86.
126. Li CX, Bell T. Principles, mechanisms and applications of active screen plasma nitriding. Heat Treatment of Metals, 2003; 30(1): 1-7.
127. Li CX, Bell T. Potential of plasma nitriding of polymer for improved hardness and wear resistance. Journal of Materials Processing Technology, 2005; 168(2): 219-224.
128. Li CX, Bell T, Dong H. A study of active screen plasma nitriding. Surface Engineering, 2002; 18(3): 174-181.
129. Desai S, Singh RP. Surface modification of polyethylene. in: Albertsson A, Editor. Long-term properties of polyolefins. Springer, New York. 2004. 231-293.
130. Chapiro A. Radiation Chemistry of Polymeric Systems. Interscience Publishers, London. 1962.
131. Venkatesan T, Calcagno L, Elman BS, Foti G. Ion Beam Modification of Insulators, ed. Mazzoldi P, Arnold GW. Elsevier, Amsterdam. 1987. 301-379.
132. Chu PK, Chen JY, Wang LP, Huang N. Plasma-surface modification of biomaterials. Materials Science & Engineering R-Reports, 2002; 36(5-6): 143-206.
133. Oehr C. Plasma surface modification of polymers for biomedical use. Nuclear Instruments & Methods in Physics Research Section B-Beam Interactions with Materials and Atoms, 2003; 208: 40-47.

127
134. VanLandingham MR, Villarrubia JS, Guthrie WF, Meyers GF. Nanoindentation of polymers: An overview. Macromolecular Symposia, 2001; 167: 15-43.
135. Oliver WC, Pharr GM. An improved technique for determining hardness and elastic-modulus using load and displacement sensing indentation experiments. Journal of Materials Research, 1992; 7(6): 1564-1583.
136. Oliver WC, Pharr GM. Measurement of hardness and elastic modulus by instrumented indentation: Advances in understanding and refinements to methodology. Journal of Materials Research, 2004; 19(1): 3-20.
137. Poletti G, Orsini F, Riccardi C, Raffaele-Addamo A, Barni R. Atomic force microscopy investigation of cold-plasma-treated poly(ethyleneterephthalate) textiles. Surface and Interface Analysis, 2003; 35(4): 410-412.
138. Vohrer U, Hegemann D, Oehr C. XPS, AES, and AFM as tools for study of optimized plasma functionalization. Analytical and Bioanalytical Chemistry, 2003; 375(7): 929-934.
139. Falconnet D, Csucs G, Grandin HM, Textor M. Surface engineering approaches to micropattern surfaces for cell-based assays. Biomaterials, 2006; 27(16): 3044-3063.
140. Khorasani MT, Mirzadeh H, Kermani Z. Wettability of porous polydimethylsiloxane surface: morphology study. Applied Surface Science, 2005; 242(3-4): 339-345.
141. Petermann J. Morphology in oriented semicrystalline polymers. in: Fakirov S, Editor. Oriented Polymer Materials. Hüthig & Wepf, New York. 1996.
142. Vickerman JC, ed. Surface analysis : the principal techniques Wiley: Chichester. 1997. 143. Kakudo M, Kasai N. X-ray Diffraction by Polymers. Kodansha Ltd, Elsvier
Publishing Company, American Elsvier Publishing Company, Inc, Tokyo, Amsterdam, New York. 1972.
144. Warren BE. X-ray diffraction. Dover Publications, New York. 1990. 145. Ensinger Ltd. Address: Wilfried Way Tonyrefail Mid Glam CF39 8JQ. Web:
www.ensinger.ltd.uk. 146. TUFNOL Limited Company. Address: Tufnol Composites Ltd, Wellhead Lane, Perry
Barr, Birmingham B42 2TN. Web: http://www.tufnol.com/. 147. Tang ZG, Black RA, Curran JM, Hunt JA, Rhodes NP, Williams DF. Surface
properties and biocompatibility of solvent-cast poly epsilon-caprolactone films. Biomaterials, 2004; 25(19): 4741-4748.
148. Gallo SC, Dong H. On the fundamental mechanisms of active screen plasma nitriding. Vacuum, 2009; 84(2): 321-325.
149. Griesser HJ, Chatelier RC, Gengenbach TR, Johnson G, Steele JG. Growth of human-cells on plasma polymers - putative role of amine and amide groups. Journal of Biomaterials Science-Polymer Edition, 1994; 5(6): 531-554.
150. Steele JG, Johnson G, McFarland C, Dalton BA, Gengenbach TR, Chatelier RC, Underwood PA, Griesser HJ. Roles of serum vitronectin and fibronectin in initial attachment of human vein endothelial-cells and dermal fibroblasts on oxygen-containing and nitrogen-containing surfaces made by radiofrequency plasmas. Journal of Biomaterials Science-Polymer Edition, 1994; 6(6): 511-532.
151. Priest JM, Baldwin MJ, Fewell MP. The action of hydrogen in low-pressure r.f.-plasma nitriding. Surface & Coatings Technology, 2001; 145(1-3): 152-163.
152. Korner N, Beck E, Dommann A, Onda N, Ramm J. Hydrogen plasma chemical cleaning of metallic substrates and silicon wafers. Surface & Coatings Technology, 1995; 76-77(1-3): 731-737.
153. Guzman AM, Carlson JD, Bares JE, Pronko PP. Chemical and physical changes induced in polyvinylidene fluoride by irradiation with high-energy ions. Nuclear Instruments & Methods in Physics Research Section B-Beam Interactions with Materials and Atoms, 1985; 7-8(MAR): 468-472.

128
154. Zhou J, Chakravartula A, Pruitt L, Komvopoulos K. Tribological and nanomechanical properties of unmodified and crosslinked ultra-high molecular weight polyethylene for total joint replacements. Journal of Tribology-Transactions of the Asme, 2004; 126(2): 386-394.
155. Owens DK, Wendt RC. Estimation of surface free energy of polymers. Journal of Applied Polymer Science, 1969; 13(8): 1741-&.
156. Gomathi N, Mishra D, Maiti TK, Neogi S. Enhanced Cell Adhesion to Helium Plasma-Treated Polypropylene. Journal of Adhesion Science and Technology, 2009; 23(13-14): 1861-1874.
157. Cottam E, Hukins DWL, Lee K, Hewitt C, Jenkins MJ. Effect of sterilisation by gamma irradiation on the ability of polycaprolactone (PCL) to act as a scaffold material. Medical Engineering & Physics, 2009; 31(2): 221-226.
158. Pena J, Corrales T, Izquierdo-Barba I, Doadrio AL, Vallet-Regi M. Long term degradation of poly(epsilon-caprolactone) films in biologically related fluids. Polymer Degradation and Stability, 2006; 91(7): 1424-1432.
159. Coombes AGA, Rizzi SC, Williamson M, Barralet JE, Downes S, Wallace WA. Precipitation casting of polycaprolactone for applications in tissue engineering and drug delivery. Biomaterials, 2004; 25(2): 315-325.
160. Reggiani M, Tinti A, Taddei P, Visentin M, Stea S, De Clerico M, Fagnano C. Phase transformation in explanted highly crystalline UHMWPE acetabular cups and debris after in vivo wear. Journal of Molecular Structure, 2006; 785(1-3): 98-105.
161. Stuart B. Infrared Spectroscopy: Fundamentals and Applications. Wiley. 2004. 162. Chanda A, Mukhopadhyay AK, Basu D, Chatterjee S. Wear and friction behaviour of
UHMWPE - Alumina combination for total hip replacement. Ceramics International, 1997; 23(5): 437-447.
163. Cho HJ, Wei WJ, Kao HC, Cheng CK. Wear behavior of UHMWPE sliding on artificial hip arthroplasty materials. Materials Chemistry and Physics, 2004; 88(1): 9-16.
164. McKellop H, Shen FW, DiMaio W, Lancaster JG. Wear of gamma-crosslinked polyethylene acetabular cups against roughened femoral balls. Clinical Orthopaedics and Related Research, 1999(369): 73-82.
165. Wang A, Sun DC, Stark C, Dumbleton JH. Wear mechanisms of UHMWPE in total joint replacements. Wear, 1995; 181: 241-249.
166. Zhou J, Komvopoulos K. Wear mechanisms of untreated and gamma irradiated ultra-high molecular weight polyethylene for total joint replacements. Journal of Tribology-Transactions of the Asme, 2005; 127(2): 273-279.
167. Kim BK, Lee SY, Xu M. Polyurethanes having shape memory effects. Polymer, 1996; 37(26): 5781-5793.
168. Beamson G, Briggs D. High Resolution XPS of Organic Polymers. The Scienta ESCA300 Database. Wiley, Chichester. 1992.
169. David RL. Handbook of Chemistry and Physics, 89th ed. CRC Press. 2008. 170. Bertoti I. Characterization of nitride coatings by XPS. Surface & Coatings Technology,
2002; 151: 194-203. 171. Narkis M, Sibony-Chaouat S, Siegmann A, Shkolnik S, Bell JP. Irradiation effects on
polycaprolactone. Polymer, 1985; 26: 50-54. 172. Darwis D, Mitomo H, Enjoji T, Yoshii F, Makuuchi K. Heat resistance of radiation
crosslinked poly(epsilon-caprolactone). Journal of Applied Polymer Science, 1998; 68(4): 581-588.
173. Chernenko T, Matthaeus C, Milane L, Quintero L, Amiji M, Diem M. Label-free Raman spectral imaging of intracellular delivery and degradation of polymeric nanoparticle systems. Acs Nano, 2009; 3(11): 3552-3559.

129
174. Diem M, Matthaus C, Chernenko T, Romeo M, Miljkovic M, Bird B, Schubert J, Papamarkakis K, Bedrossian K, Laver N. Infrared and Raman Spectroscopy and Spectral Imaging of Individual Cells. in: Salzer R, Siesler HW, Editors. Infrared and Raman Spectroscopic Imaging. Wiley-VCH, Weinheim, Germany. 2009. 3-202.
175. Johnson WC, Lyons BJ. Radiolytic formation and decay of trans-vinylene unsaturation in polyethylene - fourier-transform infrared measurements. Radiation Physics and Chemistry, 1995; 46(4-6): 829-832.
176. Lyons BJ, Johnson WC. Radiolytic formation and decay of trans-vinylene unsaturation in polyethylene. Irradiation of Polymeric Materials, 1993; 527: 62-73.
177. Muratoglu OK, Harris WH. Identification and quantification of irradiation in UHMWPE through trans-vinylene yield. Journal of Biomedical Materials Research, 2001; 56(4): 584-592.
178. Muratoglu OK, O'Connor DO, Bragdon CR, Delaney J, Jasty M, Harris WH, Merrill E, Venugopalan P. Gradient crosslinking of UHMWPE using irradiation in molten state for total joint arthroplasty. Biomaterials, 2002; 23(3): 717-724.
179. Toth A, Bertoti I, Mohai M, Ujvari T. Surface modification of polyethylene by nitrogen PIII: Surface chemical and nanomechanical properties. in: Gyulai J, Szabo PJ, Editors. Materials Science, Testing and Informatics III. 2007. 255-261.
180. Premnath V, Harris WH, Jasty M, Merrill EW. Gamma sterilization of UHMWPE articular implants: An analysis of the oxidation problem. Biomaterials, 1996; 17(18): 1741-1753.
181. Tajima S, Komvopoulos K. Effect of reactive species on surface crosslinking of plasma-treated polymers investigated by surface force microscopy. Applied Physics Letters, 2006; 89(12): 4102.
182. Peacock AJ. Handbook of Polyethylene Structure, Properties, and Applications. Marcel Dekker, Inc, New York. 2000.
183. Hannay NB, ed. Solid State Chemisrty. Crystalline and Noncrystalline Solid. Vol. 3. Plenum Press: New York-London. 1976. 507-508.
184. Simis KS, Bistolfi A, Bellare A, Pruitt LA. The combined effects of crosslinking and high crystallinity on the microstructural and mechanical properties of ultra high molecular weight polyethylene. Biomaterials, 2006; 27(9): 1688-1694.
185. Wang A, Essner A, Polineni VK, Stark C, Dumbleton JH. Lubrication and wear of ultra-high molecular weight polyethylene in total joint replacements. Tribology International, 1998; 31(1-3): 17-33.
186. Bueche F. Physical properties of polymers. Interscience Publishers, New York. 1962. 187. Bhushan B. Introduction to Tribology. Wiley, New York. 2002. 188. Ge S, Wang S, Gitis N, Vinogradov M, Xiao J. Wear behavior and wear debris
distribution of UHMWPE against Si3N4 ball in bi-directional sliding. Wear, 2008; 264(7-8): 571-578.
189. Muratoglu OK, Bragdon CR, Jasty M, Harris WH. The effect of radiation damage on the wear rate of UHMWPE components, in ASTM Symposium on Characterization and Properties of UHMWPE. 1996: New Orleans, LA.
190. Wang A, Sun DC, Stark C, Dumbleton JH. Effects of sterilization methods on the wear of UHMWPE acetabular cups. in Proceedings of 5th World Biomaterials Congress. 1996. Toronto, Canada: University of Toronto Press.
191. Clark P, Connolly P, Curtis ASG, Dow JAT, Wilkinson CDW. Topographical control of cell behavior .2. multiple grooved substrata. Development, 1990; 108(4): 635-644.
192. Kieswetter K, Schwartz Z, Hummert TW, Cochran DL, Simpson J, Dean DD, Boyan BD. Surface roughness modulates the local production of growth factors and cytokines by osteoblast-like MG-63 cells. Journal of Biomedical Materials Research, 1996; 32(1): 55-63.

130
193. Anselme K, Bigerelle M, Noel B, Dufresne E, Judas D, Iost A, Hardouin P. Qualitative and quantitative study of human osteoblast adhesion on materials with various surface roughnesses. Journal of Biomedical Materials Research, 2000; 49(2): 155-166.
194. Dalton BA, McFarland CD, Gengenbach TR, Griesser HJ, Steele JG. Polymer surface chemistry and bone cell migration. Journal of Biomaterials Science-Polymer Edition, 1998; 9(8): 781-799.
195. Hunter A, Archer CW, Walker PS, Blunn GW. Attachment and proliferation of osteoblasts and fibroblasts on biomaterials for orthopedic use. Biomaterials, 1995; 16(4): 287-295.
196. Anselme K. Osteoblast adhesion on biomaterials. Biomaterials, 2000; 21(7): 667-681. 197. Altankov G, Groth T. Reorganization of substratum-bound fibronectin on hydrophilic
and hydrophobic materials is related to biocompatibility. Journal of Materials Science-Materials in Medicine, 1994; 5(9-10): 732-737.
198. Boyan BD, Hummert TW, Dean DD, Schwartz Z. Role of material surfaces in regulating bone and cartilage cell response. Biomaterials, 1996; 17(2): 137-146.
199. Margel S, Vogler EA, Firment L, Watt T, Haynie S, Sogah DY. Peptide, protein, and cellular interactions with self-assembled monolayer model surfaces. Journal of Biomedical Materials Research, 1993; 27(12): 1463-1476.
200. Vitte J, Benoliel AM, Pierres A, Bongrand P. Is there a predictable relationship between surface physical-chemical properties and cell behaviour at the interface? European cells & materials, 2004; 7: 52-63.
201. Shin H, Jo S, Mikos AG. Biomimetic materials for tissue engineering. Biomaterials, 2003; 24(24): 4353-4364.
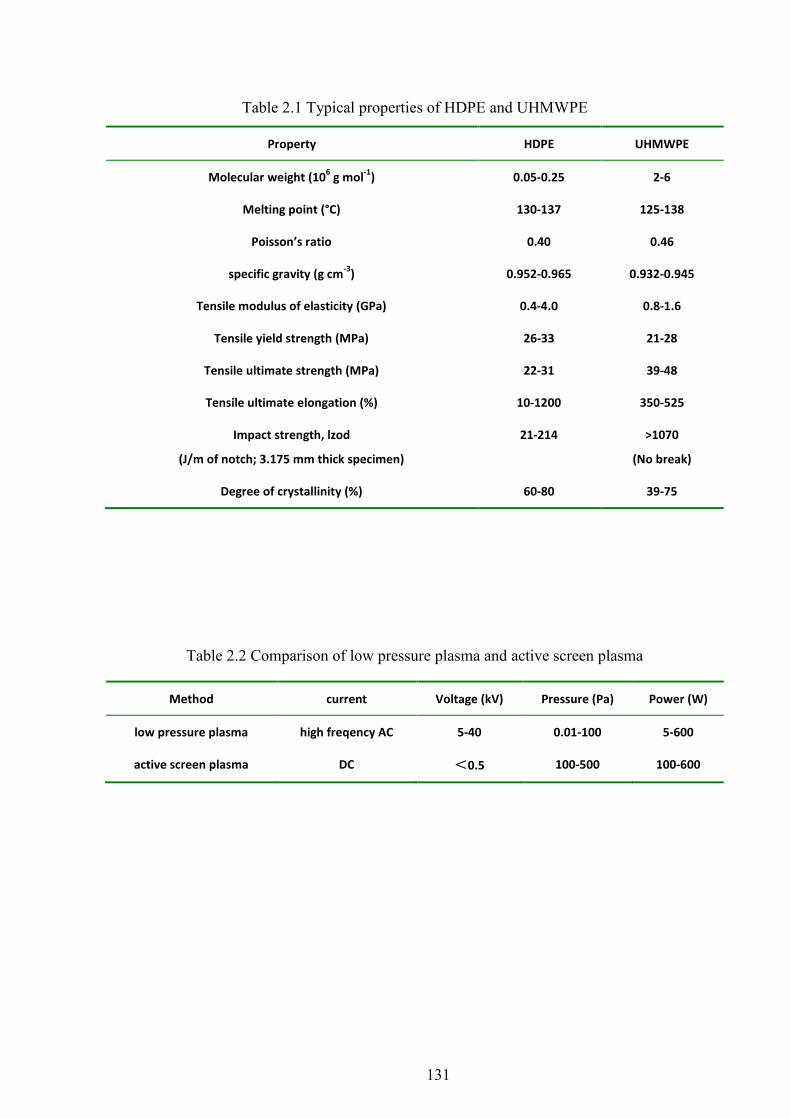
131
Table 2.1 Typical properties of HDPE and UHMWPE
Property HDPE UHMWPE
Molecular weight (106 g mol
-1) 0.05-0.25 2-6
Melting point (°C) 130-137 125-138
Poisson’s ratio 0.40 0.46
specific gravity (g cm-3
) 0.952-0.965 0.932-0.945
Tensile modulus of elasticity (GPa) 0.4-4.0 0.8-1.6
Tensile yield strength (MPa) 26-33 21-28
Tensile ultimate strength (MPa) 22-31 39-48
Tensile ultimate elongation (%) 10-1200 350-525
Impact strength, lzod
(J/m of notch; 3.175 mm thick specimen)
21-214 >1070
(No break)
Degree of crystallinity (%) 60-80 39-75
Table 2.2 Comparison of low pressure plasma and active screen plasma
Method current Voltage (kV) Pressure (Pa) Power (W)
low pressure plasma high freqency AC 5-40 0.01-100 5-600
active screen plasma DC <0.5 100-500 100-600

132
Table 2.3 Three primary modes of AFM [142]
Comparison Contact Mode Non-contact Mode Tapping Mode
Operator Zone I zone II zone I/II zone
Force sensed by tip Short range repulsive forces
Long range attractive forces
Repulsive/ attractive forces
Tip or cantilever position
Tip actually touches the sample
The tip does not contact the sample
surface.
The cantilever is oscillated at a
frequency slightly above the cantilever’s resonance frequency
with an amplitude of a few nanometers
(<10nm).
The cantilever is oscillated at or near its resonance frequency
with an amplitude from 20nm to 100nm.
Feedback loop Maintains constant cantilever deflection
maintains a constant oscillation amplitude
or frequency
Maintains a constant oscillation amplitude
by maintaining a constant RMS of the
oscillation signal
Advantages High scan speeds
Atomic resolution
Rough samples can be scanned easily
No force exerted on the sample surface
Higher lateral resolution (1~5nm)
Lower forces and less damage
Disadvantages Shear force and normal force can
distort images
Damage the soft samples
Lower lateral resolution
Slow scan speed
Usually only work on extremely
hydrophobic samples
Slightly slower scan speed than contact
mode
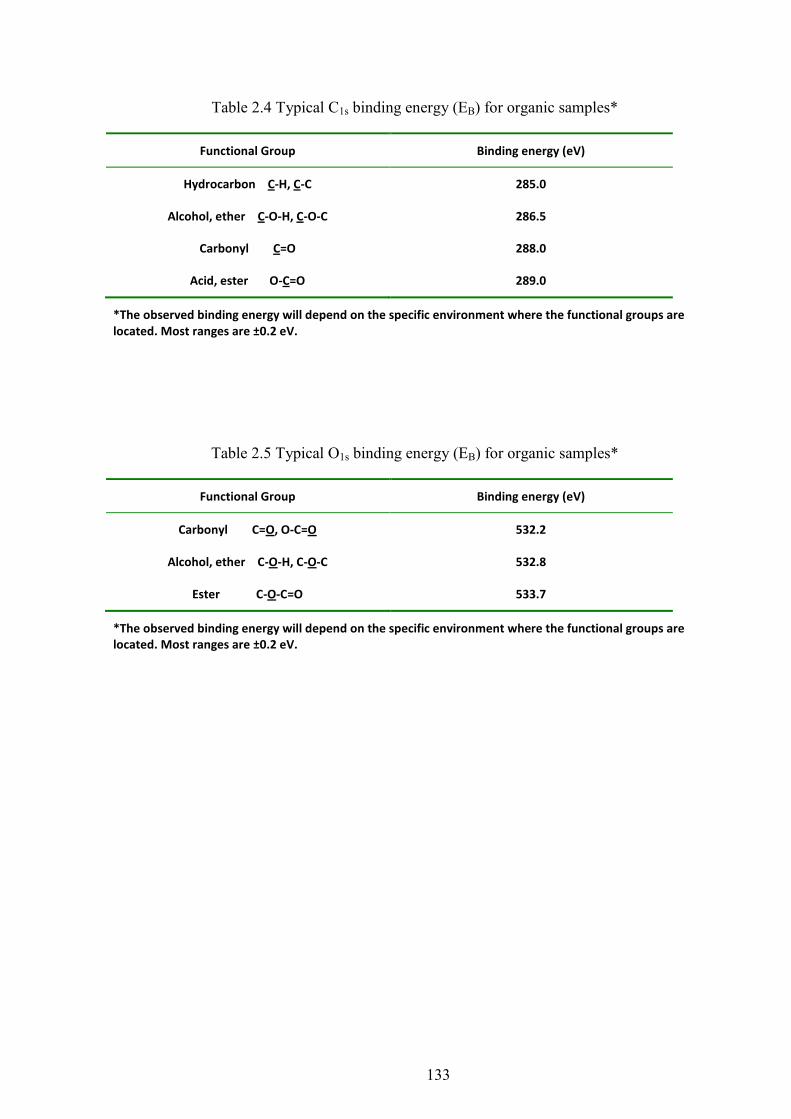
133
Table 2.4 Typical C1s binding energy (EB) for organic samples*
Functional Group Binding energy (eV)
Hydrocarbon C-H, C-C 285.0
Alcohol, ether C-O-H, C-O-C 286.5
Carbonyl C=O 288.0
Acid, ester O-C=O 289.0
*The observed binding energy will depend on the specific environment where the functional groups are located. Most ranges are ±0.2 eV.
Table 2.5 Typical O1s binding energy (EB) for organic samples*
Functional Group Binding energy (eV)
Carbonyl C=O, O-C=O 532.2
Alcohol, ether C-O-H, C-O-C 532.8
Ester C-O-C=O 533.7
*The observed binding energy will depend on the specific environment where the functional groups are located. Most ranges are ±0.2 eV.

134
Table 3.1 Typical physical properties of TECAFINE PE10
Property ASTM Test Method Typical Result Unites
Molecular weight 6×10⁶ g mol
-1
Density 527 / D 792 0.93 g cm-3
Tensile strength at yield 527 / D 638 17 Pa
Tensile strength at break 527 / D 638 40 Pa
Elongation at break 527 / D 638 > 50 %
Modulus of elasticity in tension 527 / D 638 650 Pa
Modulus of elasticity in flexure 178 / D 790 800 Pa
Water Absorptionat saturation at 23 °C 62 0.02 %
Melting point DIN 53 736 135 °C
Coefficient of friction against hardened and ground steel
p = 0.05 N mm-², v = 0.6 m s
-1
0.29
Specific heat 1.84 J(g.K)-1
Coefficient of thermal expansion DIN 53 483 /D 696 20 10-5
K-1
Table 3.2 Typical physical properties of TUFSET rigid polyurethane

135
Property ASTM Test Method Typical Result Unites
Flexural Strength D 790 15,000 lbf/in2
Flexural Modulus D 790 350,000 lbf/in2
Compressive Strength D 695 10,000 lbf/in2
Impact Strength lzod D 256 1.3 ft-lbf/inch
Specific Gravity D 792 1.2 g cm-3
Hardness, durometer D 2240 D83
Water Absorption D 570 0.1 %
Permittivity at 1 MHz D 150 4.0
Dissipation factor at 1 MHz D 150 0.02
Dielectric strength, 3mm D 149 300 Vols/mile
Table 3.3 Typical physical and chemical properties of polycaprolactone
Property ASTM Test Method Typical Result Unites
Synonyms 6-Caprolactone polymer
Formula (C6H10O2)n
Molecular Weight GPC Mn 80,000 g/mol
Density at 25 °C 1.145 g/ml
Purity >99 %
Melting point 60 °C
Table 3.4 Active screen plasma nitriding treatment conditions of UHMWPE
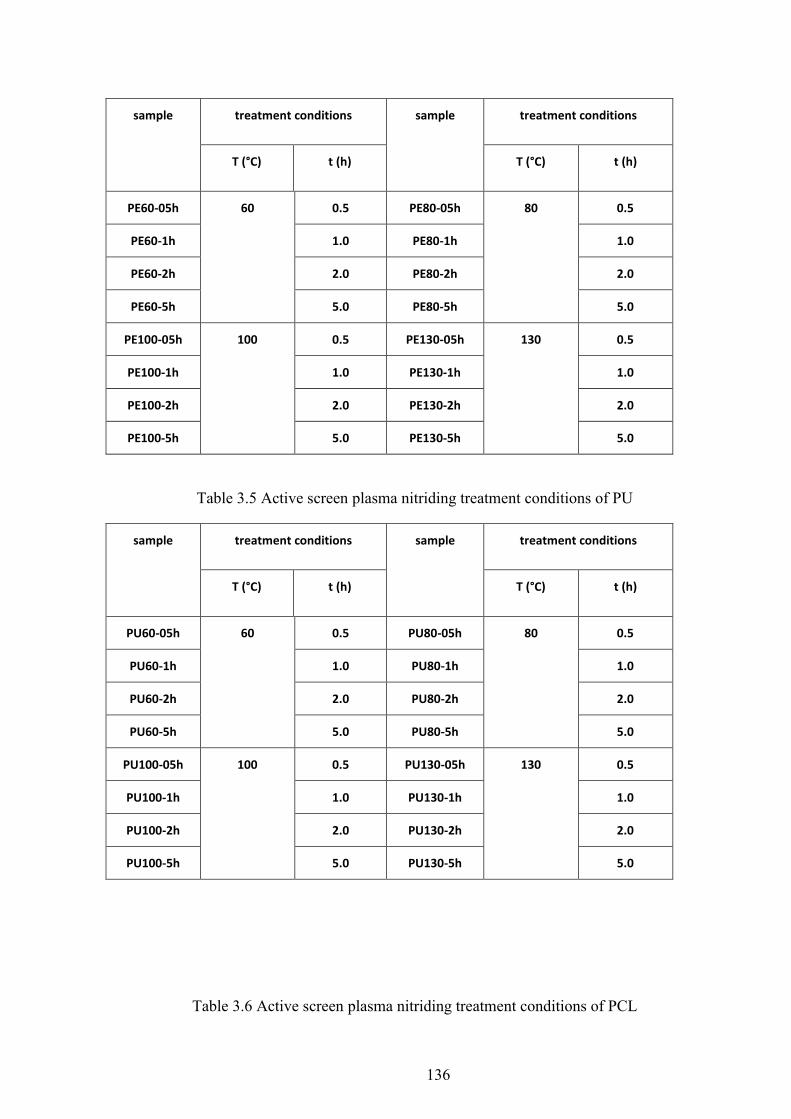
136
sample treatment conditions sample treatment conditions
T (°C) t (h) T (°C) t (h)
PE60-05h 60 0.5 PE80-05h 80 0.5
PE60-1h 1.0 PE80-1h 1.0
PE60-2h 2.0 PE80-2h 2.0
PE60-5h 5.0 PE80-5h 5.0
PE100-05h 100 0.5 PE130-05h 130 0.5
PE100-1h 1.0 PE130-1h 1.0
PE100-2h 2.0 PE130-2h 2.0
PE100-5h 5.0 PE130-5h 5.0
Table 3.5 Active screen plasma nitriding treatment conditions of PU
sample treatment conditions sample treatment conditions
T (°C) t (h) T (°C) t (h)
PU60-05h 60 0.5 PU80-05h 80 0.5
PU60-1h 1.0 PU80-1h 1.0
PU60-2h 2.0 PU80-2h 2.0
PU60-5h 5.0 PU80-5h 5.0
PU100-05h 100 0.5 PU130-05h 130 0.5
PU100-1h 1.0 PU130-1h 1.0
PU100-2h 2.0 PU130-2h 2.0
PU100-5h 5.0 PU130-5h 5.0
Table 3.6 Active screen plasma nitriding treatment conditions of PCL
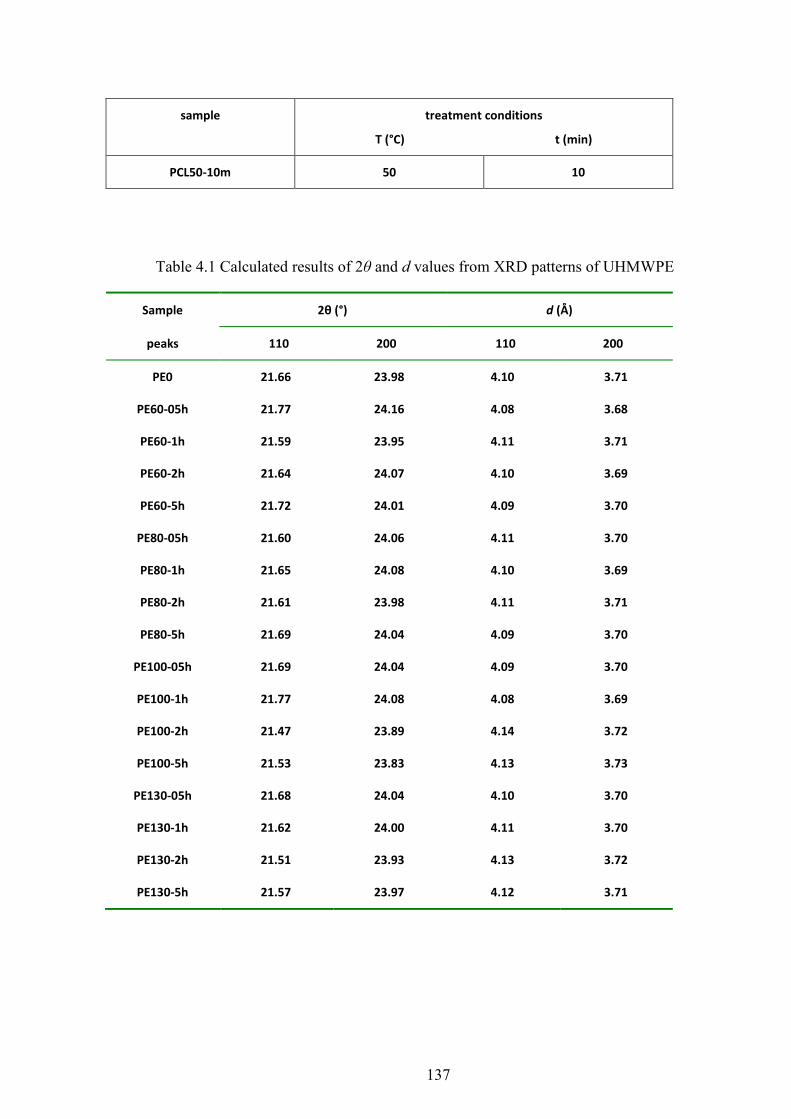
137
sample treatment conditions
T (°C) t (min)
PCL50-10m 50 10
Table 4.1 Calculated results of 2θ and d values from XRD patterns of UHMWPE
Sample 2θ (°) d (Å)
peaks 110 200 110 200
PE0 21.66 23.98 4.10 3.71
PE60-05h 21.77 24.16 4.08 3.68
PE60-1h 21.59 23.95 4.11 3.71
PE60-2h 21.64 24.07 4.10 3.69
PE60-5h 21.72 24.01 4.09 3.70
PE80-05h 21.60 24.06 4.11 3.70
PE80-1h 21.65 24.08 4.10 3.69
PE80-2h 21.61 23.98 4.11 3.71
PE80-5h 21.69 24.04 4.09 3.70
PE100-05h 21.69 24.04 4.09 3.70
PE100-1h 21.77 24.08 4.08 3.69
PE100-2h 21.47 23.89 4.14 3.72
PE100-5h 21.53 23.83 4.13 3.73
PE130-05h 21.68 24.04 4.10 3.70
PE130-1h 21.62 24.00 4.11 3.70
PE130-2h 21.51 23.93 4.13 3.72
PE130-5h 21.57 23.97 4.12 3.71
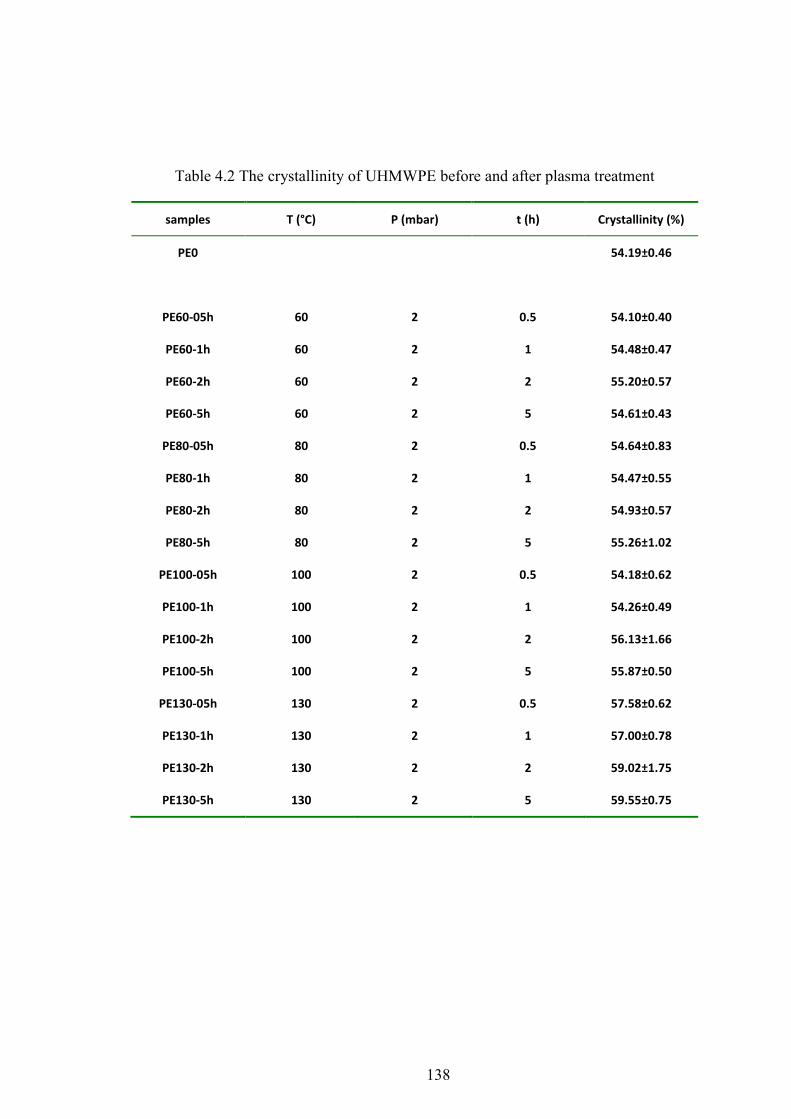
138
Table 4.2 The crystallinity of UHMWPE before and after plasma treatment
samples T (°C) P (mbar) t (h) Crystallinity (%)
PE0 54.19±0.46
PE60-05h 60 2 0.5 54.10±0.40
PE60-1h 60 2 1 54.48±0.47
PE60-2h 60 2 2 55.20±0.57
PE60-5h 60 2 5 54.61±0.43
PE80-05h 80 2 0.5 54.64±0.83
PE80-1h 80 2 1 54.47±0.55
PE80-2h 80 2 2 54.93±0.57
PE80-5h 80 2 5 55.26±1.02
PE100-05h 100 2 0.5 54.18±0.62
PE100-1h 100 2 1 54.26±0.49
PE100-2h 100 2 2 56.13±1.66
PE100-5h 100 2 5 55.87±0.50
PE130-05h 130 2 0.5 57.58±0.62
PE130-1h 130 2 1 57.00±0.78
PE130-2h 130 2 2 59.02±1.75
PE130-5h 130 2 5 59.55±0.75
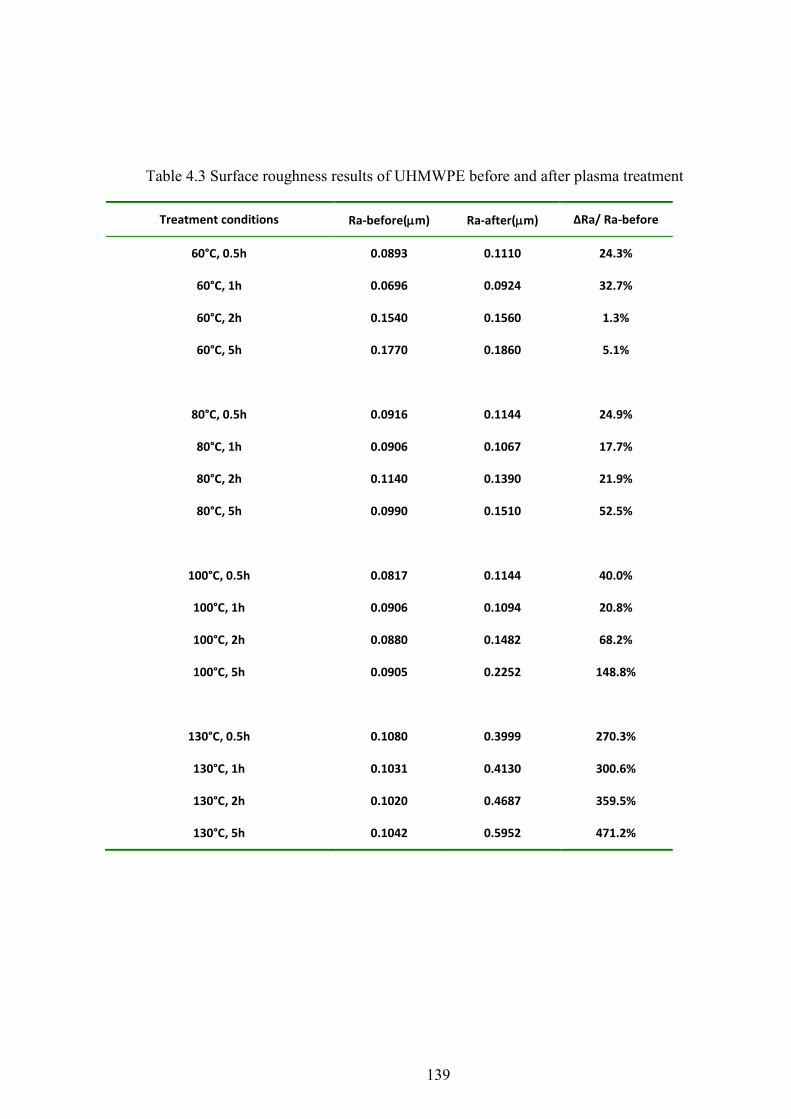
139
Table 4.3 Surface roughness results of UHMWPE before and after plasma treatment
Treatment conditions Ra-before(m) Ra-after(m) ΔRa/ Ra-before
60°C, 0.5h 0.0893 0.1110 24.3%
60°C, 1h 0.0696 0.0924 32.7%
60°C, 2h 0.1540 0.1560 1.3%
60°C, 5h 0.1770 0.1860 5.1%
80°C, 0.5h 0.0916 0.1144 24.9%
80°C, 1h 0.0906 0.1067 17.7%
80°C, 2h 0.1140 0.1390 21.9%
80°C, 5h 0.0990 0.1510 52.5%
100°C, 0.5h 0.0817 0.1144 40.0%
100°C, 1h 0.0906 0.1094 20.8%
100°C, 2h 0.0880 0.1482 68.2%
100°C, 5h 0.0905 0.2252 148.8%
130°C, 0.5h 0.1080 0.3999 270.3%
130°C, 1h 0.1031 0.4130 300.6%
130°C, 2h 0.1020 0.4687 359.5%
130°C, 5h 0.1042 0.5952 471.2%

140
Table 4.4 Nano-indentation results of UHMWPE
Samples H (GPa) E (GPa) H/E
PE 0.057819 0.796212 0.072618
PE60-0.5h 0.074847 0.867463 0.086283
PE60-1h 0.068636 0.836400 0.082061
PE60-2h 0.071923 0.955467 0.075275
PE60-5h 0.073999 0.978975 0.075589
PE80-0.5h 0.096692 1.234175 0.078345
PE80-1h 0.073703 0.948661 0.077692
PE80-2h 0.081959 1.049644 0.078083
PE80-5h 0.077964 1.101570 0.070775
PE100-0.5h 0.091068 1.259796 0.072288
PE100-1h 0.093161 1.310920 0.071065
PE100-2h 0.067699 1.030722 0.065681
PE100-5h 0.083442 1.144361 0.072916
PE130-0.5h 0.120918 1.629824 0.074191
PE130-1h 0.120918 1.629824 0.074191
PE130-2h 0.108087 1.650023 0.065506
PE130-5h 0.101727 1.709265 0.059515
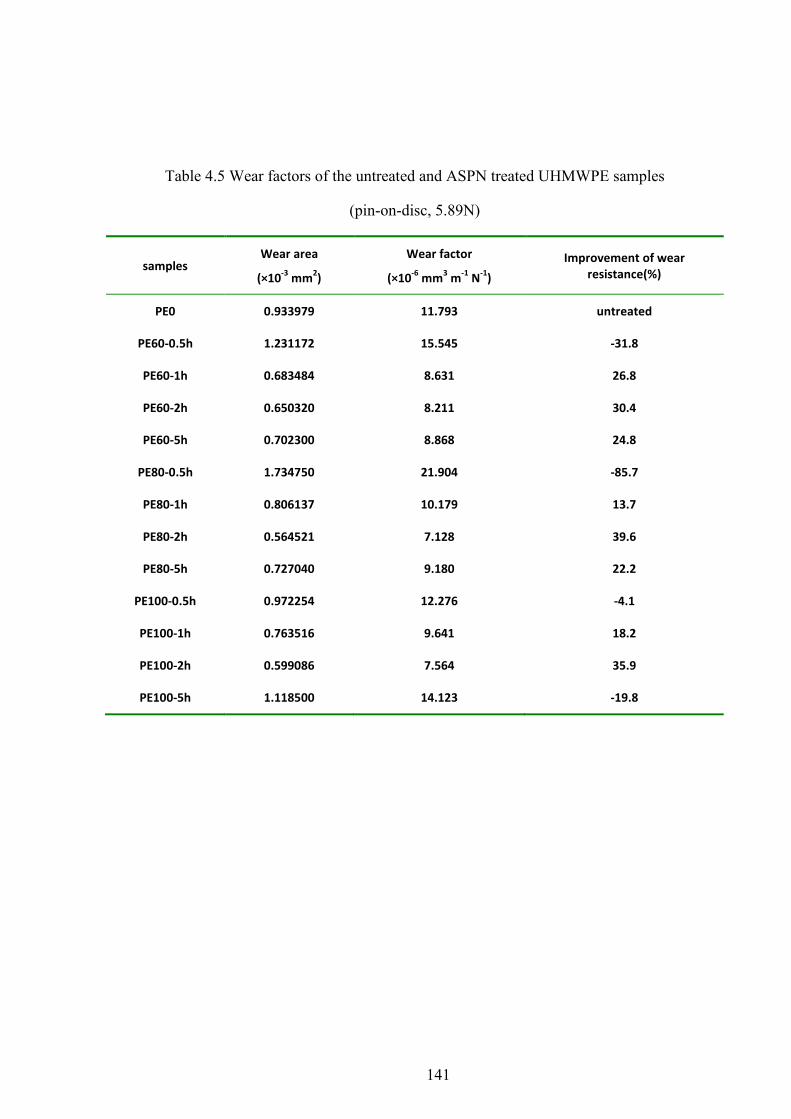
141
Table 4.5 Wear factors of the untreated and ASPN treated UHMWPE samples
(pin-on-disc, 5.89N)
samples Wear area
(×10-3
mm2)
Wear factor
(×10-6
mm3 m
-1 N
-1)
Improvement of wear resistance(%)
PE0 0.933979 11.793 untreated
PE60-0.5h 1.231172 15.545 -31.8
PE60-1h 0.683484 8.631 26.8
PE60-2h 0.650320 8.211 30.4
PE60-5h 0.702300 8.868 24.8
PE80-0.5h 1.734750 21.904 -85.7
PE80-1h 0.806137 10.179 13.7
PE80-2h 0.564521 7.128 39.6
PE80-5h 0.727040 9.180 22.2
PE100-0.5h 0.972254 12.276 -4.1
PE100-1h 0.763516 9.641 18.2
PE100-2h 0.599086 7.564 35.9
PE100-5h 1.118500 14.123 -19.8
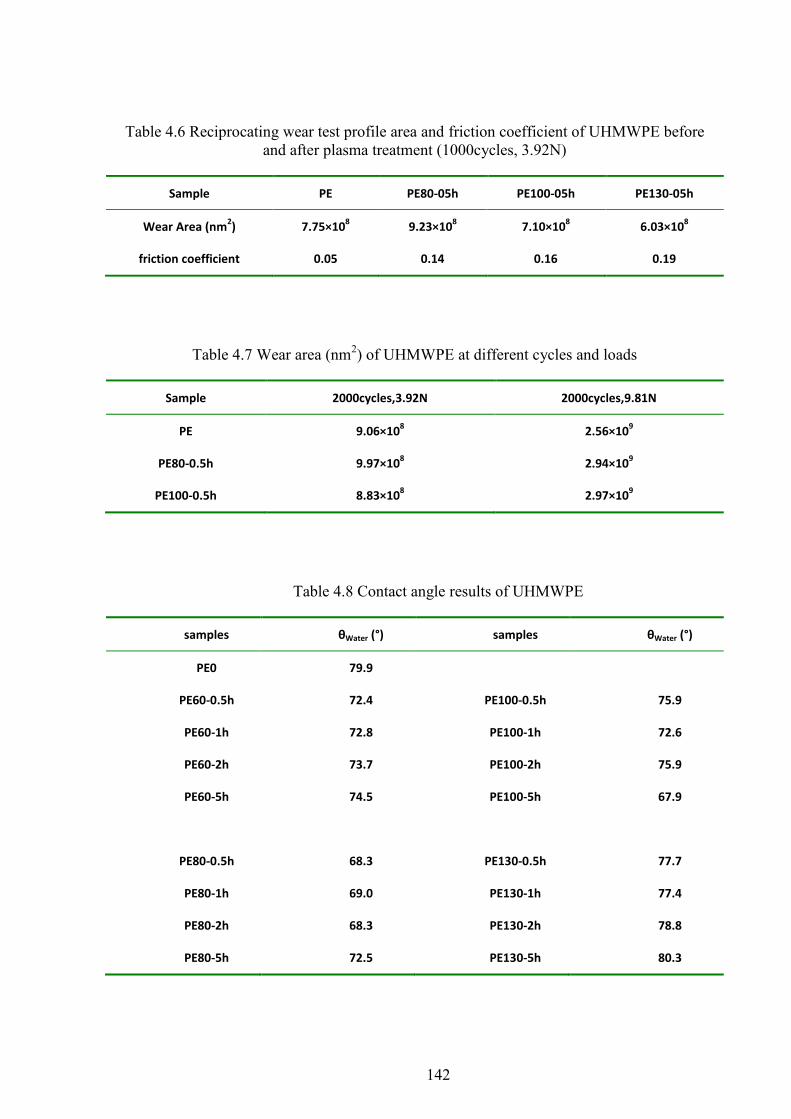
142
Table 4.6 Reciprocating wear test profile area and friction coefficient of UHMWPE before and after plasma treatment (1000cycles, 3.92N)
Sample PE PE80-05h PE100-05h PE130-05h
Wear Area (nm2) 7.75×10
8 9.23×10
8 7.10×10
8 6.03×10
8
friction coefficient 0.05 0.14 0.16 0.19
Table 4.7 Wear area (nm2) of UHMWPE at different cycles and loads
Sample 2000cycles,3.92N 2000cycles,9.81N
PE 9.06×10⁸ 2.56×10
9
PE80-0.5h 9.97×10⁸ 2.94×10
9
PE100-0.5h 8.83×10⁸ 2.97×10
9
Table 4.8 Contact angle results of UHMWPE
samples θWater (°) samples θWater (°)
PE0 79.9
PE60-0.5h 72.4 PE100-0.5h 75.9
PE60-1h 72.8 PE100-1h 72.6
PE60-2h 73.7 PE100-2h 75.9
PE60-5h 74.5 PE100-5h 67.9
PE80-0.5h 68.3 PE130-0.5h 77.7
PE80-1h 69.0 PE130-1h 77.4
PE80-2h 68.3 PE130-2h 78.8
PE80-5h 72.5 PE130-5h 80.3
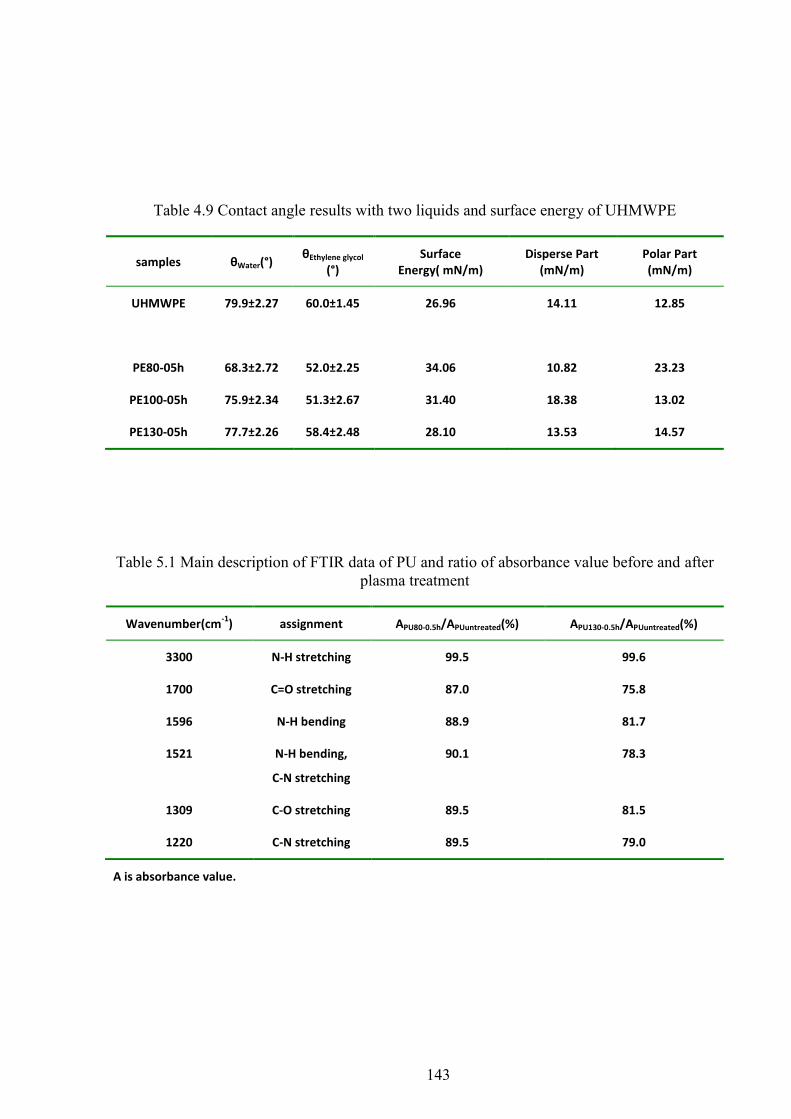
143
Table 4.9 Contact angle results with two liquids and surface energy of UHMWPE
samples θWater(°) θEthylene glycol
(°) Surface
Energy( mN/m) Disperse Part
(mN/m) Polar Part (mN/m)
UHMWPE 79.9±2.27 60.0±1.45 26.96 14.11 12.85
PE80-05h 68.3±2.72 52.0±2.25 34.06 10.82 23.23
PE100-05h 75.9±2.34 51.3±2.67 31.40 18.38 13.02
PE130-05h 77.7±2.26 58.4±2.48 28.10 13.53 14.57
Table 5.1 Main description of FTIR data of PU and ratio of absorbance value before and after plasma treatment
Wavenumber(cm-1
) assignment APU80-0.5h/APUuntreated(%) APU130-0.5h/APUuntreated(%)
3300 N-H stretching 99.5 99.6
1700 C=O stretching 87.0 75.8
1596 N-H bending 88.9 81.7
1521 N-H bending,
C-N stretching
90.1 78.3
1309 C-O stretching 89.5 81.5
1220 C-N stretching 89.5 79.0
A is absorbance value.
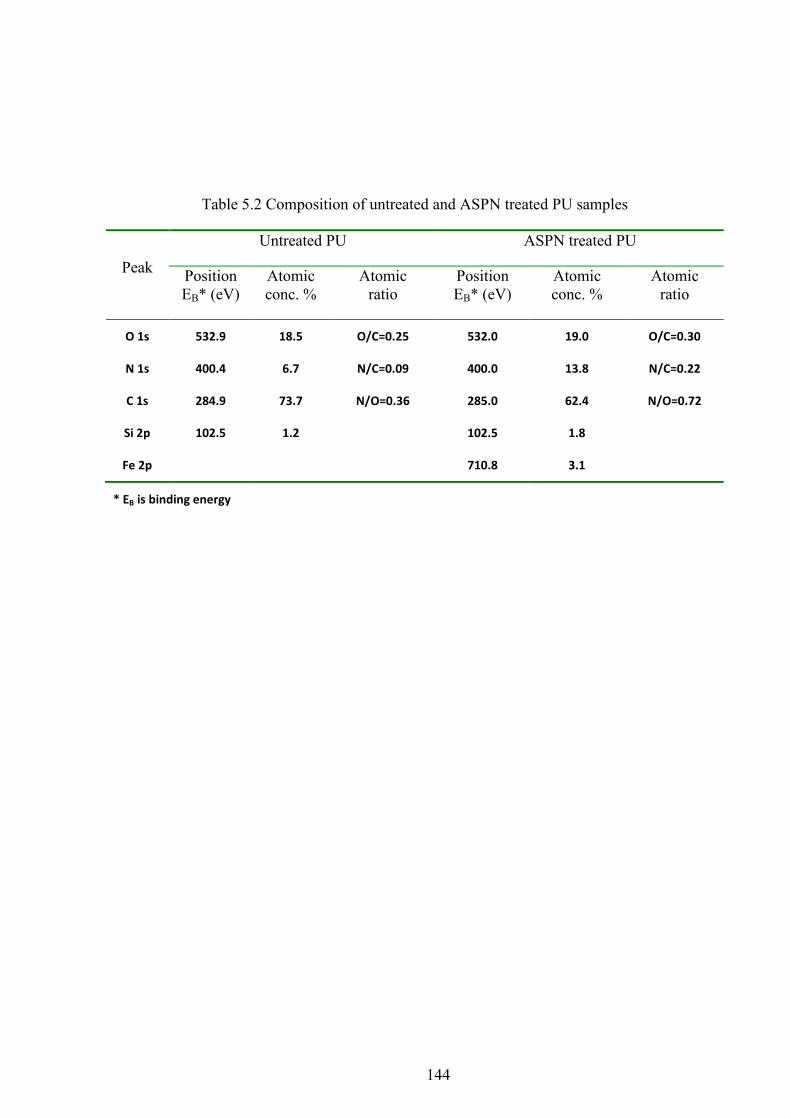
144
Table 5.2 Composition of untreated and ASPN treated PU samples
Peak
Untreated PU ASPN treated PU
Position EB* (eV)
Atomic conc. %
Atomic ratio
Position EB* (eV)
Atomic conc. %
Atomic ratio
O 1s 532.9 18.5 O/C=0.25 532.0 19.0 O/C=0.30
N 1s 400.4 6.7 N/C=0.09 400.0 13.8 N/C=0.22
C 1s 284.9 73.7 N/O=0.36 285.0 62.4 N/O=0.72
Si 2p 102.5 1.2 102.5 1.8
Fe 2p 710.8 3.1
* EB is binding energy
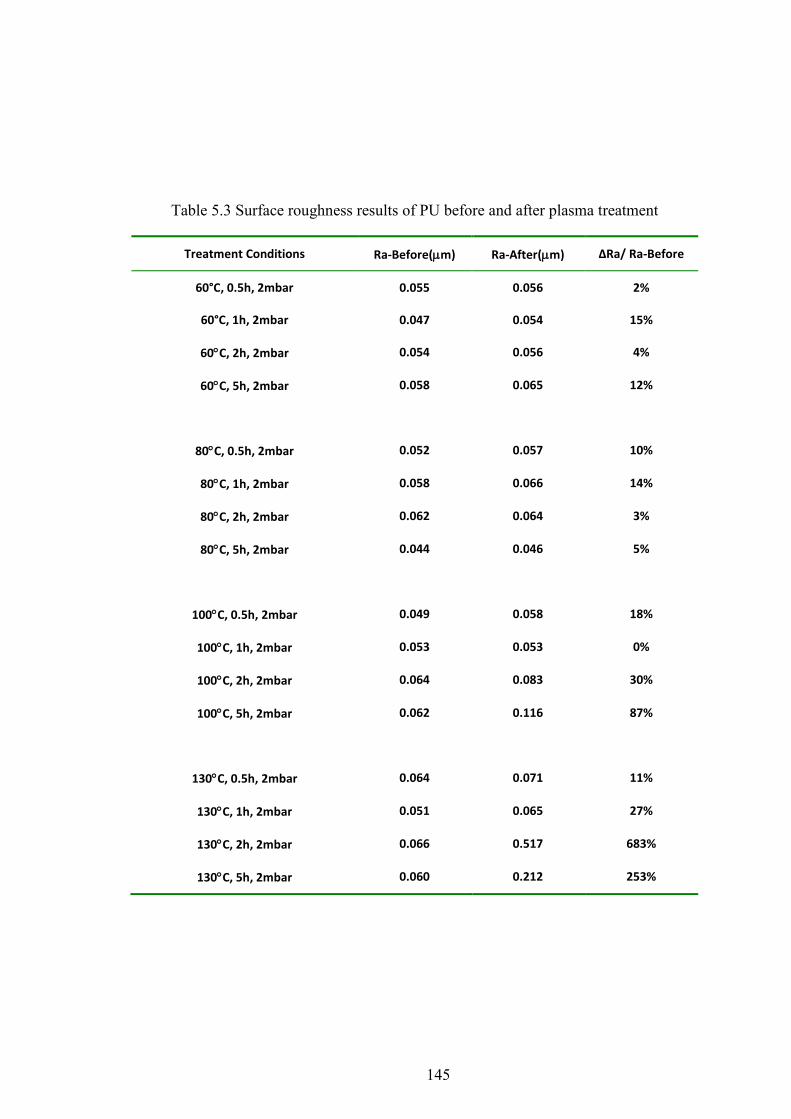
145
Table 5.3 Surface roughness results of PU before and after plasma treatment
Treatment Conditions Ra-Before(m) Ra-After(m) ΔRa/ Ra-Before
60°C, 0.5h, 2mbar 0.055 0.056 2%
60°C, 1h, 2mbar 0.047 0.054 15%
60C, 2h, 2mbar 0.054 0.056 4%
60C, 5h, 2mbar 0.058 0.065 12%
80C, 0.5h, 2mbar 0.052 0.057 10%
80C, 1h, 2mbar 0.058 0.066 14%
80C, 2h, 2mbar 0.062 0.064 3%
80C, 5h, 2mbar 0.044 0.046 5%
100C, 0.5h, 2mbar 0.049 0.058 18%
100C, 1h, 2mbar 0.053 0.053 0%
100C, 2h, 2mbar 0.064 0.083 30%
100C, 5h, 2mbar 0.062 0.116 87%
130C, 0.5h, 2mbar 0.064 0.071 11%
130C, 1h, 2mbar 0.051 0.065 27%
130C, 2h, 2mbar 0.066 0.517 683%
130C, 5h, 2mbar 0.060 0.212 253%
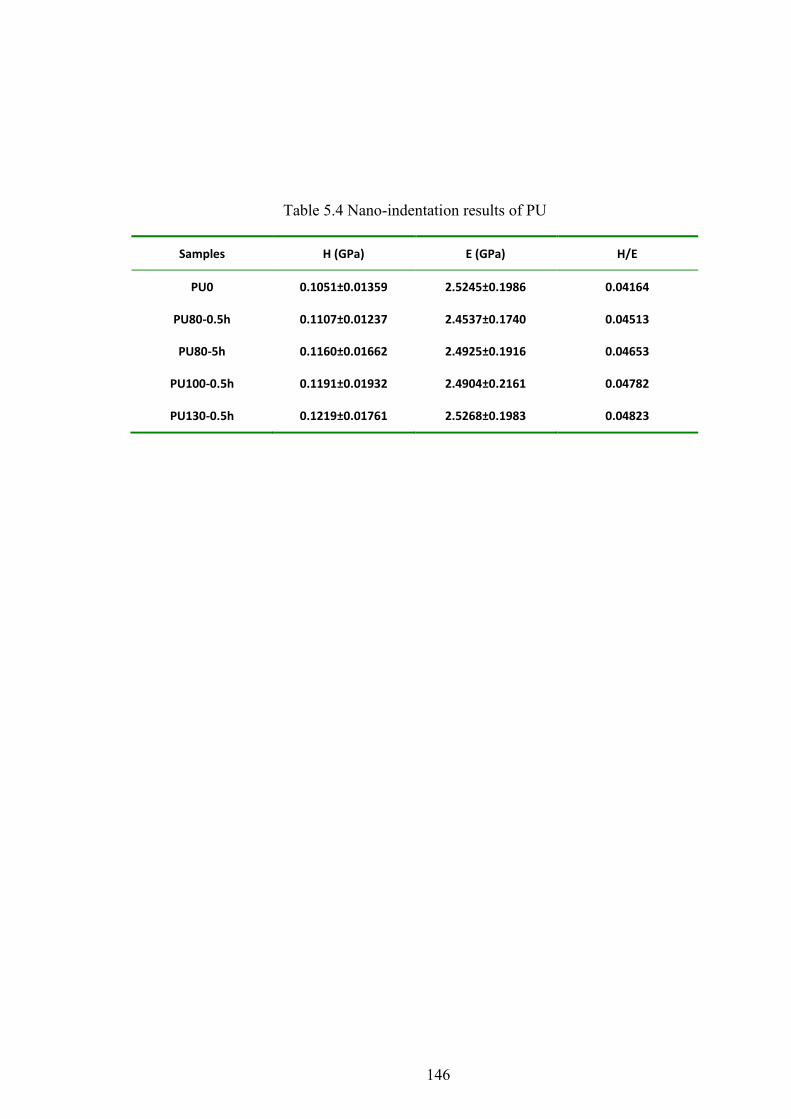
146
Table 5.4 Nano-indentation results of PU
Samples H (GPa) E (GPa) H/E
PU0 0.1051±0.01359 2.5245±0.1986 0.04164
PU80-0.5h 0.1107±0.01237 2.4537±0.1740 0.04513
PU80-5h 0.1160±0.01662 2.4925±0.1916 0.04653
PU100-0.5h 0.1191±0.01932 2.4904±0.2161 0.04782
PU130-0.5h 0.1219±0.01761 2.5268±0.1983 0.04823
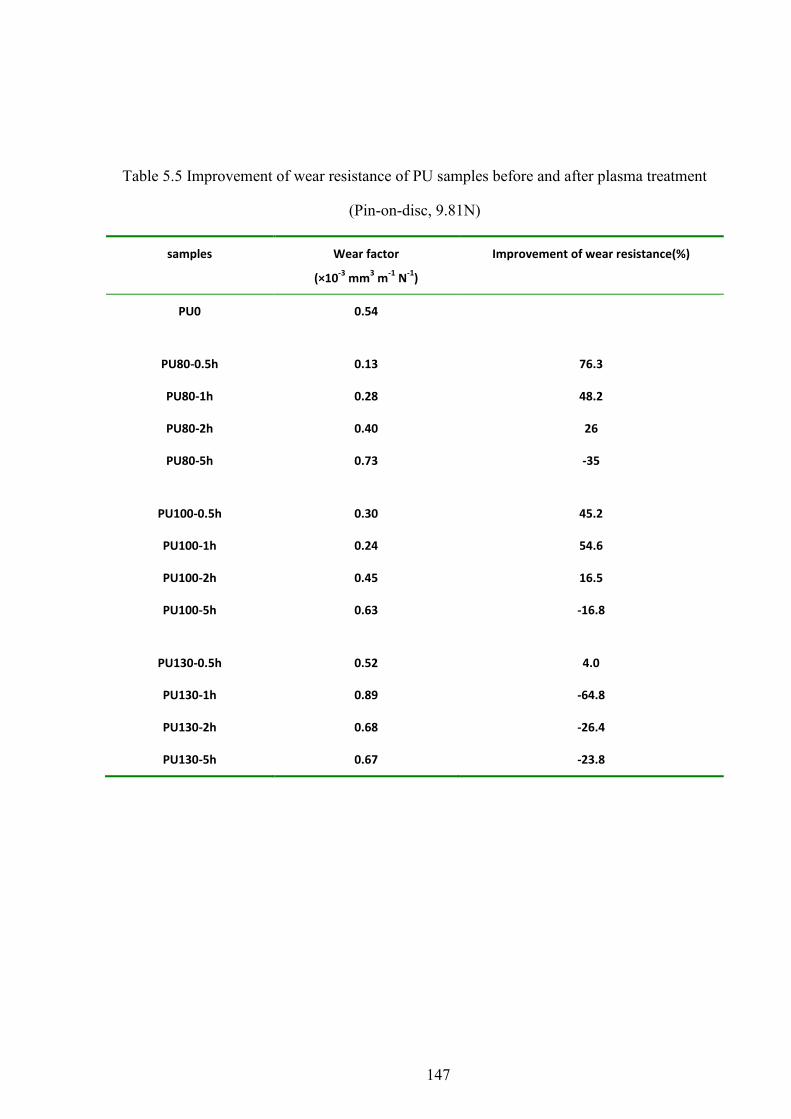
147
Table 5.5 Improvement of wear resistance of PU samples before and after plasma treatment
(Pin-on-disc, 9.81N)
samples Wear factor
(×10-3
mm3 m
-1 N
-1)
Improvement of wear resistance(%)
PU0 0.54
PU80-0.5h 0.13 76.3
PU80-1h 0.28 48.2
PU80-2h 0.40 26
PU80-5h 0.73 -35
PU100-0.5h 0.30 45.2
PU100-1h 0.24 54.6
PU100-2h 0.45 16.5
PU100-5h 0.63 -16.8
PU130-0.5h 0.52 4.0
PU130-1h 0.89 -64.8
PU130-2h 0.68 -26.4
PU130-5h 0.67 -23.8

148
Table 5.6 Wear area of PU before and after plasma treatment
(Reciprocating, 10000 cycles)
Loads (N)
Wear area (nm2)
PU PU80-0.5h PU130-0.5h
9.81 8.17×10⁷ 5.63×10
7 8.73×10
7
19.62 2.09×10⁸ 2.88×10
8 2.93×10
8
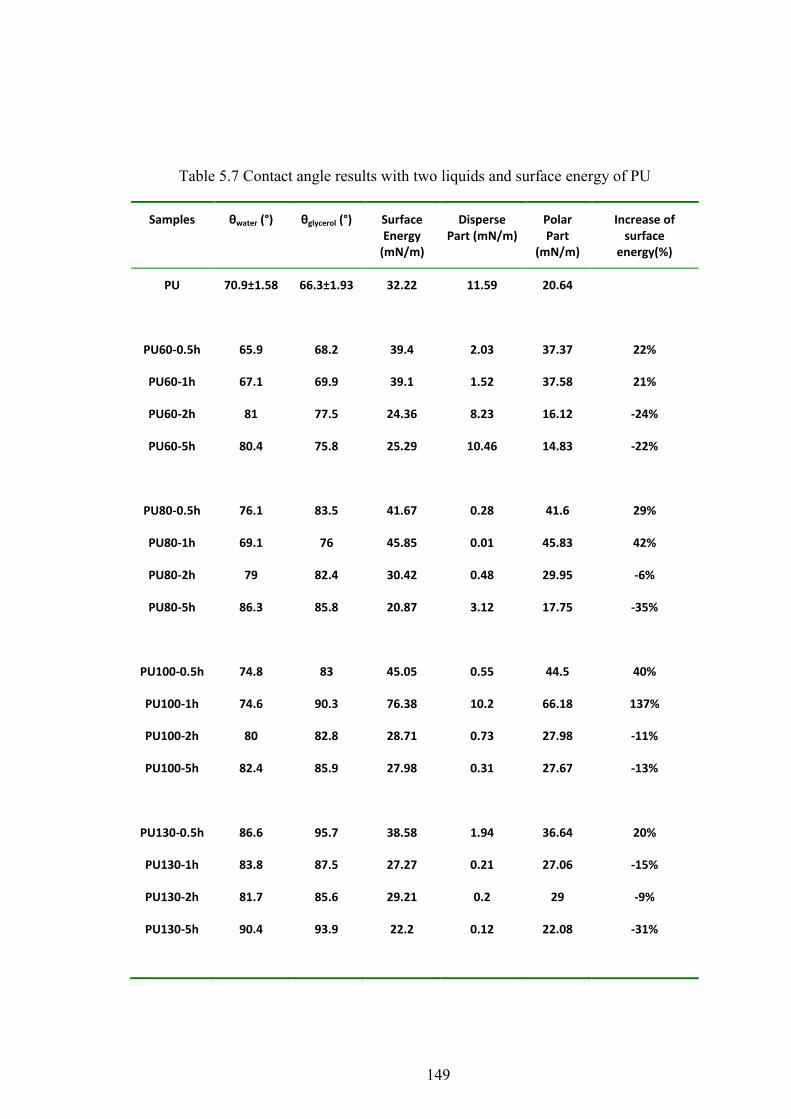
149
Table 5.7 Contact angle results with two liquids and surface energy of PU
Samples θwater (°) θglycerol (°) Surface Energy
(mN/m)
Disperse Part (mN/m)
Polar Part
(mN/m)
Increase of surface
energy(%)
PU 70.9±1.58 66.3±1.93 32.22 11.59 20.64
PU60-0.5h 65.9 68.2 39.4 2.03 37.37 22%
PU60-1h 67.1 69.9 39.1 1.52 37.58 21%
PU60-2h 81 77.5 24.36 8.23 16.12 -24%
PU60-5h 80.4 75.8 25.29 10.46 14.83 -22%
PU80-0.5h 76.1 83.5 41.67 0.28 41.6 29%
PU80-1h 69.1 76 45.85 0.01 45.83 42%
PU80-2h 79 82.4 30.42 0.48 29.95 -6%
PU80-5h 86.3 85.8 20.87 3.12 17.75 -35%
PU100-0.5h 74.8 83 45.05 0.55 44.5 40%
PU100-1h 74.6 90.3 76.38 10.2 66.18 137%
PU100-2h 80 82.8 28.71 0.73 27.98 -11%
PU100-5h 82.4 85.9 27.98 0.31 27.67 -13%
PU130-0.5h 86.6 95.7 38.58 1.94 36.64 20%
PU130-1h 83.8 87.5 27.27 0.21 27.06 -15%
PU130-2h 81.7 85.6 29.21 0.2 29 -9%
PU130-5h 90.4 93.9 22.2 0.12 22.08 -31%
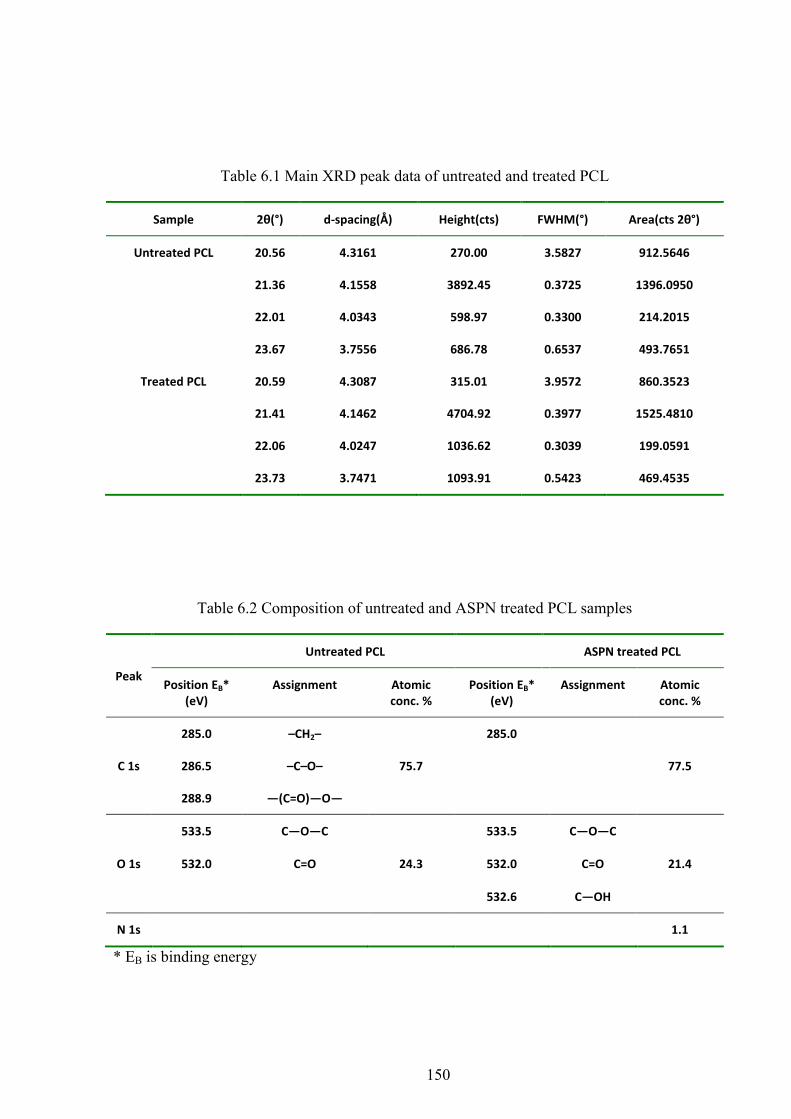
150
Table 6.1 Main XRD peak data of untreated and treated PCL
Sample 2θ(°) d-spacing(Å) Height(cts) FWHM(°) Area(cts 2θ°)
Untreated PCL 20.56 4.3161 270.00 3.5827 912.5646
21.36 4.1558 3892.45 0.3725 1396.0950
22.01 4.0343 598.97 0.3300 214.2015
23.67 3.7556 686.78 0.6537 493.7651
Treated PCL 20.59 4.3087 315.01 3.9572 860.3523
21.41 4.1462 4704.92 0.3977 1525.4810
22.06 4.0247 1036.62 0.3039 199.0591
23.73 3.7471 1093.91 0.5423 469.4535
Table 6.2 Composition of untreated and ASPN treated PCL samples
Peak
Untreated PCL ASPN treated PCL
Position EB* (eV)
Assignment Atomic conc. %
Position EB* (eV)
Assignment Atomic conc. %
C 1s
285.0 –CH2–
75.7
285.0
77.5 286.5 –C–O–
288.9 ―(C=O)—O―
O 1s
533.5 C—O―C
24.3
533.5 C—O―C
21.4 532.0 C=O 532.0 C=O
532.6 C―OH
N 1s 1.1
* EB is binding energy
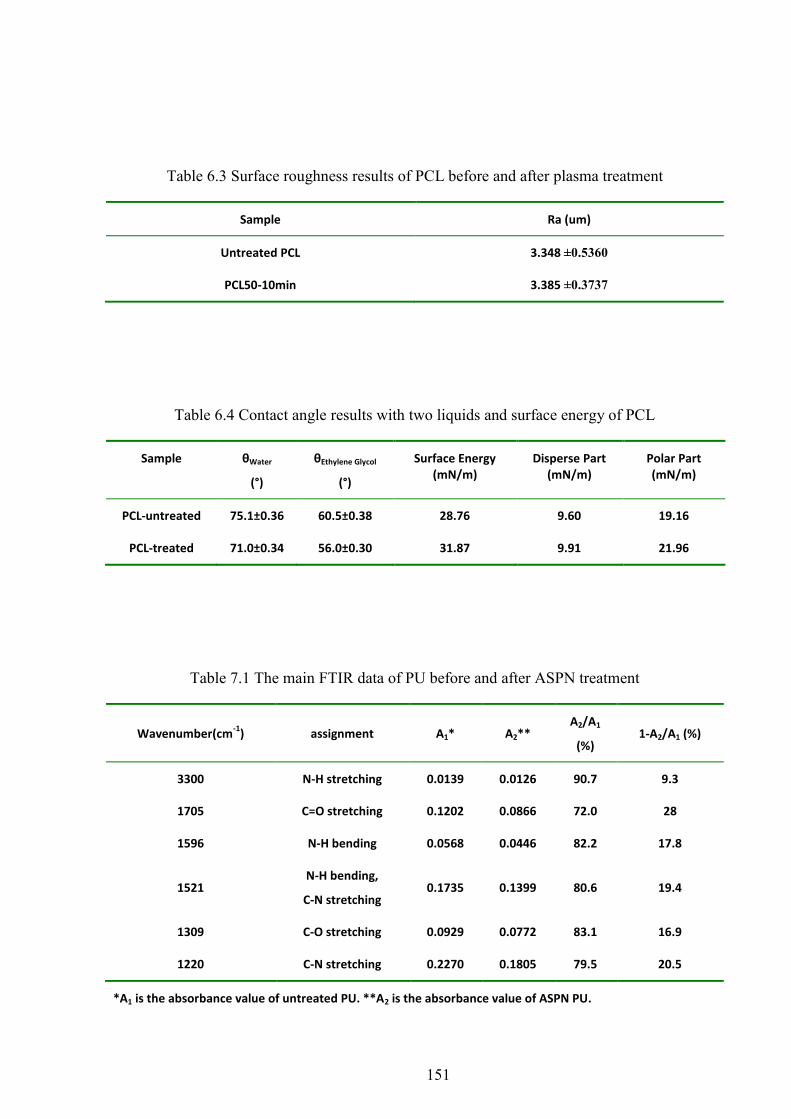
151
Table 6.3 Surface roughness results of PCL before and after plasma treatment
Sample Ra (um)
Untreated PCL 3.348 ±0.5360
PCL50-10min 3.385 ±0.3737
Table 6.4 Contact angle results with two liquids and surface energy of PCL
Sample θWater
(°)
θEthylene Glycol
(°)
Surface Energy (mN/m)
Disperse Part (mN/m)
Polar Part (mN/m)
PCL-untreated 75.1±0.36 60.5±0.38 28.76 9.60 19.16
PCL-treated 71.0±0.34 56.0±0.30 31.87 9.91 21.96
Table 7.1 The main FTIR data of PU before and after ASPN treatment
Wavenumber(cm-1
) assignment A1* A2** A2/A1
(%) 1-A2/A1 (%)
3300 N-H stretching 0.0139 0.0126 90.7 9.3
1705 C=O stretching 0.1202 0.0866 72.0 28
1596 N-H bending 0.0568 0.0446 82.2 17.8
1521 N-H bending,
C-N stretching 0.1735 0.1399 80.6 19.4
1309 C-O stretching 0.0929 0.0772 83.1 16.9
1220 C-N stretching 0.2270 0.1805 79.5 20.5
*A1 is the absorbance value of untreated PU. **A2 is the absorbance value of ASPN PU.

152
Table 7.2 Changes in the infrared spectra of PU samples are associated with hydrogen bonding before and after ASPN treatment
Wavenumber(cm-1
) assignment A1* A2** A2/A1 (%)
1705 C=O stretching
(hydrogen bonded urethane)
0.1202 0.0866 72.0
1730 C=O stretching
(non-hydrogen bonded urethane)
0.1011 0.0765 75.6
*A1 is the absorbance value of untreated PU. **A2 is the absorbance value of ASPN PU at 100°C for 2h.
Table 7.3 Changes in the FTIR spectra of PU samples with increasing treatment temperature and time are associated with the C=O stretching modes at 1730 cm−1 and 1705 cm−1.
sample A1730* A1705** A1730/A1705(%) Increase of
A1730/A1705(%)
PU-untreated 0.1011 0.1202 84.2
PU80-05h 0.0806 0.0937 86.0 1.8
PU100-2h 0.0765 0.0866 88.4 4.2
PU100-5h 0.0327 0.0368 89.0 4.8
PU130-05h 0.0607 0.697 87.1 2.9
PU130-2h 0.0245 0.0257 95.2 11.0
PU130-5h 0.0245 0.0248 98.8 14.6
* A1730 is the absorbance value at 1730 cm-1
. **A1705 is the absorbance at 1705 cm-1
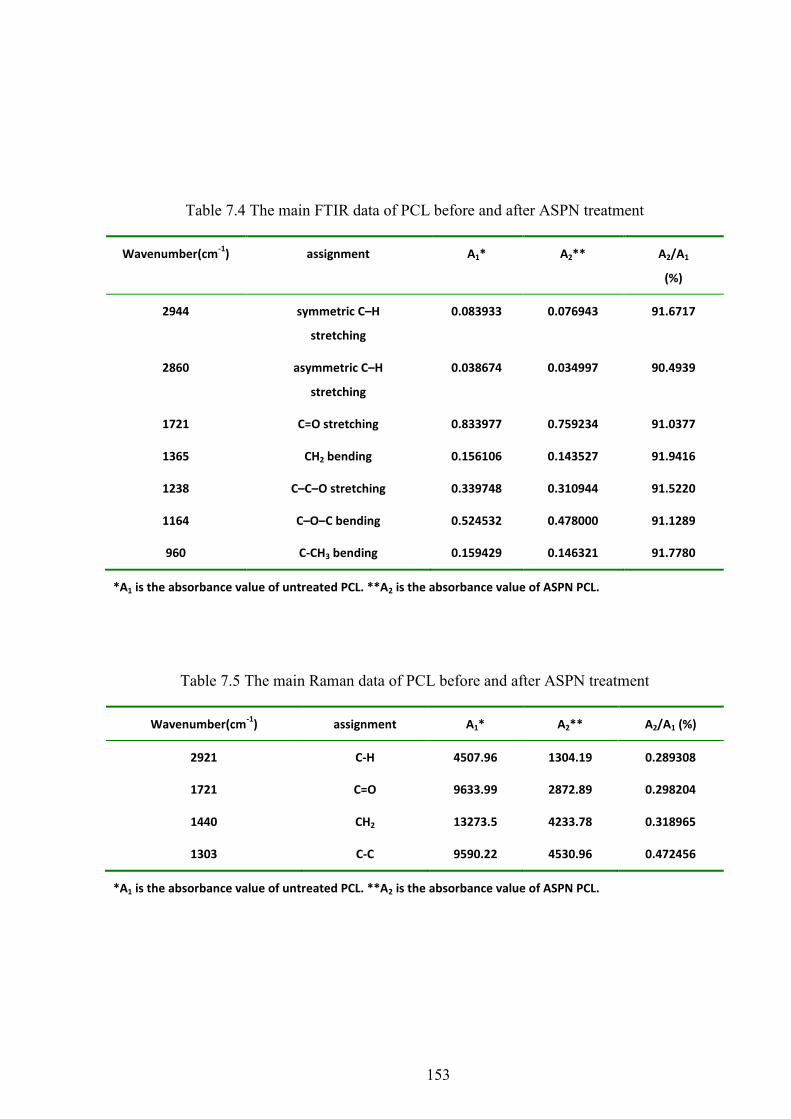
153
Table 7.4 The main FTIR data of PCL before and after ASPN treatment
Wavenumber(cm-1
) assignment A1* A2** A2/A1
(%)
2944 symmetric C–H
stretching
0.083933
0.076943
91.6717
2860 asymmetric C–H
stretching
0.038674
0.034997
90.4939
1721 C=O stretching 0.833977 0.759234 91.0377
1365 CH2 bending 0.156106 0.143527 91.9416
1238 C–C–O stretching 0.339748 0.310944 91.5220
1164 C–O–C bending 0.524532 0.478000 91.1289
960 C-CH3 bending 0.159429 0.146321 91.7780
*A1 is the absorbance value of untreated PCL. **A2 is the absorbance value of ASPN PCL.
Table 7.5 The main Raman data of PCL before and after ASPN treatment
Wavenumber(cm-1
) assignment A1* A2** A2/A1 (%)
2921 C-H 4507.96 1304.19 0.289308
1721 C=O 9633.99 2872.89 0.298204
1440 CH2 13273.5 4233.78 0.318965
1303 C-C 9590.22 4530.96 0.472456
*A1 is the absorbance value of untreated PCL. **A2 is the absorbance value of ASPN PCL.
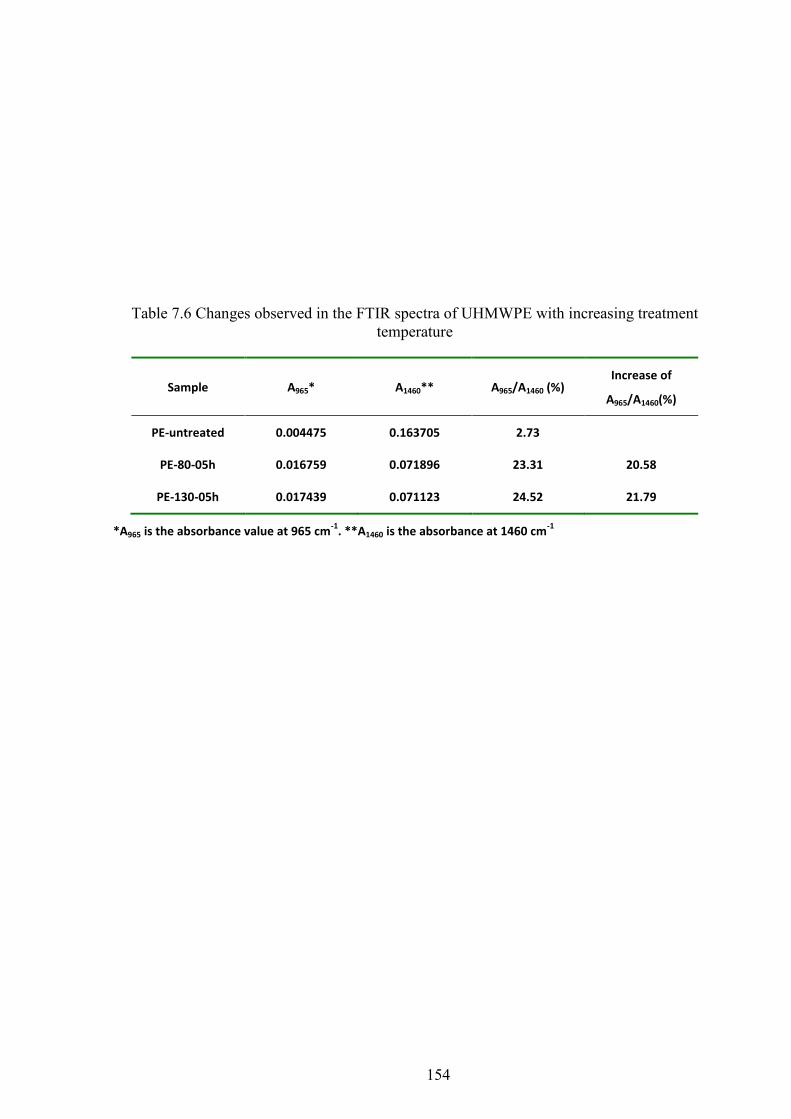
154
Table 7.6 Changes observed in the FTIR spectra of UHMWPE with increasing treatment temperature
Sample A965* A1460** A965/A1460 (%) Increase of
A965/A1460(%)
PE-untreated 0.004475 0.163705 2.73
PE-80-05h 0.016759 0.071896 23.31 20.58
PE-130-05h 0.017439 0.071123 24.52 21.79
*A965 is the absorbance value at 965 cm-1
. **A1460 is the absorbance at 1460 cm-1
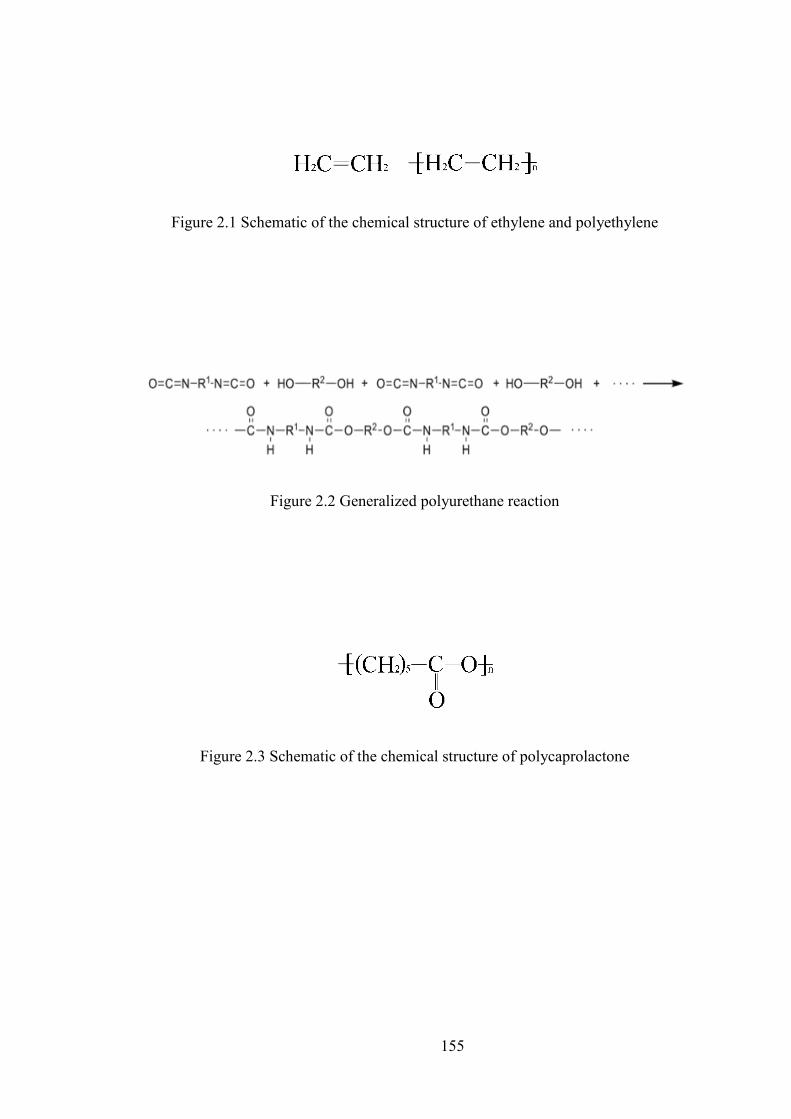
155
Figure 2.1 Schematic of the chemical structure of ethylene and polyethylene
Figure 2.2 Generalized polyurethane reaction
Figure 2.3 Schematic of the chemical structure of polycaprolactone

156
Figure 2.4 Equilibrium contact angle θ
(a) (b)
Figure 2.5 Active screen plasma system for surface modification of polymer
a)Schematic diagram; b) Photo of plasma furnace

157
H R1 C C
n H R2
Figure 2.6 Schematic of structure of a vinyl polymer
Figure 2.7 A schematic representation of indentation load - displacement curves
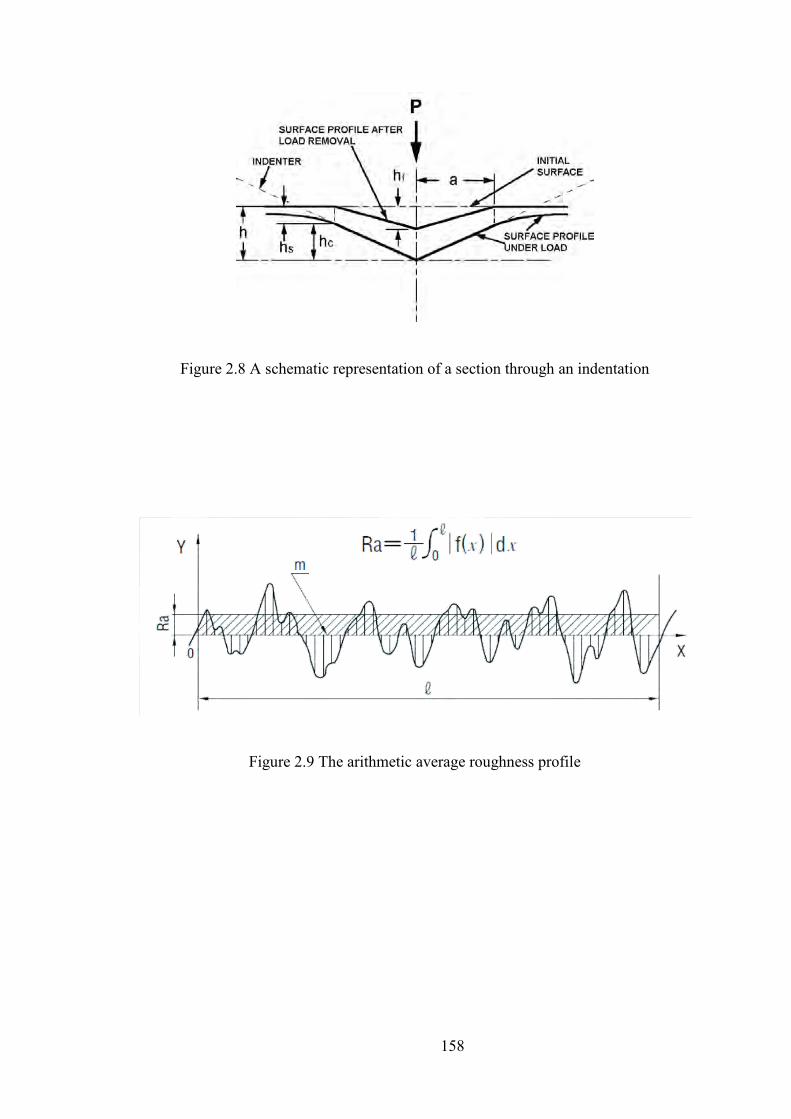
158
Figure 2.8 A schematic representation of a section through an indentation
Figure 2.9 The arithmetic average roughness profile
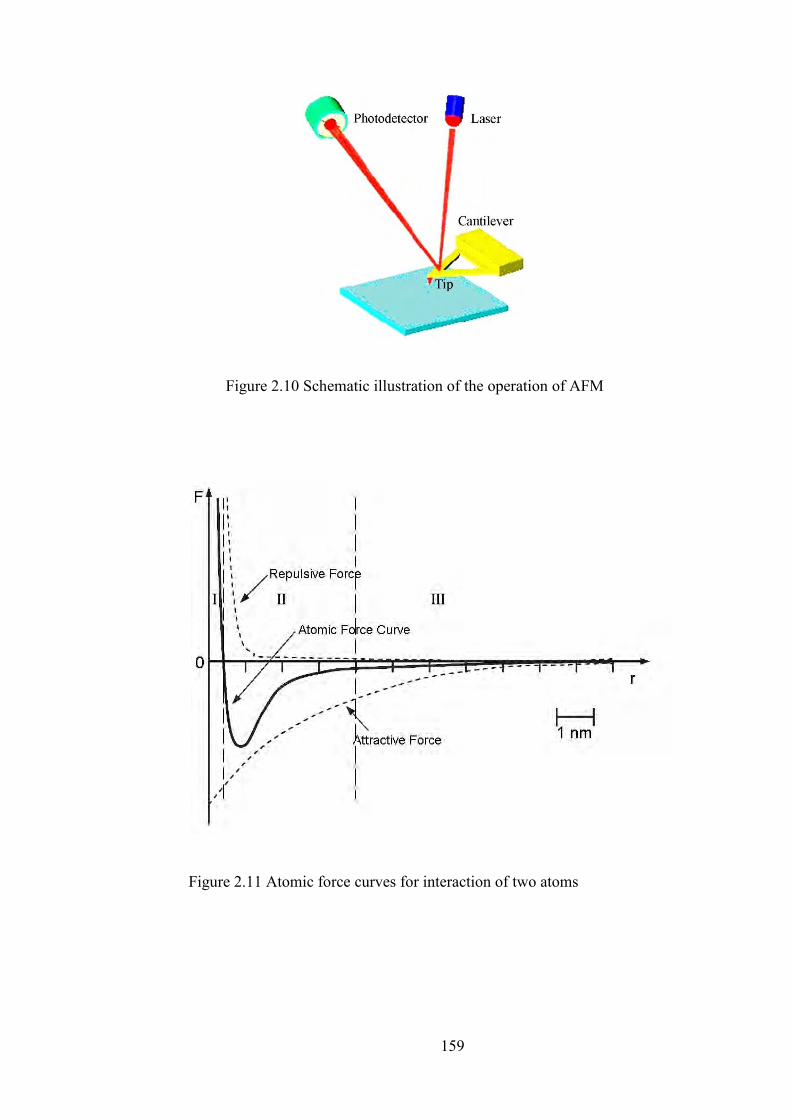
159
Figure 2.10 Schematic illustration of the operation of AFM
Figure 2.11 Atomic force curves for interaction of two atoms

160
Figure 2.12 A schematic illustration of ATR-FTIR
Figure 3.1 Schematic of nano-indentation machine

161
Figure 3.2 Schematic of pin-on-disc machine and test configuration
Figure 4.1 DSC curves of UHMWPE
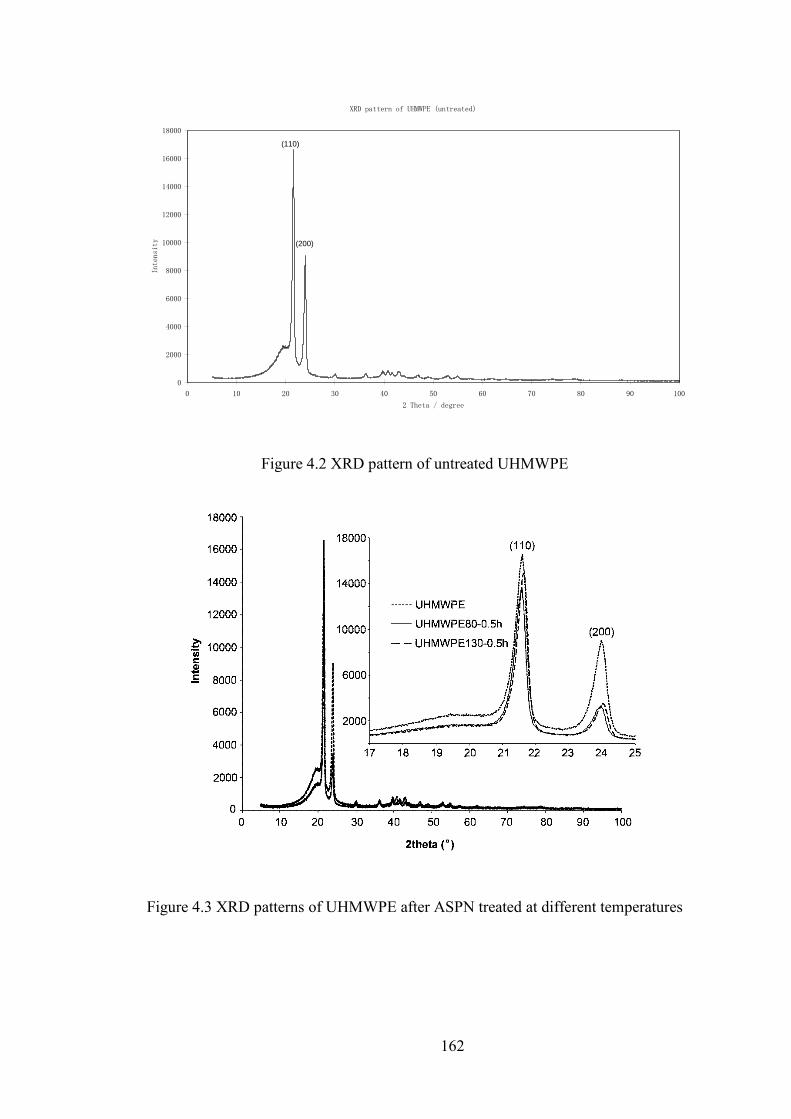
162
Figure 4.2 XRD pattern of untreated UHMWPE
Figure 4.3 XRD patterns of UHMWPE after ASPN treated at different temperatures
XRD pattern of UHMWPE (untreated)
0
2000
4000
6000
8000
10000
12000
14000
16000
18000
0 10 20 30 40 50 60 70 80 90 100
2 Theta / degree
Intensity
(110)
(200)

163
Figure 4.4 XRD patterns of UHMWPE after ASPN treated at different time
Figure 4.5 FTIR spectra of UHMWPE
ASPN treated at different time(2mbar,100 degreeC)
0
5000
10000
15000
20000
25000
20 21 22 23 24 25
2 Theta / degree
Inte
nsi
ty
PE0, untreated
PE2, 5h, 2mbar, 100 degreeC
PE1, 2h, 2mbar, 100 degreeC
(110)
(200)
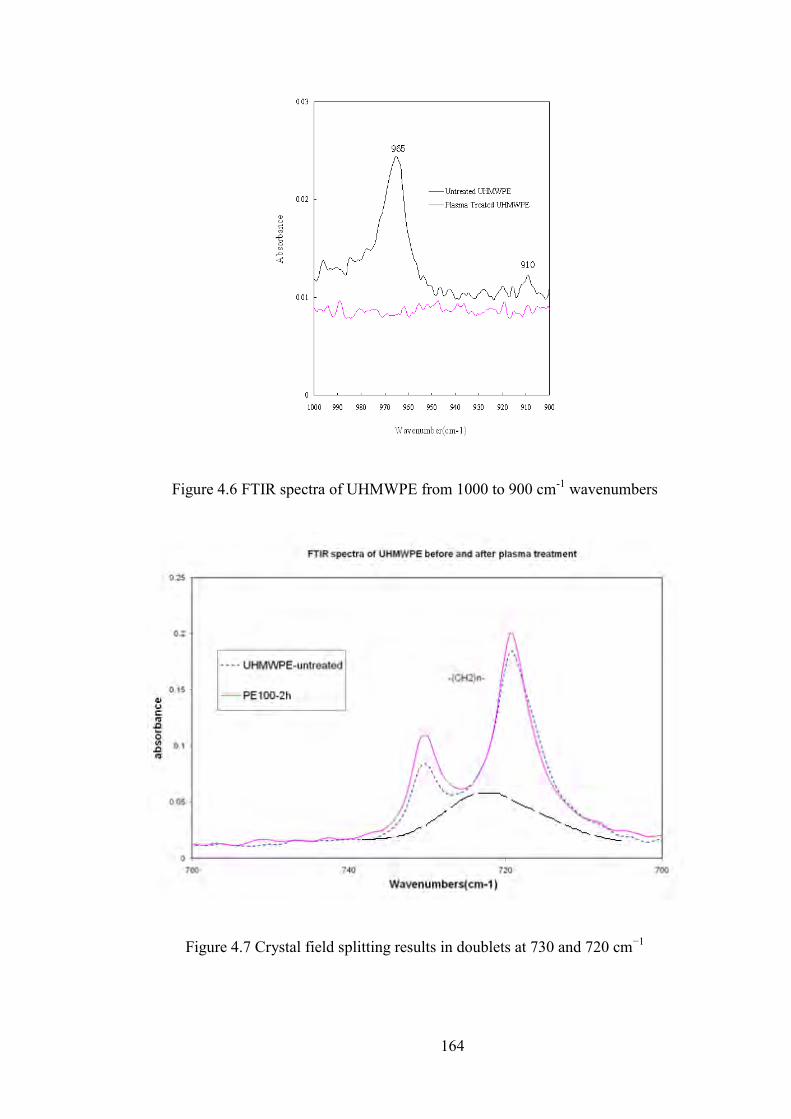
164
Figure 4.6 FTIR spectra of UHMWPE from 1000 to 900 cm-1 wavenumbers
Figure 4.7 Crystal field splitting results in doublets at 730 and 720 cm−1
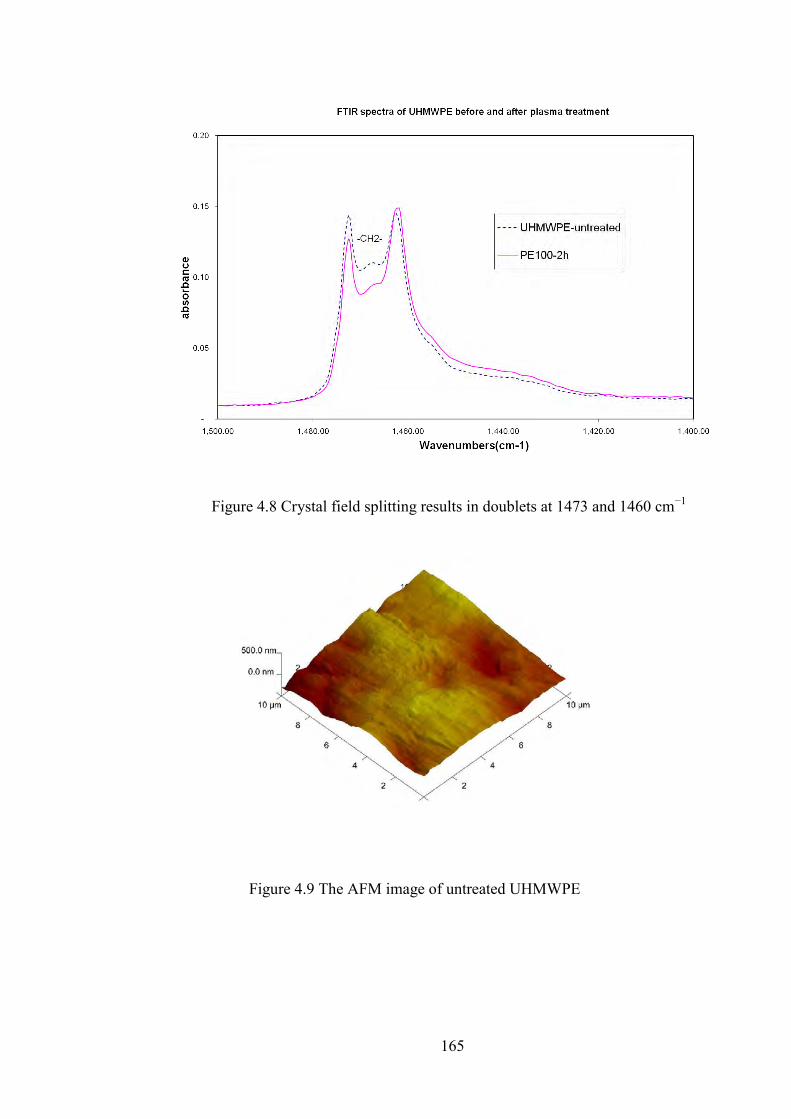
165
Figure 4.8 Crystal field splitting results in doublets at 1473 and 1460 cm−1
Figure 4.9 The AFM image of untreated UHMWPE

166
a) PE130-0.5h b) PE130-1h
c) PE130-2h d) PE130-5h
Figure 4.10 The AFM images of plasma treated UHMWPE at 130ºC a) PE130-0.5h; b) PE130-1h; c) PE130-2h; d) PE130-5h

167
a) PE100-0.5h b) PE100-1h
c) PE100-2h d) PE100-5h
Figure 4.11 The AFM images of plasma treated UHMWPE at 100 ºC a) PE100-0.5h; b)
PE100-1h; c) PE100-2h; d) PE100-5h
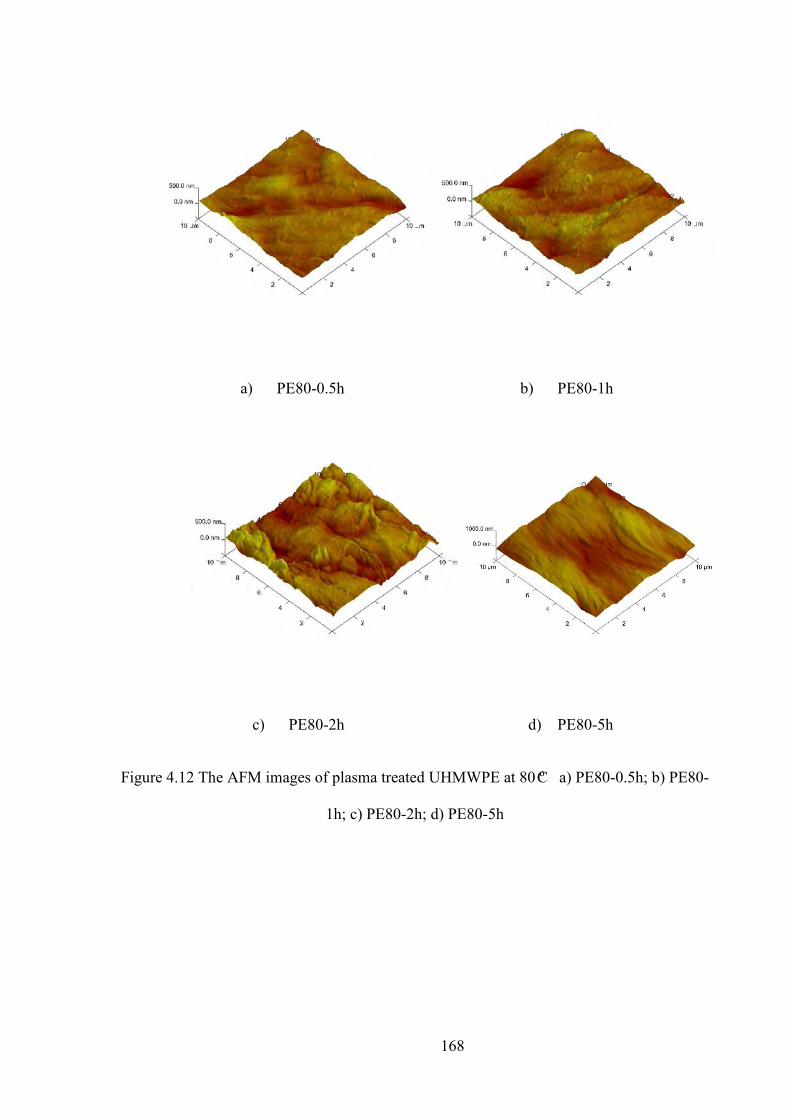
168
a) PE80-0.5h b) PE80-1h
c) PE80-2h d) PE80-5h
Figure 4.12 The AFM images of plasma treated UHMWPE at 80 ºC a) PE80-0.5h; b) PE80-
1h; c) PE80-2h; d) PE80-5h
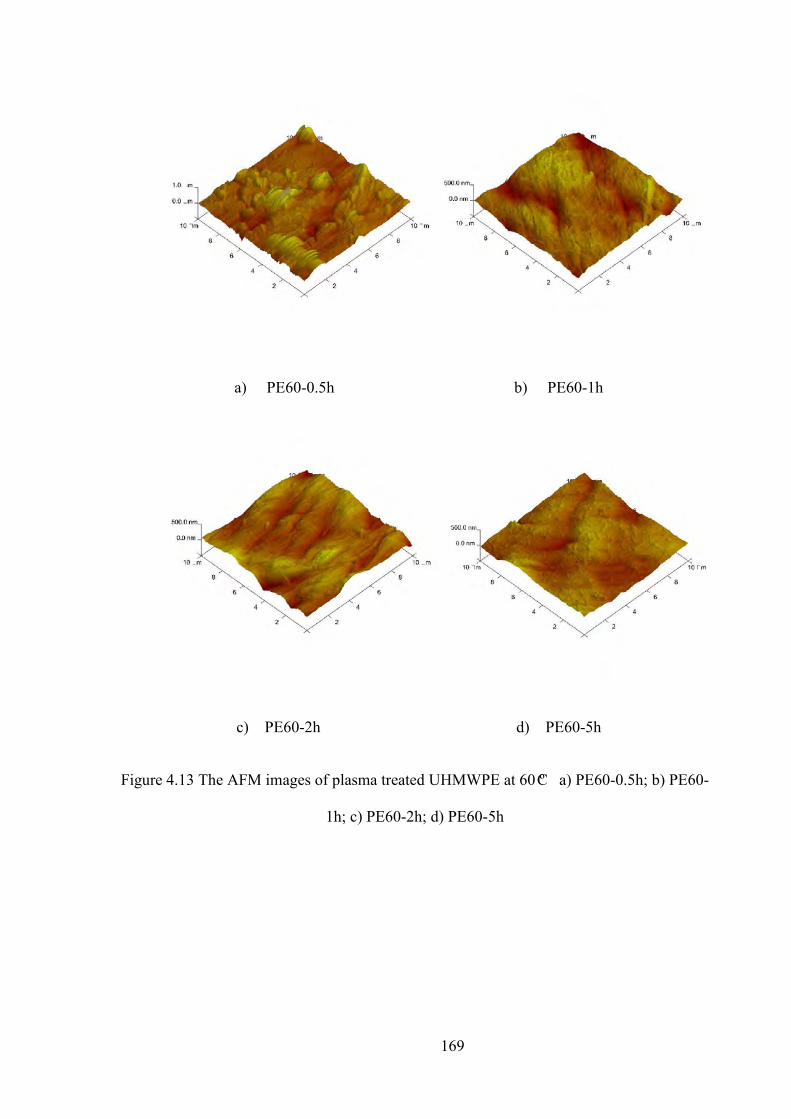
169
a) PE60-0.5h b) PE60-1h
c) PE60-2h d) PE60-5h
Figure 4.13 The AFM images of plasma treated UHMWPE at 60 ºC a) PE60-0.5h; b) PE60-
1h; c) PE60-2h; d) PE60-5h
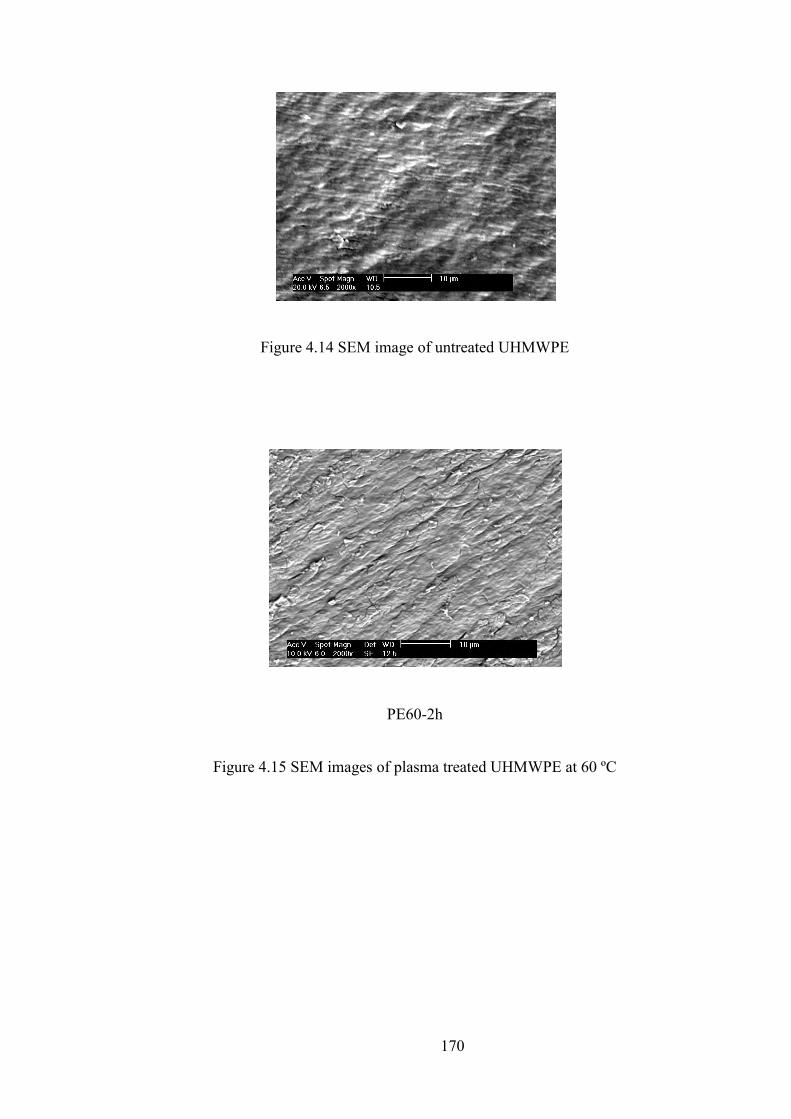
170
Figure 4.14 SEM image of untreated UHMWPE
PE60-2h
Figure 4.15 SEM images of plasma treated UHMWPE at 60 ºC

171
PE80-05h PE80-2h
Figure 4.16 SEM images of plasma treated UHMWPE at 80 ºC
PE100-05h PE100-1h
PE100-2h PE100-5h
Figure 4.17 SEM images of plasma treated UHMWPE at 100 ºC
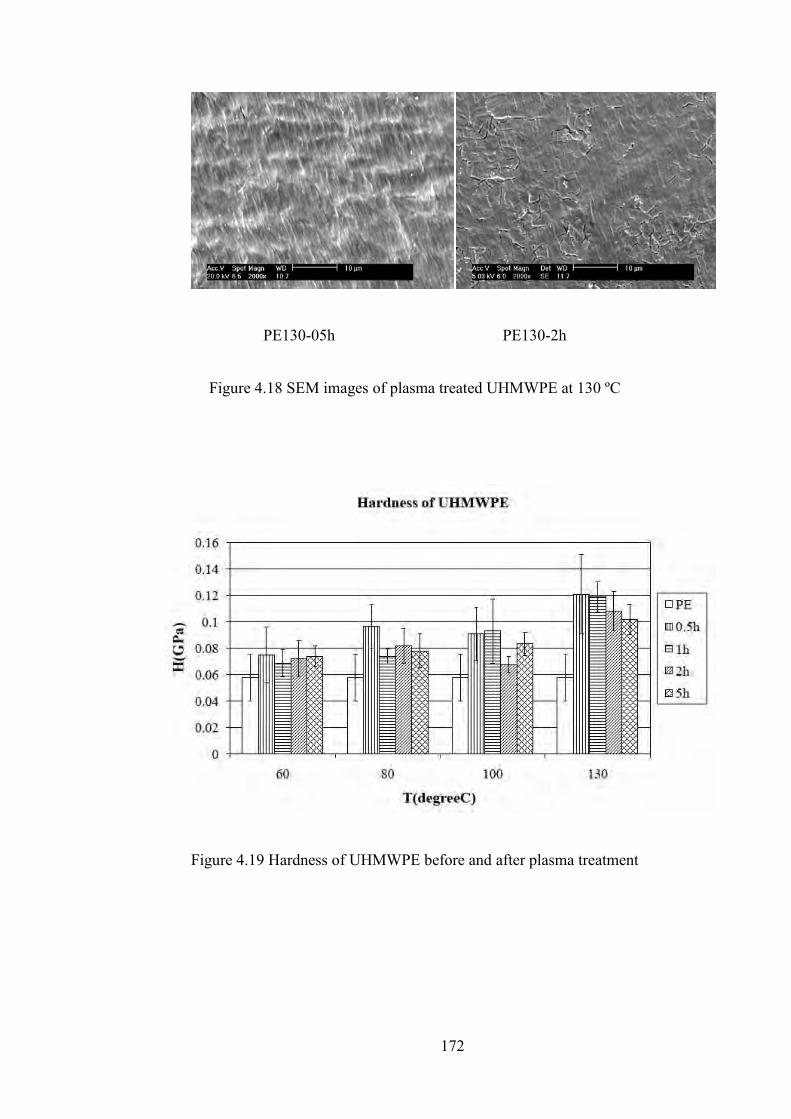
172
PE130-05h PE130-2h
Figure 4.18 SEM images of plasma treated UHMWPE at 130 ºC
Figure 4.19 Hardness of UHMWPE before and after plasma treatment
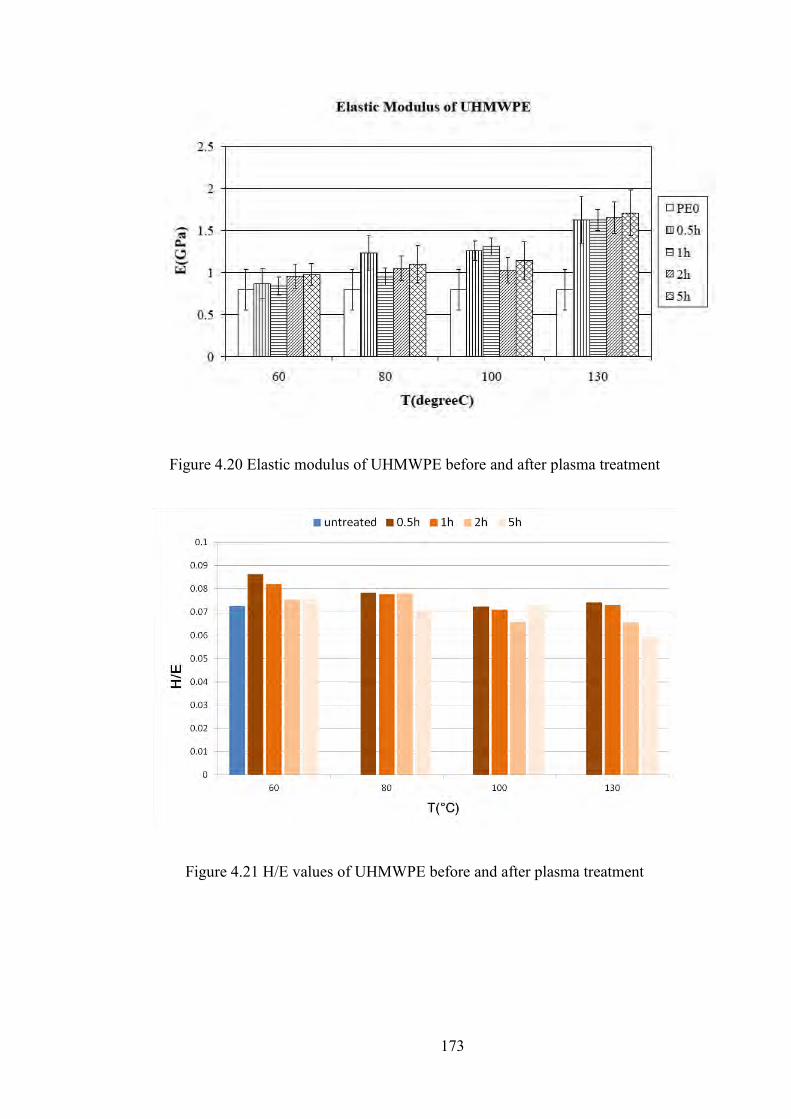
173
Figure 4.20 Elastic modulus of UHMWPE before and after plasma treatment
Figure 4.21 H/E values of UHMWPE before and after plasma treatment
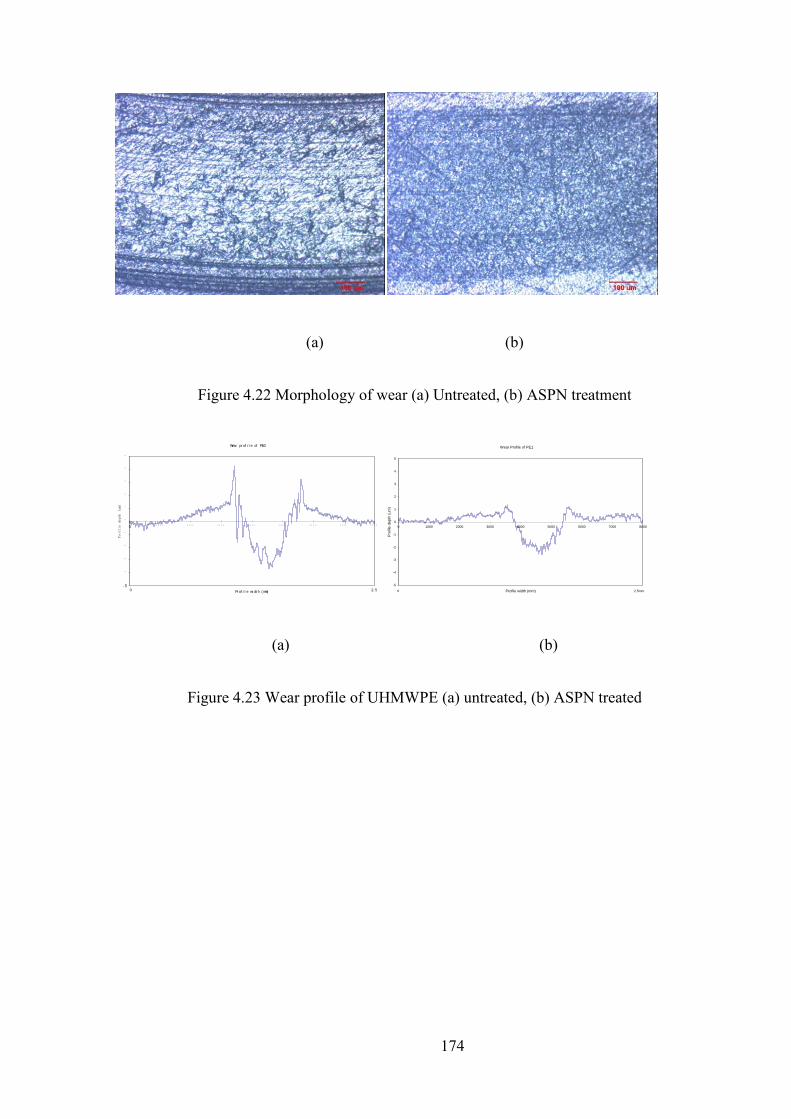
174
(a) (b)
Figure 4.22 Morphology of wear (a) Untreated, (b) ASPN treatment
(a) (b)
Figure 4.23 Wear profile of UHMWPE (a) untreated, (b) ASPN treated
Wear pr of i l e of PE0
- 5
- 4
- 3
- 2
- 1
0
1
2
3
4
5
01 0 0 0 2 0 0 0 3 0 0 0 4 0 0 0 5 0 0 0 6 0 0 0 7 0 0 0 8 0 0 0
Pr of i l e wi dt h ( mm)
Profile depth (um)
0 2. 5
Wear Profile of PE1
-5
-4
-3
-2
-1
0
1
2
3
4
5
0 1000 2000 3000 4000 5000 6000 7000 8000
Profile width (mm)
Pro
file
de
pth
(u
m)
0 2.5mm
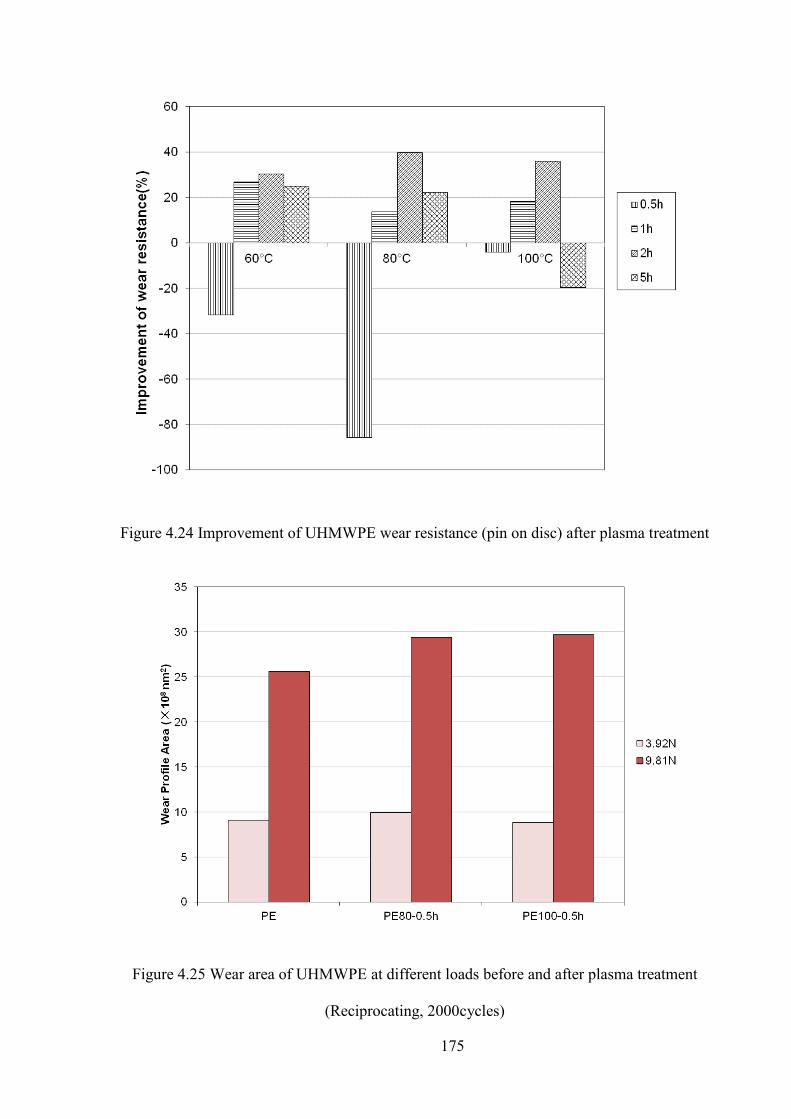
175
Figure 4.24 Improvement of UHMWPE wear resistance (pin on disc) after plasma treatment
Figure 4.25 Wear area of UHMWPE at different loads before and after plasma treatment
(Reciprocating, 2000cycles)

176
Figure 4.26 Scanning electron micrographs of cells attachment onto untreated UHMWPE
(a. ×100; b.×4000; c.×8000)
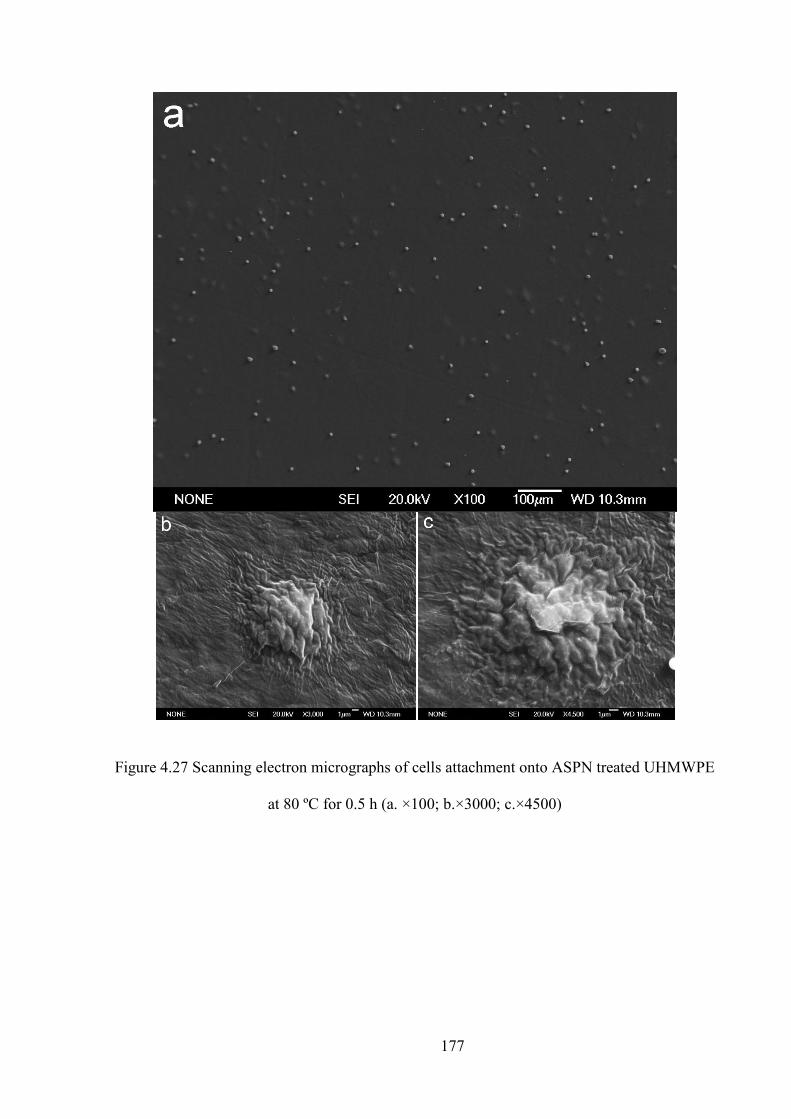
177
Figure 4.27 Scanning electron micrographs of cells attachment onto ASPN treated UHMWPE
at 80 ºC for 0.5 h (a. ×100; b.×3000; c.×4500)

178
Figure 4.28 Scanning electron micrographs of cells attachment onto ASPN treated UHMWPE
at 100 ºC for 0.5 h (a. ×100; b.×4000; c.×2500)
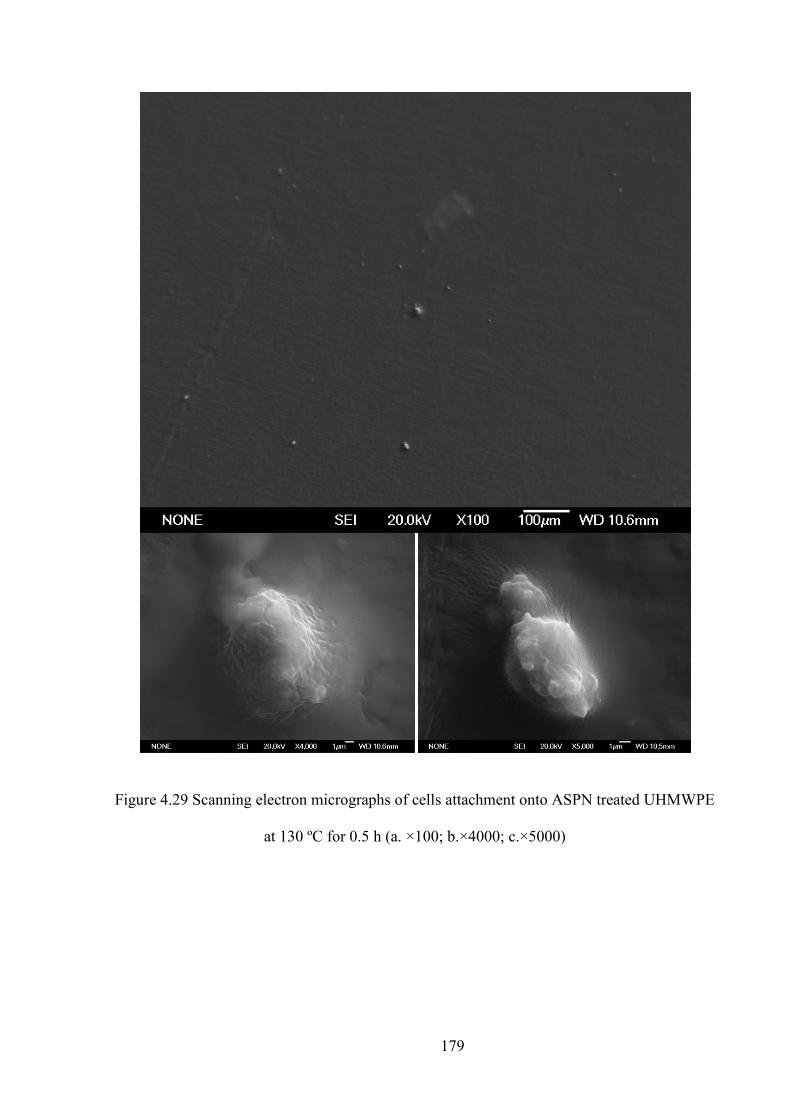
179
Figure 4.29 Scanning electron micrographs of cells attachment onto ASPN treated UHMWPE
at 130 ºC for 0.5 h (a. ×100; b.×4000; c.×5000)

180
Figure 4.30 Four stages of osteoblast cells on surface of UHMWPE ASPN treated at 80 and
100 C. 1. Adhesion; 2. Filopodial growth; 3. Cytoplasmic webbing; 4. Flat cell.
Figure 4.31 Cell density on UHMWPE surface after attachment for 1h
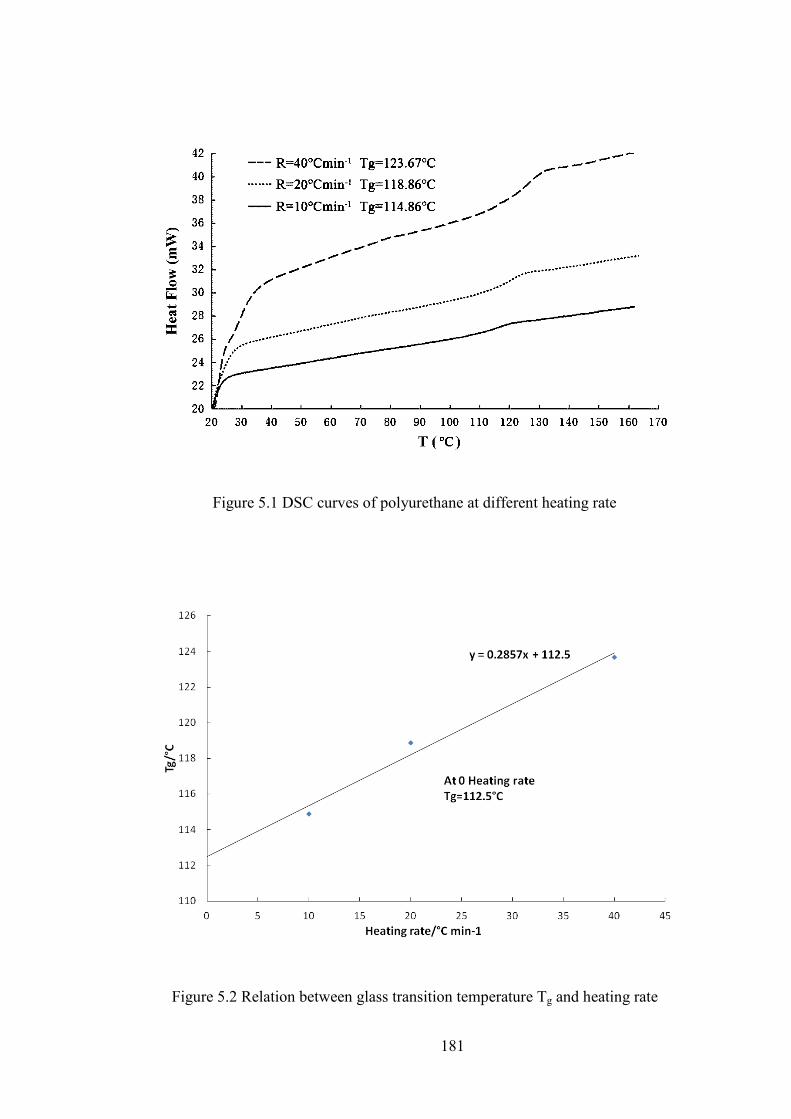
181
Figure 5.1 DSC curves of polyurethane at different heating rate
Figure 5.2 Relation between glass transition temperature Tg and heating rate
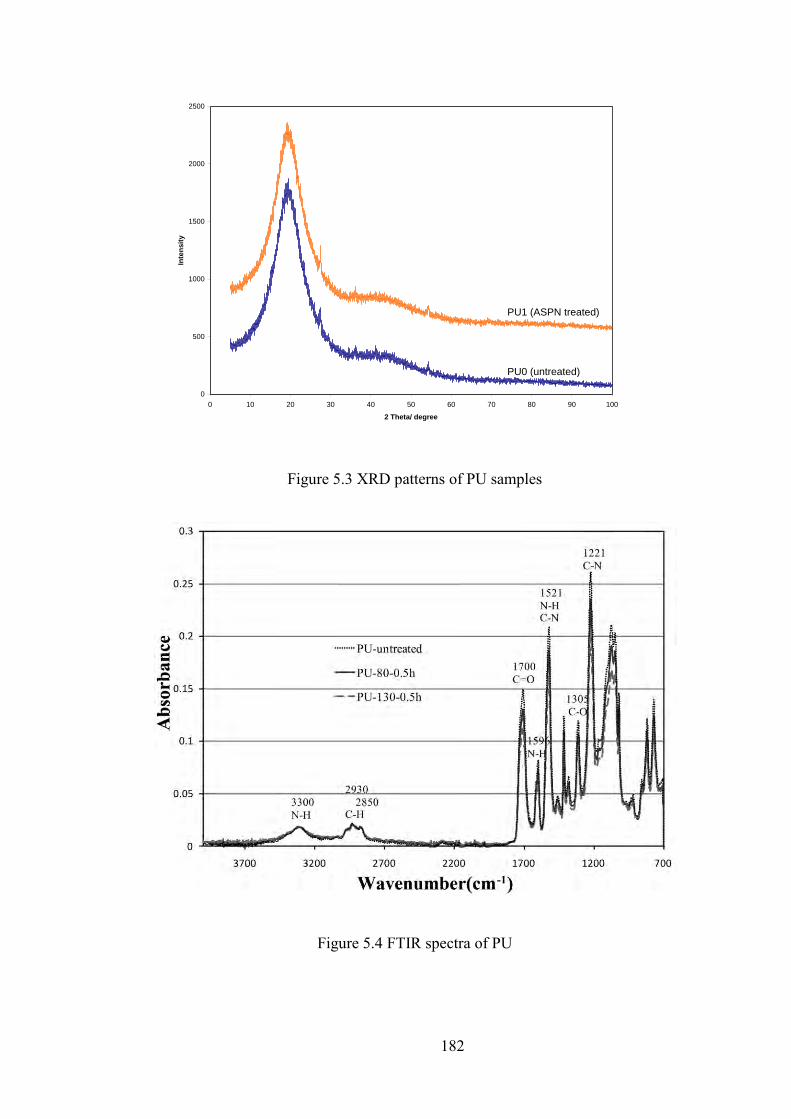
182
Figure 5.3 XRD patterns of PU samples
Figure 5.4 FTIR spectra of PU
0
500
1000
1500
2000
2500
0 10 20 30 40 50 60 70 80 90 100
2 Theta/ degree
Inte
nsit
y
PU1 (ASPN treated)
PU0 (untreated)
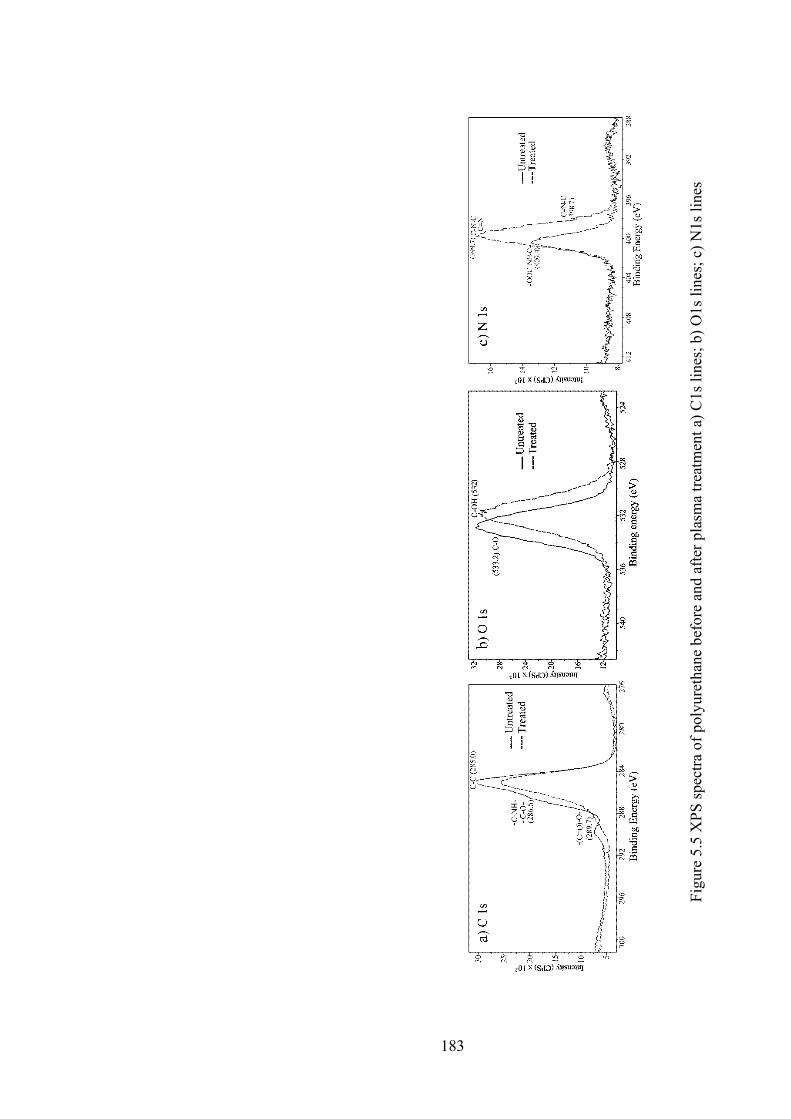
183
Figu
re 5
.5 X
PS sp
ectra
of p
olyu
reth
ane
befo
re a
nd a
fter p
lasm
a tre
atm
ent a
) C1s
line
s; b
) O1s
line
s; c
) N1s
line
s

184
Figure 5.6 C1s peaks fit of polyurethane a) untreated; b) treated.
Figure 5.7 O1s peaks fit of polyurethane a) untreated; b) treated.
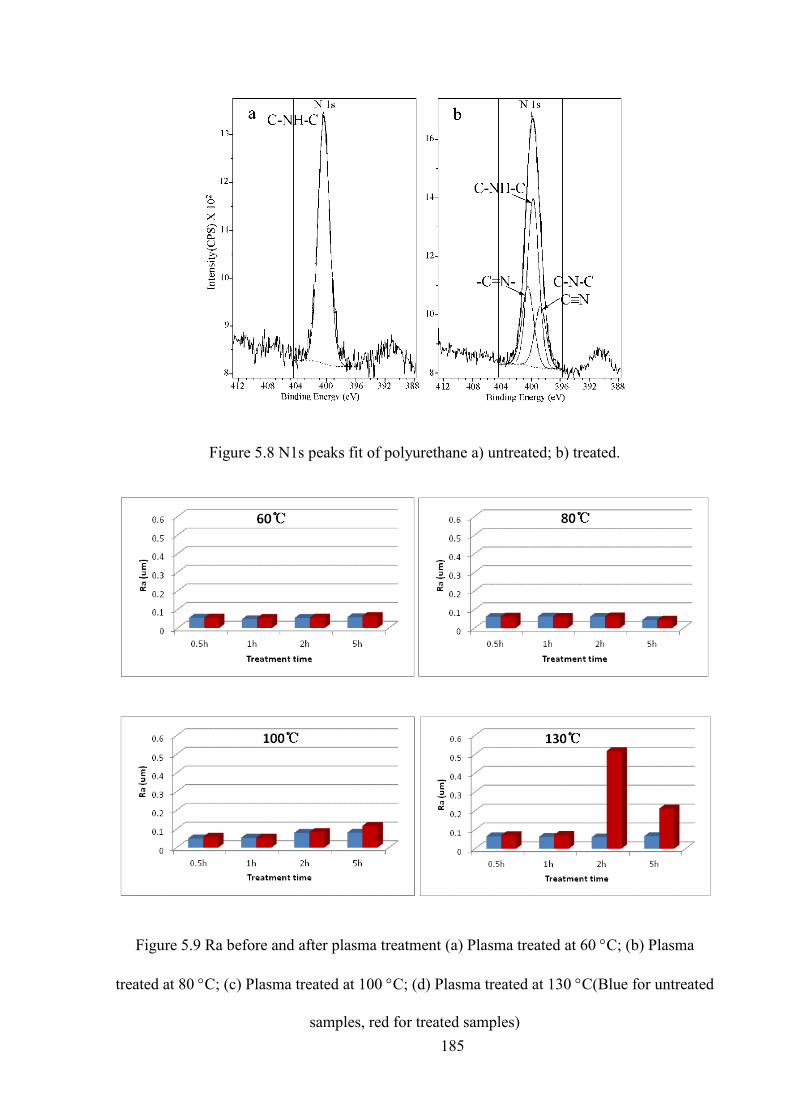
185
Figure 5.8 N1s peaks fit of polyurethane a) untreated; b) treated.
Figure 5.9 Ra before and after plasma treatment (a) Plasma treated at 60 C; (b) Plasma
treated at 80 C; (c) Plasma treated at 100 C; (d) Plasma treated at 130 C(Blue for untreated
samples, red for treated samples)

186
Figure 5.10 The AFM image of untreated PU
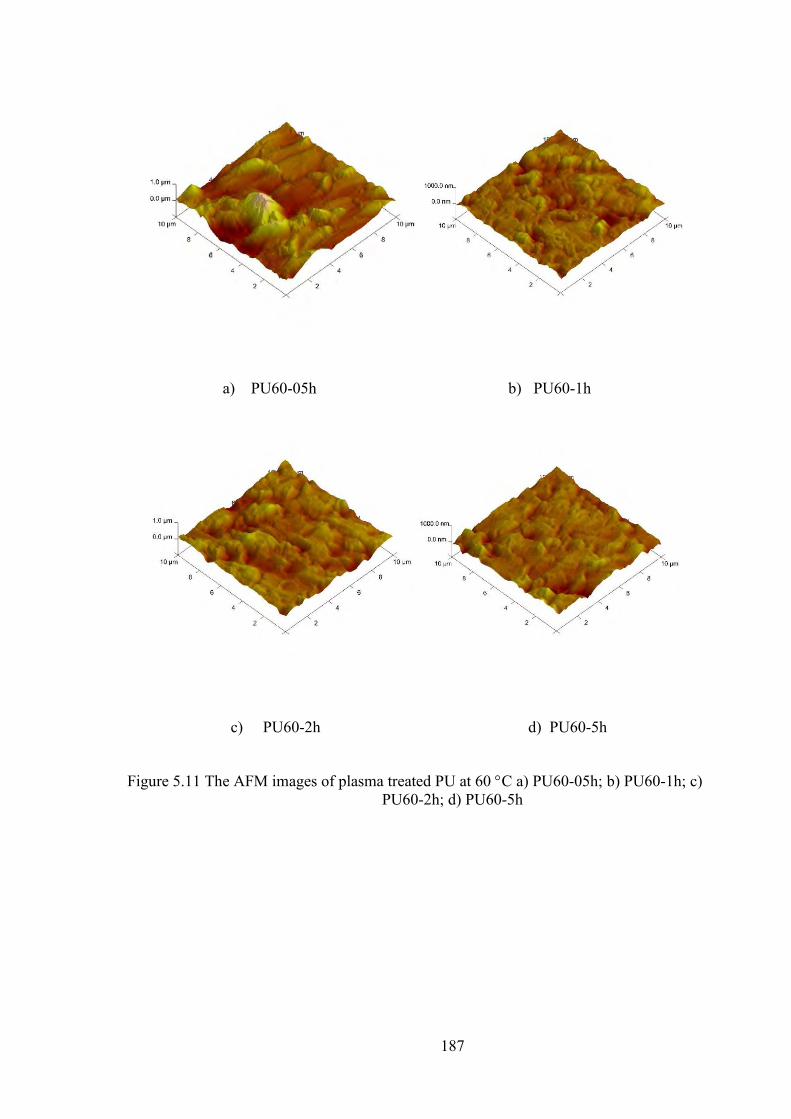
187
a) PU60-05h b) PU60-1h
c) PU60-2h d) PU60-5h
Figure 5.11 The AFM images of plasma treated PU at 60 C a) PU60-05h; b) PU60-1h; c) PU60-2h; d) PU60-5h

188
a) PU80-05h b) PU80-1h
b) PU80-2h d) PU80-5h
Figure 5.12 The AFM images of plasma treated PU at 80 C a) PU80-05h; b) PU80-1h; c) PU80-2h; d) PU80-5h

189
a) PU100-05h b) PU100-1h
c) PU100-2h d) PU100-5h
Figure 5.13 The AFM images of plasma treated PU at 100 C a) PU100-05h; b) PU100-1h; c) PU100-2h; d) PU100-5h

190
a) PU130-05h b) PU130-1h
c) PU130-2h d) PU130-5h
Figure 5.14 The AFM images of plasma treated PU at 130C130 C a) PU130-05h; b) PU130-1h; c) PU130-2h; d) PU130-5h

191
Figure 5.15 SEM image of untreated polyurethane
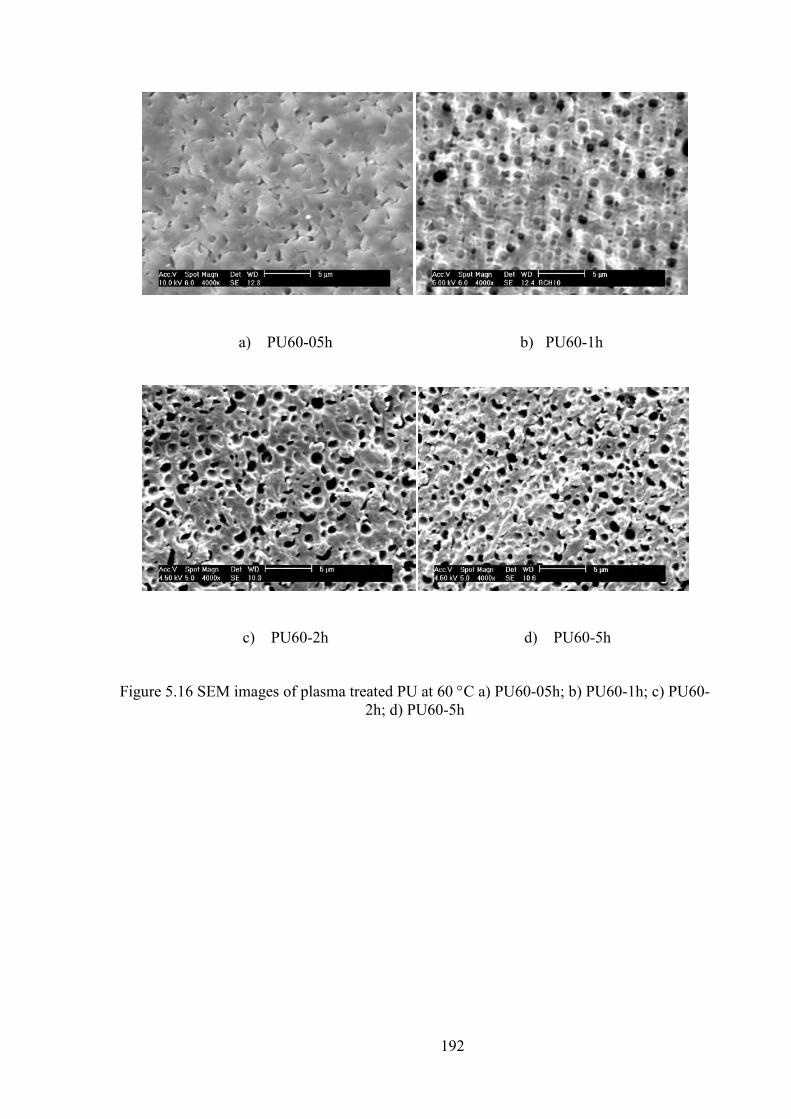
192
a) PU60-05h b) PU60-1h
c) PU60-2h d) PU60-5h
Figure 5.16 SEM images of plasma treated PU at 60 C a) PU60-05h; b) PU60-1h; c) PU60-2h; d) PU60-5h
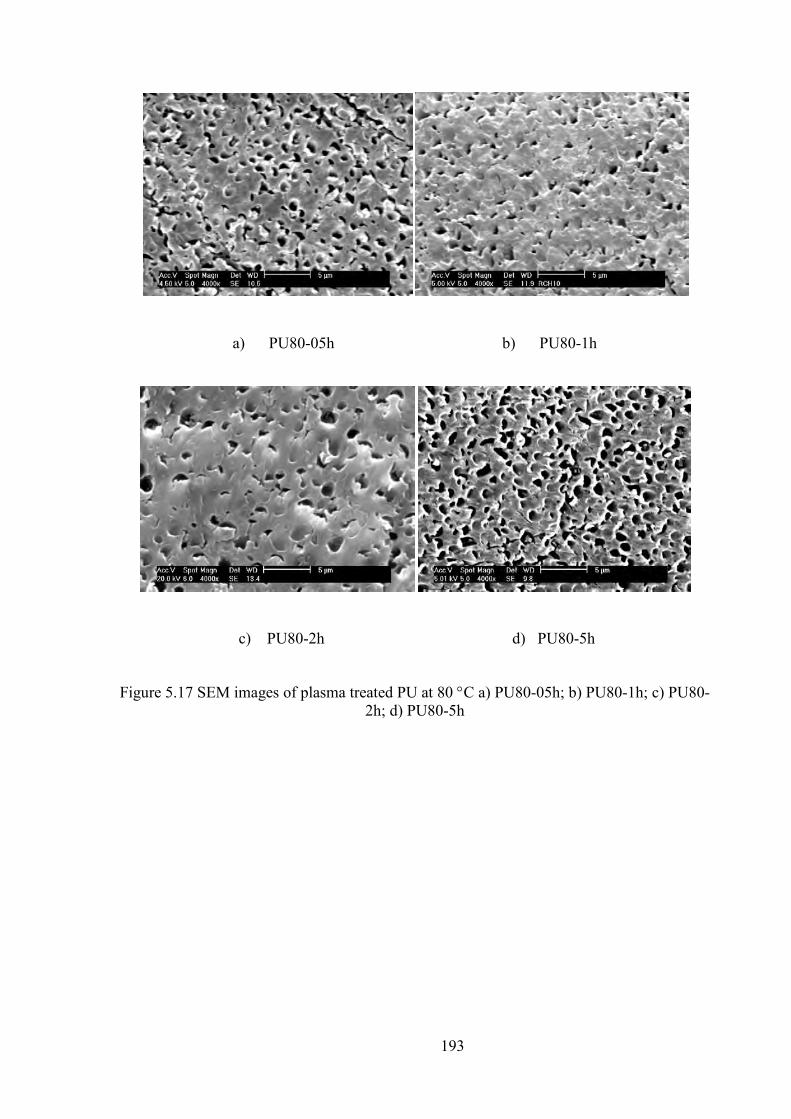
193
a) PU80-05h b) PU80-1h
c) PU80-2h d) PU80-5h
Figure 5.17 SEM images of plasma treated PU at 80 C a) PU80-05h; b) PU80-1h; c) PU80-2h; d) PU80-5h
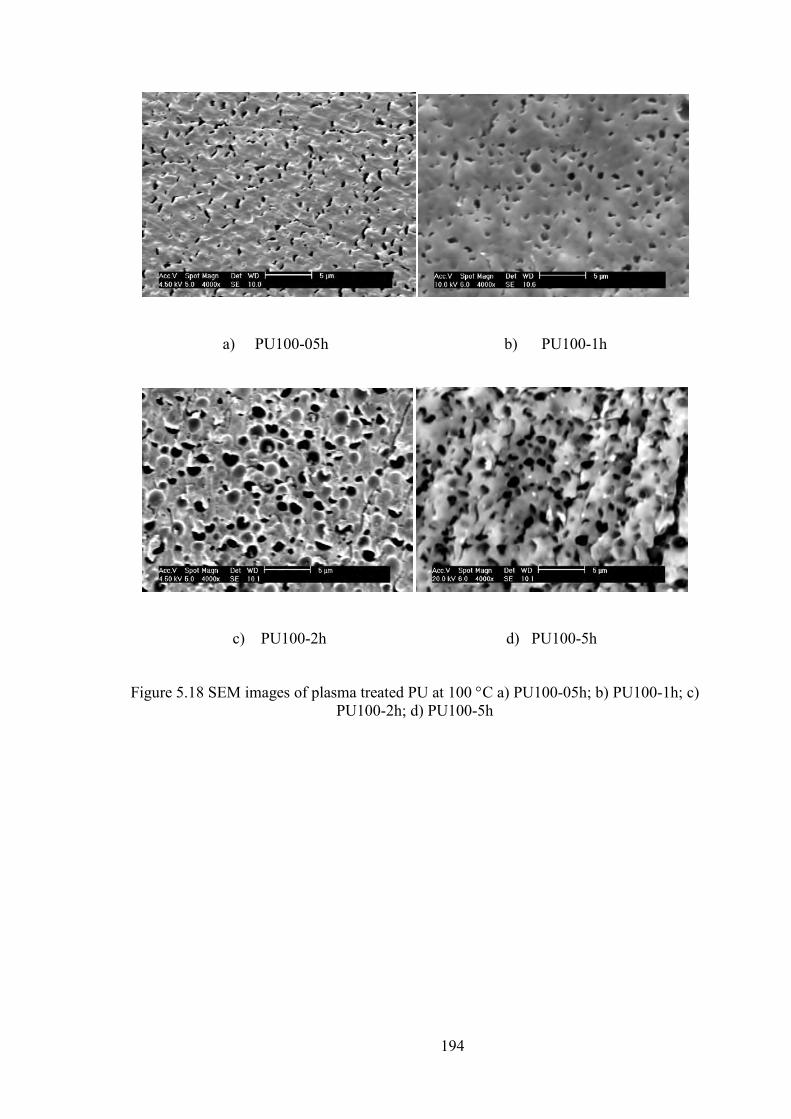
194
a) PU100-05h b) PU100-1h
c) PU100-2h d) PU100-5h
Figure 5.18 SEM images of plasma treated PU at 100 C a) PU100-05h; b) PU100-1h; c) PU100-2h; d) PU100-5h
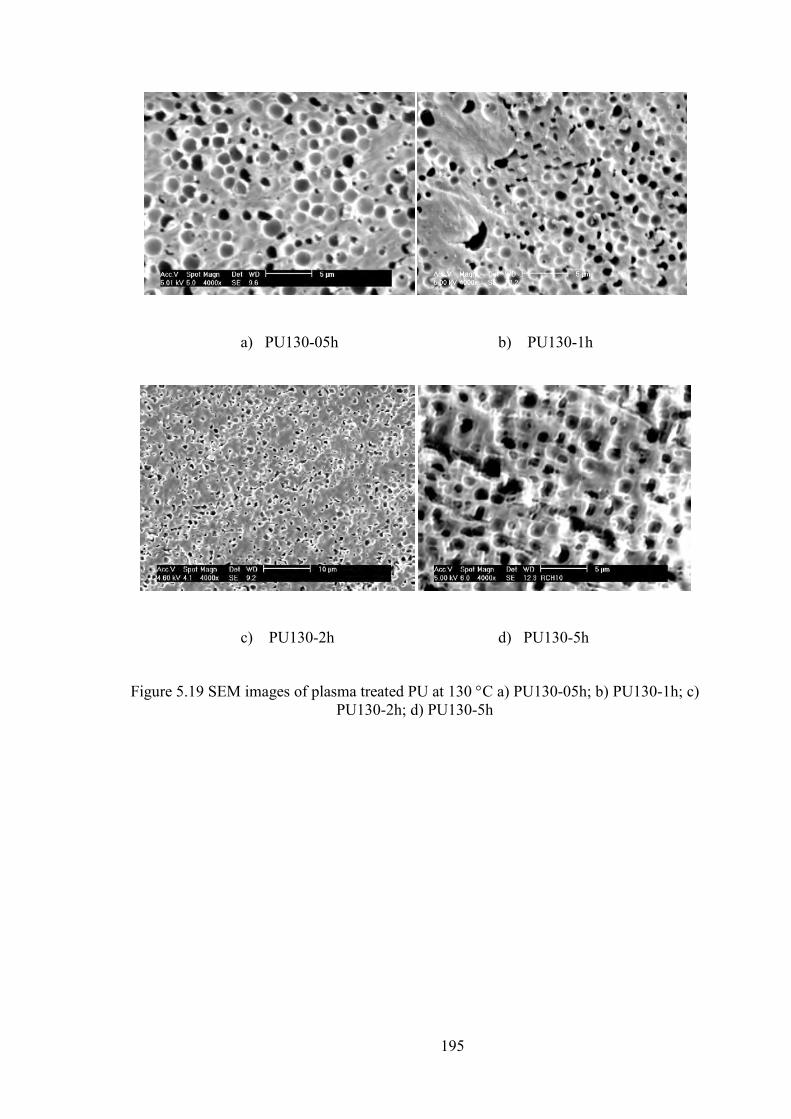
195
a) PU130-05h b) PU130-1h
c) PU130-2h d) PU130-5h
Figure 5.19 SEM images of plasma treated PU at 130 C a) PU130-05h; b) PU130-1h; c) PU130-2h; d) PU130-5h

196
Figure 5.20 Hardness of PU before and after plasma treatment
Figure 5.21 Elastic modulus of PU before and after plasma treatment
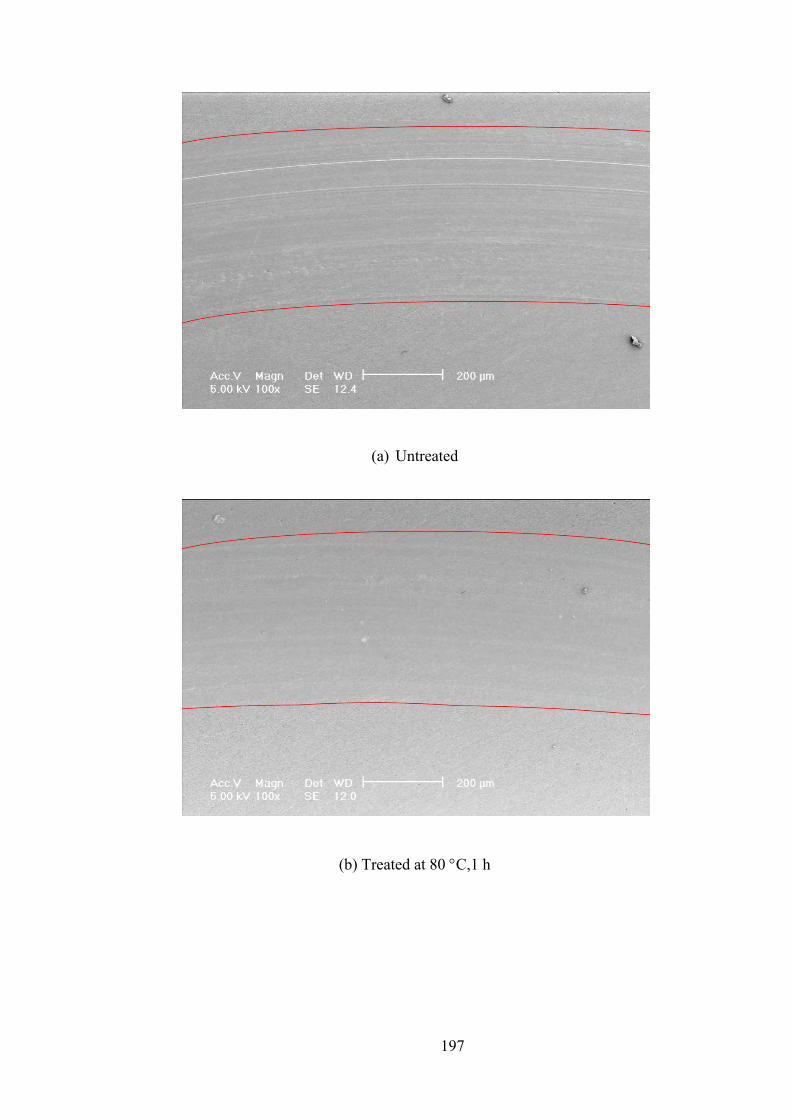
197
(a) Untreated
(b) Treated at 80 C,1 h

198
(c) Treated at 130 C,1 h
Figure 5.22 Pin-on-disc wear track morphologies of polyurethane samples (a)Untreated; (b) Treated at 80 C,1 h; (c) Treated at 130 C,1 h
Figure 5.23 Improvement of wear resistance of PU samples before and after plasma treatment
(Pin-on-disc, 9.81 N)
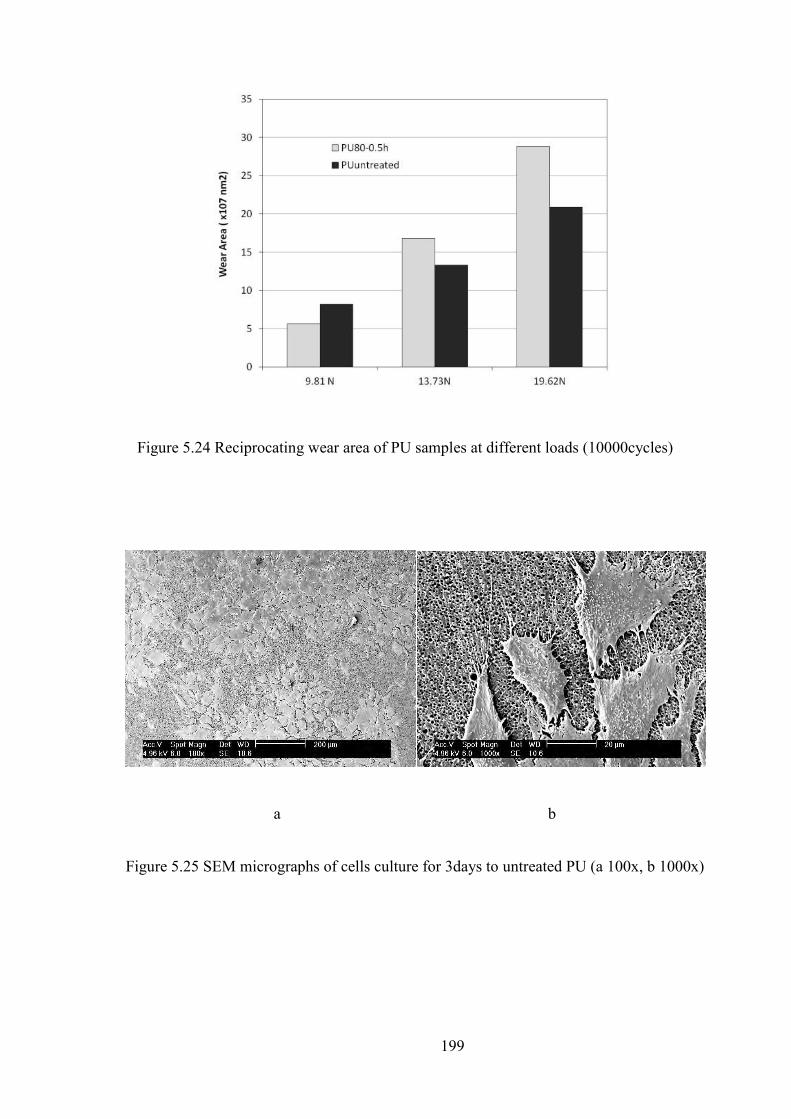
199
Figure 5.24 Reciprocating wear area of PU samples at different loads (10000cycles)
a b
Figure 5.25 SEM micrographs of cells culture for 3days to untreated PU (a 100x, b 1000x)
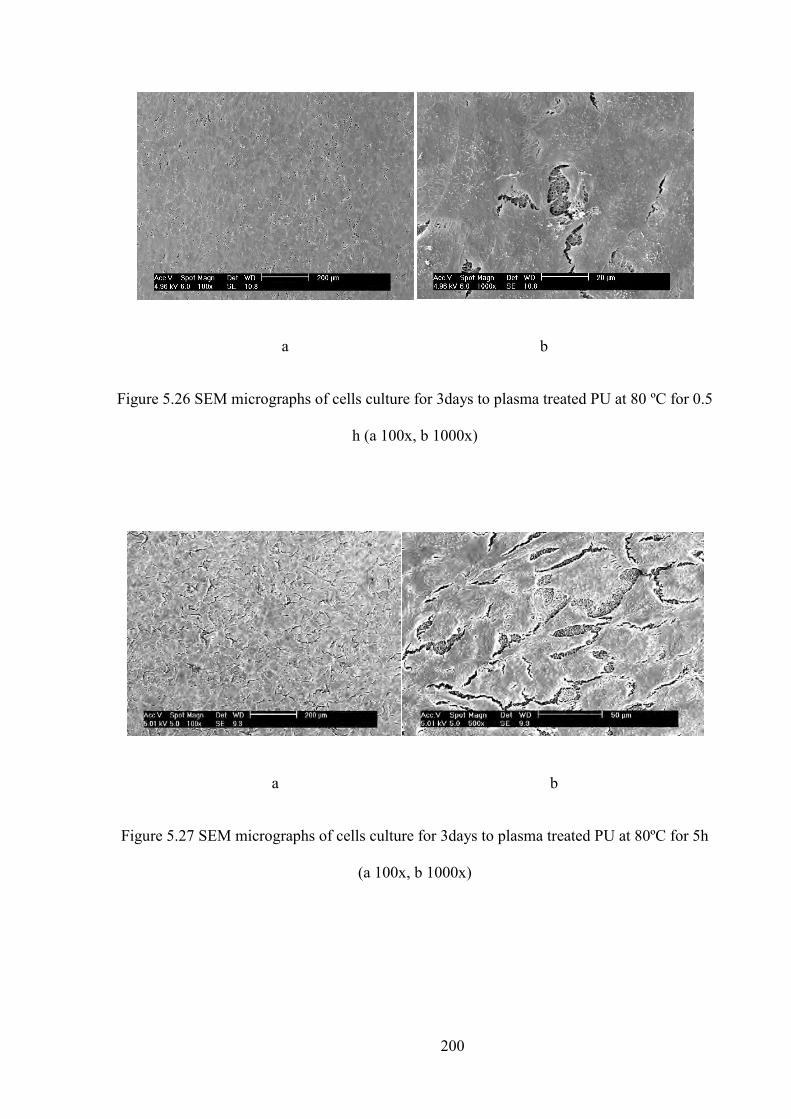
200
a b
Figure 5.26 SEM micrographs of cells culture for 3days to plasma treated PU at 80 ºC for 0.5
h (a 100x, b 1000x)
a b
Figure 5.27 SEM micrographs of cells culture for 3days to plasma treated PU at 80ºC for 5h
(a 100x, b 1000x)
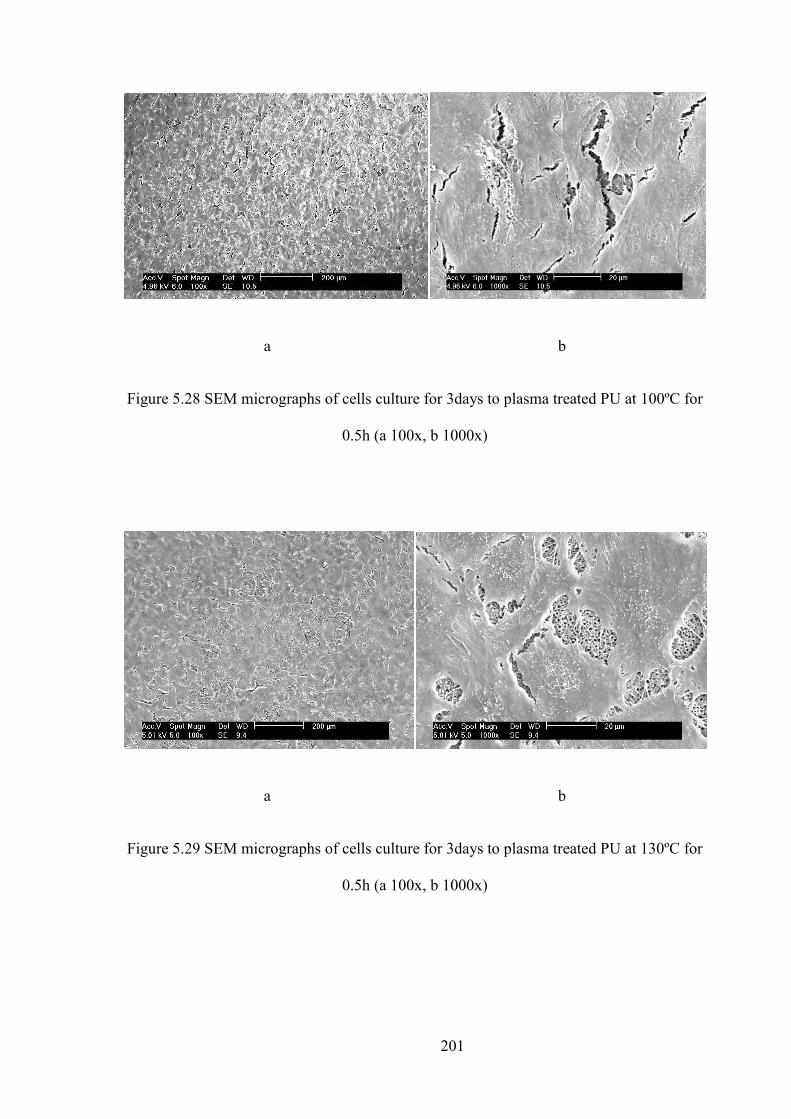
201
a b
Figure 5.28 SEM micrographs of cells culture for 3days to plasma treated PU at 100ºC for
0.5h (a 100x, b 1000x)
a b
Figure 5.29 SEM micrographs of cells culture for 3days to plasma treated PU at 130ºC for
0.5h (a 100x, b 1000x)
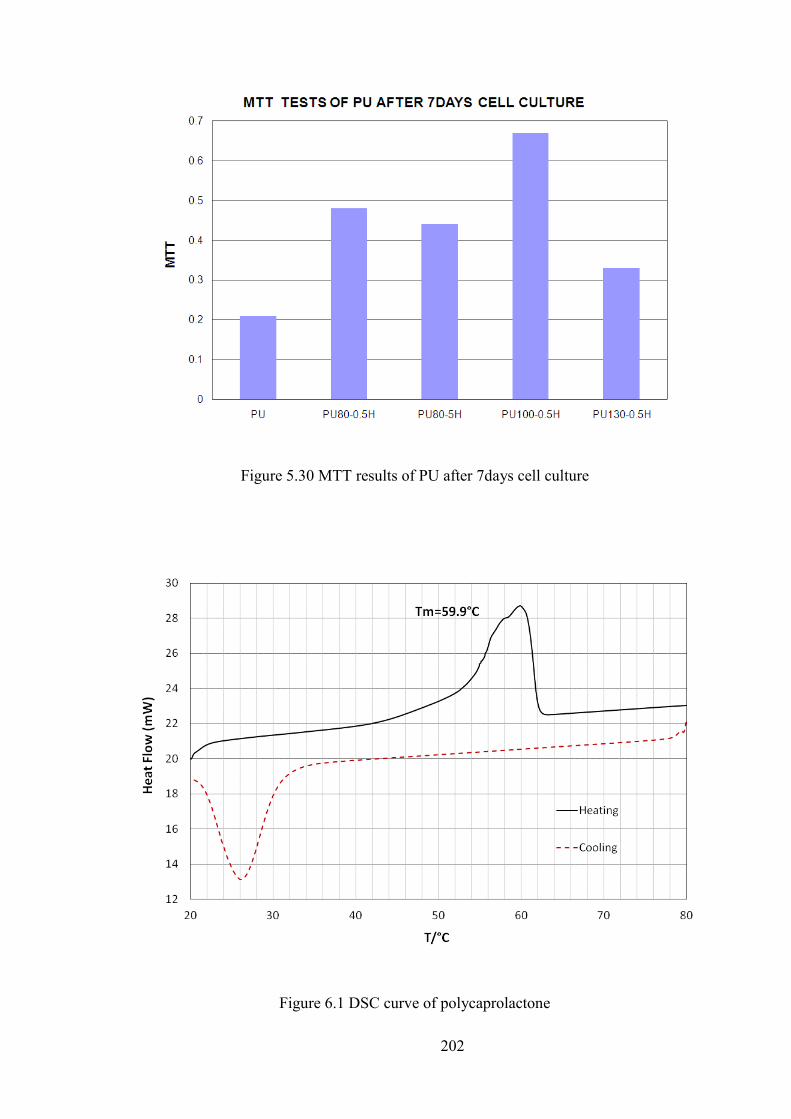
202
Figure 5.30 MTT results of PU after 7days cell culture
Figure 6.1 DSC curve of polycaprolactone
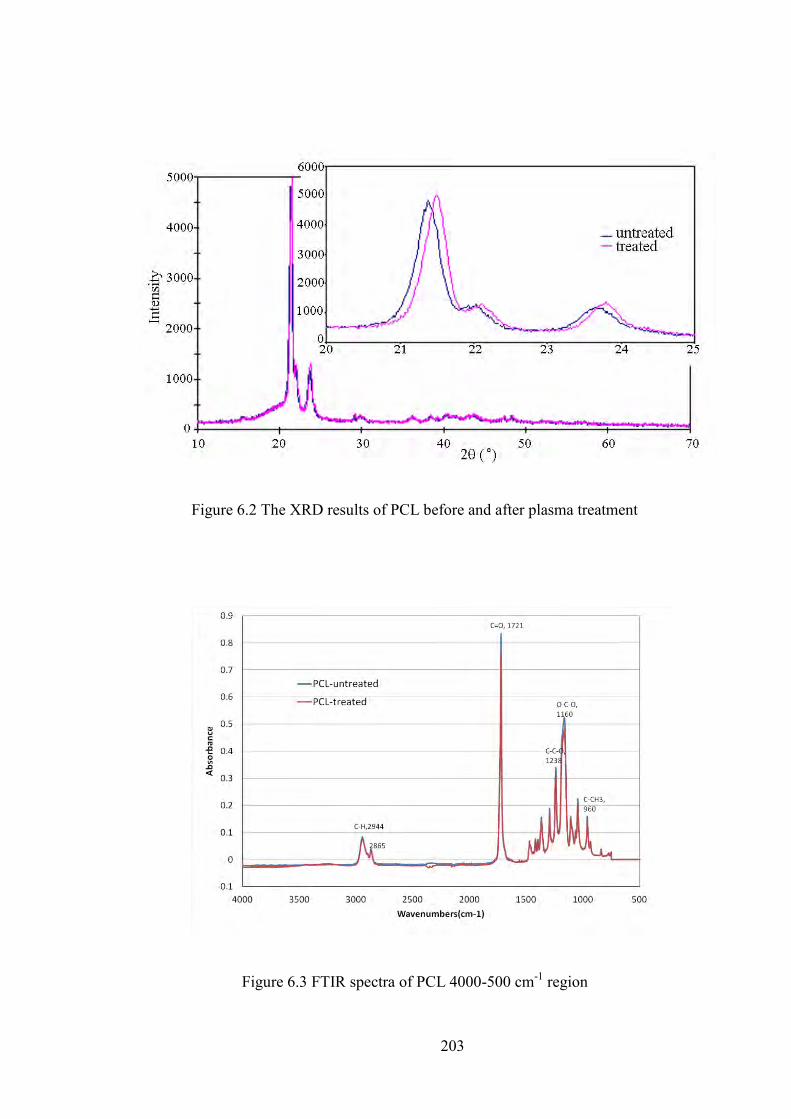
203
Figure 6.2 The XRD results of PCL before and after plasma treatment
Figure 6.3 FTIR spectra of PCL 4000-500 cm-1 region

204
Figure 6.4 FTIR spectra of PCL 3500-3100 cm-1 region
Figure 6.5 C1s spectra of PCL before and after plasma treatment

205
Figure 6.6 O1s spectra of PCL before and after plasma treatment
Figure 6.7 Raman spectra of PCL

206
Figure 6.8 The AFM image of untreated PCL
Figure 6.9 The AFM image of plasma treated PCL

207
Figure 6.10 SEM image of untreated PCL
Figure 6.11 SEM image of plasma treated PCL

208
Figure 6.12 Scanning electron micrographs of cells attachment onto untreated PCL (a. low
magnification; b. high magnification)
Figure 6.13 Scanning electron micrographs of cells attachment onto ASPN treated PCL (a.
low magnification; b. high magnification)
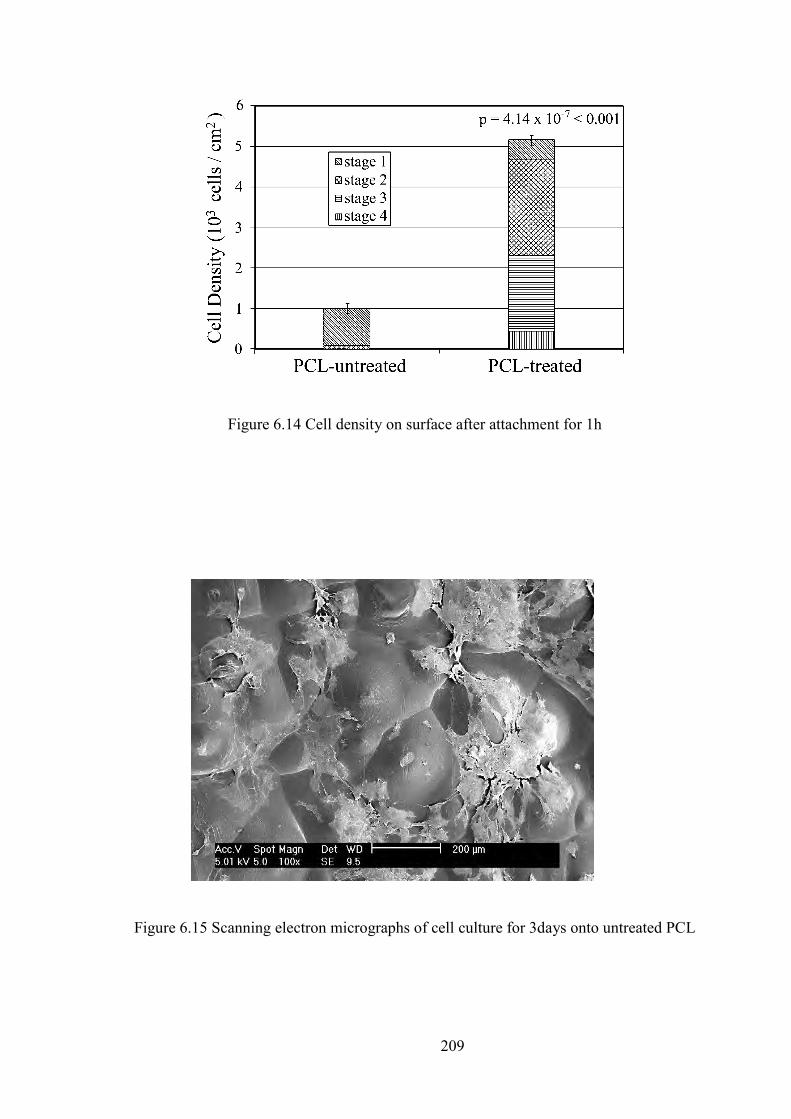
209
Figure 6.14 Cell density on surface after attachment for 1h
Figure 6.15 Scanning electron micrographs of cell culture for 3days onto untreated PCL

210
Figure 6.16 Scanning electron micrographs of cell culture for 3days onto treated PCL
Figure 6.17 MTT results of PCL after 7days cell culture

211
Figure 6.18 Degradation results of PCL films before and after plasma treatment
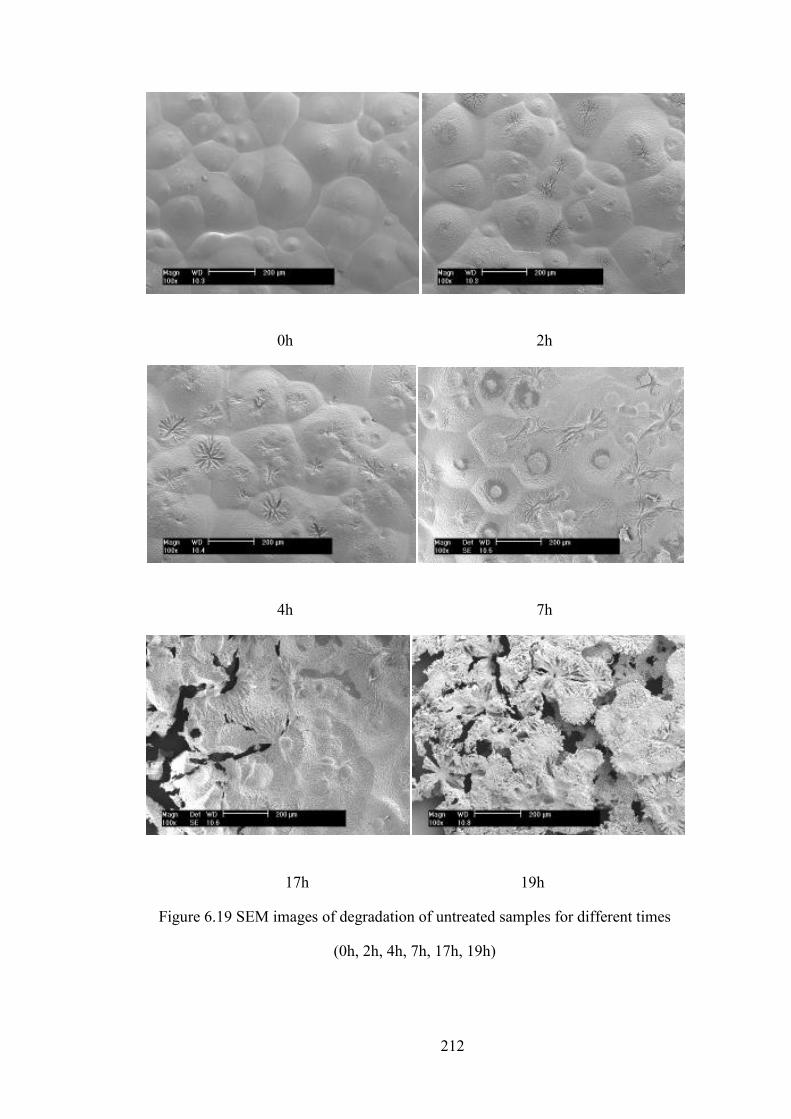
212
0h 2h
4h 7h
17h 19h
Figure 6.19 SEM images of degradation of untreated samples for different times
(0h, 2h, 4h, 7h, 17h, 19h)
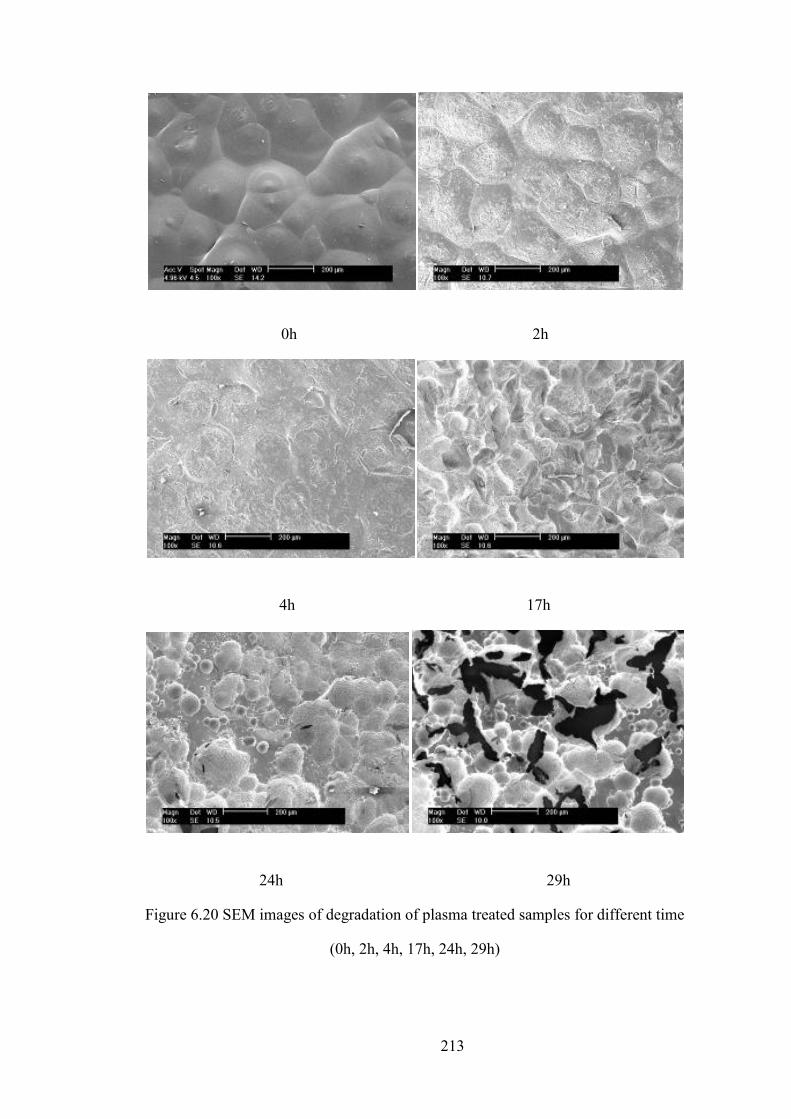
213
0h 2h
4h 17h
24h 29h
Figure 6.20 SEM images of degradation of plasma treated samples for different time
(0h, 2h, 4h, 17h, 24h, 29h)
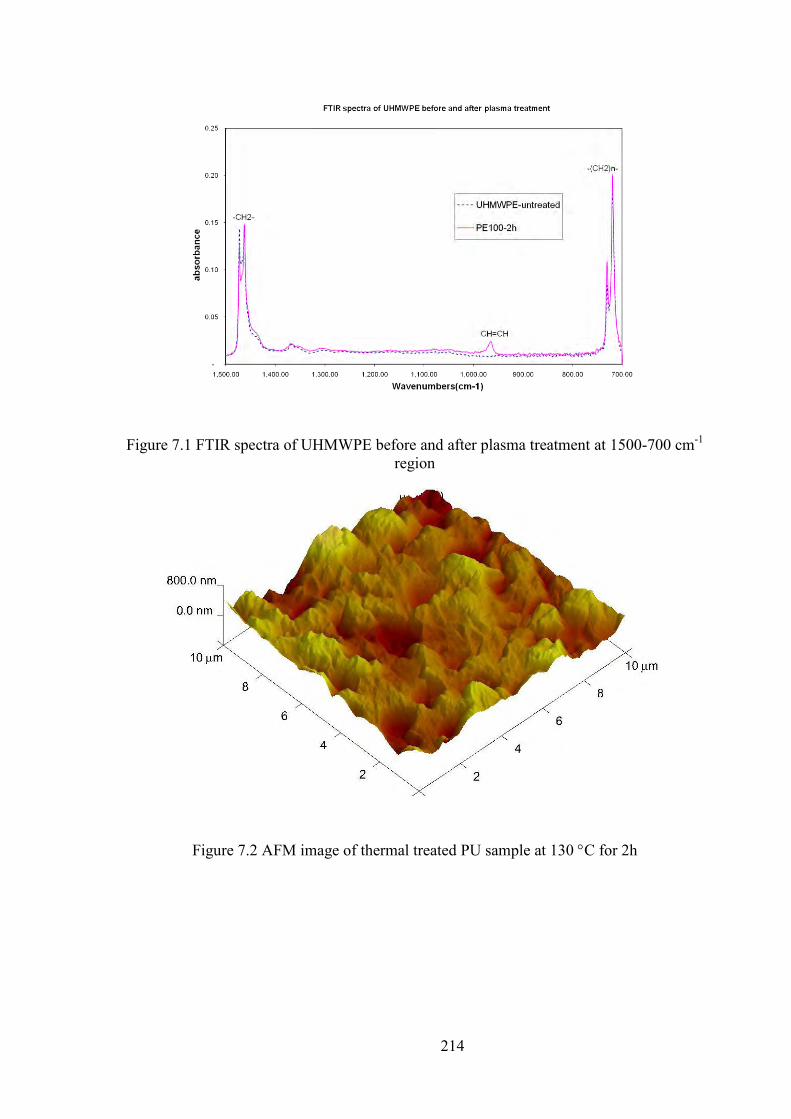
214
Figure 7.1 FTIR spectra of UHMWPE before and after plasma treatment at 1500-700 cm-1 region
Figure 7.2 AFM image of thermal treated PU sample at 130 C for 2h

215
Figure 7.3 The relationship between nano-hardness and crystallinity before and after plasma
treatment
Figure 7.4 the relationship between elastic modulus and crystallinity before and after plasma
treatment
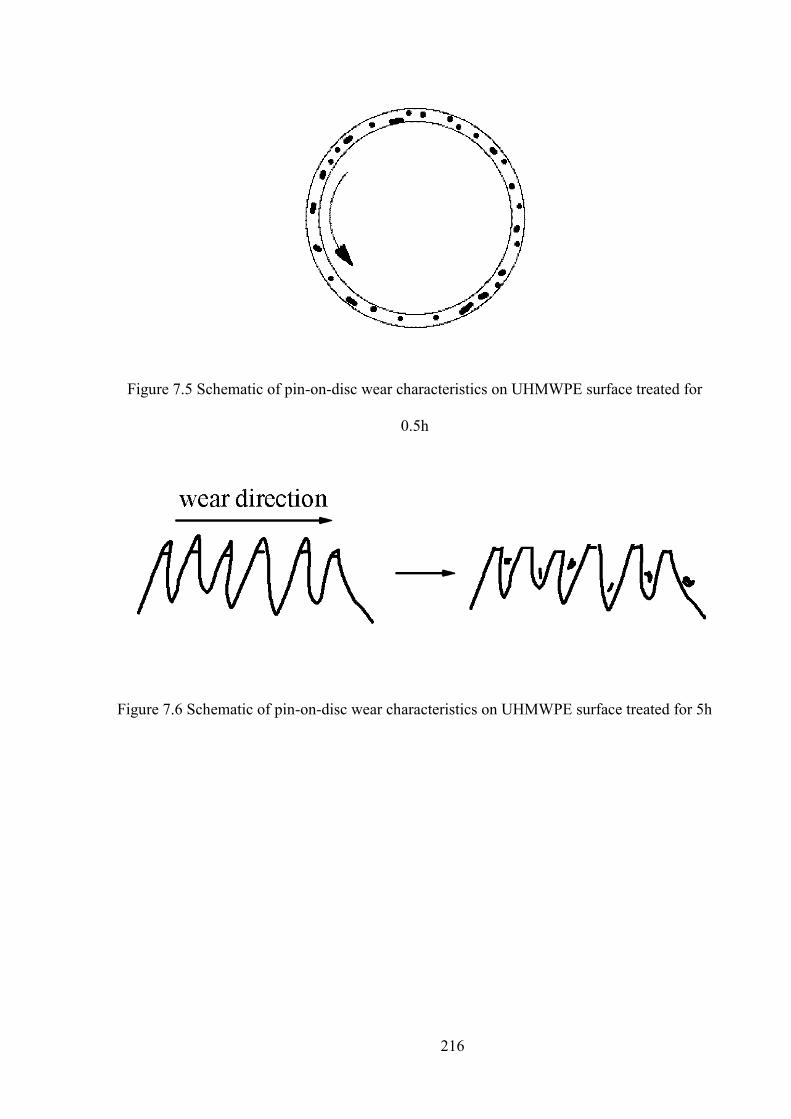
216
Figure 7.5 Schematic of pin-on-disc wear characteristics on UHMWPE surface treated for
0.5h
Figure 7.6 Schematic of pin-on-disc wear characteristics on UHMWPE surface treated for 5h

217
Figure 7.7 Schematic of reciprocating wear characteristics on UHMWPE treated surfaces
Figure 7.8 The percentage of the pore area on the surface of each sample of polyurethane after
plasma treatment


![Surface modification of atmospheric plasma …. Surface...Surface modification of atmospheric plasma activated ... PET [20,21 ], glass [22] and ... spatially uniform glow with a power](https://img.pdfslide.us/doc/110x75/5aab9cd77f8b9ac55c8c17ad/surface-modification-of-atmospheric-plasma-surfacesurface-modification.jpg)