Embed Size (px)
Citation preview

1 1
Neurodevelopment & placental dysfunction
Ahmet A. Baschat, MD Professor, Director of Maternal-Fetal
Medicine and Section of Fetal Therapy
University of Maryland School of Medicine
Important outcomes in FGR Hypoxemia
Stillbirth
Acidemia for the obstetrician
for parents A normal child
for the neonatologist
Prematurity
Neonatal death Morbidity
Nutrient partitioning in the fetus
Umbilical vein
PLACENTA
GLUCOSE
GLUCOSE
AMINO ACIDS
AMINO ACIDS
FATTY ACIDS
FATTY ACIDS
O2 O2 O2 O2 O2
O2 O2 O2 O2 O2 O2
O2 O2
Active placental nutrient transport
Fetal circulation
Fetal circulation – nutrient streaming
Ductus arteriosus
Ductus venosus
60-70%
Foramen ovale
UV
Glucose
Insulin / IGF axis Glycogen
Foramen ovale
aortic isthmus
Umbilical arteries
Ductus venosus
Natural disease progression:
The 3 phases of FGR
Preclinical : Venous redistribution & evolving growth delay
Clinical : Growth delay and arterial redistribution
Deterioration : fetal decompensation

2 2
Maternal compartment
Fetal compartment
ET - 1
ET - 1
ET - 1 ET - 1
ET - 1 TX A2
TX A2
TX A2
NO
NO NO
P-cyclin
P-cyclin
VENOUS REDISTRIBUTION
UV
Ductus venosus
↓ UV Volume flow maternal Diet behavioral State
Rigano et al., 2006, Haugen et al., 2006, Bellotti et al., 2008
Insulin / IGF axis Glycogen Liver size
maternal Compartment
fetal Compartment
notching
↑ PI
↑ PI
AEDV
REDV
Uterine artery
■ Abnormal Trophoblast Invasion: ◆ 40-70% Pre-eclampsia ◆ 15-30% fetal growth restriction (FGR)
Umbilical artery
■ abnormal villous tree ◆ 40 – 100% FGR
30 %
50 %
70 %
■ Adverse Outcomes ◆ Hypoxemia / Acidemia ◆ Stillbirth ◆ Preterm birth ◆ neonatal complications ◆ poor neurodevelopment
Middle cerebral artery ■ Branch of the circle of Willis
◆ Use parietal bone window ◆ Parallel to wings of sphenoid ◆ Distal portion recommended ◆ Insonate at 0 degrees
■ Two parameters of importance ■ Increased peak systolic velocity (0º)
◆ Fetal anemia ◆ Increased paCO2
■ Decreased pulsatility index in ◆ Fetal hypoxemia ◆ Fetal hypertension ◆ indistinguishable by waveform.
Cerebroplacental Doppler ratio (CPR)
“centralization” =
middle cerebral artery Pulsatility
index
umbilical artery Pulsatility index
“ A cerebral-umbilical Doppler ratio below 1.08 can be considered as evidence of centralization of cardiac output towards the fetal brain. “
Gramellini et al., Obstet Gynecol, 1992; 79: 416-20.
Vessel Diameter 0º PW Doppler
AAO
MPA
RV. Output
LV. Output
MCA PI
Umbilical PI
Gramellini et al., Obstet Gynecol, 1992; 79: 416-20.
Bonnin et al., Circulation, 1993; 88: 216-22.
Al Ghazali et al., BJOG 1989; 96: 697-704.
Makikallio et al., UOG, 2002; 19: 147-52.
3 3
AFTERLOAD
LV FO
Isthmus
RV
PRELOAD
LV RV
ARTERIAL REDISTRIBUTION
Umbilical vein
Ductus venosus
■ Increased venous pressure ■ Ductus venosus dilatation ■ High placental afterload ■ Fetal Acidemia ■ Cardiac dysfunction
Baschat 2010
DV
cCTG
DV
BPP
“early changes”
“late changes”
Hecher et al., UOG 2001
>32. weeks A. umbilikalis
D. venosus
cCTG
MCA
AFI
UA
Ductus
MCA
<34
>34
<34
>34
<34
>34
<34
>34
-4
-2
0
2
4
6
8
10
12
14
-1 -5 -9
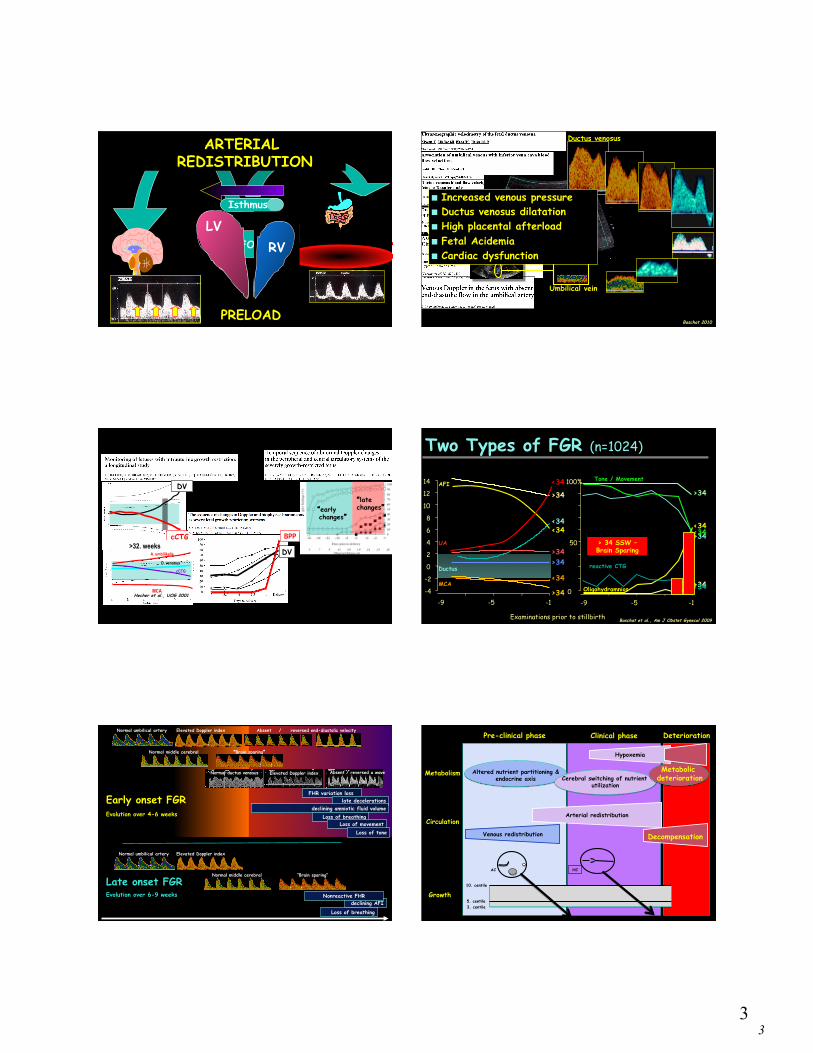
Examinations prior to stillbirth Baschat et al., Am J Obstet Gynecol 2009
Two Types of FGR (n=1024)
0
50
100%
-1 -5 -9
reactive CTG
Tone / Movement
Oligohydramnios
<34
>34
>34
<34
>34
<34 > 34 SSW – Brain Sparing
declining AFI Nonreactive FHR
Loss of breathing
FHR variation loss late decelerations
declining amniotic fluid volume Loss of breathing
Loss of movement Loss of tone
Elevated Doppler index Normal umbilical artery
Elevated Doppler index Absent / reversed a wave Normal ductus venosus
Elevated Doppler index Absent / reversed end-diastolic velocity Normal umbilical artery
Normal middle cerebral artery
“Brain sparing”
Normal middle cerebral artery
“Brain sparing”
Early onset FGR Evolution over 4-6 weeks
Late onset FGR Evolution over 6-9 weeks
Pre-clinical phase
Growth
Circulation
Metabolism
Deterioration Clinical phase
10. centile
5. centile 3. centile
AC HC
Venous redistribution
Arterial redistribution
Decompensation
Altered nutrient partitioning & endocrine axis Cerebral switching of nutrient
utilization
Metabolic deterioration
Hypoxemia

4 4
Proposed origins of damage
Hypoxemia
Acidemia
neurologic
Damage
Stillbirth James al. al, Soothill et al., Arduini et al., Senat et al., Harrington et al., Bilardo et al., Hecher et al,, Ribbert et al., Ferrazzi et al., Baschat et al., Cosmi et al., Divon et al.
abnormal Umbilical Brain sparing
abnormal venous Doppler
abnormal cCTG
abnormal biophysical
Delivery !
If this were true… ■ FGR fetuses should be normal before deterioration
■ Deterioration should be associated with worse neurodevelopmental outcome
■ Early intervention should make a difference
Am J Obstet Gynecol 2011
Fetal neurodevelopment
1st trimester 2nd trimester 3rd trimester
Individual movement coupling Rest / activity
Behavioral states
Dynamic fetal variables
Breathing
Movement & Tone
Accelerations
7.5 – 9 wks
12-14 wks
18 – 20 wks
cerebral cortex
RAS
ANS
VMC
Blood pressure
peripheral resistance Heart rate
modified by O2
Fetal heart rate control
CARDIAC OUTPUT IS ADJUSTED TO BODY NEEDS
Basic control High baseline Little variability
Reactive control lower baseline Higher variability Accelerations with activity
Behavioral control lower baseline Higher variability Changes with behavioral state

5 5
1st trimester 2nd trimester 3rd trimester
Individual movement coupling Rest / activity
Behavioral states
REM
FHR
Movement Incidental Periodic Absent Present
Absent Present Present Present
1F Quiet sleep
2F Active sleep
3F Quiet awake
4F Active awake
Time to complete BPS
26 min 3 min 14 min 2 min
• Established by 34 wks
• In 2 hours characteristic: • Concurrence • Organized transition
Behavioral states Evidence of abnormal fetal neurodevelopment in FGR ■ Abnormal organization of fetal behavior
■ Decreased percentage of coincidence ■ Abnormal state transition ■ Abnormal state organization ■ Delayed achievement of stable behavioral states
Arduini al., JPM 1988, Nijhuis et al., Dev Psychobiol 1999, Visser et al., Early Hum Dev 1990
Henson et al., BJOG 1984, Smith et al., BJOG 1987, Yum et al., EJOGRB 2001
■ Abnormal central integration of FHR control ■ Decreased accelerations – 80% nonreactive at 32 weeks ■ Increased baseline ■ Decreased variability and variation
Conclusions
■ Fetal neurodevelopment is abnormal when FGR is diagnosed
Fetal growth and neurodevelopment
Perc
entile
Gestational age 20 40
Perc
entile
Perc
entile
Asymmetrically small Symmetrically small
Symmetrically small
Symmetrically small
Harvey et al., Pediatrics 1982 • HC delay <26 weeks stronger impact on motor & cognitive development at age 5 than overall growth percentile
Roth et al., 1994 & 1999 • Slowing of 3rd trimester AC growth had no independent impact on 1 year developmental outcomes
• 6% hemiplegia or spastic diplegia • 30% mild motor disability
• Despite identical cognitive scores ~50% required education aid at age 8
Van Batenburg-Edes et al., Pediatr Res • large sample size n=2965 • 1 SD deviation in cephalization index (HC/EFW)
• 10-13% increased risk for suboptimal neurodevelopment
Conclusions
■ Fetal neurodevelopment is abnormal when FGR is diagnosed
■ Lagging head growth is the physical characteristic with the greatest impact on neurodevelopment with gestational age as an independent cofactor
■ Lagging head growth is associated with: lower perceptional performance motor disability poor cognition poor concentration deficient short-term memory poorer school achievement
i.e all brain areas are affected

6 6
Umbilical Doppler & neurodevelopment
Gestational week 26 28 30 32 34 36 38 40
Neonatal period
Infancy
Childhood
Adolescence
Figueras et al. SGA normal UA Doppler
NBAS
Vossbeck et al. AREDV –AGA control
2-5 year Bayley / K-ABC
Brodszki et al. AREDV –AGA controls
2 year CP rates
Padilla et al. AREDV –AGA control
1 year Bayley
Shand et al. FGR stratified by UA EDV
18-22 month outcomes
Figueras et al. SGA – AGA controls
2 year ASQ
McCowan et al. SGA – perinatal variables
2 year Bayley
Wienerroither et al. AREDV – AGA controls
6 year K-ABC
Shreuder et al. IUGR stratified by UA EDV
16 year motor / sensory / intelligence
Morsing et al. IUGR / AGA matched
5-8 year Wechsler scale
Brodszki et al., UOG 2000 • 40 AREDV & 40 gestational age matched controls delivered < 30 weeks • Identical rate of cerebral palsy in cases and controls (14 vs 11%)
UA Doppler & early onset FGR
Padilla et al., Acta Paediatr 2010 • AREDV & gestational age matched controls delivered at 30 weeks • Identical 1 year testing in cases and controls
• FGR had smaller HC & trend to lower PDI • Birthweight & gestational age correlated with motor development index
• HC & cephalization index correlated with psychomotor development
Shand et al., Austr N Z J Obstet Gynaecol 2009 • Early onset FGR (n=87) retrospectively stratified by UA EDV • Mild & moderate 2 year disability in 18% of AREDV vs 3% PEDV • Gestational age was main determinant of outcome
UA Doppler & early onset FGR
Morsing et al., Pediatrics 2011 • AREDV had lower verbal and global IQ compared to controls • Boys at greater risk for developmental delay
Vossbek et al., Eur J Pediatr 2000 • 40 AREDV & 40 gestational age matched controls delivered at 27 weeks • 16 completed Bayley or Kaufman ABC
AREDV Control P MDI Bayley 76 98 0.03 Delay/retardation 14 6 0.033 MPC Kaufman 57 89 0.03 Severe motor impairment 6 3 0.07
UA Doppler & Childhood development Wienerroither et al., Obstet Gynecol 2001 • 35 AREDV vs gestational age matched controls delivered 33 weeks • 6 year Kaufmann ABC – no single determinant identified
ResultsIn the 23 study group fetuses, 17 (74%) had absent andsix (26%) had reversed end-diastolic flow in the umbil-ical artery. The cesarean delivery rate was 91% in thestudy group compared with 52% in the control group(P ! .004). Birth weight was significantly lower in thestudy group according to the inclusion criteria. Perina-tal demographics were not significantly different, ex-cept for base deficit. Neonatal intensive care was signif-icantly longer in the study group, and there was atendency toward more days on ventilation (Table 1).
Results of the tests at preschool and school age foundsignificant deficits in the study group in all four subsetsof the Kaufman-Assessment Battery for Children (Fig-ures 1 and 2). The intelligence level of this group wasbelow average, whereas the control group had results
that corresponded to published average levels repre-senting 50% of the normal population. There were nostatistically significant differences between the twogroups on the Man-Drawing Test and the Child Behav-ior Checklist. The study group had significantly lowerresults in 20% of details (especially fine motor items) onthe Zurich Neuromotor Test. The rest of the test’ssubsets showed the same tendency. Similarly, neurope-diatric testing showed significant deficits in 22% ofsubsets in the study group (Table 2).
For the study group, correlations between the Kauf-man-Assessment Battery for Children variables andmother’s age, gestational age, placental weight, umbil-ical artery pH, and umbilical artery base deficit werecalculated. Furthermore, multiple regression modelswere checked for each of the four Kaufman-AssessmentBattery for Children variables separately and as amultivariable general linear model for the four compo-nents simultaneously. The only variable with predictivevalue was birth weight with respect to the Achievement
Figure 1. Intellectual outcomes according to mean values of thesubgroups. SEPS " Sequential Processing Scale; SIPS " SimultaneousProcessing Scale; MPC " Mental Processing Composite; AS "Achievement Scale of the Kaufman-Assessment Battery for Children;SD " standard deviation.
Figure 2. Comparison of matched pairs of children. Intellectual out-comes is the mean value of all subgroups of the Kaufman-AssessmentBattery for Children.
Table 1. Maternal and Fetal Demographics
Variable
Study group Control group
PMax Min Median Mean SD Max Min Median Mean SD
Maternal age (y) 39 17 26 26.1 5.4 38 21 31 29.5 4.7 NSGravidity 3 1 1 1.3 0.6 7 1 2 2.1 1.5 NSGestational age (wk) 40 28 33 34.1 3.5 40 28 33 34.3 3.3 NSBirthweight (g) 2270 600 1200 1258 482.9 3350 920 2120 2148 703.7 !.001Placenta weight (g) 730 110 260 296 148.6 1050 240 490 489 170.4 !.001Apgar score
1 min 9 1 5.5 2.3 9 2 7 2.1 NS5 min 10 5 7.9 1.5 10 7 8.8 0.9 NS10 min 10 6 8.7 1.1 10 7 9.5 0.8 .002
UA-pH 7.32 6.86 7.19 0.13 7.50 7.22 7.30 0.06 .001UA-BD (mval/L) 1.8 #18.1 #3.25 5.7 1.2 #8.1 #1.2 2.4 NSNeonatal hospitalization (days) 217 14 66.4 48.6 101 0 42.4 27.3 NSVentilation treatment (days) 59 0 7.4 12.8 21 0 5.4 7.6 NS
Max " maximum; Min " minimum; SD " standard deviation; NS " not significant; UA-pH " umbilical artery pH; UA-BD " umbilical arterybase deficit.
VOL. 97, NO. 3, MARCH 2001 Wienerroither et al Postnatal Long-Term Outcome 451
UA Doppler & Adolescent development Schreuder et al., Arch Dis Child 2002 • Cohort of 76 FGR adolescents stratified by UA EDV • Average GA at delivery 32 weeks • Intelligence, neurological, cognitive & school performance testing
• Poor performance with REDV persisted after correction for GA
( 1 4%) , a n d < 7 0 ( < −2 SD ) i n fi ve ( 7 %) . Th e r e wa s n o di f f e r -e n c e i n GCA b e t we e n t h e i n f a n t s t h a t h a d A R E D F V a n dF E D F V. Ho we ve r, me a n GCA wa s lo we r f o r t h e R E D F V g r o upwh e n c o mp a r e d t o t h e F E D F V g r o up a n d a ls o wh e n c o mp a r e dw i t h t h e A E D F V g r o up ( t a b le 3 ) . O n t h e c lus t e r o f vi s uo s p a t i a lo r p i c t o r i a l a b i li t y , t h o s e w i t h R E D F V s c o r e d wo r s e t h a n t h o s ew i t h F E D F V a n d wo r s e t h a n t h o s e w i t h A E D F V ( t a b le 3 ) .
Neurological screeningIn t h e wh o le g r o up , we f o un d a me a n t o t a l r i s k s c o r e o n Q N S To f 2 3 . 5. Th e r e wa s n o di f f e r e n c e i n me a n t o t a l r i s k s c o r eb e t we e n t h e g r o up w i t h A R E D F V a n d t h e g r o up w i t h f o r wa r dfl o w. Ho we ve r, t h e s ub g r o up w i t h R E D F V h a d s i g n i fi c a n t lywo r s e me a n s c o r e s t h a n F E D F V o r A E D F V s ub g r o up s ( t a b le4) .
A s t h e c h i ldr e n i n t h e R E D F V g r o up we r e a s s e s s e d a t a s i g -n i fi c a n t ly y o un g e r a g e t h a n t h e F E D F V c h i ldr e n , t h e Q N S Ts c o r e s we r e a djus t e d f o r a g e a t a s s e s s me n t .
A f t e r a djus t me n t , t h e me a n Q N S Ts c o r e f o r t h e R E D F Vg r o up wa s 3 0 . 3 . Th i s wa s s i g n i fi c a n t ly h i g h e r t h a n t h e me a ns c o r e f o r t h e F E D F V g r o up , wh i c h wa s 2 1 . 9 . Th e di f f e r e n c eb e t we e n me a n s c o r e s f o r t h e R E D F V a n d t h e F E D F V wa s 8 . 4( p = 0 . 0 3 3 ) .
VisionF o r t y t h r e e p e r c e n t o f i n f a n t s ( 3 2 /7 4) h a d o n e o r mo r e vi s ua la b n o r ma li t i e s . F i f t e e n o f t h e s e ( 47 %) h a d m i n o r a c ui t y p r o b -le ms , 1 5 ( 47 %) h a d s e ve r e a c ui t y p r o b le ms , a n d t wo h a d n ode p t h p e r c e p t i o n w i t h n o r ma l a c ui t y . Th e r e wa s n o s i g n i fi c a n tdi f f e r e n c e b e t we e n t h e A R E D F V a n d F E D F V g r o up s w i t hr e s p e c t t o t h e p r o p o r t i o n o f c h i ldr e n w i t h a n y vi s ua la b n o r ma li t y ( 42 % ( 1 5/3 6) ve r s us 45% ( 1 7 /3 8 ) ) , o r i n t h e p r o -p o r t i o n t h a t wo r e g la s s e s /le n s e s ( 1 7 % ( 6/3 6) ve r s us 1 8 %( 7 /3 8 ) ) . Th e r e we r e mo r e c h i ldr e n w i t h s e ve r e a c ui t y lo s s i nt h e R E D F V g r o up ( 5/9 , 56%) t h a n i n t h e A E D F V g r o up ( 3 /2 7 ,1 1 %; p = 0 . 0 1 4) o r t h e F E D F V g r o up ( 7 /3 7 , 1 9 %; p = 0 . 0 47 ) .
HearingD a t a o n h e a r i n g t h r e s h o ld we r e o n ly a va i la b le f o r 48 c h i ldr e n .M e a n h e a r i n g t h r e s h o ld wa s a lmo s t i de n t i c a l, b e t we e n 1 7 a n d1 8 de c i b e ls , f o r a ll g r o up s . Th e r e we r e t h r e e c h i ldr e n ( 6%) w i t ha s i g n i fi c a n t h e a r i n g lo s s , 0 /6 i n t h e R E D F V g r o up , 1 /1 6 i n t h eA E D F V g r o up , a n d 2 /2 6 i n t h e F E D F V g r o up .
GrowthO f t h e t o t a l g r o up , 63 % h a d a h e i g h t b e lo w t h e 50 t h c e n t i lea n d 1 9 % h a d a h e i g h t le s s t h a n t h e 1 0 t h c e n t i le a c c o un t i n g f o r
Table 3 Results of mental development testing using the British Ability Scales (BAS-II)
Umbilical artery EDFV pattern
Forward
(n=39)
Absent
(n=27)
Reversed
(n=9)
General conceptual abilityMean score 101 101.1 87.7*(95% CI of mean) (97–105) (95–107) (71–105)
Distribution of GCA scores<70 2 1 270–84 2 3 185–115 31 18 6115+ 4 5
Verbal abilityMean score 102.5 103.8 90.2(95% CI of mean) (98–107) (97–111) (70–111)
Non-verbal reasoningMean score 104.4 104.2 92.6(95% CI of mean) (99–110) (97–111) (75–110)
Spatial/pictorial abilityMean score 96.3 96.2 80.7†(95% CI of mean) (91–102) (90–102) (64–97)
*p=0.049, reversed versus forward; p=0.048, reversed versus absent.†p=0.023, reversed versus forward; p=0.025, reversed versus absent.
Table 4 Findings on Quick Neurological Screening Test (QNST-II )
Umbilical artery EDFV pattern
Forward
(n=39)
Absent
(n=27)
Reversed
(n=9)
QNST raw total risk scoreMean 21.5 23.2 32.8*(95% CI of mean) (18.1–24.9) (18.3–28.1) (24.9–40.6)
QNST moderate or severe discrepancy; score>25
No. 17 12 7(%) (44) (44) (78)
QNST total risk score after correction for age atassessment
Mean 21.9 23.4 30.3(95% CI of mean) (18.7–25.2) (19.5–27.3) (23.4–37.2)
*p=0.006, reversed versus forward; p=0.045, reversed versus absent.
Absent or reversed end diastolic flow velocity in the umbilical artery F111
www.archdischild.com
group.bmj.com on December 4, 2013 - Published by fn.bmj.comDownloaded from
m i d-p a r e n t a l h e i g h t . 2 5 Th e r e we r e n o di f f e r e n c e s b e t we e n t h ef o r wa r d, a b s e n t , o r r e ve r s e d E D F V g r o up s i n t h e p r o p o r t i o n o fc h i ldr e n w i t h we i g h t , h e i g h t , h e i g h t c o r r e c t e d f o r m i d-p a r e n t a l h e i g h t ,2 5 o r m i d up p e r a r m c i r c u mf e r e n c e 2 6 b e lo w t h e1 0 t h c e n t i le f o r a g e a n d s e x.
O f t h e 1 0 c h i ldr e n wh o h a d a h e a d c i r c u mf e r e n c e b e lo w t h e1 0 t h c e n t i le f o r a g e a n d s e x , e i g h t ( 2 4%) we r e i n t h e g r o upw i t h A R E D F V a n d t wo ( 5%) i n t h e f o r wa r d fl o w g r o up( p = 0 . 0 41 ) .
Blood pressureB lo o d p r e s s ur e ( B P ) wa s w i t h i n n o r ma l li m i t s f o r a g e i n a llc h i ldr e n t h a t we r e a s s e s s e d. 2 9 M e a n s y s t o li c B P wa s 9 9 m m Hg( r a n g e 9 3 –1 0 5) a n d me a n di a s t o li c B P wa s 54 m m Hg ( r a n g e49 –62 ) . Th e r e we r e n o s i g n i fi c a n t di f f e r e n c e s i n B P b e t we e ns ub g r o up s .
BehaviourQ ue s t i o n n a i r e s we r e r e t ur n e d b y 66/7 6 p a r e n t s a n d 55/7 4t e a c h e r s . Th e p a r e n t s o f t wo c h i ldr e n di d n o t a g r e e t o us c o n -t a c t i n g t h e s c h o o l. F o r t h e wh o le g r o up , t h e me a n s o f t h e t o t a lb e h a vi o ur a l de vi a n c e s c o r e s r a t e d b y p a r e n t s a n d t e a c h e r swe r e 1 1 . 6 a n d 8 . 7 r e s p e c t i ve ly . O ve r a ll, 1 4 o f 66 c h i ldr e n ( 2 1 %)h a d a n a b n o r ma lly h i g h t o t a l b e h a vi o ur a l de vi a n c e s c o r e a sr a t e d b y p a r e n t s , a n d n i n e o f 55 ( 1 6%) a s r a t e d b y t e a c h e r s( t a b le 5) . Th e g r o up w i t h R E D F V s c o r e d h i g h e r o n t h es ub s c a le s i n di c a t i n g h y p e r a c t i vi t y ( me di a n 5. 5 ( r a n g e 4. 4–8 . 3 )ve r s us 3 . 0 ( 1 . 0 –5. 0 ) , p = 0 . 0 1 5) a n d p e e r p r o b le ms ( me di a n4. 5 ( 2 . 2 –6. 0 ) ve r s us 2 . 0 ( 1 . 4–2 . 8 ) , p = 0 . 0 2 8 ) wh e n c o mp a r e dw i t h t h e g r o up w i t h f o r wa r d fl o w.
EducationIn t o t a l, 2 0 /55 c h i ldr e n ( 3 6%) r e qui r e d a ddi t i o n a l e duc a t i o n a lh e lp o r we r e i n a c la s s lo we r t h a n e xp e c t e d f o r t h e i r a g e . F i f -t e e n c h i ldr e n we r e r e c e i vi n g n o n -t e a c h i n g h e lp ( t h r e e i n t h eR E D F V, fi ve i n t h e A E D F V, a n d s e ve n i n t h e F E D F V g r o up s ) .O n e c h i ld i n t h e F E D F V a n d o n e i n t h e R E D F V g r o up we r e i na c la s s lo we r t h a n a p p r o p r i a t e f o r t h e i r a g e . Th r e e c h i ldr e nwe r e i n ma i n s t r e a m e duc a t i o n b ut h a d r e qui r e d s t a t e me n t s o fs p e c i a l e duc a t i o n a l n e e ds , t wo we r e i n t h e g r o up w i t h R E D F V,a n d o n e wa s i n t h e g r o up w i t h A E D F V. F o ur we r e n o t i nma i n s t r e a m e duc a t i o n ( o n e i n t h e R E D F V a n d t h r e e i n t h eA E D F V g r o up s ) . So me c h i ldr e n r e c e i ve a c o mb i n a t i o n o fdi f f e r e n t t y p e s o f e xt r a h e lp .
Ta b le 6 s h o ws t h a t 2 6/55 ( 47 %) o f t h e wh o le g r o up s c o r e d“p o o r ly o r ve r y p o o r ly ” o n t wo o r mo r e s ub je c t s a c c o r di n g t ot h e i r t e a c h e r s . P o o r o r ve r y p o o r p e r f o r ma n c e wa s r e p o r t e d i n2 2 % f o r s p e a k i n g /li s t e n i n g , 3 5% f o r wr i t i n g ( c o mp o s i t i o n ) ,2 7 % f o r wr i t i n g ( fi n e mo t o r s k i lls ) , 3 1 % f o r a r i t h me t i c /ma t h e ma t i c s , 2 2 % f o r r e a di n g , a n d 2 5% f o r P E /g a me s . We di dn o t fi n d s i g n i fi c a n t di f f e r e n c e s b e t we e n R E D F V, A E D F V, a n dF E D F V g r o up s w i t h r e s p e c t t o t h e me a n o f t h e t e a c h e r s ’r a t i n g s o n a n y o f t h e s e s c a le s .
Perinatal risk factorsIn t h i s s e le c t e d h i g h r i s k p o p ula t i o n we di d n o t fi n d a s t a t i s t i -c a lly s i g n i fi c a n t di f f e r e n c e i n me a n B A S s c o r e n o r i n t o t a lQ N S Ts c o r e b e t we e n t h e c h i ldr e n b o r n b e lo w t h e 3 r d c e n t i lef o r b i r t h we i g h t o r t h o s e b o r n b e t we e n t h e 3 r d a n d 1 0 t h c e n -t i le , o r t h o s e wh o h a d a b i r t h we i g h t a p p r o p r i a t e f o rg e s t a t i o n a l a g e . Th e R E D F V g r o up h a d s i g n i fi c a n t ly lo we r
Table 5 Behaviour from parent and from teacher completed questionnaires(Strengths and Difficulties Questionnaire)
SDQ
Umbilical artery EDFV pattern*
Forward
(n=36)
Absent
(n=22)
Reversed
(n=8)
Parent’s total scoreMean 10.5 11.8 15.4(95% CI) (7.9–13.6) (9.2–14.4) (10.7–20.6)
Parent’s total score; high >17No. 5 5 4(%) (14) (23) (50)
Forward
(n=28)
Absent
(n=19)
Reversed
(n=8)
Teacher’s total scoreMean 9.5 6† 12.6(95% CI) (6.9–12.1) (3.8–8.1) (5.4–19.9)
Teacher’s total score; high >16No. 5 0 4‡(%) (18) (50)
*A total of 66 questionnaires were returned by parents and 55 by teachers.†p=0.035, absent versus forward; ‡p=0.008, reversed versus absent.
Table 6 School performance as reported by teachers: number (%)
School performance*
Umbilical artery EDFV pattern
Forward
(n=28)
Absent
(n=19)
Reversed
(n=8)
All six subjects average or above 14 (50) 8 (42) 3 (38)Below average in two or more subjects 14 (50) 7 (37) 5 (62)Any extra educational provision 8 (29) 8 (42) 4 (50)Not in mainstream education 3 (16) 1 (13)
A total of 55 questionnaires returned by teachers.*Subjects may appear in one or more columns.
F112 Schreuder, McDonnell, Gaffney, et al
www.archdischild.com
group.bmj.com on December 4, 2013 - Published by fn.bmj.comDownloaded from
( 1 4%) , a n d < 7 0 ( < −2 SD ) i n fi ve ( 7 %) . Th e r e wa s n o di f f e r -e n c e i n GCA b e t we e n t h e i n f a n t s t h a t h a d A R E D F V a n dF E D F V. Ho we ve r, me a n GCA wa s lo we r f o r t h e R E D F V g r o upwh e n c o mp a r e d t o t h e F E D F V g r o up a n d a ls o wh e n c o mp a r e dw i t h t h e A E D F V g r o up ( t a b le 3 ) . O n t h e c lus t e r o f vi s uo s p a t i a lo r p i c t o r i a l a b i li t y , t h o s e w i t h R E D F V s c o r e d wo r s e t h a n t h o s ew i t h F E D F V a n d wo r s e t h a n t h o s e w i t h A E D F V ( t a b le 3 ) .
Neurological screeningIn t h e wh o le g r o up , we f o un d a me a n t o t a l r i s k s c o r e o n Q N S To f 2 3 . 5. Th e r e wa s n o di f f e r e n c e i n me a n t o t a l r i s k s c o r eb e t we e n t h e g r o up w i t h A R E D F V a n d t h e g r o up w i t h f o r wa r dfl o w. Ho we ve r, t h e s ub g r o up w i t h R E D F V h a d s i g n i fi c a n t lywo r s e me a n s c o r e s t h a n F E D F V o r A E D F V s ub g r o up s ( t a b le4) .
A s t h e c h i ldr e n i n t h e R E D F V g r o up we r e a s s e s s e d a t a s i g -n i fi c a n t ly y o un g e r a g e t h a n t h e F E D F V c h i ldr e n , t h e Q N S Ts c o r e s we r e a djus t e d f o r a g e a t a s s e s s me n t .
A f t e r a djus t me n t , t h e me a n Q N S Ts c o r e f o r t h e R E D F Vg r o up wa s 3 0 . 3 . Th i s wa s s i g n i fi c a n t ly h i g h e r t h a n t h e me a ns c o r e f o r t h e F E D F V g r o up , wh i c h wa s 2 1 . 9 . Th e di f f e r e n c eb e t we e n me a n s c o r e s f o r t h e R E D F V a n d t h e F E D F V wa s 8 . 4( p = 0 . 0 3 3 ) .
VisionF o r t y t h r e e p e r c e n t o f i n f a n t s ( 3 2 /7 4) h a d o n e o r mo r e vi s ua la b n o r ma li t i e s . F i f t e e n o f t h e s e ( 47 %) h a d m i n o r a c ui t y p r o b -le ms , 1 5 ( 47 %) h a d s e ve r e a c ui t y p r o b le ms , a n d t wo h a d n ode p t h p e r c e p t i o n w i t h n o r ma l a c ui t y . Th e r e wa s n o s i g n i fi c a n tdi f f e r e n c e b e t we e n t h e A R E D F V a n d F E D F V g r o up s w i t hr e s p e c t t o t h e p r o p o r t i o n o f c h i ldr e n w i t h a n y vi s ua la b n o r ma li t y ( 42 % ( 1 5/3 6) ve r s us 45% ( 1 7 /3 8 ) ) , o r i n t h e p r o -p o r t i o n t h a t wo r e g la s s e s /le n s e s ( 1 7 % ( 6/3 6) ve r s us 1 8 %( 7 /3 8 ) ) . Th e r e we r e mo r e c h i ldr e n w i t h s e ve r e a c ui t y lo s s i nt h e R E D F V g r o up ( 5/9 , 56%) t h a n i n t h e A E D F V g r o up ( 3 /2 7 ,1 1 %; p = 0 . 0 1 4) o r t h e F E D F V g r o up ( 7 /3 7 , 1 9 %; p = 0 . 0 47 ) .
HearingD a t a o n h e a r i n g t h r e s h o ld we r e o n ly a va i la b le f o r 48 c h i ldr e n .M e a n h e a r i n g t h r e s h o ld wa s a lmo s t i de n t i c a l, b e t we e n 1 7 a n d1 8 de c i b e ls , f o r a ll g r o up s . Th e r e we r e t h r e e c h i ldr e n ( 6%) w i t ha s i g n i fi c a n t h e a r i n g lo s s , 0 /6 i n t h e R E D F V g r o up , 1 /1 6 i n t h eA E D F V g r o up , a n d 2 /2 6 i n t h e F E D F V g r o up .
GrowthO f t h e t o t a l g r o up , 63 % h a d a h e i g h t b e lo w t h e 50 t h c e n t i lea n d 1 9 % h a d a h e i g h t le s s t h a n t h e 1 0 t h c e n t i le a c c o un t i n g f o r
Table 3 Results of mental development testing using the British Ability Scales (BAS-II)
Umbilical artery EDFV pattern
Forward
(n=39)
Absent
(n=27)
Reversed
(n=9)
General conceptual abilityMean score 101 101.1 87.7*(95% CI of mean) (97–105) (95–107) (71–105)
Distribution of GCA scores<70 2 1 270–84 2 3 185–115 31 18 6115+ 4 5
Verbal abilityMean score 102.5 103.8 90.2(95% CI of mean) (98–107) (97–111) (70–111)
Non-verbal reasoningMean score 104.4 104.2 92.6(95% CI of mean) (99–110) (97–111) (75–110)
Spatial/pictorial abilityMean score 96.3 96.2 80.7†(95% CI of mean) (91–102) (90–102) (64–97)
*p=0.049, reversed versus forward; p=0.048, reversed versus absent.†p=0.023, reversed versus forward; p=0.025, reversed versus absent.
Table 4 Findings on Quick Neurological Screening Test (QNST-II )
Umbilical artery EDFV pattern
Forward
(n=39)
Absent
(n=27)
Reversed
(n=9)
QNST raw total risk scoreMean 21.5 23.2 32.8*(95% CI of mean) (18.1–24.9) (18.3–28.1) (24.9–40.6)
QNST moderate or severe discrepancy; score>25
No. 17 12 7(%) (44) (44) (78)
QNST total risk score after correction for age atassessment
Mean 21.9 23.4 30.3(95% CI of mean) (18.7–25.2) (19.5–27.3) (23.4–37.2)
*p=0.006, reversed versus forward; p=0.045, reversed versus absent.
Absent or reversed end diastolic flow velocity in the umbilical artery F111
www.archdischild.com
group.bmj.com on December 4, 2013 - Published by fn.bmj.comDownloaded from

7 7
McCowan et al., Am J Obstet Gynecol 2002 • 220 SGA infants with 2 year Bayley, stratified by UA Doppler
• Average gestational age at delivery 36 weeks • MDI of 96 lower than reference population, 20% abnormal MDI, 14%
abnormal PDI • Delivery for maternal hypertension protected motor development • PDI related to HC, NICU stay and breastfeeding
UA Doppler & late onset FGR
Figueras et al., EJOG 2008, Pediatrics 2009 • Term SGA with normal UA Doppler
• Abnormal NBAS for attention, habituation, social and state regulation. • Term SGA with normal UA Doppler matched with AGA
• 2 year ASQ – lower scores for problem solving and social domains. • Abnormalities relate to frontal lobe function
Conclusion – UA Doppler
■ In early onset FGR Gestational age overrides effects of UA Doppler until early third trimester Compared to PEDV – AREDV have worse motor development at age 2 Childhood intelligence, psychomotor, speech development worse with AREDV In adolescence and worst intelligence, and motor development with REDV
■ In late onset FGR Even with normal UA Doppler neonatal state organization is abnormal Among SGA psychomotor development primarily related to HC
Compared to AGA controls worse frontal lobe function with abnormal UA
Cerebral Doppler & neurodevelopment
Early onset FGR Kutchera et al., EJOBG 2002 • 16 ARED matched with abnormal CPR & Controls delivered at 32 weeks • 3-6 year Kaufman ABC
ARED & abnormal CPR are associated with similar degree of impaired neurodevelopment
Del < 33 wks)
<0.005 SGA 7% 30% At birth
VEP 148 ms 122 ms <0.05 6-12 months
Scherjon et al., 1996, 1998, 2000, 2010 117 singleton monitored pregnancies
abnormal CPR normal CPR
<0.005 Steroids 1 % 98%
IVH 4% 1% <0.05 Abnormal Hempel score 8% 0% <0.05
HC 50 cm 48 cm <0.05 3 years
IQ 96 87 <0.02
IQ < 85 20% 54% 0.003 5 years
TRF 20 21.4 CBCL 22.8 23.3
11 years
Late onset FGR Oros et al., UOG 2010, Cruz-Martinez et al., AJOG 2009 • Term FGR with MCA and ACA Doppler and NBAS (28 days of life)
• MCA brain sparing : abnormal motor function & state organization • ACA brain sparing : poor state organization • Decreased frontal lobe flow : abnormal social interactive, state organization
and attention scores
Roza et al., Am J Epidemiol 2008 • 935 term FGR with ACA & MCA Doppler with CBCL at age 18 months
• MCA PI change : somatic complaint scores • ACA PI change : emotional reactive, attention and somatic complaint scores
Eixarch et al., UOG 2008 • 128 term FGR & AGA controls stratified by MCA Doppler – ASQ at 2 years
• Brain sparing : 53-57% communication delay : 39-47% abnormal problem solving

8 8
Conclusions – Cerebral Doppler
■ In early onset FGR Studies stratifying appropriately by MCA Doppler are lacking
■ In late onset FGR Abnormal MCA Doppler is associated with worse neurodevelopment Regional alterations in brain blood flow impedance have differential effects
Aorta, Isthmus & neurodevelopment
Ley, 1996, Tideman 2006 FGR & GA matched controls
abnormal DAO -BFC
Normal DAO - BFC
7 years
18 years
Normal 53% 29%
MND -1 33% 36%
MND -2 13.3% 36%
Determined by degree of FGR HC BFC (III)
Verbal IQ 103 95
Verbal IQ <85 9.5% 18.9%
Global IQ 102 96
Global IQ <85 8.8% 22%
Determined by BFC (III) & SE status
WAIS Performance 108 98
WAIS Total 104 96
School grade 2.5 3.1
• 44 FGR delivered at 33 weeks gestation – Griffiths DQ & neurologic exam • Net antegrade flow : 49% suboptimal development • Net retrograde : 100% suboptimal development
• Isthmic flow index <0.7 predicts suboptimal development with 55% sensitivity & 85% specificity
• Prediction independent of UA Doppler
• 85 FGR delivered at 32 weeks gestation – 2 year Bayley • AREDV, abnl CPR & abnormal aorta associated with cognitive delay • Isthmus blood flow non-contributory • Main determinant of cognitive outcome was cerebral volume
• Declining cardiac output & abnormal venous Doppler main factors. • Isthmus non-contributory
Venous Doppler, BPS & development

9 9
Neurosensory delay (52%)
● UA REDV ● Birthweight ● Gestational age
r2 = 0.31, p=0.006
Global delay (23.6%)
Cerebral palsy (8.3%) ● Gestational age ● Birthweight ● neonatal morbidity ● UA REDV
r2 = 0.52, p<0.0001
● Birthweight r2 = 0.54, p<0.0001
<27 SSW.
92 % Sensitivity 82 % Specificity AUC = 0.903 P=0.001
<640 gr. 85 % Sensitivity 83 % Specificity AUC = 0.866 P=0.003
Baschat 2010
Conclusion – Central hemodynamics
■ Even when central hemodynamics are considered Head size, overall growth delay
Gestational age at delivery
Placental Doppler parameters
Are primary determinants of neurodevelopment
■ Fetal deterioration and abnormal venous Doppler parameters play a small contributory role
Management & neurodevelopment
GRIT Studies, 2003, 2004, 2010
Lancet 2004 “2 year Follow-up: Griffith DQ, CP, Mortality”
547 singleton / Twins - 24-36 GA
Unsure about delivery timing
Immediate delivery
Deliver when no longer in doubt
<0.05 C-section 91% 76% BJOG 2003
+4.9 days (*6.9 > 31 SSW)
FDIU 2 9 <0.05 neonatal Death 27 18 0.06 Perinatal Mortality 29 27 n.s.
AJOG 2010 “6-13 year Follow-up: Kaufmann ABC, Cognitive Outcome”
Identical Long-term outcomes
8 17 Prematurity-related <0.05 <30 weeks
Cerebral palsy 0 8 <0.01 5 14 Dev. delay <0.05
<30 weeks
Summary
■ Germinal matrix / IVH Primary effects are motor Primarily related to prematurity Apparent by 2 years
■ Regional perfusion State organization Mental processing Apparent at 2 years
■ Global impact of growth delay Cognition Speech / communication Apparent in childhood

10 10
Conclusions
■ Fetal neurodevelopment is abnormal when FGR is clinically apparent
■ Lagging head growth is the physical characteristic with the greatest impact on neurodevelopment
■ Gestational age overrides effects of UA Doppler until early third trimester
■ Independent contribution of MCA Doppler is more apparent in the vulnerable term brain
■ Abnormalities in central hemodynamics appear to play a small contributory role.
■ Motor delay is related to prematurity. Cognitive delay becomes apparent later and is more related to fetal status