Embed Size (px)
Citation preview
Active Filters
This is not in the lab manual
• While the circuit that will be used is very similar to the one described in the lab manual, the steps in the lab procedure are significantly different.– Please follow the laboratory procedure posted in
the Week 9 module.

Passive Bandpass Filter
• Cascading a RC (or RL) low pass filter with a RC (or RL) high pass filter
• LC filter

Active Bandpass Filter
• While an active bandpass filter can be constructed by cascading an active low pass filter with an active high pass filter, there are designs that use only one op amp.
Active vs. Passive Filters
• The maximum magnitude of the voltage transfer function of a passive filter is at best equal to 1.– Parasitic resistances and capacitances in RL can make
this value considerably lower.
• Active filters incorporate amplifiers with the filter elements so that the filter has gain.– Maximum of the voltage transfer function can be
greater than 1.– fo limited by frequency of the operational amplifier

The transfer function for the active bandpass filter is
where
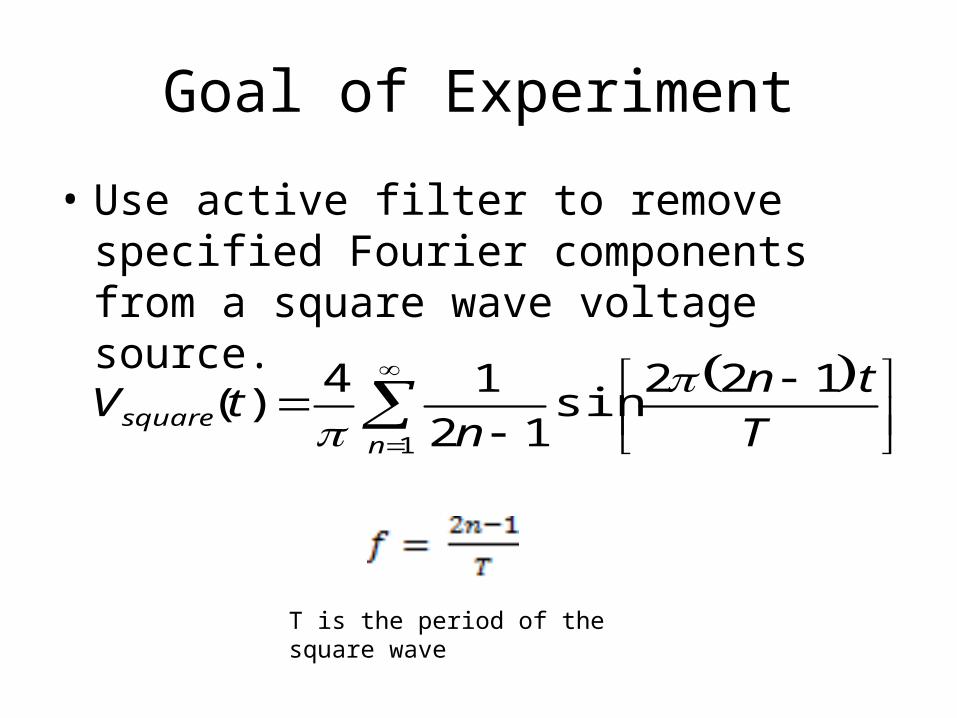
Goal of Experiment
• Use active filter to remove specified Fourier components from a square wave voltage source.
1
122sin
12
14)(
nsquare T
tn
ntV
T is the period of the square wave

Summation of Fourier Components

Bandwidth
• The difference between the frequencies (in Hz) where the power is ½ of the maximum output power– Maximum power to output occurs at fo

Order of the Filter
• The magnitude of a voltage transfer function of filter will decreases at a rate of -20dB per decade times n, where n is the order of the filter.

PSpice
• There is a DB macro or you can put in an equation into the Trace Expression to calculate -20 log (Vo/Vin)

MATLAB
• Note that you need to specify the frequency range for the bode plot.– The default is radians/s for the bode plot– Help on bode plots explains how to define the
frequency range over which the plot is performed.
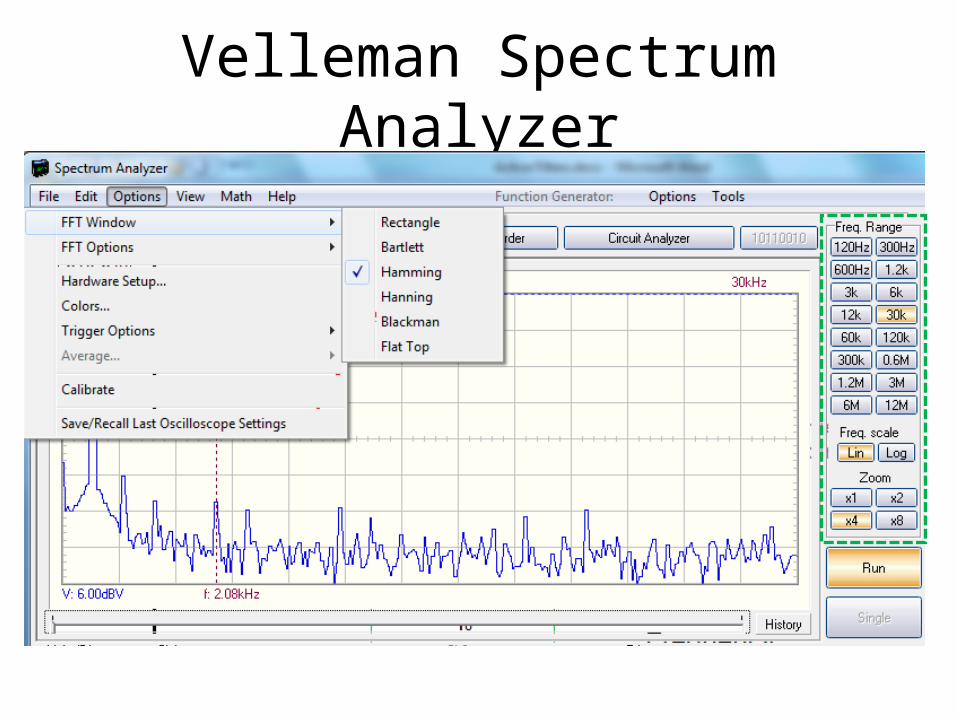
Velleman Spectrum Analyzer
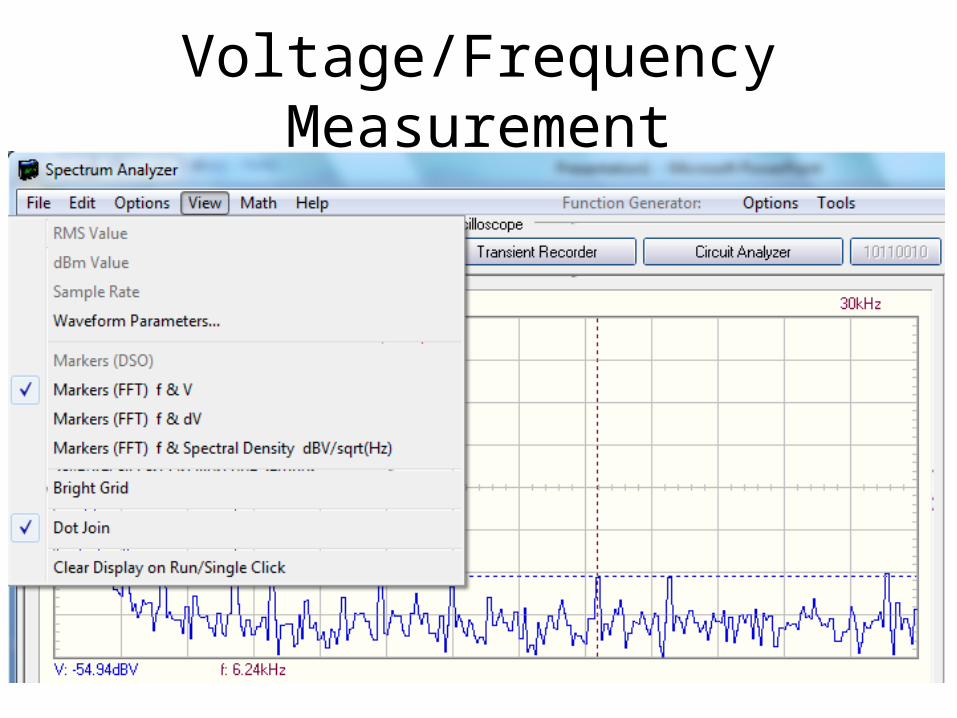
Voltage/Frequency Measurement