Embed Size (px)
Citation preview
1
Author version: J. Geophys. Res. (B: Solid Earth), vol.118; 2013; 4648-4668
Active Faulting on the Ninetyeast Ridge and its Relation to Deformation of the Indo-Australian Plate
W. W. Sager1,2, J. M. Bull3, and K. S. Krishna4
1Department of Oceanography, Texas A&M University, College Station, TX, 77843 USA, [email protected]
2Now at Department of Earth and Atmospheric Sciences, University of Houston, Houston, TX 77240, [email protected]
3School of Ocean and Earth Science, National Oceanography Centre Southampton, University of Southampton, Southampton SO14 3ZH, UK , [email protected]
4CSIR - National Institute of Oceanography, Dona Paula, Goa 403004, India, [email protected]
Abstract
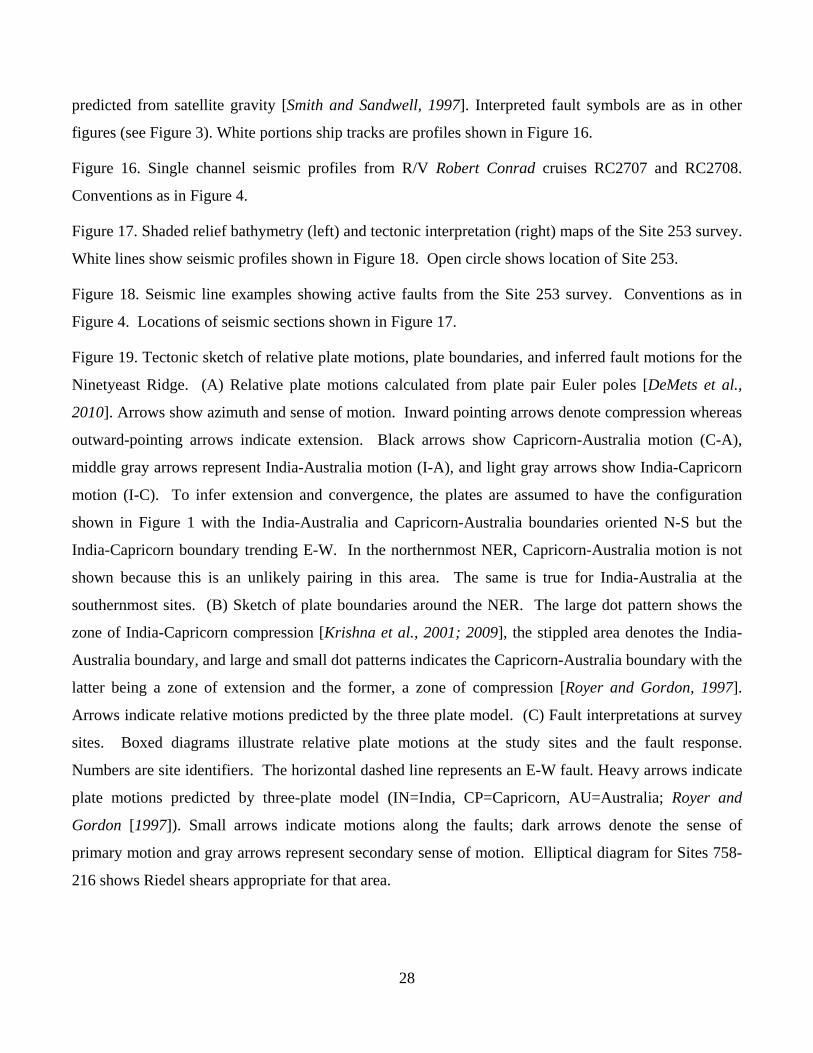
The ~4500 km-long Ninetyeast Ridge (NER) in the northeastern Indian Ocean crosses a broad zone of deformation where the Indo-Australian plate is fracturing into three smaller plates (India, Capricorn, Australia) separated by diffuse boundaries whose extents are poorly defined. New multichannel seismic reflection profiles image active faults along the entire length of the NER and show spatial changes in the style of deformation along the ridge. The northern NER (0-5°N) displays transpressional motion along WNW-ESE faults. Observed fault patterns confirm strike-slip motion at the western extent of the April 2012 Wharton Basin earthquake swarm. In the central NER (5-8°S), deformation on WNW-ESE-trending thrust faults implies nearly N-S compression. An abrupt change in fault style occurs between 8° and 11°S, with modest, extension characterizing the southern NER (11-27°S). Although extension is dominant, narrow zones of faults with strike-slip or compressional character also occur in the southern NER, suggesting a complex combination of fault motions. At all sites, active faulting is controlled by the reactivation of original, spreading-center formed, normal faults, implying that deformation is opportunistic and focused along existing zones of weakness, even when original fault trend is oblique to the direction of relative plate motion. Observed faulting can be interpreted as India-Australia deformation in the northern NER and Capricorn-Australia deformation in the southern NER. The India-Capricorn boundary is directly adjacent to the northern NER and this juxtaposition combined with a different style of faulting to the east of the NER imply that the ridge is a tectonic boundary.
2
1. Introduction
The vast Indo-Australian plate in the central Indian Ocean is breaking into three smaller pieces
separated by diffuse boundaries (Fig. 1) [Royer and Gordon, 1997]. Although this location is perhaps
the best-documented distributed deformation within an oceanic plate [Gordon, 2000], many details are
lacking owing to the large extent and remote location of the affected area. Compressional faults and
folds occur in the Central Indian Basin south of India and west of the Ninetyeast Ridge (NER) [Weissel
et al., 1980; Petroy and Wiens, 1989; Bull and Scrutton, 1992; Krishna et al., 2001; Delescluse and
Chamot Rooke, 2007]. In contrast, deformation is mainly by strike-slip faulting in the Wharton Basin to
the east of the NER [Petroy and Wiens, 1989; Stein et al., 1989; Deplus et al., 1998; Deplus, 2001]. In
the middle of this deformed zone, the NER is a long (~4500 km) volcanic ridge that displays active
seismicity in some locations, but the nature of deformation is unclear because geophysical data are
sparse in the region. If the NER is only a passive weal on the oceanic lithosphere, it may simply
respond to broad-scale tectonic forces with little change to the pattern of faulting extending from
adjacent basins. Alternatively, it has been suggested that the NER is a mechanical boundary owing to the
apparent change in deformation across it [e.g., Delescluse and Chamot-Rooke, 2007], so faulting may be
complex. We examined new multichannel seismic reflection profiles and multibeam bathymetry data
from the NER to understand its role in the fracturing of the Indo-Australian plate. We find evidence of
active faulting of variable style along its entire length. In this report, we document this faulting and
explore implications for the location and style of diffuse plate boundaries.
1.1 Tectonic Development of the Indo-Australian Plate and Formation of the NER
The Indo-Australian plate is a Cenozoic amalgamation of two pre-existing plates, India and
Australia. During the rifting of Gondwana, both plates formed on the north side of spreading ridges that
separated the northward-drifting continents from Antarctica [Norton and Sclater, 1979]. Because both
plates drifted almost exactly northward relative to Antarctica and have not rotated significantly, the
Indo-Australian plate contains many fracture zones trending approximately N-S with nearly E-W
trending magnetic anomalies in between. India and Australia continued as separate plates until the time
of anomaly 19 (~42 Ma [Cande and Kent, 1995]) when the Wharton Ridge (located east of the NER,
separating India and Australia) jumped southward to form the continuous Southeast Indian Ridge [Royer
et al., 1991; Krishna et al., 1995]. At that time, the India and Australia plates were combined.
3
The NER trends nearly N-S and stretches from 31°S at Broken Ridge to 10°N, where it
disappears beneath sediments of the Bengal Fan (Fig. 1). Magnetic lineation breaks and satellite
altimetry data show that the NER is nearly parallel to fracture zones formed at a paleo-spreading ridge
that once separated the India and Australia plates [Royer and Sandwell, 1989; Krishna et al., 1995;
2012]. Many different authors have explained the formation of the NER as a result of various tectonic
anomalies [see review by Royer et al., 1991], but the modern consensus is that it was created by hotspot
volcanism that emplaced a ridge on the northward drifting Indian plate from Late Cretaceous to early
Cenozoic time [Royer et al., 1991; Krishna et al., 2012]. The hotspot was often located near the
spreading ridge [Sager et al., 2010; Krishna et al., 2012] and changes in NER morphology may be
related to the proximity of the hotspot to the spreading ridge [Royer et al., 1991]. Because of its near-
ridge location, the hotspot emplaced material on both the Indian and Antarctic plates, with most of the
volcanic product ending up on the India plate owing to repeated southward ridge jumps [Krishna et al.,
2012]. Nevertheless, the hotspot volcanism produced a remarkably linear age progression that ranges
from 77 Ma at Ocean Drilling Program (ODP) Site 758, in the northern NER, to 43 Ma at Deep Sea
Drilling Project (DSDP) Site 254 in the southern NER [Krishna et al., 2012]. At ~42 Ma, the large-
scale reorganization of spreading centers that brought together the India and Australia plates also moved
the hotspot permanently beneath the Antarctic plate, ceasing the NER formation [Royer et al., 1991;
Krishna et al., 2012].
1.2 Diffuse Plate Boundaries in the Central Indian Ocean
Plate geometry, seafloor spreading data, and differences in crustal gravity lineations indicate that
the northern NER is the location of a diffuse triple junction [Royer and Gordon, 1997] (Fig. 1). Because
this triple junction implies that three wide plate boundaries come together, each with different stress
fields, different styles of deformation are expected along the NER as it traverses these boundary zones.
Euler poles describing relative plate motions occur within two of the diffuse boundaries and as a
result, the style of deformation changes along each of these boundaries from extension to compression
[Gordon, 2000]. The India-Capricorn Euler pole is located near the equator, close to the Chagos-
Laccadive Ridge (Fig. 1) [Royer and Gordon, 1997; DeMets et al., 2010], implying compression south
of India and extension between the Chagos-Laccadive Ridge and the Carlsberg Ridge. The Capricorn-
Australia pole is located at the southern end of the NER [Royer and Gordon, 1997; DeMets et al., 2010],
4
implying a zone of extension from the Southeast Indian Ridge (SEIR) to the southern NER and
compression farther north. In contrast, only compression is expected along the India-Australia
boundary, located southwest of the Java Trench, because the Euler pole describing that plate pair is
situated in the Central Indian Basin, ~1000 km away from that boundary [Royer and Gordon, 1997;
DeMets et al., 2010; Bull et al., 2010].
South of India, distributed deformation occurs within the India-Capricorn plate boundary and is
characterized by E-W thrust faults spaced 5-10 km apart and long wavelength (100-300 km) folds
[Weissel et al., 1980;Wiens et al., 1986; Bull and Scrutton, 1992]. The thrust faults result from nearly
N-S compression reactivating nearly E-W normal faults that were formed in the ocean crust by seafloor
spreading [Bull and Scrutton, 1992]. This deformation extends across a broad zone to the west side of
the NER (Fig. 1) and began 14-18 Myr ago [Krishna et al., 2009; Bull et al., 2010].
Earthquakes and seismic reflection profiles in the Wharton Basin imply that it is broken into narrow
slivers by reactivation of the nearly N-S trending fracture zones by left-lateral strike-slip motion
[Delescluse and Chamot Rooke, 2007; Deplus et al., 1998; Deplus, 2001]. The lateral extent of this
reactivation is unclear but has been observed in geophysical data near the equator [Deplus et al., 1998]
and in the form of strike-slip earthquakes along fracture zones in the wedge between the Java Trench
and the NER [Delescluse and Chamot Rooke, 2007; Satriano et al., 2012]. Although a few NE-SW
trending gravity lineations are observed in this region perpendicular to the convergent plate motion
direction [Petroy and Wiens, 1989; Stein et al., 1990], the trend of reactivated fracture zones is oblique
to the direction of compressive stress and presumably this mismatch between stress and fault direction is
a result of opportunistic fracturing along inherited zones of weakness caused by original crustal faults.
Few earthquakes occur along the southern NER and faulting is poorly documented in this region, so
deformation on the Capricorn-Australia boundary is unclear and the boundary may be as much as 2000
km in width [DeMets et al., 2010]. The nature of this boundary in the vicinity of the NER south of the
equator is simply not known.
1.3 Seismicity in the Vicinity of the NER
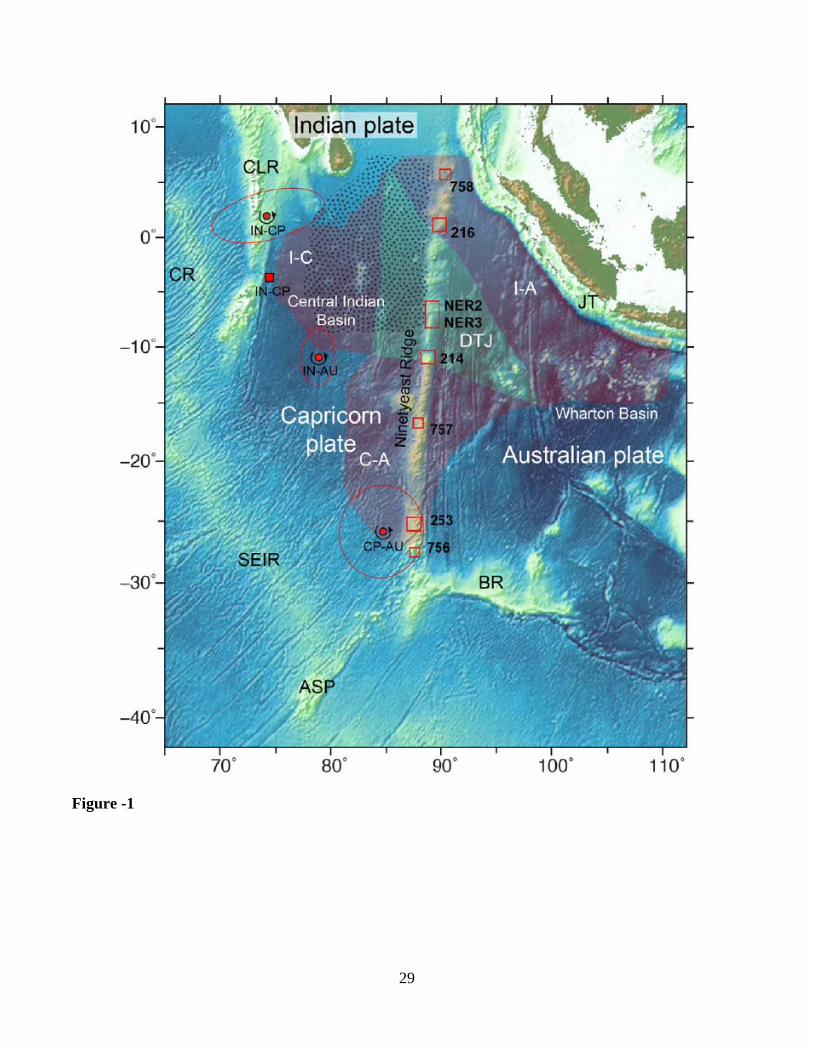
Earthquakes occur in a diffuse zone across the Central Indian Basin and Wharton Basin from ~35°S
to ~7°N (Fig. 2) [e.g., Delescluse and Chamot Rooke, 2007]. The greatest seismic activity occurs in a
5
band stretching NE-SW from the Java Trench, across the northern NER, into the Central Indian Basin
south of India. Near the Java Trench, events are mainly NE thrust faults related to subduction. In the
Central Indian Basin, near the equator, these events also display dominantly thrust focal mechanisms,
but oriented N-S with some strike-slip mechanisms mixed in (Fig. 2). This pattern is thought to result
from compression between the India and Capricorn plates, with thrusting taking place where original
normal faults in the oceanic crust are reactivated and strike-slip events occurring on N-S-trending
fracture zones [Petroy and Wiens, 1989; Bull and Scrutton, 1990; Delescluse et al., 2008].
South of ~5°S, earthquakes define a sparse NE-SW oriented band that includes the NER. As a
result, earthquakes in the Wharton Basin are observed to the north of ~17°S whereas those in the Central
Indian Basin are mainly south of ~18°S (Fig. 2). Strike-slip focal mechanisms with WNW-ESE/ENE-
WSW nodal planes dominate in the northern Wharton Basin [Petroy and Wiens, 1989; Royer and
Gordon, 1997]. They occur mostly in the wedge-shaped area from the northern NER to the Java Trench
and south to ~15°S and are thought to result mainly from Late Cretaceous and early Cenozoic fracture
zones that have been reactivated as left-lateral strike-slip faults [Deplus et al., 1998; Deplus, 2001;
Delescluse et al., 2012]. Some of these earthquakes have been remarkably strong for oceanic
earthquakes [e.g., Robinson et al., 2001], including a Mw 7.9 shock in 2000 and two recent tremors, Mw
8.6 and 8.2, that occurred on 11 April 2012 [Satriano et al., 2012; McGuire and Beroza, 2012; Meng et
al., 2012]. South of ~10°S, focal mechanisms indicate mostly strike-slip and thrust faults, with the
former having similar nodal planes to strike-slip mechanisms farther north and the latter showing NW-
SE convergence (Fig. 2). At about 10°S, a few thrust focal mechanisms are observed in the Wharton
Basin (Fig. 2) near a low SW-NE trending ridge that parallels gravity lineations. These mechanisms
may indicate thrust faulting along that feature. A small number of extensional focal mechanisms occur
to the southwest of the NER (mostly farther south than the extent of Figure 2), caused by divergence
south of the Capricorn-Australia Euler pole [Royer and Gordon, 1987].
Northern NER earthquakes display similar strike-slip mechanisms to nearby Wharton Basin
earthquakes and because the nearly N-S nodal plane is close to the trend of the NER, it was proposed
that ENE-WSW strike-slip faults occur along the NER [Stein and Okal, 1978]. The seismic energy
radiation pattern and aftershock distribution of the 2012 Wharton Basin events indicate that faulting in
the northern Wharton Basin and NER is more complex [Satriano et al., 2012; McGuire and Beroza;
2012; Delescluse et al., 2012; Meng et al, 2012]. Although the two main shocks of this cluster align
6
with the expected trend of original Wharton Basin fracture zones, it appears that the earthquake swarm
activated a lattice of WNW-ESE right lateral strike-slip faults [Meng et al., 2012]. The aftershocks
included the northern NER and imply nearly E-W strike-slip faults in that area [Meng et al., 2012].
1.4 Faulting on the NER
Given the diffuse deformation and seismicity in the area, faulting is expected on the NER. Most
published observations of NER faults are isolated examples that do not give a comprehensive picture
[Veevers, 1974; Naini and Eittreim, 1974; Curray and Munashinge, 1989; Shipboard Scientific Party,
1989a, 1989b]. Virtually all faults reported in prior publications appear to be normal, except for one
profile that apparently shows thrust faults on the east side of the southern NER near DSDP Site 214
[Pilipenko, 1996]. E-W trending normal faults have been reported along the length of the NER
[Pilipenko, 1996; Sager et al., 2010]. They often form rotated fault blocks and grabens and were
probably formed by tension near the spreading ridge during NER formation [Sager et al., 2010].
2. Data and Methods
High-resolution multibeam bathymetry data and 10-fold multichannel seismic (MCS) profiles
were collected over the NER during cruise KNOX06RR of the R/V Roger Revelle [Sager et al., 2007].
Multibeam data were acquired using a 12 kHz Kongsberg Simrad EM120 sonar system, which yielded
swaths of data 10-30 km in width, allowing detailed imaging of the seafloor at the survey sites.
More than 3700 km of MCS data were collected at six sites, four of which are coincident with
ODP or DSDP drill sites (Sites 214, 216, 253, and 758). The seismic system used a 48-channel
hydrophone array (streamer) and the source consisted of two generator-injector (GI) airguns with
generator volumes of 45 in3 (737 cm3) and injector volumes of 105 in3 (1720 cm3). Seismic data were
processed to CDP stack and time migration was produced assuming a single velocity of 1500 ms-1.
“Acoustic basement” was recognized as a strong (high acoustic impedance contrast), widespread
reflector beneath which seismic returns were absent, incoherent, or reflectors were intermittent.
Throughout much of the study area, acoustic basement was a sharp, well-defined horizon. At a few
locations, acoustic basement was absent or extended in depth (i.e., a thick package of reflections) with
an appearance similar to sediments in places, perhaps indicating the seismic waves did not reach the
7
igneous pile. In most cases the acoustic basement horizon likely represents the top of the igneous rock
beneath the sedimentary section. However, in places where the horizon is thick or has sedimentary
characteristics, basement may be volcaniclastic sediments, such as the thick section of volcanic ash
cored at DSDP Site 253 [Shipboard Scientific Party, 1974].
Faults were recognized by vertical offsets or discontinuities of sedimentary layers, monoclinal
folds, bowing or kinking of sedimentary layers, coherent diffractions cutting sediment horizons, narrow
troughs with sediment fill, and narrow grabens. Some faults show extensive deformation over an
extended area and are probably the result of fault zones with a number of smaller faults that cannot be
recognized individually. Active faults were recognized by the fact that they extend through the
sedimentary section from basement to the surface, either causing a seafloor offset or disturbance of
recent sediments.
Because of the wide spacing of survey sites, we searched for older seismic data that show faults
in the NER. Somewhat useful data were collected on three cruises of the R/V Robert Conrad during
1986 that surveyed ODP drill sites (cruises RC2705, RC2707, and RC2708). A single channel streamer
was used as the receiver and a single 80 in3 (1320 cm3) water gun was used as a source [Newman and
Sclater, 1988]. Analog seismic profiles from these cruises were obtained from Lamont Doherty Earth
Observatory. In addition, a small amount of similar single-channel seismic data collected during ODP
Leg 121 was also examined at Site 757 [Shipboard Scientific Party, 1989a; 1989b].
3. NER Fault Observations
Faults were interpreted by observing diagnostic features in seismic sections as described in the
previous section and are shown in figures by symbols on bathymetry maps and in seismic sections by
arrows that indicate the locations of fault traces near the seafloor. In this section we describe the types
of motion inferred from the observed faults. Owing to inadequate imaging or ambiguous geometry, it
was not possible to interpret the motions of all faults (usually shown by gray arrows in the figures).
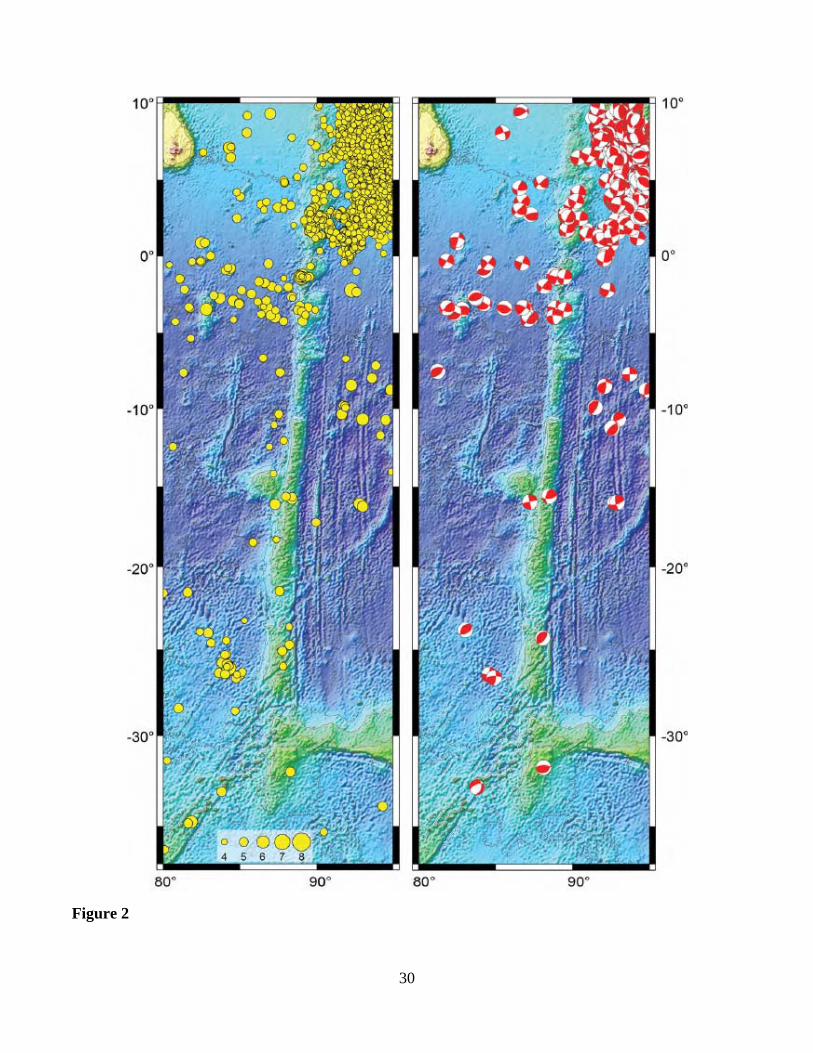
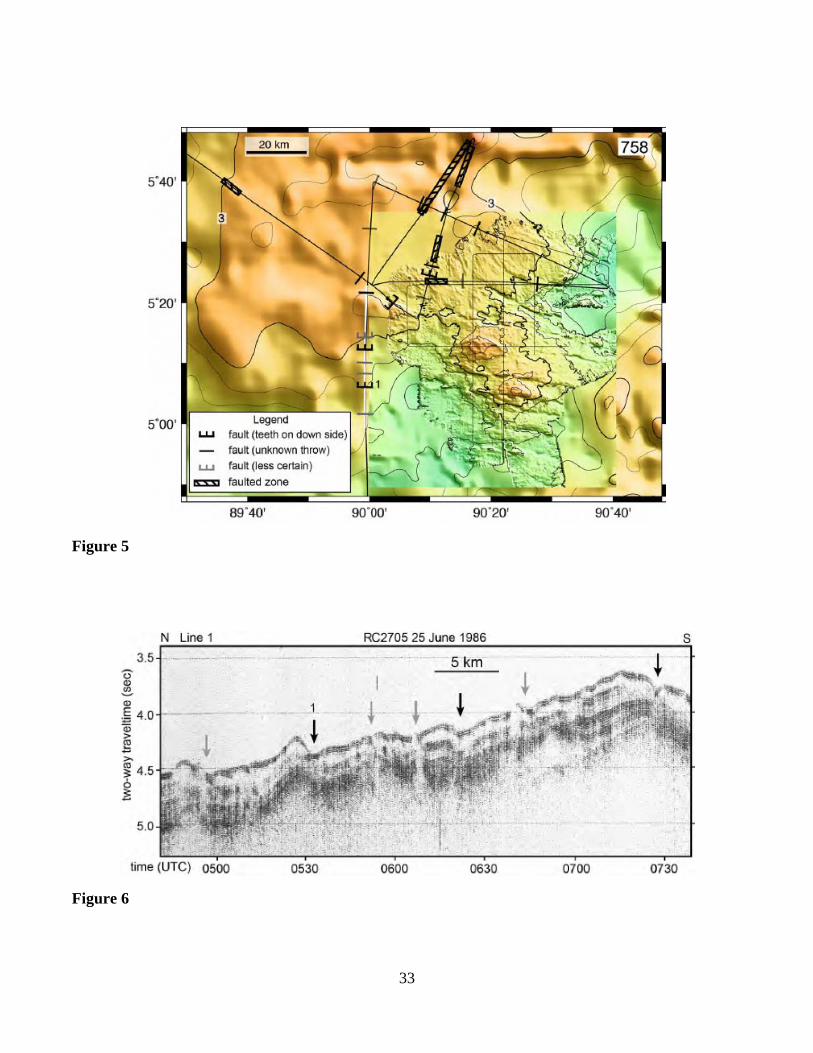
3.1 Site 758 (5.2°N)
Site 758 multibeam bathymetry data cover the southern end of a large seamount and two small
seamounts to its south (Fig. 3). These data clearly image the fractured nature of the seafloor in the
8
vicinity of the two small seamounts. Approximately 10 bathymetric lineations striking WNW-ESE
(~N100°E) are observed crossing almost the entire multibeam data set (Fig. 3). These lineations appear
to be small ridges and/or escarpments, often with paired troughs. Bathymetric contours have a “jagged”
appearance, with sharp, nearly right angle offsets of 3-10 km in many places (Fig. 3). These
displacements give the appearance that the bathymetric features have been offset. Notably, the two
small seamounts have nearly N-S trending flank contours that appear to have been offset by ~10 km
along the lineation in between them.
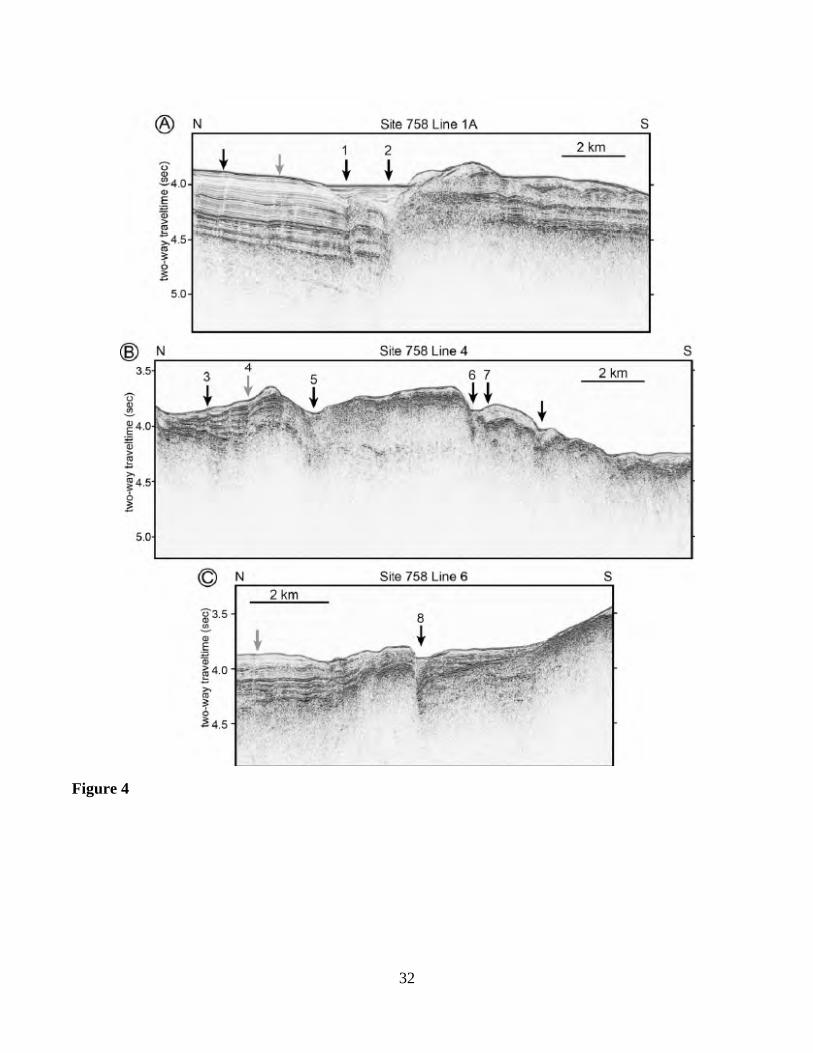
Seismic data show that the NER near Site 758 is extensively faulted (Fig. 4). Faults are apparent
on N-S trending seismic lines but are rarely noted on E-W oriented seismic lines, implying that the faults
trend nearly E-W, as do the bathymetric lineations. The bathymetric lineations correspond to major
faults that show significant offset at the seafloor (e.g., faults 1-2, 6-7, 8; numbers in Fig. 4).
Observed faulting at Site 758 implies both compression and strike-slip motion. Compression is
indicated by the upwarp of layers (between faults 1-2 and 4-5) and up-thrust acoustic basement (“pop-
up”) features such as the small block between faults 6-7 and the asymmetric ridge at fault 8.
Compression also explains the geometry of fault 3, which shows a break in sediment layers that are
upturned at the fault.
Strike-slip motion is implied by faults that separate sedimentary sections of different thickness
and different seismic character, as observed across faults 1-2. In addition, this fault pair is likely a
flower structure because the faults appear to converge at depth. Strike-slip motion is also implied by the
observed offsets in bathymetric contours.
Two of the active Site 758 faults connect with offsets of acoustic basement (faults 2, 8). It is
difficult to determine whether active faulting is the cause of the offsets because the overlying sediment
cover is too thin to compare the sedimentary and basement offsets.
Cruise RC2705 seismic data cover a broader area than the KNOX06RR survey and show that
faulting is widespread, being observed on all seismic lines (Fig. 5). Where the RC2705 data overlap the
multibeam bathymetry, bathymetric lineations correlate with faults (Fig. 4). The resolution of these
older data is mediocre and it is difficult to discern details of the faults below the seafloor. Most are
9
recognized only by notches or offsets of the seafloor; although, fault 1 (Fig. 6) displays an asymmetric
basement block uplift like that of fault 8 in Figure 4.
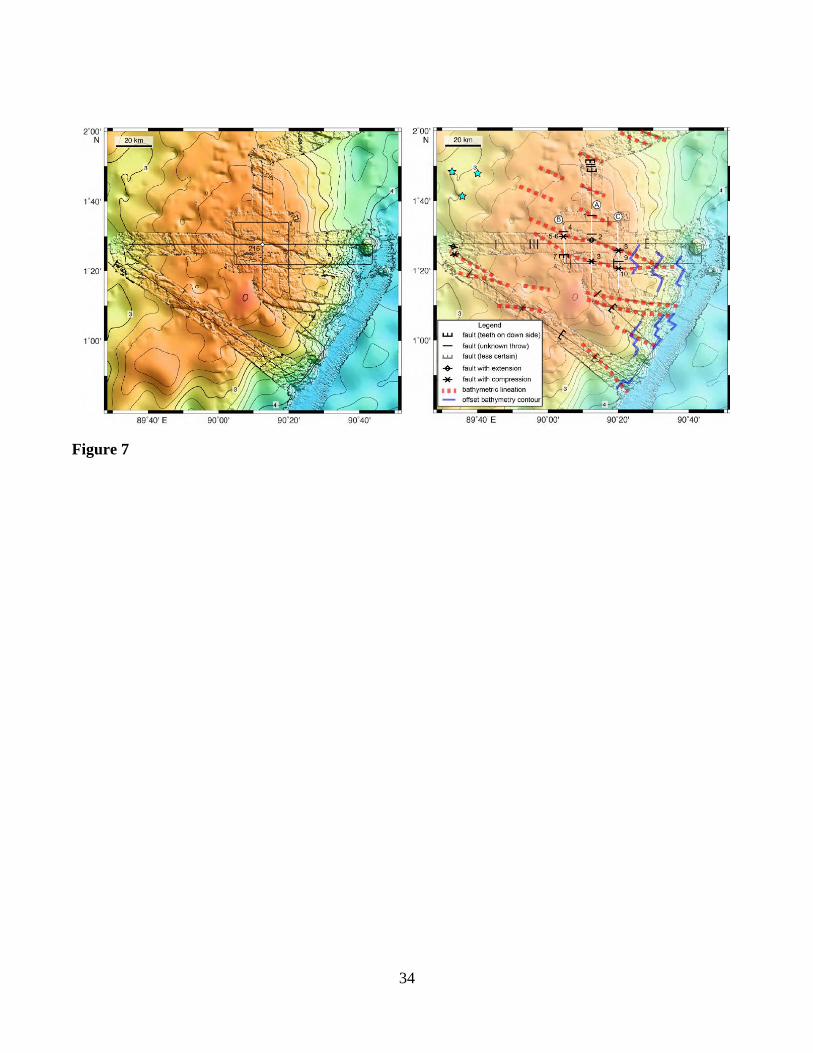
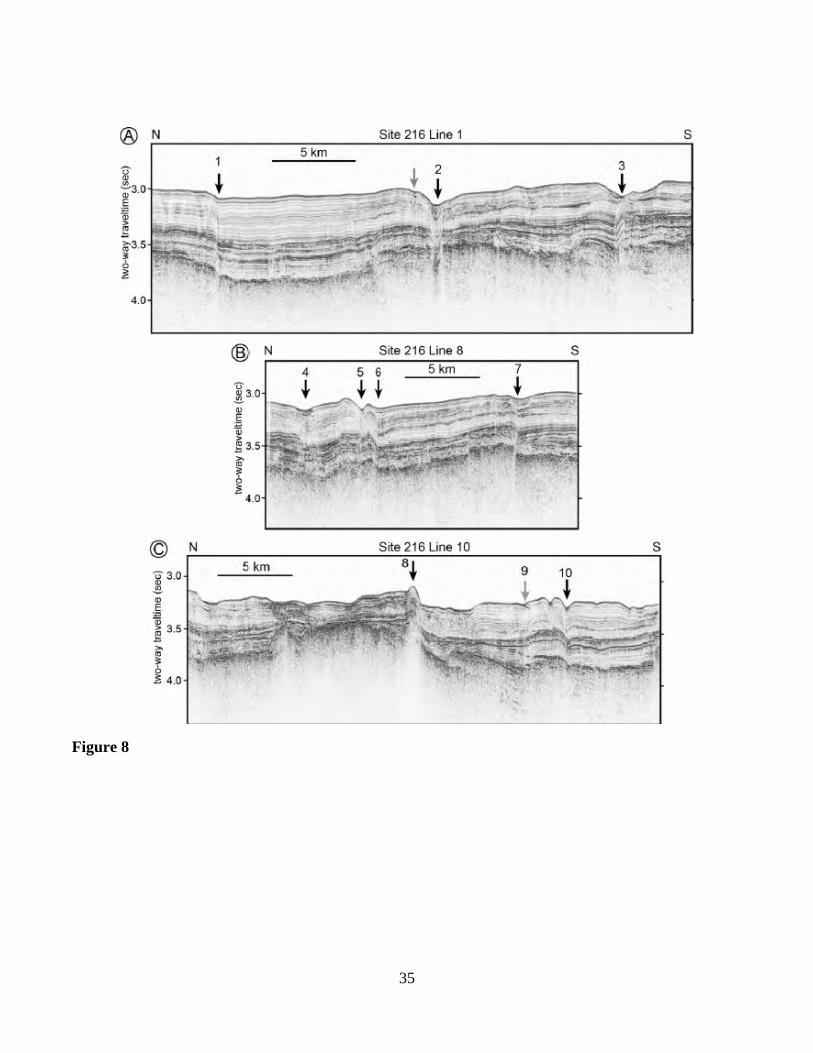
3.2 Site 216 (1.5°N)
Multibeam bathymetry data at Site 216 (Fig. 7) show lineations with WNW-ESE trends
(~N100°E to N110°E) stretching across the top and east flank of a large seamount. These lineations are
mostly troughs incising the sediments. In addition, contours on the eastern flank of the seamount appear
jagged, with right angle (mostly left lateral) offsets of a few kilometers, often occurring where
intersected by the bathymetric lineations. Seismic sections show that the bathymetric lineations
correspond to larger, active faults (faults 2, 3, 5-6, 8; numbers in Fig. 8). Faults are seen most clearly on
N-S oriented lines but also are detected on lines with other orientations, consistent with the orientation
of the nearly E-W bathymetry lineations.
Site 216 faulting has similar characteristics to that of Site 758, indicating both compression and
strike-slip motion. Compression is indicated by fault 7, which has reversed geometry and occurs at the
south edge of a basement pop-up block. Other evidence for compression is the upwarp of sediment
layers and acoustic basement observed north of fault 3, between faults 5-6, 9-10, and at fault 8. Fault 3
displays a sharp kink in sediment layering, which may have the same cause.
The highly-deformed sag trough of fault 2 is a structure commonly observed on strike slip faults.
In addition, the sediment layers across this fault have different thicknesses, indicating lateral motion.
Sedimentary layers also change thickness and character across faults 4, 7, 8, and 10, likewise implying
lateral movements. In the case of fault 8, this observation implies that both reverse and strike-slip
motion occurred. Strike-slip faulting is also consistent with the observation of laterally-offset
bathymetry contours.
Offsets of acoustic basement are observed for faults 1, 6, and 7. For the latter two, the acoustic
basement offset is larger than the sediment offset, indicating that an older basement fault was
reactivated. For fault 1, the offset of acoustic basement and sediment layers is approximately the same,
implying that faulting at later stage caused the acoustic basement to develop an offset.
10
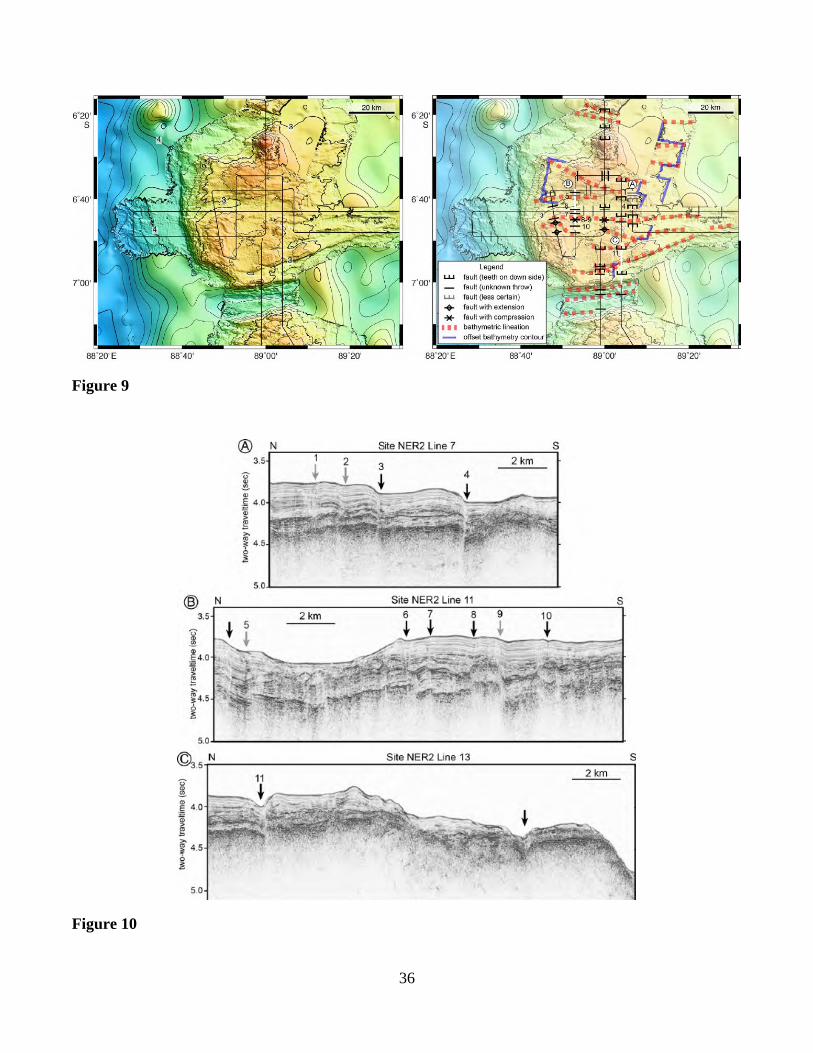
3.3 Site NER2 (6.7°S)
Site NER2 encompasses most of a flat-topped seamount with shallow valleys across its top, a
steep western flank, and a shallow eastern flank that extends eastward out of the survey (Fig. 9). E-W
bathymetric lineations also occur at this site; however, they are not as distinct as at Sites 216 and 758.
The most prominent lineation is the trough at the south flank of the seamount, which is a large graben
that was probably formed during the construction of the NER [Sager et al., 2010]. Other lineations have
similar trends crossing the top of the seamount, with several being traced across the entire summit (Fig.
9). Some seamount bathymetry contours have an angular nature, rather than being rounded, and in
several places have right angle bends and offsets similar to those seen at sites 758 and 216. These
offsets show no consistent trend, some being right-lateral and others left-lateral.
Seismic lines show that the NER2 seamount is extensively faulted and the bathymetric lineations
are correlated with major faults (Figs. 9, 10). Compression is clearly indicated by fault 4, which has a
reversed geometry with the hanging wall upthrust and bending of sedimentary layers (Fig. 10). Fault 3 is
similar, but the reverse geometry is not as clear. Other evidence of compression is the upwarp of
sediment layers observed between faults 1-2, 2-3, 8-9 and near fault 10. Faults 8-9 are associated with a
basement pop-up structure. Warping on the north side of fault 11 may also indicate compression. This
fault may also have a component of strike-slip motion as indicated by the deformed trough and by slight
differences in sediment character across the fault. Fault 6 appears as a small, negative (extensional)
flower structure, with two closely spaced faults converging at depth. This fault may indicate strike-slip
motion with a small extensional component.
A number of active faults are rooted in offsets of acoustic basement (faults 4, 5, 7, 8, 9). For
most of these, the basement offset is greater than that within the sediments or at the surface, implying
reactivation of a pre-existing basement fault.
3.4 Site NER3 (7.7°S)
Site NER3 covers much of a small, N-S-trending ridge segment (Fig. 11). Although not as
prominent as at other locations, bathymetric lineations are also observed on the summit of the NER3
seamount. Most have nearly E-W trends, but there is significant variability. These lineations correlate
with active faults and summit basin edges, implying that active deformation affects the seafloor
11
topography. Unlike other sites farther north, there are no apparent offset contours. NER3 acoustic
basement is highly dissected and offset, mostly from early extensional faults that formed rotated fault
blocks, probably formed during construction [Sager et al., 2010]. These faults strike approximately E-
W (Fig. 11) and appear to account for much of the broader topography and the bathymetric lineations,
which are formed by fault troughs or ridges.
Fault geometries imply that both compression and strike-slip faulting occur at this site, with the
former being dominant. Compression is indicated by reverse faults 14 and 15 (numbers in Fig. 12).
Both faults show hanging walls upthrust relative to footwalls. Fault 3 also appears to be reverse, with
basement on the south side upthrust (Fig. 12). Upwarped sediments indicate compression and are
observed at faults 4, 10, 11, 14, 16, and perhaps between 5-6 and 8-9. The folds at faults 11 and 14 are
large enough to create ridges imaged by the multibeam bathymetry. Compression is also indicated by
the basement pop-up feature at fault 14.
Strike-slip motion is suggested by subtle differences in sedimentary layer thicknesses across a
few faults. This situation occurs at faults 5, 6, 11, perhaps at 14, and across faults 2-3 and 7-8 (Fig. 12).
Faults 2-3 form a sag trough similar to features often observed on strike-slip faults. Because fault 3 is a
reverse fault, the combination of interpreted compressive and strike-slip motions implies transpression
across this set of faults. Faults 7-8 form a graben that is reminiscent of the fault 2-3 trough. Although
the sense of motion is not obvious, the upwarp of sediment layers on the south side of this pair likely
indicates compression.
Seismic profiles show extensive early deformation of the NER3 ridge in the form of offset and
tilted fault blocks that appear normal in nature (Fig. 12B). Many of the active faults connect to these
basement offsets. In most cases, the offset of acoustic basement is greater than that of overlying
sediments (faults 1, 6, 10, 12-13, 15), implying recent reactivation of an original basement fault. For
fault 8, the offset of acoustic basement is similar to that of upper sediment layers, suggesting that the
entire basement offset resulted from the active faulting. For fault 14, surface expression appears greater
than basement offset because of an expanded recent sediment section caused by recent differential
sedimentation.
12
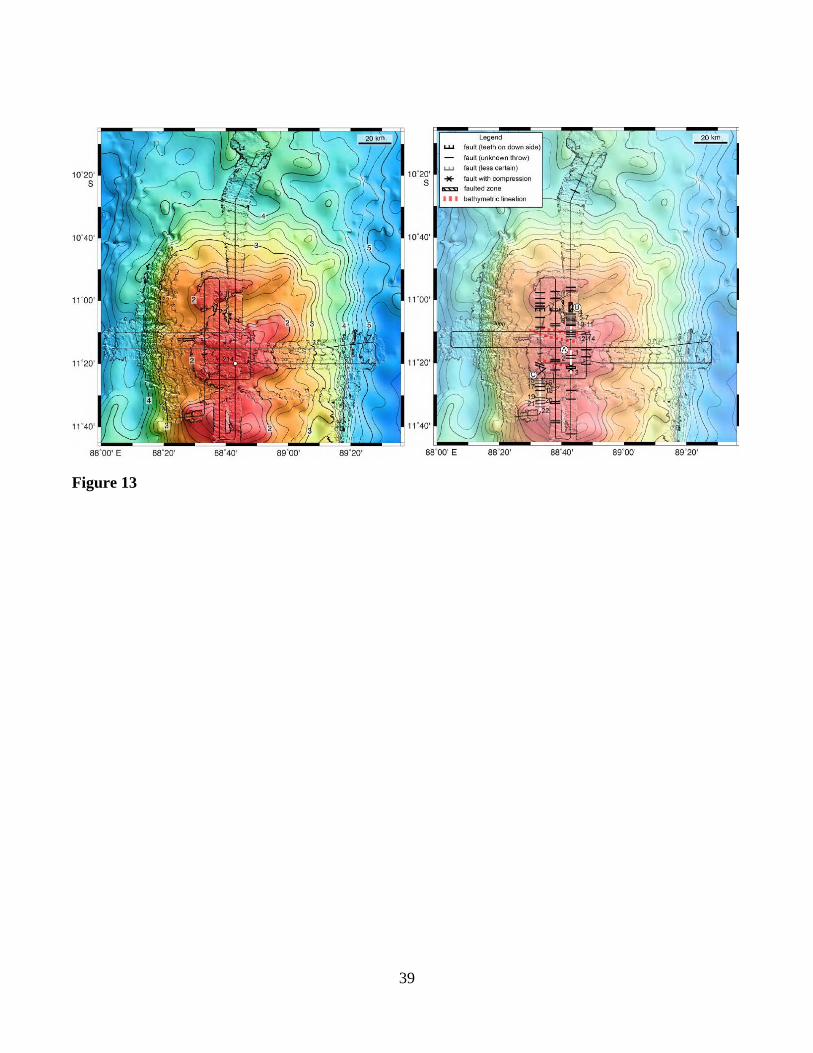
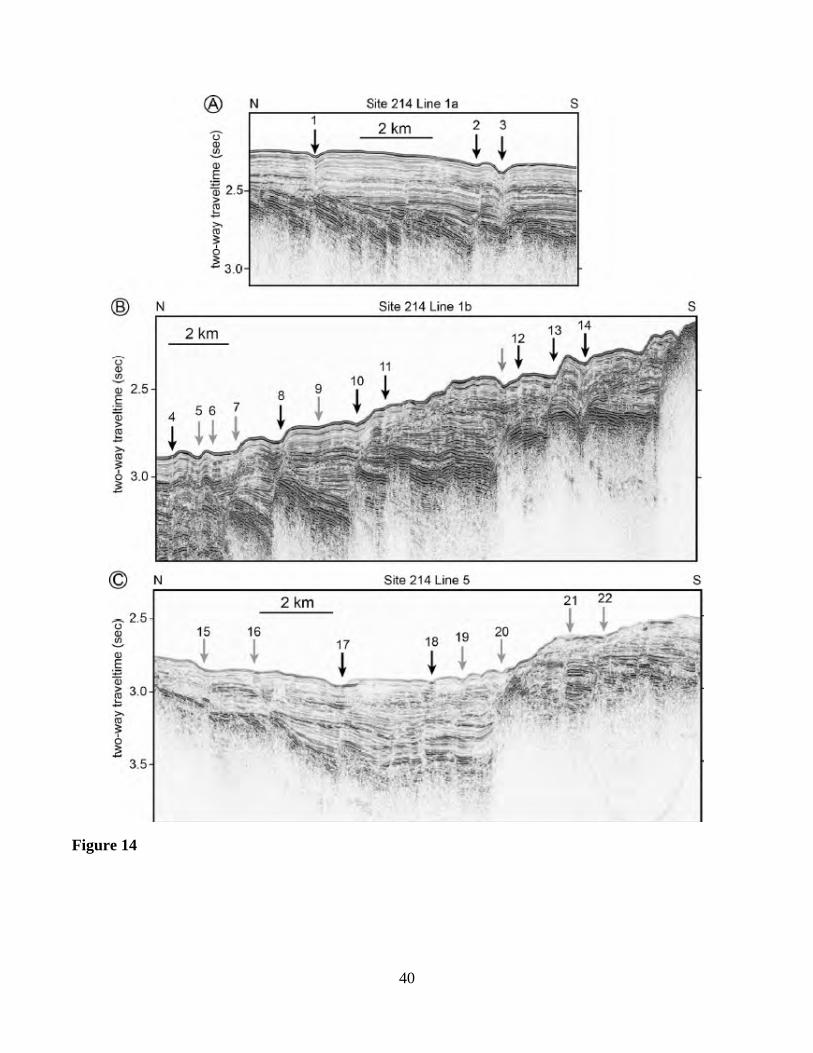
3.5 Site 214 (11.3°S)
The Site 214 survey encompasses a broad area at the northern end of the high, continuous ridge
that makes up the southern NER. The surveyed portion of the ridge summit contains three uplifts
separated by two swales, both trending ~N70°E (Fig. 13), that apparently formed from extension during
formation of the NER [Sager et al., 2010]. Bathymetric lineations are few and no offset bathymetric
contours are evident (Fig. 13).
Seismic sections in the Site 214 area show extensive faulting and most faults appear to be normal
faults as indicated by the hanging wall having moved downward relative to the footwall (e.g., faults 7-
11, 12-13, 17, 21, 22; numbers in Fig. 14). Although the stress regime appears dominantly tensional,
indications of possible compression and strike-slip are observed. Sediment layer upwarp is noted
between faults 2-3 and 4-6, implying compression. Sediment layers at faults 1 and 3 have a v-shape that
may indicate strike-slip motion. Thus, it appears that a regime of slight extension is punctuated by
zones of compression and strike-slip motion.
Acoustic basement is highly dissected at Site 214, with sediment infill indicating that this intense
normal faulting occurred at the time of or soon after ridge construction [Sager et al., 2010]. Many of
the active faults are rooted in these original faults. In almost every case an increase in displacement
with depth is consistent with basement fault reactivation.
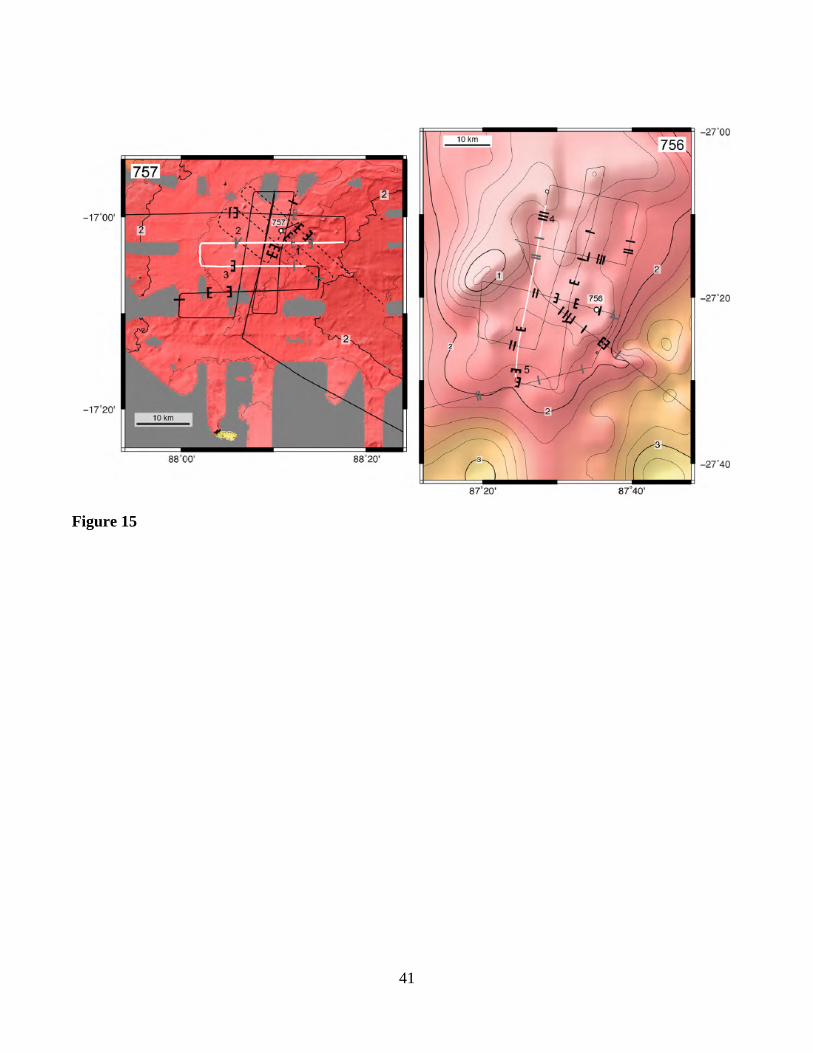
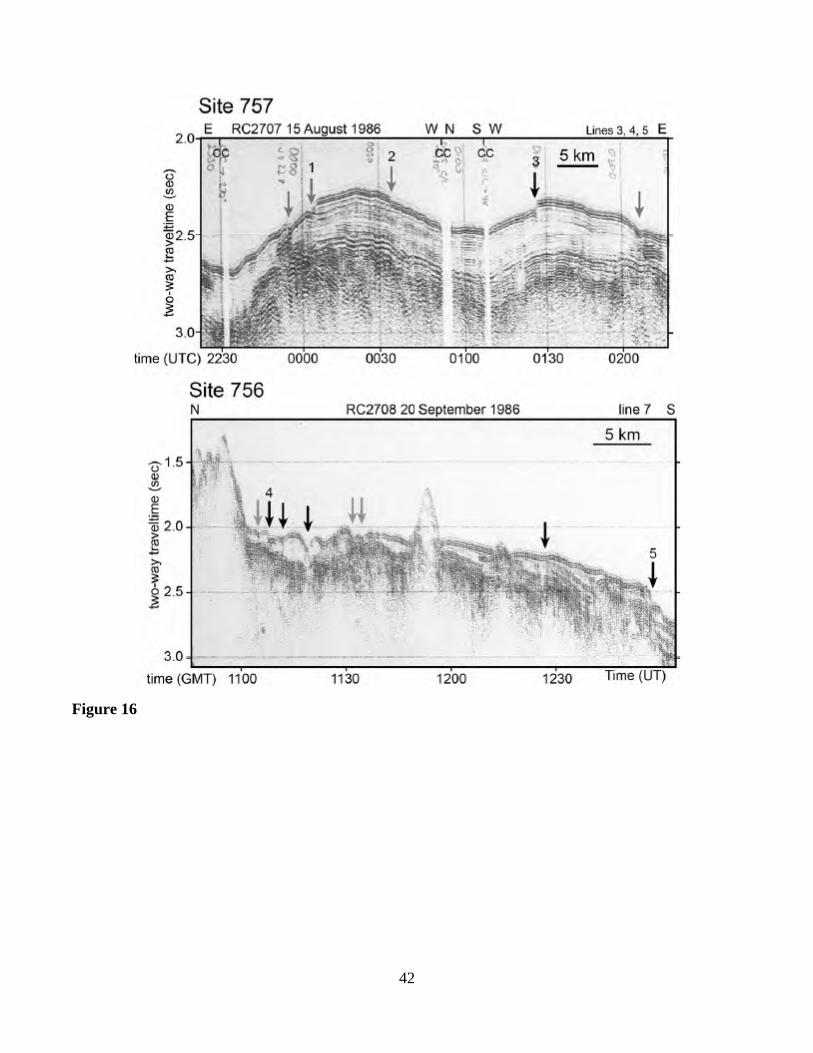
3.6 Site 757 (17.1°S)
Multibeam bathymetry data around Site 757 were collected by R/V Sonne [Flueh and Reichert,
1998; Grevemeyer et al., 2001] and single channel seismic data come from cruises RC2707 and ODP
Leg 121. The bathymetry map (Fig. 15) shows that the site is located atop the broad dome of a large
seamount and there are few bathymetric contours or features of interest. Small (<100 ms TWTT) offsets
in the seafloor were mapped (Figs. 15, 16) and are similar to those produced elsewhere by active
faulting. Most faults (e.g., numbers 1-3 in Fig. 16) appear to have normal fault geometry, with fallen
footwalls creating steep escarpments. Data quality is mediocre, with little detail imaged below the
seafloor, so fault interpretation is less certain than sites with recent data.
13
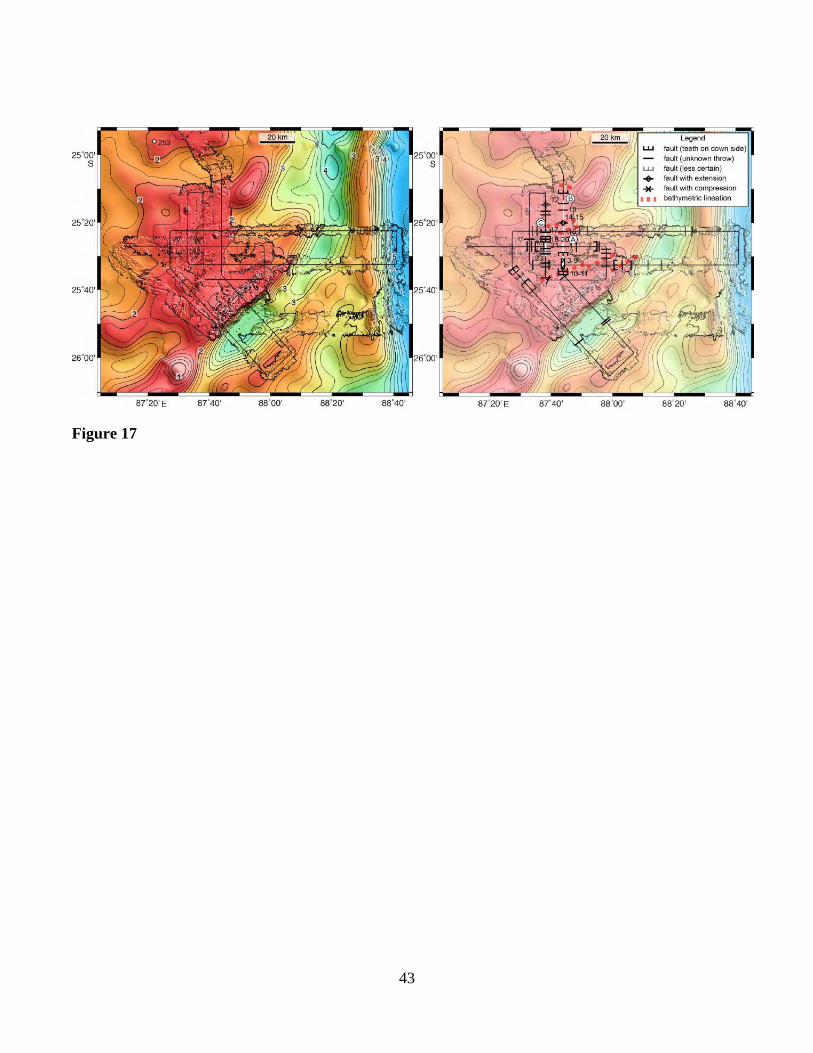
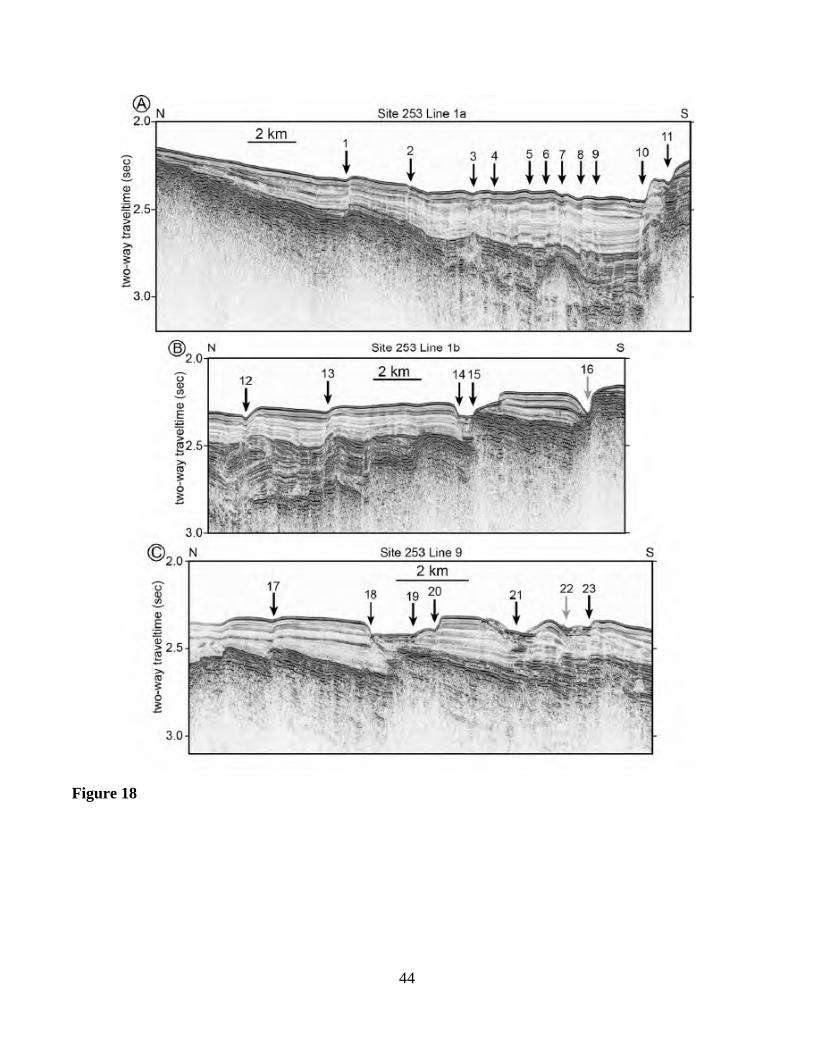
3.7 Site 253 (25.5°S)
The Site 253 survey is slightly offset from the DSDP drill site (Fig. 17) and covers an area of the
southern NER that is dissected by a large, NE-trending canyon. Satellite-predicted bathymetry data
[Smith and Sandwell, 1997] imply that the ridge is rugged, with number of local highs and lows on the
ridge top. Only a few tectonic lineations are noted in the multibeam bathymetry data (Fig. 17), trending
NE-SW (~N70°E to N80°E).
Seismic data show that this part of the ridge also experienced extensive early faulting during or
shortly after construction, creating large offsets in the acoustic basement as well as large grabens, most
of which are filled by sediments (Fig. 18). Seismic sections also show widespread active faulting. Most
faults have small offsets (<50 ms TWTT), but a few are larger, especially at the edges of large offset
basement fault blocks. Some cause small offsets and undulations of the seafloor (faults 1-9, 13, 17;
numbers in Fig. 18) and others are connected with small (fault 12) or large troughs (faults 14-15, 16, 18-
20, 21, 22-23). Overall, the faults at Site 253 are mostly normal faults, but there are some indications of
other types of motion. Although inter-fault sediment reflectors between faults 1-9 appear to be folded,
an observation that could signify compression, we interpret this geometry simply as coeval deformation
and sedimentation between closely-spaced normal faults within a zone of intense faulting (at mid-
sediment layer depths the faults are clearly normal and layer bending is insignificant). Fault 1 occurs at
the edge of a small basement uplift that may have resulted from recent compression because the
sediment layer offset is approximately the same as the acoustic basement offset.
Most active faults are connected to offsets in acoustic basement. For many, the offset of
basement or deep sediment layers is approximately the same as that in the upper sediments, implying
that the basement offset is a result of the recent faulting (faults 1, 5-8, 13). Fault 17 shows less offset at
seafloor than basement offset, whereas faults 21-23 have more seafloor topography than offset in deep
layers. The former observation implies that an original basement fault was reactivated whereas the latter
observation suggests that erosion may be a factor in creating these troughs. In some locations, the sense
of faulting may have changed. Faults 15 and 19 appear to be connected with basement reverse faults,
but the seafloor troughs (bounded by faults 14-15, 18-20) indicate extension. These observations imply
the reactivation of original basement faults but with a different motion of the active faulting.
14
3.8 Site 756 (27.3°S)
No multibeam bathymetry data are available from Site 756. Satellite-predicted bathymetry data
[Smith and Sandwell, 1997] imply that the surface of the NER at this site has significant topography
(Figs. 15, 16) similar to nearby Site 253. Single-channel seismic data from R/V Robert Conrad cruise
RC2708 show numerous seafloor offsets that are consistent with active faulting (Fig. 16). Although the
geometries of most are unclear, faults 4 and 5 (numbers in Fig. 16) appear to have normal geometry.
Faults are observed on most seismic lines, both N-S and E-W trending, implying that the fault trends are
SW-NE, similar to the bathymetric trends and fault trends at Site 253. Data from Site 756 are of such
low quality that little detail is seen below the seafloor, making unique interpretations of fault nature
difficult. Active faulting is indicated, but the sense of most faults is uncertain.
4. Discussion
High-resolution multibeam bathymetry data and 2D multichannel seismic data clearly show active
faulting along the entire length of the NER. Although our data have higher resolution than previous
NER data sets, both the wide spacing of sites and the coarse spacing of seismic lines at each survey site
are limitations to the resolution of the study. Within the survey sites, seismic lines are widely spaced,
hampering definition of fault geometry. Many faults have small offsets, are inadequately imaged, or
have ambiguous geometry, all of which also make some fault interpretations ambiguous. Despite these
cautions, the data are far better than any previously available and allow us to make important
observations about NER faulting.
4.1 Reactivation of Original NER Faults
Active faults visible at the seabed are usually connected with near-vertical steps in the top of
acoustic basement (the top of the NER volcanic pile). Analysis of differences in the vertical separation
of sediment layers relative to the throw on basement faults indicates whether the recent faulting caused
the basement fault or whether a pre-existing fault was reactivated. In some instances the vertical offsets
of the sedimentary and basement faults are the same, implying that recent deformation caused the
basement offset. For many active faults the basement offset is greater than sediment offset, implying
that recent faulting reactivated an original basement fault. The reactivation of pre-existing weaknesses
by diffuse plate boundary faulting of the Indo-Australian plate is not a new observation. The same
15
occurs in the Central Indian Basin, where original spreading-ridge-generated normal faults are
reactivated as active thrust faults [Bull and Scrutton, 1992]. Similarly, strike-slip faulting in the
Wharton Basin is thought to occur by the reactivation of original transform faults [Deplus, 2001;
Delescluse et al., 2012]. Evidently the fracturing of the Indo-Australian plate is occurring by
opportunistic reactivation of weak zones in the lithosphere created by original faulting. Active fault
trends in both the NER and adjacent basins indicate that original fault azimuths, rather than relative plate
motion vectors (discussed in the next section) or other factors, determine the pattern and direction of
active faulting.
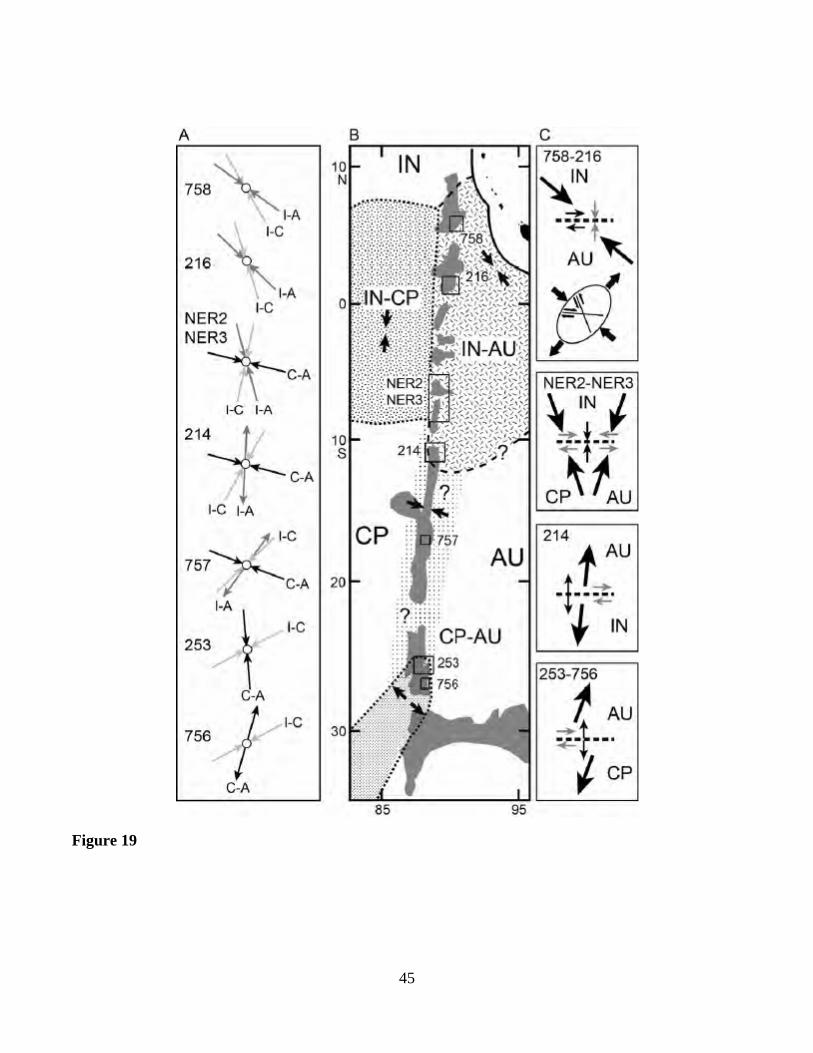
4.2 Deformation within the NER and Implications for Diffuse Plate Boundaries
It is expected that observed fault motion could be explained by relative plate motions predicted by
the three-plate model of Royer and Gordon [1997], but with uncertainty about the locations of plate
boundaries and the response of the lithosphere to the stress field implied by the plate motions. This
model is based primarily on seafloor spreading rates and fracture zone trends along central Indian Ocean
mid-ocean ridges, which define the plate-pair Euler poles (Fig. 1) [DeMets et al., 2010; Bull et al.,
2010]. These poles predict significant variations in relative motions along the NER (Fig. 19A).
Predicted motion at a given location depends on the angle that the relative motion vector makes with the
plate boundary as well as the assumed plate geometry. Only the most likely combinations are shown in
Figure 19A, where it is assumed that the India - Australia and Capricorn - Australia boundaries trend N-
S, but the India - Capricorn boundary strikes E-W. Figure 19 shows only the direction of relative
motion, but not the magnitude. The amount of movement between the plates is small but greatest for the
India-Australia pair (total ~125 km). This is slightly more than twice that for India-Capricorn and
roughly five times as much as for Capricorn-Australia [Royer and Gordon, 1997]. Both India-Australia
and India-Capricorn Euler poles lie well off the NER, consistent with greater amounts of relative motion
(Fig. 1) and greater seismicity (Fig. 2). The Capricorn -Australia Euler pole is near the southern end of
the NER and its 95% confidence ellipse encompasses Sites 253 and 756, so the magnitude of relative
motion is small and the direction of motion is uncertain at these sites.
4.2.1 Northern NER (Sites 758 and 216)
In the northern NER, prominent WNW-ESE bathymetric lineations are observed at both Sites 758
and 216 and correspond to major active faults that display evidence of strike-slip motion, often with
16
local compression and sometimes extension. Deformation is mostly strike-slip at both sites, consistent
with the observed dominance of strike-slip focal mechanisms for northern NER earthquakes (Fig. 2).
Compression also occurs at both sites; although, it appears greater at Site 758. Thus, the overall picture
in the northern NER is of transpression. Signs of extension occur at both sites, but it is minor in nature.
Extension probably occurs on releasing bends where the fault trend deviates from being parallel to the
direction of relative motion across the fault, a common feature of strike-slip faults.
Although all three Euler poles imply NW-SE compression in the northern NER, it is probable that
this location is part of the India-Australia plate boundary (Figs. 1, 19) [Royer and Gordon, 1997]. The
Euler pole for this plate boundary implies compression at an angle ~45° from the trend of the NER (Fig.
19A, C). This direction is oblique to both the WNW-ESE transform faults observed in the NER and to
the ENE-WSW trending fracture zones that are reactivated in the Wharton Basin [Deplus, 2001;
Delescluse et al., 2012]. Because the oblique compression is ~45° from the trends of the fracture zones,
it makes about the same angle with original spreading-ridge normal faults. Both sets of faults are
oriented approximately along Riedel shear directions (Fig. 19C), which likely results in opportunistic
reactivation of these faults. Back-projection of the April 2012 Wharton Basin earthquake aftershock
pattern suggests that the fault ruptures are not exactly parallel to the local magnetic lineations [Meng et
al., 2012]. It is unclear whether the small deviation in direction is significant or whether rupturing cuts
across the
Strike-slip faults with N-S orientations are not observed in the areas of the northern NER that were
mapped with multibeam bathymetry data. This finding suggests that prior interpretations of N-S strike-
slip motion within the NER [Stein and Okal, 1978; Petroy and Wiens, 1989] are incorrect. Because all
observed tectonic lineations in the northern NER are oriented nearly WNW-ESE, it is likely that strike-
slip earthquake focal mechanisms in the northern NER indicate motion with that trend. Our data do not
cover seafloor in adjacent basins where reactivated, ENE-WSW-oriented fracture zones may exist, so
we cannot tell how the NER and Wharton Basin faults connect.
Strike-slip motion observed within the northern NER is distinct from N-S compression in the
Central Indian Basin and ENE-WSW strike-slip in Wharton Basin. These differences imply that this
part of NER is indeed a tectonic discontinuity as indicated by Delescluse and Chamot-Rooke [2007].
Because the aftershock distribution related to the April 2012 Wharton Basin earthquake implies a
17
“lattice” of intersecting WNW-ESE and ENE-WSW strike-slip faults located on the east side of the
NER [Meng et al., 2012], it is possible that observed NER faulting is the western edge of that fault
pattern.
4.2.2 Central NER (Sites NER2, NER3)
At Sites NER2 and NER3, in the middle of the predicted diffuse triple junction (Fig. 1), active
faulting documented by the seismic reflection data is dominantly thrusting on E-W trending faults.
Unfortunately, no earthquake focal mechanisms have been produced from this portion of the NER (Fig.
2), so such data cannot inform this interpretation. The observation of E-W oriented thrust faults implies
N-S compressive stress, which could be a result of either India-Australia or India-Capricorn motion as
both vectors have appropriate orientations (Fig. 19A). Capricorn-Australia relative motion is nearly
parallel to the observed faults, but significant strike-slip motion is not supported by fault observations.
Because these two sites are adjacent to the India-Capricorn deformation zone and have a similar style
and direction, the observed Site NER2-NER3 faulting may linked to that in the Central Indian Basin
deformation. However, India-Australia relative motion is also plausible as a driver of faulting at this
site. An important difference from the Central Indian Basin is that thrust faults at NER2-NER3 have
small offsets, but those nearby in the Central Indian Basin can be much larger [Bull and Scrutton, 1992],
implying greater strain accumulation in the adjacent basin.
Evidence of strike-slip motion is observed on some faults within NER2-NER3, suggesting that the
relative motion at these sites includes a component parallel to the faults. Strike-slip motion may occur
because the relative motion vectors are not-quite perpendicular to the E-W trend of spreading-ridge-
formed precursor faults (Fig. 19C). If true, this observation supports the idea that original fault sets
localize deformation with recent motions having components both parallel and perpendicular to the
fault.
4.2.3 Southern NER (Sites 214, 757, 253, and 756)
In the northern and central NER, observed faulting is well-explained by the predicted relative
motions of the three plate system [Royer and Gordon, 1997]. In the southern NER, the translation of
relative plate motions into faulting is less clear. One element of uncertainty is the significant shift in
plate motions caused by the proximity of the Capricorn-Australia pole to the southernmost NER and the
18
fact that the NER crosses from a region of extension to compression in the velocity field of the India-
Australia pole. The former situation means that the magnitude of relative motion changes rapidly along
the southern NER and the direction is highly uncertain. The latter causes relative motion along a either
N-S or E-W oriented faults to shift from convergence north of ~11°S to extension farther south (Fig.
19A, compare Site NER2-NER3 to Site 214).
Faults observed in seismic sections at both Sites 214 and 253, at the north and south ends of the
high, linear section of the southern NER, mostly have a normal geometry. Data from Sites 757 and 756
are of low quality and do not clearly show the geometry of most observed faults. Although these data
are consistent with observations at Sites 214 and 253, we base our interpretations on data from the two
recently-surveyed sites. Normal faulting is dominant at both sites, but displacement on active faults
appears small, indicating low strain. A few faults at each site show characteristics of possible
compression or strike-slip motion. The non-normal faults appear clustered, implying zones of
compression or strike-slip motion surrounded by normal faulting. This mixture of fault types suggests
that faulting in the southern NER is complex and possibly incompletely defined by the small areas of
seismic reflection data available.
Normal faulting is unexpected in the southern NER, given that the three focal mechanisms located
on this part of the ridge show thrust faulting and strike-slip mechanisms occur in adjacent basins (Fig.
2). Relative plate motions for this part of the NER should be described by the Capricorn-Australia Euler
pole (Fig. 1). Although this pole predicts extension for Site 756, it implies compression, not extension,
from Site 253 northward (Fig. 19A). Both sites lie within the 95% confidence ellipse of the pole, so
relative motion predictions are uncertain for these sites. However, if the Euler pole is actually located
slightly farther north, then extension is expected at both sites (Fig. 19C), which are then part of a zone of
extension extending southwest from the southern NER [Royer and Gordon, 1997] (Fig. 19B). Because
of the proximity of the pole and its low rotation rate [Royer and Gordon, 1997], relative motion between
the two plates in this area should be very small, but this is consistent with the low strain on observed
faults.
According to Royer and Gordon [1997], Site 757 is located within the Capricorn-Australia
boundary whereas Site 214 is at the junction of that boundary with the diffuse triple junction (Fig. 1).
The Capricorn-Australia pole predicts convergence nearly perpendicular to the NER at both locations.
19
Although this prediction is consistent with the thrust fault focal mechanism recorded near Site 757, it
does not explain the prevalence of normal faults in seismic sections. In contrast, the India-Australia pole
predicts extension at both sites (Fig. 19A), whether or not a fault is oriented N-S or E-W. The abrupt
shift from convergence at Site NER2-NER3 to extension at Site 214 could be a result of the former
being north of the India-Australia Euler pole and the latter being to the south. For N-S trending faults,
the change is small because the relative motion vector has nearly the same orientation, but for E-W
oriented faults, the shift is from nearly perpendicular compression to extension.
Site 757 is located on a section of the NER that is too far south to be plausibly a part of the India-
Australia boundary. Because seismic data are unclear at this site, it is possible that the observed active
faulting is compression caused by Capricorn-Australia motion, an interpretation consistent with the
thrust focal mechanism located nearby (Fig. 2).
4.2.4. Tectonic Overview
We observe that active faulting within the NER is opportunistic, reactivating original faults mostly
in response to regional relative plate motions. It does not seem to matter that the original fault fabric is
often at a significant angle from the relative motion vectors, the original faults are weak and therefore
break before intact crust. Because the regional stress pattern and relative plate motions are both usually
oblique to the fault fabric, many active faults appear to have complex motion. In the northern NER,
original normal faults are reactivated mainly as strike-slip faults, but with a component of compression
(Fig. 19C, Sites 758, 216). In the central NER, a shift in relative motion directions causes reactivation
of early normal faults with mostly compressive motion, but with a component of strike-slip (Fig. 19C,
Sites NER2-NER3). The relationship of broad-scale plate motions to active faulting in the southern
NER is more complex. Faulting appears a mixture, with widespread extension punctuated with
compression or strike-slip motion. This apparent paradox suggests that the southern NER has narrow
zones of deformation responding to the regional plate motions with surrounding areas of slight
extension. Extension at Sites 253 and 756 may be explained by inclusion in a zone of Capricorn-
Australia divergence south of the Euler pole for that plate pair (Fig. 19B). Site 214 is interesting
because it shows a dramatic shift from the compressional deformation occurring only a few degrees of
latitude farther north at Site NER2-NER3. Given that fault motions at Sites NER2-NER3 and 214 can
be explained by the India-Australia pole, we favor the explanation that the NER north of ~11°S is part of
20
the boundary of that plate pair. This abrupt shift could instead represent a more complex blending of
deformation in the diffuse triple junction, but we have insufficient data to support an explanation of
greater complexity. Interestingly, the difference between Sites NER-NER3 and 214 is also apparent in
the active strain model of Delescluse and Chamot-Rooke [2007], derived from earthquake focal
mechanisms and geodetic GPS measurements. This model shows strong, NNW-SSE compression in the
central NER from 3°-8°S, but only slight strain south of 8°S. The maximum strain axis direction near
Sites NER2-NER3 is coincident with India-Australia motion (Fig. 19A), suggesting this portion of the
NER is associated with that boundary.
No clear seismic data are available from the ~15° of the southern NER surrounding Site 757.
Although existing data show that faulting is occurring at that site, the type of faulting is uncertain.
Because earthquake focal mechanisms and the strain model [Delescluse and Chamot-Rooke, 2007]
indicate oblique compression approximately coincident with expected Capricorn-Australia motion, it is
likely that faulting in this zone is mainly thrust faulting related to the convergence of these two plates.
It is clear from seismic data that changes in the style of faulting occur along the NER, sometimes
abruptly. Sites 216 and NER2 are separated by ~7° (~780 km) and the mostly strike-slip style of
faulting at Sites 758 and 216 is dramatically different from the primarily thrust fault deformation at Sites
NER2 and NER3. Between Sites NER3 and 214, separated by only ~2.5° (~260 km), there is an abrupt
change from mainly thrust faulting to mainly normal faulting. In addition, several sites (NER3, 214,
253) show evidence of mixed faulting. These changes probably occur because the pre-existing fault
fabric at different locations responds to regional changes in relative plate motions and stress
orientations. Faulting sometimes appears to change more abruptly than expected from the broad shifts
in relative motion implied by the three-plate model, an indication that pre-existing structure is an
important factor in the fracturing of the plates.
Changes in fault style indicate that the NER crosses at least two different diffuse boundaries. The
northern NER (Sites 214, NER2-NER3, 216, and 758) appears to show deformation related to the India-
Australia plate boundary, whereas the southern NER (Sites 757, 253, 756) shows Capricorn-Australia
motion. It is also possible that the diffuse triple junction is more complex and also shows India-
Capricorn motion (i.e., Site NER2-NER3). If the NER does not cross the India-Capricorn boundary, it
cannot be far away because the thrust faulting in this zone has been observed directly adjacent to the
21
northern NER (Fig. 19B; [Weissel et al., 1980; Bull and Scrutton, 1992]). Such an abrupt change from
one relative motion to another is consistent with the observed abrupt change in earthquake style and with
deformation models derived from earthquake motion [Deplus, 2001; Delescluse and Chamot-Rooke,
2007].
5. Conclusions
Analyses of seismic reflection data shows that active faulting is found along the entire ~4500 km
length of the NER, but with variable intensity and style depending on location relative to diffuse plate
boundaries and relative plate motion Euler poles. At all sites, recent deformation has reactivated
spreading-center-formed normal faults. Together with similar results in adjacent basins, this finding
implies that Indo-Australian plate fracturing occurs mainly by reactivation of faults formed at the time
of lithosphere creation. Fault directions are observed to correspond to the original structure rather than
the regional plate motion pattern, indicating that pre-existing structure is the most important factor
determining fault geometry.
In the northern NER (north of 1.5°N), the dominant deformation style is transpression on faults
having a WNW-ESE trend. The observed direction of strike-slip motion is unexpected because prior
interpretations of earthquake focal mechanisms within the northern NER were interpreted to support N-
S strike-slip, consistent with reactivation of ancient fracture zones in the nearby Wharton Basin.
Apparently NW-SE compression within the India-Australia diffuse plate boundary reactivates original
spreading-center normal faults in the NER and fracture zones in the Wharton Basin along oblique Riedel
shear directions.
In the central NER (6.7°-7.7°S), deformation shifts to predominantly thrust faulting, similar to that
observed in the Central Indian Basin, perhaps with a minor amount of strike-slip motion. Although this
deformation could result from either India-Capricorn or India-Australia relative motion, the latter is a
simpler explanation because it agrees with interpretations of sites to the north and south. A few faults
show evidence of strike-slip motion, suggesting that the stress pattern applied by regional plate motions
has a component parallel to the original faults.
Deformation style again changes abruptly between 7.7°S to 11.3°S. Southern NER deformation is
modest and is expressed mainly as normal faulting, but interrupted by zones of strike-slip or
22
compressional faulting. Extension at the southernmost end of the NER is explained as part of a zone of
Capricorn-Australia divergence south of that Euler pole, whereas extension at 11.3°S is explained as part
of the India-Australia boundary, as are sites farther north. Although low-resolution seismic data in the
gap between these areas show active faulting, the style of faulting is unclear but likely to be Capricorn-
Australia convergence consistent with observed thrust fault focal mechanisms.
Seismic data from the NER indicate that diffuse deformation is widespread and often complex,
sometimes with mixtures of different fault types suggesting interplay of regional stresses and pre-
existing structures. Our interpretation is that the northern NER shows India-Australia relative motion
whereas the southern NER responds to Capricorn-Australia motion. India-Capricorn deformation has
been documented to the western edge of the NER, implying that changes in deformation style can be
abrupt. This observation agrees with published findings that the northern NER is a break between
deformation fields on either side. Although observed deformation can be understood by the framework
of larger plate motions, faulting is more complex than existing plate models predict.
Acknowledgments
We thank captain Tom Desjardins, seismic technicians Lee Ellett and Brandi Reese, and the crew of
the R/V Roger Revelle during cruise KNOX06RR for making data collection possible. We are indebted
to Amy Eisin for seismic data processing and Chris Paul, for bathymetry data processing. We thank
Halliburton/Landmark for use of ProMAX software and Seismic Micro Technology for use of Kingdom
Suite software. We are appreciative of two anonymous reviewers, who provided through and
challenging reviews that helped strengthen our analysis. This project was funded by the National
Science Foundation (grants OCE�0550743 and OCE-0549852).
References
Bull, J. M., C. DeMets, K. S. Krishna, D. J. Sanderson, and S. Merkouriev (2010), Reconciling plate kinematic and seismic estimates of lithospheric convergence in the central Indian Ocean, Geology, 38, 307-310, doi:10.1130/G30521.1.
Bull, J. M., and R. A. Scrutton (1990), Fault reactivation in the central Indian Ocean and the rheology of oceanic lithosphere, Nature, 344, 855-858.
Bull, J. M., and R. A. Scrutton, R. A. (1992), Seismic reflection images of intraplate deformation, central Indian Ocean, and their tectonic significance, Geol. Soc. London J., 149, 955-966, doi: 10.1144/gsjgs.149.6.0955.
23
Cande, S. C., and D. V. Kent (1995), Revised calibration of the geomagnetic polarity timescale for the Late Cretaceous and Cenozoic, J. Geophys. Res., 100, 6093-6095.
Curray, J. S., and T. Munasinghe (1989), Timing of intraplate deformation, northeastern Indian Ocean, Earth Planet. Sci. Lett., 94, 71-77.
Delescluse, M., and N. Chamot-Rooke (2007), Instantaneous deformation and kinematics of the India-Australia plate, Geophys. J. Int., 168, 818-842, doi: 10.1111/j.1365-246X.2006.03181.x.
Delescluse, M., L. G. J. Montési, and N. Chamot-Rooke (2008), Fault reactivation and selective abandonment in the oceanic lithosphere, Geophys. Res., Lett., 35, 1-5, doi:10.1029/2008GL035066.
DeMets, D., R. G. Gordon, and D. F. Argus (2010), Geologically current plate motions: Geophys. J. Int., 181, 1-80, doi: 10.1111/j.1365-246x.2009.04491.x.
Deplus, C. (2001), Indian Ocean actively deforms, Science, 292, 1850-1851, doi: 10.1126/science.1061082.
Deplus, C., M. Diament, H. Hébert, G. Bertrand, S. Dominguez, J. Dubois, J. Malod, P. Patriat, B. Pontoise, and J. J. Sibilla (1998), Direct evidence of active deformation in the eastern Indian oceanic plate, Geology, 26, 131-134.
Flueh, C., and C. Reichert (1998), Cruise report SO131, SINUS – seismic investigations at the Ninetyeast Ridge observatory using SONNE and JOIDES RESOLUTION during ODP Leg 179, GEOMAR Rept. 72, Kiel, Germany, 377 pp.
Gordon, R. G. (2000), Diffuse oceanic plate boundaries: Strain rates, vertically averaged rheology, and comparisons with narrow plate boundaries and stable plate interiors, in The History and Dynamics of Global Plate Motions, edited by M. A. Richards, R. G. Gordon, and R. D. van der Hilst, R. D., Geophysical Monograph v. 121. pp. 143-159, AGU, Washington, DC.
Grevemeyer, I., E. R. Flueh, C. Reichert, J. Bialas, D. Kläschen, and C. Kopp (2001), Crustal architecture and deep structure of the Ninetyeast Ridge hotspot trail from active-source ocean bottom seismology, Geophys. J. Int., 144, 414-431.
International Seismological Centre (2013), On-line Bulletin, http://www.isc.ac.uk, Seis. Cent., Thatcham, United Kingdom.
Krishna, K. S., H. Abraham, W. W. Sager, M. S. Pringle, F. Frey, D. Gopala Rao, and O. V. Levchenko (2012), Tectonics of the Ninetyeast Ridge derived from spreading records in adjacent ocean basins and age constraints of the ridge, J. Geophys. Res., 117, doi:10.1029/2011JB008805.
Krishna, K. S., J. M. Bull, and R. A. Scrutton (2001), Evidence for multiphase folding of the central Indian Ocean lithosphere, Geology, 29, 715–718, doi:10.1130/0091-7613(2001).
Krishna, K. S., J. M. Bull, and R. A. Scrutton (2009), Early (pre-8 Ma) fault activity and temporal strain accumulation in the central Indian Ocean, Geology, 37, 27-230.
24
Krishna, K. S., D. Gopala Rao, M. V. Ramana, V. Subrahmanyam, K. V. L. N. S. Sarma, A. I. Pilipenko, V. S. Scherbakov, and I. V. Radhakrishna Murthy (1995), Tectonic model for the evolution of oceanic crust in the northeastern Indian Ocean from the Late Cretaceous to early Tertiary, J. Geophys. Res., 100, 20,011-20,024.
McGuire, J. J., and G. C. Beroza, (2012), A rogue earthquake off Sumatra, Science, 336, 1118-1119.
Meng, L., J.-P. Ampuero, J. Stock, Z. Duputel, Y. Luo, and V. C. Tsai (2012), Earthquake in a maze: Compressional rupture branching during the 2012 Mw 8.6 Sumatra earthquake, Science, doi:10.1126/science.1224030.
Naini, B. R., and S. L. Eittreim (1974), Appendix II. Marine geophysical survey (Site 214 DSDP) on the Ninetyeast Ridge, Indian Ocean, Init. Repts. DSDP, 22, 843-849.
Newman, J. S., and J. G. Sclater (1988), Site surveys of the central and southern Ninetyeast Ridge for the Ocean Drilling Program, Leg 121, UTIG Technical Rept. 74, University of Texas, Austin, TX, 137 pp.
Norton, I. O., and J. G. Sclater (1979), A model for the evolution of the Indian Ocean and the breakup of Gondwanaland, J. Geophys. Res., 84, 6803-6830.
Petroy, D. E., and D. A. Wiens (1989), Historical seismicity and implications for diffuse plate convergence in the northeast Indian Ocean, J. Geophys. Res., 94, 12,301-12,319.
Pilipenko, A. I. (1996), Fracture zones of the Ninetyeast Ridge area, Indian Ocean, Geotectonics, 30, 441-451.
Robinson, D. P., C. Henry, S. Das, and J. H. Woodhouse (2001), Simultaneous rupture along two conjugate planes of the Wharton Basin earthquake, Science, 292, 1145-1148.
Royer, J.-Y., and Gordon, R. G. (1997), The motion and boundary between the Capricorn and Australian plates, Science, 277, 268-1274.
Royer, J.-Y., J. W. Peirce, and J. K. Weissel (1991), Tectonic constraints on the hot-spot formation of Ninetyeast Ridge, Proc. ODP, Sci. Res., 121, 763-776.
Royer, J.-Y., and D. T. Sandwell (1989), Evolution of the eastern Indian Ocean since the Late Cretaceous: Constraints from Geosat altimetery, J. Geophys. Res., 94, 13,755-13,782.
Sager, W.W. et al. (2007), Cruise Report KNOX06RR R/V Roger Revelle, 82 pp. (http://earthref.org/erda/1172).
Sager, W. W., C. F. Paul, K. S. Krishna, M. S. Pringle, A. E. Eisin, F. A. Frey, D. Gopala Rao, and O. Levchenko (2010), Large fault fabric of the Ninetyeast Ridge implies near-spreading ridge formation, Geophys. Res. Lett., 37, doi:10.1029/ 2010GL044347.
25
Satriano, C., E. Kiraly, P. Bernard, and J.-P. Vilotte (2012), The 2012 Mw 8.6 Sumatra earthquake: Evidence of westward sequential seismic ruptures associated to the reactivation of a N-S ocean fabric, Geophys. Res. Lett., 39, doi:10.1029/2012GL052387.
Shipboard Scientific Party (1974), Site 253, Init. Repts. DSDP, 26, 153-231.
Shipboard Scientific Party (1989a), Ninetyeast Ridge underway geophysics, Proc. ODP, Init. Repts., 121, 93-107.
Shipboard Scientfic Party (1989b), Back pocket foldouts, Proc. ODP, Init. Repts, 121.
Smith, W. H. F., and D. T. Sandwell (1997), Global sea floor topography from satellite altimetry and ship depth soundings, Science, 277, 1956–1962.
Stein, C. A., S. Cloetingh, and R. Wortel (1990), Kinematics and mechanics of the Indian Ocean diffuse plate boundary zone, Proc. ODP. Sci. Res., 116, 261-277.
Stein, C., S. Cloetingh, and R. Wortel (1989), Seasat-derived gravity constraints on stress and deformation in the northeastern Indian Ocean, Geophys. Res. Lett., 16, 823-826.
Stein, S., and E. A. Okal (1978), Seismicity and tectonics of the Ninetyeast Ridge area: evidence for internal deformation of the Indian Plate, J. Geophys. Res., 83, 2233-2245.
Tinnon, M. J., W. E. Holt, and A. J. Haines (1995), Velocity gradients in the northern Indian Ocean inferred from earthquake moment tensors and relative plate velocities, J. Geophys. Res., 100, 24,315-24,329.
Veevers, J. J. (1974), Seismic profiles made underway on Leg 22, Init. Repts. DSDP, 22, 351-367.
Weissel. J. K., R. N. Anderson, and C. A. Gellar (1980), Deformation of the Indo-Australian plate, Nature, 287, 284-291.
Wiens, D. A., S. Stein, C. DeMets, R. G. Gordon, and C. Stein (1986), Plate tectonic models for Indian Ocean "intraplate" deformation, Tectonophysics, 132, 37-48.
26
Figure Captions
Figure 1. Ninetyeast Ridge environs and tectonic setting. Background plot is satellite-predicted
bathymetry [Smith and Sandwell, 1997]. Shaded areas around the NER represent diffuse plate
boundaries (I-C=India-Capricorn, C-A=Capricorn-Australia, I-A=India-Australia; DTJ=diffuse triple
junction) [Royer and Gordon, 1997]. Stippled zone northwest of the NER indicates the area of
lithospheric compression resulting from India-Capricorn convergence [Krishna et al., 2001; 2009]. Red
boxes show study sites. Red-filled circles denote Euler poles: IN-CP =India-Capricorn, IN-AU=India-
Australia, CP-AU=Capricorn-Australia [DeMets et al., 2010]. Red ellipses show pole 95% confidence
regions. Red filled square is updated IN-CP pole from Bull et al. [2010]. ASP=Amsterdam-St. Paul
Plateau; BR=Broken Ridge; CR=Carlsberg Ridge; CLR=Chagos-Laccadive Ridge; JT=Java Trench;
SEIR=Southeast Indian Ridge.
Figure 2. Earthquakes in the Ninetyeast Ridge vicinity. Left panel shows epicenters from 1970-2012
with symbols scaled with body-wave magnitude (scale at bottom). Right panel shows focal mechanisms
for the same period. Background is satellite-predicted bathymetry [Smith and Sandwell, 1997]. Data
source: International Seismological Centre (2013).
Figure 3. Shaded relief bathymetry and tectonic interpretation maps of the Site 758 survey. High detail
area is covered with multibeam echosounder data, whereas low-resolution data are satellite predicted
depths [Smith and Sandwell, 1997]. (left) Bathymetry. Thin black lines are seismic lines. Open circle
shows location of ODP Site 758. Bathymetry contours are at 200-m intervals and contour labels are in
km. (right) Tectonic interpretation. Red dashed lines show bathymetric lineaments. Blue lines
highlight contours with sharp bends. Faults observed in seismic profiles are marked by symbols along
seismic track lines; gray symbols denote less certain interpretations. Circled letters identify seismic
lines in Figure 4 whereas white track segments denote the extent of the seismic profiles shown in that
figure.
Figure 4. Seismic line examples showing active faults from the Site 758 survey. Seismic sections plot
two-way travel time versus distance. Arrows mark faults. Gray arrows denote probable, but less certain
fault interpretations. Locations of seismic sections are shown in Figure 3 (letters A, B, C denote line
segments labeled in that figure). Numbers identify faults mentioned in the text.
Figure 5. Fault interpretation map for single-channel seismic data from cruise RC2705 near ODP Site
758. Fault symbols are plotted on seismic lines. High-resolution bathymetry covers the area shown in
27
Figure 3. White line shows the location of the seismic line shown in Figure 6. Low-resolution
bathymetry contours are from satellite predicted bathymetry [Smith and Sandwell, 1997].
Figure 6. Single channel seismic profile from R/V Robert Conrad cruise RC2705. Conventions as in
Figure 4.
Figure 7. Shaded relief bathymetry map (left) and tectonic interpretation (right) of the Site 216 survey.
White lines denote seismic profiles shown in Figure 8. Open circle shows location of ODP Site 216.
Blue stars show locations of aftershock epicenters associated with the 11 April 2012 Wharton Basin
earthquake.
Figure 8. Seismic line examples showing active faults from the Site 216 survey. Conventions as in
Figure 4. Locations of seismic sections shown in Figure 7.
Figure 9. Shaded relief bathymetry map (left) and tectonic interpretation (right) of the Site NER2 survey
area. White lines denote seismic profiles shown in Figure 10.
Figure 10. Seismic line examples showing active faults from the Site NER2 survey. Conventions as in
Figure 4. Locations of seismic sections shown in Figure 9.
Figure 11. Shaded relief bathymetry map (left) and tectonic interpretation (right) of the Site NER3
survey. White lines denote seismic profiles shown in Figure 12.
Figure 12. Seismic line examples showing active faults from the Site NER3 survey. Conventions as in
Figure 4. Locations of seismic sections shown in Figure 11.
Figure 13. Shaded relief bathymetry map (left) and tectonic interpretation (right) of the Site 214 survey.
White lines denote seismic profiles shown in Figure 14. Open circle shows location of Site 214.
Figure 14. Seismic line examples showing active faults from the Site 214 survey. Conventions as in
Figure 4. Locations of seismic sections shown in Figure 13.
Figure 15. Shaded relief bathymetry around Site 757 (left) and Site 756 (right) and fault interpretations
from single-channel seismic data. Heavy line shows ship track of cruises RC2708 (left) and RC2707
(right). Site 757 bathymetry data are multibeam data from R/V Sonne [Flueh and Richert, 1998].
Dashed line in Site 757 survey shows ship track for seismic data collected by the D/V JOIDES
Resolution during ODP Leg 121 [Shipboard Scientific Party, 1989a; 1989b]. Site 756 bathymetry is
28
predicted from satellite gravity [Smith and Sandwell, 1997]. Interpreted fault symbols are as in other
figures (see Figure 3). White portions ship tracks are profiles shown in Figure 16.
Figure 16. Single channel seismic profiles from R/V Robert Conrad cruises RC2707 and RC2708.
Conventions as in Figure 4.
Figure 17. Shaded relief bathymetry (left) and tectonic interpretation (right) maps of the Site 253 survey.
White lines show seismic profiles shown in Figure 18. Open circle shows location of Site 253.
Figure 18. Seismic line examples showing active faults from the Site 253 survey. Conventions as in
Figure 4. Locations of seismic sections shown in Figure 17.
Figure 19. Tectonic sketch of relative plate motions, plate boundaries, and inferred fault motions for the
Ninetyeast Ridge. (A) Relative plate motions calculated from plate pair Euler poles [DeMets et al.,
2010]. Arrows show azimuth and sense of motion. Inward pointing arrows denote compression whereas
outward-pointing arrows indicate extension. Black arrows show Capricorn-Australia motion (C-A),
middle gray arrows represent India-Australia motion (I-A), and light gray arrows show India-Capricorn
motion (I-C). To infer extension and convergence, the plates are assumed to have the configuration
shown in Figure 1 with the India-Australia and Capricorn-Australia boundaries oriented N-S but the
India-Capricorn boundary trending E-W. In the northernmost NER, Capricorn-Australia motion is not
shown because this is an unlikely pairing in this area. The same is true for India-Australia at the
southernmost sites. (B) Sketch of plate boundaries around the NER. The large dot pattern shows the
zone of India-Capricorn compression [Krishna et al., 2001; 2009], the stippled area denotes the India-
Australia boundary, and large and small dot patterns indicates the Capricorn-Australia boundary with the
latter being a zone of extension and the former, a zone of compression [Royer and Gordon, 1997].
Arrows indicate relative motions predicted by the three plate model. (C) Fault interpretations at survey
sites. Boxed diagrams illustrate relative plate motions at the study sites and the fault response.
Numbers are site identifiers. The horizontal dashed line represents an E-W fault. Heavy arrows indicate
plate motions predicted by three-plate model (IN=India, CP=Capricorn, AU=Australia; Royer and
Gordon [1997]). Small arrows indicate motions along the faults; dark arrows denote the sense of
primary motion and gray arrows represent secondary sense of motion. Elliptical diagram for Sites 758-
216 shows Riedel shears appropriate for that area.
29
Figure -1
30
Figure 2
31
Figure 3
32
Figure 4
33
Figure 5
Figure 6
34
Figure 7
35
Figure 8
36
Figure 9
Figure 10
37
Figure 11
38
Figure 12
39
Figure 13
40
Figure 14
41
Figure 15
42
Figure 16
43
Figure 17
44
Figure 18
45
Figure 19