Embed Size (px)
Citation preview
Active Disk Meets Flash: A Case for Intelligent SSDs
Sangyeun Cho (University of Pittsburgh), Chanik Park (Samsung Electronics Co., Ltd.),Hyunok Oh (Hanyang Univesity), Sungchan Kim (Chonbuk National University),
Youngmin Yi (University of Seoul) and Gregory R. Ganger (Carnegie Mellon University)
CMU-PDL-11-115
November 2011
Parallel Data LaboratoryCarnegie Mellon UniversityPittsburgh, PA 15213-3890
Abstract
Intelligent solid-state drives (iSSDs) allow execution of limited application functions (e.g., data filtering or aggregation) on theirinternal hardware resources, exploiting SSD characteristics and trends to provide large and growing performance and energyefficiency benefits. Most notably, internal flash media bandwidth can be significantly (2–4× or more) higher than the externalbandwidth with which the SSD is connected to a host system, and the higher internal bandwidth can be exploited within an iSSD.Also, SSD bandwidth is quite high and projected to increase rapidly over time, creating a substantial energy cost for streamingof data to an external CPU for processing, which can be avoided via iSSD processing. This paper makes a case for iSSDs bydetailing these trends, quantifying the potential benefits across a range of application activities, describing how SSD architecturescould be extended cost-effectively, and demonstrating the concept with measurements of a prototype iSSD running simple data scanfunctions. Our analyses indicate that, with less than a 4% increase in hardware cost over a traditional SSD, an iSSD can provide2–4× performance increases and 5–27× energy efficiency gains for a range of data-intensive computations.
Acknowledgements: This collaborative work was done while Sangyeun Cho and Chanik Park were visiting PDL in 2011. We also thankthe members and companies of the PDL Consortium (including APC, EMC, Facebook, Fusion-IO, Google, Hewlett-Packard, Hitachi, IBM, Intel,Microsoft, NEC, NetApp, Oracle, Panasas, Riverbed, Samsung, Seagate, STEC, Symantec, and VMware) for their interest, insights, feedback, andsupport.

Keywords: Active Storage, Data-Intensive Computing, Energy-Efficient Data Processing, Reconfig-urable Processor.
1 Introduction
A large and growing class of applications process large quantities of data to extract items of interest, identifytrends, and produce models of and insights about the data’s sources [7, 14]. Increasingly, such applicationsfilter large quantities (e.g., TBs) of semi-structured data and then analyze the remainder in more detail.One popular programming model is Google’s MapReduce [12] (as embodied in the open source Hadoopsystem [34]), in which a data-parallel map function is generally used to filter data in a grep-like fashion.Another builds on more traditional database systems and makes extensive use of select and project functionsin filtering structured records. A common characteristic is streaming through data, discarding or summariz-ing most of it after a small amount of processing.
Over a decade ago, research efforts proposed and explored embedding of data-processing functionalitywithin storage or memory components as a way of improving performance for such applications. For exam-ple, there were several proposals for so-called “active disks” [1, 18, 29, 27, 28], in which limited applicationfunctions could be executed on a disk drive’s embedded CPU to increase parallelism and reduce reliance onhost bandwidth at marginal cost. Also, there were proposals for executing functions on processing elementscoupled with memory banks [26, 24], with similar goals. In developing these ideas, researchers developedprototypes, programming models, and example application demonstrations. Although interesting, few realsystems adopted these proposals, for various technical reasons including manufacturing complexity (espe-cially for active RAM proposals) and independent advances that marginalized the benefits (e.g., distributedstorage over commodity multi-function servers [4, 23, 10], which end up having conceptual similarities tothe active disk concept).
The active disk concepts are poised for a comeback, in the context of flash-based SSDs, which areemerging as a viable technology for large-scale use in systems supporting data-intensive computing. Mod-ern and projected future SSDs have characteristics that make them compelling points for embedded dataprocessing that filters/aggregates. In particular, their internal bandwidths often exceed their external band-widths by factors of 2–4×, and the bandwidth growth over time is expected to grow rapidly due to increasedinternal parallelism. Even without the internal-to-external bandwidth multiplier, the rates themselves aresufficiently high that delivering them all the way to a main CPU requires substantial energy; filtering mostof it near the flash channels would avoid that energy usage.
This paper develops the case for and an architecture for the result, which we refer to as “intelligentSSDs” (iSSDs). We detail the relevant SSD technology characteristics and trends that create the opportunityand discuss their architectural consequences. Combined with analyses of ten data-intensive applicationkernels, the internal parallelism (via multiple flash memory channels) and bandwidths of modern and futureSSDs push for optimized compute elements associated with each flash memory channel. We focus on useof low-power reconfigurable stream processors for this role.
The performance and energy efficiency benefits of iSSDs are substantial. We quantify these benefitsand explore the design space via analytical performance and energy models, as well as some demonstrationexperiments with a prototype iSSD. Compared to the traditional approach of executing the entire applica-tion on a primary server CPU, the iSSD approach offers 2–4× higher throughput and 5–27× more energyefficiency. We show that the iSSD approach provides much of this benefit even when compared to alternateapproaches to improving efficiency of data-intensive computing, including heterogeneous elements (e.g.,GPUs or the same reconfigurable stream processors we envision for iSSDs) in the server CPU [33], re-liance on so-called “wimpy” nodes [2], or embedding the processing in the RAM subsystem as in proposalsdiscussed above. All of the bandwidth benefits and half of the energy efficiency can only be achieved byexploiting the SSD-internal bandwidth and avoiding the need to move the data to other components.
1
2 Background and Related Work
2.1 Active devices for data-intensive computing
The concept of “active devices”, in which limited application functionality is executed inside a memory orstorage component, has been well-developed over the years. Active disk designs, especially, were motivatedand studied extensively. The early proposals laid out the case for exploiting the excess computing cyclesof the hard disk drive (HDD) controller’s embedded processor for useful data processing, especially filterand aggregation functions. For example, Riedel et al. [28] showed that, by aggregating the bandwidth andcomputing capabilities of ten (emulated) HDDs, measured performance improves more than 2.2×, 2.2× and2.8× for workloads like nearest-neighbor search, frequent set mining and image registration, respectively.Substantial benefits have also been demonstrated for a range of other data-intensive workloads, includingdatabase scan, select, and aggregation operations, satellite data processing, image processing, and search ofcomplex non-indexed data [1, 27, 17, 18]. Active memory system designs (sometimes called “intelligentRAM”) have also been proposed and studied [26, 24], allowing simple functions to transform and filterranges of memory within the memory system without having to move it to the main CPU.
Programming models for active disks were developed and shown to fit such data-parallel processingtasks, addressing both the data delivery and software safety issues; these same models should be suitable foriSSDs. As a representative example, Acharya et al. [1] proposed a stream-based programming frameworkand the notion of sandboxed “disklets” (disk-resident codes) for processing data ranges as they are madeavailable by the underlying device firmware.
Active devices have not become the norm, for various reasons. In the case of active memories, complexmanufacturing issues and memory technology changes arose. In the case of active disks, the demonstratedbenefits were primarily from parallelized data-local execution; for many data-intensive computing activities,those benefits have instead been realized by spreading stored data across collections of commodity servers(each with a few disks) and partitioning data processing across those same servers [4, 23, 10]. The sameapproach has been more efficiently implemented with so-called wimpy nodes and low-power CPUs [2],as well. But, we believe that flash-based SSDs have characteristics (e.g., parallel channels and very highinternal bandwidths) that make “active-ness” compelling, where it wasn’t for these other devices.
2.2 Architecture and evolution of SSDs
Figure 1 illustrates the general architecture of an SSD and how SSDs have evolved with the introductionof new higher bandwidth host interfaces [31]. Key hardware components in an SSD are the host interfacecontroller, embedded CPU(s), on-chip SRAM, DRAM and flash memory controllers connected to the flashchips. On top of the hardware substrate runs the SSD firmware commonly referred to as flash translationlayer (or FTL).
The host interface controller supports a specific bus interface protocol such as SATA, SAS and PCIExpress (PCI-e). The host interface bandwidth has steadily increased, from PATA (1.5 Gbps max) to SATA(3 to 6 Gbps) in desktop systems and from SCSI (maxed out at about 5 Gbps) to SAS (about 5 Gbps max)in enterprise applications. PCI-e has a high bandwidth of 2 to 8 Gbps per lane and shorter latency than otherinterfaces.
The CPU(s) and SRAM provide the processing engine for running FTL. SRAM stores time-criticaldata and codes. Typically, the CPU is a 32-bit RISC processor clocked at 200 to 400 MHz. Dependingon the application requirements, multiple CPUs are provided to handle host requests and flash managementtasks concurrently. DRAM stores user data and FTL metadata, and is operated at a clock rate of 667 MHzor higher.
Flash memory controllers (FMCs) are responsible for data transfer between flash memory and DRAM
2

…
…
Flash Channel #0
Flash Channel #(nch–1)
NAND Flash Array
… H
ost I
nter
face
Con
trol
ler
CPU(s) CPUs
DRAM Controller
DRAM
Hos
t
On-Chip SRAM
On-Chip SRAM
…
Flash Memory
Controller ECC
Flash Memory
Controller ECC
Time frame Characteristics
2007–2008 4-way, 4 channels, 30–80 MB/s R/W perfor-mance; mostly SLC flash based;
2008–2009 8–10 channels, 150–200+ MB/s performance(SATA, consumer); 16+ channels, 600+ MB/sperformance (PCI-e, enterprise); use of MLCflash in consumer products;
2009–2010 16+ channels, 200–300+ MB/s performance(SATA 6 Gbps); 20+ channels, 1+ GB/s per-formance (PCI-e); adoption of MLC in enter-prise products;
2010– 16+ channels; wider acceptance of PCI-e;
Table 2: SSD evolution with new host interface standards.
NAND Flash Memory. An array of NAND flash memory is used as the permanent storage medium for user
data. A flash memory is typically comprised of multiple “blocks”, each of which has multiple “pages”. A block
is a unit of “erase” operation while a page is associated with “read” and “write” operations. Each flash memory
cell can store a single bit (“single-level cell” or SLC), two bits (“multi-level cell” or MLC) or even three bits
(“three-level cell” or TLC). To aggressively improve capacity per dollar, increasingly more SSDs are built with
MLC or TLC chips. Unfortunately, with more advanced technologies and with more bits per cell, the number
of writes (erases) we can apply to flash memory decreases substantially. Today, write endurance of SLC, MLC
and TLC chips are only about 105, 104, and 103. The NAND flash interface has evolved from 40 Mbps single
data rate to 400 Mbps double data rate; as increasingly higher performance is desired, the bandwidth will be
raised even further [15] (Figure 1).
NAND Flash Management Software. FTL parses incoming host commands and maps a logical block address
to a physical address on NAND flash memory for performance and reliability reasons. At a high level, FTL
has evolved from relatively simple HDD emulation to a vertically optimized complex software. In the most
common form of SSD deployment in today’s systems, SSDs are accessed via the traditional block interface
such as ATA and SCSI. This allows the existing storage software stack (e.g., file systems) developed for HDDs
to be reused without modification.
The simple block interface is evolving to incorporate support to address SSD-specific issues. The most
notable example is the “TRIM” command, which is included in the ATA standard [16]. Adopting the notion of
“objects” and the object storage device (OSD) interface [17] can further enhance the storage interface. With the
OSD interface, objects abstract physical storage management and attributes to convey and interpret application-
level semantics. The OSD interface can help SSDs manage resources and serve applications better in spite of
changing flash parameters.
7
Figure 1: General architecture of an SSD (left): The dashed box is the boundary of the controller chip. SSD evolutionwith new host interface standards (right).
(or host interface). They also guarantee data integrity based on an error correction code (ECC). As NANDflash memory is continuously scaled down and adopt two-bits- or three-bits-per-cell schemes, the error rategrows and a stronger ECC capability is required. As a result, the ECC logic has become a dominant part ofan SSD controller chip [35]. For high performance, FMCs utilize multi-way interleaving over multiple flashchips on a shared I/O channel as well as multi-channel interleaving. FMCs are implemented with dedicatedhardware for efficiency or an application-specific instruction-set processor (ASIP) to support diverse flashcommands.
1
10
100
10
100
1,000
10,000
100,000
2005 2006 2007 2008 2009 2010 2011 2012 2013 2014 2015
CPU
Ba
nd
wid
th (
MB
/s)
CP
U t
hro
ug
hp
ut
(GH
z ×
co
res
)
HDD
SSD
NAND flash
Host i/f
24 ch.
16 ch.
8 ch.
4 ch.
Year
Figure 2: Bandwidth trends of key hardware components.
The NAND flash memory interface hasevolved from 40 Mbps single data rate to 400 Mbpsdouble data rate; as higher performance is desired,the bandwidth will be raised even further [31].Figure 2 plots the bandwidth trends of the HDD,NAND flash memory, SSD, host interface and CPU.The bandwidth improvement in NAND flash, espe-cially resulting from increased use of multiple inde-pendent memory channels (with 8–16 being com-mon today) for parallel data retrieval, results inmuch higher raw internal and external bandwidththan HDDs.
SSD bandwidth characteristics are what leadus to explore the iSSD concept. The very high band-
widths mean that substantial bandwidth capability and energy is required to deliver all data to an externalprocessing unit, both of which could be reduced by filtering and/or aggregating within the SSD. Indeed, mod-ern external SSD bandwidths lag raw internal bandwidths significantly—differences of 2–4× are common.So, an iSSD could process data 2–4× faster just by being able to exploit the internal data rate. Moreover,the natural parallelism inherent in SSD’s use of multiple channels couples well with parallelized data streamprocessing.
2.3 iSSD-relevant workload characteristics
iSSDs would be expected to provide benefits for data-intensive applications that explore, query, analyze,visualize, and, in general, process very large data sets [7, 14, 8]. In addition to simple data filtering andaggregation, some emerging data mining applications are characterized by substantial computation. Thissubsection examines a number of common data-intensive application kernels to gain insight into their rele-
3
NAME [SOURCE] DESCRIPTION INPUT SIZE CPB∗ IPB† CPI‡
word count [36] Counts the number of unique word occurrences 105MB 90.0 87.1 1.0linear regression [36] Applies linear regression best-fit over data points 542MB 31.5 40.2 0.8
histogram [36] Computes the RGB histogram of an image 1,406MB 62.4 37.4 1.7string match [36] Pattern matches a set of strings against data streams 542MB 46.4 54.0 0.9
ScalParC [22] Decision tree classification 1,161MB 83.1 133.7 0.6k-means [22] Mean-based data partitioning method 240MB 117.0 117.1 1.0
HOP [22] Density-based grouping method 60MB 48.6 41.2 1.2Naı̈ve Bayesian [22] Statistical classifier based on class conditional indepen-
dence126MB 49.3 83.6 0.6
grep (v2.6.3) Searches for a pattern in a file 1,500MB 5.7 4.6 1.2scan (PostgreSQL) Finds records meeting given conditions from a database
table1,280MB 3.1 3.9 0.8
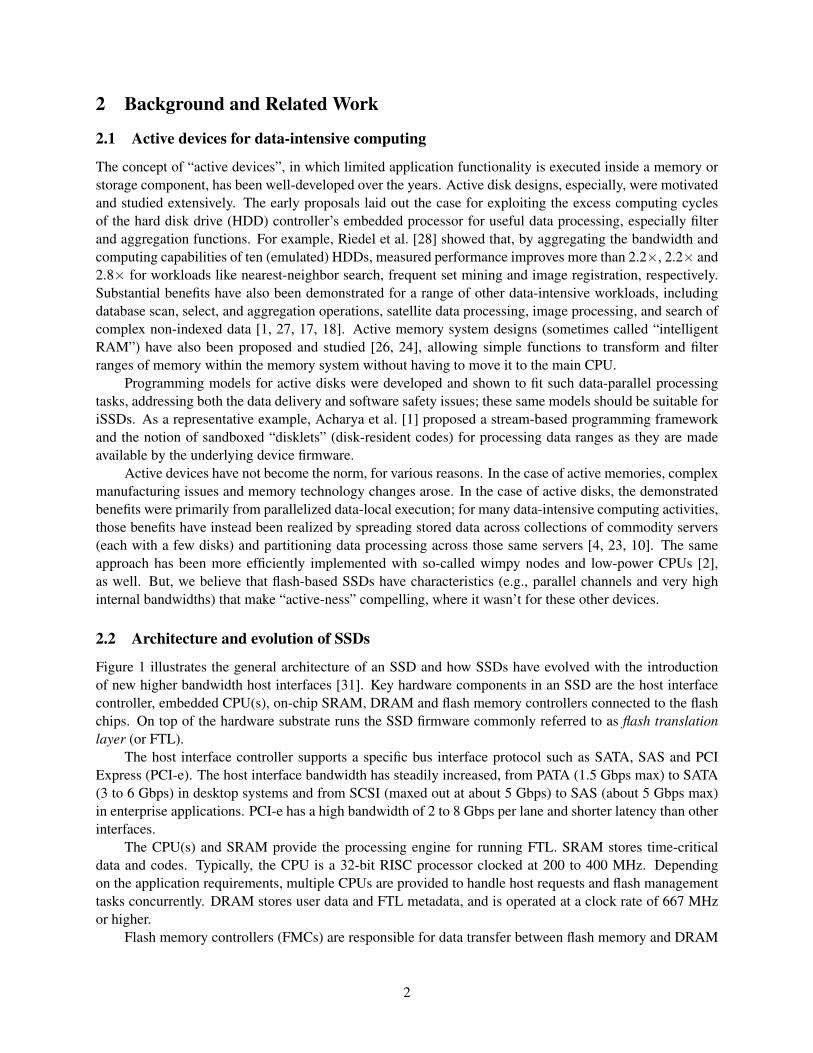
Table 1: Example data-intensive kernels. Measurements were made on a Linux box with a Nehalem-class processorusing Intel’s VTune. Programs were compiled using icc (Intel’s C/C++ compiler) with the -O3 flag. Measurementresults in the table do not include the time to handle file I/O. ∗Cycles Per Byte. †Instructions Per Byte. ‡Cycles PerInstruction.
vant characteristics.Table 1 lists the kernels.1 We show three metrics in the table to characterize and highlight the data
processing complexity and the architectural efficiency. Among the three metrics, IPB captures the dataprocessing complexity of a kernel. If IPB is high (e.g., k-means), implying that much work is needed toprocess a given input data, the workload is compute-intensive. In another example, grep and scan executewell less than ten instructions on average to process a byte. IPB is determined primarily by the specific dataprocessing algorithm, the expressiveness of the instruction set, and the compiler’s ability to produce efficientcodes.
By comparison, CPI reveals, and is determined by, the hardware architecture efficiency. On the testbedwe used, the ideal CPI is 0.20 to 0.25 because the processor is capable of issuing four to five instructionsper cycle. The measured CPI values range from 0.60 (ScalParC and Naı̈ve Bayesian) to 1.7 (histogram).Compared with the ideal CPI, the values represent at least 2× and up to 8.5× efficiency degradation. Thereare three main reasons for the inefficiency: high clock frequency (i.e., relatively long memory latency), poorcache performance, and frequent branch mispredictions. According to Ozisikyilmaz et al. [25] the L2 cachemiss rates of the classification kernels in Table 1 are as high as 10% to 68%. Moreover, HOP has a branchmisprediction rate of 10%, considerably higher than other workloads in the same benchmark suite.
Another interesting observation is that kernels with a low IPB tend to have a high CPI. Kernels with anIPB smaller than 50 have the average CPI of 1.14 while the the average CPI of kernels with an IPB above50 is only 0.82. We reason that high-IPB kernels are compute-intensive and utilize the available functionalunits and reuse the data in the cache memory relatively well. On the other hand, low-IPB kernels spendfew instructions per unit data and the utilization of the hardware resources may slide (e.g., cache performspoorly on streams).
Lastly, CPB combines IPB and CPI (CPB = IPB × CPI), and is the data processing rate of a platform.Hence, it is our goal to minimize CPB with the proposed ISSD. For the kernels we examined, CPB rangesfrom less than ten (scan and grep) to over a hundred (k-means).
1A few kernels have been adapted to run on both an x86 platform and our ARM-based simulator platform described in Sec-tion 4.3.
4
…
R0,0
RN-1,1
…
R0,0
…
ALU0
ALUN-1
R0,1
zero0 zeroN-1
zero
result ALU0
enable
…
…
ALU0
ALUN-1
…
R0,0
RN-1,1 RN-1,0
…
ALU0
ALUN-1
RN-1,1
zero
result ALUN-1 …
ALU0
ALUN-1
enable
Main
Controller
Config.
Memory
Scratchpad SRAM Interface
On-Chip
SRAM CPUs …
Host In
terf
ace C
trl
CPUs
DRAM
Controller
On-Chip
SRAM
nssd_cpu cores
…
… nch channels
Flash
Memory
Controller
EC
C
Flash
Memory
Controller
EC
C
Bus
Bridge
DMA
Flash
Interface
Stream
Processor
Embedded
Processor
Scratchpad
SRAM
Figure 3: The organization of an iSSD’s FMC (in red box) and the reconfigurable stream processor (right).
3 Intelligent SSDs
iSSDs offer the earliest opportunity to process data after they are retrieved from the physical storage medium.This section describes the iSSD—its hardware architecture and software architecture. Feasible data process-ing strategies as well as challenges to exploit iSSDs are also discussed.
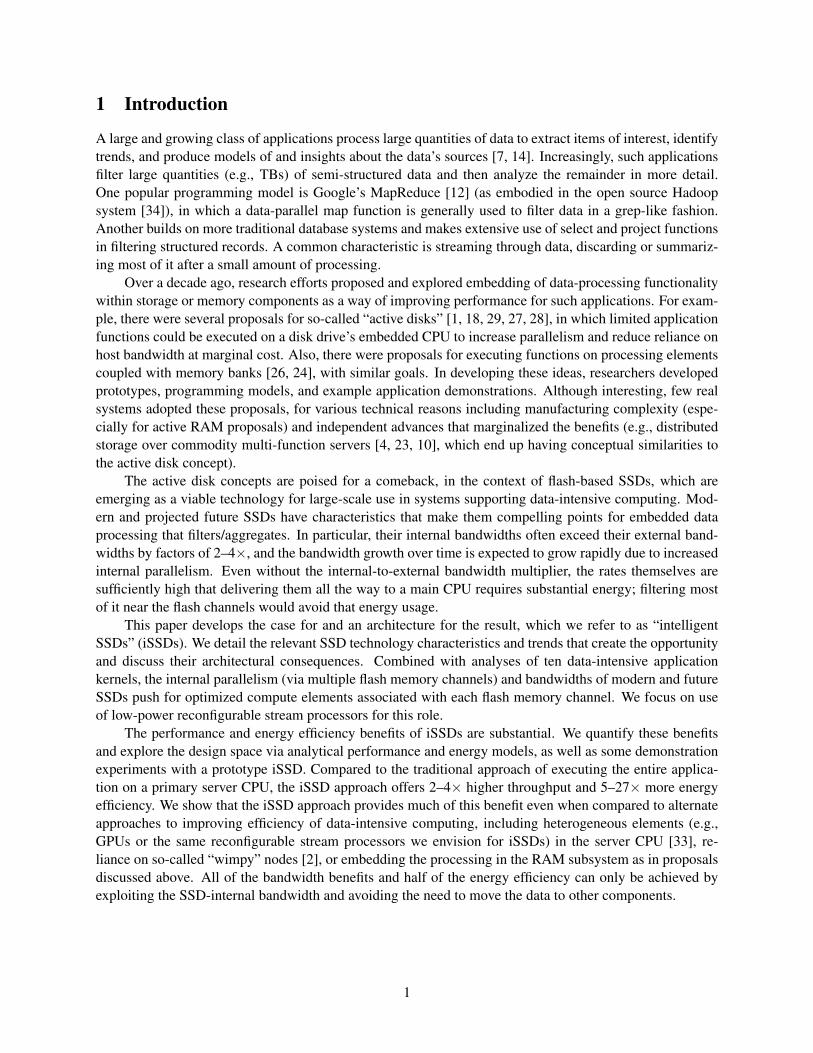
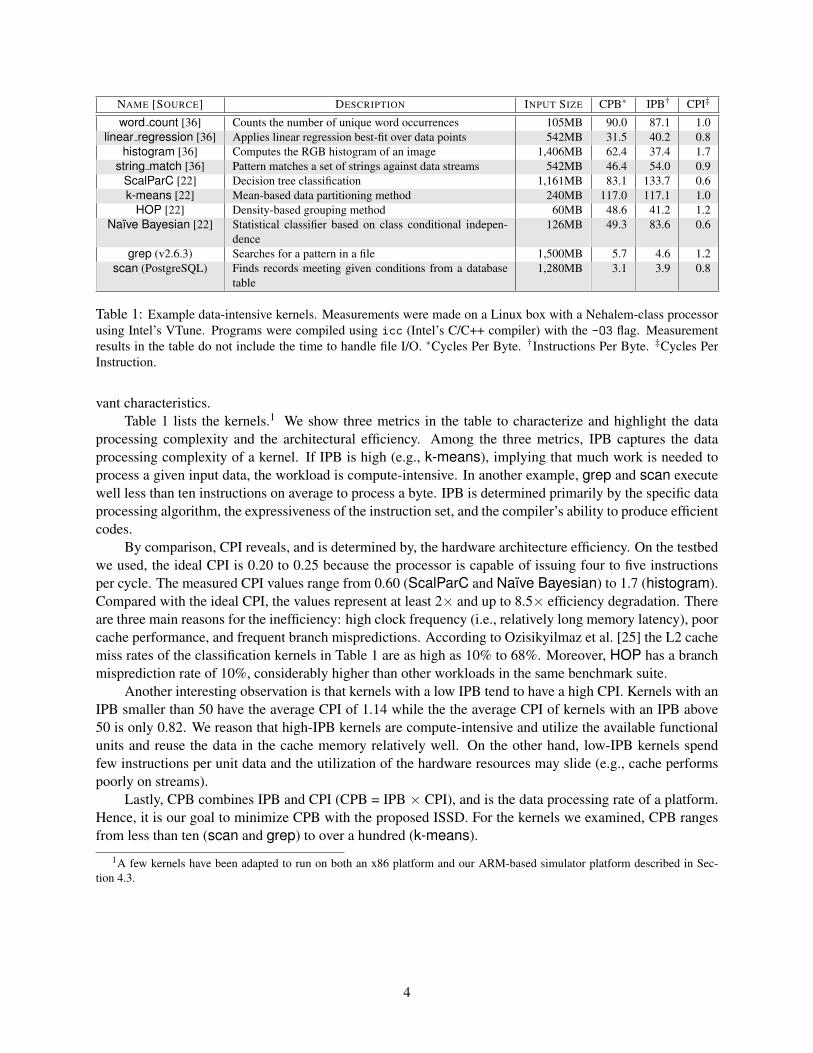
3.1 Hardware architectureThe main difference in hardware between a regular SSD and an iSSD is their compute capabilities; iSSDsmust provide substantially higher compute power to translate the raw flash memory bandwidth into highdata processing rates. In conventional HDDs and SSDs, in-storage compute power is provisioned to meetthe firmware performance requirements (e.g., host command processing, block mapping, error handling).The active disk work [1, 18, 27] optimistically predicted that future storage controller chips (in HDDs)will have increasingly more excess compute capabilities. However, that didn’t happen because there is noimmediate merit for a storage vendor to add higher horsepower to a device than needed at cost. We arguethat the iSSD internal architecture must be designed specially and offer both high raw performance andflexible programmability.
There are at least two ways to add compute resources in the SSD datapath: by integrating more (pow-erful) embedded CPUs and by augmenting each FMC with a processing element. While we consider both inthis work, we note that SSD designers have kept adding more flash memory channels to continue the SSDbandwidth growth. Hence, it is necessary to scale the amount of compute power in the iSSD according to thenumber of flash memory channels, justifying the second approach. This approach has an added benefit of notincreasing the bandwidth requirements on the shared DRAM. This work proposes to employ a customizedASIP and a reconfigurable stream processor as the FMC processing element, as shown in Figure 3.
The diagram in the bottom shows the components inside an FMC—flash interface, scratchpad SRAM,DMA, embedded processor, reconfigurable stream processor and bus bridge. Raw data from the flash mem-ory are first stored in the scratchpad SRAM before data processing begins. Data are then processed by theper-FMC embedded processor (and the stream processor). The embedded processor has a custom instruc-tion set for efficient data processing and small area cost. However, as Table 1 suggests, certain algorithmsmay still require many cycles for each input byte and may render the FMC stage a serious bottleneck. Forexample, word count has an IPB of 87. If the flash memory transfers data at 400 MB/s and the embeddedprocessor is clocked at 400 MHz, the actual achievable data processing rate would be slowed down by thefactor of 87, compared to the full raw data bandwidth (assuming a CPI of 1)!
In order to effectively increase the FMC’s data processing rate, we propose to incorporate a reconfig-urable stream processor, highlighted in the right diagram. Once configured, the stream processor performs
5

for each stream input a
//Compute SX, SY, SYY, SXX, SXY
SX += a.x; SXX += a.x * a.x;
SY += a.y; SYY += a.y * a.y;
SXY += a.x * a.y;
add
mul add
add
mul add
mul add
a.x
a.x a.x
a.y
a.y a.y
a.x a.y
for each stream input a
for each cluster centroid k
if (a.x-xk)^2 + (a.y-yk)^2 < min
min = (a.x-xk)^2 + (a.y-yk)^2;
sub mul a.x
sub mul
add
min
add
add 0
0
zero
x1,…,xk
a.y y1,…,yk
x1,…,xk
y1,…,yk
enable
enable
for each position a and b of
two strings A and B
if a == b then match_count ++;
if match_count == strlen(A) then
return true;
else return false;
cmp a
b
add
add 0
cmp
enable zero
0
Figure 4: Reconfigurable stream processor instances for linear regression, k-means and string match from left.
like dedicated hardware, achieving very high data processing rates and low power [11]. At the heart of thestream processor are an array of ALUs, configurable connections and the main controller. An ALU’s outputis either stored to the SRAM or forwarded to another ALU. How processed data flow within the processoris configurable (by programming the “configuration memory”). The main controller is responsible for theconfiguration and sequencing of operations. Figure 4 presents three example instances of the stream pro-cessor. For these examples, the CPB improvement rate is 3.4× (linear regression), 4.9× (k-means) and1.4× (string match).
Data processing with the proposed FMC is expected to be efficient. First, the stream processor exploitshigh fine-grained parallelism with multiple ALUs. Second, the embedded processor and the stream pro-cessor feed their data from a scratchpad memory, not cache. Third, the embedded processor has a shallowpipeline and does not suffer from a high branch misprediction penalty like the host CPU. Hence, the effec-tive average CPB achieved with the FMCs is expected to be very competitive. This observation is revisitedin Section 4.
Beyond FMCs, further data processing can be done by the embedded CPUs. The performance of theCPUs can be scaled with the core type (e.g., ARM7 vs. Cortex-A8), core count, and clock frequency.Because the CPUs see data from all flash memory channels, they can perform “wide-scope” tasks like theReduce stage of a MapReduce job. The performance of the embedded CPUs is limited by the shared DRAMbandwidth, however.
3.2 Software architecture
This section considers programming frameworks to utilize the proposed iSSD architecture efficiently. Sincean iSSD platform includes multiple heterogeneous processor cores, its programming framework shouldbe able to express parallelism for heterogeneous processors. Among many frameworks, for example,OpenCL [19] meets the requirements. It not only supports data parallel executions on each parallel devicebut also provides a unified programming framework to coordinate heterogeneous devices and host CPUs tocollaborate. Another framework that is particularly interesting to us is MapReduce [12]. It was developedprimarily for distributed systems and assumes that individual processing units (computers) read data from astorage device.
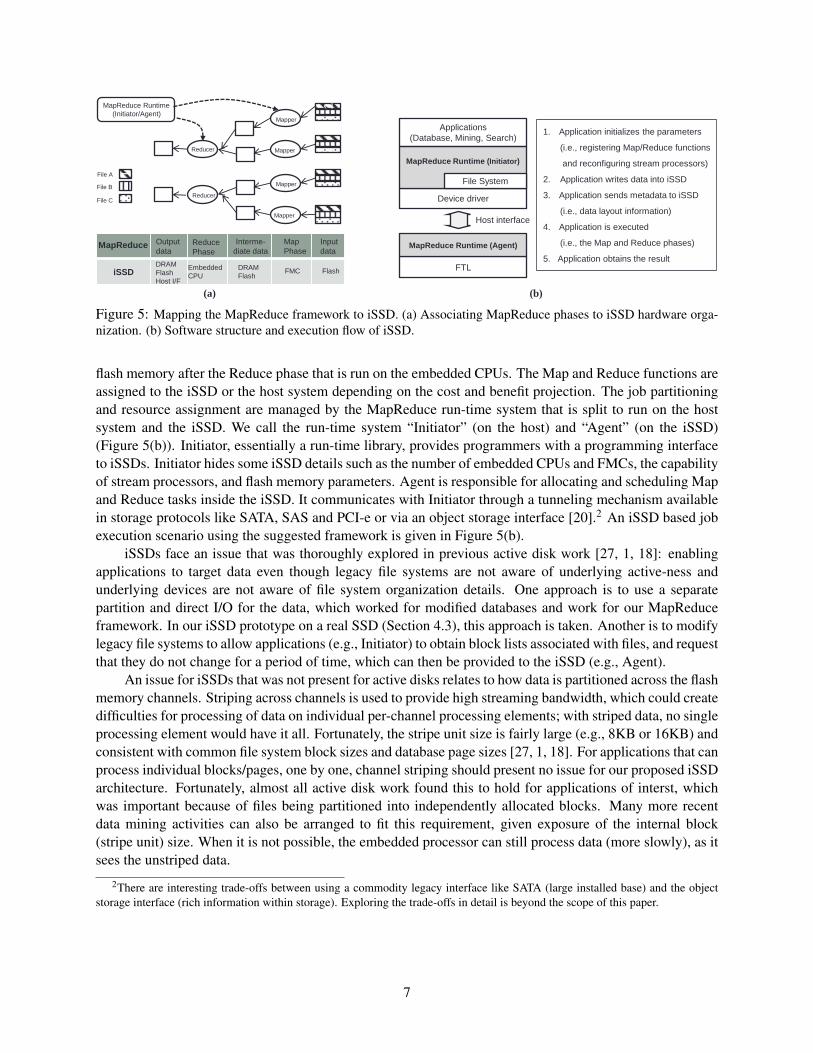
The MapReduce framework provides two basic primitives: Map and Reduce. They are user specifiedand easy to be parallelize and distribute on the computing elements (FMC processors and embedded CPUs inthe context of iSSD) with the assistance of the run-time system. In addition, the MapReduce model matcheswell with the hardware organization of iSSD as shown in Figure 5(a). Input data are saved in flash memoryprior to being transferred to FMCs. They execute the Map phase and the intermediate results are stored inDRAM or flash memory temporarily. The output data are produced and transferred to the host system or
6
MapReduce Runtime
(Initiator/Agent)
1
Mapper
Mapper
Mapper
Mapper
Reducer
Reducer
Input
data
Map
Phase
Interme-
diate data Reduce
Phase
Output
data
DRAM
Flash
Host I/F
Embedded
CPU
DRAM
Flash FMC Flash
MapReduce
iSSD
1
File A
File B
File C
(a)
FTL
MapReduce Runtime (Agent)
Device driver
MapReduce Runtime (Initiator)
Applications
(Database, Mining, Search)
File System
Host interface
1. Application initializes the parameters
(i.e., registering Map/Reduce functions
and reconfiguring stream processors)
2. Application writes data into iSSD
3. Application sends metadata to iSSD
(i.e., data layout information)
4. Application is executed
(i.e., the Map and Reduce phases)
5. Application obtains the result
(b)
Figure 5: Mapping the MapReduce framework to iSSD. (a) Associating MapReduce phases to iSSD hardware orga-nization. (b) Software structure and execution flow of iSSD.
flash memory after the Reduce phase that is run on the embedded CPUs. The Map and Reduce functions areassigned to the iSSD or the host system depending on the cost and benefit projection. The job partitioningand resource assignment are managed by the MapReduce run-time system that is split to run on the hostsystem and the iSSD. We call the run-time system “Initiator” (on the host) and “Agent” (on the iSSD)(Figure 5(b)). Initiator, essentially a run-time library, provides programmers with a programming interfaceto iSSDs. Initiator hides some iSSD details such as the number of embedded CPUs and FMCs, the capabilityof stream processors, and flash memory parameters. Agent is responsible for allocating and scheduling Mapand Reduce tasks inside the iSSD. It communicates with Initiator through a tunneling mechanism availablein storage protocols like SATA, SAS and PCI-e or via an object storage interface [20].2 An iSSD based jobexecution scenario using the suggested framework is given in Figure 5(b).
iSSDs face an issue that was thoroughly explored in previous active disk work [27, 1, 18]: enablingapplications to target data even though legacy file systems are not aware of underlying active-ness andunderlying devices are not aware of file system organization details. One approach is to use a separatepartition and direct I/O for the data, which worked for modified databases and work for our MapReduceframework. In our iSSD prototype on a real SSD (Section 4.3), this approach is taken. Another is to modifylegacy file systems to allow applications (e.g., Initiator) to obtain block lists associated with files, and requestthat they do not change for a period of time, which can then be provided to the iSSD (e.g., Agent).
An issue for iSSDs that was not present for active disks relates to how data is partitioned across the flashmemory channels. Striping across channels is used to provide high streaming bandwidth, which could createdifficulties for processing of data on individual per-channel processing elements; with striped data, no singleprocessing element would have it all. Fortunately, the stripe unit size is fairly large (e.g., 8KB or 16KB) andconsistent with common file system block sizes and database page sizes [27, 1, 18]. For applications that canprocess individual blocks/pages, one by one, channel striping should present no issue for our proposed iSSDarchitecture. Fortunately, almost all active disk work found this to hold for applications of interst, whichwas important because of files being partitioned into independently allocated blocks. Many more recentdata mining activities can also be arranged to fit this requirement, given exposure of the internal block(stripe unit) size. When it is not possible, the embedded processor can still process data (more slowly), as itsees the unstriped data.
2There are interesting trade-offs between using a commodity legacy interface like SATA (large installed base) and the objectstorage interface (rich information within storage). Exploring the trade-offs in detail is beyond the scope of this paper.
7

3.3 Data processing strategies with iSSDs
Allocation of Map and Reduce functions to different processing elements affects the system performancesignificantly. Therefore, one must carefully map tasks onto heterogeneous hardware resources in an iSSDplatform. This work proposes two data processing strategies: pipelining and partitioning.
Pipelining. The pipelining strategy assigns tasks to a set of computing resources in a hierarchical manner.For instance, Map functions could be mapped onto processors inside FMCs and Reduce functions onto theiSSD’s embedded CPUs. As such, a set of homogeneous processors execute their mapped tasks in paralleland send the computed results to the next layer of processors in a pipeline fashion. For example, FMCscan perform pattern search in parallel. They can then pass the matched values to the shared DRAM buffer.Next, the iSSD’s embedded CPUs can accomplish complex operations that require global information, suchas Reduce tasks, join in database, and sort over filtered data sets (preprocessed by FMCs). Intermediate dataare stored in temporary memory (SRAM and DRAM) and computation results are passed to the higher levelcomputing stages.
Because the available physical processing resources are organized in a hierarchical manner in an iSSDplatform—from FMCs to embedded processors (inside the iSSD) to host CPUs—, this data processing strat-egy fits nicely with the available hardware infrastructure. However, certain applications may not naturallyand efficiently exploit this strategy (e.g., lack of low-level parallelism needed to utilize FMCs).
Partitioning. In general, host CPUs are higher performance than any single computing resource in theiSSD. If we map a given data-intensive computing job entirely to an iSSD we may end up under-utilizingthe host CPUs. To fully utilize the computing resources in both the host platform and the iSSD, we couldassign Map functions to both entities by “partitioning” the job into properly sized sub-jobs. For example, ifthe input data set is composed of 1,000 files, 400 files could be delegated to the iSSD and the remaining 600files could be processed by the host CPUs.
For best results, we need to balance the amount of data (computation) the host CPUs and the iSSD takebased on their performance. This decision can be made at run time (“dynamic load-balancing”) or before thejob is launched (“static load-balancing”). For stream oriented applications, the simple, static load-balancingwould work well (the actual balancing decisions are reached based on accurate performance models like theones in Section 4). This is because the execution time of each function varies little in stream applications.Still, if the execution time of a function varies or it is hard to predict the execution time a priori, a dynamicload-balancing strategy will be effective.
Finally, the pipelining and the partitioning strategies can be used in combination. In fact, combiningboth strategies will likely lead to better system performance with higher overall resource utilization. We willcome back to this point when we discuss evaluation results in Section 5.2.
4 Modeling iSSD Benefits
This section develops models to evaluate the benefits of the proposed iSSD approach. We take a data-centricperspective and express performance and energy as a function of input data size. In essence, the overallperformance (or inversely, total time) and energy are determined by the average time and energy to processa single input byte. We will separately discuss models for pipelining and partitioning.
4.1 Models for pipelining
Performance. A data-intensive workload may involve multiple execution phases. For example, a typicalMapReduce workload would go through three phases, namely, map, sort and reduce. Hence, once we
8

compute the times of individual phases, we can combine them to obtain the overall execution time.3 Theexecution time of a given phase is, simply put, D/B, where D is the input data size and B the overallprocessing bandwidth for the phase. Our performance modeling effort accordingly focuses on computing B.
We assume that D is sufficiently large for each phase. Moreover, B is determined primarily by theunderlying hardware architecture and the workload characteristics. Then, each phase’s execution time isdetermined by D and the steady data processing bandwidth (=B) of the system during the phase. Note thatRiedel [27] makes the same assumptions in his active disk performance models.
With the pipelining workload mapping strategy, data being processed go through multiple steps in apipelined manner. Each step can be thought of as a pipeline stage and the step that takes the longest amountof time determines the overall data processing bandwidth at the system level. The steps are: (a) Data transferfrom NAND flash chips to an FMC on each channel; (b) Data processing at the FMC; (c) Data transfer fromthe FMC to the DRAM; (d) Data processing with the SSD embedded CPU(s) on the data stored in theDRAM; (e) Data transfer from the SSD (DRAM) to the host via the host interface; and (f) Data processingwith the host CPU(s). If the time needed for each of the above steps is tnand2 f mc, t f mc, t f mc2dram, tssd cpu,tssd2host and thost cpu, respectively, the bandwidth is the inverse of the total time (Ttotal). Hence, we have:
Ttotal = (1− p) · tconv +max(t∗), B =D
Ttotal(1)
where t∗ is the list of the time components defined above (for steps (a)–(f)) and (1− p) is the portion of theexecution that is not pipelinable [27] using the iSSD scheme, and tconv is the time that would be consumedwith the conventional scheme. Let us now tackle each term in t∗.(a) Data transfer from NAND flash chips to an FMC on each channel. Given nch flash channels and theper-channel effective data rate of rnand , tnand2 f mc = D/nch · rnand . We assume that data have been split ontothe NAND flash chips evenly and all data channels are utilized equally.(b) Data processing at the FMC. Once data are retrieved from NAND flash chips, they are processed inparallel using nch FMCs. Each ASIP processor at an FMC is assumed to run at the clock frequency of f f mc.Furthermore, to process a single byte, the processor would require CPB f mc cycles on average. Hence,
t f mc =D ·CPB f mc
nch · f f mc=
D · IPB f mc ·CPI f mc
nch · f f mc. (2)
In the above formulation, IPB f mc exposes the efficiency of the instruction set chosen (and the compiler),CPI f mc the microarchitecture, and f f mc the microarchitecture and the circuit-level processor implementation.(c) Data transfer from the FMC to the DRAM. We introduce a key parameter α to express the amountof residual data for further processing after FMCs finish processing a batch of data. α can be referred to asreduction factor or selectivity depending on the workload semantics and has a value between 0 and 1. Thetime needed to push the residual data from the FMCs to the DRAM is, then: t f mc2dram = α ·D/rdram. Weassumed that the aggregate data rate of the nch NAND flash channels is at least rdram, the DRAM bandwidth.(d) Data processing with the embedded CPU(s). Our formulation here is similar to that for Equation (2).
tssd cpu =α ·D ·CPBssd cpu
nssd cpu · fssd cpu=
α ·D · IPBssd cpu ·CPIssd cpu
nssd cpu · fssd cpu.
CPBssd cpu, fssd cpu, IPBssd cpu and CPIssd cpu are defined similarly. nssd cpu is the number of embeddedCPUs.(e) Data transfer from the SSD to the host. If there remains further processing after step (d), data transferoccurs from the iSSD to the host. With a data reduction factor β, the time to transfer data is expressed as:tssd2host = α ·β ·D/rhost , where rhost is the host interface data transfer rate.
3Tasks of different phases may overlap in time depending on how the “master” coordinates task allocations [12].
9
(f) Data processing with the host CPU(s). In the last step, data processing with the host CPU takes:
thost cpu =α ·β ·D ·CPBhost cpu
nhost cpu · fhost cpu=
α ·β ·D · IPBhost cpu ·CPIhost cpu
nhost cpu · fhost cpu,
where nhost cpu is the number of host CPUs. CPBhost cpu, fhost cpu, IPBhost cpu and CPIhost cpu are CPB, clockfrequency, IPB and CPI for the host CPUs.
The above time components ((a) through (f)) are plugged into Equation (1) to obtain the data processingbandwidth of a particular phase in a workload. Note that the effect of parallel processing with multiplecomputing resources (nch, nssd cpu and nhost cpu) is exposed.
Finally, let us derive the bandwidth of the conventional data processing scheme by adapting the aboveformulation. Because there is no data processing within the SSD, α = β = 1 (all data will be transferred tothe host). Furthermore, step (b) and (d) are skipped, i.e., t f mc = tssd cpu = 0. With these changes, Equation (1)remains valid for the conventional data processing scheme.
Energy. The main idea of our energy models is: The overall energy is a function of input data size andenergy to process a single byte. Energy consumption of a system is the sum of two components, dynamicenergy and static energy (Etotal = Edyn +Estatic). We assume that Estatic is simply Pstatic ·Ttotal where Pstatic
is a constant (static power); accordingly, we focus in this section on deriving Edyn.Dynamic energy consumption is split into energy due to computation and energy for data transfer.
That is, Edyn = Ecomp + Ex f er = D · (EPBcomp + EPBx f er), where EPBcomp is the average energy spenton processing a single byte of input and EPBx f er is the average energy spent on data transfer per sin-gle byte. EPBcomp can be further decomposed into terms that represent the contributions of differenthardware components: EPBcomp = EPB f mc + α · EPBssd cpu + α · β · EPBhost cpu. Similarly, EPBx f er =EPBnand2 f mc +α ·EPB f mc2dram +α · β ·EPBssd2host , where EPBA2B is the energy needed to move a bytefrom A to B.
To expose the processor design choices and their impact, we can further decompose the terms ofEPBcomp: EPB f mc = EPI f mc · IPB f mc, EPBssd cpu = EPIssd cpu · IPBssd cpu, and EPBhost cpu = EPIhost cpu ·IPBhost cpu, where EPI∗ is the average energy per instruction, an architectural and circuit design parameter.
4.2 Models for partitioning
Performance. With the partitioning strategy, data are split between the iSSD and the host for processing.Hence, D=Dissd+Dhost . Then, based on the partition, the execution time Ttotal =max(Dissd/Bissd ,Dhost/Bhost),where Bissd and Bhost stand for the data processing bandwidth of the iSSD and the host. Clearly, the aboveformulation captures the importance of partitioning, because Ttotal is minimized when the execution times ofthe iSSD and the host are equal. Bissd and Bhost can be easily obtained with our formulation of Section 4.1.For example, Bhost can be expressed as nhost cpu · fhost cpu/CPBhost cpu.
Energy. Like before, we assume that Estatic is Pstatic · Ttotal and focus on deriving the dynamic energy,Edyn = Ecomp + Ex f er = Dissd · EPBissd comp +Dhost · EPBhost cpu +Dhost · EPBssd2host . EPBissd comp is theaverage energy spent on processing a single byte of input within the iSSD and can be computed using ourformulation for the pipelining case with β = 0. EPBhost cpu and EPBssd2host were previously defined.
4.3 Validation
The basic performance modeling framework of this work was previously validated by Riedel [27]. Theycompare the performance of a single server with fast, directly attached SCSI disks against the same machinewith network-attached (emulated) active disks. Because the iSSD architecture stresses high data accessparallelism inside a single device, the emulation approach is too limiting in our case. Instead, we develop
10

1 2 4 8 16
model
sim
sim (XL)
model (XL)
k-means
1 2 4 8 16
model (XL)
sim
model
sim (XL)
linear_regression
-
500,000
1,000,000
1,500,000
2,000,000
2,500,000
3,000,000
3,500,000
4,000,000
4,500,000
5,000,000
0
1 2 4 8 16
sim
model
model (XL)
sim (XL)
string_match C
ycle
s
# flash channels
-
500,000
1,000,000
1,500,000
2,000,000
2,500,000
3,000,000
3,500,000
4,000,000
-
500,000
1,000,000
1,500,000
2,000,000
2,500,000
3,000,000
3,500,000
4,000,000
4,500,000
0 0
Figure 6: Comparison of cycle counts of three benchmarks obtained with our models and SoC Designer simulation.Dotted lines and solid lines are for iSSD processing with and without stream processor acceleration (XL), respectively.
and use two iSSD prototypes to validate our models and evaluate the iSSD approach. Our first prototype isa detailed execution-driven iSSD simulator that runs on SoC Designer [9]. Our second prototype is built ona real SSD product platform provided by Samsung [30]. Let us discuss each in the following.
Model validation through simulation of iSSD hardware. Our simulation is both functional and timing.We describe the hardware components in Figure 3 using SystemC and realistic timings. We use an existingcycle-accurate ARM9 model to simulate embedded CPUs and FMC processors. Additionally, we build atiming-only wrapper simulation component for reconfigurable stream processors to avoid designing a full-fledged stream processor at the RTL level. This component reads program execution traces and generatesnecessary events (e.g., bus transactions) at specified time points.
We have ported a MapReduce framework similar to Stanford Phoenix [36] to natively run on oursimulator. An embedded CPU in the iSSD becomes a “master” and triggers FMCs to execute Map tasks(more experimental settings in Section 5.1). It also manages buffers in DRAM to collect intermediate data.If the output buffer in DRAM gets full, the embedded CPU flushes the data and triggers the FMCs for furtherdata processing.
Figure 6 plots how well the results obtained from our model and the simulator agree. Overall, the modelis shown to predict the performance trends very well as we change the number of flash memory channels.The maximum error between the two results was 17.9% and the average error was 5.1%.
Scan experiments with prototype iSSD. We also separately studied how database scan is accelerated andsystem-level energy consumption is saved with the iSSD approach by porting PostgreSQL’s scan algorithmto the Samsung SSD platform, having sixteen 40 MB/s FMCs (i.e., internal bandwidth is 640 MB/s) anda SATA 3 Gbps interface (∼250 MB/s on the quad-core system used). The SSD has two ARM processorsand 256 MB DRAM. As for software implementation, simple Initiator and Agent were implemented in thehost system and the SSD. They communicate with each other through a system call, ioctl() with theATA PASS THROUGH parameter. A SATA reserved command was used for parameter and metadata passing.The scan algorithm is implemented into a Map function and loaded into the code memory of an embeddedCPU.
For input data, a 1 GB TPC-H Lineitem table [32] was written into flash memory with striping. Se-lectivity was 1% and projectivity was 4 bytes (out of 150 bytes). After input data was stored, the datalayout information such as table schema and projected column was delivered to the SSD. As soon as thehost system invoked the scan function through Initiator, the input data were read into the internal buffermemory (DRAM) of the SSD and compared with the key value for scan operation. Matched data items aretransferred to the host periodically by Initiator until there is no more data to be scanned.
The measured performance improvement with the iSSD over the host system was 2.3×. Becausedatabase scan is not compute-intensive, this performance improvement came closely by the ratio between the
11

SSD-internal NAND flash bandwidth and the host interface bandwidth (640 MB/250 MB=2.56). Throughcareful mapping of the scan algorithm, we were able to achieve a near-maximum performance gain withonly a single embedded CPU. In particular, scan operation and FTL execution time (tens of microseconds)are effectively hidden by data transfer time between flash memory and the internal buffer memory. Ouranalytical models are capable of capturing this effect, and the performance predictions in Figure 7 agreewith our measurement result. We also measured dynamic energy improvement (difference of current flowingfrom the wall outlet to the system) of 5.2× using a multimeter.
5 Quantitative Evaluation
To complement the prototype measurements above, this section uses the analytical models to study theperformance and energy benefits of the iSSD approach across a broader range of configurations. Our mainfocus is to prove the concept of the iSSD and identify conditions when the iSSD obtains the most and leastbenefit.
5.1 Evaluation setup
iSSD parametersrnand 400 MB/srdram 3.2GB/s (@800 MHz, 32-bit bus)nch 8–64 with the step of 8f f mc 400 MHz, 800 MHz
nssd_cpu, fssd_cpu 4, 400 MHz
System parametersrhost 600 MB/s (SATA), 4 or 8 GB/s
nhost_cpu 4, 8, 16fhost_cpu 3.2 GHz
Workload parameters—linear_regression, string_match,k-means, scan
p 1α 0.05 for scan; <0.05 for others;
CPB f mc 33.6, 38.8, 157.6, 4.0CPB f mc (w/ accel.) 10.1, 28.3, 32.4, 1.0
CPBhost_cpu 31.5, 46.4, 117.0, 3.1
Table 2: Parameter values used during evaluation.
0
500
1,000
1,500
2,000
2,500
3,000
8 16 24 32 40 48 56 64
0
100
200
300
400
500
600
700
800
900
8 16 24 32 40 48 56 64
0
4,000
8,000
12,000
16,000
20,000
8 16 24 32 40 48 56 64
Da
ta p
roc
es
sin
g r
ate
(M
B/s
)
Number of FMCs
ISSD-XL
ISSD-400.
ISSD-800
HOST-SATA
HOST-4/8G
HOST-8G
HOST-SATA
HOST-4G
linear regression k-means string_match scan
Number of FMCs Number of FMCs Number of FMCs
ISSD-XL
ISSD-XL ISSD-XL ISSD-800
ISSD-400
ISSD-800
ISSD-400.
ISSD-800 ISSD-400.
HOST-* HOST-*
0
200
400
600
800
1,000
1,200
1,400
8 16 24 32 40 48 56 64
Figure 7: Performance of selected kernels on five system configurations: HOST-SATA, HOST-4G, HOST-8G, iSSD-400,iSSD-800, and iSSD-XL. HOST-“speed” represents a conventional, host CPU based processing scheme with the storageinterface speed of “speed” (“SATA”=600 MB/s, “4G”=4 GB/s, “8G”=8 GB/s). iSSD-400 and iSSD-800 employ FMCsrunning at 400 MHz and 800 MHz for data processing. iSSD-XL uses reconfigurable stream processors for processing.iSSD-400 uses the SATA interface, iSSD-800 the PCI-e 4 GB/s interface, and iSSD-XL the PCI-e 8 GB/s interface.
example, with k-means and string_match (our “compute-intensive” kernels), the host interface speed mattered
little. With linear_regression, the 4 GB/s and 8 GB/s host interface speeds made no difference. iSSD configura-
tions show scalable performance in the whole FMC count range, except with scan. In this case, the performance
of iSSD-XL was saturated due to the internal DRAM bandwidth wall (not the host interface bandwidth) when
the number of FMCs exceeded 48. By comparison, all conventional machine configurations suffered the host
interface bandwidth limitation, making scan the only truly storage bandwidth bound workload among the ker-
nels examined. Still, iSSD configurations scale the scan throughput for the most part because the iSSD does
not transfer filtered data to the host, reducing the required data traffic substantially. Our results clearly highlight
the importance of efficient data handling with optimized hardware, parallel data processing and data filtering.
Among the examined kernels, string_match and k-means have an IPB larger than 50 and are compute-
17
The right table lists the values of the parameters toplug into our models. Hardware parameters (for theiSSD and the host platform) are based on the tech-nology trends summarized in Section 2.2. For intu-itive discussions, we focus on four selected kernelsthat have different characteristics: linear regression,string match, k-means, and scan. In terms of com-putation complexity (expressed in IPB), scan is thesimplest and k-means is the most complex. Exceptscan, which we implement its kernel to directly runon FMCs, we ported the Map stage of the remainingkernels to FMCs. We focus on the Map stage of thekernels only because there are many options for run-ning the Reduce stage (e.g., in iSSD or host? Over-lapped or not?) and the Map stage is often the time-dominant phase (76–99% in our examples). We use hardware acceleration to speed up the kernels using thestream processor instances in Figure 4. For scan, we estimate CPBs for iSSD to be 4 and 1 (with hardwaresupport for fast matching) based on our experiments on a real SSD platform (Section 4.3).
Throughout this section, we fix rnand to 400 MB/s to keep the design space to explore reasonablybounded. This way, we focus on nch, the only parameter to control the internal raw data bandwidth ofthe storage. In the case of iSSD, nch also determines the raw data processing throughput. Lastly, we setp = 1 [27].
5.2 Results
Performance improvement potential. Figure 7 compares the data processing rate of different iSSD andconventional machine configurations, as we change the number of FMCs. We assume that the host machinehas eight CPUs. iSSD configurations are shown to effectively increase the data processing bandwidth as weadd more FMCs while conventional machine configurations (having equivalently fast SSDs) gain little.
Interestingly, the performance of the conventional configurations were compute-bound except for scan.For example, with k-means and string match (our “compute-intensive” kernels), the host interface speed
12

0
500
1,000
1,500
2,000
2,500
3,000
8 16 24 32 40 48 56 64
0
100
200
300
400
500
600
700
800
900
8 16 24 32 40 48 56 64
0
4,000
8,000
12,000
16,000
20,000
8 16 24 32 40 48 56 64
Da
ta p
roc
es
sin
g r
ate
(M
B/s
)
Number of FMCs
ISSD-XL
ISSD-400.
ISSD-800
HOST-SATA
HOST-4/8G
HOST-8G
HOST-SATA
HOST-4G
linear regression k-means string_match scan
Number of FMCs Number of FMCs Number of FMCs
ISSD-XL ISSD-XL ISSD-800
ISSD-400
ISSD-800
ISSD-400.
ISSD-800 ISSD-400.
HOST-* HOST-*
0
200
400
600
800
1,000
1,200
1,400
8 16 24 32 40 48 56 64
ISSD-XL
Figure 7: Performance of selected kernels on five system configurations: HOST-SATA, HOST-4G, HOST-8G, iSSD-400, iSSD-800, and iSSD-XL. HOST-“speed” represents a conventional, host CPU based processing scheme withthe storage interface speed of “speed” (“SATA”=600 MB/s, “4G”=4 GB/s, “8G”=8 GB/s). iSSD-400 and iSSD-800employ FMCs running at 400 MHz and 800 MHz for data processing. iSSD-XL uses reconfigurable stream processorsfor processing. iSSD-400 uses the SATA interface, iSSD-800 the PCI-e 4 GB/s interface, and iSSD-XL the PCI-e8 GB/s interface.
mattered little. With linear regression, the 4 GB/s and 8 GB/s host interface speeds made no difference.iSSD configurations show scalable performance in the whole FMC count range, except with scan. In thiscase, the performance of iSSD-XL was saturated due to the internal DRAM bandwidth wall (not the hostinterface bandwidth) when the number of FMCs exceeded 48. By comparison, all conventional machineconfigurations suffered the host interface bandwidth limitation, making scan the only truly storage band-width bound workload among the kernels examined. Still, iSSD configurations scale the scan throughputfor the most part because the iSSD does not transfer filtered data to the host, reducing the required datatraffic substantially. Our results clearly highlight the importance of efficient data handling with optimizedhardware, parallel data processing and data filtering.
Among the examined kernels, string match and k-means have an IPB larger than 50 and are compute-intensive (see Table 1). In both cases, the data processing rate on the host CPUs is not bounded by the hostinterface bandwidth at all. Interestingly, their performance behavior on the iSSD is quite different. k-meanswas successfully accelerated and performs substantially better on the iSSD than host CPUs with 24 or moreFMCs. In contrast, string match required as many as 40 FMCs to outperform host CPUs. The main reasonis that the stream processor is not as effective for this kernel as other kernels and produced a small gain ofonly 37% compared with the 400 MHz FMC processor (also indirectly evidenced by the large improvementwith the 800 MHz FMCs). If the iSSD does not have sufficient resources available, one would executeworkloads like string match on host CPUs [27]. Still, the particular example of string match motivatesus to investigate (in the future) a broader array of workload acceleration opportunities, especially to handleunstructured data streams efficiently.
In a conventional system, parallelism is exploited by involving more CPUs in computation. To gainfurther insight about the effectiveness of parallel processing inside the iSSD (with FMCs) as opposed to onthe host platform (with multiple CPUs), Figure 8 identifies iso-performance configurations of the iSSD andconventional systems in two plots, each assuming a different host interface speed (600 MB/s vs. 8 GB/s).
Both plots show that hardware acceleration makes iSSD data processing much more efficient by in-creasing the effective per-channel throughput. Consider linear regression for example: When rhost is600 MB/s, the iSSD obtains the performance of the 16-CPU host configuration with 52 FMCs (withoutacceleration) and 15 FMCs (with acceleration). Note that there is a large difference between the maximumraw instruction throughput between the iSSD and the host configurations; the 4-CPU host configuration(4×3.2 GHz×4 instructions/cycle) corresponds to twice the computing capacity of the 64-FMC iSSD con-
13
0
8
16
24
32
40
48
56
64
4 8 12 16
Number of host CPUs
Nu
mb
er
of
FM
Cs
rhost = 600 MB/s
linear_regression
scan
k-means string_match
linear_regression-XL
scan-XL
k-means-XL
string_match-XL
0
8
16
24
32
40
48
56
64
4 8 12 16
Number of host CPUs
rhost = 8 GB/s
linear_regression
scan
k-means
string_match
linear_regression-XL
scan-XL
k-means-XL
string_match-XL
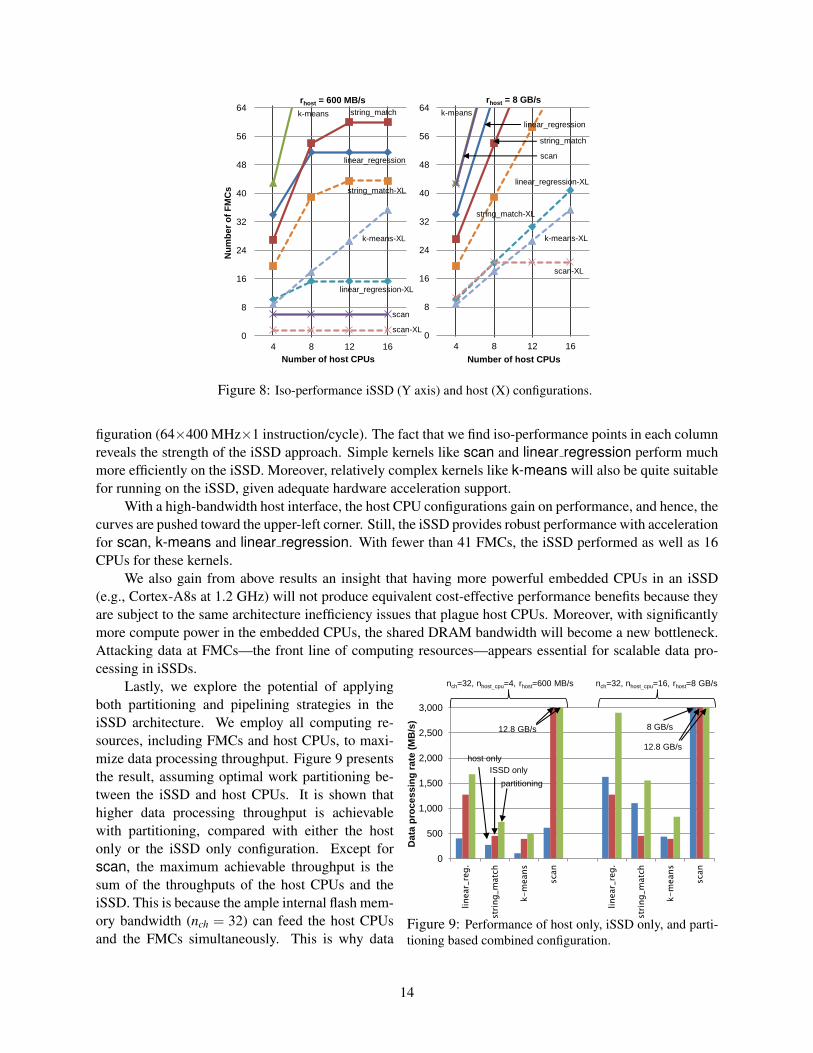
Figure 8: Iso-performance iSSD (Y axis) and host (X) configurations.
figuration (64×400 MHz×1 instruction/cycle). The fact that we find iso-performance points in each columnreveals the strength of the iSSD approach. Simple kernels like scan and linear regression perform muchmore efficiently on the iSSD. Moreover, relatively complex kernels like k-means will also be quite suitablefor running on the iSSD, given adequate hardware acceleration support.
With a high-bandwidth host interface, the host CPU configurations gain on performance, and hence, thecurves are pushed toward the upper-left corner. Still, the iSSD provides robust performance with accelerationfor scan, k-means and linear regression. With fewer than 41 FMCs, the iSSD performed as well as 16CPUs for these kernels.
We also gain from above results an insight that having more powerful embedded CPUs in an iSSD(e.g., Cortex-A8s at 1.2 GHz) will not produce equivalent cost-effective performance benefits because theyare subject to the same architecture inefficiency issues that plague host CPUs. Moreover, with significantlymore compute power in the embedded CPUs, the shared DRAM bandwidth will become a new bottleneck.Attacking data at FMCs—the front line of computing resources—appears essential for scalable data pro-cessing in iSSDs.
0
500
1,000
1,500
2,000
2,500
3,000
linear_reg.
string_match
k-means
scan
linear_reg.
string_match
k-means
scan
nch=32, nhost_cpu=4, rhost=600 MB/s nch=32, nhost_cpu=16, rhost=8 GB/s
host only
ISSD only
partitioning
12.8 GB/s
12.8 GB/s
8 GB/s
Da
ta p
roc
es
sin
g r
ate
(M
B/s
)
Figure 9: Performance of host only, iSSD only, and parti-tioning based combined configuration.
Lastly, we explore the potential of applyingboth partitioning and pipelining strategies in theiSSD architecture. We employ all computing re-sources, including FMCs and host CPUs, to maxi-mize data processing throughput. Figure 9 presentsthe result, assuming optimal work partitioning be-tween the iSSD and host CPUs. It is shown thathigher data processing throughput is achievablewith partitioning, compared with either the hostonly or the iSSD only configuration. Except forscan, the maximum achievable throughput is thesum of the throughputs of the host CPUs and theiSSD. This is because the ample internal flash mem-ory bandwidth (nch = 32) can feed the host CPUsand the FMCs simultaneously. This is why data
14

0
4
8
12
0
4
8
12
0
10
20
30
40E
nerg
y P
er
Byte
(n
J/B
)
0
50
100
150
200
host ISSDw/o SP
ISSD w/SP
host ISSDw/o SP
ISSD w/SP
host ISSDw/o SP
ISSD w/SP
host ISSDw/o SP
ISSD w/SP
linear_reg. string_match k-means scan Legend
host
CPU
main
memory
I/O
SSD
chipset
NAND
DRAM
0
4
8
12
processor
I/O
SP
CATEGORY ENERGY PARAMETERS
Host system ECPU = 0.82 nJ/inst. [13]PDRAM = 420 mW [21]Pchipset = 5.49 W [5]
PI/O = 9.61 W [5]SSD & ISSD ENAND,8kB read = 3.31 µJ
ENAND,8kB write = 64.94 µJPDRAM = 154 mW [21]
Ehost i/ f = 1.05 nJ/B [23]Eproc. = 192 pJ/inst. [3]
Estream ALU = 2.11 pJ/op. [11]Estream MUL = 67.6 pJ/op [11]
Estream Reg. = 4.23 pJ/access [11]Eproc. SRAM = 89.3 pJ/read [16]Estream SRAM = 21.1 pJ/read [16]
24
Figure 10: Breakdown of energy into key system components (left) and input parameters to the energy model (right).
processing throughput of nearly 1,700 MB/s is achieved with linear regression when the host interfacebandwidth is merely 600 MB/s. In case of scan, pipelining with the iSSD already achieves the highestpossible data throughput (12.8 GB/s) that matches the raw flash memory bandwidth and partitioning bringsno additional benefit. In this case, the host CPUs may perform other useful computation or enter into a lowpower mode.
The partitioning strategy brings practical benefits because partitioning is relatively straightforwardwhen the input data is large and the partitioning overhead becomes relatively small. We are encouragedby our result, and specific research issues of static and dynamic partitioning (and load balancing) are left forfuture work.
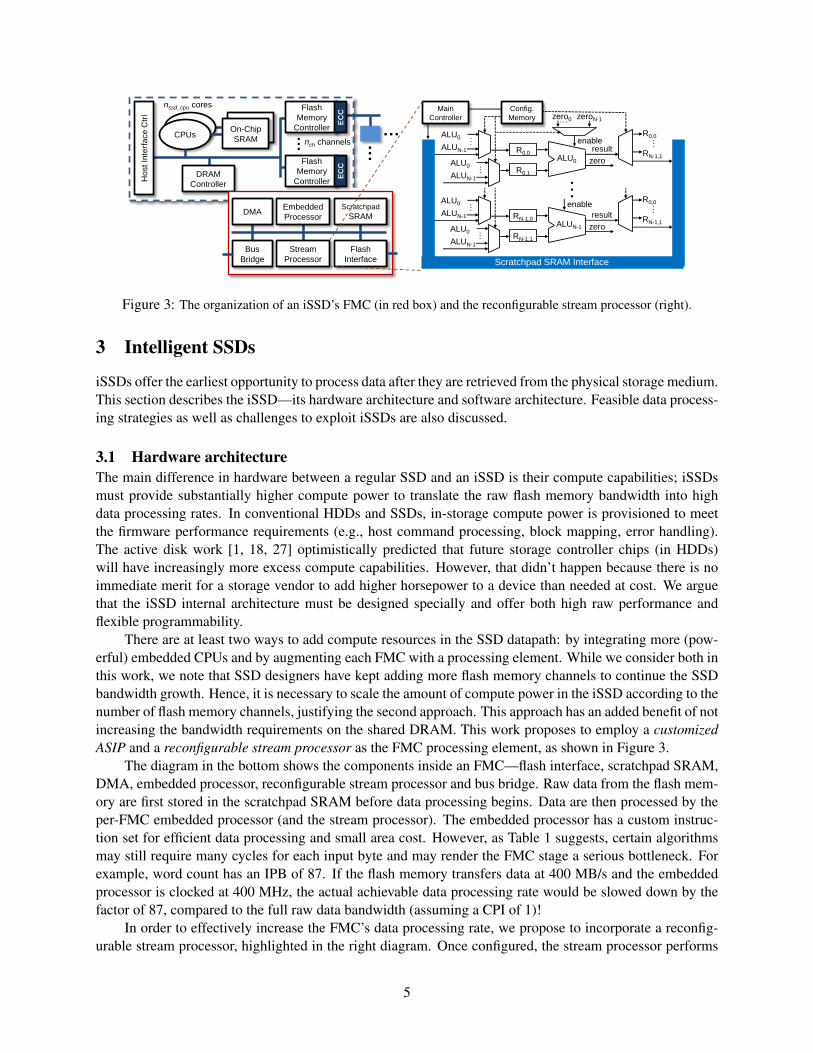
Energy reduction potential. To investigate potential energy savings of the iSSD approach, we computeEPB for three configurations: conventional host processing, iSSD without acceleration, and iSSD withacceleration. The examined configurations follow the setup of Section 5.1 and nch = 8. We break downenergy into key system components. In case of host processing, they are: CPUs, main memory, chipset, I/Obus and SSD. For iSSD, we consider: FMC processor, stream processor, DRAM, NAND flash and I/O.
We use the widely practiced event-based energy estimation method (e.g., [6, 5]). We determine ourenergy parameters based on publicly available information. For example, energy of the host CPU and the in-iSSD processors are derived from [13, 3, 11]. SRAM scratchpad memory and DRAM energy are estimatedusing [16] and [21]. Flash memory energy is obtained from data books and in-house measurement. For faircomparison, we assume that the host CPU is built with a 22-nm technology while the SSD/iSSD controllersare built with a 45-nm technology (i.e., two technology generations apart). Figure 10 is the result and theparameters used.
It is shown that overall, the iSSD configurations see large energy reduction in all examined ker-nels by at least 5× (k-means) and the average reduction was over 9×. Furthermore, energy is sig-nificantly smaller when the stream processor was used—the maximum reduction was over 27× for lin-ear regression (9× without the stream processor). The stream processor was very energy-efficient, con-suming only 0.123 nJ/byte in the worst case (string match), compared with 63.0 nJ/byte of the host CPUfor the same kernel. Clearly, hardware acceleration proves to be effective for both performance improvementand energy saving in iSSDs.
In host processing, typically more than half of all energy is consumed for data transfer (I/O, chipsetand main memory). iSSD addresses this inefficiency by migrating computation and eliminating unnecessarydata transfer. In this sense, the iSSD approach is in stark contrast with other approaches toward efficientdata processing, such as intelligent memory [26], on-CPU specialization [33], GPGPUs [15] and low-powerCPUs [2]; they offer more efficient computing than powerful CPUs but do not eliminate the overheads of
15

data transfer. For example, even if these approaches employ the same energy-efficient reconfigurable streamprocessors, their energy improvement would be limited to 1.04× to 1.60× (when iSSD achieves 17× to27× with acceleration).
0
4
8
12
0
4
8
12
0
10
20
30
40
En
erg
y P
er
Byte
(n
J/B
)
0
50
100
150
200
host ISSDw/o SP
ISSD w/SP
host ISSDw/o SP
ISSD w/SP
host ISSDw/o SP
ISSD w/SP
host ISSDw/o SP
ISSD w/SP
linear_reg. string_match k-means scan Legend
host
CPU
main
memory
I/O
SSD
chipset
NAND
DRAM
0
4
8
12
processor
I/O
SP
CATEGORY ENERGY PARAMETERS
Host system ECPU = 0.82 nJ/inst. [11]PDRAM = 420 mW [20]Pchipset = 5.49 W [4]
PI/O = 9.61 W [4]SSD & ISSD ENAND,8kB read = 3.31 µJ
ENAND,8kB write = 64.94 µJPDRAM = 154 mW [20]
Ehost i/ f = 1.05 nJ/B [23]Eproc. = 192 pJ/inst. [2]
Estream ALU = 2.11 pJ/op. [9]Estream MUL = 67.6 pJ/op [9]
Estream Reg. = 4.23 pJ/access [9]Eproc. SRAM = 89.3 pJ/read [14]Estream SRAM = 21.1 pJ/read [14]
24
Figure 10: Breakdown of energy into key system components (left) and input parameters to the energy model (right).
CHIP COMPONENT SSD iSSD
CPUs 700K 2,200K(int core×2) ((int+fp)×4)
SRAM (256 KB) 1,500K 1,500KFMC (incl. ECC, 7,200K 11,200K
16 channels) (450K×16) (700K×16)PCI-e (mac only) 500K 500KDRAM controller 50K 50K
Peripherals 60K 60KMisc. (glue, pads, ...) 2,000K 2,000K
TOTAL 12,010K 17,510K
Table 2: Gate count estimation of a conventional SSD controller and an iSSD controller chip.
In host processing, typically more than half of all energy is consumed for data transfer (I/O, chipset and main
memory). iSSD addresses this inefficiency by migrating computation and eliminating unnecessary data transfer.
In this sense, the iSSD approach is in stark contrast with other approaches toward efficient data processing,
such as intelligent memory [27], on-CPU specialization [34], GPGPUs [15] and low-power CPUs [2]; they
offer more efficient computing than powerful CPUs but do not eliminate the overheads of data transfer. For
example, even if these approaches employ the same energy-efficient reconfigurable stream processors, their
energy improvement would be limited to 1.04× to 1.60× (when iSSD achieves 17× to 27× with acceleration).
0
4
8
12
0
4
8
12
0
10
20
30
40
En
erg
y P
er
Byte
(n
J/B
)
0
50
100
150
200
host ISSDw/o SP
ISSD w/SP
host ISSDw/o SP
ISSD w/SP
host ISSDw/o SP
ISSD w/SP
host ISSDw/o SP
ISSD w/SP
linear_reg. string_match k-means scan Legend
host
CPU
main
memory
I/O
SSD
chipset
NAND
DRAM
0
4
8
12
processor
I/O
SP
CATEGORY ENERGY PARAMETERS
Host system ECPU = 0.82 nJ/inst. [11]PDRAM = 420 mW [20]Pchipset = 5.49 W [4]
PI/O = 9.61 W [4]SSD & ISSD ENAND,8kB read = 3.31 µJ
ENAND,8kB write = 64.94 µJPDRAM = 154 mW [20]
Ehost i/ f = 1.05 nJ/B [23]Eproc. = 192 pJ/inst. [2]
Estream ALU = 2.11 pJ/op. [9]Estream MUL = 67.6 pJ/op [9]
Estream Reg. = 4.23 pJ/access [9]Eproc. SRAM = 89.3 pJ/read [14]Estream SRAM = 21.1 pJ/read [14]
24
Figure 10: Breakdown of energy into key system components (left) and input parameters to the energy model (right).
CHIP COMPONENT SSD iSSD
CPUs 700K 2,200K(int core×2) ((int+fp)×4)
SRAM (256 KB) 1,500K 1,500KFMC (incl. ECC, 7,200K 11,200K
16 channels) (450K×16) (700K×16)PCI-e (mac only) 500K 500KDRAM controller 50K 50K
Peripherals 60K 60KMisc. (glue, pads, ...) 2,000K 2,000K
TOTAL 12,010K 17,510K
Table 2: Gate count estimation of a conventional SSD controller and an iSSD controller chip.
In host processing, typically more than half of all energy is consumed for data transfer (I/O, chipset and main
memory). iSSD addresses this inefficiency by migrating computation and eliminating unnecessary data transfer.
In this sense, the iSSD approach is in stark contrast with other approaches toward efficient data processing,
such as intelligent memory [27], on-CPU specialization [34], GPGPUs [15] and low-power CPUs [2]; they
offer more efficient computing than powerful CPUs but do not eliminate the overheads of data transfer. For
example, even if these approaches employ the same energy-efficient reconfigurable stream processors, their
energy improvement would be limited to 1.04× to 1.60× (when iSSD achieves 17× to 27× with acceleration).
0
4
8
12
16
0
10
20
30
40
0
10
20
30
40
0
4
8
12
En
erg
y P
er
Byte
(n
J/B
)
0
50
100
150
200
250
300
host ISSDw/o SP
ISSDw/ SP
host ISSDw/o SP
ISSDw/ SP
host ISSDw/o SP
ISSDw/ SP
host ISSDw/o SP
ISSDw/ SP
linear_reg. string_match k-means scan Legend
host CPU
main
memory
I/O
SSD
chipset
processor
SP
NAND
DRAM
Figure 9: Breakdown of energy consumption into key system components.
CHIP COMPONENT SSD ISSD
CPUs 700K 2,200K(int core×2) ((int+fp)×4)
SRAM (256 KB) 1,500K 1,500KFMC (16 ch.) 7,200K 11,200K
(450K×16) (700K×16)PCI-e (mac only) 500K 500KDRAM controller 50K 50K
Peripherals 60K 60KMisc. (glue, pads, ...) 2,000K 2,000K
TOTAL 12,010K 17,510K
Table 4: Gate count estimation of a conventional SSD controller and an ISSD controller chip.
(string_match), compared with 16.8 nJ/byte of the host CPU. Hardware acceleration proves to be an effective
way for further energy savings in ISSDs.
In host processing, more than half of all energy consumption is for data transfer (in I/O, chipset, and
main memory). In contrast, the dominant energy consumer in ISSD is FMC processors. This implies that a
platform’s energy inefficiency caused by lots of data transfer on the I/O path is mitigated successfully in the
ISSD approach.
Figure 10: Bandwidth trends of key hardware components.
Cost analysis. As the final step of evaluation, we
compare the hardware cost of an SSD and an ISSD
based on estimation. We assume standard components like flash and DRAM chips are identical in both designs.
With that the main cost difference comes from the controller chip and we break down the chip cost into the
chip’s components in Table 4. We estimate the die cost difference to be 40%.
The SSD bill of materials is dominated by the NAND flash chips. For example, commodity 256 GB SSDs
22
Cost analysis. Finally, we estimate and compare the hard-
ware cost of an SSD and an iSSD. Standard components like
flash and DRAM chips are identical in both designs. With
that the main cost difference comes from the controller chip.
We break down the chip cost in the right table and estimate
the die cost difference to be 40%.
The SSD bill of material (BOM) is dominated by the
20
Cost analysis. Finally, we estimate and compare the hard-ware cost of an SSD and an iSSD. Standard componentslike flash and DRAM chips are identical in both designs.With that the main cost difference comes from the con-troller chip. We break down the chip cost in the right tableand estimate the die cost difference to be 40%.
The SSD bill of material (BOM) is dominated bythe NAND flash chips. For example, commodity 256 GBSSDs are priced at as low as $370 in on-line stores as ofJuly 2011, whereas 64 Gbit MLC NAND flash chips aresold at $9.92 (obtained at www.dramexchange.com on July 13, 2011). According to this price, the cost forthe flash memory chips is $317, accounting for over 86% of the SSD end user’s price. With a larger capacitySSD, it won’t be surprising that the flash cost exceeds 90% of the drive’s BOM. Hence, even if the dominantportion of the remaining cost—around 10% of the drive’s BOM—is attributed to the controller chip, theadditional cost of iSSD will not exceed 4%. We believe that this cost is substantially smaller than upgradingthe host system (e.g., CPUs with more cores) to get the same performance improvement the iSSD can bringand is well exceeded by the expected energy savings.
6 Conclusions
Intelligent solid-state drives (iSSDs) offer compelling performance and energy efficiency benefits, arisingfrom modern and projected SSD characteristics. Based on analytic models and limited experimentationwith a prototype iSSD, we show that iSSDs could provide 2–4× higher data scanning throughput and 5–27× better energy efficiency relative to today’s use of commodity servers. Based on analysis of ten data-intensive application kernels, we describe an architecture based on reconfigurable stream processors (oneper internal flash memory channel) that could provide these benefits at marginal hardware cost increases(<4%) to traditional SSDs. Most of these benefits would also be realized over non-iSSD approaches basedon efficient processing outside of SSDs, because they do not exploit SSD-internal bandwidth or avoid costlyhigh-bandwidth transfers of all processed data.
References
[1] ACHARYA, A., UYSAL, M., AND SALTZ, J. Active disks: programming model, algorithms andevaluation. ASPLOS-VIII, pp. 81–91.
[2] ANDERSEN, D. G., FRANKLIN, J., KAMINSKY, M., PHANISHAYEE, A., TAN, L., AND VASUDE-VAN, V. Fawn: a fast array of wimpy nodes. In Proceedings of the ACM SIGOPS 22nd symposium onOperating systems principles (New York, NY, USA, 2009), SOSP ’09, ACM, pp. 1–14.
[3] ARM LTD. Cortex a9 processor. http://www.arm.com/products/processors/cortex-a/
cortex-a9.php.
[4] BARROSO, L., DEAN, J., AND HOLZLE, U. Web search for a planet: The google cluster architecture.IEEE Micro 23, 2 (March-April 2003), 22–28.
16
[5] BIRCHER, W., AND JOHN, L. Complete system power estimation: A trickle-down approach based onperformance events. ISPASS, pp. 158–168.
[6] BROOKS, D., TIWARI, V., AND MARTONOSI, M. Wattch: a framework for architectural-level poweranalysis and optimizations. ISCA ’00, pp. 83–94.
[7] BRYANT, R. E. Data-intensive supercomputing: The case for disc. Tech. Rep. CMU-CS-07-128,School of Computer Science, Carnegie Mellon University, Pittsburgh, PA, May 2007.
[8] CANNATARO, M., TALIA, D., AND SRIMANI, P. K. Parallel data intensive computing in scientificand commercial applications. Parallel Comput. 28 (May 2002), 673–704.
[9] CARBON SOC DESIGNER PLUS. http://carbondesignsystems.com/SocDesignerPlus.aspx.
[10] COOPER, B. F., BALDESCHWIELER, E., FONSECA, R., KISTLER, J. J., NARAYAN, P. P. S., NEER-DAELS, C., NEGRIN, T., RAMAKRISHNAN, R., SILBERSTEIN, A., SRIVASTAVA, U., AND STATA,R. Building a cloud for yahoo! IEEE Data Eng. Bull. 32, 1 (2009), 36–43.
[11] DALLY, W. J., KAPASI, U. J., KHAILANY, B., AHN, J. H., AND DAS, A. Stream processors:Progammability and efficiency. Queue 2 (March 2004), 52–62.
[12] DEAN, J., AND GHEMAWAT, S. Mapreduce: Simplified data processing on large clusters. In OSDI(2004), pp. 137–150.
[13] GROCHOWSKI, E., AND ANNAVARAM, M. Energy per instruction trends in intel microprocessors.Tech.@Intel Magazine, March 2006.
[14] HALEVY, A., NORVIG, P., AND PEREIRA, F. The unreasonable effectiveness of data. IEEE IntelligentSystems 24 (March 2009), 8–12.
[15] HE, B., FANG, W., LUO, Q., GOVINDARAJU, N. K., AND WANG, T. Mars: a mapreduce frameworkon graphics processors. PACT ’08, pp. 260–269.
[16] HP LABS. Cacti 5.3. http://quid.hpl.hp.com:9081/cacti/.
[17] HUSTON, L., SUKTHANKAR, R., WICKREMESINGHE, R., SATYANARAYANAN, M., GANGER,G. R., RIEDEL, E., AND AILAMAKI, A. Diamond: A storage architecture for early discard in in-teractive search. FAST, pp. 73–86.
[18] KEETON, K., PATTERSON, D. A., AND HELLERSTEIN, J. M. A case for intelligent disks (idisks).SIGMOD Record 27, 3 (1998), 42–52.
[19] KHRONOS GROUP. Opencl. http://www.khronos.org/opencl/.
[20] MESNIER, M., GANGER, G. R., AND RIEDEL, E. Object-based storage. IEEE CommunicationMagazine 41 (August 2003), 84–90.
[21] MICRON TECHNOLOGY, INC. Sdram power calculator. http://download.micron.com/
downloads/misc/SDRAM_Power_Calc_10.xls.
[22] NARAYANAN, R., OZISIKYILMAZ, B., ZAMBRENO, J., MEMIK, G., AND CHOUDHARY, A.Minebench: A benchmark suite for data mining workloads. IISWC, pp. 182–188.
[23] OPEN COMPUTE PROJECT. http://opencompute.org.
17

[24] OSKIN, M., CHONG, F., AND SHERWOOD, T. Active pages: a computation model for intelligentmemory. In Computer Architecture, 1998. Proceedings. The 25th Annual International Symposium on(June 1998), pp. 192–203.
[25] OZISIKYILMAZ, B., NARAYANAN, R., ZAMBRENO, J., MEMIK, G., AND CHOUDHARY, A. Anarchitectural characterization study of data mining and bioinformatics workloads. IISWC, pp. 61–70.
[26] PATTERSON, D., ANDERSON, T., CARDWELL, N., FROMM, R., KEETON, K., KOZYRAKIS, C.,THOMAS, R., AND YELICK, K. A case for intelligent ram. Micro, IEEE 17, 2 (March/April 1997),34–44.
[27] RIEDEL, E. Active Disks–Remote Execution for Network-Attached Storage. PhD thesis, CarnegieMellon University, Pittsburgh, PA, 1999.
[28] RIEDEL, E., FALOUTSOS, C., GIBSON, G., AND NAGLE, D. Active disks for large-scale data pro-cessing. Computer 34, 6 (June 2001), 68–74.
[29] RIEDEL, E., GIBSON, G. A., AND FALOUTSOS, C. Active storage for large-scale data mining andmultimedia. VLDB ’98, pp. 62–73.
[30] SAMSUNG ELECTRONICS CO., L. http://www.samsung.com/global/business/
semiconductor/Greenmemory/Products/SSD/SSD_Lineup.html.
[31] SCHUETZ, R., AND JEONG, S. Looking ahead to higher performance ssds with hlnand. In FlashMemory Summit (2010).
[32] TPC. Tpc-h. http://www.tpc.org/tpch/default.asp.
[33] VENKATESH, G., SAMPSON, J., GOULDING, N., GARCIA, S., BRYKSIN, V., LUGO-MARTINEZ,J., SWANSON, S., AND TAYLOR, M. B. Conservation cores: reducing the energy of mature compu-tations. In Proceedings of the fifteenth edition of ASPLOS on Architectural support for programminglanguages and operating systems (New York, NY, USA, 2010), ASPLOS ’10, ACM, pp. 205–218.
[34] WHITE, T. Hadoop: The Definitive Guide (Chapter 6: How MapReduce Works). O’Reilly, 2009.
[35] WONG, W. A chat about micron’s clearnand technology. electronic design (December 2010).
[36] YOO, R. M., ROMANO, A., AND KOZYRAKIS, C. Phoenix rebirth: Scalable mapreduce on a large-scale shared-memory system. IISWC, pp. 198–207.
18