Embed Size (px)
Citation preview
8.31.17
JOHN HANCOCK
Funds IIAnnual Report
Manager’s commentary and fund performance (See below for each fund’s page #) ..............................................................3Shareholder expense example ....................................................................................................................................................................37Portfolio of investments (See below for each fund’s page #) ...........................................................................................................41Statements of assets and liabilities........................................................................................................................................................227Statements of operations............................................................................................................................................................................236Statements of changes in net assets .....................................................................................................................................................245Statement of cash flows ..............................................................................................................................................................................251Financial highlights.........................................................................................................................................................................................252Notes to financial statements ...................................................................................................................................................................260Report of independent registered public accounting firm .........................................................................................................298Federal tax information ...............................................................................................................................................................................299Evaluation of advisory and subadvisory agreements by the Board of Trustees .............................................................300Appendix A .......................................................................................................................................................................................................306Trustees and officers information ...........................................................................................................................................................314For more information ....................................................................................................................................................................................318
FundManager’s commentary and
fund performancePortfolio of
investments
Asia Pacific Total Return Bond Fund ........................4 ....................41Capital Appreciation Fund .......................................5 ....................44Capital Appreciation Value Fund .............................6 ....................45Core Bond Fund .......................................................7 ....................52Fundamental Global Franchise Fund .......................8 ....................62Global Bond Fund ....................................................9 ....................62Global Real Estate Fund .........................................10 ....................77Health Sciences Fund .............................................11 ....................79High Yield Fund ......................................................12 ....................81International Growth Stock Fund ..........................13 ....................89International Small Cap Fund ................................14 ....................90International Strategic Equity Allocation Fund ......15 ....................91International Value Fund ........................................16 ..................108Investment Quality Bond Fund ..............................17 ..................109Mid Cap Stock Fund ..............................................18 ..................118Mid Value Fund ......................................................19 ..................120Multi-Index Lifestyle Aggressive Portfolio ..............20 ..................122
FundManager’s commentary and
fund performancePortfolio of
investments
Multi-Index Lifestyle Balanced Portfolio .................21 ..................122Multi-Index Lifestyle Conservative Portfolio ..........22 ..................123Multi-Index Lifestyle Growth Portfolio ...................23 ..................124Multi-Index Lifestyle Moderate Portfolio ...............24 ..................124Real Estate Equity Fund ..........................................25 ..................125Real Estate Securities Fund ....................................26 ..................125Real Return Bond Fund ..........................................27 ..................126Science & Technology Fund ...................................28 ..................136Short Term Government Income Fund ..................29 ..................138Small Cap Growth Fund ........................................30 ..................139Small Company Growth Fund ...............................31 ..................141Small Company Value Fund ...................................32 ..................143Strategic Equity Allocation Fund ............................33 ..................146Total Return Fund ...................................................34 ..................184U.S. High Yield Bond Fund ....................................35 ..................198U.S. Strategic Equity Allocation Fund ....................36 ..................203
John Hancock Funds IIAnnual report — table of contents
2
Fund performance
In the following pages we have set forth information regarding
the performance of certain funds of John Hancock Funds II
(the Trust). There are several ways to evaluate a fund’s historical
performance. One can look at the total percentage change in
value, the average annual percentage change, or the growth of
a hypothetical $10,000 investment. With respect to all perfor-
mance information presented, it is important to understand
that past performance does not guarantee future results. Return
and principal fluctuate, and shares, when redeemed, may be
worth more or less than their original cost.
Performance tables
The performance tables show two types of total return informa-
tion: cumulative and average annual total returns. A cumulative
total return is an expression of a fund’s total change in share
value in percentage terms over a set period of time—one, five,
and ten years (or since the fund’s inception if less than the
applicable period). An average annual total return takes the
fund’s cumulative total return for a time period greater than
one year and shows what would have happened if the fund
had performed at a constant rate each year. The tables show all
cumulative and average annual total returns, net of fees and
expenses of the Trust, but do not reflect the expenses of any
insurance company separate accounts (including a possible
contingent deferred sales charge) that may invest in the funds,
as applicable. If these were included, performance would
be lower.
Graph—Change in value of $10,000 investment and
comparative indexes
The performance graph for each fund (or portfolio), shows the
change in value of a $10,000 investment over the life or ten-
year period of each fund (or portfolio) whichever is shorter.
Each fund’s (or portfolio’s) performance is compared with the
performance of one or more broad-based securities indexes as a
“benchmark.” All performance information includes the rein-
vestment of dividends and capital gain distributions, as well
as the deduction of ongoing management fees and fund (or
portfolio) operating expenses. The benchmarks used for com-
parison are unmanaged and include reinvestment of dividends
and capital gains distributions, if any, but do not reflect any
fees or expenses. Funds (or portfolios), that invest in multiple
asset classes are compared with a customized benchmark. This
benchmark comprises a set percentage allocation from each of
the asset classes in which the fund invests.
Portfolio manager’s commentary
Finally, we have provided a commentary by each portfolio
manager regarding each fund’s (or portfolio’s) performance dur-
ing the period ended August 31, 2017. The views expressed
are those of the portfolio managers as of August 31, 2017, and
are subject to change based on market and other conditions.
Information about a fund’s (or portfolio’s) holdings, asset alloca-
tion, or country diversification is historical and is no indication
of future fund composition, which will vary. Information pro-
vided in this report should not be considered a recommenda-
tion to purchase or sell securities. The funds (or portfolios) are
not insured by the Federal Deposit Insurance Corp., are not
deposits or other obligations of, or guaranteed by, banks, and
are subject to investment risks, including loss of principal
amount invested. For a more detailed discussion of the risks
associated with the funds (or portfolios), see the
funds’ prospectuses.
Standard & Poor’s, Standard & Poor’s 500, “S&P 500,” and “S&P MidCap 400 Index” are trademarks of The McGraw-Hill Companies, Inc. “Russell 1000,”“Russell 2000,” “Russell 3000,” and “Russell Midcap” are trademarks of Frank Russell Company. “Wilshire 5000” is a trademark of Wilshire Associates.“EAFE” and “MSCI” are trademarks of MSCI, Inc. “Bloomberg Barclays” is a registered trademark of Bloomberg LP. “Lipper” is a registered trademark ofReuters S.A. None of the funds in the Trust is sponsored, endorsed, managed, advised, sold, or promoted by any of these companies, and none of thesecompanies makes any representation regarding the advisability of investing in the Trust.
John Hancock Funds IIManager’s commentary and fund performance
3
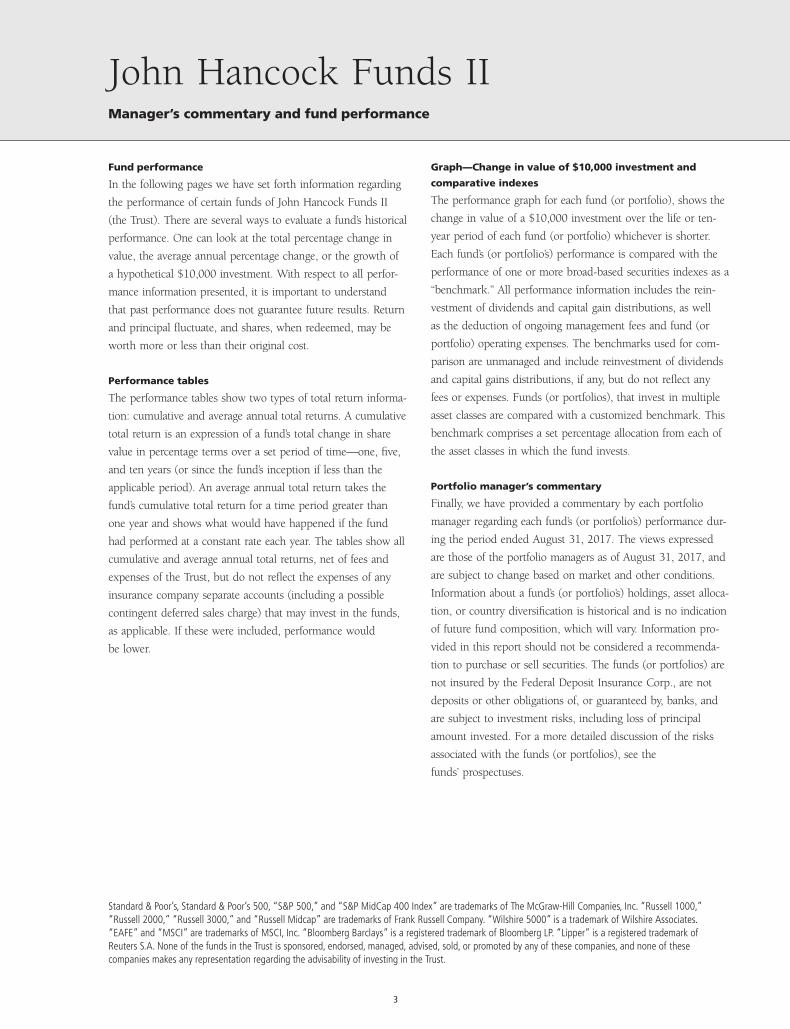
INVESTMENT OBJECTIVE & POLICIES c The fund seeks to maximize total return. The fundseeks to generate capital appreciation and income by investing at least 80% of net assets (plusborrowings for investment purposes) in a diversified portfolio of bonds issued by governments,government agencies, international organizations issuing supranational bonds, and corporate issuersin Asia and the Asian region, including Australia and New Zealand.
CHANGE IN VALUE OF $10,000 INVESTMENT AND COMPARATIVE INDEXES
PORTFOLIO MANAGERS’ COMMENTARY
Performance c For the year ended August 31,2017, the Asia Pacific Total Return Bond FundClass NAV shares returned 3.30% and a blendof 50% J.P. Morgan Asia Credit Index and 50%J.P. Morgan Emerging Local Markets Plus AsiaIndex returned 2.95%.
Environment c The U.S. Federal Reserveincreased its federal funds target rate three timesduring the reporting period. After the 2016 U.S.presidential election, U.S. Treasury yields spikedsharply amid expectations of expansive fiscalspending and higher inflation under the newadministration. Since August 31, 2016, 10-yearTreasury yields rose from 1.58% to 2.12%.
Moody’s Investors Services downgraded China’ssovereign credit rating from Aa3 to A1, citingfactors such as rising debt levels and slowingpotential growth. However, the announcementhad minimal impact on the Chinese bondand currency market since it was expected by
most market participants. Standard and Poor’supgraded Indonesia’s sovereign credit ratingfrom BB+ to BBB-, as the government reducedits budget deficit. The upgrade meant all threemajor credit rating agencies rate the country asinvestment grade.
Indian government bond yields fell as the gov-ernment announced the demonetization of large-denomination notes. This move led to a surgeof liquidity in the banking system and a subse-quent increase in bond investments from banks.Asian corporate credit markets saw gains, pre-dominately driven by the positive carry costs(investment income exceeds carry cost).
The performance of Asian currencies against theU.S. dollar was mixed. The Indian rupee was oneof the better-performing currencies amid capitalinflow into the equity market. The Philippinepeso was one of the weaker-performing curren-cies, as the country’s trade deficit widened.
The fund’s exposure to Indonesian and Indianlocal currency contributed positively to relativeperformance amid lower bond yields. The fund’sunderweight exposure to U.S. dollar interest ratepositioning also contributed, as did its overallsecurity selection in corporate bonds.
The fund’s underweight exposure to the Thaibaht and zero exposure to New Taiwan dollarsdetracted from performance, as the currenciesstrengthened against the U.S. dollar.
We increased the fund’s interest rate durationslightly after the spike in U.S. Treasury yieldsduring the fourth quarter of 2016, to takeadvantage of the higher yields (3.51 to 3.57).In addition, we reduced the fund’s exposure toAsian local currencies to lock in gains amid theweak U.S. dollar environment.
PERFORMANCE TABLE1,2 Average Annual Total Return Cumulative Total Return
Periods Ending August 31, 2017 1-year 5-year 10-yearSince
Inception 5-year 10-yearSince
Inception
Asia Pacific Total Return Bond Fund Class NAV (began 1/16/13) 3.30% — — 1.94% — — 9.31%J.P. Morgan Asia Credit Index3,4 2.41% — — 4.41% — — 22.11%J.P. Morgan Emerging Local Markets Plus Asia Index4,5 3.48% — — –0.12% — — –0.57%Blended Index4,6 2.95% — — 2.14% — — 10.28%
1 Performance does not reflect the deduction of taxes on fund distributions or redemptions of fund shares. Past performance does not guarantee future results.2 Since inception, a portion of the Asia Pacific Total Return Bond Fund expenses was reimbursed. If such expenses had not been reimbursed, returns would be lower.3 The J.P. Morgan Asia Credit Index measures the performance of Asia ex Japan U.S.D. denominated bond market.4 It is not possible to invest directly in an index. Index figures do not reflect expenses or sales charges, which would result in lower returns.5 The J.P. Morgan Emerging Local Markets Plus Asia Index tracks total returns for local-currency-denominated money market instruments in over 20 emerging markets countries.6 The Blended Index is 50% J.P. Morgan Asia Credit Index and 50% J.P. Morgan Emerging Local Markets Plus Asia Index.The expense ratios of the fund, both net (including any fee waivers or expense limitations) and gross (excluding any fee waivers or expense limitations), are set forth according to themost recent publicly available prospectus for the fund and may differ from the expense ratios disclosed in the financial highlights tables in this report. For Class NAV shares the netexpense equals the gross expense and is 0.81%.
Portfolio Composition* % of TotalCorporate bonds 57.9Foreign government obligations 37.0U.S. Government 3.2Other assets and liabilities, net 1.9
* As a percentage of net assets.
8/178/16
$12,211
$11,028$10,931
$9,943
8/158/148/131/13$9,000
$9,500
$10,000
$10,500
$11,000
$11,500
$12,000
$12,500
Asia Pacific Total Return Bond Fund Class NAVJ.P. Morgan Asia Credit IndexJ.P. Morgan Emerging Local Markets Plus Asia IndexBlended Index
Asia Pacific Total Return Bond FundSubadvisor: John Hancock Asset Management a division of Manulife Asset Management (US) LLC (John Hancock Asset Management)Portfolio Managers: Neal Capecci, Endre Pedersen, Jimond Wong, CFA, CPA
4
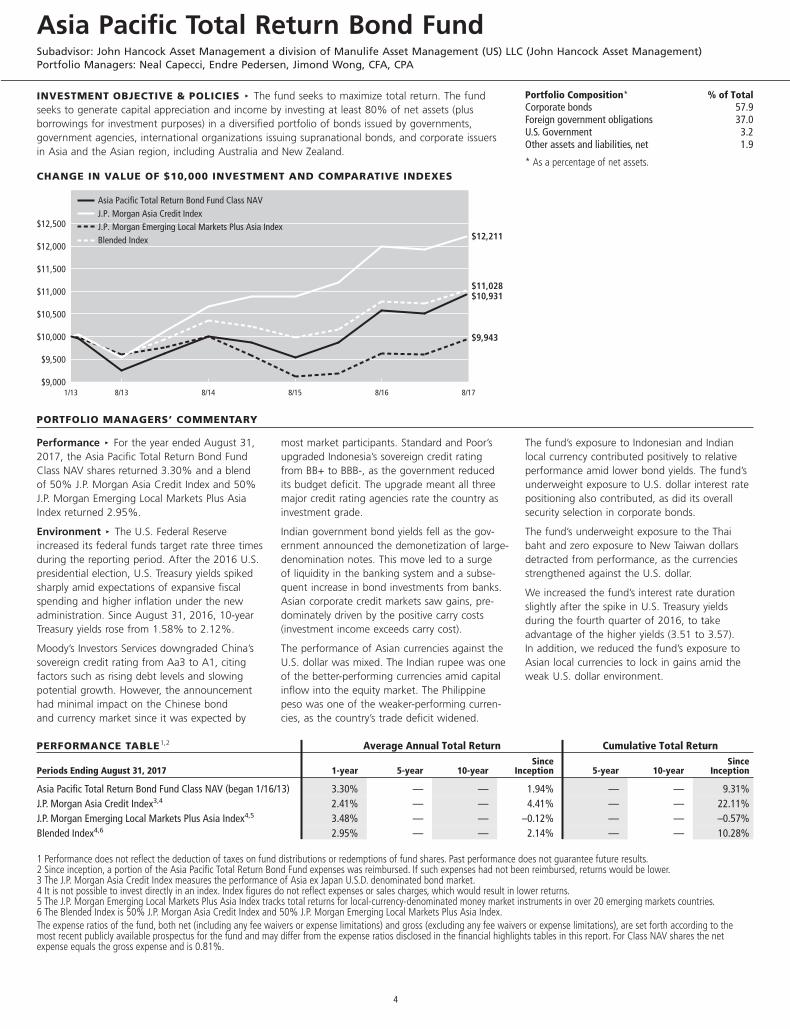
INVESTMENT OBJECTIVE & POLICIES c The fund seeks long-term growth of capital. Undernormal market conditions, the fund invests at least 65% of the fund’s total assets in equity andequity-related securities of companies that, at the time of investment, exceed $1 billion in marketcapitalization and that the subadvisor believes to have above-average growth prospects.
CHANGE IN VALUE OF $10,000 INVESTMENT AND COMPARATIVE INDEX
PORTFOLIO MANAGERS’ COMMENTARY
Performance c For the year ended August 31,2017, the Capital Appreciation Fund Class NAVshares returned 26.62% and the Russell 1000Growth Index returned 20.82%.
Environment c The surprising outcome of theU.S. presidential election and the new adminis-tration’s shaky start contributed to investor uncer-tainty in the period. The initial favorable responseto the election reflected anticipation of lowercorporate tax rates, a less onerous regulatoryenvironment, and increased fiscal spending oninfrastructure. With legislative accomplishmentselusive and factionalism impeding cooperation,market expectations moderated. Solid economicfundamentals in the U.S. included moderategross domestic product growth, robust employ-ment, and accelerating corporate profit growth.
The information technology and consumer discre-tionary sectors had the greatest positive impacton relative performance. In information technol-ogy, Apple, Inc.’s strength reflected the prolifera-tion of the iOS platform across mobile andpersonal computer landscapes as well as thefinancial power and attractive margins of the
company’s hardware products. NVIDIA Corp.’srevenue and earnings exceeded expectations,and the company is focusing on high-growthmarkets where it is leveraging its graphics exper-tise to offer high-value-added solutions. AlibabaGroup Holding, Ltd. beat consensus earningsexpectations. The company operates China’slargest online wholesale platform for small busi-nesses, China’s largest online retail website, andChina’s largest online third-party platform forbrands and retailers. Facebook, Inc.’s revenue andearnings beat consensus expectations, with usergrowth continuing to accelerate and engagementremaining solid.
In consumer discretionary, Netflix, Inc.’s strongsubscriber growth reflected the appeal of thecompany’s original programming. A shift towardexclusive deals and original content, increasingpricing power, international expansion, and scaleadvantage have strengthened the company’slong-term competitive positioning. Amazon.com,Inc. continued to invest in its core retail businessand the proliferation of digital commerce via the
mobile market. The stock benefited from strongexecution, long-term revenue growth, and devel-opment of an important business opportunityin cloud infrastructure. Amazon’s acquisition ofWhole Foods (not held) potentially unlocksanother large addressable market.
Health care holdings detracted from relative per-formance. Alexion Pharmaceuticals, Inc. declinedon news of management shakeups and an inves-tigation into its sales practices. Shire PLC’s weak-ness was related to the possibility of increasedcompetition for its hemophilia drugs. Pressuresfrom growing competition also hurt NovoNordisk A/S, the world’s leading insulin maker.Other detractors from performance includedO’Reilly Automotive, Inc. and QUALCOMM, Inc.O’Reilly’s revenue, earnings, and comparable-store sales missed estimates. The stock’s weak-ness also may have reflected concerns aboutonline competition. Cellphone chipmakerQUALCOMM fell on new and ongoing antitrustlitigation. We sold Shire, Novo Nordisk, andO’Reilly.
PERFORMANCE TABLE1,2 Average Annual Total Return Cumulative Total ReturnPeriods Ending August 31, 2017 1-year 5-year 10-year 5-year 10-year
Capital Appreciation Fund Class 1 26.53% 16.34% 9.91% 113.17% 157.17%Capital Appreciation Fund Class NAV 26.62% 16.39% 9.96% 113.58% 158.48%Russell 1000 Growth Index3,4 20.82% 15.41% 9.39% 104.72% 145.35%
1 Performance does not reflect the deduction of taxes on fund distributions or redemptions of fund shares. Past performance does not guarantee future results.2 Since inception, a portion of the Capital Appreciation Fund expenses was reimbursed. If such expenses had not been reimbursed, returns would be lower.3 The Russell 1000 Growth Index is an unmanaged index composed of the Russell 1000 Index securities that have a greater-than-average growth orientation.4 It is not possible to invest directly in an index. Index figures do not reflect expenses or sales charges, which would result in lower returns.The expense ratios of the fund, both net (including any fee waivers or expense limitations) and gross (excluding any fee waivers or expense limitations), are set forth according to themost recent publicly available prospectuses for the fund and may differ from the expense ratios disclosed in the financial highlights tables in this report. The net expenses equal thegross expenses and are as follows: Class 1 shares – 0.79% and Class NAV shares – 0.74%.
Sector Composition* % of TotalInformation technology 51.7Consumer discretionary 21.5Health care 12.1Industrials 4.7Consumer staples 3.1Financials 2.8Real estate 1.3Materials 1.2Energy 0.8Short-term investments and other 0.8
* As a percentage of net assets.
$4,000
$10,000
$16,000
$22,000
$28,000
Capital Appreciation Fund Class NAVRussell 1000 Growth Index
$25,848$24,535
8/178/168/158/148/138/128/118/108/098/088/07
Capital Appreciation FundSubadvisor: Jennison Associates LLCPortfolio Managers: Michael A. Del Balso, Kathleen A. McCarragher, Spiros “Sig” Segalas
5
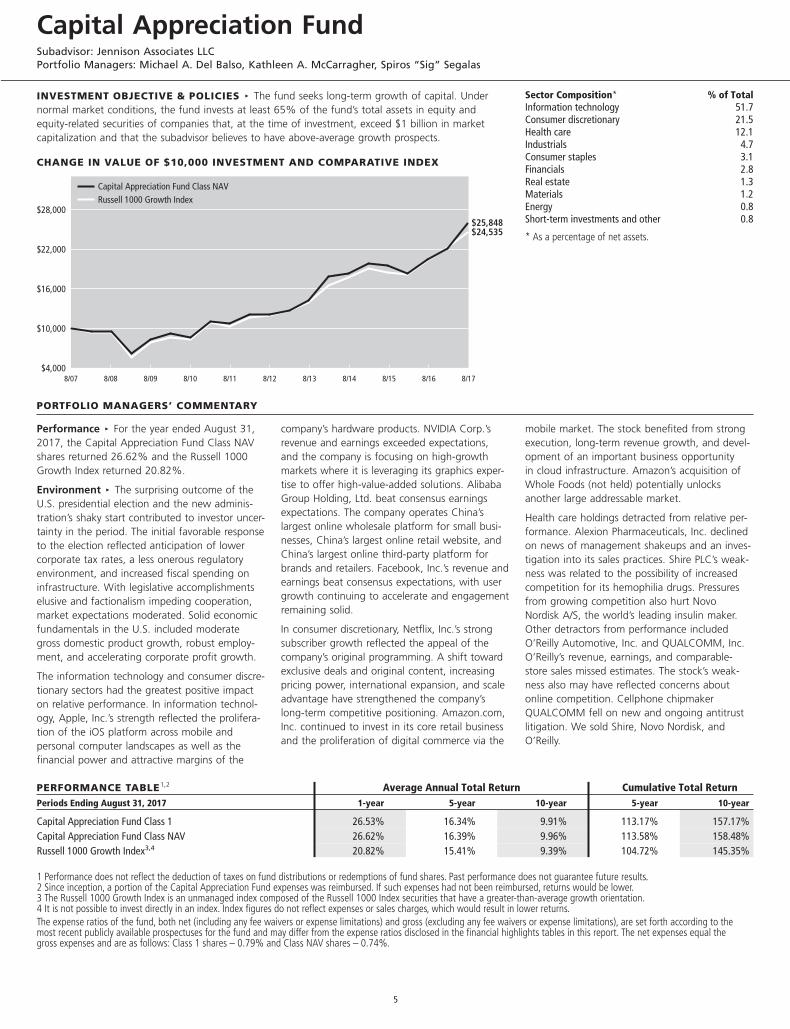
INVESTMENT OBJECTIVE & POLICIES c The fund seeks long-term capital appreciation.Common stocks typically constitute at least 50% of the fund’s total assets. The remaining assetsare generally invested in other securities, including convertible securities, corporate and governmentdebt, bank loans, foreign securities, futures, and options.
CHANGE IN VALUE OF $10,000 INVESTMENT AND COMPARATIVE INDEX
PORTFOLIO MANAGER’S COMMENTARY
Performance c For the year ended August 31,2017, the Capital Appreciation Value FundClass NAV shares returned 11.26% and theS&P 500 Index returned 16.23%.
Environment c U.S. markets remained relativelyflat in the months leading up to the November2016 U.S. elections due to political uncertaintyand concerns about the timing of upcomingFederal Reserve (Fed) interest rate increases.Following the presidential election of DonaldTrump, U.S. equities rocketed higher amid hopesfor lower tax rates, reduced regulation, andincreased infrastructure spending that could leadto stronger economic growth and corporate prof-its. Although the Fed raised short-term ratesthree times during the period and new fiscalstimulus had yet to materialize, stocks continuedto grind higher in 2017, helped by generally solidcorporate earnings and confidence that monetary
policy would remain supportive. Returns weremore muted late in the period, as worries aboutcrises both in the U.S. and abroad seemedto play a large role in dampening investorsentiment.
In this environment, the S&P 500 Index postedstrong positive returns. Most sectors advanced,led by information technology and financials.Energy and telecommunication services werethe only sectors that declined.
From an asset class perspective, the fund’s under-lying equity holdings by themselves outperformedthe S&P 500 Index. The fund’s bond holdings,although posting a positive return for the period,were a drag on results relative to the benchmarkas equities outperformed fixed income securities.
Among equities, the leading detractor fromrelative performance was the financials sector,
due to stock selection. Shares of global insurancebroker Marsh & McLennan Companies, Inc.advanced but trailed the broader sector, as bankand capital markets names provided strongerreturns on a rise in interest rates and optimismfor a healthier regulatory environment. Stockchoices in the consumer discretionary sectoralso hindered relative results.
The health care sector was the leading contri-butor to relative results due to stock choices.UnitedHealth Group, Inc. benefited from better-than-expected medical loss ratios, lower taxrates, and solid performance in its Optum healthservices business. The energy sector alsosupported relative performance due to bothan underweight position and stock selection.
PERFORMANCE TABLE1,2 Average Annual Total Return Cumulative Total Return
Periods Ending August 31, 2017 1-year 5-year 10-yearSince
Inception 5-year 10-yearSince
Inception
Capital Appreciation Value Fund Class NAV (began 1/6/11) 11.26% 12.35% — 11.17% 79.00% — 102.21%S&P 500 Index3,4 16.23% 14.34% — 12.82% 95.43% — 123.12%
1 Performance does not reflect the deduction of taxes on fund distributions or redemptions of fund shares. Past performance does not guarantee future results.2 Since inception, a portion of the Capital Appreciation Value Fund expenses was reimbursed. If such expenses had not been reimbursed, returns would be lower.3 The S&P 500 Index is an unmanaged index that includes 500 widely traded common stocks.4 It is not possible to invest directly in an index. Index figures do not reflect expenses or sales charges, which would result in lower returns.The expense ratios of the fund, both net (including any fee waivers or expense limitations) and gross (excluding any fee waivers or expense limitations), are set forth according to themost recent publicly available prospectus for the fund and may differ from the expense ratios disclosed in the financial highlights tables in this report. For Class NAV shares, the netexpense equals the gross expense and is 0.85%.
Portfolio Composition* % of TotalCommon stocks 62.5Corporate bonds 20.1Preferred securities 3.6Term loans 1.3Short-term investments and other 12.5
* As a percentage of net assets.
8/17$8,000
$10,000
$12,000
$14,000
$16,000
$18,000
$20,000
$22,000
$24,000
$22,312
$20,221
Capital Appreciation Value Fund Class NAVS&P 500 Index
8/168/158/148/138/128/111/11
Capital Appreciation Value FundSubadvisor: T. Rowe Price Associates, Inc.Portfolio Manager: David R. Giroux
6
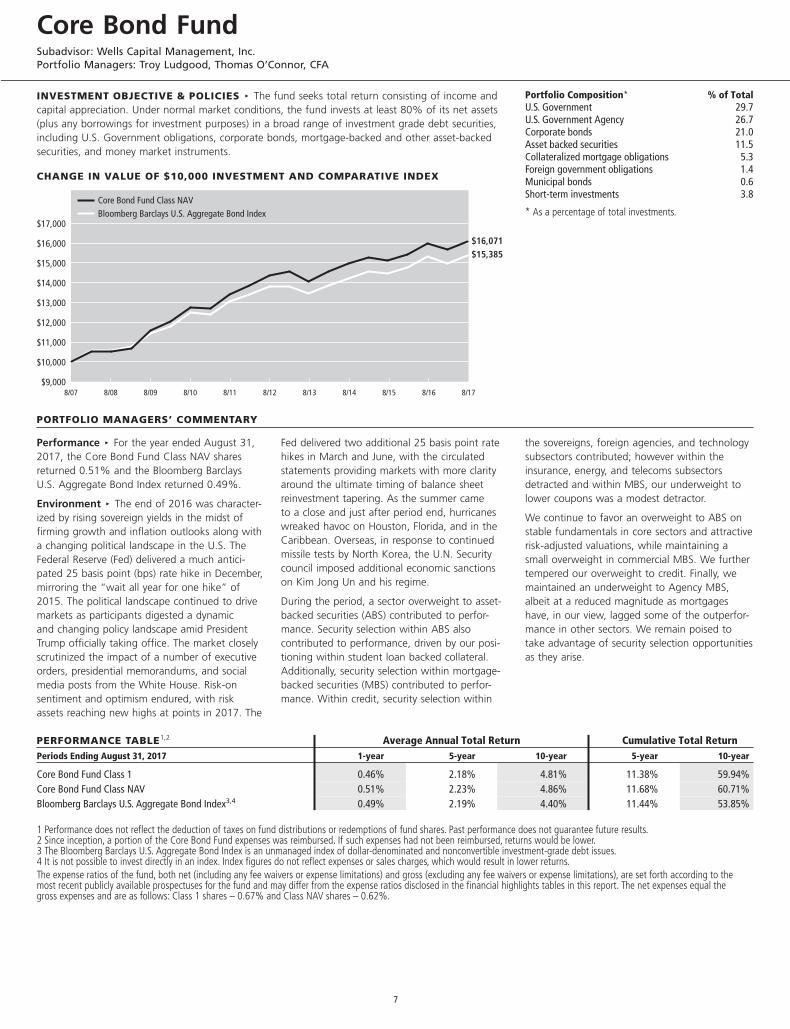
INVESTMENT OBJECTIVE & POLICIES c The fund seeks total return consisting of income andcapital appreciation. Under normal market conditions, the fund invests at least 80% of its net assets(plus any borrowings for investment purposes) in a broad range of investment grade debt securities,including U.S. Government obligations, corporate bonds, mortgage-backed and other asset-backedsecurities, and money market instruments.
CHANGE IN VALUE OF $10,000 INVESTMENT AND COMPARATIVE INDEX
PORTFOLIO MANAGERS’ COMMENTARY
Performance c For the year ended August 31,2017, the Core Bond Fund Class NAV sharesreturned 0.51% and the Bloomberg BarclaysU.S. Aggregate Bond Index returned 0.49%.
Environment c The end of 2016 was character-ized by rising sovereign yields in the midst offirming growth and inflation outlooks along witha changing political landscape in the U.S. TheFederal Reserve (Fed) delivered a much antici-pated 25 basis point (bps) rate hike in December,mirroring the “wait all year for one hike” of2015. The political landscape continued to drivemarkets as participants digested a dynamicand changing policy landscape amid PresidentTrump officially taking office. The market closelyscrutinized the impact of a number of executiveorders, presidential memorandums, and socialmedia posts from the White House. Risk-onsentiment and optimism endured, with riskassets reaching new highs at points in 2017. The
Fed delivered two additional 25 basis point ratehikes in March and June, with the circulatedstatements providing markets with more clarityaround the ultimate timing of balance sheetreinvestment tapering. As the summer cameto a close and just after period end, hurricaneswreaked havoc on Houston, Florida, and in theCaribbean. Overseas, in response to continuedmissile tests by North Korea, the U.N. Securitycouncil imposed additional economic sanctionson Kim Jong Un and his regime.
During the period, a sector overweight to asset-backed securities (ABS) contributed to perfor-mance. Security selection within ABS alsocontributed to performance, driven by our posi-tioning within student loan backed collateral.Additionally, security selection within mortgage-backed securities (MBS) contributed to perfor-mance. Within credit, security selection within
the sovereigns, foreign agencies, and technologysubsectors contributed; however within theinsurance, energy, and telecoms subsectorsdetracted and within MBS, our underweight tolower coupons was a modest detractor.
We continue to favor an overweight to ABS onstable fundamentals in core sectors and attractiverisk-adjusted valuations, while maintaining asmall overweight in commercial MBS. We furthertempered our overweight to credit. Finally, wemaintained an underweight to Agency MBS,albeit at a reduced magnitude as mortgageshave, in our view, lagged some of the outperfor-mance in other sectors. We remain poised totake advantage of security selection opportunitiesas they arise.
PERFORMANCE TABLE1,2 Average Annual Total Return Cumulative Total ReturnPeriods Ending August 31, 2017 1-year 5-year 10-year 5-year 10-year
Core Bond Fund Class 1 0.46% 2.18% 4.81% 11.38% 59.94%Core Bond Fund Class NAV 0.51% 2.23% 4.86% 11.68% 60.71%Bloomberg Barclays U.S. Aggregate Bond Index3,4 0.49% 2.19% 4.40% 11.44% 53.85%
1 Performance does not reflect the deduction of taxes on fund distributions or redemptions of fund shares. Past performance does not guarantee future results.2 Since inception, a portion of the Core Bond Fund expenses was reimbursed. If such expenses had not been reimbursed, returns would be lower.3 The Bloomberg Barclays U.S. Aggregate Bond Index is an unmanaged index of dollar-denominated and nonconvertible investment-grade debt issues.4 It is not possible to invest directly in an index. Index figures do not reflect expenses or sales charges, which would result in lower returns.The expense ratios of the fund, both net (including any fee waivers or expense limitations) and gross (excluding any fee waivers or expense limitations), are set forth according to themost recent publicly available prospectuses for the fund and may differ from the expense ratios disclosed in the financial highlights tables in this report. The net expenses equal thegross expenses and are as follows: Class 1 shares – 0.67% and Class NAV shares – 0.62%.
Portfolio Composition* % of TotalU.S. Government 29.7U.S. Government Agency 26.7Corporate bonds 21.0Asset backed securities 11.5Collateralized mortgage obligations 5.3Foreign government obligations 1.4Municipal bonds 0.6Short-term investments 3.8
* As a percentage of total investments.
$9,000
$10,000
$11,000
$12,000
$13,000
$14,000
$15,000
$16,000
$17,000
$16,071$15,385
Core Bond Fund Class NAVBloomberg Barclays U.S. Aggregate Bond Index
8/178/168/158/148/138/128/118/108/098/088/07
Core Bond FundSubadvisor: Wells Capital Management, Inc.Portfolio Managers: Troy Ludgood, Thomas O’Connor, CFA
7
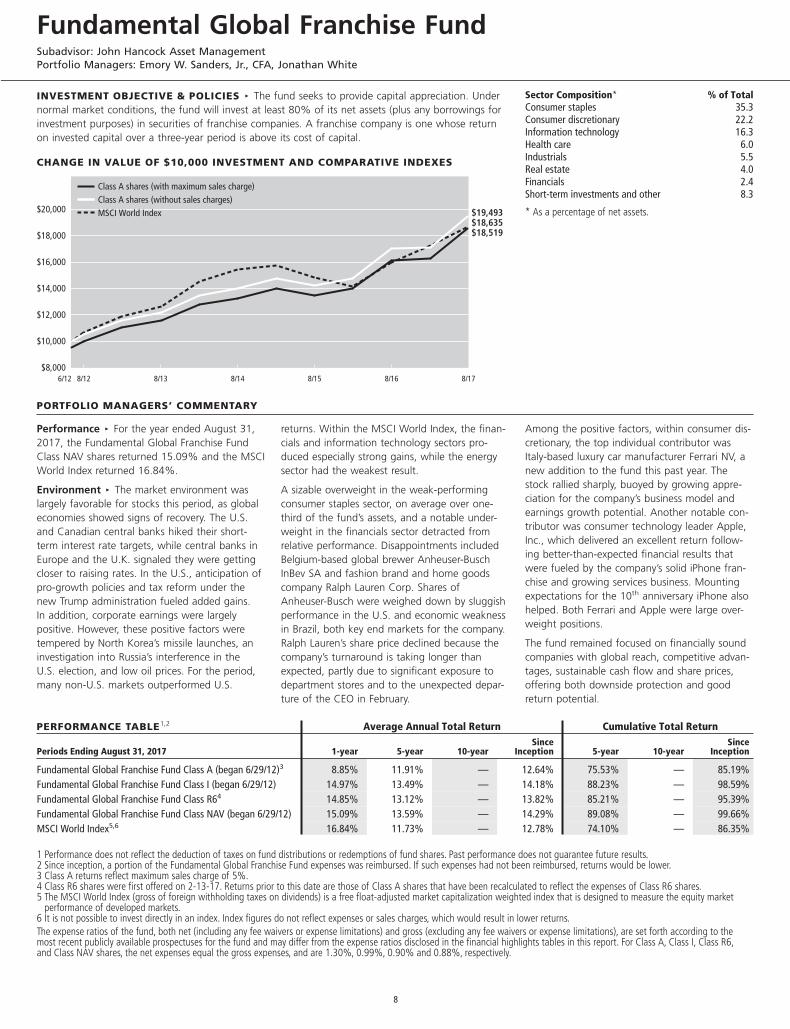
INVESTMENT OBJECTIVE & POLICIES c The fund seeks to provide capital appreciation. Undernormal market conditions, the fund will invest at least 80% of its net assets (plus any borrowings forinvestment purposes) in securities of franchise companies. A franchise company is one whose returnon invested capital over a three-year period is above its cost of capital.
CHANGE IN VALUE OF $10,000 INVESTMENT AND COMPARATIVE INDEXES
PORTFOLIO MANAGERS’ COMMENTARY
Performance c For the year ended August 31,2017, the Fundamental Global Franchise FundClass NAV shares returned 15.09% and the MSCIWorld Index returned 16.84%.
Environment c The market environment waslargely favorable for stocks this period, as globaleconomies showed signs of recovery. The U.S.and Canadian central banks hiked their short-term interest rate targets, while central banks inEurope and the U.K. signaled they were gettingcloser to raising rates. In the U.S., anticipation ofpro-growth policies and tax reform under thenew Trump administration fueled added gains.In addition, corporate earnings were largelypositive. However, these positive factors weretempered by North Korea’s missile launches, aninvestigation into Russia’s interference in theU.S. election, and low oil prices. For the period,many non-U.S. markets outperformed U.S.
returns. Within the MSCI World Index, the finan-cials and information technology sectors pro-duced especially strong gains, while the energysector had the weakest result.
A sizable overweight in the weak-performingconsumer staples sector, on average over one-third of the fund’s assets, and a notable under-weight in the financials sector detracted fromrelative performance. Disappointments includedBelgium-based global brewer Anheuser-BuschInBev SA and fashion brand and home goodscompany Ralph Lauren Corp. Shares ofAnheuser-Busch were weighed down by sluggishperformance in the U.S. and economic weaknessin Brazil, both key end markets for the company.Ralph Lauren’s share price declined because thecompany’s turnaround is taking longer thanexpected, partly due to significant exposure todepartment stores and to the unexpected depar-ture of the CEO in February.
Among the positive factors, within consumer dis-cretionary, the top individual contributor wasItaly-based luxury car manufacturer Ferrari NV, anew addition to the fund this past year. Thestock rallied sharply, buoyed by growing appre-ciation for the company’s business model andearnings growth potential. Another notable con-tributor was consumer technology leader Apple,Inc., which delivered an excellent return follow-ing better-than-expected financial results thatwere fueled by the company’s solid iPhone fran-chise and growing services business. Mountingexpectations for the 10th anniversary iPhone alsohelped. Both Ferrari and Apple were large over-weight positions.
The fund remained focused on financially soundcompanies with global reach, competitive advan-tages, sustainable cash flow and share prices,offering both downside protection and goodreturn potential.
PERFORMANCE TABLE1,2 Average Annual Total Return Cumulative Total Return
Periods Ending August 31, 2017 1-year 5-year 10-yearSince
Inception 5-year 10-yearSince
Inception
Fundamental Global Franchise Fund Class A (began 6/29/12)3 8.85% 11.91% — 12.64% 75.53% — 85.19%Fundamental Global Franchise Fund Class I (began 6/29/12) 14.97% 13.49% — 14.18% 88.23% — 98.59%Fundamental Global Franchise Fund Class R64 14.85% 13.12% — 13.82% 85.21% — 95.39%Fundamental Global Franchise Fund Class NAV (began 6/29/12) 15.09% 13.59% — 14.29% 89.08% — 99.66%MSCI World Index5,6 16.84% 11.73% — 12.78% 74.10% — 86.35%
1 Performance does not reflect the deduction of taxes on fund distributions or redemptions of fund shares. Past performance does not guarantee future results.2 Since inception, a portion of the Fundamental Global Franchise Fund expenses was reimbursed. If such expenses had not been reimbursed, returns would be lower.3 Class A returns reflect maximum sales charge of 5%.4 Class R6 shares were first offered on 2-13-17. Returns prior to this date are those of Class A shares that have been recalculated to reflect the expenses of Class R6 shares.5 The MSCI World Index (gross of foreign withholding taxes on dividends) is a free float-adjusted market capitalization weighted index that is designed to measure the equity market
performance of developed markets.6 It is not possible to invest directly in an index. Index figures do not reflect expenses or sales charges, which would result in lower returns.The expense ratios of the fund, both net (including any fee waivers or expense limitations) and gross (excluding any fee waivers or expense limitations), are set forth according to themost recent publicly available prospectuses for the fund and may differ from the expense ratios disclosed in the financial highlights tables in this report. For Class A, Class I, Class R6,and Class NAV shares, the net expenses equal the gross expenses, and are 1.30%, 0.99%, 0.90% and 0.88%, respectively.
Sector Composition* % of TotalConsumer staples 35.3Consumer discretionary 22.2Information technology 16.3Health care 6.0Industrials 5.5Real estate 4.0Financials 2.4Short-term investments and other 8.3
* As a percentage of net assets.
8/17$8,000
$10,000
$12,000
$14,000
$16,000
$18,000
$20,000
Class A shares (with maximum sales charge)Class A shares (without sales charges)MSCI World Index $19,493
$18,635$18,519
8/168/158/148/138/126/12
Fundamental Global Franchise FundSubadvisor: John Hancock Asset ManagementPortfolio Managers: Emory W. Sanders, Jr., CFA, Jonathan White
8
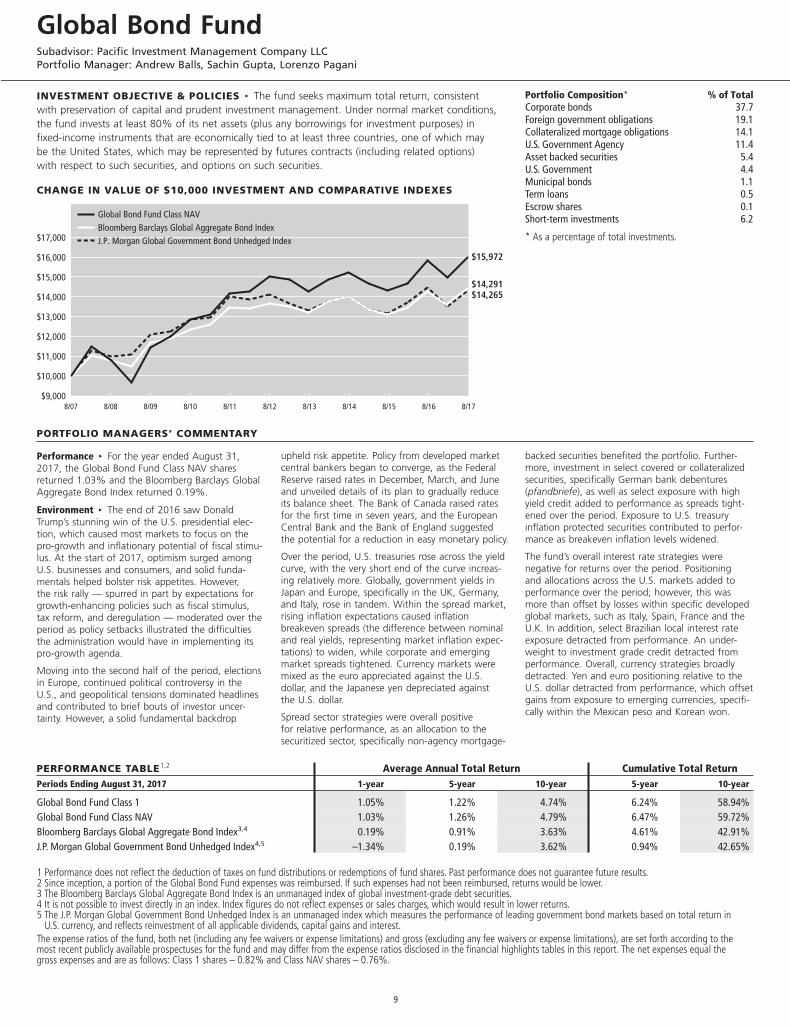
INVESTMENT OBJECTIVE & POLICIES c The fund seeks maximum total return, consistentwith preservation of capital and prudent investment management. Under normal market conditions,the fund invests at least 80% of its net assets (plus any borrowings for investment purposes) infixed-income instruments that are economically tied to at least three countries, one of which maybe the United States, which may be represented by futures contracts (including related options)with respect to such securities, and options on such securities.
CHANGE IN VALUE OF $10,000 INVESTMENT AND COMPARATIVE INDEXES
PORTFOLIO MANAGERS’ COMMENTARY
Performance c For the year ended August 31,2017, the Global Bond Fund Class NAV sharesreturned 1.03% and the Bloomberg Barclays GlobalAggregate Bond Index returned 0.19%.
Environment c The end of 2016 saw DonaldTrump’s stunning win of the U.S. presidential elec-tion, which caused most markets to focus on thepro-growth and inflationary potential of fiscal stimu-lus. At the start of 2017, optimism surged amongU.S. businesses and consumers, and solid funda-mentals helped bolster risk appetites. However,the risk rally — spurred in part by expectations forgrowth-enhancing policies such as fiscal stimulus,tax reform, and deregulation — moderated over theperiod as policy setbacks illustrated the difficultiesthe administration would have in implementing itspro-growth agenda.
Moving into the second half of the period, electionsin Europe, continued political controversy in theU.S., and geopolitical tensions dominated headlinesand contributed to brief bouts of investor uncer-tainty. However, a solid fundamental backdrop
upheld risk appetite. Policy from developed marketcentral bankers began to converge, as the FederalReserve raised rates in December, March, and Juneand unveiled details of its plan to gradually reduceits balance sheet. The Bank of Canada raised ratesfor the first time in seven years, and the EuropeanCentral Bank and the Bank of England suggestedthe potential for a reduction in easy monetary policy.
Over the period, U.S. treasuries rose across the yieldcurve, with the very short end of the curve increas-ing relatively more. Globally, government yields inJapan and Europe, specifically in the UK, Germany,and Italy, rose in tandem. Within the spread market,rising inflation expectations caused inflationbreakeven spreads (the difference between nominaland real yields, representing market inflation expec-tations) to widen, while corporate and emergingmarket spreads tightened. Currency markets weremixed as the euro appreciated against the U.S.dollar, and the Japanese yen depreciated againstthe U.S. dollar.
Spread sector strategies were overall positivefor relative performance, as an allocation to thesecuritized sector, specifically non-agency mortgage-
backed securities benefited the portfolio. Further-more, investment in select covered or collateralizedsecurities, specifically German bank debentures(pfandbriefe), as well as select exposure with highyield credit added to performance as spreads tight-ened over the period. Exposure to U.S. treasuryinflation protected securities contributed to perfor-mance as breakeven inflation levels widened.
The fund’s overall interest rate strategies werenegative for returns over the period. Positioningand allocations across the U.S. markets added toperformance over the period; however, this wasmore than offset by losses within specific developedglobal markets, such as Italy, Spain, France and theU.K. In addition, select Brazilian local interest rateexposure detracted from performance. An under-weight to investment grade credit detracted fromperformance. Overall, currency strategies broadlydetracted. Yen and euro positioning relative to theU.S. dollar detracted from performance, which offsetgains from exposure to emerging currencies, specifi-cally within the Mexican peso and Korean won.
PERFORMANCE TABLE1,2 Average Annual Total Return Cumulative Total ReturnPeriods Ending August 31, 2017 1-year 5-year 10-year 5-year 10-year
Global Bond Fund Class 1 1.05% 1.22% 4.74% 6.24% 58.94%Global Bond Fund Class NAV 1.03% 1.26% 4.79% 6.47% 59.72%Bloomberg Barclays Global Aggregate Bond Index3,4 0.19% 0.91% 3.63% 4.61% 42.91%J.P. Morgan Global Government Bond Unhedged Index4,5 –1.34% 0.19% 3.62% 0.94% 42.65%
1 Performance does not reflect the deduction of taxes on fund distributions or redemptions of fund shares. Past performance does not guarantee future results.2 Since inception, a portion of the Global Bond Fund expenses was reimbursed. If such expenses had not been reimbursed, returns would be lower.3 The Bloomberg Barclays Global Aggregate Bond Index is an unmanaged index of global investment-grade debt securities.4 It is not possible to invest directly in an index. Index figures do not reflect expenses or sales charges, which would result in lower returns.5 The J.P. Morgan Global Government Bond Unhedged Index is an unmanaged index which measures the performance of leading government bond markets based on total return in
U.S. currency, and reflects reinvestment of all applicable dividends, capital gains and interest.The expense ratios of the fund, both net (including any fee waivers or expense limitations) and gross (excluding any fee waivers or expense limitations), are set forth according to themost recent publicly available prospectuses for the fund and may differ from the expense ratios disclosed in the financial highlights tables in this report. The net expenses equal thegross expenses and are as follows: Class 1 shares – 0.82% and Class NAV shares – 0.76%.
Portfolio Composition* % of TotalCorporate bonds 37.7Foreign government obligations 19.1Collateralized mortgage obligations 14.1U.S. Government Agency 11.4Asset backed securities 5.4U.S. Government 4.4Municipal bonds 1.1Term loans 0.5Escrow shares 0.1Short-term investments 6.2
* As a percentage of total investments.
$9,000
$10,000
$11,000
$12,000
$13,000
$14,000
$15,000
$16,000
$17,000
8/178/168/158/148/138/128/118/108/098/088/07
Global Bond Fund Class NAVBloomberg Barclays Global Aggregate Bond IndexJ.P. Morgan Global Government Bond Unhedged Index
$15,972
$14,291$14,265
Global Bond FundSubadvisor: Pacific Investment Management Company LLCPortfolio Manager: Andrew Balls, Sachin Gupta, Lorenzo Pagani
9
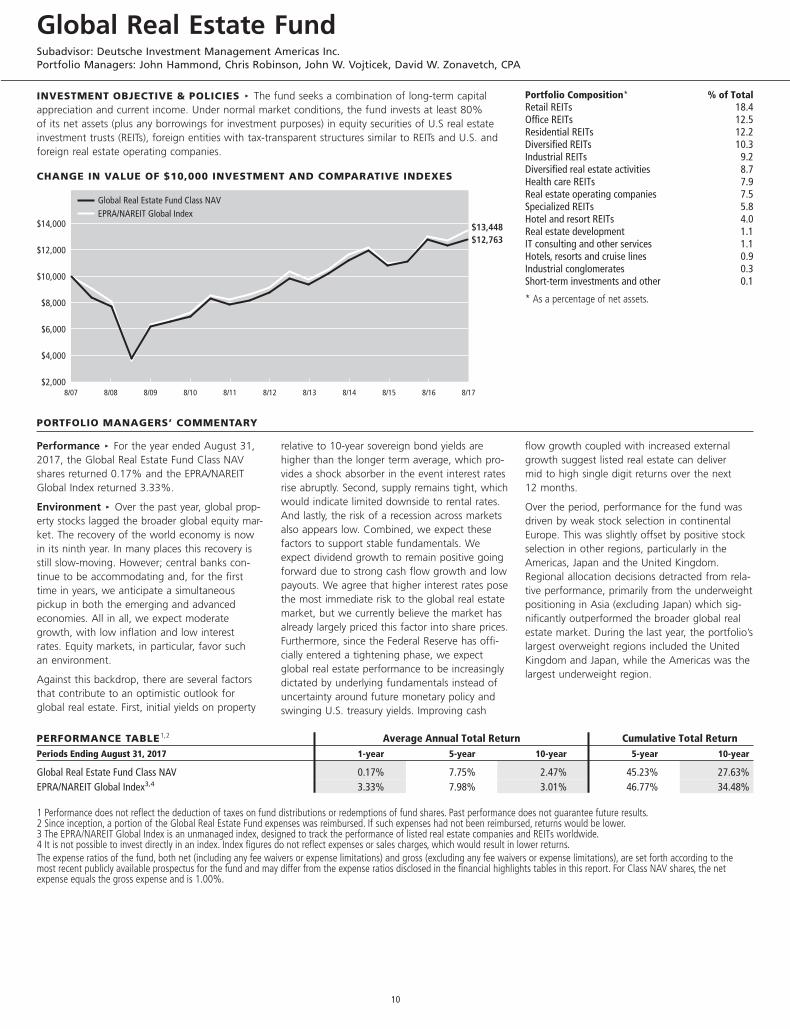
INVESTMENT OBJECTIVE & POLICIES c The fund seeks a combination of long-term capitalappreciation and current income. Under normal market conditions, the fund invests at least 80%of its net assets (plus any borrowings for investment purposes) in equity securities of U.S real estateinvestment trusts (REITs), foreign entities with tax-transparent structures similar to REITs and U.S. andforeign real estate operating companies.
CHANGE IN VALUE OF $10,000 INVESTMENT AND COMPARATIVE INDEXES
PORTFOLIO MANAGERS’ COMMENTARY
Performance c For the year ended August 31,2017, the Global Real Estate Fund Class NAVshares returned 0.17% and the EPRA/NAREITGlobal Index returned 3.33%.
Environment c Over the past year, global prop-erty stocks lagged the broader global equity mar-ket. The recovery of the world economy is nowin its ninth year. In many places this recovery isstill slow-moving. However; central banks con-tinue to be accommodating and, for the firsttime in years, we anticipate a simultaneouspickup in both the emerging and advancedeconomies. All in all, we expect moderategrowth, with low inflation and low interestrates. Equity markets, in particular, favor suchan environment.
Against this backdrop, there are several factorsthat contribute to an optimistic outlook forglobal real estate. First, initial yields on property
relative to 10-year sovereign bond yields arehigher than the longer term average, which pro-vides a shock absorber in the event interest ratesrise abruptly. Second, supply remains tight, whichwould indicate limited downside to rental rates.And lastly, the risk of a recession across marketsalso appears low. Combined, we expect thesefactors to support stable fundamentals. Weexpect dividend growth to remain positive goingforward due to strong cash flow growth and lowpayouts. We agree that higher interest rates posethe most immediate risk to the global real estatemarket, but we currently believe the market hasalready largely priced this factor into share prices.Furthermore, since the Federal Reserve has offi-cially entered a tightening phase, we expectglobal real estate performance to be increasinglydictated by underlying fundamentals instead ofuncertainty around future monetary policy andswinging U.S. treasury yields. Improving cash
flow growth coupled with increased externalgrowth suggest listed real estate can delivermid to high single digit returns over the next12 months.
Over the period, performance for the fund wasdriven by weak stock selection in continentalEurope. This was slightly offset by positive stockselection in other regions, particularly in theAmericas, Japan and the United Kingdom.Regional allocation decisions detracted from rela-tive performance, primarily from the underweightpositioning in Asia (excluding Japan) which sig-nificantly outperformed the broader global realestate market. During the last year, the portfolio’slargest overweight regions included the UnitedKingdom and Japan, while the Americas was thelargest underweight region.
PERFORMANCE TABLE1,2 Average Annual Total Return Cumulative Total ReturnPeriods Ending August 31, 2017 1-year 5-year 10-year 5-year 10-year
Global Real Estate Fund Class NAV 0.17% 7.75% 2.47% 45.23% 27.63%EPRA/NAREIT Global Index3,4 3.33% 7.98% 3.01% 46.77% 34.48%
1 Performance does not reflect the deduction of taxes on fund distributions or redemptions of fund shares. Past performance does not guarantee future results.2 Since inception, a portion of the Global Real Estate Fund expenses was reimbursed. If such expenses had not been reimbursed, returns would be lower.3 The EPRA/NAREIT Global Index is an unmanaged index, designed to track the performance of listed real estate companies and REITs worldwide.4 It is not possible to invest directly in an index. Index figures do not reflect expenses or sales charges, which would result in lower returns.The expense ratios of the fund, both net (including any fee waivers or expense limitations) and gross (excluding any fee waivers or expense limitations), are set forth according to themost recent publicly available prospectus for the fund and may differ from the expense ratios disclosed in the financial highlights tables in this report. For Class NAV shares, the netexpense equals the gross expense and is 1.00%.
Portfolio Composition* % of TotalRetail REITs 18.4Office REITs 12.5Residential REITs 12.2Diversified REITs 10.3Industrial REITs 9.2Diversified real estate activities 8.7Health care REITs 7.9Real estate operating companies 7.5Specialized REITs 5.8Hotel and resort REITs 4.0Real estate development 1.1IT consulting and other services 1.1Hotels, resorts and cruise lines 0.9Industrial conglomerates 0.3Short-term investments and other 0.1
* As a percentage of net assets.
$2,000
$4,000
$6,000
$8,000
$10,000
$12,000
$14,000 $13,448$12,763
Global Real Estate Fund Class NAVEPRA/NAREIT Global Index
8/178/168/158/148/138/128/118/108/098/088/07
Global Real Estate FundSubadvisor: Deutsche Investment Management Americas Inc.Portfolio Managers: John Hammond, Chris Robinson, John W. Vojticek, David W. Zonavetch, CPA
10

INVESTMENT OBJECTIVE & POLICIES c The fund seeks long-term capital appreciation. Undernormal market conditions, the fund invests at least 80% of its net assets (plus any borrowings forinvestment purposes) in common stocks of companies engaged, at the time of investment, in theresearch, development, production, or distribution of products or services related to healthcare,medicine, or the life sciences.
CHANGE IN VALUE OF $10,000 INVESTMENT AND COMPARATIVE INDEXES
PORTFOLIO MANAGERS’ COMMENTARY
Performance c For the year ended August 31,2017, the Health Sciences Fund Class NAVshares returned 18.48% and the Lipper Health/Biotechnology Index returned 19.10%.
Environment c The election of Donald Trumpin last year’s U.S. presidential election prompteda substantial rally as hopes for the new adminis-tration seemed to help stocks gather renewedmomentum later in November and into mid-December. Several factors may have been atwork in the rally. Chief among them were expec-tations for higher economic growth and corpo-rate profits in response to both tax cuts andincreased infrastructure spending. However, set-backs in the Republicans’ effort to repeal andreplace the Affordable Care Act sparked investorconcerns during the first half of 2017 as mostobservers anticipated that progress on tax cutsand other stimulus initiatives would be delayed.The 12-month period ended with heightenedtensions between the U.S. and North Korea, as
the latter’s launch of a ballistic missile over Japanon August 28 caused a brief pullback.
After struggling for much of 2016 amidst a diffi-cult backdrop with increased pressure on drugpricing and fears of a deceleration in innovation,health care has been a notable area of strength,and the Lipper Health/Biotechnology Funds Indexoutperformed the broader market. Services andbiotechnology performed the best. The possiblerepeal and replacement of the Affordable CareAct served as an area of interest for services;however, since the likelihood of a new programthat differs drastically from the status quo hasdecreased, the level of uncertainty surroundingthis area diminished during the period. Biotech-nology gained traction as concerns surroundingdrug pricing lessened. Conversely, pharmaceuti-cals yielded more modest positive returns, thelowest segment return in the index.
Stock selection in pharmaceuticals detractedfrom results. Shares of Mallinckrodt PLC fellduring the period on concerns about drug
pricing that affected the specialty pharmaceuticalindustry broadly. Shares of Shire PLC were pres-sured by concerns that its hemophilia businesswould be negatively impacted by a new drugbeing developed by a competitor. We believethat Shire’s hemophilia business is more defen-sible than the market expects and think thecompany has a compelling product pipelineand a solid, seasoned management team.
On the other hand, stock selection in biotech-nology assisted relative performance the most.Within the sector, Kite Pharma, Inc. was a notablecontributor to relative results. Its shares increasedsignificantly throughout 2017, thanks in large partto optimism surrounding early approval for AxiCel,the firm’s cutting-edge cancer therapy. Sharesspiked at the end of August as speculation thatKite Pharma was a prime takeout target turnedinto reality when Gilead Sciences, Inc. (also heldby the fund) announced plans to acquire thecompany at a substantial premium.
PERFORMANCE TABLE1,2 Average Annual Total Return Cumulative Total Return
Periods Ending August 31, 2017 1-year 5-year 10-yearSince
Inception 5-year 10-yearSince
Inception
Health Sciences Fund Class NAV (began 9/30/11) 18.48% 20.32% — 23.28% 152.12% — 245.41%S&P 500 Index3,4 16.23% 14.34% — 16.08% 95.43% — 141.85%Lipper Health/Biotechnology Index4,5 19.10% 19.59% — 21.60% 144.57% — 218.47%
1 Performance does not reflect the deduction of taxes on fund distributions or redemptions of fund shares. Past performance does not guarantee future results.2 Since inception, a portion of the Health Sciences Fund expenses was reimbursed. If such expenses were not reimbursed, returns would be lower.3 The S&P 500 Index is an unmanaged index that includes 500 widely traded stocks.4 It is not possible to invest directly in an index. Index figures do not reflect expenses or sales charges, which would result in lower returns.5 The Lipper Health/Biotechnology Index measures the performance of health and biotech funds.The expense ratios of the fund, both net (including any fee waivers or expense limitations) and gross (excluding any fee waivers or expense limitations), are set forth according to themost recent publicly available prospectus for the fund and may differ from the expense ratios disclosed in the financial highlights tables in this report. For Class NAV shares, the netexpense equals the gross expense and is 1.10%.
Industry Composition* % of TotalBiotechnology 39.0Health care providers and services 22.1Health care equipment and supplies 17.1Pharmaceuticals 13.3Life sciences tools and services 5.5Food and staples retailing 1.1Health care technology 0.7Specialty retail 0.1Software 0.1Short-term investments 1.0
* As a percentage of total investments.
8/17$5,000
$10,000
$15,000
$20,000
$25,000
$30,000
$35,000 $34,541
$31,847
$24,185
Health Sciences Fund Class NAVS&P 500 IndexLipper Health/Biotechnology Index
8/168/158/148/138/129/11
Health Sciences FundSubadvisor: T. Rowe Price Associates, Inc.Portfolio Manager: Ziad Bakri
11
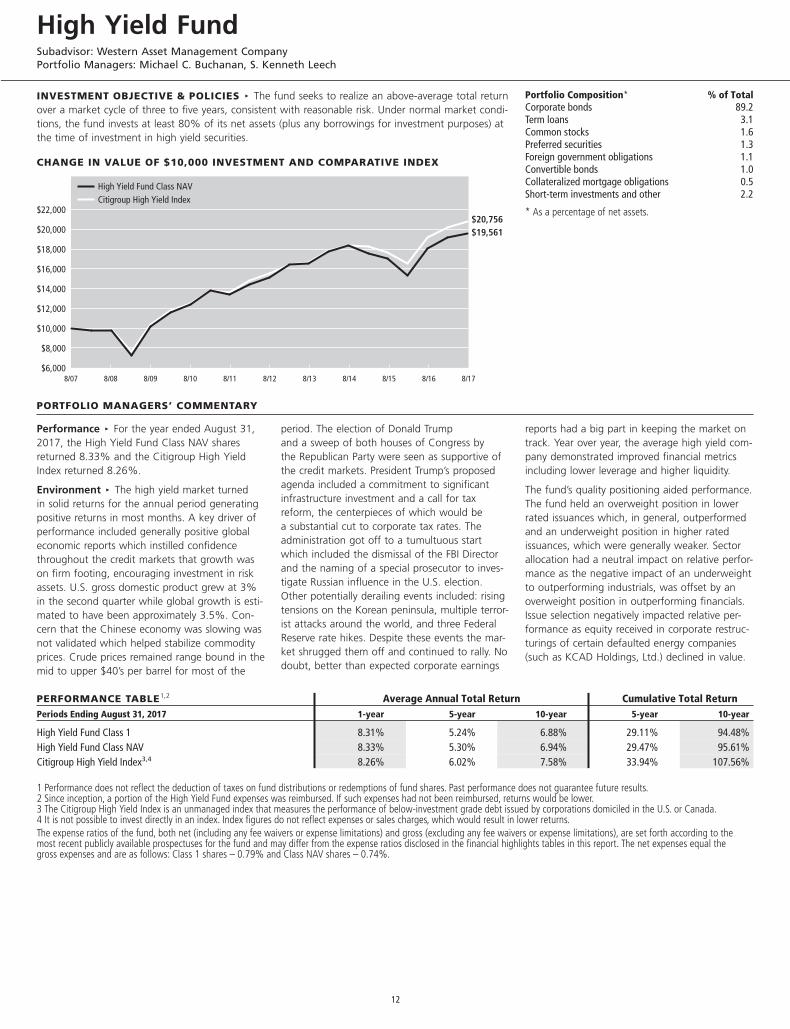
INVESTMENT OBJECTIVE & POLICIES c The fund seeks to realize an above-average total returnover a market cycle of three to five years, consistent with reasonable risk. Under normal market condi-tions, the fund invests at least 80% of its net assets (plus any borrowings for investment purposes) atthe time of investment in high yield securities.
CHANGE IN VALUE OF $10,000 INVESTMENT AND COMPARATIVE INDEX
PORTFOLIO MANAGERS’ COMMENTARY
Performance c For the year ended August 31,2017, the High Yield Fund Class NAV sharesreturned 8.33% and the Citigroup High YieldIndex returned 8.26%.
Environment c The high yield market turnedin solid returns for the annual period generatingpositive returns in most months. A key driver ofperformance included generally positive globaleconomic reports which instilled confidencethroughout the credit markets that growth wason firm footing, encouraging investment in riskassets. U.S. gross domestic product grew at 3%in the second quarter while global growth is esti-mated to have been approximately 3.5%. Con-cern that the Chinese economy was slowing wasnot validated which helped stabilize commodityprices. Crude prices remained range bound in themid to upper $40’s per barrel for most of the
period. The election of Donald Trumpand a sweep of both houses of Congress bythe Republican Party were seen as supportive ofthe credit markets. President Trump’s proposedagenda included a commitment to significantinfrastructure investment and a call for taxreform, the centerpieces of which would bea substantial cut to corporate tax rates. Theadministration got off to a tumultuous startwhich included the dismissal of the FBI Directorand the naming of a special prosecutor to inves-tigate Russian influence in the U.S. election.Other potentially derailing events included: risingtensions on the Korean peninsula, multiple terror-ist attacks around the world, and three FederalReserve rate hikes. Despite these events the mar-ket shrugged them off and continued to rally. Nodoubt, better than expected corporate earnings
reports had a big part in keeping the market ontrack. Year over year, the average high yield com-pany demonstrated improved financial metricsincluding lower leverage and higher liquidity.
The fund’s quality positioning aided performance.The fund held an overweight position in lowerrated issuances which, in general, outperformedand an underweight position in higher ratedissuances, which were generally weaker. Sectorallocation had a neutral impact on relative perfor-mance as the negative impact of an underweightto outperforming industrials, was offset by anoverweight position in outperforming financials.Issue selection negatively impacted relative per-formance as equity received in corporate restruc-turings of certain defaulted energy companies(such as KCAD Holdings, Ltd.) declined in value.
PERFORMANCE TABLE1,2 Average Annual Total Return Cumulative Total ReturnPeriods Ending August 31, 2017 1-year 5-year 10-year 5-year 10-year
High Yield Fund Class 1 8.31% 5.24% 6.88% 29.11% 94.48%High Yield Fund Class NAV 8.33% 5.30% 6.94% 29.47% 95.61%Citigroup High Yield Index3,4 8.26% 6.02% 7.58% 33.94% 107.56%
1 Performance does not reflect the deduction of taxes on fund distributions or redemptions of fund shares. Past performance does not guarantee future results.2 Since inception, a portion of the High Yield Fund expenses was reimbursed. If such expenses had not been reimbursed, returns would be lower.3 The Citigroup High Yield Index is an unmanaged index that measures the performance of below-investment grade debt issued by corporations domiciled in the U.S. or Canada.4 It is not possible to invest directly in an index. Index figures do not reflect expenses or sales charges, which would result in lower returns.The expense ratios of the fund, both net (including any fee waivers or expense limitations) and gross (excluding any fee waivers or expense limitations), are set forth according to themost recent publicly available prospectuses for the fund and may differ from the expense ratios disclosed in the financial highlights tables in this report. The net expenses equal thegross expenses and are as follows: Class 1 shares – 0.79% and Class NAV shares – 0.74%.
Portfolio Composition* % of TotalCorporate bonds 89.2Term loans 3.1Common stocks 1.6Preferred securities 1.3Foreign government obligations 1.1Convertible bonds 1.0Collateralized mortgage obligations 0.5Short-term investments and other 2.2
* As a percentage of net assets.
$6,000
$8,000
$10,000
$12,000
$14,000
$16,000
$18,000
$20,000
$22,000$20,756$19,561
High Yield Fund Class NAVCitigroup High Yield Index
8/178/168/158/148/138/128/118/108/098/088/07
High Yield FundSubadvisor: Western Asset Management CompanyPortfolio Managers: Michael C. Buchanan, S. Kenneth Leech
12
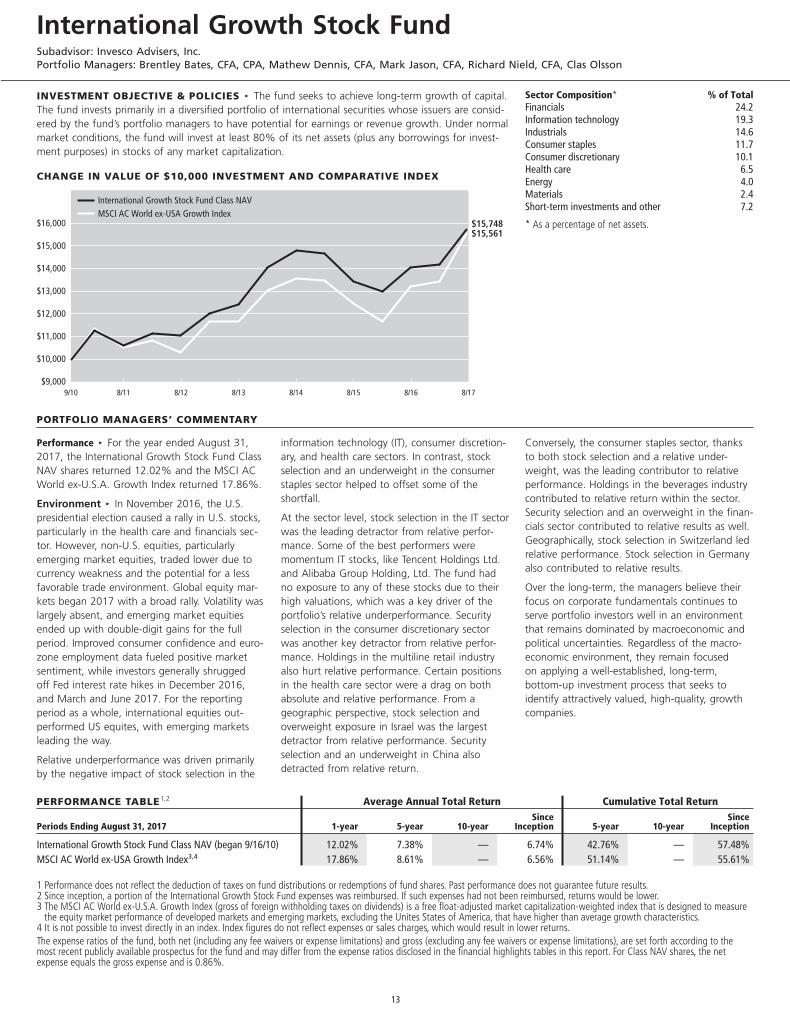
INVESTMENT OBJECTIVE & POLICIES c The fund seeks to achieve long-term growth of capital.The fund invests primarily in a diversified portfolio of international securities whose issuers are consid-ered by the fund’s portfolio managers to have potential for earnings or revenue growth. Under normalmarket conditions, the fund will invest at least 80% of its net assets (plus any borrowings for invest-ment purposes) in stocks of any market capitalization.
CHANGE IN VALUE OF $10,000 INVESTMENT AND COMPARATIVE INDEX
PORTFOLIO MANAGERS’ COMMENTARY
Performance c For the year ended August 31,2017, the International Growth Stock Fund ClassNAV shares returned 12.02% and the MSCI ACWorld ex-U.S.A. Growth Index returned 17.86%.
Environment c In November 2016, the U.S.presidential election caused a rally in U.S. stocks,particularly in the health care and financials sec-tor. However, non-U.S. equities, particularlyemerging market equities, traded lower due tocurrency weakness and the potential for a lessfavorable trade environment. Global equity mar-kets began 2017 with a broad rally. Volatility waslargely absent, and emerging market equitiesended up with double-digit gains for the fullperiod. Improved consumer confidence and euro-zone employment data fueled positive marketsentiment, while investors generally shruggedoff Fed interest rate hikes in December 2016,and March and June 2017. For the reportingperiod as a whole, international equities out-performed US equites, with emerging marketsleading the way.
Relative underperformance was driven primarilyby the negative impact of stock selection in the
information technology (IT), consumer discretion-ary, and health care sectors. In contrast, stockselection and an underweight in the consumerstaples sector helped to offset some of theshortfall.
At the sector level, stock selection in the IT sectorwas the leading detractor from relative perfor-mance. Some of the best performers weremomentum IT stocks, like Tencent Holdings Ltd.and Alibaba Group Holding, Ltd. The fund hadno exposure to any of these stocks due to theirhigh valuations, which was a key driver of theportfolio’s relative underperformance. Securityselection in the consumer discretionary sectorwas another key detractor from relative perfor-mance. Holdings in the multiline retail industryalso hurt relative performance. Certain positionsin the health care sector were a drag on bothabsolute and relative performance. From ageographic perspective, stock selection andoverweight exposure in Israel was the largestdetractor from relative performance. Securityselection and an underweight in China alsodetracted from relative return.
Conversely, the consumer staples sector, thanksto both stock selection and a relative under-weight, was the leading contributor to relativeperformance. Holdings in the beverages industrycontributed to relative return within the sector.Security selection and an overweight in the finan-cials sector contributed to relative results as well.Geographically, stock selection in Switzerland ledrelative performance. Stock selection in Germanyalso contributed to relative results.
Over the long-term, the managers believe theirfocus on corporate fundamentals continues toserve portfolio investors well in an environmentthat remains dominated by macroeconomic andpolitical uncertainties. Regardless of the macro-economic environment, they remain focusedon applying a well-established, long-term,bottom-up investment process that seeks toidentify attractively valued, high-quality, growthcompanies.
PERFORMANCE TABLE1,2 Average Annual Total Return Cumulative Total Return
Periods Ending August 31, 2017 1-year 5-year 10-yearSince
Inception 5-year 10-yearSince
Inception
International Growth Stock Fund Class NAV (began 9/16/10) 12.02% 7.38% — 6.74% 42.76% — 57.48%MSCI AC World ex-USA Growth Index3,4 17.86% 8.61% — 6.56% 51.14% — 55.61%
1 Performance does not reflect the deduction of taxes on fund distributions or redemptions of fund shares. Past performance does not guarantee future results.2 Since inception, a portion of the International Growth Stock Fund expenses was reimbursed. If such expenses had not been reimbursed, returns would be lower.3 The MSCI AC World ex-U.S.A. Growth Index (gross of foreign withholding taxes on dividends) is a free float-adjusted market capitalization-weighted index that is designed to measure
the equity market performance of developed markets and emerging markets, excluding the Unites States of America, that have higher than average growth characteristics.4 It is not possible to invest directly in an index. Index figures do not reflect expenses or sales charges, which would result in lower returns.The expense ratios of the fund, both net (including any fee waivers or expense limitations) and gross (excluding any fee waivers or expense limitations), are set forth according to themost recent publicly available prospectus for the fund and may differ from the expense ratios disclosed in the financial highlights tables in this report. For Class NAV shares, the netexpense equals the gross expense and is 0.86%.
Sector Composition* % of TotalFinancials 24.2Information technology 19.3Industrials 14.6Consumer staples 11.7Consumer discretionary 10.1Health care 6.5Energy 4.0Materials 2.4Short-term investments and other 7.2
* As a percentage of net assets.
8/178/168/14 8/158/138/128/119/10$9,000
$10,000
$11,000
$12,000
$13,000
$14,000
$15,000
$16,000$15,561$15,748
International Growth Stock Fund Class NAVMSCI AC World ex-USA Growth Index
International Growth Stock FundSubadvisor: Invesco Advisers, Inc.Portfolio Managers: Brentley Bates, CFA, CPA, Mathew Dennis, CFA, Mark Jason, CFA, Richard Nield, CFA, Clas Olsson
13
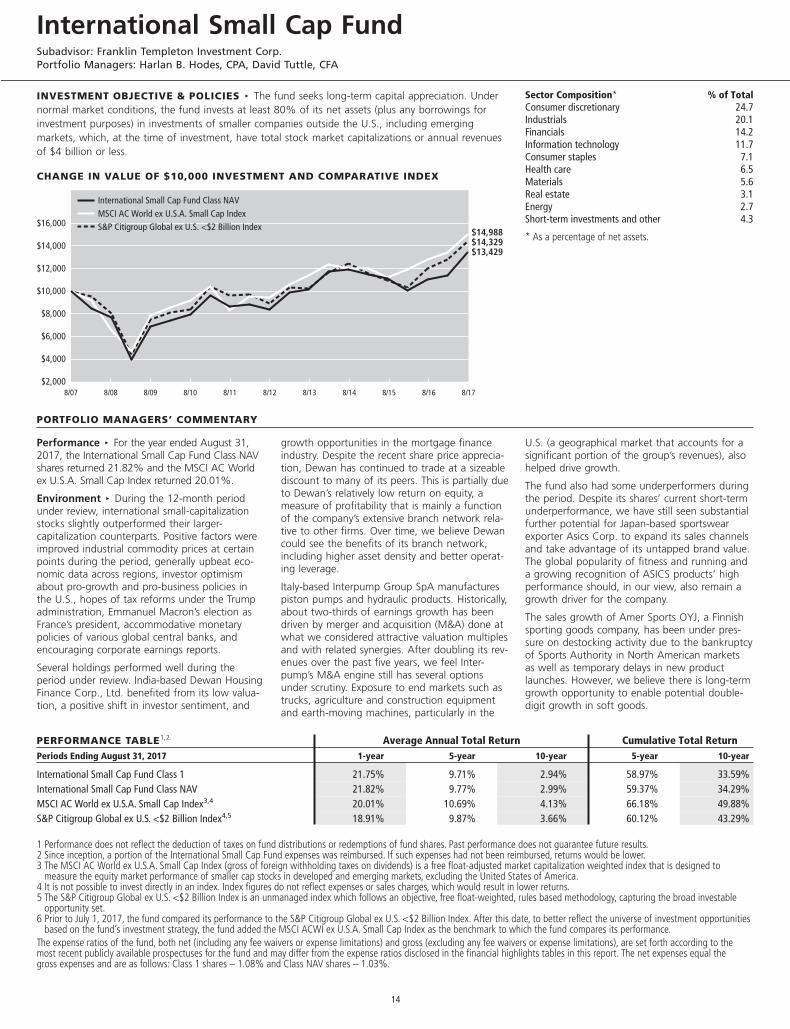
INVESTMENT OBJECTIVE & POLICIES c The fund seeks long-term capital appreciation. Undernormal market conditions, the fund invests at least 80% of its net assets (plus any borrowings forinvestment purposes) in investments of smaller companies outside the U.S., including emergingmarkets, which, at the time of investment, have total stock market capitalizations or annual revenuesof $4 billion or less.
CHANGE IN VALUE OF $10,000 INVESTMENT AND COMPARATIVE INDEX
PORTFOLIO MANAGERS’ COMMENTARY
Performance c For the year ended August 31,2017, the International Small Cap Fund Class NAVshares returned 21.82% and the MSCI AC Worldex U.S.A. Small Cap Index returned 20.01%.
Environment c During the 12-month periodunder review, international small-capitalizationstocks slightly outperformed their larger-capitalization counterparts. Positive factors wereimproved industrial commodity prices at certainpoints during the period, generally upbeat eco-nomic data across regions, investor optimismabout pro-growth and pro-business policies inthe U.S., hopes of tax reforms under the Trumpadministration, Emmanuel Macron’s election asFrance’s president, accommodative monetarypolicies of various global central banks, andencouraging corporate earnings reports.
Several holdings performed well during theperiod under review. India-based Dewan HousingFinance Corp., Ltd. benefited from its low valua-tion, a positive shift in investor sentiment, and
growth opportunities in the mortgage financeindustry. Despite the recent share price apprecia-tion, Dewan has continued to trade at a sizeablediscount to many of its peers. This is partially dueto Dewan’s relatively low return on equity, ameasure of profitability that is mainly a functionof the company’s extensive branch network rela-tive to other firms. Over time, we believe Dewancould see the benefits of its branch network,including higher asset density and better operat-ing leverage.
Italy-based Interpump Group SpA manufacturespiston pumps and hydraulic products. Historically,about two-thirds of earnings growth has beendriven by merger and acquisition (M&A) done atwhat we considered attractive valuation multiplesand with related synergies. After doubling its rev-enues over the past five years, we feel Inter-pump’s M&A engine still has several optionsunder scrutiny. Exposure to end markets such astrucks, agriculture and construction equipmentand earth-moving machines, particularly in the
U.S. (a geographical market that accounts for asignificant portion of the group’s revenues), alsohelped drive growth.
The fund also had some underperformers duringthe period. Despite its shares’ current short-termunderperformance, we have still seen substantialfurther potential for Japan-based sportswearexporter Asics Corp. to expand its sales channelsand take advantage of its untapped brand value.The global popularity of fitness and running anda growing recognition of ASICS products’ highperformance should, in our view, also remain agrowth driver for the company.
The sales growth of Amer Sports OYJ, a Finnishsporting goods company, has been under pres-sure on destocking activity due to the bankruptcyof Sports Authority in North American marketsas well as temporary delays in new productlaunches. However, we believe there is long-termgrowth opportunity to enable potential double-digit growth in soft goods.
PERFORMANCE TABLE1,2 Average Annual Total Return Cumulative Total ReturnPeriods Ending August 31, 2017 1-year 5-year 10-year 5-year 10-year
International Small Cap Fund Class 1 21.75% 9.71% 2.94% 58.97% 33.59%International Small Cap Fund Class NAV 21.82% 9.77% 2.99% 59.37% 34.29%MSCI AC World ex U.S.A. Small Cap Index3,4 20.01% 10.69% 4.13% 66.18% 49.88%S&P Citigroup Global ex U.S. <$2 Billion Index4,5 18.91% 9.87% 3.66% 60.12% 43.29%
1 Performance does not reflect the deduction of taxes on fund distributions or redemptions of fund shares. Past performance does not guarantee future results.2 Since inception, a portion of the International Small Cap Fund expenses was reimbursed. If such expenses had not been reimbursed, returns would be lower.3 The MSCI AC World ex U.S.A. Small Cap Index (gross of foreign withholding taxes on dividends) is a free float-adjusted market capitalization weighted index that is designed to
measure the equity market performance of smaller cap stocks in developed and emerging markets, excluding the United States of America.4 It is not possible to invest directly in an index. Index figures do not reflect expenses or sales charges, which would result in lower returns.5 The S&P Citigroup Global ex U.S. <$2 Billion Index is an unmanaged index which follows an objective, free float-weighted, rules based methodology, capturing the broad investable
opportunity set.6 Prior to July 1, 2017, the fund compared its performance to the S&P Citigroup Global ex U.S. <$2 Billion Index. After this date, to better reflect the universe of investment opportunities
based on the fund’s investment strategy, the fund added the MSCI ACWI ex U.S.A. Small Cap Index as the benchmark to which the fund compares its performance.The expense ratios of the fund, both net (including any fee waivers or expense limitations) and gross (excluding any fee waivers or expense limitations), are set forth according to themost recent publicly available prospectuses for the fund and may differ from the expense ratios disclosed in the financial highlights tables in this report. The net expenses equal thegross expenses and are as follows: Class 1 shares – 1.08% and Class NAV shares – 1.03%.
Sector Composition* % of TotalConsumer discretionary 24.7Industrials 20.1Financials 14.2Information technology 11.7Consumer staples 7.1Health care 6.5Materials 5.6Real estate 3.1Energy 2.7Short-term investments and other 4.3
* As a percentage of net assets.
$2,000
$4,000
$6,000
$8,000
$10,000
$12,000
$14,000
$16,000
$13,429$14,329$14,988
International Small Cap Fund Class NAVMSCI AC World ex U.S.A. Small Cap IndexS&P Citigroup Global ex U.S. <$2 Billion Index
8/178/168/158/148/138/128/118/108/098/088/07
International Small Cap FundSubadvisor: Franklin Templeton Investment Corp.Portfolio Managers: Harlan B. Hodes, CPA, David Tuttle, CFA
14
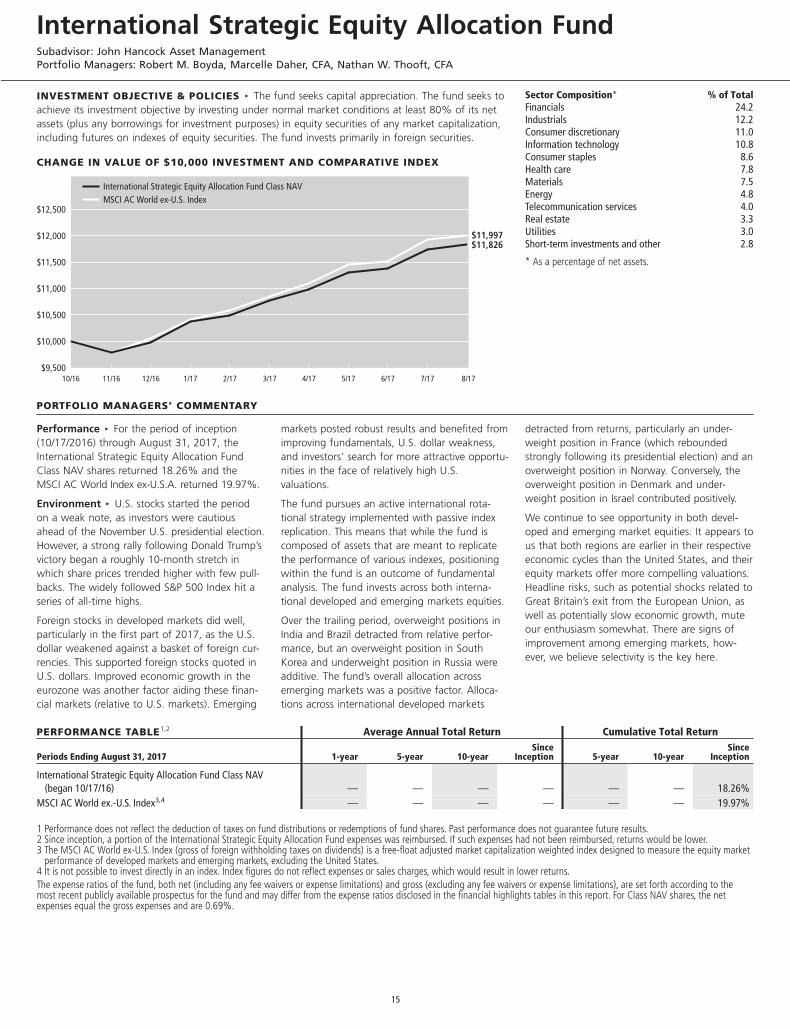
INVESTMENT OBJECTIVE & POLICIES c The fund seeks capital appreciation. The fund seeks toachieve its investment objective by investing under normal market conditions at least 80% of its netassets (plus any borrowings for investment purposes) in equity securities of any market capitalization,including futures on indexes of equity securities. The fund invests primarily in foreign securities.
CHANGE IN VALUE OF $10,000 INVESTMENT AND COMPARATIVE INDEX
PORTFOLIO MANAGERS’ COMMENTARY
Performance c For the period of inception(10/17/2016) through August 31, 2017, theInternational Strategic Equity Allocation FundClass NAV shares returned 18.26% and theMSCI AC World Index ex-U.S.A. returned 19.97%.
Environment c U.S. stocks started the periodon a weak note, as investors were cautiousahead of the November U.S. presidential election.However, a strong rally following Donald Trump’svictory began a roughly 10-month stretch inwhich share prices trended higher with few pull-backs. The widely followed S&P 500 Index hit aseries of all-time highs.
Foreign stocks in developed markets did well,particularly in the first part of 2017, as the U.S.dollar weakened against a basket of foreign cur-rencies. This supported foreign stocks quoted inU.S. dollars. Improved economic growth in theeurozone was another factor aiding these finan-cial markets (relative to U.S. markets). Emerging
markets posted robust results and benefited fromimproving fundamentals, U.S. dollar weakness,and investors’ search for more attractive opportu-nities in the face of relatively high U.S.valuations.
The fund pursues an active international rota-tional strategy implemented with passive indexreplication. This means that while the fund iscomposed of assets that are meant to replicatethe performance of various indexes, positioningwithin the fund is an outcome of fundamentalanalysis. The fund invests across both interna-tional developed and emerging markets equities.
Over the trailing period, overweight positions inIndia and Brazil detracted from relative perfor-mance, but an overweight position in SouthKorea and underweight position in Russia wereadditive. The fund’s overall allocation acrossemerging markets was a positive factor. Alloca-tions across international developed markets
detracted from returns, particularly an under-weight position in France (which reboundedstrongly following its presidential election) and anoverweight position in Norway. Conversely, theoverweight position in Denmark and under-weight position in Israel contributed positively.
We continue to see opportunity in both devel-oped and emerging market equities. It appears tous that both regions are earlier in their respectiveeconomic cycles than the United States, and theirequity markets offer more compelling valuations.Headline risks, such as potential shocks related toGreat Britain’s exit from the European Union, aswell as potentially slow economic growth, muteour enthusiasm somewhat. There are signs ofimprovement among emerging markets, how-ever, we believe selectivity is the key here.
PERFORMANCE TABLE1,2 Average Annual Total Return Cumulative Total Return
Periods Ending August 31, 2017 1-year 5-year 10-yearSince
Inception 5-year 10-yearSince
Inception
International Strategic Equity Allocation Fund Class NAV(began 10/17/16) — — — — — — 18.26%
MSCI AC World ex.-U.S. Index3,4 — — — — — — 19.97%
1 Performance does not reflect the deduction of taxes on fund distributions or redemptions of fund shares. Past performance does not guarantee future results.2 Since inception, a portion of the International Strategic Equity Allocation Fund expenses was reimbursed. If such expenses had not been reimbursed, returns would be lower.3 The MSCI AC World ex-U.S. Index (gross of foreign withholding taxes on dividends) is a free-float adjusted market capitalization weighted index designed to measure the equity market
performance of developed markets and emerging markets, excluding the United States.4 It is not possible to invest directly in an index. Index figures do not reflect expenses or sales charges, which would result in lower returns.The expense ratios of the fund, both net (including any fee waivers or expense limitations) and gross (excluding any fee waivers or expense limitations), are set forth according to themost recent publicly available prospectus for the fund and may differ from the expense ratios disclosed in the financial highlights tables in this report. For Class NAV shares, the netexpenses equal the gross expenses and are 0.69%.
Sector Composition* % of TotalFinancials 24.2Industrials 12.2Consumer discretionary 11.0Information technology 10.8Consumer staples 8.6Health care 7.8Materials 7.5Energy 4.8Telecommunication services 4.0Real estate 3.3Utilities 3.0Short-term investments and other 2.8
* As a percentage of net assets.
8/17$9,500
$10,000
$10,500
$11,000
$11,500
$12,000
$12,500
$11,997$11,826
International Strategic Equity Allocation Fund Class NAVMSCI AC World ex-U.S. Index
10/16 11/16 12/16 1/17 2/17 3/17 4/17 5/17 6/17 7/17
International Strategic Equity Allocation FundSubadvisor: John Hancock Asset ManagementPortfolio Managers: Robert M. Boyda, Marcelle Daher, CFA, Nathan W. Thooft, CFA
15
INVESTMENT OBJECTIVE & POLICIES c The fund seeks long-term growth of capital. Undernormal market conditions, the fund invests primarily in equity securities of companies located outsidethe U.S., including emerging markets.
CHANGE IN VALUE OF $10,000 INVESTMENT AND COMPARATIVE INDEX
PORTFOLIO MANAGERS’ COMMENTARY
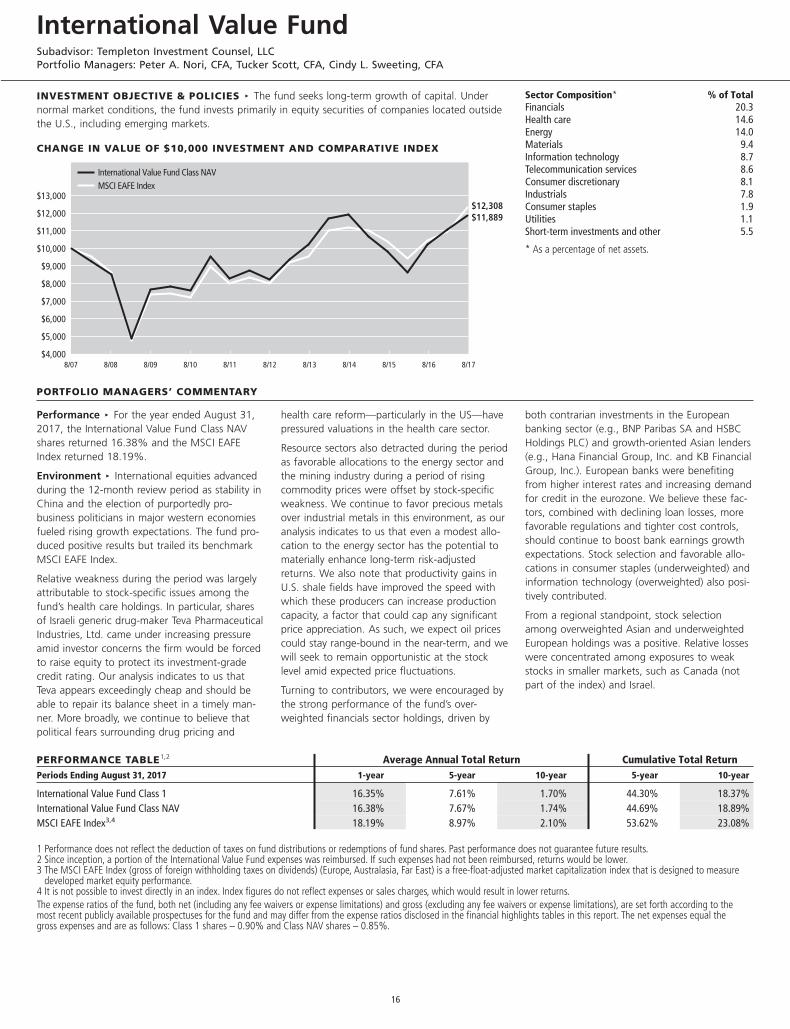
Performance c For the year ended August 31,2017, the International Value Fund Class NAVshares returned 16.38% and the MSCI EAFEIndex returned 18.19%.
Environment c International equities advancedduring the 12-month review period as stability inChina and the election of purportedly pro-business politicians in major western economiesfueled rising growth expectations. The fund pro-duced positive results but trailed its benchmarkMSCI EAFE Index.
Relative weakness during the period was largelyattributable to stock-specific issues among thefund’s health care holdings. In particular, sharesof Israeli generic drug-maker Teva PharmaceuticalIndustries, Ltd. came under increasing pressureamid investor concerns the firm would be forcedto raise equity to protect its investment-gradecredit rating. Our analysis indicates to us thatTeva appears exceedingly cheap and should beable to repair its balance sheet in a timely man-ner. More broadly, we continue to believe thatpolitical fears surrounding drug pricing and
health care reform—particularly in the US—havepressured valuations in the health care sector.
Resource sectors also detracted during the periodas favorable allocations to the energy sector andthe mining industry during a period of risingcommodity prices were offset by stock-specificweakness. We continue to favor precious metalsover industrial metals in this environment, as ouranalysis indicates to us that even a modest allo-cation to the energy sector has the potential tomaterially enhance long-term risk-adjustedreturns. We also note that productivity gains inU.S. shale fields have improved the speed withwhich these producers can increase productioncapacity, a factor that could cap any significantprice appreciation. As such, we expect oil pricescould stay range-bound in the near-term, and wewill seek to remain opportunistic at the stocklevel amid expected price fluctuations.
Turning to contributors, we were encouraged bythe strong performance of the fund’s over-weighted financials sector holdings, driven by
both contrarian investments in the Europeanbanking sector (e.g., BNP Paribas SA and HSBCHoldings PLC) and growth-oriented Asian lenders(e.g., Hana Financial Group, Inc. and KB FinancialGroup, Inc.). European banks were benefitingfrom higher interest rates and increasing demandfor credit in the eurozone. We believe these fac-tors, combined with declining loan losses, morefavorable regulations and tighter cost controls,should continue to boost bank earnings growthexpectations. Stock selection and favorable allo-cations in consumer staples (underweighted) andinformation technology (overweighted) also posi-tively contributed.
From a regional standpoint, stock selectionamong overweighted Asian and underweightedEuropean holdings was a positive. Relative losseswere concentrated among exposures to weakstocks in smaller markets, such as Canada (notpart of the index) and Israel.
PERFORMANCE TABLE1,2 Average Annual Total Return Cumulative Total ReturnPeriods Ending August 31, 2017 1-year 5-year 10-year 5-year 10-year
International Value Fund Class 1 16.35% 7.61% 1.70% 44.30% 18.37%International Value Fund Class NAV 16.38% 7.67% 1.74% 44.69% 18.89%MSCI EAFE Index3,4 18.19% 8.97% 2.10% 53.62% 23.08%
1 Performance does not reflect the deduction of taxes on fund distributions or redemptions of fund shares. Past performance does not guarantee future results.2 Since inception, a portion of the International Value Fund expenses was reimbursed. If such expenses had not been reimbursed, returns would be lower.3 The MSCI EAFE Index (gross of foreign withholding taxes on dividends) (Europe, Australasia, Far East) is a free-float-adjusted market capitalization index that is designed to measure
developed market equity performance.4 It is not possible to invest directly in an index. Index figures do not reflect expenses or sales charges, which would result in lower returns.The expense ratios of the fund, both net (including any fee waivers or expense limitations) and gross (excluding any fee waivers or expense limitations), are set forth according to themost recent publicly available prospectuses for the fund and may differ from the expense ratios disclosed in the financial highlights tables in this report. The net expenses equal thegross expenses and are as follows: Class 1 shares – 0.90% and Class NAV shares – 0.85%.
Sector Composition* % of TotalFinancials 20.3Health care 14.6Energy 14.0Materials 9.4Information technology 8.7Telecommunication services 8.6Consumer discretionary 8.1Industrials 7.8Consumer staples 1.9Utilities 1.1Short-term investments and other 5.5
* As a percentage of net assets.
$4,000
$5,000
$6,000
$7,000
$8,000
$9,000
$10,000
$11,000
$12,000
$13,000$12,308$11,889
International Value Fund Class NAVMSCI EAFE Index
8/178/168/158/148/138/128/118/108/098/088/07
International Value FundSubadvisor: Templeton Investment Counsel, LLCPortfolio Managers: Peter A. Nori, CFA, Tucker Scott, CFA, Cindy L. Sweeting, CFA
16
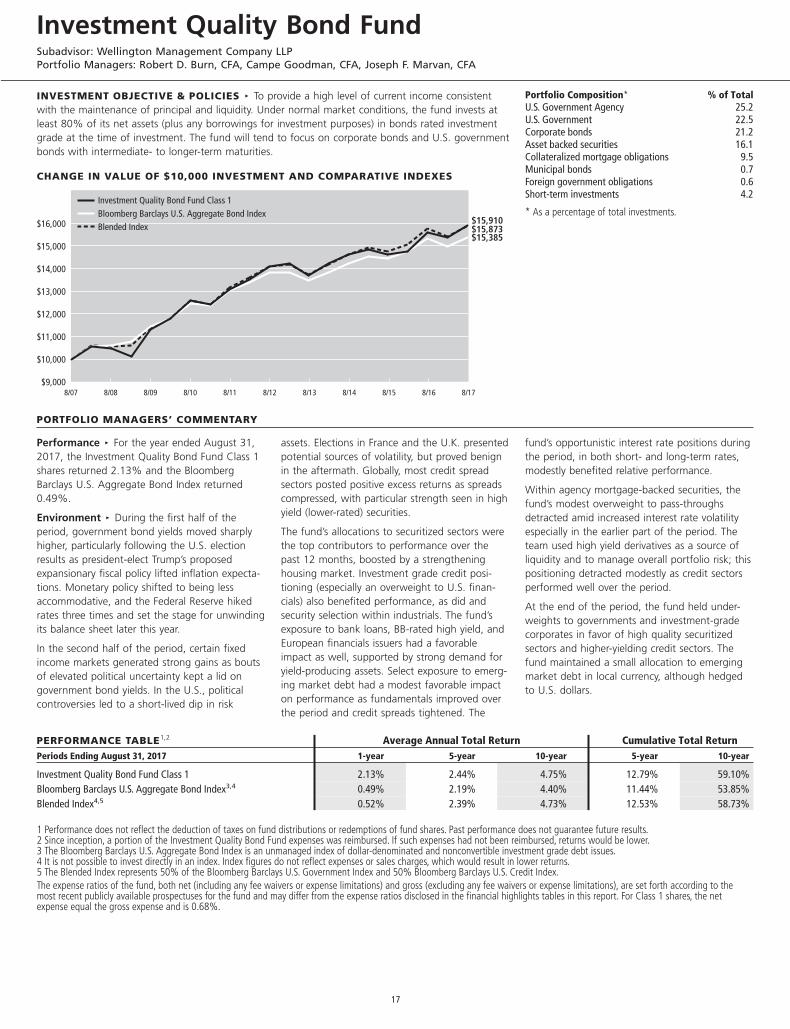
INVESTMENT OBJECTIVE & POLICIES c To provide a high level of current income consistentwith the maintenance of principal and liquidity. Under normal market conditions, the fund invests atleast 80% of its net assets (plus any borrowings for investment purposes) in bonds rated investmentgrade at the time of investment. The fund will tend to focus on corporate bonds and U.S. governmentbonds with intermediate- to longer-term maturities.
CHANGE IN VALUE OF $10,000 INVESTMENT AND COMPARATIVE INDEXES
PORTFOLIO MANAGERS’ COMMENTARY
Performance c For the year ended August 31,2017, the Investment Quality Bond Fund Class 1shares returned 2.13% and the BloombergBarclays U.S. Aggregate Bond Index returned0.49%.
Environment c During the first half of theperiod, government bond yields moved sharplyhigher, particularly following the U.S. electionresults as president-elect Trump’s proposedexpansionary fiscal policy lifted inflation expecta-tions. Monetary policy shifted to being lessaccommodative, and the Federal Reserve hikedrates three times and set the stage for unwindingits balance sheet later this year.
In the second half of the period, certain fixedincome markets generated strong gains as boutsof elevated political uncertainty kept a lid ongovernment bond yields. In the U.S., politicalcontroversies led to a short-lived dip in risk
assets. Elections in France and the U.K. presentedpotential sources of volatility, but proved benignin the aftermath. Globally, most credit spreadsectors posted positive excess returns as spreadscompressed, with particular strength seen in highyield (lower-rated) securities.
The fund’s allocations to securitized sectors werethe top contributors to performance over thepast 12 months, boosted by a strengtheninghousing market. Investment grade credit posi-tioning (especially an overweight to U.S. finan-cials) also benefited performance, as did andsecurity selection within industrials. The fund’sexposure to bank loans, BB-rated high yield, andEuropean financials issuers had a favorableimpact as well, supported by strong demand foryield-producing assets. Select exposure to emerg-ing market debt had a modest favorable impacton performance as fundamentals improved overthe period and credit spreads tightened. The
fund’s opportunistic interest rate positions duringthe period, in both short- and long-term rates,modestly benefited relative performance.
Within agency mortgage-backed securities, thefund’s modest overweight to pass-throughsdetracted amid increased interest rate volatilityespecially in the earlier part of the period. Theteam used high yield derivatives as a source ofliquidity and to manage overall portfolio risk; thispositioning detracted modestly as credit sectorsperformed well over the period.
At the end of the period, the fund held under-weights to governments and investment-gradecorporates in favor of high quality securitizedsectors and higher-yielding credit sectors. Thefund maintained a small allocation to emergingmarket debt in local currency, although hedgedto U.S. dollars.
PERFORMANCE TABLE1,2 Average Annual Total Return Cumulative Total ReturnPeriods Ending August 31, 2017 1-year 5-year 10-year 5-year 10-year
Investment Quality Bond Fund Class 1 2.13% 2.44% 4.75% 12.79% 59.10%Bloomberg Barclays U.S. Aggregate Bond Index3,4 0.49% 2.19% 4.40% 11.44% 53.85%Blended Index4,5 0.52% 2.39% 4.73% 12.53% 58.73%
1 Performance does not reflect the deduction of taxes on fund distributions or redemptions of fund shares. Past performance does not guarantee future results.2 Since inception, a portion of the Investment Quality Bond Fund expenses was reimbursed. If such expenses had not been reimbursed, returns would be lower.3 The Bloomberg Barclays U.S. Aggregate Bond Index is an unmanaged index of dollar-denominated and nonconvertible investment grade debt issues.4 It is not possible to invest directly in an index. Index figures do not reflect expenses or sales charges, which would result in lower returns.5 The Blended Index represents 50% of the Bloomberg Barclays U.S. Government Index and 50% Bloomberg Barclays U.S. Credit Index.The expense ratios of the fund, both net (including any fee waivers or expense limitations) and gross (excluding any fee waivers or expense limitations), are set forth according to themost recent publicly available prospectuses for the fund and may differ from the expense ratios disclosed in the financial highlights tables in this report. For Class 1 shares, the netexpense equal the gross expense and is 0.68%.
Portfolio Composition* % of TotalU.S. Government Agency 25.2U.S. Government 22.5Corporate bonds 21.2Asset backed securities 16.1Collateralized mortgage obligations 9.5Municipal bonds 0.7Foreign government obligations 0.6Short-term investments 4.2
* As a percentage of total investments.
$9,000
$10,000
$11,000
$12,000
$13,000
$14,000
$15,000
$16,000 $15,910$15,873$15,385
Investment Quality Bond Fund Class 1Bloomberg Barclays U.S. Aggregate Bond IndexBlended Index
8/178/168/158/148/138/128/118/108/098/088/07
Investment Quality Bond FundSubadvisor: Wellington Management Company LLPPortfolio Managers: Robert D. Burn, CFA, Campe Goodman, CFA, Joseph F. Marvan, CFA
17
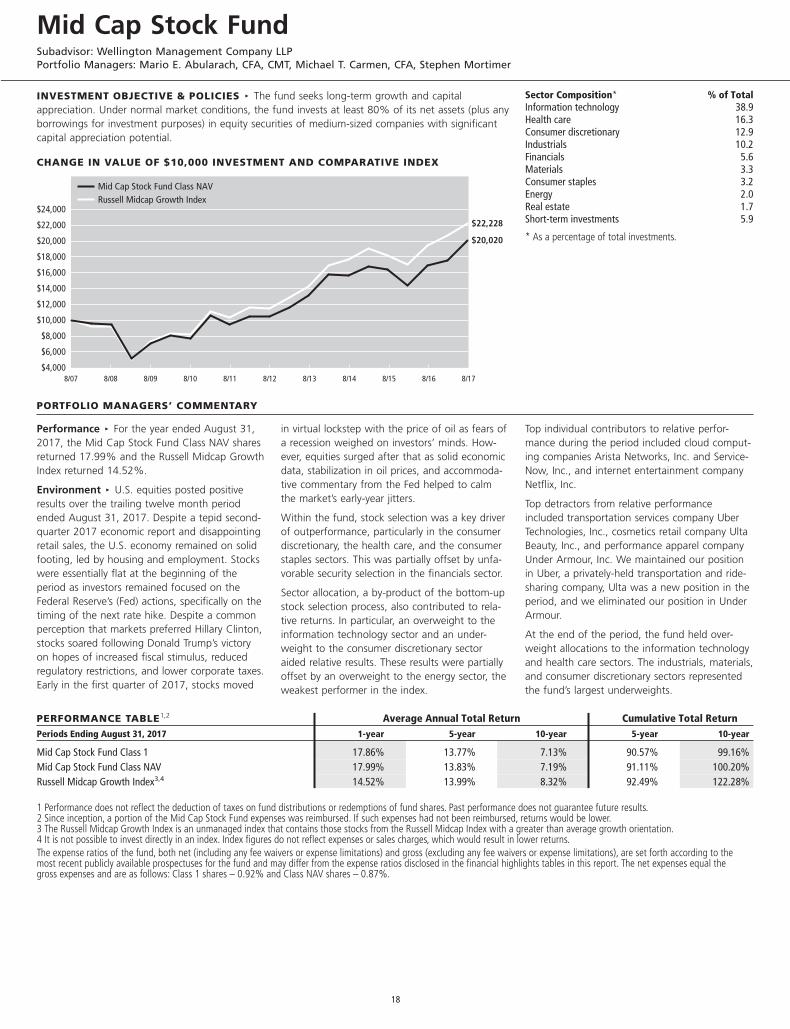
INVESTMENT OBJECTIVE & POLICIES c The fund seeks long-term growth and capitalappreciation. Under normal market conditions, the fund invests at least 80% of its net assets (plus anyborrowings for investment purposes) in equity securities of medium-sized companies with significantcapital appreciation potential.
CHANGE IN VALUE OF $10,000 INVESTMENT AND COMPARATIVE INDEX
PORTFOLIO MANAGERS’ COMMENTARY
Performance c For the year ended August 31,2017, the Mid Cap Stock Fund Class NAV sharesreturned 17.99% and the Russell Midcap GrowthIndex returned 14.52%.
Environment c U.S. equities posted positiveresults over the trailing twelve month periodended August 31, 2017. Despite a tepid second-quarter 2017 economic report and disappointingretail sales, the U.S. economy remained on solidfooting, led by housing and employment. Stockswere essentially flat at the beginning of theperiod as investors remained focused on theFederal Reserve’s (Fed) actions, specifically on thetiming of the next rate hike. Despite a commonperception that markets preferred Hillary Clinton,stocks soared following Donald Trump’s victoryon hopes of increased fiscal stimulus, reducedregulatory restrictions, and lower corporate taxes.Early in the first quarter of 2017, stocks moved
in virtual lockstep with the price of oil as fears ofa recession weighed on investors’ minds. How-ever, equities surged after that as solid economicdata, stabilization in oil prices, and accommoda-tive commentary from the Fed helped to calmthe market’s early-year jitters.
Within the fund, stock selection was a key driverof outperformance, particularly in the consumerdiscretionary, the health care, and the consumerstaples sectors. This was partially offset by unfa-vorable security selection in the financials sector.
Sector allocation, a by-product of the bottom-upstock selection process, also contributed to rela-tive returns. In particular, an overweight to theinformation technology sector and an under-weight to the consumer discretionary sectoraided relative results. These results were partiallyoffset by an overweight to the energy sector, theweakest performer in the index.
Top individual contributors to relative perfor-mance during the period included cloud comput-ing companies Arista Networks, Inc. and Service-Now, Inc., and internet entertainment companyNetflix, Inc.
Top detractors from relative performanceincluded transportation services company UberTechnologies, Inc., cosmetics retail company UltaBeauty, Inc., and performance apparel companyUnder Armour, Inc. We maintained our positionin Uber, a privately-held transportation and ride-sharing company, Ulta was a new position in theperiod, and we eliminated our position in UnderArmour.
At the end of the period, the fund held over-weight allocations to the information technologyand health care sectors. The industrials, materials,and consumer discretionary sectors representedthe fund’s largest underweights.
PERFORMANCE TABLE1,2 Average Annual Total Return Cumulative Total ReturnPeriods Ending August 31, 2017 1-year 5-year 10-year 5-year 10-year
Mid Cap Stock Fund Class 1 17.86% 13.77% 7.13% 90.57% 99.16%Mid Cap Stock Fund Class NAV 17.99% 13.83% 7.19% 91.11% 100.20%Russell Midcap Growth Index3,4 14.52% 13.99% 8.32% 92.49% 122.28%
1 Performance does not reflect the deduction of taxes on fund distributions or redemptions of fund shares. Past performance does not guarantee future results.2 Since inception, a portion of the Mid Cap Stock Fund expenses was reimbursed. If such expenses had not been reimbursed, returns would be lower.3 The Russell Midcap Growth Index is an unmanaged index that contains those stocks from the Russell Midcap Index with a greater than average growth orientation.4 It is not possible to invest directly in an index. Index figures do not reflect expenses or sales charges, which would result in lower returns.The expense ratios of the fund, both net (including any fee waivers or expense limitations) and gross (excluding any fee waivers or expense limitations), are set forth according to themost recent publicly available prospectuses for the fund and may differ from the expense ratios disclosed in the financial highlights tables in this report. The net expenses equal thegross expenses and are as follows: Class 1 shares – 0.92% and Class NAV shares – 0.87%.
Sector Composition* % of TotalInformation technology 38.9Health care 16.3Consumer discretionary 12.9Industrials 10.2Financials 5.6Materials 3.3Consumer staples 3.2Energy 2.0Real estate 1.7Short-term investments 5.9
* As a percentage of total investments.
$4,000
$6,000
$8,000
$10,000
$12,000
$14,000
$16,000
$18,000
$20,000
$22,000
$24,000
$22,228
$20,020
Mid Cap Stock Fund Class NAVRussell Midcap Growth Index
8/178/168/158/148/138/128/118/108/098/088/07
Mid Cap Stock FundSubadvisor: Wellington Management Company LLPPortfolio Managers: Mario E. Abularach, CFA, CMT, Michael T. Carmen, CFA, Stephen Mortimer
18
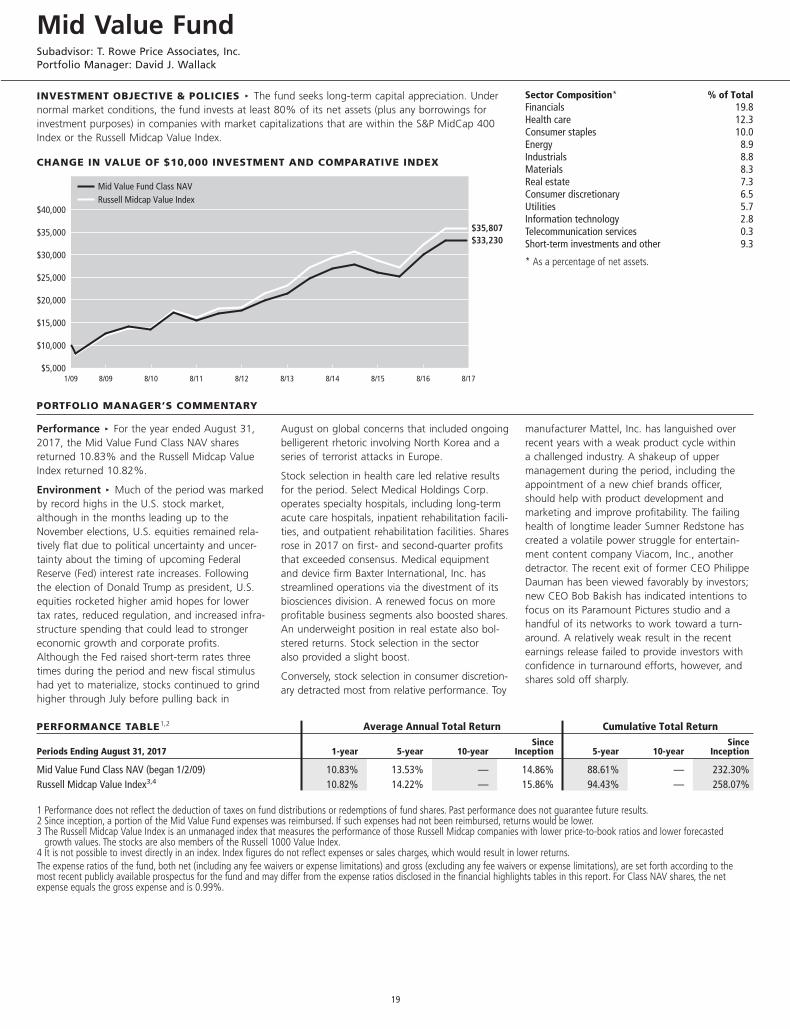
INVESTMENT OBJECTIVE & POLICIES c The fund seeks long-term capital appreciation. Undernormal market conditions, the fund invests at least 80% of its net assets (plus any borrowings forinvestment purposes) in companies with market capitalizations that are within the S&P MidCap 400Index or the Russell Midcap Value Index.
CHANGE IN VALUE OF $10,000 INVESTMENT AND COMPARATIVE INDEX
PORTFOLIO MANAGER’S COMMENTARY
Performance c For the year ended August 31,2017, the Mid Value Fund Class NAV sharesreturned 10.83% and the Russell Midcap ValueIndex returned 10.82%.
Environment c Much of the period was markedby record highs in the U.S. stock market,although in the months leading up to theNovember elections, U.S. equities remained rela-tively flat due to political uncertainty and uncer-tainty about the timing of upcoming FederalReserve (Fed) interest rate increases. Followingthe election of Donald Trump as president, U.S.equities rocketed higher amid hopes for lowertax rates, reduced regulation, and increased infra-structure spending that could lead to strongereconomic growth and corporate profits.Although the Fed raised short-term rates threetimes during the period and new fiscal stimulushad yet to materialize, stocks continued to grindhigher through July before pulling back in
August on global concerns that included ongoingbelligerent rhetoric involving North Korea and aseries of terrorist attacks in Europe.
Stock selection in health care led relative resultsfor the period. Select Medical Holdings Corp.operates specialty hospitals, including long-termacute care hospitals, inpatient rehabilitation facili-ties, and outpatient rehabilitation facilities. Sharesrose in 2017 on first- and second-quarter profitsthat exceeded consensus. Medical equipmentand device firm Baxter International, Inc. hasstreamlined operations via the divestment of itsbiosciences division. A renewed focus on moreprofitable business segments also boosted shares.An underweight position in real estate also bol-stered returns. Stock selection in the sectoralso provided a slight boost.
Conversely, stock selection in consumer discretion-ary detracted most from relative performance. Toy
manufacturer Mattel, Inc. has languished overrecent years with a weak product cycle withina challenged industry. A shakeup of uppermanagement during the period, including theappointment of a new chief brands officer,should help with product development andmarketing and improve profitability. The failinghealth of longtime leader Sumner Redstone hascreated a volatile power struggle for entertain-ment content company Viacom, Inc., anotherdetractor. The recent exit of former CEO PhilippeDauman has been viewed favorably by investors;new CEO Bob Bakish has indicated intentions tofocus on its Paramount Pictures studio and ahandful of its networks to work toward a turn-around. A relatively weak result in the recentearnings release failed to provide investors withconfidence in turnaround efforts, however, andshares sold off sharply.
PERFORMANCE TABLE1,2 Average Annual Total Return Cumulative Total Return
Periods Ending August 31, 2017 1-year 5-year 10-yearSince
Inception 5-year 10-yearSince
Inception
Mid Value Fund Class NAV (began 1/2/09) 10.83% 13.53% — 14.86% 88.61% — 232.30%Russell Midcap Value Index3,4 10.82% 14.22% — 15.86% 94.43% — 258.07%
1 Performance does not reflect the deduction of taxes on fund distributions or redemptions of fund shares. Past performance does not guarantee future results.2 Since inception, a portion of the Mid Value Fund expenses was reimbursed. If such expenses had not been reimbursed, returns would be lower.3 The Russell Midcap Value Index is an unmanaged index that measures the performance of those Russell Midcap companies with lower price-to-book ratios and lower forecasted
growth values. The stocks are also members of the Russell 1000 Value Index.4 It is not possible to invest directly in an index. Index figures do not reflect expenses or sales charges, which would result in lower returns.The expense ratios of the fund, both net (including any fee waivers or expense limitations) and gross (excluding any fee waivers or expense limitations), are set forth according to themost recent publicly available prospectus for the fund and may differ from the expense ratios disclosed in the financial highlights tables in this report. For Class NAV shares, the netexpense equals the gross expense and is 0.99%.
Sector Composition* % of TotalFinancials 19.8Health care 12.3Consumer staples 10.0Energy 8.9Industrials 8.8Materials 8.3Real estate 7.3Consumer discretionary 6.5Utilities 5.7Information technology 2.8Telecommunication services 0.3Short-term investments and other 9.3
* As a percentage of net assets.
8/17$5,000
$10,000
$15,000
$20,000
$25,000
$30,000
$35,000
$40,000
Mid Value Fund Class NAVRussell Midcap Value Index
$33,230$35,807
8/168/158/148/138/128/118/108/091/09
Mid Value FundSubadvisor: T. Rowe Price Associates, Inc.Portfolio Manager: David J. Wallack
19
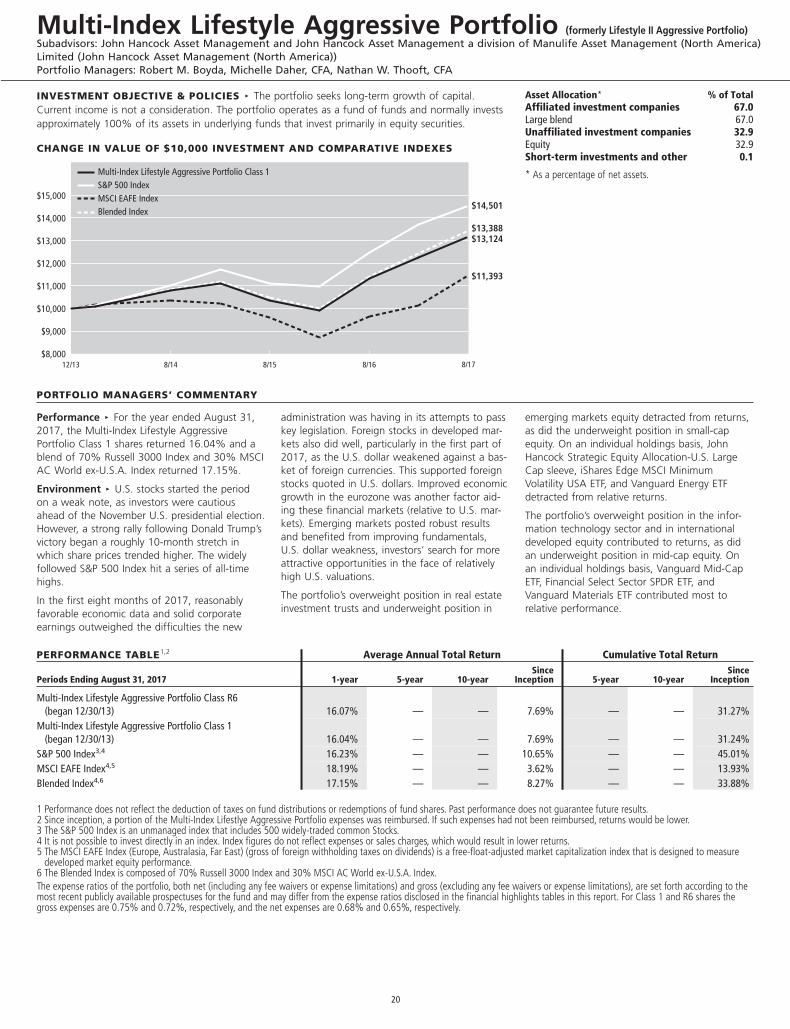
INVESTMENT OBJECTIVE & POLICIES c The portfolio seeks long-term growth of capital.Current income is not a consideration. The portfolio operates as a fund of funds and normally investsapproximately 100% of its assets in underlying funds that invest primarily in equity securities.
CHANGE IN VALUE OF $10,000 INVESTMENT AND COMPARATIVE INDEXES
PORTFOLIO MANAGERS’ COMMENTARY
Performance c For the year ended August 31,2017, the Multi-Index Lifestyle AggressivePortfolio Class 1 shares returned 16.04% and ablend of 70% Russell 3000 Index and 30% MSCIAC World ex-U.S.A. Index returned 17.15%.
Environment c U.S. stocks started the periodon a weak note, as investors were cautiousahead of the November U.S. presidential election.However, a strong rally following Donald Trump’svictory began a roughly 10-month stretch inwhich share prices trended higher. The widelyfollowed S&P 500 Index hit a series of all-timehighs.
In the first eight months of 2017, reasonablyfavorable economic data and solid corporateearnings outweighed the difficulties the new
administration was having in its attempts to passkey legislation. Foreign stocks in developed mar-kets also did well, particularly in the first part of2017, as the U.S. dollar weakened against a bas-ket of foreign currencies. This supported foreignstocks quoted in U.S. dollars. Improved economicgrowth in the eurozone was another factor aid-ing these financial markets (relative to U.S. mar-kets). Emerging markets posted robust resultsand benefited from improving fundamentals,U.S. dollar weakness, investors’ search for moreattractive opportunities in the face of relativelyhigh U.S. valuations.
The portfolio’s overweight position in real estateinvestment trusts and underweight position in
emerging markets equity detracted from returns,as did the underweight position in small-capequity. On an individual holdings basis, JohnHancock Strategic Equity Allocation-U.S. LargeCap sleeve, iShares Edge MSCI MinimumVolatility USA ETF, and Vanguard Energy ETFdetracted from relative returns.
The portfolio’s overweight position in the infor-mation technology sector and in internationaldeveloped equity contributed to returns, as didan underweight position in mid-cap equity. Onan individual holdings basis, Vanguard Mid-CapETF, Financial Select Sector SPDR ETF, andVanguard Materials ETF contributed most torelative performance.
PERFORMANCE TABLE1,2 Average Annual Total Return Cumulative Total Return
Periods Ending August 31, 2017 1-year 5-year 10-yearSince
Inception 5-year 10-yearSince
Inception
Multi-Index Lifestyle Aggressive Portfolio Class R6(began 12/30/13) 16.07% — — 7.69% — — 31.27%
Multi-Index Lifestyle Aggressive Portfolio Class 1(began 12/30/13) 16.04% — — 7.69% — — 31.24%
S&P 500 Index3,4 16.23% — — 10.65% — — 45.01%MSCI EAFE Index4,5 18.19% — — 3.62% — — 13.93%Blended Index4,6 17.15% — — 8.27% — — 33.88%
1 Performance does not reflect the deduction of taxes on fund distributions or redemptions of fund shares. Past performance does not guarantee future results.2 Since inception, a portion of the Multi-Index Lifestlye Aggressive Portfolio expenses was reimbursed. If such expenses had not been reimbursed, returns would be lower.3 The S&P 500 Index is an unmanaged index that includes 500 widely-traded common Stocks.4 It is not possible to invest directly in an index. Index figures do not reflect expenses or sales charges, which would result in lower returns.5 The MSCI EAFE Index (Europe, Australasia, Far East) (gross of foreign withholding taxes on dividends) is a free-float-adjusted market capitalization index that is designed to measure
developed market equity performance.6 The Blended Index is composed of 70% Russell 3000 Index and 30% MSCI AC World ex-U.S.A. Index.The expense ratios of the portfolio, both net (including any fee waivers or expense limitations) and gross (excluding any fee waivers or expense limitations), are set forth according to themost recent publicly available prospectuses for the fund and may differ from the expense ratios disclosed in the financial highlights tables in this report. For Class 1 and R6 shares thegross expenses are 0.75% and 0.72%, respectively, and the net expenses are 0.68% and 0.65%, respectively.
Asset Allocation* % of TotalAffiliated investment companies 67.0Large blend 67.0Unaffiliated investment companies 32.9Equity 32.9Short-term investments and other 0.1
* As a percentage of net assets.
$14,501
$13,388$13,124
$11,393
8/17$8,000
$9,000
$10,000
$11,000
$12,000
$13,000
$14,000
$15,000
8/168/158/1412/13
Multi-Index Lifestyle Aggressive Portfolio Class 1S&P 500 IndexMSCI EAFE IndexBlended Index
Multi-Index Lifestyle Aggressive Portfolio (formerly Lifestyle II Aggressive Portfolio)Subadvisors: John Hancock Asset Management and John Hancock Asset Management a division of Manulife Asset Management (North America)Limited (John Hancock Asset Management (North America))Portfolio Managers: Robert M. Boyda, Michelle Daher, CFA, Nathan W. Thooft, CFA
20
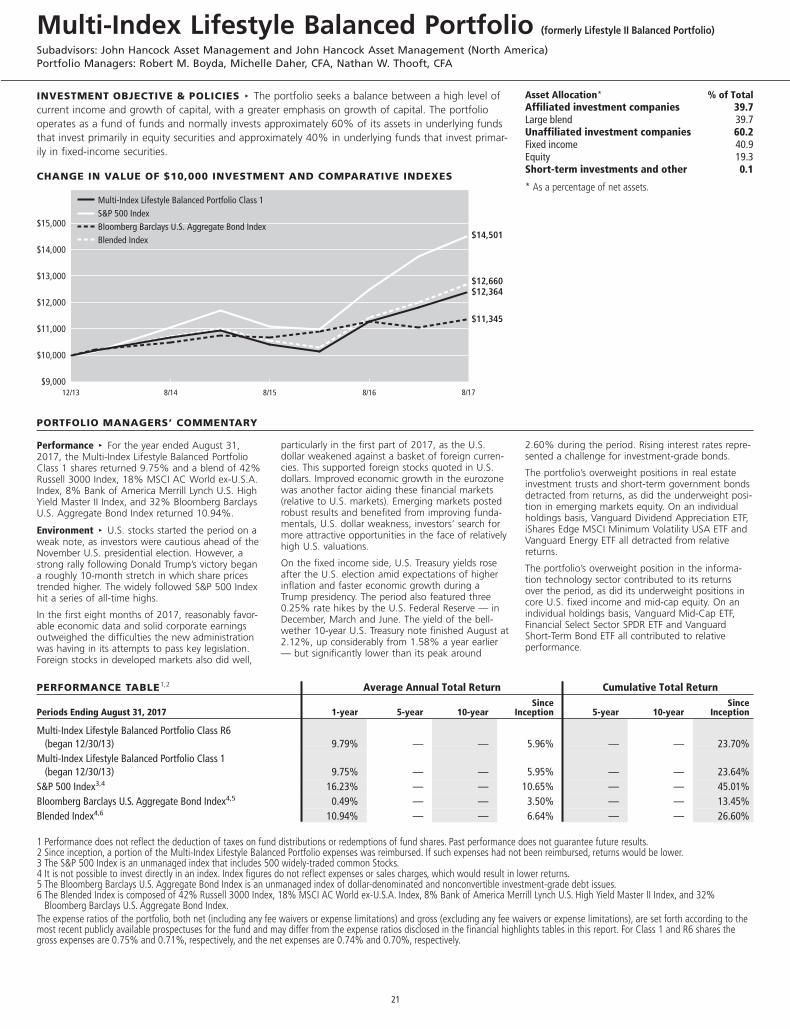
INVESTMENT OBJECTIVE & POLICIES c The portfolio seeks a balance between a high level ofcurrent income and growth of capital, with a greater emphasis on growth of capital. The portfoliooperates as a fund of funds and normally invests approximately 60% of its assets in underlying fundsthat invest primarily in equity securities and approximately 40% in underlying funds that invest primar-ily in fixed-income securities.
CHANGE IN VALUE OF $10,000 INVESTMENT AND COMPARATIVE INDEXES
PORTFOLIO MANAGERS’ COMMENTARY
Performance c For the year ended August 31,2017, the Multi-Index Lifestyle Balanced PortfolioClass 1 shares returned 9.75% and a blend of 42%Russell 3000 Index, 18% MSCI AC World ex-U.S.A.Index, 8% Bank of America Merrill Lynch U.S. HighYield Master II Index, and 32% Bloomberg BarclaysU.S. Aggregate Bond Index returned 10.94%.
Environment c U.S. stocks started the period on aweak note, as investors were cautious ahead of theNovember U.S. presidential election. However, astrong rally following Donald Trump’s victory begana roughly 10-month stretch in which share pricestrended higher. The widely followed S&P 500 Indexhit a series of all-time highs.
In the first eight months of 2017, reasonably favor-able economic data and solid corporate earningsoutweighed the difficulties the new administrationwas having in its attempts to pass key legislation.Foreign stocks in developed markets also did well,
particularly in the first part of 2017, as the U.S.dollar weakened against a basket of foreign curren-cies. This supported foreign stocks quoted in U.S.dollars. Improved economic growth in the eurozonewas another factor aiding these financial markets(relative to U.S. markets). Emerging markets postedrobust results and benefited from improving funda-mentals, U.S. dollar weakness, investors’ search formore attractive opportunities in the face of relativelyhigh U.S. valuations.
On the fixed income side, U.S. Treasury yields roseafter the U.S. election amid expectations of higherinflation and faster economic growth during aTrump presidency. The period also featured three0.25% rate hikes by the U.S. Federal Reserve — inDecember, March and June. The yield of the bell-wether 10-year U.S. Treasury note finished August at2.12%, up considerably from 1.58% a year earlier— but significantly lower than its peak around
2.60% during the period. Rising interest rates repre-sented a challenge for investment-grade bonds.
The portfolio’s overweight positions in real estateinvestment trusts and short-term government bondsdetracted from returns, as did the underweight posi-tion in emerging markets equity. On an individualholdings basis, Vanguard Dividend Appreciation ETF,iShares Edge MSCI Minimum Volatility USA ETF andVanguard Energy ETF all detracted from relativereturns.
The portfolio’s overweight position in the informa-tion technology sector contributed to its returnsover the period, as did its underweight positions incore U.S. fixed income and mid-cap equity. On anindividual holdings basis, Vanguard Mid-Cap ETF,Financial Select Sector SPDR ETF and VanguardShort-Term Bond ETF all contributed to relativeperformance.
PERFORMANCE TABLE1,2 Average Annual Total Return Cumulative Total Return
Periods Ending August 31, 2017 1-year 5-year 10-yearSince
Inception 5-year 10-yearSince
Inception
Multi-Index Lifestyle Balanced Portfolio Class R6(began 12/30/13) 9.79% — — 5.96% — — 23.70%
Multi-Index Lifestyle Balanced Portfolio Class 1(began 12/30/13) 9.75% — — 5.95% — — 23.64%
S&P 500 Index3,4 16.23% — — 10.65% — — 45.01%Bloomberg Barclays U.S. Aggregate Bond Index4,5 0.49% — — 3.50% — — 13.45%Blended Index4,6 10.94% — — 6.64% — — 26.60%
1 Performance does not reflect the deduction of taxes on fund distributions or redemptions of fund shares. Past performance does not guarantee future results.2 Since inception, a portion of the Multi-Index Lifestyle Balanced Portfolio expenses was reimbursed. If such expenses had not been reimbursed, returns would be lower.3 The S&P 500 Index is an unmanaged index that includes 500 widely-traded common Stocks.4 It is not possible to invest directly in an index. Index figures do not reflect expenses or sales charges, which would result in lower returns.5 The Bloomberg Barclays U.S. Aggregate Bond Index is an unmanaged index of dollar-denominated and nonconvertible investment-grade debt issues.6 The Blended Index is composed of 42% Russell 3000 Index, 18% MSCI AC World ex-U.S.A. Index, 8% Bank of America Merrill Lynch U.S. High Yield Master II Index, and 32%
Bloomberg Barclays U.S. Aggregate Bond Index.The expense ratios of the portfolio, both net (including any fee waivers or expense limitations) and gross (excluding any fee waivers or expense limitations), are set forth according to themost recent publicly available prospectuses for the fund and may differ from the expense ratios disclosed in the financial highlights tables in this report. For Class 1 and R6 shares thegross expenses are 0.75% and 0.71%, respectively, and the net expenses are 0.74% and 0.70%, respectively.
Asset Allocation* % of TotalAffiliated investment companies 39.7Large blend 39.7Unaffiliated investment companies 60.2Fixed income 40.9Equity 19.3Short-term investments and other 0.1
* As a percentage of net assets.
$14,501
$9,000
$10,000
$11,000
$12,000
$13,000
$14,000
$15,000
$12,660$12,364
$11,345
Multi-Index Lifestyle Balanced Portfolio Class 1S&P 500 IndexBloomberg Barclays U.S. Aggregate Bond IndexBlended Index
8/178/168/158/1412/13
Multi-Index Lifestyle Balanced Portfolio (formerly Lifestyle II Balanced Portfolio)
Subadvisors: John Hancock Asset Management and John Hancock Asset Management (North America)Portfolio Managers: Robert M. Boyda, Michelle Daher, CFA, Nathan W. Thooft, CFA
21
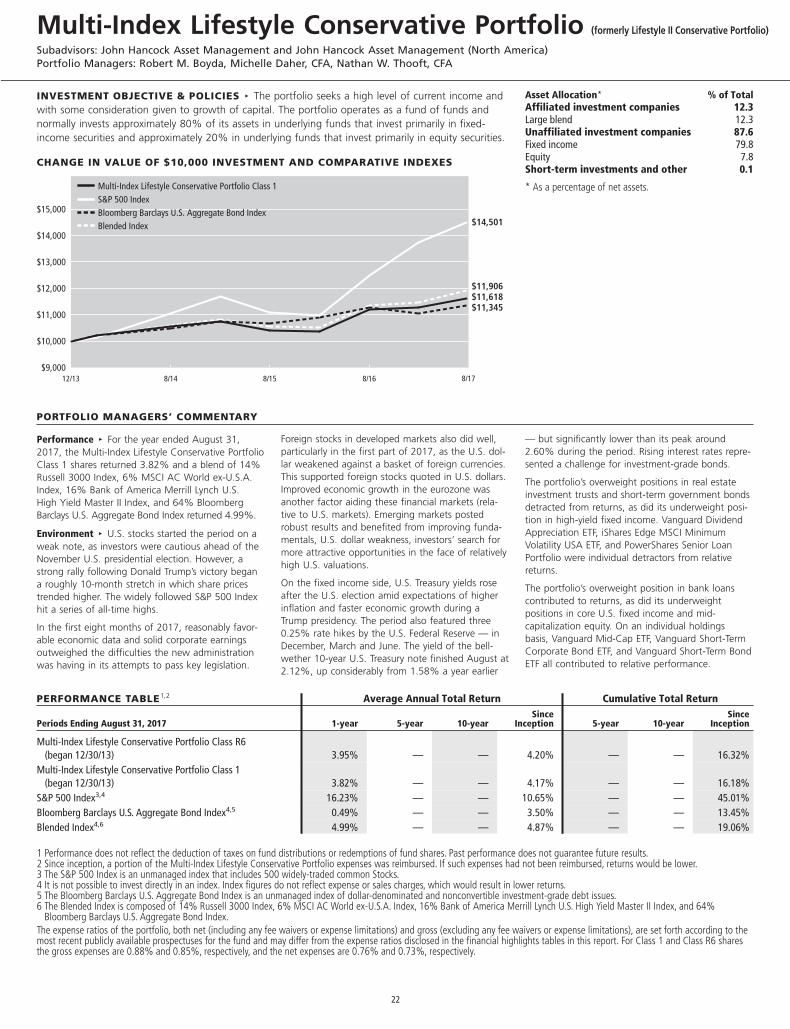
INVESTMENT OBJECTIVE & POLICIES c The portfolio seeks a high level of current income andwith some consideration given to growth of capital. The portfolio operates as a fund of funds andnormally invests approximately 80% of its assets in underlying funds that invest primarily in fixed-income securities and approximately 20% in underlying funds that invest primarily in equity securities.
CHANGE IN VALUE OF $10,000 INVESTMENT AND COMPARATIVE INDEXES
PORTFOLIO MANAGERS’ COMMENTARY
Performance c For the year ended August 31,2017, the Multi-Index Lifestyle Conservative PortfolioClass 1 shares returned 3.82% and a blend of 14%Russell 3000 Index, 6% MSCI AC World ex-U.S.A.Index, 16% Bank of America Merrill Lynch U.S.High Yield Master II Index, and 64% BloombergBarclays U.S. Aggregate Bond Index returned 4.99%.
Environment c U.S. stocks started the period on aweak note, as investors were cautious ahead of theNovember U.S. presidential election. However, astrong rally following Donald Trump’s victory begana roughly 10-month stretch in which share pricestrended higher. The widely followed S&P 500 Indexhit a series of all-time highs.
In the first eight months of 2017, reasonably favor-able economic data and solid corporate earningsoutweighed the difficulties the new administrationwas having in its attempts to pass key legislation.
Foreign stocks in developed markets also did well,particularly in the first part of 2017, as the U.S. dol-lar weakened against a basket of foreign currencies.This supported foreign stocks quoted in U.S. dollars.Improved economic growth in the eurozone wasanother factor aiding these financial markets (rela-tive to U.S. markets). Emerging markets postedrobust results and benefited from improving funda-mentals, U.S. dollar weakness, investors’ search formore attractive opportunities in the face of relativelyhigh U.S. valuations.
On the fixed income side, U.S. Treasury yields roseafter the U.S. election amid expectations of higherinflation and faster economic growth during aTrump presidency. The period also featured three0.25% rate hikes by the U.S. Federal Reserve — inDecember, March and June. The yield of the bell-wether 10-year U.S. Treasury note finished August at2.12%, up considerably from 1.58% a year earlier
— but significantly lower than its peak around2.60% during the period. Rising interest rates repre-sented a challenge for investment-grade bonds.
The portfolio’s overweight positions in real estateinvestment trusts and short-term government bondsdetracted from returns, as did its underweight posi-tion in high-yield fixed income. Vanguard DividendAppreciation ETF, iShares Edge MSCI MinimumVolatility USA ETF, and PowerShares Senior LoanPortfolio were individual detractors from relativereturns.
The portfolio’s overweight position in bank loanscontributed to returns, as did its underweightpositions in core U.S. fixed income and mid-capitalization equity. On an individual holdingsbasis, Vanguard Mid-Cap ETF, Vanguard Short-TermCorporate Bond ETF, and Vanguard Short-Term BondETF all contributed to relative performance.
PERFORMANCE TABLE1,2 Average Annual Total Return Cumulative Total Return
Periods Ending August 31, 2017 1-year 5-year 10-yearSince
Inception 5-year 10-yearSince
Inception
Multi-Index Lifestyle Conservative Portfolio Class R6(began 12/30/13) 3.95% — — 4.20% — — 16.32%
Multi-Index Lifestyle Conservative Portfolio Class 1(began 12/30/13) 3.82% — — 4.17% — — 16.18%
S&P 500 Index3,4 16.23% — — 10.65% — — 45.01%Bloomberg Barclays U.S. Aggregate Bond Index4,5 0.49% — — 3.50% — — 13.45%Blended Index4,6 4.99% — — 4.87% — — 19.06%
1 Performance does not reflect the deduction of taxes on fund distributions or redemptions of fund shares. Past performance does not guarantee future results.2 Since inception, a portion of the Multi-Index Lifestyle Conservative Portfolio expenses was reimbursed. If such expenses had not been reimbursed, returns would be lower.3 The S&P 500 Index is an unmanaged index that includes 500 widely-traded common Stocks.4 It is not possible to invest directly in an index. Index figures do not reflect expense or sales charges, which would result in lower returns.5 The Bloomberg Barclays U.S. Aggregate Bond Index is an unmanaged index of dollar-denominated and nonconvertible investment-grade debt issues.6 The Blended Index is composed of 14% Russell 3000 Index, 6% MSCI AC World ex-U.S.A. Index, 16% Bank of America Merrill Lynch U.S. High Yield Master II Index, and 64%
Bloomberg Barclays U.S. Aggregate Bond Index.The expense ratios of the portfolio, both net (including any fee waivers or expense limitations) and gross (excluding any fee waivers or expense limitations), are set forth according to themost recent publicly available prospectuses for the fund and may differ from the expense ratios disclosed in the financial highlights tables in this report. For Class 1 and Class R6 sharesthe gross expenses are 0.88% and 0.85%, respectively, and the net expenses are 0.76% and 0.73%, respectively.
Asset Allocation* % of TotalAffiliated investment companies 12.3Large blend 12.3Unaffiliated investment companies 87.6Fixed income 79.8Equity 7.8Short-term investments and other 0.1
* As a percentage of net assets.
$14,501
$11,906$11,618$11,345
$9,000
$10,000
$11,000
$12,000
$13,000
$14,000
$15,000
Multi-Index Lifestyle Conservative Portfolio Class 1S&P 500 IndexBloomberg Barclays U.S. Aggregate Bond IndexBlended Index
8/178/168/158/1412/13
Multi-Index Lifestyle Conservative Portfolio (formerly Lifestyle II Conservative Portfolio)
Subadvisors: John Hancock Asset Management and John Hancock Asset Management (North America)Portfolio Managers: Robert M. Boyda, Michelle Daher, CFA, Nathan W. Thooft, CFA
22
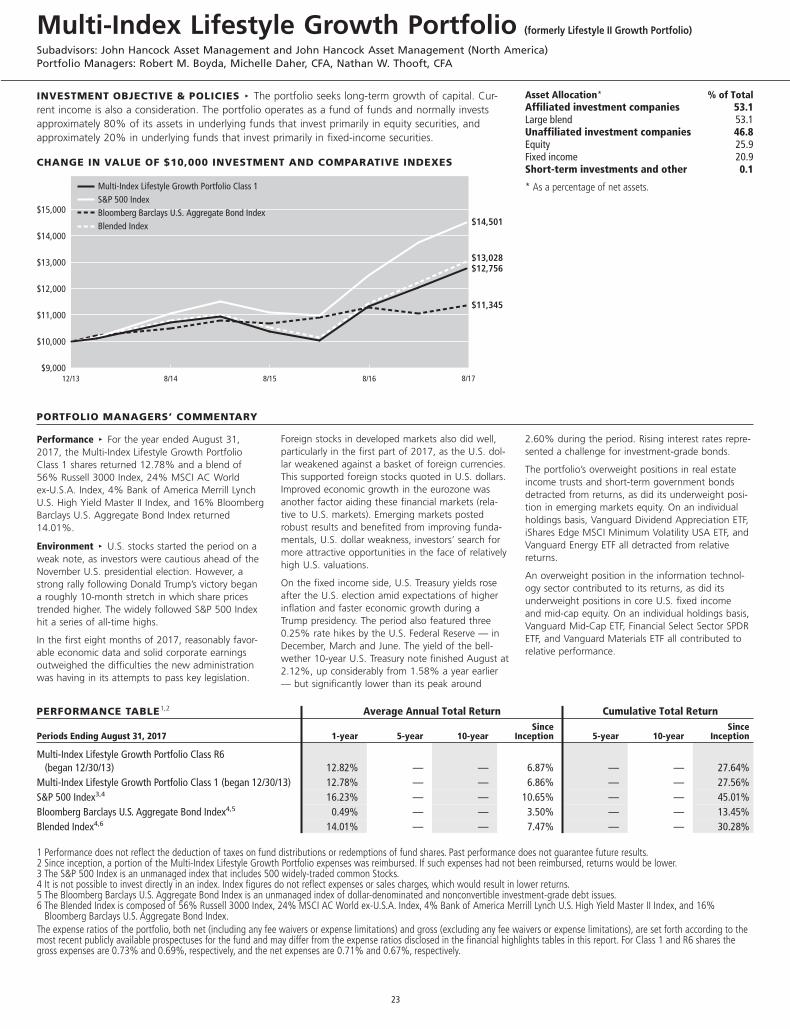
INVESTMENT OBJECTIVE & POLICIES c The portfolio seeks long-term growth of capital. Cur-rent income is also a consideration. The portfolio operates as a fund of funds and normally investsapproximately 80% of its assets in underlying funds that invest primarily in equity securities, andapproximately 20% in underlying funds that invest primarily in fixed-income securities.
CHANGE IN VALUE OF $10,000 INVESTMENT AND COMPARATIVE INDEXES
PORTFOLIO MANAGERS’ COMMENTARY
Performance c For the year ended August 31,2017, the Multi-Index Lifestyle Growth PortfolioClass 1 shares returned 12.78% and a blend of56% Russell 3000 Index, 24% MSCI AC Worldex-U.S.A. Index, 4% Bank of America Merrill LynchU.S. High Yield Master II Index, and 16% BloombergBarclays U.S. Aggregate Bond Index returned14.01%.
Environment c U.S. stocks started the period on aweak note, as investors were cautious ahead of theNovember U.S. presidential election. However, astrong rally following Donald Trump’s victory begana roughly 10-month stretch in which share pricestrended higher. The widely followed S&P 500 Indexhit a series of all-time highs.
In the first eight months of 2017, reasonably favor-able economic data and solid corporate earningsoutweighed the difficulties the new administrationwas having in its attempts to pass key legislation.
Foreign stocks in developed markets also did well,particularly in the first part of 2017, as the U.S. dol-lar weakened against a basket of foreign currencies.This supported foreign stocks quoted in U.S. dollars.Improved economic growth in the eurozone wasanother factor aiding these financial markets (rela-tive to U.S. markets). Emerging markets postedrobust results and benefited from improving funda-mentals, U.S. dollar weakness, investors’ search formore attractive opportunities in the face of relativelyhigh U.S. valuations.
On the fixed income side, U.S. Treasury yields roseafter the U.S. election amid expectations of higherinflation and faster economic growth during aTrump presidency. The period also featured three0.25% rate hikes by the U.S. Federal Reserve — inDecember, March and June. The yield of the bell-wether 10-year U.S. Treasury note finished August at2.12%, up considerably from 1.58% a year earlier— but significantly lower than its peak around
2.60% during the period. Rising interest rates repre-sented a challenge for investment-grade bonds.
The portfolio’s overweight positions in real estateincome trusts and short-term government bondsdetracted from returns, as did its underweight posi-tion in emerging markets equity. On an individualholdings basis, Vanguard Dividend Appreciation ETF,iShares Edge MSCI Minimum Volatility USA ETF, andVanguard Energy ETF all detracted from relativereturns.
An overweight position in the information technol-ogy sector contributed to its returns, as did itsunderweight positions in core U.S. fixed incomeand mid-cap equity. On an individual holdings basis,Vanguard Mid-Cap ETF, Financial Select Sector SPDRETF, and Vanguard Materials ETF all contributed torelative performance.
PERFORMANCE TABLE1,2 Average Annual Total Return Cumulative Total Return
Periods Ending August 31, 2017 1-year 5-year 10-yearSince
Inception 5-year 10-yearSince
Inception
Multi-Index Lifestyle Growth Portfolio Class R6(began 12/30/13) 12.82% — — 6.87% — — 27.64%
Multi-Index Lifestyle Growth Portfolio Class 1 (began 12/30/13) 12.78% — — 6.86% — — 27.56%S&P 500 Index3,4 16.23% — — 10.65% — — 45.01%Bloomberg Barclays U.S. Aggregate Bond Index4,5 0.49% — — 3.50% — — 13.45%Blended Index4,6 14.01% — — 7.47% — — 30.28%
1 Performance does not reflect the deduction of taxes on fund distributions or redemptions of fund shares. Past performance does not guarantee future results.2 Since inception, a portion of the Multi-Index Lifestyle Growth Portfolio expenses was reimbursed. If such expenses had not been reimbursed, returns would be lower.3 The S&P 500 Index is an unmanaged index that includes 500 widely-traded common Stocks.4 It is not possible to invest directly in an index. Index figures do not reflect expenses or sales charges, which would result in lower returns.5 The Bloomberg Barclays U.S. Aggregate Bond Index is an unmanaged index of dollar-denominated and nonconvertible investment-grade debt issues.6 The Blended Index is composed of 56% Russell 3000 Index, 24% MSCI AC World ex-U.S.A. Index, 4% Bank of America Merrill Lynch U.S. High Yield Master II Index, and 16%
Bloomberg Barclays U.S. Aggregate Bond Index.The expense ratios of the portfolio, both net (including any fee waivers or expense limitations) and gross (excluding any fee waivers or expense limitations), are set forth according to themost recent publicly available prospectuses for the fund and may differ from the expense ratios disclosed in the financial highlights tables in this report. For Class 1 and R6 shares thegross expenses are 0.73% and 0.69%, respectively, and the net expenses are 0.71% and 0.67%, respectively.
Asset Allocation* % of TotalAffiliated investment companies 53.1Large blend 53.1Unaffiliated investment companies 46.8Equity 25.9Fixed income 20.9Short-term investments and other 0.1
* As a percentage of net assets.
$9,000
$10,000
$11,000
$12,000
$13,000
$14,000
$15,000
Multi-Index Lifestyle Growth Portfolio Class 1S&P 500 IndexBloomberg Barclays U.S. Aggregate Bond IndexBlended Index $14,501
$13,028$12,756
$11,345
8/178/168/158/1412/13
Multi-Index Lifestyle Growth Portfolio (formerly Lifestyle II Growth Portfolio)
Subadvisors: John Hancock Asset Management and John Hancock Asset Management (North America)Portfolio Managers: Robert M. Boyda, Michelle Daher, CFA, Nathan W. Thooft, CFA
23
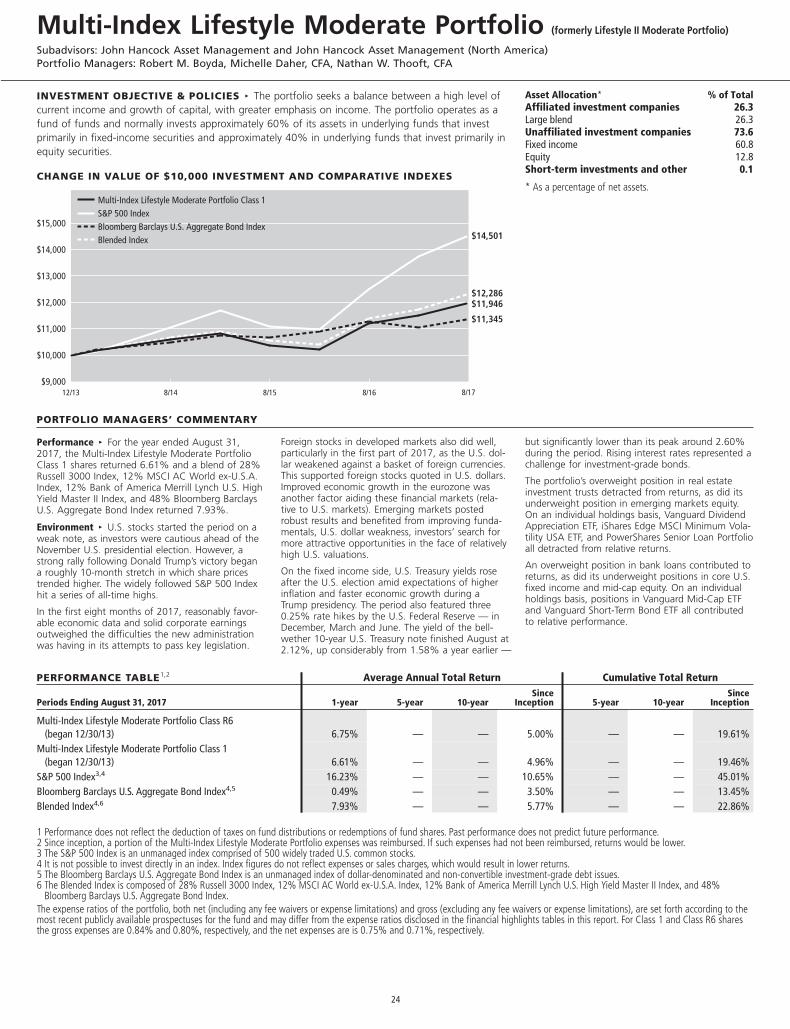
INVESTMENT OBJECTIVE & POLICIES c The portfolio seeks a balance between a high level ofcurrent income and growth of capital, with greater emphasis on income. The portfolio operates as afund of funds and normally invests approximately 60% of its assets in underlying funds that investprimarily in fixed-income securities and approximately 40% in underlying funds that invest primarily inequity securities.
CHANGE IN VALUE OF $10,000 INVESTMENT AND COMPARATIVE INDEXES
PORTFOLIO MANAGERS’ COMMENTARY
Performance c For the year ended August 31,2017, the Multi-Index Lifestyle Moderate PortfolioClass 1 shares returned 6.61% and a blend of 28%Russell 3000 Index, 12% MSCI AC World ex-U.S.A.Index, 12% Bank of America Merrill Lynch U.S. HighYield Master II Index, and 48% Bloomberg BarclaysU.S. Aggregate Bond Index returned 7.93%.
Environment c U.S. stocks started the period on aweak note, as investors were cautious ahead of theNovember U.S. presidential election. However, astrong rally following Donald Trump’s victory begana roughly 10-month stretch in which share pricestrended higher. The widely followed S&P 500 Indexhit a series of all-time highs.
In the first eight months of 2017, reasonably favor-able economic data and solid corporate earningsoutweighed the difficulties the new administrationwas having in its attempts to pass key legislation.
Foreign stocks in developed markets also did well,particularly in the first part of 2017, as the U.S. dol-lar weakened against a basket of foreign currencies.This supported foreign stocks quoted in U.S. dollars.Improved economic growth in the eurozone wasanother factor aiding these financial markets (rela-tive to U.S. markets). Emerging markets postedrobust results and benefited from improving funda-mentals, U.S. dollar weakness, investors’ search formore attractive opportunities in the face of relativelyhigh U.S. valuations.
On the fixed income side, U.S. Treasury yields roseafter the U.S. election amid expectations of higherinflation and faster economic growth during aTrump presidency. The period also featured three0.25% rate hikes by the U.S. Federal Reserve — inDecember, March and June. The yield of the bell-wether 10-year U.S. Treasury note finished August at2.12%, up considerably from 1.58% a year earlier —
but significantly lower than its peak around 2.60%during the period. Rising interest rates represented achallenge for investment-grade bonds.
The portfolio’s overweight position in real estateinvestment trusts detracted from returns, as did itsunderweight position in emerging markets equity.On an individual holdings basis, Vanguard DividendAppreciation ETF, iShares Edge MSCI Minimum Vola-tility USA ETF, and PowerShares Senior Loan Portfolioall detracted from relative returns.
An overweight position in bank loans contributed toreturns, as did its underweight positions in core U.S.fixed income and mid-cap equity. On an individualholdings basis, positions in Vanguard Mid-Cap ETFand Vanguard Short-Term Bond ETF all contributedto relative performance.
PERFORMANCE TABLE1,2 Average Annual Total Return Cumulative Total Return
Periods Ending August 31, 2017 1-year 5-year 10-yearSince
Inception 5-year 10-yearSince
Inception
Multi-Index Lifestyle Moderate Portfolio Class R6(began 12/30/13) 6.75% — — 5.00% — — 19.61%
Multi-Index Lifestyle Moderate Portfolio Class 1(began 12/30/13) 6.61% — — 4.96% — — 19.46%
S&P 500 Index3,4 16.23% — — 10.65% — — 45.01%Bloomberg Barclays U.S. Aggregate Bond Index4,5 0.49% — — 3.50% — — 13.45%Blended Index4,6 7.93% — — 5.77% — — 22.86%
1 Performance does not reflect the deduction of taxes on fund distributions or redemptions of fund shares. Past performance does not predict future performance.2 Since inception, a portion of the Multi-Index Lifestyle Moderate Portfolio expenses was reimbursed. If such expenses had not been reimbursed, returns would be lower.3 The S&P 500 Index is an unmanaged index comprised of 500 widely traded U.S. common stocks.4 It is not possible to invest directly in an index. Index figures do not reflect expenses or sales charges, which would result in lower returns.5 The Bloomberg Barclays U.S. Aggregate Bond Index is an unmanaged index of dollar-denominated and non-convertible investment-grade debt issues.6 The Blended Index is composed of 28% Russell 3000 Index, 12% MSCI AC World ex-U.S.A. Index, 12% Bank of America Merrill Lynch U.S. High Yield Master II Index, and 48%
Bloomberg Barclays U.S. Aggregate Bond Index.The expense ratios of the portfolio, both net (including any fee waivers or expense limitations) and gross (excluding any fee waivers or expense limitations), are set forth according to themost recent publicly available prospectuses for the fund and may differ from the expense ratios disclosed in the financial highlights tables in this report. For Class 1 and Class R6 sharesthe gross expenses are 0.84% and 0.80%, respectively, and the net expenses are is 0.75% and 0.71%, respectively.
Asset Allocation* % of TotalAffiliated investment companies 26.3Large blend 26.3Unaffiliated investment companies 73.6Fixed income 60.8Equity 12.8Short-term investments and other 0.1
* As a percentage of net assets.
$14,501
$12,286$11,946
$11,345
$9,000
$10,000
$11,000
$12,000
$13,000
$14,000
$15,000
Multi-Index Lifestyle Moderate Portfolio Class 1S&P 500 IndexBloomberg Barclays U.S. Aggregate Bond IndexBlended Index
8/178/168/158/1412/13
Multi-Index Lifestyle Moderate Portfolio (formerly Lifestyle II Moderate Portfolio)
Subadvisors: John Hancock Asset Management and John Hancock Asset Management (North America)Portfolio Managers: Robert M. Boyda, Michelle Daher, CFA, Nathan W. Thooft, CFA
24
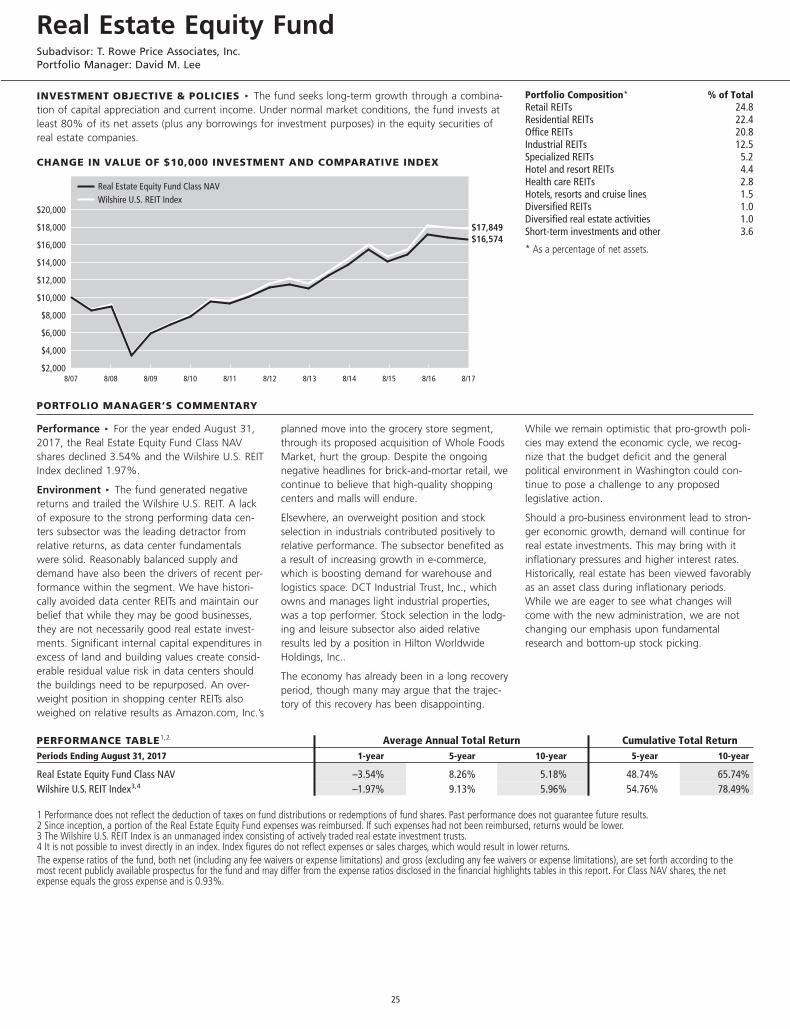
INVESTMENT OBJECTIVE & POLICIES c The fund seeks long-term growth through a combina-tion of capital appreciation and current income. Under normal market conditions, the fund invests atleast 80% of its net assets (plus any borrowings for investment purposes) in the equity securities ofreal estate companies.
CHANGE IN VALUE OF $10,000 INVESTMENT AND COMPARATIVE INDEX
PORTFOLIO MANAGER’S COMMENTARY
Performance c For the year ended August 31,2017, the Real Estate Equity Fund Class NAVshares declined 3.54% and the Wilshire U.S. REITIndex declined 1.97%.
Environment c The fund generated negativereturns and trailed the Wilshire U.S. REIT. A lackof exposure to the strong performing data cen-ters subsector was the leading detractor fromrelative returns, as data center fundamentalswere solid. Reasonably balanced supply anddemand have also been the drivers of recent per-formance within the segment. We have histori-cally avoided data center REITs and maintain ourbelief that while they may be good businesses,they are not necessarily good real estate invest-ments. Significant internal capital expenditures inexcess of land and building values create consid-erable residual value risk in data centers shouldthe buildings need to be repurposed. An over-weight position in shopping center REITs alsoweighed on relative results as Amazon.com, Inc.’s
planned move into the grocery store segment,through its proposed acquisition of Whole FoodsMarket, hurt the group. Despite the ongoingnegative headlines for brick-and-mortar retail, wecontinue to believe that high-quality shoppingcenters and malls will endure.
Elsewhere, an overweight position and stockselection in industrials contributed positively torelative performance. The subsector benefited asa result of increasing growth in e-commerce,which is boosting demand for warehouse andlogistics space. DCT Industrial Trust, Inc., whichowns and manages light industrial properties,was a top performer. Stock selection in the lodg-ing and leisure subsector also aided relativeresults led by a position in Hilton WorldwideHoldings, Inc..
The economy has already been in a long recoveryperiod, though many may argue that the trajec-tory of this recovery has been disappointing.
While we remain optimistic that pro-growth poli-cies may extend the economic cycle, we recog-nize that the budget deficit and the generalpolitical environment in Washington could con-tinue to pose a challenge to any proposedlegislative action.
Should a pro-business environment lead to stron-ger economic growth, demand will continue forreal estate investments. This may bring with itinflationary pressures and higher interest rates.Historically, real estate has been viewed favorablyas an asset class during inflationary periods.While we are eager to see what changes willcome with the new administration, we are notchanging our emphasis upon fundamentalresearch and bottom-up stock picking.
PERFORMANCE TABLE1,2 Average Annual Total Return Cumulative Total ReturnPeriods Ending August 31, 2017 1-year 5-year 10-year 5-year 10-year
Real Estate Equity Fund Class NAV –3.54% 8.26% 5.18% 48.74% 65.74%Wilshire U.S. REIT Index3,4 –1.97% 9.13% 5.96% 54.76% 78.49%
1 Performance does not reflect the deduction of taxes on fund distributions or redemptions of fund shares. Past performance does not guarantee future results.2 Since inception, a portion of the Real Estate Equity Fund expenses was reimbursed. If such expenses had not been reimbursed, returns would be lower.3 The Wilshire U.S. REIT Index is an unmanaged index consisting of actively traded real estate investment trusts.4 It is not possible to invest directly in an index. Index figures do not reflect expenses or sales charges, which would result in lower returns.The expense ratios of the fund, both net (including any fee waivers or expense limitations) and gross (excluding any fee waivers or expense limitations), are set forth according to themost recent publicly available prospectus for the fund and may differ from the expense ratios disclosed in the financial highlights tables in this report. For Class NAV shares, the netexpense equals the gross expense and is 0.93%.
Portfolio Composition* % of TotalRetail REITs 24.8Residential REITs 22.4Office REITs 20.8Industrial REITs 12.5Specialized REITs 5.2Hotel and resort REITs 4.4Health care REITs 2.8Hotels, resorts and cruise lines 1.5Diversified REITs 1.0Diversified real estate activities 1.0Short-term investments and other 3.6
* As a percentage of net assets.
8/178/168/158/148/138/128/118/108/098/088/07$2,000
$4,000
$6,000
$8,000
$10,000
$12,000
$14,000
$16,000
$18,000
$20,000
$17,849$16,574
Real Estate Equity Fund Class NAVWilshire U.S. REIT Index
Real Estate Equity FundSubadvisor: T. Rowe Price Associates, Inc.Portfolio Manager: David M. Lee
25
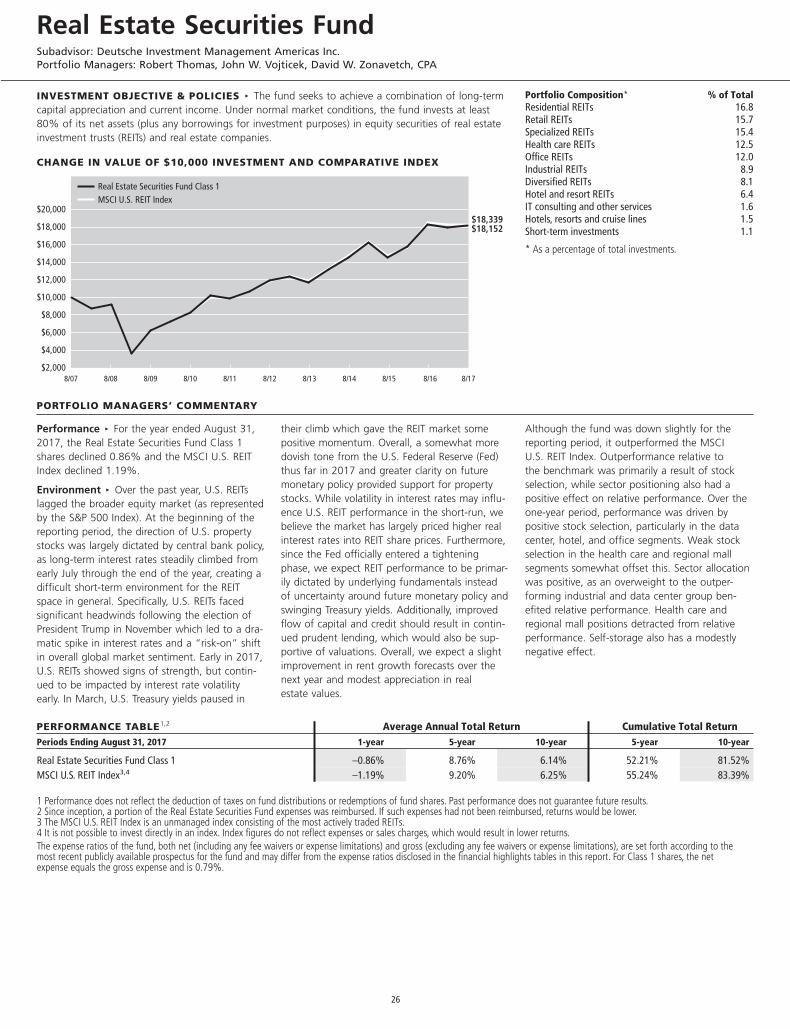
INVESTMENT OBJECTIVE & POLICIES c The fund seeks to achieve a combination of long-termcapital appreciation and current income. Under normal market conditions, the fund invests at least80% of its net assets (plus any borrowings for investment purposes) in equity securities of real estateinvestment trusts (REITs) and real estate companies.
CHANGE IN VALUE OF $10,000 INVESTMENT AND COMPARATIVE INDEX
PORTFOLIO MANAGERS’ COMMENTARY
Performance c For the year ended August 31,2017, the Real Estate Securities Fund Class 1shares declined 0.86% and the MSCI U.S. REITIndex declined 1.19%.
Environment c Over the past year, U.S. REITslagged the broader equity market (as representedby the S&P 500 Index). At the beginning of thereporting period, the direction of U.S. propertystocks was largely dictated by central bank policy,as long-term interest rates steadily climbed fromearly July through the end of the year, creating adifficult short-term environment for the REITspace in general. Specifically, U.S. REITs facedsignificant headwinds following the election ofPresident Trump in November which led to a dra-matic spike in interest rates and a “risk-on” shiftin overall global market sentiment. Early in 2017,U.S. REITs showed signs of strength, but contin-ued to be impacted by interest rate volatilityearly. In March, U.S. Treasury yields paused in
their climb which gave the REIT market somepositive momentum. Overall, a somewhat moredovish tone from the U.S. Federal Reserve (Fed)thus far in 2017 and greater clarity on futuremonetary policy provided support for propertystocks. While volatility in interest rates may influ-ence U.S. REIT performance in the short-run, webelieve the market has largely priced higher realinterest rates into REIT share prices. Furthermore,since the Fed officially entered a tighteningphase, we expect REIT performance to be primar-ily dictated by underlying fundamentals insteadof uncertainty around future monetary policy andswinging Treasury yields. Additionally, improvedflow of capital and credit should result in contin-ued prudent lending, which would also be sup-portive of valuations. Overall, we expect a slightimprovement in rent growth forecasts over thenext year and modest appreciation in realestate values.
Although the fund was down slightly for thereporting period, it outperformed the MSCIU.S. REIT Index. Outperformance relative tothe benchmark was primarily a result of stockselection, while sector positioning also had apositive effect on relative performance. Over theone-year period, performance was driven bypositive stock selection, particularly in the datacenter, hotel, and office segments. Weak stockselection in the health care and regional mallsegments somewhat offset this. Sector allocationwas positive, as an overweight to the outper-forming industrial and data center group ben-efited relative performance. Health care andregional mall positions detracted from relativeperformance. Self-storage also has a modestlynegative effect.
PERFORMANCE TABLE1,2 Average Annual Total Return Cumulative Total ReturnPeriods Ending August 31, 2017 1-year 5-year 10-year 5-year 10-year
Real Estate Securities Fund Class 1 –0.86% 8.76% 6.14% 52.21% 81.52%MSCI U.S. REIT Index3,4 –1.19% 9.20% 6.25% 55.24% 83.39%
1 Performance does not reflect the deduction of taxes on fund distributions or redemptions of fund shares. Past performance does not guarantee future results.2 Since inception, a portion of the Real Estate Securities Fund expenses was reimbursed. If such expenses had not been reimbursed, returns would be lower.3 The MSCI U.S. REIT Index is an unmanaged index consisting of the most actively traded REITs.4 It is not possible to invest directly in an index. Index figures do not reflect expenses or sales charges, which would result in lower returns.The expense ratios of the fund, both net (including any fee waivers or expense limitations) and gross (excluding any fee waivers or expense limitations), are set forth according to themost recent publicly available prospectus for the fund and may differ from the expense ratios disclosed in the financial highlights tables in this report. For Class 1 shares, the netexpense equals the gross expense and is 0.79%.
Portfolio Composition* % of TotalResidential REITs 16.8Retail REITs 15.7Specialized REITs 15.4Health care REITs 12.5Office REITs 12.0Industrial REITs 8.9Diversified REITs 8.1Hotel and resort REITs 6.4IT consulting and other services 1.6Hotels, resorts and cruise lines 1.5Short-term investments 1.1
* As a percentage of total investments.
8/178/168/158/148/138/128/118/108/098/088/07$2,000
$4,000
$6,000
$8,000
$10,000
$12,000
$14,000
$16,000
$18,000
$20,000$18,339$18,152
Real Estate Securities Fund Class 1MSCI U.S. REIT Index
Real Estate Securities FundSubadvisor: Deutsche Investment Management Americas Inc.Portfolio Managers: Robert Thomas, John W. Vojticek, David W. Zonavetch, CPA
26
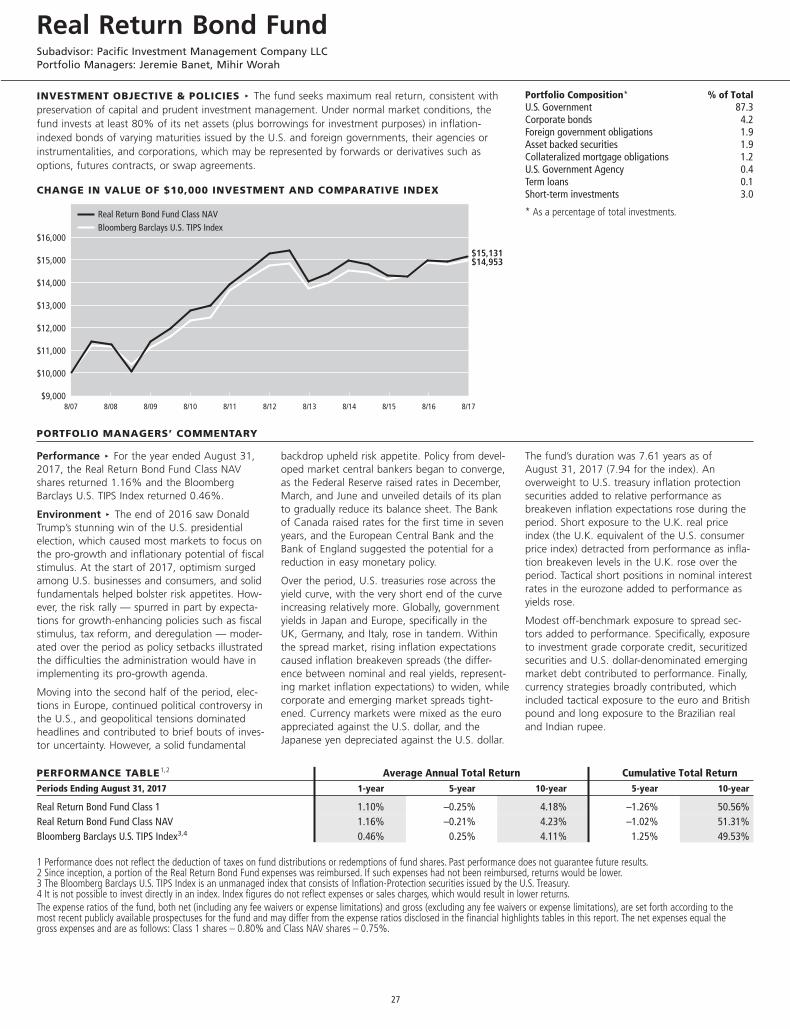
INVESTMENT OBJECTIVE & POLICIES c The fund seeks maximum real return, consistent withpreservation of capital and prudent investment management. Under normal market conditions, thefund invests at least 80% of its net assets (plus borrowings for investment purposes) in inflation-indexed bonds of varying maturities issued by the U.S. and foreign governments, their agencies orinstrumentalities, and corporations, which may be represented by forwards or derivatives such asoptions, futures contracts, or swap agreements.
CHANGE IN VALUE OF $10,000 INVESTMENT AND COMPARATIVE INDEX
PORTFOLIO MANAGERS’ COMMENTARY
Performance c For the year ended August 31,2017, the Real Return Bond Fund Class NAVshares returned 1.16% and the BloombergBarclays U.S. TIPS Index returned 0.46%.
Environment c The end of 2016 saw DonaldTrump’s stunning win of the U.S. presidentialelection, which caused most markets to focus onthe pro-growth and inflationary potential of fiscalstimulus. At the start of 2017, optimism surgedamong U.S. businesses and consumers, and solidfundamentals helped bolster risk appetites. How-ever, the risk rally — spurred in part by expecta-tions for growth-enhancing policies such as fiscalstimulus, tax reform, and deregulation — moder-ated over the period as policy setbacks illustratedthe difficulties the administration would have inimplementing its pro-growth agenda.
Moving into the second half of the period, elec-tions in Europe, continued political controversy inthe U.S., and geopolitical tensions dominatedheadlines and contributed to brief bouts of inves-tor uncertainty. However, a solid fundamental
backdrop upheld risk appetite. Policy from devel-oped market central bankers began to converge,as the Federal Reserve raised rates in December,March, and June and unveiled details of its planto gradually reduce its balance sheet. The Bankof Canada raised rates for the first time in sevenyears, and the European Central Bank and theBank of England suggested the potential for areduction in easy monetary policy.
Over the period, U.S. treasuries rose across theyield curve, with the very short end of the curveincreasing relatively more. Globally, governmentyields in Japan and Europe, specifically in theUK, Germany, and Italy, rose in tandem. Withinthe spread market, rising inflation expectationscaused inflation breakeven spreads (the differ-ence between nominal and real yields, represent-ing market inflation expectations) to widen, whilecorporate and emerging market spreads tight-ened. Currency markets were mixed as the euroappreciated against the U.S. dollar, and theJapanese yen depreciated against the U.S. dollar.
The fund’s duration was 7.61 years as ofAugust 31, 2017 (7.94 for the index). Anoverweight to U.S. treasury inflation protectionsecurities added to relative performance asbreakeven inflation expectations rose during theperiod. Short exposure to the U.K. real priceindex (the U.K. equivalent of the U.S. consumerprice index) detracted from performance as infla-tion breakeven levels in the U.K. rose over theperiod. Tactical short positions in nominal interestrates in the eurozone added to performance asyields rose.
Modest off-benchmark exposure to spread sec-tors added to performance. Specifically, exposureto investment grade corporate credit, securitizedsecurities and U.S. dollar-denominated emergingmarket debt contributed to performance. Finally,currency strategies broadly contributed, whichincluded tactical exposure to the euro and Britishpound and long exposure to the Brazilian realand Indian rupee.
PERFORMANCE TABLE1,2 Average Annual Total Return Cumulative Total ReturnPeriods Ending August 31, 2017 1-year 5-year 10-year 5-year 10-year
Real Return Bond Fund Class 1 1.10% –0.25% 4.18% –1.26% 50.56%Real Return Bond Fund Class NAV 1.16% –0.21% 4.23% –1.02% 51.31%Bloomberg Barclays U.S. TIPS Index3,4 0.46% 0.25% 4.11% 1.25% 49.53%
1 Performance does not reflect the deduction of taxes on fund distributions or redemptions of fund shares. Past performance does not guarantee future results.2 Since inception, a portion of the Real Return Bond Fund expenses was reimbursed. If such expenses had not been reimbursed, returns would be lower.3 The Bloomberg Barclays U.S. TIPS Index is an unmanaged index that consists of Inflation-Protection securities issued by the U.S. Treasury.4 It is not possible to invest directly in an index. Index figures do not reflect expenses or sales charges, which would result in lower returns.The expense ratios of the fund, both net (including any fee waivers or expense limitations) and gross (excluding any fee waivers or expense limitations), are set forth according to themost recent publicly available prospectuses for the fund and may differ from the expense ratios disclosed in the financial highlights tables in this report. The net expenses equal thegross expenses and are as follows: Class 1 shares – 0.80% and Class NAV shares – 0.75%.
Portfolio Composition* % of TotalU.S. Government 87.3Corporate bonds 4.2Foreign government obligations 1.9Asset backed securities 1.9Collateralized mortgage obligations 1.2U.S. Government Agency 0.4Term loans 0.1Short-term investments 3.0
* As a percentage of total investments.
8/178/168/158/148/138/128/118/108/098/088/07$9,000
$10,000
$11,000
$12,000
$13,000
$14,000
$15,000
$16,000
Real Return Bond Fund Class NAVBloomberg Barclays U.S. TIPS Index
$15,131$14,953
Real Return Bond FundSubadvisor: Pacific Investment Management Company LLCPortfolio Managers: Jeremie Banet, Mihir Worah
27
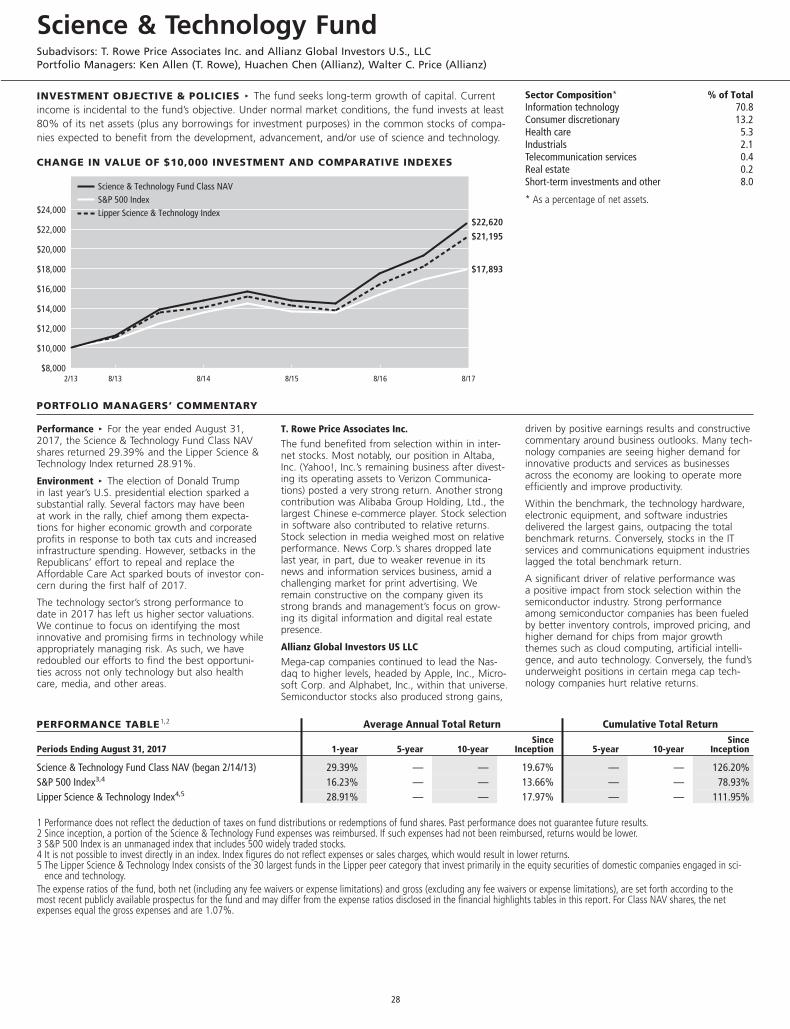
INVESTMENT OBJECTIVE & POLICIES c The fund seeks long-term growth of capital. Currentincome is incidental to the fund’s objective. Under normal market conditions, the fund invests at least80% of its net assets (plus any borrowings for investment purposes) in the common stocks of compa-nies expected to benefit from the development, advancement, and/or use of science and technology.
CHANGE IN VALUE OF $10,000 INVESTMENT AND COMPARATIVE INDEXES
PORTFOLIO MANAGERS’ COMMENTARY
Performance c For the year ended August 31,2017, the Science & Technology Fund Class NAVshares returned 29.39% and the Lipper Science &Technology Index returned 28.91%.
Environment c The election of Donald Trumpin last year’s U.S. presidential election sparked asubstantial rally. Several factors may have beenat work in the rally, chief among them expecta-tions for higher economic growth and corporateprofits in response to both tax cuts and increasedinfrastructure spending. However, setbacks in theRepublicans’ effort to repeal and replace theAffordable Care Act sparked bouts of investor con-cern during the first half of 2017.
The technology sector’s strong performance todate in 2017 has left us higher sector valuations.We continue to focus on identifying the mostinnovative and promising firms in technology whileappropriately managing risk. As such, we haveredoubled our efforts to find the best opportuni-ties across not only technology but also healthcare, media, and other areas.
T. Rowe Price Associates Inc.
The fund benefited from selection within in inter-net stocks. Most notably, our position in Altaba,Inc. (Yahoo!, Inc.’s remaining business after divest-ing its operating assets to Verizon Communica-tions) posted a very strong return. Another strongcontribution was Alibaba Group Holding, Ltd., thelargest Chinese e-commerce player. Stock selectionin software also contributed to relative returns.Stock selection in media weighed most on relativeperformance. News Corp.’s shares dropped latelast year, in part, due to weaker revenue in itsnews and information services business, amid achallenging market for print advertising. Weremain constructive on the company given itsstrong brands and management’s focus on grow-ing its digital information and digital real estatepresence.
Allianz Global Investors US LLC
Mega-cap companies continued to lead the Nas-daq to higher levels, headed by Apple, Inc., Micro-soft Corp. and Alphabet, Inc., within that universe.Semiconductor stocks also produced strong gains,
driven by positive earnings results and constructivecommentary around business outlooks. Many tech-nology companies are seeing higher demand forinnovative products and services as businessesacross the economy are looking to operate moreefficiently and improve productivity.
Within the benchmark, the technology hardware,electronic equipment, and software industriesdelivered the largest gains, outpacing the totalbenchmark returns. Conversely, stocks in the ITservices and communications equipment industrieslagged the total benchmark return.
A significant driver of relative performance wasa positive impact from stock selection within thesemiconductor industry. Strong performanceamong semiconductor companies has been fueledby better inventory controls, improved pricing, andhigher demand for chips from major growththemes such as cloud computing, artificial intelli-gence, and auto technology. Conversely, the fund’sunderweight positions in certain mega cap tech-nology companies hurt relative returns.
PERFORMANCE TABLE1,2 Average Annual Total Return Cumulative Total Return
Periods Ending August 31, 2017 1-year 5-year 10-yearSince
Inception 5-year 10-yearSince
Inception
Science & Technology Fund Class NAV (began 2/14/13) 29.39% — — 19.67% — — 126.20%S&P 500 Index3,4 16.23% — — 13.66% — — 78.93%Lipper Science & Technology Index4,5 28.91% — — 17.97% — — 111.95%
1 Performance does not reflect the deduction of taxes on fund distributions or redemptions of fund shares. Past performance does not guarantee future results.2 Since inception, a portion of the Science & Technology Fund expenses was reimbursed. If such expenses had not been reimbursed, returns would be lower.3 S&P 500 Index is an unmanaged index that includes 500 widely traded stocks.4 It is not possible to invest directly in an index. Index figures do not reflect expenses or sales charges, which would result in lower returns.5 The Lipper Science & Technology Index consists of the 30 largest funds in the Lipper peer category that invest primarily in the equity securities of domestic companies engaged in sci-
ence and technology.The expense ratios of the fund, both net (including any fee waivers or expense limitations) and gross (excluding any fee waivers or expense limitations), are set forth according to themost recent publicly available prospectus for the fund and may differ from the expense ratios disclosed in the financial highlights tables in this report. For Class NAV shares, the netexpenses equal the gross expenses and are 1.07%.
Sector Composition* % of TotalInformation technology 70.8Consumer discretionary 13.2Health care 5.3Industrials 2.1Telecommunication services 0.4Real estate 0.2Short-term investments and other 8.0
* As a percentage of net assets.
8/17$8,000
$10,000
$12,000
$14,000
$16,000
$18,000
$20,000
$22,000
$24,000$22,620
$21,195
$17,893
Science & Technology Fund Class NAVS&P 500 IndexLipper Science & Technology Index
8/168/158/148/132/13
Science & Technology FundSubadvisors: T. Rowe Price Associates Inc. and Allianz Global Investors U.S., LLCPortfolio Managers: Ken Allen (T. Rowe), Huachen Chen (Allianz), Walter C. Price (Allianz)
28
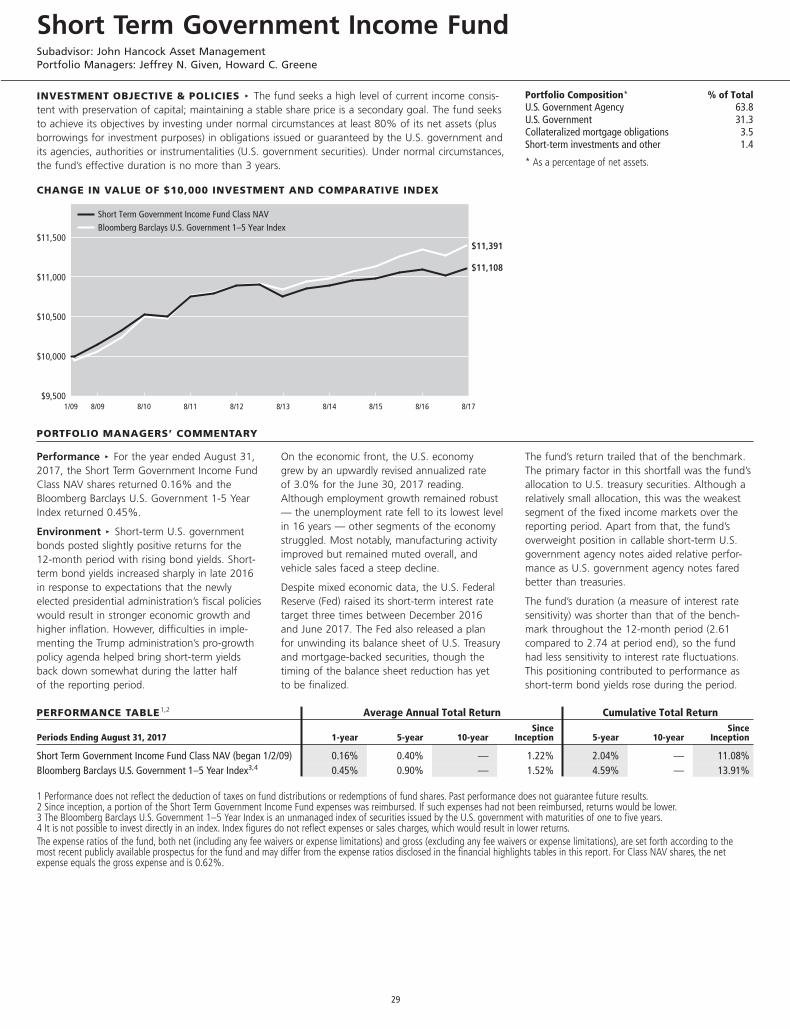
INVESTMENT OBJECTIVE & POLICIES c The fund seeks a high level of current income consis-tent with preservation of capital; maintaining a stable share price is a secondary goal. The fund seeksto achieve its objectives by investing under normal circumstances at least 80% of its net assets (plusborrowings for investment purposes) in obligations issued or guaranteed by the U.S. government andits agencies, authorities or instrumentalities (U.S. government securities). Under normal circumstances,the fund’s effective duration is no more than 3 years.
CHANGE IN VALUE OF $10,000 INVESTMENT AND COMPARATIVE INDEX
PORTFOLIO MANAGERS’ COMMENTARY
Performance c For the year ended August 31,2017, the Short Term Government Income FundClass NAV shares returned 0.16% and theBloomberg Barclays U.S. Government 1-5 YearIndex returned 0.45%.
Environment c Short-term U.S. governmentbonds posted slightly positive returns for the12-month period with rising bond yields. Short-term bond yields increased sharply in late 2016in response to expectations that the newlyelected presidential administration’s fiscal policieswould result in stronger economic growth andhigher inflation. However, difficulties in imple-menting the Trump administration’s pro-growthpolicy agenda helped bring short-term yieldsback down somewhat during the latter halfof the reporting period.
On the economic front, the U.S. economygrew by an upwardly revised annualized rateof 3.0% for the June 30, 2017 reading.Although employment growth remained robust— the unemployment rate fell to its lowest levelin 16 years — other segments of the economystruggled. Most notably, manufacturing activityimproved but remained muted overall, andvehicle sales faced a steep decline.
Despite mixed economic data, the U.S. FederalReserve (Fed) raised its short-term interest ratetarget three times between December 2016and June 2017. The Fed also released a planfor unwinding its balance sheet of U.S. Treasuryand mortgage-backed securities, though thetiming of the balance sheet reduction has yetto be finalized.
The fund’s return trailed that of the benchmark.The primary factor in this shortfall was the fund’sallocation to U.S. treasury securities. Although arelatively small allocation, this was the weakestsegment of the fixed income markets over thereporting period. Apart from that, the fund’soverweight position in callable short-term U.S.government agency notes aided relative perfor-mance as U.S. government agency notes faredbetter than treasuries.
The fund’s duration (a measure of interest ratesensitivity) was shorter than that of the bench-mark throughout the 12-month period (2.61compared to 2.74 at period end), so the fundhad less sensitivity to interest rate fluctuations.This positioning contributed to performance asshort-term bond yields rose during the period.
PERFORMANCE TABLE1,2 Average Annual Total Return Cumulative Total Return
Periods Ending August 31, 2017 1-year 5-year 10-yearSince
Inception 5-year 10-yearSince
Inception
Short Term Government Income Fund Class NAV (began 1/2/09) 0.16% 0.40% — 1.22% 2.04% — 11.08%Bloomberg Barclays U.S. Government 1–5 Year Index3,4 0.45% 0.90% — 1.52% 4.59% — 13.91%
1 Performance does not reflect the deduction of taxes on fund distributions or redemptions of fund shares. Past performance does not guarantee future results.2 Since inception, a portion of the Short Term Government Income Fund expenses was reimbursed. If such expenses had not been reimbursed, returns would be lower.3 The Bloomberg Barclays U.S. Government 1–5 Year Index is an unmanaged index of securities issued by the U.S. government with maturities of one to five years.4 It is not possible to invest directly in an index. Index figures do not reflect expenses or sales charges, which would result in lower returns.The expense ratios of the fund, both net (including any fee waivers or expense limitations) and gross (excluding any fee waivers or expense limitations), are set forth according to themost recent publicly available prospectus for the fund and may differ from the expense ratios disclosed in the financial highlights tables in this report. For Class NAV shares, the netexpense equals the gross expense and is 0.62%.
Portfolio Composition* % of TotalU.S. Government Agency 63.8U.S. Government 31.3Collateralized mortgage obligations 3.5Short-term investments and other 1.4
* As a percentage of net assets.
8/178/168/158/148/138/128/118/108/091/09$9,500
$10,000
$10,500
$11,000
$11,500
$11,108
$11,391
Short Term Government Income Fund Class NAVBloomberg Barclays U.S. Government 1–5 Year Index
Short Term Government Income FundSubadvisor: John Hancock Asset ManagementPortfolio Managers: Jeffrey N. Given, Howard C. Greene
29
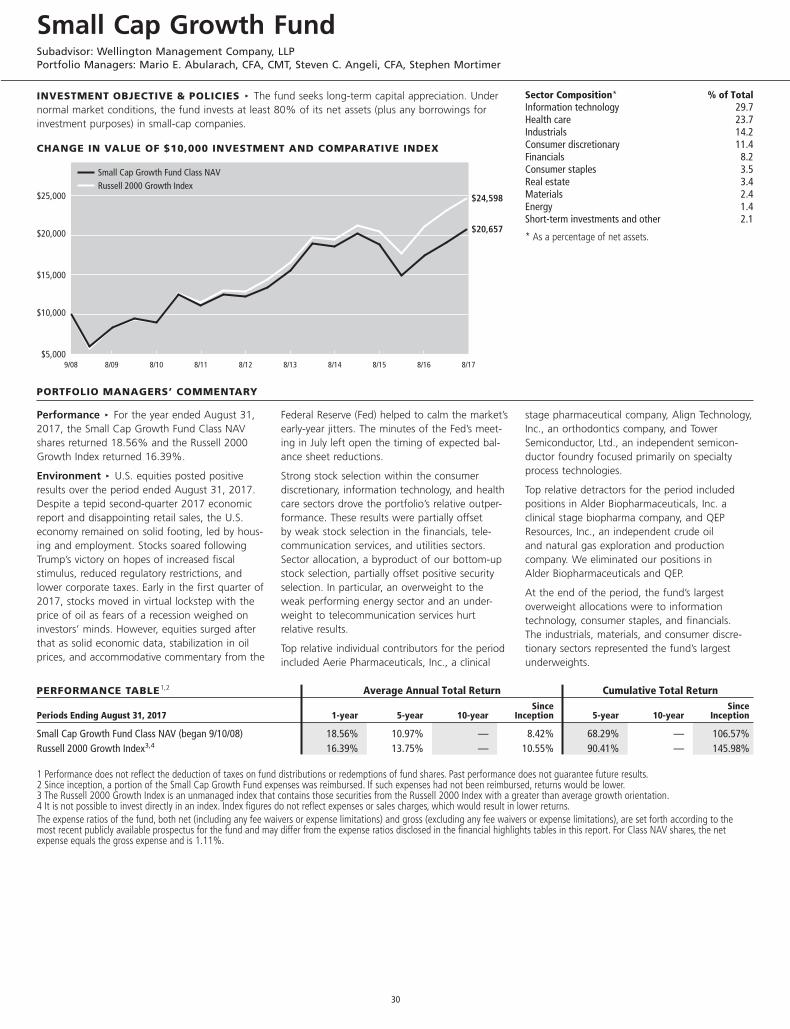
INVESTMENT OBJECTIVE & POLICIES c The fund seeks long-term capital appreciation. Undernormal market conditions, the fund invests at least 80% of its net assets (plus any borrowings forinvestment purposes) in small-cap companies.
CHANGE IN VALUE OF $10,000 INVESTMENT AND COMPARATIVE INDEX
PORTFOLIO MANAGERS’ COMMENTARY
Performance c For the year ended August 31,2017, the Small Cap Growth Fund Class NAVshares returned 18.56% and the Russell 2000Growth Index returned 16.39%.
Environment c U.S. equities posted positiveresults over the period ended August 31, 2017.Despite a tepid second-quarter 2017 economicreport and disappointing retail sales, the U.S.economy remained on solid footing, led by hous-ing and employment. Stocks soared followingTrump’s victory on hopes of increased fiscalstimulus, reduced regulatory restrictions, andlower corporate taxes. Early in the first quarter of2017, stocks moved in virtual lockstep with theprice of oil as fears of a recession weighed oninvestors’ minds. However, equities surged afterthat as solid economic data, stabilization in oilprices, and accommodative commentary from the
Federal Reserve (Fed) helped to calm the market’searly-year jitters. The minutes of the Fed’s meet-ing in July left open the timing of expected bal-ance sheet reductions.
Strong stock selection within the consumerdiscretionary, information technology, and healthcare sectors drove the portfolio’s relative outper-formance. These results were partially offsetby weak stock selection in the financials, tele-communication services, and utilities sectors.Sector allocation, a byproduct of our bottom-upstock selection, partially offset positive securityselection. In particular, an overweight to theweak performing energy sector and an under-weight to telecommunication services hurtrelative results.
Top relative individual contributors for the periodincluded Aerie Pharmaceuticals, Inc., a clinical
stage pharmaceutical company, Align Technology,Inc., an orthodontics company, and TowerSemiconductor, Ltd., an independent semicon-ductor foundry focused primarily on specialtyprocess technologies.
Top relative detractors for the period includedpositions in Alder Biopharmaceuticals, Inc. aclinical stage biopharma company, and QEPResources, Inc., an independent crude oiland natural gas exploration and productioncompany. We eliminated our positions inAlder Biopharmaceuticals and QEP.
At the end of the period, the fund’s largestoverweight allocations were to informationtechnology, consumer staples, and financials.The industrials, materials, and consumer discre-tionary sectors represented the fund’s largestunderweights.
PERFORMANCE TABLE1,2 Average Annual Total Return Cumulative Total Return
Periods Ending August 31, 2017 1-year 5-year 10-yearSince
Inception 5-year 10-yearSince
Inception
Small Cap Growth Fund Class NAV (began 9/10/08) 18.56% 10.97% — 8.42% 68.29% — 106.57%Russell 2000 Growth Index3,4 16.39% 13.75% — 10.55% 90.41% — 145.98%
1 Performance does not reflect the deduction of taxes on fund distributions or redemptions of fund shares. Past performance does not guarantee future results.2 Since inception, a portion of the Small Cap Growth Fund expenses was reimbursed. If such expenses had not been reimbursed, returns would be lower.3 The Russell 2000 Growth Index is an unmanaged index that contains those securities from the Russell 2000 Index with a greater than average growth orientation.4 It is not possible to invest directly in an index. Index figures do not reflect expenses or sales charges, which would result in lower returns.The expense ratios of the fund, both net (including any fee waivers or expense limitations) and gross (excluding any fee waivers or expense limitations), are set forth according to themost recent publicly available prospectus for the fund and may differ from the expense ratios disclosed in the financial highlights tables in this report. For Class NAV shares, the netexpense equals the gross expense and is 1.11%.
Sector Composition* % of TotalInformation technology 29.7Health care 23.7Industrials 14.2Consumer discretionary 11.4Financials 8.2Consumer staples 3.5Real estate 3.4Materials 2.4Energy 1.4Short-term investments and other 2.1
* As a percentage of net assets.
8/178/168/158/148/138/128/118/108/099/08$5,000
$10,000
$15,000
$20,000
$25,000
$20,657
$24,598
Small Cap Growth Fund Class NAVRussell 2000 Growth Index
Small Cap Growth FundSubadvisor: Wellington Management Company, LLPPortfolio Managers: Mario E. Abularach, CFA, CMT, Steven C. Angeli, CFA, Stephen Mortimer
30
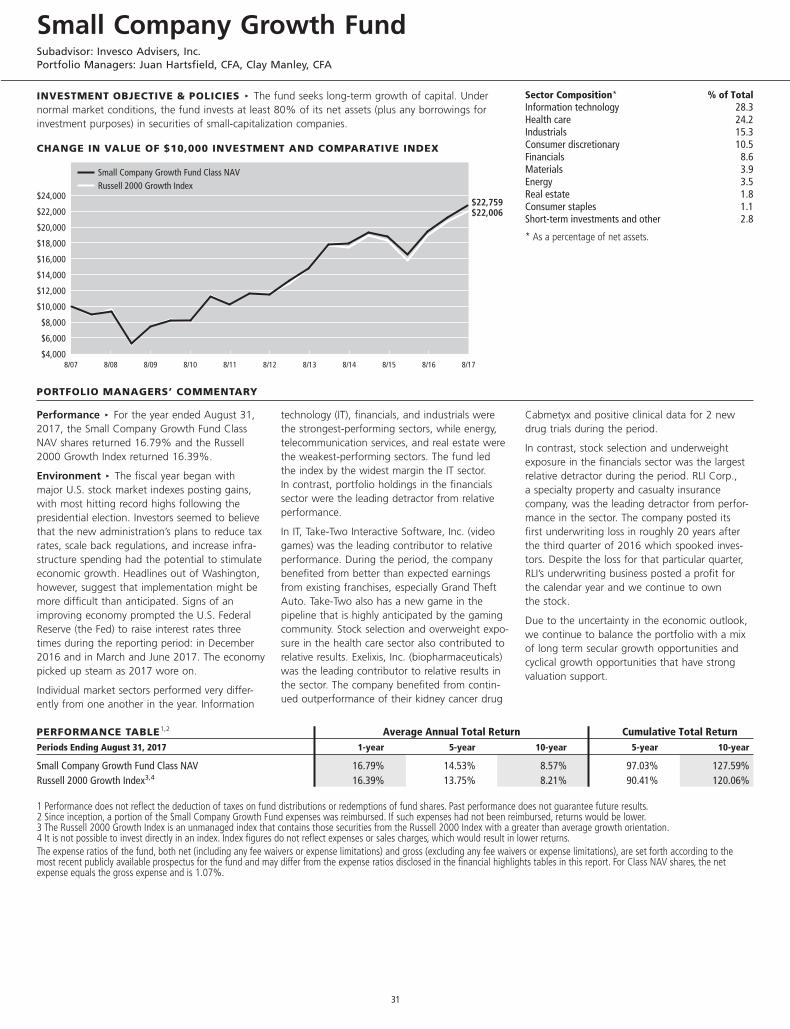
INVESTMENT OBJECTIVE & POLICIES c The fund seeks long-term growth of capital. Undernormal market conditions, the fund invests at least 80% of its net assets (plus any borrowings forinvestment purposes) in securities of small-capitalization companies.
CHANGE IN VALUE OF $10,000 INVESTMENT AND COMPARATIVE INDEX
PORTFOLIO MANAGERS’ COMMENTARY
Performance c For the year ended August 31,2017, the Small Company Growth Fund ClassNAV shares returned 16.79% and the Russell2000 Growth Index returned 16.39%.
Environment c The fiscal year began withmajor U.S. stock market indexes posting gains,with most hitting record highs following thepresidential election. Investors seemed to believethat the new administration’s plans to reduce taxrates, scale back regulations, and increase infra-structure spending had the potential to stimulateeconomic growth. Headlines out of Washington,however, suggest that implementation might bemore difficult than anticipated. Signs of animproving economy prompted the U.S. FederalReserve (the Fed) to raise interest rates threetimes during the reporting period: in December2016 and in March and June 2017. The economypicked up steam as 2017 wore on.
Individual market sectors performed very differ-ently from one another in the year. Information
technology (IT), financials, and industrials werethe strongest-performing sectors, while energy,telecommunication services, and real estate werethe weakest-performing sectors. The fund ledthe index by the widest margin the IT sector.In contrast, portfolio holdings in the financialssector were the leading detractor from relativeperformance.
In IT, Take-Two Interactive Software, Inc. (videogames) was the leading contributor to relativeperformance. During the period, the companybenefited from better than expected earningsfrom existing franchises, especially Grand TheftAuto. Take-Two also has a new game in thepipeline that is highly anticipated by the gamingcommunity. Stock selection and overweight expo-sure in the health care sector also contributed torelative results. Exelixis, Inc. (biopharmaceuticals)was the leading contributor to relative results inthe sector. The company benefited from contin-ued outperformance of their kidney cancer drug
Cabmetyx and positive clinical data for 2 newdrug trials during the period.
In contrast, stock selection and underweightexposure in the financials sector was the largestrelative detractor during the period. RLI Corp.,a specialty property and casualty insurancecompany, was the leading detractor from perfor-mance in the sector. The company posted itsfirst underwriting loss in roughly 20 years afterthe third quarter of 2016 which spooked inves-tors. Despite the loss for that particular quarter,RLI’s underwriting business posted a profit forthe calendar year and we continue to ownthe stock.
Due to the uncertainty in the economic outlook,we continue to balance the portfolio with a mixof long term secular growth opportunities andcyclical growth opportunities that have strongvaluation support.
PERFORMANCE TABLE1,2 Average Annual Total Return Cumulative Total ReturnPeriods Ending August 31, 2017 1-year 5-year 10-year 5-year 10-year
Small Company Growth Fund Class NAV 16.79% 14.53% 8.57% 97.03% 127.59%Russell 2000 Growth Index3,4 16.39% 13.75% 8.21% 90.41% 120.06%
1 Performance does not reflect the deduction of taxes on fund distributions or redemptions of fund shares. Past performance does not guarantee future results.2 Since inception, a portion of the Small Company Growth Fund expenses was reimbursed. If such expenses had not been reimbursed, returns would be lower.3 The Russell 2000 Growth Index is an unmanaged index that contains those securities from the Russell 2000 Index with a greater than average growth orientation.4 It is not possible to invest directly in an index. Index figures do not reflect expenses or sales charges, which would result in lower returns.The expense ratios of the fund, both net (including any fee waivers or expense limitations) and gross (excluding any fee waivers or expense limitations), are set forth according to themost recent publicly available prospectus for the fund and may differ from the expense ratios disclosed in the financial highlights tables in this report. For Class NAV shares, the netexpense equals the gross expense and is 1.07%.
Sector Composition* % of TotalInformation technology 28.3Health care 24.2Industrials 15.3Consumer discretionary 10.5Financials 8.6Materials 3.9Energy 3.5Real estate 1.8Consumer staples 1.1Short-term investments and other 2.8
* As a percentage of net assets.
$4,000
$6,000
$8,000
$10,000
$12,000
$14,000
$16,000
$18,000
$20,000
$22,000
$24,000
$22,006$22,759
Small Company Growth Fund Class NAVRussell 2000 Growth Index
8/178/168/158/148/138/128/118/108/098/088/07
Small Company Growth FundSubadvisor: Invesco Advisers, Inc.Portfolio Managers: Juan Hartsfield, CFA, Clay Manley, CFA
31
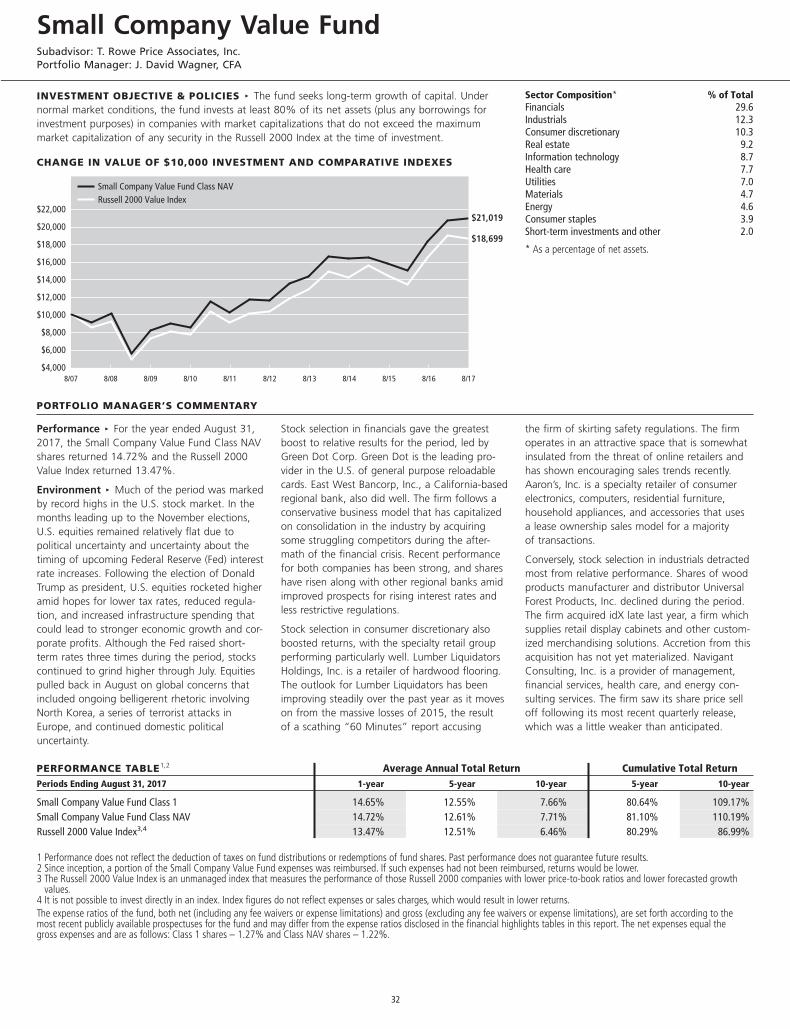
INVESTMENT OBJECTIVE & POLICIES c The fund seeks long-term growth of capital. Undernormal market conditions, the fund invests at least 80% of its net assets (plus any borrowings forinvestment purposes) in companies with market capitalizations that do not exceed the maximummarket capitalization of any security in the Russell 2000 Index at the time of investment.
CHANGE IN VALUE OF $10,000 INVESTMENT AND COMPARATIVE INDEXES
PORTFOLIO MANAGER’S COMMENTARY
Performance c For the year ended August 31,2017, the Small Company Value Fund Class NAVshares returned 14.72% and the Russell 2000Value Index returned 13.47%.
Environment c Much of the period was markedby record highs in the U.S. stock market. In themonths leading up to the November elections,U.S. equities remained relatively flat due topolitical uncertainty and uncertainty about thetiming of upcoming Federal Reserve (Fed) interestrate increases. Following the election of DonaldTrump as president, U.S. equities rocketed higheramid hopes for lower tax rates, reduced regula-tion, and increased infrastructure spending thatcould lead to stronger economic growth and cor-porate profits. Although the Fed raised short-term rates three times during the period, stockscontinued to grind higher through July. Equitiespulled back in August on global concerns thatincluded ongoing belligerent rhetoric involvingNorth Korea, a series of terrorist attacks inEurope, and continued domestic politicaluncertainty.
Stock selection in financials gave the greatestboost to relative results for the period, led byGreen Dot Corp. Green Dot is the leading pro-vider in the U.S. of general purpose reloadablecards. East West Bancorp, Inc., a California-basedregional bank, also did well. The firm follows aconservative business model that has capitalizedon consolidation in the industry by acquiringsome struggling competitors during the after-math of the financial crisis. Recent performancefor both companies has been strong, and shareshave risen along with other regional banks amidimproved prospects for rising interest rates andless restrictive regulations.
Stock selection in consumer discretionary alsoboosted returns, with the specialty retail groupperforming particularly well. Lumber LiquidatorsHoldings, Inc. is a retailer of hardwood flooring.The outlook for Lumber Liquidators has beenimproving steadily over the past year as it moveson from the massive losses of 2015, the resultof a scathing “60 Minutes” report accusing
the firm of skirting safety regulations. The firmoperates in an attractive space that is somewhatinsulated from the threat of online retailers andhas shown encouraging sales trends recently.Aaron’s, Inc. is a specialty retailer of consumerelectronics, computers, residential furniture,household appliances, and accessories that usesa lease ownership sales model for a majorityof transactions.
Conversely, stock selection in industrials detractedmost from relative performance. Shares of woodproducts manufacturer and distributor UniversalForest Products, Inc. declined during the period.The firm acquired idX late last year, a firm whichsupplies retail display cabinets and other custom-ized merchandising solutions. Accretion from thisacquisition has not yet materialized. NavigantConsulting, Inc. is a provider of management,financial services, health care, and energy con-sulting services. The firm saw its share price selloff following its most recent quarterly release,which was a little weaker than anticipated.
PERFORMANCE TABLE1,2 Average Annual Total Return Cumulative Total ReturnPeriods Ending August 31, 2017 1-year 5-year 10-year 5-year 10-year
Small Company Value Fund Class 1 14.65% 12.55% 7.66% 80.64% 109.17%Small Company Value Fund Class NAV 14.72% 12.61% 7.71% 81.10% 110.19%Russell 2000 Value Index3,4 13.47% 12.51% 6.46% 80.29% 86.99%
1 Performance does not reflect the deduction of taxes on fund distributions or redemptions of fund shares. Past performance does not guarantee future results.2 Since inception, a portion of the Small Company Value Fund expenses was reimbursed. If such expenses had not been reimbursed, returns would be lower.3 The Russell 2000 Value Index is an unmanaged index that measures the performance of those Russell 2000 companies with lower price-to-book ratios and lower forecasted growth
values.4 It is not possible to invest directly in an index. Index figures do not reflect expenses or sales charges, which would result in lower returns.The expense ratios of the fund, both net (including any fee waivers or expense limitations) and gross (excluding any fee waivers or expense limitations), are set forth according to themost recent publicly available prospectuses for the fund and may differ from the expense ratios disclosed in the financial highlights tables in this report. The net expenses equal thegross expenses and are as follows: Class 1 shares – 1.27% and Class NAV shares – 1.22%.
Sector Composition* % of TotalFinancials 29.6Industrials 12.3Consumer discretionary 10.3Real estate 9.2Information technology 8.7Health care 7.7Utilities 7.0Materials 4.7Energy 4.6Consumer staples 3.9Short-term investments and other 2.0
* As a percentage of net assets.
$4,000
$6,000
$8,000
$10,000
$12,000
$14,000
$16,000
$18,000
$20,000
$22,000
$18,699
$21,019
Small Company Value Fund Class NAVRussell 2000 Value Index
8/178/168/158/148/138/128/118/108/098/088/07
Small Company Value FundSubadvisor: T. Rowe Price Associates, Inc.Portfolio Manager: J. David Wagner, CFA
32
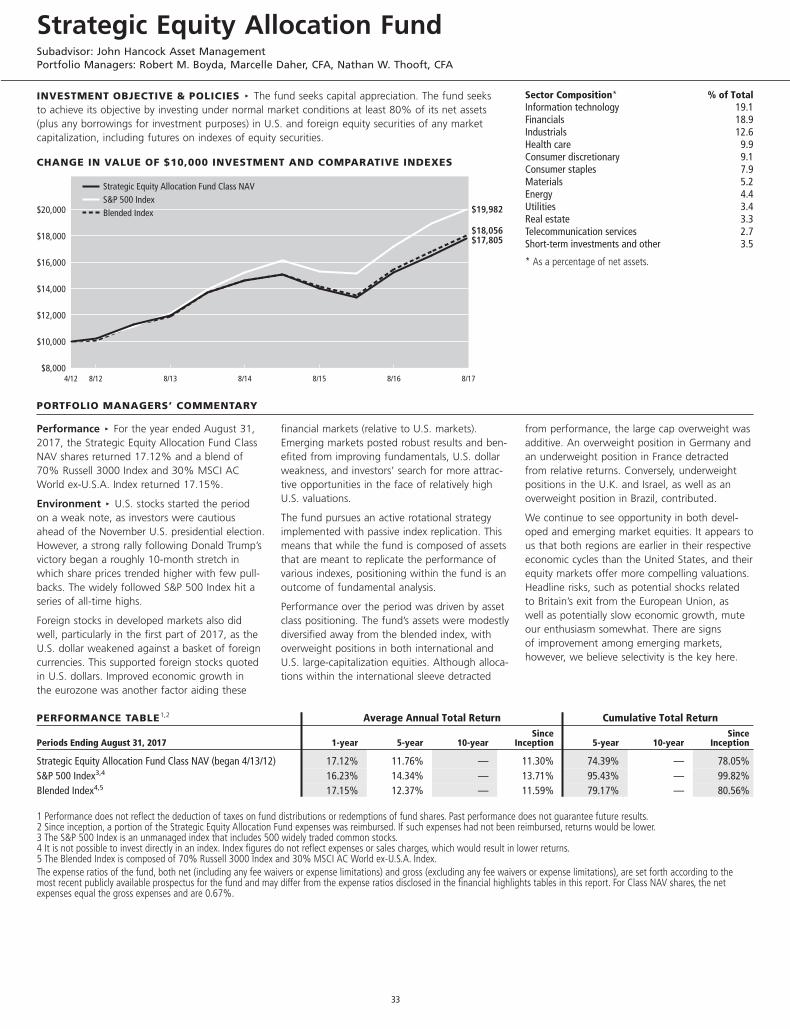
INVESTMENT OBJECTIVE & POLICIES c The fund seeks capital appreciation. The fund seeksto achieve its objective by investing under normal market conditions at least 80% of its net assets(plus any borrowings for investment purposes) in U.S. and foreign equity securities of any marketcapitalization, including futures on indexes of equity securities.
CHANGE IN VALUE OF $10,000 INVESTMENT AND COMPARATIVE INDEXES
PORTFOLIO MANAGERS’ COMMENTARY
Performance c For the year ended August 31,2017, the Strategic Equity Allocation Fund ClassNAV shares returned 17.12% and a blend of70% Russell 3000 Index and 30% MSCI ACWorld ex-U.S.A. Index returned 17.15%.
Environment c U.S. stocks started the periodon a weak note, as investors were cautiousahead of the November U.S. presidential election.However, a strong rally following Donald Trump’svictory began a roughly 10-month stretch inwhich share prices trended higher with few pull-backs. The widely followed S&P 500 Index hit aseries of all-time highs.
Foreign stocks in developed markets also didwell, particularly in the first part of 2017, as theU.S. dollar weakened against a basket of foreigncurrencies. This supported foreign stocks quotedin U.S. dollars. Improved economic growth inthe eurozone was another factor aiding these
financial markets (relative to U.S. markets).Emerging markets posted robust results and ben-efited from improving fundamentals, U.S. dollarweakness, and investors’ search for more attrac-tive opportunities in the face of relatively highU.S. valuations.
The fund pursues an active rotational strategyimplemented with passive index replication. Thismeans that while the fund is composed of assetsthat are meant to replicate the performance ofvarious indexes, positioning within the fund is anoutcome of fundamental analysis.
Performance over the period was driven by assetclass positioning. The fund’s assets were modestlydiversified away from the blended index, withoverweight positions in both international andU.S. large-capitalization equities. Although alloca-tions within the international sleeve detracted
from performance, the large cap overweight wasadditive. An overweight position in Germany andan underweight position in France detractedfrom relative returns. Conversely, underweightpositions in the U.K. and Israel, as well as anoverweight position in Brazil, contributed.
We continue to see opportunity in both devel-oped and emerging market equities. It appears tous that both regions are earlier in their respectiveeconomic cycles than the United States, and theirequity markets offer more compelling valuations.Headline risks, such as potential shocks relatedto Britain’s exit from the European Union, aswell as potentially slow economic growth, muteour enthusiasm somewhat. There are signsof improvement among emerging markets,however, we believe selectivity is the key here.
PERFORMANCE TABLE1,2 Average Annual Total Return Cumulative Total Return
Periods Ending August 31, 2017 1-year 5-year 10-yearSince
Inception 5-year 10-yearSince
Inception
Strategic Equity Allocation Fund Class NAV (began 4/13/12) 17.12% 11.76% — 11.30% 74.39% — 78.05%S&P 500 Index3,4 16.23% 14.34% — 13.71% 95.43% — 99.82%Blended Index4,5 17.15% 12.37% — 11.59% 79.17% — 80.56%
1 Performance does not reflect the deduction of taxes on fund distributions or redemptions of fund shares. Past performance does not guarantee future results.2 Since inception, a portion of the Strategic Equity Allocation Fund expenses was reimbursed. If such expenses had not been reimbursed, returns would be lower.3 The S&P 500 Index is an unmanaged index that includes 500 widely traded common stocks.4 It is not possible to invest directly in an index. Index figures do not reflect expenses or sales charges, which would result in lower returns.5 The Blended Index is composed of 70% Russell 3000 Index and 30% MSCI AC World ex-U.S.A. Index.The expense ratios of the fund, both net (including any fee waivers or expense limitations) and gross (excluding any fee waivers or expense limitations), are set forth according to themost recent publicly available prospectus for the fund and may differ from the expense ratios disclosed in the financial highlights tables in this report. For Class NAV shares, the netexpenses equal the gross expenses and are 0.67%.
Sector Composition* % of TotalInformation technology 19.1Financials 18.9Industrials 12.6Health care 9.9Consumer discretionary 9.1Consumer staples 7.9Materials 5.2Energy 4.4Utilities 3.4Real estate 3.3Telecommunication services 2.7Short-term investments and other 3.5
* As a percentage of net assets.
8/17$8,000
$10,000
$12,000
$14,000
$16,000
$18,000
$20,000
$18,056$17,805
$19,982
Strategic Equity Allocation Fund Class NAVS&P 500 IndexBlended Index
8/168/158/148/138/124/12
Strategic Equity Allocation FundSubadvisor: John Hancock Asset ManagementPortfolio Managers: Robert M. Boyda, Marcelle Daher, CFA, Nathan W. Thooft, CFA
33
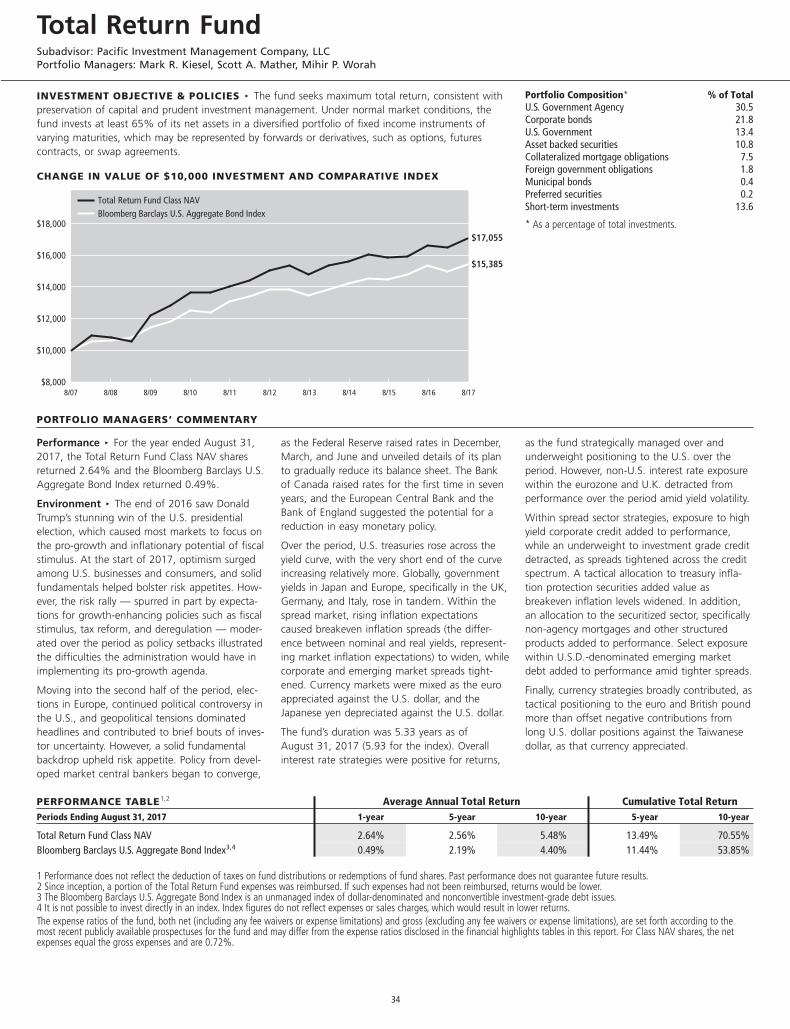
INVESTMENT OBJECTIVE & POLICIES c The fund seeks maximum total return, consistent withpreservation of capital and prudent investment management. Under normal market conditions, thefund invests at least 65% of its net assets in a diversified portfolio of fixed income instruments ofvarying maturities, which may be represented by forwards or derivatives, such as options, futurescontracts, or swap agreements.
CHANGE IN VALUE OF $10,000 INVESTMENT AND COMPARATIVE INDEX
PORTFOLIO MANAGERS’ COMMENTARY
Performance c For the year ended August 31,2017, the Total Return Fund Class NAV sharesreturned 2.64% and the Bloomberg Barclays U.S.Aggregate Bond Index returned 0.49%.
Environment c The end of 2016 saw DonaldTrump’s stunning win of the U.S. presidentialelection, which caused most markets to focus onthe pro-growth and inflationary potential of fiscalstimulus. At the start of 2017, optimism surgedamong U.S. businesses and consumers, and solidfundamentals helped bolster risk appetites. How-ever, the risk rally — spurred in part by expecta-tions for growth-enhancing policies such as fiscalstimulus, tax reform, and deregulation — moder-ated over the period as policy setbacks illustratedthe difficulties the administration would have inimplementing its pro-growth agenda.
Moving into the second half of the period, elec-tions in Europe, continued political controversy inthe U.S., and geopolitical tensions dominatedheadlines and contributed to brief bouts of inves-tor uncertainty. However, a solid fundamentalbackdrop upheld risk appetite. Policy from devel-oped market central bankers began to converge,
as the Federal Reserve raised rates in December,March, and June and unveiled details of its planto gradually reduce its balance sheet. The Bankof Canada raised rates for the first time in sevenyears, and the European Central Bank and theBank of England suggested the potential for areduction in easy monetary policy.
Over the period, U.S. treasuries rose across theyield curve, with the very short end of the curveincreasing relatively more. Globally, governmentyields in Japan and Europe, specifically in the UK,Germany, and Italy, rose in tandem. Within thespread market, rising inflation expectationscaused breakeven inflation spreads (the differ-ence between nominal and real yields, represent-ing market inflation expectations) to widen, whilecorporate and emerging market spreads tight-ened. Currency markets were mixed as the euroappreciated against the U.S. dollar, and theJapanese yen depreciated against the U.S. dollar.
The fund’s duration was 5.33 years as ofAugust 31, 2017 (5.93 for the index). Overallinterest rate strategies were positive for returns,
as the fund strategically managed over andunderweight positioning to the U.S. over theperiod. However, non-U.S. interest rate exposurewithin the eurozone and U.K. detracted fromperformance over the period amid yield volatility.
Within spread sector strategies, exposure to highyield corporate credit added to performance,while an underweight to investment grade creditdetracted, as spreads tightened across the creditspectrum. A tactical allocation to treasury infla-tion protection securities added value asbreakeven inflation levels widened. In addition,an allocation to the securitized sector, specificallynon-agency mortgages and other structuredproducts added to performance. Select exposurewithin U.S.D.-denominated emerging marketdebt added to performance amid tighter spreads.
Finally, currency strategies broadly contributed, astactical positioning to the euro and British poundmore than offset negative contributions fromlong U.S. dollar positions against the Taiwanesedollar, as that currency appreciated.
PERFORMANCE TABLE1,2 Average Annual Total Return Cumulative Total ReturnPeriods Ending August 31, 2017 1-year 5-year 10-year 5-year 10-year
Total Return Fund Class NAV 2.64% 2.56% 5.48% 13.49% 70.55%Bloomberg Barclays U.S. Aggregate Bond Index3,4 0.49% 2.19% 4.40% 11.44% 53.85%
1 Performance does not reflect the deduction of taxes on fund distributions or redemptions of fund shares. Past performance does not guarantee future results.2 Since inception, a portion of the Total Return Fund expenses was reimbursed. If such expenses had not been reimbursed, returns would be lower.3 The Bloomberg Barclays U.S. Aggregate Bond Index is an unmanaged index of dollar-denominated and nonconvertible investment-grade debt issues.4 It is not possible to invest directly in an index. Index figures do not reflect expenses or sales charges, which would result in lower returns.The expense ratios of the fund, both net (including any fee waivers or expense limitations) and gross (excluding any fee waivers or expense limitations), are set forth according to themost recent publicly available prospectuses for the fund and may differ from the expense ratios disclosed in the financial highlights tables in this report. For Class NAV shares, the netexpenses equal the gross expenses and are 0.72%.
Portfolio Composition* % of TotalU.S. Government Agency 30.5Corporate bonds 21.8U.S. Government 13.4Asset backed securities 10.8Collateralized mortgage obligations 7.5Foreign government obligations 1.8Municipal bonds 0.4Preferred securities 0.2Short-term investments 13.6
* As a percentage of total investments.
$8,000
$10,000
$12,000
$14,000
$16,000
$18,000
$15,385
$17,055
Total Return Fund Class NAVBloomberg Barclays U.S. Aggregate Bond Index
8/178/168/158/148/138/128/118/108/098/088/07
Total Return FundSubadvisor: Pacific Investment Management Company, LLCPortfolio Managers: Mark R. Kiesel, Scott A. Mather, Mihir P. Worah
34
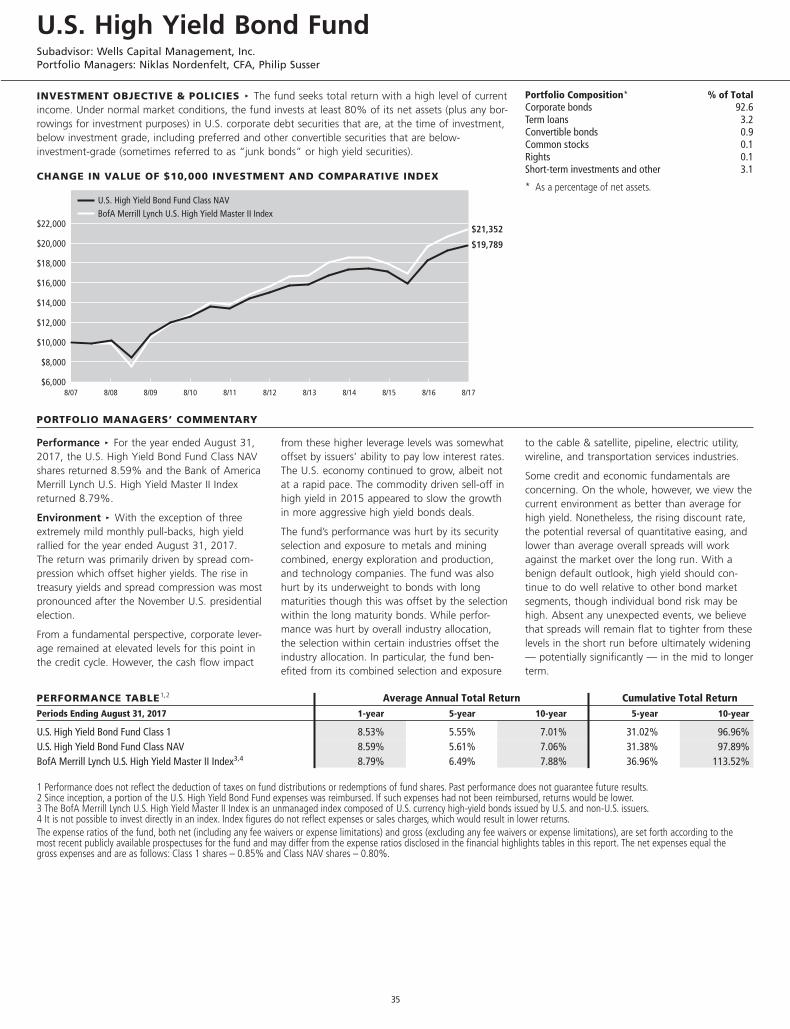
INVESTMENT OBJECTIVE & POLICIES c The fund seeks total return with a high level of currentincome. Under normal market conditions, the fund invests at least 80% of its net assets (plus any bor-rowings for investment purposes) in U.S. corporate debt securities that are, at the time of investment,below investment grade, including preferred and other convertible securities that are below-investment-grade (sometimes referred to as “junk bonds” or high yield securities).
CHANGE IN VALUE OF $10,000 INVESTMENT AND COMPARATIVE INDEX
PORTFOLIO MANAGERS’ COMMENTARY
Performance c For the year ended August 31,2017, the U.S. High Yield Bond Fund Class NAVshares returned 8.59% and the Bank of AmericaMerrill Lynch U.S. High Yield Master II Indexreturned 8.79%.
Environment c With the exception of threeextremely mild monthly pull-backs, high yieldrallied for the year ended August 31, 2017.The return was primarily driven by spread com-pression which offset higher yields. The rise intreasury yields and spread compression was mostpronounced after the November U.S. presidentialelection.
From a fundamental perspective, corporate lever-age remained at elevated levels for this point inthe credit cycle. However, the cash flow impact
from these higher leverage levels was somewhatoffset by issuers’ ability to pay low interest rates.The U.S. economy continued to grow, albeit notat a rapid pace. The commodity driven sell-off inhigh yield in 2015 appeared to slow the growthin more aggressive high yield bonds deals.
The fund’s performance was hurt by its securityselection and exposure to metals and miningcombined, energy exploration and production,and technology companies. The fund was alsohurt by its underweight to bonds with longmaturities though this was offset by the selectionwithin the long maturity bonds. While perfor-mance was hurt by overall industry allocation,the selection within certain industries offset theindustry allocation. In particular, the fund ben-efited from its combined selection and exposure
to the cable & satellite, pipeline, electric utility,wireline, and transportation services industries.
Some credit and economic fundamentals areconcerning. On the whole, however, we view thecurrent environment as better than average forhigh yield. Nonetheless, the rising discount rate,the potential reversal of quantitative easing, andlower than average overall spreads will workagainst the market over the long run. With abenign default outlook, high yield should con-tinue to do well relative to other bond marketsegments, though individual bond risk may behigh. Absent any unexpected events, we believethat spreads will remain flat to tighter from theselevels in the short run before ultimately widening— potentially significantly — in the mid to longerterm.
PERFORMANCE TABLE1,2 Average Annual Total Return Cumulative Total ReturnPeriods Ending August 31, 2017 1-year 5-year 10-year 5-year 10-year
U.S. High Yield Bond Fund Class 1 8.53% 5.55% 7.01% 31.02% 96.96%U.S. High Yield Bond Fund Class NAV 8.59% 5.61% 7.06% 31.38% 97.89%BofA Merrill Lynch U.S. High Yield Master II Index3,4 8.79% 6.49% 7.88% 36.96% 113.52%
1 Performance does not reflect the deduction of taxes on fund distributions or redemptions of fund shares. Past performance does not guarantee future results.2 Since inception, a portion of the U.S. High Yield Bond Fund expenses was reimbursed. If such expenses had not been reimbursed, returns would be lower.3 The BofA Merrill Lynch U.S. High Yield Master II Index is an unmanaged index composed of U.S. currency high-yield bonds issued by U.S. and non-U.S. issuers.4 It is not possible to invest directly in an index. Index figures do not reflect expenses or sales charges, which would result in lower returns.The expense ratios of the fund, both net (including any fee waivers or expense limitations) and gross (excluding any fee waivers or expense limitations), are set forth according to themost recent publicly available prospectuses for the fund and may differ from the expense ratios disclosed in the financial highlights tables in this report. The net expenses equal thegross expenses and are as follows: Class 1 shares – 0.85% and Class NAV shares – 0.80%.
Portfolio Composition* % of TotalCorporate bonds 92.6Term loans 3.2Convertible bonds 0.9Common stocks 0.1Rights 0.1Short-term investments and other 3.1
* As a percentage of net assets.
$6,000
$8,000
$10,000
$12,000
$14,000
$16,000
$18,000
$20,000
$22,000
$19,789
$21,352
U.S. High Yield Bond Fund Class NAVBofA Merrill Lynch U.S. High Yield Master II Index
8/178/168/158/148/138/128/118/108/098/088/07
U.S. High Yield Bond FundSubadvisor: Wells Capital Management, Inc.Portfolio Managers: Niklas Nordenfelt, CFA, Philip Susser
35
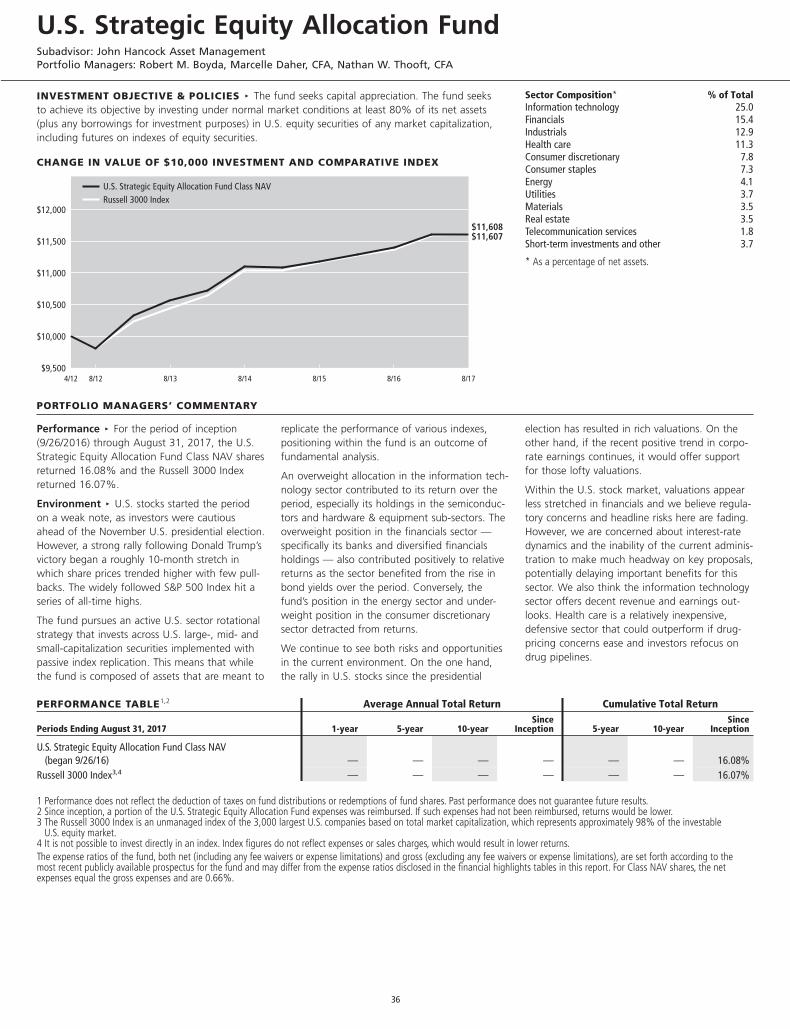
INVESTMENT OBJECTIVE & POLICIES c The fund seeks capital appreciation. The fund seeksto achieve its objective by investing under normal market conditions at least 80% of its net assets(plus any borrowings for investment purposes) in U.S. equity securities of any market capitalization,including futures on indexes of equity securities.
CHANGE IN VALUE OF $10,000 INVESTMENT AND COMPARATIVE INDEX
PORTFOLIO MANAGERS’ COMMENTARY
Performance c For the period of inception(9/26/2016) through August 31, 2017, the U.S.Strategic Equity Allocation Fund Class NAV sharesreturned 16.08% and the Russell 3000 Indexreturned 16.07%.
Environment c U.S. stocks started the periodon a weak note, as investors were cautiousahead of the November U.S. presidential election.However, a strong rally following Donald Trump’svictory began a roughly 10-month stretch inwhich share prices trended higher with few pull-backs. The widely followed S&P 500 Index hit aseries of all-time highs.
The fund pursues an active U.S. sector rotationalstrategy that invests across U.S. large-, mid- andsmall-capitalization securities implemented withpassive index replication. This means that whilethe fund is composed of assets that are meant to
replicate the performance of various indexes,positioning within the fund is an outcome offundamental analysis.
An overweight allocation in the information tech-nology sector contributed to its return over theperiod, especially its holdings in the semiconduc-tors and hardware & equipment sub-sectors. Theoverweight position in the financials sector —specifically its banks and diversified financialsholdings — also contributed positively to relativereturns as the sector benefited from the rise inbond yields over the period. Conversely, thefund’s position in the energy sector and under-weight position in the consumer discretionarysector detracted from returns.
We continue to see both risks and opportunitiesin the current environment. On the one hand,the rally in U.S. stocks since the presidential
election has resulted in rich valuations. On theother hand, if the recent positive trend in corpo-rate earnings continues, it would offer supportfor those lofty valuations.
Within the U.S. stock market, valuations appearless stretched in financials and we believe regula-tory concerns and headline risks here are fading.However, we are concerned about interest-ratedynamics and the inability of the current adminis-tration to make much headway on key proposals,potentially delaying important benefits for thissector. We also think the information technologysector offers decent revenue and earnings out-looks. Health care is a relatively inexpensive,defensive sector that could outperform if drug-pricing concerns ease and investors refocus ondrug pipelines.
PERFORMANCE TABLE1,2 Average Annual Total Return Cumulative Total Return
Periods Ending August 31, 2017 1-year 5-year 10-yearSince
Inception 5-year 10-yearSince
Inception
U.S. Strategic Equity Allocation Fund Class NAV(began 9/26/16) — — — — — — 16.08%
Russell 3000 Index3,4 — — — — — — 16.07%
1 Performance does not reflect the deduction of taxes on fund distributions or redemptions of fund shares. Past performance does not guarantee future results.2 Since inception, a portion of the U.S. Strategic Equity Allocation Fund expenses was reimbursed. If such expenses had not been reimbursed, returns would be lower.3 The Russell 3000 Index is an unmanaged index of the 3,000 largest U.S. companies based on total market capitalization, which represents approximately 98% of the investable
U.S. equity market.4 It is not possible to invest directly in an index. Index figures do not reflect expenses or sales charges, which would result in lower returns.The expense ratios of the fund, both net (including any fee waivers or expense limitations) and gross (excluding any fee waivers or expense limitations), are set forth according to themost recent publicly available prospectus for the fund and may differ from the expense ratios disclosed in the financial highlights tables in this report. For Class NAV shares, the netexpenses equal the gross expenses and are 0.66%.
Sector Composition* % of TotalInformation technology 25.0Financials 15.4Industrials 12.9Health care 11.3Consumer discretionary 7.8Consumer staples 7.3Energy 4.1Utilities 3.7Materials 3.5Real estate 3.5Telecommunication services 1.8Short-term investments and other 3.7
* As a percentage of net assets.
8/17
$11,608$11,607
U.S. Strategic Equity Allocation Fund Class NAVRussell 3000 Index
8/168/158/148/138/124/12$9,500
$10,000
$10,500
$11,000
$11,500
$12,000
U.S. Strategic Equity Allocation FundSubadvisor: John Hancock Asset ManagementPortfolio Managers: Robert M. Boyda, Marcelle Daher, CFA, Nathan W. Thooft, CFA
36
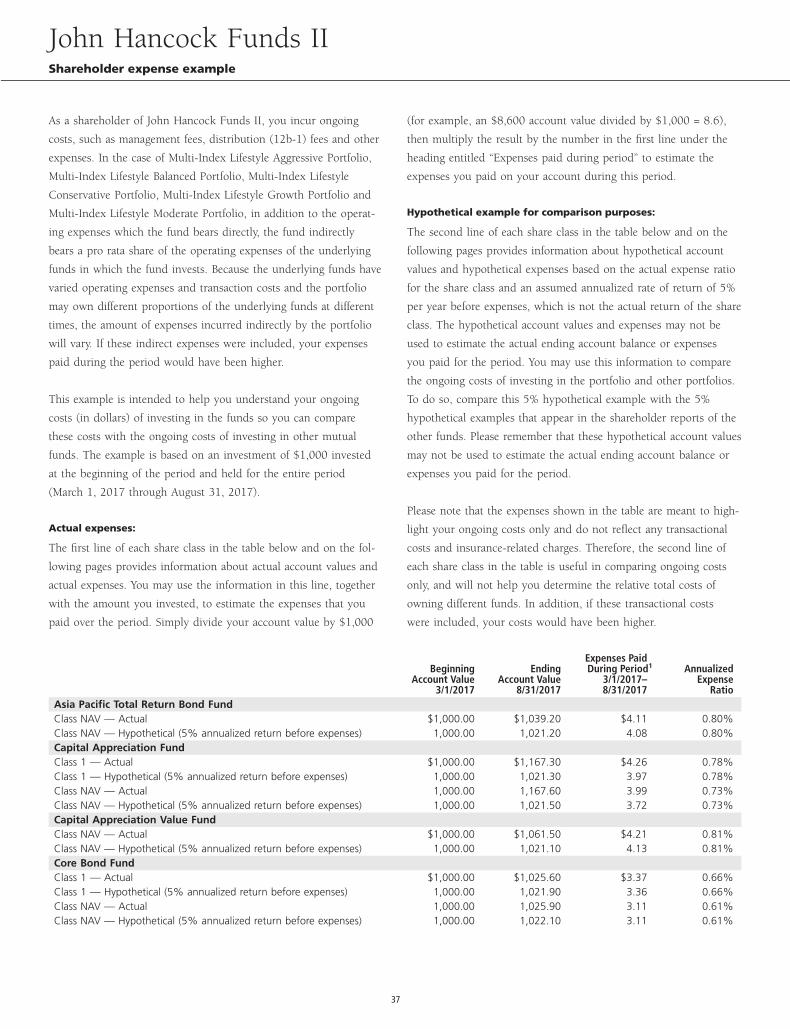
As a shareholder of John Hancock Funds II, you incur ongoing
costs, such as management fees, distribution (12b-1) fees and other
expenses. In the case of Multi-Index Lifestyle Aggressive Portfolio,
Multi-Index Lifestyle Balanced Portfolio, Multi-Index Lifestyle
Conservative Portfolio, Multi-Index Lifestyle Growth Portfolio and
Multi-Index Lifestyle Moderate Portfolio, in addition to the operat-
ing expenses which the fund bears directly, the fund indirectly
bears a pro rata share of the operating expenses of the underlying
funds in which the fund invests. Because the underlying funds have
varied operating expenses and transaction costs and the portfolio
may own different proportions of the underlying funds at different
times, the amount of expenses incurred indirectly by the portfolio
will vary. If these indirect expenses were included, your expenses
paid during the period would have been higher.
This example is intended to help you understand your ongoing
costs (in dollars) of investing in the funds so you can compare
these costs with the ongoing costs of investing in other mutual
funds. The example is based on an investment of $1,000 invested
at the beginning of the period and held for the entire period
(March 1, 2017 through August 31, 2017).
Actual expenses:
The first line of each share class in the table below and on the fol-
lowing pages provides information about actual account values and
actual expenses. You may use the information in this line, together
with the amount you invested, to estimate the expenses that you
paid over the period. Simply divide your account value by $1,000
(for example, an $8,600 account value divided by $1,000 = 8.6),
then multiply the result by the number in the first line under the
heading entitled “Expenses paid during period” to estimate the
expenses you paid on your account during this period.
Hypothetical example for comparison purposes:
The second line of each share class in the table below and on the
following pages provides information about hypothetical account
values and hypothetical expenses based on the actual expense ratio
for the share class and an assumed annualized rate of return of 5%
per year before expenses, which is not the actual return of the share
class. The hypothetical account values and expenses may not be
used to estimate the actual ending account balance or expenses
you paid for the period. You may use this information to compare
the ongoing costs of investing in the portfolio and other portfolios.
To do so, compare this 5% hypothetical example with the 5%
hypothetical examples that appear in the shareholder reports of the
other funds. Please remember that these hypothetical account values
may not be used to estimate the actual ending account balance or
expenses you paid for the period.
Please note that the expenses shown in the table are meant to high-
light your ongoing costs only and do not reflect any transactional
costs and insurance-related charges. Therefore, the second line of
each share class in the table is useful in comparing ongoing costs
only, and will not help you determine the relative total costs of
owning different funds. In addition, if these transactional costs
were included, your costs would have been higher.
BeginningAccount Value
3/1/2017
EndingAccount Value
8/31/2017
Expenses PaidDuring Period1
3/1/2017–8/31/2017
AnnualizedExpense
RatioAsia Pacific Total Return Bond FundClass NAV — Actual $1,000.00 $1,039.20 $4.11 0.80%Class NAV — Hypothetical (5% annualized return before expenses) 1,000.00 1,021.20 4.08 0.80%Capital Appreciation FundClass 1 — Actual $1,000.00 $1,167.30 $4.26 0.78%Class 1 — Hypothetical (5% annualized return before expenses) 1,000.00 1,021.30 3.97 0.78%Class NAV — Actual 1,000.00 1,167.60 3.99 0.73%Class NAV — Hypothetical (5% annualized return before expenses) 1,000.00 1,021.50 3.72 0.73%Capital Appreciation Value FundClass NAV — Actual $1,000.00 $1,061.50 $4.21 0.81%Class NAV — Hypothetical (5% annualized return before expenses) 1,000.00 1,021.10 4.13 0.81%Core Bond FundClass 1 — Actual $1,000.00 $1,025.60 $3.37 0.66%Class 1 — Hypothetical (5% annualized return before expenses) 1,000.00 1,021.90 3.36 0.66%Class NAV — Actual 1,000.00 1,025.90 3.11 0.61%Class NAV — Hypothetical (5% annualized return before expenses) 1,000.00 1,022.10 3.11 0.61%
John Hancock Funds IIShareholder expense example
37
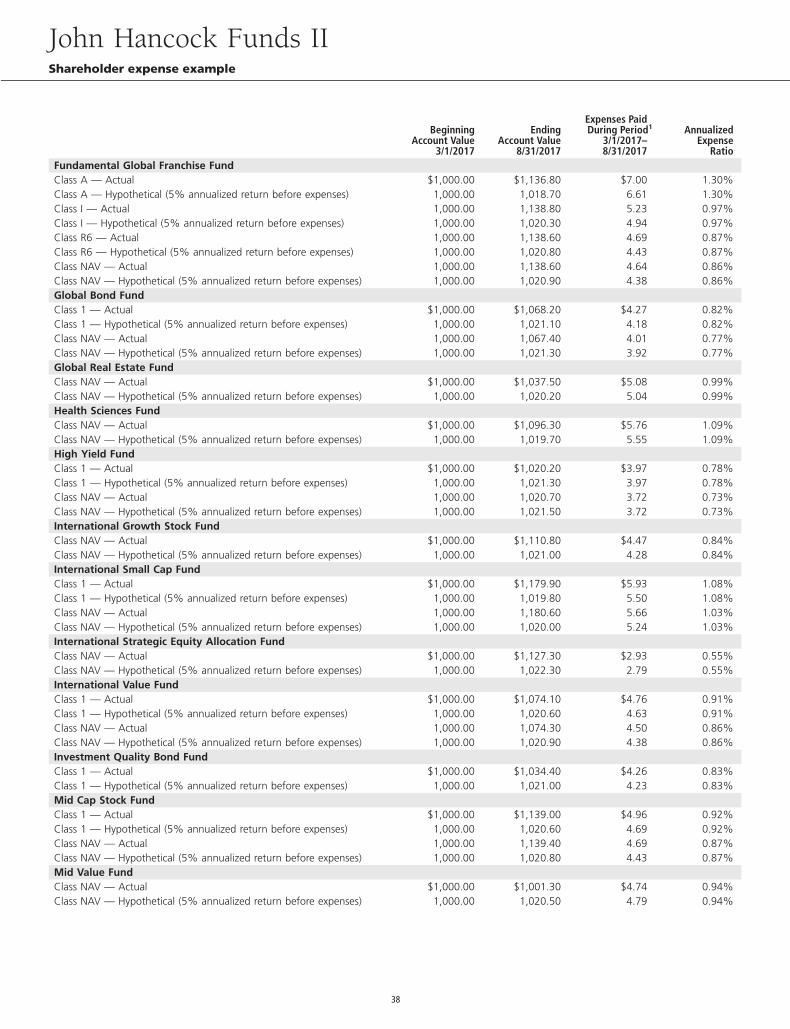
BeginningAccount Value
3/1/2017
EndingAccount Value
8/31/2017
Expenses PaidDuring Period1
3/1/2017–8/31/2017
AnnualizedExpense
RatioFundamental Global Franchise FundClass A — Actual $1,000.00 $1,136.80 $7.00 1.30%Class A — Hypothetical (5% annualized return before expenses) 1,000.00 1,018.70 6.61 1.30%Class I — Actual 1,000.00 1,138.80 5.23 0.97%Class I — Hypothetical (5% annualized return before expenses) 1,000.00 1,020.30 4.94 0.97%Class R6 — Actual 1,000.00 1,138.60 4.69 0.87%Class R6 — Hypothetical (5% annualized return before expenses) 1,000.00 1,020.80 4.43 0.87%Class NAV — Actual 1,000.00 1,138.60 4.64 0.86%Class NAV — Hypothetical (5% annualized return before expenses) 1,000.00 1,020.90 4.38 0.86%Global Bond FundClass 1 — Actual $1,000.00 $1,068.20 $4.27 0.82%Class 1 — Hypothetical (5% annualized return before expenses) 1,000.00 1,021.10 4.18 0.82%Class NAV — Actual 1,000.00 1,067.40 4.01 0.77%Class NAV — Hypothetical (5% annualized return before expenses) 1,000.00 1,021.30 3.92 0.77%Global Real Estate FundClass NAV — Actual $1,000.00 $1,037.50 $5.08 0.99%Class NAV — Hypothetical (5% annualized return before expenses) 1,000.00 1,020.20 5.04 0.99%Health Sciences FundClass NAV — Actual $1,000.00 $1,096.30 $5.76 1.09%Class NAV — Hypothetical (5% annualized return before expenses) 1,000.00 1,019.70 5.55 1.09%High Yield FundClass 1 — Actual $1,000.00 $1,020.20 $3.97 0.78%Class 1 — Hypothetical (5% annualized return before expenses) 1,000.00 1,021.30 3.97 0.78%Class NAV — Actual 1,000.00 1,020.70 3.72 0.73%Class NAV — Hypothetical (5% annualized return before expenses) 1,000.00 1,021.50 3.72 0.73%International Growth Stock FundClass NAV — Actual $1,000.00 $1,110.80 $4.47 0.84%Class NAV — Hypothetical (5% annualized return before expenses) 1,000.00 1,021.00 4.28 0.84%International Small Cap FundClass 1 — Actual $1,000.00 $1,179.90 $5.93 1.08%Class 1 — Hypothetical (5% annualized return before expenses) 1,000.00 1,019.80 5.50 1.08%Class NAV — Actual 1,000.00 1,180.60 5.66 1.03%Class NAV — Hypothetical (5% annualized return before expenses) 1,000.00 1,020.00 5.24 1.03%International Strategic Equity Allocation FundClass NAV — Actual $1,000.00 $1,127.30 $2.93 0.55%Class NAV — Hypothetical (5% annualized return before expenses) 1,000.00 1,022.30 2.79 0.55%International Value FundClass 1 — Actual $1,000.00 $1,074.10 $4.76 0.91%Class 1 — Hypothetical (5% annualized return before expenses) 1,000.00 1,020.60 4.63 0.91%Class NAV — Actual 1,000.00 1,074.30 4.50 0.86%Class NAV — Hypothetical (5% annualized return before expenses) 1,000.00 1,020.90 4.38 0.86%Investment Quality Bond FundClass 1 — Actual $1,000.00 $1,034.40 $4.26 0.83%Class 1 — Hypothetical (5% annualized return before expenses) 1,000.00 1,021.00 4.23 0.83%Mid Cap Stock FundClass 1 — Actual $1,000.00 $1,139.00 $4.96 0.92%Class 1 — Hypothetical (5% annualized return before expenses) 1,000.00 1,020.60 4.69 0.92%Class NAV — Actual 1,000.00 1,139.40 4.69 0.87%Class NAV — Hypothetical (5% annualized return before expenses) 1,000.00 1,020.80 4.43 0.87%Mid Value FundClass NAV — Actual $1,000.00 $1,001.30 $4.74 0.94%Class NAV — Hypothetical (5% annualized return before expenses) 1,000.00 1,020.50 4.79 0.94%
John Hancock Funds IIShareholder expense example
38
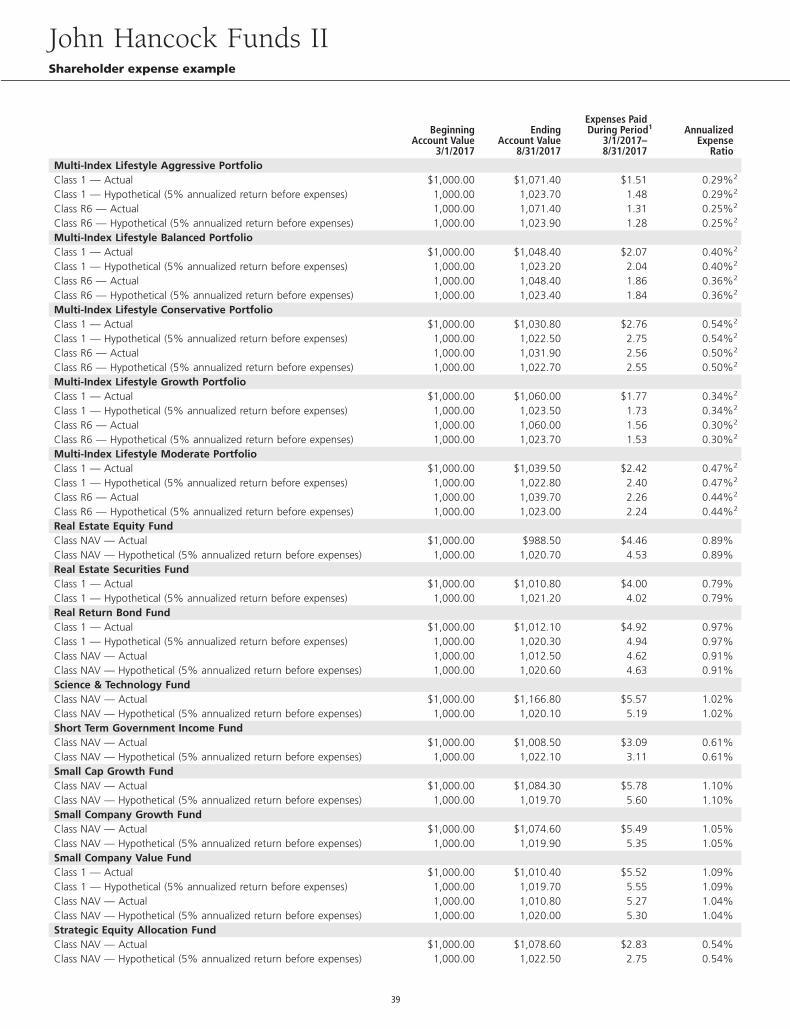
BeginningAccount Value
3/1/2017
EndingAccount Value
8/31/2017
Expenses PaidDuring Period1
3/1/2017–8/31/2017
AnnualizedExpense
RatioMulti-Index Lifestyle Aggressive PortfolioClass 1 — Actual $1,000.00 $1,071.40 $1.51 0.29%2
Class 1 — Hypothetical (5% annualized return before expenses) 1,000.00 1,023.70 1.48 0.29%2
Class R6 — Actual 1,000.00 1,071.40 1.31 0.25%2
Class R6 — Hypothetical (5% annualized return before expenses) 1,000.00 1,023.90 1.28 0.25%2
Multi-Index Lifestyle Balanced PortfolioClass 1 — Actual $1,000.00 $1,048.40 $2.07 0.40%2
Class 1 — Hypothetical (5% annualized return before expenses) 1,000.00 1,023.20 2.04 0.40%2
Class R6 — Actual 1,000.00 1,048.40 1.86 0.36%2
Class R6 — Hypothetical (5% annualized return before expenses) 1,000.00 1,023.40 1.84 0.36%2
Multi-Index Lifestyle Conservative PortfolioClass 1 — Actual $1,000.00 $1,030.80 $2.76 0.54%2
Class 1 — Hypothetical (5% annualized return before expenses) 1,000.00 1,022.50 2.75 0.54%2
Class R6 — Actual 1,000.00 1,031.90 2.56 0.50%2
Class R6 — Hypothetical (5% annualized return before expenses) 1,000.00 1,022.70 2.55 0.50%2
Multi-Index Lifestyle Growth PortfolioClass 1 — Actual $1,000.00 $1,060.00 $1.77 0.34%2
Class 1 — Hypothetical (5% annualized return before expenses) 1,000.00 1,023.50 1.73 0.34%2
Class R6 — Actual 1,000.00 1,060.00 1.56 0.30%2
Class R6 — Hypothetical (5% annualized return before expenses) 1,000.00 1,023.70 1.53 0.30%2
Multi-Index Lifestyle Moderate PortfolioClass 1 — Actual $1,000.00 $1,039.50 $2.42 0.47%2
Class 1 — Hypothetical (5% annualized return before expenses) 1,000.00 1,022.80 2.40 0.47%2
Class R6 — Actual 1,000.00 1,039.70 2.26 0.44%2
Class R6 — Hypothetical (5% annualized return before expenses) 1,000.00 1,023.00 2.24 0.44%2
Real Estate Equity FundClass NAV — Actual $1,000.00 $988.50 $4.46 0.89%Class NAV — Hypothetical (5% annualized return before expenses) 1,000.00 1,020.70 4.53 0.89%Real Estate Securities FundClass 1 — Actual $1,000.00 $1,010.80 $4.00 0.79%Class 1 — Hypothetical (5% annualized return before expenses) 1,000.00 1,021.20 4.02 0.79%Real Return Bond FundClass 1 — Actual $1,000.00 $1,012.10 $4.92 0.97%Class 1 — Hypothetical (5% annualized return before expenses) 1,000.00 1,020.30 4.94 0.97%Class NAV — Actual 1,000.00 1,012.50 4.62 0.91%Class NAV — Hypothetical (5% annualized return before expenses) 1,000.00 1,020.60 4.63 0.91%Science & Technology FundClass NAV — Actual $1,000.00 $1,166.80 $5.57 1.02%Class NAV — Hypothetical (5% annualized return before expenses) 1,000.00 1,020.10 5.19 1.02%Short Term Government Income FundClass NAV — Actual $1,000.00 $1,008.50 $3.09 0.61%Class NAV — Hypothetical (5% annualized return before expenses) 1,000.00 1,022.10 3.11 0.61%Small Cap Growth FundClass NAV — Actual $1,000.00 $1,084.30 $5.78 1.10%Class NAV — Hypothetical (5% annualized return before expenses) 1,000.00 1,019.70 5.60 1.10%Small Company Growth FundClass NAV — Actual $1,000.00 $1,074.60 $5.49 1.05%Class NAV — Hypothetical (5% annualized return before expenses) 1,000.00 1,019.90 5.35 1.05%Small Company Value FundClass 1 — Actual $1,000.00 $1,010.40 $5.52 1.09%Class 1 — Hypothetical (5% annualized return before expenses) 1,000.00 1,019.70 5.55 1.09%Class NAV — Actual 1,000.00 1,010.80 5.27 1.04%Class NAV — Hypothetical (5% annualized return before expenses) 1,000.00 1,020.00 5.30 1.04%Strategic Equity Allocation FundClass NAV — Actual $1,000.00 $1,078.60 $2.83 0.54%Class NAV — Hypothetical (5% annualized return before expenses) 1,000.00 1,022.50 2.75 0.54%
John Hancock Funds IIShareholder expense example
39
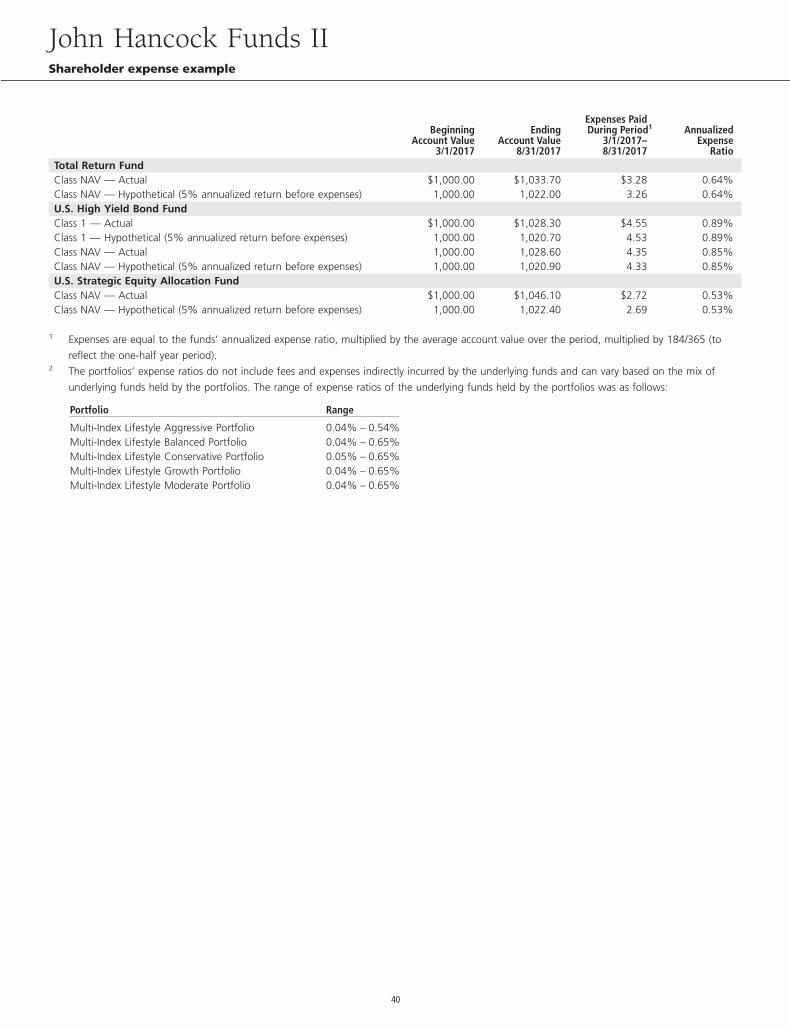
BeginningAccount Value
3/1/2017
EndingAccount Value
8/31/2017
Expenses PaidDuring Period1
3/1/2017–8/31/2017
AnnualizedExpense
RatioTotal Return FundClass NAV — Actual $1,000.00 $1,033.70 $3.28 0.64%Class NAV — Hypothetical (5% annualized return before expenses) 1,000.00 1,022.00 3.26 0.64%U.S. High Yield Bond FundClass 1 — Actual $1,000.00 $1,028.30 $4.55 0.89%Class 1 — Hypothetical (5% annualized return before expenses) 1,000.00 1,020.70 4.53 0.89%Class NAV — Actual 1,000.00 1,028.60 4.35 0.85%Class NAV — Hypothetical (5% annualized return before expenses) 1,000.00 1,020.90 4.33 0.85%U.S. Strategic Equity Allocation FundClass NAV — Actual $1,000.00 $1,046.10 $2.72 0.53%Class NAV — Hypothetical (5% annualized return before expenses) 1,000.00 1,022.40 2.69 0.53%
1 Expenses are equal to the funds’ annualized expense ratio, multiplied by the average account value over the period, multiplied by 184/365 (to
reflect the one-half year period).2 The portfolios’ expense ratios do not include fees and expenses indirectly incurred by the underlying funds and can vary based on the mix of
underlying funds held by the portfolios. The range of expense ratios of the underlying funds held by the portfolios was as follows:
Portfolio Range
Multi-Index Lifestyle Aggressive Portfolio 0.04% – 0.54%Multi-Index Lifestyle Balanced Portfolio 0.04% – 0.65%Multi-Index Lifestyle Conservative Portfolio 0.05% – 0.65%Multi-Index Lifestyle Growth Portfolio 0.04% – 0.65%Multi-Index Lifestyle Moderate Portfolio 0.04% – 0.65%
John Hancock Funds IIShareholder expense example
40
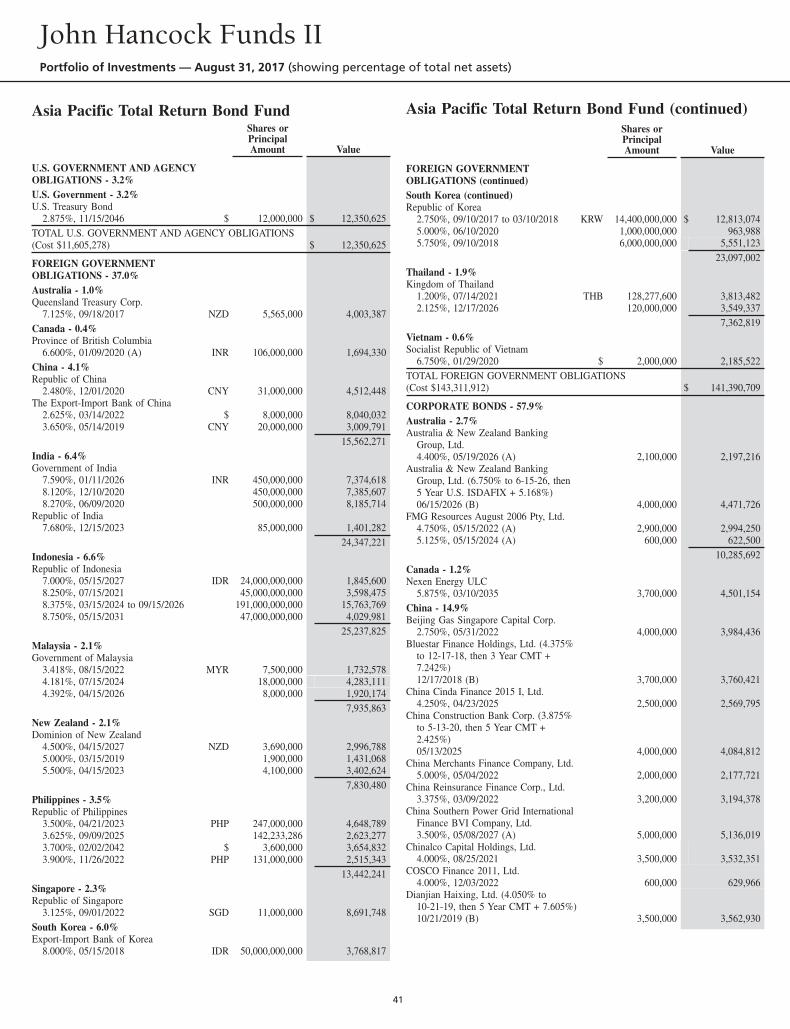
Asia Pacific Total Return Bond FundShares orPrincipalAmount Value
U.S. GOVERNMENT AND AGENCYOBLIGATIONS - 3.2%U.S. Government - 3.2%U.S. Treasury Bond
2.875%, 11/15/2046 $ 12,000,000 $ 12,350,625TOTAL U.S. GOVERNMENT AND AGENCY OBLIGATIONS(Cost $11,605,278) $ 12,350,625
FOREIGN GOVERNMENTOBLIGATIONS - 37.0%Australia - 1.0%Queensland Treasury Corp.
7.125%, 09/18/2017 NZD 5,565,000 4,003,387Canada - 0.4%Province of British Columbia
6.600%, 01/09/2020 (A) INR 106,000,000 1,694,330China - 4.1%Republic of China
2.480%, 12/01/2020 CNY 31,000,000 4,512,448The Export-Import Bank of China
2.625%, 03/14/2022 $ 8,000,000 8,040,0323.650%, 05/14/2019 CNY 20,000,000 3,009,791
15,562,271India - 6.4%Government of India
7.590%, 01/11/2026 INR 450,000,000 7,374,6188.120%, 12/10/2020 450,000,000 7,385,6078.270%, 06/09/2020 500,000,000 8,185,714
Republic of India7.680%, 12/15/2023 85,000,000 1,401,282
24,347,221Indonesia - 6.6%Republic of Indonesia
7.000%, 05/15/2027 IDR 24,000,000,000 1,845,6008.250%, 07/15/2021 45,000,000,000 3,598,4758.375%, 03/15/2024 to 09/15/2026 191,000,000,000 15,763,7698.750%, 05/15/2031 47,000,000,000 4,029,981
25,237,825Malaysia - 2.1%Government of Malaysia
3.418%, 08/15/2022 MYR 7,500,000 1,732,5784.181%, 07/15/2024 18,000,000 4,283,1114.392%, 04/15/2026 8,000,000 1,920,174
7,935,863New Zealand - 2.1%Dominion of New Zealand
4.500%, 04/15/2027 NZD 3,690,000 2,996,7885.000%, 03/15/2019 1,900,000 1,431,0685.500%, 04/15/2023 4,100,000 3,402,624
7,830,480Philippines - 3.5%Republic of Philippines
3.500%, 04/21/2023 PHP 247,000,000 4,648,7893.625%, 09/09/2025 142,233,286 2,623,2773.700%, 02/02/2042 $ 3,600,000 3,654,8323.900%, 11/26/2022 PHP 131,000,000 2,515,343
13,442,241Singapore - 2.3%Republic of Singapore
3.125%, 09/01/2022 SGD 11,000,000 8,691,748South Korea - 6.0%Export-Import Bank of Korea
8.000%, 05/15/2018 IDR 50,000,000,000 3,768,817
Asia Pacific Total Return Bond Fund (continued)Shares orPrincipalAmount Value
FOREIGN GOVERNMENTOBLIGATIONS (continued)South Korea (continued)Republic of Korea
2.750%, 09/10/2017 to 03/10/2018 KRW 14,400,000,000 $ 12,813,0745.000%, 06/10/2020 1,000,000,000 963,9885.750%, 09/10/2018 6,000,000,000 5,551,123
23,097,002Thailand - 1.9%Kingdom of Thailand
1.200%, 07/14/2021 THB 128,277,600 3,813,4822.125%, 12/17/2026 120,000,000 3,549,337
7,362,819Vietnam - 0.6%Socialist Republic of Vietnam
6.750%, 01/29/2020 $ 2,000,000 2,185,522TOTAL FOREIGN GOVERNMENT OBLIGATIONS(Cost $143,311,912) $ 141,390,709
CORPORATE BONDS - 57.9%Australia - 2.7%Australia & New Zealand Banking
Group, Ltd.4.400%, 05/19/2026 (A) 2,100,000 2,197,216
Australia & New Zealand BankingGroup, Ltd. (6.750% to 6-15-26, then5 Year U.S. ISDAFIX + 5.168%)06/15/2026 (B) 4,000,000 4,471,726
FMG Resources August 2006 Pty, Ltd.4.750%, 05/15/2022 (A) 2,900,000 2,994,2505.125%, 05/15/2024 (A) 600,000 622,500
10,285,692Canada - 1.2%Nexen Energy ULC
5.875%, 03/10/2035 3,700,000 4,501,154China - 14.9%Beijing Gas Singapore Capital Corp.
2.750%, 05/31/2022 4,000,000 3,984,436Bluestar Finance Holdings, Ltd. (4.375%
to 12-17-18, then 3 Year CMT +7.242%)12/17/2018 (B) 3,700,000 3,760,421
China Cinda Finance 2015 I, Ltd.4.250%, 04/23/2025 2,500,000 2,569,795
China Construction Bank Corp. (3.875%to 5-13-20, then 5 Year CMT +2.425%)05/13/2025 4,000,000 4,084,812
China Merchants Finance Company, Ltd.5.000%, 05/04/2022 2,000,000 2,177,721
China Reinsurance Finance Corp., Ltd.3.375%, 03/09/2022 3,200,000 3,194,378
China Southern Power Grid InternationalFinance BVI Company, Ltd.3.500%, 05/08/2027 (A) 5,000,000 5,136,019
Chinalco Capital Holdings, Ltd.4.000%, 08/25/2021 3,500,000 3,532,351
COSCO Finance 2011, Ltd.4.000%, 12/03/2022 600,000 629,966
Dianjian Haixing, Ltd. (4.050% to10-21-19, then 5 Year CMT + 7.605%)10/21/2019 (B) 3,500,000 3,562,930
John Hancock Funds IIPortfolio of Investments — August 31, 2017 (showing percentage of total net assets)
41
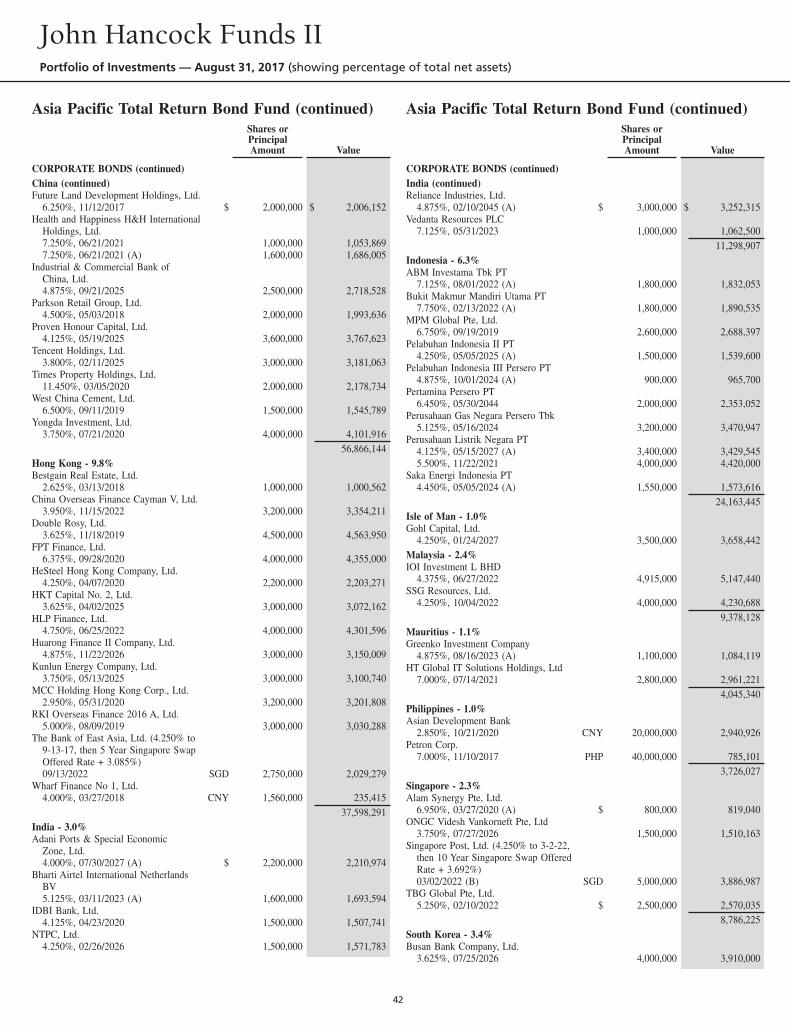
Asia Pacific Total Return Bond Fund (continued)Shares orPrincipalAmount Value
CORPORATE BONDS (continued)China (continued)Future Land Development Holdings, Ltd.
6.250%, 11/12/2017 $ 2,000,000 $ 2,006,152Health and Happiness H&H International
Holdings, Ltd.7.250%, 06/21/2021 1,000,000 1,053,8697.250%, 06/21/2021 (A) 1,600,000 1,686,005
Industrial & Commercial Bank ofChina, Ltd.4.875%, 09/21/2025 2,500,000 2,718,528
Parkson Retail Group, Ltd.4.500%, 05/03/2018 2,000,000 1,993,636
Proven Honour Capital, Ltd.4.125%, 05/19/2025 3,600,000 3,767,623
Tencent Holdings, Ltd.3.800%, 02/11/2025 3,000,000 3,181,063
Times Property Holdings, Ltd.11.450%, 03/05/2020 2,000,000 2,178,734
West China Cement, Ltd.6.500%, 09/11/2019 1,500,000 1,545,789
Yongda Investment, Ltd.3.750%, 07/21/2020 4,000,000 4,101,916
56,866,144Hong Kong - 9.8%Bestgain Real Estate, Ltd.
2.625%, 03/13/2018 1,000,000 1,000,562China Overseas Finance Cayman V, Ltd.
3.950%, 11/15/2022 3,200,000 3,354,211Double Rosy, Ltd.
3.625%, 11/18/2019 4,500,000 4,563,950FPT Finance, Ltd.
6.375%, 09/28/2020 4,000,000 4,355,000HeSteel Hong Kong Company, Ltd.
4.250%, 04/07/2020 2,200,000 2,203,271HKT Capital No. 2, Ltd.
3.625%, 04/02/2025 3,000,000 3,072,162HLP Finance, Ltd.
4.750%, 06/25/2022 4,000,000 4,301,596Huarong Finance II Company, Ltd.
4.875%, 11/22/2026 3,000,000 3,150,009Kunlun Energy Company, Ltd.
3.750%, 05/13/2025 3,000,000 3,100,740MCC Holding Hong Kong Corp., Ltd.
2.950%, 05/31/2020 3,200,000 3,201,808RKI Overseas Finance 2016 A, Ltd.
5.000%, 08/09/2019 3,000,000 3,030,288The Bank of East Asia, Ltd. (4.250% to
9-13-17, then 5 Year Singapore SwapOffered Rate + 3.085%)09/13/2022 SGD 2,750,000 2,029,279
Wharf Finance No 1, Ltd.4.000%, 03/27/2018 CNY 1,560,000 235,415
37,598,291India - 3.0%Adani Ports & Special Economic
Zone, Ltd.4.000%, 07/30/2027 (A) $ 2,200,000 2,210,974
Bharti Airtel International NetherlandsBV5.125%, 03/11/2023 (A) 1,600,000 1,693,594
IDBI Bank, Ltd.4.125%, 04/23/2020 1,500,000 1,507,741
NTPC, Ltd.4.250%, 02/26/2026 1,500,000 1,571,783
Asia Pacific Total Return Bond Fund (continued)Shares orPrincipalAmount Value
CORPORATE BONDS (continued)India (continued)Reliance Industries, Ltd.
4.875%, 02/10/2045 (A) $ 3,000,000 $ 3,252,315Vedanta Resources PLC
7.125%, 05/31/2023 1,000,000 1,062,50011,298,907
Indonesia - 6.3%ABM Investama Tbk PT
7.125%, 08/01/2022 (A) 1,800,000 1,832,053Bukit Makmur Mandiri Utama PT
7.750%, 02/13/2022 (A) 1,800,000 1,890,535MPM Global Pte, Ltd.
6.750%, 09/19/2019 2,600,000 2,688,397Pelabuhan Indonesia II PT
4.250%, 05/05/2025 (A) 1,500,000 1,539,600Pelabuhan Indonesia III Persero PT
4.875%, 10/01/2024 (A) 900,000 965,700Pertamina Persero PT
6.450%, 05/30/2044 2,000,000 2,353,052Perusahaan Gas Negara Persero Tbk
5.125%, 05/16/2024 3,200,000 3,470,947Perusahaan Listrik Negara PT
4.125%, 05/15/2027 (A) 3,400,000 3,429,5455.500%, 11/22/2021 4,000,000 4,420,000
Saka Energi Indonesia PT4.450%, 05/05/2024 (A) 1,550,000 1,573,616
24,163,445Isle of Man - 1.0%Gohl Capital, Ltd.
4.250%, 01/24/2027 3,500,000 3,658,442Malaysia - 2.4%IOI Investment L BHD
4.375%, 06/27/2022 4,915,000 5,147,440SSG Resources, Ltd.
4.250%, 10/04/2022 4,000,000 4,230,6889,378,128
Mauritius - 1.1%Greenko Investment Company
4.875%, 08/16/2023 (A) 1,100,000 1,084,119HT Global IT Solutions Holdings, Ltd
7.000%, 07/14/2021 2,800,000 2,961,2214,045,340
Philippines - 1.0%Asian Development Bank
2.850%, 10/21/2020 CNY 20,000,000 2,940,926Petron Corp.
7.000%, 11/10/2017 PHP 40,000,000 785,1013,726,027
Singapore - 2.3%Alam Synergy Pte, Ltd.
6.950%, 03/27/2020 (A) $ 800,000 819,040ONGC Videsh Vankorneft Pte, Ltd
3.750%, 07/27/2026 1,500,000 1,510,163Singapore Post, Ltd. (4.250% to 3-2-22,
then 10 Year Singapore Swap OfferedRate + 3.692%)03/02/2022 (B) SGD 5,000,000 3,886,987
TBG Global Pte, Ltd.5.250%, 02/10/2022 $ 2,500,000 2,570,035
8,786,225South Korea - 3.4%Busan Bank Company, Ltd.
3.625%, 07/25/2026 4,000,000 3,910,000
John Hancock Funds IIPortfolio of Investments — August 31, 2017 (showing percentage of total net assets)
42
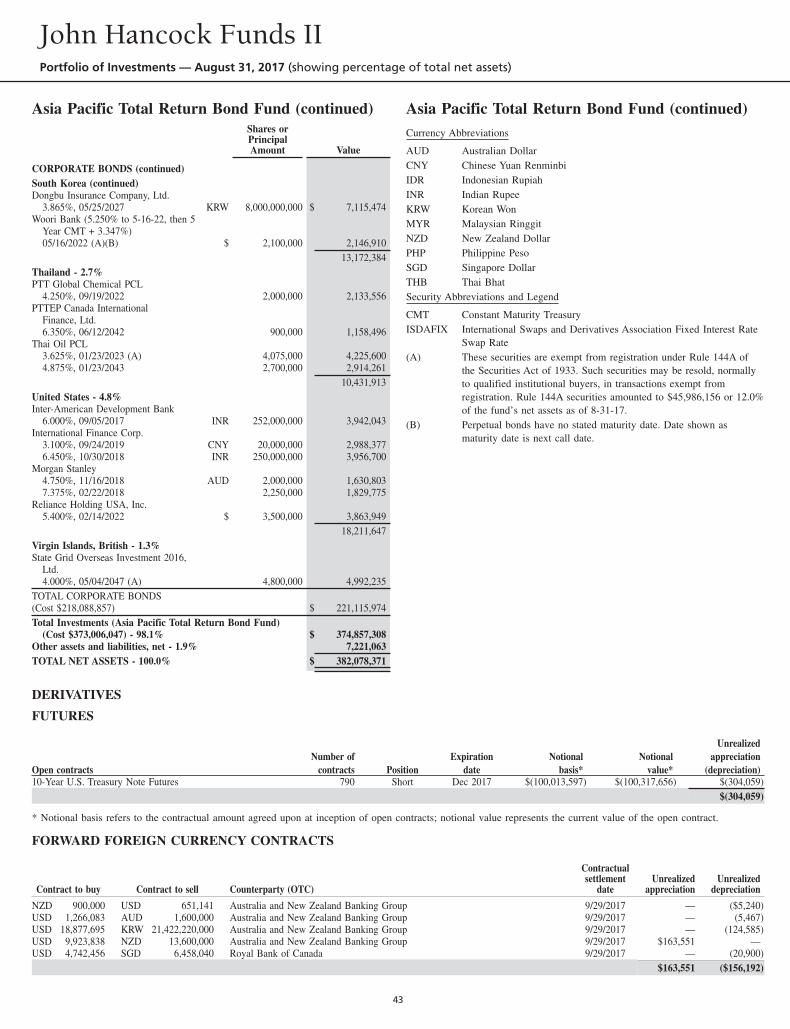
Asia Pacific Total Return Bond Fund (continued)Shares orPrincipalAmount Value
CORPORATE BONDS (continued)South Korea (continued)Dongbu Insurance Company, Ltd.
3.865%, 05/25/2027 KRW 8,000,000,000 $ 7,115,474Woori Bank (5.250% to 5-16-22, then 5
Year CMT + 3.347%)05/16/2022 (A)(B) $ 2,100,000 2,146,910
13,172,384Thailand - 2.7%PTT Global Chemical PCL
4.250%, 09/19/2022 2,000,000 2,133,556PTTEP Canada International
Finance, Ltd.6.350%, 06/12/2042 900,000 1,158,496
Thai Oil PCL3.625%, 01/23/2023 (A) 4,075,000 4,225,6004.875%, 01/23/2043 2,700,000 2,914,261
10,431,913United States - 4.8%Inter-American Development Bank
6.000%, 09/05/2017 INR 252,000,000 3,942,043International Finance Corp.
3.100%, 09/24/2019 CNY 20,000,000 2,988,3776.450%, 10/30/2018 INR 250,000,000 3,956,700
Morgan Stanley4.750%, 11/16/2018 AUD 2,000,000 1,630,8037.375%, 02/22/2018 2,250,000 1,829,775
Reliance Holding USA, Inc.5.400%, 02/14/2022 $ 3,500,000 3,863,949
18,211,647Virgin Islands, British - 1.3%State Grid Overseas Investment 2016,
Ltd.4.000%, 05/04/2047 (A) 4,800,000 4,992,235
TOTAL CORPORATE BONDS(Cost $218,088,857) $ 221,115,974Total Investments (Asia Pacific Total Return Bond Fund)
(Cost $373,006,047) - 98.1% $ 374,857,308Other assets and liabilities, net - 1.9% 7,221,063TOTAL NET ASSETS - 100.0% $ 382,078,371
Asia Pacific Total Return Bond Fund (continued)Currency Abbreviations
AUD Australian DollarCNY Chinese Yuan RenminbiIDR Indonesian RupiahINR Indian RupeeKRW Korean WonMYR Malaysian RinggitNZD New Zealand DollarPHP Philippine PesoSGD Singapore DollarTHB Thai BhatSecurity Abbreviations and Legend
CMT Constant Maturity TreasuryISDAFIX International Swaps and Derivatives Association Fixed Interest Rate
Swap Rate(A) These securities are exempt from registration under Rule 144A of
the Securities Act of 1933. Such securities may be resold, normallyto qualified institutional buyers, in transactions exempt fromregistration. Rule 144A securities amounted to $45,986,156 or 12.0%of the fund’s net assets as of 8-31-17.
(B) Perpetual bonds have no stated maturity date. Date shown asmaturity date is next call date.
DERIVATIVES
FUTURES
Open contractsNumber of
contracts PositionExpiration
dateNotional
basis*Notional
value*
Unrealizedappreciation
(depreciation)10-Year U.S. Treasury Note Futures 790 Short Dec 2017 $(100,013,597) $(100,317,656) $(304,059)
$(304,059)
* Notional basis refers to the contractual amount agreed upon at inception of open contracts; notional value represents the current value of the open contract.
FORWARD FOREIGN CURRENCY CONTRACTS
Contract to buy Contract to sell Counterparty (OTC)
Contractualsettlement
dateUnrealized
appreciationUnrealized
depreciation
NZD 900,000 USD 651,141 Australia and New Zealand Banking Group 9/29/2017 — ($5,240)USD 1,266,083 AUD 1,600,000 Australia and New Zealand Banking Group 9/29/2017 — (5,467)USD 18,877,695 KRW 21,422,220,000 Australia and New Zealand Banking Group 9/29/2017 — (124,585)USD 9,923,838 NZD 13,600,000 Australia and New Zealand Banking Group 9/29/2017 $163,551 —USD 4,742,456 SGD 6,458,040 Royal Bank of Canada 9/29/2017 — (20,900)
$163,551 ($156,192)
John Hancock Funds IIPortfolio of Investments — August 31, 2017 (showing percentage of total net assets)
43
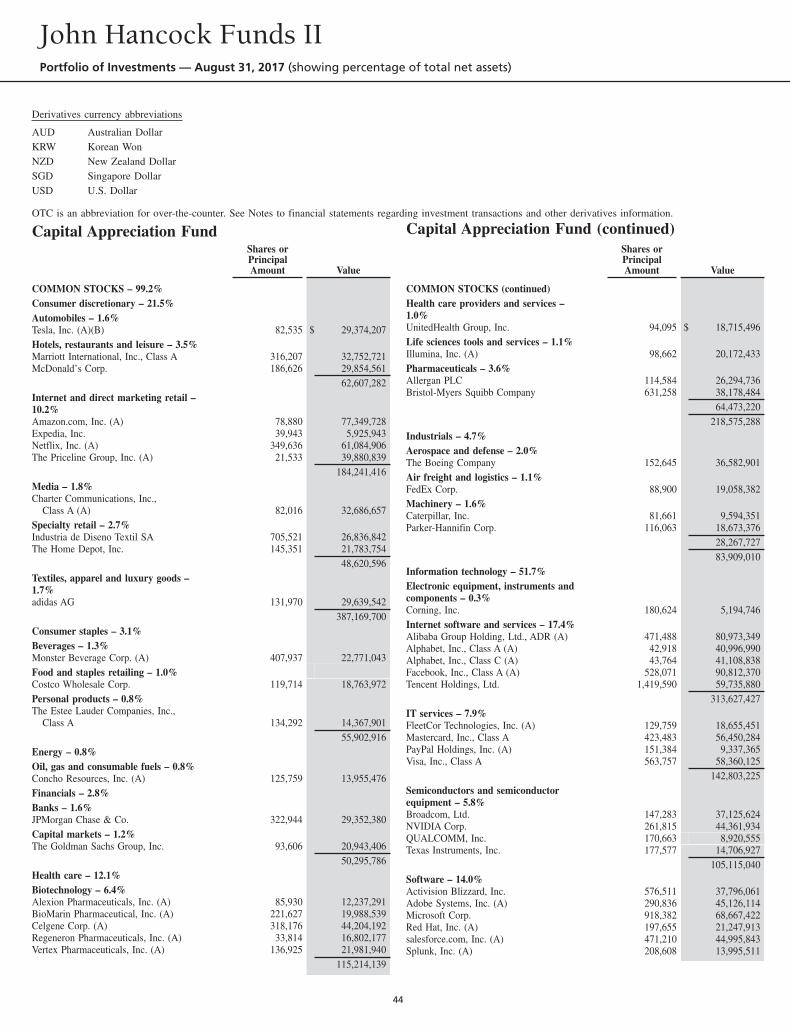
Derivatives currency abbreviations
AUD Australian DollarKRW Korean WonNZD New Zealand DollarSGD Singapore DollarUSD U.S. Dollar
OTC is an abbreviation for over-the-counter. See Notes to financial statements regarding investment transactions and other derivatives information.
Capital Appreciation FundShares orPrincipalAmount Value
COMMON STOCKS – 99.2%Consumer discretionary – 21.5%Automobiles – 1.6%Tesla, Inc. (A)(B) 82,535 $ 29,374,207Hotels, restaurants and leisure – 3.5%Marriott International, Inc., Class A 316,207 32,752,721McDonald’s Corp. 186,626 29,854,561
62,607,282Internet and direct marketing retail –10.2%Amazon.com, Inc. (A) 78,880 77,349,728Expedia, Inc. 39,943 5,925,943Netflix, Inc. (A) 349,636 61,084,906The Priceline Group, Inc. (A) 21,533 39,880,839
184,241,416Media – 1.8%Charter Communications, Inc.,
Class A (A) 82,016 32,686,657Specialty retail – 2.7%Industria de Diseno Textil SA 705,521 26,836,842The Home Depot, Inc. 145,351 21,783,754
48,620,596Textiles, apparel and luxury goods –1.7%adidas AG 131,970 29,639,542
387,169,700Consumer staples – 3.1%Beverages – 1.3%Monster Beverage Corp. (A) 407,937 22,771,043Food and staples retailing – 1.0%Costco Wholesale Corp. 119,714 18,763,972Personal products – 0.8%The Estee Lauder Companies, Inc.,
Class A 134,292 14,367,90155,902,916
Energy – 0.8%Oil, gas and consumable fuels – 0.8%Concho Resources, Inc. (A) 125,759 13,955,476Financials – 2.8%Banks – 1.6%JPMorgan Chase & Co. 322,944 29,352,380Capital markets – 1.2%The Goldman Sachs Group, Inc. 93,606 20,943,406
50,295,786Health care – 12.1%Biotechnology – 6.4%Alexion Pharmaceuticals, Inc. (A) 85,930 12,237,291BioMarin Pharmaceutical, Inc. (A) 221,627 19,988,539Celgene Corp. (A) 318,176 44,204,192Regeneron Pharmaceuticals, Inc. (A) 33,814 16,802,177Vertex Pharmaceuticals, Inc. (A) 136,925 21,981,940
115,214,139
Capital Appreciation Fund (continued)Shares orPrincipalAmount Value
COMMON STOCKS (continued)Health care providers and services –1.0%UnitedHealth Group, Inc. 94,095 $ 18,715,496Life sciences tools and services – 1.1%Illumina, Inc. (A) 98,662 20,172,433Pharmaceuticals – 3.6%Allergan PLC 114,584 26,294,736Bristol-Myers Squibb Company 631,258 38,178,484
64,473,220218,575,288
Industrials – 4.7%Aerospace and defense – 2.0%The Boeing Company 152,645 36,582,901Air freight and logistics – 1.1%FedEx Corp. 88,900 19,058,382Machinery – 1.6%Caterpillar, Inc. 81,661 9,594,351Parker-Hannifin Corp. 116,063 18,673,376
28,267,72783,909,010
Information technology – 51.7%Electronic equipment, instruments andcomponents – 0.3%Corning, Inc. 180,624 5,194,746Internet software and services – 17.4%Alibaba Group Holding, Ltd., ADR (A) 471,488 80,973,349Alphabet, Inc., Class A (A) 42,918 40,996,990Alphabet, Inc., Class C (A) 43,764 41,108,838Facebook, Inc., Class A (A) 528,071 90,812,370Tencent Holdings, Ltd. 1,419,590 59,735,880
313,627,427IT services – 7.9%FleetCor Technologies, Inc. (A) 129,759 18,655,451Mastercard, Inc., Class A 423,483 56,450,284PayPal Holdings, Inc. (A) 151,384 9,337,365Visa, Inc., Class A 563,757 58,360,125
142,803,225Semiconductors and semiconductorequipment – 5.8%Broadcom, Ltd. 147,283 37,125,624NVIDIA Corp. 261,815 44,361,934QUALCOMM, Inc. 170,663 8,920,555Texas Instruments, Inc. 177,577 14,706,927
105,115,040Software – 14.0%Activision Blizzard, Inc. 576,511 37,796,061Adobe Systems, Inc. (A) 290,836 45,126,114Microsoft Corp. 918,382 68,667,422Red Hat, Inc. (A) 197,655 21,247,913salesforce.com, Inc. (A) 471,210 44,995,843Splunk, Inc. (A) 208,608 13,995,511
John Hancock Funds IIPortfolio of Investments — August 31, 2017 (showing percentage of total net assets)
44
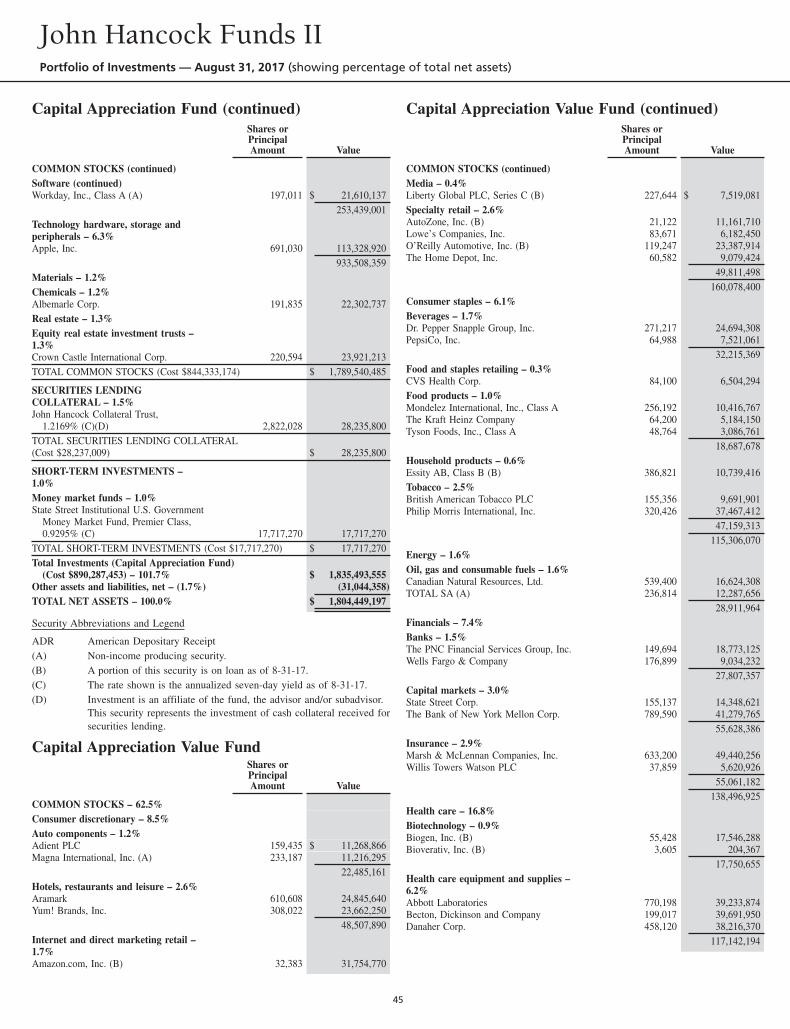
Capital Appreciation Fund (continued)Shares orPrincipalAmount Value
COMMON STOCKS (continued)Software (continued)Workday, Inc., Class A (A) 197,011 $ 21,610,137
253,439,001Technology hardware, storage andperipherals – 6.3%Apple, Inc. 691,030 113,328,920
933,508,359Materials – 1.2%Chemicals – 1.2%Albemarle Corp. 191,835 22,302,737Real estate – 1.3%Equity real estate investment trusts –1.3%Crown Castle International Corp. 220,594 23,921,213TOTAL COMMON STOCKS (Cost $844,333,174) $ 1,789,540,485
SECURITIES LENDINGCOLLATERAL – 1.5%John Hancock Collateral Trust,
1.2169% (C)(D) 2,822,028 28,235,800TOTAL SECURITIES LENDING COLLATERAL(Cost $28,237,009) $ 28,235,800
SHORT-TERM INVESTMENTS –1.0%Money market funds – 1.0%State Street Institutional U.S. Government
Money Market Fund, Premier Class,0.9295% (C) 17,717,270 17,717,270
TOTAL SHORT-TERM INVESTMENTS (Cost $17,717,270) $ 17,717,270Total Investments (Capital Appreciation Fund)
(Cost $890,287,453) – 101.7% $ 1,835,493,555Other assets and liabilities, net – (1.7%) (31,044,358)TOTAL NET ASSETS – 100.0% $ 1,804,449,197
Security Abbreviations and Legend
ADR American Depositary Receipt(A) Non-income producing security.(B) A portion of this security is on loan as of 8-31-17.(C) The rate shown is the annualized seven-day yield as of 8-31-17.(D) Investment is an affiliate of the fund, the advisor and/or subadvisor.
This security represents the investment of cash collateral received forsecurities lending.
Capital Appreciation Value FundShares orPrincipalAmount Value
COMMON STOCKS – 62.5%Consumer discretionary – 8.5%Auto components – 1.2%Adient PLC 159,435 $ 11,268,866Magna International, Inc. (A) 233,187 11,216,295
22,485,161Hotels, restaurants and leisure – 2.6%Aramark 610,608 24,845,640Yum! Brands, Inc. 308,022 23,662,250
48,507,890Internet and direct marketing retail –1.7%Amazon.com, Inc. (B) 32,383 31,754,770
Capital Appreciation Value Fund (continued)Shares orPrincipalAmount Value
COMMON STOCKS (continued)Media – 0.4%Liberty Global PLC, Series C (B) 227,644 $ 7,519,081Specialty retail – 2.6%AutoZone, Inc. (B) 21,122 11,161,710Lowe’s Companies, Inc. 83,671 6,182,450O’Reilly Automotive, Inc. (B) 119,247 23,387,914The Home Depot, Inc. 60,582 9,079,424
49,811,498160,078,400
Consumer staples – 6.1%Beverages – 1.7%Dr. Pepper Snapple Group, Inc. 271,217 24,694,308PepsiCo, Inc. 64,988 7,521,061
32,215,369Food and staples retailing – 0.3%CVS Health Corp. 84,100 6,504,294Food products – 1.0%Mondelez International, Inc., Class A 256,192 10,416,767The Kraft Heinz Company 64,200 5,184,150Tyson Foods, Inc., Class A 48,764 3,086,761
18,687,678Household products – 0.6%Essity AB, Class B (B) 386,821 10,739,416Tobacco – 2.5%British American Tobacco PLC 155,356 9,691,901Philip Morris International, Inc. 320,426 37,467,412
47,159,313115,306,070
Energy – 1.6%Oil, gas and consumable fuels – 1.6%Canadian Natural Resources, Ltd. 539,400 16,624,308TOTAL SA (A) 236,814 12,287,656
28,911,964Financials – 7.4%Banks – 1.5%The PNC Financial Services Group, Inc. 149,694 18,773,125Wells Fargo & Company 176,899 9,034,232
27,807,357Capital markets – 3.0%State Street Corp. 155,137 14,348,621The Bank of New York Mellon Corp. 789,590 41,279,765
55,628,386Insurance – 2.9%Marsh & McLennan Companies, Inc. 633,200 49,440,256Willis Towers Watson PLC 37,859 5,620,926
55,061,182138,496,925
Health care – 16.8%Biotechnology – 0.9%Biogen, Inc. (B) 55,428 17,546,288Bioverativ, Inc. (B) 3,605 204,367
17,750,655Health care equipment and supplies –6.2%Abbott Laboratories 770,198 39,233,874Becton, Dickinson and Company 199,017 39,691,950Danaher Corp. 458,120 38,216,370
117,142,194
John Hancock Funds IIPortfolio of Investments — August 31, 2017 (showing percentage of total net assets)
45
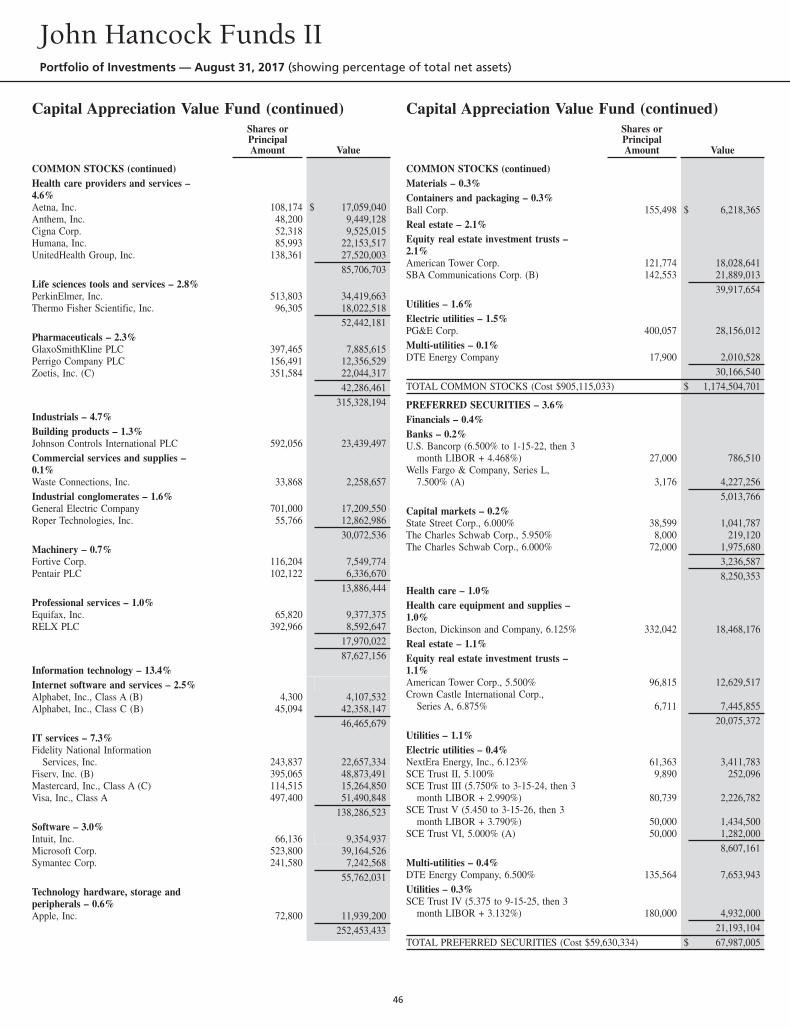
Capital Appreciation Value Fund (continued)Shares orPrincipalAmount Value
COMMON STOCKS (continued)Health care providers and services –4.6%Aetna, Inc. 108,174 $ 17,059,040Anthem, Inc. 48,200 9,449,128Cigna Corp. 52,318 9,525,015Humana, Inc. 85,993 22,153,517UnitedHealth Group, Inc. 138,361 27,520,003
85,706,703Life sciences tools and services – 2.8%PerkinElmer, Inc. 513,803 34,419,663Thermo Fisher Scientific, Inc. 96,305 18,022,518
52,442,181Pharmaceuticals – 2.3%GlaxoSmithKline PLC 397,465 7,885,615Perrigo Company PLC 156,491 12,356,529Zoetis, Inc. (C) 351,584 22,044,317
42,286,461315,328,194
Industrials – 4.7%Building products – 1.3%Johnson Controls International PLC 592,056 23,439,497Commercial services and supplies –0.1%Waste Connections, Inc. 33,868 2,258,657Industrial conglomerates – 1.6%General Electric Company 701,000 17,209,550Roper Technologies, Inc. 55,766 12,862,986
30,072,536Machinery – 0.7%Fortive Corp. 116,204 7,549,774Pentair PLC 102,122 6,336,670
13,886,444Professional services – 1.0%Equifax, Inc. 65,820 9,377,375RELX PLC 392,966 8,592,647
17,970,02287,627,156
Information technology – 13.4%Internet software and services – 2.5%Alphabet, Inc., Class A (B) 4,300 4,107,532Alphabet, Inc., Class C (B) 45,094 42,358,147
46,465,679IT services – 7.3%Fidelity National Information
Services, Inc. 243,837 22,657,334Fiserv, Inc. (B) 395,065 48,873,491Mastercard, Inc., Class A (C) 114,515 15,264,850Visa, Inc., Class A 497,400 51,490,848
138,286,523Software – 3.0%Intuit, Inc. 66,136 9,354,937Microsoft Corp. 523,800 39,164,526Symantec Corp. 241,580 7,242,568
55,762,031Technology hardware, storage andperipherals – 0.6%Apple, Inc. 72,800 11,939,200
252,453,433
Capital Appreciation Value Fund (continued)Shares orPrincipalAmount Value
COMMON STOCKS (continued)Materials – 0.3%Containers and packaging – 0.3%Ball Corp. 155,498 $ 6,218,365Real estate – 2.1%Equity real estate investment trusts –2.1%American Tower Corp. 121,774 18,028,641SBA Communications Corp. (B) 142,553 21,889,013
39,917,654Utilities – 1.6%Electric utilities – 1.5%PG&E Corp. 400,057 28,156,012Multi-utilities – 0.1%DTE Energy Company 17,900 2,010,528
30,166,540TOTAL COMMON STOCKS (Cost $905,115,033) $ 1,174,504,701
PREFERRED SECURITIES – 3.6%Financials – 0.4%Banks – 0.2%U.S. Bancorp (6.500% to 1-15-22, then 3
month LIBOR + 4.468%) 27,000 786,510Wells Fargo & Company, Series L,
7.500% (A) 3,176 4,227,2565,013,766
Capital markets – 0.2%State Street Corp., 6.000% 38,599 1,041,787The Charles Schwab Corp., 5.950% 8,000 219,120The Charles Schwab Corp., 6.000% 72,000 1,975,680
3,236,5878,250,353
Health care – 1.0%Health care equipment and supplies –1.0%Becton, Dickinson and Company, 6.125% 332,042 18,468,176Real estate – 1.1%Equity real estate investment trusts –1.1%American Tower Corp., 5.500% 96,815 12,629,517Crown Castle International Corp.,
Series A, 6.875% 6,711 7,445,85520,075,372
Utilities – 1.1%Electric utilities – 0.4%NextEra Energy, Inc., 6.123% 61,363 3,411,783SCE Trust II, 5.100% 9,890 252,096SCE Trust III (5.750% to 3-15-24, then 3
month LIBOR + 2.990%) 80,739 2,226,782SCE Trust V (5.450 to 3-15-26, then 3
month LIBOR + 3.790%) 50,000 1,434,500SCE Trust VI, 5.000% (A) 50,000 1,282,000
8,607,161Multi-utilities – 0.4%DTE Energy Company, 6.500% 135,564 7,653,943Utilities – 0.3%SCE Trust IV (5.375 to 9-15-25, then 3
month LIBOR + 3.132%) 180,000 4,932,00021,193,104
TOTAL PREFERRED SECURITIES (Cost $59,630,334) $ 67,987,005
John Hancock Funds IIPortfolio of Investments — August 31, 2017 (showing percentage of total net assets)
46
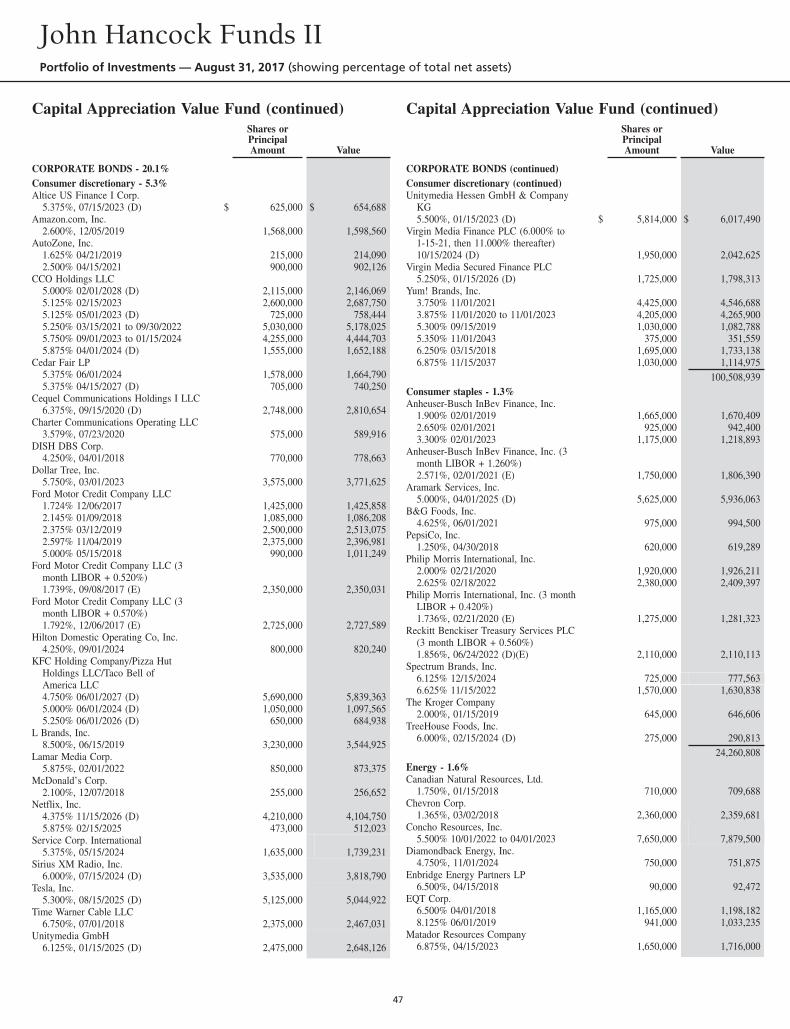
Capital Appreciation Value Fund (continued)Shares orPrincipalAmount Value
CORPORATE BONDS - 20.1%Consumer discretionary - 5.3%Altice US Finance I Corp.
5.375%, 07/15/2023 (D) $ 625,000 $ 654,688Amazon.com, Inc.
2.600%, 12/05/2019 1,568,000 1,598,560AutoZone, Inc.
1.625% 04/21/2019 215,000 214,0902.500% 04/15/2021 900,000 902,126
CCO Holdings LLC5.000% 02/01/2028 (D) 2,115,000 2,146,0695.125% 02/15/2023 2,600,000 2,687,7505.125% 05/01/2023 (D) 725,000 758,4445.250% 03/15/2021 to 09/30/2022 5,030,000 5,178,0255.750% 09/01/2023 to 01/15/2024 4,255,000 4,444,7035.875% 04/01/2024 (D) 1,555,000 1,652,188
Cedar Fair LP5.375% 06/01/2024 1,578,000 1,664,7905.375% 04/15/2027 (D) 705,000 740,250
Cequel Communications Holdings I LLC6.375%, 09/15/2020 (D) 2,748,000 2,810,654
Charter Communications Operating LLC3.579%, 07/23/2020 575,000 589,916
DISH DBS Corp.4.250%, 04/01/2018 770,000 778,663
Dollar Tree, Inc.5.750%, 03/01/2023 3,575,000 3,771,625
Ford Motor Credit Company LLC1.724% 12/06/2017 1,425,000 1,425,8582.145% 01/09/2018 1,085,000 1,086,2082.375% 03/12/2019 2,500,000 2,513,0752.597% 11/04/2019 2,375,000 2,396,9815.000% 05/15/2018 990,000 1,011,249
Ford Motor Credit Company LLC (3month LIBOR + 0.520%)1.739%, 09/08/2017 (E) 2,350,000 2,350,031
Ford Motor Credit Company LLC (3month LIBOR + 0.570%)1.792%, 12/06/2017 (E) 2,725,000 2,727,589
Hilton Domestic Operating Co, Inc.4.250%, 09/01/2024 800,000 820,240
KFC Holding Company/Pizza HutHoldings LLC/Taco Bell ofAmerica LLC4.750% 06/01/2027 (D) 5,690,000 5,839,3635.000% 06/01/2024 (D) 1,050,000 1,097,5655.250% 06/01/2026 (D) 650,000 684,938
L Brands, Inc.8.500%, 06/15/2019 3,230,000 3,544,925
Lamar Media Corp.5.875%, 02/01/2022 850,000 873,375
McDonald’s Corp.2.100%, 12/07/2018 255,000 256,652
Netflix, Inc.4.375% 11/15/2026 (D) 4,210,000 4,104,7505.875% 02/15/2025 473,000 512,023
Service Corp. International5.375%, 05/15/2024 1,635,000 1,739,231
Sirius XM Radio, Inc.6.000%, 07/15/2024 (D) 3,535,000 3,818,790
Tesla, Inc.5.300%, 08/15/2025 (D) 5,125,000 5,044,922
Time Warner Cable LLC6.750%, 07/01/2018 2,375,000 2,467,031
Unitymedia GmbH6.125%, 01/15/2025 (D) 2,475,000 2,648,126
Capital Appreciation Value Fund (continued)Shares orPrincipalAmount Value
CORPORATE BONDS (continued)Consumer discretionary (continued)Unitymedia Hessen GmbH & Company
KG5.500%, 01/15/2023 (D) $ 5,814,000 $ 6,017,490
Virgin Media Finance PLC (6.000% to1-15-21, then 11.000% thereafter)10/15/2024 (D) 1,950,000 2,042,625
Virgin Media Secured Finance PLC5.250%, 01/15/2026 (D) 1,725,000 1,798,313
Yum! Brands, Inc.3.750% 11/01/2021 4,425,000 4,546,6883.875% 11/01/2020 to 11/01/2023 4,205,000 4,265,9005.300% 09/15/2019 1,030,000 1,082,7885.350% 11/01/2043 375,000 351,5596.250% 03/15/2018 1,695,000 1,733,1386.875% 11/15/2037 1,030,000 1,114,975
100,508,939Consumer staples - 1.3%Anheuser-Busch InBev Finance, Inc.
1.900% 02/01/2019 1,665,000 1,670,4092.650% 02/01/2021 925,000 942,4003.300% 02/01/2023 1,175,000 1,218,893
Anheuser-Busch InBev Finance, Inc. (3month LIBOR + 1.260%)2.571%, 02/01/2021 (E) 1,750,000 1,806,390
Aramark Services, Inc.5.000%, 04/01/2025 (D) 5,625,000 5,936,063
B&G Foods, Inc.4.625%, 06/01/2021 975,000 994,500
PepsiCo, Inc.1.250%, 04/30/2018 620,000 619,289
Philip Morris International, Inc.2.000% 02/21/2020 1,920,000 1,926,2112.625% 02/18/2022 2,380,000 2,409,397
Philip Morris International, Inc. (3 monthLIBOR + 0.420%)1.736%, 02/21/2020 (E) 1,275,000 1,281,323
Reckitt Benckiser Treasury Services PLC(3 month LIBOR + 0.560%)1.856%, 06/24/2022 (D)(E) 2,110,000 2,110,113
Spectrum Brands, Inc.6.125% 12/15/2024 725,000 777,5636.625% 11/15/2022 1,570,000 1,630,838
The Kroger Company2.000%, 01/15/2019 645,000 646,606
TreeHouse Foods, Inc.6.000%, 02/15/2024 (D) 275,000 290,813
24,260,808Energy - 1.6%Canadian Natural Resources, Ltd.
1.750%, 01/15/2018 710,000 709,688Chevron Corp.
1.365%, 03/02/2018 2,360,000 2,359,681Concho Resources, Inc.
5.500% 10/01/2022 to 04/01/2023 7,650,000 7,879,500Diamondback Energy, Inc.
4.750%, 11/01/2024 750,000 751,875Enbridge Energy Partners LP
6.500%, 04/15/2018 90,000 92,472EQT Corp.
6.500% 04/01/2018 1,165,000 1,198,1828.125% 06/01/2019 941,000 1,033,235
Matador Resources Company6.875%, 04/15/2023 1,650,000 1,716,000
John Hancock Funds IIPortfolio of Investments — August 31, 2017 (showing percentage of total net assets)
47
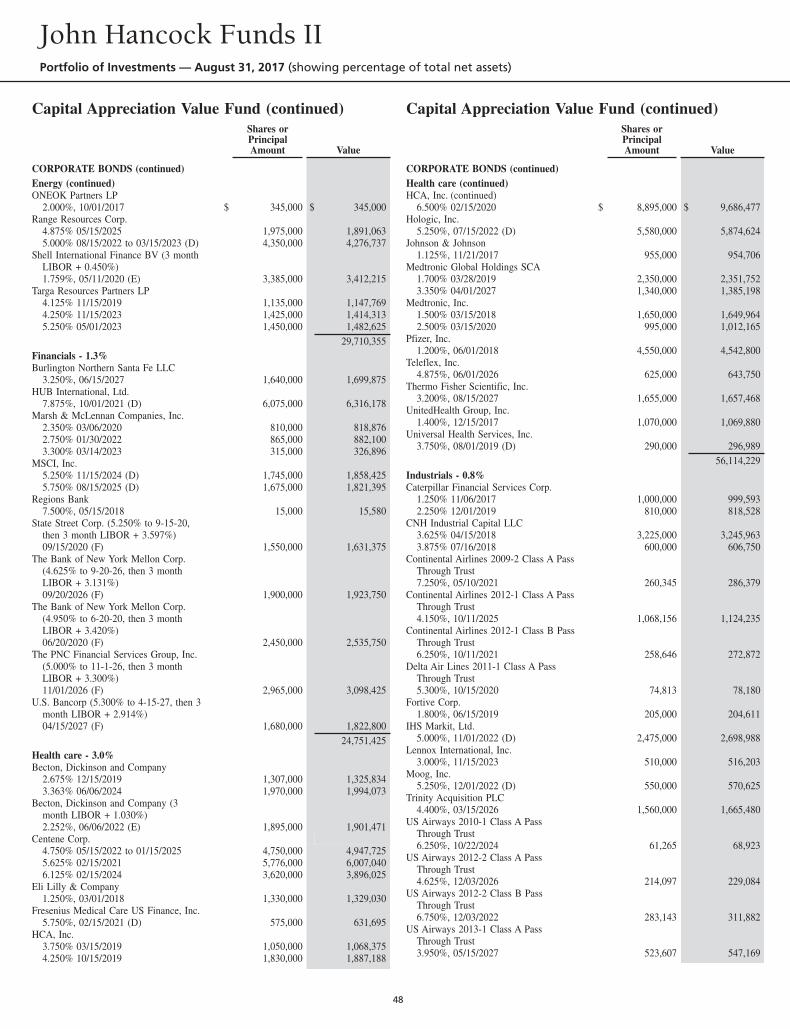
Capital Appreciation Value Fund (continued)Shares orPrincipalAmount Value
CORPORATE BONDS (continued)Energy (continued)ONEOK Partners LP
2.000%, 10/01/2017 $ 345,000 $ 345,000Range Resources Corp.
4.875% 05/15/2025 1,975,000 1,891,0635.000% 08/15/2022 to 03/15/2023 (D) 4,350,000 4,276,737
Shell International Finance BV (3 monthLIBOR + 0.450%)1.759%, 05/11/2020 (E) 3,385,000 3,412,215
Targa Resources Partners LP4.125% 11/15/2019 1,135,000 1,147,7694.250% 11/15/2023 1,425,000 1,414,3135.250% 05/01/2023 1,450,000 1,482,625
29,710,355Financials - 1.3%Burlington Northern Santa Fe LLC
3.250%, 06/15/2027 1,640,000 1,699,875HUB International, Ltd.
7.875%, 10/01/2021 (D) 6,075,000 6,316,178Marsh & McLennan Companies, Inc.
2.350% 03/06/2020 810,000 818,8762.750% 01/30/2022 865,000 882,1003.300% 03/14/2023 315,000 326,896
MSCI, Inc.5.250% 11/15/2024 (D) 1,745,000 1,858,4255.750% 08/15/2025 (D) 1,675,000 1,821,395
Regions Bank7.500%, 05/15/2018 15,000 15,580
State Street Corp. (5.250% to 9-15-20,then 3 month LIBOR + 3.597%)09/15/2020 (F) 1,550,000 1,631,375
The Bank of New York Mellon Corp.(4.625% to 9-20-26, then 3 monthLIBOR + 3.131%)09/20/2026 (F) 1,900,000 1,923,750
The Bank of New York Mellon Corp.(4.950% to 6-20-20, then 3 monthLIBOR + 3.420%)06/20/2020 (F) 2,450,000 2,535,750
The PNC Financial Services Group, Inc.(5.000% to 11-1-26, then 3 monthLIBOR + 3.300%)11/01/2026 (F) 2,965,000 3,098,425
U.S. Bancorp (5.300% to 4-15-27, then 3month LIBOR + 2.914%)04/15/2027 (F) 1,680,000 1,822,800
24,751,425Health care - 3.0%Becton, Dickinson and Company
2.675% 12/15/2019 1,307,000 1,325,8343.363% 06/06/2024 1,970,000 1,994,073
Becton, Dickinson and Company (3month LIBOR + 1.030%)2.252%, 06/06/2022 (E) 1,895,000 1,901,471
Centene Corp.4.750% 05/15/2022 to 01/15/2025 4,750,000 4,947,7255.625% 02/15/2021 5,776,000 6,007,0406.125% 02/15/2024 3,620,000 3,896,025
Eli Lilly & Company1.250%, 03/01/2018 1,330,000 1,329,030
Fresenius Medical Care US Finance, Inc.5.750%, 02/15/2021 (D) 575,000 631,695
HCA, Inc.3.750% 03/15/2019 1,050,000 1,068,3754.250% 10/15/2019 1,830,000 1,887,188
Capital Appreciation Value Fund (continued)Shares orPrincipalAmount Value
CORPORATE BONDS (continued)Health care (continued)HCA, Inc. (continued)
6.500% 02/15/2020 $ 8,895,000 $ 9,686,477Hologic, Inc.
5.250%, 07/15/2022 (D) 5,580,000 5,874,624Johnson & Johnson
1.125%, 11/21/2017 955,000 954,706Medtronic Global Holdings SCA
1.700% 03/28/2019 2,350,000 2,351,7523.350% 04/01/2027 1,340,000 1,385,198
Medtronic, Inc.1.500% 03/15/2018 1,650,000 1,649,9642.500% 03/15/2020 995,000 1,012,165
Pfizer, Inc.1.200%, 06/01/2018 4,550,000 4,542,800
Teleflex, Inc.4.875%, 06/01/2026 625,000 643,750
Thermo Fisher Scientific, Inc.3.200%, 08/15/2027 1,655,000 1,657,468
UnitedHealth Group, Inc.1.400%, 12/15/2017 1,070,000 1,069,880
Universal Health Services, Inc.3.750%, 08/01/2019 (D) 290,000 296,989
56,114,229Industrials - 0.8%Caterpillar Financial Services Corp.
1.250% 11/06/2017 1,000,000 999,5932.250% 12/01/2019 810,000 818,528
CNH Industrial Capital LLC3.625% 04/15/2018 3,225,000 3,245,9633.875% 07/16/2018 600,000 606,750
Continental Airlines 2009-2 Class A PassThrough Trust7.250%, 05/10/2021 260,345 286,379
Continental Airlines 2012-1 Class A PassThrough Trust4.150%, 10/11/2025 1,068,156 1,124,235
Continental Airlines 2012-1 Class B PassThrough Trust6.250%, 10/11/2021 258,646 272,872
Delta Air Lines 2011-1 Class A PassThrough Trust5.300%, 10/15/2020 74,813 78,180
Fortive Corp.1.800%, 06/15/2019 205,000 204,611
IHS Markit, Ltd.5.000%, 11/01/2022 (D) 2,475,000 2,698,988
Lennox International, Inc.3.000%, 11/15/2023 510,000 516,203
Moog, Inc.5.250%, 12/01/2022 (D) 550,000 570,625
Trinity Acquisition PLC4.400%, 03/15/2026 1,560,000 1,665,480
US Airways 2010-1 Class A PassThrough Trust6.250%, 10/22/2024 61,265 68,923
US Airways 2012-2 Class A PassThrough Trust4.625%, 12/03/2026 214,097 229,084
US Airways 2012-2 Class B PassThrough Trust6.750%, 12/03/2022 283,143 311,882
US Airways 2013-1 Class A PassThrough Trust3.950%, 05/15/2027 523,607 547,169
John Hancock Funds IIPortfolio of Investments — August 31, 2017 (showing percentage of total net assets)
48
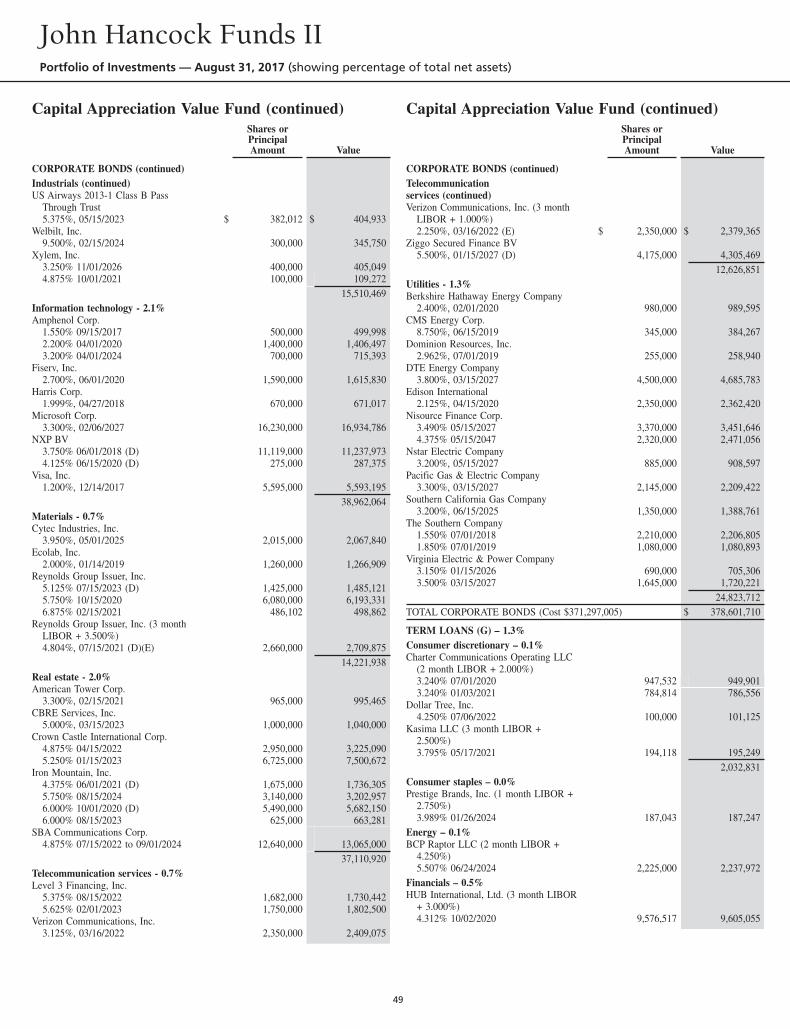
Capital Appreciation Value Fund (continued)Shares orPrincipalAmount Value
CORPORATE BONDS (continued)Industrials (continued)US Airways 2013-1 Class B Pass
Through Trust5.375%, 05/15/2023 $ 382,012 $ 404,933
Welbilt, Inc.9.500%, 02/15/2024 300,000 345,750
Xylem, Inc.3.250% 11/01/2026 400,000 405,0494.875% 10/01/2021 100,000 109,272
15,510,469Information technology - 2.1%Amphenol Corp.
1.550% 09/15/2017 500,000 499,9982.200% 04/01/2020 1,400,000 1,406,4973.200% 04/01/2024 700,000 715,393
Fiserv, Inc.2.700%, 06/01/2020 1,590,000 1,615,830
Harris Corp.1.999%, 04/27/2018 670,000 671,017
Microsoft Corp.3.300%, 02/06/2027 16,230,000 16,934,786
NXP BV3.750% 06/01/2018 (D) 11,119,000 11,237,9734.125% 06/15/2020 (D) 275,000 287,375
Visa, Inc.1.200%, 12/14/2017 5,595,000 5,593,195
38,962,064Materials - 0.7%Cytec Industries, Inc.
3.950%, 05/01/2025 2,015,000 2,067,840Ecolab, Inc.
2.000%, 01/14/2019 1,260,000 1,266,909Reynolds Group Issuer, Inc.
5.125% 07/15/2023 (D) 1,425,000 1,485,1215.750% 10/15/2020 6,080,000 6,193,3316.875% 02/15/2021 486,102 498,862
Reynolds Group Issuer, Inc. (3 monthLIBOR + 3.500%)4.804%, 07/15/2021 (D)(E) 2,660,000 2,709,875
14,221,938Real estate - 2.0%American Tower Corp.
3.300%, 02/15/2021 965,000 995,465CBRE Services, Inc.
5.000%, 03/15/2023 1,000,000 1,040,000Crown Castle International Corp.
4.875% 04/15/2022 2,950,000 3,225,0905.250% 01/15/2023 6,725,000 7,500,672
Iron Mountain, Inc.4.375% 06/01/2021 (D) 1,675,000 1,736,3055.750% 08/15/2024 3,140,000 3,202,9576.000% 10/01/2020 (D) 5,490,000 5,682,1506.000% 08/15/2023 625,000 663,281
SBA Communications Corp.4.875% 07/15/2022 to 09/01/2024 12,640,000 13,065,000
37,110,920Telecommunication services - 0.7%Level 3 Financing, Inc.
5.375% 08/15/2022 1,682,000 1,730,4425.625% 02/01/2023 1,750,000 1,802,500
Verizon Communications, Inc.3.125%, 03/16/2022 2,350,000 2,409,075
Capital Appreciation Value Fund (continued)Shares orPrincipalAmount Value
CORPORATE BONDS (continued)Telecommunicationservices (continued)Verizon Communications, Inc. (3 month
LIBOR + 1.000%)2.250%, 03/16/2022 (E) $ 2,350,000 $ 2,379,365
Ziggo Secured Finance BV5.500%, 01/15/2027 (D) 4,175,000 4,305,469
12,626,851Utilities - 1.3%Berkshire Hathaway Energy Company
2.400%, 02/01/2020 980,000 989,595CMS Energy Corp.
8.750%, 06/15/2019 345,000 384,267Dominion Resources, Inc.
2.962%, 07/01/2019 255,000 258,940DTE Energy Company
3.800%, 03/15/2027 4,500,000 4,685,783Edison International
2.125%, 04/15/2020 2,350,000 2,362,420Nisource Finance Corp.
3.490% 05/15/2027 3,370,000 3,451,6464.375% 05/15/2047 2,320,000 2,471,056
Nstar Electric Company3.200%, 05/15/2027 885,000 908,597
Pacific Gas & Electric Company3.300%, 03/15/2027 2,145,000 2,209,422
Southern California Gas Company3.200%, 06/15/2025 1,350,000 1,388,761
The Southern Company1.550% 07/01/2018 2,210,000 2,206,8051.850% 07/01/2019 1,080,000 1,080,893
Virginia Electric & Power Company3.150% 01/15/2026 690,000 705,3063.500% 03/15/2027 1,645,000 1,720,221
24,823,712TOTAL CORPORATE BONDS (Cost $371,297,005) $ 378,601,710
TERM LOANS (G) – 1.3%Consumer discretionary – 0.1%Charter Communications Operating LLC
(2 month LIBOR + 2.000%)3.240% 07/01/2020 947,532 949,9013.240% 01/03/2021 784,814 786,556
Dollar Tree, Inc.4.250% 07/06/2022 100,000 101,125
Kasima LLC (3 month LIBOR +2.500%)3.795% 05/17/2021 194,118 195,249
2,032,831Consumer staples – 0.0%Prestige Brands, Inc. (1 month LIBOR +
2.750%)3.989% 01/26/2024 187,043 187,247
Energy – 0.1%BCP Raptor LLC (2 month LIBOR +
4.250%)5.507% 06/24/2024 2,225,000 2,237,972
Financials – 0.5%HUB International, Ltd. (3 month LIBOR
+ 3.000%)4.312% 10/02/2020 9,576,517 9,605,055
John Hancock Funds IIPortfolio of Investments — August 31, 2017 (showing percentage of total net assets)
49
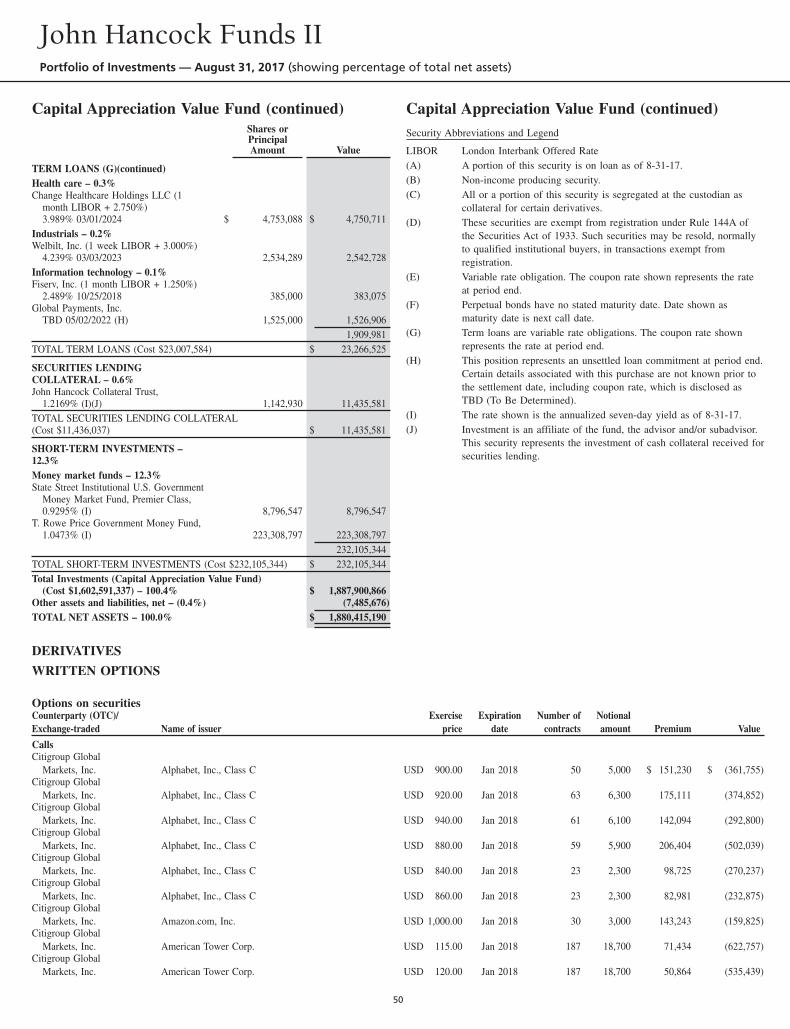
Capital Appreciation Value Fund (continued)Shares orPrincipalAmount Value
TERM LOANS (G)(continued)Health care – 0.3%Change Healthcare Holdings LLC (1
month LIBOR + 2.750%)3.989% 03/01/2024 $ 4,753,088 $ 4,750,711
Industrials – 0.2%Welbilt, Inc. (1 week LIBOR + 3.000%)
4.239% 03/03/2023 2,534,289 2,542,728Information technology – 0.1%Fiserv, Inc. (1 month LIBOR + 1.250%)
2.489% 10/25/2018 385,000 383,075Global Payments, Inc.
TBD 05/02/2022 (H) 1,525,000 1,526,9061,909,981
TOTAL TERM LOANS (Cost $23,007,584) $ 23,266,525
SECURITIES LENDINGCOLLATERAL – 0.6%John Hancock Collateral Trust,
1.2169% (I)(J) 1,142,930 11,435,581TOTAL SECURITIES LENDING COLLATERAL(Cost $11,436,037) $ 11,435,581
SHORT-TERM INVESTMENTS –12.3%Money market funds – 12.3%State Street Institutional U.S. Government
Money Market Fund, Premier Class,0.9295% (I) 8,796,547 8,796,547
T. Rowe Price Government Money Fund,1.0473% (I) 223,308,797 223,308,797
232,105,344TOTAL SHORT-TERM INVESTMENTS (Cost $232,105,344) $ 232,105,344Total Investments (Capital Appreciation Value Fund)
(Cost $1,602,591,337) – 100.4% $ 1,887,900,866Other assets and liabilities, net – (0.4%) (7,485,676)TOTAL NET ASSETS – 100.0% $ 1,880,415,190
Capital Appreciation Value Fund (continued)Security Abbreviations and Legend
LIBOR London Interbank Offered Rate(A) A portion of this security is on loan as of 8-31-17.(B) Non-income producing security.(C) All or a portion of this security is segregated at the custodian as
collateral for certain derivatives.(D) These securities are exempt from registration under Rule 144A of
the Securities Act of 1933. Such securities may be resold, normallyto qualified institutional buyers, in transactions exempt fromregistration.
(E) Variable rate obligation. The coupon rate shown represents the rateat period end.
(F) Perpetual bonds have no stated maturity date. Date shown asmaturity date is next call date.
(G) Term loans are variable rate obligations. The coupon rate shownrepresents the rate at period end.
(H) This position represents an unsettled loan commitment at period end.Certain details associated with this purchase are not known prior tothe settlement date, including coupon rate, which is disclosed asTBD (To Be Determined).
(I) The rate shown is the annualized seven-day yield as of 8-31-17.(J) Investment is an affiliate of the fund, the advisor and/or subadvisor.
This security represents the investment of cash collateral received forsecurities lending.
DERIVATIVES
WRITTEN OPTIONS
Options on securitiesCounterparty (OTC)/Exchange-traded Name of issuer
Exerciseprice
Expirationdate
Number ofcontracts
Notionalamount Premium Value
CallsCitigroup Global
Markets, Inc. Alphabet, Inc., Class C USD 900.00 Jan 2018 50 5,000 $ 151,230 $ (361,755)Citigroup Global
Markets, Inc. Alphabet, Inc., Class C USD 920.00 Jan 2018 63 6,300 175,111 (374,852)Citigroup Global
Markets, Inc. Alphabet, Inc., Class C USD 940.00 Jan 2018 61 6,100 142,094 (292,800)Citigroup Global
Markets, Inc. Alphabet, Inc., Class C USD 880.00 Jan 2018 59 5,900 206,404 (502,039)Citigroup Global
Markets, Inc. Alphabet, Inc., Class C USD 840.00 Jan 2018 23 2,300 98,725 (270,237)Citigroup Global
Markets, Inc. Alphabet, Inc., Class C USD 860.00 Jan 2018 23 2,300 82,981 (232,875)Citigroup Global
Markets, Inc. Amazon.com, Inc. USD 1,000.00 Jan 2018 30 3,000 143,243 (159,825)Citigroup Global
Markets, Inc. American Tower Corp. USD 115.00 Jan 2018 187 18,700 71,434 (622,757)Citigroup Global
Markets, Inc. American Tower Corp. USD 120.00 Jan 2018 187 18,700 50,864 (535,439)
John Hancock Funds IIPortfolio of Investments — August 31, 2017 (showing percentage of total net assets)
50
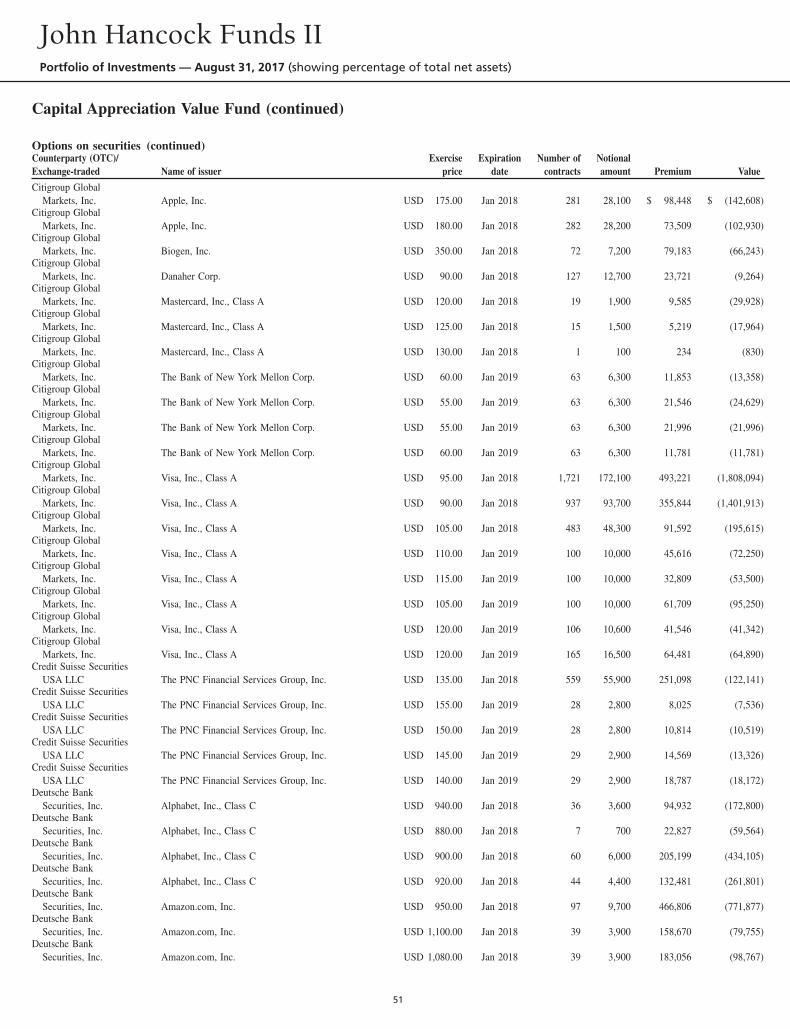
Capital Appreciation Value Fund (continued)
Options on securities (continued)Counterparty (OTC)/Exchange-traded Name of issuer
Exerciseprice
Expirationdate
Number ofcontracts
Notionalamount Premium Value
Citigroup GlobalMarkets, Inc. Apple, Inc. USD 175.00 Jan 2018 281 28,100 $ 98,448 $ (142,608)
Citigroup GlobalMarkets, Inc. Apple, Inc. USD 180.00 Jan 2018 282 28,200 73,509 (102,930)
Citigroup GlobalMarkets, Inc. Biogen, Inc. USD 350.00 Jan 2018 72 7,200 79,183 (66,243)
Citigroup GlobalMarkets, Inc. Danaher Corp. USD 90.00 Jan 2018 127 12,700 23,721 (9,264)
Citigroup GlobalMarkets, Inc. Mastercard, Inc., Class A USD 120.00 Jan 2018 19 1,900 9,585 (29,928)
Citigroup GlobalMarkets, Inc. Mastercard, Inc., Class A USD 125.00 Jan 2018 15 1,500 5,219 (17,964)
Citigroup GlobalMarkets, Inc. Mastercard, Inc., Class A USD 130.00 Jan 2018 1 100 234 (830)
Citigroup GlobalMarkets, Inc. The Bank of New York Mellon Corp. USD 60.00 Jan 2019 63 6,300 11,853 (13,358)
Citigroup GlobalMarkets, Inc. The Bank of New York Mellon Corp. USD 55.00 Jan 2019 63 6,300 21,546 (24,629)
Citigroup GlobalMarkets, Inc. The Bank of New York Mellon Corp. USD 55.00 Jan 2019 63 6,300 21,996 (21,996)
Citigroup GlobalMarkets, Inc. The Bank of New York Mellon Corp. USD 60.00 Jan 2019 63 6,300 11,781 (11,781)
Citigroup GlobalMarkets, Inc. Visa, Inc., Class A USD 95.00 Jan 2018 1,721 172,100 493,221 (1,808,094)
Citigroup GlobalMarkets, Inc. Visa, Inc., Class A USD 90.00 Jan 2018 937 93,700 355,844 (1,401,913)
Citigroup GlobalMarkets, Inc. Visa, Inc., Class A USD 105.00 Jan 2018 483 48,300 91,592 (195,615)
Citigroup GlobalMarkets, Inc. Visa, Inc., Class A USD 110.00 Jan 2019 100 10,000 45,616 (72,250)
Citigroup GlobalMarkets, Inc. Visa, Inc., Class A USD 115.00 Jan 2019 100 10,000 32,809 (53,500)
Citigroup GlobalMarkets, Inc. Visa, Inc., Class A USD 105.00 Jan 2019 100 10,000 61,709 (95,250)
Citigroup GlobalMarkets, Inc. Visa, Inc., Class A USD 120.00 Jan 2019 106 10,600 41,546 (41,342)
Citigroup GlobalMarkets, Inc. Visa, Inc., Class A USD 120.00 Jan 2019 165 16,500 64,481 (64,890)
Credit Suisse SecuritiesUSA LLC The PNC Financial Services Group, Inc. USD 135.00 Jan 2018 559 55,900 251,098 (122,141)
Credit Suisse SecuritiesUSA LLC The PNC Financial Services Group, Inc. USD 155.00 Jan 2019 28 2,800 8,025 (7,536)
Credit Suisse SecuritiesUSA LLC The PNC Financial Services Group, Inc. USD 150.00 Jan 2019 28 2,800 10,814 (10,519)
Credit Suisse SecuritiesUSA LLC The PNC Financial Services Group, Inc. USD 145.00 Jan 2019 29 2,900 14,569 (13,326)
Credit Suisse SecuritiesUSA LLC The PNC Financial Services Group, Inc. USD 140.00 Jan 2019 29 2,900 18,787 (18,172)
Deutsche BankSecurities, Inc. Alphabet, Inc., Class C USD 940.00 Jan 2018 36 3,600 94,932 (172,800)
Deutsche BankSecurities, Inc. Alphabet, Inc., Class C USD 880.00 Jan 2018 7 700 22,827 (59,564)
Deutsche BankSecurities, Inc. Alphabet, Inc., Class C USD 900.00 Jan 2018 60 6,000 205,199 (434,105)
Deutsche BankSecurities, Inc. Alphabet, Inc., Class C USD 920.00 Jan 2018 44 4,400 132,481 (261,801)
Deutsche BankSecurities, Inc. Amazon.com, Inc. USD 950.00 Jan 2018 97 9,700 466,806 (771,877)
Deutsche BankSecurities, Inc. Amazon.com, Inc. USD 1,100.00 Jan 2018 39 3,900 158,670 (79,755)
Deutsche BankSecurities, Inc. Amazon.com, Inc. USD 1,080.00 Jan 2018 39 3,900 183,056 (98,767)
John Hancock Funds IIPortfolio of Investments — August 31, 2017 (showing percentage of total net assets)
51
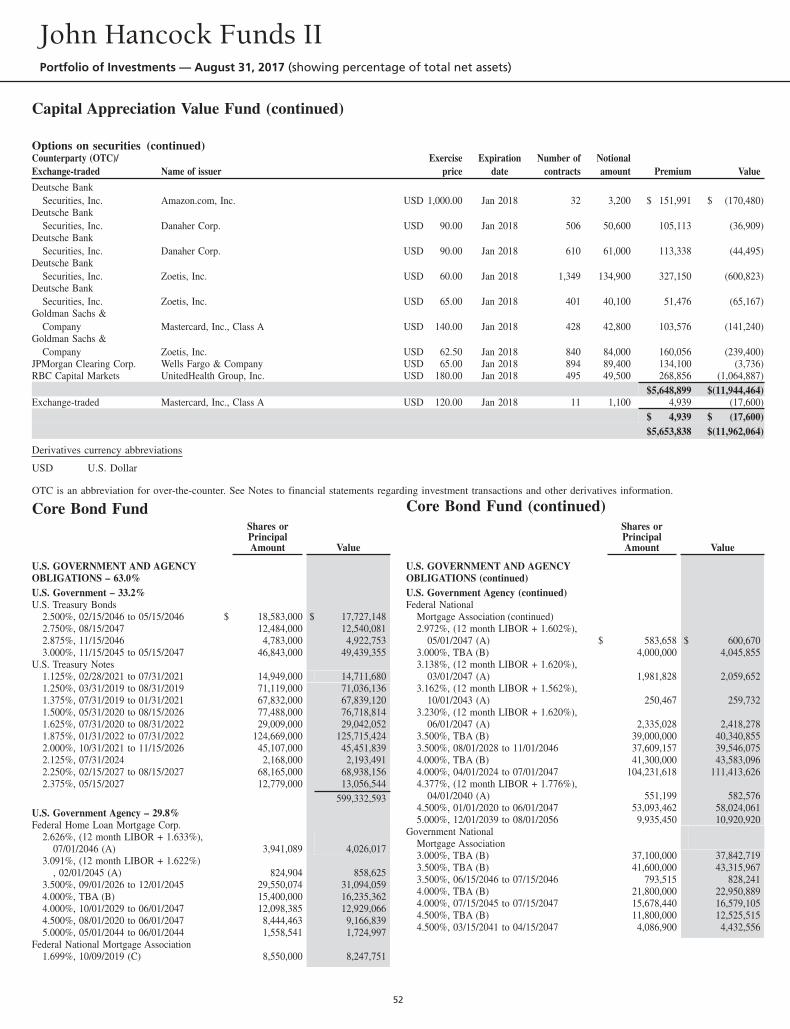
Capital Appreciation Value Fund (continued)
Options on securities (continued)Counterparty (OTC)/Exchange-traded Name of issuer
Exerciseprice
Expirationdate
Number ofcontracts
Notionalamount Premium Value
Deutsche BankSecurities, Inc. Amazon.com, Inc. USD 1,000.00 Jan 2018 32 3,200 $ 151,991 $ (170,480)
Deutsche BankSecurities, Inc. Danaher Corp. USD 90.00 Jan 2018 506 50,600 105,113 (36,909)
Deutsche BankSecurities, Inc. Danaher Corp. USD 90.00 Jan 2018 610 61,000 113,338 (44,495)
Deutsche BankSecurities, Inc. Zoetis, Inc. USD 60.00 Jan 2018 1,349 134,900 327,150 (600,823)
Deutsche BankSecurities, Inc. Zoetis, Inc. USD 65.00 Jan 2018 401 40,100 51,476 (65,167)
Goldman Sachs &Company Mastercard, Inc., Class A USD 140.00 Jan 2018 428 42,800 103,576 (141,240)
Goldman Sachs &Company Zoetis, Inc. USD 62.50 Jan 2018 840 84,000 160,056 (239,400)
JPMorgan Clearing Corp. Wells Fargo & Company USD 65.00 Jan 2018 894 89,400 134,100 (3,736)RBC Capital Markets UnitedHealth Group, Inc. USD 180.00 Jan 2018 495 49,500 268,856 (1,064,887)
$5,648,899 $(11,944,464)Exchange-traded Mastercard, Inc., Class A USD 120.00 Jan 2018 11 1,100 4,939 (17,600)
$ 4,939 $ (17,600)$5,653,838 $(11,962,064)
Derivatives currency abbreviations
USD U.S. Dollar
OTC is an abbreviation for over-the-counter. See Notes to financial statements regarding investment transactions and other derivatives information.
Core Bond FundShares orPrincipalAmount Value
U.S. GOVERNMENT AND AGENCYOBLIGATIONS – 63.0%U.S. Government – 33.2%U.S. Treasury Bonds
2.500%, 02/15/2046 to 05/15/2046 $ 18,583,000 $ 17,727,1482.750%, 08/15/2047 12,484,000 12,540,0812.875%, 11/15/2046 4,783,000 4,922,7533.000%, 11/15/2045 to 05/15/2047 46,843,000 49,439,355
U.S. Treasury Notes1.125%, 02/28/2021 to 07/31/2021 14,949,000 14,711,6801.250%, 03/31/2019 to 08/31/2019 71,119,000 71,036,1361.375%, 07/31/2019 to 01/31/2021 67,832,000 67,839,1201.500%, 05/31/2020 to 08/15/2026 77,488,000 76,718,8141.625%, 07/31/2020 to 08/31/2022 29,009,000 29,042,0521.875%, 01/31/2022 to 07/31/2022 124,669,000 125,715,4242.000%, 10/31/2021 to 11/15/2026 45,107,000 45,451,8392.125%, 07/31/2024 2,168,000 2,193,4912.250%, 02/15/2027 to 08/15/2027 68,165,000 68,938,1562.375%, 05/15/2027 12,779,000 13,056,544
599,332,593U.S. Government Agency – 29.8%Federal Home Loan Mortgage Corp.
2.626%, (12 month LIBOR + 1.633%),07/01/2046 (A) 3,941,089 4,026,017
3.091%, (12 month LIBOR + 1.622%), 02/01/2045 (A) 824,904 858,625
3.500%, 09/01/2026 to 12/01/2045 29,550,074 31,094,0594.000%, TBA (B) 15,400,000 16,235,3624.000%, 10/01/2029 to 06/01/2047 12,098,385 12,929,0664.500%, 08/01/2020 to 06/01/2047 8,444,463 9,166,8395.000%, 05/01/2044 to 06/01/2044 1,558,541 1,724,997
Federal National Mortgage Association1.699%, 10/09/2019 (C) 8,550,000 8,247,751
Core Bond Fund (continued)Shares orPrincipalAmount Value
U.S. GOVERNMENT AND AGENCYOBLIGATIONS (continued)U.S. Government Agency (continued)Federal National
Mortgage Association (continued)2.972%, (12 month LIBOR + 1.602%),
05/01/2047 (A) $ 583,658 $ 600,6703.000%, TBA (B) 4,000,000 4,045,8553.138%, (12 month LIBOR + 1.620%),
03/01/2047 (A) 1,981,828 2,059,6523.162%, (12 month LIBOR + 1.562%),
10/01/2043 (A) 250,467 259,7323.230%, (12 month LIBOR + 1.620%),
06/01/2047 (A) 2,335,028 2,418,2783.500%, TBA (B) 39,000,000 40,340,8553.500%, 08/01/2028 to 11/01/2046 37,609,157 39,546,0754.000%, TBA (B) 41,300,000 43,583,0964.000%, 04/01/2024 to 07/01/2047 104,231,618 111,413,6264.377%, (12 month LIBOR + 1.776%),
04/01/2040 (A) 551,199 582,5764.500%, 01/01/2020 to 06/01/2047 53,093,462 58,024,0615.000%, 12/01/2039 to 08/01/2056 9,935,450 10,920,920
Government NationalMortgage Association3.000%, TBA (B) 37,100,000 37,842,7193.500%, TBA (B) 41,600,000 43,315,9673.500%, 06/15/2046 to 07/15/2046 793,515 828,2414.000%, TBA (B) 21,800,000 22,950,8894.000%, 07/15/2045 to 07/15/2047 15,678,440 16,579,1054.500%, TBA (B) 11,800,000 12,525,5154.500%, 03/15/2041 to 04/15/2047 4,086,900 4,432,556
John Hancock Funds IIPortfolio of Investments — August 31, 2017 (showing percentage of total net assets)
52
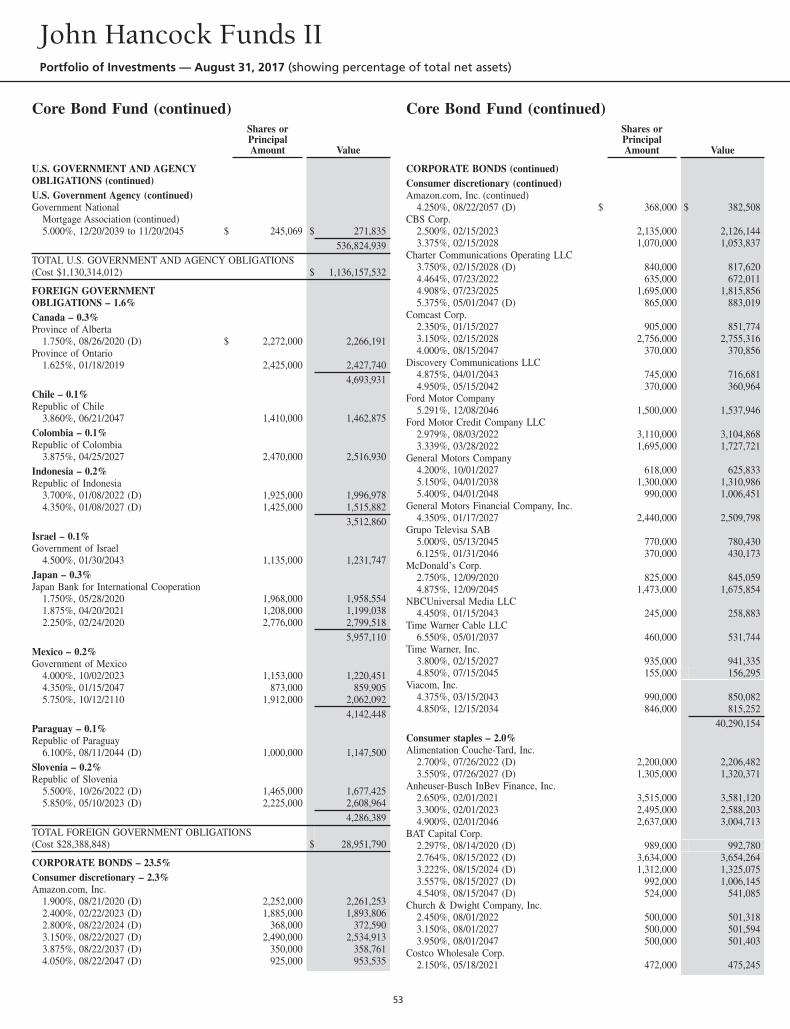
Core Bond Fund (continued)Shares orPrincipalAmount Value
U.S. GOVERNMENT AND AGENCYOBLIGATIONS (continued)U.S. Government Agency (continued)Government National
Mortgage Association (continued)5.000%, 12/20/2039 to 11/20/2045 $ 245,069 $ 271,835
536,824,939TOTAL U.S. GOVERNMENT AND AGENCY OBLIGATIONS(Cost $1,130,314,012) $ 1,136,157,532
FOREIGN GOVERNMENTOBLIGATIONS – 1.6%Canada – 0.3%Province of Alberta
1.750%, 08/26/2020 (D) $ 2,272,000 2,266,191Province of Ontario
1.625%, 01/18/2019 2,425,000 2,427,7404,693,931
Chile – 0.1%Republic of Chile
3.860%, 06/21/2047 1,410,000 1,462,875Colombia – 0.1%Republic of Colombia
3.875%, 04/25/2027 2,470,000 2,516,930Indonesia – 0.2%Republic of Indonesia
3.700%, 01/08/2022 (D) 1,925,000 1,996,9784.350%, 01/08/2027 (D) 1,425,000 1,515,882
3,512,860Israel – 0.1%Government of Israel
4.500%, 01/30/2043 1,135,000 1,231,747Japan – 0.3%Japan Bank for International Cooperation
1.750%, 05/28/2020 1,968,000 1,958,5541.875%, 04/20/2021 1,208,000 1,199,0382.250%, 02/24/2020 2,776,000 2,799,518
5,957,110Mexico – 0.2%Government of Mexico
4.000%, 10/02/2023 1,153,000 1,220,4514.350%, 01/15/2047 873,000 859,9055.750%, 10/12/2110 1,912,000 2,062,092
4,142,448Paraguay – 0.1%Republic of Paraguay
6.100%, 08/11/2044 (D) 1,000,000 1,147,500Slovenia – 0.2%Republic of Slovenia
5.500%, 10/26/2022 (D) 1,465,000 1,677,4255.850%, 05/10/2023 (D) 2,225,000 2,608,964
4,286,389TOTAL FOREIGN GOVERNMENT OBLIGATIONS(Cost $28,388,848) $ 28,951,790
CORPORATE BONDS – 23.5%Consumer discretionary – 2.3%Amazon.com, Inc.
1.900%, 08/21/2020 (D) 2,252,000 2,261,2532.400%, 02/22/2023 (D) 1,885,000 1,893,8062.800%, 08/22/2024 (D) 368,000 372,5903.150%, 08/22/2027 (D) 2,490,000 2,534,9133.875%, 08/22/2037 (D) 350,000 358,7614.050%, 08/22/2047 (D) 925,000 953,535
Core Bond Fund (continued)Shares orPrincipalAmount Value
CORPORATE BONDS (continued)Consumer discretionary (continued)Amazon.com, Inc. (continued)
4.250%, 08/22/2057 (D) $ 368,000 $ 382,508CBS Corp.
2.500%, 02/15/2023 2,135,000 2,126,1443.375%, 02/15/2028 1,070,000 1,053,837
Charter Communications Operating LLC3.750%, 02/15/2028 (D) 840,000 817,6204.464%, 07/23/2022 635,000 672,0114.908%, 07/23/2025 1,695,000 1,815,8565.375%, 05/01/2047 (D) 865,000 883,019
Comcast Corp.2.350%, 01/15/2027 905,000 851,7743.150%, 02/15/2028 2,756,000 2,755,3164.000%, 08/15/2047 370,000 370,856
Discovery Communications LLC4.875%, 04/01/2043 745,000 716,6814.950%, 05/15/2042 370,000 360,964
Ford Motor Company5.291%, 12/08/2046 1,500,000 1,537,946
Ford Motor Credit Company LLC2.979%, 08/03/2022 3,110,000 3,104,8683.339%, 03/28/2022 1,695,000 1,727,721
General Motors Company4.200%, 10/01/2027 618,000 625,8335.150%, 04/01/2038 1,300,000 1,310,9865.400%, 04/01/2048 990,000 1,006,451
General Motors Financial Company, Inc.4.350%, 01/17/2027 2,440,000 2,509,798
Grupo Televisa SAB5.000%, 05/13/2045 770,000 780,4306.125%, 01/31/2046 370,000 430,173
McDonald’s Corp.2.750%, 12/09/2020 825,000 845,0594.875%, 12/09/2045 1,473,000 1,675,854
NBCUniversal Media LLC4.450%, 01/15/2043 245,000 258,883
Time Warner Cable LLC6.550%, 05/01/2037 460,000 531,744
Time Warner, Inc.3.800%, 02/15/2027 935,000 941,3354.850%, 07/15/2045 155,000 156,295
Viacom, Inc.4.375%, 03/15/2043 990,000 850,0824.850%, 12/15/2034 846,000 815,252
40,290,154Consumer staples – 2.0%Alimentation Couche-Tard, Inc.
2.700%, 07/26/2022 (D) 2,200,000 2,206,4823.550%, 07/26/2027 (D) 1,305,000 1,320,371
Anheuser-Busch InBev Finance, Inc.2.650%, 02/01/2021 3,515,000 3,581,1203.300%, 02/01/2023 2,495,000 2,588,2034.900%, 02/01/2046 2,637,000 3,004,713
BAT Capital Corp.2.297%, 08/14/2020 (D) 989,000 992,7802.764%, 08/15/2022 (D) 3,634,000 3,654,2643.222%, 08/15/2024 (D) 1,312,000 1,325,0753.557%, 08/15/2027 (D) 992,000 1,006,1454.540%, 08/15/2047 (D) 524,000 541,085
Church & Dwight Company, Inc.2.450%, 08/01/2022 500,000 501,3183.150%, 08/01/2027 500,000 501,5943.950%, 08/01/2047 500,000 501,403
Costco Wholesale Corp.2.150%, 05/18/2021 472,000 475,245
John Hancock Funds IIPortfolio of Investments — August 31, 2017 (showing percentage of total net assets)
53
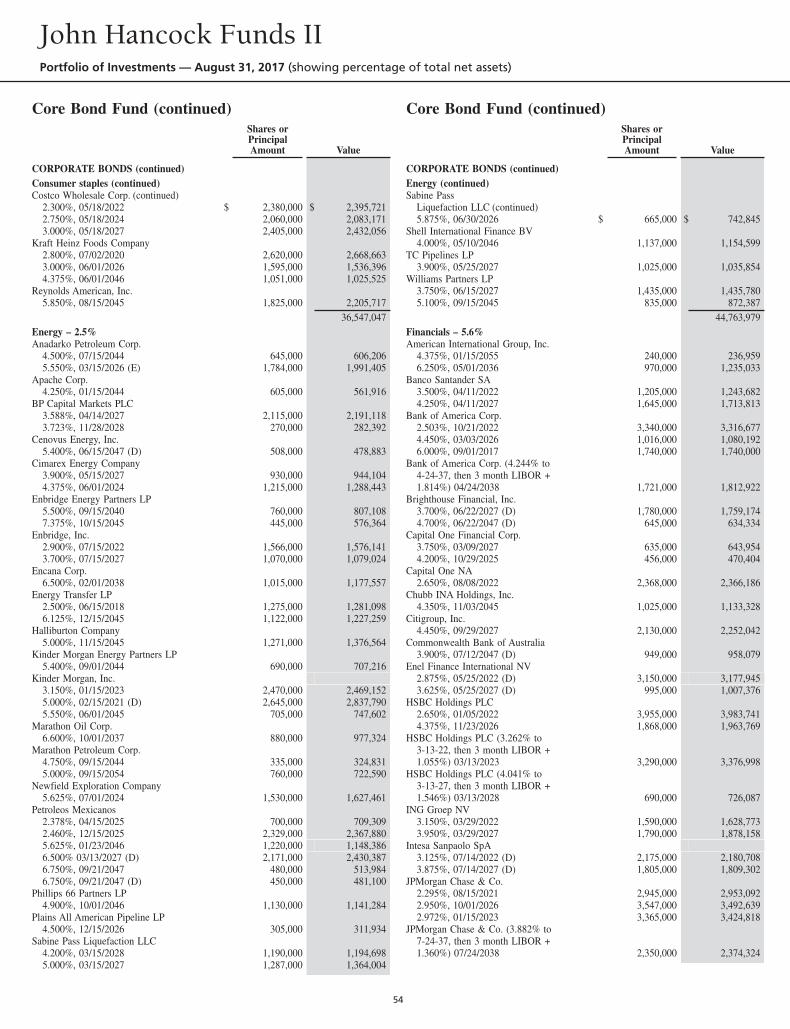
Core Bond Fund (continued)Shares orPrincipalAmount Value
CORPORATE BONDS (continued)Consumer staples (continued)Costco Wholesale Corp. (continued)
2.300%, 05/18/2022 $ 2,380,000 $ 2,395,7212.750%, 05/18/2024 2,060,000 2,083,1713.000%, 05/18/2027 2,405,000 2,432,056
Kraft Heinz Foods Company2.800%, 07/02/2020 2,620,000 2,668,6633.000%, 06/01/2026 1,595,000 1,536,3964.375%, 06/01/2046 1,051,000 1,025,525
Reynolds American, Inc.5.850%, 08/15/2045 1,825,000 2,205,717
36,547,047Energy – 2.5%Anadarko Petroleum Corp.
4.500%, 07/15/2044 645,000 606,2065.550%, 03/15/2026 (E) 1,784,000 1,991,405
Apache Corp.4.250%, 01/15/2044 605,000 561,916
BP Capital Markets PLC3.588%, 04/14/2027 2,115,000 2,191,1183.723%, 11/28/2028 270,000 282,392
Cenovus Energy, Inc.5.400%, 06/15/2047 (D) 508,000 478,883
Cimarex Energy Company3.900%, 05/15/2027 930,000 944,1044.375%, 06/01/2024 1,215,000 1,288,443
Enbridge Energy Partners LP5.500%, 09/15/2040 760,000 807,1087.375%, 10/15/2045 445,000 576,364
Enbridge, Inc.2.900%, 07/15/2022 1,566,000 1,576,1413.700%, 07/15/2027 1,070,000 1,079,024
Encana Corp.6.500%, 02/01/2038 1,015,000 1,177,557
Energy Transfer LP2.500%, 06/15/2018 1,275,000 1,281,0986.125%, 12/15/2045 1,122,000 1,227,259
Halliburton Company5.000%, 11/15/2045 1,271,000 1,376,564
Kinder Morgan Energy Partners LP5.400%, 09/01/2044 690,000 707,216
Kinder Morgan, Inc.3.150%, 01/15/2023 2,470,000 2,469,1525.000%, 02/15/2021 (D) 2,645,000 2,837,7905.550%, 06/01/2045 705,000 747,602
Marathon Oil Corp.6.600%, 10/01/2037 880,000 977,324
Marathon Petroleum Corp.4.750%, 09/15/2044 335,000 324,8315.000%, 09/15/2054 760,000 722,590
Newfield Exploration Company5.625%, 07/01/2024 1,530,000 1,627,461
Petroleos Mexicanos2.378%, 04/15/2025 700,000 709,3092.460%, 12/15/2025 2,329,000 2,367,8805.625%, 01/23/2046 1,220,000 1,148,3866.500% 03/13/2027 (D) 2,171,000 2,430,3876.750%, 09/21/2047 480,000 513,9846.750%, 09/21/2047 (D) 450,000 481,100
Phillips 66 Partners LP4.900%, 10/01/2046 1,130,000 1,141,284
Plains All American Pipeline LP4.500%, 12/15/2026 305,000 311,934
Sabine Pass Liquefaction LLC4.200%, 03/15/2028 1,190,000 1,194,6985.000%, 03/15/2027 1,287,000 1,364,004
Core Bond Fund (continued)Shares orPrincipalAmount Value
CORPORATE BONDS (continued)Energy (continued)Sabine Pass
Liquefaction LLC (continued)5.875%, 06/30/2026 $ 665,000 $ 742,845
Shell International Finance BV4.000%, 05/10/2046 1,137,000 1,154,599
TC Pipelines LP3.900%, 05/25/2027 1,025,000 1,035,854
Williams Partners LP3.750%, 06/15/2027 1,435,000 1,435,7805.100%, 09/15/2045 835,000 872,387
44,763,979Financials – 5.6%American International Group, Inc.
4.375%, 01/15/2055 240,000 236,9596.250%, 05/01/2036 970,000 1,235,033
Banco Santander SA3.500%, 04/11/2022 1,205,000 1,243,6824.250%, 04/11/2027 1,645,000 1,713,813
Bank of America Corp.2.503%, 10/21/2022 3,340,000 3,316,6774.450%, 03/03/2026 1,016,000 1,080,1926.000%, 09/01/2017 1,740,000 1,740,000
Bank of America Corp. (4.244% to4-24-37, then 3 month LIBOR +1.814%) 04/24/2038 1,721,000 1,812,922
Brighthouse Financial, Inc.3.700%, 06/22/2027 (D) 1,780,000 1,759,1744.700%, 06/22/2047 (D) 645,000 634,334
Capital One Financial Corp.3.750%, 03/09/2027 635,000 643,9544.200%, 10/29/2025 456,000 470,404
Capital One NA2.650%, 08/08/2022 2,368,000 2,366,186
Chubb INA Holdings, Inc.4.350%, 11/03/2045 1,025,000 1,133,328
Citigroup, Inc.4.450%, 09/29/2027 2,130,000 2,252,042
Commonwealth Bank of Australia3.900%, 07/12/2047 (D) 949,000 958,079
Enel Finance International NV2.875%, 05/25/2022 (D) 3,150,000 3,177,9453.625%, 05/25/2027 (D) 995,000 1,007,376
HSBC Holdings PLC2.650%, 01/05/2022 3,955,000 3,983,7414.375%, 11/23/2026 1,868,000 1,963,769
HSBC Holdings PLC (3.262% to3-13-22, then 3 month LIBOR +1.055%) 03/13/2023 3,290,000 3,376,998
HSBC Holdings PLC (4.041% to3-13-27, then 3 month LIBOR +1.546%) 03/13/2028 690,000 726,087
ING Groep NV3.150%, 03/29/2022 1,590,000 1,628,7733.950%, 03/29/2027 1,790,000 1,878,158
Intesa Sanpaolo SpA3.125%, 07/14/2022 (D) 2,175,000 2,180,7083.875%, 07/14/2027 (D) 1,805,000 1,809,302
JPMorgan Chase & Co.2.295%, 08/15/2021 2,945,000 2,953,0922.950%, 10/01/2026 3,547,000 3,492,6392.972%, 01/15/2023 3,365,000 3,424,818
JPMorgan Chase & Co. (3.882% to7-24-37, then 3 month LIBOR +1.360%) 07/24/2038 2,350,000 2,374,324
John Hancock Funds IIPortfolio of Investments — August 31, 2017 (showing percentage of total net assets)
54
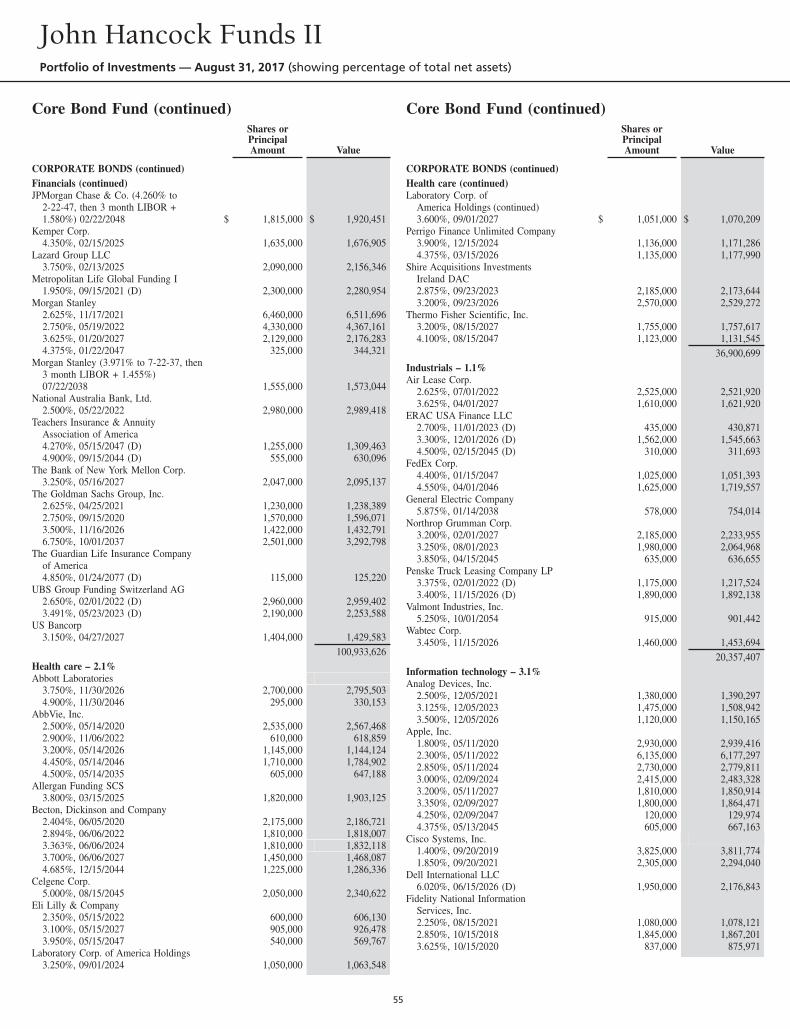
Core Bond Fund (continued)Shares orPrincipalAmount Value
CORPORATE BONDS (continued)Financials (continued)JPMorgan Chase & Co. (4.260% to
2-22-47, then 3 month LIBOR +1.580%) 02/22/2048 $ 1,815,000 $ 1,920,451
Kemper Corp.4.350%, 02/15/2025 1,635,000 1,676,905
Lazard Group LLC3.750%, 02/13/2025 2,090,000 2,156,346
Metropolitan Life Global Funding I1.950%, 09/15/2021 (D) 2,300,000 2,280,954
Morgan Stanley2.625%, 11/17/2021 6,460,000 6,511,6962.750%, 05/19/2022 4,330,000 4,367,1613.625%, 01/20/2027 2,129,000 2,176,2834.375%, 01/22/2047 325,000 344,321
Morgan Stanley (3.971% to 7-22-37, then3 month LIBOR + 1.455%)07/22/2038 1,555,000 1,573,044
National Australia Bank, Ltd.2.500%, 05/22/2022 2,980,000 2,989,418
Teachers Insurance & AnnuityAssociation of America4.270%, 05/15/2047 (D) 1,255,000 1,309,4634.900%, 09/15/2044 (D) 555,000 630,096
The Bank of New York Mellon Corp.3.250%, 05/16/2027 2,047,000 2,095,137
The Goldman Sachs Group, Inc.2.625%, 04/25/2021 1,230,000 1,238,3892.750%, 09/15/2020 1,570,000 1,596,0713.500%, 11/16/2026 1,422,000 1,432,7916.750%, 10/01/2037 2,501,000 3,292,798
The Guardian Life Insurance Companyof America4.850%, 01/24/2077 (D) 115,000 125,220
UBS Group Funding Switzerland AG2.650%, 02/01/2022 (D) 2,960,000 2,959,4023.491%, 05/23/2023 (D) 2,190,000 2,253,588
US Bancorp3.150%, 04/27/2027 1,404,000 1,429,583
100,933,626Health care – 2.1%Abbott Laboratories
3.750%, 11/30/2026 2,700,000 2,795,5034.900%, 11/30/2046 295,000 330,153
AbbVie, Inc.2.500%, 05/14/2020 2,535,000 2,567,4682.900%, 11/06/2022 610,000 618,8593.200%, 05/14/2026 1,145,000 1,144,1244.450%, 05/14/2046 1,710,000 1,784,9024.500%, 05/14/2035 605,000 647,188
Allergan Funding SCS3.800%, 03/15/2025 1,820,000 1,903,125
Becton, Dickinson and Company2.404%, 06/05/2020 2,175,000 2,186,7212.894%, 06/06/2022 1,810,000 1,818,0073.363%, 06/06/2024 1,810,000 1,832,1183.700%, 06/06/2027 1,450,000 1,468,0874.685%, 12/15/2044 1,225,000 1,286,336
Celgene Corp.5.000%, 08/15/2045 2,050,000 2,340,622
Eli Lilly & Company2.350%, 05/15/2022 600,000 606,1303.100%, 05/15/2027 905,000 926,4783.950%, 05/15/2047 540,000 569,767
Laboratory Corp. of America Holdings3.250%, 09/01/2024 1,050,000 1,063,548
Core Bond Fund (continued)Shares orPrincipalAmount Value
CORPORATE BONDS (continued)Health care (continued)Laboratory Corp. of
America Holdings (continued)3.600%, 09/01/2027 $ 1,051,000 $ 1,070,209
Perrigo Finance Unlimited Company3.900%, 12/15/2024 1,136,000 1,171,2864.375%, 03/15/2026 1,135,000 1,177,990
Shire Acquisitions InvestmentsIreland DAC2.875%, 09/23/2023 2,185,000 2,173,6443.200%, 09/23/2026 2,570,000 2,529,272
Thermo Fisher Scientific, Inc.3.200%, 08/15/2027 1,755,000 1,757,6174.100%, 08/15/2047 1,123,000 1,131,545
36,900,699Industrials – 1.1%Air Lease Corp.
2.625%, 07/01/2022 2,525,000 2,521,9203.625%, 04/01/2027 1,610,000 1,621,920
ERAC USA Finance LLC2.700%, 11/01/2023 (D) 435,000 430,8713.300%, 12/01/2026 (D) 1,562,000 1,545,6634.500%, 02/15/2045 (D) 310,000 311,693
FedEx Corp.4.400%, 01/15/2047 1,025,000 1,051,3934.550%, 04/01/2046 1,625,000 1,719,557
General Electric Company5.875%, 01/14/2038 578,000 754,014
Northrop Grumman Corp.3.200%, 02/01/2027 2,185,000 2,233,9553.250%, 08/01/2023 1,980,000 2,064,9683.850%, 04/15/2045 635,000 636,655
Penske Truck Leasing Company LP3.375%, 02/01/2022 (D) 1,175,000 1,217,5243.400%, 11/15/2026 (D) 1,890,000 1,892,138
Valmont Industries, Inc.5.250%, 10/01/2054 915,000 901,442
Wabtec Corp.3.450%, 11/15/2026 1,460,000 1,453,694
20,357,407Information technology – 3.1%Analog Devices, Inc.
2.500%, 12/05/2021 1,380,000 1,390,2973.125%, 12/05/2023 1,475,000 1,508,9423.500%, 12/05/2026 1,120,000 1,150,165
Apple, Inc.1.800%, 05/11/2020 2,930,000 2,939,4162.300%, 05/11/2022 6,135,000 6,177,2972.850%, 05/11/2024 2,730,000 2,779,8113.000%, 02/09/2024 2,415,000 2,483,3283.200%, 05/11/2027 1,810,000 1,850,9143.350%, 02/09/2027 1,800,000 1,864,4714.250%, 02/09/2047 120,000 129,9744.375%, 05/13/2045 605,000 667,163
Cisco Systems, Inc.1.400%, 09/20/2019 3,825,000 3,811,7741.850%, 09/20/2021 2,305,000 2,294,040
Dell International LLC6.020%, 06/15/2026 (D) 1,950,000 2,176,843
Fidelity National InformationServices, Inc.2.250%, 08/15/2021 1,080,000 1,078,1212.850%, 10/15/2018 1,845,000 1,867,2013.625%, 10/15/2020 837,000 875,971
John Hancock Funds IIPortfolio of Investments — August 31, 2017 (showing percentage of total net assets)
55
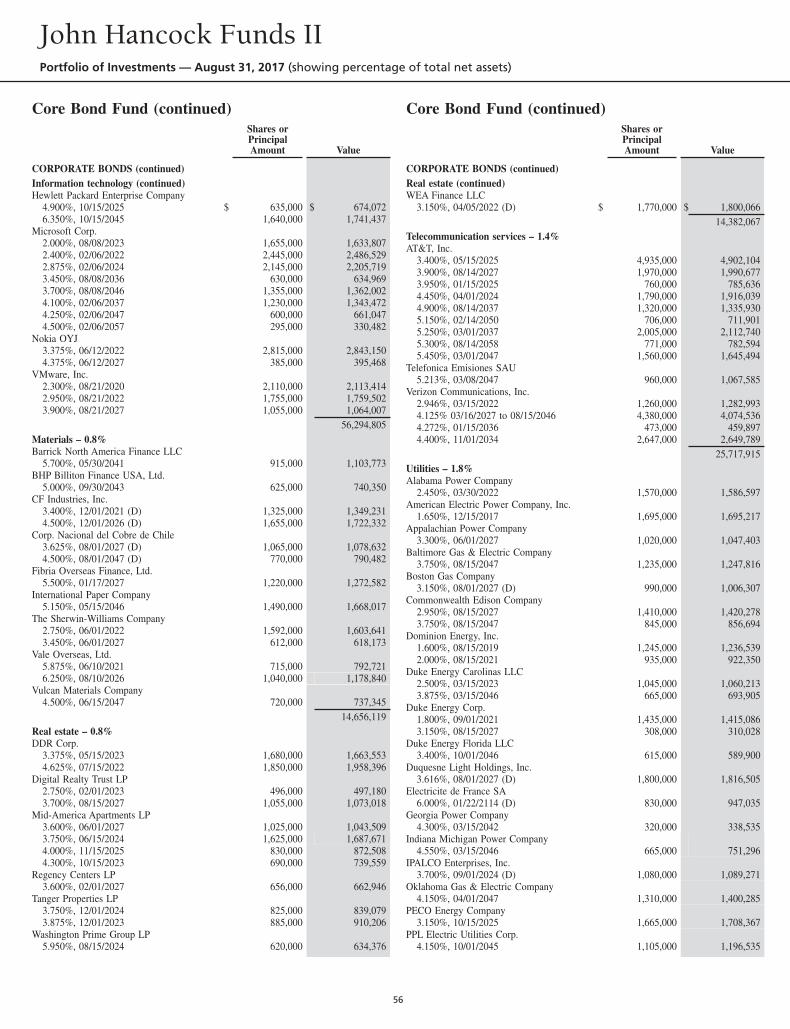
Core Bond Fund (continued)Shares orPrincipalAmount Value
CORPORATE BONDS (continued)Information technology (continued)Hewlett Packard Enterprise Company
4.900%, 10/15/2025 $ 635,000 $ 674,0726.350%, 10/15/2045 1,640,000 1,741,437
Microsoft Corp.2.000%, 08/08/2023 1,655,000 1,633,8072.400%, 02/06/2022 2,445,000 2,486,5292.875%, 02/06/2024 2,145,000 2,205,7193.450%, 08/08/2036 630,000 634,9693.700%, 08/08/2046 1,355,000 1,362,0024.100%, 02/06/2037 1,230,000 1,343,4724.250%, 02/06/2047 600,000 661,0474.500%, 02/06/2057 295,000 330,482
Nokia OYJ3.375%, 06/12/2022 2,815,000 2,843,1504.375%, 06/12/2027 385,000 395,468
VMware, Inc.2.300%, 08/21/2020 2,110,000 2,113,4142.950%, 08/21/2022 1,755,000 1,759,5023.900%, 08/21/2027 1,055,000 1,064,007
56,294,805Materials – 0.8%Barrick North America Finance LLC
5.700%, 05/30/2041 915,000 1,103,773BHP Billiton Finance USA, Ltd.
5.000%, 09/30/2043 625,000 740,350CF Industries, Inc.
3.400%, 12/01/2021 (D) 1,325,000 1,349,2314.500%, 12/01/2026 (D) 1,655,000 1,722,332
Corp. Nacional del Cobre de Chile3.625%, 08/01/2027 (D) 1,065,000 1,078,6324.500%, 08/01/2047 (D) 770,000 790,482
Fibria Overseas Finance, Ltd.5.500%, 01/17/2027 1,220,000 1,272,582
International Paper Company5.150%, 05/15/2046 1,490,000 1,668,017
The Sherwin-Williams Company2.750%, 06/01/2022 1,592,000 1,603,6413.450%, 06/01/2027 612,000 618,173
Vale Overseas, Ltd.5.875%, 06/10/2021 715,000 792,7216.250%, 08/10/2026 1,040,000 1,178,840
Vulcan Materials Company4.500%, 06/15/2047 720,000 737,345
14,656,119Real estate – 0.8%DDR Corp.
3.375%, 05/15/2023 1,680,000 1,663,5534.625%, 07/15/2022 1,850,000 1,958,396
Digital Realty Trust LP2.750%, 02/01/2023 496,000 497,1803.700%, 08/15/2027 1,055,000 1,073,018
Mid-America Apartments LP3.600%, 06/01/2027 1,025,000 1,043,5093.750%, 06/15/2024 1,625,000 1,687,6714.000%, 11/15/2025 830,000 872,5084.300%, 10/15/2023 690,000 739,559
Regency Centers LP3.600%, 02/01/2027 656,000 662,946
Tanger Properties LP3.750%, 12/01/2024 825,000 839,0793.875%, 12/01/2023 885,000 910,206
Washington Prime Group LP5.950%, 08/15/2024 620,000 634,376
Core Bond Fund (continued)Shares orPrincipalAmount Value
CORPORATE BONDS (continued)Real estate (continued)WEA Finance LLC
3.150%, 04/05/2022 (D) $ 1,770,000 $ 1,800,06614,382,067
Telecommunication services – 1.4%AT&T, Inc.
3.400%, 05/15/2025 4,935,000 4,902,1043.900%, 08/14/2027 1,970,000 1,990,6773.950%, 01/15/2025 760,000 785,6364.450%, 04/01/2024 1,790,000 1,916,0394.900%, 08/14/2037 1,320,000 1,335,9305.150%, 02/14/2050 706,000 711,9015.250%, 03/01/2037 2,005,000 2,112,7405.300%, 08/14/2058 771,000 782,5945.450%, 03/01/2047 1,560,000 1,645,494
Telefonica Emisiones SAU5.213%, 03/08/2047 960,000 1,067,585
Verizon Communications, Inc.2.946%, 03/15/2022 1,260,000 1,282,9934.125% 03/16/2027 to 08/15/2046 4,380,000 4,074,5364.272%, 01/15/2036 473,000 459,8974.400%, 11/01/2034 2,647,000 2,649,789
25,717,915Utilities – 1.8%Alabama Power Company
2.450%, 03/30/2022 1,570,000 1,586,597American Electric Power Company, Inc.
1.650%, 12/15/2017 1,695,000 1,695,217Appalachian Power Company
3.300%, 06/01/2027 1,020,000 1,047,403Baltimore Gas & Electric Company
3.750%, 08/15/2047 1,235,000 1,247,816Boston Gas Company
3.150%, 08/01/2027 (D) 990,000 1,006,307Commonwealth Edison Company
2.950%, 08/15/2027 1,410,000 1,420,2783.750%, 08/15/2047 845,000 856,694
Dominion Energy, Inc.1.600%, 08/15/2019 1,245,000 1,236,5392.000%, 08/15/2021 935,000 922,350
Duke Energy Carolinas LLC2.500%, 03/15/2023 1,045,000 1,060,2133.875%, 03/15/2046 665,000 693,905
Duke Energy Corp.1.800%, 09/01/2021 1,435,000 1,415,0863.150%, 08/15/2027 308,000 310,028
Duke Energy Florida LLC3.400%, 10/01/2046 615,000 589,900
Duquesne Light Holdings, Inc.3.616%, 08/01/2027 (D) 1,800,000 1,816,505
Electricite de France SA6.000%, 01/22/2114 (D) 830,000 947,035
Georgia Power Company4.300%, 03/15/2042 320,000 338,535
Indiana Michigan Power Company4.550%, 03/15/2046 665,000 751,296
IPALCO Enterprises, Inc.3.700%, 09/01/2024 (D) 1,080,000 1,089,271
Oklahoma Gas & Electric Company4.150%, 04/01/2047 1,310,000 1,400,285
PECO Energy Company3.150%, 10/15/2025 1,665,000 1,708,367
PPL Electric Utilities Corp.4.150%, 10/01/2045 1,105,000 1,196,535
John Hancock Funds IIPortfolio of Investments — August 31, 2017 (showing percentage of total net assets)
56
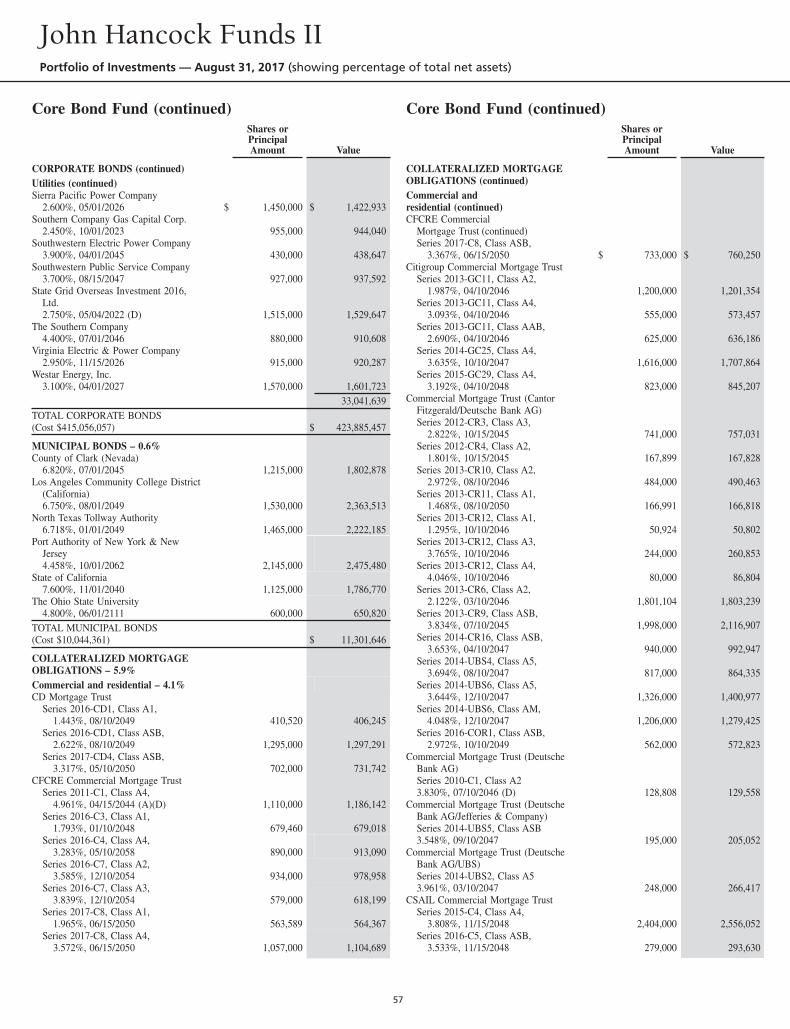
Core Bond Fund (continued)Shares orPrincipalAmount Value
CORPORATE BONDS (continued)Utilities (continued)Sierra Pacific Power Company
2.600%, 05/01/2026 $ 1,450,000 $ 1,422,933Southern Company Gas Capital Corp.
2.450%, 10/01/2023 955,000 944,040Southwestern Electric Power Company
3.900%, 04/01/2045 430,000 438,647Southwestern Public Service Company
3.700%, 08/15/2047 927,000 937,592State Grid Overseas Investment 2016,
Ltd.2.750%, 05/04/2022 (D) 1,515,000 1,529,647
The Southern Company4.400%, 07/01/2046 880,000 910,608
Virginia Electric & Power Company2.950%, 11/15/2026 915,000 920,287
Westar Energy, Inc.3.100%, 04/01/2027 1,570,000 1,601,723
33,041,639TOTAL CORPORATE BONDS(Cost $415,056,057) $ 423,885,457
MUNICIPAL BONDS – 0.6%County of Clark (Nevada)
6.820%, 07/01/2045 1,215,000 1,802,878Los Angeles Community College District
(California)6.750%, 08/01/2049 1,530,000 2,363,513
North Texas Tollway Authority6.718%, 01/01/2049 1,465,000 2,222,185
Port Authority of New York & NewJersey4.458%, 10/01/2062 2,145,000 2,475,480
State of California7.600%, 11/01/2040 1,125,000 1,786,770
The Ohio State University4.800%, 06/01/2111 600,000 650,820
TOTAL MUNICIPAL BONDS(Cost $10,044,361) $ 11,301,646
COLLATERALIZED MORTGAGEOBLIGATIONS – 5.9%Commercial and residential – 4.1%CD Mortgage Trust
Series 2016-CD1, Class A1,1.443%, 08/10/2049 410,520 406,245
Series 2016-CD1, Class ASB,2.622%, 08/10/2049 1,295,000 1,297,291
Series 2017-CD4, Class ASB,3.317%, 05/10/2050 702,000 731,742
CFCRE Commercial Mortgage TrustSeries 2011-C1, Class A4,
4.961%, 04/15/2044 (A)(D) 1,110,000 1,186,142Series 2016-C3, Class A1,
1.793%, 01/10/2048 679,460 679,018Series 2016-C4, Class A4,
3.283%, 05/10/2058 890,000 913,090Series 2016-C7, Class A2,
3.585%, 12/10/2054 934,000 978,958Series 2016-C7, Class A3,
3.839%, 12/10/2054 579,000 618,199Series 2017-C8, Class A1,
1.965%, 06/15/2050 563,589 564,367Series 2017-C8, Class A4,
3.572%, 06/15/2050 1,057,000 1,104,689
Core Bond Fund (continued)Shares orPrincipalAmount Value
COLLATERALIZED MORTGAGEOBLIGATIONS (continued)Commercial andresidential (continued)CFCRE Commercial
Mortgage Trust (continued)Series 2017-C8, Class ASB,
3.367%, 06/15/2050 $ 733,000 $ 760,250Citigroup Commercial Mortgage Trust
Series 2013-GC11, Class A2,1.987%, 04/10/2046 1,200,000 1,201,354
Series 2013-GC11, Class A4,3.093%, 04/10/2046 555,000 573,457
Series 2013-GC11, Class AAB,2.690%, 04/10/2046 625,000 636,186
Series 2014-GC25, Class A4,3.635%, 10/10/2047 1,616,000 1,707,864
Series 2015-GC29, Class A4,3.192%, 04/10/2048 823,000 845,207
Commercial Mortgage Trust (CantorFitzgerald/Deutsche Bank AG)Series 2012-CR3, Class A3,
2.822%, 10/15/2045 741,000 757,031Series 2012-CR4, Class A2,
1.801%, 10/15/2045 167,899 167,828Series 2013-CR10, Class A2,
2.972%, 08/10/2046 484,000 490,463Series 2013-CR11, Class A1,
1.468%, 08/10/2050 166,991 166,818Series 2013-CR12, Class A1,
1.295%, 10/10/2046 50,924 50,802Series 2013-CR12, Class A3,
3.765%, 10/10/2046 244,000 260,853Series 2013-CR12, Class A4,
4.046%, 10/10/2046 80,000 86,804Series 2013-CR6, Class A2,
2.122%, 03/10/2046 1,801,104 1,803,239Series 2013-CR9, Class ASB,
3.834%, 07/10/2045 1,998,000 2,116,907Series 2014-CR16, Class ASB,
3.653%, 04/10/2047 940,000 992,947Series 2014-UBS4, Class A5,
3.694%, 08/10/2047 817,000 864,335Series 2014-UBS6, Class A5,
3.644%, 12/10/2047 1,326,000 1,400,977Series 2014-UBS6, Class AM,
4.048%, 12/10/2047 1,206,000 1,279,425Series 2016-COR1, Class ASB,
2.972%, 10/10/2049 562,000 572,823Commercial Mortgage Trust (Deutsche
Bank AG)Series 2010-C1, Class A23.830%, 07/10/2046 (D) 128,808 129,558
Commercial Mortgage Trust (DeutscheBank AG/Jefferies & Company)Series 2014-UBS5, Class ASB3.548%, 09/10/2047 195,000 205,052
Commercial Mortgage Trust (DeutscheBank AG/UBS)Series 2014-UBS2, Class A53.961%, 03/10/2047 248,000 266,417
CSAIL Commercial Mortgage TrustSeries 2015-C4, Class A4,
3.808%, 11/15/2048 2,404,000 2,556,052Series 2016-C5, Class ASB,
3.533%, 11/15/2048 279,000 293,630
John Hancock Funds IIPortfolio of Investments — August 31, 2017 (showing percentage of total net assets)
57
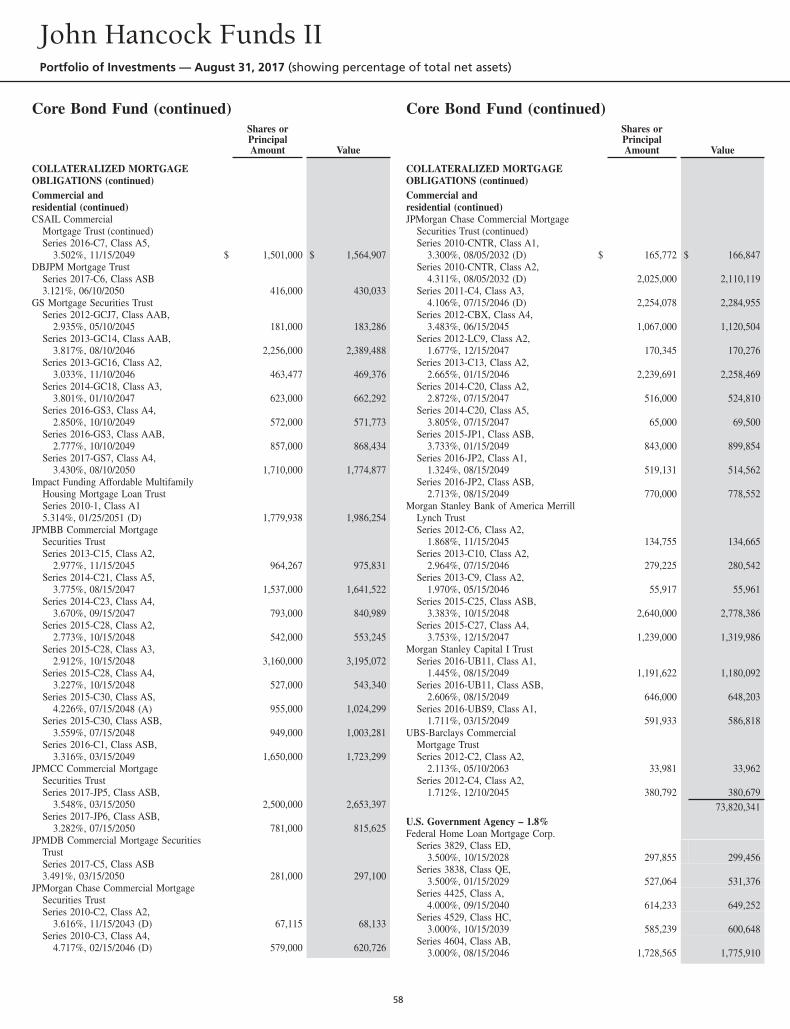
Core Bond Fund (continued)Shares orPrincipalAmount Value
COLLATERALIZED MORTGAGEOBLIGATIONS (continued)Commercial andresidential (continued)CSAIL Commercial
Mortgage Trust (continued)Series 2016-C7, Class A5,
3.502%, 11/15/2049 $ 1,501,000 $ 1,564,907DBJPM Mortgage Trust
Series 2017-C6, Class ASB3.121%, 06/10/2050 416,000 430,033
GS Mortgage Securities TrustSeries 2012-GCJ7, Class AAB,
2.935%, 05/10/2045 181,000 183,286Series 2013-GC14, Class AAB,
3.817%, 08/10/2046 2,256,000 2,389,488Series 2013-GC16, Class A2,
3.033%, 11/10/2046 463,477 469,376Series 2014-GC18, Class A3,
3.801%, 01/10/2047 623,000 662,292Series 2016-GS3, Class A4,
2.850%, 10/10/2049 572,000 571,773Series 2016-GS3, Class AAB,
2.777%, 10/10/2049 857,000 868,434Series 2017-GS7, Class A4,
3.430%, 08/10/2050 1,710,000 1,774,877Impact Funding Affordable Multifamily
Housing Mortgage Loan TrustSeries 2010-1, Class A15.314%, 01/25/2051 (D) 1,779,938 1,986,254
JPMBB Commercial MortgageSecurities TrustSeries 2013-C15, Class A2,
2.977%, 11/15/2045 964,267 975,831Series 2014-C21, Class A5,
3.775%, 08/15/2047 1,537,000 1,641,522Series 2014-C23, Class A4,
3.670%, 09/15/2047 793,000 840,989Series 2015-C28, Class A2,
2.773%, 10/15/2048 542,000 553,245Series 2015-C28, Class A3,
2.912%, 10/15/2048 3,160,000 3,195,072Series 2015-C28, Class A4,
3.227%, 10/15/2048 527,000 543,340Series 2015-C30, Class AS,
4.226%, 07/15/2048 (A) 955,000 1,024,299Series 2015-C30, Class ASB,
3.559%, 07/15/2048 949,000 1,003,281Series 2016-C1, Class ASB,
3.316%, 03/15/2049 1,650,000 1,723,299JPMCC Commercial Mortgage
Securities TrustSeries 2017-JP5, Class ASB,
3.548%, 03/15/2050 2,500,000 2,653,397Series 2017-JP6, Class ASB,
3.282%, 07/15/2050 781,000 815,625JPMDB Commercial Mortgage Securities
TrustSeries 2017-C5, Class ASB3.491%, 03/15/2050 281,000 297,100
JPMorgan Chase Commercial MortgageSecurities TrustSeries 2010-C2, Class A2,
3.616%, 11/15/2043 (D) 67,115 68,133Series 2010-C3, Class A4,
4.717%, 02/15/2046 (D) 579,000 620,726
Core Bond Fund (continued)Shares orPrincipalAmount Value
COLLATERALIZED MORTGAGEOBLIGATIONS (continued)Commercial andresidential (continued)JPMorgan Chase Commercial Mortgage
Securities Trust (continued)Series 2010-CNTR, Class A1,
3.300%, 08/05/2032 (D) $ 165,772 $ 166,847Series 2010-CNTR, Class A2,
4.311%, 08/05/2032 (D) 2,025,000 2,110,119Series 2011-C4, Class A3,
4.106%, 07/15/2046 (D) 2,254,078 2,284,955Series 2012-CBX, Class A4,
3.483%, 06/15/2045 1,067,000 1,120,504Series 2012-LC9, Class A2,
1.677%, 12/15/2047 170,345 170,276Series 2013-C13, Class A2,
2.665%, 01/15/2046 2,239,691 2,258,469Series 2014-C20, Class A2,
2.872%, 07/15/2047 516,000 524,810Series 2014-C20, Class A5,
3.805%, 07/15/2047 65,000 69,500Series 2015-JP1, Class ASB,
3.733%, 01/15/2049 843,000 899,854Series 2016-JP2, Class A1,
1.324%, 08/15/2049 519,131 514,562Series 2016-JP2, Class ASB,
2.713%, 08/15/2049 770,000 778,552Morgan Stanley Bank of America Merrill
Lynch TrustSeries 2012-C6, Class A2,
1.868%, 11/15/2045 134,755 134,665Series 2013-C10, Class A2,
2.964%, 07/15/2046 279,225 280,542Series 2013-C9, Class A2,
1.970%, 05/15/2046 55,917 55,961Series 2015-C25, Class ASB,
3.383%, 10/15/2048 2,640,000 2,778,386Series 2015-C27, Class A4,
3.753%, 12/15/2047 1,239,000 1,319,986Morgan Stanley Capital I Trust
Series 2016-UB11, Class A1,1.445%, 08/15/2049 1,191,622 1,180,092
Series 2016-UB11, Class ASB,2.606%, 08/15/2049 646,000 648,203
Series 2016-UBS9, Class A1,1.711%, 03/15/2049 591,933 586,818
UBS-Barclays CommercialMortgage TrustSeries 2012-C2, Class A2,
2.113%, 05/10/2063 33,981 33,962Series 2012-C4, Class A2,
1.712%, 12/10/2045 380,792 380,67973,820,341
U.S. Government Agency – 1.8%Federal Home Loan Mortgage Corp.
Series 3829, Class ED,3.500%, 10/15/2028 297,855 299,456
Series 3838, Class QE,3.500%, 01/15/2029 527,064 531,376
Series 4425, Class A,4.000%, 09/15/2040 614,233 649,252
Series 4529, Class HC,3.000%, 10/15/2039 585,239 600,648
Series 4604, Class AB,3.000%, 08/15/2046 1,728,565 1,775,910
John Hancock Funds IIPortfolio of Investments — August 31, 2017 (showing percentage of total net assets)
58
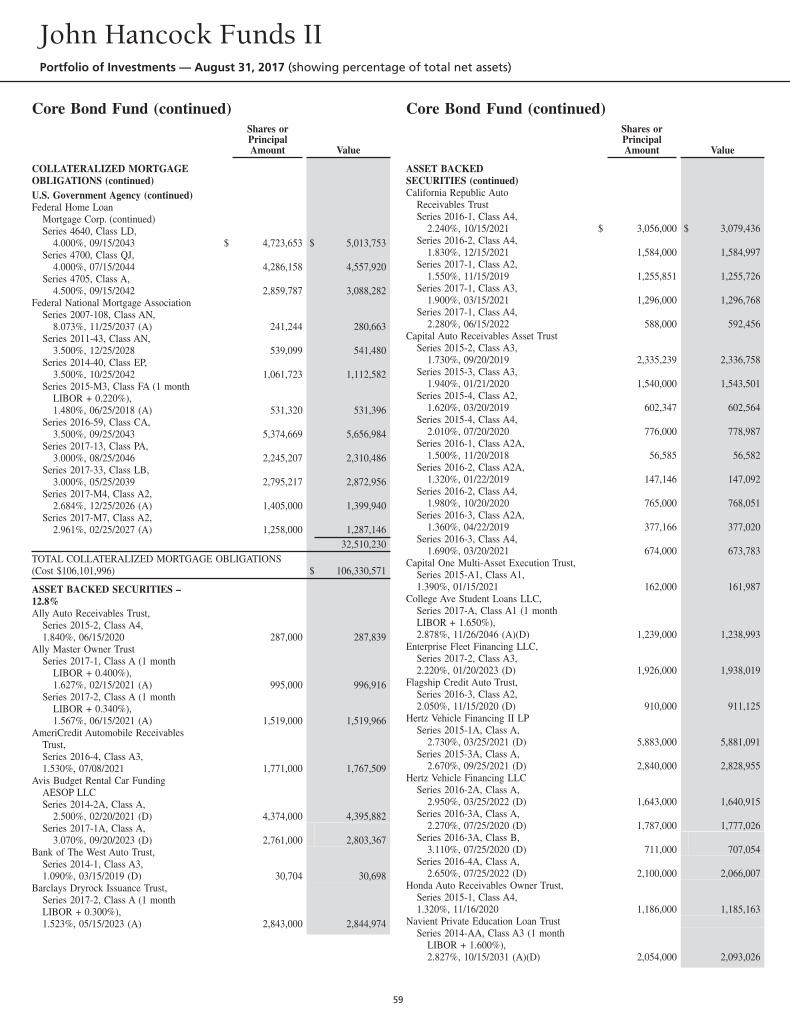
Core Bond Fund (continued)Shares orPrincipalAmount Value
COLLATERALIZED MORTGAGEOBLIGATIONS (continued)U.S. Government Agency (continued)Federal Home Loan
Mortgage Corp. (continued)Series 4640, Class LD,
4.000%, 09/15/2043 $ 4,723,653 $ 5,013,753Series 4700, Class QJ,
4.000%, 07/15/2044 4,286,158 4,557,920Series 4705, Class A,
4.500%, 09/15/2042 2,859,787 3,088,282Federal National Mortgage Association
Series 2007-108, Class AN,8.073%, 11/25/2037 (A) 241,244 280,663
Series 2011-43, Class AN,3.500%, 12/25/2028 539,099 541,480
Series 2014-40, Class EP,3.500%, 10/25/2042 1,061,723 1,112,582
Series 2015-M3, Class FA (1 monthLIBOR + 0.220%),1.480%, 06/25/2018 (A) 531,320 531,396
Series 2016-59, Class CA,3.500%, 09/25/2043 5,374,669 5,656,984
Series 2017-13, Class PA,3.000%, 08/25/2046 2,245,207 2,310,486
Series 2017-33, Class LB,3.000%, 05/25/2039 2,795,217 2,872,956
Series 2017-M4, Class A2,2.684%, 12/25/2026 (A) 1,405,000 1,399,940
Series 2017-M7, Class A2,2.961%, 02/25/2027 (A) 1,258,000 1,287,146
32,510,230TOTAL COLLATERALIZED MORTGAGE OBLIGATIONS(Cost $106,101,996) $ 106,330,571
ASSET BACKED SECURITIES –12.8%Ally Auto Receivables Trust,
Series 2015-2, Class A4,1.840%, 06/15/2020 287,000 287,839
Ally Master Owner TrustSeries 2017-1, Class A (1 month
LIBOR + 0.400%),1.627%, 02/15/2021 (A) 995,000 996,916
Series 2017-2, Class A (1 monthLIBOR + 0.340%),1.567%, 06/15/2021 (A) 1,519,000 1,519,966
AmeriCredit Automobile ReceivablesTrust,Series 2016-4, Class A3,1.530%, 07/08/2021 1,771,000 1,767,509
Avis Budget Rental Car FundingAESOP LLCSeries 2014-2A, Class A,
2.500%, 02/20/2021 (D) 4,374,000 4,395,882Series 2017-1A, Class A,
3.070%, 09/20/2023 (D) 2,761,000 2,803,367Bank of The West Auto Trust,
Series 2014-1, Class A3,1.090%, 03/15/2019 (D) 30,704 30,698
Barclays Dryrock Issuance Trust,Series 2017-2, Class A (1 monthLIBOR + 0.300%),1.523%, 05/15/2023 (A) 2,843,000 2,844,974
Core Bond Fund (continued)Shares orPrincipalAmount Value
ASSET BACKEDSECURITIES (continued)California Republic Auto
Receivables TrustSeries 2016-1, Class A4,
2.240%, 10/15/2021 $ 3,056,000 $ 3,079,436Series 2016-2, Class A4,
1.830%, 12/15/2021 1,584,000 1,584,997Series 2017-1, Class A2,
1.550%, 11/15/2019 1,255,851 1,255,726Series 2017-1, Class A3,
1.900%, 03/15/2021 1,296,000 1,296,768Series 2017-1, Class A4,
2.280%, 06/15/2022 588,000 592,456Capital Auto Receivables Asset Trust
Series 2015-2, Class A3,1.730%, 09/20/2019 2,335,239 2,336,758
Series 2015-3, Class A3,1.940%, 01/21/2020 1,540,000 1,543,501
Series 2015-4, Class A2,1.620%, 03/20/2019 602,347 602,564
Series 2015-4, Class A4,2.010%, 07/20/2020 776,000 778,987
Series 2016-1, Class A2A,1.500%, 11/20/2018 56,585 56,582
Series 2016-2, Class A2A,1.320%, 01/22/2019 147,146 147,092
Series 2016-2, Class A4,1.980%, 10/20/2020 765,000 768,051
Series 2016-3, Class A2A,1.360%, 04/22/2019 377,166 377,020
Series 2016-3, Class A4,1.690%, 03/20/2021 674,000 673,783
Capital One Multi-Asset Execution Trust,Series 2015-A1, Class A1,1.390%, 01/15/2021 162,000 161,987
College Ave Student Loans LLC,Series 2017-A, Class A1 (1 monthLIBOR + 1.650%),2.878%, 11/26/2046 (A)(D) 1,239,000 1,238,993
Enterprise Fleet Financing LLC,Series 2017-2, Class A3,2.220%, 01/20/2023 (D) 1,926,000 1,938,019
Flagship Credit Auto Trust,Series 2016-3, Class A2,2.050%, 11/15/2020 (D) 910,000 911,125
Hertz Vehicle Financing II LPSeries 2015-1A, Class A,
2.730%, 03/25/2021 (D) 5,883,000 5,881,091Series 2015-3A, Class A,
2.670%, 09/25/2021 (D) 2,840,000 2,828,955Hertz Vehicle Financing LLC
Series 2016-2A, Class A,2.950%, 03/25/2022 (D) 1,643,000 1,640,915
Series 2016-3A, Class A,2.270%, 07/25/2020 (D) 1,787,000 1,777,026
Series 2016-3A, Class B,3.110%, 07/25/2020 (D) 711,000 707,054
Series 2016-4A, Class A,2.650%, 07/25/2022 (D) 2,100,000 2,066,007
Honda Auto Receivables Owner Trust,Series 2015-1, Class A4,1.320%, 11/16/2020 1,186,000 1,185,163
Navient Private Education Loan TrustSeries 2014-AA, Class A3 (1 month
LIBOR + 1.600%),2.827%, 10/15/2031 (A)(D) 2,054,000 2,093,026
John Hancock Funds IIPortfolio of Investments — August 31, 2017 (showing percentage of total net assets)
59
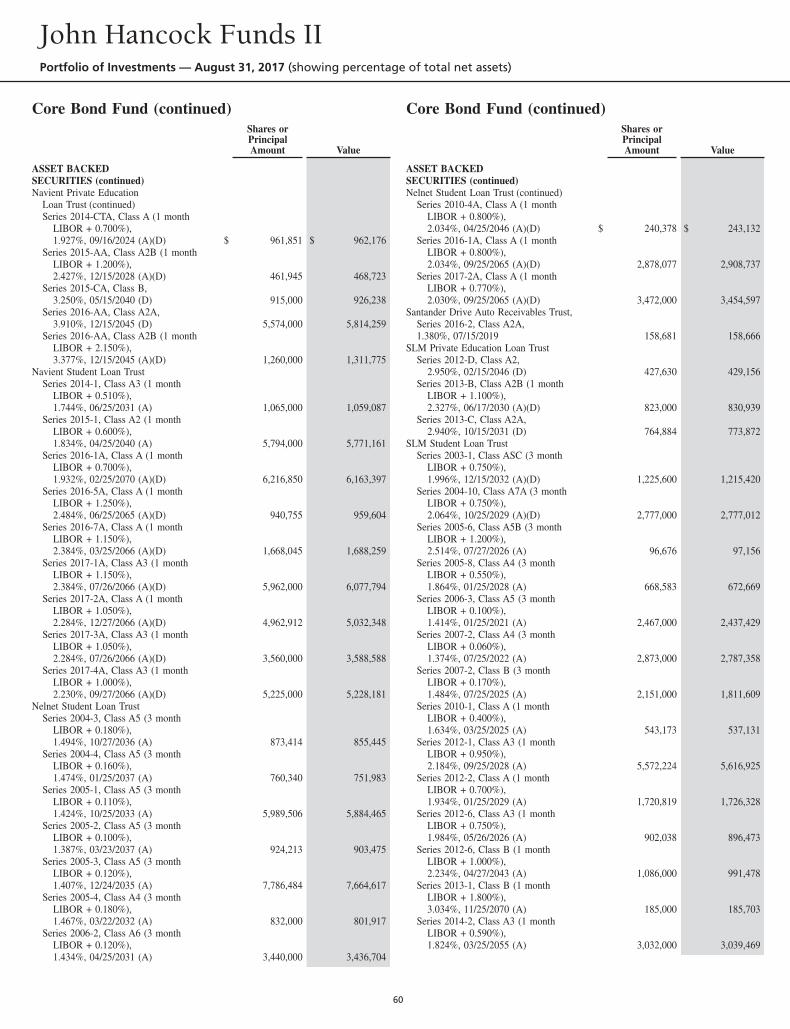
Core Bond Fund (continued)Shares orPrincipalAmount Value
ASSET BACKEDSECURITIES (continued)Navient Private Education
Loan Trust (continued)Series 2014-CTA, Class A (1 month
LIBOR + 0.700%),1.927%, 09/16/2024 (A)(D) $ 961,851 $ 962,176
Series 2015-AA, Class A2B (1 monthLIBOR + 1.200%),2.427%, 12/15/2028 (A)(D) 461,945 468,723
Series 2015-CA, Class B,3.250%, 05/15/2040 (D) 915,000 926,238
Series 2016-AA, Class A2A,3.910%, 12/15/2045 (D) 5,574,000 5,814,259
Series 2016-AA, Class A2B (1 monthLIBOR + 2.150%),3.377%, 12/15/2045 (A)(D) 1,260,000 1,311,775
Navient Student Loan TrustSeries 2014-1, Class A3 (1 month
LIBOR + 0.510%),1.744%, 06/25/2031 (A) 1,065,000 1,059,087
Series 2015-1, Class A2 (1 monthLIBOR + 0.600%),1.834%, 04/25/2040 (A) 5,794,000 5,771,161
Series 2016-1A, Class A (1 monthLIBOR + 0.700%),1.932%, 02/25/2070 (A)(D) 6,216,850 6,163,397
Series 2016-5A, Class A (1 monthLIBOR + 1.250%),2.484%, 06/25/2065 (A)(D) 940,755 959,604
Series 2016-7A, Class A (1 monthLIBOR + 1.150%),2.384%, 03/25/2066 (A)(D) 1,668,045 1,688,259
Series 2017-1A, Class A3 (1 monthLIBOR + 1.150%),2.384%, 07/26/2066 (A)(D) 5,962,000 6,077,794
Series 2017-2A, Class A (1 monthLIBOR + 1.050%),2.284%, 12/27/2066 (A)(D) 4,962,912 5,032,348
Series 2017-3A, Class A3 (1 monthLIBOR + 1.050%),2.284%, 07/26/2066 (A)(D) 3,560,000 3,588,588
Series 2017-4A, Class A3 (1 monthLIBOR + 1.000%),2.230%, 09/27/2066 (A)(D) 5,225,000 5,228,181
Nelnet Student Loan TrustSeries 2004-3, Class A5 (3 month
LIBOR + 0.180%),1.494%, 10/27/2036 (A) 873,414 855,445
Series 2004-4, Class A5 (3 monthLIBOR + 0.160%),1.474%, 01/25/2037 (A) 760,340 751,983
Series 2005-1, Class A5 (3 monthLIBOR + 0.110%),1.424%, 10/25/2033 (A) 5,989,506 5,884,465
Series 2005-2, Class A5 (3 monthLIBOR + 0.100%),1.387%, 03/23/2037 (A) 924,213 903,475
Series 2005-3, Class A5 (3 monthLIBOR + 0.120%),1.407%, 12/24/2035 (A) 7,786,484 7,664,617
Series 2005-4, Class A4 (3 monthLIBOR + 0.180%),1.467%, 03/22/2032 (A) 832,000 801,917
Series 2006-2, Class A6 (3 monthLIBOR + 0.120%),1.434%, 04/25/2031 (A) 3,440,000 3,436,704
Core Bond Fund (continued)Shares orPrincipalAmount Value
ASSET BACKEDSECURITIES (continued)Nelnet Student Loan Trust (continued)
Series 2010-4A, Class A (1 monthLIBOR + 0.800%),2.034%, 04/25/2046 (A)(D) $ 240,378 $ 243,132
Series 2016-1A, Class A (1 monthLIBOR + 0.800%),2.034%, 09/25/2065 (A)(D) 2,878,077 2,908,737
Series 2017-2A, Class A (1 monthLIBOR + 0.770%),2.030%, 09/25/2065 (A)(D) 3,472,000 3,454,597
Santander Drive Auto Receivables Trust,Series 2016-2, Class A2A,1.380%, 07/15/2019 158,681 158,666
SLM Private Education Loan TrustSeries 2012-D, Class A2,
2.950%, 02/15/2046 (D) 427,630 429,156Series 2013-B, Class A2B (1 month
LIBOR + 1.100%),2.327%, 06/17/2030 (A)(D) 823,000 830,939
Series 2013-C, Class A2A,2.940%, 10/15/2031 (D) 764,884 773,872
SLM Student Loan TrustSeries 2003-1, Class ASC (3 month
LIBOR + 0.750%),1.996%, 12/15/2032 (A)(D) 1,225,600 1,215,420
Series 2004-10, Class A7A (3 monthLIBOR + 0.750%),2.064%, 10/25/2029 (A)(D) 2,777,000 2,777,012
Series 2005-6, Class A5B (3 monthLIBOR + 1.200%),2.514%, 07/27/2026 (A) 96,676 97,156
Series 2005-8, Class A4 (3 monthLIBOR + 0.550%),1.864%, 01/25/2028 (A) 668,583 672,669
Series 2006-3, Class A5 (3 monthLIBOR + 0.100%),1.414%, 01/25/2021 (A) 2,467,000 2,437,429
Series 2007-2, Class A4 (3 monthLIBOR + 0.060%),1.374%, 07/25/2022 (A) 2,873,000 2,787,358
Series 2007-2, Class B (3 monthLIBOR + 0.170%),1.484%, 07/25/2025 (A) 2,151,000 1,811,609
Series 2010-1, Class A (1 monthLIBOR + 0.400%),1.634%, 03/25/2025 (A) 543,173 537,131
Series 2012-1, Class A3 (1 monthLIBOR + 0.950%),2.184%, 09/25/2028 (A) 5,572,224 5,616,925
Series 2012-2, Class A (1 monthLIBOR + 0.700%),1.934%, 01/25/2029 (A) 1,720,819 1,726,328
Series 2012-6, Class A3 (1 monthLIBOR + 0.750%),1.984%, 05/26/2026 (A) 902,038 896,473
Series 2012-6, Class B (1 monthLIBOR + 1.000%),2.234%, 04/27/2043 (A) 1,086,000 991,478
Series 2013-1, Class B (1 monthLIBOR + 1.800%),3.034%, 11/25/2070 (A) 185,000 185,703
Series 2014-2, Class A3 (1 monthLIBOR + 0.590%),1.824%, 03/25/2055 (A) 3,032,000 3,039,469
John Hancock Funds IIPortfolio of Investments — August 31, 2017 (showing percentage of total net assets)
60
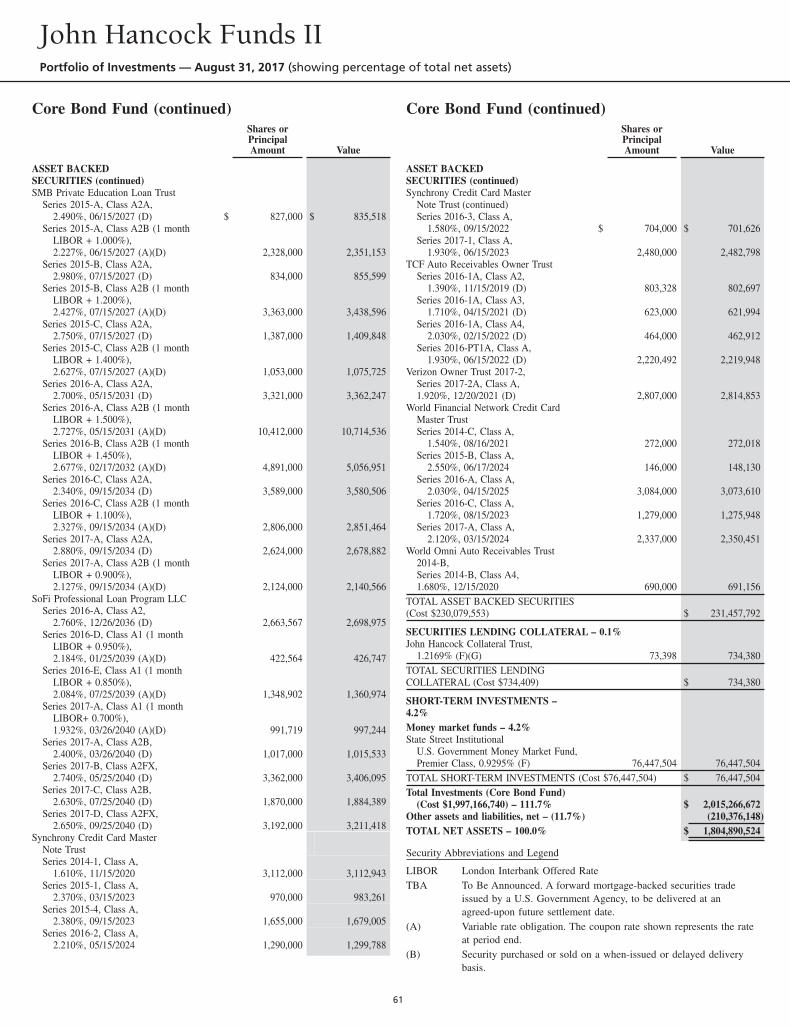
Core Bond Fund (continued)Shares orPrincipalAmount Value
ASSET BACKEDSECURITIES (continued)SMB Private Education Loan Trust
Series 2015-A, Class A2A,2.490%, 06/15/2027 (D) $ 827,000 $ 835,518
Series 2015-A, Class A2B (1 monthLIBOR + 1.000%),2.227%, 06/15/2027 (A)(D) 2,328,000 2,351,153
Series 2015-B, Class A2A,2.980%, 07/15/2027 (D) 834,000 855,599
Series 2015-B, Class A2B (1 monthLIBOR + 1.200%),2.427%, 07/15/2027 (A)(D) 3,363,000 3,438,596
Series 2015-C, Class A2A,2.750%, 07/15/2027 (D) 1,387,000 1,409,848
Series 2015-C, Class A2B (1 monthLIBOR + 1.400%),2.627%, 07/15/2027 (A)(D) 1,053,000 1,075,725
Series 2016-A, Class A2A,2.700%, 05/15/2031 (D) 3,321,000 3,362,247
Series 2016-A, Class A2B (1 monthLIBOR + 1.500%),2.727%, 05/15/2031 (A)(D) 10,412,000 10,714,536
Series 2016-B, Class A2B (1 monthLIBOR + 1.450%),2.677%, 02/17/2032 (A)(D) 4,891,000 5,056,951
Series 2016-C, Class A2A,2.340%, 09/15/2034 (D) 3,589,000 3,580,506
Series 2016-C, Class A2B (1 monthLIBOR + 1.100%),2.327%, 09/15/2034 (A)(D) 2,806,000 2,851,464
Series 2017-A, Class A2A,2.880%, 09/15/2034 (D) 2,624,000 2,678,882
Series 2017-A, Class A2B (1 monthLIBOR + 0.900%),2.127%, 09/15/2034 (A)(D) 2,124,000 2,140,566
SoFi Professional Loan Program LLCSeries 2016-A, Class A2,
2.760%, 12/26/2036 (D) 2,663,567 2,698,975Series 2016-D, Class A1 (1 month
LIBOR + 0.950%),2.184%, 01/25/2039 (A)(D) 422,564 426,747
Series 2016-E, Class A1 (1 monthLIBOR + 0.850%),2.084%, 07/25/2039 (A)(D) 1,348,902 1,360,974
Series 2017-A, Class A1 (1 monthLIBOR+ 0.700%),1.932%, 03/26/2040 (A)(D) 991,719 997,244
Series 2017-A, Class A2B,2.400%, 03/26/2040 (D) 1,017,000 1,015,533
Series 2017-B, Class A2FX,2.740%, 05/25/2040 (D) 3,362,000 3,406,095
Series 2017-C, Class A2B,2.630%, 07/25/2040 (D) 1,870,000 1,884,389
Series 2017-D, Class A2FX,2.650%, 09/25/2040 (D) 3,192,000 3,211,418
Synchrony Credit Card MasterNote TrustSeries 2014-1, Class A,
1.610%, 11/15/2020 3,112,000 3,112,943Series 2015-1, Class A,
2.370%, 03/15/2023 970,000 983,261Series 2015-4, Class A,
2.380%, 09/15/2023 1,655,000 1,679,005Series 2016-2, Class A,
2.210%, 05/15/2024 1,290,000 1,299,788
Core Bond Fund (continued)Shares orPrincipalAmount Value
ASSET BACKEDSECURITIES (continued)Synchrony Credit Card Master
Note Trust (continued)Series 2016-3, Class A,
1.580%, 09/15/2022 $ 704,000 $ 701,626Series 2017-1, Class A,
1.930%, 06/15/2023 2,480,000 2,482,798TCF Auto Receivables Owner Trust
Series 2016-1A, Class A2,1.390%, 11/15/2019 (D) 803,328 802,697
Series 2016-1A, Class A3,1.710%, 04/15/2021 (D) 623,000 621,994
Series 2016-1A, Class A4,2.030%, 02/15/2022 (D) 464,000 462,912
Series 2016-PT1A, Class A,1.930%, 06/15/2022 (D) 2,220,492 2,219,948
Verizon Owner Trust 2017-2,Series 2017-2A, Class A,1.920%, 12/20/2021 (D) 2,807,000 2,814,853
World Financial Network Credit CardMaster TrustSeries 2014-C, Class A,
1.540%, 08/16/2021 272,000 272,018Series 2015-B, Class A,
2.550%, 06/17/2024 146,000 148,130Series 2016-A, Class A,
2.030%, 04/15/2025 3,084,000 3,073,610Series 2016-C, Class A,
1.720%, 08/15/2023 1,279,000 1,275,948Series 2017-A, Class A,
2.120%, 03/15/2024 2,337,000 2,350,451World Omni Auto Receivables Trust
2014-B,Series 2014-B, Class A4,1.680%, 12/15/2020 690,000 691,156
TOTAL ASSET BACKED SECURITIES(Cost $230,079,553) $ 231,457,792
SECURITIES LENDING COLLATERAL – 0.1%John Hancock Collateral Trust,
1.2169% (F)(G) 73,398 734,380TOTAL SECURITIES LENDINGCOLLATERAL (Cost $734,409) $ 734,380
SHORT-TERM INVESTMENTS –4.2%Money market funds – 4.2%State Street Institutional
U.S. Government Money Market Fund,Premier Class, 0.9295% (F) 76,447,504 76,447,504
TOTAL SHORT-TERM INVESTMENTS (Cost $76,447,504) $ 76,447,504Total Investments (Core Bond Fund)
(Cost $1,997,166,740) – 111.7% $ 2,015,266,672Other assets and liabilities, net – (11.7%) (210,376,148)TOTAL NET ASSETS – 100.0% $ 1,804,890,524
Security Abbreviations and Legend
LIBOR London Interbank Offered RateTBA To Be Announced. A forward mortgage-backed securities trade
issued by a U.S. Government Agency, to be delivered at anagreed-upon future settlement date.
(A) Variable rate obligation. The coupon rate shown represents the rateat period end.
(B) Security purchased or sold on a when-issued or delayed deliverybasis.
John Hancock Funds IIPortfolio of Investments — August 31, 2017 (showing percentage of total net assets)
61
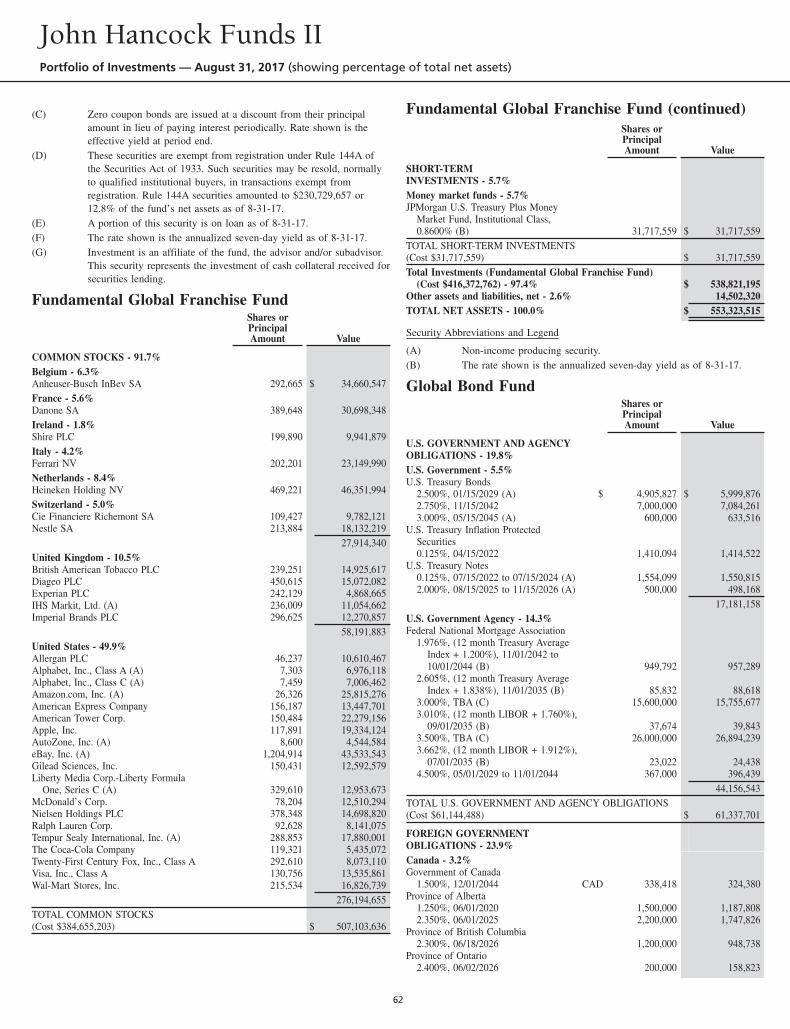
(C) Zero coupon bonds are issued at a discount from their principalamount in lieu of paying interest periodically. Rate shown is theeffective yield at period end.
(D) These securities are exempt from registration under Rule 144A ofthe Securities Act of 1933. Such securities may be resold, normallyto qualified institutional buyers, in transactions exempt fromregistration. Rule 144A securities amounted to $230,729,657 or12.8% of the fund’s net assets as of 8-31-17.
(E) A portion of this security is on loan as of 8-31-17.(F) The rate shown is the annualized seven-day yield as of 8-31-17.(G) Investment is an affiliate of the fund, the advisor and/or subadvisor.
This security represents the investment of cash collateral received forsecurities lending.
Fundamental Global Franchise FundShares orPrincipalAmount Value
COMMON STOCKS - 91.7%Belgium - 6.3%Anheuser-Busch InBev SA 292,665 $ 34,660,547France - 5.6%Danone SA 389,648 30,698,348Ireland - 1.8%Shire PLC 199,890 9,941,879Italy - 4.2%Ferrari NV 202,201 23,149,990Netherlands - 8.4%Heineken Holding NV 469,221 46,351,994Switzerland - 5.0%Cie Financiere Richemont SA 109,427 9,782,121Nestle SA 213,884 18,132,219
27,914,340United Kingdom - 10.5%British American Tobacco PLC 239,251 14,925,617Diageo PLC 450,615 15,072,082Experian PLC 242,129 4,868,665IHS Markit, Ltd. (A) 236,009 11,054,662Imperial Brands PLC 296,625 12,270,857
58,191,883United States - 49.9%Allergan PLC 46,237 10,610,467Alphabet, Inc., Class A (A) 7,303 6,976,118Alphabet, Inc., Class C (A) 7,459 7,006,462Amazon.com, Inc. (A) 26,326 25,815,276American Express Company 156,187 13,447,701American Tower Corp. 150,484 22,279,156Apple, Inc. 117,891 19,334,124AutoZone, Inc. (A) 8,600 4,544,584eBay, Inc. (A) 1,204,914 43,533,543Gilead Sciences, Inc. 150,431 12,592,579Liberty Media Corp.-Liberty Formula
One, Series C (A) 329,610 12,953,673McDonald’s Corp. 78,204 12,510,294Nielsen Holdings PLC 378,348 14,698,820Ralph Lauren Corp. 92,628 8,141,075Tempur Sealy International, Inc. (A) 288,853 17,880,001The Coca-Cola Company 119,321 5,435,072Twenty-First Century Fox, Inc., Class A 292,610 8,073,110Visa, Inc., Class A 130,756 13,535,861Wal-Mart Stores, Inc. 215,534 16,826,739
276,194,655TOTAL COMMON STOCKS(Cost $384,655,203) $ 507,103,636
Fundamental Global Franchise Fund (continued)Shares orPrincipalAmount Value
SHORT-TERMINVESTMENTS - 5.7%Money market funds - 5.7%JPMorgan U.S. Treasury Plus Money
Market Fund, Institutional Class,0.8600% (B) 31,717,559 $ 31,717,559
TOTAL SHORT-TERM INVESTMENTS(Cost $31,717,559) $ 31,717,559Total Investments (Fundamental Global Franchise Fund)
(Cost $416,372,762) - 97.4% $ 538,821,195Other assets and liabilities, net - 2.6% 14,502,320TOTAL NET ASSETS - 100.0% $ 553,323,515
Security Abbreviations and Legend
(A) Non-income producing security.(B) The rate shown is the annualized seven-day yield as of 8-31-17.
Global Bond FundShares orPrincipalAmount Value
U.S. GOVERNMENT AND AGENCYOBLIGATIONS - 19.8%U.S. Government - 5.5%U.S. Treasury Bonds
2.500%, 01/15/2029 (A) $ 4,905,827 $ 5,999,8762.750%, 11/15/2042 7,000,000 7,084,2613.000%, 05/15/2045 (A) 600,000 633,516
U.S. Treasury Inflation ProtectedSecurities0.125%, 04/15/2022 1,410,094 1,414,522
U.S. Treasury Notes0.125%, 07/15/2022 to 07/15/2024 (A) 1,554,099 1,550,8152.000%, 08/15/2025 to 11/15/2026 (A) 500,000 498,168
17,181,158U.S. Government Agency - 14.3%Federal National Mortgage Association
1.976%, (12 month Treasury AverageIndex + 1.200%), 11/01/2042 to10/01/2044 (B) 949,792 957,289
2.605%, (12 month Treasury AverageIndex + 1.838%), 11/01/2035 (B) 85,832 88,618
3.000%, TBA (C) 15,600,000 15,755,6773.010%, (12 month LIBOR + 1.760%),
09/01/2035 (B) 37,674 39,8433.500%, TBA (C) 26,000,000 26,894,2393.662%, (12 month LIBOR + 1.912%),
07/01/2035 (B) 23,022 24,4384.500%, 05/01/2029 to 11/01/2044 367,000 396,439
44,156,543TOTAL U.S. GOVERNMENT AND AGENCY OBLIGATIONS(Cost $61,144,488) $ 61,337,701
FOREIGN GOVERNMENTOBLIGATIONS - 23.9%Canada - 3.2%Government of Canada
1.500%, 12/01/2044 CAD 338,418 324,380Province of Alberta
1.250%, 06/01/2020 1,500,000 1,187,8082.350%, 06/01/2025 2,200,000 1,747,826
Province of British Columbia2.300%, 06/18/2026 1,200,000 948,738
Province of Ontario2.400%, 06/02/2026 200,000 158,823
John Hancock Funds IIPortfolio of Investments — August 31, 2017 (showing percentage of total net assets)
62
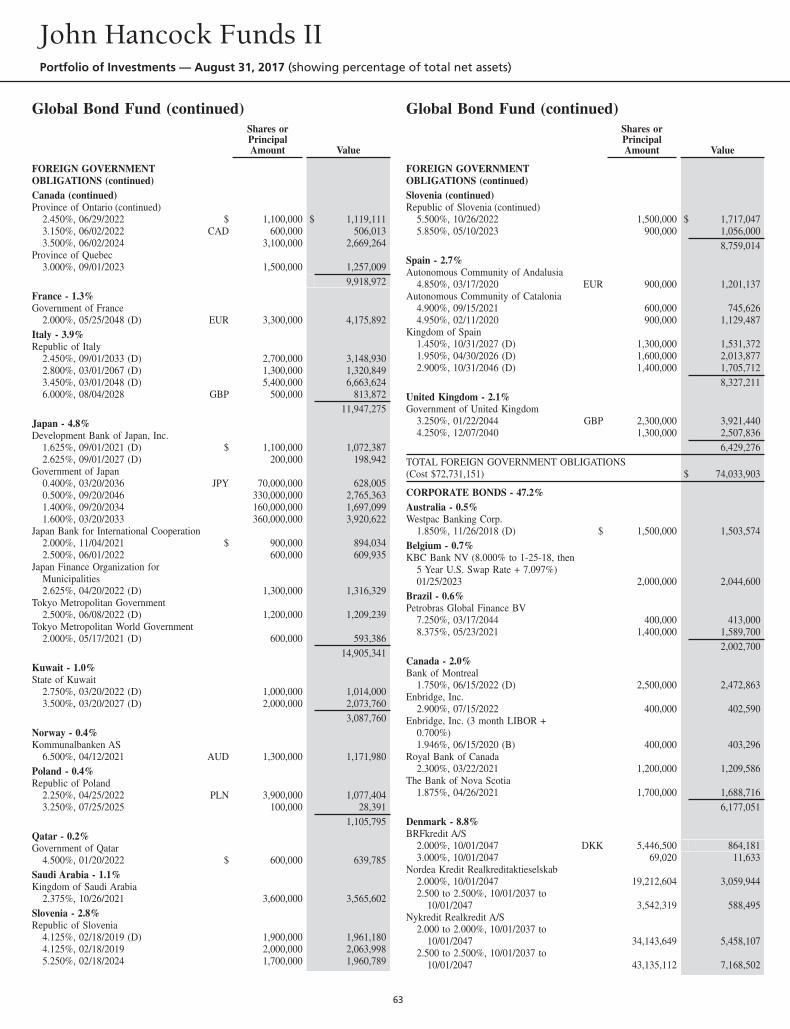
Global Bond Fund (continued)Shares orPrincipalAmount Value
FOREIGN GOVERNMENTOBLIGATIONS (continued)Canada (continued)Province of Ontario (continued)
2.450%, 06/29/2022 $ 1,100,000 $ 1,119,1113.150%, 06/02/2022 CAD 600,000 506,0133.500%, 06/02/2024 3,100,000 2,669,264
Province of Quebec3.000%, 09/01/2023 1,500,000 1,257,009
9,918,972France - 1.3%Government of France
2.000%, 05/25/2048 (D) EUR 3,300,000 4,175,892Italy - 3.9%Republic of Italy
2.450%, 09/01/2033 (D) 2,700,000 3,148,9302.800%, 03/01/2067 (D) 1,300,000 1,320,8493.450%, 03/01/2048 (D) 5,400,000 6,663,6246.000%, 08/04/2028 GBP 500,000 813,872
11,947,275Japan - 4.8%Development Bank of Japan, Inc.
1.625%, 09/01/2021 (D) $ 1,100,000 1,072,3872.625%, 09/01/2027 (D) 200,000 198,942
Government of Japan0.400%, 03/20/2036 JPY 70,000,000 628,0050.500%, 09/20/2046 330,000,000 2,765,3631.400%, 09/20/2034 160,000,000 1,697,0991.600%, 03/20/2033 360,000,000 3,920,622
Japan Bank for International Cooperation2.000%, 11/04/2021 $ 900,000 894,0342.500%, 06/01/2022 600,000 609,935
Japan Finance Organization forMunicipalities2.625%, 04/20/2022 (D) 1,300,000 1,316,329
Tokyo Metropolitan Government2.500%, 06/08/2022 (D) 1,200,000 1,209,239
Tokyo Metropolitan World Government2.000%, 05/17/2021 (D) 600,000 593,386
14,905,341Kuwait - 1.0%State of Kuwait
2.750%, 03/20/2022 (D) 1,000,000 1,014,0003.500%, 03/20/2027 (D) 2,000,000 2,073,760
3,087,760Norway - 0.4%Kommunalbanken AS
6.500%, 04/12/2021 AUD 1,300,000 1,171,980Poland - 0.4%Republic of Poland
2.250%, 04/25/2022 PLN 3,900,000 1,077,4043.250%, 07/25/2025 100,000 28,391
1,105,795Qatar - 0.2%Government of Qatar
4.500%, 01/20/2022 $ 600,000 639,785Saudi Arabia - 1.1%Kingdom of Saudi Arabia
2.375%, 10/26/2021 3,600,000 3,565,602Slovenia - 2.8%Republic of Slovenia
4.125%, 02/18/2019 (D) 1,900,000 1,961,1804.125%, 02/18/2019 2,000,000 2,063,9985.250%, 02/18/2024 1,700,000 1,960,789
Global Bond Fund (continued)Shares orPrincipalAmount Value
FOREIGN GOVERNMENTOBLIGATIONS (continued)Slovenia (continued)Republic of Slovenia (continued)
5.500%, 10/26/2022 1,500,000 $ 1,717,0475.850%, 05/10/2023 900,000 1,056,000
8,759,014Spain - 2.7%Autonomous Community of Andalusia
4.850%, 03/17/2020 EUR 900,000 1,201,137Autonomous Community of Catalonia
4.900%, 09/15/2021 600,000 745,6264.950%, 02/11/2020 900,000 1,129,487
Kingdom of Spain1.450%, 10/31/2027 (D) 1,300,000 1,531,3721.950%, 04/30/2026 (D) 1,600,000 2,013,8772.900%, 10/31/2046 (D) 1,400,000 1,705,712
8,327,211United Kingdom - 2.1%Government of United Kingdom
3.250%, 01/22/2044 GBP 2,300,000 3,921,4404.250%, 12/07/2040 1,300,000 2,507,836
6,429,276TOTAL FOREIGN GOVERNMENT OBLIGATIONS(Cost $72,731,151) $ 74,033,903
CORPORATE BONDS - 47.2%Australia - 0.5%Westpac Banking Corp.
1.850%, 11/26/2018 (D) $ 1,500,000 1,503,574Belgium - 0.7%KBC Bank NV (8.000% to 1-25-18, then
5 Year U.S. Swap Rate + 7.097%)01/25/2023 2,000,000 2,044,600
Brazil - 0.6%Petrobras Global Finance BV
7.250%, 03/17/2044 400,000 413,0008.375%, 05/23/2021 1,400,000 1,589,700
2,002,700Canada - 2.0%Bank of Montreal
1.750%, 06/15/2022 (D) 2,500,000 2,472,863Enbridge, Inc.
2.900%, 07/15/2022 400,000 402,590Enbridge, Inc. (3 month LIBOR +
0.700%)1.946%, 06/15/2020 (B) 400,000 403,296
Royal Bank of Canada2.300%, 03/22/2021 1,200,000 1,209,586
The Bank of Nova Scotia1.875%, 04/26/2021 1,700,000 1,688,716
6,177,051Denmark - 8.8%BRFkredit A/S
2.000%, 10/01/2047 DKK 5,446,500 864,1813.000%, 10/01/2047 69,020 11,633
Nordea Kredit Realkreditaktieselskab2.000%, 10/01/2047 19,212,604 3,059,9442.500 to 2.500%, 10/01/2037 to
10/01/2047 3,542,319 588,495Nykredit Realkredit A/S
2.000 to 2.000%, 10/01/2037 to10/01/2047 34,143,649 5,458,107
2.500 to 2.500%, 10/01/2037 to10/01/2047 43,135,112 7,168,502
John Hancock Funds IIPortfolio of Investments — August 31, 2017 (showing percentage of total net assets)
63
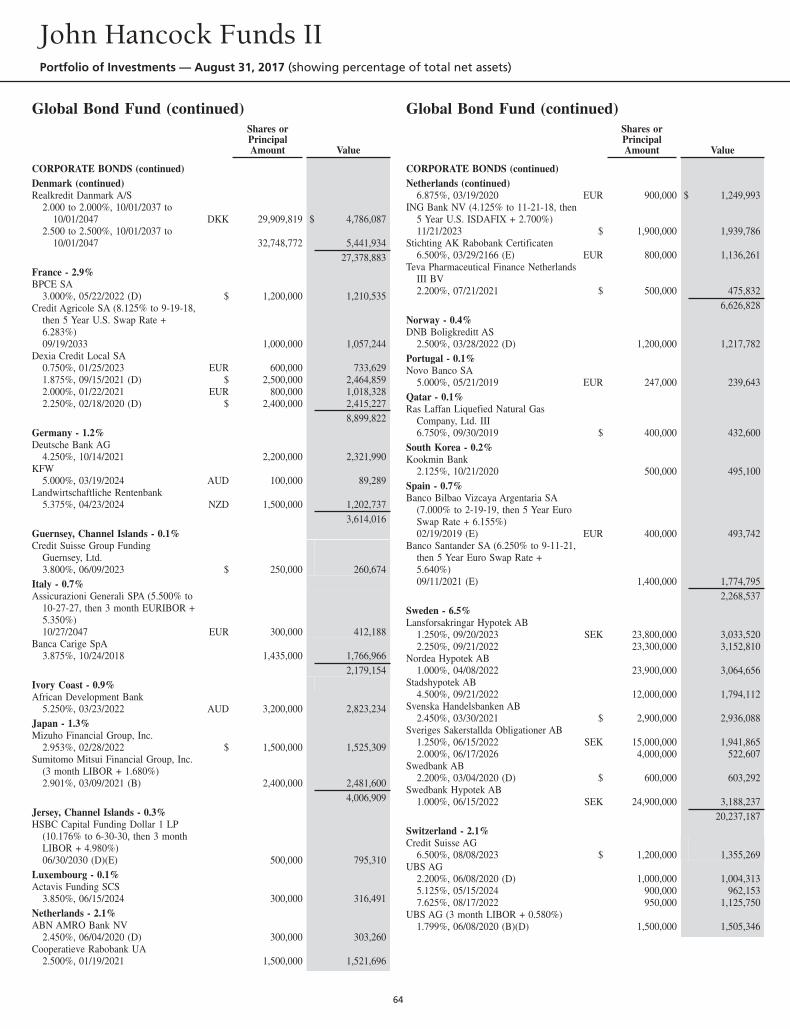
Global Bond Fund (continued)Shares orPrincipalAmount Value
CORPORATE BONDS (continued)Denmark (continued)Realkredit Danmark A/S
2.000 to 2.000%, 10/01/2037 to10/01/2047 DKK 29,909,819 $ 4,786,087
2.500 to 2.500%, 10/01/2037 to10/01/2047 32,748,772 5,441,934
27,378,883France - 2.9%BPCE SA
3.000%, 05/22/2022 (D) $ 1,200,000 1,210,535Credit Agricole SA (8.125% to 9-19-18,
then 5 Year U.S. Swap Rate +6.283%)09/19/2033 1,000,000 1,057,244
Dexia Credit Local SA0.750%, 01/25/2023 EUR 600,000 733,6291.875%, 09/15/2021 (D) $ 2,500,000 2,464,8592.000%, 01/22/2021 EUR 800,000 1,018,3282.250%, 02/18/2020 (D) $ 2,400,000 2,415,227
8,899,822Germany - 1.2%Deutsche Bank AG
4.250%, 10/14/2021 2,200,000 2,321,990KFW
5.000%, 03/19/2024 AUD 100,000 89,289Landwirtschaftliche Rentenbank
5.375%, 04/23/2024 NZD 1,500,000 1,202,7373,614,016
Guernsey, Channel Islands - 0.1%Credit Suisse Group Funding
Guernsey, Ltd.3.800%, 06/09/2023 $ 250,000 260,674
Italy - 0.7%Assicurazioni Generali SPA (5.500% to
10-27-27, then 3 month EURIBOR +5.350%)10/27/2047 EUR 300,000 412,188
Banca Carige SpA3.875%, 10/24/2018 1,435,000 1,766,966
2,179,154Ivory Coast - 0.9%African Development Bank
5.250%, 03/23/2022 AUD 3,200,000 2,823,234Japan - 1.3%Mizuho Financial Group, Inc.
2.953%, 02/28/2022 $ 1,500,000 1,525,309Sumitomo Mitsui Financial Group, Inc.
(3 month LIBOR + 1.680%)2.901%, 03/09/2021 (B) 2,400,000 2,481,600
4,006,909Jersey, Channel Islands - 0.3%HSBC Capital Funding Dollar 1 LP
(10.176% to 6-30-30, then 3 monthLIBOR + 4.980%)06/30/2030 (D)(E) 500,000 795,310
Luxembourg - 0.1%Actavis Funding SCS
3.850%, 06/15/2024 300,000 316,491Netherlands - 2.1%ABN AMRO Bank NV
2.450%, 06/04/2020 (D) 300,000 303,260Cooperatieve Rabobank UA
2.500%, 01/19/2021 1,500,000 1,521,696
Global Bond Fund (continued)Shares orPrincipalAmount Value
CORPORATE BONDS (continued)Netherlands (continued)
6.875%, 03/19/2020 EUR 900,000 $ 1,249,993ING Bank NV (4.125% to 11-21-18, then
5 Year U.S. ISDAFIX + 2.700%)11/21/2023 $ 1,900,000 1,939,786
Stichting AK Rabobank Certificaten6.500%, 03/29/2166 (E) EUR 800,000 1,136,261
Teva Pharmaceutical Finance NetherlandsIII BV2.200%, 07/21/2021 $ 500,000 475,832
6,626,828Norway - 0.4%DNB Boligkreditt AS
2.500%, 03/28/2022 (D) 1,200,000 1,217,782Portugal - 0.1%Novo Banco SA
5.000%, 05/21/2019 EUR 247,000 239,643Qatar - 0.1%Ras Laffan Liquefied Natural Gas
Company, Ltd. III6.750%, 09/30/2019 $ 400,000 432,600
South Korea - 0.2%Kookmin Bank
2.125%, 10/21/2020 500,000 495,100Spain - 0.7%Banco Bilbao Vizcaya Argentaria SA
(7.000% to 2-19-19, then 5 Year EuroSwap Rate + 6.155%)02/19/2019 (E) EUR 400,000 493,742
Banco Santander SA (6.250% to 9-11-21,then 5 Year Euro Swap Rate +5.640%)09/11/2021 (E) 1,400,000 1,774,795
2,268,537Sweden - 6.5%Lansforsakringar Hypotek AB
1.250%, 09/20/2023 SEK 23,800,000 3,033,5202.250%, 09/21/2022 23,300,000 3,152,810
Nordea Hypotek AB1.000%, 04/08/2022 23,900,000 3,064,656
Stadshypotek AB4.500%, 09/21/2022 12,000,000 1,794,112
Svenska Handelsbanken AB2.450%, 03/30/2021 $ 2,900,000 2,936,088
Sveriges Sakerstallda Obligationer AB1.250%, 06/15/2022 SEK 15,000,000 1,941,8652.000%, 06/17/2026 4,000,000 522,607
Swedbank AB2.200%, 03/04/2020 (D) $ 600,000 603,292
Swedbank Hypotek AB1.000%, 06/15/2022 SEK 24,900,000 3,188,237
20,237,187Switzerland - 2.1%Credit Suisse AG
6.500%, 08/08/2023 $ 1,200,000 1,355,269UBS AG
2.200%, 06/08/2020 (D) 1,000,000 1,004,3135.125%, 05/15/2024 900,000 962,1537.625%, 08/17/2022 950,000 1,125,750
UBS AG (3 month LIBOR + 0.580%)1.799%, 06/08/2020 (B)(D) 1,500,000 1,505,346
John Hancock Funds IIPortfolio of Investments — August 31, 2017 (showing percentage of total net assets)
64
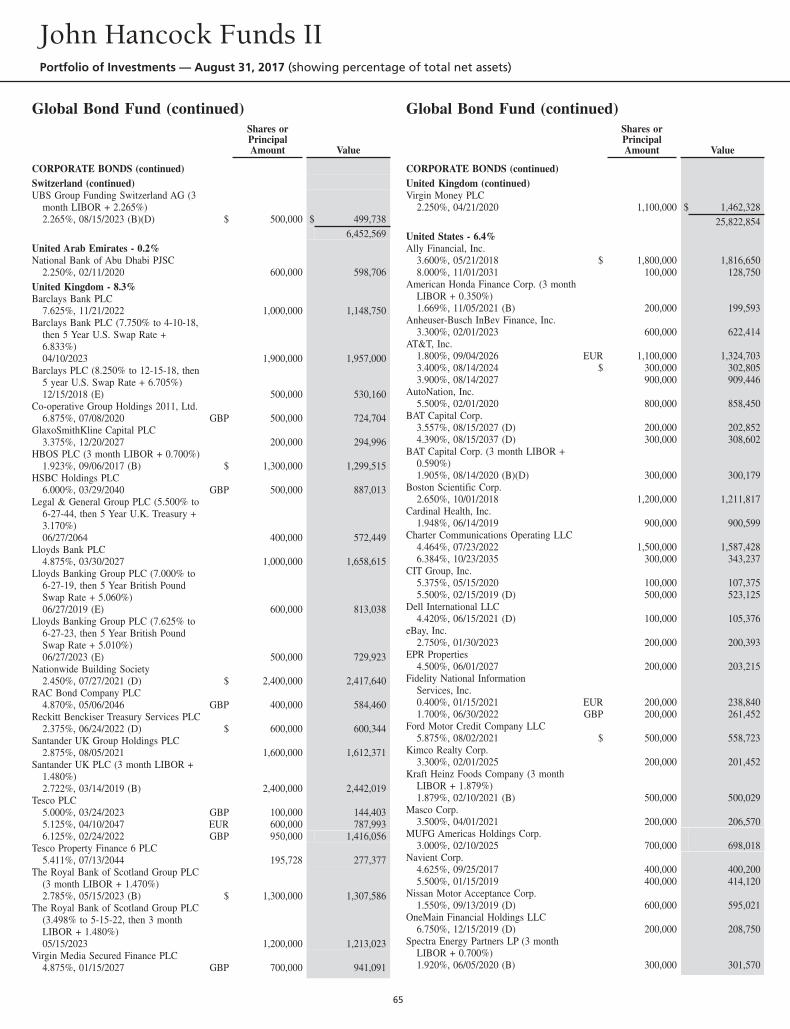
Global Bond Fund (continued)Shares orPrincipalAmount Value
CORPORATE BONDS (continued)Switzerland (continued)UBS Group Funding Switzerland AG (3
month LIBOR + 2.265%)2.265%, 08/15/2023 (B)(D) $ 500,000 $ 499,738
6,452,569United Arab Emirates - 0.2%National Bank of Abu Dhabi PJSC
2.250%, 02/11/2020 600,000 598,706United Kingdom - 8.3%Barclays Bank PLC
7.625%, 11/21/2022 1,000,000 1,148,750Barclays Bank PLC (7.750% to 4-10-18,
then 5 Year U.S. Swap Rate +6.833%)04/10/2023 1,900,000 1,957,000
Barclays PLC (8.250% to 12-15-18, then5 year U.S. Swap Rate + 6.705%)12/15/2018 (E) 500,000 530,160
Co-operative Group Holdings 2011, Ltd.6.875%, 07/08/2020 GBP 500,000 724,704
GlaxoSmithKline Capital PLC3.375%, 12/20/2027 200,000 294,996
HBOS PLC (3 month LIBOR + 0.700%)1.923%, 09/06/2017 (B) $ 1,300,000 1,299,515
HSBC Holdings PLC6.000%, 03/29/2040 GBP 500,000 887,013
Legal & General Group PLC (5.500% to6-27-44, then 5 Year U.K. Treasury +3.170%)06/27/2064 400,000 572,449
Lloyds Bank PLC4.875%, 03/30/2027 1,000,000 1,658,615
Lloyds Banking Group PLC (7.000% to6-27-19, then 5 Year British PoundSwap Rate + 5.060%)06/27/2019 (E) 600,000 813,038
Lloyds Banking Group PLC (7.625% to6-27-23, then 5 Year British PoundSwap Rate + 5.010%)06/27/2023 (E) 500,000 729,923
Nationwide Building Society2.450%, 07/27/2021 (D) $ 2,400,000 2,417,640
RAC Bond Company PLC4.870%, 05/06/2046 GBP 400,000 584,460
Reckitt Benckiser Treasury Services PLC2.375%, 06/24/2022 (D) $ 600,000 600,344
Santander UK Group Holdings PLC2.875%, 08/05/2021 1,600,000 1,612,371
Santander UK PLC (3 month LIBOR +1.480%)2.722%, 03/14/2019 (B) 2,400,000 2,442,019
Tesco PLC5.000%, 03/24/2023 GBP 100,000 144,4035.125%, 04/10/2047 EUR 600,000 787,9936.125%, 02/24/2022 GBP 950,000 1,416,056
Tesco Property Finance 6 PLC5.411%, 07/13/2044 195,728 277,377
The Royal Bank of Scotland Group PLC(3 month LIBOR + 1.470%)2.785%, 05/15/2023 (B) $ 1,300,000 1,307,586
The Royal Bank of Scotland Group PLC(3.498% to 5-15-22, then 3 monthLIBOR + 1.480%)05/15/2023 1,200,000 1,213,023
Virgin Media Secured Finance PLC4.875%, 01/15/2027 GBP 700,000 941,091
Global Bond Fund (continued)Shares orPrincipalAmount Value
CORPORATE BONDS (continued)United Kingdom (continued)Virgin Money PLC
2.250%, 04/21/2020 1,100,000 $ 1,462,32825,822,854
United States - 6.4%Ally Financial, Inc.
3.600%, 05/21/2018 $ 1,800,000 1,816,6508.000%, 11/01/2031 100,000 128,750
American Honda Finance Corp. (3 monthLIBOR + 0.350%)1.669%, 11/05/2021 (B) 200,000 199,593
Anheuser-Busch InBev Finance, Inc.3.300%, 02/01/2023 600,000 622,414
AT&T, Inc.1.800%, 09/04/2026 EUR 1,100,000 1,324,7033.400%, 08/14/2024 $ 300,000 302,8053.900%, 08/14/2027 900,000 909,446
AutoNation, Inc.5.500%, 02/01/2020 800,000 858,450
BAT Capital Corp.3.557%, 08/15/2027 (D) 200,000 202,8524.390%, 08/15/2037 (D) 300,000 308,602
BAT Capital Corp. (3 month LIBOR +0.590%)1.905%, 08/14/2020 (B)(D) 300,000 300,179
Boston Scientific Corp.2.650%, 10/01/2018 1,200,000 1,211,817
Cardinal Health, Inc.1.948%, 06/14/2019 900,000 900,599
Charter Communications Operating LLC4.464%, 07/23/2022 1,500,000 1,587,4286.384%, 10/23/2035 300,000 343,237
CIT Group, Inc.5.375%, 05/15/2020 100,000 107,3755.500%, 02/15/2019 (D) 500,000 523,125
Dell International LLC4.420%, 06/15/2021 (D) 100,000 105,376
eBay, Inc.2.750%, 01/30/2023 200,000 200,393
EPR Properties4.500%, 06/01/2027 200,000 203,215
Fidelity National InformationServices, Inc.0.400%, 01/15/2021 EUR 200,000 238,8401.700%, 06/30/2022 GBP 200,000 261,452
Ford Motor Credit Company LLC5.875%, 08/02/2021 $ 500,000 558,723
Kimco Realty Corp.3.300%, 02/01/2025 200,000 201,452
Kraft Heinz Foods Company (3 monthLIBOR + 1.879%)1.879%, 02/10/2021 (B) 500,000 500,029
Masco Corp.3.500%, 04/01/2021 200,000 206,570
MUFG Americas Holdings Corp.3.000%, 02/10/2025 700,000 698,018
Navient Corp.4.625%, 09/25/2017 400,000 400,2005.500%, 01/15/2019 400,000 414,120
Nissan Motor Acceptance Corp.1.550%, 09/13/2019 (D) 600,000 595,021
OneMain Financial Holdings LLC6.750%, 12/15/2019 (D) 200,000 208,750
Spectra Energy Partners LP (3 monthLIBOR + 0.700%)1.920%, 06/05/2020 (B) 300,000 301,570
John Hancock Funds IIPortfolio of Investments — August 31, 2017 (showing percentage of total net assets)
65
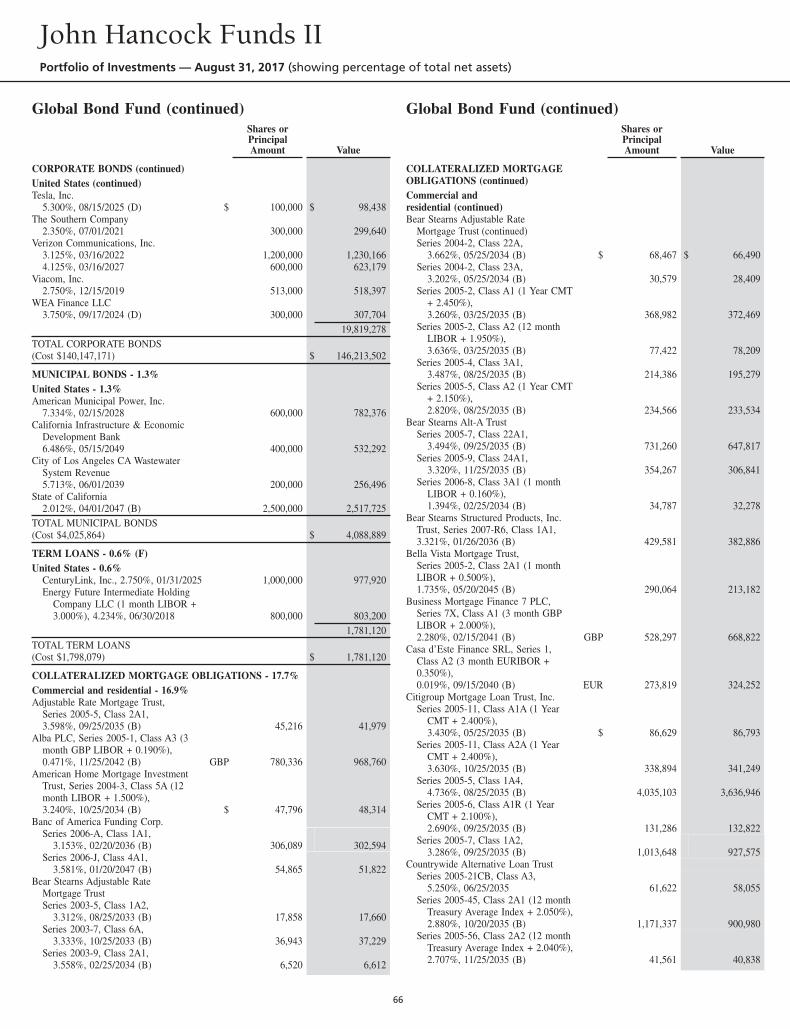
Global Bond Fund (continued)Shares orPrincipalAmount Value
CORPORATE BONDS (continued)United States (continued)Tesla, Inc.
5.300%, 08/15/2025 (D) $ 100,000 $ 98,438The Southern Company
2.350%, 07/01/2021 300,000 299,640Verizon Communications, Inc.
3.125%, 03/16/2022 1,200,000 1,230,1664.125%, 03/16/2027 600,000 623,179
Viacom, Inc.2.750%, 12/15/2019 513,000 518,397
WEA Finance LLC3.750%, 09/17/2024 (D) 300,000 307,704
19,819,278TOTAL CORPORATE BONDS(Cost $140,147,171) $ 146,213,502
MUNICIPAL BONDS - 1.3%United States - 1.3%American Municipal Power, Inc.
7.334%, 02/15/2028 600,000 782,376California Infrastructure & Economic
Development Bank6.486%, 05/15/2049 400,000 532,292
City of Los Angeles CA WastewaterSystem Revenue5.713%, 06/01/2039 200,000 256,496
State of California2.012%, 04/01/2047 (B) 2,500,000 2,517,725
TOTAL MUNICIPAL BONDS(Cost $4,025,864) $ 4,088,889
TERM LOANS - 0.6% (F)United States - 0.6%
CenturyLink, Inc., 2.750%, 01/31/2025 1,000,000 977,920Energy Future Intermediate Holding
Company LLC (1 month LIBOR +3.000%), 4.234%, 06/30/2018 800,000 803,200
1,781,120TOTAL TERM LOANS(Cost $1,798,079) $ 1,781,120
COLLATERALIZED MORTGAGE OBLIGATIONS - 17.7%Commercial and residential - 16.9%Adjustable Rate Mortgage Trust,
Series 2005-5, Class 2A1,3.598%, 09/25/2035 (B) 45,216 41,979
Alba PLC, Series 2005-1, Class A3 (3month GBP LIBOR + 0.190%),0.471%, 11/25/2042 (B) GBP 780,336 968,760
American Home Mortgage InvestmentTrust, Series 2004-3, Class 5A (12month LIBOR + 1.500%),3.240%, 10/25/2034 (B) $ 47,796 48,314
Banc of America Funding Corp.Series 2006-A, Class 1A1,
3.153%, 02/20/2036 (B) 306,089 302,594Series 2006-J, Class 4A1,
3.581%, 01/20/2047 (B) 54,865 51,822Bear Stearns Adjustable Rate
Mortgage TrustSeries 2003-5, Class 1A2,
3.312%, 08/25/2033 (B) 17,858 17,660Series 2003-7, Class 6A,
3.333%, 10/25/2033 (B) 36,943 37,229Series 2003-9, Class 2A1,
3.558%, 02/25/2034 (B) 6,520 6,612
Global Bond Fund (continued)Shares orPrincipalAmount Value
COLLATERALIZED MORTGAGEOBLIGATIONS (continued)Commercial andresidential (continued)Bear Stearns Adjustable Rate
Mortgage Trust (continued)Series 2004-2, Class 22A,
3.662%, 05/25/2034 (B) $ 68,467 $ 66,490Series 2004-2, Class 23A,
3.202%, 05/25/2034 (B) 30,579 28,409Series 2005-2, Class A1 (1 Year CMT
+ 2.450%),3.260%, 03/25/2035 (B) 368,982 372,469
Series 2005-2, Class A2 (12 monthLIBOR + 1.950%),3.636%, 03/25/2035 (B) 77,422 78,209
Series 2005-4, Class 3A1,3.487%, 08/25/2035 (B) 214,386 195,279
Series 2005-5, Class A2 (1 Year CMT+ 2.150%),2.820%, 08/25/2035 (B) 234,566 233,534
Bear Stearns Alt-A TrustSeries 2005-7, Class 22A1,
3.494%, 09/25/2035 (B) 731,260 647,817Series 2005-9, Class 24A1,
3.320%, 11/25/2035 (B) 354,267 306,841Series 2006-8, Class 3A1 (1 month
LIBOR + 0.160%),1.394%, 02/25/2034 (B) 34,787 32,278
Bear Stearns Structured Products, Inc.Trust, Series 2007-R6, Class 1A1,3.321%, 01/26/2036 (B) 429,581 382,886
Bella Vista Mortgage Trust,Series 2005-2, Class 2A1 (1 monthLIBOR + 0.500%),1.735%, 05/20/2045 (B) 290,064 213,182
Business Mortgage Finance 7 PLC,Series 7X, Class A1 (3 month GBPLIBOR + 2.000%),2.280%, 02/15/2041 (B) GBP 528,297 668,822
Casa d’Este Finance SRL, Series 1,Class A2 (3 month EURIBOR +0.350%),0.019%, 09/15/2040 (B) EUR 273,819 324,252
Citigroup Mortgage Loan Trust, Inc.Series 2005-11, Class A1A (1 Year
CMT + 2.400%),3.430%, 05/25/2035 (B) $ 86,629 86,793
Series 2005-11, Class A2A (1 YearCMT + 2.400%),3.630%, 10/25/2035 (B) 338,894 341,249
Series 2005-5, Class 1A4,4.736%, 08/25/2035 (B) 4,035,103 3,636,946
Series 2005-6, Class A1R (1 YearCMT + 2.100%),2.690%, 09/25/2035 (B) 131,286 132,822
Series 2005-7, Class 1A2,3.286%, 09/25/2035 (B) 1,013,648 927,575
Countrywide Alternative Loan TrustSeries 2005-21CB, Class A3,
5.250%, 06/25/2035 61,622 58,055Series 2005-45, Class 2A1 (12 month
Treasury Average Index + 2.050%),2.880%, 10/20/2035 (B) 1,171,337 900,980
Series 2005-56, Class 2A2 (12 monthTreasury Average Index + 2.040%),2.707%, 11/25/2035 (B) 41,561 40,838
John Hancock Funds IIPortfolio of Investments — August 31, 2017 (showing percentage of total net assets)
66
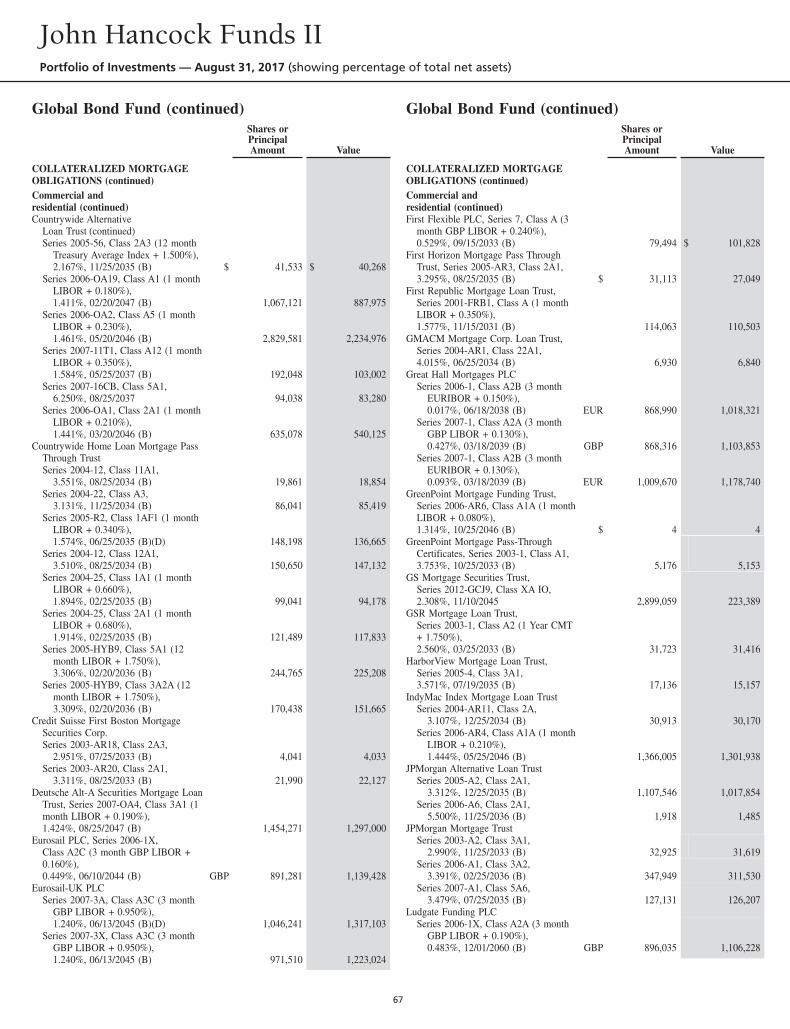
Global Bond Fund (continued)Shares orPrincipalAmount Value
COLLATERALIZED MORTGAGEOBLIGATIONS (continued)Commercial andresidential (continued)Countrywide Alternative
Loan Trust (continued)Series 2005-56, Class 2A3 (12 month
Treasury Average Index + 1.500%),2.167%, 11/25/2035 (B) $ 41,533 $ 40,268
Series 2006-OA19, Class A1 (1 monthLIBOR + 0.180%),1.411%, 02/20/2047 (B) 1,067,121 887,975
Series 2006-OA2, Class A5 (1 monthLIBOR + 0.230%),1.461%, 05/20/2046 (B) 2,829,581 2,234,976
Series 2007-11T1, Class A12 (1 monthLIBOR + 0.350%),1.584%, 05/25/2037 (B) 192,048 103,002
Series 2007-16CB, Class 5A1,6.250%, 08/25/2037 94,038 83,280
Series 2006-OA1, Class 2A1 (1 monthLIBOR + 0.210%),1.441%, 03/20/2046 (B) 635,078 540,125
Countrywide Home Loan Mortgage PassThrough TrustSeries 2004-12, Class 11A1,
3.551%, 08/25/2034 (B) 19,861 18,854Series 2004-22, Class A3,
3.131%, 11/25/2034 (B) 86,041 85,419Series 2005-R2, Class 1AF1 (1 month
LIBOR + 0.340%),1.574%, 06/25/2035 (B)(D) 148,198 136,665
Series 2004-12, Class 12A1,3.510%, 08/25/2034 (B) 150,650 147,132
Series 2004-25, Class 1A1 (1 monthLIBOR + 0.660%),1.894%, 02/25/2035 (B) 99,041 94,178
Series 2004-25, Class 2A1 (1 monthLIBOR + 0.680%),1.914%, 02/25/2035 (B) 121,489 117,833
Series 2005-HYB9, Class 5A1 (12month LIBOR + 1.750%),3.306%, 02/20/2036 (B) 244,765 225,208
Series 2005-HYB9, Class 3A2A (12month LIBOR + 1.750%),3.309%, 02/20/2036 (B) 170,438 151,665
Credit Suisse First Boston MortgageSecurities Corp.Series 2003-AR18, Class 2A3,
2.951%, 07/25/2033 (B) 4,041 4,033Series 2003-AR20, Class 2A1,
3.311%, 08/25/2033 (B) 21,990 22,127Deutsche Alt-A Securities Mortgage Loan
Trust, Series 2007-OA4, Class 3A1 (1month LIBOR + 0.190%),1.424%, 08/25/2047 (B) 1,454,271 1,297,000
Eurosail PLC, Series 2006-1X,Class A2C (3 month GBP LIBOR +0.160%),0.449%, 06/10/2044 (B) GBP 891,281 1,139,428
Eurosail-UK PLCSeries 2007-3A, Class A3C (3 month
GBP LIBOR + 0.950%),1.240%, 06/13/2045 (B)(D) 1,046,241 1,317,103
Series 2007-3X, Class A3C (3 monthGBP LIBOR + 0.950%),1.240%, 06/13/2045 (B) 971,510 1,223,024
Global Bond Fund (continued)Shares orPrincipalAmount Value
COLLATERALIZED MORTGAGEOBLIGATIONS (continued)Commercial andresidential (continued)First Flexible PLC, Series 7, Class A (3
month GBP LIBOR + 0.240%),0.529%, 09/15/2033 (B) 79,494 $ 101,828
First Horizon Mortgage Pass ThroughTrust, Series 2005-AR3, Class 2A1,3.295%, 08/25/2035 (B) $ 31,113 27,049
First Republic Mortgage Loan Trust,Series 2001-FRB1, Class A (1 monthLIBOR + 0.350%),1.577%, 11/15/2031 (B) 114,063 110,503
GMACM Mortgage Corp. Loan Trust,Series 2004-AR1, Class 22A1,4.015%, 06/25/2034 (B) 6,930 6,840
Great Hall Mortgages PLCSeries 2006-1, Class A2B (3 month
EURIBOR + 0.150%),0.017%, 06/18/2038 (B) EUR 868,990 1,018,321
Series 2007-1, Class A2A (3 monthGBP LIBOR + 0.130%),0.427%, 03/18/2039 (B) GBP 868,316 1,103,853
Series 2007-1, Class A2B (3 monthEURIBOR + 0.130%),0.093%, 03/18/2039 (B) EUR 1,009,670 1,178,740
GreenPoint Mortgage Funding Trust,Series 2006-AR6, Class A1A (1 monthLIBOR + 0.080%),1.314%, 10/25/2046 (B) $ 4 4
GreenPoint Mortgage Pass-ThroughCertificates, Series 2003-1, Class A1,3.753%, 10/25/2033 (B) 5,176 5,153
GS Mortgage Securities Trust,Series 2012-GCJ9, Class XA IO,2.308%, 11/10/2045 2,899,059 223,389
GSR Mortgage Loan Trust,Series 2003-1, Class A2 (1 Year CMT+ 1.750%),2.560%, 03/25/2033 (B) 31,723 31,416
HarborView Mortgage Loan Trust,Series 2005-4, Class 3A1,3.571%, 07/19/2035 (B) 17,136 15,157
IndyMac Index Mortgage Loan TrustSeries 2004-AR11, Class 2A,
3.107%, 12/25/2034 (B) 30,913 30,170Series 2006-AR4, Class A1A (1 month
LIBOR + 0.210%),1.444%, 05/25/2046 (B) 1,366,005 1,301,938
JPMorgan Alternative Loan TrustSeries 2005-A2, Class 2A1,
3.312%, 12/25/2035 (B) 1,107,546 1,017,854Series 2006-A6, Class 2A1,
5.500%, 11/25/2036 (B) 1,918 1,485JPMorgan Mortgage Trust
Series 2003-A2, Class 3A1,2.990%, 11/25/2033 (B) 32,925 31,619
Series 2006-A1, Class 3A2,3.391%, 02/25/2036 (B) 347,949 311,530
Series 2007-A1, Class 5A6,3.479%, 07/25/2035 (B) 127,131 126,207
Ludgate Funding PLCSeries 2006-1X, Class A2A (3 month
GBP LIBOR + 0.190%),0.483%, 12/01/2060 (B) GBP 896,035 1,106,228
John Hancock Funds IIPortfolio of Investments — August 31, 2017 (showing percentage of total net assets)
67
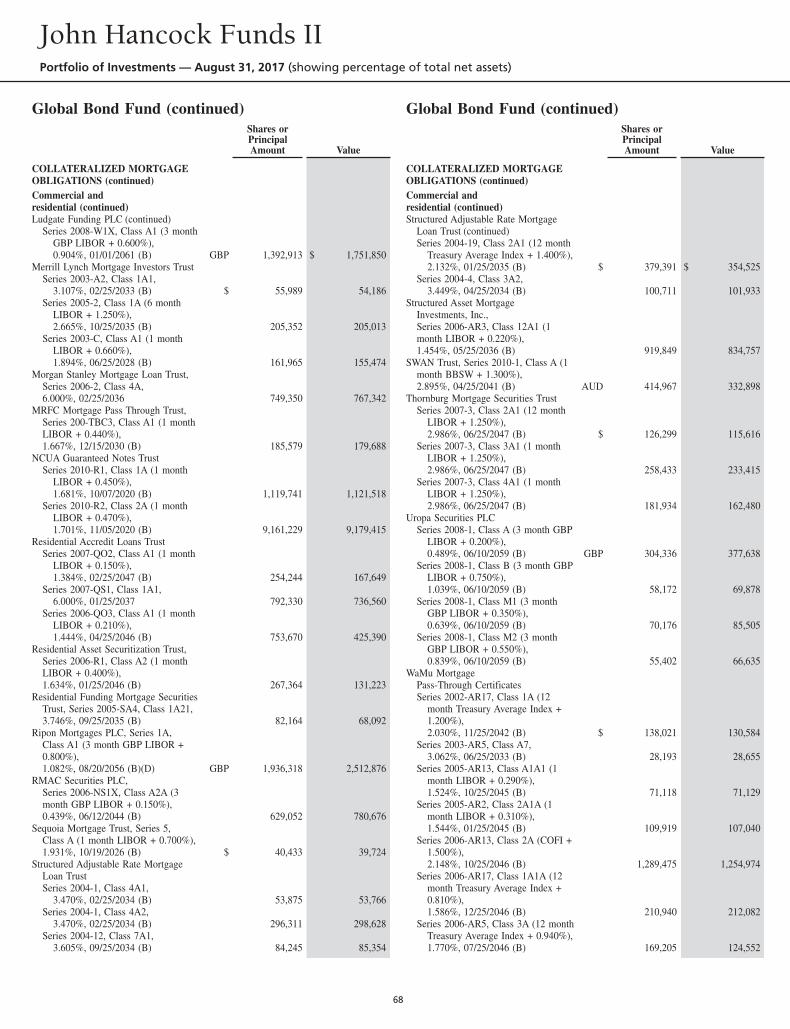
Global Bond Fund (continued)Shares orPrincipalAmount Value
COLLATERALIZED MORTGAGEOBLIGATIONS (continued)Commercial andresidential (continued)Ludgate Funding PLC (continued)
Series 2008-W1X, Class A1 (3 monthGBP LIBOR + 0.600%),0.904%, 01/01/2061 (B) GBP 1,392,913 $ 1,751,850
Merrill Lynch Mortgage Investors TrustSeries 2003-A2, Class 1A1,
3.107%, 02/25/2033 (B) $ 55,989 54,186Series 2005-2, Class 1A (6 month
LIBOR + 1.250%),2.665%, 10/25/2035 (B) 205,352 205,013
Series 2003-C, Class A1 (1 monthLIBOR + 0.660%),1.894%, 06/25/2028 (B) 161,965 155,474
Morgan Stanley Mortgage Loan Trust,Series 2006-2, Class 4A,6.000%, 02/25/2036 749,350 767,342
MRFC Mortgage Pass Through Trust,Series 200-TBC3, Class A1 (1 monthLIBOR + 0.440%),1.667%, 12/15/2030 (B) 185,579 179,688
NCUA Guaranteed Notes TrustSeries 2010-R1, Class 1A (1 month
LIBOR + 0.450%),1.681%, 10/07/2020 (B) 1,119,741 1,121,518
Series 2010-R2, Class 2A (1 monthLIBOR + 0.470%),1.701%, 11/05/2020 (B) 9,161,229 9,179,415
Residential Accredit Loans TrustSeries 2007-QO2, Class A1 (1 month
LIBOR + 0.150%),1.384%, 02/25/2047 (B) 254,244 167,649
Series 2007-QS1, Class 1A1,6.000%, 01/25/2037 792,330 736,560
Series 2006-QO3, Class A1 (1 monthLIBOR + 0.210%),1.444%, 04/25/2046 (B) 753,670 425,390
Residential Asset Securitization Trust,Series 2006-R1, Class A2 (1 monthLIBOR + 0.400%),1.634%, 01/25/2046 (B) 267,364 131,223
Residential Funding Mortgage SecuritiesTrust, Series 2005-SA4, Class 1A21,3.746%, 09/25/2035 (B) 82,164 68,092
Ripon Mortgages PLC, Series 1A,Class A1 (3 month GBP LIBOR +0.800%),1.082%, 08/20/2056 (B)(D) GBP 1,936,318 2,512,876
RMAC Securities PLC,Series 2006-NS1X, Class A2A (3month GBP LIBOR + 0.150%),0.439%, 06/12/2044 (B) 629,052 780,676
Sequoia Mortgage Trust, Series 5,Class A (1 month LIBOR + 0.700%),1.931%, 10/19/2026 (B) $ 40,433 39,724
Structured Adjustable Rate MortgageLoan TrustSeries 2004-1, Class 4A1,
3.470%, 02/25/2034 (B) 53,875 53,766Series 2004-1, Class 4A2,
3.470%, 02/25/2034 (B) 296,311 298,628Series 2004-12, Class 7A1,
3.605%, 09/25/2034 (B) 84,245 85,354
Global Bond Fund (continued)Shares orPrincipalAmount Value
COLLATERALIZED MORTGAGEOBLIGATIONS (continued)Commercial andresidential (continued)Structured Adjustable Rate Mortgage
Loan Trust (continued)Series 2004-19, Class 2A1 (12 month
Treasury Average Index + 1.400%),2.132%, 01/25/2035 (B) $ 379,391 $ 354,525
Series 2004-4, Class 3A2,3.449%, 04/25/2034 (B) 100,711 101,933
Structured Asset MortgageInvestments, Inc.,Series 2006-AR3, Class 12A1 (1month LIBOR + 0.220%),1.454%, 05/25/2036 (B) 919,849 834,757
SWAN Trust, Series 2010-1, Class A (1month BBSW + 1.300%),2.895%, 04/25/2041 (B) AUD 414,967 332,898
Thornburg Mortgage Securities TrustSeries 2007-3, Class 2A1 (12 month
LIBOR + 1.250%),2.986%, 06/25/2047 (B) $ 126,299 115,616
Series 2007-3, Class 3A1 (1 monthLIBOR + 1.250%),2.986%, 06/25/2047 (B) 258,433 233,415
Series 2007-3, Class 4A1 (1 monthLIBOR + 1.250%),2.986%, 06/25/2047 (B) 181,934 162,480
Uropa Securities PLCSeries 2008-1, Class A (3 month GBP
LIBOR + 0.200%),0.489%, 06/10/2059 (B) GBP 304,336 377,638
Series 2008-1, Class B (3 month GBPLIBOR + 0.750%),1.039%, 06/10/2059 (B) 58,172 69,878
Series 2008-1, Class M1 (3 monthGBP LIBOR + 0.350%),0.639%, 06/10/2059 (B) 70,176 85,505
Series 2008-1, Class M2 (3 monthGBP LIBOR + 0.550%),0.839%, 06/10/2059 (B) 55,402 66,635
WaMu MortgagePass-Through CertificatesSeries 2002-AR17, Class 1A (12
month Treasury Average Index +1.200%),2.030%, 11/25/2042 (B) $ 138,021 130,584
Series 2003-AR5, Class A7,3.062%, 06/25/2033 (B) 28,193 28,655
Series 2005-AR13, Class A1A1 (1month LIBOR + 0.290%),1.524%, 10/25/2045 (B) 71,118 71,129
Series 2005-AR2, Class 2A1A (1month LIBOR + 0.310%),1.544%, 01/25/2045 (B) 109,919 107,040
Series 2006-AR13, Class 2A (COFI +1.500%),2.148%, 10/25/2046 (B) 1,289,475 1,254,974
Series 2006-AR17, Class 1A1A (12month Treasury Average Index +0.810%),1.586%, 12/25/2046 (B) 210,940 212,082
Series 2006-AR5, Class 3A (12 monthTreasury Average Index + 0.940%),1.770%, 07/25/2046 (B) 169,205 124,552
John Hancock Funds IIPortfolio of Investments — August 31, 2017 (showing percentage of total net assets)
68
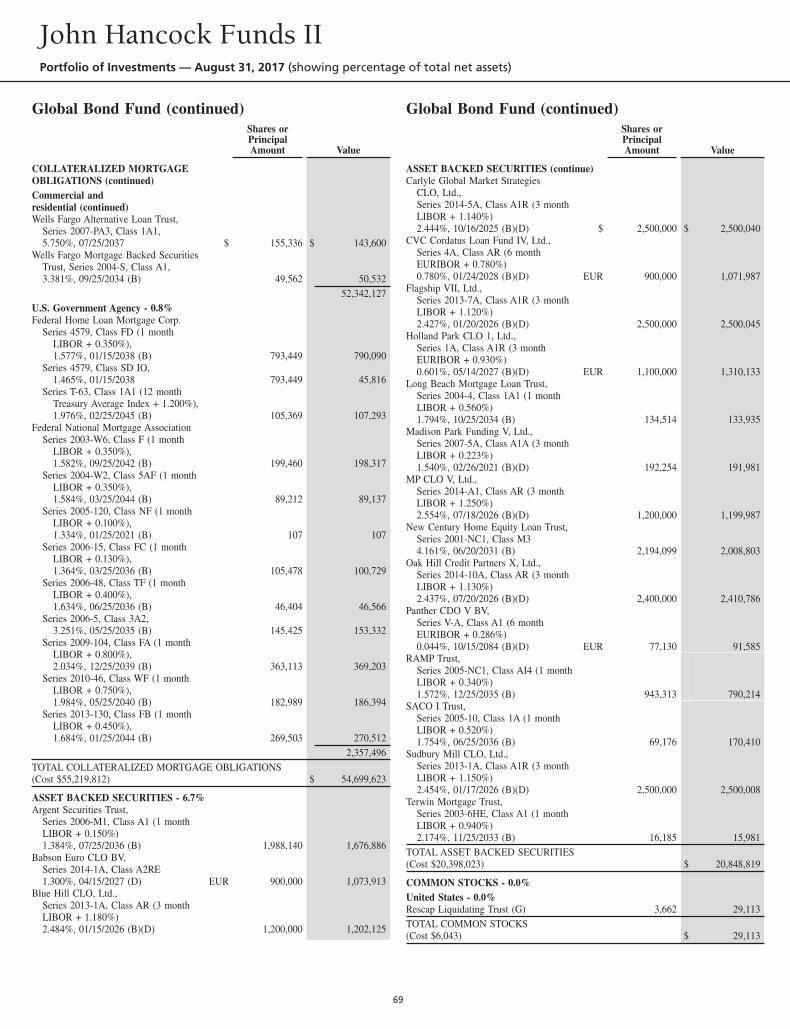
Global Bond Fund (continued)Shares orPrincipalAmount Value
COLLATERALIZED MORTGAGEOBLIGATIONS (continued)Commercial andresidential (continued)Wells Fargo Alternative Loan Trust,
Series 2007-PA3, Class 1A1,5.750%, 07/25/2037 $ 155,336 $ 143,600
Wells Fargo Mortgage Backed SecuritiesTrust, Series 2004-S, Class A1,3.381%, 09/25/2034 (B) 49,562 50,532
52,342,127U.S. Government Agency - 0.8%Federal Home Loan Mortgage Corp.
Series 4579, Class FD (1 monthLIBOR + 0.350%),1.577%, 01/15/2038 (B) 793,449 790,090
Series 4579, Class SD IO,1.465%, 01/15/2038 793,449 45,816
Series T-63, Class 1A1 (12 monthTreasury Average Index + 1.200%),1.976%, 02/25/2045 (B) 105,369 107,293
Federal National Mortgage AssociationSeries 2003-W6, Class F (1 month
LIBOR + 0.350%),1.582%, 09/25/2042 (B) 199,460 198,317
Series 2004-W2, Class 5AF (1 monthLIBOR + 0.350%),1.584%, 03/25/2044 (B) 89,212 89,137
Series 2005-120, Class NF (1 monthLIBOR + 0.100%),1.334%, 01/25/2021 (B) 107 107
Series 2006-15, Class FC (1 monthLIBOR + 0.130%),1.364%, 03/25/2036 (B) 105,478 100,729
Series 2006-48, Class TF (1 monthLIBOR + 0.400%),1.634%, 06/25/2036 (B) 46,404 46,566
Series 2006-5, Class 3A2,3.251%, 05/25/2035 (B) 145,425 153,332
Series 2009-104, Class FA (1 monthLIBOR + 0.800%),2.034%, 12/25/2039 (B) 363,113 369,203
Series 2010-46, Class WF (1 monthLIBOR + 0.750%),1.984%, 05/25/2040 (B) 182,989 186,394
Series 2013-130, Class FB (1 monthLIBOR + 0.450%),1.684%, 01/25/2044 (B) 269,503 270,512
2,357,496TOTAL COLLATERALIZED MORTGAGE OBLIGATIONS(Cost $55,219,812) $ 54,699,623
ASSET BACKED SECURITIES - 6.7%Argent Securities Trust,
Series 2006-M1, Class A1 (1 monthLIBOR + 0.150%)1.384%, 07/25/2036 (B) 1,988,140 1,676,886
Babson Euro CLO BV,Series 2014-1A, Class A2RE1.300%, 04/15/2027 (D) EUR 900,000 1,073,913
Blue Hill CLO, Ltd.,Series 2013-1A, Class AR (3 monthLIBOR + 1.180%)2.484%, 01/15/2026 (B)(D) 1,200,000 1,202,125
Global Bond Fund (continued)Shares orPrincipalAmount Value
ASSET BACKED SECURITIES (continue)Carlyle Global Market Strategies
CLO, Ltd.,Series 2014-5A, Class A1R (3 monthLIBOR + 1.140%)2.444%, 10/16/2025 (B)(D) $ 2,500,000 $ 2,500,040
CVC Cordatus Loan Fund IV, Ltd.,Series 4A, Class AR (6 monthEURIBOR + 0.780%)0.780%, 01/24/2028 (B)(D) EUR 900,000 1,071,987
Flagship VII, Ltd.,Series 2013-7A, Class A1R (3 monthLIBOR + 1.120%)2.427%, 01/20/2026 (B)(D) 2,500,000 2,500,045
Holland Park CLO 1, Ltd.,Series 1A, Class A1R (3 monthEURIBOR + 0.930%)0.601%, 05/14/2027 (B)(D) EUR 1,100,000 1,310,133
Long Beach Mortgage Loan Trust,Series 2004-4, Class 1A1 (1 monthLIBOR + 0.560%)1.794%, 10/25/2034 (B) 134,514 133,935
Madison Park Funding V, Ltd.,Series 2007-5A, Class A1A (3 monthLIBOR + 0.223%)1.540%, 02/26/2021 (B)(D) 192,254 191,981
MP CLO V, Ltd.,Series 2014-A1, Class AR (3 monthLIBOR + 1.250%)2.554%, 07/18/2026 (B)(D) 1,200,000 1,199,987
New Century Home Equity Loan Trust,Series 2001-NC1, Class M34.161%, 06/20/2031 (B) 2,194,099 2,008,803
Oak Hill Credit Partners X, Ltd.,Series 2014-10A, Class AR (3 monthLIBOR + 1.130%)2.437%, 07/20/2026 (B)(D) 2,400,000 2,410,786
Panther CDO V BV,Series V-A, Class A1 (6 monthEURIBOR + 0.286%)0.044%, 10/15/2084 (B)(D) EUR 77,130 91,585
RAMP Trust,Series 2005-NC1, Class AI4 (1 monthLIBOR + 0.340%)1.572%, 12/25/2035 (B) 943,313 790,214
SACO I Trust,Series 2005-10, Class 1A (1 monthLIBOR + 0.520%)1.754%, 06/25/2036 (B) 69,176 170,410
Sudbury Mill CLO, Ltd.,Series 2013-1A, Class A1R (3 monthLIBOR + 1.150%)2.454%, 01/17/2026 (B)(D) 2,500,000 2,500,008
Terwin Mortgage Trust,Series 2003-6HE, Class A1 (1 monthLIBOR + 0.940%)2.174%, 11/25/2033 (B) 16,185 15,981
TOTAL ASSET BACKED SECURITIES(Cost $20,398,023) $ 20,848,819
COMMON STOCKS - 0.0%United States - 0.0%Rescap Liquidating Trust (G) 3,662 29,113TOTAL COMMON STOCKS(Cost $6,043) $ 29,113
John Hancock Funds IIPortfolio of Investments — August 31, 2017 (showing percentage of total net assets)
69
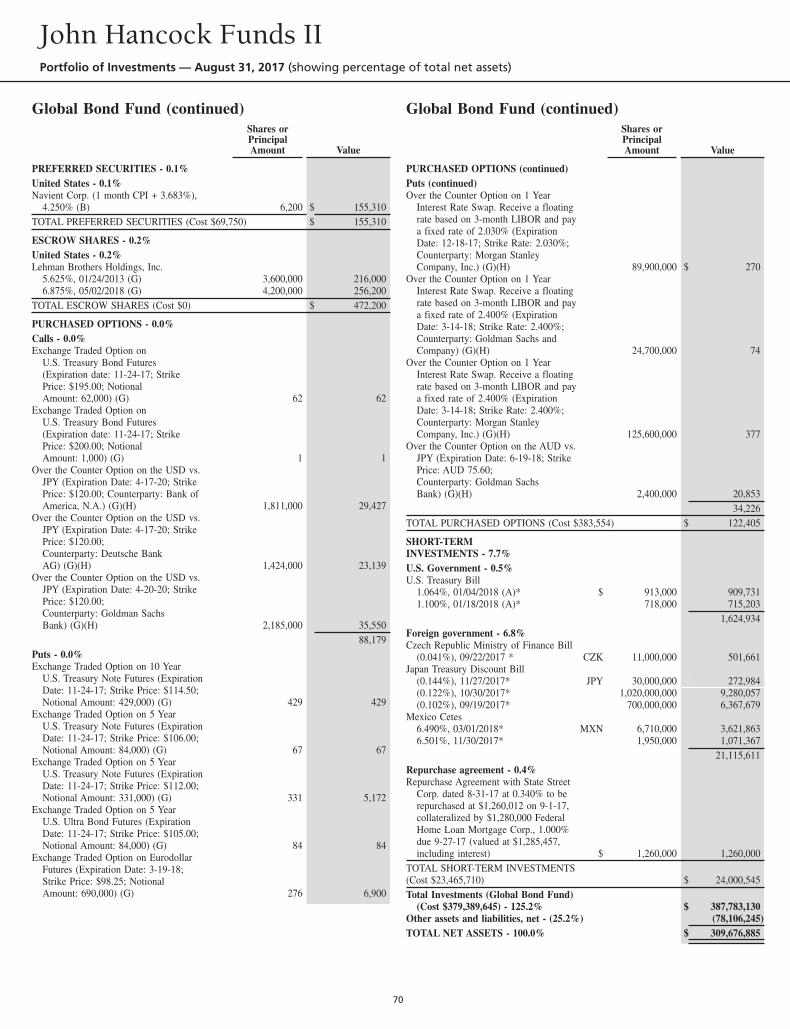
Global Bond Fund (continued)Shares orPrincipalAmount Value
PREFERRED SECURITIES - 0.1%United States - 0.1%Navient Corp. (1 month CPI + 3.683%),
4.250% (B) 6,200 $ 155,310TOTAL PREFERRED SECURITIES (Cost $69,750) $ 155,310
ESCROW SHARES - 0.2%United States - 0.2%Lehman Brothers Holdings, Inc.
5.625%, 01/24/2013 (G) 3,600,000 216,0006.875%, 05/02/2018 (G) 4,200,000 256,200
TOTAL ESCROW SHARES (Cost $0) $ 472,200
PURCHASED OPTIONS - 0.0%Calls - 0.0%Exchange Traded Option on
U.S. Treasury Bond Futures(Expiration date: 11-24-17; StrikePrice: $195.00; NotionalAmount: 62,000) (G) 62 62
Exchange Traded Option onU.S. Treasury Bond Futures(Expiration date: 11-24-17; StrikePrice: $200.00; NotionalAmount: 1,000) (G) 1 1
Over the Counter Option on the USD vs.JPY (Expiration Date: 4-17-20; StrikePrice: $120.00; Counterparty: Bank ofAmerica, N.A.) (G)(H) 1,811,000 29,427
Over the Counter Option on the USD vs.JPY (Expiration Date: 4-17-20; StrikePrice: $120.00;Counterparty: Deutsche BankAG) (G)(H) 1,424,000 23,139
Over the Counter Option on the USD vs.JPY (Expiration Date: 4-20-20; StrikePrice: $120.00;Counterparty: Goldman SachsBank) (G)(H) 2,185,000 35,550
88,179Puts - 0.0%Exchange Traded Option on 10 Year
U.S. Treasury Note Futures (ExpirationDate: 11-24-17; Strike Price: $114.50;Notional Amount: 429,000) (G) 429 429
Exchange Traded Option on 5 YearU.S. Treasury Note Futures (ExpirationDate: 11-24-17; Strike Price: $106.00;Notional Amount: 84,000) (G) 67 67
Exchange Traded Option on 5 YearU.S. Treasury Note Futures (ExpirationDate: 11-24-17; Strike Price: $112.00;Notional Amount: 331,000) (G) 331 5,172
Exchange Traded Option on 5 YearU.S. Ultra Bond Futures (ExpirationDate: 11-24-17; Strike Price: $105.00;Notional Amount: 84,000) (G) 84 84
Exchange Traded Option on EurodollarFutures (Expiration Date: 3-19-18;Strike Price: $98.25; NotionalAmount: 690,000) (G) 276 6,900
Global Bond Fund (continued)Shares orPrincipalAmount Value
PURCHASED OPTIONS (continued)Puts (continued)Over the Counter Option on 1 Year
Interest Rate Swap. Receive a floatingrate based on 3-month LIBOR and paya fixed rate of 2.030% (ExpirationDate: 12-18-17; Strike Rate: 2.030%;Counterparty: Morgan StanleyCompany, Inc.) (G)(H) 89,900,000 $ 270
Over the Counter Option on 1 YearInterest Rate Swap. Receive a floatingrate based on 3-month LIBOR and paya fixed rate of 2.400% (ExpirationDate: 3-14-18; Strike Rate: 2.400%;Counterparty: Goldman Sachs andCompany) (G)(H) 24,700,000 74
Over the Counter Option on 1 YearInterest Rate Swap. Receive a floatingrate based on 3-month LIBOR and paya fixed rate of 2.400% (ExpirationDate: 3-14-18; Strike Rate: 2.400%;Counterparty: Morgan StanleyCompany, Inc.) (G)(H) 125,600,000 377
Over the Counter Option on the AUD vs.JPY (Expiration Date: 6-19-18; StrikePrice: AUD 75.60;Counterparty: Goldman SachsBank) (G)(H) 2,400,000 20,853
34,226TOTAL PURCHASED OPTIONS (Cost $383,554) $ 122,405
SHORT-TERMINVESTMENTS - 7.7%U.S. Government - 0.5%U.S. Treasury Bill
1.064%, 01/04/2018 (A)* $ 913,000 909,7311.100%, 01/18/2018 (A)* 718,000 715,203
1,624,934Foreign government - 6.8%Czech Republic Ministry of Finance Bill
(0.041%), 09/22/2017 * CZK 11,000,000 501,661Japan Treasury Discount Bill
(0.144%), 11/27/2017* JPY 30,000,000 272,984(0.122%), 10/30/2017* 1,020,000,000 9,280,057(0.102%), 09/19/2017* 700,000,000 6,367,679
Mexico Cetes6.490%, 03/01/2018* MXN 6,710,000 3,621,8636.501%, 11/30/2017* 1,950,000 1,071,367
21,115,611Repurchase agreement - 0.4%Repurchase Agreement with State Street
Corp. dated 8-31-17 at 0.340% to berepurchased at $1,260,012 on 9-1-17,collateralized by $1,280,000 FederalHome Loan Mortgage Corp., 1.000%due 9-27-17 (valued at $1,285,457,including interest) $ 1,260,000 1,260,000
TOTAL SHORT-TERM INVESTMENTS(Cost $23,465,710) $ 24,000,545Total Investments (Global Bond Fund)
(Cost $379,389,645) - 125.2% $ 387,783,130Other assets and liabilities, net - (25.2%) (78,106,245)TOTAL NET ASSETS - 100.0% $ 309,676,885
John Hancock Funds IIPortfolio of Investments — August 31, 2017 (showing percentage of total net assets)
70
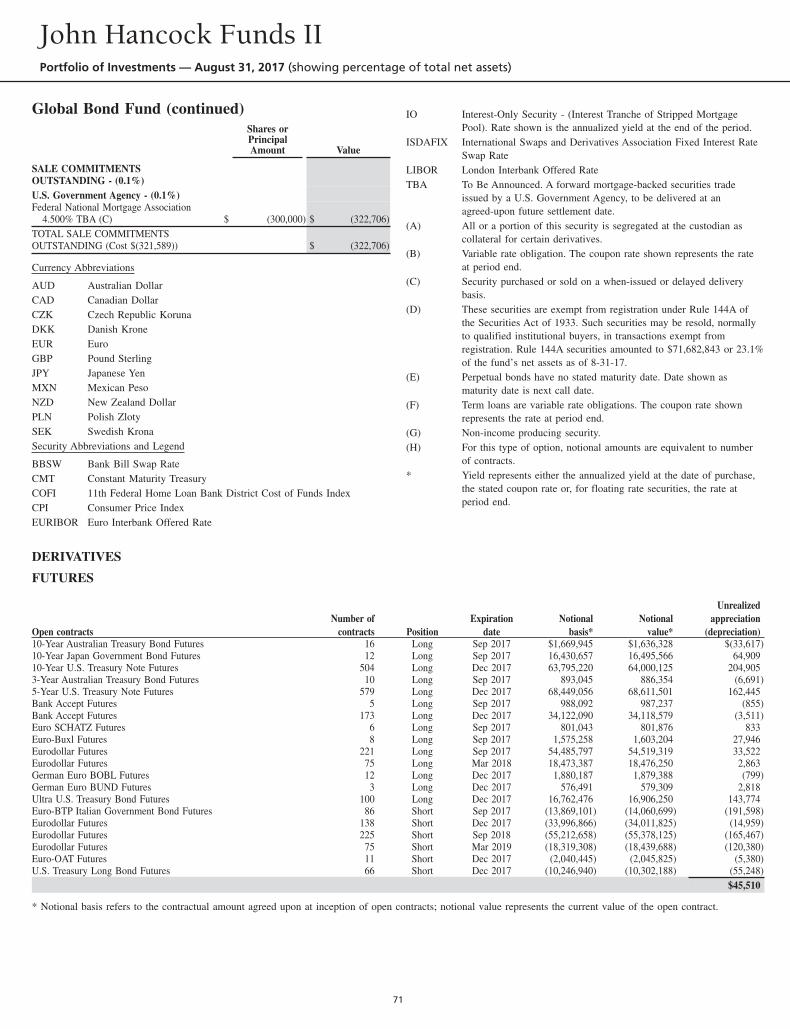
Global Bond Fund (continued)Shares orPrincipalAmount Value
SALE COMMITMENTSOUTSTANDING - (0.1%)U.S. Government Agency - (0.1%)Federal National Mortgage Association
4.500% TBA (C) $ (300,000) $ (322,706)TOTAL SALE COMMITMENTSOUTSTANDING (Cost $(321,589)) $ (322,706)
Currency Abbreviations
AUD Australian DollarCAD Canadian DollarCZK Czech Republic KorunaDKK Danish KroneEUR EuroGBP Pound SterlingJPY Japanese YenMXN Mexican PesoNZD New Zealand DollarPLN Polish ZlotySEK Swedish KronaSecurity Abbreviations and Legend
BBSW Bank Bill Swap RateCMT Constant Maturity TreasuryCOFI 11th Federal Home Loan Bank District Cost of Funds IndexCPI Consumer Price IndexEURIBOR Euro Interbank Offered Rate
IO Interest-Only Security - (Interest Tranche of Stripped MortgagePool). Rate shown is the annualized yield at the end of the period.
ISDAFIX International Swaps and Derivatives Association Fixed Interest RateSwap Rate
LIBOR London Interbank Offered RateTBA To Be Announced. A forward mortgage-backed securities trade
issued by a U.S. Government Agency, to be delivered at anagreed-upon future settlement date.
(A) All or a portion of this security is segregated at the custodian ascollateral for certain derivatives.
(B) Variable rate obligation. The coupon rate shown represents the rateat period end.
(C) Security purchased or sold on a when-issued or delayed deliverybasis.
(D) These securities are exempt from registration under Rule 144A ofthe Securities Act of 1933. Such securities may be resold, normallyto qualified institutional buyers, in transactions exempt fromregistration. Rule 144A securities amounted to $71,682,843 or 23.1%of the fund’s net assets as of 8-31-17.
(E) Perpetual bonds have no stated maturity date. Date shown asmaturity date is next call date.
(F) Term loans are variable rate obligations. The coupon rate shownrepresents the rate at period end.
(G) Non-income producing security.(H) For this type of option, notional amounts are equivalent to number
of contracts.* Yield represents either the annualized yield at the date of purchase,
the stated coupon rate or, for floating rate securities, the rate atperiod end.
DERIVATIVES
FUTURES
Open contractsNumber of
contracts PositionExpiration
dateNotional
basis*Notional
value*
Unrealizedappreciation
(depreciation)10-Year Australian Treasury Bond Futures 16 Long Sep 2017 $1,669,945 $1,636,328 $(33,617)10-Year Japan Government Bond Futures 12 Long Sep 2017 16,430,657 16,495,566 64,90910-Year U.S. Treasury Note Futures 504 Long Dec 2017 63,795,220 64,000,125 204,9053-Year Australian Treasury Bond Futures 10 Long Sep 2017 893,045 886,354 (6,691)5-Year U.S. Treasury Note Futures 579 Long Dec 2017 68,449,056 68,611,501 162,445Bank Accept Futures 5 Long Sep 2017 988,092 987,237 (855)Bank Accept Futures 173 Long Dec 2017 34,122,090 34,118,579 (3,511)Euro SCHATZ Futures 6 Long Sep 2017 801,043 801,876 833Euro-Buxl Futures 8 Long Sep 2017 1,575,258 1,603,204 27,946Eurodollar Futures 221 Long Sep 2017 54,485,797 54,519,319 33,522Eurodollar Futures 75 Long Mar 2018 18,473,387 18,476,250 2,863German Euro BOBL Futures 12 Long Dec 2017 1,880,187 1,879,388 (799)German Euro BUND Futures 3 Long Dec 2017 576,491 579,309 2,818Ultra U.S. Treasury Bond Futures 100 Long Dec 2017 16,762,476 16,906,250 143,774Euro-BTP Italian Government Bond Futures 86 Short Sep 2017 (13,869,101) (14,060,699) (191,598)Eurodollar Futures 138 Short Dec 2017 (33,996,866) (34,011,825) (14,959)Eurodollar Futures 225 Short Sep 2018 (55,212,658) (55,378,125) (165,467)Eurodollar Futures 75 Short Mar 2019 (18,319,308) (18,439,688) (120,380)Euro-OAT Futures 11 Short Dec 2017 (2,040,445) (2,045,825) (5,380)U.S. Treasury Long Bond Futures 66 Short Dec 2017 (10,246,940) (10,302,188) (55,248)
$45,510
* Notional basis refers to the contractual amount agreed upon at inception of open contracts; notional value represents the current value of the open contract.
John Hancock Funds IIPortfolio of Investments — August 31, 2017 (showing percentage of total net assets)
71
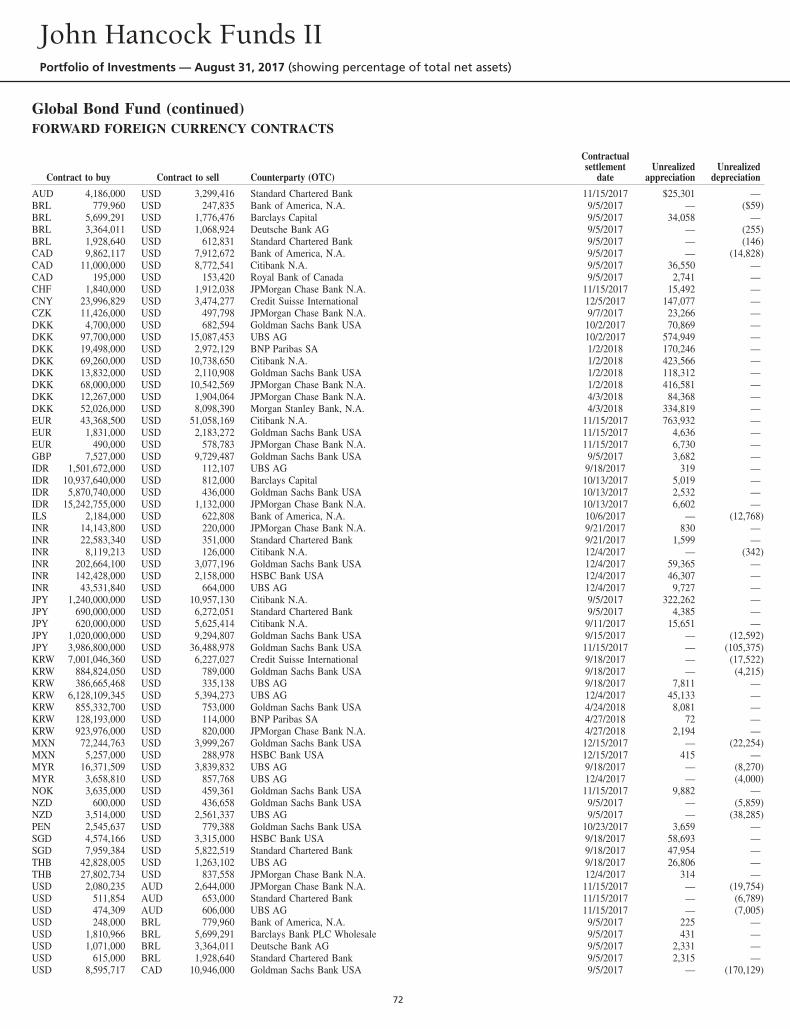
Global Bond Fund (continued)FORWARD FOREIGN CURRENCY CONTRACTS
Contract to buy Contract to sell Counterparty (OTC)
Contractualsettlement
dateUnrealized
appreciationUnrealized
depreciation
AUD 4,186,000 USD 3,299,416 Standard Chartered Bank 11/15/2017 $25,301 —BRL 779,960 USD 247,835 Bank of America, N.A. 9/5/2017 — ($59)BRL 5,699,291 USD 1,776,476 Barclays Capital 9/5/2017 34,058 —BRL 3,364,011 USD 1,068,924 Deutsche Bank AG 9/5/2017 — (255)BRL 1,928,640 USD 612,831 Standard Chartered Bank 9/5/2017 — (146)CAD 9,862,117 USD 7,912,672 Bank of America, N.A. 9/5/2017 — (14,828)CAD 11,000,000 USD 8,772,541 Citibank N.A. 9/5/2017 36,550 —CAD 195,000 USD 153,420 Royal Bank of Canada 9/5/2017 2,741 —CHF 1,840,000 USD 1,912,038 JPMorgan Chase Bank N.A. 11/15/2017 15,492 —CNY 23,996,829 USD 3,474,277 Credit Suisse International 12/5/2017 147,077 —CZK 11,426,000 USD 497,798 JPMorgan Chase Bank N.A. 9/7/2017 23,266 —DKK 4,700,000 USD 682,594 Goldman Sachs Bank USA 10/2/2017 70,869 —DKK 97,700,000 USD 15,087,453 UBS AG 10/2/2017 574,949 —DKK 19,498,000 USD 2,972,129 BNP Paribas SA 1/2/2018 170,246 —DKK 69,260,000 USD 10,738,650 Citibank N.A. 1/2/2018 423,566 —DKK 13,832,000 USD 2,110,908 Goldman Sachs Bank USA 1/2/2018 118,312 —DKK 68,000,000 USD 10,542,569 JPMorgan Chase Bank N.A. 1/2/2018 416,581 —DKK 12,267,000 USD 1,904,064 JPMorgan Chase Bank N.A. 4/3/2018 84,368 —DKK 52,026,000 USD 8,098,390 Morgan Stanley Bank, N.A. 4/3/2018 334,819 —EUR 43,368,500 USD 51,058,169 Citibank N.A. 11/15/2017 763,932 —EUR 1,831,000 USD 2,183,272 Goldman Sachs Bank USA 11/15/2017 4,636 —EUR 490,000 USD 578,783 JPMorgan Chase Bank N.A. 11/15/2017 6,730 —GBP 7,527,000 USD 9,729,487 Goldman Sachs Bank USA 9/5/2017 3,682 —IDR 1,501,672,000 USD 112,107 UBS AG 9/18/2017 319 —IDR 10,937,640,000 USD 812,000 Barclays Capital 10/13/2017 5,019 —IDR 5,870,740,000 USD 436,000 Goldman Sachs Bank USA 10/13/2017 2,532 —IDR 15,242,755,000 USD 1,132,000 JPMorgan Chase Bank N.A. 10/13/2017 6,602 —ILS 2,184,000 USD 622,808 Bank of America, N.A. 10/6/2017 — (12,768)INR 14,143,800 USD 220,000 JPMorgan Chase Bank N.A. 9/21/2017 830 —INR 22,583,340 USD 351,000 Standard Chartered Bank 9/21/2017 1,599 —INR 8,119,213 USD 126,000 Citibank N.A. 12/4/2017 — (342)INR 202,664,100 USD 3,077,196 Goldman Sachs Bank USA 12/4/2017 59,365 —INR 142,428,000 USD 2,158,000 HSBC Bank USA 12/4/2017 46,307 —INR 43,531,840 USD 664,000 UBS AG 12/4/2017 9,727 —JPY 1,240,000,000 USD 10,957,130 Citibank N.A. 9/5/2017 322,262 —JPY 690,000,000 USD 6,272,051 Standard Chartered Bank 9/5/2017 4,385 —JPY 620,000,000 USD 5,625,414 Citibank N.A. 9/11/2017 15,651 —JPY 1,020,000,000 USD 9,294,807 Goldman Sachs Bank USA 9/15/2017 — (12,592)JPY 3,986,800,000 USD 36,488,978 Goldman Sachs Bank USA 11/15/2017 — (105,375)KRW 7,001,046,360 USD 6,227,027 Credit Suisse International 9/18/2017 — (17,522)KRW 884,824,050 USD 789,000 Goldman Sachs Bank USA 9/18/2017 — (4,215)KRW 386,665,468 USD 335,138 UBS AG 9/18/2017 7,811 —KRW 6,128,109,345 USD 5,394,273 UBS AG 12/4/2017 45,133 —KRW 855,332,700 USD 753,000 Goldman Sachs Bank USA 4/24/2018 8,081 —KRW 128,193,000 USD 114,000 BNP Paribas SA 4/27/2018 72 —KRW 923,976,000 USD 820,000 JPMorgan Chase Bank N.A. 4/27/2018 2,194 —MXN 72,244,763 USD 3,999,267 Goldman Sachs Bank USA 12/15/2017 — (22,254)MXN 5,257,000 USD 288,978 HSBC Bank USA 12/15/2017 415 —MYR 16,371,509 USD 3,839,832 UBS AG 9/18/2017 — (8,270)MYR 3,658,810 USD 857,768 UBS AG 12/4/2017 — (4,000)NOK 3,635,000 USD 459,361 Goldman Sachs Bank USA 11/15/2017 9,882 —NZD 600,000 USD 436,658 Goldman Sachs Bank USA 9/5/2017 — (5,859)NZD 3,514,000 USD 2,561,337 UBS AG 9/5/2017 — (38,285)PEN 2,545,637 USD 779,388 Goldman Sachs Bank USA 10/23/2017 3,659 —SGD 4,574,166 USD 3,315,000 HSBC Bank USA 9/18/2017 58,693 —SGD 7,959,384 USD 5,822,519 Standard Chartered Bank 9/18/2017 47,954 —THB 42,828,005 USD 1,263,102 UBS AG 9/18/2017 26,806 —THB 27,802,734 USD 837,558 JPMorgan Chase Bank N.A. 12/4/2017 314 —USD 2,080,235 AUD 2,644,000 JPMorgan Chase Bank N.A. 11/15/2017 — (19,754)USD 511,854 AUD 653,000 Standard Chartered Bank 11/15/2017 — (6,789)USD 474,309 AUD 606,000 UBS AG 11/15/2017 — (7,005)USD 248,000 BRL 779,960 Bank of America, N.A. 9/5/2017 225 —USD 1,810,966 BRL 5,699,291 Barclays Bank PLC Wholesale 9/5/2017 431 —USD 1,071,000 BRL 3,364,011 Deutsche Bank AG 9/5/2017 2,331 —USD 615,000 BRL 1,928,640 Standard Chartered Bank 9/5/2017 2,315 —USD 8,595,717 CAD 10,946,000 Goldman Sachs Bank USA 9/5/2017 — (170,129)
John Hancock Funds IIPortfolio of Investments — August 31, 2017 (showing percentage of total net assets)
72
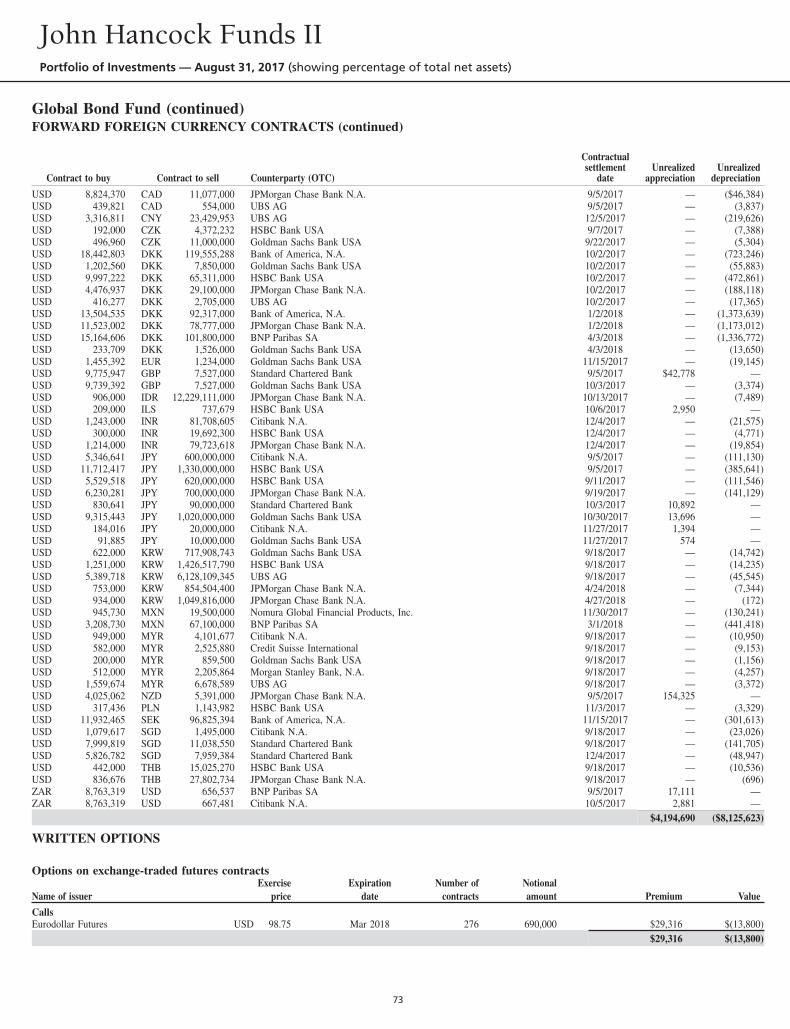
Global Bond Fund (continued)FORWARD FOREIGN CURRENCY CONTRACTS (continued)
Contract to buy Contract to sell Counterparty (OTC)
Contractualsettlement
dateUnrealized
appreciationUnrealized
depreciation
USD 8,824,370 CAD 11,077,000 JPMorgan Chase Bank N.A. 9/5/2017 — ($46,384)USD 439,821 CAD 554,000 UBS AG 9/5/2017 — (3,837)USD 3,316,811 CNY 23,429,953 UBS AG 12/5/2017 — (219,626)USD 192,000 CZK 4,372,232 HSBC Bank USA 9/7/2017 — (7,388)USD 496,960 CZK 11,000,000 Goldman Sachs Bank USA 9/22/2017 — (5,304)USD 18,442,803 DKK 119,555,288 Bank of America, N.A. 10/2/2017 — (723,246)USD 1,202,560 DKK 7,850,000 Goldman Sachs Bank USA 10/2/2017 — (55,883)USD 9,997,222 DKK 65,311,000 HSBC Bank USA 10/2/2017 — (472,861)USD 4,476,937 DKK 29,100,000 JPMorgan Chase Bank N.A. 10/2/2017 — (188,118)USD 416,277 DKK 2,705,000 UBS AG 10/2/2017 — (17,365)USD 13,504,535 DKK 92,317,000 Bank of America, N.A. 1/2/2018 — (1,373,639)USD 11,523,002 DKK 78,777,000 JPMorgan Chase Bank N.A. 1/2/2018 — (1,173,012)USD 15,164,606 DKK 101,800,000 BNP Paribas SA 4/3/2018 — (1,336,772)USD 233,709 DKK 1,526,000 Goldman Sachs Bank USA 4/3/2018 — (13,650)USD 1,455,392 EUR 1,234,000 Goldman Sachs Bank USA 11/15/2017 — (19,145)USD 9,775,947 GBP 7,527,000 Standard Chartered Bank 9/5/2017 $42,778 —USD 9,739,392 GBP 7,527,000 Goldman Sachs Bank USA 10/3/2017 — (3,374)USD 906,000 IDR 12,229,111,000 JPMorgan Chase Bank N.A. 10/13/2017 — (7,489)USD 209,000 ILS 737,679 HSBC Bank USA 10/6/2017 2,950 —USD 1,243,000 INR 81,708,605 Citibank N.A. 12/4/2017 — (21,575)USD 300,000 INR 19,692,300 HSBC Bank USA 12/4/2017 — (4,771)USD 1,214,000 INR 79,723,618 JPMorgan Chase Bank N.A. 12/4/2017 — (19,854)USD 5,346,641 JPY 600,000,000 Citibank N.A. 9/5/2017 — (111,130)USD 11,712,417 JPY 1,330,000,000 HSBC Bank USA 9/5/2017 — (385,641)USD 5,529,518 JPY 620,000,000 HSBC Bank USA 9/11/2017 — (111,546)USD 6,230,281 JPY 700,000,000 JPMorgan Chase Bank N.A. 9/19/2017 — (141,129)USD 830,641 JPY 90,000,000 Standard Chartered Bank 10/3/2017 10,892 —USD 9,315,443 JPY 1,020,000,000 Goldman Sachs Bank USA 10/30/2017 13,696 —USD 184,016 JPY 20,000,000 Citibank N.A. 11/27/2017 1,394 —USD 91,885 JPY 10,000,000 Goldman Sachs Bank USA 11/27/2017 574 —USD 622,000 KRW 717,908,743 Goldman Sachs Bank USA 9/18/2017 — (14,742)USD 1,251,000 KRW 1,426,517,790 HSBC Bank USA 9/18/2017 — (14,235)USD 5,389,718 KRW 6,128,109,345 UBS AG 9/18/2017 — (45,545)USD 753,000 KRW 854,504,400 JPMorgan Chase Bank N.A. 4/24/2018 — (7,344)USD 934,000 KRW 1,049,816,000 JPMorgan Chase Bank N.A. 4/27/2018 — (172)USD 945,730 MXN 19,500,000 Nomura Global Financial Products, Inc. 11/30/2017 — (130,241)USD 3,208,730 MXN 67,100,000 BNP Paribas SA 3/1/2018 — (441,418)USD 949,000 MYR 4,101,677 Citibank N.A. 9/18/2017 — (10,950)USD 582,000 MYR 2,525,880 Credit Suisse International 9/18/2017 — (9,153)USD 200,000 MYR 859,500 Goldman Sachs Bank USA 9/18/2017 — (1,156)USD 512,000 MYR 2,205,864 Morgan Stanley Bank, N.A. 9/18/2017 — (4,257)USD 1,559,674 MYR 6,678,589 UBS AG 9/18/2017 — (3,372)USD 4,025,062 NZD 5,391,000 JPMorgan Chase Bank N.A. 9/5/2017 154,325 —USD 317,436 PLN 1,143,982 HSBC Bank USA 11/3/2017 — (3,329)USD 11,932,465 SEK 96,825,394 Bank of America, N.A. 11/15/2017 — (301,613)USD 1,079,617 SGD 1,495,000 Citibank N.A. 9/18/2017 — (23,026)USD 7,999,819 SGD 11,038,550 Standard Chartered Bank 9/18/2017 — (141,705)USD 5,826,782 SGD 7,959,384 Standard Chartered Bank 12/4/2017 — (48,947)USD 442,000 THB 15,025,270 HSBC Bank USA 9/18/2017 — (10,536)USD 836,676 THB 27,802,734 JPMorgan Chase Bank N.A. 9/18/2017 — (696)ZAR 8,763,319 USD 656,537 BNP Paribas SA 9/5/2017 17,111 —ZAR 8,763,319 USD 667,481 Citibank N.A. 10/5/2017 2,881 —
$4,194,690 ($8,125,623)
WRITTEN OPTIONS
Options on exchange-traded futures contracts
Name of issuerExercise
priceExpiration
dateNumber of
contractsNotionalamount Premium Value
CallsEurodollar Futures USD 98.75 Mar 2018 276 690,000 $29,316 $(13,800)
$29,316 $(13,800)
John Hancock Funds IIPortfolio of Investments — August 31, 2017 (showing percentage of total net assets)
73
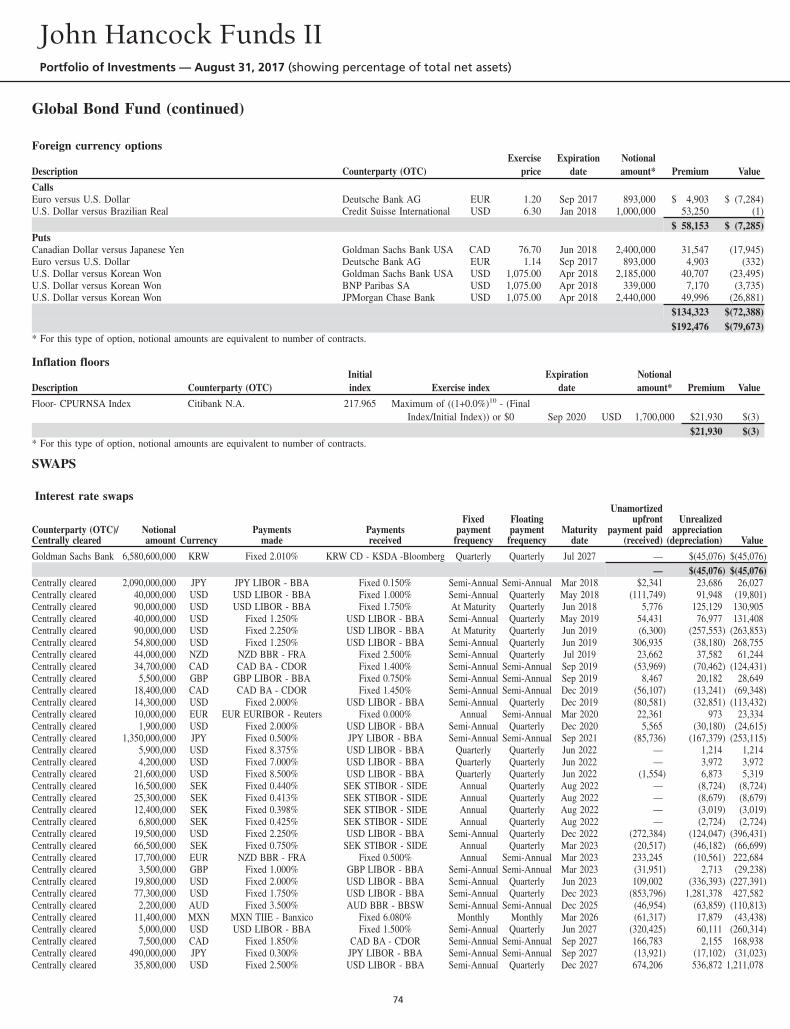
Global Bond Fund (continued)
Foreign currency options
Description Counterparty (OTC)Exercise
priceExpiration
dateNotionalamount* Premium Value
CallsEuro versus U.S. Dollar Deutsche Bank AG EUR 1.20 Sep 2017 893,000 $ 4,903 $ (7,284)U.S. Dollar versus Brazilian Real Credit Suisse International USD 6.30 Jan 2018 1,000,000 53,250 (1)
$ 58,153 $ (7,285)PutsCanadian Dollar versus Japanese Yen Goldman Sachs Bank USA CAD 76.70 Jun 2018 2,400,000 31,547 (17,945)Euro versus U.S. Dollar Deutsche Bank AG EUR 1.14 Sep 2017 893,000 4,903 (332)U.S. Dollar versus Korean Won Goldman Sachs Bank USA USD 1,075.00 Apr 2018 2,185,000 40,707 (23,495)U.S. Dollar versus Korean Won BNP Paribas SA USD 1,075.00 Apr 2018 339,000 7,170 (3,735)U.S. Dollar versus Korean Won JPMorgan Chase Bank USD 1,075.00 Apr 2018 2,440,000 49,996 (26,881)
$134,323 $(72,388)$192,476 $(79,673)
* For this type of option, notional amounts are equivalent to number of contracts.
Inflation floors
Description Counterparty (OTC)Initialindex Exercise index
Expirationdate
Notionalamount* Premium Value
Floor- CPURNSA Index Citibank N.A. 217.965 Maximum of ((1+0.0%)10 - (FinalIndex/Initial Index)) or $0 Sep 2020 USD 1,700,000 $21,930 $(3)
$21,930 $(3)* For this type of option, notional amounts are equivalent to number of contracts.
SWAPS
Interest rate swaps
Counterparty (OTC)/Centrally cleared
Notionalamount Currency
Paymentsmade
Paymentsreceived
Fixedpayment
frequency
Floatingpayment
frequencyMaturity
date
Unamortizedupfront
payment paid(received)
Unrealizedappreciation
(depreciation) Value
Goldman Sachs Bank 6,580,600,000 KRW Fixed 2.010% KRW CD - KSDA -Bloomberg Quarterly Quarterly Jul 2027 — $(45,076) $(45,076)— $(45,076) $(45,076)
Centrally cleared 2,090,000,000 JPY JPY LIBOR - BBA Fixed 0.150% Semi-Annual Semi-Annual Mar 2018 $2,341 23,686 26,027Centrally cleared 40,000,000 USD USD LIBOR - BBA Fixed 1.000% Semi-Annual Quarterly May 2018 (111,749) 91,948 (19,801)Centrally cleared 90,000,000 USD USD LIBOR - BBA Fixed 1.750% At Maturity Quarterly Jun 2018 5,776 125,129 130,905Centrally cleared 40,000,000 USD Fixed 1.250% USD LIBOR - BBA Semi-Annual Quarterly May 2019 54,431 76,977 131,408Centrally cleared 90,000,000 USD Fixed 2.250% USD LIBOR - BBA At Maturity Quarterly Jun 2019 (6,300) (257,553) (263,853)Centrally cleared 54,800,000 USD Fixed 1.250% USD LIBOR - BBA Semi-Annual Quarterly Jun 2019 306,935 (38,180) 268,755Centrally cleared 44,000,000 NZD NZD BBR - FRA Fixed 2.500% Semi-Annual Quarterly Jul 2019 23,662 37,582 61,244Centrally cleared 34,700,000 CAD CAD BA - CDOR Fixed 1.400% Semi-Annual Semi-Annual Sep 2019 (53,969) (70,462) (124,431)Centrally cleared 5,500,000 GBP GBP LIBOR - BBA Fixed 0.750% Semi-Annual Semi-Annual Sep 2019 8,467 20,182 28,649Centrally cleared 18,400,000 CAD CAD BA - CDOR Fixed 1.450% Semi-Annual Semi-Annual Dec 2019 (56,107) (13,241) (69,348)Centrally cleared 14,300,000 USD Fixed 2.000% USD LIBOR - BBA Semi-Annual Quarterly Dec 2019 (80,581) (32,851) (113,432)Centrally cleared 10,000,000 EUR EUR EURIBOR - Reuters Fixed 0.000% Annual Semi-Annual Mar 2020 22,361 973 23,334Centrally cleared 1,900,000 USD Fixed 2.000% USD LIBOR - BBA Semi-Annual Quarterly Dec 2020 5,565 (30,180) (24,615)Centrally cleared 1,350,000,000 JPY Fixed 0.500% JPY LIBOR - BBA Semi-Annual Semi-Annual Sep 2021 (85,736) (167,379) (253,115)Centrally cleared 5,900,000 USD Fixed 8.375% USD LIBOR - BBA Quarterly Quarterly Jun 2022 — 1,214 1,214Centrally cleared 4,200,000 USD Fixed 7.000% USD LIBOR - BBA Quarterly Quarterly Jun 2022 — 3,972 3,972Centrally cleared 21,600,000 USD Fixed 8.500% USD LIBOR - BBA Quarterly Quarterly Jun 2022 (1,554) 6,873 5,319Centrally cleared 16,500,000 SEK Fixed 0.440% SEK STIBOR - SIDE Annual Quarterly Aug 2022 — (8,724) (8,724)Centrally cleared 25,300,000 SEK Fixed 0.413% SEK STIBOR - SIDE Annual Quarterly Aug 2022 — (8,679) (8,679)Centrally cleared 12,400,000 SEK Fixed 0.398% SEK STIBOR - SIDE Annual Quarterly Aug 2022 — (3,019) (3,019)Centrally cleared 6,800,000 SEK Fixed 0.425% SEK STIBOR - SIDE Annual Quarterly Aug 2022 — (2,724) (2,724)Centrally cleared 19,500,000 USD Fixed 2.250% USD LIBOR - BBA Semi-Annual Quarterly Dec 2022 (272,384) (124,047) (396,431)Centrally cleared 66,500,000 SEK Fixed 0.750% SEK STIBOR - SIDE Annual Quarterly Mar 2023 (20,517) (46,182) (66,699)Centrally cleared 17,700,000 EUR NZD BBR - FRA Fixed 0.500% Annual Semi-Annual Mar 2023 233,245 (10,561) 222,684Centrally cleared 3,500,000 GBP Fixed 1.000% GBP LIBOR - BBA Semi-Annual Semi-Annual Mar 2023 (31,951) 2,713 (29,238)Centrally cleared 19,800,000 USD Fixed 2.000% USD LIBOR - BBA Semi-Annual Quarterly Jun 2023 109,002 (336,393) (227,391)Centrally cleared 77,300,000 USD Fixed 1.750% USD LIBOR - BBA Semi-Annual Quarterly Dec 2023 (853,796) 1,281,378 427,582Centrally cleared 2,200,000 AUD Fixed 3.500% AUD BBR - BBSW Semi-Annual Semi-Annual Dec 2025 (46,954) (63,859) (110,813)Centrally cleared 11,400,000 MXN MXN TIIE - Banxico Fixed 6.080% Monthly Monthly Mar 2026 (61,317) 17,879 (43,438)Centrally cleared 5,000,000 USD USD LIBOR - BBA Fixed 1.500% Semi-Annual Quarterly Jun 2027 (320,425) 60,111 (260,314)Centrally cleared 7,500,000 CAD Fixed 1.850% CAD BA - CDOR Semi-Annual Semi-Annual Sep 2027 166,783 2,155 168,938Centrally cleared 490,000,000 JPY Fixed 0.300% JPY LIBOR - BBA Semi-Annual Semi-Annual Sep 2027 (13,921) (17,102) (31,023)Centrally cleared 35,800,000 USD Fixed 2.500% USD LIBOR - BBA Semi-Annual Quarterly Dec 2027 674,206 536,872 1,211,078
John Hancock Funds IIPortfolio of Investments — August 31, 2017 (showing percentage of total net assets)
74
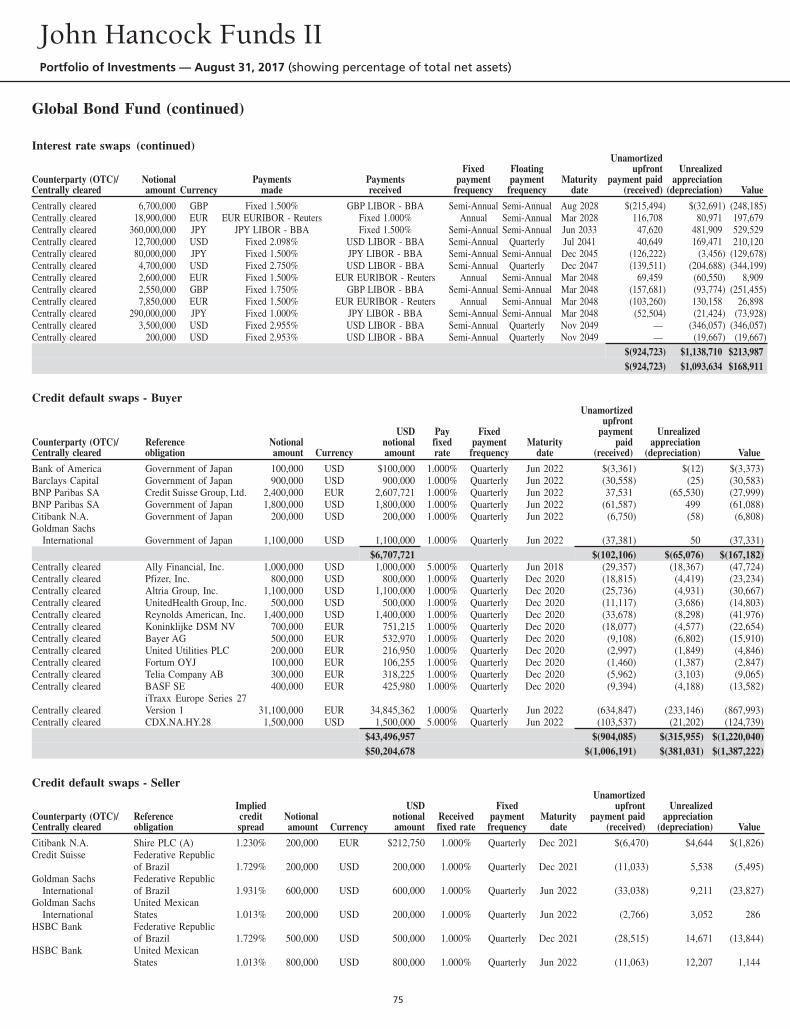
Global Bond Fund (continued)
Interest rate swaps (continued)
Counterparty (OTC)/Centrally cleared
Notionalamount Currency
Paymentsmade
Paymentsreceived
Fixedpayment
frequency
Floatingpayment
frequencyMaturity
date
Unamortizedupfront
payment paid(received)
Unrealizedappreciation
(depreciation) Value
Centrally cleared 6,700,000 GBP Fixed 1.500% GBP LIBOR - BBA Semi-Annual Semi-Annual Aug 2028 $(215,494) $(32,691) (248,185)Centrally cleared 18,900,000 EUR EUR EURIBOR - Reuters Fixed 1.000% Annual Semi-Annual Mar 2028 116,708 80,971 197,679Centrally cleared 360,000,000 JPY JPY LIBOR - BBA Fixed 1.500% Semi-Annual Semi-Annual Jun 2033 47,620 481,909 529,529Centrally cleared 12,700,000 USD Fixed 2.098% USD LIBOR - BBA Semi-Annual Quarterly Jul 2041 40,649 169,471 210,120Centrally cleared 80,000,000 JPY Fixed 1.500% JPY LIBOR - BBA Semi-Annual Semi-Annual Dec 2045 (126,222) (3,456) (129,678)Centrally cleared 4,700,000 USD Fixed 2.750% USD LIBOR - BBA Semi-Annual Quarterly Dec 2047 (139,511) (204,688) (344,199)Centrally cleared 2,600,000 EUR Fixed 1.500% EUR EURIBOR - Reuters Annual Semi-Annual Mar 2048 69,459 (60,550) 8,909Centrally cleared 2,550,000 GBP Fixed 1.750% GBP LIBOR - BBA Semi-Annual Semi-Annual Mar 2048 (157,681) (93,774) (251,455)Centrally cleared 7,850,000 EUR Fixed 1.500% EUR EURIBOR - Reuters Annual Semi-Annual Mar 2048 (103,260) 130,158 26,898Centrally cleared 290,000,000 JPY Fixed 1.000% JPY LIBOR - BBA Semi-Annual Semi-Annual Mar 2048 (52,504) (21,424) (73,928)Centrally cleared 3,500,000 USD Fixed 2.955% USD LIBOR - BBA Semi-Annual Quarterly Nov 2049 — (346,057) (346,057)Centrally cleared 200,000 USD Fixed 2.953% USD LIBOR - BBA Semi-Annual Quarterly Nov 2049 — (19,667) (19,667)
$(924,723) $1,138,710 $213,987$(924,723) $1,093,634 $168,911
Credit default swaps - Buyer
Counterparty (OTC)/Centrally cleared
Referenceobligation
Notionalamount Currency
USDnotionalamount
Payfixedrate
Fixedpayment
frequencyMaturity
date
Unamortizedupfront
paymentpaid
(received)
Unrealizedappreciation
(depreciation) Value
Bank of America Government of Japan 100,000 USD $100,000 1.000% Quarterly Jun 2022 $(3,361) $(12) $(3,373)Barclays Capital Government of Japan 900,000 USD 900,000 1.000% Quarterly Jun 2022 (30,558) (25) (30,583)BNP Paribas SA Credit Suisse Group, Ltd. 2,400,000 EUR 2,607,721 1.000% Quarterly Jun 2022 37,531 (65,530) (27,999)BNP Paribas SA Government of Japan 1,800,000 USD 1,800,000 1.000% Quarterly Jun 2022 (61,587) 499 (61,088)Citibank N.A. Government of Japan 200,000 USD 200,000 1.000% Quarterly Jun 2022 (6,750) (58) (6,808)Goldman Sachs
International Government of Japan 1,100,000 USD 1,100,000 1.000% Quarterly Jun 2022 (37,381) 50 (37,331)$6,707,721 $(102,106) $(65,076) $(167,182)
Centrally cleared Ally Financial, Inc. 1,000,000 USD 1,000,000 5.000% Quarterly Jun 2018 (29,357) (18,367) (47,724)Centrally cleared Pfizer, Inc. 800,000 USD 800,000 1.000% Quarterly Dec 2020 (18,815) (4,419) (23,234)Centrally cleared Altria Group, Inc. 1,100,000 USD 1,100,000 1.000% Quarterly Dec 2020 (25,736) (4,931) (30,667)Centrally cleared UnitedHealth Group, Inc. 500,000 USD 500,000 1.000% Quarterly Dec 2020 (11,117) (3,686) (14,803)Centrally cleared Reynolds American, Inc. 1,400,000 USD 1,400,000 1.000% Quarterly Dec 2020 (33,678) (8,298) (41,976)Centrally cleared Koninklijke DSM NV 700,000 EUR 751,215 1.000% Quarterly Dec 2020 (18,077) (4,577) (22,654)Centrally cleared Bayer AG 500,000 EUR 532,970 1.000% Quarterly Dec 2020 (9,108) (6,802) (15,910)Centrally cleared United Utilities PLC 200,000 EUR 216,950 1.000% Quarterly Dec 2020 (2,997) (1,849) (4,846)Centrally cleared Fortum OYJ 100,000 EUR 106,255 1.000% Quarterly Dec 2020 (1,460) (1,387) (2,847)Centrally cleared Telia Company AB 300,000 EUR 318,225 1.000% Quarterly Dec 2020 (5,962) (3,103) (9,065)Centrally cleared BASF SE 400,000 EUR 425,980 1.000% Quarterly Dec 2020 (9,394) (4,188) (13,582)
Centrally clearediTraxx Europe Series 27Version 1 31,100,000 EUR 34,845,362 1.000% Quarterly Jun 2022 (634,847) (233,146) (867,993)
Centrally cleared CDX.NA.HY.28 1,500,000 USD 1,500,000 5.000% Quarterly Jun 2022 (103,537) (21,202) (124,739)$43,496,957 $(904,085) $(315,955) $(1,220,040)$50,204,678 $(1,006,191) $(381,031) $(1,387,222)
Credit default swaps - Seller
Counterparty (OTC)/Centrally cleared
Referenceobligation
Impliedcreditspread
Notionalamount Currency
USDnotionalamount
Receivedfixed rate
Fixedpayment
frequencyMaturity
date
Unamortizedupfront
payment paid(received)
Unrealizedappreciation
(depreciation) Value
Citibank N.A. Shire PLC (A) 1.230% 200,000 EUR $212,750 1.000% Quarterly Dec 2021 $(6,470) $4,644 $(1,826)Credit Suisse Federative Republic
of Brazil 1.729% 200,000 USD 200,000 1.000% Quarterly Dec 2021 (11,033) 5,538 (5,495)Goldman Sachs
InternationalFederative Republicof Brazil 1.931% 600,000 USD 600,000 1.000% Quarterly Jun 2022 (33,038) 9,211 (23,827)
Goldman SachsInternational
United MexicanStates 1.013% 200,000 USD 200,000 1.000% Quarterly Jun 2022 (2,766) 3,052 286
HSBC Bank Federative Republicof Brazil 1.729% 500,000 USD 500,000 1.000% Quarterly Dec 2021 (28,515) 14,671 (13,844)
HSBC Bank United MexicanStates 1.013% 800,000 USD 800,000 1.000% Quarterly Jun 2022 (11,063) 12,207 1,144
John Hancock Funds IIPortfolio of Investments — August 31, 2017 (showing percentage of total net assets)
75
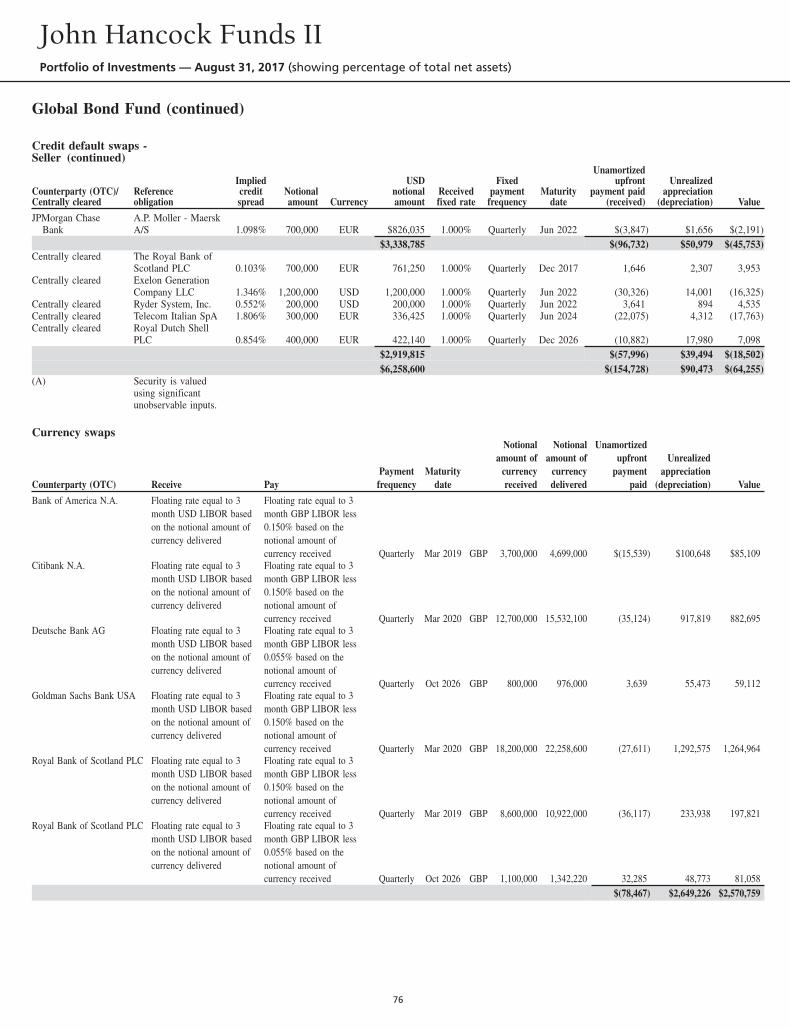
Global Bond Fund (continued)
Credit default swaps -Seller (continued)
Counterparty (OTC)/Centrally cleared
Referenceobligation
Impliedcreditspread
Notionalamount Currency
USDnotionalamount
Receivedfixed rate
Fixedpayment
frequencyMaturity
date
Unamortizedupfront
payment paid(received)
Unrealizedappreciation
(depreciation) Value
JPMorgan ChaseBank
A.P. Moller - MaerskA/S 1.098% 700,000 EUR $826,035 1.000% Quarterly Jun 2022 $(3,847) $1,656 $(2,191)
$3,338,785 $(96,732) $50,979 $(45,753)Centrally cleared The Royal Bank of
Scotland PLC 0.103% 700,000 EUR 761,250 1.000% Quarterly Dec 2017 1,646 2,307 3,953Centrally cleared Exelon Generation
Company LLC 1.346% 1,200,000 USD 1,200,000 1.000% Quarterly Jun 2022 (30,326) 14,001 (16,325)Centrally cleared Ryder System, Inc. 0.552% 200,000 USD 200,000 1.000% Quarterly Jun 2022 3,641 894 4,535Centrally cleared Telecom Italian SpA 1.806% 300,000 EUR 336,425 1.000% Quarterly Jun 2024 (22,075) 4,312 (17,763)Centrally cleared Royal Dutch Shell
PLC 0.854% 400,000 EUR 422,140 1.000% Quarterly Dec 2026 (10,882) 17,980 7,098$2,919,815 $(57,996) $39,494 $(18,502)$6,258,600 $(154,728) $90,473 $(64,255)
(A) Security is valuedusing significantunobservable inputs.
Currency swaps
Counterparty (OTC) Receive PayPaymentfrequency
Maturitydate
Notionalamount of
currencyreceived
Notionalamount of
currencydelivered
Unamortizedupfront
paymentpaid
Unrealizedappreciation
(depreciation) Value
Bank of America N.A. Floating rate equal to 3month USD LIBOR basedon the notional amount ofcurrency delivered
Floating rate equal to 3month GBP LIBOR less0.150% based on thenotional amount ofcurrency received Quarterly Mar 2019 GBP 3,700,000 4,699,000 $(15,539) $100,648 $85,109
Citibank N.A. Floating rate equal to 3month USD LIBOR basedon the notional amount ofcurrency delivered
Floating rate equal to 3month GBP LIBOR less0.150% based on thenotional amount ofcurrency received Quarterly Mar 2020 GBP 12,700,000 15,532,100 (35,124) 917,819 882,695
Deutsche Bank AG Floating rate equal to 3month USD LIBOR basedon the notional amount ofcurrency delivered
Floating rate equal to 3month GBP LIBOR less0.055% based on thenotional amount ofcurrency received Quarterly Oct 2026 GBP 800,000 976,000 3,639 55,473 59,112
Goldman Sachs Bank USA Floating rate equal to 3month USD LIBOR basedon the notional amount ofcurrency delivered
Floating rate equal to 3month GBP LIBOR less0.150% based on thenotional amount ofcurrency received Quarterly Mar 2020 GBP 18,200,000 22,258,600 (27,611) 1,292,575 1,264,964
Royal Bank of Scotland PLC Floating rate equal to 3month USD LIBOR basedon the notional amount ofcurrency delivered
Floating rate equal to 3month GBP LIBOR less0.150% based on thenotional amount ofcurrency received Quarterly Mar 2019 GBP 8,600,000 10,922,000 (36,117) 233,938 197,821
Royal Bank of Scotland PLC Floating rate equal to 3month USD LIBOR basedon the notional amount ofcurrency delivered
Floating rate equal to 3month GBP LIBOR less0.055% based on thenotional amount ofcurrency received Quarterly Oct 2026 GBP 1,100,000 1,342,220 32,285 48,773 81,058
$(78,467) $2,649,226 $2,570,759
John Hancock Funds IIPortfolio of Investments — August 31, 2017 (showing percentage of total net assets)
76
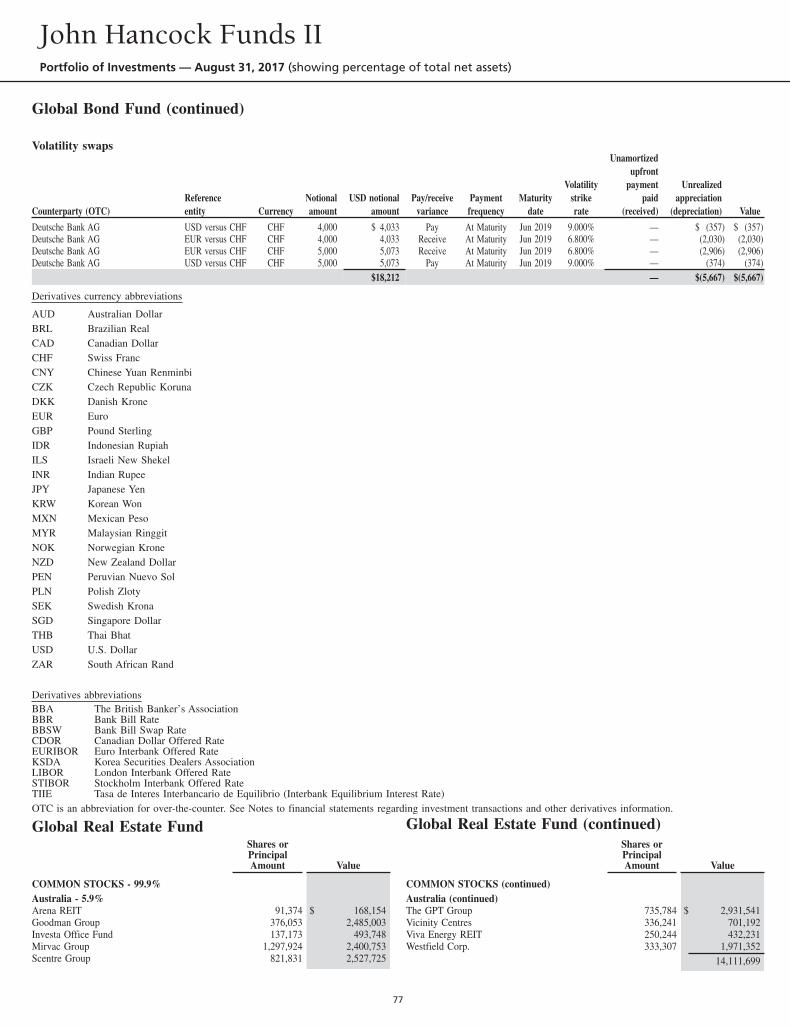
Global Bond Fund (continued)
Volatility swaps
Counterparty (OTC)Referenceentity Currency
Notionalamount
USD notionalamount
Pay/receivevariance
Paymentfrequency
Maturitydate
Volatilitystrikerate
Unamortizedupfront
paymentpaid
(received)
Unrealizedappreciation
(depreciation) Value
Deutsche Bank AG USD versus CHF CHF 4,000 $ 4,033 Pay At Maturity Jun 2019 9.000% — $ (357) $ (357)Deutsche Bank AG EUR versus CHF CHF 4,000 4,033 Receive At Maturity Jun 2019 6.800% — (2,030) (2,030)Deutsche Bank AG EUR versus CHF CHF 5,000 5,073 Receive At Maturity Jun 2019 6.800% — (2,906) (2,906)Deutsche Bank AG USD versus CHF CHF 5,000 5,073 Pay At Maturity Jun 2019 9.000% — (374) (374)
$18,212 — $(5,667) $(5,667)
Derivatives currency abbreviations
AUD Australian DollarBRL Brazilian RealCAD Canadian DollarCHF Swiss FrancCNY Chinese Yuan RenminbiCZK Czech Republic KorunaDKK Danish KroneEUR EuroGBP Pound SterlingIDR Indonesian RupiahILS Israeli New ShekelINR Indian RupeeJPY Japanese YenKRW Korean WonMXN Mexican PesoMYR Malaysian RinggitNOK Norwegian KroneNZD New Zealand DollarPEN Peruvian Nuevo SolPLN Polish ZlotySEK Swedish KronaSGD Singapore DollarTHB Thai BhatUSD U.S. DollarZAR South African Rand
Derivatives abbreviationsBBA The British Banker’s AssociationBBR Bank Bill RateBBSW Bank Bill Swap RateCDOR Canadian Dollar Offered RateEURIBOR Euro Interbank Offered RateKSDA Korea Securities Dealers AssociationLIBOR London Interbank Offered RateSTIBOR Stockholm Interbank Offered RateTIIE Tasa de Interes Interbancario de Equilibrio (Interbank Equilibrium Interest Rate)OTC is an abbreviation for over-the-counter. See Notes to financial statements regarding investment transactions and other derivatives information.
Global Real Estate FundShares orPrincipalAmount Value
COMMON STOCKS - 99.9%Australia - 5.9%Arena REIT 91,374 $ 168,154Goodman Group 376,053 2,485,003Investa Office Fund 137,173 493,748Mirvac Group 1,297,924 2,400,753Scentre Group 821,831 2,527,725
Global Real Estate Fund (continued)Shares orPrincipalAmount Value
COMMON STOCKS (continued)Australia (continued)The GPT Group 735,784 $ 2,931,541Vicinity Centres 336,241 701,192Viva Energy REIT 250,244 432,231Westfield Corp. 333,307 1,971,352
14,111,699
John Hancock Funds IIPortfolio of Investments — August 31, 2017 (showing percentage of total net assets)
77
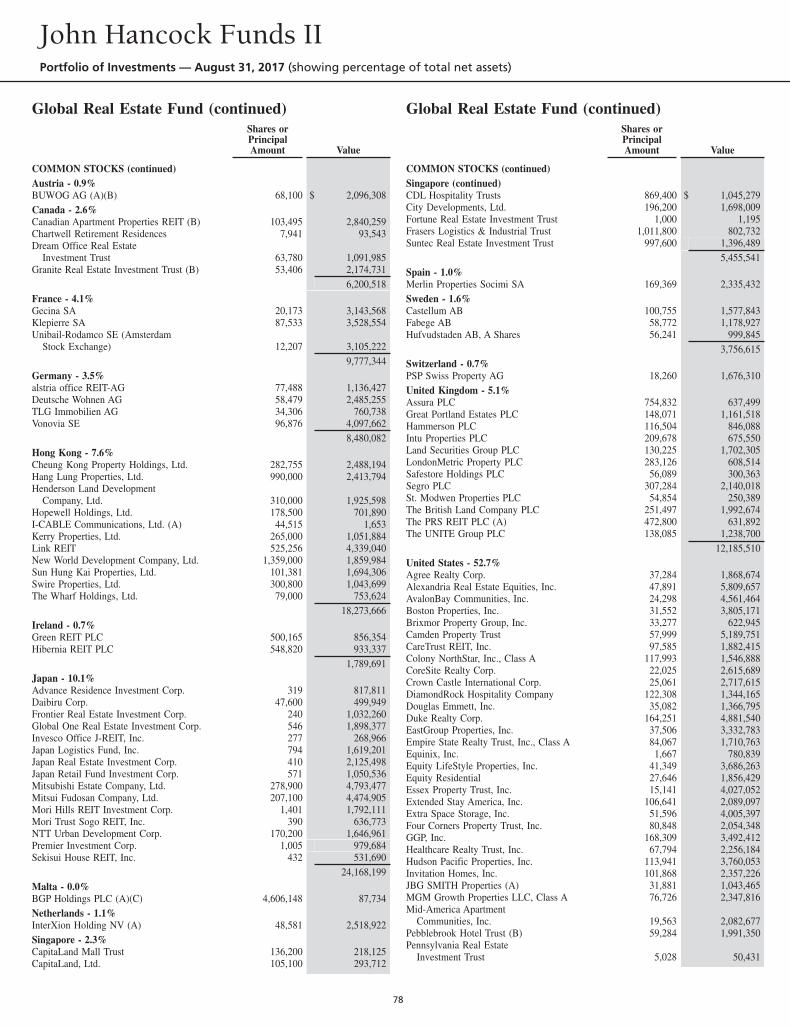
Global Real Estate Fund (continued)Shares orPrincipalAmount Value
COMMON STOCKS (continued)Austria - 0.9%BUWOG AG (A)(B) 68,100 $ 2,096,308Canada - 2.6%Canadian Apartment Properties REIT (B) 103,495 2,840,259Chartwell Retirement Residences 7,941 93,543Dream Office Real Estate
Investment Trust 63,780 1,091,985Granite Real Estate Investment Trust (B) 53,406 2,174,731
6,200,518France - 4.1%Gecina SA 20,173 3,143,568Klepierre SA 87,533 3,528,554Unibail-Rodamco SE (Amsterdam
Stock Exchange) 12,207 3,105,2229,777,344
Germany - 3.5%alstria office REIT-AG 77,488 1,136,427Deutsche Wohnen AG 58,479 2,485,255TLG Immobilien AG 34,306 760,738Vonovia SE 96,876 4,097,662
8,480,082Hong Kong - 7.6%Cheung Kong Property Holdings, Ltd. 282,755 2,488,194Hang Lung Properties, Ltd. 990,000 2,413,794Henderson Land Development
Company, Ltd. 310,000 1,925,598Hopewell Holdings, Ltd. 178,500 701,890I-CABLE Communications, Ltd. (A) 44,515 1,653Kerry Properties, Ltd. 265,000 1,051,884Link REIT 525,256 4,339,040New World Development Company, Ltd. 1,359,000 1,859,984Sun Hung Kai Properties, Ltd. 101,381 1,694,306Swire Properties, Ltd. 300,800 1,043,699The Wharf Holdings, Ltd. 79,000 753,624
18,273,666Ireland - 0.7%Green REIT PLC 500,165 856,354Hibernia REIT PLC 548,820 933,337
1,789,691Japan - 10.1%Advance Residence Investment Corp. 319 817,811Daibiru Corp. 47,600 499,949Frontier Real Estate Investment Corp. 240 1,032,260Global One Real Estate Investment Corp. 546 1,898,377Invesco Office J-REIT, Inc. 277 268,966Japan Logistics Fund, Inc. 794 1,619,201Japan Real Estate Investment Corp. 410 2,125,498Japan Retail Fund Investment Corp. 571 1,050,536Mitsubishi Estate Company, Ltd. 278,900 4,793,477Mitsui Fudosan Company, Ltd. 207,100 4,474,905Mori Hills REIT Investment Corp. 1,401 1,792,111Mori Trust Sogo REIT, Inc. 390 636,773NTT Urban Development Corp. 170,200 1,646,961Premier Investment Corp. 1,005 979,684Sekisui House REIT, Inc. 432 531,690
24,168,199Malta - 0.0%BGP Holdings PLC (A)(C) 4,606,148 87,734Netherlands - 1.1%InterXion Holding NV (A) 48,581 2,518,922Singapore - 2.3%CapitaLand Mall Trust 136,200 218,125CapitaLand, Ltd. 105,100 293,712
Global Real Estate Fund (continued)Shares orPrincipalAmount Value
COMMON STOCKS (continued)Singapore (continued)CDL Hospitality Trusts 869,400 $ 1,045,279City Developments, Ltd. 196,200 1,698,009Fortune Real Estate Investment Trust 1,000 1,195Frasers Logistics & Industrial Trust 1,011,800 802,732Suntec Real Estate Investment Trust 997,600 1,396,489
5,455,541Spain - 1.0%Merlin Properties Socimi SA 169,369 2,335,432Sweden - 1.6%Castellum AB 100,755 1,577,843Fabege AB 58,772 1,178,927Hufvudstaden AB, A Shares 56,241 999,845
3,756,615Switzerland - 0.7%PSP Swiss Property AG 18,260 1,676,310United Kingdom - 5.1%Assura PLC 754,832 637,499Great Portland Estates PLC 148,071 1,161,518Hammerson PLC 116,504 846,088Intu Properties PLC 209,678 675,550Land Securities Group PLC 130,225 1,702,305LondonMetric Property PLC 283,126 608,514Safestore Holdings PLC 56,089 300,363Segro PLC 307,284 2,140,018St. Modwen Properties PLC 54,854 250,389The British Land Company PLC 251,497 1,992,674The PRS REIT PLC (A) 472,800 631,892The UNITE Group PLC 138,085 1,238,700
12,185,510United States - 52.7%Agree Realty Corp. 37,284 1,868,674Alexandria Real Estate Equities, Inc. 47,891 5,809,657AvalonBay Communities, Inc. 24,298 4,561,464Boston Properties, Inc. 31,552 3,805,171Brixmor Property Group, Inc. 33,277 622,945Camden Property Trust 57,999 5,189,751CareTrust REIT, Inc. 97,585 1,882,415Colony NorthStar, Inc., Class A 117,993 1,546,888CoreSite Realty Corp. 22,025 2,615,689Crown Castle International Corp. 25,061 2,717,615DiamondRock Hospitality Company 122,308 1,344,165Douglas Emmett, Inc. 35,082 1,366,795Duke Realty Corp. 164,251 4,881,540EastGroup Properties, Inc. 37,506 3,332,783Empire State Realty Trust, Inc., Class A 84,067 1,710,763Equinix, Inc. 1,667 780,839Equity LifeStyle Properties, Inc. 41,349 3,686,263Equity Residential 27,646 1,856,429Essex Property Trust, Inc. 15,141 4,027,052Extended Stay America, Inc. 106,641 2,089,097Extra Space Storage, Inc. 51,596 4,005,397Four Corners Property Trust, Inc. 80,848 2,054,348GGP, Inc. 168,309 3,492,412Healthcare Realty Trust, Inc. 67,794 2,256,184Hudson Pacific Properties, Inc. 113,941 3,760,053Invitation Homes, Inc. 101,868 2,357,226JBG SMITH Properties (A) 31,881 1,043,465MGM Growth Properties LLC, Class A 76,726 2,347,816Mid-America Apartment
Communities, Inc. 19,563 2,082,677Pebblebrook Hotel Trust (B) 59,284 1,991,350Pennsylvania Real Estate
Investment Trust 5,028 50,431
John Hancock Funds IIPortfolio of Investments — August 31, 2017 (showing percentage of total net assets)
78
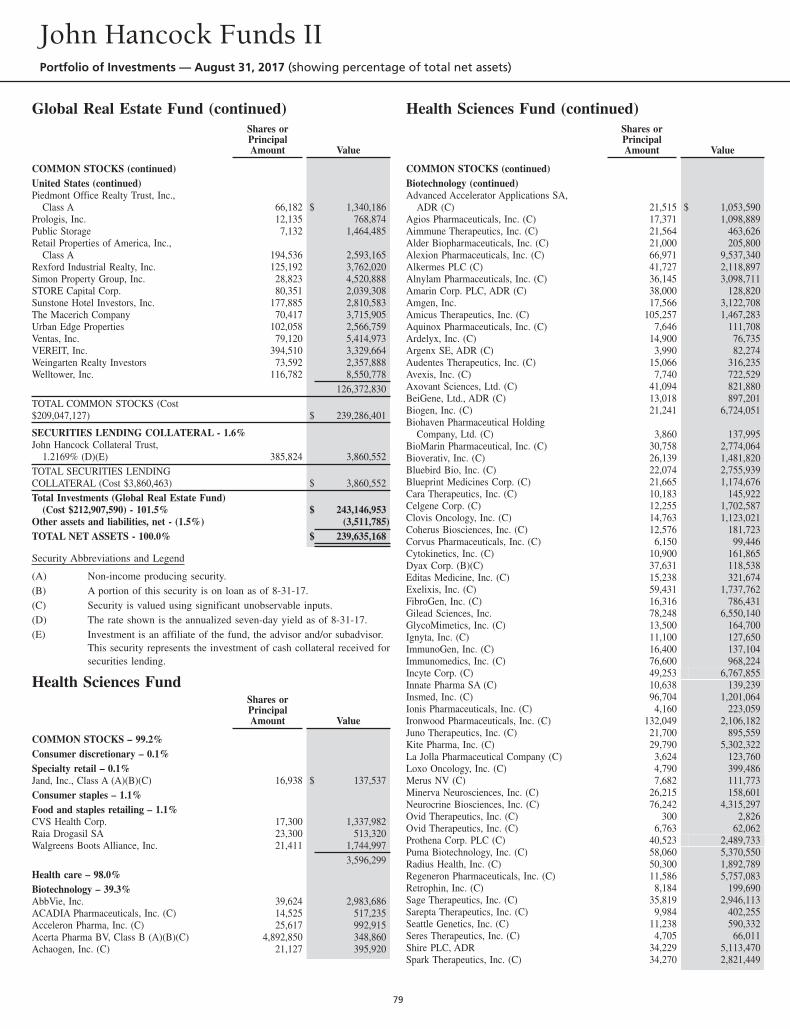
Global Real Estate Fund (continued)Shares orPrincipalAmount Value
COMMON STOCKS (continued)United States (continued)Piedmont Office Realty Trust, Inc.,
Class A 66,182 $ 1,340,186Prologis, Inc. 12,135 768,874Public Storage 7,132 1,464,485Retail Properties of America, Inc.,
Class A 194,536 2,593,165Rexford Industrial Realty, Inc. 125,192 3,762,020Simon Property Group, Inc. 28,823 4,520,888STORE Capital Corp. 80,351 2,039,308Sunstone Hotel Investors, Inc. 177,885 2,810,583The Macerich Company 70,417 3,715,905Urban Edge Properties 102,058 2,566,759Ventas, Inc. 79,120 5,414,973VEREIT, Inc. 394,510 3,329,664Weingarten Realty Investors 73,592 2,357,888Welltower, Inc. 116,782 8,550,778
126,372,830TOTAL COMMON STOCKS (Cost$209,047,127) $ 239,286,401
SECURITIES LENDING COLLATERAL - 1.6%John Hancock Collateral Trust,
1.2169% (D)(E) 385,824 3,860,552TOTAL SECURITIES LENDINGCOLLATERAL (Cost $3,860,463) $ 3,860,552Total Investments (Global Real Estate Fund)
(Cost $212,907,590) - 101.5% $ 243,146,953Other assets and liabilities, net - (1.5%) (3,511,785)TOTAL NET ASSETS - 100.0% $ 239,635,168
Security Abbreviations and Legend
(A) Non-income producing security.(B) A portion of this security is on loan as of 8-31-17.(C) Security is valued using significant unobservable inputs.(D) The rate shown is the annualized seven-day yield as of 8-31-17.(E) Investment is an affiliate of the fund, the advisor and/or subadvisor.
This security represents the investment of cash collateral received forsecurities lending.
Health Sciences FundShares orPrincipalAmount Value
COMMON STOCKS – 99.2%Consumer discretionary – 0.1%Specialty retail – 0.1%Jand, Inc., Class A (A)(B)(C) 16,938 $ 137,537Consumer staples – 1.1%Food and staples retailing – 1.1%CVS Health Corp. 17,300 1,337,982Raia Drogasil SA 23,300 513,320Walgreens Boots Alliance, Inc. 21,411 1,744,997
3,596,299Health care – 98.0%Biotechnology – 39.3%AbbVie, Inc. 39,624 2,983,686ACADIA Pharmaceuticals, Inc. (C) 14,525 517,235Acceleron Pharma, Inc. (C) 25,617 992,915Acerta Pharma BV, Class B (A)(B)(C) 4,892,850 348,860Achaogen, Inc. (C) 21,127 395,920
Health Sciences Fund (continued)Shares orPrincipalAmount Value
COMMON STOCKS (continued)Biotechnology (continued)Advanced Accelerator Applications SA,
ADR (C) 21,515 $ 1,053,590Agios Pharmaceuticals, Inc. (C) 17,371 1,098,889Aimmune Therapeutics, Inc. (C) 21,564 463,626Alder Biopharmaceuticals, Inc. (C) 21,000 205,800Alexion Pharmaceuticals, Inc. (C) 66,971 9,537,340Alkermes PLC (C) 41,727 2,118,897Alnylam Pharmaceuticals, Inc. (C) 36,145 3,098,711Amarin Corp. PLC, ADR (C) 38,000 128,820Amgen, Inc. 17,566 3,122,708Amicus Therapeutics, Inc. (C) 105,257 1,467,283Aquinox Pharmaceuticals, Inc. (C) 7,646 111,708Ardelyx, Inc. (C) 14,900 76,735Argenx SE, ADR (C) 3,990 82,274Audentes Therapeutics, Inc. (C) 15,066 316,235Avexis, Inc. (C) 7,740 722,529Axovant Sciences, Ltd. (C) 41,094 821,880BeiGene, Ltd., ADR (C) 13,018 897,201Biogen, Inc. (C) 21,241 6,724,051Biohaven Pharmaceutical Holding
Company, Ltd. (C) 3,860 137,995BioMarin Pharmaceutical, Inc. (C) 30,758 2,774,064Bioverativ, Inc. (C) 26,139 1,481,820Bluebird Bio, Inc. (C) 22,074 2,755,939Blueprint Medicines Corp. (C) 21,665 1,174,676Cara Therapeutics, Inc. (C) 10,183 145,922Celgene Corp. (C) 12,255 1,702,587Clovis Oncology, Inc. (C) 14,763 1,123,021Coherus Biosciences, Inc. (C) 12,576 181,723Corvus Pharmaceuticals, Inc. (C) 6,150 99,446Cytokinetics, Inc. (C) 10,900 161,865Dyax Corp. (B)(C) 37,631 118,538Editas Medicine, Inc. (C) 15,238 321,674Exelixis, Inc. (C) 59,431 1,737,762FibroGen, Inc. (C) 16,316 786,431Gilead Sciences, Inc. 78,248 6,550,140GlycoMimetics, Inc. (C) 13,500 164,700Ignyta, Inc. (C) 11,100 127,650ImmunoGen, Inc. (C) 16,400 137,104Immunomedics, Inc. (C) 76,600 968,224Incyte Corp. (C) 49,253 6,767,855Innate Pharma SA (C) 10,638 139,239Insmed, Inc. (C) 96,704 1,201,064Ionis Pharmaceuticals, Inc. (C) 4,160 223,059Ironwood Pharmaceuticals, Inc. (C) 132,049 2,106,182Juno Therapeutics, Inc. (C) 21,700 895,559Kite Pharma, Inc. (C) 29,790 5,302,322La Jolla Pharmaceutical Company (C) 3,624 123,760Loxo Oncology, Inc. (C) 4,790 399,486Merus NV (C) 7,682 111,773Minerva Neurosciences, Inc. (C) 26,215 158,601Neurocrine Biosciences, Inc. (C) 76,242 4,315,297Ovid Therapeutics, Inc. (C) 300 2,826Ovid Therapeutics, Inc. (C) 6,763 62,062Prothena Corp. PLC (C) 40,523 2,489,733Puma Biotechnology, Inc. (C) 58,060 5,370,550Radius Health, Inc. (C) 50,300 1,892,789Regeneron Pharmaceuticals, Inc. (C) 11,586 5,757,083Retrophin, Inc. (C) 8,184 199,690Sage Therapeutics, Inc. (C) 35,819 2,946,113Sarepta Therapeutics, Inc. (C) 9,984 402,255Seattle Genetics, Inc. (C) 11,238 590,332Seres Therapeutics, Inc. (C) 4,705 66,011Shire PLC, ADR 34,229 5,113,470Spark Therapeutics, Inc. (C) 34,270 2,821,449
John Hancock Funds IIPortfolio of Investments — August 31, 2017 (showing percentage of total net assets)
79
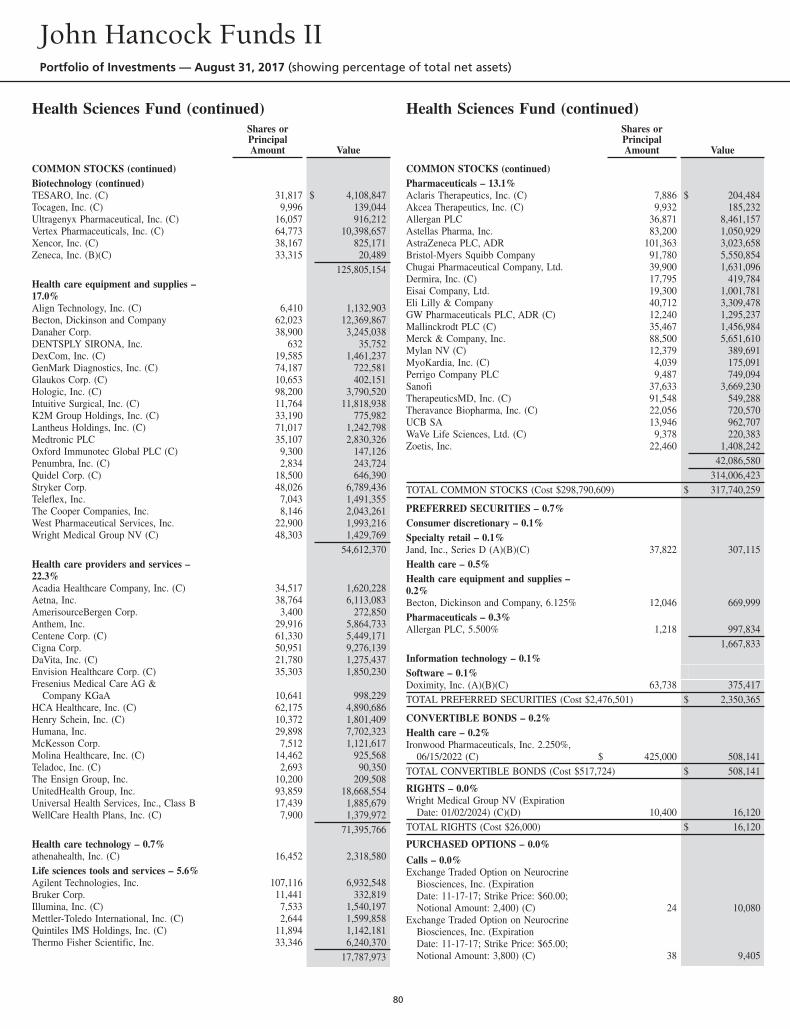
Health Sciences Fund (continued)Shares orPrincipalAmount Value
COMMON STOCKS (continued)Biotechnology (continued)TESARO, Inc. (C) 31,817 $ 4,108,847Tocagen, Inc. (C) 9,996 139,044Ultragenyx Pharmaceutical, Inc. (C) 16,057 916,212Vertex Pharmaceuticals, Inc. (C) 64,773 10,398,657Xencor, Inc. (C) 38,167 825,171Zeneca, Inc. (B)(C) 33,315 20,489
125,805,154Health care equipment and supplies –17.0%Align Technology, Inc. (C) 6,410 1,132,903Becton, Dickinson and Company 62,023 12,369,867Danaher Corp. 38,900 3,245,038DENTSPLY SIRONA, Inc. 632 35,752DexCom, Inc. (C) 19,585 1,461,237GenMark Diagnostics, Inc. (C) 74,187 722,581Glaukos Corp. (C) 10,653 402,151Hologic, Inc. (C) 98,200 3,790,520Intuitive Surgical, Inc. (C) 11,764 11,818,938K2M Group Holdings, Inc. (C) 33,190 775,982Lantheus Holdings, Inc. (C) 71,017 1,242,798Medtronic PLC 35,107 2,830,326Oxford Immunotec Global PLC (C) 9,300 147,126Penumbra, Inc. (C) 2,834 243,724Quidel Corp. (C) 18,500 646,390Stryker Corp. 48,026 6,789,436Teleflex, Inc. 7,043 1,491,355The Cooper Companies, Inc. 8,146 2,043,261West Pharmaceutical Services, Inc. 22,900 1,993,216Wright Medical Group NV (C) 48,303 1,429,769
54,612,370Health care providers and services –22.3%Acadia Healthcare Company, Inc. (C) 34,517 1,620,228Aetna, Inc. 38,764 6,113,083AmerisourceBergen Corp. 3,400 272,850Anthem, Inc. 29,916 5,864,733Centene Corp. (C) 61,330 5,449,171Cigna Corp. 50,951 9,276,139DaVita, Inc. (C) 21,780 1,275,437Envision Healthcare Corp. (C) 35,303 1,850,230Fresenius Medical Care AG &
Company KGaA 10,641 998,229HCA Healthcare, Inc. (C) 62,175 4,890,686Henry Schein, Inc. (C) 10,372 1,801,409Humana, Inc. 29,898 7,702,323McKesson Corp. 7,512 1,121,617Molina Healthcare, Inc. (C) 14,462 925,568Teladoc, Inc. (C) 2,693 90,350The Ensign Group, Inc. 10,200 209,508UnitedHealth Group, Inc. 93,859 18,668,554Universal Health Services, Inc., Class B 17,439 1,885,679WellCare Health Plans, Inc. (C) 7,900 1,379,972
71,395,766Health care technology – 0.7%athenahealth, Inc. (C) 16,452 2,318,580Life sciences tools and services – 5.6%Agilent Technologies, Inc. 107,116 6,932,548Bruker Corp. 11,441 332,819Illumina, Inc. (C) 7,533 1,540,197Mettler-Toledo International, Inc. (C) 2,644 1,599,858Quintiles IMS Holdings, Inc. (C) 11,894 1,142,181Thermo Fisher Scientific, Inc. 33,346 6,240,370
17,787,973
Health Sciences Fund (continued)Shares orPrincipalAmount Value
COMMON STOCKS (continued)Pharmaceuticals – 13.1%Aclaris Therapeutics, Inc. (C) 7,886 $ 204,484Akcea Therapeutics, Inc. (C) 9,932 185,232Allergan PLC 36,871 8,461,157Astellas Pharma, Inc. 83,200 1,050,929AstraZeneca PLC, ADR 101,363 3,023,658Bristol-Myers Squibb Company 91,780 5,550,854Chugai Pharmaceutical Company, Ltd. 39,900 1,631,096Dermira, Inc. (C) 17,795 419,784Eisai Company, Ltd. 19,300 1,001,781Eli Lilly & Company 40,712 3,309,478GW Pharmaceuticals PLC, ADR (C) 12,240 1,295,237Mallinckrodt PLC (C) 35,467 1,456,984Merck & Company, Inc. 88,500 5,651,610Mylan NV (C) 12,379 389,691MyoKardia, Inc. (C) 4,039 175,091Perrigo Company PLC 9,487 749,094Sanofi 37,633 3,669,230TherapeuticsMD, Inc. (C) 91,548 549,288Theravance Biopharma, Inc. (C) 22,056 720,570UCB SA 13,946 962,707WaVe Life Sciences, Ltd. (C) 9,378 220,383Zoetis, Inc. 22,460 1,408,242
42,086,580314,006,423
TOTAL COMMON STOCKS (Cost $298,790,609) $ 317,740,259
PREFERRED SECURITIES – 0.7%Consumer discretionary – 0.1%Specialty retail – 0.1%Jand, Inc., Series D (A)(B)(C) 37,822 307,115Health care – 0.5%Health care equipment and supplies –0.2%Becton, Dickinson and Company, 6.125% 12,046 669,999Pharmaceuticals – 0.3%Allergan PLC, 5.500% 1,218 997,834
1,667,833Information technology – 0.1%Software – 0.1%Doximity, Inc. (A)(B)(C) 63,738 375,417TOTAL PREFERRED SECURITIES (Cost $2,476,501) $ 2,350,365
CONVERTIBLE BONDS – 0.2%Health care – 0.2%Ironwood Pharmaceuticals, Inc. 2.250%,
06/15/2022 (C) $ 425,000 508,141TOTAL CONVERTIBLE BONDS (Cost $517,724) $ 508,141
RIGHTS – 0.0%Wright Medical Group NV (Expiration
Date: 01/02/2024) (C)(D) 10,400 16,120TOTAL RIGHTS (Cost $26,000) $ 16,120
PURCHASED OPTIONS – 0.0%
Calls – 0.0%Exchange Traded Option on Neurocrine
Biosciences, Inc. (ExpirationDate: 11-17-17; Strike Price: $60.00;Notional Amount: 2,400) (C) 24 10,080
Exchange Traded Option on NeurocrineBiosciences, Inc. (ExpirationDate: 11-17-17; Strike Price: $65.00;Notional Amount: 3,800) (C) 38 9,405
John Hancock Funds IIPortfolio of Investments — August 31, 2017 (showing percentage of total net assets)
80
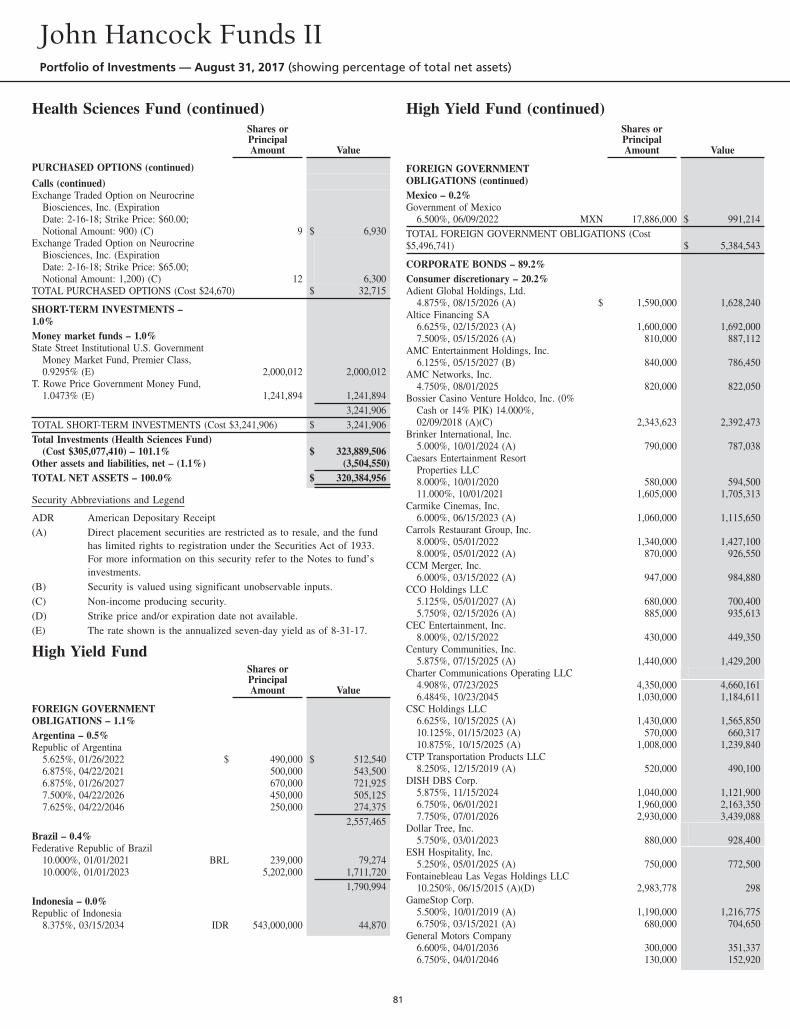
Health Sciences Fund (continued)Shares orPrincipalAmount Value
PURCHASED OPTIONS (continued)
Calls (continued)Exchange Traded Option on Neurocrine
Biosciences, Inc. (ExpirationDate: 2-16-18; Strike Price: $60.00;Notional Amount: 900) (C) 9 $ 6,930
Exchange Traded Option on NeurocrineBiosciences, Inc. (ExpirationDate: 2-16-18; Strike Price: $65.00;Notional Amount: 1,200) (C) 12 6,300
TOTAL PURCHASED OPTIONS (Cost $24,670) $ 32,715
SHORT-TERM INVESTMENTS –1.0%Money market funds – 1.0%State Street Institutional U.S. Government
Money Market Fund, Premier Class,0.9295% (E) 2,000,012 2,000,012
T. Rowe Price Government Money Fund,1.0473% (E) 1,241,894 1,241,894
3,241,906TOTAL SHORT-TERM INVESTMENTS (Cost $3,241,906) $ 3,241,906Total Investments (Health Sciences Fund)
(Cost $305,077,410) – 101.1% $ 323,889,506Other assets and liabilities, net – (1.1%) (3,504,550)TOTAL NET ASSETS – 100.0% $ 320,384,956
Security Abbreviations and Legend
ADR American Depositary Receipt(A) Direct placement securities are restricted as to resale, and the fund
has limited rights to registration under the Securities Act of 1933.For more information on this security refer to the Notes to fund’sinvestments.
(B) Security is valued using significant unobservable inputs.(C) Non-income producing security.(D) Strike price and/or expiration date not available.(E) The rate shown is the annualized seven-day yield as of 8-31-17.
High Yield FundShares orPrincipalAmount Value
FOREIGN GOVERNMENTOBLIGATIONS – 1.1%Argentina – 0.5%Republic of Argentina
5.625%, 01/26/2022 $ 490,000 $ 512,5406.875%, 04/22/2021 500,000 543,5006.875%, 01/26/2027 670,000 721,9257.500%, 04/22/2026 450,000 505,1257.625%, 04/22/2046 250,000 274,375
2,557,465Brazil – 0.4%Federative Republic of Brazil
10.000%, 01/01/2021 BRL 239,000 79,27410.000%, 01/01/2023 5,202,000 1,711,720
1,790,994Indonesia – 0.0%Republic of Indonesia
8.375%, 03/15/2034 IDR 543,000,000 44,870
High Yield Fund (continued)Shares orPrincipalAmount Value
FOREIGN GOVERNMENTOBLIGATIONS (continued)Mexico – 0.2%Government of Mexico
6.500%, 06/09/2022 MXN 17,886,000 $ 991,214TOTAL FOREIGN GOVERNMENT OBLIGATIONS (Cost$5,496,741) $ 5,384,543
CORPORATE BONDS – 89.2%Consumer discretionary – 20.2%Adient Global Holdings, Ltd.
4.875%, 08/15/2026 (A) $ 1,590,000 1,628,240Altice Financing SA
6.625%, 02/15/2023 (A) 1,600,000 1,692,0007.500%, 05/15/2026 (A) 810,000 887,112
AMC Entertainment Holdings, Inc.6.125%, 05/15/2027 (B) 840,000 786,450
AMC Networks, Inc.4.750%, 08/01/2025 820,000 822,050
Bossier Casino Venture Holdco, Inc. (0%Cash or 14% PIK) 14.000%,02/09/2018 (A)(C) 2,343,623 2,392,473
Brinker International, Inc.5.000%, 10/01/2024 (A) 790,000 787,038
Caesars Entertainment ResortProperties LLC8.000%, 10/01/2020 580,000 594,50011.000%, 10/01/2021 1,605,000 1,705,313
Carmike Cinemas, Inc.6.000%, 06/15/2023 (A) 1,060,000 1,115,650
Carrols Restaurant Group, Inc.8.000%, 05/01/2022 1,340,000 1,427,1008.000%, 05/01/2022 (A) 870,000 926,550
CCM Merger, Inc.6.000%, 03/15/2022 (A) 947,000 984,880
CCO Holdings LLC5.125%, 05/01/2027 (A) 680,000 700,4005.750%, 02/15/2026 (A) 885,000 935,613
CEC Entertainment, Inc.8.000%, 02/15/2022 430,000 449,350
Century Communities, Inc.5.875%, 07/15/2025 (A) 1,440,000 1,429,200
Charter Communications Operating LLC4.908%, 07/23/2025 4,350,000 4,660,1616.484%, 10/23/2045 1,030,000 1,184,611
CSC Holdings LLC6.625%, 10/15/2025 (A) 1,430,000 1,565,85010.125%, 01/15/2023 (A) 570,000 660,31710.875%, 10/15/2025 (A) 1,008,000 1,239,840
CTP Transportation Products LLC8.250%, 12/15/2019 (A) 520,000 490,100
DISH DBS Corp.5.875%, 11/15/2024 1,040,000 1,121,9006.750%, 06/01/2021 1,960,000 2,163,3507.750%, 07/01/2026 2,930,000 3,439,088
Dollar Tree, Inc.5.750%, 03/01/2023 880,000 928,400
ESH Hospitality, Inc.5.250%, 05/01/2025 (A) 750,000 772,500
Fontainebleau Las Vegas Holdings LLC10.250%, 06/15/2015 (A)(D) 2,983,778 298
GameStop Corp.5.500%, 10/01/2019 (A) 1,190,000 1,216,7756.750%, 03/15/2021 (A) 680,000 704,650
General Motors Company6.600%, 04/01/2036 300,000 351,3376.750%, 04/01/2046 130,000 152,920
John Hancock Funds IIPortfolio of Investments — August 31, 2017 (showing percentage of total net assets)
81
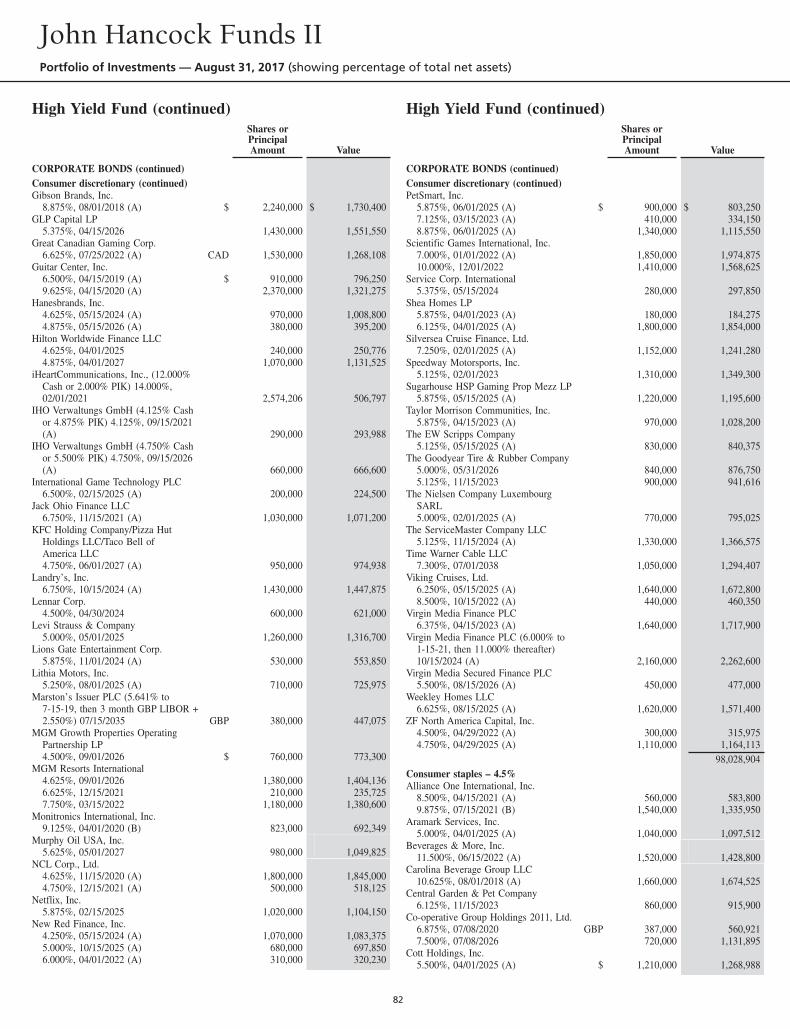
High Yield Fund (continued)Shares orPrincipalAmount Value
CORPORATE BONDS (continued)Consumer discretionary (continued)Gibson Brands, Inc.
8.875%, 08/01/2018 (A) $ 2,240,000 $ 1,730,400GLP Capital LP
5.375%, 04/15/2026 1,430,000 1,551,550Great Canadian Gaming Corp.
6.625%, 07/25/2022 (A) CAD 1,530,000 1,268,108Guitar Center, Inc.
6.500%, 04/15/2019 (A) $ 910,000 796,2509.625%, 04/15/2020 (A) 2,370,000 1,321,275
Hanesbrands, Inc.4.625%, 05/15/2024 (A) 970,000 1,008,8004.875%, 05/15/2026 (A) 380,000 395,200
Hilton Worldwide Finance LLC4.625%, 04/01/2025 240,000 250,7764.875%, 04/01/2027 1,070,000 1,131,525
iHeartCommunications, Inc., (12.000%Cash or 2.000% PIK) 14.000%,02/01/2021 2,574,206 506,797
IHO Verwaltungs GmbH (4.125% Cashor 4.875% PIK) 4.125%, 09/15/2021(A) 290,000 293,988
IHO Verwaltungs GmbH (4.750% Cashor 5.500% PIK) 4.750%, 09/15/2026(A) 660,000 666,600
International Game Technology PLC6.500%, 02/15/2025 (A) 200,000 224,500
Jack Ohio Finance LLC6.750%, 11/15/2021 (A) 1,030,000 1,071,200
KFC Holding Company/Pizza HutHoldings LLC/Taco Bell ofAmerica LLC4.750%, 06/01/2027 (A) 950,000 974,938
Landry’s, Inc.6.750%, 10/15/2024 (A) 1,430,000 1,447,875
Lennar Corp.4.500%, 04/30/2024 600,000 621,000
Levi Strauss & Company5.000%, 05/01/2025 1,260,000 1,316,700
Lions Gate Entertainment Corp.5.875%, 11/01/2024 (A) 530,000 553,850
Lithia Motors, Inc.5.250%, 08/01/2025 (A) 710,000 725,975
Marston’s Issuer PLC (5.641% to7-15-19, then 3 month GBP LIBOR +2.550%) 07/15/2035 GBP 380,000 447,075
MGM Growth Properties OperatingPartnership LP4.500%, 09/01/2026 $ 760,000 773,300
MGM Resorts International4.625%, 09/01/2026 1,380,000 1,404,1366.625%, 12/15/2021 210,000 235,7257.750%, 03/15/2022 1,180,000 1,380,600
Monitronics International, Inc.9.125%, 04/01/2020 (B) 823,000 692,349
Murphy Oil USA, Inc.5.625%, 05/01/2027 980,000 1,049,825
NCL Corp., Ltd.4.625%, 11/15/2020 (A) 1,800,000 1,845,0004.750%, 12/15/2021 (A) 500,000 518,125
Netflix, Inc.5.875%, 02/15/2025 1,020,000 1,104,150
New Red Finance, Inc.4.250%, 05/15/2024 (A) 1,070,000 1,083,3755.000%, 10/15/2025 (A) 680,000 697,8506.000%, 04/01/2022 (A) 310,000 320,230
High Yield Fund (continued)Shares orPrincipalAmount Value
CORPORATE BONDS (continued)Consumer discretionary (continued)PetSmart, Inc.
5.875%, 06/01/2025 (A) $ 900,000 $ 803,2507.125%, 03/15/2023 (A) 410,000 334,1508.875%, 06/01/2025 (A) 1,340,000 1,115,550
Scientific Games International, Inc.7.000%, 01/01/2022 (A) 1,850,000 1,974,87510.000%, 12/01/2022 1,410,000 1,568,625
Service Corp. International5.375%, 05/15/2024 280,000 297,850
Shea Homes LP5.875%, 04/01/2023 (A) 180,000 184,2756.125%, 04/01/2025 (A) 1,800,000 1,854,000
Silversea Cruise Finance, Ltd.7.250%, 02/01/2025 (A) 1,152,000 1,241,280
Speedway Motorsports, Inc.5.125%, 02/01/2023 1,310,000 1,349,300
Sugarhouse HSP Gaming Prop Mezz LP5.875%, 05/15/2025 (A) 1,220,000 1,195,600
Taylor Morrison Communities, Inc.5.875%, 04/15/2023 (A) 970,000 1,028,200
The EW Scripps Company5.125%, 05/15/2025 (A) 830,000 840,375
The Goodyear Tire & Rubber Company5.000%, 05/31/2026 840,000 876,7505.125%, 11/15/2023 900,000 941,616
The Nielsen Company LuxembourgSARL5.000%, 02/01/2025 (A) 770,000 795,025
The ServiceMaster Company LLC5.125%, 11/15/2024 (A) 1,330,000 1,366,575
Time Warner Cable LLC7.300%, 07/01/2038 1,050,000 1,294,407
Viking Cruises, Ltd.6.250%, 05/15/2025 (A) 1,640,000 1,672,8008.500%, 10/15/2022 (A) 440,000 460,350
Virgin Media Finance PLC6.375%, 04/15/2023 (A) 1,640,000 1,717,900
Virgin Media Finance PLC (6.000% to1-15-21, then 11.000% thereafter)10/15/2024 (A) 2,160,000 2,262,600
Virgin Media Secured Finance PLC5.500%, 08/15/2026 (A) 450,000 477,000
Weekley Homes LLC6.625%, 08/15/2025 (A) 1,620,000 1,571,400
ZF North America Capital, Inc.4.500%, 04/29/2022 (A) 300,000 315,9754.750%, 04/29/2025 (A) 1,110,000 1,164,113
98,028,904Consumer staples – 4.5%Alliance One International, Inc.
8.500%, 04/15/2021 (A) 560,000 583,8009.875%, 07/15/2021 (B) 1,540,000 1,335,950
Aramark Services, Inc.5.000%, 04/01/2025 (A) 1,040,000 1,097,512
Beverages & More, Inc.11.500%, 06/15/2022 (A) 1,520,000 1,428,800
Carolina Beverage Group LLC10.625%, 08/01/2018 (A) 1,660,000 1,674,525
Central Garden & Pet Company6.125%, 11/15/2023 860,000 915,900
Co-operative Group Holdings 2011, Ltd.6.875%, 07/08/2020 GBP 387,000 560,9217.500%, 07/08/2026 720,000 1,131,895
Cott Holdings, Inc.5.500%, 04/01/2025 (A) $ 1,210,000 1,268,988
John Hancock Funds IIPortfolio of Investments — August 31, 2017 (showing percentage of total net assets)
82
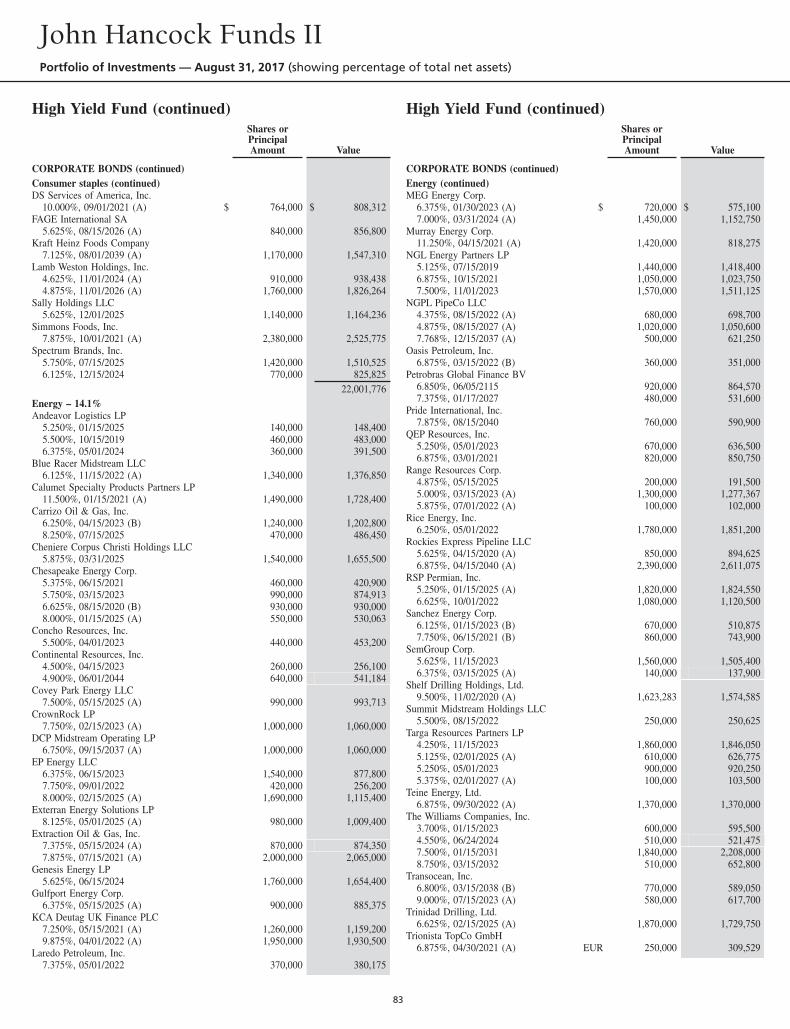
High Yield Fund (continued)Shares orPrincipalAmount Value
CORPORATE BONDS (continued)Consumer staples (continued)DS Services of America, Inc.
10.000%, 09/01/2021 (A) $ 764,000 $ 808,312FAGE International SA
5.625%, 08/15/2026 (A) 840,000 856,800Kraft Heinz Foods Company
7.125%, 08/01/2039 (A) 1,170,000 1,547,310Lamb Weston Holdings, Inc.
4.625%, 11/01/2024 (A) 910,000 938,4384.875%, 11/01/2026 (A) 1,760,000 1,826,264
Sally Holdings LLC5.625%, 12/01/2025 1,140,000 1,164,236
Simmons Foods, Inc.7.875%, 10/01/2021 (A) 2,380,000 2,525,775
Spectrum Brands, Inc.5.750%, 07/15/2025 1,420,000 1,510,5256.125%, 12/15/2024 770,000 825,825
22,001,776Energy – 14.1%Andeavor Logistics LP
5.250%, 01/15/2025 140,000 148,4005.500%, 10/15/2019 460,000 483,0006.375%, 05/01/2024 360,000 391,500
Blue Racer Midstream LLC6.125%, 11/15/2022 (A) 1,340,000 1,376,850
Calumet Specialty Products Partners LP11.500%, 01/15/2021 (A) 1,490,000 1,728,400
Carrizo Oil & Gas, Inc.6.250%, 04/15/2023 (B) 1,240,000 1,202,8008.250%, 07/15/2025 470,000 486,450
Cheniere Corpus Christi Holdings LLC5.875%, 03/31/2025 1,540,000 1,655,500
Chesapeake Energy Corp.5.375%, 06/15/2021 460,000 420,9005.750%, 03/15/2023 990,000 874,9136.625%, 08/15/2020 (B) 930,000 930,0008.000%, 01/15/2025 (A) 550,000 530,063
Concho Resources, Inc.5.500%, 04/01/2023 440,000 453,200
Continental Resources, Inc.4.500%, 04/15/2023 260,000 256,1004.900%, 06/01/2044 640,000 541,184
Covey Park Energy LLC7.500%, 05/15/2025 (A) 990,000 993,713
CrownRock LP7.750%, 02/15/2023 (A) 1,000,000 1,060,000
DCP Midstream Operating LP6.750%, 09/15/2037 (A) 1,000,000 1,060,000
EP Energy LLC6.375%, 06/15/2023 1,540,000 877,8007.750%, 09/01/2022 420,000 256,2008.000%, 02/15/2025 (A) 1,690,000 1,115,400
Exterran Energy Solutions LP8.125%, 05/01/2025 (A) 980,000 1,009,400
Extraction Oil & Gas, Inc.7.375%, 05/15/2024 (A) 870,000 874,3507.875%, 07/15/2021 (A) 2,000,000 2,065,000
Genesis Energy LP5.625%, 06/15/2024 1,760,000 1,654,400
Gulfport Energy Corp.6.375%, 05/15/2025 (A) 900,000 885,375
KCA Deutag UK Finance PLC7.250%, 05/15/2021 (A) 1,260,000 1,159,2009.875%, 04/01/2022 (A) 1,950,000 1,930,500
Laredo Petroleum, Inc.7.375%, 05/01/2022 370,000 380,175
High Yield Fund (continued)Shares orPrincipalAmount Value
CORPORATE BONDS (continued)Energy (continued)MEG Energy Corp.
6.375%, 01/30/2023 (A) $ 720,000 $ 575,1007.000%, 03/31/2024 (A) 1,450,000 1,152,750
Murray Energy Corp.11.250%, 04/15/2021 (A) 1,420,000 818,275
NGL Energy Partners LP5.125%, 07/15/2019 1,440,000 1,418,4006.875%, 10/15/2021 1,050,000 1,023,7507.500%, 11/01/2023 1,570,000 1,511,125
NGPL PipeCo LLC4.375%, 08/15/2022 (A) 680,000 698,7004.875%, 08/15/2027 (A) 1,020,000 1,050,6007.768%, 12/15/2037 (A) 500,000 621,250
Oasis Petroleum, Inc.6.875%, 03/15/2022 (B) 360,000 351,000
Petrobras Global Finance BV6.850%, 06/05/2115 920,000 864,5707.375%, 01/17/2027 480,000 531,600
Pride International, Inc.7.875%, 08/15/2040 760,000 590,900
QEP Resources, Inc.5.250%, 05/01/2023 670,000 636,5006.875%, 03/01/2021 820,000 850,750
Range Resources Corp.4.875%, 05/15/2025 200,000 191,5005.000%, 03/15/2023 (A) 1,300,000 1,277,3675.875%, 07/01/2022 (A) 100,000 102,000
Rice Energy, Inc.6.250%, 05/01/2022 1,780,000 1,851,200
Rockies Express Pipeline LLC5.625%, 04/15/2020 (A) 850,000 894,6256.875%, 04/15/2040 (A) 2,390,000 2,611,075
RSP Permian, Inc.5.250%, 01/15/2025 (A) 1,820,000 1,824,5506.625%, 10/01/2022 1,080,000 1,120,500
Sanchez Energy Corp.6.125%, 01/15/2023 (B) 670,000 510,8757.750%, 06/15/2021 (B) 860,000 743,900
SemGroup Corp.5.625%, 11/15/2023 1,560,000 1,505,4006.375%, 03/15/2025 (A) 140,000 137,900
Shelf Drilling Holdings, Ltd.9.500%, 11/02/2020 (A) 1,623,283 1,574,585
Summit Midstream Holdings LLC5.500%, 08/15/2022 250,000 250,625
Targa Resources Partners LP4.250%, 11/15/2023 1,860,000 1,846,0505.125%, 02/01/2025 (A) 610,000 626,7755.250%, 05/01/2023 900,000 920,2505.375%, 02/01/2027 (A) 100,000 103,500
Teine Energy, Ltd.6.875%, 09/30/2022 (A) 1,370,000 1,370,000
The Williams Companies, Inc.3.700%, 01/15/2023 600,000 595,5004.550%, 06/24/2024 510,000 521,4757.500%, 01/15/2031 1,840,000 2,208,0008.750%, 03/15/2032 510,000 652,800
Transocean, Inc.6.800%, 03/15/2038 (B) 770,000 589,0509.000%, 07/15/2023 (A) 580,000 617,700
Trinidad Drilling, Ltd.6.625%, 02/15/2025 (A) 1,870,000 1,729,750
Trionista TopCo GmbH6.875%, 04/30/2021 (A) EUR 250,000 309,529
John Hancock Funds IIPortfolio of Investments — August 31, 2017 (showing percentage of total net assets)
83
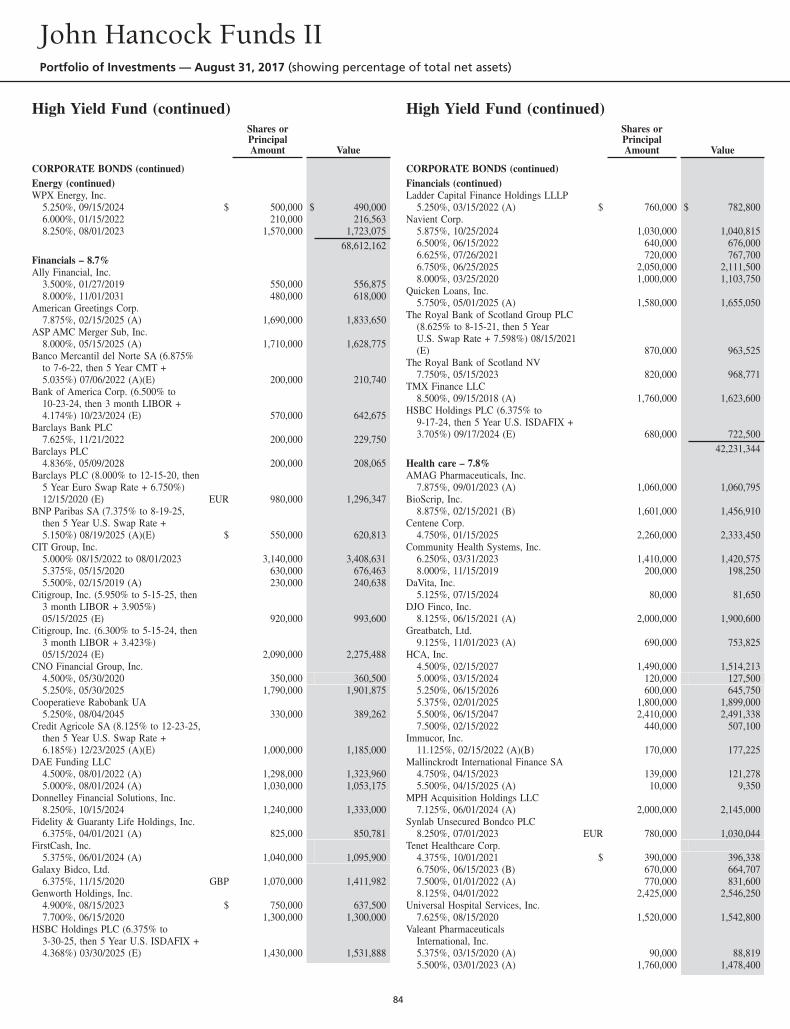
High Yield Fund (continued)Shares orPrincipalAmount Value
CORPORATE BONDS (continued)Energy (continued)WPX Energy, Inc.
5.250%, 09/15/2024 $ 500,000 $ 490,0006.000%, 01/15/2022 210,000 216,5638.250%, 08/01/2023 1,570,000 1,723,075
68,612,162Financials – 8.7%Ally Financial, Inc.
3.500%, 01/27/2019 550,000 556,8758.000%, 11/01/2031 480,000 618,000
American Greetings Corp.7.875%, 02/15/2025 (A) 1,690,000 1,833,650
ASP AMC Merger Sub, Inc.8.000%, 05/15/2025 (A) 1,710,000 1,628,775
Banco Mercantil del Norte SA (6.875%to 7-6-22, then 5 Year CMT +5.035%) 07/06/2022 (A)(E) 200,000 210,740
Bank of America Corp. (6.500% to10-23-24, then 3 month LIBOR +4.174%) 10/23/2024 (E) 570,000 642,675
Barclays Bank PLC7.625%, 11/21/2022 200,000 229,750
Barclays PLC4.836%, 05/09/2028 200,000 208,065
Barclays PLC (8.000% to 12-15-20, then5 Year Euro Swap Rate + 6.750%)12/15/2020 (E) EUR 980,000 1,296,347
BNP Paribas SA (7.375% to 8-19-25,then 5 Year U.S. Swap Rate +5.150%) 08/19/2025 (A)(E) $ 550,000 620,813
CIT Group, Inc.5.000% 08/15/2022 to 08/01/2023 3,140,000 3,408,6315.375%, 05/15/2020 630,000 676,4635.500%, 02/15/2019 (A) 230,000 240,638
Citigroup, Inc. (5.950% to 5-15-25, then3 month LIBOR + 3.905%)05/15/2025 (E) 920,000 993,600
Citigroup, Inc. (6.300% to 5-15-24, then3 month LIBOR + 3.423%)05/15/2024 (E) 2,090,000 2,275,488
CNO Financial Group, Inc.4.500%, 05/30/2020 350,000 360,5005.250%, 05/30/2025 1,790,000 1,901,875
Cooperatieve Rabobank UA5.250%, 08/04/2045 330,000 389,262
Credit Agricole SA (8.125% to 12-23-25,then 5 Year U.S. Swap Rate +6.185%) 12/23/2025 (A)(E) 1,000,000 1,185,000
DAE Funding LLC4.500%, 08/01/2022 (A) 1,298,000 1,323,9605.000%, 08/01/2024 (A) 1,030,000 1,053,175
Donnelley Financial Solutions, Inc.8.250%, 10/15/2024 1,240,000 1,333,000
Fidelity & Guaranty Life Holdings, Inc.6.375%, 04/01/2021 (A) 825,000 850,781
FirstCash, Inc.5.375%, 06/01/2024 (A) 1,040,000 1,095,900
Galaxy Bidco, Ltd.6.375%, 11/15/2020 GBP 1,070,000 1,411,982
Genworth Holdings, Inc.4.900%, 08/15/2023 $ 750,000 637,5007.700%, 06/15/2020 1,300,000 1,300,000
HSBC Holdings PLC (6.375% to3-30-25, then 5 Year U.S. ISDAFIX +4.368%) 03/30/2025 (E) 1,430,000 1,531,888
High Yield Fund (continued)Shares orPrincipalAmount Value
CORPORATE BONDS (continued)Financials (continued)Ladder Capital Finance Holdings LLLP
5.250%, 03/15/2022 (A) $ 760,000 $ 782,800Navient Corp.
5.875%, 10/25/2024 1,030,000 1,040,8156.500%, 06/15/2022 640,000 676,0006.625%, 07/26/2021 720,000 767,7006.750%, 06/25/2025 2,050,000 2,111,5008.000%, 03/25/2020 1,000,000 1,103,750
Quicken Loans, Inc.5.750%, 05/01/2025 (A) 1,580,000 1,655,050
The Royal Bank of Scotland Group PLC(8.625% to 8-15-21, then 5 YearU.S. Swap Rate + 7.598%) 08/15/2021(E) 870,000 963,525
The Royal Bank of Scotland NV7.750%, 05/15/2023 820,000 968,771
TMX Finance LLC8.500%, 09/15/2018 (A) 1,760,000 1,623,600
HSBC Holdings PLC (6.375% to9-17-24, then 5 Year U.S. ISDAFIX +3.705%) 09/17/2024 (E) 680,000 722,500
42,231,344Health care – 7.8%AMAG Pharmaceuticals, Inc.
7.875%, 09/01/2023 (A) 1,060,000 1,060,795BioScrip, Inc.
8.875%, 02/15/2021 (B) 1,601,000 1,456,910Centene Corp.
4.750%, 01/15/2025 2,260,000 2,333,450Community Health Systems, Inc.
6.250%, 03/31/2023 1,410,000 1,420,5758.000%, 11/15/2019 200,000 198,250
DaVita, Inc.5.125%, 07/15/2024 80,000 81,650
DJO Finco, Inc.8.125%, 06/15/2021 (A) 2,000,000 1,900,600
Greatbatch, Ltd.9.125%, 11/01/2023 (A) 690,000 753,825
HCA, Inc.4.500%, 02/15/2027 1,490,000 1,514,2135.000%, 03/15/2024 120,000 127,5005.250%, 06/15/2026 600,000 645,7505.375%, 02/01/2025 1,800,000 1,899,0005.500%, 06/15/2047 2,410,000 2,491,3387.500%, 02/15/2022 440,000 507,100
Immucor, Inc.11.125%, 02/15/2022 (A)(B) 170,000 177,225
Mallinckrodt International Finance SA4.750%, 04/15/2023 139,000 121,2785.500%, 04/15/2025 (A) 10,000 9,350
MPH Acquisition Holdings LLC7.125%, 06/01/2024 (A) 2,000,000 2,145,000
Synlab Unsecured Bondco PLC8.250%, 07/01/2023 EUR 780,000 1,030,044
Tenet Healthcare Corp.4.375%, 10/01/2021 $ 390,000 396,3386.750%, 06/15/2023 (B) 670,000 664,7077.500%, 01/01/2022 (A) 770,000 831,6008.125%, 04/01/2022 2,425,000 2,546,250
Universal Hospital Services, Inc.7.625%, 08/15/2020 1,520,000 1,542,800
Valeant PharmaceuticalsInternational, Inc.5.375%, 03/15/2020 (A) 90,000 88,8195.500%, 03/01/2023 (A) 1,760,000 1,478,400
John Hancock Funds IIPortfolio of Investments — August 31, 2017 (showing percentage of total net assets)
84
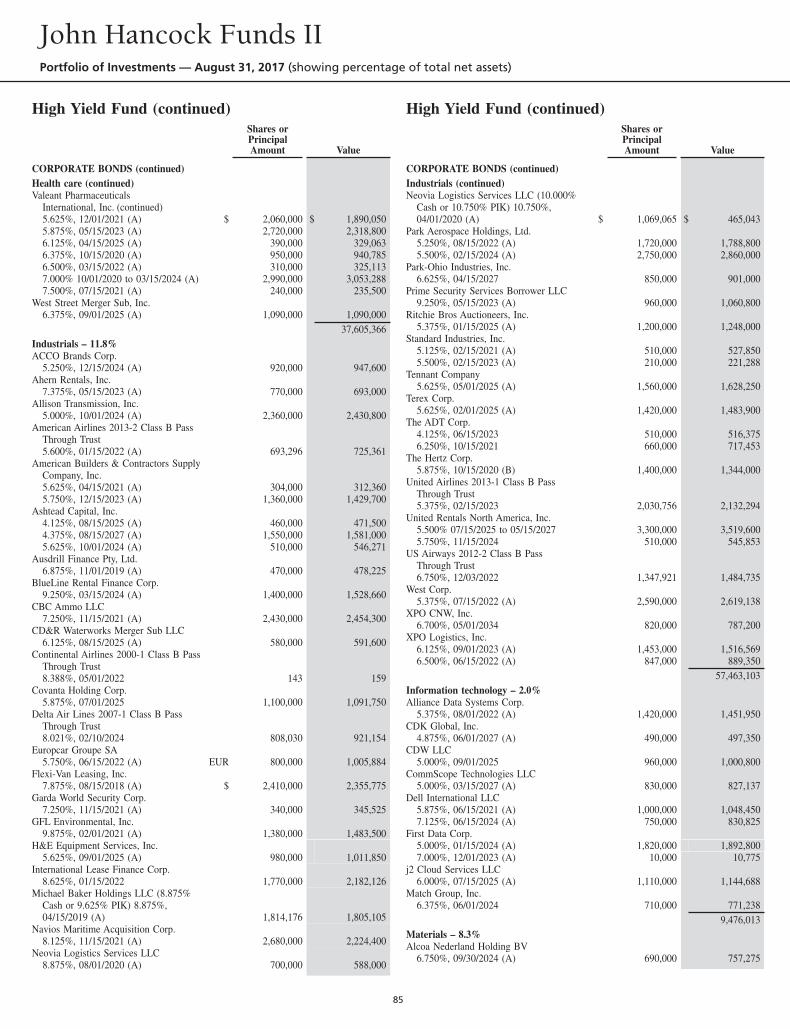
High Yield Fund (continued)Shares orPrincipalAmount Value
CORPORATE BONDS (continued)Health care (continued)Valeant Pharmaceuticals
International, Inc. (continued)5.625%, 12/01/2021 (A) $ 2,060,000 $ 1,890,0505.875%, 05/15/2023 (A) 2,720,000 2,318,8006.125%, 04/15/2025 (A) 390,000 329,0636.375%, 10/15/2020 (A) 950,000 940,7856.500%, 03/15/2022 (A) 310,000 325,1137.000% 10/01/2020 to 03/15/2024 (A) 2,990,000 3,053,2887.500%, 07/15/2021 (A) 240,000 235,500
West Street Merger Sub, Inc.6.375%, 09/01/2025 (A) 1,090,000 1,090,000
37,605,366Industrials – 11.8%ACCO Brands Corp.
5.250%, 12/15/2024 (A) 920,000 947,600Ahern Rentals, Inc.
7.375%, 05/15/2023 (A) 770,000 693,000Allison Transmission, Inc.
5.000%, 10/01/2024 (A) 2,360,000 2,430,800American Airlines 2013-2 Class B Pass
Through Trust5.600%, 01/15/2022 (A) 693,296 725,361
American Builders & Contractors SupplyCompany, Inc.5.625%, 04/15/2021 (A) 304,000 312,3605.750%, 12/15/2023 (A) 1,360,000 1,429,700
Ashtead Capital, Inc.4.125%, 08/15/2025 (A) 460,000 471,5004.375%, 08/15/2027 (A) 1,550,000 1,581,0005.625%, 10/01/2024 (A) 510,000 546,271
Ausdrill Finance Pty, Ltd.6.875%, 11/01/2019 (A) 470,000 478,225
BlueLine Rental Finance Corp.9.250%, 03/15/2024 (A) 1,400,000 1,528,660
CBC Ammo LLC7.250%, 11/15/2021 (A) 2,430,000 2,454,300
CD&R Waterworks Merger Sub LLC6.125%, 08/15/2025 (A) 580,000 591,600
Continental Airlines 2000-1 Class B PassThrough Trust8.388%, 05/01/2022 143 159
Covanta Holding Corp.5.875%, 07/01/2025 1,100,000 1,091,750
Delta Air Lines 2007-1 Class B PassThrough Trust8.021%, 02/10/2024 808,030 921,154
Europcar Groupe SA5.750%, 06/15/2022 (A) EUR 800,000 1,005,884
Flexi-Van Leasing, Inc.7.875%, 08/15/2018 (A) $ 2,410,000 2,355,775
Garda World Security Corp.7.250%, 11/15/2021 (A) 340,000 345,525
GFL Environmental, Inc.9.875%, 02/01/2021 (A) 1,380,000 1,483,500
H&E Equipment Services, Inc.5.625%, 09/01/2025 (A) 980,000 1,011,850
International Lease Finance Corp.8.625%, 01/15/2022 1,770,000 2,182,126
Michael Baker Holdings LLC (8.875%Cash or 9.625% PIK) 8.875%,04/15/2019 (A) 1,814,176 1,805,105
Navios Maritime Acquisition Corp.8.125%, 11/15/2021 (A) 2,680,000 2,224,400
Neovia Logistics Services LLC8.875%, 08/01/2020 (A) 700,000 588,000
High Yield Fund (continued)Shares orPrincipalAmount Value
CORPORATE BONDS (continued)Industrials (continued)Neovia Logistics Services LLC (10.000%
Cash or 10.750% PIK) 10.750%,04/01/2020 (A) $ 1,069,065 $ 465,043
Park Aerospace Holdings, Ltd.5.250%, 08/15/2022 (A) 1,720,000 1,788,8005.500%, 02/15/2024 (A) 2,750,000 2,860,000
Park-Ohio Industries, Inc.6.625%, 04/15/2027 850,000 901,000
Prime Security Services Borrower LLC9.250%, 05/15/2023 (A) 960,000 1,060,800
Ritchie Bros Auctioneers, Inc.5.375%, 01/15/2025 (A) 1,200,000 1,248,000
Standard Industries, Inc.5.125%, 02/15/2021 (A) 510,000 527,8505.500%, 02/15/2023 (A) 210,000 221,288
Tennant Company5.625%, 05/01/2025 (A) 1,560,000 1,628,250
Terex Corp.5.625%, 02/01/2025 (A) 1,420,000 1,483,900
The ADT Corp.4.125%, 06/15/2023 510,000 516,3756.250%, 10/15/2021 660,000 717,453
The Hertz Corp.5.875%, 10/15/2020 (B) 1,400,000 1,344,000
United Airlines 2013-1 Class B PassThrough Trust5.375%, 02/15/2023 2,030,756 2,132,294
United Rentals North America, Inc.5.500% 07/15/2025 to 05/15/2027 3,300,000 3,519,6005.750%, 11/15/2024 510,000 545,853
US Airways 2012-2 Class B PassThrough Trust6.750%, 12/03/2022 1,347,921 1,484,735
West Corp.5.375%, 07/15/2022 (A) 2,590,000 2,619,138
XPO CNW, Inc.6.700%, 05/01/2034 820,000 787,200
XPO Logistics, Inc.6.125%, 09/01/2023 (A) 1,453,000 1,516,5696.500%, 06/15/2022 (A) 847,000 889,350
57,463,103Information technology – 2.0%Alliance Data Systems Corp.
5.375%, 08/01/2022 (A) 1,420,000 1,451,950CDK Global, Inc.
4.875%, 06/01/2027 (A) 490,000 497,350CDW LLC
5.000%, 09/01/2025 960,000 1,000,800CommScope Technologies LLC
5.000%, 03/15/2027 (A) 830,000 827,137Dell International LLC
5.875%, 06/15/2021 (A) 1,000,000 1,048,4507.125%, 06/15/2024 (A) 750,000 830,825
First Data Corp.5.000%, 01/15/2024 (A) 1,820,000 1,892,8007.000%, 12/01/2023 (A) 10,000 10,775
j2 Cloud Services LLC6.000%, 07/15/2025 (A) 1,110,000 1,144,688
Match Group, Inc.6.375%, 06/01/2024 710,000 771,238
9,476,013Materials – 8.3%Alcoa Nederland Holding BV
6.750%, 09/30/2024 (A) 690,000 757,275
John Hancock Funds IIPortfolio of Investments — August 31, 2017 (showing percentage of total net assets)
85
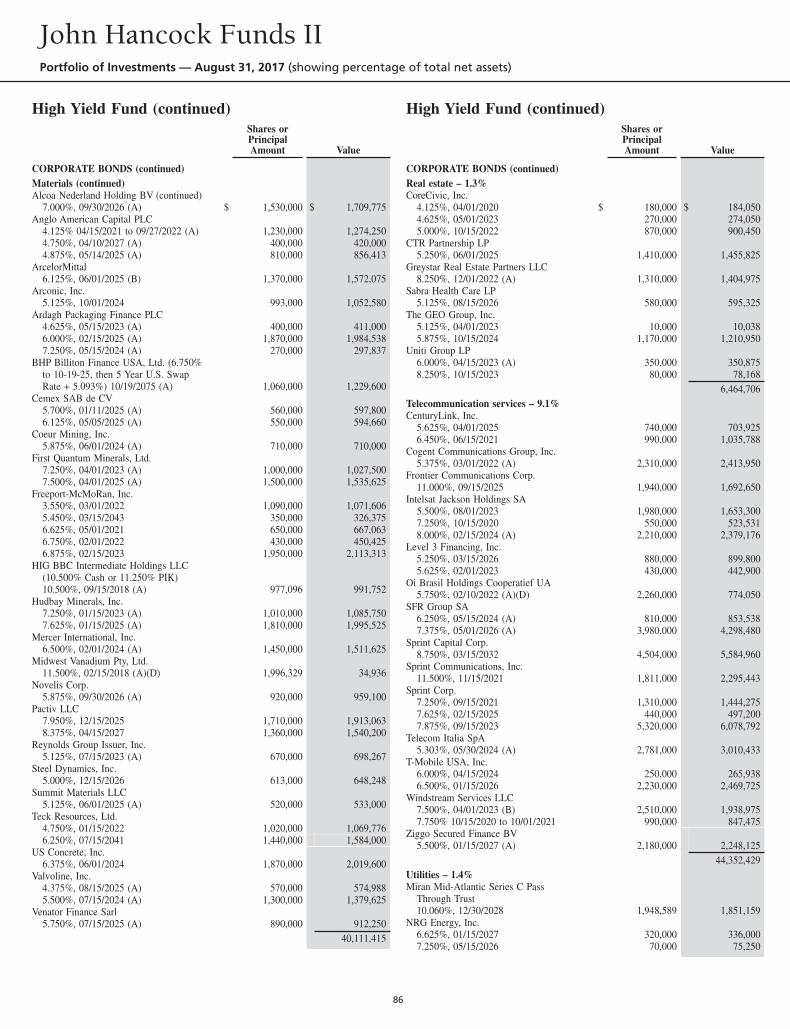
High Yield Fund (continued)Shares orPrincipalAmount Value
CORPORATE BONDS (continued)Materials (continued)Alcoa Nederland Holding BV (continued)
7.000%, 09/30/2026 (A) $ 1,530,000 $ 1,709,775Anglo American Capital PLC
4.125% 04/15/2021 to 09/27/2022 (A) 1,230,000 1,274,2504.750%, 04/10/2027 (A) 400,000 420,0004.875%, 05/14/2025 (A) 810,000 856,413
ArcelorMittal6.125%, 06/01/2025 (B) 1,370,000 1,572,075
Arconic, Inc.5.125%, 10/01/2024 993,000 1,052,580
Ardagh Packaging Finance PLC4.625%, 05/15/2023 (A) 400,000 411,0006.000%, 02/15/2025 (A) 1,870,000 1,984,5387.250%, 05/15/2024 (A) 270,000 297,837
BHP Billiton Finance USA, Ltd. (6.750%to 10-19-25, then 5 Year U.S. SwapRate + 5.093%) 10/19/2075 (A) 1,060,000 1,229,600
Cemex SAB de CV5.700%, 01/11/2025 (A) 560,000 597,8006.125%, 05/05/2025 (A) 550,000 594,660
Coeur Mining, Inc.5.875%, 06/01/2024 (A) 710,000 710,000
First Quantum Minerals, Ltd.7.250%, 04/01/2023 (A) 1,000,000 1,027,5007.500%, 04/01/2025 (A) 1,500,000 1,535,625
Freeport-McMoRan, Inc.3.550%, 03/01/2022 1,090,000 1,071,6065.450%, 03/15/2043 350,000 326,3756.625%, 05/01/2021 650,000 667,0636.750%, 02/01/2022 430,000 450,4256.875%, 02/15/2023 1,950,000 2,113,313
HIG BBC Intermediate Holdings LLC(10.500% Cash or 11.250% PIK)10.500%, 09/15/2018 (A) 977,096 991,752
Hudbay Minerals, Inc.7.250%, 01/15/2023 (A) 1,010,000 1,085,7507.625%, 01/15/2025 (A) 1,810,000 1,995,525
Mercer International, Inc.6.500%, 02/01/2024 (A) 1,450,000 1,511,625
Midwest Vanadium Pty, Ltd.11.500%, 02/15/2018 (A)(D) 1,996,329 34,936
Novelis Corp.5.875%, 09/30/2026 (A) 920,000 959,100
Pactiv LLC7.950%, 12/15/2025 1,710,000 1,913,0638.375%, 04/15/2027 1,360,000 1,540,200
Reynolds Group Issuer, Inc.5.125%, 07/15/2023 (A) 670,000 698,267
Steel Dynamics, Inc.5.000%, 12/15/2026 613,000 648,248
Summit Materials LLC5.125%, 06/01/2025 (A) 520,000 533,000
Teck Resources, Ltd.4.750%, 01/15/2022 1,020,000 1,069,7766.250%, 07/15/2041 1,440,000 1,584,000
US Concrete, Inc.6.375%, 06/01/2024 1,870,000 2,019,600
Valvoline, Inc.4.375%, 08/15/2025 (A) 570,000 574,9885.500%, 07/15/2024 (A) 1,300,000 1,379,625
Venator Finance Sarl5.750%, 07/15/2025 (A) 890,000 912,250
40,111,415
High Yield Fund (continued)Shares orPrincipalAmount Value
CORPORATE BONDS (continued)Real estate – 1.3%CoreCivic, Inc.
4.125%, 04/01/2020 $ 180,000 $ 184,0504.625%, 05/01/2023 270,000 274,0505.000%, 10/15/2022 870,000 900,450
CTR Partnership LP5.250%, 06/01/2025 1,410,000 1,455,825
Greystar Real Estate Partners LLC8.250%, 12/01/2022 (A) 1,310,000 1,404,975
Sabra Health Care LP5.125%, 08/15/2026 580,000 595,325
The GEO Group, Inc.5.125%, 04/01/2023 10,000 10,0385.875%, 10/15/2024 1,170,000 1,210,950
Uniti Group LP6.000%, 04/15/2023 (A) 350,000 350,8758.250%, 10/15/2023 80,000 78,168
6,464,706Telecommunication services – 9.1%CenturyLink, Inc.
5.625%, 04/01/2025 740,000 703,9256.450%, 06/15/2021 990,000 1,035,788
Cogent Communications Group, Inc.5.375%, 03/01/2022 (A) 2,310,000 2,413,950
Frontier Communications Corp.11.000%, 09/15/2025 1,940,000 1,692,650
Intelsat Jackson Holdings SA5.500%, 08/01/2023 1,980,000 1,653,3007.250%, 10/15/2020 550,000 523,5318.000%, 02/15/2024 (A) 2,210,000 2,379,176
Level 3 Financing, Inc.5.250%, 03/15/2026 880,000 899,8005.625%, 02/01/2023 430,000 442,900
Oi Brasil Holdings Cooperatief UA5.750%, 02/10/2022 (A)(D) 2,260,000 774,050
SFR Group SA6.250%, 05/15/2024 (A) 810,000 853,5387.375%, 05/01/2026 (A) 3,980,000 4,298,480
Sprint Capital Corp.8.750%, 03/15/2032 4,504,000 5,584,960
Sprint Communications, Inc.11.500%, 11/15/2021 1,811,000 2,295,443
Sprint Corp.7.250%, 09/15/2021 1,310,000 1,444,2757.625%, 02/15/2025 440,000 497,2007.875%, 09/15/2023 5,320,000 6,078,792
Telecom Italia SpA5.303%, 05/30/2024 (A) 2,781,000 3,010,433
T-Mobile USA, Inc.6.000%, 04/15/2024 250,000 265,9386.500%, 01/15/2026 2,230,000 2,469,725
Windstream Services LLC7.500%, 04/01/2023 (B) 2,510,000 1,938,9757.750% 10/15/2020 to 10/01/2021 990,000 847,475
Ziggo Secured Finance BV5.500%, 01/15/2027 (A) 2,180,000 2,248,125
44,352,429Utilities – 1.4%Miran Mid-Atlantic Series C Pass
Through Trust10.060%, 12/30/2028 1,948,589 1,851,159
NRG Energy, Inc.6.625%, 01/15/2027 320,000 336,0007.250%, 05/15/2026 70,000 75,250
John Hancock Funds IIPortfolio of Investments — August 31, 2017 (showing percentage of total net assets)
86
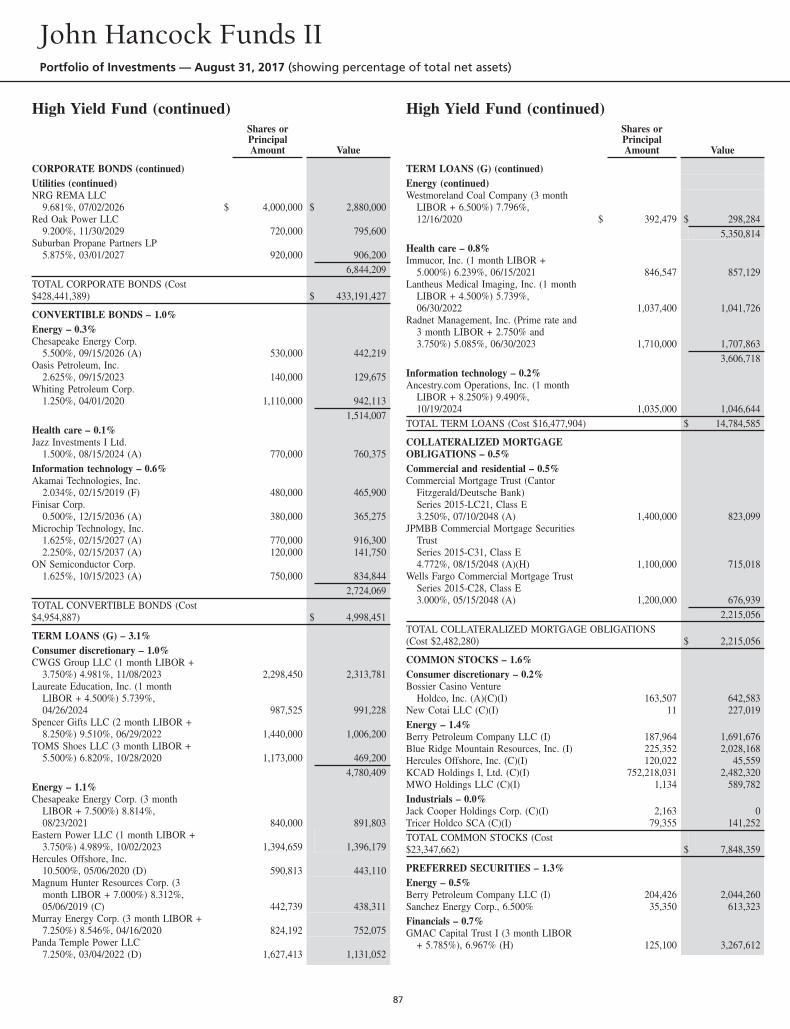
High Yield Fund (continued)Shares orPrincipalAmount Value
CORPORATE BONDS (continued)Utilities (continued)NRG REMA LLC
9.681%, 07/02/2026 $ 4,000,000 $ 2,880,000Red Oak Power LLC
9.200%, 11/30/2029 720,000 795,600Suburban Propane Partners LP
5.875%, 03/01/2027 920,000 906,2006,844,209
TOTAL CORPORATE BONDS (Cost$428,441,389) $ 433,191,427
CONVERTIBLE BONDS – 1.0%Energy – 0.3%Chesapeake Energy Corp.
5.500%, 09/15/2026 (A) 530,000 442,219Oasis Petroleum, Inc.
2.625%, 09/15/2023 140,000 129,675Whiting Petroleum Corp.
1.250%, 04/01/2020 1,110,000 942,1131,514,007
Health care – 0.1%Jazz Investments I Ltd.
1.500%, 08/15/2024 (A) 770,000 760,375Information technology – 0.6%Akamai Technologies, Inc.
2.034%, 02/15/2019 (F) 480,000 465,900Finisar Corp.
0.500%, 12/15/2036 (A) 380,000 365,275Microchip Technology, Inc.
1.625%, 02/15/2027 (A) 770,000 916,3002.250%, 02/15/2037 (A) 120,000 141,750
ON Semiconductor Corp.1.625%, 10/15/2023 (A) 750,000 834,844
2,724,069TOTAL CONVERTIBLE BONDS (Cost$4,954,887) $ 4,998,451
TERM LOANS (G) – 3.1%Consumer discretionary – 1.0%CWGS Group LLC (1 month LIBOR +
3.750%) 4.981%, 11/08/2023 2,298,450 2,313,781Laureate Education, Inc. (1 month
LIBOR + 4.500%) 5.739%,04/26/2024 987,525 991,228
Spencer Gifts LLC (2 month LIBOR +8.250%) 9.510%, 06/29/2022 1,440,000 1,006,200
TOMS Shoes LLC (3 month LIBOR +5.500%) 6.820%, 10/28/2020 1,173,000 469,200
4,780,409Energy – 1.1%Chesapeake Energy Corp. (3 month
LIBOR + 7.500%) 8.814%,08/23/2021 840,000 891,803
Eastern Power LLC (1 month LIBOR +3.750%) 4.989%, 10/02/2023 1,394,659 1,396,179
Hercules Offshore, Inc.10.500%, 05/06/2020 (D) 590,813 443,110
Magnum Hunter Resources Corp. (3month LIBOR + 7.000%) 8.312%,05/06/2019 (C) 442,739 438,311
Murray Energy Corp. (3 month LIBOR +7.250%) 8.546%, 04/16/2020 824,192 752,075
Panda Temple Power LLC7.250%, 03/04/2022 (D) 1,627,413 1,131,052
High Yield Fund (continued)Shares orPrincipalAmount Value
TERM LOANS (G) (continued)Energy (continued)Westmoreland Coal Company (3 month
LIBOR + 6.500%) 7.796%,12/16/2020 $ 392,479 $ 298,284
5,350,814Health care – 0.8%Immucor, Inc. (1 month LIBOR +
5.000%) 6.239%, 06/15/2021 846,547 857,129Lantheus Medical Imaging, Inc. (1 month
LIBOR + 4.500%) 5.739%,06/30/2022 1,037,400 1,041,726
Radnet Management, Inc. (Prime rate and3 month LIBOR + 2.750% and3.750%) 5.085%, 06/30/2023 1,710,000 1,707,863
3,606,718Information technology – 0.2%Ancestry.com Operations, Inc. (1 month
LIBOR + 8.250%) 9.490%,10/19/2024 1,035,000 1,046,644
TOTAL TERM LOANS (Cost $16,477,904) $ 14,784,585
COLLATERALIZED MORTGAGEOBLIGATIONS – 0.5%Commercial and residential – 0.5%Commercial Mortgage Trust (Cantor
Fitzgerald/Deutsche Bank)Series 2015-LC21, Class E3.250%, 07/10/2048 (A) 1,400,000 823,099
JPMBB Commercial Mortgage SecuritiesTrustSeries 2015-C31, Class E4.772%, 08/15/2048 (A)(H) 1,100,000 715,018
Wells Fargo Commercial Mortgage TrustSeries 2015-C28, Class E3.000%, 05/15/2048 (A) 1,200,000 676,939
2,215,056TOTAL COLLATERALIZED MORTGAGE OBLIGATIONS(Cost $2,482,280) $ 2,215,056
COMMON STOCKS – 1.6%Consumer discretionary – 0.2%Bossier Casino Venture
Holdco, Inc. (A)(C)(I) 163,507 642,583New Cotai LLC (C)(I) 11 227,019Energy – 1.4%Berry Petroleum Company LLC (I) 187,964 1,691,676Blue Ridge Mountain Resources, Inc. (I) 225,352 2,028,168Hercules Offshore, Inc. (C)(I) 120,022 45,559KCAD Holdings I, Ltd. (C)(I) 752,218,031 2,482,320MWO Holdings LLC (C)(I) 1,134 589,782Industrials – 0.0%Jack Cooper Holdings Corp. (C)(I) 2,163 0Tricer Holdco SCA (C)(I) 79,355 141,252TOTAL COMMON STOCKS (Cost$23,347,662) $ 7,848,359
PREFERRED SECURITIES – 1.3%Energy – 0.5%Berry Petroleum Company LLC (I) 204,426 2,044,260Sanchez Energy Corp., 6.500% 35,350 613,323Financials – 0.7%GMAC Capital Trust I (3 month LIBOR
+ 5.785%), 6.967% (H) 125,100 3,267,612
John Hancock Funds IIPortfolio of Investments — August 31, 2017 (showing percentage of total net assets)
87
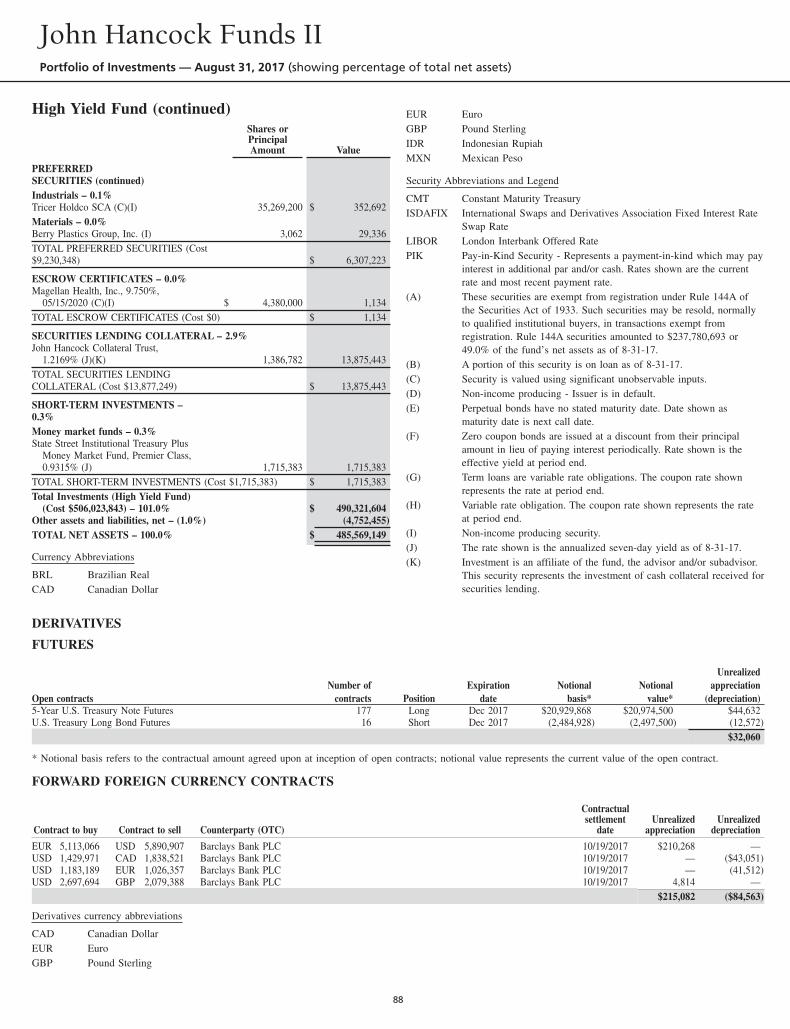
High Yield Fund (continued)Shares orPrincipalAmount Value
PREFERREDSECURITIES (continued)Industrials – 0.1%Tricer Holdco SCA (C)(I) 35,269,200 $ 352,692Materials – 0.0%Berry Plastics Group, Inc. (I) 3,062 29,336TOTAL PREFERRED SECURITIES (Cost$9,230,348) $ 6,307,223
ESCROW CERTIFICATES – 0.0%Magellan Health, Inc., 9.750%,
05/15/2020 (C)(I) $ 4,380,000 1,134TOTAL ESCROW CERTIFICATES (Cost $0) $ 1,134
SECURITIES LENDING COLLATERAL – 2.9%John Hancock Collateral Trust,
1.2169% (J)(K) 1,386,782 13,875,443TOTAL SECURITIES LENDINGCOLLATERAL (Cost $13,877,249) $ 13,875,443
SHORT-TERM INVESTMENTS –0.3%Money market funds – 0.3%State Street Institutional Treasury Plus
Money Market Fund, Premier Class,0.9315% (J) 1,715,383 1,715,383
TOTAL SHORT-TERM INVESTMENTS (Cost $1,715,383) $ 1,715,383Total Investments (High Yield Fund)
(Cost $506,023,843) – 101.0% $ 490,321,604Other assets and liabilities, net – (1.0%) (4,752,455)TOTAL NET ASSETS – 100.0% $ 485,569,149
Currency Abbreviations
BRL Brazilian RealCAD Canadian Dollar
EUR EuroGBP Pound SterlingIDR Indonesian RupiahMXN Mexican Peso
Security Abbreviations and Legend
CMT Constant Maturity TreasuryISDAFIX International Swaps and Derivatives Association Fixed Interest Rate
Swap RateLIBOR London Interbank Offered RatePIK Pay-in-Kind Security - Represents a payment-in-kind which may pay
interest in additional par and/or cash. Rates shown are the currentrate and most recent payment rate.
(A) These securities are exempt from registration under Rule 144A ofthe Securities Act of 1933. Such securities may be resold, normallyto qualified institutional buyers, in transactions exempt fromregistration. Rule 144A securities amounted to $237,780,693 or49.0% of the fund’s net assets as of 8-31-17.
(B) A portion of this security is on loan as of 8-31-17.(C) Security is valued using significant unobservable inputs.(D) Non-income producing - Issuer is in default.(E) Perpetual bonds have no stated maturity date. Date shown as
maturity date is next call date.(F) Zero coupon bonds are issued at a discount from their principal
amount in lieu of paying interest periodically. Rate shown is theeffective yield at period end.
(G) Term loans are variable rate obligations. The coupon rate shownrepresents the rate at period end.
(H) Variable rate obligation. The coupon rate shown represents the rateat period end.
(I) Non-income producing security.(J) The rate shown is the annualized seven-day yield as of 8-31-17.(K) Investment is an affiliate of the fund, the advisor and/or subadvisor.
This security represents the investment of cash collateral received forsecurities lending.
DERIVATIVES
FUTURES
Open contractsNumber of
contracts PositionExpiration
dateNotional
basis*Notional
value*
Unrealizedappreciation
(depreciation)5-Year U.S. Treasury Note Futures 177 Long Dec 2017 $20,929,868 $20,974,500 $44,632U.S. Treasury Long Bond Futures 16 Short Dec 2017 (2,484,928) (2,497,500) (12,572)
$32,060
* Notional basis refers to the contractual amount agreed upon at inception of open contracts; notional value represents the current value of the open contract.
FORWARD FOREIGN CURRENCY CONTRACTS
Contract to buy Contract to sell Counterparty (OTC)
Contractualsettlement
dateUnrealized
appreciationUnrealized
depreciation
EUR 5,113,066 USD 5,890,907 Barclays Bank PLC 10/19/2017 $210,268 —USD 1,429,971 CAD 1,838,521 Barclays Bank PLC 10/19/2017 — ($43,051)USD 1,183,189 EUR 1,026,357 Barclays Bank PLC 10/19/2017 — (41,512)USD 2,697,694 GBP 2,079,388 Barclays Bank PLC 10/19/2017 4,814 —
$215,082 ($84,563)
Derivatives currency abbreviations
CAD Canadian DollarEUR EuroGBP Pound Sterling
John Hancock Funds IIPortfolio of Investments — August 31, 2017 (showing percentage of total net assets)
88
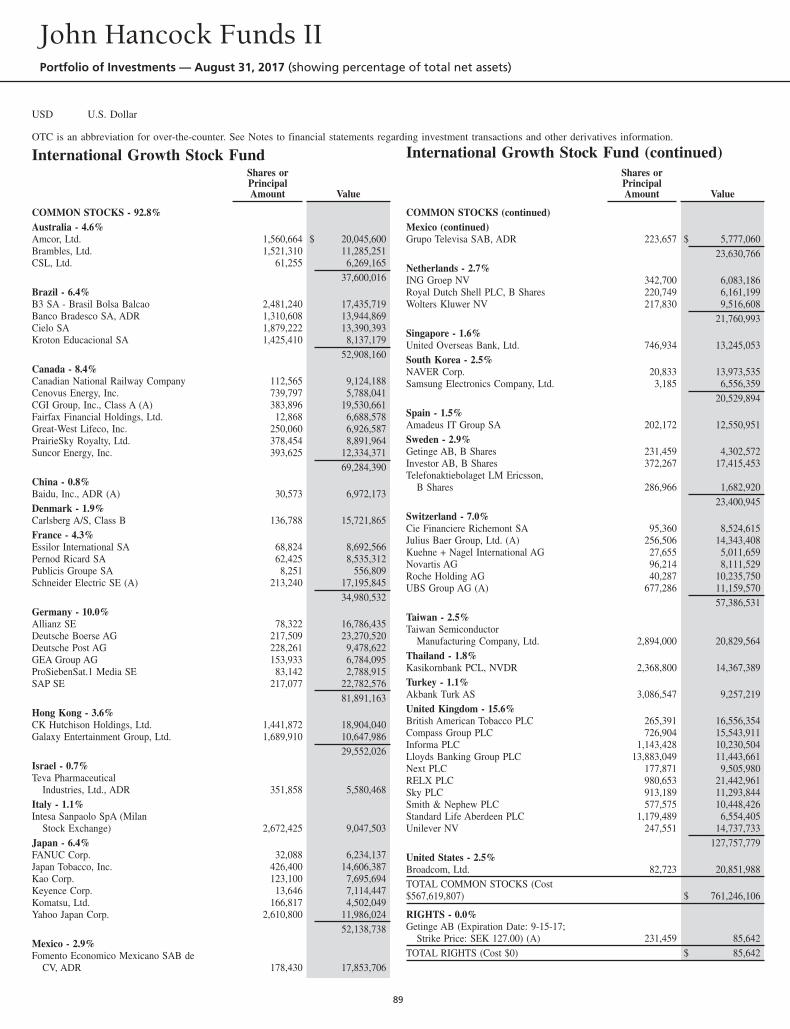
USD U.S. Dollar
OTC is an abbreviation for over-the-counter. See Notes to financial statements regarding investment transactions and other derivatives information.
International Growth Stock FundShares orPrincipalAmount Value
COMMON STOCKS - 92.8%Australia - 4.6%Amcor, Ltd. 1,560,664 $ 20,045,600Brambles, Ltd. 1,521,310 11,285,251CSL, Ltd. 61,255 6,269,165
37,600,016Brazil - 6.4%B3 SA - Brasil Bolsa Balcao 2,481,240 17,435,719Banco Bradesco SA, ADR 1,310,608 13,944,869Cielo SA 1,879,222 13,390,393Kroton Educacional SA 1,425,410 8,137,179
52,908,160Canada - 8.4%Canadian National Railway Company 112,565 9,124,188Cenovus Energy, Inc. 739,797 5,788,041CGI Group, Inc., Class A (A) 383,896 19,530,661Fairfax Financial Holdings, Ltd. 12,868 6,688,578Great-West Lifeco, Inc. 250,060 6,926,587PrairieSky Royalty, Ltd. 378,454 8,891,964Suncor Energy, Inc. 393,625 12,334,371
69,284,390China - 0.8%Baidu, Inc., ADR (A) 30,573 6,972,173Denmark - 1.9%Carlsberg A/S, Class B 136,788 15,721,865France - 4.3%Essilor International SA 68,824 8,692,566Pernod Ricard SA 62,425 8,535,312Publicis Groupe SA 8,251 556,809Schneider Electric SE (A) 213,240 17,195,845
34,980,532Germany - 10.0%Allianz SE 78,322 16,786,435Deutsche Boerse AG 217,509 23,270,520Deutsche Post AG 228,261 9,478,622GEA Group AG 153,933 6,784,095ProSiebenSat.1 Media SE 83,142 2,788,915SAP SE 217,077 22,782,576
81,891,163Hong Kong - 3.6%CK Hutchison Holdings, Ltd. 1,441,872 18,904,040Galaxy Entertainment Group, Ltd. 1,689,910 10,647,986
29,552,026Israel - 0.7%Teva Pharmaceutical
Industries, Ltd., ADR 351,858 5,580,468Italy - 1.1%Intesa Sanpaolo SpA (Milan
Stock Exchange) 2,672,425 9,047,503Japan - 6.4%FANUC Corp. 32,088 6,234,137Japan Tobacco, Inc. 426,400 14,606,387Kao Corp. 123,100 7,695,694Keyence Corp. 13,646 7,114,447Komatsu, Ltd. 166,817 4,502,049Yahoo Japan Corp. 2,610,800 11,986,024
52,138,738Mexico - 2.9%Fomento Economico Mexicano SAB de
CV, ADR 178,430 17,853,706
International Growth Stock Fund (continued)Shares orPrincipalAmount Value
COMMON STOCKS (continued)Mexico (continued)Grupo Televisa SAB, ADR 223,657 $ 5,777,060
23,630,766Netherlands - 2.7%ING Groep NV 342,700 6,083,186Royal Dutch Shell PLC, B Shares 220,749 6,161,199Wolters Kluwer NV 217,830 9,516,608
21,760,993Singapore - 1.6%United Overseas Bank, Ltd. 746,934 13,245,053South Korea - 2.5%NAVER Corp. 20,833 13,973,535Samsung Electronics Company, Ltd. 3,185 6,556,359
20,529,894Spain - 1.5%Amadeus IT Group SA 202,172 12,550,951Sweden - 2.9%Getinge AB, B Shares 231,459 4,302,572Investor AB, B Shares 372,267 17,415,453Telefonaktiebolaget LM Ericsson,
B Shares 286,966 1,682,92023,400,945
Switzerland - 7.0%Cie Financiere Richemont SA 95,360 8,524,615Julius Baer Group, Ltd. (A) 256,506 14,343,408Kuehne + Nagel International AG 27,655 5,011,659Novartis AG 96,214 8,111,529Roche Holding AG 40,287 10,235,750UBS Group AG (A) 677,286 11,159,570
57,386,531Taiwan - 2.5%Taiwan Semiconductor
Manufacturing Company, Ltd. 2,894,000 20,829,564Thailand - 1.8%Kasikornbank PCL, NVDR 2,368,800 14,367,389Turkey - 1.1%Akbank Turk AS 3,086,547 9,257,219United Kingdom - 15.6%British American Tobacco PLC 265,391 16,556,354Compass Group PLC 726,904 15,543,911Informa PLC 1,143,428 10,230,504Lloyds Banking Group PLC 13,883,049 11,443,661Next PLC 177,871 9,505,980RELX PLC 980,653 21,442,961Sky PLC 913,189 11,293,844Smith & Nephew PLC 577,575 10,448,426Standard Life Aberdeen PLC 1,179,489 6,554,405Unilever NV 247,551 14,737,733
127,757,779United States - 2.5%Broadcom, Ltd. 82,723 20,851,988TOTAL COMMON STOCKS (Cost$567,619,807) $ 761,246,106
RIGHTS - 0.0%Getinge AB (Expiration Date: 9-15-17;
Strike Price: SEK 127.00) (A) 231,459 85,642TOTAL RIGHTS (Cost $0) $ 85,642
John Hancock Funds IIPortfolio of Investments — August 31, 2017 (showing percentage of total net assets)
89
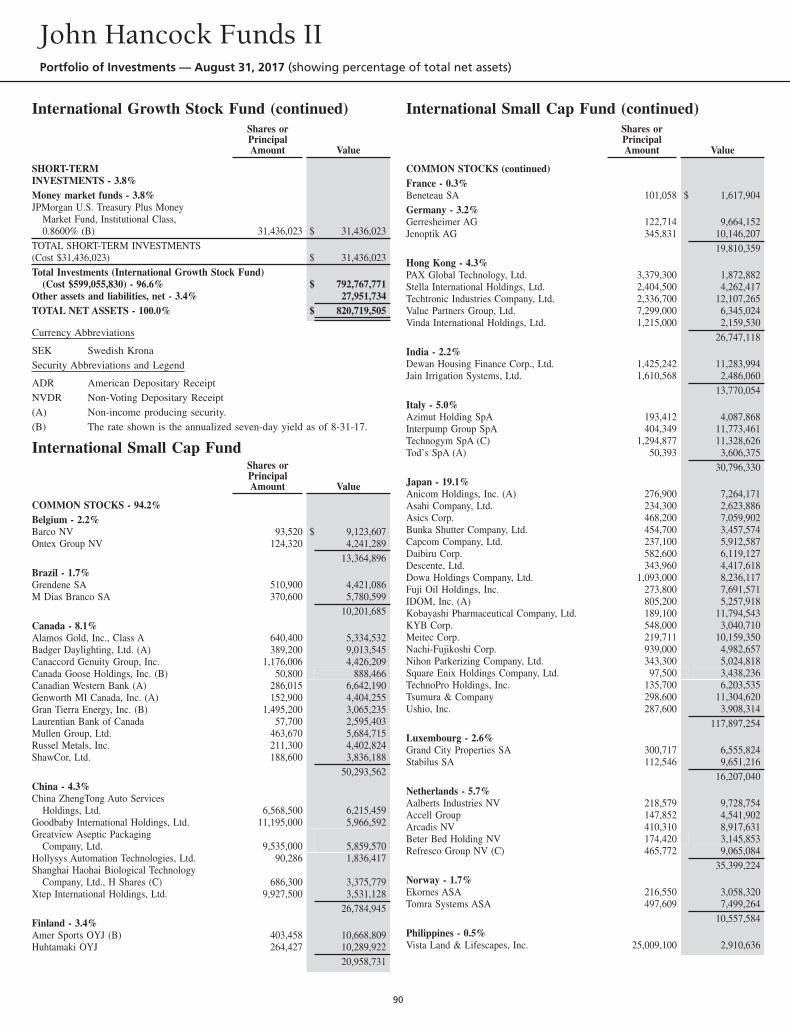
International Growth Stock Fund (continued)Shares orPrincipalAmount Value
SHORT-TERMINVESTMENTS - 3.8%Money market funds - 3.8%JPMorgan U.S. Treasury Plus Money
Market Fund, Institutional Class,0.8600% (B) 31,436,023 $ 31,436,023
TOTAL SHORT-TERM INVESTMENTS(Cost $31,436,023) $ 31,436,023Total Investments (International Growth Stock Fund)
(Cost $599,055,830) - 96.6% $ 792,767,771Other assets and liabilities, net - 3.4% 27,951,734TOTAL NET ASSETS - 100.0% $ 820,719,505
Currency Abbreviations
SEK Swedish KronaSecurity Abbreviations and Legend
ADR American Depositary ReceiptNVDR Non-Voting Depositary Receipt(A) Non-income producing security.(B) The rate shown is the annualized seven-day yield as of 8-31-17.
International Small Cap FundShares orPrincipalAmount Value
COMMON STOCKS - 94.2%Belgium - 2.2%Barco NV 93,520 $ 9,123,607Ontex Group NV 124,320 4,241,289
13,364,896Brazil - 1.7%Grendene SA 510,900 4,421,086M Dias Branco SA 370,600 5,780,599
10,201,685Canada - 8.1%Alamos Gold, Inc., Class A 640,400 5,334,532Badger Daylighting, Ltd. (A) 389,200 9,013,545Canaccord Genuity Group, Inc. 1,176,006 4,426,209Canada Goose Holdings, Inc. (B) 50,800 888,466Canadian Western Bank (A) 286,015 6,642,190Genworth MI Canada, Inc. (A) 152,900 4,404,255Gran Tierra Energy, Inc. (B) 1,495,200 3,065,235Laurentian Bank of Canada 57,700 2,595,403Mullen Group, Ltd. 463,670 5,684,715Russel Metals, Inc. 211,300 4,402,824ShawCor, Ltd. 188,600 3,836,188
50,293,562China - 4.3%China ZhengTong Auto Services
Holdings, Ltd. 6,568,500 6,215,459Goodbaby International Holdings, Ltd. 11,195,000 5,966,592Greatview Aseptic Packaging
Company, Ltd. 9,535,000 5,859,570Hollysys Automation Technologies, Ltd. 90,286 1,836,417Shanghai Haohai Biological Technology
Company, Ltd., H Shares (C) 686,300 3,375,779Xtep International Holdings, Ltd. 9,927,500 3,531,128
26,784,945Finland - 3.4%Amer Sports OYJ (B) 403,458 10,668,809Huhtamaki OYJ 264,427 10,289,922
20,958,731
International Small Cap Fund (continued)Shares orPrincipalAmount Value
COMMON STOCKS (continued)France - 0.3%Beneteau SA 101,058 $ 1,617,904Germany - 3.2%Gerresheimer AG 122,714 9,664,152Jenoptik AG 345,831 10,146,207
19,810,359Hong Kong - 4.3%PAX Global Technology, Ltd. 3,379,300 1,872,882Stella International Holdings, Ltd. 2,404,500 4,262,417Techtronic Industries Company, Ltd. 2,336,700 12,107,265Value Partners Group, Ltd. 7,299,000 6,345,024Vinda International Holdings, Ltd. 1,215,000 2,159,530
26,747,118India - 2.2%Dewan Housing Finance Corp., Ltd. 1,425,242 11,283,994Jain Irrigation Systems, Ltd. 1,610,568 2,486,060
13,770,054Italy - 5.0%Azimut Holding SpA 193,412 4,087,868Interpump Group SpA 404,349 11,773,461Technogym SpA (C) 1,294,877 11,328,626Tod’s SpA (A) 50,393 3,606,375
30,796,330Japan - 19.1%Anicom Holdings, Inc. (A) 276,900 7,264,171Asahi Company, Ltd. 234,300 2,623,886Asics Corp. 468,200 7,059,902Bunka Shutter Company, Ltd. 454,700 3,457,574Capcom Company, Ltd. 237,100 5,912,587Daibiru Corp. 582,600 6,119,127Descente, Ltd. 343,960 4,417,618Dowa Holdings Company, Ltd. 1,093,000 8,236,117Fuji Oil Holdings, Inc. 273,800 7,691,571IDOM, Inc. (A) 805,200 5,257,918Kobayashi Pharmaceutical Company, Ltd. 189,100 11,794,543KYB Corp. 548,000 3,040,710Meitec Corp. 219,711 10,159,350Nachi-Fujikoshi Corp. 939,000 4,982,657Nihon Parkerizing Company, Ltd. 343,300 5,024,818Square Enix Holdings Company, Ltd. 97,500 3,438,236TechnoPro Holdings, Inc. 135,700 6,203,535Tsumura & Company 298,600 11,304,620Ushio, Inc. 287,600 3,908,314
117,897,254Luxembourg - 2.6%Grand City Properties SA 300,717 6,555,824Stabilus SA 112,546 9,651,216
16,207,040Netherlands - 5.7%Aalberts Industries NV 218,579 9,728,754Accell Group 147,852 4,541,902Arcadis NV 410,310 8,917,631Beter Bed Holding NV 174,420 3,145,853Refresco Group NV (C) 465,772 9,065,084
35,399,224Norway - 1.7%Ekornes ASA 216,550 3,058,320Tomra Systems ASA 497,609 7,499,264
10,557,584Philippines - 0.5%Vista Land & Lifescapes, Inc. 25,009,100 2,910,636
John Hancock Funds IIPortfolio of Investments — August 31, 2017 (showing percentage of total net assets)
90
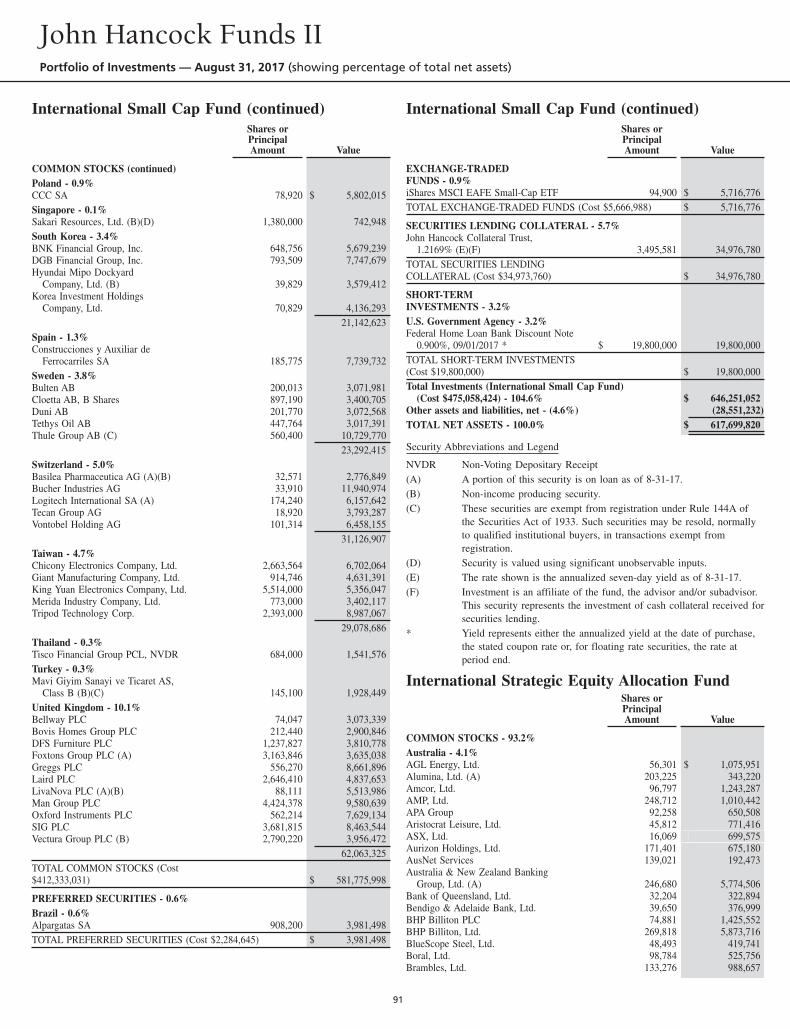
International Small Cap Fund (continued)Shares orPrincipalAmount Value
COMMON STOCKS (continued)Poland - 0.9%CCC SA 78,920 $ 5,802,015Singapore - 0.1%Sakari Resources, Ltd. (B)(D) 1,380,000 742,948South Korea - 3.4%BNK Financial Group, Inc. 648,756 5,679,239DGB Financial Group, Inc. 793,509 7,747,679Hyundai Mipo Dockyard
Company, Ltd. (B) 39,829 3,579,412Korea Investment Holdings
Company, Ltd. 70,829 4,136,29321,142,623
Spain - 1.3%Construcciones y Auxiliar de
Ferrocarriles SA 185,775 7,739,732Sweden - 3.8%Bulten AB 200,013 3,071,981Cloetta AB, B Shares 897,190 3,400,705Duni AB 201,770 3,072,568Tethys Oil AB 447,764 3,017,391Thule Group AB (C) 560,400 10,729,770
23,292,415Switzerland - 5.0%Basilea Pharmaceutica AG (A)(B) 32,571 2,776,849Bucher Industries AG 33,910 11,940,974Logitech International SA (A) 174,240 6,157,642Tecan Group AG 18,920 3,793,287Vontobel Holding AG 101,314 6,458,155
31,126,907Taiwan - 4.7%Chicony Electronics Company, Ltd. 2,663,564 6,702,064Giant Manufacturing Company, Ltd. 914,746 4,631,391King Yuan Electronics Company, Ltd. 5,514,000 5,356,047Merida Industry Company, Ltd. 773,000 3,402,117Tripod Technology Corp. 2,393,000 8,987,067
29,078,686Thailand - 0.3%Tisco Financial Group PCL, NVDR 684,000 1,541,576Turkey - 0.3%Mavi Giyim Sanayi ve Ticaret AS,
Class B (B)(C) 145,100 1,928,449United Kingdom - 10.1%Bellway PLC 74,047 3,073,339Bovis Homes Group PLC 212,440 2,900,846DFS Furniture PLC 1,237,827 3,810,778Foxtons Group PLC (A) 3,163,846 3,635,038Greggs PLC 556,270 8,661,896Laird PLC 2,646,410 4,837,653LivaNova PLC (A)(B) 88,111 5,513,986Man Group PLC 4,424,378 9,580,639Oxford Instruments PLC 562,214 7,629,134SIG PLC 3,681,815 8,463,544Vectura Group PLC (B) 2,790,220 3,956,472
62,063,325TOTAL COMMON STOCKS (Cost$412,333,031) $ 581,775,998
PREFERRED SECURITIES - 0.6%Brazil - 0.6%Alpargatas SA 908,200 3,981,498TOTAL PREFERRED SECURITIES (Cost $2,284,645) $ 3,981,498
International Small Cap Fund (continued)Shares orPrincipalAmount Value
EXCHANGE-TRADEDFUNDS - 0.9%iShares MSCI EAFE Small-Cap ETF 94,900 $ 5,716,776TOTAL EXCHANGE-TRADED FUNDS (Cost $5,666,988) $ 5,716,776
SECURITIES LENDING COLLATERAL - 5.7%John Hancock Collateral Trust,
1.2169% (E)(F) 3,495,581 34,976,780TOTAL SECURITIES LENDINGCOLLATERAL (Cost $34,973,760) $ 34,976,780
SHORT-TERMINVESTMENTS - 3.2%U.S. Government Agency - 3.2%Federal Home Loan Bank Discount Note
0.900%, 09/01/2017 * $ 19,800,000 19,800,000TOTAL SHORT-TERM INVESTMENTS(Cost $19,800,000) $ 19,800,000Total Investments (International Small Cap Fund)
(Cost $475,058,424) - 104.6% $ 646,251,052Other assets and liabilities, net - (4.6%) (28,551,232)TOTAL NET ASSETS - 100.0% $ 617,699,820
Security Abbreviations and Legend
NVDR Non-Voting Depositary Receipt(A) A portion of this security is on loan as of 8-31-17.(B) Non-income producing security.(C) These securities are exempt from registration under Rule 144A of
the Securities Act of 1933. Such securities may be resold, normallyto qualified institutional buyers, in transactions exempt fromregistration.
(D) Security is valued using significant unobservable inputs.(E) The rate shown is the annualized seven-day yield as of 8-31-17.(F) Investment is an affiliate of the fund, the advisor and/or subadvisor.
This security represents the investment of cash collateral received forsecurities lending.
* Yield represents either the annualized yield at the date of purchase,the stated coupon rate or, for floating rate securities, the rate atperiod end.
International Strategic Equity Allocation FundShares orPrincipalAmount Value
COMMON STOCKS - 93.2%Australia - 4.1%AGL Energy, Ltd. 56,301 $ 1,075,951Alumina, Ltd. (A) 203,225 343,220Amcor, Ltd. 96,797 1,243,287AMP, Ltd. 248,712 1,010,442APA Group 92,258 650,508Aristocrat Leisure, Ltd. 45,812 771,416ASX, Ltd. 16,069 699,575Aurizon Holdings, Ltd. 171,401 675,180AusNet Services 139,021 192,473Australia & New Zealand Banking
Group, Ltd. (A) 246,680 5,774,506Bank of Queensland, Ltd. 32,204 322,894Bendigo & Adelaide Bank, Ltd. 39,650 376,999BHP Billiton PLC 74,881 1,425,552BHP Billiton, Ltd. 269,818 5,873,716BlueScope Steel, Ltd. 48,493 419,741Boral, Ltd. 98,784 525,756Brambles, Ltd. 133,276 988,657
John Hancock Funds IIPortfolio of Investments — August 31, 2017 (showing percentage of total net assets)
91
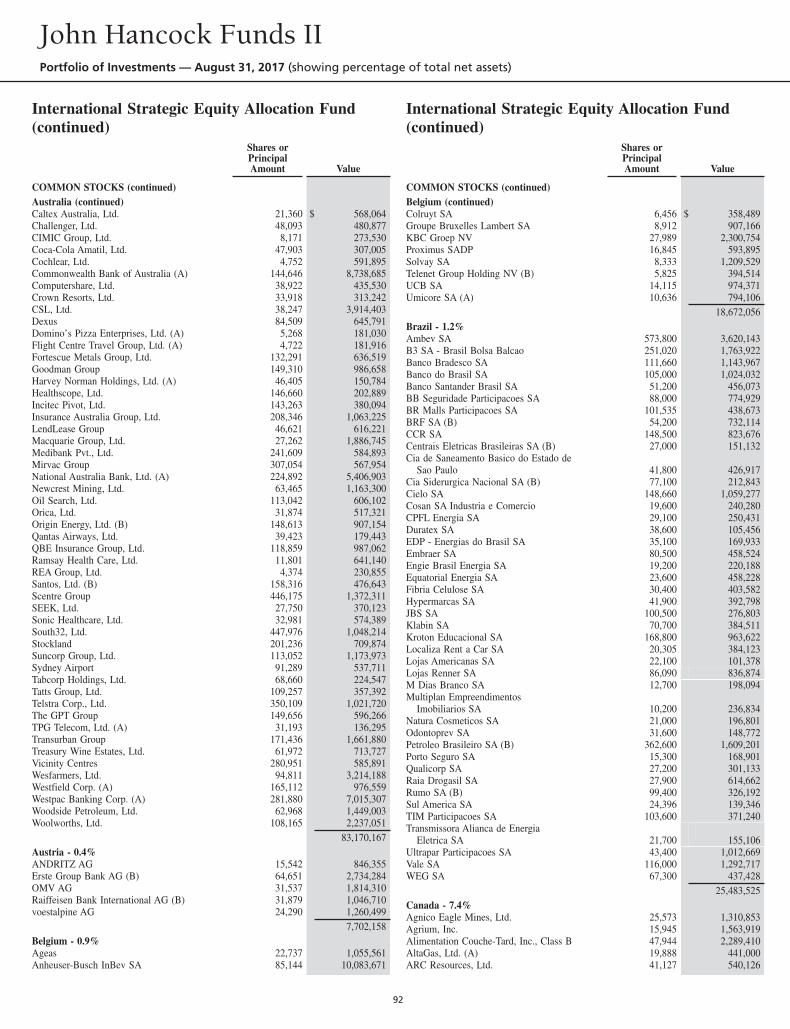
International Strategic Equity Allocation Fund(continued)
Shares orPrincipalAmount Value
COMMON STOCKS (continued)Australia (continued)Caltex Australia, Ltd. 21,360 $ 568,064Challenger, Ltd. 48,093 480,877CIMIC Group, Ltd. 8,171 273,530Coca-Cola Amatil, Ltd. 47,903 307,005Cochlear, Ltd. 4,752 591,895Commonwealth Bank of Australia (A) 144,646 8,738,685Computershare, Ltd. 38,922 435,530Crown Resorts, Ltd. 33,918 313,242CSL, Ltd. 38,247 3,914,403Dexus 84,509 645,791Domino’s Pizza Enterprises, Ltd. (A) 5,268 181,030Flight Centre Travel Group, Ltd. (A) 4,722 181,916Fortescue Metals Group, Ltd. 132,291 636,519Goodman Group 149,310 986,658Harvey Norman Holdings, Ltd. (A) 46,405 150,784Healthscope, Ltd. 146,660 202,889Incitec Pivot, Ltd. 143,263 380,094Insurance Australia Group, Ltd. 208,346 1,063,225LendLease Group 46,621 616,221Macquarie Group, Ltd. 27,262 1,886,745Medibank Pvt., Ltd. 241,609 584,893Mirvac Group 307,054 567,954National Australia Bank, Ltd. (A) 224,892 5,406,903Newcrest Mining, Ltd. 63,465 1,163,300Oil Search, Ltd. 113,042 606,102Orica, Ltd. 31,874 517,321Origin Energy, Ltd. (B) 148,613 907,154Qantas Airways, Ltd. 39,423 179,443QBE Insurance Group, Ltd. 118,859 987,062Ramsay Health Care, Ltd. 11,801 641,140REA Group, Ltd. 4,374 230,855Santos, Ltd. (B) 158,316 476,643Scentre Group 446,175 1,372,311SEEK, Ltd. 27,750 370,123Sonic Healthcare, Ltd. 32,981 574,389South32, Ltd. 447,976 1,048,214Stockland 201,236 709,874Suncorp Group, Ltd. 113,052 1,173,973Sydney Airport 91,289 537,711Tabcorp Holdings, Ltd. 68,660 224,547Tatts Group, Ltd. 109,257 357,392Telstra Corp., Ltd. 350,109 1,021,720The GPT Group 149,656 596,266TPG Telecom, Ltd. (A) 31,193 136,295Transurban Group 171,436 1,661,880Treasury Wine Estates, Ltd. 61,972 713,727Vicinity Centres 280,951 585,891Wesfarmers, Ltd. 94,811 3,214,188Westfield Corp. (A) 165,112 976,559Westpac Banking Corp. (A) 281,880 7,015,307Woodside Petroleum, Ltd. 62,968 1,449,003Woolworths, Ltd. 108,165 2,237,051
83,170,167Austria - 0.4%ANDRITZ AG 15,542 846,355Erste Group Bank AG (B) 64,651 2,734,284OMV AG 31,537 1,814,310Raiffeisen Bank International AG (B) 31,879 1,046,710voestalpine AG 24,290 1,260,499
7,702,158Belgium - 0.9%Ageas 22,737 1,055,561Anheuser-Busch InBev SA 85,144 10,083,671
International Strategic Equity Allocation Fund(continued)
Shares orPrincipalAmount Value
COMMON STOCKS (continued)Belgium (continued)Colruyt SA 6,456 $ 358,489Groupe Bruxelles Lambert SA 8,912 907,166KBC Groep NV 27,989 2,300,754Proximus SADP 16,845 593,895Solvay SA 8,333 1,209,529Telenet Group Holding NV (B) 5,825 394,514UCB SA 14,115 974,371Umicore SA (A) 10,636 794,106
18,672,056Brazil - 1.2%Ambev SA 573,800 3,620,143B3 SA - Brasil Bolsa Balcao 251,020 1,763,922Banco Bradesco SA 111,660 1,143,967Banco do Brasil SA 105,000 1,024,032Banco Santander Brasil SA 51,200 456,073BB Seguridade Participacoes SA 88,000 774,929BR Malls Participacoes SA 101,535 438,673BRF SA (B) 54,200 732,114CCR SA 148,500 823,676Centrais Eletricas Brasileiras SA (B) 27,000 151,132Cia de Saneamento Basico do Estado de
Sao Paulo 41,800 426,917Cia Siderurgica Nacional SA (B) 77,100 212,843Cielo SA 148,660 1,059,277Cosan SA Industria e Comercio 19,600 240,280CPFL Energia SA 29,100 250,431Duratex SA 38,600 105,456EDP - Energias do Brasil SA 35,100 169,933Embraer SA 80,500 458,524Engie Brasil Energia SA 19,200 220,188Equatorial Energia SA 23,600 458,228Fibria Celulose SA 30,400 403,582Hypermarcas SA 41,900 392,798JBS SA 100,500 276,803Klabin SA 70,700 384,511Kroton Educacional SA 168,800 963,622Localiza Rent a Car SA 20,305 384,123Lojas Americanas SA 22,100 101,378Lojas Renner SA 86,090 836,874M Dias Branco SA 12,700 198,094Multiplan Empreendimentos
Imobiliarios SA 10,200 236,834Natura Cosmeticos SA 21,000 196,801Odontoprev SA 31,600 148,772Petroleo Brasileiro SA (B) 362,600 1,609,201Porto Seguro SA 15,300 168,901Qualicorp SA 27,200 301,133Raia Drogasil SA 27,900 614,662Rumo SA (B) 99,400 326,192Sul America SA 24,396 139,346TIM Participacoes SA 103,600 371,240Transmissora Alianca de Energia
Eletrica SA 21,700 155,106Ultrapar Participacoes SA 43,400 1,012,669Vale SA 116,000 1,292,717WEG SA 67,300 437,428
25,483,525Canada - 7.4%Agnico Eagle Mines, Ltd. 25,573 1,310,853Agrium, Inc. 15,945 1,563,919Alimentation Couche-Tard, Inc., Class B 47,944 2,289,410AltaGas, Ltd. (A) 19,888 441,000ARC Resources, Ltd. 41,127 540,126
John Hancock Funds IIPortfolio of Investments — August 31, 2017 (showing percentage of total net assets)
92
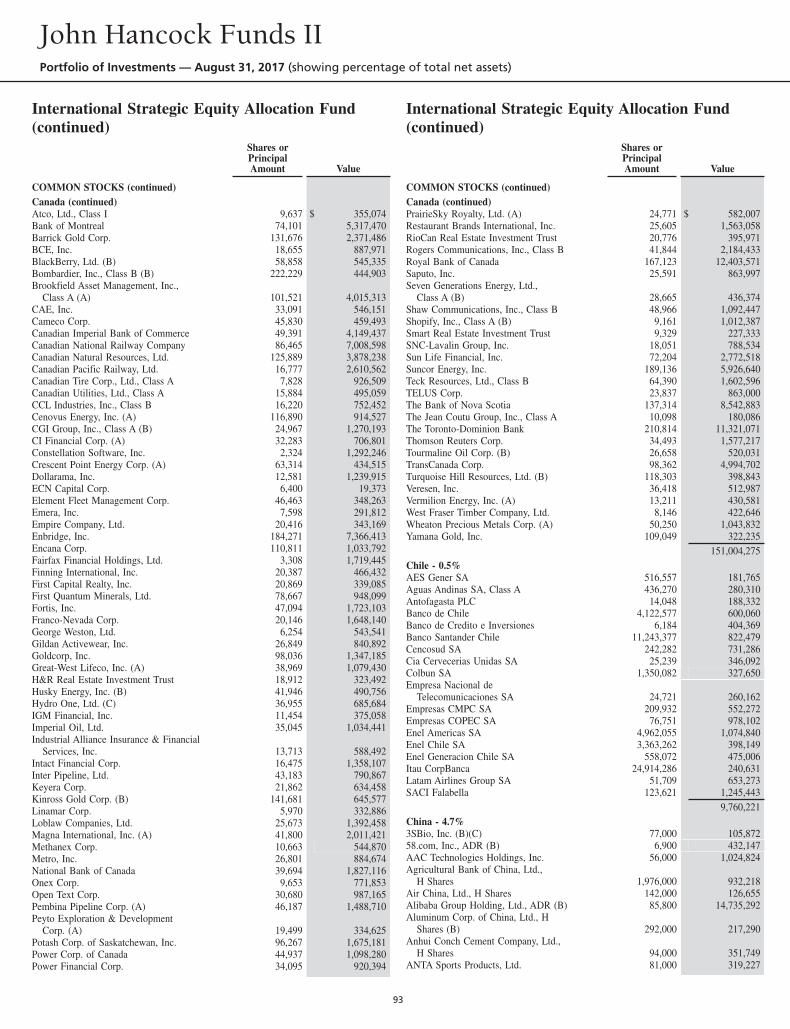
International Strategic Equity Allocation Fund(continued)
Shares orPrincipalAmount Value
COMMON STOCKS (continued)Canada (continued)Atco, Ltd., Class I 9,637 $ 355,074Bank of Montreal 74,101 5,317,470Barrick Gold Corp. 131,676 2,371,486BCE, Inc. 18,655 887,971BlackBerry, Ltd. (B) 58,858 545,335Bombardier, Inc., Class B (B) 222,229 444,903Brookfield Asset Management, Inc.,
Class A (A) 101,521 4,015,313CAE, Inc. 33,091 546,151Cameco Corp. 45,830 459,493Canadian Imperial Bank of Commerce 49,391 4,149,437Canadian National Railway Company 86,465 7,008,598Canadian Natural Resources, Ltd. 125,889 3,878,238Canadian Pacific Railway, Ltd. 16,777 2,610,562Canadian Tire Corp., Ltd., Class A 7,828 926,509Canadian Utilities, Ltd., Class A 15,884 495,059CCL Industries, Inc., Class B 16,220 752,452Cenovus Energy, Inc. (A) 116,890 914,527CGI Group, Inc., Class A (B) 24,967 1,270,193CI Financial Corp. (A) 32,283 706,801Constellation Software, Inc. 2,324 1,292,246Crescent Point Energy Corp. (A) 63,314 434,515Dollarama, Inc. 12,581 1,239,915ECN Capital Corp. 6,400 19,373Element Fleet Management Corp. 46,463 348,263Emera, Inc. 7,598 291,812Empire Company, Ltd. 20,416 343,169Enbridge, Inc. 184,271 7,366,413Encana Corp. 110,811 1,033,792Fairfax Financial Holdings, Ltd. 3,308 1,719,445Finning International, Inc. 20,387 466,432First Capital Realty, Inc. 20,869 339,085First Quantum Minerals, Ltd. 78,667 948,099Fortis, Inc. 47,094 1,723,103Franco-Nevada Corp. 20,146 1,648,140George Weston, Ltd. 6,254 543,541Gildan Activewear, Inc. 26,849 840,892Goldcorp, Inc. 98,036 1,347,185Great-West Lifeco, Inc. (A) 38,969 1,079,430H&R Real Estate Investment Trust 18,912 323,492Husky Energy, Inc. (B) 41,946 490,756Hydro One, Ltd. (C) 36,955 685,684IGM Financial, Inc. 11,454 375,058Imperial Oil, Ltd. 35,045 1,034,441Industrial Alliance Insurance & Financial
Services, Inc. 13,713 588,492Intact Financial Corp. 16,475 1,358,107Inter Pipeline, Ltd. 43,183 790,867Keyera Corp. 21,862 634,458Kinross Gold Corp. (B) 141,681 645,577Linamar Corp. 5,970 332,886Loblaw Companies, Ltd. 25,673 1,392,458Magna International, Inc. (A) 41,800 2,011,421Methanex Corp. 10,663 544,870Metro, Inc. 26,801 884,674National Bank of Canada 39,694 1,827,116Onex Corp. 9,653 771,853Open Text Corp. 30,680 987,165Pembina Pipeline Corp. (A) 46,187 1,488,710Peyto Exploration & Development
Corp. (A) 19,499 334,625Potash Corp. of Saskatchewan, Inc. 96,267 1,675,181Power Corp. of Canada 44,937 1,098,280Power Financial Corp. 34,095 920,394
International Strategic Equity Allocation Fund(continued)
Shares orPrincipalAmount Value
COMMON STOCKS (continued)Canada (continued)PrairieSky Royalty, Ltd. (A) 24,771 $ 582,007Restaurant Brands International, Inc. 25,605 1,563,058RioCan Real Estate Investment Trust 20,776 395,971Rogers Communications, Inc., Class B 41,844 2,184,433Royal Bank of Canada 167,123 12,403,571Saputo, Inc. 25,591 863,997Seven Generations Energy, Ltd.,
Class A (B) 28,665 436,374Shaw Communications, Inc., Class B 48,966 1,092,447Shopify, Inc., Class A (B) 9,161 1,012,387Smart Real Estate Investment Trust 9,329 227,333SNC-Lavalin Group, Inc. 18,051 788,534Sun Life Financial, Inc. 72,204 2,772,518Suncor Energy, Inc. 189,136 5,926,640Teck Resources, Ltd., Class B 64,390 1,602,596TELUS Corp. 23,837 863,000The Bank of Nova Scotia 137,314 8,542,883The Jean Coutu Group, Inc., Class A 10,098 180,086The Toronto-Dominion Bank 210,814 11,321,071Thomson Reuters Corp. 34,493 1,577,217Tourmaline Oil Corp. (B) 26,658 520,031TransCanada Corp. 98,362 4,994,702Turquoise Hill Resources, Ltd. (B) 118,303 398,843Veresen, Inc. 36,418 512,987Vermilion Energy, Inc. (A) 13,211 430,581West Fraser Timber Company, Ltd. 8,146 422,646Wheaton Precious Metals Corp. (A) 50,250 1,043,832Yamana Gold, Inc. 109,049 322,235
151,004,275Chile - 0.5%AES Gener SA 516,557 181,765Aguas Andinas SA, Class A 436,270 280,310Antofagasta PLC 14,048 188,332Banco de Chile 4,122,577 600,060Banco de Credito e Inversiones 6,184 404,369Banco Santander Chile 11,243,377 822,479Cencosud SA 242,282 731,286Cia Cervecerias Unidas SA 25,239 346,092Colbun SA 1,350,082 327,650Empresa Nacional de
Telecomunicaciones SA 24,721 260,162Empresas CMPC SA 209,932 552,272Empresas COPEC SA 76,751 978,102Enel Americas SA 4,962,055 1,074,840Enel Chile SA 3,363,262 398,149Enel Generacion Chile SA 558,072 475,006Itau CorpBanca 24,914,286 240,631Latam Airlines Group SA 51,709 653,273SACI Falabella 123,621 1,245,443
9,760,221China - 4.7%3SBio, Inc. (B)(C) 77,000 105,87258.com, Inc., ADR (B) 6,900 432,147AAC Technologies Holdings, Inc. 56,000 1,024,824Agricultural Bank of China, Ltd.,
H Shares 1,976,000 932,218Air China, Ltd., H Shares 142,000 126,655Alibaba Group Holding, Ltd., ADR (B) 85,800 14,735,292Aluminum Corp. of China, Ltd., H
Shares (B) 292,000 217,290Anhui Conch Cement Company, Ltd.,
H Shares 94,000 351,749ANTA Sports Products, Ltd. 81,000 319,227
John Hancock Funds IIPortfolio of Investments — August 31, 2017 (showing percentage of total net assets)
93
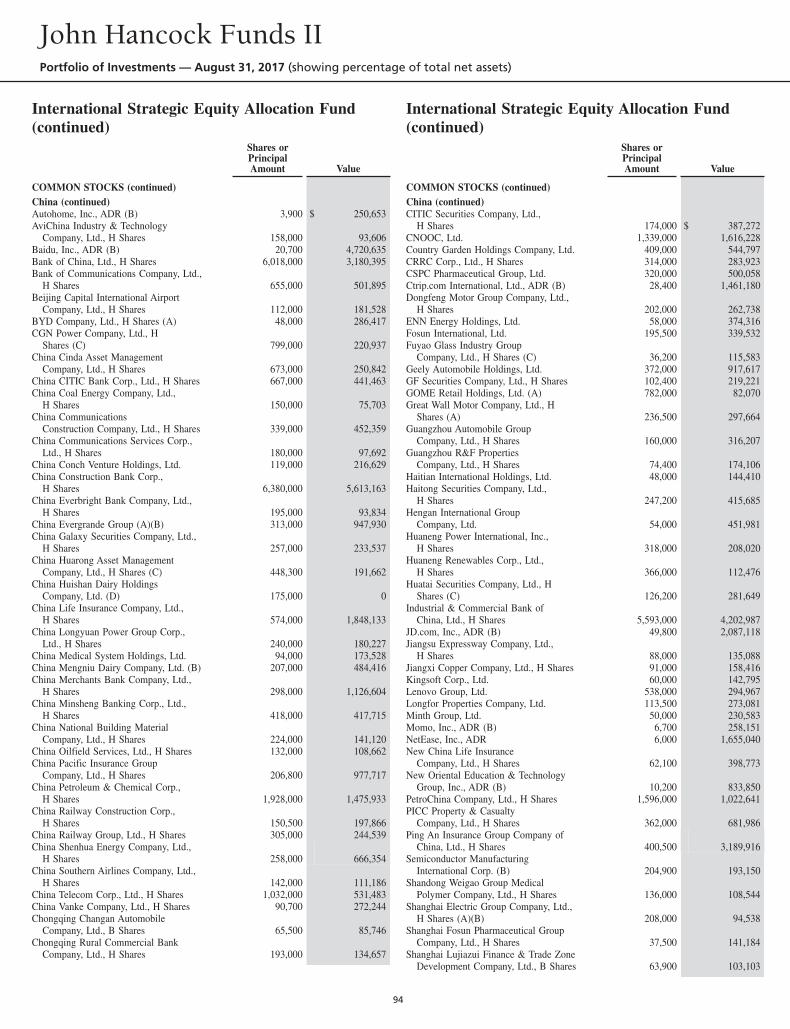
International Strategic Equity Allocation Fund(continued)
Shares orPrincipalAmount Value
COMMON STOCKS (continued)China (continued)Autohome, Inc., ADR (B) 3,900 $ 250,653AviChina Industry & Technology
Company, Ltd., H Shares 158,000 93,606Baidu, Inc., ADR (B) 20,700 4,720,635Bank of China, Ltd., H Shares 6,018,000 3,180,395Bank of Communications Company, Ltd.,
H Shares 655,000 501,895Beijing Capital International Airport
Company, Ltd., H Shares 112,000 181,528BYD Company, Ltd., H Shares (A) 48,000 286,417CGN Power Company, Ltd., H
Shares (C) 799,000 220,937China Cinda Asset Management
Company, Ltd., H Shares 673,000 250,842China CITIC Bank Corp., Ltd., H Shares 667,000 441,463China Coal Energy Company, Ltd.,
H Shares 150,000 75,703China Communications
Construction Company, Ltd., H Shares 339,000 452,359China Communications Services Corp.,
Ltd., H Shares 180,000 97,692China Conch Venture Holdings, Ltd. 119,000 216,629China Construction Bank Corp.,
H Shares 6,380,000 5,613,163China Everbright Bank Company, Ltd.,
H Shares 195,000 93,834China Evergrande Group (A)(B) 313,000 947,930China Galaxy Securities Company, Ltd.,
H Shares 257,000 233,537China Huarong Asset Management
Company, Ltd., H Shares (C) 448,300 191,662China Huishan Dairy Holdings
Company, Ltd. (D) 175,000 0China Life Insurance Company, Ltd.,
H Shares 574,000 1,848,133China Longyuan Power Group Corp.,
Ltd., H Shares 240,000 180,227China Medical System Holdings, Ltd. 94,000 173,528China Mengniu Dairy Company, Ltd. (B) 207,000 484,416China Merchants Bank Company, Ltd.,
H Shares 298,000 1,126,604China Minsheng Banking Corp., Ltd.,
H Shares 418,000 417,715China National Building Material
Company, Ltd., H Shares 224,000 141,120China Oilfield Services, Ltd., H Shares 132,000 108,662China Pacific Insurance Group
Company, Ltd., H Shares 206,800 977,717China Petroleum & Chemical Corp.,
H Shares 1,928,000 1,475,933China Railway Construction Corp.,
H Shares 150,500 197,866China Railway Group, Ltd., H Shares 305,000 244,539China Shenhua Energy Company, Ltd.,
H Shares 258,000 666,354China Southern Airlines Company, Ltd.,
H Shares 142,000 111,186China Telecom Corp., Ltd., H Shares 1,032,000 531,483China Vanke Company, Ltd., H Shares 90,700 272,244Chongqing Changan Automobile
Company, Ltd., B Shares 65,500 85,746Chongqing Rural Commercial Bank
Company, Ltd., H Shares 193,000 134,657
International Strategic Equity Allocation Fund(continued)
Shares orPrincipalAmount Value
COMMON STOCKS (continued)China (continued)CITIC Securities Company, Ltd.,
H Shares 174,000 $ 387,272CNOOC, Ltd. 1,339,000 1,616,228Country Garden Holdings Company, Ltd. 409,000 544,797CRRC Corp., Ltd., H Shares 314,000 283,923CSPC Pharmaceutical Group, Ltd. 320,000 500,058Ctrip.com International, Ltd., ADR (B) 28,400 1,461,180Dongfeng Motor Group Company, Ltd.,
H Shares 202,000 262,738ENN Energy Holdings, Ltd. 58,000 374,316Fosun International, Ltd. 195,500 339,532Fuyao Glass Industry Group
Company, Ltd., H Shares (C) 36,200 115,583Geely Automobile Holdings, Ltd. 372,000 917,617GF Securities Company, Ltd., H Shares 102,400 219,221GOME Retail Holdings, Ltd. (A) 782,000 82,070Great Wall Motor Company, Ltd., H
Shares (A) 236,500 297,664Guangzhou Automobile Group
Company, Ltd., H Shares 160,000 316,207Guangzhou R&F Properties
Company, Ltd., H Shares 74,400 174,106Haitian International Holdings, Ltd. 48,000 144,410Haitong Securities Company, Ltd.,
H Shares 247,200 415,685Hengan International Group
Company, Ltd. 54,000 451,981Huaneng Power International, Inc.,
H Shares 318,000 208,020Huaneng Renewables Corp., Ltd.,
H Shares 366,000 112,476Huatai Securities Company, Ltd., H
Shares (C) 126,200 281,649Industrial & Commercial Bank of
China, Ltd., H Shares 5,593,000 4,202,987JD.com, Inc., ADR (B) 49,800 2,087,118Jiangsu Expressway Company, Ltd.,
H Shares 88,000 135,088Jiangxi Copper Company, Ltd., H Shares 91,000 158,416Kingsoft Corp., Ltd. 60,000 142,795Lenovo Group, Ltd. 538,000 294,967Longfor Properties Company, Ltd. 113,500 273,081Minth Group, Ltd. 50,000 230,583Momo, Inc., ADR (B) 6,700 258,151NetEase, Inc., ADR 6,000 1,655,040New China Life Insurance
Company, Ltd., H Shares 62,100 398,773New Oriental Education & Technology
Group, Inc., ADR (B) 10,200 833,850PetroChina Company, Ltd., H Shares 1,596,000 1,022,641PICC Property & Casualty
Company, Ltd., H Shares 362,000 681,986Ping An Insurance Group Company of
China, Ltd., H Shares 400,500 3,189,916Semiconductor Manufacturing
International Corp. (B) 204,900 193,150Shandong Weigao Group Medical
Polymer Company, Ltd., H Shares 136,000 108,544Shanghai Electric Group Company, Ltd.,
H Shares (A)(B) 208,000 94,538Shanghai Fosun Pharmaceutical Group
Company, Ltd., H Shares 37,500 141,184Shanghai Lujiazui Finance & Trade Zone
Development Company, Ltd., B Shares 63,900 103,103
John Hancock Funds IIPortfolio of Investments — August 31, 2017 (showing percentage of total net assets)
94
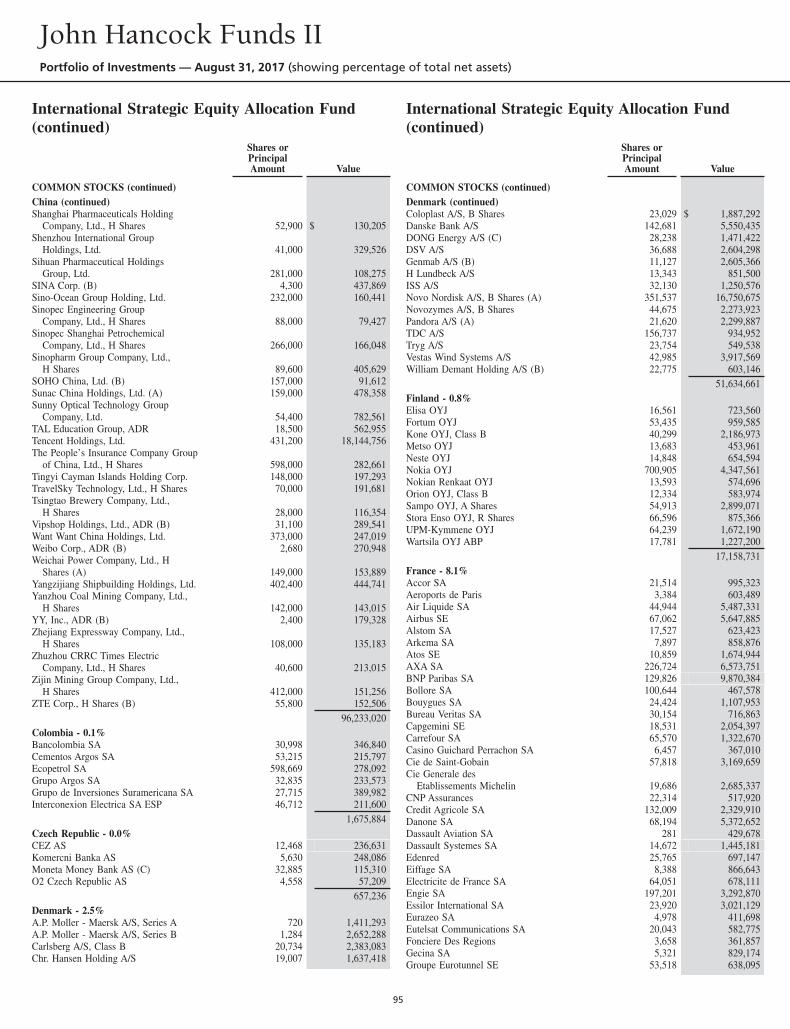
International Strategic Equity Allocation Fund(continued)
Shares orPrincipalAmount Value
COMMON STOCKS (continued)China (continued)Shanghai Pharmaceuticals Holding
Company, Ltd., H Shares 52,900 $ 130,205Shenzhou International Group
Holdings, Ltd. 41,000 329,526Sihuan Pharmaceutical Holdings
Group, Ltd. 281,000 108,275SINA Corp. (B) 4,300 437,869Sino-Ocean Group Holding, Ltd. 232,000 160,441Sinopec Engineering Group
Company, Ltd., H Shares 88,000 79,427Sinopec Shanghai Petrochemical
Company, Ltd., H Shares 266,000 166,048Sinopharm Group Company, Ltd.,
H Shares 89,600 405,629SOHO China, Ltd. (B) 157,000 91,612Sunac China Holdings, Ltd. (A) 159,000 478,358Sunny Optical Technology Group
Company, Ltd. 54,400 782,561TAL Education Group, ADR 18,500 562,955Tencent Holdings, Ltd. 431,200 18,144,756The People’s Insurance Company Group
of China, Ltd., H Shares 598,000 282,661Tingyi Cayman Islands Holding Corp. 148,000 197,293TravelSky Technology, Ltd., H Shares 70,000 191,681Tsingtao Brewery Company, Ltd.,
H Shares 28,000 116,354Vipshop Holdings, Ltd., ADR (B) 31,100 289,541Want Want China Holdings, Ltd. 373,000 247,019Weibo Corp., ADR (B) 2,680 270,948Weichai Power Company, Ltd., H
Shares (A) 149,000 153,889Yangzijiang Shipbuilding Holdings, Ltd. 402,400 444,741Yanzhou Coal Mining Company, Ltd.,
H Shares 142,000 143,015YY, Inc., ADR (B) 2,400 179,328Zhejiang Expressway Company, Ltd.,
H Shares 108,000 135,183Zhuzhou CRRC Times Electric
Company, Ltd., H Shares 40,600 213,015Zijin Mining Group Company, Ltd.,
H Shares 412,000 151,256ZTE Corp., H Shares (B) 55,800 152,506
96,233,020Colombia - 0.1%Bancolombia SA 30,998 346,840Cementos Argos SA 53,215 215,797Ecopetrol SA 598,669 278,092Grupo Argos SA 32,835 233,573Grupo de Inversiones Suramericana SA 27,715 389,982Interconexion Electrica SA ESP 46,712 211,600
1,675,884Czech Republic - 0.0%CEZ AS 12,468 236,631Komercni Banka AS 5,630 248,086Moneta Money Bank AS (C) 32,885 115,310O2 Czech Republic AS 4,558 57,209
657,236Denmark - 2.5%A.P. Moller - Maersk A/S, Series A 720 1,411,293A.P. Moller - Maersk A/S, Series B 1,284 2,652,288Carlsberg A/S, Class B 20,734 2,383,083Chr. Hansen Holding A/S 19,007 1,637,418
International Strategic Equity Allocation Fund(continued)
Shares orPrincipalAmount Value
COMMON STOCKS (continued)Denmark (continued)Coloplast A/S, B Shares 23,029 $ 1,887,292Danske Bank A/S 142,681 5,550,435DONG Energy A/S (C) 28,238 1,471,422DSV A/S 36,688 2,604,298Genmab A/S (B) 11,127 2,605,366H Lundbeck A/S 13,343 851,500ISS A/S 32,130 1,250,576Novo Nordisk A/S, B Shares (A) 351,537 16,750,675Novozymes A/S, B Shares 44,675 2,273,923Pandora A/S (A) 21,620 2,299,887TDC A/S 156,737 934,952Tryg A/S 23,754 549,538Vestas Wind Systems A/S 42,985 3,917,569William Demant Holding A/S (B) 22,775 603,146
51,634,661Finland - 0.8%Elisa OYJ 16,561 723,560Fortum OYJ 53,435 959,585Kone OYJ, Class B 40,299 2,186,973Metso OYJ 13,683 453,961Neste OYJ 14,848 654,594Nokia OYJ 700,905 4,347,561Nokian Renkaat OYJ 13,593 574,696Orion OYJ, Class B 12,334 583,974Sampo OYJ, A Shares 54,913 2,899,071Stora Enso OYJ, R Shares 66,596 875,366UPM-Kymmene OYJ 64,239 1,672,190Wartsila OYJ ABP 17,781 1,227,200
17,158,731France - 8.1%Accor SA 21,514 995,323Aeroports de Paris 3,384 603,489Air Liquide SA 44,944 5,487,331Airbus SE 67,062 5,647,885Alstom SA 17,527 623,423Arkema SA 7,897 858,876Atos SE 10,859 1,674,944AXA SA 226,724 6,573,751BNP Paribas SA 129,826 9,870,384Bollore SA 100,644 467,578Bouygues SA 24,424 1,107,953Bureau Veritas SA 30,154 716,863Capgemini SE 18,531 2,054,397Carrefour SA 65,570 1,322,670Casino Guichard Perrachon SA 6,457 367,010Cie de Saint-Gobain 57,818 3,169,659Cie Generale des
Etablissements Michelin 19,686 2,685,337CNP Assurances 22,314 517,920Credit Agricole SA 132,009 2,329,910Danone SA 68,194 5,372,652Dassault Aviation SA 281 429,678Dassault Systemes SA 14,672 1,445,181Edenred 25,765 697,147Eiffage SA 8,388 866,643Electricite de France SA 64,051 678,111Engie SA 197,201 3,292,870Essilor International SA 23,920 3,021,129Eurazeo SA 4,978 411,698Eutelsat Communications SA 20,043 582,775Fonciere Des Regions 3,658 361,857Gecina SA 5,321 829,174Groupe Eurotunnel SE 53,518 638,095
John Hancock Funds IIPortfolio of Investments — August 31, 2017 (showing percentage of total net assets)
95
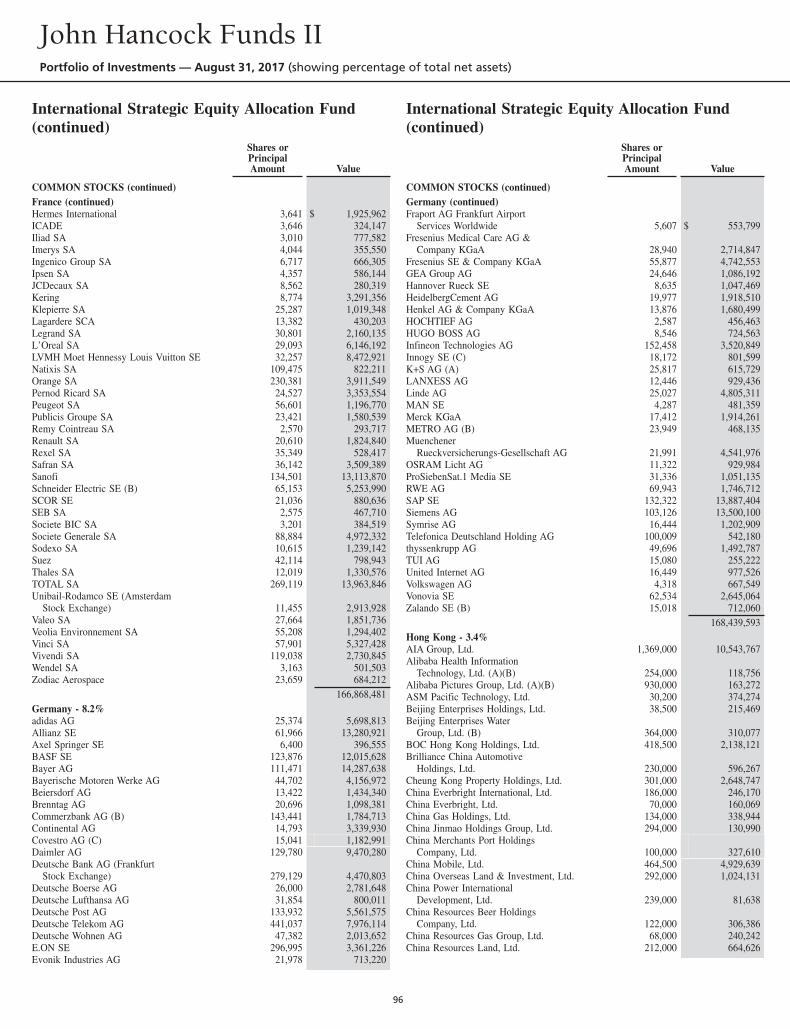
International Strategic Equity Allocation Fund(continued)
Shares orPrincipalAmount Value
COMMON STOCKS (continued)France (continued)Hermes International 3,641 $ 1,925,962ICADE 3,646 324,147Iliad SA 3,010 777,582Imerys SA 4,044 355,550Ingenico Group SA 6,717 666,305Ipsen SA 4,357 586,144JCDecaux SA 8,562 280,319Kering 8,774 3,291,356Klepierre SA 25,287 1,019,348Lagardere SCA 13,382 430,203Legrand SA 30,801 2,160,135L’Oreal SA 29,093 6,146,192LVMH Moet Hennessy Louis Vuitton SE 32,257 8,472,921Natixis SA 109,475 822,211Orange SA 230,381 3,911,549Pernod Ricard SA 24,527 3,353,554Peugeot SA 56,601 1,196,770Publicis Groupe SA 23,421 1,580,539Remy Cointreau SA 2,570 293,717Renault SA 20,610 1,824,840Rexel SA 35,349 528,417Safran SA 36,142 3,509,389Sanofi 134,501 13,113,870Schneider Electric SE (B) 65,153 5,253,990SCOR SE 21,036 880,636SEB SA 2,575 467,710Societe BIC SA 3,201 384,519Societe Generale SA 88,884 4,972,332Sodexo SA 10,615 1,239,142Suez 42,114 798,943Thales SA 12,019 1,330,576TOTAL SA 269,119 13,963,846Unibail-Rodamco SE (Amsterdam
Stock Exchange) 11,455 2,913,928Valeo SA 27,664 1,851,736Veolia Environnement SA 55,208 1,294,402Vinci SA 57,901 5,327,428Vivendi SA 119,038 2,730,845Wendel SA 3,163 501,503Zodiac Aerospace 23,659 684,212
166,868,481Germany - 8.2%adidas AG 25,374 5,698,813Allianz SE 61,966 13,280,921Axel Springer SE 6,400 396,555BASF SE 123,876 12,015,628Bayer AG 111,471 14,287,638Bayerische Motoren Werke AG 44,702 4,156,972Beiersdorf AG 13,422 1,434,340Brenntag AG 20,696 1,098,381Commerzbank AG (B) 143,441 1,784,713Continental AG 14,793 3,339,930Covestro AG (C) 15,041 1,182,991Daimler AG 129,780 9,470,280Deutsche Bank AG (Frankfurt
Stock Exchange) 279,129 4,470,803Deutsche Boerse AG 26,000 2,781,648Deutsche Lufthansa AG 31,854 800,011Deutsche Post AG 133,932 5,561,575Deutsche Telekom AG 441,037 7,976,114Deutsche Wohnen AG 47,382 2,013,652E.ON SE 296,995 3,361,226Evonik Industries AG 21,978 713,220
International Strategic Equity Allocation Fund(continued)
Shares orPrincipalAmount Value
COMMON STOCKS (continued)Germany (continued)Fraport AG Frankfurt Airport
Services Worldwide 5,607 $ 553,799Fresenius Medical Care AG &
Company KGaA 28,940 2,714,847Fresenius SE & Company KGaA 55,877 4,742,553GEA Group AG 24,646 1,086,192Hannover Rueck SE 8,635 1,047,469HeidelbergCement AG 19,977 1,918,510Henkel AG & Company KGaA 13,876 1,680,499HOCHTIEF AG 2,587 456,463HUGO BOSS AG 8,546 724,563Infineon Technologies AG 152,458 3,520,849Innogy SE (C) 18,172 801,599K+S AG (A) 25,817 615,729LANXESS AG 12,446 929,436Linde AG 25,027 4,805,311MAN SE 4,287 481,359Merck KGaA 17,412 1,914,261METRO AG (B) 23,949 468,135Muenchener
Rueckversicherungs-Gesellschaft AG 21,991 4,541,976OSRAM Licht AG 11,322 929,984ProSiebenSat.1 Media SE 31,336 1,051,135RWE AG 69,943 1,746,712SAP SE 132,322 13,887,404Siemens AG 103,126 13,500,100Symrise AG 16,444 1,202,909Telefonica Deutschland Holding AG 100,009 542,180thyssenkrupp AG 49,696 1,492,787TUI AG 15,080 255,222United Internet AG 16,449 977,526Volkswagen AG 4,318 667,549Vonovia SE 62,534 2,645,064Zalando SE (B) 15,018 712,060
168,439,593Hong Kong - 3.4%AIA Group, Ltd. 1,369,000 10,543,767Alibaba Health Information
Technology, Ltd. (A)(B) 254,000 118,756Alibaba Pictures Group, Ltd. (A)(B) 930,000 163,272ASM Pacific Technology, Ltd. 30,200 374,274Beijing Enterprises Holdings, Ltd. 38,500 215,469Beijing Enterprises Water
Group, Ltd. (B) 364,000 310,077BOC Hong Kong Holdings, Ltd. 418,500 2,138,121Brilliance China Automotive
Holdings, Ltd. 230,000 596,267Cheung Kong Property Holdings, Ltd. 301,000 2,648,747China Everbright International, Ltd. 186,000 246,170China Everbright, Ltd. 70,000 160,069China Gas Holdings, Ltd. 134,000 338,944China Jinmao Holdings Group, Ltd. 294,000 130,990China Merchants Port Holdings
Company, Ltd. 100,000 327,610China Mobile, Ltd. 464,500 4,929,639China Overseas Land & Investment, Ltd. 292,000 1,024,131China Power International
Development, Ltd. 239,000 81,638China Resources Beer Holdings
Company, Ltd. 122,000 306,386China Resources Gas Group, Ltd. 68,000 240,242China Resources Land, Ltd. 212,000 664,626
John Hancock Funds IIPortfolio of Investments — August 31, 2017 (showing percentage of total net assets)
96
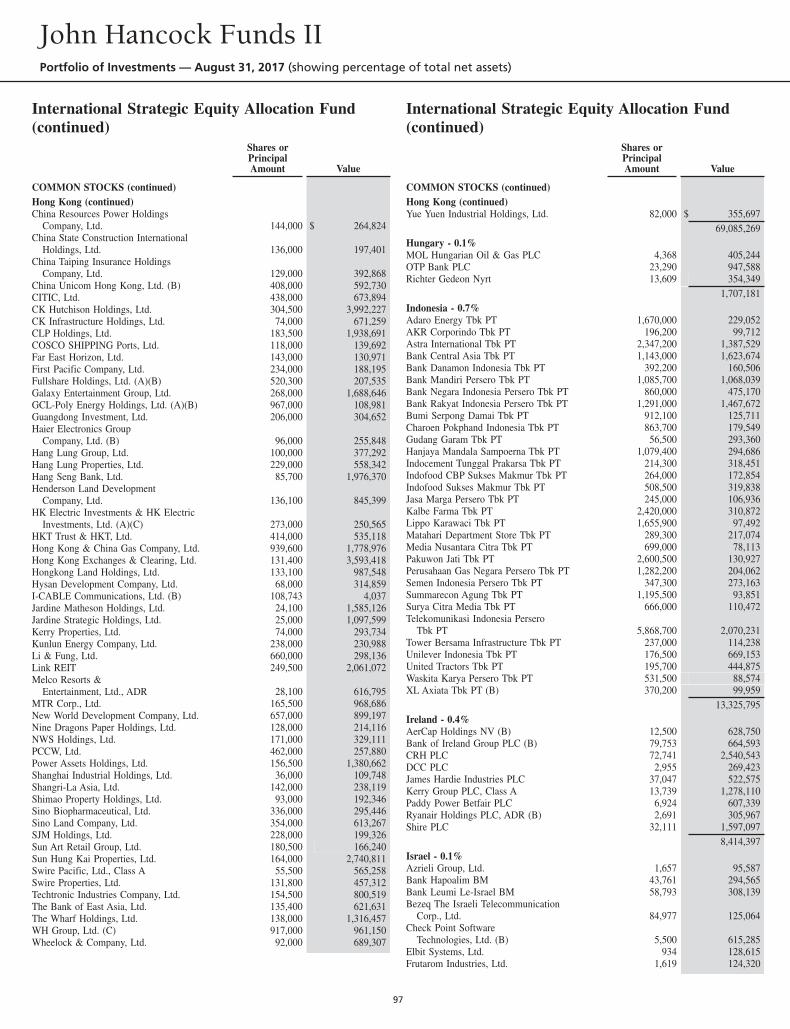
International Strategic Equity Allocation Fund(continued)
Shares orPrincipalAmount Value
COMMON STOCKS (continued)Hong Kong (continued)China Resources Power Holdings
Company, Ltd. 144,000 $ 264,824China State Construction International
Holdings, Ltd. 136,000 197,401China Taiping Insurance Holdings
Company, Ltd. 129,000 392,868China Unicom Hong Kong, Ltd. (B) 408,000 592,730CITIC, Ltd. 438,000 673,894CK Hutchison Holdings, Ltd. 304,500 3,992,227CK Infrastructure Holdings, Ltd. 74,000 671,259CLP Holdings, Ltd. 183,500 1,938,691COSCO SHIPPING Ports, Ltd. 118,000 139,692Far East Horizon, Ltd. 143,000 130,971First Pacific Company, Ltd. 234,000 188,195Fullshare Holdings, Ltd. (A)(B) 520,300 207,535Galaxy Entertainment Group, Ltd. 268,000 1,688,646GCL-Poly Energy Holdings, Ltd. (A)(B) 967,000 108,981Guangdong Investment, Ltd. 206,000 304,652Haier Electronics Group
Company, Ltd. (B) 96,000 255,848Hang Lung Group, Ltd. 100,000 377,292Hang Lung Properties, Ltd. 229,000 558,342Hang Seng Bank, Ltd. 85,700 1,976,370Henderson Land Development
Company, Ltd. 136,100 845,399HK Electric Investments & HK Electric
Investments, Ltd. (A)(C) 273,000 250,565HKT Trust & HKT, Ltd. 414,000 535,118Hong Kong & China Gas Company, Ltd. 939,600 1,778,976Hong Kong Exchanges & Clearing, Ltd. 131,400 3,593,418Hongkong Land Holdings, Ltd. 133,100 987,548Hysan Development Company, Ltd. 68,000 314,859I-CABLE Communications, Ltd. (B) 108,743 4,037Jardine Matheson Holdings, Ltd. 24,100 1,585,126Jardine Strategic Holdings, Ltd. 25,000 1,097,599Kerry Properties, Ltd. 74,000 293,734Kunlun Energy Company, Ltd. 238,000 230,988Li & Fung, Ltd. 660,000 298,136Link REIT 249,500 2,061,072Melco Resorts &
Entertainment, Ltd., ADR 28,100 616,795MTR Corp., Ltd. 165,500 968,686New World Development Company, Ltd. 657,000 899,197Nine Dragons Paper Holdings, Ltd. 128,000 214,116NWS Holdings, Ltd. 171,000 329,111PCCW, Ltd. 462,000 257,880Power Assets Holdings, Ltd. 156,500 1,380,662Shanghai Industrial Holdings, Ltd. 36,000 109,748Shangri-La Asia, Ltd. 142,000 238,119Shimao Property Holdings, Ltd. 93,000 192,346Sino Biopharmaceutical, Ltd. 336,000 295,446Sino Land Company, Ltd. 354,000 613,267SJM Holdings, Ltd. 228,000 199,326Sun Art Retail Group, Ltd. 180,500 166,240Sun Hung Kai Properties, Ltd. 164,000 2,740,811Swire Pacific, Ltd., Class A 55,500 565,258Swire Properties, Ltd. 131,800 457,312Techtronic Industries Company, Ltd. 154,500 800,519The Bank of East Asia, Ltd. 135,400 621,631The Wharf Holdings, Ltd. 138,000 1,316,457WH Group, Ltd. (C) 917,000 961,150Wheelock & Company, Ltd. 92,000 689,307
International Strategic Equity Allocation Fund(continued)
Shares orPrincipalAmount Value
COMMON STOCKS (continued)Hong Kong (continued)Yue Yuen Industrial Holdings, Ltd. 82,000 $ 355,697
69,085,269Hungary - 0.1%MOL Hungarian Oil & Gas PLC 4,368 405,244OTP Bank PLC 23,290 947,588Richter Gedeon Nyrt 13,609 354,349
1,707,181Indonesia - 0.7%Adaro Energy Tbk PT 1,670,000 229,052AKR Corporindo Tbk PT 196,200 99,712Astra International Tbk PT 2,347,200 1,387,529Bank Central Asia Tbk PT 1,143,000 1,623,674Bank Danamon Indonesia Tbk PT 392,200 160,506Bank Mandiri Persero Tbk PT 1,085,700 1,068,039Bank Negara Indonesia Persero Tbk PT 860,000 475,170Bank Rakyat Indonesia Persero Tbk PT 1,291,000 1,467,672Bumi Serpong Damai Tbk PT 912,100 125,711Charoen Pokphand Indonesia Tbk PT 863,700 179,549Gudang Garam Tbk PT 56,500 293,360Hanjaya Mandala Sampoerna Tbk PT 1,079,400 294,686Indocement Tunggal Prakarsa Tbk PT 214,300 318,451Indofood CBP Sukses Makmur Tbk PT 264,000 172,854Indofood Sukses Makmur Tbk PT 508,500 319,838Jasa Marga Persero Tbk PT 245,000 106,936Kalbe Farma Tbk PT 2,420,000 310,872Lippo Karawaci Tbk PT 1,655,900 97,492Matahari Department Store Tbk PT 289,300 217,074Media Nusantara Citra Tbk PT 699,000 78,113Pakuwon Jati Tbk PT 2,600,500 130,927Perusahaan Gas Negara Persero Tbk PT 1,282,200 204,062Semen Indonesia Persero Tbk PT 347,300 273,163Summarecon Agung Tbk PT 1,195,500 93,851Surya Citra Media Tbk PT 666,000 110,472Telekomunikasi Indonesia Persero
Tbk PT 5,868,700 2,070,231Tower Bersama Infrastructure Tbk PT 237,000 114,238Unilever Indonesia Tbk PT 176,500 669,153United Tractors Tbk PT 195,700 444,875Waskita Karya Persero Tbk PT 531,500 88,574XL Axiata Tbk PT (B) 370,200 99,959
13,325,795Ireland - 0.4%AerCap Holdings NV (B) 12,500 628,750Bank of Ireland Group PLC (B) 79,753 664,593CRH PLC 72,741 2,540,543DCC PLC 2,955 269,423James Hardie Industries PLC 37,047 522,575Kerry Group PLC, Class A 13,739 1,278,110Paddy Power Betfair PLC 6,924 607,339Ryanair Holdings PLC, ADR (B) 2,691 305,967Shire PLC 32,111 1,597,097
8,414,397Israel - 0.1%Azrieli Group, Ltd. 1,657 95,587Bank Hapoalim BM 43,761 294,565Bank Leumi Le-Israel BM 58,793 308,139Bezeq The Israeli Telecommunication
Corp., Ltd. 84,977 125,064Check Point Software
Technologies, Ltd. (B) 5,500 615,285Elbit Systems, Ltd. 934 128,615Frutarom Industries, Ltd. 1,619 124,320
John Hancock Funds IIPortfolio of Investments — August 31, 2017 (showing percentage of total net assets)
97
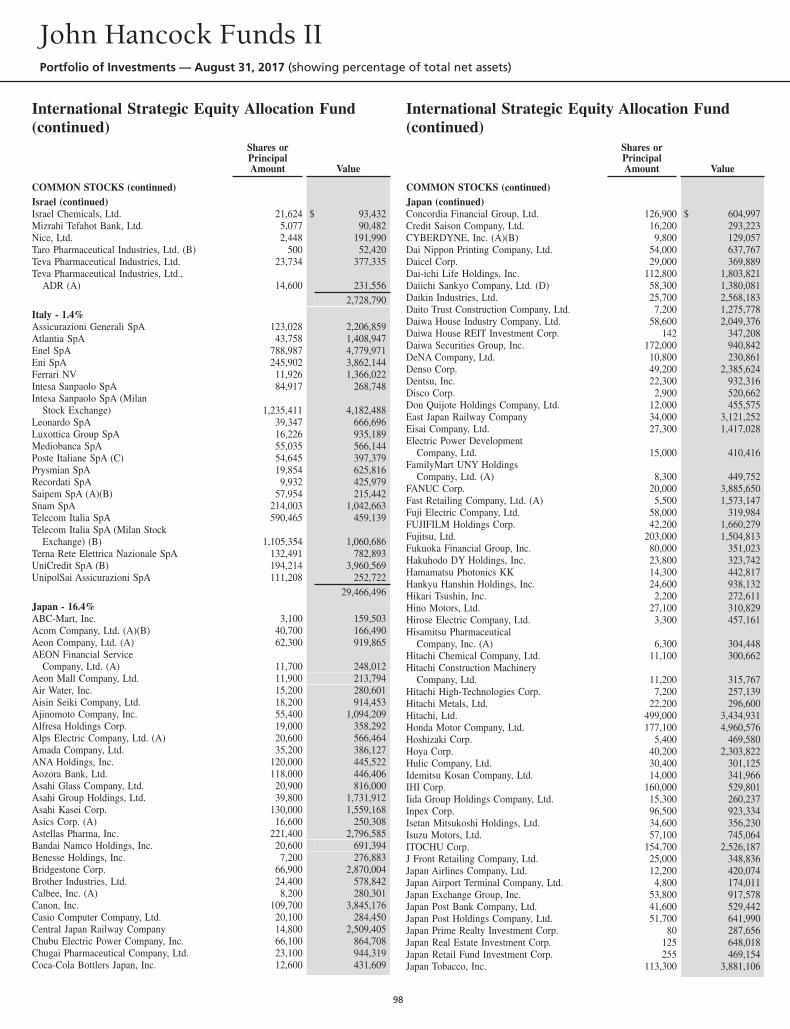
International Strategic Equity Allocation Fund(continued)
Shares orPrincipalAmount Value
COMMON STOCKS (continued)Israel (continued)Israel Chemicals, Ltd. 21,624 $ 93,432Mizrahi Tefahot Bank, Ltd. 5,077 90,482Nice, Ltd. 2,448 191,990Taro Pharmaceutical Industries, Ltd. (B) 500 52,420Teva Pharmaceutical Industries, Ltd. 23,734 377,335Teva Pharmaceutical Industries, Ltd.,
ADR (A) 14,600 231,5562,728,790
Italy - 1.4%Assicurazioni Generali SpA 123,028 2,206,859Atlantia SpA 43,758 1,408,947Enel SpA 788,987 4,779,971Eni SpA 245,902 3,862,144Ferrari NV 11,926 1,366,022Intesa Sanpaolo SpA 84,917 268,748Intesa Sanpaolo SpA (Milan
Stock Exchange) 1,235,411 4,182,488Leonardo SpA 39,347 666,696Luxottica Group SpA 16,226 935,189Mediobanca SpA 55,035 566,144Poste Italiane SpA (C) 54,645 397,379Prysmian SpA 19,854 625,816Recordati SpA 9,932 425,979Saipem SpA (A)(B) 57,954 215,442Snam SpA 214,003 1,042,663Telecom Italia SpA 590,465 459,139Telecom Italia SpA (Milan Stock
Exchange) (B) 1,105,354 1,060,686Terna Rete Elettrica Nazionale SpA 132,491 782,893UniCredit SpA (B) 194,214 3,960,569UnipolSai Assicurazioni SpA 111,208 252,722
29,466,496Japan - 16.4%ABC-Mart, Inc. 3,100 159,503Acom Company, Ltd. (A)(B) 40,700 166,490Aeon Company, Ltd. (A) 62,300 919,865AEON Financial Service
Company, Ltd. (A) 11,700 248,012Aeon Mall Company, Ltd. 11,900 213,794Air Water, Inc. 15,200 280,601Aisin Seiki Company, Ltd. 18,200 914,453Ajinomoto Company, Inc. 55,400 1,094,209Alfresa Holdings Corp. 19,000 358,292Alps Electric Company, Ltd. (A) 20,600 566,464Amada Company, Ltd. 35,200 386,127ANA Holdings, Inc. 120,000 445,522Aozora Bank, Ltd. 118,000 446,406Asahi Glass Company, Ltd. 20,900 816,000Asahi Group Holdings, Ltd. 39,800 1,731,912Asahi Kasei Corp. 130,000 1,559,168Asics Corp. (A) 16,600 250,308Astellas Pharma, Inc. 221,400 2,796,585Bandai Namco Holdings, Inc. 20,600 691,394Benesse Holdings, Inc. 7,200 276,883Bridgestone Corp. 66,900 2,870,004Brother Industries, Ltd. 24,400 578,842Calbee, Inc. (A) 8,200 280,301Canon, Inc. 109,700 3,845,176Casio Computer Company, Ltd. 20,100 284,450Central Japan Railway Company 14,800 2,509,405Chubu Electric Power Company, Inc. 66,100 864,708Chugai Pharmaceutical Company, Ltd. 23,100 944,319Coca-Cola Bottlers Japan, Inc. 12,600 431,609
International Strategic Equity Allocation Fund(continued)
Shares orPrincipalAmount Value
COMMON STOCKS (continued)Japan (continued)Concordia Financial Group, Ltd. 126,900 $ 604,997Credit Saison Company, Ltd. 16,200 293,223CYBERDYNE, Inc. (A)(B) 9,800 129,057Dai Nippon Printing Company, Ltd. 54,000 637,767Daicel Corp. 29,000 369,889Dai-ichi Life Holdings, Inc. 112,800 1,803,821Daiichi Sankyo Company, Ltd. (D) 58,300 1,380,081Daikin Industries, Ltd. 25,700 2,568,183Daito Trust Construction Company, Ltd. 7,200 1,275,778Daiwa House Industry Company, Ltd. 58,600 2,049,376Daiwa House REIT Investment Corp. 142 347,208Daiwa Securities Group, Inc. 172,000 940,842DeNA Company, Ltd. 10,800 230,861Denso Corp. 49,200 2,385,624Dentsu, Inc. 22,300 932,316Disco Corp. 2,900 520,662Don Quijote Holdings Company, Ltd. 12,000 455,575East Japan Railway Company 34,000 3,121,252Eisai Company, Ltd. 27,300 1,417,028Electric Power Development
Company, Ltd. 15,000 410,416FamilyMart UNY Holdings
Company, Ltd. (A) 8,300 449,752FANUC Corp. 20,000 3,885,650Fast Retailing Company, Ltd. (A) 5,500 1,573,147Fuji Electric Company, Ltd. 58,000 319,984FUJIFILM Holdings Corp. 42,200 1,660,279Fujitsu, Ltd. 203,000 1,504,813Fukuoka Financial Group, Inc. 80,000 351,023Hakuhodo DY Holdings, Inc. 23,800 323,742Hamamatsu Photonics KK 14,300 442,817Hankyu Hanshin Holdings, Inc. 24,600 938,132Hikari Tsushin, Inc. 2,200 272,611Hino Motors, Ltd. 27,100 310,829Hirose Electric Company, Ltd. 3,300 457,161Hisamitsu Pharmaceutical
Company, Inc. (A) 6,300 304,448Hitachi Chemical Company, Ltd. 11,100 300,662Hitachi Construction Machinery
Company, Ltd. 11,200 315,767Hitachi High-Technologies Corp. 7,200 257,139Hitachi Metals, Ltd. 22,200 296,600Hitachi, Ltd. 499,000 3,434,931Honda Motor Company, Ltd. 177,100 4,960,576Hoshizaki Corp. 5,400 469,580Hoya Corp. 40,200 2,303,822Hulic Company, Ltd. 30,400 301,125Idemitsu Kosan Company, Ltd. 14,000 341,966IHI Corp. 160,000 529,801Iida Group Holdings Company, Ltd. 15,300 260,237Inpex Corp. 96,500 923,334Isetan Mitsukoshi Holdings, Ltd. 34,600 356,230Isuzu Motors, Ltd. 57,100 745,064ITOCHU Corp. 154,700 2,526,187J Front Retailing Company, Ltd. 25,000 348,836Japan Airlines Company, Ltd. 12,200 420,074Japan Airport Terminal Company, Ltd. 4,800 174,011Japan Exchange Group, Inc. 53,800 917,578Japan Post Bank Company, Ltd. 41,600 529,442Japan Post Holdings Company, Ltd. 51,700 641,990Japan Prime Realty Investment Corp. 80 287,656Japan Real Estate Investment Corp. 125 648,018Japan Retail Fund Investment Corp. 255 469,154Japan Tobacco, Inc. 113,300 3,881,106
John Hancock Funds IIPortfolio of Investments — August 31, 2017 (showing percentage of total net assets)
98
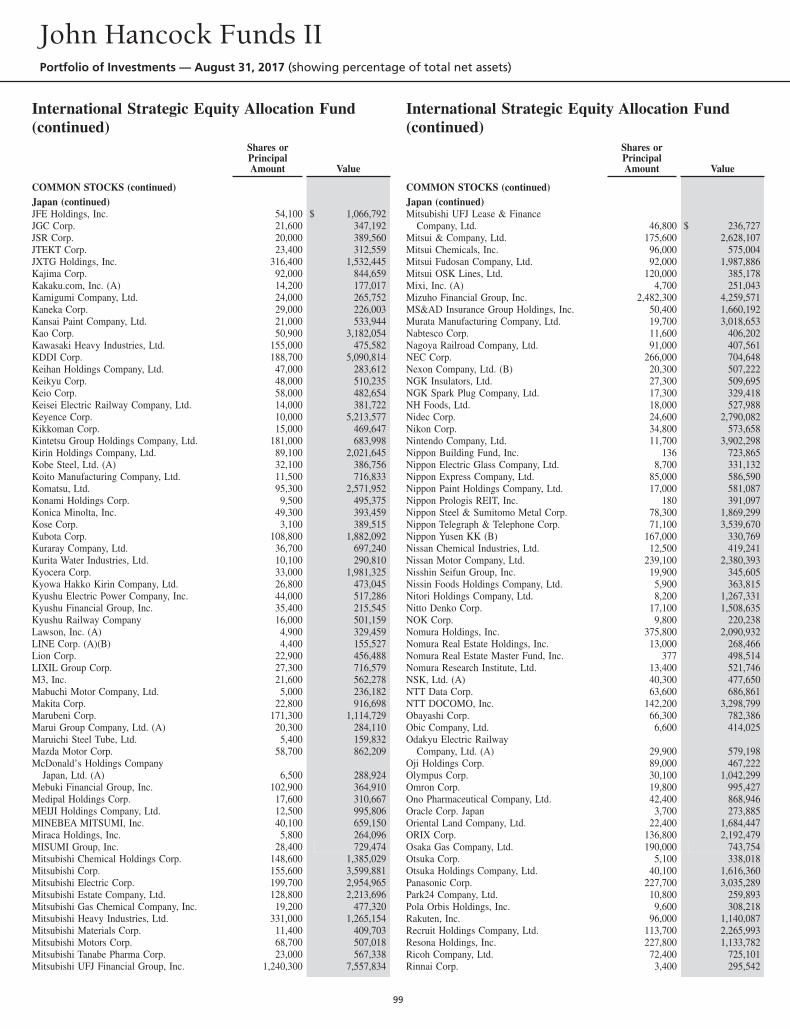
International Strategic Equity Allocation Fund(continued)
Shares orPrincipalAmount Value
COMMON STOCKS (continued)Japan (continued)JFE Holdings, Inc. 54,100 $ 1,066,792JGC Corp. 21,600 347,192JSR Corp. 20,000 389,560JTEKT Corp. 23,400 312,559JXTG Holdings, Inc. 316,400 1,532,445Kajima Corp. 92,000 844,659Kakaku.com, Inc. (A) 14,200 177,017Kamigumi Company, Ltd. 24,000 265,752Kaneka Corp. 29,000 226,003Kansai Paint Company, Ltd. 21,000 533,944Kao Corp. 50,900 3,182,054Kawasaki Heavy Industries, Ltd. 155,000 475,582KDDI Corp. 188,700 5,090,814Keihan Holdings Company, Ltd. 47,000 283,612Keikyu Corp. 48,000 510,235Keio Corp. 58,000 482,654Keisei Electric Railway Company, Ltd. 14,000 381,722Keyence Corp. 10,000 5,213,577Kikkoman Corp. 15,000 469,647Kintetsu Group Holdings Company, Ltd. 181,000 683,998Kirin Holdings Company, Ltd. 89,100 2,021,645Kobe Steel, Ltd. (A) 32,100 386,756Koito Manufacturing Company, Ltd. 11,500 716,833Komatsu, Ltd. 95,300 2,571,952Konami Holdings Corp. 9,500 495,375Konica Minolta, Inc. 49,300 393,459Kose Corp. 3,100 389,515Kubota Corp. 108,800 1,882,092Kuraray Company, Ltd. 36,700 697,240Kurita Water Industries, Ltd. 10,100 290,810Kyocera Corp. 33,000 1,981,325Kyowa Hakko Kirin Company, Ltd. 26,800 473,045Kyushu Electric Power Company, Inc. 44,000 517,286Kyushu Financial Group, Inc. 35,400 215,545Kyushu Railway Company 16,000 501,159Lawson, Inc. (A) 4,900 329,459LINE Corp. (A)(B) 4,400 155,527Lion Corp. 22,900 456,488LIXIL Group Corp. 27,300 716,579M3, Inc. 21,600 562,278Mabuchi Motor Company, Ltd. 5,000 236,182Makita Corp. 22,800 916,698Marubeni Corp. 171,300 1,114,729Marui Group Company, Ltd. (A) 20,300 284,110Maruichi Steel Tube, Ltd. 5,400 159,832Mazda Motor Corp. 58,700 862,209McDonald’s Holdings Company
Japan, Ltd. (A) 6,500 288,924Mebuki Financial Group, Inc. 102,900 364,910Medipal Holdings Corp. 17,600 310,667MEIJI Holdings Company, Ltd. 12,500 995,806MINEBEA MITSUMI, Inc. 40,100 659,150Miraca Holdings, Inc. 5,800 264,096MISUMI Group, Inc. 28,400 729,474Mitsubishi Chemical Holdings Corp. 148,600 1,385,029Mitsubishi Corp. 155,600 3,599,881Mitsubishi Electric Corp. 199,700 2,954,965Mitsubishi Estate Company, Ltd. 128,800 2,213,696Mitsubishi Gas Chemical Company, Inc. 19,200 477,320Mitsubishi Heavy Industries, Ltd. 331,000 1,265,154Mitsubishi Materials Corp. 11,400 409,703Mitsubishi Motors Corp. 68,700 507,018Mitsubishi Tanabe Pharma Corp. 23,000 567,338Mitsubishi UFJ Financial Group, Inc. 1,240,300 7,557,834
International Strategic Equity Allocation Fund(continued)
Shares orPrincipalAmount Value
COMMON STOCKS (continued)Japan (continued)Mitsubishi UFJ Lease & Finance
Company, Ltd. 46,800 $ 236,727Mitsui & Company, Ltd. 175,600 2,628,107Mitsui Chemicals, Inc. 96,000 575,004Mitsui Fudosan Company, Ltd. 92,000 1,987,886Mitsui OSK Lines, Ltd. 120,000 385,178Mixi, Inc. (A) 4,700 251,043Mizuho Financial Group, Inc. 2,482,300 4,259,571MS&AD Insurance Group Holdings, Inc. 50,400 1,660,192Murata Manufacturing Company, Ltd. 19,700 3,018,653Nabtesco Corp. 11,600 406,202Nagoya Railroad Company, Ltd. 91,000 407,561NEC Corp. 266,000 704,648Nexon Company, Ltd. (B) 20,300 507,222NGK Insulators, Ltd. 27,300 509,695NGK Spark Plug Company, Ltd. 17,300 329,418NH Foods, Ltd. 18,000 527,988Nidec Corp. 24,600 2,790,082Nikon Corp. 34,800 573,658Nintendo Company, Ltd. 11,700 3,902,298Nippon Building Fund, Inc. 136 723,865Nippon Electric Glass Company, Ltd. 8,700 331,132Nippon Express Company, Ltd. 85,000 586,590Nippon Paint Holdings Company, Ltd. 17,000 581,087Nippon Prologis REIT, Inc. 180 391,097Nippon Steel & Sumitomo Metal Corp. 78,300 1,869,299Nippon Telegraph & Telephone Corp. 71,100 3,539,670Nippon Yusen KK (B) 167,000 330,769Nissan Chemical Industries, Ltd. 12,500 419,241Nissan Motor Company, Ltd. 239,100 2,380,393Nisshin Seifun Group, Inc. 19,900 345,605Nissin Foods Holdings Company, Ltd. 5,900 363,815Nitori Holdings Company, Ltd. 8,200 1,267,331Nitto Denko Corp. 17,100 1,508,635NOK Corp. 9,800 220,238Nomura Holdings, Inc. 375,800 2,090,932Nomura Real Estate Holdings, Inc. 13,000 268,466Nomura Real Estate Master Fund, Inc. 377 498,514Nomura Research Institute, Ltd. 13,400 521,746NSK, Ltd. (A) 40,300 477,650NTT Data Corp. 63,600 686,861NTT DOCOMO, Inc. 142,200 3,298,799Obayashi Corp. 66,300 782,386Obic Company, Ltd. 6,600 414,025Odakyu Electric Railway
Company, Ltd. (A) 29,900 579,198Oji Holdings Corp. 89,000 467,222Olympus Corp. 30,100 1,042,299Omron Corp. 19,800 995,427Ono Pharmaceutical Company, Ltd. 42,400 868,946Oracle Corp. Japan 3,700 273,885Oriental Land Company, Ltd. 22,400 1,684,447ORIX Corp. 136,800 2,192,479Osaka Gas Company, Ltd. 190,000 743,754Otsuka Corp. 5,100 338,018Otsuka Holdings Company, Ltd. 40,100 1,616,360Panasonic Corp. 227,700 3,035,289Park24 Company, Ltd. 10,800 259,893Pola Orbis Holdings, Inc. 9,600 308,218Rakuten, Inc. 96,000 1,140,087Recruit Holdings Company, Ltd. 113,700 2,265,993Resona Holdings, Inc. 227,800 1,133,782Ricoh Company, Ltd. 72,400 725,101Rinnai Corp. 3,400 295,542
John Hancock Funds IIPortfolio of Investments — August 31, 2017 (showing percentage of total net assets)
99
International Strategic Equity Allocation Fund(continued)
Shares orPrincipalAmount Value
COMMON STOCKS (continued)Japan (continued)Rohm Company, Ltd. 9,800 $ 763,028Ryohin Keikaku Company, Ltd. 2,400 666,598Sankyo Company, Ltd. 4,100 133,887Santen Pharmaceutical Company, Ltd. 37,400 582,720SBI Holdings, Inc. (A) 21,100 293,464Secom Company, Ltd. 21,500 1,595,701Sega Sammy Holdings, Inc. 17,600 253,203Seibu Holdings, Inc. 19,100 328,721Seiko Epson Corp. 28,800 739,081Sekisui Chemical Company, Ltd. 41,900 782,365Sekisui House, Ltd. 62,100 1,075,177Seven & i Holdings Company, Ltd. 77,500 3,075,053Seven Bank, Ltd. (A) 60,100 228,074Sharp Corp. (A)(B) 154,000 462,121Shimadzu Corp. 25,700 472,909Shimamura Company, Ltd. 2,200 268,778Shimano, Inc. 7,600 1,026,761Shimizu Corp. 56,300 581,772Shin-Etsu Chemical Company, Ltd. 40,100 3,551,929Shinsei Bank, Ltd. 171,000 273,445Shionogi & Company, Ltd. 30,500 1,611,608Shiseido Company, Ltd. 39,100 1,620,043Showa Shell Sekiyu KK 18,900 207,315SMC Corp. 5,900 2,025,258SoftBank Group Corp. 85,100 6,928,094Sohgo Security Services
Company, Ltd. (A) 7,400 323,762Sompo Holdings, Inc. 37,400 1,404,729Sony Corp. 130,100 5,147,841Sony Financial Holdings, Inc. 19,500 307,430Stanley Electric Company, Ltd. 14,300 474,898Start Today Company, Ltd. 20,000 622,603Subaru Corp. 63,500 2,219,438Sumitomo Chemical Company, Ltd. 164,000 984,329Sumitomo Corp. 122,600 1,736,589Sumitomo Dainippon Pharma
Company, Ltd. (A) 16,300 222,508Sumitomo Electric Industries, Ltd. 77,800 1,217,266Sumitomo Heavy Industries, Ltd. 61,000 454,880Sumitomo Metal Mining Company, Ltd. 51,000 879,351Sumitomo Mitsui Financial Group, Inc. 138,500 5,156,810Sumitomo Mitsui Trust Holdings, Inc. 34,200 1,180,252Sumitomo Realty & Development
Company, Ltd. 37,000 1,118,047Sumitomo Rubber Industries, Ltd. 18,600 308,479Sundrug Company, Ltd. 7,400 306,889Suntory Beverage & Food, Ltd. 14,100 651,741Suruga Bank, Ltd. 17,800 380,077Suzuken Company, Ltd. 7,300 266,096Suzuki Motor Corp. 35,400 1,777,568Sysmex Corp. 16,100 996,422T&D Holdings, Inc. 58,100 791,055Taiheiyo Cement Corp. 124,000 478,195Taisei Corp. 106,000 1,063,601Taisho Pharmaceutical Holdings
Company, Ltd. 3,100 242,716Taiyo Nippon Sanso Corp. 13,900 162,389Takashimaya Company, Ltd. 31,000 284,491Takeda Pharmaceutical Company, Ltd. 73,200 4,059,247TDK Corp. 13,400 898,263Teijin, Ltd. 19,300 392,082Terumo Corp. 32,900 1,272,919The Bank of Kyoto, Ltd. 31,000 286,407The Chiba Bank, Ltd. 72,000 481,405
International Strategic Equity Allocation Fund(continued)
Shares orPrincipalAmount Value
COMMON STOCKS (continued)Japan (continued)The Chugoku Bank, Ltd. 16,100 $ 216,886The Chugoku Electric Power
Company, Inc. 27,600 318,235The Hachijuni Bank, Ltd. 41,600 253,175The Hiroshima Bank, Ltd. 51,000 204,936The Kansai Electric Power
Company, Ltd. 72,600 1,018,012The Shizuoka Bank, Ltd. 53,000 462,114The Yokohama Rubber Company, Ltd. 12,100 223,709THK Company, Ltd. 12,600 420,556Tobu Railway Company, Ltd. 97,000 536,818Toho Company, Ltd. 11,700 434,932Toho Gas Company, Ltd. 38,000 250,791Tohoku Electric Power Company, Inc. 46,100 630,721Tokio Marine Holdings, Inc. 71,300 2,839,157Tokyo Electric Power Company
Holdings, Inc. (B) 148,600 601,721Tokyo Electron, Ltd. 16,200 2,281,583Tokyo Gas Company, Ltd. 201,000 1,065,681Tokyo Tatemono Company, Ltd. 21,400 263,337Tokyu Corp. 54,200 789,689Tokyu Fudosan Holdings Corp. 52,800 315,056Toppan Printing Company, Ltd. 54,000 540,969Toray Industries, Inc. 150,000 1,429,968Toshiba Corp. (A)(B) 415,000 1,157,663Tosoh Corp. 61,000 717,100TOTO, Ltd. 14,500 551,979Toyo Seikan Group Holdings, Ltd. 16,600 273,566Toyo Suisan Kaisha, Ltd. 8,500 314,188Toyoda Gosei Company, Ltd. 6,500 151,459Toyota Industries Corp. 16,900 899,587Toyota Motor Corp. 268,400 15,112,042Toyota Tsusho Corp. 22,200 683,118Trend Micro, Inc. 12,200 564,683Tsuruha Holdings, Inc. 3,700 440,776Unicharm Corp. 41,500 977,041United Urban Investment Corp. 304 458,880USS Company, Ltd. 22,300 438,614West Japan Railway Company 16,900 1,229,158Yahoo Japan Corp. (A) 145,500 667,982Yakult Honsha Company, Ltd. 9,100 630,260Yamada Denki Company, Ltd. (A) 63,400 343,290Yamaguchi Financial Group, Inc. 20,000 226,013Yamaha Corp. 17,200 599,619Yamaha Motor Company, Ltd. 28,900 816,112Yamato Holdings Company, Ltd. 36,000 767,618Yamazaki Baking Company, Ltd. 13,000 246,395Yaskawa Electric Corp. 26,200 794,145Yokogawa Electric Corp. 23,400 364,911
336,736,287Jersey, Channel Islands - 0.0%Randgold Resources, Ltd. 3,149 323,017Jordan - 0.0%Hikma Pharmaceuticals PLC 5,155 83,539Luxembourg - 0.3%ArcelorMittal (B) 77,072 2,053,522Eurofins Scientific SE 1,264 722,777Millicom International Cellular SA 7,836 488,609RTL Group SA 5,083 386,261SES SA 41,909 958,299Tenaris SA (A) 44,694 595,559
5,205,027
John Hancock Funds IIPortfolio of Investments — August 31, 2017 (showing percentage of total net assets)
100
International Strategic Equity Allocation Fund(continued)
Shares orPrincipalAmount Value
COMMON STOCKS (continued)Macau - 0.1%MGM China Holdings, Ltd. (A) 109,200 $ 219,413Sands China, Ltd. 275,200 1,236,699Wynn Macau, Ltd. 178,800 394,047
1,850,159Malaysia - 0.7%AirAsia BHD 184,900 144,133Alliance Financial Group BHD 116,700 104,984AMMB Holdings BHD 196,200 197,254Astro Malaysia Holdings BHD 190,400 119,612Axiata Group BHD 322,000 372,804British American Tobacco Malaysia BHD 16,900 175,005CIMB Group Holdings BHD 486,400 808,198Dialog Group BHD 307,100 147,689DiGi.Com BHD 364,200 413,122Felda Global Ventures Holdings BHD 179,800 65,452Gamuda BHD 194,600 243,489Genting BHD 272,100 619,996Genting Malaysia BHD 360,800 497,747Genting Plantations BHD 27,100 67,605HAP Seng Consolidated BHD 70,300 149,891Hartalega Holdings BHD 78,300 124,449Hong Leong Bank BHD 72,700 263,196Hong Leong Financial Group BHD 27,000 107,019IHH Healthcare BHD 244,200 341,855IJM Corp. BHD 329,800 258,090IOI Corp. BHD 266,700 284,179IOI Properties Group BHD 197,900 92,362Kuala Lumpur Kepong BHD 55,500 319,034Malayan Banking BHD 417,300 925,350Malaysia Airports Holdings BHD 99,300 209,366Maxis BHD 218,300 295,721MISC BHD 160,100 279,434Petronas Chemicals Group BHD 290,300 486,848Petronas Dagangan BHD 24,900 142,356Petronas Gas BHD 83,900 362,471PPB Group BHD 55,100 215,445Public Bank BHD 340,600 1,643,525RHB Bank BHD 96,000 113,694Sapura Energy BHD 472,200 153,657Sime Darby BHD 283,900 598,504Telekom Malaysia BHD 127,300 191,772Tenaga Nasional BHD 402,200 1,346,434UMW Holdings BHD (B) 52,900 75,488Westports Holdings BHD 114,300 100,641YTL Corp. BHD 508,900 170,641YTL Power International BHD 224,300 74,117
13,302,629Malta - 0.0%Brait SE (B) 34,753 153,952Mexico - 1.2%Alfa SAB de CV, Class A 427,700 598,040America Movil SAB de CV, Series L 4,673,400 4,344,249Arca Continental SAB de CV 62,000 452,466Cemex SAB de CV (B) 2,042,748 1,906,873Coca-Cola Femsa SAB de CV,
Series L (A) 70,000 573,609El Puerto de Liverpool SAB de CV,
Series C1 (A) 26,300 234,165Fibra Uno Administracion SA de CV (A) 364,300 648,351Fomento Economico Mexicano SAB
de CV 272,300 2,727,074Fresnillo PLC 7,431 155,410Gentera SAB de CV 137,400 211,642
International Strategic Equity Allocation Fund(continued)
Shares orPrincipalAmount Value
COMMON STOCKS (continued)Mexico (continued)Gruma SAB de CV, Class B 30,020 $ 440,329Grupo Aeroportuario del Pacifico SAB
de CV, B Shares 49,900 551,295Grupo Aeroportuario del Sureste SAB de
CV, B Shares 29,190 594,257Grupo Bimbo SAB de CV, Series A 232,300 561,935Grupo Carso SAB de CV, Series A1 63,700 256,735Grupo Financiero Banorte SAB de CV,
Series O 348,700 2,379,373Grupo Financiero Inbursa SAB de CV,
Series O 322,100 539,558Grupo Financiero Santander Mexico SAB
de CV, Class B 257,600 529,053Grupo Lala SAB de CV 86,100 152,897Grupo Mexico SAB de CV, Series B 530,400 1,750,275Grupo Televisa SAB (A) 341,800 1,764,511Industrias Penoles SAB de CV 19,305 502,221Infraestructura Energetica Nova SAB
de CV 74,800 407,861Kimberly-Clark de Mexico SAB de CV,
Class A 211,600 415,880Mexichem SAB de CV 147,035 391,452Promotora y Operadora de Infraestructura
SAB de CV 31,550 344,771Wal-Mart de Mexico SAB de CV 729,800 1,775,595
25,209,877Netherlands - 2.0%ABN AMRO Group NV (C) 30,942 866,903Aegon NV 150,934 863,020Akzo Nobel NV 20,893 1,908,914Altice NV, Class A (B) 32,546 750,776Altice NV, Class B (B) 7,661 177,157ASML Holding NV 30,836 4,814,258Boskalis Westminster 7,323 239,337EXOR NV 10,565 678,955Gemalto NV 6,790 367,152Heineken Holding NV 8,325 822,385Heineken NV 19,079 2,002,351ING Groep NV 320,628 5,691,391Koninklijke Ahold Delhaize NV 105,939 1,904,423Koninklijke DSM NV 15,054 1,142,647Koninklijke KPN NV 281,449 995,430Koninklijke Philips NV 77,054 2,922,186Koninklijke Vopak NV 5,670 240,031NN Group NV 26,314 1,044,756NXP Semiconductors NV (B) 28,600 3,230,651QIAGEN NV (B) 29,582 954,326Randstad Holding NV 9,941 581,209Royal Dutch Shell PLC, A Shares 155,453 4,284,081Royal Dutch Shell PLC, B Shares 133,608 3,729,057Wolters Kluwer NV 24,840 1,085,216
41,296,612New Zealand - 0.1%Auckland International Airport, Ltd. 81,797 399,408Contact Energy, Ltd. (A) 58,828 236,199Fletcher Building, Ltd. 59,814 351,357Mercury NZ, Ltd. 58,828 145,494Meridian Energy, Ltd. 110,225 233,575Ryman Healthcare, Ltd. 34,256 223,485Spark New Zealand, Ltd. 155,745 438,170
2,027,688
John Hancock Funds IIPortfolio of Investments — August 31, 2017 (showing percentage of total net assets)
101
International Strategic Equity Allocation Fund(continued)
Shares orPrincipalAmount Value
COMMON STOCKS (continued)Norway - 0.2%DNB ASA 30,589 $ 597,483Gjensidige Forsikring ASA 8,198 143,457Marine Harvest ASA (A)(B) 11,921 236,809Norsk Hydro ASA 41,800 301,799Orkla ASA 24,877 255,426Schibsted ASA, A Shares 2,581 62,716Schibsted ASA, B Shares 2,575 58,995Statoil ASA 35,221 666,518Telenor ASA 23,644 478,559Yara International ASA 5,584 228,482
3,030,244Peru - 0.1%Cia de Minas Buenaventura SAA, ADR 14,100 189,363Credicorp, Ltd. 5,153 1,045,235Southern Copper Corp. 6,500 264,550
1,499,148Philippines - 0.2%Aboitiz Equity Ventures, Inc. 160,550 233,572Aboitiz Power Corp. 116,500 89,989Alliance Global Group, Inc. (B) 361,000 98,071Ayala Corp. 20,910 376,447Ayala Land, Inc. 628,800 516,598Bank of the Philippine Islands 57,360 118,754BDO Unibank, Inc. 161,660 402,157DMCI Holdings, Inc. 332,800 102,122Energy Development Corp. 806,500 106,941Globe Telecom, Inc. 2,775 108,482GT Capital Holdings, Inc. 7,355 160,754International Container Terminal
Services, Inc. 43,770 89,452JG Summit Holdings, Inc. 241,530 338,963Jollibee Foods Corp. 35,830 167,001Megaworld Corp. 1,006,000 97,240Metro Pacific Investments Corp. 1,159,300 144,009Metropolitan Bank & Trust Company 52,260 89,477PLDT, Inc. 7,335 248,217Robinsons Land Corp. 137,300 62,289Security Bank Corp. 7,560 36,965SM Investments Corp. 20,310 321,728SM Prime Holdings, Inc. 739,800 482,967Universal Robina Corp. 73,620 210,490
4,602,685Poland - 0.4%Alior Bank SA (B) 9,611 177,843Bank Handlowy w Warszawie SA 3,223 64,159Bank Millennium SA (B) 63,772 133,427Bank Pekao SA 16,672 598,912Bank Zachodni WBK SA 3,704 384,033CCC SA 2,927 215,186Cyfrowy Polsat SA 23,550 177,019Eurocash SA 7,821 85,855Grupa Azoty SA 4,708 91,003Grupa Lotos SA (B) 9,724 160,628Jastrzebska Spolka Weglowa SA (B) 5,597 163,272KGHM Polska Miedz SA 15,114 534,869LPP SA 138 338,019mBank SA (B) 1,544 189,896Orange Polska SA (B) 65,497 110,124PGE Polska Grupa Energetyczna SA 91,063 364,657Polski Koncern Naftowy ORLEN SA 32,121 1,062,637Polskie Gornictwo Naftowe i
Gazownictwo SA 187,922 359,869
International Strategic Equity Allocation Fund(continued)
Shares orPrincipalAmount Value
COMMON STOCKS (continued)Poland (continued)Powszechna Kasa Oszczednosci Bank
Polski SA (B) 100,151 $ 1,030,441Powszechny Zaklad Ubezpieczen SA 66,722 908,331Synthos SA 58,472 78,365Tauron Polska Energia SA (B) 110,466 121,464
7,350,009Portugal - 0.1%EDP - Energias de Portugal SA 238,554 917,138Galp Energia SGPS SA 49,107 813,533Jeronimo Martins SGPS SA 24,781 494,742
2,225,413Romania - 0.0%NEPI Rockcastle PLC (B) 55,219 800,137Singapore - 1.5%Ascendas Real Estate Investment Trust 428,200 840,641CapitaLand Commercial Trust 355,500 456,770CapitaLand Mall Trust 422,000 675,835CapitaLand, Ltd. 445,400 1,244,714City Developments, Ltd. 71,300 617,064ComfortDelGro Corp., Ltd. 373,800 632,017DBS Group Holdings, Ltd. 308,700 4,703,263Genting Singapore PLC 1,055,300 924,319Global Logistic Properties, Ltd. 463,200 1,107,753Golden Agri-Resources, Ltd. 1,236,600 360,328Hutchison Port Holdings Trust 914,700 416,721Jardine Cycle & Carriage, Ltd. 17,100 504,446Keppel Corp., Ltd. 252,400 1,178,279Oversea-Chinese Banking Corp., Ltd. 544,200 4,489,031SATS, Ltd. 113,300 404,106Sembcorp Industries, Ltd. 172,400 379,737Singapore Airlines, Ltd. 92,900 707,138Singapore Exchange, Ltd. 137,300 760,033Singapore Press Holdings, Ltd. 274,800 560,020Singapore Technologies Engineering, Ltd. 271,400 732,025Singapore Telecommunications, Ltd. 1,410,760 3,855,360StarHub, Ltd. 98,300 189,279Suntec Real Estate Investment Trust 414,400 580,097United Overseas Bank, Ltd. 227,900 4,041,251UOL Group, Ltd. 85,000 513,571Wilmar International, Ltd. 281,800 691,308
31,565,106South Africa - 1.6%Anglo American Platinum, Ltd. (B) 4,986 135,200AngloGold Ashanti, Ltd. 37,286 377,523Aspen Pharmacare Holdings, Ltd. 36,157 806,145Barclays Africa Group, Ltd. 62,902 717,760Bid Corp., Ltd. 31,272 710,818Capitec Bank Holdings, Ltd. 3,674 254,499Coronation Fund Managers, Ltd. 21,409 115,982Discovery, Ltd. 35,256 408,451Exxaro Resources, Ltd. 19,209 193,600FirstRand, Ltd. 315,230 1,347,540Fortress Income Fund, Ltd. 73,540 222,862Fortress Income Fund, Ltd., Class A 90,590 122,169Gold Fields, Ltd. 74,986 334,839Growthpoint Properties, Ltd. 193,571 374,587Hyprop Investments, Ltd. 22,704 199,315Impala Platinum Holdings, Ltd. (B) 57,997 179,361Imperial Holdings, Ltd. 14,010 225,010Investec PLC 23,544 179,874Investec, Ltd. 24,901 189,822Liberty Holdings, Ltd. 14,774 117,721
John Hancock Funds IIPortfolio of Investments — August 31, 2017 (showing percentage of total net assets)
102
International Strategic Equity Allocation Fund(continued)
Shares orPrincipalAmount Value
COMMON STOCKS (continued)South Africa (continued)Life Healthcare Group Holdings, Ltd. 120,441 $ 244,844Massmart Holdings, Ltd. 10,129 94,731Mediclinic International PLC 12,761 126,395MMI Holdings, Ltd. 101,695 162,773Mondi PLC 12,936 353,471Mondi, Ltd. 10,753 293,578Mr. Price Group, Ltd. 22,608 315,169MTN Group, Ltd. 158,256 1,574,668Naspers, Ltd., N Shares 40,880 9,260,508Nedbank Group, Ltd. 20,761 350,960Netcare, Ltd. 94,144 175,061Pick n Pay Stores, Ltd. 33,154 163,096Pioneer Foods Group, Ltd. 11,878 115,727PSG Group, Ltd. 8,584 166,768Rand Merchant Investment
Holdings, Ltd. 70,803 226,666Redefine Properties, Ltd. 459,367 376,491Remgro, Ltd. 49,381 825,655Resilient REIT, Ltd. 25,117 241,471RMB Holdings, Ltd. 65,929 336,854Sanlam, Ltd. 136,977 756,738Sappi, Ltd. 51,178 344,290Sasol, Ltd. 51,800 1,566,338Shoprite Holdings, Ltd. 40,016 693,184Sibanye Gold, Ltd. 156,074 249,073Standard Bank Group, Ltd. 121,034 1,559,940Steinhoff International Holdings NV 277,349 1,341,680Telkom SA SOC, Ltd. 24,507 118,339The Bidvest Group, Ltd. 30,906 407,564The Foschini Group, Ltd. 20,987 247,535The SPAR Group, Ltd. 17,440 226,758Tiger Brands, Ltd. 15,159 469,895Truworths International, Ltd. 40,848 260,619Vodacom Group, Ltd. 47,839 667,795Woolworths Holdings, Ltd. 92,413 421,905
31,949,617South Korea - 4.0%Amorepacific Corp. 3,807 974,826AMOREPACIFIC Group 3,462 412,203BGF retail Company, Ltd. 2,690 217,812BNK Financial Group, Inc. 31,108 272,321Celltrion, Inc. (A)(B) 9,437 966,311Cheil Worldwide, Inc. 8,266 139,445CJ CheilJedang Corp. 944 304,019CJ Corp. 1,743 274,148CJ E&M Corp. 2,324 156,967CJ Logistics Corp. (B) 964 144,607Coway Company, Ltd. 6,369 559,116Daelim Industrial Company, Ltd. 3,341 248,949Daewoo Engineering & Construction
Company, Ltd. (B) 15,856 99,103DGB Financial Group, Inc. 20,414 199,319Dongbu Insurance Company, Ltd. 6,167 411,602Dongsuh Company, Inc. 4,261 100,261Doosan Bobcat, Inc. 4,454 151,039Doosan Heavy Industries & Construction
Company, Ltd. 6,565 105,072E-MART, Inc. 2,484 494,612GS Engineering & Construction
Corp. (B) 6,101 154,737GS Holdings Corp. 6,097 382,760GS Retail Company, Ltd. 3,273 117,223Hana Financial Group, Inc. 35,051 1,524,362
International Strategic Equity Allocation Fund(continued)
Shares orPrincipalAmount Value
COMMON STOCKS (continued)South Korea (continued)Hankook Tire Company, Ltd. 8,787 $ 460,859Hanmi Pharm Company, Ltd. (B) 731 262,132Hanmi Science Company, Ltd. (B) 1,512 120,586Hanon Systems 21,949 225,570Hanssem Company, Ltd. 1,272 192,018Hanwha Life Insurance Company, Ltd. 19,678 127,886Hanwha Techwin Company, Ltd. (B) 3,100 106,733Hotel Shilla Company, Ltd. 3,765 207,297Hyosung Corp. 2,556 360,326Hyundai Department Store
Company, Ltd. 1,683 144,304Hyundai Development Co-Engineering &
Construction 7,335 245,489Hyundai Engineering & Construction
Company, Ltd. 9,407 340,069Hyundai Glovis Company, Ltd. 2,263 311,801Hyundai Heavy Industries
Company, Ltd. (B) 3,735 493,299Hyundai Marine & Fire Insurance
Company, Ltd. 7,982 327,819Hyundai Mobis Company, Ltd. 8,038 1,684,262Hyundai Motor Company 18,058 2,254,754Hyundai Robotics Company, Ltd. (B) 1,165 458,047Hyundai Steel Company 9,521 487,627Hyundai Wia Corp. (A) 1,940 120,704Industrial Bank of Korea 29,964 397,305Kakao Corp. 4,033 441,172Kangwon Land, Inc. 13,979 428,065KB Financial Group, Inc. 46,941 2,309,431KCC Corp. 706 248,222KEPCO Plant Service & Engineering
Company, Ltd. 2,684 109,057Kia Motors Corp. 31,043 977,635Korea Aerospace Industries, Ltd. 8,230 338,385Korea Electric Power Corp. 30,419 1,162,409Korea Gas Corp. (B) 3,486 140,305Korea Investment Holdings
Company, Ltd. 4,761 278,034Korea Zinc Company, Ltd. 992 454,247Korean Air Lines Company, Ltd. (B) 5,490 162,241KT&G Corp. 13,772 1,400,138Kumho Petrochemical Company, Ltd. 2,264 158,533LG Chem, Ltd. 5,424 1,827,796LG Corp. 11,329 845,720LG Display Company, Ltd. 27,597 765,726LG Electronics, Inc. 12,590 912,621LG Household & Health Care, Ltd. 1,107 943,017LG Innotek Company, Ltd. 1,733 284,954LG Uplus Corp. 13,329 163,574Lotte Chemical Corp. 1,841 654,263Lotte Chilsung Beverage Company, Ltd. 71 97,488Lotte Confectionery Company, Ltd. 664 116,558Lotte Shopping Company, Ltd. 1,511 344,796Medy-Tox, Inc. 508 256,814Mirae Asset Daewoo Company, Ltd. 44,207 399,028NAVER Corp. 3,296 2,210,760NCSoft Corp. 2,079 710,255Netmarble Games Corp. (B)(C) 2,101 288,849NH Investment & Securities
Company, Ltd. 17,411 213,528OCI Company, Ltd. 2,056 179,884Orion Corp. (B) 2,862 221,579Ottogi Corp. 148 99,947Pan Ocean Company, Ltd. (B) 26,501 151,295
John Hancock Funds IIPortfolio of Investments — August 31, 2017 (showing percentage of total net assets)
103
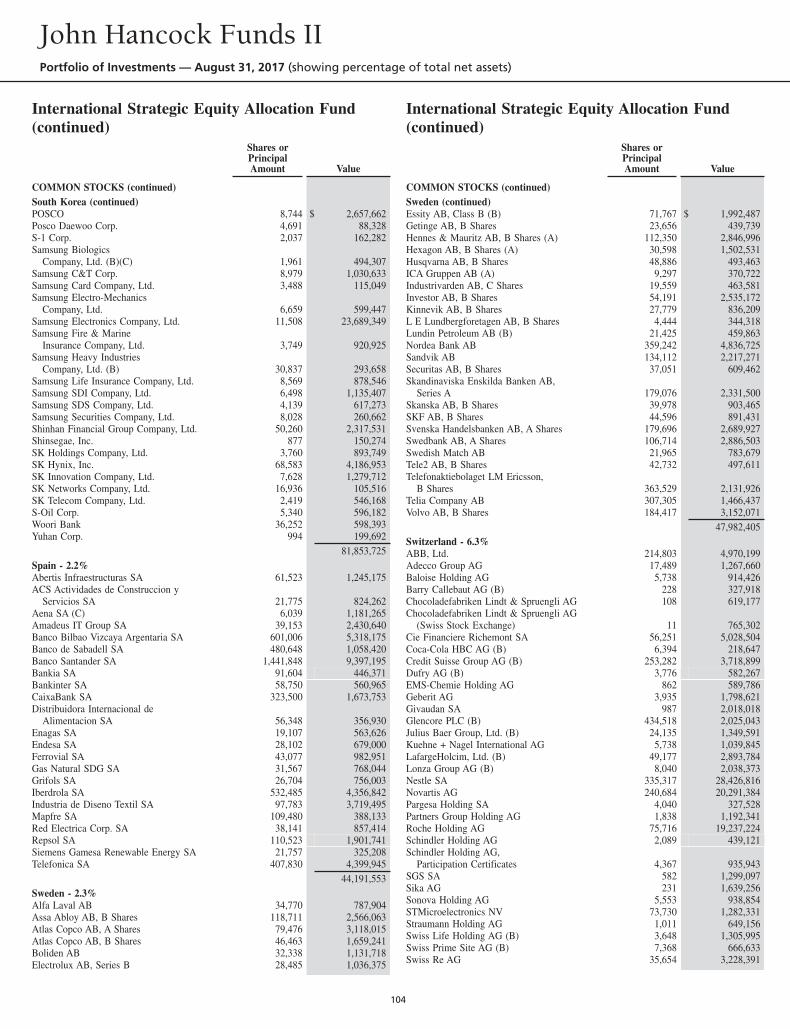
International Strategic Equity Allocation Fund(continued)
Shares orPrincipalAmount Value
COMMON STOCKS (continued)South Korea (continued)POSCO 8,744 $ 2,657,662Posco Daewoo Corp. 4,691 88,328S-1 Corp. 2,037 162,282Samsung Biologics
Company, Ltd. (B)(C) 1,961 494,307Samsung C&T Corp. 8,979 1,030,633Samsung Card Company, Ltd. 3,488 115,049Samsung Electro-Mechanics
Company, Ltd. 6,659 599,447Samsung Electronics Company, Ltd. 11,508 23,689,349Samsung Fire & Marine
Insurance Company, Ltd. 3,749 920,925Samsung Heavy Industries
Company, Ltd. (B) 30,837 293,658Samsung Life Insurance Company, Ltd. 8,569 878,546Samsung SDI Company, Ltd. 6,498 1,135,407Samsung SDS Company, Ltd. 4,139 617,273Samsung Securities Company, Ltd. 8,028 260,662Shinhan Financial Group Company, Ltd. 50,260 2,317,531Shinsegae, Inc. 877 150,274SK Holdings Company, Ltd. 3,760 893,749SK Hynix, Inc. 68,583 4,186,953SK Innovation Company, Ltd. 7,628 1,279,712SK Networks Company, Ltd. 16,936 105,516SK Telecom Company, Ltd. 2,419 546,168S-Oil Corp. 5,340 596,182Woori Bank 36,252 598,393Yuhan Corp. 994 199,692
81,853,725Spain - 2.2%Abertis Infraestructuras SA 61,523 1,245,175ACS Actividades de Construccion y
Servicios SA 21,775 824,262Aena SA (C) 6,039 1,181,265Amadeus IT Group SA 39,153 2,430,640Banco Bilbao Vizcaya Argentaria SA 601,006 5,318,175Banco de Sabadell SA 480,648 1,058,420Banco Santander SA 1,441,848 9,397,195Bankia SA 91,604 446,371Bankinter SA 58,750 560,965CaixaBank SA 323,500 1,673,753Distribuidora Internacional de
Alimentacion SA 56,348 356,930Enagas SA 19,107 563,626Endesa SA 28,102 679,000Ferrovial SA 43,077 982,951Gas Natural SDG SA 31,567 768,044Grifols SA 26,704 756,003Iberdrola SA 532,485 4,356,842Industria de Diseno Textil SA 97,783 3,719,495Mapfre SA 109,480 388,133Red Electrica Corp. SA 38,141 857,414Repsol SA 110,523 1,901,741Siemens Gamesa Renewable Energy SA 21,757 325,208Telefonica SA 407,830 4,399,945
44,191,553Sweden - 2.3%Alfa Laval AB 34,770 787,904Assa Abloy AB, B Shares 118,711 2,566,063Atlas Copco AB, A Shares 79,476 3,118,015Atlas Copco AB, B Shares 46,463 1,659,241Boliden AB 32,338 1,131,718Electrolux AB, Series B 28,485 1,036,375
International Strategic Equity Allocation Fund(continued)
Shares orPrincipalAmount Value
COMMON STOCKS (continued)Sweden (continued)Essity AB, Class B (B) 71,767 $ 1,992,487Getinge AB, B Shares 23,656 439,739Hennes & Mauritz AB, B Shares (A) 112,350 2,846,996Hexagon AB, B Shares (A) 30,598 1,502,531Husqvarna AB, B Shares 48,886 493,463ICA Gruppen AB (A) 9,297 370,722Industrivarden AB, C Shares 19,559 463,581Investor AB, B Shares 54,191 2,535,172Kinnevik AB, B Shares 27,779 836,209L E Lundbergforetagen AB, B Shares 4,444 344,318Lundin Petroleum AB (B) 21,425 459,863Nordea Bank AB 359,242 4,836,725Sandvik AB 134,112 2,217,271Securitas AB, B Shares 37,051 609,462Skandinaviska Enskilda Banken AB,
Series A 179,076 2,331,500Skanska AB, B Shares 39,978 903,465SKF AB, B Shares 44,596 891,431Svenska Handelsbanken AB, A Shares 179,696 2,689,927Swedbank AB, A Shares 106,714 2,886,503Swedish Match AB 21,965 783,679Tele2 AB, B Shares 42,732 497,611Telefonaktiebolaget LM Ericsson,
B Shares 363,529 2,131,926Telia Company AB 307,305 1,466,437Volvo AB, B Shares 184,417 3,152,071
47,982,405Switzerland - 6.3%ABB, Ltd. 214,803 4,970,199Adecco Group AG 17,489 1,267,660Baloise Holding AG 5,738 914,426Barry Callebaut AG (B) 228 327,918Chocoladefabriken Lindt & Spruengli AG 108 619,177Chocoladefabriken Lindt & Spruengli AG
(Swiss Stock Exchange) 11 765,302Cie Financiere Richemont SA 56,251 5,028,504Coca-Cola HBC AG (B) 6,394 218,647Credit Suisse Group AG (B) 253,282 3,718,899Dufry AG (B) 3,776 582,267EMS-Chemie Holding AG 862 589,786Geberit AG 3,935 1,798,621Givaudan SA 987 2,018,018Glencore PLC (B) 434,518 2,025,043Julius Baer Group, Ltd. (B) 24,135 1,349,591Kuehne + Nagel International AG 5,738 1,039,845LafargeHolcim, Ltd. (B) 49,177 2,893,784Lonza Group AG (B) 8,040 2,038,373Nestle SA 335,317 28,426,816Novartis AG 240,684 20,291,384Pargesa Holding SA 4,040 327,528Partners Group Holding AG 1,838 1,192,341Roche Holding AG 75,716 19,237,224Schindler Holding AG 2,089 439,121Schindler Holding AG,
Participation Certificates 4,367 935,943SGS SA 582 1,299,097Sika AG 231 1,639,256Sonova Holding AG 5,553 938,854STMicroelectronics NV 73,730 1,282,331Straumann Holding AG 1,011 649,156Swiss Life Holding AG (B) 3,648 1,305,995Swiss Prime Site AG (B) 7,368 666,633Swiss Re AG 35,654 3,228,391
John Hancock Funds IIPortfolio of Investments — August 31, 2017 (showing percentage of total net assets)
104
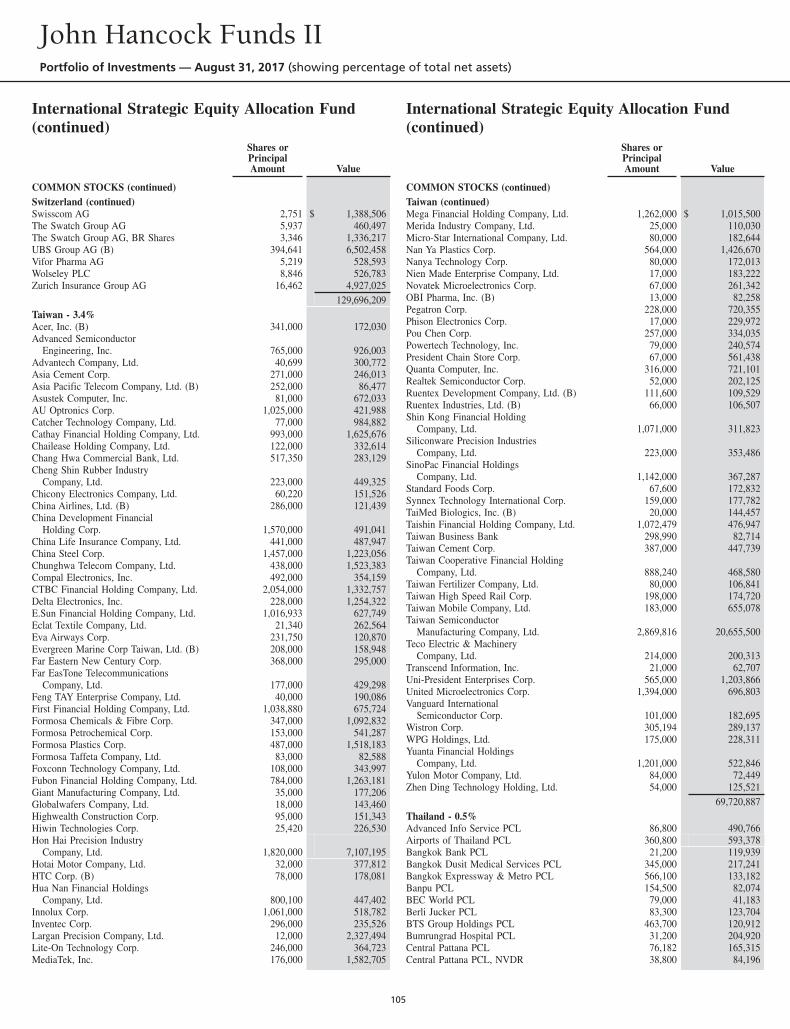
International Strategic Equity Allocation Fund(continued)
Shares orPrincipalAmount Value
COMMON STOCKS (continued)Switzerland (continued)Swisscom AG 2,751 $ 1,388,506The Swatch Group AG 5,937 460,497The Swatch Group AG, BR Shares 3,346 1,336,217UBS Group AG (B) 394,641 6,502,458Vifor Pharma AG 5,219 528,593Wolseley PLC 8,846 526,783Zurich Insurance Group AG 16,462 4,927,025
129,696,209Taiwan - 3.4%Acer, Inc. (B) 341,000 172,030Advanced Semiconductor
Engineering, Inc. 765,000 926,003Advantech Company, Ltd. 40,699 300,772Asia Cement Corp. 271,000 246,013Asia Pacific Telecom Company, Ltd. (B) 252,000 86,477Asustek Computer, Inc. 81,000 672,033AU Optronics Corp. 1,025,000 421,988Catcher Technology Company, Ltd. 77,000 984,882Cathay Financial Holding Company, Ltd. 993,000 1,625,676Chailease Holding Company, Ltd. 122,000 332,614Chang Hwa Commercial Bank, Ltd. 517,350 283,129Cheng Shin Rubber Industry
Company, Ltd. 223,000 449,325Chicony Electronics Company, Ltd. 60,220 151,526China Airlines, Ltd. (B) 286,000 121,439China Development Financial
Holding Corp. 1,570,000 491,041China Life Insurance Company, Ltd. 441,000 487,947China Steel Corp. 1,457,000 1,223,056Chunghwa Telecom Company, Ltd. 438,000 1,523,383Compal Electronics, Inc. 492,000 354,159CTBC Financial Holding Company, Ltd. 2,054,000 1,332,757Delta Electronics, Inc. 228,000 1,254,322E.Sun Financial Holding Company, Ltd. 1,016,933 627,749Eclat Textile Company, Ltd. 21,340 262,564Eva Airways Corp. 231,750 120,870Evergreen Marine Corp Taiwan, Ltd. (B) 208,000 158,948Far Eastern New Century Corp. 368,000 295,000Far EasTone Telecommunications
Company, Ltd. 177,000 429,298Feng TAY Enterprise Company, Ltd. 40,000 190,086First Financial Holding Company, Ltd. 1,038,880 675,724Formosa Chemicals & Fibre Corp. 347,000 1,092,832Formosa Petrochemical Corp. 153,000 541,287Formosa Plastics Corp. 487,000 1,518,183Formosa Taffeta Company, Ltd. 83,000 82,588Foxconn Technology Company, Ltd. 108,000 343,997Fubon Financial Holding Company, Ltd. 784,000 1,263,181Giant Manufacturing Company, Ltd. 35,000 177,206Globalwafers Company, Ltd. 18,000 143,460Highwealth Construction Corp. 95,000 151,343Hiwin Technologies Corp. 25,420 226,530Hon Hai Precision Industry
Company, Ltd. 1,820,000 7,107,195Hotai Motor Company, Ltd. 32,000 377,812HTC Corp. (B) 78,000 178,081Hua Nan Financial Holdings
Company, Ltd. 800,100 447,402Innolux Corp. 1,061,000 518,782Inventec Corp. 296,000 235,526Largan Precision Company, Ltd. 12,000 2,327,494Lite-On Technology Corp. 246,000 364,723MediaTek, Inc. 176,000 1,582,705
International Strategic Equity Allocation Fund(continued)
Shares orPrincipalAmount Value
COMMON STOCKS (continued)Taiwan (continued)Mega Financial Holding Company, Ltd. 1,262,000 $ 1,015,500Merida Industry Company, Ltd. 25,000 110,030Micro-Star International Company, Ltd. 80,000 182,644Nan Ya Plastics Corp. 564,000 1,426,670Nanya Technology Corp. 80,000 172,013Nien Made Enterprise Company, Ltd. 17,000 183,222Novatek Microelectronics Corp. 67,000 261,342OBI Pharma, Inc. (B) 13,000 82,258Pegatron Corp. 228,000 720,355Phison Electronics Corp. 17,000 229,972Pou Chen Corp. 257,000 334,035Powertech Technology, Inc. 79,000 240,574President Chain Store Corp. 67,000 561,438Quanta Computer, Inc. 316,000 721,101Realtek Semiconductor Corp. 52,000 202,125Ruentex Development Company, Ltd. (B) 111,600 109,529Ruentex Industries, Ltd. (B) 66,000 106,507Shin Kong Financial Holding
Company, Ltd. 1,071,000 311,823Siliconware Precision Industries
Company, Ltd. 223,000 353,486SinoPac Financial Holdings
Company, Ltd. 1,142,000 367,287Standard Foods Corp. 67,600 172,832Synnex Technology International Corp. 159,000 177,782TaiMed Biologics, Inc. (B) 20,000 144,457Taishin Financial Holding Company, Ltd. 1,072,479 476,947Taiwan Business Bank 298,990 82,714Taiwan Cement Corp. 387,000 447,739Taiwan Cooperative Financial Holding
Company, Ltd. 888,240 468,580Taiwan Fertilizer Company, Ltd. 80,000 106,841Taiwan High Speed Rail Corp. 198,000 174,720Taiwan Mobile Company, Ltd. 183,000 655,078Taiwan Semiconductor
Manufacturing Company, Ltd. 2,869,816 20,655,500Teco Electric & Machinery
Company, Ltd. 214,000 200,313Transcend Information, Inc. 21,000 62,707Uni-President Enterprises Corp. 565,000 1,203,866United Microelectronics Corp. 1,394,000 696,803Vanguard International
Semiconductor Corp. 101,000 182,695Wistron Corp. 305,194 289,137WPG Holdings, Ltd. 175,000 228,311Yuanta Financial Holdings
Company, Ltd. 1,201,000 522,846Yulon Motor Company, Ltd. 84,000 72,449Zhen Ding Technology Holding, Ltd. 54,000 125,521
69,720,887Thailand - 0.5%Advanced Info Service PCL 86,800 490,766Airports of Thailand PCL 360,800 593,378Bangkok Bank PCL 21,200 119,939Bangkok Dusit Medical Services PCL 345,000 217,241Bangkok Expressway & Metro PCL 566,100 133,182Banpu PCL 154,500 82,074BEC World PCL 79,000 41,183Berli Jucker PCL 83,300 123,704BTS Group Holdings PCL 463,700 120,912Bumrungrad Hospital PCL 31,200 204,920Central Pattana PCL 76,182 165,315Central Pattana PCL, NVDR 38,800 84,196
John Hancock Funds IIPortfolio of Investments — August 31, 2017 (showing percentage of total net assets)
105
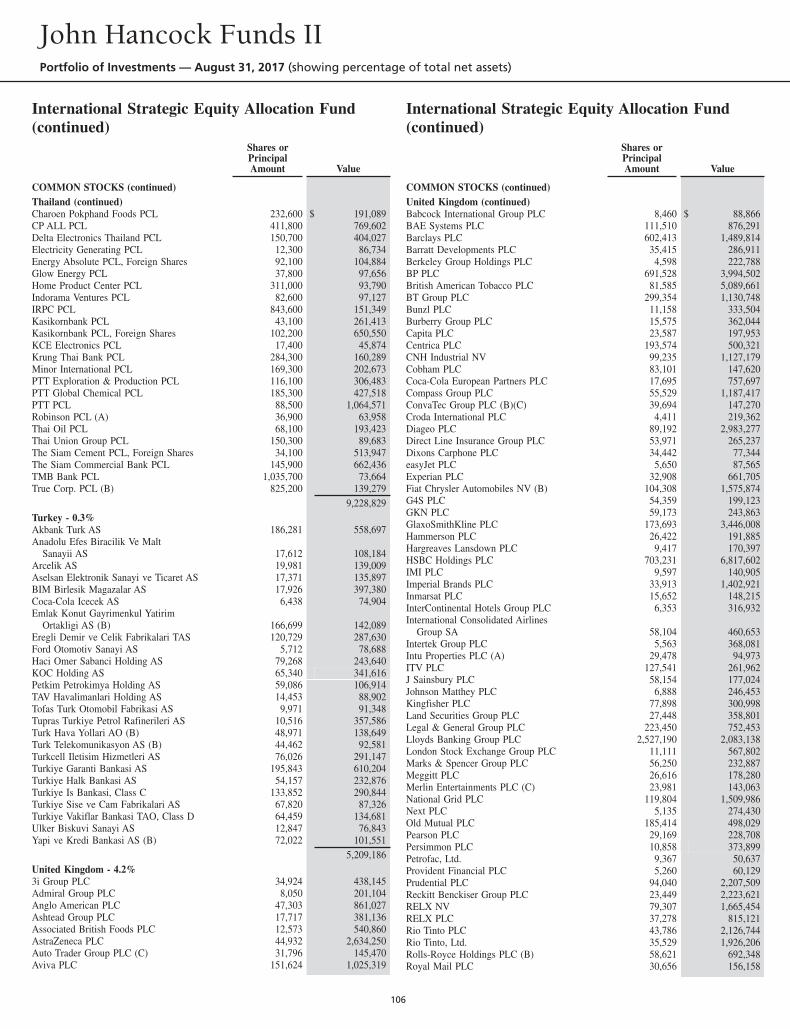
International Strategic Equity Allocation Fund(continued)
Shares orPrincipalAmount Value
COMMON STOCKS (continued)Thailand (continued)Charoen Pokphand Foods PCL 232,600 $ 191,089CP ALL PCL 411,800 769,602Delta Electronics Thailand PCL 150,700 404,027Electricity Generating PCL 12,300 86,734Energy Absolute PCL, Foreign Shares 92,100 104,884Glow Energy PCL 37,800 97,656Home Product Center PCL 311,000 93,790Indorama Ventures PCL 82,600 97,127IRPC PCL 843,600 151,349Kasikornbank PCL 43,100 261,413Kasikornbank PCL, Foreign Shares 102,200 650,550KCE Electronics PCL 17,400 45,874Krung Thai Bank PCL 284,300 160,289Minor International PCL 169,300 202,673PTT Exploration & Production PCL 116,100 306,483PTT Global Chemical PCL 185,300 427,518PTT PCL 88,500 1,064,571Robinson PCL (A) 36,900 63,958Thai Oil PCL 68,100 193,423Thai Union Group PCL 150,300 89,683The Siam Cement PCL, Foreign Shares 34,100 513,947The Siam Commercial Bank PCL 145,900 662,436TMB Bank PCL 1,035,700 73,664True Corp. PCL (B) 825,200 139,279
9,228,829Turkey - 0.3%Akbank Turk AS 186,281 558,697Anadolu Efes Biracilik Ve Malt
Sanayii AS 17,612 108,184Arcelik AS 19,981 139,009Aselsan Elektronik Sanayi ve Ticaret AS 17,371 135,897BIM Birlesik Magazalar AS 17,926 397,380Coca-Cola Icecek AS 6,438 74,904Emlak Konut Gayrimenkul Yatirim
Ortakligi AS (B) 166,699 142,089Eregli Demir ve Celik Fabrikalari TAS 120,729 287,630Ford Otomotiv Sanayi AS 5,712 78,688Haci Omer Sabanci Holding AS 79,268 243,640KOC Holding AS 65,340 341,616Petkim Petrokimya Holding AS 59,086 106,914TAV Havalimanlari Holding AS 14,453 88,902Tofas Turk Otomobil Fabrikasi AS 9,971 91,348Tupras Turkiye Petrol Rafinerileri AS 10,516 357,586Turk Hava Yollari AO (B) 48,971 138,649Turk Telekomunikasyon AS (B) 44,462 92,581Turkcell Iletisim Hizmetleri AS 76,026 291,147Turkiye Garanti Bankasi AS 195,843 610,204Turkiye Halk Bankasi AS 54,157 232,876Turkiye Is Bankasi, Class C 133,852 290,844Turkiye Sise ve Cam Fabrikalari AS 67,820 87,326Turkiye Vakiflar Bankasi TAO, Class D 64,459 134,681Ulker Biskuvi Sanayi AS 12,847 76,843Yapi ve Kredi Bankasi AS (B) 72,022 101,551
5,209,186United Kingdom - 4.2%3i Group PLC 34,924 438,145Admiral Group PLC 8,050 201,104Anglo American PLC 47,303 861,027Ashtead Group PLC 17,717 381,136Associated British Foods PLC 12,573 540,860AstraZeneca PLC 44,932 2,634,250Auto Trader Group PLC (C) 31,796 145,470Aviva PLC 151,624 1,025,319
International Strategic Equity Allocation Fund(continued)
Shares orPrincipalAmount Value
COMMON STOCKS (continued)United Kingdom (continued)Babcock International Group PLC 8,460 $ 88,866BAE Systems PLC 111,510 876,291Barclays PLC 602,413 1,489,814Barratt Developments PLC 35,415 286,911Berkeley Group Holdings PLC 4,598 222,788BP PLC 691,528 3,994,502British American Tobacco PLC 81,585 5,089,661BT Group PLC 299,354 1,130,748Bunzl PLC 11,158 333,504Burberry Group PLC 15,575 362,044Capita PLC 23,587 197,953Centrica PLC 193,574 500,321CNH Industrial NV 99,235 1,127,179Cobham PLC 83,101 147,620Coca-Cola European Partners PLC 17,695 757,697Compass Group PLC 55,529 1,187,417ConvaTec Group PLC (B)(C) 39,694 147,270Croda International PLC 4,411 219,362Diageo PLC 89,192 2,983,277Direct Line Insurance Group PLC 53,971 265,237Dixons Carphone PLC 34,442 77,344easyJet PLC 5,650 87,565Experian PLC 32,908 661,705Fiat Chrysler Automobiles NV (B) 104,308 1,575,874G4S PLC 54,359 199,123GKN PLC 59,173 243,863GlaxoSmithKline PLC 173,693 3,446,008Hammerson PLC 26,422 191,885Hargreaves Lansdown PLC 9,417 170,397HSBC Holdings PLC 703,231 6,817,602IMI PLC 9,597 140,905Imperial Brands PLC 33,913 1,402,921Inmarsat PLC 15,652 148,215InterContinental Hotels Group PLC 6,353 316,932International Consolidated Airlines
Group SA 58,104 460,653Intertek Group PLC 5,563 368,081Intu Properties PLC (A) 29,478 94,973ITV PLC 127,541 261,962J Sainsbury PLC 58,154 177,024Johnson Matthey PLC 6,888 246,453Kingfisher PLC 77,898 300,998Land Securities Group PLC 27,448 358,801Legal & General Group PLC 223,450 752,453Lloyds Banking Group PLC 2,527,190 2,083,138London Stock Exchange Group PLC 11,111 567,802Marks & Spencer Group PLC 56,250 232,887Meggitt PLC 26,616 178,280Merlin Entertainments PLC (C) 23,981 143,063National Grid PLC 119,804 1,509,986Next PLC 5,135 274,430Old Mutual PLC 185,414 498,029Pearson PLC 29,169 228,708Persimmon PLC 10,858 373,899Petrofac, Ltd. 9,367 50,637Provident Financial PLC 5,260 60,129Prudential PLC 94,040 2,207,509Reckitt Benckiser Group PLC 23,449 2,223,621RELX NV 79,307 1,665,454RELX PLC 37,278 815,121Rio Tinto PLC 43,786 2,126,744Rio Tinto, Ltd. 35,529 1,926,206Rolls-Royce Holdings PLC (B) 58,621 692,348Royal Mail PLC 30,656 156,158
John Hancock Funds IIPortfolio of Investments — August 31, 2017 (showing percentage of total net assets)
106
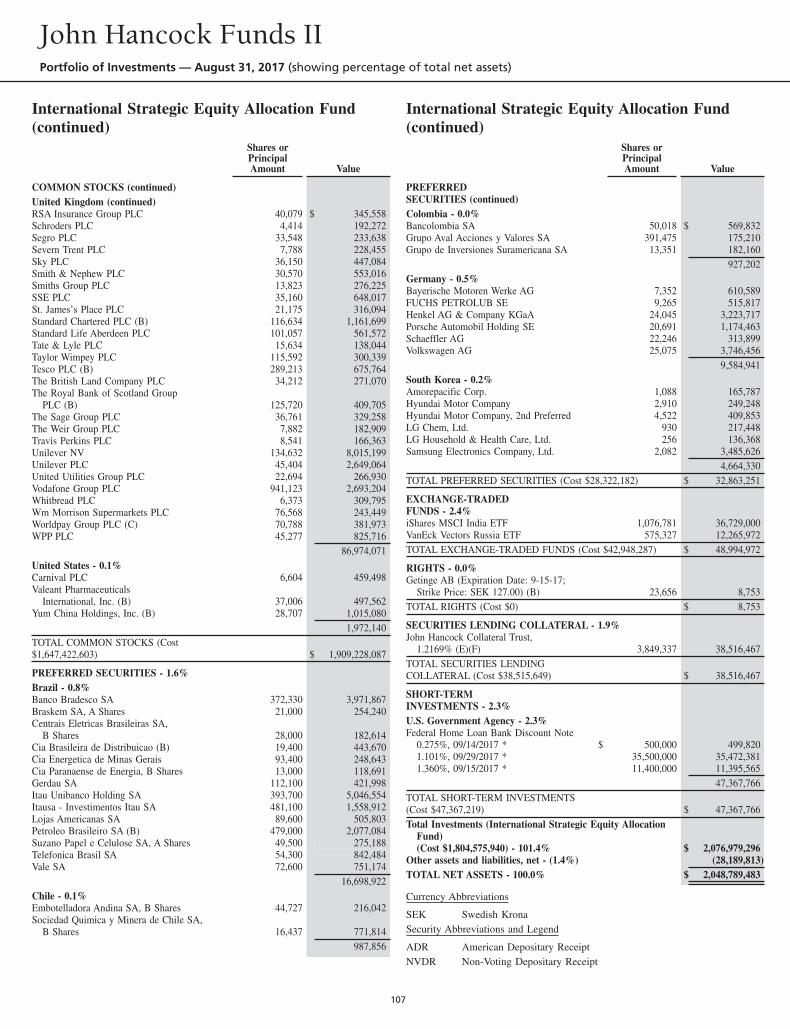
International Strategic Equity Allocation Fund(continued)
Shares orPrincipalAmount Value
COMMON STOCKS (continued)United Kingdom (continued)RSA Insurance Group PLC 40,079 $ 345,558Schroders PLC 4,414 192,272Segro PLC 33,548 233,638Severn Trent PLC 7,788 228,455Sky PLC 36,150 447,084Smith & Nephew PLC 30,570 553,016Smiths Group PLC 13,823 276,225SSE PLC 35,160 648,017St. James’s Place PLC 21,175 316,094Standard Chartered PLC (B) 116,634 1,161,699Standard Life Aberdeen PLC 101,057 561,572Tate & Lyle PLC 15,634 138,044Taylor Wimpey PLC 115,592 300,339Tesco PLC (B) 289,213 675,764The British Land Company PLC 34,212 271,070The Royal Bank of Scotland Group
PLC (B) 125,720 409,705The Sage Group PLC 36,761 329,258The Weir Group PLC 7,882 182,909Travis Perkins PLC 8,541 166,363Unilever NV 134,632 8,015,199Unilever PLC 45,404 2,649,064United Utilities Group PLC 22,694 266,930Vodafone Group PLC 941,123 2,693,204Whitbread PLC 6,373 309,795Wm Morrison Supermarkets PLC 76,568 243,449Worldpay Group PLC (C) 70,788 381,973WPP PLC 45,277 825,716
86,974,071United States - 0.1%Carnival PLC 6,604 459,498Valeant Pharmaceuticals
International, Inc. (B) 37,006 497,562Yum China Holdings, Inc. (B) 28,707 1,015,080
1,972,140TOTAL COMMON STOCKS (Cost$1,647,422,603) $ 1,909,228,087
PREFERRED SECURITIES - 1.6%Brazil - 0.8%Banco Bradesco SA 372,330 3,971,867Braskem SA, A Shares 21,000 254,240Centrais Eletricas Brasileiras SA,
B Shares 28,000 182,614Cia Brasileira de Distribuicao (B) 19,400 443,670Cia Energetica de Minas Gerais 93,400 248,643Cia Paranaense de Energia, B Shares 13,000 118,691Gerdau SA 112,100 421,998Itau Unibanco Holding SA 393,700 5,046,554Itausa - Investimentos Itau SA 481,100 1,558,912Lojas Americanas SA 89,600 505,803Petroleo Brasileiro SA (B) 479,000 2,077,084Suzano Papel e Celulose SA, A Shares 49,500 275,188Telefonica Brasil SA 54,300 842,484Vale SA 72,600 751,174
16,698,922Chile - 0.1%Embotelladora Andina SA, B Shares 44,727 216,042Sociedad Quimica y Minera de Chile SA,
B Shares 16,437 771,814987,856
International Strategic Equity Allocation Fund(continued)
Shares orPrincipalAmount Value
PREFERREDSECURITIES (continued)Colombia - 0.0%Bancolombia SA 50,018 $ 569,832Grupo Aval Acciones y Valores SA 391,475 175,210Grupo de Inversiones Suramericana SA 13,351 182,160
927,202Germany - 0.5%Bayerische Motoren Werke AG 7,352 610,589FUCHS PETROLUB SE 9,265 515,817Henkel AG & Company KGaA 24,045 3,223,717Porsche Automobil Holding SE 20,691 1,174,463Schaeffler AG 22,246 313,899Volkswagen AG 25,075 3,746,456
9,584,941South Korea - 0.2%Amorepacific Corp. 1,088 165,787Hyundai Motor Company 2,910 249,248Hyundai Motor Company, 2nd Preferred 4,522 409,853LG Chem, Ltd. 930 217,448LG Household & Health Care, Ltd. 256 136,368Samsung Electronics Company, Ltd. 2,082 3,485,626
4,664,330TOTAL PREFERRED SECURITIES (Cost $28,322,182) $ 32,863,251
EXCHANGE-TRADEDFUNDS - 2.4%iShares MSCI India ETF 1,076,781 36,729,000VanEck Vectors Russia ETF 575,327 12,265,972TOTAL EXCHANGE-TRADED FUNDS (Cost $42,948,287) $ 48,994,972
RIGHTS - 0.0%Getinge AB (Expiration Date: 9-15-17;
Strike Price: SEK 127.00) (B) 23,656 8,753TOTAL RIGHTS (Cost $0) $ 8,753
SECURITIES LENDING COLLATERAL - 1.9%John Hancock Collateral Trust,
1.2169% (E)(F) 3,849,337 38,516,467TOTAL SECURITIES LENDINGCOLLATERAL (Cost $38,515,649) $ 38,516,467
SHORT-TERMINVESTMENTS - 2.3%U.S. Government Agency - 2.3%Federal Home Loan Bank Discount Note
0.275%, 09/14/2017 * $ 500,000 499,8201.101%, 09/29/2017 * 35,500,000 35,472,3811.360%, 09/15/2017 * 11,400,000 11,395,565
47,367,766TOTAL SHORT-TERM INVESTMENTS(Cost $47,367,219) $ 47,367,766Total Investments (International Strategic Equity Allocation
Fund)(Cost $1,804,575,940) - 101.4% $ 2,076,979,296
Other assets and liabilities, net - (1.4%) (28,189,813)TOTAL NET ASSETS - 100.0% $ 2,048,789,483
Currency Abbreviations
SEK Swedish KronaSecurity Abbreviations and Legend
ADR American Depositary ReceiptNVDR Non-Voting Depositary Receipt
John Hancock Funds IIPortfolio of Investments — August 31, 2017 (showing percentage of total net assets)
107
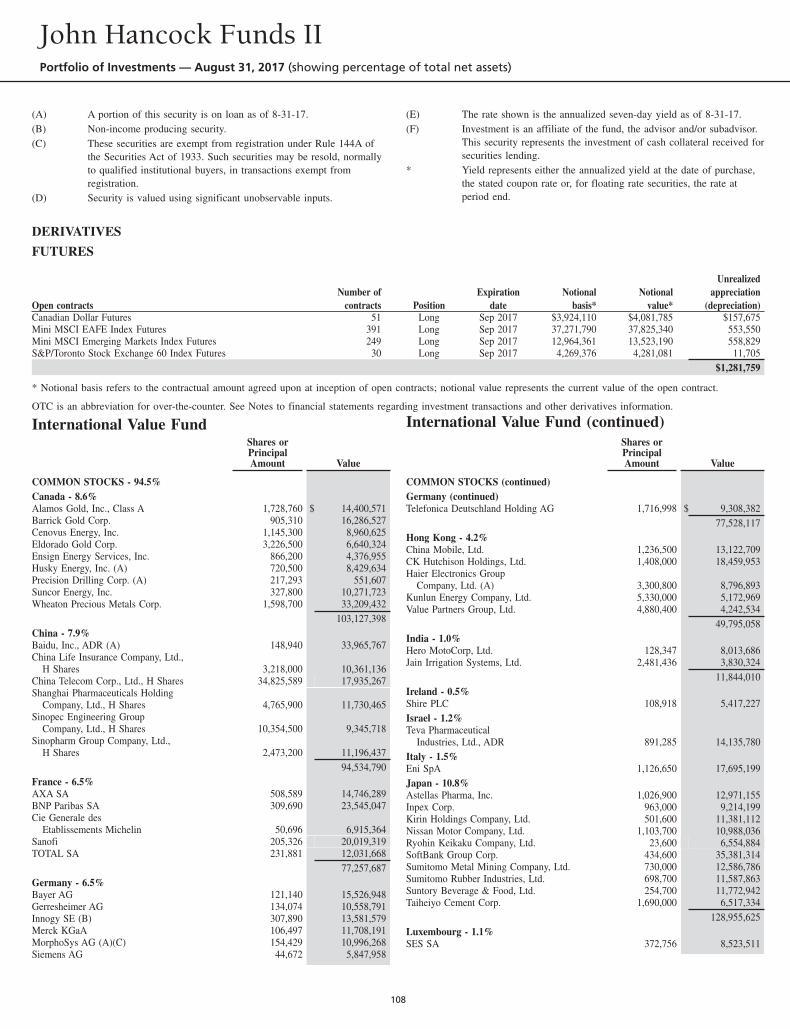
(A) A portion of this security is on loan as of 8-31-17.(B) Non-income producing security.(C) These securities are exempt from registration under Rule 144A of
the Securities Act of 1933. Such securities may be resold, normallyto qualified institutional buyers, in transactions exempt fromregistration.
(D) Security is valued using significant unobservable inputs.
(E) The rate shown is the annualized seven-day yield as of 8-31-17.(F) Investment is an affiliate of the fund, the advisor and/or subadvisor.
This security represents the investment of cash collateral received forsecurities lending.
* Yield represents either the annualized yield at the date of purchase,the stated coupon rate or, for floating rate securities, the rate atperiod end.
DERIVATIVES
FUTURES
Open contractsNumber of
contracts PositionExpiration
dateNotional
basis*Notional
value*
Unrealizedappreciation
(depreciation)Canadian Dollar Futures 51 Long Sep 2017 $3,924,110 $4,081,785 $157,675Mini MSCI EAFE Index Futures 391 Long Sep 2017 37,271,790 37,825,340 553,550Mini MSCI Emerging Markets Index Futures 249 Long Sep 2017 12,964,361 13,523,190 558,829S&P/Toronto Stock Exchange 60 Index Futures 30 Long Sep 2017 4,269,376 4,281,081 11,705
$1,281,759
* Notional basis refers to the contractual amount agreed upon at inception of open contracts; notional value represents the current value of the open contract.
OTC is an abbreviation for over-the-counter. See Notes to financial statements regarding investment transactions and other derivatives information.
International Value FundShares orPrincipalAmount Value
COMMON STOCKS - 94.5%Canada - 8.6%Alamos Gold, Inc., Class A 1,728,760 $ 14,400,571Barrick Gold Corp. 905,310 16,286,527Cenovus Energy, Inc. 1,145,300 8,960,625Eldorado Gold Corp. 3,226,500 6,640,324Ensign Energy Services, Inc. 866,200 4,376,955Husky Energy, Inc. (A) 720,500 8,429,634Precision Drilling Corp. (A) 217,293 551,607Suncor Energy, Inc. 327,800 10,271,723Wheaton Precious Metals Corp. 1,598,700 33,209,432
103,127,398China - 7.9%Baidu, Inc., ADR (A) 148,940 33,965,767China Life Insurance Company, Ltd.,
H Shares 3,218,000 10,361,136China Telecom Corp., Ltd., H Shares 34,825,589 17,935,267Shanghai Pharmaceuticals Holding
Company, Ltd., H Shares 4,765,900 11,730,465Sinopec Engineering Group
Company, Ltd., H Shares 10,354,500 9,345,718Sinopharm Group Company, Ltd.,
H Shares 2,473,200 11,196,43794,534,790
France - 6.5%AXA SA 508,589 14,746,289BNP Paribas SA 309,690 23,545,047Cie Generale des
Etablissements Michelin 50,696 6,915,364Sanofi 205,326 20,019,319TOTAL SA 231,881 12,031,668
77,257,687Germany - 6.5%Bayer AG 121,140 15,526,948Gerresheimer AG 134,074 10,558,791Innogy SE (B) 307,890 13,581,579Merck KGaA 106,497 11,708,191MorphoSys AG (A)(C) 154,429 10,996,268Siemens AG 44,672 5,847,958
International Value Fund (continued)Shares orPrincipalAmount Value
COMMON STOCKS (continued)Germany (continued)Telefonica Deutschland Holding AG 1,716,998 $ 9,308,382
77,528,117Hong Kong - 4.2%China Mobile, Ltd. 1,236,500 13,122,709CK Hutchison Holdings, Ltd. 1,408,000 18,459,953Haier Electronics Group
Company, Ltd. (A) 3,300,800 8,796,893Kunlun Energy Company, Ltd. 5,330,000 5,172,969Value Partners Group, Ltd. 4,880,400 4,242,534
49,795,058India - 1.0%Hero MotoCorp, Ltd. 128,347 8,013,686Jain Irrigation Systems, Ltd. 2,481,436 3,830,324
11,844,010Ireland - 0.5%Shire PLC 108,918 5,417,227Israel - 1.2%Teva Pharmaceutical
Industries, Ltd., ADR 891,285 14,135,780Italy - 1.5%Eni SpA 1,126,650 17,695,199Japan - 10.8%Astellas Pharma, Inc. 1,026,900 12,971,155Inpex Corp. 963,000 9,214,199Kirin Holdings Company, Ltd. 501,600 11,381,112Nissan Motor Company, Ltd. 1,103,700 10,988,036Ryohin Keikaku Company, Ltd. 23,600 6,554,884SoftBank Group Corp. 434,600 35,381,314Sumitomo Metal Mining Company, Ltd. 730,000 12,586,786Sumitomo Rubber Industries, Ltd. 698,700 11,587,863Suntory Beverage & Food, Ltd. 254,700 11,772,942Taiheiyo Cement Corp. 1,690,000 6,517,334
128,955,625Luxembourg - 1.1%SES SA 372,756 8,523,511
John Hancock Funds IIPortfolio of Investments — August 31, 2017 (showing percentage of total net assets)
108
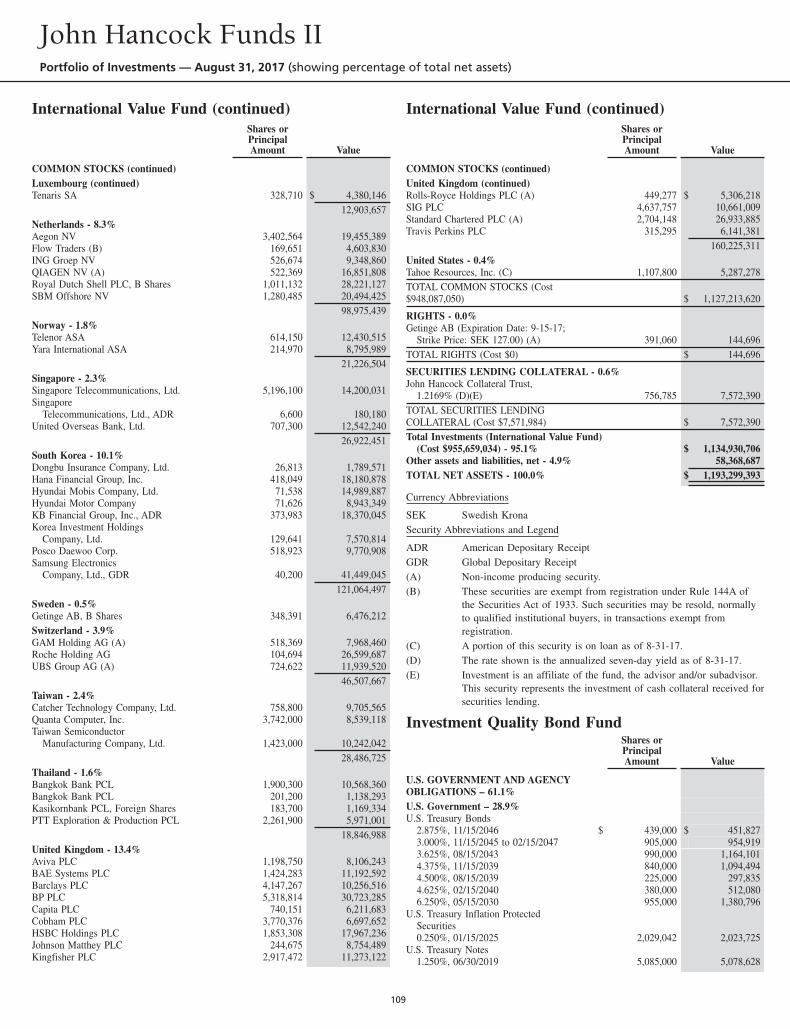
International Value Fund (continued)Shares orPrincipalAmount Value
COMMON STOCKS (continued)Luxembourg (continued)Tenaris SA 328,710 $ 4,380,146
12,903,657Netherlands - 8.3%Aegon NV 3,402,564 19,455,389Flow Traders (B) 169,651 4,603,830ING Groep NV 526,674 9,348,860QIAGEN NV (A) 522,369 16,851,808Royal Dutch Shell PLC, B Shares 1,011,132 28,221,127SBM Offshore NV 1,280,485 20,494,425
98,975,439Norway - 1.8%Telenor ASA 614,150 12,430,515Yara International ASA 214,970 8,795,989
21,226,504Singapore - 2.3%Singapore Telecommunications, Ltd. 5,196,100 14,200,031Singapore
Telecommunications, Ltd., ADR 6,600 180,180United Overseas Bank, Ltd. 707,300 12,542,240
26,922,451South Korea - 10.1%Dongbu Insurance Company, Ltd. 26,813 1,789,571Hana Financial Group, Inc. 418,049 18,180,878Hyundai Mobis Company, Ltd. 71,538 14,989,887Hyundai Motor Company 71,626 8,943,349KB Financial Group, Inc., ADR 373,983 18,370,045Korea Investment Holdings
Company, Ltd. 129,641 7,570,814Posco Daewoo Corp. 518,923 9,770,908Samsung Electronics
Company, Ltd., GDR 40,200 41,449,045121,064,497
Sweden - 0.5%Getinge AB, B Shares 348,391 6,476,212Switzerland - 3.9%GAM Holding AG (A) 518,369 7,968,460Roche Holding AG 104,694 26,599,687UBS Group AG (A) 724,622 11,939,520
46,507,667Taiwan - 2.4%Catcher Technology Company, Ltd. 758,800 9,705,565Quanta Computer, Inc. 3,742,000 8,539,118Taiwan Semiconductor
Manufacturing Company, Ltd. 1,423,000 10,242,04228,486,725
Thailand - 1.6%Bangkok Bank PCL 1,900,300 10,568,360Bangkok Bank PCL 201,200 1,138,293Kasikornbank PCL, Foreign Shares 183,700 1,169,334PTT Exploration & Production PCL 2,261,900 5,971,001
18,846,988United Kingdom - 13.4%Aviva PLC 1,198,750 8,106,243BAE Systems PLC 1,424,283 11,192,592Barclays PLC 4,147,267 10,256,516BP PLC 5,318,814 30,723,285Capita PLC 740,151 6,211,683Cobham PLC 3,770,376 6,697,652HSBC Holdings PLC 1,853,308 17,967,236Johnson Matthey PLC 244,675 8,754,489Kingfisher PLC 2,917,472 11,273,122
International Value Fund (continued)Shares orPrincipalAmount Value
COMMON STOCKS (continued)United Kingdom (continued)Rolls-Royce Holdings PLC (A) 449,277 $ 5,306,218SIG PLC 4,637,757 10,661,009Standard Chartered PLC (A) 2,704,148 26,933,885Travis Perkins PLC 315,295 6,141,381
160,225,311United States - 0.4%Tahoe Resources, Inc. (C) 1,107,800 5,287,278TOTAL COMMON STOCKS (Cost$948,087,050) $ 1,127,213,620
RIGHTS - 0.0%Getinge AB (Expiration Date: 9-15-17;
Strike Price: SEK 127.00) (A) 391,060 144,696TOTAL RIGHTS (Cost $0) $ 144,696
SECURITIES LENDING COLLATERAL - 0.6%John Hancock Collateral Trust,
1.2169% (D)(E) 756,785 7,572,390TOTAL SECURITIES LENDINGCOLLATERAL (Cost $7,571,984) $ 7,572,390Total Investments (International Value Fund)
(Cost $955,659,034) - 95.1% $ 1,134,930,706Other assets and liabilities, net - 4.9% 58,368,687TOTAL NET ASSETS - 100.0% $ 1,193,299,393
Currency Abbreviations
SEK Swedish KronaSecurity Abbreviations and Legend
ADR American Depositary ReceiptGDR Global Depositary Receipt(A) Non-income producing security.(B) These securities are exempt from registration under Rule 144A of
the Securities Act of 1933. Such securities may be resold, normallyto qualified institutional buyers, in transactions exempt fromregistration.
(C) A portion of this security is on loan as of 8-31-17.(D) The rate shown is the annualized seven-day yield as of 8-31-17.(E) Investment is an affiliate of the fund, the advisor and/or subadvisor.
This security represents the investment of cash collateral received forsecurities lending.
Investment Quality Bond FundShares orPrincipalAmount Value
U.S. GOVERNMENT AND AGENCYOBLIGATIONS – 61.1%U.S. Government – 28.9%U.S. Treasury Bonds
2.875%, 11/15/2046 $ 439,000 $ 451,8273.000%, 11/15/2045 to 02/15/2047 905,000 954,9193.625%, 08/15/2043 990,000 1,164,1014.375%, 11/15/2039 840,000 1,094,4944.500%, 08/15/2039 225,000 297,8354.625%, 02/15/2040 380,000 512,0806.250%, 05/15/2030 955,000 1,380,796
U.S. Treasury Inflation ProtectedSecurities0.250%, 01/15/2025 2,029,042 2,023,725
U.S. Treasury Notes1.250%, 06/30/2019 5,085,000 5,078,628
John Hancock Funds IIPortfolio of Investments — August 31, 2017 (showing percentage of total net assets)
109
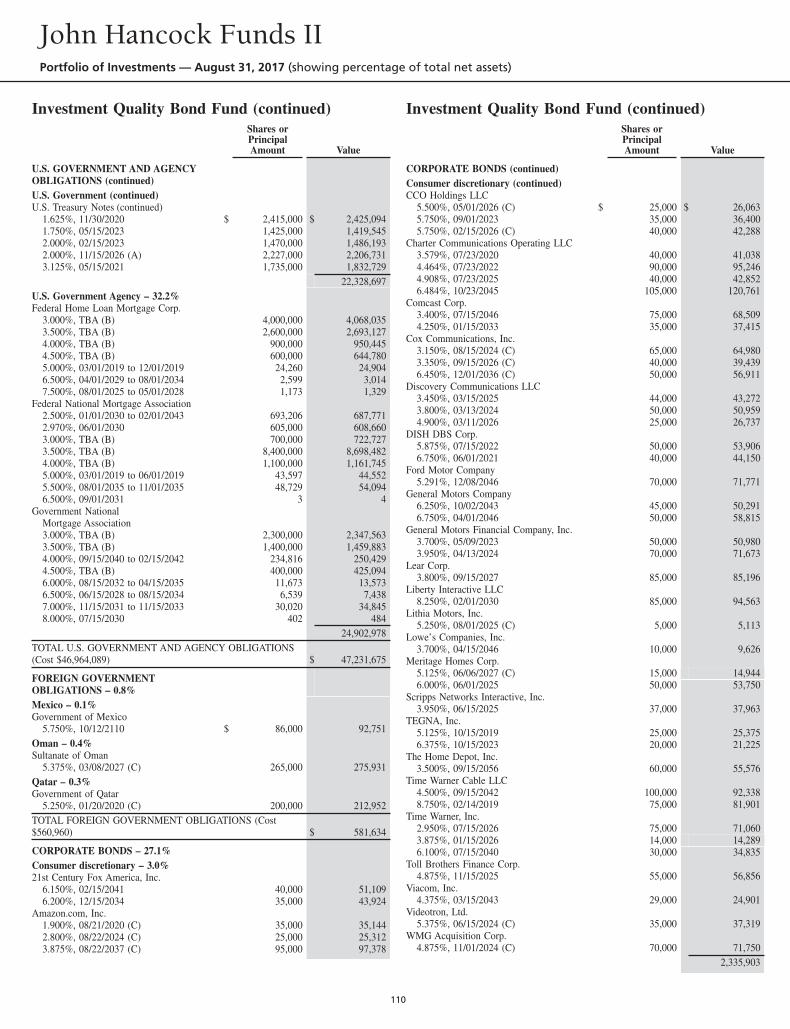
Investment Quality Bond Fund (continued)Shares orPrincipalAmount Value
U.S. GOVERNMENT AND AGENCYOBLIGATIONS (continued)U.S. Government (continued)U.S. Treasury Notes (continued)
1.625%, 11/30/2020 $ 2,415,000 $ 2,425,0941.750%, 05/15/2023 1,425,000 1,419,5452.000%, 02/15/2023 1,470,000 1,486,1932.000%, 11/15/2026 (A) 2,227,000 2,206,7313.125%, 05/15/2021 1,735,000 1,832,729
22,328,697U.S. Government Agency – 32.2%Federal Home Loan Mortgage Corp.
3.000%, TBA (B) 4,000,000 4,068,0353.500%, TBA (B) 2,600,000 2,693,1274.000%, TBA (B) 900,000 950,4454.500%, TBA (B) 600,000 644,7805.000%, 03/01/2019 to 12/01/2019 24,260 24,9046.500%, 04/01/2029 to 08/01/2034 2,599 3,0147.500%, 08/01/2025 to 05/01/2028 1,173 1,329
Federal National Mortgage Association2.500%, 01/01/2030 to 02/01/2043 693,206 687,7712.970%, 06/01/2030 605,000 608,6603.000%, TBA (B) 700,000 722,7273.500%, TBA (B) 8,400,000 8,698,4824.000%, TBA (B) 1,100,000 1,161,7455.000%, 03/01/2019 to 06/01/2019 43,597 44,5525.500%, 08/01/2035 to 11/01/2035 48,729 54,0946.500%, 09/01/2031 3 4
Government NationalMortgage Association3.000%, TBA (B) 2,300,000 2,347,5633.500%, TBA (B) 1,400,000 1,459,8834.000%, 09/15/2040 to 02/15/2042 234,816 250,4294.500%, TBA (B) 400,000 425,0946.000%, 08/15/2032 to 04/15/2035 11,673 13,5736.500%, 06/15/2028 to 08/15/2034 6,539 7,4387.000%, 11/15/2031 to 11/15/2033 30,020 34,8458.000%, 07/15/2030 402 484
24,902,978TOTAL U.S. GOVERNMENT AND AGENCY OBLIGATIONS(Cost $46,964,089) $ 47,231,675
FOREIGN GOVERNMENTOBLIGATIONS – 0.8%Mexico – 0.1%Government of Mexico
5.750%, 10/12/2110 $ 86,000 92,751Oman – 0.4%Sultanate of Oman
5.375%, 03/08/2027 (C) 265,000 275,931Qatar – 0.3%Government of Qatar
5.250%, 01/20/2020 (C) 200,000 212,952TOTAL FOREIGN GOVERNMENT OBLIGATIONS (Cost$560,960) $ 581,634
CORPORATE BONDS – 27.1%Consumer discretionary – 3.0%21st Century Fox America, Inc.
6.150%, 02/15/2041 40,000 51,1096.200%, 12/15/2034 35,000 43,924
Amazon.com, Inc.1.900%, 08/21/2020 (C) 35,000 35,1442.800%, 08/22/2024 (C) 25,000 25,3123.875%, 08/22/2037 (C) 95,000 97,378
Investment Quality Bond Fund (continued)Shares orPrincipalAmount Value
CORPORATE BONDS (continued)Consumer discretionary (continued)CCO Holdings LLC
5.500%, 05/01/2026 (C) $ 25,000 $ 26,0635.750%, 09/01/2023 35,000 36,4005.750%, 02/15/2026 (C) 40,000 42,288
Charter Communications Operating LLC3.579%, 07/23/2020 40,000 41,0384.464%, 07/23/2022 90,000 95,2464.908%, 07/23/2025 40,000 42,8526.484%, 10/23/2045 105,000 120,761
Comcast Corp.3.400%, 07/15/2046 75,000 68,5094.250%, 01/15/2033 35,000 37,415
Cox Communications, Inc.3.150%, 08/15/2024 (C) 65,000 64,9803.350%, 09/15/2026 (C) 40,000 39,4396.450%, 12/01/2036 (C) 50,000 56,911
Discovery Communications LLC3.450%, 03/15/2025 44,000 43,2723.800%, 03/13/2024 50,000 50,9594.900%, 03/11/2026 25,000 26,737
DISH DBS Corp.5.875%, 07/15/2022 50,000 53,9066.750%, 06/01/2021 40,000 44,150
Ford Motor Company5.291%, 12/08/2046 70,000 71,771
General Motors Company6.250%, 10/02/2043 45,000 50,2916.750%, 04/01/2046 50,000 58,815
General Motors Financial Company, Inc.3.700%, 05/09/2023 50,000 50,9803.950%, 04/13/2024 70,000 71,673
Lear Corp.3.800%, 09/15/2027 85,000 85,196
Liberty Interactive LLC8.250%, 02/01/2030 85,000 94,563
Lithia Motors, Inc.5.250%, 08/01/2025 (C) 5,000 5,113
Lowe’s Companies, Inc.3.700%, 04/15/2046 10,000 9,626
Meritage Homes Corp.5.125%, 06/06/2027 (C) 15,000 14,9446.000%, 06/01/2025 50,000 53,750
Scripps Networks Interactive, Inc.3.950%, 06/15/2025 37,000 37,963
TEGNA, Inc.5.125%, 10/15/2019 25,000 25,3756.375%, 10/15/2023 20,000 21,225
The Home Depot, Inc.3.500%, 09/15/2056 60,000 55,576
Time Warner Cable LLC4.500%, 09/15/2042 100,000 92,3388.750%, 02/14/2019 75,000 81,901
Time Warner, Inc.2.950%, 07/15/2026 75,000 71,0603.875%, 01/15/2026 14,000 14,2896.100%, 07/15/2040 30,000 34,835
Toll Brothers Finance Corp.4.875%, 11/15/2025 55,000 56,856
Viacom, Inc.4.375%, 03/15/2043 29,000 24,901
Videotron, Ltd.5.375%, 06/15/2024 (C) 35,000 37,319
WMG Acquisition Corp.4.875%, 11/01/2024 (C) 70,000 71,750
2,335,903
John Hancock Funds IIPortfolio of Investments — August 31, 2017 (showing percentage of total net assets)
110
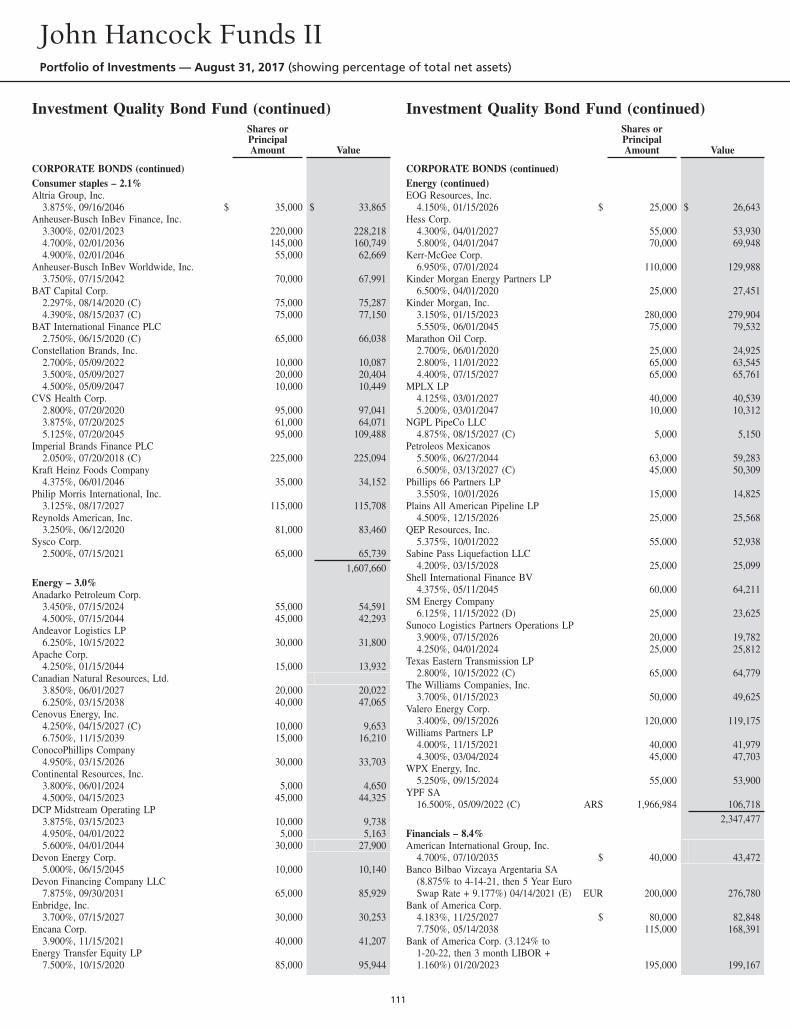
Investment Quality Bond Fund (continued)Shares orPrincipalAmount Value
CORPORATE BONDS (continued)Consumer staples – 2.1%Altria Group, Inc.
3.875%, 09/16/2046 $ 35,000 $ 33,865Anheuser-Busch InBev Finance, Inc.
3.300%, 02/01/2023 220,000 228,2184.700%, 02/01/2036 145,000 160,7494.900%, 02/01/2046 55,000 62,669
Anheuser-Busch InBev Worldwide, Inc.3.750%, 07/15/2042 70,000 67,991
BAT Capital Corp.2.297%, 08/14/2020 (C) 75,000 75,2874.390%, 08/15/2037 (C) 75,000 77,150
BAT International Finance PLC2.750%, 06/15/2020 (C) 65,000 66,038
Constellation Brands, Inc.2.700%, 05/09/2022 10,000 10,0873.500%, 05/09/2027 20,000 20,4044.500%, 05/09/2047 10,000 10,449
CVS Health Corp.2.800%, 07/20/2020 95,000 97,0413.875%, 07/20/2025 61,000 64,0715.125%, 07/20/2045 95,000 109,488
Imperial Brands Finance PLC2.050%, 07/20/2018 (C) 225,000 225,094
Kraft Heinz Foods Company4.375%, 06/01/2046 35,000 34,152
Philip Morris International, Inc.3.125%, 08/17/2027 115,000 115,708
Reynolds American, Inc.3.250%, 06/12/2020 81,000 83,460
Sysco Corp.2.500%, 07/15/2021 65,000 65,739
1,607,660Energy – 3.0%Anadarko Petroleum Corp.
3.450%, 07/15/2024 55,000 54,5914.500%, 07/15/2044 45,000 42,293
Andeavor Logistics LP6.250%, 10/15/2022 30,000 31,800
Apache Corp.4.250%, 01/15/2044 15,000 13,932
Canadian Natural Resources, Ltd.3.850%, 06/01/2027 20,000 20,0226.250%, 03/15/2038 40,000 47,065
Cenovus Energy, Inc.4.250%, 04/15/2027 (C) 10,000 9,6536.750%, 11/15/2039 15,000 16,210
ConocoPhillips Company4.950%, 03/15/2026 30,000 33,703
Continental Resources, Inc.3.800%, 06/01/2024 5,000 4,6504.500%, 04/15/2023 45,000 44,325
DCP Midstream Operating LP3.875%, 03/15/2023 10,000 9,7384.950%, 04/01/2022 5,000 5,1635.600%, 04/01/2044 30,000 27,900
Devon Energy Corp.5.000%, 06/15/2045 10,000 10,140
Devon Financing Company LLC7.875%, 09/30/2031 65,000 85,929
Enbridge, Inc.3.700%, 07/15/2027 30,000 30,253
Encana Corp.3.900%, 11/15/2021 40,000 41,207
Energy Transfer Equity LP7.500%, 10/15/2020 85,000 95,944
Investment Quality Bond Fund (continued)Shares orPrincipalAmount Value
CORPORATE BONDS (continued)Energy (continued)EOG Resources, Inc.
4.150%, 01/15/2026 $ 25,000 $ 26,643Hess Corp.
4.300%, 04/01/2027 55,000 53,9305.800%, 04/01/2047 70,000 69,948
Kerr-McGee Corp.6.950%, 07/01/2024 110,000 129,988
Kinder Morgan Energy Partners LP6.500%, 04/01/2020 25,000 27,451
Kinder Morgan, Inc.3.150%, 01/15/2023 280,000 279,9045.550%, 06/01/2045 75,000 79,532
Marathon Oil Corp.2.700%, 06/01/2020 25,000 24,9252.800%, 11/01/2022 65,000 63,5454.400%, 07/15/2027 65,000 65,761
MPLX LP4.125%, 03/01/2027 40,000 40,5395.200%, 03/01/2047 10,000 10,312
NGPL PipeCo LLC4.875%, 08/15/2027 (C) 5,000 5,150
Petroleos Mexicanos5.500%, 06/27/2044 63,000 59,2836.500%, 03/13/2027 (C) 45,000 50,309
Phillips 66 Partners LP3.550%, 10/01/2026 15,000 14,825
Plains All American Pipeline LP4.500%, 12/15/2026 25,000 25,568
QEP Resources, Inc.5.375%, 10/01/2022 55,000 52,938
Sabine Pass Liquefaction LLC4.200%, 03/15/2028 25,000 25,099
Shell International Finance BV4.375%, 05/11/2045 60,000 64,211
SM Energy Company6.125%, 11/15/2022 (D) 25,000 23,625
Sunoco Logistics Partners Operations LP3.900%, 07/15/2026 20,000 19,7824.250%, 04/01/2024 25,000 25,812
Texas Eastern Transmission LP2.800%, 10/15/2022 (C) 65,000 64,779
The Williams Companies, Inc.3.700%, 01/15/2023 50,000 49,625
Valero Energy Corp.3.400%, 09/15/2026 120,000 119,175
Williams Partners LP4.000%, 11/15/2021 40,000 41,9794.300%, 03/04/2024 45,000 47,703
WPX Energy, Inc.5.250%, 09/15/2024 55,000 53,900
YPF SA16.500%, 05/09/2022 (C) ARS 1,966,984 106,718
2,347,477Financials – 8.4%American International Group, Inc.
4.700%, 07/10/2035 $ 40,000 43,472Banco Bilbao Vizcaya Argentaria SA
(8.875% to 4-14-21, then 5 Year EuroSwap Rate + 9.177%) 04/14/2021 (E) EUR 200,000 276,780
Bank of America Corp.4.183%, 11/25/2027 $ 80,000 82,8487.750%, 05/14/2038 115,000 168,391
Bank of America Corp. (3.124% to1-20-22, then 3 month LIBOR +1.160%) 01/20/2023 195,000 199,167
John Hancock Funds IIPortfolio of Investments — August 31, 2017 (showing percentage of total net assets)
111
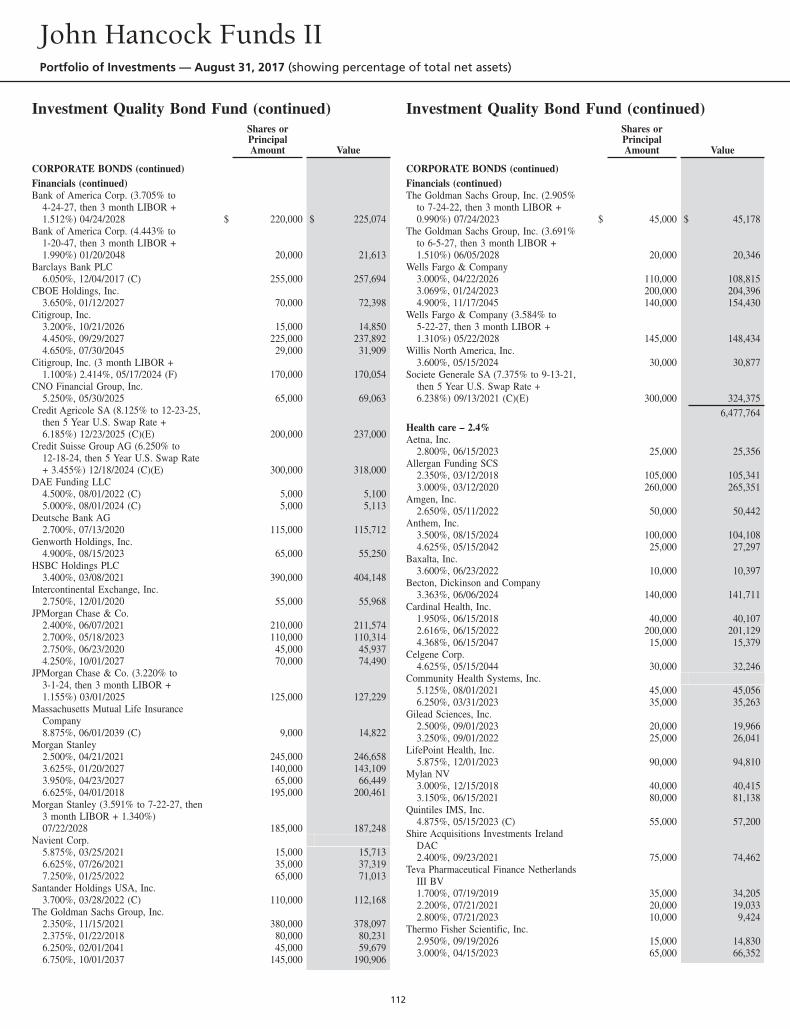
Investment Quality Bond Fund (continued)Shares orPrincipalAmount Value
CORPORATE BONDS (continued)Financials (continued)Bank of America Corp. (3.705% to
4-24-27, then 3 month LIBOR +1.512%) 04/24/2028 $ 220,000 $ 225,074
Bank of America Corp. (4.443% to1-20-47, then 3 month LIBOR +1.990%) 01/20/2048 20,000 21,613
Barclays Bank PLC6.050%, 12/04/2017 (C) 255,000 257,694
CBOE Holdings, Inc.3.650%, 01/12/2027 70,000 72,398
Citigroup, Inc.3.200%, 10/21/2026 15,000 14,8504.450%, 09/29/2027 225,000 237,8924.650%, 07/30/2045 29,000 31,909
Citigroup, Inc. (3 month LIBOR +1.100%) 2.414%, 05/17/2024 (F) 170,000 170,054
CNO Financial Group, Inc.5.250%, 05/30/2025 65,000 69,063
Credit Agricole SA (8.125% to 12-23-25,then 5 Year U.S. Swap Rate +6.185%) 12/23/2025 (C)(E) 200,000 237,000
Credit Suisse Group AG (6.250% to12-18-24, then 5 Year U.S. Swap Rate+ 3.455%) 12/18/2024 (C)(E) 300,000 318,000
DAE Funding LLC4.500%, 08/01/2022 (C) 5,000 5,1005.000%, 08/01/2024 (C) 5,000 5,113
Deutsche Bank AG2.700%, 07/13/2020 115,000 115,712
Genworth Holdings, Inc.4.900%, 08/15/2023 65,000 55,250
HSBC Holdings PLC3.400%, 03/08/2021 390,000 404,148
Intercontinental Exchange, Inc.2.750%, 12/01/2020 55,000 55,968
JPMorgan Chase & Co.2.400%, 06/07/2021 210,000 211,5742.700%, 05/18/2023 110,000 110,3142.750%, 06/23/2020 45,000 45,9374.250%, 10/01/2027 70,000 74,490
JPMorgan Chase & Co. (3.220% to3-1-24, then 3 month LIBOR +1.155%) 03/01/2025 125,000 127,229
Massachusetts Mutual Life InsuranceCompany8.875%, 06/01/2039 (C) 9,000 14,822
Morgan Stanley2.500%, 04/21/2021 245,000 246,6583.625%, 01/20/2027 140,000 143,1093.950%, 04/23/2027 65,000 66,4496.625%, 04/01/2018 195,000 200,461
Morgan Stanley (3.591% to 7-22-27, then3 month LIBOR + 1.340%)07/22/2028 185,000 187,248
Navient Corp.5.875%, 03/25/2021 15,000 15,7136.625%, 07/26/2021 35,000 37,3197.250%, 01/25/2022 65,000 71,013
Santander Holdings USA, Inc.3.700%, 03/28/2022 (C) 110,000 112,168
The Goldman Sachs Group, Inc.2.350%, 11/15/2021 380,000 378,0972.375%, 01/22/2018 80,000 80,2316.250%, 02/01/2041 45,000 59,6796.750%, 10/01/2037 145,000 190,906
Investment Quality Bond Fund (continued)Shares orPrincipalAmount Value
CORPORATE BONDS (continued)Financials (continued)The Goldman Sachs Group, Inc. (2.905%
to 7-24-22, then 3 month LIBOR +0.990%) 07/24/2023 $ 45,000 $ 45,178
The Goldman Sachs Group, Inc. (3.691%to 6-5-27, then 3 month LIBOR +1.510%) 06/05/2028 20,000 20,346
Wells Fargo & Company3.000%, 04/22/2026 110,000 108,8153.069%, 01/24/2023 200,000 204,3964.900%, 11/17/2045 140,000 154,430
Wells Fargo & Company (3.584% to5-22-27, then 3 month LIBOR +1.310%) 05/22/2028 145,000 148,434
Willis North America, Inc.3.600%, 05/15/2024 30,000 30,877
Societe Generale SA (7.375% to 9-13-21,then 5 Year U.S. Swap Rate +6.238%) 09/13/2021 (C)(E) 300,000 324,375
6,477,764Health care – 2.4%Aetna, Inc.
2.800%, 06/15/2023 25,000 25,356Allergan Funding SCS
2.350%, 03/12/2018 105,000 105,3413.000%, 03/12/2020 260,000 265,351
Amgen, Inc.2.650%, 05/11/2022 50,000 50,442
Anthem, Inc.3.500%, 08/15/2024 100,000 104,1084.625%, 05/15/2042 25,000 27,297
Baxalta, Inc.3.600%, 06/23/2022 10,000 10,397
Becton, Dickinson and Company3.363%, 06/06/2024 140,000 141,711
Cardinal Health, Inc.1.950%, 06/15/2018 40,000 40,1072.616%, 06/15/2022 200,000 201,1294.368%, 06/15/2047 15,000 15,379
Celgene Corp.4.625%, 05/15/2044 30,000 32,246
Community Health Systems, Inc.5.125%, 08/01/2021 45,000 45,0566.250%, 03/31/2023 35,000 35,263
Gilead Sciences, Inc.2.500%, 09/01/2023 20,000 19,9663.250%, 09/01/2022 25,000 26,041
LifePoint Health, Inc.5.875%, 12/01/2023 90,000 94,810
Mylan NV3.000%, 12/15/2018 40,000 40,4153.150%, 06/15/2021 80,000 81,138
Quintiles IMS, Inc.4.875%, 05/15/2023 (C) 55,000 57,200
Shire Acquisitions Investments IrelandDAC2.400%, 09/23/2021 75,000 74,462
Teva Pharmaceutical Finance NetherlandsIII BV1.700%, 07/19/2019 35,000 34,2052.200%, 07/21/2021 20,000 19,0332.800%, 07/21/2023 10,000 9,424
Thermo Fisher Scientific, Inc.2.950%, 09/19/2026 15,000 14,8303.000%, 04/15/2023 65,000 66,352
John Hancock Funds IIPortfolio of Investments — August 31, 2017 (showing percentage of total net assets)
112
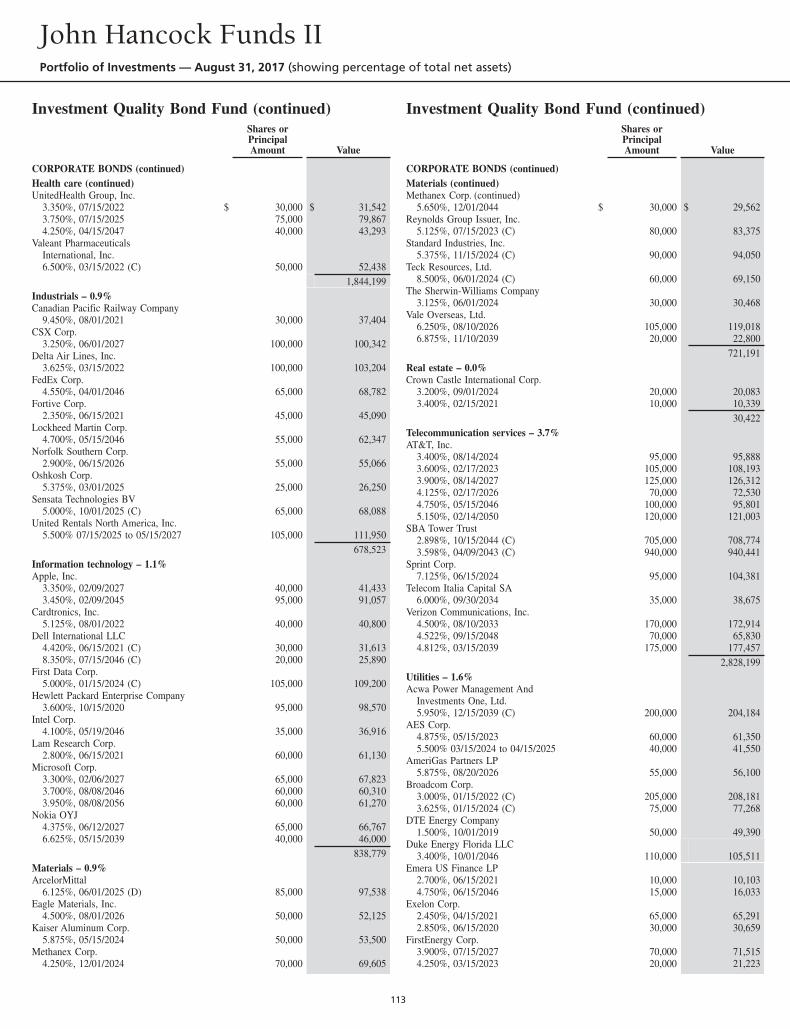
Investment Quality Bond Fund (continued)Shares orPrincipalAmount Value
CORPORATE BONDS (continued)Health care (continued)UnitedHealth Group, Inc.
3.350%, 07/15/2022 $ 30,000 $ 31,5423.750%, 07/15/2025 75,000 79,8674.250%, 04/15/2047 40,000 43,293
Valeant PharmaceuticalsInternational, Inc.6.500%, 03/15/2022 (C) 50,000 52,438
1,844,199Industrials – 0.9%Canadian Pacific Railway Company
9.450%, 08/01/2021 30,000 37,404CSX Corp.
3.250%, 06/01/2027 100,000 100,342Delta Air Lines, Inc.
3.625%, 03/15/2022 100,000 103,204FedEx Corp.
4.550%, 04/01/2046 65,000 68,782Fortive Corp.
2.350%, 06/15/2021 45,000 45,090Lockheed Martin Corp.
4.700%, 05/15/2046 55,000 62,347Norfolk Southern Corp.
2.900%, 06/15/2026 55,000 55,066Oshkosh Corp.
5.375%, 03/01/2025 25,000 26,250Sensata Technologies BV
5.000%, 10/01/2025 (C) 65,000 68,088United Rentals North America, Inc.
5.500% 07/15/2025 to 05/15/2027 105,000 111,950678,523
Information technology – 1.1%Apple, Inc.
3.350%, 02/09/2027 40,000 41,4333.450%, 02/09/2045 95,000 91,057
Cardtronics, Inc.5.125%, 08/01/2022 40,000 40,800
Dell International LLC4.420%, 06/15/2021 (C) 30,000 31,6138.350%, 07/15/2046 (C) 20,000 25,890
First Data Corp.5.000%, 01/15/2024 (C) 105,000 109,200
Hewlett Packard Enterprise Company3.600%, 10/15/2020 95,000 98,570
Intel Corp.4.100%, 05/19/2046 35,000 36,916
Lam Research Corp.2.800%, 06/15/2021 60,000 61,130
Microsoft Corp.3.300%, 02/06/2027 65,000 67,8233.700%, 08/08/2046 60,000 60,3103.950%, 08/08/2056 60,000 61,270
Nokia OYJ4.375%, 06/12/2027 65,000 66,7676.625%, 05/15/2039 40,000 46,000
838,779Materials – 0.9%ArcelorMittal
6.125%, 06/01/2025 (D) 85,000 97,538Eagle Materials, Inc.
4.500%, 08/01/2026 50,000 52,125Kaiser Aluminum Corp.
5.875%, 05/15/2024 50,000 53,500Methanex Corp.
4.250%, 12/01/2024 70,000 69,605
Investment Quality Bond Fund (continued)Shares orPrincipalAmount Value
CORPORATE BONDS (continued)Materials (continued)Methanex Corp. (continued)
5.650%, 12/01/2044 $ 30,000 $ 29,562Reynolds Group Issuer, Inc.
5.125%, 07/15/2023 (C) 80,000 83,375Standard Industries, Inc.
5.375%, 11/15/2024 (C) 90,000 94,050Teck Resources, Ltd.
8.500%, 06/01/2024 (C) 60,000 69,150The Sherwin-Williams Company
3.125%, 06/01/2024 30,000 30,468Vale Overseas, Ltd.
6.250%, 08/10/2026 105,000 119,0186.875%, 11/10/2039 20,000 22,800
721,191Real estate – 0.0%Crown Castle International Corp.
3.200%, 09/01/2024 20,000 20,0833.400%, 02/15/2021 10,000 10,339
30,422Telecommunication services – 3.7%AT&T, Inc.
3.400%, 08/14/2024 95,000 95,8883.600%, 02/17/2023 105,000 108,1933.900%, 08/14/2027 125,000 126,3124.125%, 02/17/2026 70,000 72,5304.750%, 05/15/2046 100,000 95,8015.150%, 02/14/2050 120,000 121,003
SBA Tower Trust2.898%, 10/15/2044 (C) 705,000 708,7743.598%, 04/09/2043 (C) 940,000 940,441
Sprint Corp.7.125%, 06/15/2024 95,000 104,381
Telecom Italia Capital SA6.000%, 09/30/2034 35,000 38,675
Verizon Communications, Inc.4.500%, 08/10/2033 170,000 172,9144.522%, 09/15/2048 70,000 65,8304.812%, 03/15/2039 175,000 177,457
2,828,199Utilities – 1.6%Acwa Power Management And
Investments One, Ltd.5.950%, 12/15/2039 (C) 200,000 204,184
AES Corp.4.875%, 05/15/2023 60,000 61,3505.500% 03/15/2024 to 04/15/2025 40,000 41,550
AmeriGas Partners LP5.875%, 08/20/2026 55,000 56,100
Broadcom Corp.3.000%, 01/15/2022 (C) 205,000 208,1813.625%, 01/15/2024 (C) 75,000 77,268
DTE Energy Company1.500%, 10/01/2019 50,000 49,390
Duke Energy Florida LLC3.400%, 10/01/2046 110,000 105,511
Emera US Finance LP2.700%, 06/15/2021 10,000 10,1034.750%, 06/15/2046 15,000 16,033
Exelon Corp.2.450%, 04/15/2021 65,000 65,2912.850%, 06/15/2020 30,000 30,659
FirstEnergy Corp.3.900%, 07/15/2027 70,000 71,5154.250%, 03/15/2023 20,000 21,223
John Hancock Funds IIPortfolio of Investments — August 31, 2017 (showing percentage of total net assets)
113
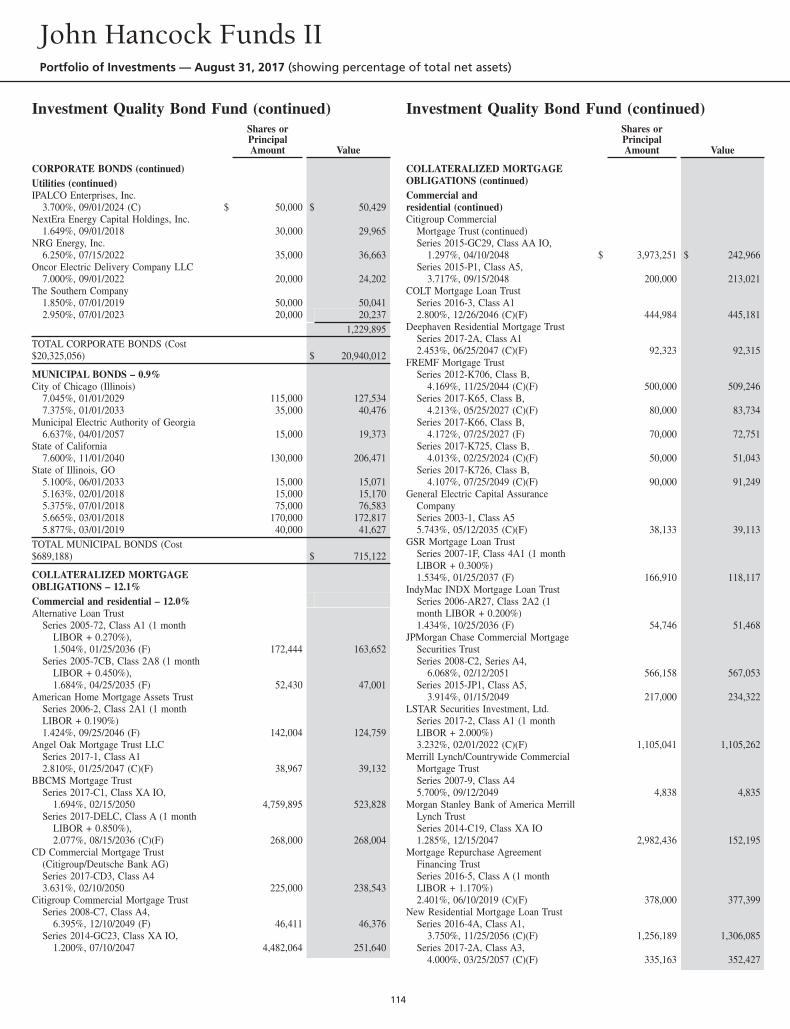
Investment Quality Bond Fund (continued)Shares orPrincipalAmount Value
CORPORATE BONDS (continued)Utilities (continued)IPALCO Enterprises, Inc.
3.700%, 09/01/2024 (C) $ 50,000 $ 50,429NextEra Energy Capital Holdings, Inc.
1.649%, 09/01/2018 30,000 29,965NRG Energy, Inc.
6.250%, 07/15/2022 35,000 36,663Oncor Electric Delivery Company LLC
7.000%, 09/01/2022 20,000 24,202The Southern Company
1.850%, 07/01/2019 50,000 50,0412.950%, 07/01/2023 20,000 20,237
1,229,895TOTAL CORPORATE BONDS (Cost$20,325,056) $ 20,940,012
MUNICIPAL BONDS – 0.9%City of Chicago (Illinois)
7.045%, 01/01/2029 115,000 127,5347.375%, 01/01/2033 35,000 40,476
Municipal Electric Authority of Georgia6.637%, 04/01/2057 15,000 19,373
State of California7.600%, 11/01/2040 130,000 206,471
State of Illinois, GO5.100%, 06/01/2033 15,000 15,0715.163%, 02/01/2018 15,000 15,1705.375%, 07/01/2018 75,000 76,5835.665%, 03/01/2018 170,000 172,8175.877%, 03/01/2019 40,000 41,627
TOTAL MUNICIPAL BONDS (Cost$689,188) $ 715,122
COLLATERALIZED MORTGAGEOBLIGATIONS – 12.1%Commercial and residential – 12.0%Alternative Loan Trust
Series 2005-72, Class A1 (1 monthLIBOR + 0.270%),1.504%, 01/25/2036 (F) 172,444 163,652
Series 2005-7CB, Class 2A8 (1 monthLIBOR + 0.450%),1.684%, 04/25/2035 (F) 52,430 47,001
American Home Mortgage Assets TrustSeries 2006-2, Class 2A1 (1 monthLIBOR + 0.190%)1.424%, 09/25/2046 (F) 142,004 124,759
Angel Oak Mortgage Trust LLCSeries 2017-1, Class A12.810%, 01/25/2047 (C)(F) 38,967 39,132
BBCMS Mortgage TrustSeries 2017-C1, Class XA IO,
1.694%, 02/15/2050 4,759,895 523,828Series 2017-DELC, Class A (1 month
LIBOR + 0.850%),2.077%, 08/15/2036 (C)(F) 268,000 268,004
CD Commercial Mortgage Trust(Citigroup/Deutsche Bank AG)Series 2017-CD3, Class A43.631%, 02/10/2050 225,000 238,543
Citigroup Commercial Mortgage TrustSeries 2008-C7, Class A4,
6.395%, 12/10/2049 (F) 46,411 46,376Series 2014-GC23, Class XA IO,
1.200%, 07/10/2047 4,482,064 251,640
Investment Quality Bond Fund (continued)Shares orPrincipalAmount Value
COLLATERALIZED MORTGAGEOBLIGATIONS (continued)Commercial andresidential (continued)Citigroup Commercial
Mortgage Trust (continued)Series 2015-GC29, Class AA IO,
1.297%, 04/10/2048 $ 3,973,251 $ 242,966Series 2015-P1, Class A5,
3.717%, 09/15/2048 200,000 213,021COLT Mortgage Loan Trust
Series 2016-3, Class A12.800%, 12/26/2046 (C)(F) 444,984 445,181
Deephaven Residential Mortgage TrustSeries 2017-2A, Class A12.453%, 06/25/2047 (C)(F) 92,323 92,315
FREMF Mortgage TrustSeries 2012-K706, Class B,
4.169%, 11/25/2044 (C)(F) 500,000 509,246Series 2017-K65, Class B,
4.213%, 05/25/2027 (C)(F) 80,000 83,734Series 2017-K66, Class B,
4.172%, 07/25/2027 (F) 70,000 72,751Series 2017-K725, Class B,
4.013%, 02/25/2024 (C)(F) 50,000 51,043Series 2017-K726, Class B,
4.107%, 07/25/2049 (C)(F) 90,000 91,249General Electric Capital Assurance
CompanySeries 2003-1, Class A55.743%, 05/12/2035 (C)(F) 38,133 39,113
GSR Mortgage Loan TrustSeries 2007-1F, Class 4A1 (1 monthLIBOR + 0.300%)1.534%, 01/25/2037 (F) 166,910 118,117
IndyMac INDX Mortgage Loan TrustSeries 2006-AR27, Class 2A2 (1month LIBOR + 0.200%)1.434%, 10/25/2036 (F) 54,746 51,468
JPMorgan Chase Commercial MortgageSecurities TrustSeries 2008-C2, Series A4,
6.068%, 02/12/2051 566,158 567,053Series 2015-JP1, Class A5,
3.914%, 01/15/2049 217,000 234,322LSTAR Securities Investment, Ltd.
Series 2017-2, Class A1 (1 monthLIBOR + 2.000%)3.232%, 02/01/2022 (C)(F) 1,105,041 1,105,262
Merrill Lynch/Countrywide CommercialMortgage TrustSeries 2007-9, Class A45.700%, 09/12/2049 4,838 4,835
Morgan Stanley Bank of America MerrillLynch TrustSeries 2014-C19, Class XA IO1.285%, 12/15/2047 2,982,436 152,195
Mortgage Repurchase AgreementFinancing TrustSeries 2016-5, Class A (1 monthLIBOR + 1.170%)2.401%, 06/10/2019 (C)(F) 378,000 377,399
New Residential Mortgage Loan TrustSeries 2016-4A, Class A1,
3.750%, 11/25/2056 (C)(F) 1,256,189 1,306,085Series 2017-2A, Class A3,
4.000%, 03/25/2057 (C)(F) 335,163 352,427
John Hancock Funds IIPortfolio of Investments — August 31, 2017 (showing percentage of total net assets)
114
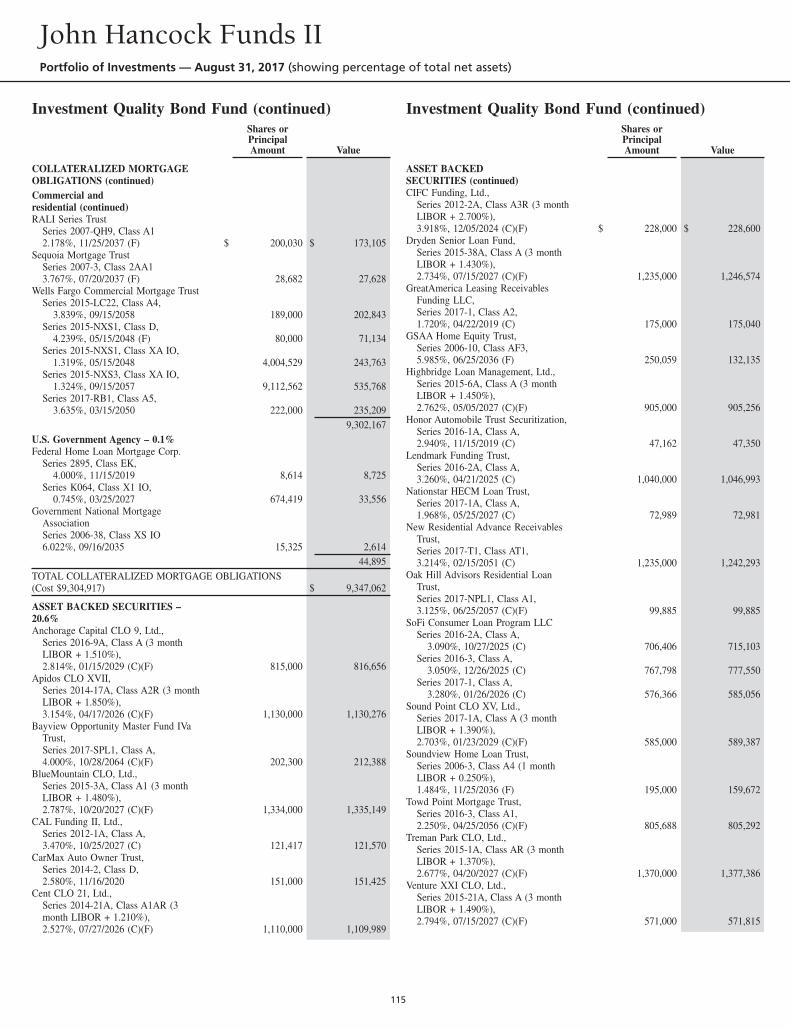
Investment Quality Bond Fund (continued)Shares orPrincipalAmount Value
COLLATERALIZED MORTGAGEOBLIGATIONS (continued)Commercial andresidential (continued)RALI Series Trust
Series 2007-QH9, Class A12.178%, 11/25/2037 (F) $ 200,030 $ 173,105
Sequoia Mortgage TrustSeries 2007-3, Class 2AA13.767%, 07/20/2037 (F) 28,682 27,628
Wells Fargo Commercial Mortgage TrustSeries 2015-LC22, Class A4,
3.839%, 09/15/2058 189,000 202,843Series 2015-NXS1, Class D,
4.239%, 05/15/2048 (F) 80,000 71,134Series 2015-NXS1, Class XA IO,
1.319%, 05/15/2048 4,004,529 243,763Series 2015-NXS3, Class XA IO,
1.324%, 09/15/2057 9,112,562 535,768Series 2017-RB1, Class A5,
3.635%, 03/15/2050 222,000 235,2099,302,167
U.S. Government Agency – 0.1%Federal Home Loan Mortgage Corp.
Series 2895, Class EK,4.000%, 11/15/2019 8,614 8,725
Series K064, Class X1 IO,0.745%, 03/25/2027 674,419 33,556
Government National MortgageAssociationSeries 2006-38, Class XS IO6.022%, 09/16/2035 15,325 2,614
44,895TOTAL COLLATERALIZED MORTGAGE OBLIGATIONS(Cost $9,304,917) $ 9,347,062
ASSET BACKED SECURITIES –20.6%Anchorage Capital CLO 9, Ltd.,
Series 2016-9A, Class A (3 monthLIBOR + 1.510%),2.814%, 01/15/2029 (C)(F) 815,000 816,656
Apidos CLO XVII,Series 2014-17A, Class A2R (3 monthLIBOR + 1.850%),3.154%, 04/17/2026 (C)(F) 1,130,000 1,130,276
Bayview Opportunity Master Fund IVaTrust,Series 2017-SPL1, Class A,4.000%, 10/28/2064 (C)(F) 202,300 212,388
BlueMountain CLO, Ltd.,Series 2015-3A, Class A1 (3 monthLIBOR + 1.480%),2.787%, 10/20/2027 (C)(F) 1,334,000 1,335,149
CAL Funding II, Ltd.,Series 2012-1A, Class A,3.470%, 10/25/2027 (C) 121,417 121,570
CarMax Auto Owner Trust,Series 2014-2, Class D,2.580%, 11/16/2020 151,000 151,425
Cent CLO 21, Ltd.,Series 2014-21A, Class A1AR (3month LIBOR + 1.210%),2.527%, 07/27/2026 (C)(F) 1,110,000 1,109,989
Investment Quality Bond Fund (continued)Shares orPrincipalAmount Value
ASSET BACKEDSECURITIES (continued)CIFC Funding, Ltd.,
Series 2012-2A, Class A3R (3 monthLIBOR + 2.700%),3.918%, 12/05/2024 (C)(F) $ 228,000 $ 228,600
Dryden Senior Loan Fund,Series 2015-38A, Class A (3 monthLIBOR + 1.430%),2.734%, 07/15/2027 (C)(F) 1,235,000 1,246,574
GreatAmerica Leasing ReceivablesFunding LLC,Series 2017-1, Class A2,1.720%, 04/22/2019 (C) 175,000 175,040
GSAA Home Equity Trust,Series 2006-10, Class AF3,5.985%, 06/25/2036 (F) 250,059 132,135
Highbridge Loan Management, Ltd.,Series 2015-6A, Class A (3 monthLIBOR + 1.450%),2.762%, 05/05/2027 (C)(F) 905,000 905,256
Honor Automobile Trust Securitization,Series 2016-1A, Class A,2.940%, 11/15/2019 (C) 47,162 47,350
Lendmark Funding Trust,Series 2016-2A, Class A,3.260%, 04/21/2025 (C) 1,040,000 1,046,993
Nationstar HECM Loan Trust,Series 2017-1A, Class A,1.968%, 05/25/2027 (C) 72,989 72,981
New Residential Advance ReceivablesTrust,Series 2017-T1, Class AT1,3.214%, 02/15/2051 (C) 1,235,000 1,242,293
Oak Hill Advisors Residential LoanTrust,Series 2017-NPL1, Class A1,3.125%, 06/25/2057 (C)(F) 99,885 99,885
SoFi Consumer Loan Program LLCSeries 2016-2A, Class A,
3.090%, 10/27/2025 (C) 706,406 715,103Series 2016-3, Class A,
3.050%, 12/26/2025 (C) 767,798 777,550Series 2017-1, Class A,
3.280%, 01/26/2026 (C) 576,366 585,056Sound Point CLO XV, Ltd.,
Series 2017-1A, Class A (3 monthLIBOR + 1.390%),2.703%, 01/23/2029 (C)(F) 585,000 589,387
Soundview Home Loan Trust,Series 2006-3, Class A4 (1 monthLIBOR + 0.250%),1.484%, 11/25/2036 (F) 195,000 159,672
Towd Point Mortgage Trust,Series 2016-3, Class A1,2.250%, 04/25/2056 (C)(F) 805,688 805,292
Treman Park CLO, Ltd.,Series 2015-1A, Class AR (3 monthLIBOR + 1.370%),2.677%, 04/20/2027 (C)(F) 1,370,000 1,377,386
Venture XXI CLO, Ltd.,Series 2015-21A, Class A (3 monthLIBOR + 1.490%),2.794%, 07/15/2027 (C)(F) 571,000 571,815
John Hancock Funds IIPortfolio of Investments — August 31, 2017 (showing percentage of total net assets)
115
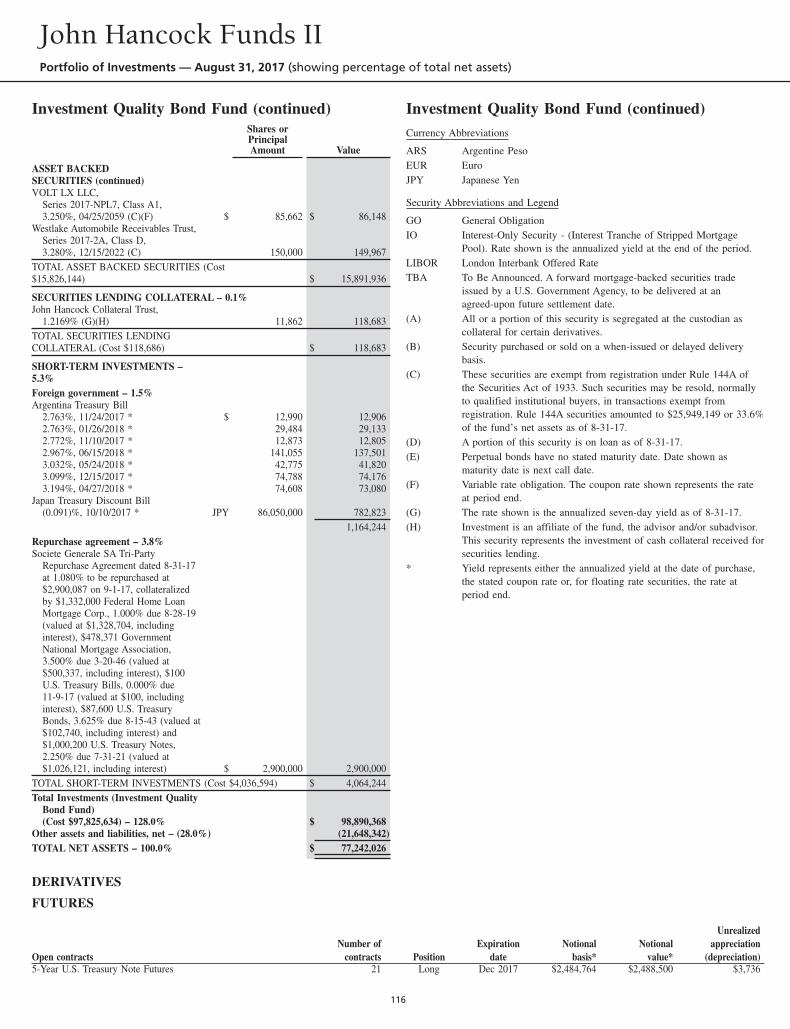
Investment Quality Bond Fund (continued)Shares orPrincipalAmount Value
ASSET BACKEDSECURITIES (continued)VOLT LX LLC,
Series 2017-NPL7, Class A1,3.250%, 04/25/2059 (C)(F) $ 85,662 $ 86,148
Westlake Automobile Receivables Trust,Series 2017-2A, Class D,3.280%, 12/15/2022 (C) 150,000 149,967
TOTAL ASSET BACKED SECURITIES (Cost$15,826,144) $ 15,891,936
SECURITIES LENDING COLLATERAL – 0.1%John Hancock Collateral Trust,
1.2169% (G)(H) 11,862 118,683TOTAL SECURITIES LENDINGCOLLATERAL (Cost $118,686) $ 118,683
SHORT-TERM INVESTMENTS –5.3%Foreign government – 1.5%Argentina Treasury Bill
2.763%, 11/24/2017 * $ 12,990 12,9062.763%, 01/26/2018 * 29,484 29,1332.772%, 11/10/2017 * 12,873 12,8052.967%, 06/15/2018 * 141,055 137,5013.032%, 05/24/2018 * 42,775 41,8203.099%, 12/15/2017 * 74,788 74,1763.194%, 04/27/2018 * 74,608 73,080
Japan Treasury Discount Bill(0.091)%, 10/10/2017 * JPY 86,050,000 782,823
1,164,244Repurchase agreement – 3.8%Societe Generale SA Tri-Party
Repurchase Agreement dated 8-31-17at 1.080% to be repurchased at$2,900,087 on 9-1-17, collateralizedby $1,332,000 Federal Home LoanMortgage Corp., 1.000% due 8-28-19(valued at $1,328,704, includinginterest), $478,371 GovernmentNational Mortgage Association,3.500% due 3-20-46 (valued at$500,337, including interest), $100U.S. Treasury Bills, 0.000% due11-9-17 (valued at $100, includinginterest), $87,600 U.S. TreasuryBonds, 3.625% due 8-15-43 (valued at$102,740, including interest) and$1,000,200 U.S. Treasury Notes,2.250% due 7-31-21 (valued at$1,026,121, including interest) $ 2,900,000 2,900,000
TOTAL SHORT-TERM INVESTMENTS (Cost $4,036,594) $ 4,064,244Total Investments (Investment Quality
Bond Fund)(Cost $97,825,634) – 128.0% $ 98,890,368
Other assets and liabilities, net – (28.0%) (21,648,342)TOTAL NET ASSETS – 100.0% $ 77,242,026
Investment Quality Bond Fund (continued)Currency Abbreviations
ARS Argentine PesoEUR EuroJPY Japanese Yen
Security Abbreviations and Legend
GO General ObligationIO Interest-Only Security - (Interest Tranche of Stripped Mortgage
Pool). Rate shown is the annualized yield at the end of the period.LIBOR London Interbank Offered RateTBA To Be Announced. A forward mortgage-backed securities trade
issued by a U.S. Government Agency, to be delivered at anagreed-upon future settlement date.
(A) All or a portion of this security is segregated at the custodian ascollateral for certain derivatives.
(B) Security purchased or sold on a when-issued or delayed deliverybasis.
(C) These securities are exempt from registration under Rule 144A ofthe Securities Act of 1933. Such securities may be resold, normallyto qualified institutional buyers, in transactions exempt fromregistration. Rule 144A securities amounted to $25,949,149 or 33.6%of the fund’s net assets as of 8-31-17.
(D) A portion of this security is on loan as of 8-31-17.(E) Perpetual bonds have no stated maturity date. Date shown as
maturity date is next call date.(F) Variable rate obligation. The coupon rate shown represents the rate
at period end.(G) The rate shown is the annualized seven-day yield as of 8-31-17.(H) Investment is an affiliate of the fund, the advisor and/or subadvisor.
This security represents the investment of cash collateral received forsecurities lending.
* Yield represents either the annualized yield at the date of purchase,the stated coupon rate or, for floating rate securities, the rate atperiod end.
DERIVATIVES
FUTURES
Open contractsNumber of
contracts PositionExpiration
dateNotional
basis*Notional
value*
Unrealizedappreciation
(depreciation)5-Year U.S. Treasury Note Futures 21 Long Dec 2017 $2,484,764 $2,488,500 $3,736
John Hancock Funds IIPortfolio of Investments — August 31, 2017 (showing percentage of total net assets)
116
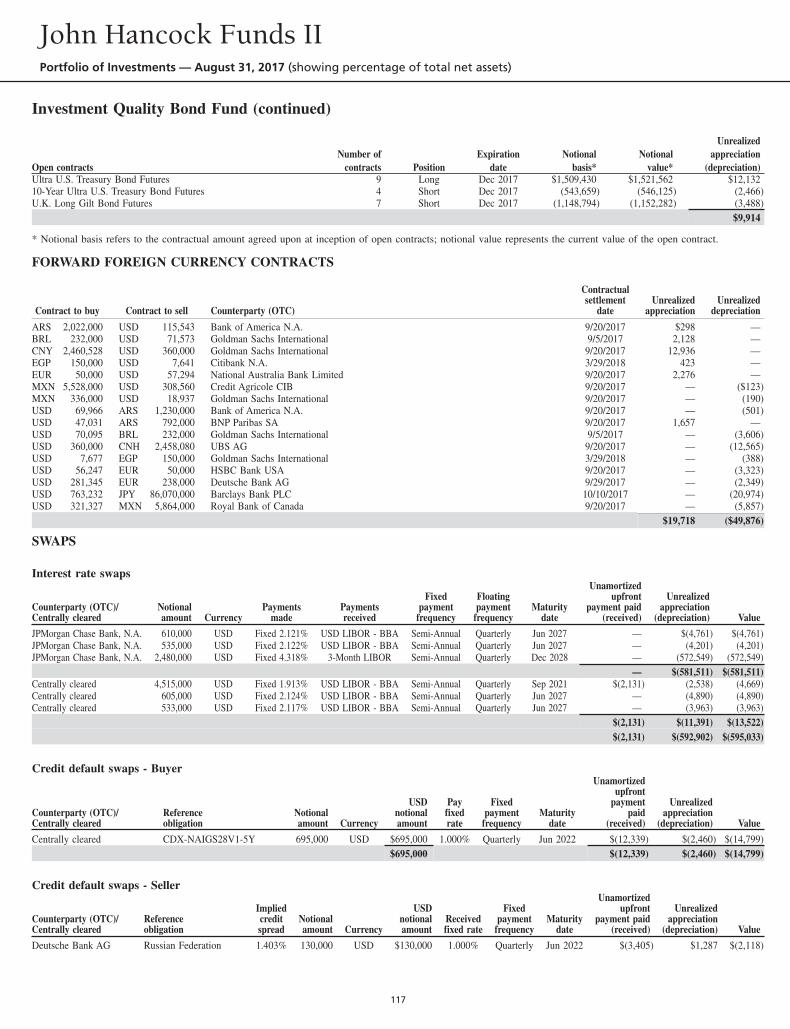
Investment Quality Bond Fund (continued)
Open contractsNumber of
contracts PositionExpiration
dateNotional
basis*Notional
value*
Unrealizedappreciation
(depreciation)Ultra U.S. Treasury Bond Futures 9 Long Dec 2017 $1,509,430 $1,521,562 $12,13210-Year Ultra U.S. Treasury Bond Futures 4 Short Dec 2017 (543,659) (546,125) (2,466)U.K. Long Gilt Bond Futures 7 Short Dec 2017 (1,148,794) (1,152,282) (3,488)
$9,914
* Notional basis refers to the contractual amount agreed upon at inception of open contracts; notional value represents the current value of the open contract.
FORWARD FOREIGN CURRENCY CONTRACTS
Contract to buy Contract to sell Counterparty (OTC)
Contractualsettlement
dateUnrealized
appreciationUnrealized
depreciation
ARS 2,022,000 USD 115,543 Bank of America N.A. 9/20/2017 $298 —BRL 232,000 USD 71,573 Goldman Sachs International 9/5/2017 2,128 —CNY 2,460,528 USD 360,000 Goldman Sachs International 9/20/2017 12,936 —EGP 150,000 USD 7,641 Citibank N.A. 3/29/2018 423 —EUR 50,000 USD 57,294 National Australia Bank Limited 9/20/2017 2,276 —MXN 5,528,000 USD 308,560 Credit Agricole CIB 9/20/2017 — ($123)MXN 336,000 USD 18,937 Goldman Sachs International 9/20/2017 — (190)USD 69,966 ARS 1,230,000 Bank of America N.A. 9/20/2017 — (501)USD 47,031 ARS 792,000 BNP Paribas SA 9/20/2017 1,657 —USD 70,095 BRL 232,000 Goldman Sachs International 9/5/2017 — (3,606)USD 360,000 CNH 2,458,080 UBS AG 9/20/2017 — (12,565)USD 7,677 EGP 150,000 Goldman Sachs International 3/29/2018 — (388)USD 56,247 EUR 50,000 HSBC Bank USA 9/20/2017 — (3,323)USD 281,345 EUR 238,000 Deutsche Bank AG 9/29/2017 — (2,349)USD 763,232 JPY 86,070,000 Barclays Bank PLC 10/10/2017 — (20,974)USD 321,327 MXN 5,864,000 Royal Bank of Canada 9/20/2017 — (5,857)
$19,718 ($49,876)
SWAPS
Interest rate swaps
Counterparty (OTC)/Centrally cleared
Notionalamount Currency
Paymentsmade
Paymentsreceived
Fixedpayment
frequency
Floatingpayment
frequencyMaturity
date
Unamortizedupfront
payment paid(received)
Unrealizedappreciation
(depreciation) Value
JPMorgan Chase Bank, N.A. 610,000 USD Fixed 2.121% USD LIBOR - BBA Semi-Annual Quarterly Jun 2027 — $(4,761) $(4,761)JPMorgan Chase Bank, N.A. 535,000 USD Fixed 2.122% USD LIBOR - BBA Semi-Annual Quarterly Jun 2027 — (4,201) (4,201)JPMorgan Chase Bank, N.A. 2,480,000 USD Fixed 4.318% 3-Month LIBOR Semi-Annual Quarterly Dec 2028 — (572,549) (572,549)
— $(581,511) $(581,511)Centrally cleared 4,515,000 USD Fixed 1.913% USD LIBOR - BBA Semi-Annual Quarterly Sep 2021 $(2,131) (2,538) (4,669)Centrally cleared 605,000 USD Fixed 2.124% USD LIBOR - BBA Semi-Annual Quarterly Jun 2027 — (4,890) (4,890)Centrally cleared 533,000 USD Fixed 2.117% USD LIBOR - BBA Semi-Annual Quarterly Jun 2027 — (3,963) (3,963)
$(2,131) $(11,391) $(13,522)$(2,131) $(592,902) $(595,033)
Credit default swaps - Buyer
Counterparty (OTC)/Centrally cleared
Referenceobligation
Notionalamount Currency
USDnotionalamount
Payfixedrate
Fixedpayment
frequencyMaturity
date
Unamortizedupfront
paymentpaid
(received)
Unrealizedappreciation
(depreciation) Value
Centrally cleared CDX-NAIGS28V1-5Y 695,000 USD $695,000 1.000% Quarterly Jun 2022 $(12,339) $(2,460) $(14,799)$695,000 $(12,339) $(2,460) $(14,799)
Credit default swaps - Seller
Counterparty (OTC)/Centrally cleared
Referenceobligation
Impliedcreditspread
Notionalamount Currency
USDnotionalamount
Receivedfixed rate
Fixedpayment
frequencyMaturity
date
Unamortizedupfront
payment paid(received)
Unrealizedappreciation
(depreciation) Value
Deutsche Bank AG Russian Federation 1.403% 130,000 USD $130,000 1.000% Quarterly Jun 2022 $(3,405) $1,287 $(2,118)
John Hancock Funds IIPortfolio of Investments — August 31, 2017 (showing percentage of total net assets)
117
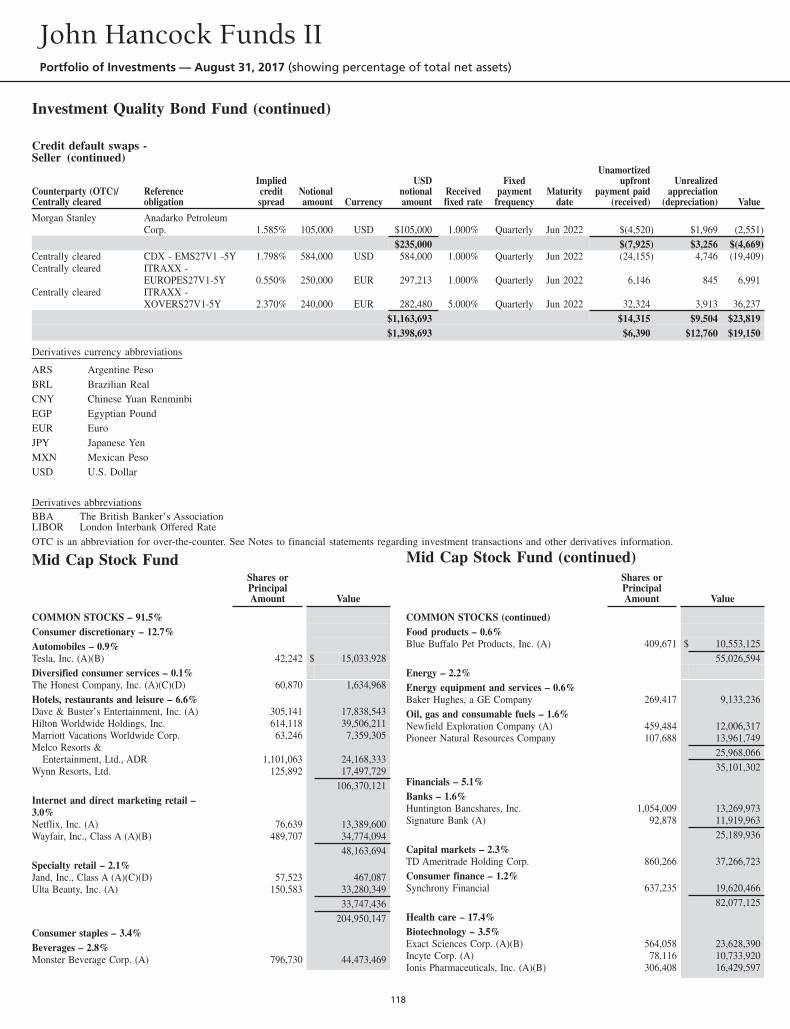
Investment Quality Bond Fund (continued)
Credit default swaps -Seller (continued)
Counterparty (OTC)/Centrally cleared
Referenceobligation
Impliedcreditspread
Notionalamount Currency
USDnotionalamount
Receivedfixed rate
Fixedpayment
frequencyMaturity
date
Unamortizedupfront
payment paid(received)
Unrealizedappreciation
(depreciation) Value
Morgan Stanley Anadarko PetroleumCorp. 1.585% 105,000 USD $105,000 1.000% Quarterly Jun 2022 $(4,520) $1,969 (2,551)
$235,000 $(7,925) $3,256 $(4,669)Centrally cleared CDX - EMS27V1 -5Y 1.798% 584,000 USD 584,000 1.000% Quarterly Jun 2022 (24,155) 4,746 (19,409)Centrally cleared ITRAXX -
EUROPES27V1-5Y 0.550% 250,000 EUR 297,213 1.000% Quarterly Jun 2022 6,146 845 6,991Centrally cleared ITRAXX -
XOVERS27V1-5Y 2.370% 240,000 EUR 282,480 5.000% Quarterly Jun 2022 32,324 3,913 36,237$1,163,693 $14,315 $9,504 $23,819$1,398,693 $6,390 $12,760 $19,150
Derivatives currency abbreviations
ARS Argentine PesoBRL Brazilian RealCNY Chinese Yuan RenminbiEGP Egyptian PoundEUR EuroJPY Japanese YenMXN Mexican PesoUSD U.S. Dollar
Derivatives abbreviationsBBA The British Banker’s AssociationLIBOR London Interbank Offered RateOTC is an abbreviation for over-the-counter. See Notes to financial statements regarding investment transactions and other derivatives information.
Mid Cap Stock FundShares orPrincipalAmount Value
COMMON STOCKS – 91.5%Consumer discretionary – 12.7%Automobiles – 0.9%Tesla, Inc. (A)(B) 42,242 $ 15,033,928Diversified consumer services – 0.1%The Honest Company, Inc. (A)(C)(D) 60,870 1,634,968Hotels, restaurants and leisure – 6.6%Dave & Buster’s Entertainment, Inc. (A) 305,141 17,838,543Hilton Worldwide Holdings, Inc. 614,118 39,506,211Marriott Vacations Worldwide Corp. 63,246 7,359,305Melco Resorts &
Entertainment, Ltd., ADR 1,101,063 24,168,333Wynn Resorts, Ltd. 125,892 17,497,729
106,370,121Internet and direct marketing retail –3.0%Netflix, Inc. (A) 76,639 13,389,600Wayfair, Inc., Class A (A)(B) 489,707 34,774,094
48,163,694Specialty retail – 2.1%Jand, Inc., Class A (A)(C)(D) 57,523 467,087Ulta Beauty, Inc. (A) 150,583 33,280,349
33,747,436204,950,147
Consumer staples – 3.4%Beverages – 2.8%Monster Beverage Corp. (A) 796,730 44,473,469
Mid Cap Stock Fund (continued)Shares orPrincipalAmount Value
COMMON STOCKS (continued)Food products – 0.6%Blue Buffalo Pet Products, Inc. (A) 409,671 $ 10,553,125
55,026,594Energy – 2.2%Energy equipment and services – 0.6%Baker Hughes, a GE Company 269,417 9,133,236Oil, gas and consumable fuels – 1.6%Newfield Exploration Company (A) 459,484 12,006,317Pioneer Natural Resources Company 107,688 13,961,749
25,968,06635,101,302
Financials – 5.1%Banks – 1.6%Huntington Bancshares, Inc. 1,054,009 13,269,973Signature Bank (A) 92,878 11,919,963
25,189,936Capital markets – 2.3%TD Ameritrade Holding Corp. 860,266 37,266,723Consumer finance – 1.2%Synchrony Financial 637,235 19,620,466
82,077,125Health care – 17.4%Biotechnology – 3.5%Exact Sciences Corp. (A)(B) 564,058 23,628,390Incyte Corp. (A) 78,116 10,733,920Ionis Pharmaceuticals, Inc. (A)(B) 306,408 16,429,597
John Hancock Funds IIPortfolio of Investments — August 31, 2017 (showing percentage of total net assets)
118
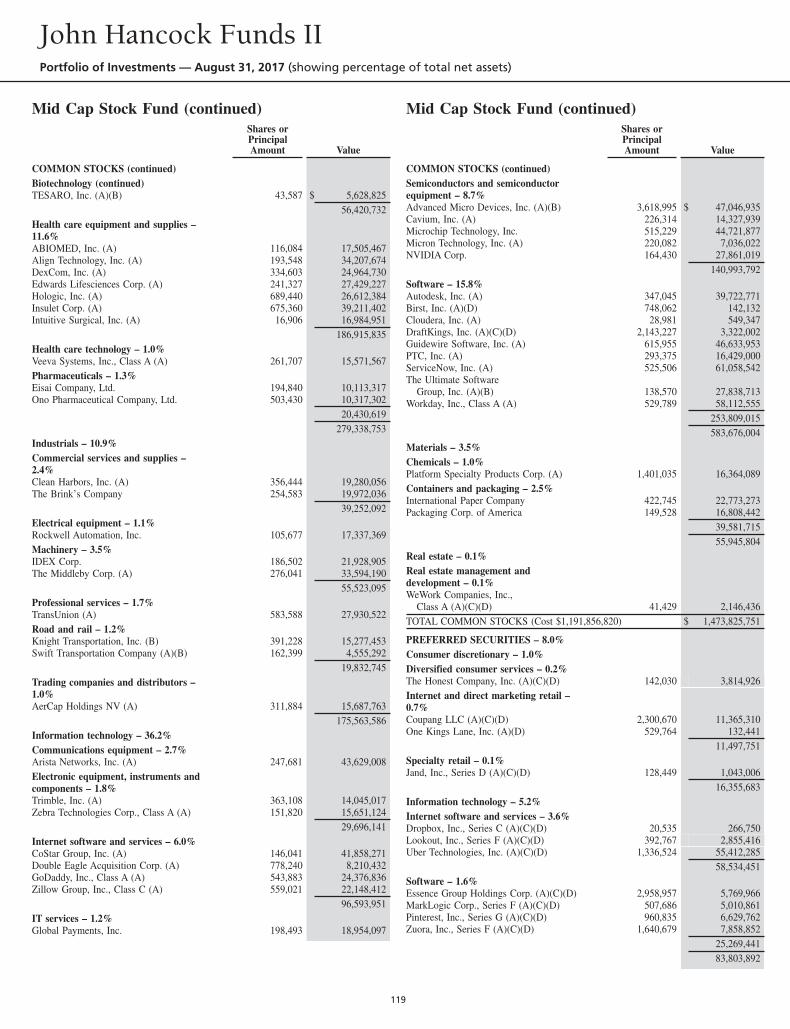
Mid Cap Stock Fund (continued)Shares orPrincipalAmount Value
COMMON STOCKS (continued)Biotechnology (continued)TESARO, Inc. (A)(B) 43,587 $ 5,628,825
56,420,732Health care equipment and supplies –11.6%ABIOMED, Inc. (A) 116,084 17,505,467Align Technology, Inc. (A) 193,548 34,207,674DexCom, Inc. (A) 334,603 24,964,730Edwards Lifesciences Corp. (A) 241,327 27,429,227Hologic, Inc. (A) 689,440 26,612,384Insulet Corp. (A) 675,360 39,211,402Intuitive Surgical, Inc. (A) 16,906 16,984,951
186,915,835Health care technology – 1.0%Veeva Systems, Inc., Class A (A) 261,707 15,571,567Pharmaceuticals – 1.3%Eisai Company, Ltd. 194,840 10,113,317Ono Pharmaceutical Company, Ltd. 503,430 10,317,302
20,430,619279,338,753
Industrials – 10.9%Commercial services and supplies –2.4%Clean Harbors, Inc. (A) 356,444 19,280,056The Brink’s Company 254,583 19,972,036
39,252,092Electrical equipment – 1.1%Rockwell Automation, Inc. 105,677 17,337,369Machinery – 3.5%IDEX Corp. 186,502 21,928,905The Middleby Corp. (A) 276,041 33,594,190
55,523,095Professional services – 1.7%TransUnion (A) 583,588 27,930,522Road and rail – 1.2%Knight Transportation, Inc. (B) 391,228 15,277,453Swift Transportation Company (A)(B) 162,399 4,555,292
19,832,745Trading companies and distributors –1.0%AerCap Holdings NV (A) 311,884 15,687,763
175,563,586Information technology – 36.2%Communications equipment – 2.7%Arista Networks, Inc. (A) 247,681 43,629,008Electronic equipment, instruments andcomponents – 1.8%Trimble, Inc. (A) 363,108 14,045,017Zebra Technologies Corp., Class A (A) 151,820 15,651,124
29,696,141Internet software and services – 6.0%CoStar Group, Inc. (A) 146,041 41,858,271Double Eagle Acquisition Corp. (A) 778,240 8,210,432GoDaddy, Inc., Class A (A) 543,883 24,376,836Zillow Group, Inc., Class C (A) 559,021 22,148,412
96,593,951IT services – 1.2%Global Payments, Inc. 198,493 18,954,097
Mid Cap Stock Fund (continued)Shares orPrincipalAmount Value
COMMON STOCKS (continued)Semiconductors and semiconductorequipment – 8.7%Advanced Micro Devices, Inc. (A)(B) 3,618,995 $ 47,046,935Cavium, Inc. (A) 226,314 14,327,939Microchip Technology, Inc. 515,229 44,721,877Micron Technology, Inc. (A) 220,082 7,036,022NVIDIA Corp. 164,430 27,861,019
140,993,792Software – 15.8%Autodesk, Inc. (A) 347,045 39,722,771Birst, Inc. (A)(D) 748,062 142,132Cloudera, Inc. (A) 28,981 549,347DraftKings, Inc. (A)(C)(D) 2,143,227 3,322,002Guidewire Software, Inc. (A) 615,955 46,633,953PTC, Inc. (A) 293,375 16,429,000ServiceNow, Inc. (A) 525,506 61,058,542The Ultimate Software
Group, Inc. (A)(B) 138,570 27,838,713Workday, Inc., Class A (A) 529,789 58,112,555
253,809,015583,676,004
Materials – 3.5%Chemicals – 1.0%Platform Specialty Products Corp. (A) 1,401,035 16,364,089Containers and packaging – 2.5%International Paper Company 422,745 22,773,273Packaging Corp. of America 149,528 16,808,442
39,581,71555,945,804
Real estate – 0.1%Real estate management anddevelopment – 0.1%WeWork Companies, Inc.,
Class A (A)(C)(D) 41,429 2,146,436TOTAL COMMON STOCKS (Cost $1,191,856,820) $ 1,473,825,751
PREFERRED SECURITIES – 8.0%Consumer discretionary – 1.0%Diversified consumer services – 0.2%The Honest Company, Inc. (A)(C)(D) 142,030 3,814,926Internet and direct marketing retail –0.7%Coupang LLC (A)(C)(D) 2,300,670 11,365,310One Kings Lane, Inc. (A)(D) 529,764 132,441
11,497,751Specialty retail – 0.1%Jand, Inc., Series D (A)(C)(D) 128,449 1,043,006
16,355,683Information technology – 5.2%Internet software and services – 3.6%Dropbox, Inc., Series C (A)(C)(D) 20,535 266,750Lookout, Inc., Series F (A)(C)(D) 392,767 2,855,416Uber Technologies, Inc. (A)(C)(D) 1,336,524 55,412,285
58,534,451Software – 1.6%Essence Group Holdings Corp. (A)(C)(D) 2,958,957 5,769,966MarkLogic Corp., Series F (A)(C)(D) 507,686 5,010,861Pinterest, Inc., Series G (A)(C)(D) 960,835 6,629,762Zuora, Inc., Series F (A)(C)(D) 1,640,679 7,858,852
25,269,44183,803,892
John Hancock Funds IIPortfolio of Investments — August 31, 2017 (showing percentage of total net assets)
119
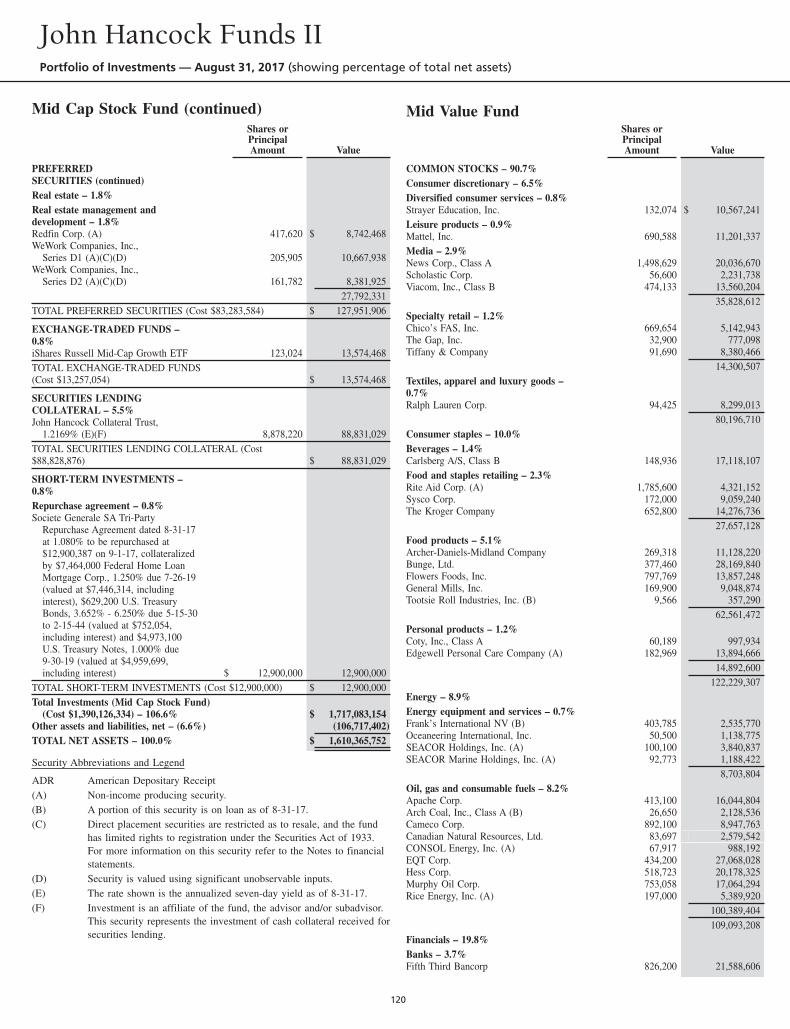
Mid Cap Stock Fund (continued)Shares orPrincipalAmount Value
PREFERREDSECURITIES (continued)Real estate – 1.8%Real estate management anddevelopment – 1.8%Redfin Corp. (A) 417,620 $ 8,742,468WeWork Companies, Inc.,
Series D1 (A)(C)(D) 205,905 10,667,938WeWork Companies, Inc.,
Series D2 (A)(C)(D) 161,782 8,381,92527,792,331
TOTAL PREFERRED SECURITIES (Cost $83,283,584) $ 127,951,906
EXCHANGE-TRADED FUNDS –0.8%iShares Russell Mid-Cap Growth ETF 123,024 13,574,468TOTAL EXCHANGE-TRADED FUNDS(Cost $13,257,054) $ 13,574,468
SECURITIES LENDINGCOLLATERAL – 5.5%John Hancock Collateral Trust,
1.2169% (E)(F) 8,878,220 88,831,029TOTAL SECURITIES LENDING COLLATERAL (Cost$88,828,876) $ 88,831,029
SHORT-TERM INVESTMENTS –0.8%Repurchase agreement – 0.8%Societe Generale SA Tri-Party
Repurchase Agreement dated 8-31-17at 1.080% to be repurchased at$12,900,387 on 9-1-17, collateralizedby $7,464,000 Federal Home LoanMortgage Corp., 1.250% due 7-26-19(valued at $7,446,314, includinginterest), $629,200 U.S. TreasuryBonds, 3.652% - 6.250% due 5-15-30to 2-15-44 (valued at $752,054,including interest) and $4,973,100U.S. Treasury Notes, 1.000% due9-30-19 (valued at $4,959,699,including interest) $ 12,900,000 12,900,000
TOTAL SHORT-TERM INVESTMENTS (Cost $12,900,000) $ 12,900,000Total Investments (Mid Cap Stock Fund)
(Cost $1,390,126,334) – 106.6% $ 1,717,083,154Other assets and liabilities, net – (6.6%) (106,717,402)TOTAL NET ASSETS – 100.0% $ 1,610,365,752
Security Abbreviations and Legend
ADR American Depositary Receipt(A) Non-income producing security.(B) A portion of this security is on loan as of 8-31-17.(C) Direct placement securities are restricted as to resale, and the fund
has limited rights to registration under the Securities Act of 1933.For more information on this security refer to the Notes to financialstatements.
(D) Security is valued using significant unobservable inputs.(E) The rate shown is the annualized seven-day yield as of 8-31-17.(F) Investment is an affiliate of the fund, the advisor and/or subadvisor.
This security represents the investment of cash collateral received forsecurities lending.
Mid Value FundShares orPrincipalAmount Value
COMMON STOCKS – 90.7%Consumer discretionary – 6.5%Diversified consumer services – 0.8%Strayer Education, Inc. 132,074 $ 10,567,241Leisure products – 0.9%Mattel, Inc. 690,588 11,201,337Media – 2.9%News Corp., Class A 1,498,629 20,036,670Scholastic Corp. 56,600 2,231,738Viacom, Inc., Class B 474,133 13,560,204
35,828,612Specialty retail – 1.2%Chico’s FAS, Inc. 669,654 5,142,943The Gap, Inc. 32,900 777,098Tiffany & Company 91,690 8,380,466
14,300,507Textiles, apparel and luxury goods –0.7%Ralph Lauren Corp. 94,425 8,299,013
80,196,710Consumer staples – 10.0%Beverages – 1.4%Carlsberg A/S, Class B 148,936 17,118,107Food and staples retailing – 2.3%Rite Aid Corp. (A) 1,785,600 4,321,152Sysco Corp. 172,000 9,059,240The Kroger Company 652,800 14,276,736
27,657,128Food products – 5.1%Archer-Daniels-Midland Company 269,318 11,128,220Bunge, Ltd. 377,460 28,169,840Flowers Foods, Inc. 797,769 13,857,248General Mills, Inc. 169,900 9,048,874Tootsie Roll Industries, Inc. (B) 9,566 357,290
62,561,472Personal products – 1.2%Coty, Inc., Class A 60,189 997,934Edgewell Personal Care Company (A) 182,969 13,894,666
14,892,600122,229,307
Energy – 8.9%Energy equipment and services – 0.7%Frank’s International NV (B) 403,785 2,535,770Oceaneering International, Inc. 50,500 1,138,775SEACOR Holdings, Inc. (A) 100,100 3,840,837SEACOR Marine Holdings, Inc. (A) 92,773 1,188,422
8,703,804Oil, gas and consumable fuels – 8.2%Apache Corp. 413,100 16,044,804Arch Coal, Inc., Class A (B) 26,650 2,128,536Cameco Corp. 892,100 8,947,763Canadian Natural Resources, Ltd. 83,697 2,579,542CONSOL Energy, Inc. (A) 67,917 988,192EQT Corp. 434,200 27,068,028Hess Corp. 518,723 20,178,325Murphy Oil Corp. 753,058 17,064,294Rice Energy, Inc. (A) 197,000 5,389,920
100,389,404109,093,208
Financials – 19.8%Banks – 3.7%Fifth Third Bancorp 826,200 21,588,606
John Hancock Funds IIPortfolio of Investments — August 31, 2017 (showing percentage of total net assets)
120
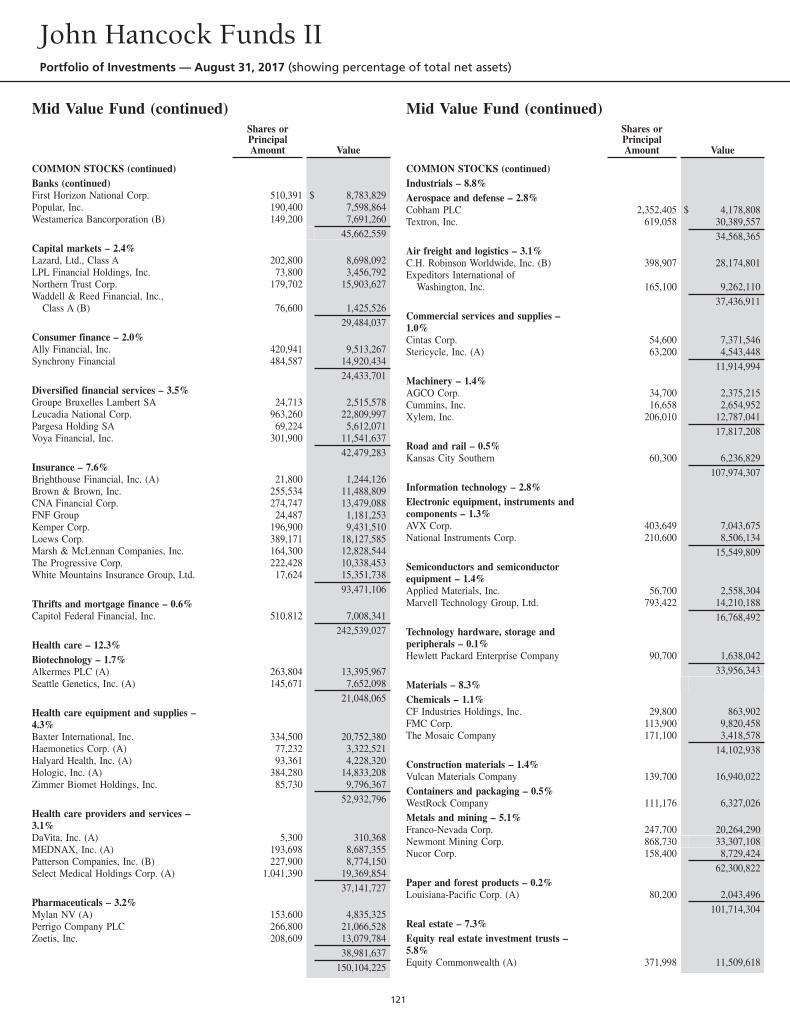
Mid Value Fund (continued)Shares orPrincipalAmount Value
COMMON STOCKS (continued)Banks (continued)First Horizon National Corp. 510,391 $ 8,783,829Popular, Inc. 190,400 7,598,864Westamerica Bancorporation (B) 149,200 7,691,260
45,662,559Capital markets – 2.4%Lazard, Ltd., Class A 202,800 8,698,092LPL Financial Holdings, Inc. 73,800 3,456,792Northern Trust Corp. 179,702 15,903,627Waddell & Reed Financial, Inc.,
Class A (B) 76,600 1,425,52629,484,037
Consumer finance – 2.0%Ally Financial, Inc. 420,941 9,513,267Synchrony Financial 484,587 14,920,434
24,433,701Diversified financial services – 3.5%Groupe Bruxelles Lambert SA 24,713 2,515,578Leucadia National Corp. 963,260 22,809,997Pargesa Holding SA 69,224 5,612,071Voya Financial, Inc. 301,900 11,541,637
42,479,283Insurance – 7.6%Brighthouse Financial, Inc. (A) 21,800 1,244,126Brown & Brown, Inc. 255,534 11,488,809CNA Financial Corp. 274,747 13,479,088FNF Group 24,487 1,181,253Kemper Corp. 196,900 9,431,510Loews Corp. 389,171 18,127,585Marsh & McLennan Companies, Inc. 164,300 12,828,544The Progressive Corp. 222,428 10,338,453White Mountains Insurance Group, Ltd. 17,624 15,351,738
93,471,106Thrifts and mortgage finance – 0.6%Capitol Federal Financial, Inc. 510,812 7,008,341
242,539,027Health care – 12.3%Biotechnology – 1.7%Alkermes PLC (A) 263,804 13,395,967Seattle Genetics, Inc. (A) 145,671 7,652,098
21,048,065Health care equipment and supplies –4.3%Baxter International, Inc. 334,500 20,752,380Haemonetics Corp. (A) 77,232 3,322,521Halyard Health, Inc. (A) 93,361 4,228,320Hologic, Inc. (A) 384,280 14,833,208Zimmer Biomet Holdings, Inc. 85,730 9,796,367
52,932,796Health care providers and services –3.1%DaVita, Inc. (A) 5,300 310,368MEDNAX, Inc. (A) 193,698 8,687,355Patterson Companies, Inc. (B) 227,900 8,774,150Select Medical Holdings Corp. (A) 1,041,390 19,369,854
37,141,727Pharmaceuticals – 3.2%Mylan NV (A) 153,600 4,835,325Perrigo Company PLC 266,800 21,066,528Zoetis, Inc. 208,609 13,079,784
38,981,637150,104,225
Mid Value Fund (continued)Shares orPrincipalAmount Value
COMMON STOCKS (continued)Industrials – 8.8%Aerospace and defense – 2.8%Cobham PLC 2,352,405 $ 4,178,808Textron, Inc. 619,058 30,389,557
34,568,365Air freight and logistics – 3.1%C.H. Robinson Worldwide, Inc. (B) 398,907 28,174,801Expeditors International of
Washington, Inc. 165,100 9,262,11037,436,911
Commercial services and supplies –1.0%Cintas Corp. 54,600 7,371,546Stericycle, Inc. (A) 63,200 4,543,448
11,914,994Machinery – 1.4%AGCO Corp. 34,700 2,375,215Cummins, Inc. 16,658 2,654,952Xylem, Inc. 206,010 12,787,041
17,817,208Road and rail – 0.5%Kansas City Southern 60,300 6,236,829
107,974,307Information technology – 2.8%Electronic equipment, instruments andcomponents – 1.3%AVX Corp. 403,649 7,043,675National Instruments Corp. 210,600 8,506,134
15,549,809Semiconductors and semiconductorequipment – 1.4%Applied Materials, Inc. 56,700 2,558,304Marvell Technology Group, Ltd. 793,422 14,210,188
16,768,492Technology hardware, storage andperipherals – 0.1%Hewlett Packard Enterprise Company 90,700 1,638,042
33,956,343Materials – 8.3%Chemicals – 1.1%CF Industries Holdings, Inc. 29,800 863,902FMC Corp. 113,900 9,820,458The Mosaic Company 171,100 3,418,578
14,102,938Construction materials – 1.4%Vulcan Materials Company 139,700 16,940,022Containers and packaging – 0.5%WestRock Company 111,176 6,327,026Metals and mining – 5.1%Franco-Nevada Corp. 247,700 20,264,290Newmont Mining Corp. 868,730 33,307,108Nucor Corp. 158,400 8,729,424
62,300,822Paper and forest products – 0.2%Louisiana-Pacific Corp. (A) 80,200 2,043,496
101,714,304Real estate – 7.3%Equity real estate investment trusts –5.8%Equity Commonwealth (A) 371,998 11,509,618
John Hancock Funds IIPortfolio of Investments — August 31, 2017 (showing percentage of total net assets)
121
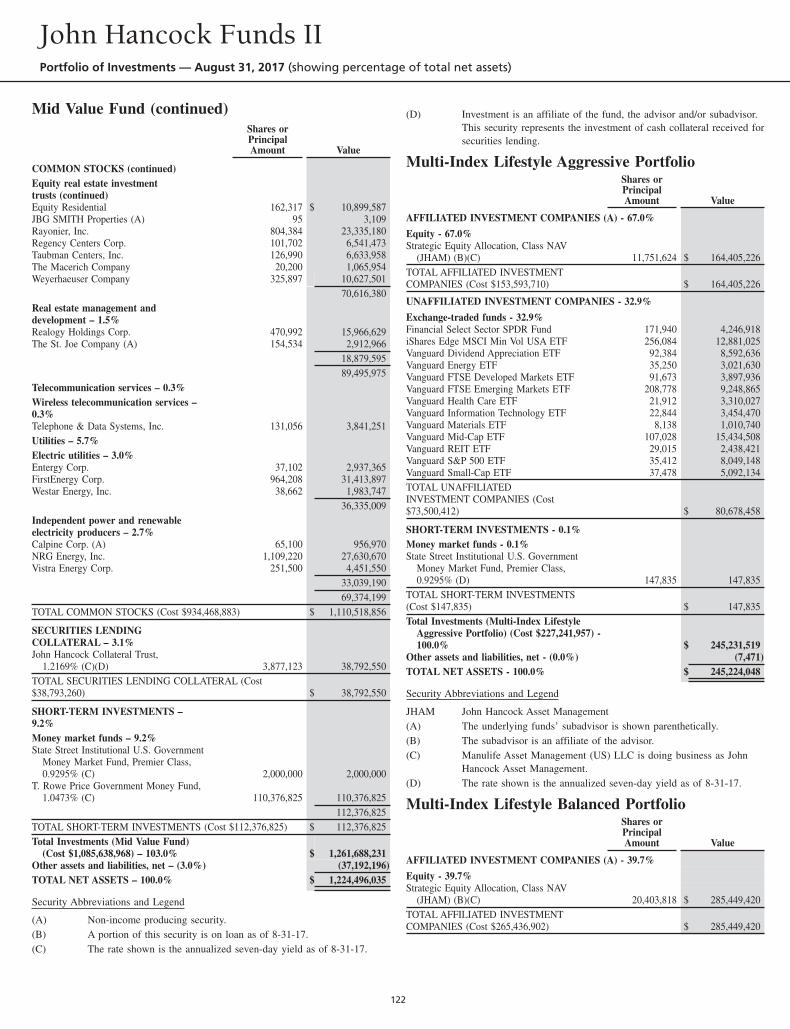
Mid Value Fund (continued)Shares orPrincipalAmount Value
COMMON STOCKS (continued)Equity real estate investmenttrusts (continued)Equity Residential 162,317 $ 10,899,587JBG SMITH Properties (A) 95 3,109Rayonier, Inc. 804,384 23,335,180Regency Centers Corp. 101,702 6,541,473Taubman Centers, Inc. 126,990 6,633,958The Macerich Company 20,200 1,065,954Weyerhaeuser Company 325,897 10,627,501
70,616,380Real estate management anddevelopment – 1.5%Realogy Holdings Corp. 470,992 15,966,629The St. Joe Company (A) 154,534 2,912,966
18,879,59589,495,975
Telecommunication services – 0.3%Wireless telecommunication services –0.3%Telephone & Data Systems, Inc. 131,056 3,841,251Utilities – 5.7%Electric utilities – 3.0%Entergy Corp. 37,102 2,937,365FirstEnergy Corp. 964,208 31,413,897Westar Energy, Inc. 38,662 1,983,747
36,335,009Independent power and renewableelectricity producers – 2.7%Calpine Corp. (A) 65,100 956,970NRG Energy, Inc. 1,109,220 27,630,670Vistra Energy Corp. 251,500 4,451,550
33,039,19069,374,199
TOTAL COMMON STOCKS (Cost $934,468,883) $ 1,110,518,856
SECURITIES LENDINGCOLLATERAL – 3.1%John Hancock Collateral Trust,
1.2169% (C)(D) 3,877,123 38,792,550TOTAL SECURITIES LENDING COLLATERAL (Cost$38,793,260) $ 38,792,550
SHORT-TERM INVESTMENTS –9.2%Money market funds – 9.2%State Street Institutional U.S. Government
Money Market Fund, Premier Class,0.9295% (C) 2,000,000 2,000,000
T. Rowe Price Government Money Fund,1.0473% (C) 110,376,825 110,376,825
112,376,825TOTAL SHORT-TERM INVESTMENTS (Cost $112,376,825) $ 112,376,825Total Investments (Mid Value Fund)
(Cost $1,085,638,968) – 103.0% $ 1,261,688,231Other assets and liabilities, net – (3.0%) (37,192,196)TOTAL NET ASSETS – 100.0% $ 1,224,496,035
Security Abbreviations and Legend
(A) Non-income producing security.(B) A portion of this security is on loan as of 8-31-17.(C) The rate shown is the annualized seven-day yield as of 8-31-17.
(D) Investment is an affiliate of the fund, the advisor and/or subadvisor.This security represents the investment of cash collateral received forsecurities lending.
Multi-Index Lifestyle Aggressive PortfolioShares orPrincipalAmount Value
AFFILIATED INVESTMENT COMPANIES (A) - 67.0%
Equity - 67.0%Strategic Equity Allocation, Class NAV
(JHAM) (B)(C) 11,751,624 $ 164,405,226TOTAL AFFILIATED INVESTMENTCOMPANIES (Cost $153,593,710) $ 164,405,226
UNAFFILIATED INVESTMENT COMPANIES - 32.9%
Exchange-traded funds - 32.9%Financial Select Sector SPDR Fund 171,940 4,246,918iShares Edge MSCI Min Vol USA ETF 256,084 12,881,025Vanguard Dividend Appreciation ETF 92,384 8,592,636Vanguard Energy ETF 35,250 3,021,630Vanguard FTSE Developed Markets ETF 91,673 3,897,936Vanguard FTSE Emerging Markets ETF 208,778 9,248,865Vanguard Health Care ETF 21,912 3,310,027Vanguard Information Technology ETF 22,844 3,454,470Vanguard Materials ETF 8,138 1,010,740Vanguard Mid-Cap ETF 107,028 15,434,508Vanguard REIT ETF 29,015 2,438,421Vanguard S&P 500 ETF 35,412 8,049,148Vanguard Small-Cap ETF 37,478 5,092,134TOTAL UNAFFILIATEDINVESTMENT COMPANIES (Cost$73,500,412) $ 80,678,458
SHORT-TERM INVESTMENTS - 0.1%Money market funds - 0.1%State Street Institutional U.S. Government
Money Market Fund, Premier Class,0.9295% (D) 147,835 147,835
TOTAL SHORT-TERM INVESTMENTS(Cost $147,835) $ 147,835Total Investments (Multi-Index Lifestyle
Aggressive Portfolio) (Cost $227,241,957) -100.0% $ 245,231,519
Other assets and liabilities, net - (0.0%) (7,471)TOTAL NET ASSETS - 100.0% $ 245,224,048
Security Abbreviations and Legend
JHAM John Hancock Asset Management(A) The underlying funds’ subadvisor is shown parenthetically.(B) The subadvisor is an affiliate of the advisor.(C) Manulife Asset Management (US) LLC is doing business as John
Hancock Asset Management.(D) The rate shown is the annualized seven-day yield as of 8-31-17.
Multi-Index Lifestyle Balanced PortfolioShares orPrincipalAmount Value
AFFILIATED INVESTMENT COMPANIES (A) - 39.7%
Equity - 39.7%Strategic Equity Allocation, Class NAV
(JHAM) (B)(C) 20,403,818 $ 285,449,420TOTAL AFFILIATED INVESTMENTCOMPANIES (Cost $265,436,902) $ 285,449,420
John Hancock Funds IIPortfolio of Investments — August 31, 2017 (showing percentage of total net assets)
122
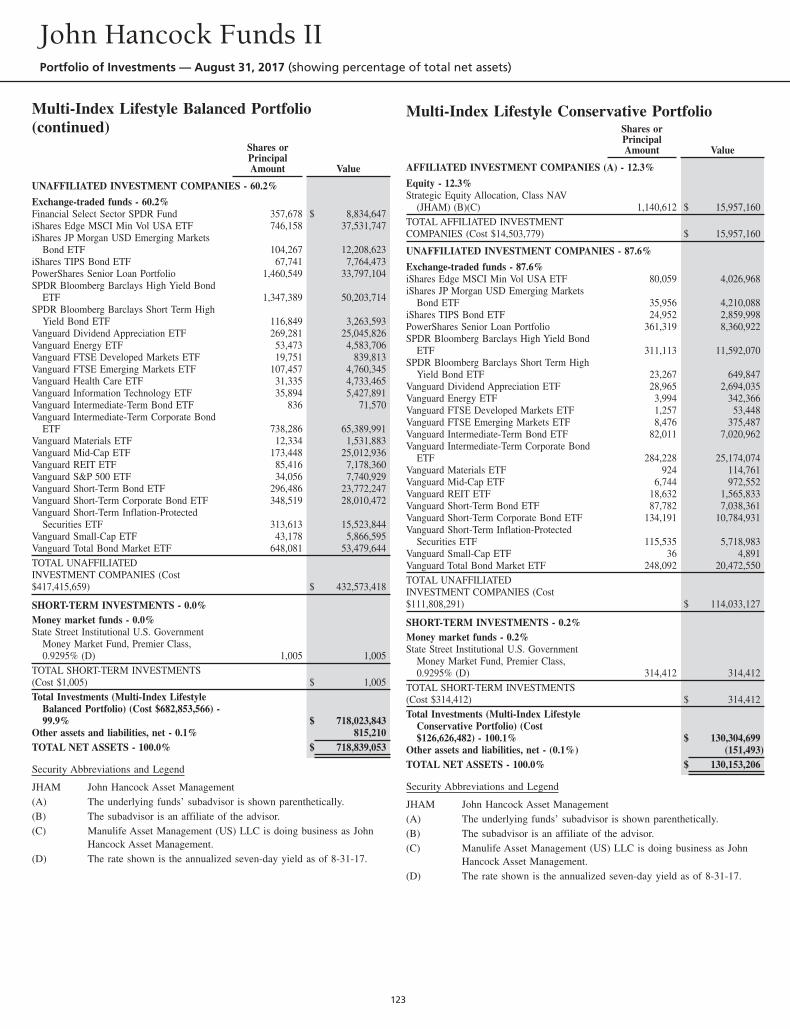
Multi-Index Lifestyle Balanced Portfolio(continued)
Shares orPrincipalAmount Value
UNAFFILIATED INVESTMENT COMPANIES - 60.2%
Exchange-traded funds - 60.2%Financial Select Sector SPDR Fund 357,678 $ 8,834,647iShares Edge MSCI Min Vol USA ETF 746,158 37,531,747iShares JP Morgan USD Emerging Markets
Bond ETF 104,267 12,208,623iShares TIPS Bond ETF 67,741 7,764,473PowerShares Senior Loan Portfolio 1,460,549 33,797,104SPDR Bloomberg Barclays High Yield Bond
ETF 1,347,389 50,203,714SPDR Bloomberg Barclays Short Term High
Yield Bond ETF 116,849 3,263,593Vanguard Dividend Appreciation ETF 269,281 25,045,826Vanguard Energy ETF 53,473 4,583,706Vanguard FTSE Developed Markets ETF 19,751 839,813Vanguard FTSE Emerging Markets ETF 107,457 4,760,345Vanguard Health Care ETF 31,335 4,733,465Vanguard Information Technology ETF 35,894 5,427,891Vanguard Intermediate-Term Bond ETF 836 71,570Vanguard Intermediate-Term Corporate Bond
ETF 738,286 65,389,991Vanguard Materials ETF 12,334 1,531,883Vanguard Mid-Cap ETF 173,448 25,012,936Vanguard REIT ETF 85,416 7,178,360Vanguard S&P 500 ETF 34,056 7,740,929Vanguard Short-Term Bond ETF 296,486 23,772,247Vanguard Short-Term Corporate Bond ETF 348,519 28,010,472Vanguard Short-Term Inflation-Protected
Securities ETF 313,613 15,523,844Vanguard Small-Cap ETF 43,178 5,866,595Vanguard Total Bond Market ETF 648,081 53,479,644TOTAL UNAFFILIATEDINVESTMENT COMPANIES (Cost$417,415,659) $ 432,573,418
SHORT-TERM INVESTMENTS - 0.0%Money market funds - 0.0%State Street Institutional U.S. Government
Money Market Fund, Premier Class,0.9295% (D) 1,005 1,005
TOTAL SHORT-TERM INVESTMENTS(Cost $1,005) $ 1,005Total Investments (Multi-Index Lifestyle
Balanced Portfolio) (Cost $682,853,566) -99.9% $ 718,023,843
Other assets and liabilities, net - 0.1% 815,210TOTAL NET ASSETS - 100.0% $ 718,839,053
Security Abbreviations and Legend
JHAM John Hancock Asset Management(A) The underlying funds’ subadvisor is shown parenthetically.(B) The subadvisor is an affiliate of the advisor.(C) Manulife Asset Management (US) LLC is doing business as John
Hancock Asset Management.(D) The rate shown is the annualized seven-day yield as of 8-31-17.
Multi-Index Lifestyle Conservative PortfolioShares orPrincipalAmount Value
AFFILIATED INVESTMENT COMPANIES (A) - 12.3%
Equity - 12.3%Strategic Equity Allocation, Class NAV
(JHAM) (B)(C) 1,140,612 $ 15,957,160TOTAL AFFILIATED INVESTMENTCOMPANIES (Cost $14,503,779) $ 15,957,160
UNAFFILIATED INVESTMENT COMPANIES - 87.6%
Exchange-traded funds - 87.6%iShares Edge MSCI Min Vol USA ETF 80,059 4,026,968iShares JP Morgan USD Emerging Markets
Bond ETF 35,956 4,210,088iShares TIPS Bond ETF 24,952 2,859,998PowerShares Senior Loan Portfolio 361,319 8,360,922SPDR Bloomberg Barclays High Yield Bond
ETF 311,113 11,592,070SPDR Bloomberg Barclays Short Term High
Yield Bond ETF 23,267 649,847Vanguard Dividend Appreciation ETF 28,965 2,694,035Vanguard Energy ETF 3,994 342,366Vanguard FTSE Developed Markets ETF 1,257 53,448Vanguard FTSE Emerging Markets ETF 8,476 375,487Vanguard Intermediate-Term Bond ETF 82,011 7,020,962Vanguard Intermediate-Term Corporate Bond
ETF 284,228 25,174,074Vanguard Materials ETF 924 114,761Vanguard Mid-Cap ETF 6,744 972,552Vanguard REIT ETF 18,632 1,565,833Vanguard Short-Term Bond ETF 87,782 7,038,361Vanguard Short-Term Corporate Bond ETF 134,191 10,784,931Vanguard Short-Term Inflation-Protected
Securities ETF 115,535 5,718,983Vanguard Small-Cap ETF 36 4,891Vanguard Total Bond Market ETF 248,092 20,472,550TOTAL UNAFFILIATEDINVESTMENT COMPANIES (Cost$111,808,291) $ 114,033,127
SHORT-TERM INVESTMENTS - 0.2%Money market funds - 0.2%State Street Institutional U.S. Government
Money Market Fund, Premier Class,0.9295% (D) 314,412 314,412
TOTAL SHORT-TERM INVESTMENTS(Cost $314,412) $ 314,412Total Investments (Multi-Index Lifestyle
Conservative Portfolio) (Cost$126,626,482) - 100.1% $ 130,304,699
Other assets and liabilities, net - (0.1%) (151,493)TOTAL NET ASSETS - 100.0% $ 130,153,206
Security Abbreviations and Legend
JHAM John Hancock Asset Management(A) The underlying funds’ subadvisor is shown parenthetically.(B) The subadvisor is an affiliate of the advisor.(C) Manulife Asset Management (US) LLC is doing business as John
Hancock Asset Management.(D) The rate shown is the annualized seven-day yield as of 8-31-17.
John Hancock Funds IIPortfolio of Investments — August 31, 2017 (showing percentage of total net assets)
123
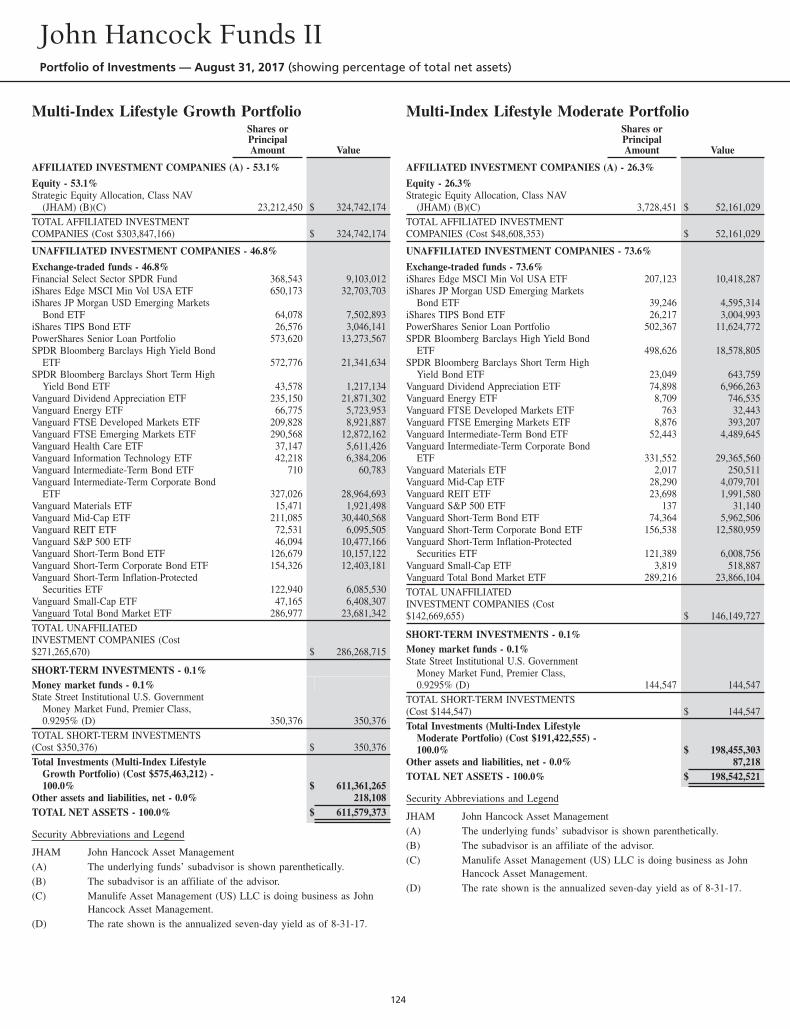
Multi-Index Lifestyle Growth PortfolioShares orPrincipalAmount Value
AFFILIATED INVESTMENT COMPANIES (A) - 53.1%
Equity - 53.1%Strategic Equity Allocation, Class NAV
(JHAM) (B)(C) 23,212,450 $ 324,742,174TOTAL AFFILIATED INVESTMENTCOMPANIES (Cost $303,847,166) $ 324,742,174
UNAFFILIATED INVESTMENT COMPANIES - 46.8%
Exchange-traded funds - 46.8%Financial Select Sector SPDR Fund 368,543 9,103,012iShares Edge MSCI Min Vol USA ETF 650,173 32,703,703iShares JP Morgan USD Emerging Markets
Bond ETF 64,078 7,502,893iShares TIPS Bond ETF 26,576 3,046,141PowerShares Senior Loan Portfolio 573,620 13,273,567SPDR Bloomberg Barclays High Yield Bond
ETF 572,776 21,341,634SPDR Bloomberg Barclays Short Term High
Yield Bond ETF 43,578 1,217,134Vanguard Dividend Appreciation ETF 235,150 21,871,302Vanguard Energy ETF 66,775 5,723,953Vanguard FTSE Developed Markets ETF 209,828 8,921,887Vanguard FTSE Emerging Markets ETF 290,568 12,872,162Vanguard Health Care ETF 37,147 5,611,426Vanguard Information Technology ETF 42,218 6,384,206Vanguard Intermediate-Term Bond ETF 710 60,783Vanguard Intermediate-Term Corporate Bond
ETF 327,026 28,964,693Vanguard Materials ETF 15,471 1,921,498Vanguard Mid-Cap ETF 211,085 30,440,568Vanguard REIT ETF 72,531 6,095,505Vanguard S&P 500 ETF 46,094 10,477,166Vanguard Short-Term Bond ETF 126,679 10,157,122Vanguard Short-Term Corporate Bond ETF 154,326 12,403,181Vanguard Short-Term Inflation-Protected
Securities ETF 122,940 6,085,530Vanguard Small-Cap ETF 47,165 6,408,307Vanguard Total Bond Market ETF 286,977 23,681,342TOTAL UNAFFILIATEDINVESTMENT COMPANIES (Cost$271,265,670) $ 286,268,715
SHORT-TERM INVESTMENTS - 0.1%Money market funds - 0.1%State Street Institutional U.S. Government
Money Market Fund, Premier Class,0.9295% (D) 350,376 350,376
TOTAL SHORT-TERM INVESTMENTS(Cost $350,376) $ 350,376Total Investments (Multi-Index Lifestyle
Growth Portfolio) (Cost $575,463,212) -100.0% $ 611,361,265
Other assets and liabilities, net - 0.0% 218,108TOTAL NET ASSETS - 100.0% $ 611,579,373
Security Abbreviations and Legend
JHAM John Hancock Asset Management(A) The underlying funds’ subadvisor is shown parenthetically.(B) The subadvisor is an affiliate of the advisor.(C) Manulife Asset Management (US) LLC is doing business as John
Hancock Asset Management.(D) The rate shown is the annualized seven-day yield as of 8-31-17.
Multi-Index Lifestyle Moderate PortfolioShares orPrincipalAmount Value
AFFILIATED INVESTMENT COMPANIES (A) - 26.3%
Equity - 26.3%Strategic Equity Allocation, Class NAV
(JHAM) (B)(C) 3,728,451 $ 52,161,029TOTAL AFFILIATED INVESTMENTCOMPANIES (Cost $48,608,353) $ 52,161,029
UNAFFILIATED INVESTMENT COMPANIES - 73.6%
Exchange-traded funds - 73.6%iShares Edge MSCI Min Vol USA ETF 207,123 10,418,287iShares JP Morgan USD Emerging Markets
Bond ETF 39,246 4,595,314iShares TIPS Bond ETF 26,217 3,004,993PowerShares Senior Loan Portfolio 502,367 11,624,772SPDR Bloomberg Barclays High Yield Bond
ETF 498,626 18,578,805SPDR Bloomberg Barclays Short Term High
Yield Bond ETF 23,049 643,759Vanguard Dividend Appreciation ETF 74,898 6,966,263Vanguard Energy ETF 8,709 746,535Vanguard FTSE Developed Markets ETF 763 32,443Vanguard FTSE Emerging Markets ETF 8,876 393,207Vanguard Intermediate-Term Bond ETF 52,443 4,489,645Vanguard Intermediate-Term Corporate Bond
ETF 331,552 29,365,560Vanguard Materials ETF 2,017 250,511Vanguard Mid-Cap ETF 28,290 4,079,701Vanguard REIT ETF 23,698 1,991,580Vanguard S&P 500 ETF 137 31,140Vanguard Short-Term Bond ETF 74,364 5,962,506Vanguard Short-Term Corporate Bond ETF 156,538 12,580,959Vanguard Short-Term Inflation-Protected
Securities ETF 121,389 6,008,756Vanguard Small-Cap ETF 3,819 518,887Vanguard Total Bond Market ETF 289,216 23,866,104TOTAL UNAFFILIATEDINVESTMENT COMPANIES (Cost$142,669,655) $ 146,149,727
SHORT-TERM INVESTMENTS - 0.1%Money market funds - 0.1%State Street Institutional U.S. Government
Money Market Fund, Premier Class,0.9295% (D) 144,547 144,547
TOTAL SHORT-TERM INVESTMENTS(Cost $144,547) $ 144,547Total Investments (Multi-Index Lifestyle
Moderate Portfolio) (Cost $191,422,555) -100.0% $ 198,455,303
Other assets and liabilities, net - 0.0% 87,218TOTAL NET ASSETS - 100.0% $ 198,542,521
Security Abbreviations and Legend
JHAM John Hancock Asset Management(A) The underlying funds’ subadvisor is shown parenthetically.(B) The subadvisor is an affiliate of the advisor.(C) Manulife Asset Management (US) LLC is doing business as John
Hancock Asset Management.(D) The rate shown is the annualized seven-day yield as of 8-31-17.
John Hancock Funds IIPortfolio of Investments — August 31, 2017 (showing percentage of total net assets)
124
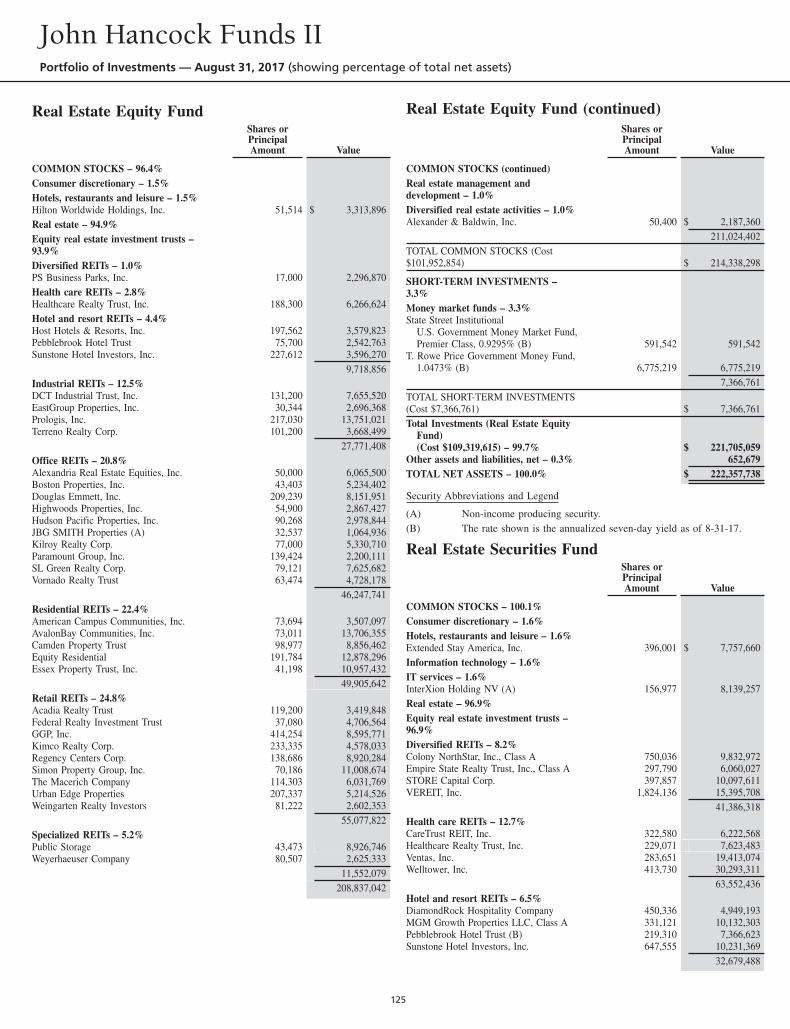
Real Estate Equity FundShares orPrincipalAmount Value
COMMON STOCKS – 96.4%Consumer discretionary – 1.5%Hotels, restaurants and leisure – 1.5%Hilton Worldwide Holdings, Inc. 51,514 $ 3,313,896Real estate – 94.9%Equity real estate investment trusts –93.9%Diversified REITs – 1.0%PS Business Parks, Inc. 17,000 2,296,870Health care REITs – 2.8%Healthcare Realty Trust, Inc. 188,300 6,266,624Hotel and resort REITs – 4.4%Host Hotels & Resorts, Inc. 197,562 3,579,823Pebblebrook Hotel Trust 75,700 2,542,763Sunstone Hotel Investors, Inc. 227,612 3,596,270
9,718,856Industrial REITs – 12.5%DCT Industrial Trust, Inc. 131,200 7,655,520EastGroup Properties, Inc. 30,344 2,696,368Prologis, Inc. 217,030 13,751,021Terreno Realty Corp. 101,200 3,668,499
27,771,408Office REITs – 20.8%Alexandria Real Estate Equities, Inc. 50,000 6,065,500Boston Properties, Inc. 43,403 5,234,402Douglas Emmett, Inc. 209,239 8,151,951Highwoods Properties, Inc. 54,900 2,867,427Hudson Pacific Properties, Inc. 90,268 2,978,844JBG SMITH Properties (A) 32,537 1,064,936Kilroy Realty Corp. 77,000 5,330,710Paramount Group, Inc. 139,424 2,200,111SL Green Realty Corp. 79,121 7,625,682Vornado Realty Trust 63,474 4,728,178
46,247,741Residential REITs – 22.4%American Campus Communities, Inc. 73,694 3,507,097AvalonBay Communities, Inc. 73,011 13,706,355Camden Property Trust 98,977 8,856,462Equity Residential 191,784 12,878,296Essex Property Trust, Inc. 41,198 10,957,432
49,905,642Retail REITs – 24.8%Acadia Realty Trust 119,200 3,419,848Federal Realty Investment Trust 37,080 4,706,564GGP, Inc. 414,254 8,595,771Kimco Realty Corp. 233,335 4,578,033Regency Centers Corp. 138,686 8,920,284Simon Property Group, Inc. 70,186 11,008,674The Macerich Company 114,303 6,031,769Urban Edge Properties 207,337 5,214,526Weingarten Realty Investors 81,222 2,602,353
55,077,822Specialized REITs – 5.2%Public Storage 43,473 8,926,746Weyerhaeuser Company 80,507 2,625,333
11,552,079208,837,042
Real Estate Equity Fund (continued)Shares orPrincipalAmount Value
COMMON STOCKS (continued)Real estate management anddevelopment – 1.0%Diversified real estate activities – 1.0%Alexander & Baldwin, Inc. 50,400 $ 2,187,360
211,024,402TOTAL COMMON STOCKS (Cost$101,952,854) $ 214,338,298
SHORT-TERM INVESTMENTS –3.3%Money market funds – 3.3%State Street Institutional
U.S. Government Money Market Fund,Premier Class, 0.9295% (B) 591,542 591,542
T. Rowe Price Government Money Fund,1.0473% (B) 6,775,219 6,775,219
7,366,761TOTAL SHORT-TERM INVESTMENTS(Cost $7,366,761) $ 7,366,761Total Investments (Real Estate Equity
Fund)(Cost $109,319,615) – 99.7% $ 221,705,059
Other assets and liabilities, net – 0.3% 652,679TOTAL NET ASSETS – 100.0% $ 222,357,738
Security Abbreviations and Legend
(A) Non-income producing security.(B) The rate shown is the annualized seven-day yield as of 8-31-17.
Real Estate Securities FundShares orPrincipalAmount Value
COMMON STOCKS – 100.1%Consumer discretionary – 1.6%Hotels, restaurants and leisure – 1.6%Extended Stay America, Inc. 396,001 $ 7,757,660Information technology – 1.6%IT services – 1.6%InterXion Holding NV (A) 156,977 8,139,257Real estate – 96.9%Equity real estate investment trusts –96.9%Diversified REITs – 8.2%Colony NorthStar, Inc., Class A 750,036 9,832,972Empire State Realty Trust, Inc., Class A 297,790 6,060,027STORE Capital Corp. 397,857 10,097,611VEREIT, Inc. 1,824,136 15,395,708
41,386,318Health care REITs – 12.7%CareTrust REIT, Inc. 322,580 6,222,568Healthcare Realty Trust, Inc. 229,071 7,623,483Ventas, Inc. 283,651 19,413,074Welltower, Inc. 413,730 30,293,311
63,552,436Hotel and resort REITs – 6.5%DiamondRock Hospitality Company 450,336 4,949,193MGM Growth Properties LLC, Class A 331,121 10,132,303Pebblebrook Hotel Trust (B) 219,310 7,366,623Sunstone Hotel Investors, Inc. 647,555 10,231,369
32,679,488
John Hancock Funds IIPortfolio of Investments — August 31, 2017 (showing percentage of total net assets)
125
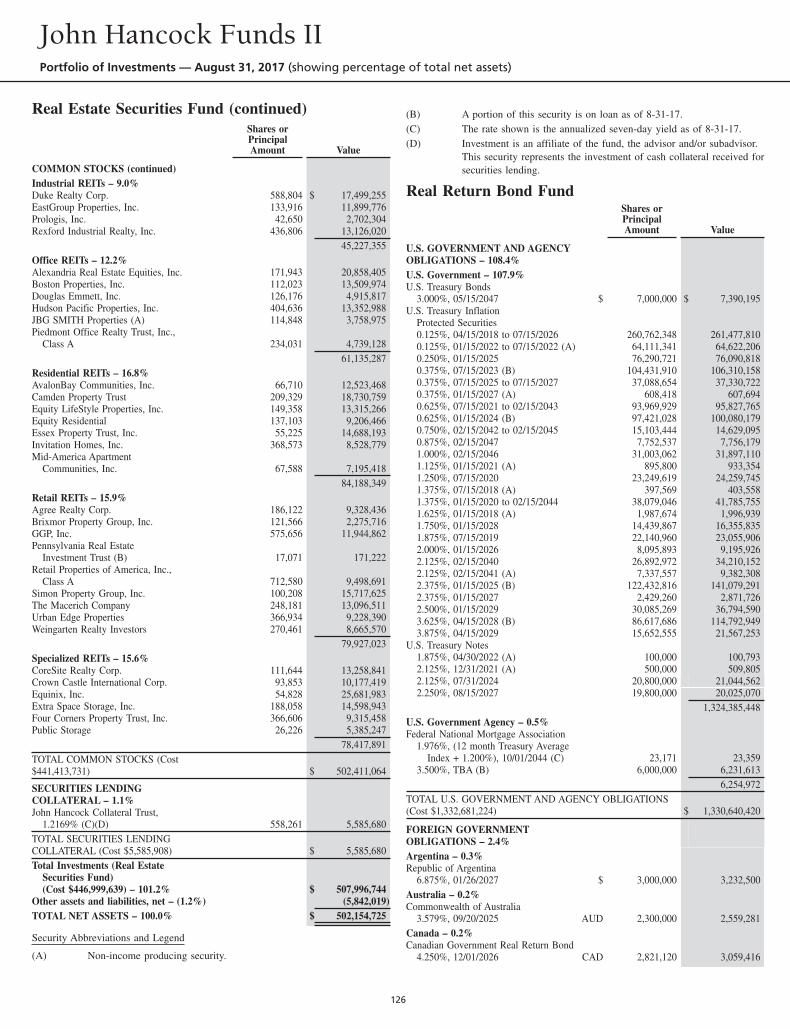
Real Estate Securities Fund (continued)Shares orPrincipalAmount Value
COMMON STOCKS (continued)Industrial REITs – 9.0%Duke Realty Corp. 588,804 $ 17,499,255EastGroup Properties, Inc. 133,916 11,899,776Prologis, Inc. 42,650 2,702,304Rexford Industrial Realty, Inc. 436,806 13,126,020
45,227,355Office REITs – 12.2%Alexandria Real Estate Equities, Inc. 171,943 20,858,405Boston Properties, Inc. 112,023 13,509,974Douglas Emmett, Inc. 126,176 4,915,817Hudson Pacific Properties, Inc. 404,636 13,352,988JBG SMITH Properties (A) 114,848 3,758,975Piedmont Office Realty Trust, Inc.,
Class A 234,031 4,739,12861,135,287
Residential REITs – 16.8%AvalonBay Communities, Inc. 66,710 12,523,468Camden Property Trust 209,329 18,730,759Equity LifeStyle Properties, Inc. 149,358 13,315,266Equity Residential 137,103 9,206,466Essex Property Trust, Inc. 55,225 14,688,193Invitation Homes, Inc. 368,573 8,528,779Mid-America Apartment
Communities, Inc. 67,588 7,195,41884,188,349
Retail REITs – 15.9%Agree Realty Corp. 186,122 9,328,436Brixmor Property Group, Inc. 121,566 2,275,716GGP, Inc. 575,656 11,944,862Pennsylvania Real Estate
Investment Trust (B) 17,071 171,222Retail Properties of America, Inc.,
Class A 712,580 9,498,691Simon Property Group, Inc. 100,208 15,717,625The Macerich Company 248,181 13,096,511Urban Edge Properties 366,934 9,228,390Weingarten Realty Investors 270,461 8,665,570
79,927,023Specialized REITs – 15.6%CoreSite Realty Corp. 111,644 13,258,841Crown Castle International Corp. 93,853 10,177,419Equinix, Inc. 54,828 25,681,983Extra Space Storage, Inc. 188,058 14,598,943Four Corners Property Trust, Inc. 366,606 9,315,458Public Storage 26,226 5,385,247
78,417,891TOTAL COMMON STOCKS (Cost$441,413,731) $ 502,411,064
SECURITIES LENDINGCOLLATERAL – 1.1%John Hancock Collateral Trust,
1.2169% (C)(D) 558,261 5,585,680TOTAL SECURITIES LENDINGCOLLATERAL (Cost $5,585,908) $ 5,585,680Total Investments (Real Estate
Securities Fund)(Cost $446,999,639) – 101.2% $ 507,996,744
Other assets and liabilities, net – (1.2%) (5,842,019)TOTAL NET ASSETS – 100.0% $ 502,154,725
Security Abbreviations and Legend
(A) Non-income producing security.
(B) A portion of this security is on loan as of 8-31-17.(C) The rate shown is the annualized seven-day yield as of 8-31-17.(D) Investment is an affiliate of the fund, the advisor and/or subadvisor.
This security represents the investment of cash collateral received forsecurities lending.
Real Return Bond FundShares orPrincipalAmount Value
U.S. GOVERNMENT AND AGENCYOBLIGATIONS – 108.4%U.S. Government – 107.9%U.S. Treasury Bonds
3.000%, 05/15/2047 $ 7,000,000 $ 7,390,195U.S. Treasury Inflation
Protected Securities0.125%, 04/15/2018 to 07/15/2026 260,762,348 261,477,8100.125%, 01/15/2022 to 07/15/2022 (A) 64,111,341 64,622,2060.250%, 01/15/2025 76,290,721 76,090,8180.375%, 07/15/2023 (B) 104,431,910 106,310,1580.375%, 07/15/2025 to 07/15/2027 37,088,654 37,330,7220.375%, 01/15/2027 (A) 608,418 607,6940.625%, 07/15/2021 to 02/15/2043 93,969,929 95,827,7650.625%, 01/15/2024 (B) 97,421,028 100,080,1790.750%, 02/15/2042 to 02/15/2045 15,103,444 14,629,0950.875%, 02/15/2047 7,752,537 7,756,1791.000%, 02/15/2046 31,003,062 31,897,1101.125%, 01/15/2021 (A) 895,800 933,3541.250%, 07/15/2020 23,249,619 24,259,7451.375%, 07/15/2018 (A) 397,569 403,5581.375%, 01/15/2020 to 02/15/2044 38,079,046 41,785,7551.625%, 01/15/2018 (A) 1,987,674 1,996,9391.750%, 01/15/2028 14,439,867 16,355,8351.875%, 07/15/2019 22,140,960 23,055,9062.000%, 01/15/2026 8,095,893 9,195,9262.125%, 02/15/2040 26,892,972 34,210,1522.125%, 02/15/2041 (A) 7,337,557 9,382,3082.375%, 01/15/2025 (B) 122,432,816 141,079,2912.375%, 01/15/2027 2,429,260 2,871,7262.500%, 01/15/2029 30,085,269 36,794,5903.625%, 04/15/2028 (B) 86,617,686 114,792,9493.875%, 04/15/2029 15,652,555 21,567,253
U.S. Treasury Notes1.875%, 04/30/2022 (A) 100,000 100,7932.125%, 12/31/2021 (A) 500,000 509,8052.125%, 07/31/2024 20,800,000 21,044,5622.250%, 08/15/2027 19,800,000 20,025,070
1,324,385,448U.S. Government Agency – 0.5%Federal National Mortgage Association
1.976%, (12 month Treasury AverageIndex + 1.200%), 10/01/2044 (C) 23,171 23,359
3.500%, TBA (B) 6,000,000 6,231,6136,254,972
TOTAL U.S. GOVERNMENT AND AGENCY OBLIGATIONS(Cost $1,332,681,224) $ 1,330,640,420
FOREIGN GOVERNMENTOBLIGATIONS – 2.4%Argentina – 0.3%Republic of Argentina
6.875%, 01/26/2027 $ 3,000,000 3,232,500Australia – 0.2%Commonwealth of Australia
3.579%, 09/20/2025 AUD 2,300,000 2,559,281Canada – 0.2%Canadian Government Real Return Bond
4.250%, 12/01/2026 CAD 2,821,120 3,059,416
John Hancock Funds IIPortfolio of Investments — August 31, 2017 (showing percentage of total net assets)
126
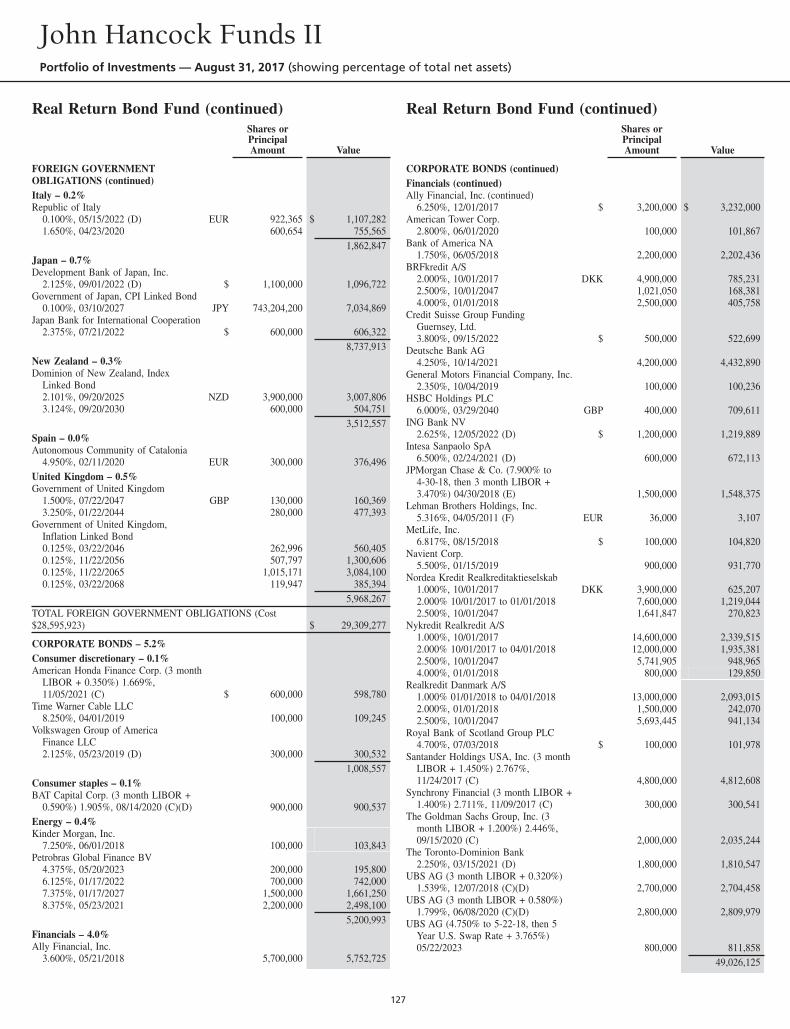
Real Return Bond Fund (continued)Shares orPrincipalAmount Value
FOREIGN GOVERNMENTOBLIGATIONS (continued)Italy – 0.2%Republic of Italy
0.100%, 05/15/2022 (D) EUR 922,365 $ 1,107,2821.650%, 04/23/2020 600,654 755,565
1,862,847Japan – 0.7%Development Bank of Japan, Inc.
2.125%, 09/01/2022 (D) $ 1,100,000 1,096,722Government of Japan, CPI Linked Bond
0.100%, 03/10/2027 JPY 743,204,200 7,034,869Japan Bank for International Cooperation
2.375%, 07/21/2022 $ 600,000 606,3228,737,913
New Zealand – 0.3%Dominion of New Zealand, Index
Linked Bond2.101%, 09/20/2025 NZD 3,900,000 3,007,8063.124%, 09/20/2030 600,000 504,751
3,512,557Spain – 0.0%Autonomous Community of Catalonia
4.950%, 02/11/2020 EUR 300,000 376,496United Kingdom – 0.5%Government of United Kingdom
1.500%, 07/22/2047 GBP 130,000 160,3693.250%, 01/22/2044 280,000 477,393
Government of United Kingdom,Inflation Linked Bond0.125%, 03/22/2046 262,996 560,4050.125%, 11/22/2056 507,797 1,300,6060.125%, 11/22/2065 1,015,171 3,084,1000.125%, 03/22/2068 119,947 385,394
5,968,267TOTAL FOREIGN GOVERNMENT OBLIGATIONS (Cost$28,595,923) $ 29,309,277
CORPORATE BONDS – 5.2%Consumer discretionary – 0.1%American Honda Finance Corp. (3 month
LIBOR + 0.350%) 1.669%,11/05/2021 (C) $ 600,000 598,780
Time Warner Cable LLC8.250%, 04/01/2019 100,000 109,245
Volkswagen Group of AmericaFinance LLC2.125%, 05/23/2019 (D) 300,000 300,532
1,008,557Consumer staples – 0.1%BAT Capital Corp. (3 month LIBOR +
0.590%) 1.905%, 08/14/2020 (C)(D) 900,000 900,537Energy – 0.4%Kinder Morgan, Inc.
7.250%, 06/01/2018 100,000 103,843Petrobras Global Finance BV
4.375%, 05/20/2023 200,000 195,8006.125%, 01/17/2022 700,000 742,0007.375%, 01/17/2027 1,500,000 1,661,2508.375%, 05/23/2021 2,200,000 2,498,100
5,200,993Financials – 4.0%Ally Financial, Inc.
3.600%, 05/21/2018 5,700,000 5,752,725
Real Return Bond Fund (continued)Shares orPrincipalAmount Value
CORPORATE BONDS (continued)Financials (continued)Ally Financial, Inc. (continued)
6.250%, 12/01/2017 $ 3,200,000 $ 3,232,000American Tower Corp.
2.800%, 06/01/2020 100,000 101,867Bank of America NA
1.750%, 06/05/2018 2,200,000 2,202,436BRFkredit A/S
2.000%, 10/01/2017 DKK 4,900,000 785,2312.500%, 10/01/2047 1,021,050 168,3814.000%, 01/01/2018 2,500,000 405,758
Credit Suisse Group FundingGuernsey, Ltd.3.800%, 09/15/2022 $ 500,000 522,699
Deutsche Bank AG4.250%, 10/14/2021 4,200,000 4,432,890
General Motors Financial Company, Inc.2.350%, 10/04/2019 100,000 100,236
HSBC Holdings PLC6.000%, 03/29/2040 GBP 400,000 709,611
ING Bank NV2.625%, 12/05/2022 (D) $ 1,200,000 1,219,889
Intesa Sanpaolo SpA6.500%, 02/24/2021 (D) 600,000 672,113
JPMorgan Chase & Co. (7.900% to4-30-18, then 3 month LIBOR +3.470%) 04/30/2018 (E) 1,500,000 1,548,375
Lehman Brothers Holdings, Inc.5.316%, 04/05/2011 (F) EUR 36,000 3,107
MetLife, Inc.6.817%, 08/15/2018 $ 100,000 104,820
Navient Corp.5.500%, 01/15/2019 900,000 931,770
Nordea Kredit Realkreditaktieselskab1.000%, 10/01/2017 DKK 3,900,000 625,2072.000% 10/01/2017 to 01/01/2018 7,600,000 1,219,0442.500%, 10/01/2047 1,641,847 270,823
Nykredit Realkredit A/S1.000%, 10/01/2017 14,600,000 2,339,5152.000% 10/01/2017 to 04/01/2018 12,000,000 1,935,3812.500%, 10/01/2047 5,741,905 948,9654.000%, 01/01/2018 800,000 129,850
Realkredit Danmark A/S1.000% 01/01/2018 to 04/01/2018 13,000,000 2,093,0152.000%, 01/01/2018 1,500,000 242,0702.500%, 10/01/2047 5,693,445 941,134
Royal Bank of Scotland Group PLC4.700%, 07/03/2018 $ 100,000 101,978
Santander Holdings USA, Inc. (3 monthLIBOR + 1.450%) 2.767%,11/24/2017 (C) 4,800,000 4,812,608
Synchrony Financial (3 month LIBOR +1.400%) 2.711%, 11/09/2017 (C) 300,000 300,541
The Goldman Sachs Group, Inc. (3month LIBOR + 1.200%) 2.446%,09/15/2020 (C) 2,000,000 2,035,244
The Toronto-Dominion Bank2.250%, 03/15/2021 (D) 1,800,000 1,810,547
UBS AG (3 month LIBOR + 0.320%)1.539%, 12/07/2018 (C)(D) 2,700,000 2,704,458
UBS AG (3 month LIBOR + 0.580%)1.799%, 06/08/2020 (C)(D) 2,800,000 2,809,979
UBS AG (4.750% to 5-22-18, then 5Year U.S. Swap Rate + 3.765%)05/22/2023 800,000 811,858
49,026,125
John Hancock Funds IIPortfolio of Investments — August 31, 2017 (showing percentage of total net assets)
127
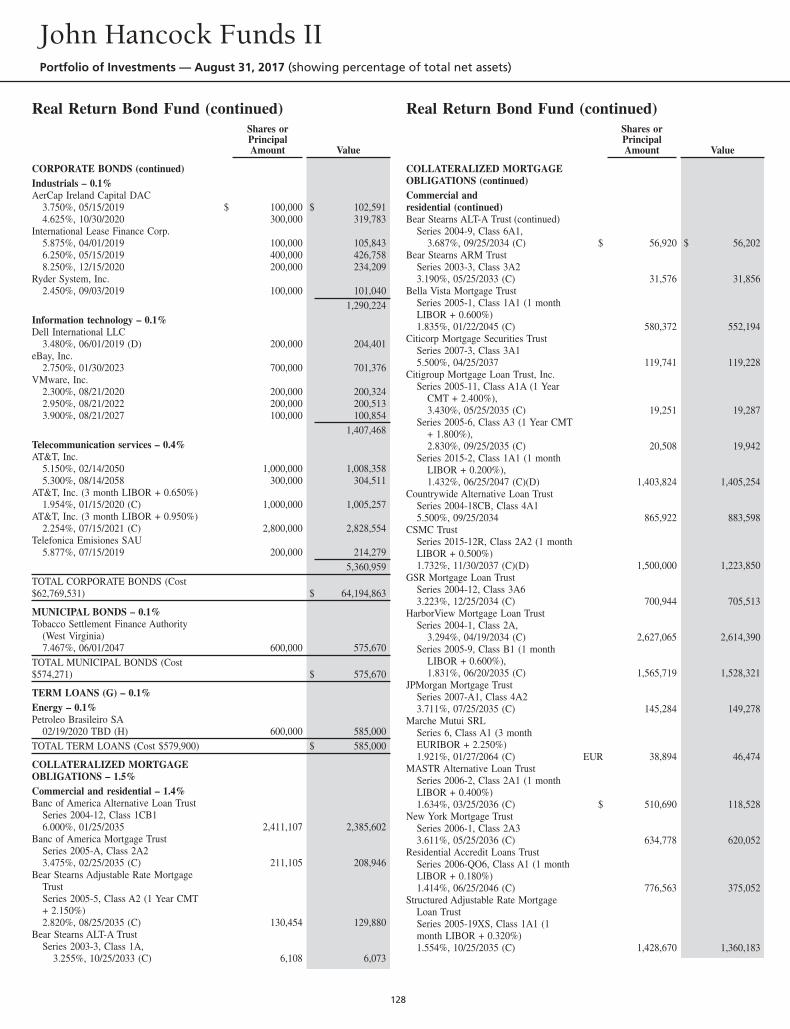
Real Return Bond Fund (continued)Shares orPrincipalAmount Value
CORPORATE BONDS (continued)Industrials – 0.1%AerCap Ireland Capital DAC
3.750%, 05/15/2019 $ 100,000 $ 102,5914.625%, 10/30/2020 300,000 319,783
International Lease Finance Corp.5.875%, 04/01/2019 100,000 105,8436.250%, 05/15/2019 400,000 426,7588.250%, 12/15/2020 200,000 234,209
Ryder System, Inc.2.450%, 09/03/2019 100,000 101,040
1,290,224Information technology – 0.1%Dell International LLC
3.480%, 06/01/2019 (D) 200,000 204,401eBay, Inc.
2.750%, 01/30/2023 700,000 701,376VMware, Inc.
2.300%, 08/21/2020 200,000 200,3242.950%, 08/21/2022 200,000 200,5133.900%, 08/21/2027 100,000 100,854
1,407,468Telecommunication services – 0.4%AT&T, Inc.
5.150%, 02/14/2050 1,000,000 1,008,3585.300%, 08/14/2058 300,000 304,511
AT&T, Inc. (3 month LIBOR + 0.650%)1.954%, 01/15/2020 (C) 1,000,000 1,005,257
AT&T, Inc. (3 month LIBOR + 0.950%)2.254%, 07/15/2021 (C) 2,800,000 2,828,554
Telefonica Emisiones SAU5.877%, 07/15/2019 200,000 214,279
5,360,959TOTAL CORPORATE BONDS (Cost$62,769,531) $ 64,194,863
MUNICIPAL BONDS – 0.1%Tobacco Settlement Finance Authority
(West Virginia)7.467%, 06/01/2047 600,000 575,670
TOTAL MUNICIPAL BONDS (Cost$574,271) $ 575,670
TERM LOANS (G) – 0.1%Energy – 0.1%Petroleo Brasileiro SA
02/19/2020 TBD (H) 600,000 585,000TOTAL TERM LOANS (Cost $579,900) $ 585,000
COLLATERALIZED MORTGAGEOBLIGATIONS – 1.5%Commercial and residential – 1.4%Banc of America Alternative Loan Trust
Series 2004-12, Class 1CB16.000%, 01/25/2035 2,411,107 2,385,602
Banc of America Mortgage TrustSeries 2005-A, Class 2A23.475%, 02/25/2035 (C) 211,105 208,946
Bear Stearns Adjustable Rate MortgageTrustSeries 2005-5, Class A2 (1 Year CMT+ 2.150%)2.820%, 08/25/2035 (C) 130,454 129,880
Bear Stearns ALT-A TrustSeries 2003-3, Class 1A,
3.255%, 10/25/2033 (C) 6,108 6,073
Real Return Bond Fund (continued)Shares orPrincipalAmount Value
COLLATERALIZED MORTGAGEOBLIGATIONS (continued)Commercial andresidential (continued)Bear Stearns ALT-A Trust (continued)
Series 2004-9, Class 6A1,3.687%, 09/25/2034 (C) $ 56,920 $ 56,202
Bear Stearns ARM TrustSeries 2003-3, Class 3A23.190%, 05/25/2033 (C) 31,576 31,856
Bella Vista Mortgage TrustSeries 2005-1, Class 1A1 (1 monthLIBOR + 0.600%)1.835%, 01/22/2045 (C) 580,372 552,194
Citicorp Mortgage Securities TrustSeries 2007-3, Class 3A15.500%, 04/25/2037 119,741 119,228
Citigroup Mortgage Loan Trust, Inc.Series 2005-11, Class A1A (1 Year
CMT + 2.400%),3.430%, 05/25/2035 (C) 19,251 19,287
Series 2005-6, Class A3 (1 Year CMT+ 1.800%),2.830%, 09/25/2035 (C) 20,508 19,942
Series 2015-2, Class 1A1 (1 monthLIBOR + 0.200%),1.432%, 06/25/2047 (C)(D) 1,403,824 1,405,254
Countrywide Alternative Loan TrustSeries 2004-18CB, Class 4A15.500%, 09/25/2034 865,922 883,598
CSMC TrustSeries 2015-12R, Class 2A2 (1 monthLIBOR + 0.500%)1.732%, 11/30/2037 (C)(D) 1,500,000 1,223,850
GSR Mortgage Loan TrustSeries 2004-12, Class 3A63.223%, 12/25/2034 (C) 700,944 705,513
HarborView Mortgage Loan TrustSeries 2004-1, Class 2A,
3.294%, 04/19/2034 (C) 2,627,065 2,614,390Series 2005-9, Class B1 (1 month
LIBOR + 0.600%),1.831%, 06/20/2035 (C) 1,565,719 1,528,321
JPMorgan Mortgage TrustSeries 2007-A1, Class 4A23.711%, 07/25/2035 (C) 145,284 149,278
Marche Mutui SRLSeries 6, Class A1 (3 monthEURIBOR + 2.250%)1.921%, 01/27/2064 (C) EUR 38,894 46,474
MASTR Alternative Loan TrustSeries 2006-2, Class 2A1 (1 monthLIBOR + 0.400%)1.634%, 03/25/2036 (C) $ 510,690 118,528
New York Mortgage TrustSeries 2006-1, Class 2A33.611%, 05/25/2036 (C) 634,778 620,052
Residential Accredit Loans TrustSeries 2006-QO6, Class A1 (1 monthLIBOR + 0.180%)1.414%, 06/25/2046 (C) 776,563 375,052
Structured Adjustable Rate MortgageLoan TrustSeries 2005-19XS, Class 1A1 (1month LIBOR + 0.320%)1.554%, 10/25/2035 (C) 1,428,670 1,360,183
John Hancock Funds IIPortfolio of Investments — August 31, 2017 (showing percentage of total net assets)
128
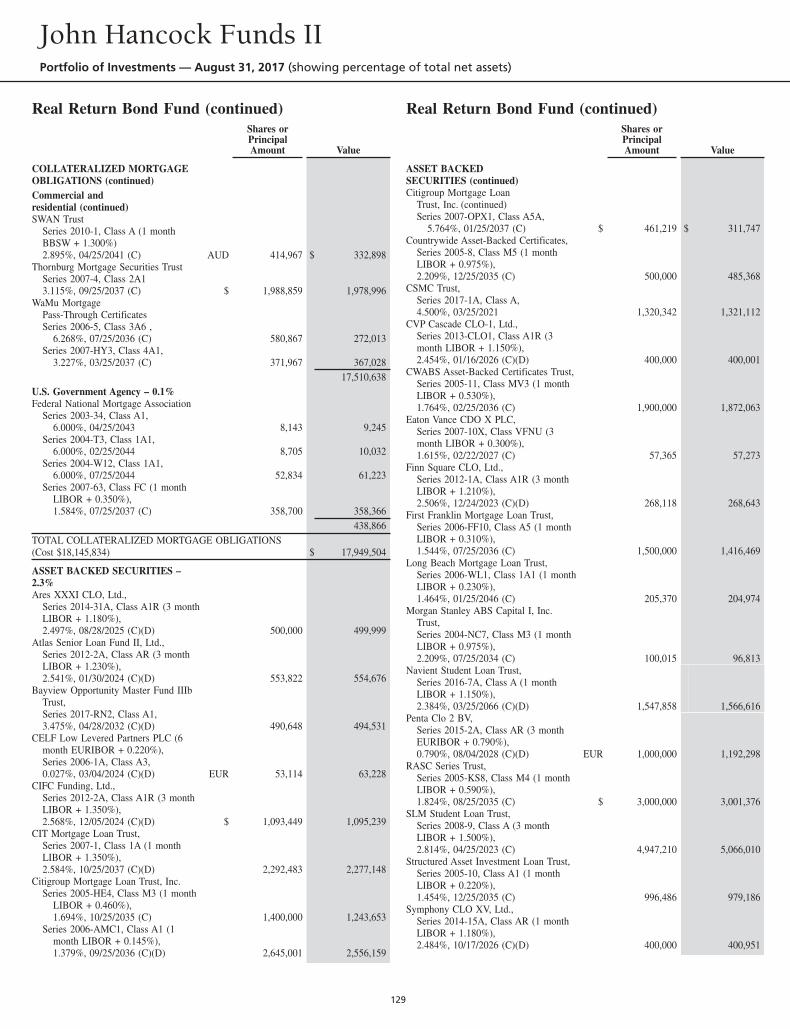
Real Return Bond Fund (continued)Shares orPrincipalAmount Value
COLLATERALIZED MORTGAGEOBLIGATIONS (continued)Commercial andresidential (continued)SWAN Trust
Series 2010-1, Class A (1 monthBBSW + 1.300%)2.895%, 04/25/2041 (C) AUD 414,967 $ 332,898
Thornburg Mortgage Securities TrustSeries 2007-4, Class 2A13.115%, 09/25/2037 (C) $ 1,988,859 1,978,996
WaMu MortgagePass-Through CertificatesSeries 2006-5, Class 3A6 ,
6.268%, 07/25/2036 (C) 580,867 272,013Series 2007-HY3, Class 4A1,
3.227%, 03/25/2037 (C) 371,967 367,02817,510,638
U.S. Government Agency – 0.1%Federal National Mortgage Association
Series 2003-34, Class A1,6.000%, 04/25/2043 8,143 9,245
Series 2004-T3, Class 1A1,6.000%, 02/25/2044 8,705 10,032
Series 2004-W12, Class 1A1,6.000%, 07/25/2044 52,834 61,223
Series 2007-63, Class FC (1 monthLIBOR + 0.350%),1.584%, 07/25/2037 (C) 358,700 358,366
438,866TOTAL COLLATERALIZED MORTGAGE OBLIGATIONS(Cost $18,145,834) $ 17,949,504
ASSET BACKED SECURITIES –2.3%Ares XXXI CLO, Ltd.,
Series 2014-31A, Class A1R (3 monthLIBOR + 1.180%),2.497%, 08/28/2025 (C)(D) 500,000 499,999
Atlas Senior Loan Fund II, Ltd.,Series 2012-2A, Class AR (3 monthLIBOR + 1.230%),2.541%, 01/30/2024 (C)(D) 553,822 554,676
Bayview Opportunity Master Fund IIIbTrust,Series 2017-RN2, Class A1,3.475%, 04/28/2032 (C)(D) 490,648 494,531
CELF Low Levered Partners PLC (6month EURIBOR + 0.220%),Series 2006-1A, Class A3,0.027%, 03/04/2024 (C)(D) EUR 53,114 63,228
CIFC Funding, Ltd.,Series 2012-2A, Class A1R (3 monthLIBOR + 1.350%),2.568%, 12/05/2024 (C)(D) $ 1,093,449 1,095,239
CIT Mortgage Loan Trust,Series 2007-1, Class 1A (1 monthLIBOR + 1.350%),2.584%, 10/25/2037 (C)(D) 2,292,483 2,277,148
Citigroup Mortgage Loan Trust, Inc.Series 2005-HE4, Class M3 (1 month
LIBOR + 0.460%),1.694%, 10/25/2035 (C) 1,400,000 1,243,653
Series 2006-AMC1, Class A1 (1month LIBOR + 0.145%),1.379%, 09/25/2036 (C)(D) 2,645,001 2,556,159
Real Return Bond Fund (continued)Shares orPrincipalAmount Value
ASSET BACKEDSECURITIES (continued)Citigroup Mortgage Loan
Trust, Inc. (continued)Series 2007-OPX1, Class A5A,
5.764%, 01/25/2037 (C) $ 461,219 $ 311,747Countrywide Asset-Backed Certificates,
Series 2005-8, Class M5 (1 monthLIBOR + 0.975%),2.209%, 12/25/2035 (C) 500,000 485,368
CSMC Trust,Series 2017-1A, Class A,4.500%, 03/25/2021 1,320,342 1,321,112
CVP Cascade CLO-1, Ltd.,Series 2013-CLO1, Class A1R (3month LIBOR + 1.150%),2.454%, 01/16/2026 (C)(D) 400,000 400,001
CWABS Asset-Backed Certificates Trust,Series 2005-11, Class MV3 (1 monthLIBOR + 0.530%),1.764%, 02/25/2036 (C) 1,900,000 1,872,063
Eaton Vance CDO X PLC,Series 2007-10X, Class VFNU (3month LIBOR + 0.300%),1.615%, 02/22/2027 (C) 57,365 57,273
Finn Square CLO, Ltd.,Series 2012-1A, Class A1R (3 monthLIBOR + 1.210%),2.506%, 12/24/2023 (C)(D) 268,118 268,643
First Franklin Mortgage Loan Trust,Series 2006-FF10, Class A5 (1 monthLIBOR + 0.310%),1.544%, 07/25/2036 (C) 1,500,000 1,416,469
Long Beach Mortgage Loan Trust,Series 2006-WL1, Class 1A1 (1 monthLIBOR + 0.230%),1.464%, 01/25/2046 (C) 205,370 204,974
Morgan Stanley ABS Capital I, Inc.Trust,Series 2004-NC7, Class M3 (1 monthLIBOR + 0.975%),2.209%, 07/25/2034 (C) 100,015 96,813
Navient Student Loan Trust,Series 2016-7A, Class A (1 monthLIBOR + 1.150%),2.384%, 03/25/2066 (C)(D) 1,547,858 1,566,616
Penta Clo 2 BV,Series 2015-2A, Class AR (3 monthEURIBOR + 0.790%),0.790%, 08/04/2028 (C)(D) EUR 1,000,000 1,192,298
RASC Series Trust,Series 2005-KS8, Class M4 (1 monthLIBOR + 0.590%),1.824%, 08/25/2035 (C) $ 3,000,000 3,001,376
SLM Student Loan Trust,Series 2008-9, Class A (3 monthLIBOR + 1.500%),2.814%, 04/25/2023 (C) 4,947,210 5,066,010
Structured Asset Investment Loan Trust,Series 2005-10, Class A1 (1 monthLIBOR + 0.220%),1.454%, 12/25/2035 (C) 996,486 979,186
Symphony CLO XV, Ltd.,Series 2014-15A, Class AR (1 monthLIBOR + 1.180%),2.484%, 10/17/2026 (C)(D) 400,000 400,951
John Hancock Funds IIPortfolio of Investments — August 31, 2017 (showing percentage of total net assets)
129
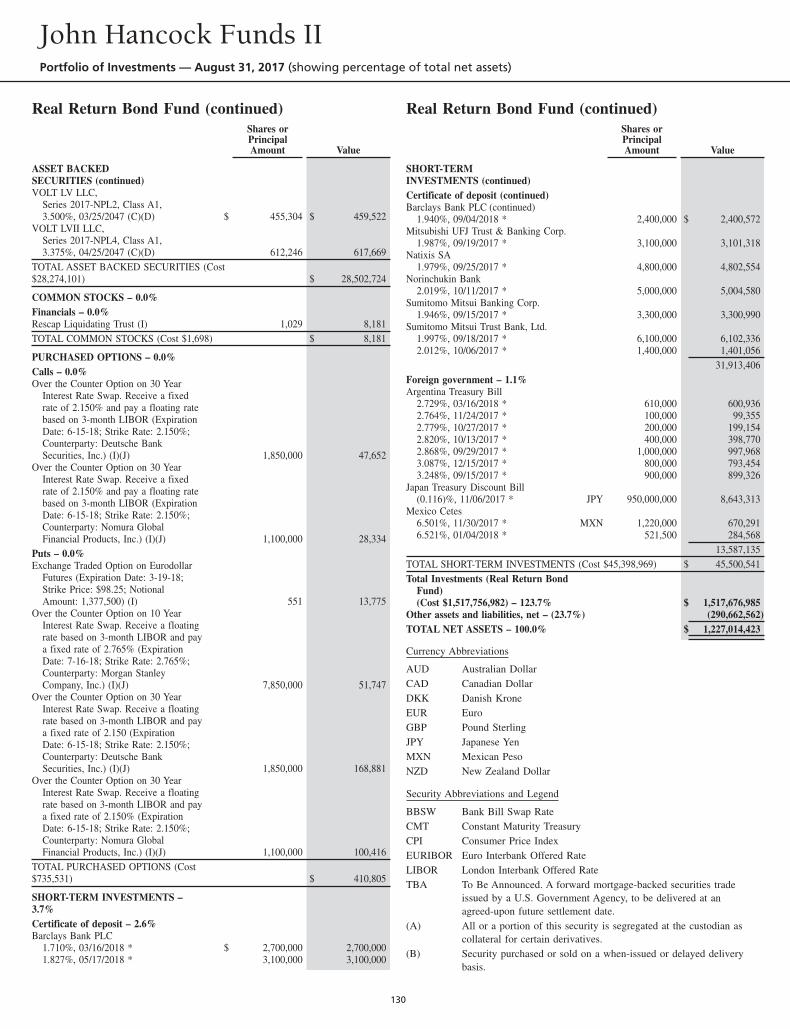
Real Return Bond Fund (continued)Shares orPrincipalAmount Value
ASSET BACKEDSECURITIES (continued)VOLT LV LLC,
Series 2017-NPL2, Class A1,3.500%, 03/25/2047 (C)(D) $ 455,304 $ 459,522
VOLT LVII LLC,Series 2017-NPL4, Class A1,3.375%, 04/25/2047 (C)(D) 612,246 617,669
TOTAL ASSET BACKED SECURITIES (Cost$28,274,101) $ 28,502,724
COMMON STOCKS – 0.0%Financials – 0.0%Rescap Liquidating Trust (I) 1,029 8,181TOTAL COMMON STOCKS (Cost $1,698) $ 8,181
PURCHASED OPTIONS – 0.0%Calls – 0.0%Over the Counter Option on 30 Year
Interest Rate Swap. Receive a fixedrate of 2.150% and pay a floating ratebased on 3-month LIBOR (ExpirationDate: 6-15-18; Strike Rate: 2.150%;Counterparty: Deutsche BankSecurities, Inc.) (I)(J) 1,850,000 47,652
Over the Counter Option on 30 YearInterest Rate Swap. Receive a fixedrate of 2.150% and pay a floating ratebased on 3-month LIBOR (ExpirationDate: 6-15-18; Strike Rate: 2.150%;Counterparty: Nomura GlobalFinancial Products, Inc.) (I)(J) 1,100,000 28,334
Puts – 0.0%Exchange Traded Option on Eurodollar
Futures (Expiration Date: 3-19-18;Strike Price: $98.25; NotionalAmount: 1,377,500) (I) 551 13,775
Over the Counter Option on 10 YearInterest Rate Swap. Receive a floatingrate based on 3-month LIBOR and paya fixed rate of 2.765% (ExpirationDate: 7-16-18; Strike Rate: 2.765%;Counterparty: Morgan StanleyCompany, Inc.) (I)(J) 7,850,000 51,747
Over the Counter Option on 30 YearInterest Rate Swap. Receive a floatingrate based on 3-month LIBOR and paya fixed rate of 2.150 (ExpirationDate: 6-15-18; Strike Rate: 2.150%;Counterparty: Deutsche BankSecurities, Inc.) (I)(J) 1,850,000 168,881
Over the Counter Option on 30 YearInterest Rate Swap. Receive a floatingrate based on 3-month LIBOR and paya fixed rate of 2.150% (ExpirationDate: 6-15-18; Strike Rate: 2.150%;Counterparty: Nomura GlobalFinancial Products, Inc.) (I)(J) 1,100,000 100,416
TOTAL PURCHASED OPTIONS (Cost$735,531) $ 410,805
SHORT-TERM INVESTMENTS –3.7%Certificate of deposit – 2.6%Barclays Bank PLC
1.710%, 03/16/2018 * $ 2,700,000 2,700,0001.827%, 05/17/2018 * 3,100,000 3,100,000
Real Return Bond Fund (continued)Shares orPrincipalAmount Value
SHORT-TERMINVESTMENTS (continued)Certificate of deposit (continued)Barclays Bank PLC (continued)
1.940%, 09/04/2018 * 2,400,000 $ 2,400,572Mitsubishi UFJ Trust & Banking Corp.
1.987%, 09/19/2017 * 3,100,000 3,101,318Natixis SA
1.979%, 09/25/2017 * 4,800,000 4,802,554Norinchukin Bank
2.019%, 10/11/2017 * 5,000,000 5,004,580Sumitomo Mitsui Banking Corp.
1.946%, 09/15/2017 * 3,300,000 3,300,990Sumitomo Mitsui Trust Bank, Ltd.
1.997%, 09/18/2017 * 6,100,000 6,102,3362.012%, 10/06/2017 * 1,400,000 1,401,056
31,913,406Foreign government – 1.1%Argentina Treasury Bill
2.729%, 03/16/2018 * 610,000 600,9362.764%, 11/24/2017 * 100,000 99,3552.779%, 10/27/2017 * 200,000 199,1542.820%, 10/13/2017 * 400,000 398,7702.868%, 09/29/2017 * 1,000,000 997,9683.087%, 12/15/2017 * 800,000 793,4543.248%, 09/15/2017 * 900,000 899,326
Japan Treasury Discount Bill(0.116)%, 11/06/2017 * JPY 950,000,000 8,643,313
Mexico Cetes6.501%, 11/30/2017 * MXN 1,220,000 670,2916.521%, 01/04/2018 * 521,500 284,568
13,587,135TOTAL SHORT-TERM INVESTMENTS (Cost $45,398,969) $ 45,500,541Total Investments (Real Return Bond
Fund)(Cost $1,517,756,982) – 123.7% $ 1,517,676,985
Other assets and liabilities, net – (23.7%) (290,662,562)TOTAL NET ASSETS – 100.0% $ 1,227,014,423
Currency Abbreviations
AUD Australian DollarCAD Canadian DollarDKK Danish KroneEUR EuroGBP Pound SterlingJPY Japanese YenMXN Mexican PesoNZD New Zealand Dollar
Security Abbreviations and Legend
BBSW Bank Bill Swap RateCMT Constant Maturity TreasuryCPI Consumer Price IndexEURIBOR Euro Interbank Offered RateLIBOR London Interbank Offered RateTBA To Be Announced. A forward mortgage-backed securities trade
issued by a U.S. Government Agency, to be delivered at anagreed-upon future settlement date.
(A) All or a portion of this security is segregated at the custodian ascollateral for certain derivatives.
(B) Security purchased or sold on a when-issued or delayed deliverybasis.
John Hancock Funds IIPortfolio of Investments — August 31, 2017 (showing percentage of total net assets)
130
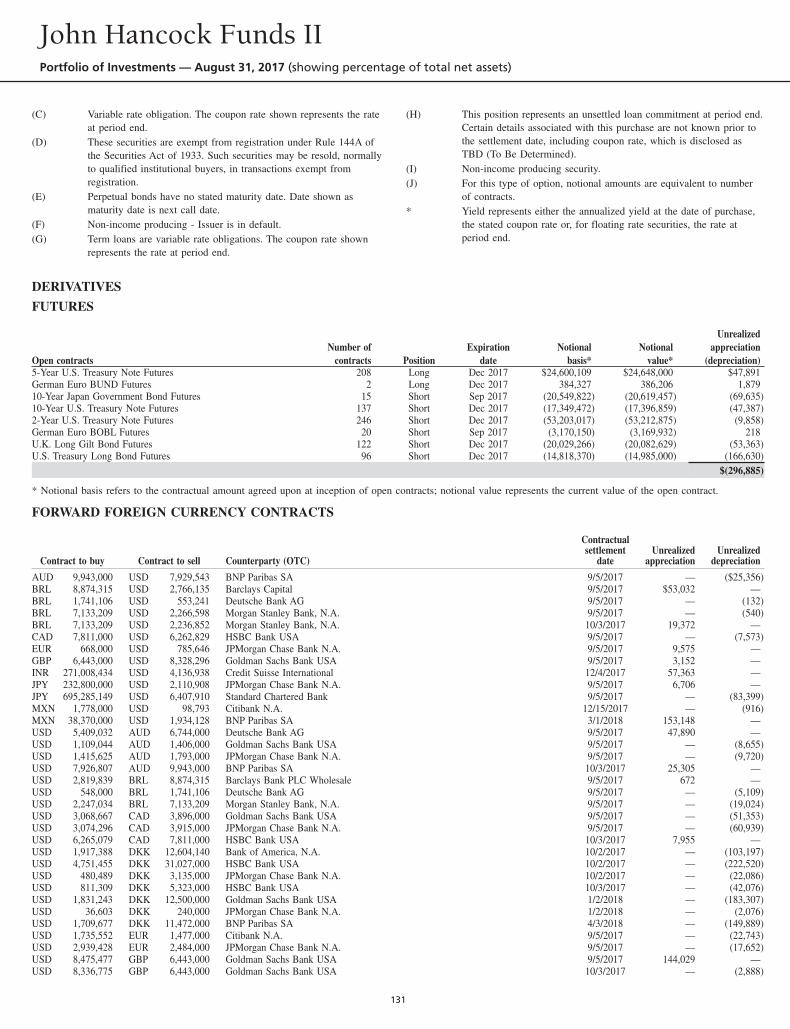
(C) Variable rate obligation. The coupon rate shown represents the rateat period end.
(D) These securities are exempt from registration under Rule 144A ofthe Securities Act of 1933. Such securities may be resold, normallyto qualified institutional buyers, in transactions exempt fromregistration.
(E) Perpetual bonds have no stated maturity date. Date shown asmaturity date is next call date.
(F) Non-income producing - Issuer is in default.(G) Term loans are variable rate obligations. The coupon rate shown
represents the rate at period end.
(H) This position represents an unsettled loan commitment at period end.Certain details associated with this purchase are not known prior tothe settlement date, including coupon rate, which is disclosed asTBD (To Be Determined).
(I) Non-income producing security.(J) For this type of option, notional amounts are equivalent to number
of contracts.* Yield represents either the annualized yield at the date of purchase,
the stated coupon rate or, for floating rate securities, the rate atperiod end.
DERIVATIVES
FUTURES
Open contractsNumber of
contracts PositionExpiration
dateNotional
basis*Notional
value*
Unrealizedappreciation
(depreciation)5-Year U.S. Treasury Note Futures 208 Long Dec 2017 $24,600,109 $24,648,000 $47,891German Euro BUND Futures 2 Long Dec 2017 384,327 386,206 1,87910-Year Japan Government Bond Futures 15 Short Sep 2017 (20,549,822) (20,619,457) (69,635)10-Year U.S. Treasury Note Futures 137 Short Dec 2017 (17,349,472) (17,396,859) (47,387)2-Year U.S. Treasury Note Futures 246 Short Dec 2017 (53,203,017) (53,212,875) (9,858)German Euro BOBL Futures 20 Short Sep 2017 (3,170,150) (3,169,932) 218U.K. Long Gilt Bond Futures 122 Short Dec 2017 (20,029,266) (20,082,629) (53,363)U.S. Treasury Long Bond Futures 96 Short Dec 2017 (14,818,370) (14,985,000) (166,630)
$(296,885)
* Notional basis refers to the contractual amount agreed upon at inception of open contracts; notional value represents the current value of the open contract.
FORWARD FOREIGN CURRENCY CONTRACTS
Contract to buy Contract to sell Counterparty (OTC)
Contractualsettlement
dateUnrealized
appreciationUnrealized
depreciation
AUD 9,943,000 USD 7,929,543 BNP Paribas SA 9/5/2017 — ($25,356)BRL 8,874,315 USD 2,766,135 Barclays Capital 9/5/2017 $53,032 —BRL 1,741,106 USD 553,241 Deutsche Bank AG 9/5/2017 — (132)BRL 7,133,209 USD 2,266,598 Morgan Stanley Bank, N.A. 9/5/2017 — (540)BRL 7,133,209 USD 2,236,852 Morgan Stanley Bank, N.A. 10/3/2017 19,372 —CAD 7,811,000 USD 6,262,829 HSBC Bank USA 9/5/2017 — (7,573)EUR 668,000 USD 785,646 JPMorgan Chase Bank N.A. 9/5/2017 9,575 —GBP 6,443,000 USD 8,328,296 Goldman Sachs Bank USA 9/5/2017 3,152 —INR 271,008,434 USD 4,136,938 Credit Suisse International 12/4/2017 57,363 —JPY 232,800,000 USD 2,110,908 JPMorgan Chase Bank N.A. 9/5/2017 6,706 —JPY 695,285,149 USD 6,407,910 Standard Chartered Bank 9/5/2017 — (83,399)MXN 1,778,000 USD 98,793 Citibank N.A. 12/15/2017 — (916)MXN 38,370,000 USD 1,934,128 BNP Paribas SA 3/1/2018 153,148 —USD 5,409,032 AUD 6,744,000 Deutsche Bank AG 9/5/2017 47,890 —USD 1,109,044 AUD 1,406,000 Goldman Sachs Bank USA 9/5/2017 — (8,655)USD 1,415,625 AUD 1,793,000 JPMorgan Chase Bank N.A. 9/5/2017 — (9,720)USD 7,926,807 AUD 9,943,000 BNP Paribas SA 10/3/2017 25,305 —USD 2,819,839 BRL 8,874,315 Barclays Bank PLC Wholesale 9/5/2017 672 —USD 548,000 BRL 1,741,106 Deutsche Bank AG 9/5/2017 — (5,109)USD 2,247,034 BRL 7,133,209 Morgan Stanley Bank, N.A. 9/5/2017 — (19,024)USD 3,068,667 CAD 3,896,000 Goldman Sachs Bank USA 9/5/2017 — (51,353)USD 3,074,296 CAD 3,915,000 JPMorgan Chase Bank N.A. 9/5/2017 — (60,939)USD 6,265,079 CAD 7,811,000 HSBC Bank USA 10/3/2017 7,955 —USD 1,917,388 DKK 12,604,140 Bank of America, N.A. 10/2/2017 — (103,197)USD 4,751,455 DKK 31,027,000 HSBC Bank USA 10/2/2017 — (222,520)USD 480,489 DKK 3,135,000 JPMorgan Chase Bank N.A. 10/2/2017 — (22,086)USD 811,309 DKK 5,323,000 HSBC Bank USA 10/3/2017 — (42,076)USD 1,831,243 DKK 12,500,000 Goldman Sachs Bank USA 1/2/2018 — (183,307)USD 36,603 DKK 240,000 JPMorgan Chase Bank N.A. 1/2/2018 — (2,076)USD 1,709,677 DKK 11,472,000 BNP Paribas SA 4/3/2018 — (149,889)USD 1,735,552 EUR 1,477,000 Citibank N.A. 9/5/2017 — (22,743)USD 2,939,428 EUR 2,484,000 JPMorgan Chase Bank N.A. 9/5/2017 — (17,652)USD 8,475,477 GBP 6,443,000 Goldman Sachs Bank USA 9/5/2017 144,029 —USD 8,336,775 GBP 6,443,000 Goldman Sachs Bank USA 10/3/2017 — (2,888)
John Hancock Funds IIPortfolio of Investments — August 31, 2017 (showing percentage of total net assets)
131
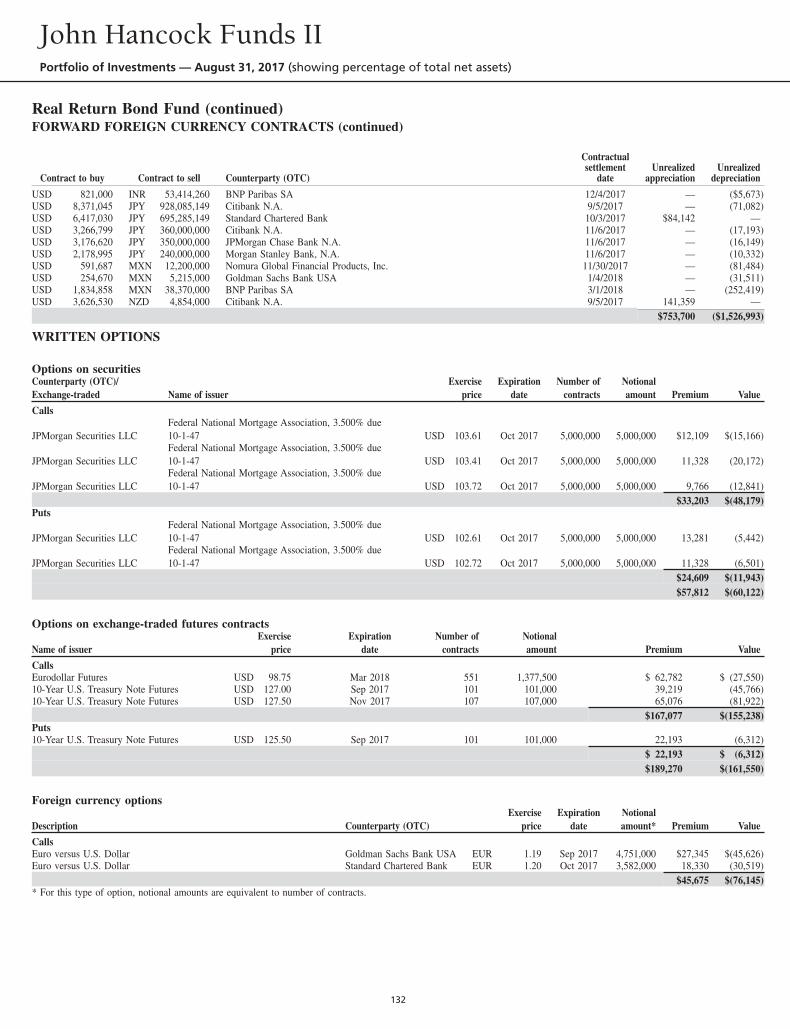
Real Return Bond Fund (continued)FORWARD FOREIGN CURRENCY CONTRACTS (continued)
Contract to buy Contract to sell Counterparty (OTC)
Contractualsettlement
dateUnrealized
appreciationUnrealized
depreciation
USD 821,000 INR 53,414,260 BNP Paribas SA 12/4/2017 — ($5,673)USD 8,371,045 JPY 928,085,149 Citibank N.A. 9/5/2017 — (71,082)USD 6,417,030 JPY 695,285,149 Standard Chartered Bank 10/3/2017 $84,142 —USD 3,266,799 JPY 360,000,000 Citibank N.A. 11/6/2017 — (17,193)USD 3,176,620 JPY 350,000,000 JPMorgan Chase Bank N.A. 11/6/2017 — (16,149)USD 2,178,995 JPY 240,000,000 Morgan Stanley Bank, N.A. 11/6/2017 — (10,332)USD 591,687 MXN 12,200,000 Nomura Global Financial Products, Inc. 11/30/2017 — (81,484)USD 254,670 MXN 5,215,000 Goldman Sachs Bank USA 1/4/2018 — (31,511)USD 1,834,858 MXN 38,370,000 BNP Paribas SA 3/1/2018 — (252,419)USD 3,626,530 NZD 4,854,000 Citibank N.A. 9/5/2017 141,359 —
$753,700 ($1,526,993)
WRITTEN OPTIONS
Options on securitiesCounterparty (OTC)/Exchange-traded Name of issuer
Exerciseprice
Expirationdate
Number ofcontracts
Notionalamount Premium Value
Calls
JPMorgan Securities LLCFederal National Mortgage Association, 3.500% due10-1-47 USD 103.61 Oct 2017 5,000,000 5,000,000 $12,109 $(15,166)
JPMorgan Securities LLCFederal National Mortgage Association, 3.500% due10-1-47 USD 103.41 Oct 2017 5,000,000 5,000,000 11,328 (20,172)
JPMorgan Securities LLCFederal National Mortgage Association, 3.500% due10-1-47 USD 103.72 Oct 2017 5,000,000 5,000,000 9,766 (12,841)
$33,203 $(48,179)Puts
JPMorgan Securities LLCFederal National Mortgage Association, 3.500% due10-1-47 USD 102.61 Oct 2017 5,000,000 5,000,000 13,281 (5,442)
JPMorgan Securities LLCFederal National Mortgage Association, 3.500% due10-1-47 USD 102.72 Oct 2017 5,000,000 5,000,000 11,328 (6,501)
$24,609 $(11,943)$57,812 $(60,122)
Options on exchange-traded futures contracts
Name of issuerExercise
priceExpiration
dateNumber of
contractsNotionalamount Premium Value
CallsEurodollar Futures USD 98.75 Mar 2018 551 1,377,500 $ 62,782 $ (27,550)10-Year U.S. Treasury Note Futures USD 127.00 Sep 2017 101 101,000 39,219 (45,766)10-Year U.S. Treasury Note Futures USD 127.50 Nov 2017 107 107,000 65,076 (81,922)
$167,077 $(155,238)Puts10-Year U.S. Treasury Note Futures USD 125.50 Sep 2017 101 101,000 22,193 (6,312)
$ 22,193 $ (6,312)$189,270 $(161,550)
Foreign currency options
Description Counterparty (OTC)Exercise
priceExpiration
dateNotionalamount* Premium Value
CallsEuro versus U.S. Dollar Goldman Sachs Bank USA EUR 1.19 Sep 2017 4,751,000 $27,345 $(45,626)Euro versus U.S. Dollar Standard Chartered Bank EUR 1.20 Oct 2017 3,582,000 18,330 (30,519)
$45,675 $(76,145)* For this type of option, notional amounts are equivalent to number of contracts.
John Hancock Funds IIPortfolio of Investments — August 31, 2017 (showing percentage of total net assets)
132
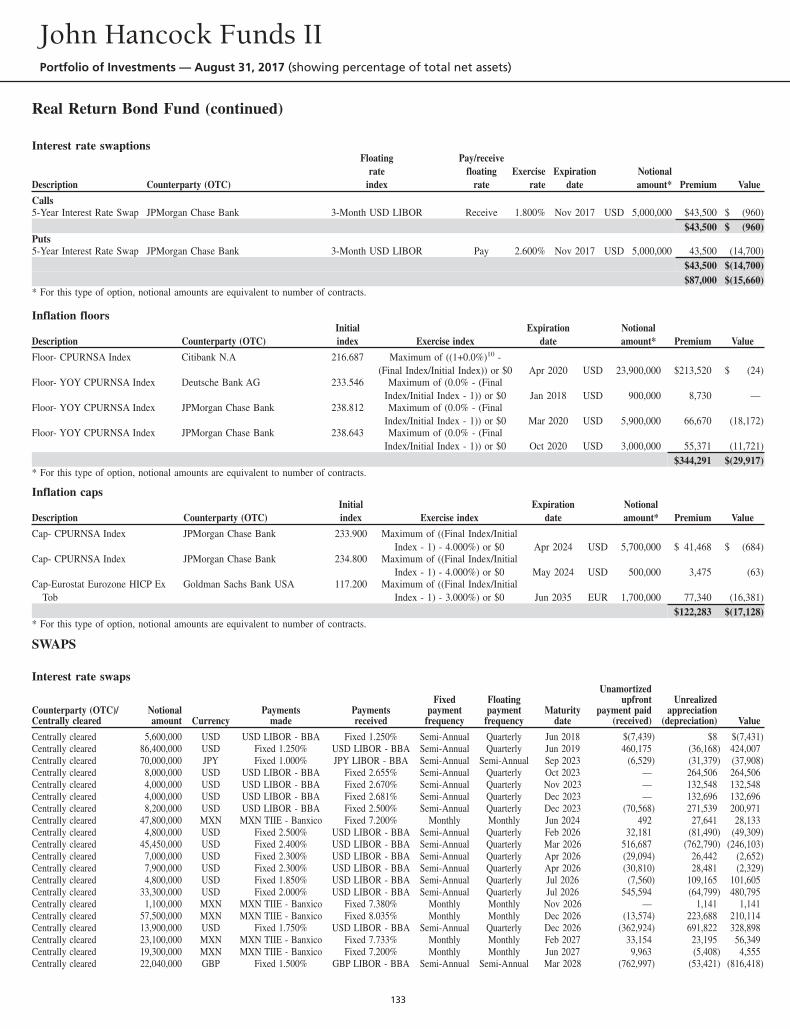
Real Return Bond Fund (continued)
Interest rate swaptions
Description Counterparty (OTC)
Floatingrate
index
Pay/receivefloating
rateExercise
rateExpiration
dateNotionalamount* Premium Value
Calls5-Year Interest Rate Swap JPMorgan Chase Bank 3-Month USD LIBOR Receive 1.800% Nov 2017 USD 5,000,000 $43,500 $ (960)
$43,500 $ (960)Puts5-Year Interest Rate Swap JPMorgan Chase Bank 3-Month USD LIBOR Pay 2.600% Nov 2017 USD 5,000,000 43,500 (14,700)
$43,500 $(14,700)$87,000 $(15,660)
* For this type of option, notional amounts are equivalent to number of contracts.
Inflation floors
Description Counterparty (OTC)Initialindex Exercise index
Expirationdate
Notionalamount* Premium Value
Floor- CPURNSA Index Citibank N.A 216.687 Maximum of ((1+0.0%)10 -(Final Index/Initial Index)) or $0 Apr 2020 USD 23,900,000 $213,520 $ (24)
Floor- YOY CPURNSA Index Deutsche Bank AG 233.546 Maximum of (0.0% - (FinalIndex/Initial Index - 1)) or $0 Jan 2018 USD 900,000 8,730 —
Floor- YOY CPURNSA Index JPMorgan Chase Bank 238.812 Maximum of (0.0% - (FinalIndex/Initial Index - 1)) or $0 Mar 2020 USD 5,900,000 66,670 (18,172)
Floor- YOY CPURNSA Index JPMorgan Chase Bank 238.643 Maximum of (0.0% - (FinalIndex/Initial Index - 1)) or $0 Oct 2020 USD 3,000,000 55,371 (11,721)
$344,291 $(29,917)* For this type of option, notional amounts are equivalent to number of contracts.
Inflation caps
Description Counterparty (OTC)Initialindex Exercise index
Expirationdate
Notionalamount* Premium Value
Cap- CPURNSA Index JPMorgan Chase Bank 233.900 Maximum of ((Final Index/InitialIndex - 1) - 4.000%) or $0 Apr 2024 USD 5,700,000 $ 41,468 $ (684)
Cap- CPURNSA Index JPMorgan Chase Bank 234.800 Maximum of ((Final Index/InitialIndex - 1) - 4.000%) or $0 May 2024 USD 500,000 3,475 (63)
Cap-Eurostat Eurozone HICP ExTob
Goldman Sachs Bank USA 117.200 Maximum of ((Final Index/InitialIndex - 1) - 3.000%) or $0 Jun 2035 EUR 1,700,000 77,340 (16,381)
$122,283 $(17,128)* For this type of option, notional amounts are equivalent to number of contracts.
SWAPS
Interest rate swaps
Counterparty (OTC)/Centrally cleared
Notionalamount Currency
Paymentsmade
Paymentsreceived
Fixedpayment
frequency
Floatingpayment
frequencyMaturity
date
Unamortizedupfront
payment paid(received)
Unrealizedappreciation
(depreciation) Value
Centrally cleared 5,600,000 USD USD LIBOR - BBA Fixed 1.250% Semi-Annual Quarterly Jun 2018 $(7,439) $8 $(7,431)Centrally cleared 86,400,000 USD Fixed 1.250% USD LIBOR - BBA Semi-Annual Quarterly Jun 2019 460,175 (36,168) 424,007Centrally cleared 70,000,000 JPY Fixed 1.000% JPY LIBOR - BBA Semi-Annual Semi-Annual Sep 2023 (6,529) (31,379) (37,908)Centrally cleared 8,000,000 USD USD LIBOR - BBA Fixed 2.655% Semi-Annual Quarterly Oct 2023 — 264,506 264,506Centrally cleared 4,000,000 USD USD LIBOR - BBA Fixed 2.670% Semi-Annual Quarterly Nov 2023 — 132,548 132,548Centrally cleared 4,000,000 USD USD LIBOR - BBA Fixed 2.681% Semi-Annual Quarterly Dec 2023 — 132,696 132,696Centrally cleared 8,200,000 USD USD LIBOR - BBA Fixed 2.500% Semi-Annual Quarterly Dec 2023 (70,568) 271,539 200,971Centrally cleared 47,800,000 MXN MXN TIIE - Banxico Fixed 7.200% Monthly Monthly Jun 2024 492 27,641 28,133Centrally cleared 4,800,000 USD Fixed 2.500% USD LIBOR - BBA Semi-Annual Quarterly Feb 2026 32,181 (81,490) (49,309)Centrally cleared 45,450,000 USD Fixed 2.400% USD LIBOR - BBA Semi-Annual Quarterly Mar 2026 516,687 (762,790) (246,103)Centrally cleared 7,000,000 USD Fixed 2.300% USD LIBOR - BBA Semi-Annual Quarterly Apr 2026 (29,094) 26,442 (2,652)Centrally cleared 7,900,000 USD Fixed 2.300% USD LIBOR - BBA Semi-Annual Quarterly Apr 2026 (30,810) 28,481 (2,329)Centrally cleared 4,800,000 USD Fixed 1.850% USD LIBOR - BBA Semi-Annual Quarterly Jul 2026 (7,560) 109,165 101,605Centrally cleared 33,300,000 USD Fixed 2.000% USD LIBOR - BBA Semi-Annual Quarterly Jul 2026 545,594 (64,799) 480,795Centrally cleared 1,100,000 MXN MXN TIIE - Banxico Fixed 7.380% Monthly Monthly Nov 2026 — 1,141 1,141Centrally cleared 57,500,000 MXN MXN TIIE - Banxico Fixed 8.035% Monthly Monthly Dec 2026 (13,574) 223,688 210,114Centrally cleared 13,900,000 USD Fixed 1.750% USD LIBOR - BBA Semi-Annual Quarterly Dec 2026 (362,924) 691,822 328,898Centrally cleared 23,100,000 MXN MXN TIIE - Banxico Fixed 7.733% Monthly Monthly Feb 2027 33,154 23,195 56,349Centrally cleared 19,300,000 MXN MXN TIIE - Banxico Fixed 7.200% Monthly Monthly Jun 2027 9,963 (5,408) 4,555Centrally cleared 22,040,000 GBP Fixed 1.500% GBP LIBOR - BBA Semi-Annual Semi-Annual Mar 2028 (762,997) (53,421) (816,418)
John Hancock Funds IIPortfolio of Investments — August 31, 2017 (showing percentage of total net assets)
133
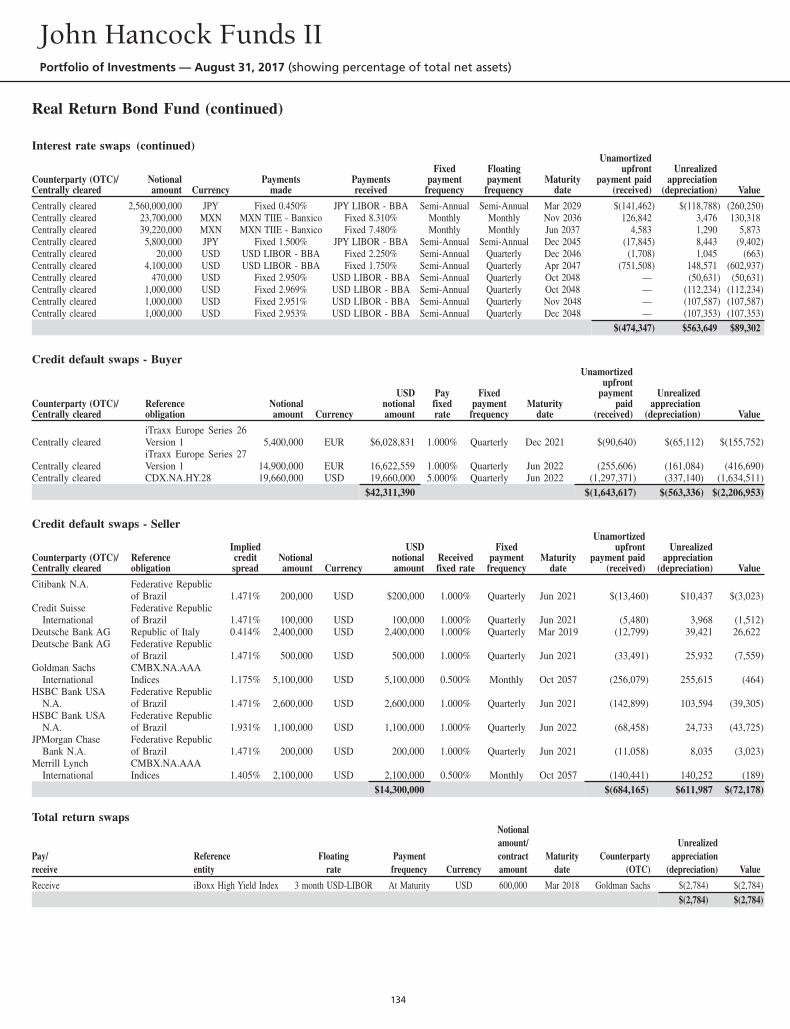
Real Return Bond Fund (continued)
Interest rate swaps (continued)
Counterparty (OTC)/Centrally cleared
Notionalamount Currency
Paymentsmade
Paymentsreceived
Fixedpayment
frequency
Floatingpayment
frequencyMaturity
date
Unamortizedupfront
payment paid(received)
Unrealizedappreciation
(depreciation) Value
Centrally cleared 2,560,000,000 JPY Fixed 0.450% JPY LIBOR - BBA Semi-Annual Semi-Annual Mar 2029 $(141,462) $(118,788) (260,250)Centrally cleared 23,700,000 MXN MXN TIIE - Banxico Fixed 8.310% Monthly Monthly Nov 2036 126,842 3,476 130,318Centrally cleared 39,220,000 MXN MXN TIIE - Banxico Fixed 7.480% Monthly Monthly Jun 2037 4,583 1,290 5,873Centrally cleared 5,800,000 JPY Fixed 1.500% JPY LIBOR - BBA Semi-Annual Semi-Annual Dec 2045 (17,845) 8,443 (9,402)Centrally cleared 20,000 USD USD LIBOR - BBA Fixed 2.250% Semi-Annual Quarterly Dec 2046 (1,708) 1,045 (663)Centrally cleared 4,100,000 USD USD LIBOR - BBA Fixed 1.750% Semi-Annual Quarterly Apr 2047 (751,508) 148,571 (602,937)Centrally cleared 470,000 USD Fixed 2.950% USD LIBOR - BBA Semi-Annual Quarterly Oct 2048 — (50,631) (50,631)Centrally cleared 1,000,000 USD Fixed 2.969% USD LIBOR - BBA Semi-Annual Quarterly Oct 2048 — (112,234) (112,234)Centrally cleared 1,000,000 USD Fixed 2.951% USD LIBOR - BBA Semi-Annual Quarterly Nov 2048 — (107,587) (107,587)Centrally cleared 1,000,000 USD Fixed 2.953% USD LIBOR - BBA Semi-Annual Quarterly Dec 2048 — (107,353) (107,353)
$(474,347) $563,649 $89,302
Credit default swaps - Buyer
Counterparty (OTC)/Centrally cleared
Referenceobligation
Notionalamount Currency
USDnotionalamount
Payfixedrate
Fixedpayment
frequencyMaturity
date
Unamortizedupfront
paymentpaid
(received)
Unrealizedappreciation
(depreciation) Value
Centrally clearediTraxx Europe Series 26Version 1 5,400,000 EUR $6,028,831 1.000% Quarterly Dec 2021 $(90,640) $(65,112) $(155,752)
Centrally clearediTraxx Europe Series 27Version 1 14,900,000 EUR 16,622,559 1.000% Quarterly Jun 2022 (255,606) (161,084) (416,690)
Centrally cleared CDX.NA.HY.28 19,660,000 USD 19,660,000 5.000% Quarterly Jun 2022 (1,297,371) (337,140) (1,634,511)$42,311,390 $(1,643,617) $(563,336) $(2,206,953)
Credit default swaps - Seller
Counterparty (OTC)/Centrally cleared
Referenceobligation
Impliedcreditspread
Notionalamount Currency
USDnotionalamount
Receivedfixed rate
Fixedpayment
frequencyMaturity
date
Unamortizedupfront
payment paid(received)
Unrealizedappreciation
(depreciation) Value
Citibank N.A. Federative Republicof Brazil 1.471% 200,000 USD $200,000 1.000% Quarterly Jun 2021 $(13,460) $10,437 $(3,023)
Credit SuisseInternational
Federative Republicof Brazil 1.471% 100,000 USD 100,000 1.000% Quarterly Jun 2021 (5,480) 3,968 (1,512)
Deutsche Bank AG Republic of Italy 0.414% 2,400,000 USD 2,400,000 1.000% Quarterly Mar 2019 (12,799) 39,421 26,622Deutsche Bank AG Federative Republic
of Brazil 1.471% 500,000 USD 500,000 1.000% Quarterly Jun 2021 (33,491) 25,932 (7,559)Goldman Sachs
InternationalCMBX.NA.AAAIndices 1.175% 5,100,000 USD 5,100,000 0.500% Monthly Oct 2057 (256,079) 255,615 (464)
HSBC Bank USAN.A.
Federative Republicof Brazil 1.471% 2,600,000 USD 2,600,000 1.000% Quarterly Jun 2021 (142,899) 103,594 (39,305)
HSBC Bank USAN.A.
Federative Republicof Brazil 1.931% 1,100,000 USD 1,100,000 1.000% Quarterly Jun 2022 (68,458) 24,733 (43,725)
JPMorgan ChaseBank N.A.
Federative Republicof Brazil 1.471% 200,000 USD 200,000 1.000% Quarterly Jun 2021 (11,058) 8,035 (3,023)
Merrill LynchInternational
CMBX.NA.AAAIndices 1.405% 2,100,000 USD 2,100,000 0.500% Monthly Oct 2057 (140,441) 140,252 (189)
$14,300,000 $(684,165) $611,987 $(72,178)
Total return swaps
Pay/receive
Referenceentity
Floatingrate
Paymentfrequency Currency
Notionalamount/contractamount
Maturitydate
Counterparty(OTC)
Unrealizedappreciation
(depreciation) Value
Receive iBoxx High Yield Index 3 month USD-LIBOR At Maturity USD 600,000 Mar 2018 Goldman Sachs $(2,784) $(2,784)$(2,784) $(2,784)
John Hancock Funds IIPortfolio of Investments — August 31, 2017 (showing percentage of total net assets)
134
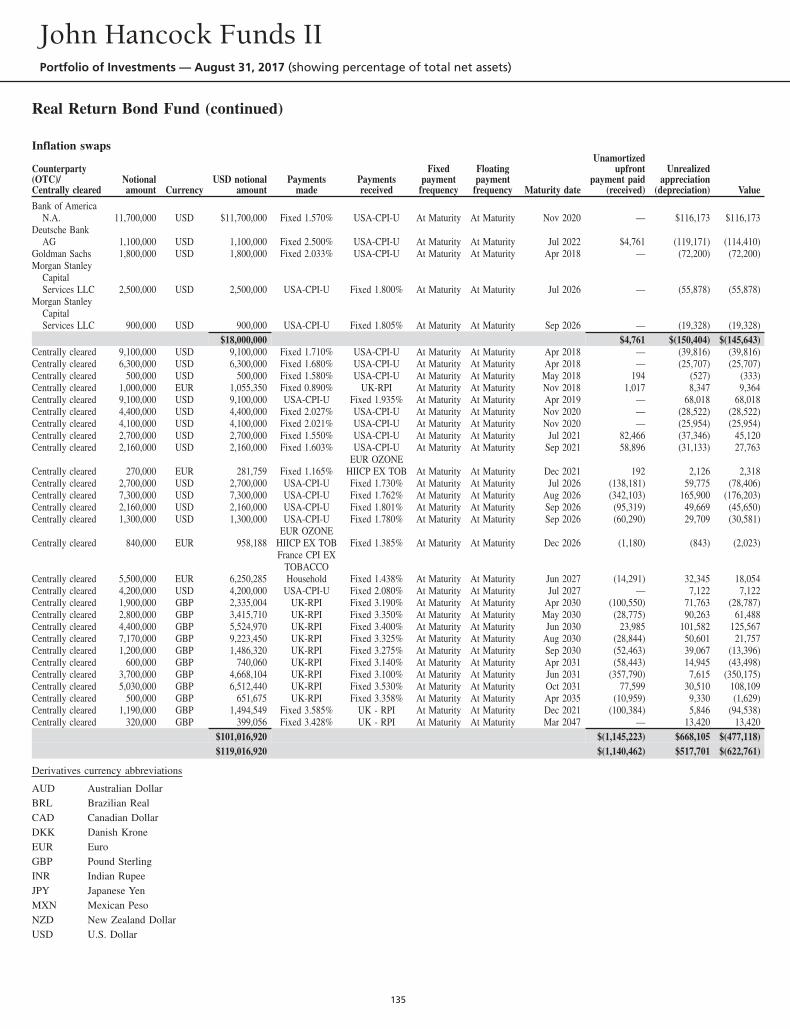
Real Return Bond Fund (continued)
Inflation swaps
Counterparty(OTC)/Centrally cleared
Notionalamount Currency
USD notionalamount
Paymentsmade
Paymentsreceived
Fixedpayment
frequency
Floatingpayment
frequency Maturity date
Unamortizedupfront
payment paid(received)
Unrealizedappreciation
(depreciation) Value
Bank of AmericaN.A. 11,700,000 USD $11,700,000 Fixed 1.570% USA-CPI-U At Maturity At Maturity Nov 2020 — $116,173 $116,173
Deutsche BankAG 1,100,000 USD 1,100,000 Fixed 2.500% USA-CPI-U At Maturity At Maturity Jul 2022 $4,761 (119,171) (114,410)
Goldman Sachs 1,800,000 USD 1,800,000 Fixed 2.033% USA-CPI-U At Maturity At Maturity Apr 2018 — (72,200) (72,200)Morgan Stanley
CapitalServices LLC 2,500,000 USD 2,500,000 USA-CPI-U Fixed 1.800% At Maturity At Maturity Jul 2026 — (55,878) (55,878)
Morgan StanleyCapitalServices LLC 900,000 USD 900,000 USA-CPI-U Fixed 1.805% At Maturity At Maturity Sep 2026 — (19,328) (19,328)
$18,000,000 $4,761 $(150,404) $(145,643)Centrally cleared 9,100,000 USD 9,100,000 Fixed 1.710% USA-CPI-U At Maturity At Maturity Apr 2018 — (39,816) (39,816)Centrally cleared 6,300,000 USD 6,300,000 Fixed 1.680% USA-CPI-U At Maturity At Maturity Apr 2018 — (25,707) (25,707)Centrally cleared 500,000 USD 500,000 Fixed 1.580% USA-CPI-U At Maturity At Maturity May 2018 194 (527) (333)Centrally cleared 1,000,000 EUR 1,055,350 Fixed 0.890% UK-RPI At Maturity At Maturity Nov 2018 1,017 8,347 9,364Centrally cleared 9,100,000 USD 9,100,000 USA-CPI-U Fixed 1.935% At Maturity At Maturity Apr 2019 — 68,018 68,018Centrally cleared 4,400,000 USD 4,400,000 Fixed 2.027% USA-CPI-U At Maturity At Maturity Nov 2020 — (28,522) (28,522)Centrally cleared 4,100,000 USD 4,100,000 Fixed 2.021% USA-CPI-U At Maturity At Maturity Nov 2020 — (25,954) (25,954)Centrally cleared 2,700,000 USD 2,700,000 Fixed 1.550% USA-CPI-U At Maturity At Maturity Jul 2021 82,466 (37,346) 45,120Centrally cleared 2,160,000 USD 2,160,000 Fixed 1.603% USA-CPI-U At Maturity At Maturity Sep 2021 58,896 (31,133) 27,763
Centrally cleared 270,000 EUR 281,759 Fixed 1.165%EUR OZONE
HIICP EX TOB At Maturity At Maturity Dec 2021 192 2,126 2,318Centrally cleared 2,700,000 USD 2,700,000 USA-CPI-U Fixed 1.730% At Maturity At Maturity Jul 2026 (138,181) 59,775 (78,406)Centrally cleared 7,300,000 USD 7,300,000 USA-CPI-U Fixed 1.762% At Maturity At Maturity Aug 2026 (342,103) 165,900 (176,203)Centrally cleared 2,160,000 USD 2,160,000 USA-CPI-U Fixed 1.801% At Maturity At Maturity Sep 2026 (95,319) 49,669 (45,650)Centrally cleared 1,300,000 USD 1,300,000 USA-CPI-U Fixed 1.780% At Maturity At Maturity Sep 2026 (60,290) 29,709 (30,581)
Centrally cleared 840,000 EUR 958,188EUR OZONE
HIICP EX TOB Fixed 1.385% At Maturity At Maturity Dec 2026 (1,180) (843) (2,023)
Centrally cleared 5,500,000 EUR 6,250,285
France CPI EXTOBACCOHousehold Fixed 1.438% At Maturity At Maturity Jun 2027 (14,291) 32,345 18,054
Centrally cleared 4,200,000 USD 4,200,000 USA-CPI-U Fixed 2.080% At Maturity At Maturity Jul 2027 — 7,122 7,122Centrally cleared 1,900,000 GBP 2,335,004 UK-RPI Fixed 3.190% At Maturity At Maturity Apr 2030 (100,550) 71,763 (28,787)Centrally cleared 2,800,000 GBP 3,415,710 UK-RPI Fixed 3.350% At Maturity At Maturity May 2030 (28,775) 90,263 61,488Centrally cleared 4,400,000 GBP 5,524,970 UK-RPI Fixed 3.400% At Maturity At Maturity Jun 2030 23,985 101,582 125,567Centrally cleared 7,170,000 GBP 9,223,450 UK-RPI Fixed 3.325% At Maturity At Maturity Aug 2030 (28,844) 50,601 21,757Centrally cleared 1,200,000 GBP 1,486,320 UK-RPI Fixed 3.275% At Maturity At Maturity Sep 2030 (52,463) 39,067 (13,396)Centrally cleared 600,000 GBP 740,060 UK-RPI Fixed 3.140% At Maturity At Maturity Apr 2031 (58,443) 14,945 (43,498)Centrally cleared 3,700,000 GBP 4,668,104 UK-RPI Fixed 3.100% At Maturity At Maturity Jun 2031 (357,790) 7,615 (350,175)Centrally cleared 5,030,000 GBP 6,512,440 UK-RPI Fixed 3.530% At Maturity At Maturity Oct 2031 77,599 30,510 108,109Centrally cleared 500,000 GBP 651,675 UK-RPI Fixed 3.358% At Maturity At Maturity Apr 2035 (10,959) 9,330 (1,629)Centrally cleared 1,190,000 GBP 1,494,549 Fixed 3.585% UK - RPI At Maturity At Maturity Dec 2021 (100,384) 5,846 (94,538)Centrally cleared 320,000 GBP 399,056 Fixed 3.428% UK - RPI At Maturity At Maturity Mar 2047 — 13,420 13,420
$101,016,920 $(1,145,223) $668,105 $(477,118)$119,016,920 $(1,140,462) $517,701 $(622,761)
Derivatives currency abbreviations
AUD Australian DollarBRL Brazilian RealCAD Canadian DollarDKK Danish KroneEUR EuroGBP Pound SterlingINR Indian RupeeJPY Japanese YenMXN Mexican PesoNZD New Zealand DollarUSD U.S. Dollar
John Hancock Funds IIPortfolio of Investments — August 31, 2017 (showing percentage of total net assets)
135
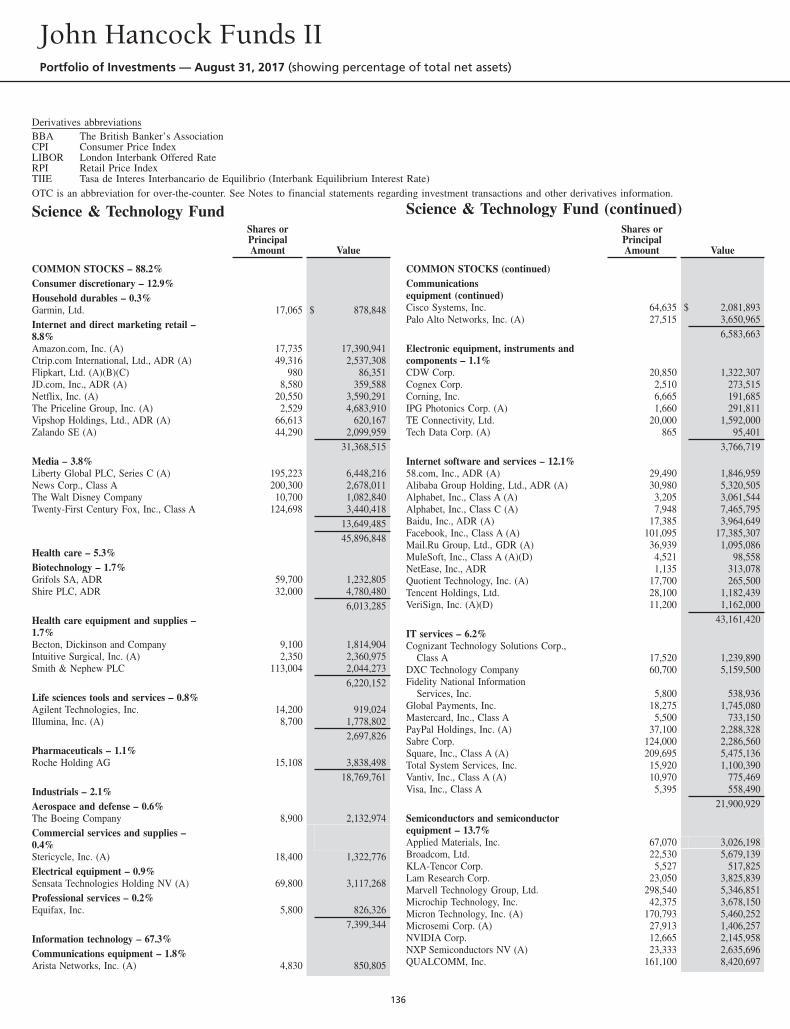
Derivatives abbreviationsBBA The British Banker’s AssociationCPI Consumer Price IndexLIBOR London Interbank Offered RateRPI Retail Price IndexTIIE Tasa de Interes Interbancario de Equilibrio (Interbank Equilibrium Interest Rate)OTC is an abbreviation for over-the-counter. See Notes to financial statements regarding investment transactions and other derivatives information.
Science & Technology FundShares orPrincipalAmount Value
COMMON STOCKS – 88.2%Consumer discretionary – 12.9%Household durables – 0.3%Garmin, Ltd. 17,065 $ 878,848Internet and direct marketing retail –8.8%Amazon.com, Inc. (A) 17,735 17,390,941Ctrip.com International, Ltd., ADR (A) 49,316 2,537,308Flipkart, Ltd. (A)(B)(C) 980 86,351JD.com, Inc., ADR (A) 8,580 359,588Netflix, Inc. (A) 20,550 3,590,291The Priceline Group, Inc. (A) 2,529 4,683,910Vipshop Holdings, Ltd., ADR (A) 66,613 620,167Zalando SE (A) 44,290 2,099,959
31,368,515Media – 3.8%Liberty Global PLC, Series C (A) 195,223 6,448,216News Corp., Class A 200,300 2,678,011The Walt Disney Company 10,700 1,082,840Twenty-First Century Fox, Inc., Class A 124,698 3,440,418
13,649,48545,896,848
Health care – 5.3%Biotechnology – 1.7%Grifols SA, ADR 59,700 1,232,805Shire PLC, ADR 32,000 4,780,480
6,013,285Health care equipment and supplies –1.7%Becton, Dickinson and Company 9,100 1,814,904Intuitive Surgical, Inc. (A) 2,350 2,360,975Smith & Nephew PLC 113,004 2,044,273
6,220,152Life sciences tools and services – 0.8%Agilent Technologies, Inc. 14,200 919,024Illumina, Inc. (A) 8,700 1,778,802
2,697,826Pharmaceuticals – 1.1%Roche Holding AG 15,108 3,838,498
18,769,761Industrials – 2.1%Aerospace and defense – 0.6%The Boeing Company 8,900 2,132,974Commercial services and supplies –0.4%Stericycle, Inc. (A) 18,400 1,322,776Electrical equipment – 0.9%Sensata Technologies Holding NV (A) 69,800 3,117,268Professional services – 0.2%Equifax, Inc. 5,800 826,326
7,399,344Information technology – 67.3%Communications equipment – 1.8%Arista Networks, Inc. (A) 4,830 850,805
Science & Technology Fund (continued)Shares orPrincipalAmount Value
COMMON STOCKS (continued)Communicationsequipment (continued)Cisco Systems, Inc. 64,635 $ 2,081,893Palo Alto Networks, Inc. (A) 27,515 3,650,965
6,583,663Electronic equipment, instruments andcomponents – 1.1%CDW Corp. 20,850 1,322,307Cognex Corp. 2,510 273,515Corning, Inc. 6,665 191,685IPG Photonics Corp. (A) 1,660 291,811TE Connectivity, Ltd. 20,000 1,592,000Tech Data Corp. (A) 865 95,401
3,766,719Internet software and services – 12.1%58.com, Inc., ADR (A) 29,490 1,846,959Alibaba Group Holding, Ltd., ADR (A) 30,980 5,320,505Alphabet, Inc., Class A (A) 3,205 3,061,544Alphabet, Inc., Class C (A) 7,948 7,465,795Baidu, Inc., ADR (A) 17,385 3,964,649Facebook, Inc., Class A (A) 101,095 17,385,307Mail.Ru Group, Ltd., GDR (A) 36,939 1,095,086MuleSoft, Inc., Class A (A)(D) 4,521 98,558NetEase, Inc., ADR 1,135 313,078Quotient Technology, Inc. (A) 17,700 265,500Tencent Holdings, Ltd. 28,100 1,182,439VeriSign, Inc. (A)(D) 11,200 1,162,000
43,161,420IT services – 6.2%Cognizant Technology Solutions Corp.,
Class A 17,520 1,239,890DXC Technology Company 60,700 5,159,500Fidelity National Information
Services, Inc. 5,800 538,936Global Payments, Inc. 18,275 1,745,080Mastercard, Inc., Class A 5,500 733,150PayPal Holdings, Inc. (A) 37,100 2,288,328Sabre Corp. 124,000 2,286,560Square, Inc., Class A (A) 209,695 5,475,136Total System Services, Inc. 15,920 1,100,390Vantiv, Inc., Class A (A) 10,970 775,469Visa, Inc., Class A 5,395 558,490
21,900,929Semiconductors and semiconductorequipment – 13.7%Applied Materials, Inc. 67,070 3,026,198Broadcom, Ltd. 22,530 5,679,139KLA-Tencor Corp. 5,527 517,825Lam Research Corp. 23,050 3,825,839Marvell Technology Group, Ltd. 298,540 5,346,851Microchip Technology, Inc. 42,375 3,678,150Micron Technology, Inc. (A) 170,793 5,460,252Microsemi Corp. (A) 27,913 1,406,257NVIDIA Corp. 12,665 2,145,958NXP Semiconductors NV (A) 23,333 2,635,696QUALCOMM, Inc. 161,100 8,420,697
John Hancock Funds IIPortfolio of Investments — August 31, 2017 (showing percentage of total net assets)
136
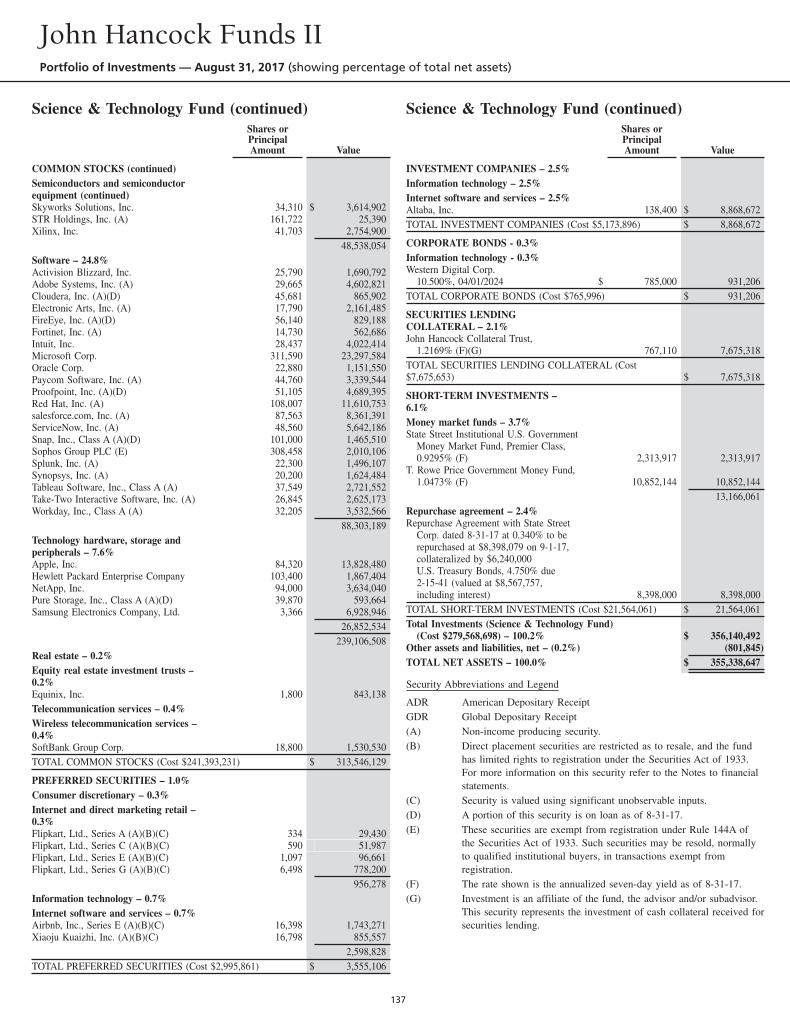
Science & Technology Fund (continued)Shares orPrincipalAmount Value
COMMON STOCKS (continued)Semiconductors and semiconductorequipment (continued)Skyworks Solutions, Inc. 34,310 $ 3,614,902STR Holdings, Inc. (A) 161,722 25,390Xilinx, Inc. 41,703 2,754,900
48,538,054Software – 24.8%Activision Blizzard, Inc. 25,790 1,690,792Adobe Systems, Inc. (A) 29,665 4,602,821Cloudera, Inc. (A)(D) 45,681 865,902Electronic Arts, Inc. (A) 17,790 2,161,485FireEye, Inc. (A)(D) 56,140 829,188Fortinet, Inc. (A) 14,730 562,686Intuit, Inc. 28,437 4,022,414Microsoft Corp. 311,590 23,297,584Oracle Corp. 22,880 1,151,550Paycom Software, Inc. (A) 44,760 3,339,544Proofpoint, Inc. (A)(D) 51,105 4,689,395Red Hat, Inc. (A) 108,007 11,610,753salesforce.com, Inc. (A) 87,563 8,361,391ServiceNow, Inc. (A) 48,560 5,642,186Snap, Inc., Class A (A)(D) 101,000 1,465,510Sophos Group PLC (E) 308,458 2,010,106Splunk, Inc. (A) 22,300 1,496,107Synopsys, Inc. (A) 20,200 1,624,484Tableau Software, Inc., Class A (A) 37,549 2,721,552Take-Two Interactive Software, Inc. (A) 26,845 2,625,173Workday, Inc., Class A (A) 32,205 3,532,566
88,303,189Technology hardware, storage andperipherals – 7.6%Apple, Inc. 84,320 13,828,480Hewlett Packard Enterprise Company 103,400 1,867,404NetApp, Inc. 94,000 3,634,040Pure Storage, Inc., Class A (A)(D) 39,870 593,664Samsung Electronics Company, Ltd. 3,366 6,928,946
26,852,534239,106,508
Real estate – 0.2%Equity real estate investment trusts –0.2%Equinix, Inc. 1,800 843,138Telecommunication services – 0.4%Wireless telecommunication services –0.4%SoftBank Group Corp. 18,800 1,530,530TOTAL COMMON STOCKS (Cost $241,393,231) $ 313,546,129
PREFERRED SECURITIES – 1.0%Consumer discretionary – 0.3%Internet and direct marketing retail –0.3%Flipkart, Ltd., Series A (A)(B)(C) 334 29,430Flipkart, Ltd., Series C (A)(B)(C) 590 51,987Flipkart, Ltd., Series E (A)(B)(C) 1,097 96,661Flipkart, Ltd., Series G (A)(B)(C) 6,498 778,200
956,278Information technology – 0.7%Internet software and services – 0.7%Airbnb, Inc., Series E (A)(B)(C) 16,398 1,743,271Xiaoju Kuaizhi, Inc. (A)(B)(C) 16,798 855,557
2,598,828TOTAL PREFERRED SECURITIES (Cost $2,995,861) $ 3,555,106
Science & Technology Fund (continued)Shares orPrincipalAmount Value
INVESTMENT COMPANIES – 2.5%Information technology – 2.5%Internet software and services – 2.5%Altaba, Inc. 138,400 $ 8,868,672TOTAL INVESTMENT COMPANIES (Cost $5,173,896) $ 8,868,672
CORPORATE BONDS - 0.3%Information technology - 0.3%Western Digital Corp.
10.500%, 04/01/2024 $ 785,000 931,206TOTAL CORPORATE BONDS (Cost $765,996) $ 931,206
SECURITIES LENDINGCOLLATERAL – 2.1%John Hancock Collateral Trust,
1.2169% (F)(G) 767,110 7,675,318TOTAL SECURITIES LENDING COLLATERAL (Cost$7,675,653) $ 7,675,318
SHORT-TERM INVESTMENTS –6.1%Money market funds – 3.7%State Street Institutional U.S. Government
Money Market Fund, Premier Class,0.9295% (F) 2,313,917 2,313,917
T. Rowe Price Government Money Fund,1.0473% (F) 10,852,144 10,852,144
13,166,061Repurchase agreement – 2.4%Repurchase Agreement with State Street
Corp. dated 8-31-17 at 0.340% to berepurchased at $8,398,079 on 9-1-17,collateralized by $6,240,000U.S. Treasury Bonds, 4.750% due2-15-41 (valued at $8,567,757,including interest) 8,398,000 8,398,000
TOTAL SHORT-TERM INVESTMENTS (Cost $21,564,061) $ 21,564,061Total Investments (Science & Technology Fund)
(Cost $279,568,698) – 100.2% $ 356,140,492Other assets and liabilities, net – (0.2%) (801,845)TOTAL NET ASSETS – 100.0% $ 355,338,647
Security Abbreviations and Legend
ADR American Depositary ReceiptGDR Global Depositary Receipt(A) Non-income producing security.(B) Direct placement securities are restricted as to resale, and the fund
has limited rights to registration under the Securities Act of 1933.For more information on this security refer to the Notes to financialstatements.
(C) Security is valued using significant unobservable inputs.(D) A portion of this security is on loan as of 8-31-17.(E) These securities are exempt from registration under Rule 144A of
the Securities Act of 1933. Such securities may be resold, normallyto qualified institutional buyers, in transactions exempt fromregistration.
(F) The rate shown is the annualized seven-day yield as of 8-31-17.(G) Investment is an affiliate of the fund, the advisor and/or subadvisor.
This security represents the investment of cash collateral received forsecurities lending.
John Hancock Funds IIPortfolio of Investments — August 31, 2017 (showing percentage of total net assets)
137
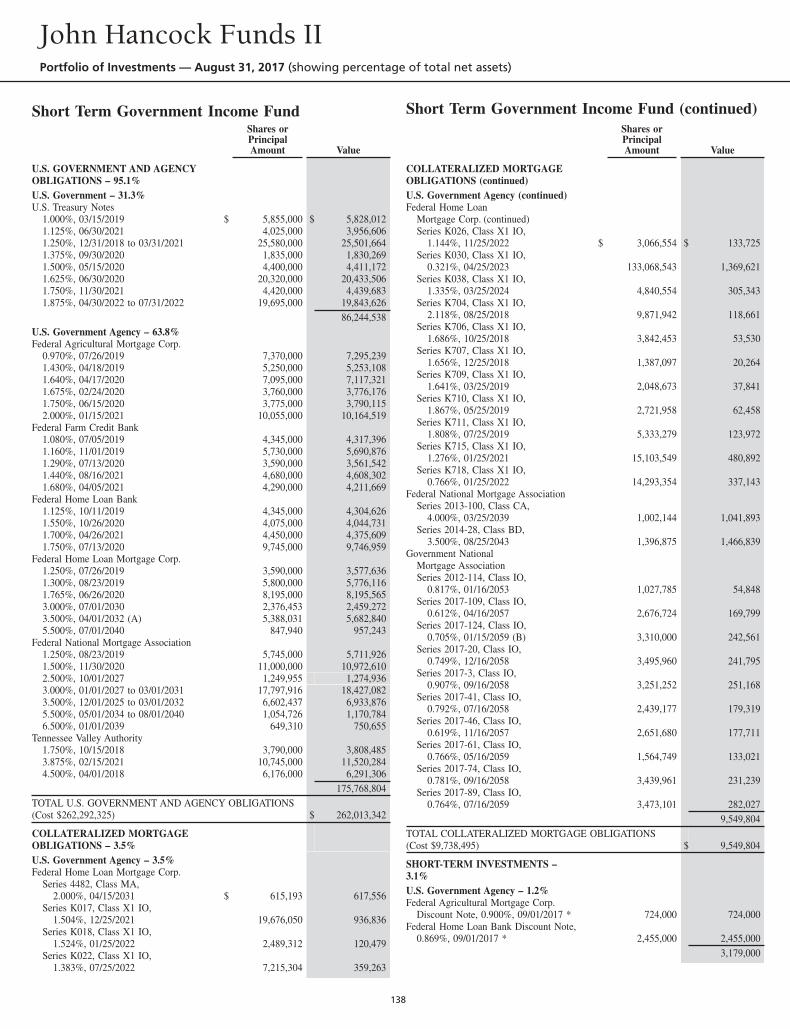
Short Term Government Income FundShares orPrincipalAmount Value
U.S. GOVERNMENT AND AGENCYOBLIGATIONS – 95.1%U.S. Government – 31.3%U.S. Treasury Notes
1.000%, 03/15/2019 $ 5,855,000 $ 5,828,0121.125%, 06/30/2021 4,025,000 3,956,6061.250%, 12/31/2018 to 03/31/2021 25,580,000 25,501,6641.375%, 09/30/2020 1,835,000 1,830,2691.500%, 05/15/2020 4,400,000 4,411,1721.625%, 06/30/2020 20,320,000 20,433,5061.750%, 11/30/2021 4,420,000 4,439,6831.875%, 04/30/2022 to 07/31/2022 19,695,000 19,843,626
86,244,538U.S. Government Agency – 63.8%Federal Agricultural Mortgage Corp.
0.970%, 07/26/2019 7,370,000 7,295,2391.430%, 04/18/2019 5,250,000 5,253,1081.640%, 04/17/2020 7,095,000 7,117,3211.675%, 02/24/2020 3,760,000 3,776,1761.750%, 06/15/2020 3,775,000 3,790,1152.000%, 01/15/2021 10,055,000 10,164,519
Federal Farm Credit Bank1.080%, 07/05/2019 4,345,000 4,317,3961.160%, 11/01/2019 5,730,000 5,690,8761.290%, 07/13/2020 3,590,000 3,561,5421.440%, 08/16/2021 4,680,000 4,608,3021.680%, 04/05/2021 4,290,000 4,211,669
Federal Home Loan Bank1.125%, 10/11/2019 4,345,000 4,304,6261.550%, 10/26/2020 4,075,000 4,044,7311.700%, 04/26/2021 4,450,000 4,375,6091.750%, 07/13/2020 9,745,000 9,746,959
Federal Home Loan Mortgage Corp.1.250%, 07/26/2019 3,590,000 3,577,6361.300%, 08/23/2019 5,800,000 5,776,1161.765%, 06/26/2020 8,195,000 8,195,5653.000%, 07/01/2030 2,376,453 2,459,2723.500%, 04/01/2032 (A) 5,388,031 5,682,8405.500%, 07/01/2040 847,940 957,243
Federal National Mortgage Association1.250%, 08/23/2019 5,745,000 5,711,9261.500%, 11/30/2020 11,000,000 10,972,6102.500%, 10/01/2027 1,249,955 1,274,9363.000%, 01/01/2027 to 03/01/2031 17,797,916 18,427,0823.500%, 12/01/2025 to 03/01/2032 6,602,437 6,933,8765.500%, 05/01/2034 to 08/01/2040 1,054,726 1,170,7846.500%, 01/01/2039 649,310 750,655
Tennessee Valley Authority1.750%, 10/15/2018 3,790,000 3,808,4853.875%, 02/15/2021 10,745,000 11,520,2844.500%, 04/01/2018 6,176,000 6,291,306
175,768,804TOTAL U.S. GOVERNMENT AND AGENCY OBLIGATIONS(Cost $262,292,325) $ 262,013,342
COLLATERALIZED MORTGAGEOBLIGATIONS – 3.5%U.S. Government Agency – 3.5%Federal Home Loan Mortgage Corp.
Series 4482, Class MA,2.000%, 04/15/2031 $ 615,193 617,556
Series K017, Class X1 IO,1.504%, 12/25/2021 19,676,050 936,836
Series K018, Class X1 IO,1.524%, 01/25/2022 2,489,312 120,479
Series K022, Class X1 IO,1.383%, 07/25/2022 7,215,304 359,263
Short Term Government Income Fund (continued)Shares orPrincipalAmount Value
COLLATERALIZED MORTGAGEOBLIGATIONS (continued)U.S. Government Agency (continued)Federal Home Loan
Mortgage Corp. (continued)Series K026, Class X1 IO,
1.144%, 11/25/2022 $ 3,066,554 $ 133,725Series K030, Class X1 IO,
0.321%, 04/25/2023 133,068,543 1,369,621Series K038, Class X1 IO,
1.335%, 03/25/2024 4,840,554 305,343Series K704, Class X1 IO,
2.118%, 08/25/2018 9,871,942 118,661Series K706, Class X1 IO,
1.686%, 10/25/2018 3,842,453 53,530Series K707, Class X1 IO,
1.656%, 12/25/2018 1,387,097 20,264Series K709, Class X1 IO,
1.641%, 03/25/2019 2,048,673 37,841Series K710, Class X1 IO,
1.867%, 05/25/2019 2,721,958 62,458Series K711, Class X1 IO,
1.808%, 07/25/2019 5,333,279 123,972Series K715, Class X1 IO,
1.276%, 01/25/2021 15,103,549 480,892Series K718, Class X1 IO,
0.766%, 01/25/2022 14,293,354 337,143Federal National Mortgage Association
Series 2013-100, Class CA,4.000%, 03/25/2039 1,002,144 1,041,893
Series 2014-28, Class BD,3.500%, 08/25/2043 1,396,875 1,466,839
Government NationalMortgage AssociationSeries 2012-114, Class IO,
0.817%, 01/16/2053 1,027,785 54,848Series 2017-109, Class IO,
0.612%, 04/16/2057 2,676,724 169,799Series 2017-124, Class IO,
0.705%, 01/15/2059 (B) 3,310,000 242,561Series 2017-20, Class IO,
0.749%, 12/16/2058 3,495,960 241,795Series 2017-3, Class IO,
0.907%, 09/16/2058 3,251,252 251,168Series 2017-41, Class IO,
0.792%, 07/16/2058 2,439,177 179,319Series 2017-46, Class IO,
0.619%, 11/16/2057 2,651,680 177,711Series 2017-61, Class IO,
0.766%, 05/16/2059 1,564,749 133,021Series 2017-74, Class IO,
0.781%, 09/16/2058 3,439,961 231,239Series 2017-89, Class IO,
0.764%, 07/16/2059 3,473,101 282,0279,549,804
TOTAL COLLATERALIZED MORTGAGE OBLIGATIONS(Cost $9,738,495) $ 9,549,804
SHORT-TERM INVESTMENTS –3.1%U.S. Government Agency – 1.2%Federal Agricultural Mortgage Corp.
Discount Note, 0.900%, 09/01/2017 * 724,000 724,000Federal Home Loan Bank Discount Note,
0.869%, 09/01/2017 * 2,455,000 2,455,0003,179,000
John Hancock Funds IIPortfolio of Investments — August 31, 2017 (showing percentage of total net assets)
138
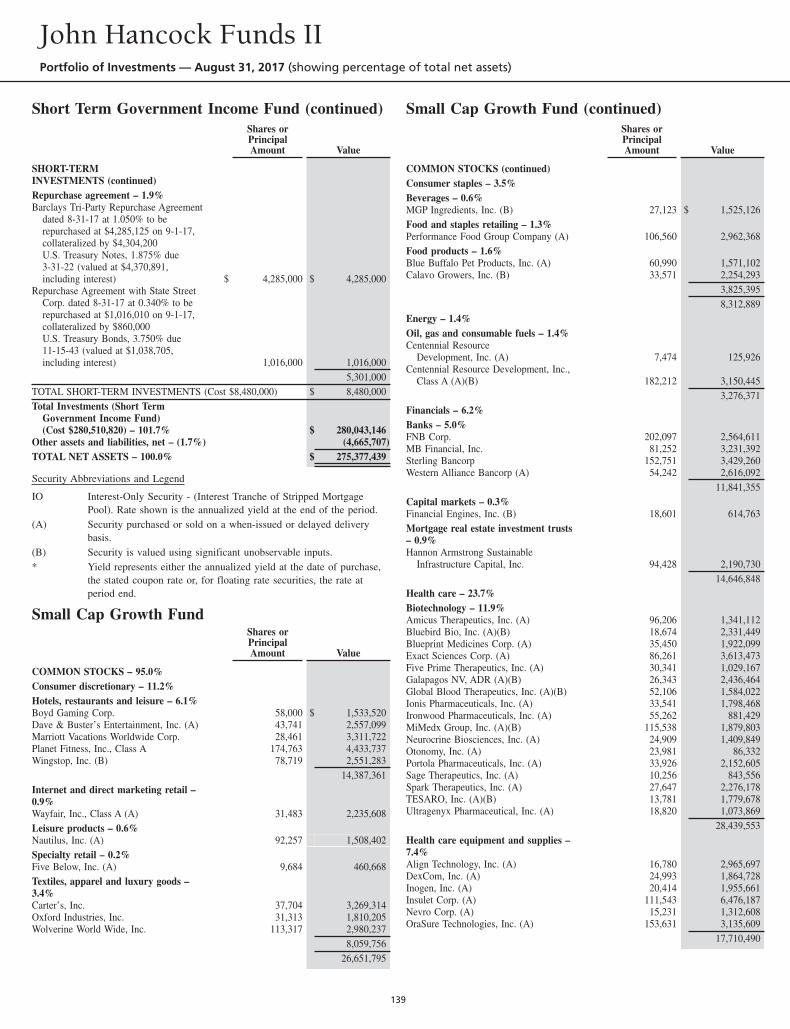
Short Term Government Income Fund (continued)Shares orPrincipalAmount Value
SHORT-TERMINVESTMENTS (continued)Repurchase agreement – 1.9%Barclays Tri-Party Repurchase Agreement
dated 8-31-17 at 1.050% to berepurchased at $4,285,125 on 9-1-17,collateralized by $4,304,200U.S. Treasury Notes, 1.875% due3-31-22 (valued at $4,370,891,including interest) $ 4,285,000 $ 4,285,000
Repurchase Agreement with State StreetCorp. dated 8-31-17 at 0.340% to berepurchased at $1,016,010 on 9-1-17,collateralized by $860,000U.S. Treasury Bonds, 3.750% due11-15-43 (valued at $1,038,705,including interest) 1,016,000 1,016,000
5,301,000TOTAL SHORT-TERM INVESTMENTS (Cost $8,480,000) $ 8,480,000Total Investments (Short Term
Government Income Fund)(Cost $280,510,820) – 101.7% $ 280,043,146
Other assets and liabilities, net – (1.7%) (4,665,707)TOTAL NET ASSETS – 100.0% $ 275,377,439
Security Abbreviations and Legend
IO Interest-Only Security - (Interest Tranche of Stripped MortgagePool). Rate shown is the annualized yield at the end of the period.
(A) Security purchased or sold on a when-issued or delayed deliverybasis.
(B) Security is valued using significant unobservable inputs.* Yield represents either the annualized yield at the date of purchase,
the stated coupon rate or, for floating rate securities, the rate atperiod end.
Small Cap Growth FundShares orPrincipalAmount Value
COMMON STOCKS – 95.0%Consumer discretionary – 11.2%Hotels, restaurants and leisure – 6.1%Boyd Gaming Corp. 58,000 $ 1,533,520Dave & Buster’s Entertainment, Inc. (A) 43,741 2,557,099Marriott Vacations Worldwide Corp. 28,461 3,311,722Planet Fitness, Inc., Class A 174,763 4,433,737Wingstop, Inc. (B) 78,719 2,551,283
14,387,361Internet and direct marketing retail –0.9%Wayfair, Inc., Class A (A) 31,483 2,235,608Leisure products – 0.6%Nautilus, Inc. (A) 92,257 1,508,402Specialty retail – 0.2%Five Below, Inc. (A) 9,684 460,668Textiles, apparel and luxury goods –3.4%Carter’s, Inc. 37,704 3,269,314Oxford Industries, Inc. 31,313 1,810,205Wolverine World Wide, Inc. 113,317 2,980,237
8,059,75626,651,795
Small Cap Growth Fund (continued)Shares orPrincipalAmount Value
COMMON STOCKS (continued)Consumer staples – 3.5%Beverages – 0.6%MGP Ingredients, Inc. (B) 27,123 $ 1,525,126Food and staples retailing – 1.3%Performance Food Group Company (A) 106,560 2,962,368Food products – 1.6%Blue Buffalo Pet Products, Inc. (A) 60,990 1,571,102Calavo Growers, Inc. (B) 33,571 2,254,293
3,825,3958,312,889
Energy – 1.4%Oil, gas and consumable fuels – 1.4%Centennial Resource
Development, Inc. (A) 7,474 125,926Centennial Resource Development, Inc.,
Class A (A)(B) 182,212 3,150,4453,276,371
Financials – 6.2%Banks – 5.0%FNB Corp. 202,097 2,564,611MB Financial, Inc. 81,252 3,231,392Sterling Bancorp 152,751 3,429,260Western Alliance Bancorp (A) 54,242 2,616,092
11,841,355Capital markets – 0.3%Financial Engines, Inc. (B) 18,601 614,763Mortgage real estate investment trusts– 0.9%Hannon Armstrong Sustainable
Infrastructure Capital, Inc. 94,428 2,190,73014,646,848
Health care – 23.7%Biotechnology – 11.9%Amicus Therapeutics, Inc. (A) 96,206 1,341,112Bluebird Bio, Inc. (A)(B) 18,674 2,331,449Blueprint Medicines Corp. (A) 35,450 1,922,099Exact Sciences Corp. (A) 86,261 3,613,473Five Prime Therapeutics, Inc. (A) 30,341 1,029,167Galapagos NV, ADR (A)(B) 26,343 2,436,464Global Blood Therapeutics, Inc. (A)(B) 52,106 1,584,022Ionis Pharmaceuticals, Inc. (A) 33,541 1,798,468Ironwood Pharmaceuticals, Inc. (A) 55,262 881,429MiMedx Group, Inc. (A)(B) 115,538 1,879,803Neurocrine Biosciences, Inc. (A) 24,909 1,409,849Otonomy, Inc. (A) 23,981 86,332Portola Pharmaceuticals, Inc. (A) 33,926 2,152,605Sage Therapeutics, Inc. (A) 10,256 843,556Spark Therapeutics, Inc. (A) 27,647 2,276,178TESARO, Inc. (A)(B) 13,781 1,779,678Ultragenyx Pharmaceutical, Inc. (A) 18,820 1,073,869
28,439,553Health care equipment and supplies –7.4%Align Technology, Inc. (A) 16,780 2,965,697DexCom, Inc. (A) 24,993 1,864,728Inogen, Inc. (A) 20,414 1,955,661Insulet Corp. (A) 111,543 6,476,187Nevro Corp. (A) 15,231 1,312,608OraSure Technologies, Inc. (A) 153,631 3,135,609
17,710,490
John Hancock Funds IIPortfolio of Investments — August 31, 2017 (showing percentage of total net assets)
139
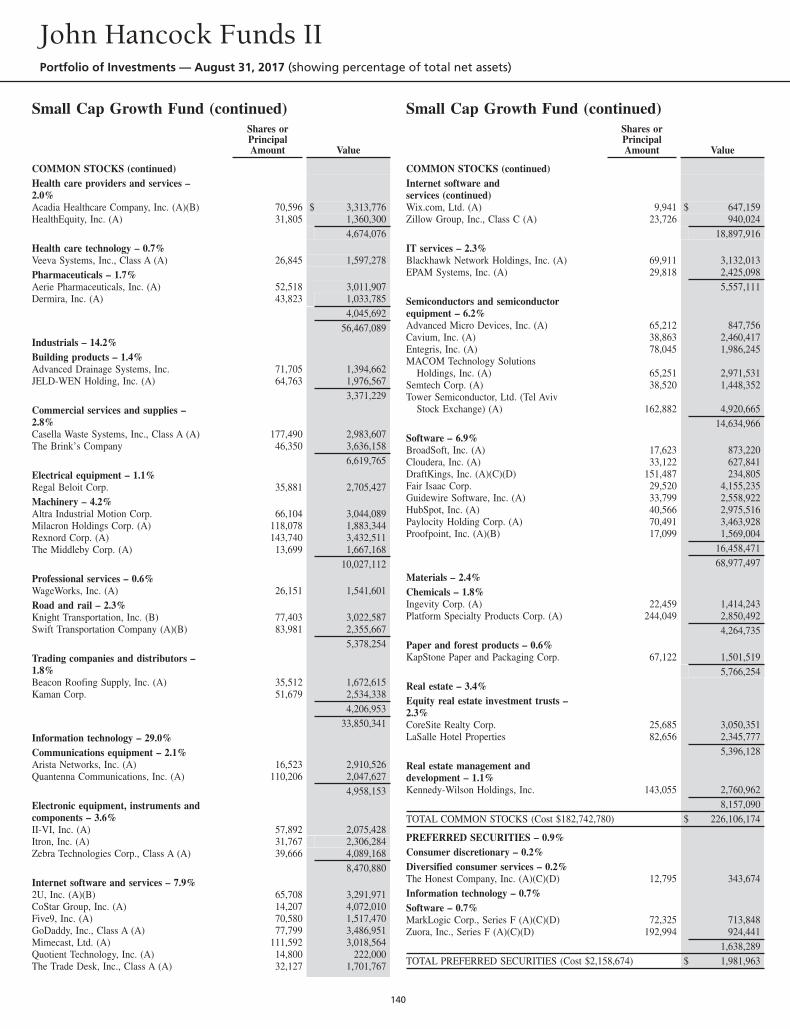
Small Cap Growth Fund (continued)Shares orPrincipalAmount Value
COMMON STOCKS (continued)Health care providers and services –2.0%Acadia Healthcare Company, Inc. (A)(B) 70,596 $ 3,313,776HealthEquity, Inc. (A) 31,805 1,360,300
4,674,076Health care technology – 0.7%Veeva Systems, Inc., Class A (A) 26,845 1,597,278Pharmaceuticals – 1.7%Aerie Pharmaceuticals, Inc. (A) 52,518 3,011,907Dermira, Inc. (A) 43,823 1,033,785
4,045,69256,467,089
Industrials – 14.2%Building products – 1.4%Advanced Drainage Systems, Inc. 71,705 1,394,662JELD-WEN Holding, Inc. (A) 64,763 1,976,567
3,371,229Commercial services and supplies –2.8%Casella Waste Systems, Inc., Class A (A) 177,490 2,983,607The Brink’s Company 46,350 3,636,158
6,619,765Electrical equipment – 1.1%Regal Beloit Corp. 35,881 2,705,427Machinery – 4.2%Altra Industrial Motion Corp. 66,104 3,044,089Milacron Holdings Corp. (A) 118,078 1,883,344Rexnord Corp. (A) 143,740 3,432,511The Middleby Corp. (A) 13,699 1,667,168
10,027,112Professional services – 0.6%WageWorks, Inc. (A) 26,151 1,541,601Road and rail – 2.3%Knight Transportation, Inc. (B) 77,403 3,022,587Swift Transportation Company (A)(B) 83,981 2,355,667
5,378,254Trading companies and distributors –1.8%Beacon Roofing Supply, Inc. (A) 35,512 1,672,615Kaman Corp. 51,679 2,534,338
4,206,95333,850,341
Information technology – 29.0%Communications equipment – 2.1%Arista Networks, Inc. (A) 16,523 2,910,526Quantenna Communications, Inc. (A) 110,206 2,047,627
4,958,153Electronic equipment, instruments andcomponents – 3.6%II-VI, Inc. (A) 57,892 2,075,428Itron, Inc. (A) 31,767 2,306,284Zebra Technologies Corp., Class A (A) 39,666 4,089,168
8,470,880Internet software and services – 7.9%2U, Inc. (A)(B) 65,708 3,291,971CoStar Group, Inc. (A) 14,207 4,072,010Five9, Inc. (A) 70,580 1,517,470GoDaddy, Inc., Class A (A) 77,799 3,486,951Mimecast, Ltd. (A) 111,592 3,018,564Quotient Technology, Inc. (A) 14,800 222,000The Trade Desk, Inc., Class A (A) 32,127 1,701,767
Small Cap Growth Fund (continued)Shares orPrincipalAmount Value
COMMON STOCKS (continued)Internet software andservices (continued)Wix.com, Ltd. (A) 9,941 $ 647,159Zillow Group, Inc., Class C (A) 23,726 940,024
18,897,916IT services – 2.3%Blackhawk Network Holdings, Inc. (A) 69,911 3,132,013EPAM Systems, Inc. (A) 29,818 2,425,098
5,557,111Semiconductors and semiconductorequipment – 6.2%Advanced Micro Devices, Inc. (A) 65,212 847,756Cavium, Inc. (A) 38,863 2,460,417Entegris, Inc. (A) 78,045 1,986,245MACOM Technology Solutions
Holdings, Inc. (A) 65,251 2,971,531Semtech Corp. (A) 38,520 1,448,352Tower Semiconductor, Ltd. (Tel Aviv
Stock Exchange) (A) 162,882 4,920,66514,634,966
Software – 6.9%BroadSoft, Inc. (A) 17,623 873,220Cloudera, Inc. (A) 33,122 627,841DraftKings, Inc. (A)(C)(D) 151,487 234,805Fair Isaac Corp. 29,520 4,155,235Guidewire Software, Inc. (A) 33,799 2,558,922HubSpot, Inc. (A) 40,566 2,975,516Paylocity Holding Corp. (A) 70,491 3,463,928Proofpoint, Inc. (A)(B) 17,099 1,569,004
16,458,47168,977,497
Materials – 2.4%Chemicals – 1.8%Ingevity Corp. (A) 22,459 1,414,243Platform Specialty Products Corp. (A) 244,049 2,850,492
4,264,735Paper and forest products – 0.6%KapStone Paper and Packaging Corp. 67,122 1,501,519
5,766,254Real estate – 3.4%Equity real estate investment trusts –2.3%CoreSite Realty Corp. 25,685 3,050,351LaSalle Hotel Properties 82,656 2,345,777
5,396,128Real estate management anddevelopment – 1.1%Kennedy-Wilson Holdings, Inc. 143,055 2,760,962
8,157,090TOTAL COMMON STOCKS (Cost $182,742,780) $ 226,106,174
PREFERRED SECURITIES – 0.9%Consumer discretionary – 0.2%Diversified consumer services – 0.2%The Honest Company, Inc. (A)(C)(D) 12,795 343,674Information technology – 0.7%Software – 0.7%MarkLogic Corp., Series F (A)(C)(D) 72,325 713,848Zuora, Inc., Series F (A)(C)(D) 192,994 924,441
1,638,289TOTAL PREFERRED SECURITIES (Cost $2,158,674) $ 1,981,963
John Hancock Funds IIPortfolio of Investments — August 31, 2017 (showing percentage of total net assets)
140
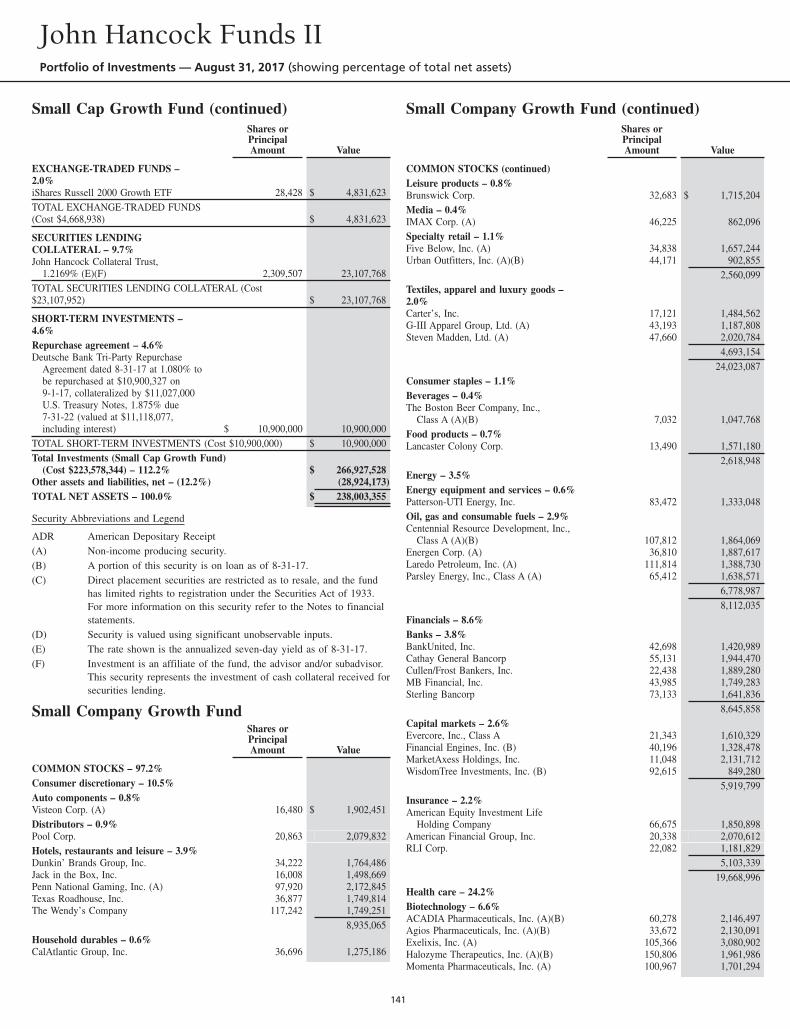
Small Cap Growth Fund (continued)Shares orPrincipalAmount Value
EXCHANGE-TRADED FUNDS –2.0%iShares Russell 2000 Growth ETF 28,428 $ 4,831,623TOTAL EXCHANGE-TRADED FUNDS(Cost $4,668,938) $ 4,831,623
SECURITIES LENDINGCOLLATERAL – 9.7%John Hancock Collateral Trust,
1.2169% (E)(F) 2,309,507 23,107,768TOTAL SECURITIES LENDING COLLATERAL (Cost$23,107,952) $ 23,107,768
SHORT-TERM INVESTMENTS –4.6%Repurchase agreement – 4.6%Deutsche Bank Tri-Party Repurchase
Agreement dated 8-31-17 at 1.080% tobe repurchased at $10,900,327 on9-1-17, collateralized by $11,027,000U.S. Treasury Notes, 1.875% due7-31-22 (valued at $11,118,077,including interest) $ 10,900,000 10,900,000
TOTAL SHORT-TERM INVESTMENTS (Cost $10,900,000) $ 10,900,000Total Investments (Small Cap Growth Fund)
(Cost $223,578,344) – 112.2% $ 266,927,528Other assets and liabilities, net – (12.2%) (28,924,173)TOTAL NET ASSETS – 100.0% $ 238,003,355
Security Abbreviations and Legend
ADR American Depositary Receipt(A) Non-income producing security.(B) A portion of this security is on loan as of 8-31-17.(C) Direct placement securities are restricted as to resale, and the fund
has limited rights to registration under the Securities Act of 1933.For more information on this security refer to the Notes to financialstatements.
(D) Security is valued using significant unobservable inputs.(E) The rate shown is the annualized seven-day yield as of 8-31-17.(F) Investment is an affiliate of the fund, the advisor and/or subadvisor.
This security represents the investment of cash collateral received forsecurities lending.
Small Company Growth FundShares orPrincipalAmount Value
COMMON STOCKS – 97.2%Consumer discretionary – 10.5%Auto components – 0.8%Visteon Corp. (A) 16,480 $ 1,902,451Distributors – 0.9%Pool Corp. 20,863 2,079,832Hotels, restaurants and leisure – 3.9%Dunkin’ Brands Group, Inc. 34,222 1,764,486Jack in the Box, Inc. 16,008 1,498,669Penn National Gaming, Inc. (A) 97,920 2,172,845Texas Roadhouse, Inc. 36,877 1,749,814The Wendy’s Company 117,242 1,749,251
8,935,065Household durables – 0.6%CalAtlantic Group, Inc. 36,696 1,275,186
Small Company Growth Fund (continued)Shares orPrincipalAmount Value
COMMON STOCKS (continued)Leisure products – 0.8%Brunswick Corp. 32,683 $ 1,715,204Media – 0.4%IMAX Corp. (A) 46,225 862,096Specialty retail – 1.1%Five Below, Inc. (A) 34,838 1,657,244Urban Outfitters, Inc. (A)(B) 44,171 902,855
2,560,099Textiles, apparel and luxury goods –2.0%Carter’s, Inc. 17,121 1,484,562G-III Apparel Group, Ltd. (A) 43,193 1,187,808Steven Madden, Ltd. (A) 47,660 2,020,784
4,693,15424,023,087
Consumer staples – 1.1%Beverages – 0.4%The Boston Beer Company, Inc.,
Class A (A)(B) 7,032 1,047,768Food products – 0.7%Lancaster Colony Corp. 13,490 1,571,180
2,618,948Energy – 3.5%Energy equipment and services – 0.6%Patterson-UTI Energy, Inc. 83,472 1,333,048Oil, gas and consumable fuels – 2.9%Centennial Resource Development, Inc.,
Class A (A)(B) 107,812 1,864,069Energen Corp. (A) 36,810 1,887,617Laredo Petroleum, Inc. (A) 111,814 1,388,730Parsley Energy, Inc., Class A (A) 65,412 1,638,571
6,778,9878,112,035
Financials – 8.6%Banks – 3.8%BankUnited, Inc. 42,698 1,420,989Cathay General Bancorp 55,131 1,944,470Cullen/Frost Bankers, Inc. 22,438 1,889,280MB Financial, Inc. 43,985 1,749,283Sterling Bancorp 73,133 1,641,836
8,645,858Capital markets – 2.6%Evercore, Inc., Class A 21,343 1,610,329Financial Engines, Inc. (B) 40,196 1,328,478MarketAxess Holdings, Inc. 11,048 2,131,712WisdomTree Investments, Inc. (B) 92,615 849,280
5,919,799Insurance – 2.2%American Equity Investment Life
Holding Company 66,675 1,850,898American Financial Group, Inc. 20,338 2,070,612RLI Corp. 22,082 1,181,829
5,103,33919,668,996
Health care – 24.2%Biotechnology – 6.6%ACADIA Pharmaceuticals, Inc. (A)(B) 60,278 2,146,497Agios Pharmaceuticals, Inc. (A)(B) 33,672 2,130,091Exelixis, Inc. (A) 105,366 3,080,902Halozyme Therapeutics, Inc. (A)(B) 150,806 1,961,986Momenta Pharmaceuticals, Inc. (A) 100,967 1,701,294
John Hancock Funds IIPortfolio of Investments — August 31, 2017 (showing percentage of total net assets)
141
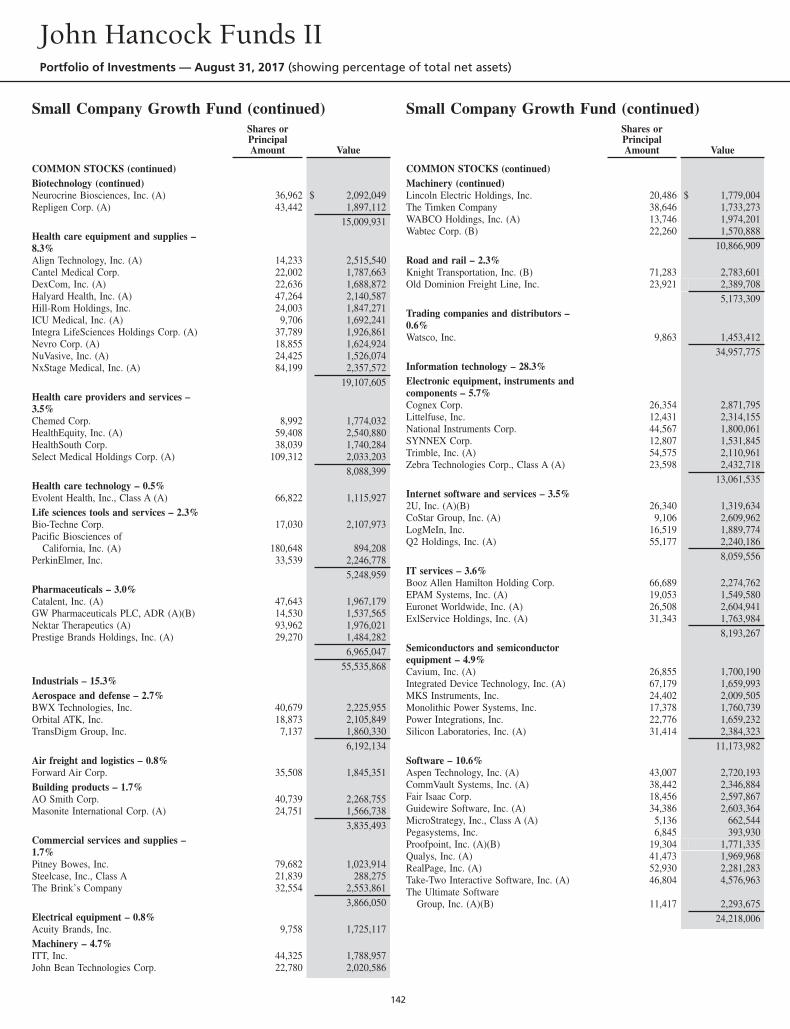
Small Company Growth Fund (continued)Shares orPrincipalAmount Value
COMMON STOCKS (continued)Biotechnology (continued)Neurocrine Biosciences, Inc. (A) 36,962 $ 2,092,049Repligen Corp. (A) 43,442 1,897,112
15,009,931Health care equipment and supplies –8.3%Align Technology, Inc. (A) 14,233 2,515,540Cantel Medical Corp. 22,002 1,787,663DexCom, Inc. (A) 22,636 1,688,872Halyard Health, Inc. (A) 47,264 2,140,587Hill-Rom Holdings, Inc. 24,003 1,847,271ICU Medical, Inc. (A) 9,706 1,692,241Integra LifeSciences Holdings Corp. (A) 37,789 1,926,861Nevro Corp. (A) 18,855 1,624,924NuVasive, Inc. (A) 24,425 1,526,074NxStage Medical, Inc. (A) 84,199 2,357,572
19,107,605Health care providers and services –3.5%Chemed Corp. 8,992 1,774,032HealthEquity, Inc. (A) 59,408 2,540,880HealthSouth Corp. 38,039 1,740,284Select Medical Holdings Corp. (A) 109,312 2,033,203
8,088,399Health care technology – 0.5%Evolent Health, Inc., Class A (A) 66,822 1,115,927Life sciences tools and services – 2.3%Bio-Techne Corp. 17,030 2,107,973Pacific Biosciences of
California, Inc. (A) 180,648 894,208PerkinElmer, Inc. 33,539 2,246,778
5,248,959Pharmaceuticals – 3.0%Catalent, Inc. (A) 47,643 1,967,179GW Pharmaceuticals PLC, ADR (A)(B) 14,530 1,537,565Nektar Therapeutics (A) 93,962 1,976,021Prestige Brands Holdings, Inc. (A) 29,270 1,484,282
6,965,04755,535,868
Industrials – 15.3%Aerospace and defense – 2.7%BWX Technologies, Inc. 40,679 2,225,955Orbital ATK, Inc. 18,873 2,105,849TransDigm Group, Inc. 7,137 1,860,330
6,192,134Air freight and logistics – 0.8%Forward Air Corp. 35,508 1,845,351Building products – 1.7%AO Smith Corp. 40,739 2,268,755Masonite International Corp. (A) 24,751 1,566,738
3,835,493Commercial services and supplies –1.7%Pitney Bowes, Inc. 79,682 1,023,914Steelcase, Inc., Class A 21,839 288,275The Brink’s Company 32,554 2,553,861
3,866,050Electrical equipment – 0.8%Acuity Brands, Inc. 9,758 1,725,117Machinery – 4.7%ITT, Inc. 44,325 1,788,957John Bean Technologies Corp. 22,780 2,020,586
Small Company Growth Fund (continued)Shares orPrincipalAmount Value
COMMON STOCKS (continued)Machinery (continued)Lincoln Electric Holdings, Inc. 20,486 $ 1,779,004The Timken Company 38,646 1,733,273WABCO Holdings, Inc. (A) 13,746 1,974,201Wabtec Corp. (B) 22,260 1,570,888
10,866,909Road and rail – 2.3%Knight Transportation, Inc. (B) 71,283 2,783,601Old Dominion Freight Line, Inc. 23,921 2,389,708
5,173,309Trading companies and distributors –0.6%Watsco, Inc. 9,863 1,453,412
34,957,775Information technology – 28.3%Electronic equipment, instruments andcomponents – 5.7%Cognex Corp. 26,354 2,871,795Littelfuse, Inc. 12,431 2,314,155National Instruments Corp. 44,567 1,800,061SYNNEX Corp. 12,807 1,531,845Trimble, Inc. (A) 54,575 2,110,961Zebra Technologies Corp., Class A (A) 23,598 2,432,718
13,061,535Internet software and services – 3.5%2U, Inc. (A)(B) 26,340 1,319,634CoStar Group, Inc. (A) 9,106 2,609,962LogMeIn, Inc. 16,519 1,889,774Q2 Holdings, Inc. (A) 55,177 2,240,186
8,059,556IT services – 3.6%Booz Allen Hamilton Holding Corp. 66,689 2,274,762EPAM Systems, Inc. (A) 19,053 1,549,580Euronet Worldwide, Inc. (A) 26,508 2,604,941ExlService Holdings, Inc. (A) 31,343 1,763,984
8,193,267Semiconductors and semiconductorequipment – 4.9%Cavium, Inc. (A) 26,855 1,700,190Integrated Device Technology, Inc. (A) 67,179 1,659,993MKS Instruments, Inc. 24,402 2,009,505Monolithic Power Systems, Inc. 17,378 1,760,739Power Integrations, Inc. 22,776 1,659,232Silicon Laboratories, Inc. (A) 31,414 2,384,323
11,173,982Software – 10.6%Aspen Technology, Inc. (A) 43,007 2,720,193CommVault Systems, Inc. (A) 38,442 2,346,884Fair Isaac Corp. 18,456 2,597,867Guidewire Software, Inc. (A) 34,386 2,603,364MicroStrategy, Inc., Class A (A) 5,136 662,544Pegasystems, Inc. 6,845 393,930Proofpoint, Inc. (A)(B) 19,304 1,771,335Qualys, Inc. (A) 41,473 1,969,968RealPage, Inc. (A) 52,930 2,281,283Take-Two Interactive Software, Inc. (A) 46,804 4,576,963The Ultimate Software
Group, Inc. (A)(B) 11,417 2,293,67524,218,006
John Hancock Funds IIPortfolio of Investments — August 31, 2017 (showing percentage of total net assets)
142
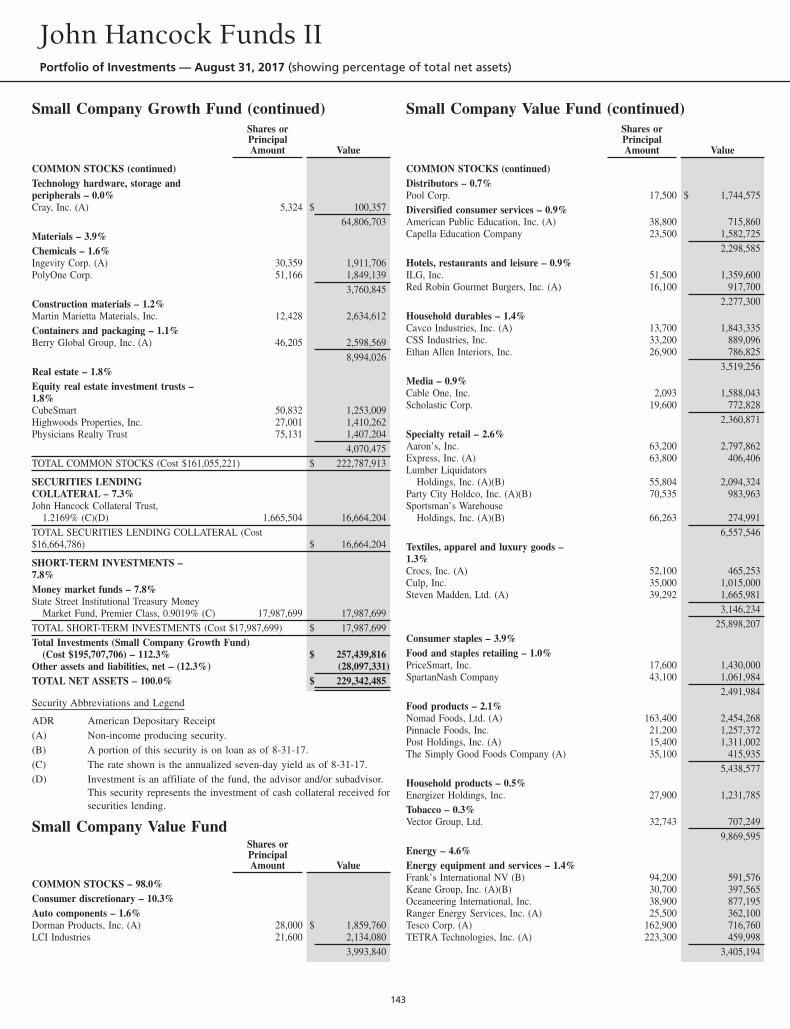
Small Company Growth Fund (continued)Shares orPrincipalAmount Value
COMMON STOCKS (continued)Technology hardware, storage andperipherals – 0.0%Cray, Inc. (A) 5,324 $ 100,357
64,806,703Materials – 3.9%Chemicals – 1.6%Ingevity Corp. (A) 30,359 1,911,706PolyOne Corp. 51,166 1,849,139
3,760,845Construction materials – 1.2%Martin Marietta Materials, Inc. 12,428 2,634,612Containers and packaging – 1.1%Berry Global Group, Inc. (A) 46,205 2,598,569
8,994,026Real estate – 1.8%Equity real estate investment trusts –1.8%CubeSmart 50,832 1,253,009Highwoods Properties, Inc. 27,001 1,410,262Physicians Realty Trust 75,131 1,407,204
4,070,475TOTAL COMMON STOCKS (Cost $161,055,221) $ 222,787,913
SECURITIES LENDINGCOLLATERAL – 7.3%John Hancock Collateral Trust,
1.2169% (C)(D) 1,665,504 16,664,204TOTAL SECURITIES LENDING COLLATERAL (Cost$16,664,786) $ 16,664,204
SHORT-TERM INVESTMENTS –7.8%Money market funds – 7.8%State Street Institutional Treasury Money
Market Fund, Premier Class, 0.9019% (C) 17,987,699 17,987,699TOTAL SHORT-TERM INVESTMENTS (Cost $17,987,699) $ 17,987,699Total Investments (Small Company Growth Fund)
(Cost $195,707,706) – 112.3% $ 257,439,816Other assets and liabilities, net – (12.3%) (28,097,331)TOTAL NET ASSETS – 100.0% $ 229,342,485
Security Abbreviations and Legend
ADR American Depositary Receipt(A) Non-income producing security.(B) A portion of this security is on loan as of 8-31-17.(C) The rate shown is the annualized seven-day yield as of 8-31-17.(D) Investment is an affiliate of the fund, the advisor and/or subadvisor.
This security represents the investment of cash collateral received forsecurities lending.
Small Company Value FundShares orPrincipalAmount Value
COMMON STOCKS – 98.0%Consumer discretionary – 10.3%Auto components – 1.6%Dorman Products, Inc. (A) 28,000 $ 1,859,760LCI Industries 21,600 2,134,080
3,993,840
Small Company Value Fund (continued)Shares orPrincipalAmount Value
COMMON STOCKS (continued)Distributors – 0.7%Pool Corp. 17,500 $ 1,744,575Diversified consumer services – 0.9%American Public Education, Inc. (A) 38,800 715,860Capella Education Company 23,500 1,582,725
2,298,585Hotels, restaurants and leisure – 0.9%ILG, Inc. 51,500 1,359,600Red Robin Gourmet Burgers, Inc. (A) 16,100 917,700
2,277,300Household durables – 1.4%Cavco Industries, Inc. (A) 13,700 1,843,335CSS Industries, Inc. 33,200 889,096Ethan Allen Interiors, Inc. 26,900 786,825
3,519,256Media – 0.9%Cable One, Inc. 2,093 1,588,043Scholastic Corp. 19,600 772,828
2,360,871Specialty retail – 2.6%Aaron’s, Inc. 63,200 2,797,862Express, Inc. (A) 63,800 406,406Lumber Liquidators
Holdings, Inc. (A)(B) 55,804 2,094,324Party City Holdco, Inc. (A)(B) 70,535 983,963Sportsman’s Warehouse
Holdings, Inc. (A)(B) 66,263 274,9916,557,546
Textiles, apparel and luxury goods –1.3%Crocs, Inc. (A) 52,100 465,253Culp, Inc. 35,000 1,015,000Steven Madden, Ltd. (A) 39,292 1,665,981
3,146,23425,898,207
Consumer staples – 3.9%Food and staples retailing – 1.0%PriceSmart, Inc. 17,600 1,430,000SpartanNash Company 43,100 1,061,984
2,491,984Food products – 2.1%Nomad Foods, Ltd. (A) 163,400 2,454,268Pinnacle Foods, Inc. 21,200 1,257,372Post Holdings, Inc. (A) 15,400 1,311,002The Simply Good Foods Company (A) 35,100 415,935
5,438,577Household products – 0.5%Energizer Holdings, Inc. 27,900 1,231,785Tobacco – 0.3%Vector Group, Ltd. 32,743 707,249
9,869,595Energy – 4.6%Energy equipment and services – 1.4%Frank’s International NV (B) 94,200 591,576Keane Group, Inc. (A)(B) 30,700 397,565Oceaneering International, Inc. 38,900 877,195Ranger Energy Services, Inc. (A) 25,500 362,100Tesco Corp. (A) 162,900 716,760TETRA Technologies, Inc. (A) 223,300 459,998
3,405,194
John Hancock Funds IIPortfolio of Investments — August 31, 2017 (showing percentage of total net assets)
143
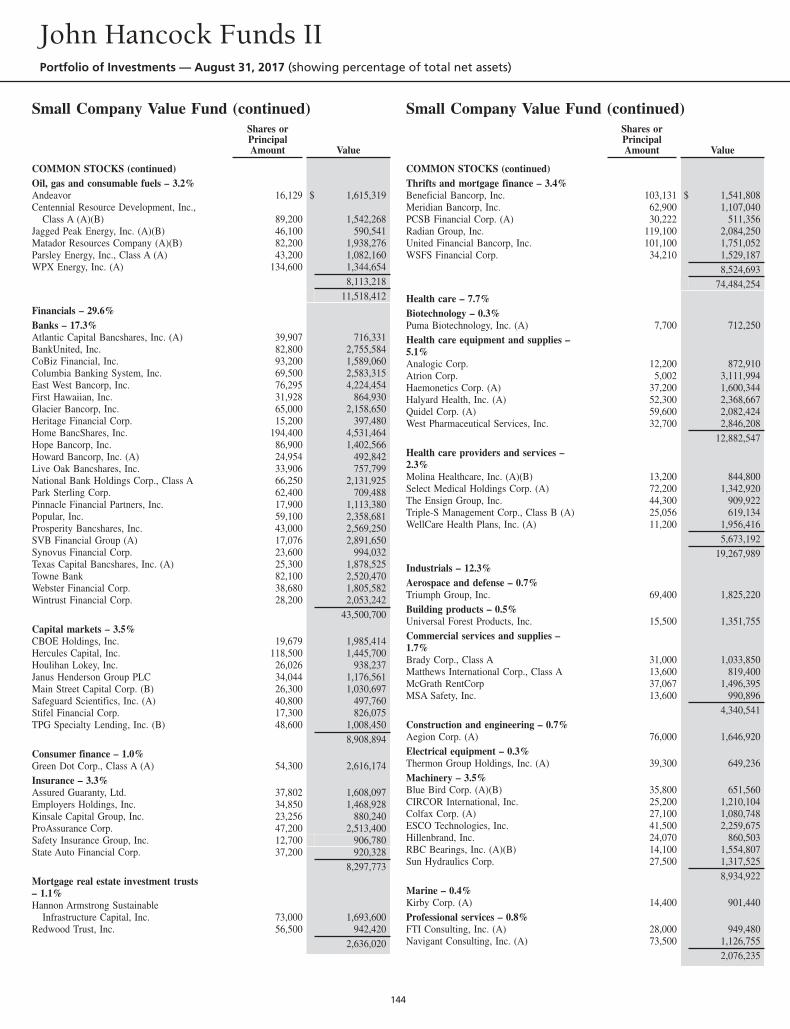
Small Company Value Fund (continued)Shares orPrincipalAmount Value
COMMON STOCKS (continued)Oil, gas and consumable fuels – 3.2%Andeavor 16,129 $ 1,615,319Centennial Resource Development, Inc.,
Class A (A)(B) 89,200 1,542,268Jagged Peak Energy, Inc. (A)(B) 46,100 590,541Matador Resources Company (A)(B) 82,200 1,938,276Parsley Energy, Inc., Class A (A) 43,200 1,082,160WPX Energy, Inc. (A) 134,600 1,344,654
8,113,21811,518,412
Financials – 29.6%Banks – 17.3%Atlantic Capital Bancshares, Inc. (A) 39,907 716,331BankUnited, Inc. 82,800 2,755,584CoBiz Financial, Inc. 93,200 1,589,060Columbia Banking System, Inc. 69,500 2,583,315East West Bancorp, Inc. 76,295 4,224,454First Hawaiian, Inc. 31,928 864,930Glacier Bancorp, Inc. 65,000 2,158,650Heritage Financial Corp. 15,200 397,480Home BancShares, Inc. 194,400 4,531,464Hope Bancorp, Inc. 86,900 1,402,566Howard Bancorp, Inc. (A) 24,954 492,842Live Oak Bancshares, Inc. 33,906 757,799National Bank Holdings Corp., Class A 66,250 2,131,925Park Sterling Corp. 62,400 709,488Pinnacle Financial Partners, Inc. 17,900 1,113,380Popular, Inc. 59,100 2,358,681Prosperity Bancshares, Inc. 43,000 2,569,250SVB Financial Group (A) 17,076 2,891,650Synovus Financial Corp. 23,600 994,032Texas Capital Bancshares, Inc. (A) 25,300 1,878,525Towne Bank 82,100 2,520,470Webster Financial Corp. 38,680 1,805,582Wintrust Financial Corp. 28,200 2,053,242
43,500,700Capital markets – 3.5%CBOE Holdings, Inc. 19,679 1,985,414Hercules Capital, Inc. 118,500 1,445,700Houlihan Lokey, Inc. 26,026 938,237Janus Henderson Group PLC 34,044 1,176,561Main Street Capital Corp. (B) 26,300 1,030,697Safeguard Scientifics, Inc. (A) 40,800 497,760Stifel Financial Corp. 17,300 826,075TPG Specialty Lending, Inc. (B) 48,600 1,008,450
8,908,894Consumer finance – 1.0%Green Dot Corp., Class A (A) 54,300 2,616,174Insurance – 3.3%Assured Guaranty, Ltd. 37,802 1,608,097Employers Holdings, Inc. 34,850 1,468,928Kinsale Capital Group, Inc. 23,256 880,240ProAssurance Corp. 47,200 2,513,400Safety Insurance Group, Inc. 12,700 906,780State Auto Financial Corp. 37,200 920,328
8,297,773Mortgage real estate investment trusts– 1.1%Hannon Armstrong Sustainable
Infrastructure Capital, Inc. 73,000 1,693,600Redwood Trust, Inc. 56,500 942,420
2,636,020
Small Company Value Fund (continued)Shares orPrincipalAmount Value
COMMON STOCKS (continued)Thrifts and mortgage finance – 3.4%Beneficial Bancorp, Inc. 103,131 $ 1,541,808Meridian Bancorp, Inc. 62,900 1,107,040PCSB Financial Corp. (A) 30,222 511,356Radian Group, Inc. 119,100 2,084,250United Financial Bancorp, Inc. 101,100 1,751,052WSFS Financial Corp. 34,210 1,529,187
8,524,69374,484,254
Health care – 7.7%Biotechnology – 0.3%Puma Biotechnology, Inc. (A) 7,700 712,250Health care equipment and supplies –5.1%Analogic Corp. 12,200 872,910Atrion Corp. 5,002 3,111,994Haemonetics Corp. (A) 37,200 1,600,344Halyard Health, Inc. (A) 52,300 2,368,667Quidel Corp. (A) 59,600 2,082,424West Pharmaceutical Services, Inc. 32,700 2,846,208
12,882,547Health care providers and services –2.3%Molina Healthcare, Inc. (A)(B) 13,200 844,800Select Medical Holdings Corp. (A) 72,200 1,342,920The Ensign Group, Inc. 44,300 909,922Triple-S Management Corp., Class B (A) 25,056 619,134WellCare Health Plans, Inc. (A) 11,200 1,956,416
5,673,19219,267,989
Industrials – 12.3%Aerospace and defense – 0.7%Triumph Group, Inc. 69,400 1,825,220Building products – 0.5%Universal Forest Products, Inc. 15,500 1,351,755Commercial services and supplies –1.7%Brady Corp., Class A 31,000 1,033,850Matthews International Corp., Class A 13,600 819,400McGrath RentCorp 37,067 1,496,395MSA Safety, Inc. 13,600 990,896
4,340,541Construction and engineering – 0.7%Aegion Corp. (A) 76,000 1,646,920Electrical equipment – 0.3%Thermon Group Holdings, Inc. (A) 39,300 649,236Machinery – 3.5%Blue Bird Corp. (A)(B) 35,800 651,560CIRCOR International, Inc. 25,200 1,210,104Colfax Corp. (A) 27,100 1,080,748ESCO Technologies, Inc. 41,500 2,259,675Hillenbrand, Inc. 24,070 860,503RBC Bearings, Inc. (A)(B) 14,100 1,554,807Sun Hydraulics Corp. 27,500 1,317,525
8,934,922Marine – 0.4%Kirby Corp. (A) 14,400 901,440Professional services – 0.8%FTI Consulting, Inc. (A) 28,000 949,480Navigant Consulting, Inc. (A) 73,500 1,126,755
2,076,235
John Hancock Funds IIPortfolio of Investments — August 31, 2017 (showing percentage of total net assets)
144
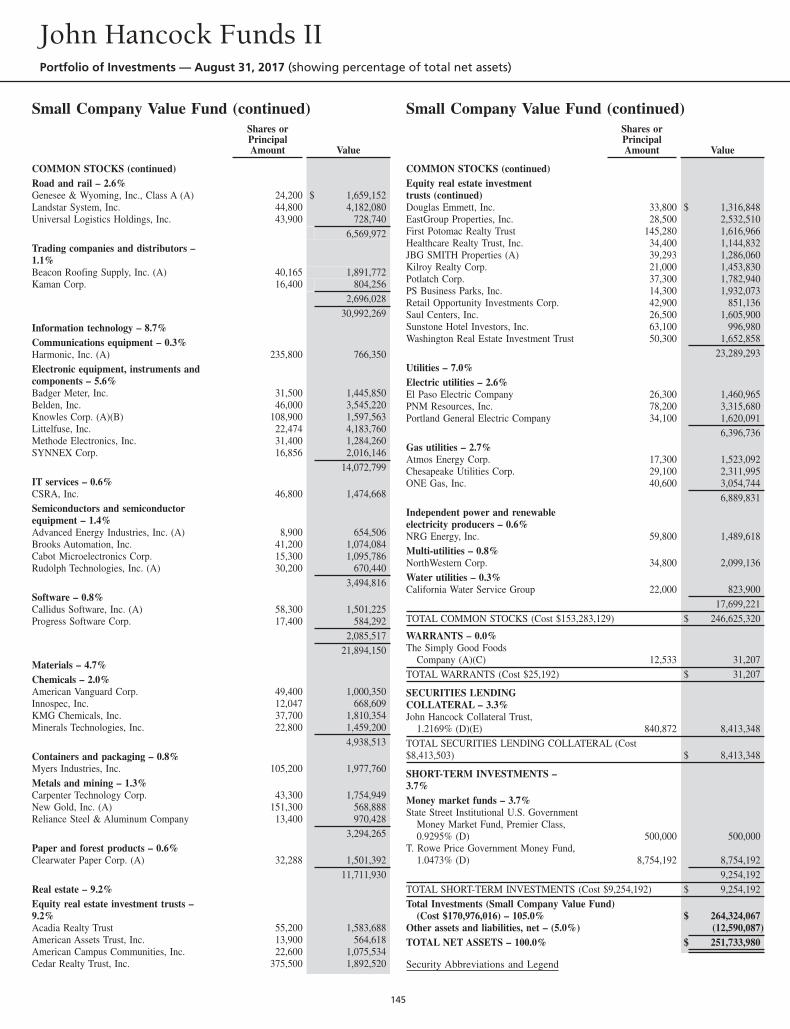
Small Company Value Fund (continued)Shares orPrincipalAmount Value
COMMON STOCKS (continued)Road and rail – 2.6%Genesee & Wyoming, Inc., Class A (A) 24,200 $ 1,659,152Landstar System, Inc. 44,800 4,182,080Universal Logistics Holdings, Inc. 43,900 728,740
6,569,972Trading companies and distributors –1.1%Beacon Roofing Supply, Inc. (A) 40,165 1,891,772Kaman Corp. 16,400 804,256
2,696,02830,992,269
Information technology – 8.7%Communications equipment – 0.3%Harmonic, Inc. (A) 235,800 766,350Electronic equipment, instruments andcomponents – 5.6%Badger Meter, Inc. 31,500 1,445,850Belden, Inc. 46,000 3,545,220Knowles Corp. (A)(B) 108,900 1,597,563Littelfuse, Inc. 22,474 4,183,760Methode Electronics, Inc. 31,400 1,284,260SYNNEX Corp. 16,856 2,016,146
14,072,799IT services – 0.6%CSRA, Inc. 46,800 1,474,668Semiconductors and semiconductorequipment – 1.4%Advanced Energy Industries, Inc. (A) 8,900 654,506Brooks Automation, Inc. 41,200 1,074,084Cabot Microelectronics Corp. 15,300 1,095,786Rudolph Technologies, Inc. (A) 30,200 670,440
3,494,816Software – 0.8%Callidus Software, Inc. (A) 58,300 1,501,225Progress Software Corp. 17,400 584,292
2,085,51721,894,150
Materials – 4.7%Chemicals – 2.0%American Vanguard Corp. 49,400 1,000,350Innospec, Inc. 12,047 668,609KMG Chemicals, Inc. 37,700 1,810,354Minerals Technologies, Inc. 22,800 1,459,200
4,938,513Containers and packaging – 0.8%Myers Industries, Inc. 105,200 1,977,760Metals and mining – 1.3%Carpenter Technology Corp. 43,300 1,754,949New Gold, Inc. (A) 151,300 568,888Reliance Steel & Aluminum Company 13,400 970,428
3,294,265Paper and forest products – 0.6%Clearwater Paper Corp. (A) 32,288 1,501,392
11,711,930Real estate – 9.2%Equity real estate investment trusts –9.2%Acadia Realty Trust 55,200 1,583,688American Assets Trust, Inc. 13,900 564,618American Campus Communities, Inc. 22,600 1,075,534Cedar Realty Trust, Inc. 375,500 1,892,520
Small Company Value Fund (continued)Shares orPrincipalAmount Value
COMMON STOCKS (continued)Equity real estate investmenttrusts (continued)Douglas Emmett, Inc. 33,800 $ 1,316,848EastGroup Properties, Inc. 28,500 2,532,510First Potomac Realty Trust 145,280 1,616,966Healthcare Realty Trust, Inc. 34,400 1,144,832JBG SMITH Properties (A) 39,293 1,286,060Kilroy Realty Corp. 21,000 1,453,830Potlatch Corp. 37,300 1,782,940PS Business Parks, Inc. 14,300 1,932,073Retail Opportunity Investments Corp. 42,900 851,136Saul Centers, Inc. 26,500 1,605,900Sunstone Hotel Investors, Inc. 63,100 996,980Washington Real Estate Investment Trust 50,300 1,652,858
23,289,293Utilities – 7.0%Electric utilities – 2.6%El Paso Electric Company 26,300 1,460,965PNM Resources, Inc. 78,200 3,315,680Portland General Electric Company 34,100 1,620,091
6,396,736Gas utilities – 2.7%Atmos Energy Corp. 17,300 1,523,092Chesapeake Utilities Corp. 29,100 2,311,995ONE Gas, Inc. 40,600 3,054,744
6,889,831Independent power and renewableelectricity producers – 0.6%NRG Energy, Inc. 59,800 1,489,618Multi-utilities – 0.8%NorthWestern Corp. 34,800 2,099,136Water utilities – 0.3%California Water Service Group 22,000 823,900
17,699,221TOTAL COMMON STOCKS (Cost $153,283,129) $ 246,625,320
WARRANTS – 0.0%The Simply Good Foods
Company (A)(C) 12,533 31,207TOTAL WARRANTS (Cost $25,192) $ 31,207
SECURITIES LENDINGCOLLATERAL – 3.3%John Hancock Collateral Trust,
1.2169% (D)(E) 840,872 8,413,348TOTAL SECURITIES LENDING COLLATERAL (Cost$8,413,503) $ 8,413,348
SHORT-TERM INVESTMENTS –3.7%Money market funds – 3.7%State Street Institutional U.S. Government
Money Market Fund, Premier Class,0.9295% (D) 500,000 500,000
T. Rowe Price Government Money Fund,1.0473% (D) 8,754,192 8,754,192
9,254,192TOTAL SHORT-TERM INVESTMENTS (Cost $9,254,192) $ 9,254,192Total Investments (Small Company Value Fund)
(Cost $170,976,016) – 105.0% $ 264,324,067Other assets and liabilities, net – (5.0%) (12,590,087)TOTAL NET ASSETS – 100.0% $ 251,733,980
Security Abbreviations and Legend
John Hancock Funds IIPortfolio of Investments — August 31, 2017 (showing percentage of total net assets)
145
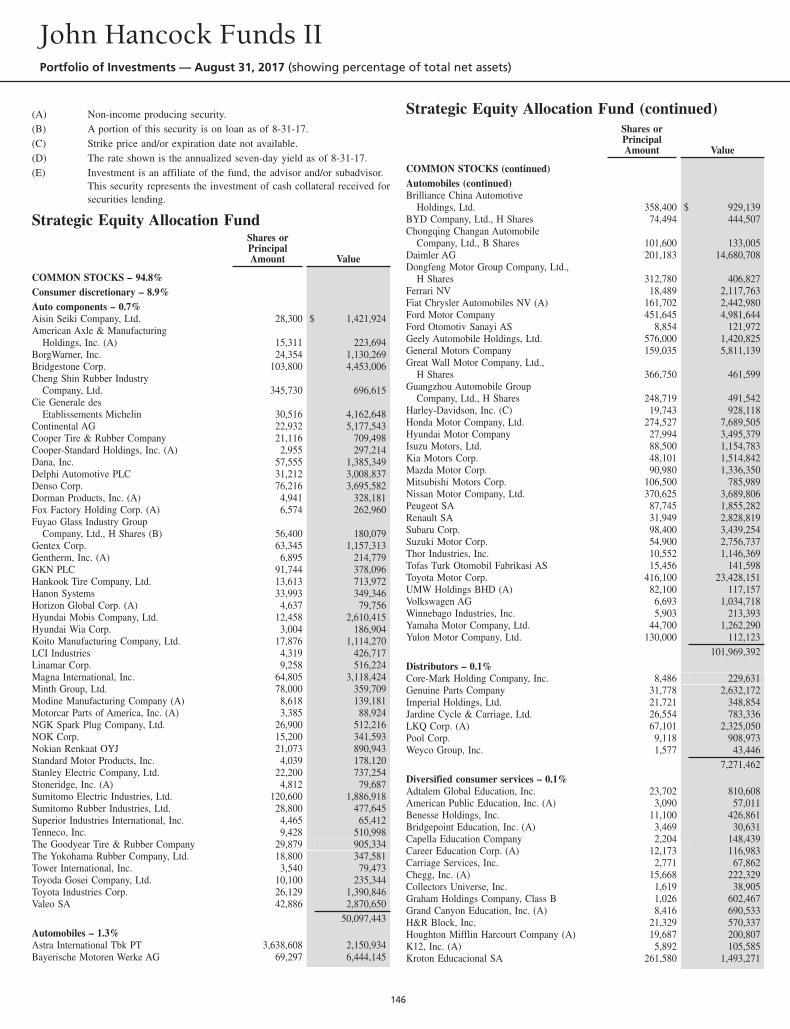
(A) Non-income producing security.(B) A portion of this security is on loan as of 8-31-17.(C) Strike price and/or expiration date not available.(D) The rate shown is the annualized seven-day yield as of 8-31-17.(E) Investment is an affiliate of the fund, the advisor and/or subadvisor.
This security represents the investment of cash collateral received forsecurities lending.
Strategic Equity Allocation FundShares orPrincipalAmount Value
COMMON STOCKS – 94.8%Consumer discretionary – 8.9%Auto components – 0.7%Aisin Seiki Company, Ltd. 28,300 $ 1,421,924American Axle & Manufacturing
Holdings, Inc. (A) 15,311 223,694BorgWarner, Inc. 24,354 1,130,269Bridgestone Corp. 103,800 4,453,006Cheng Shin Rubber Industry
Company, Ltd. 345,730 696,615Cie Generale des
Etablissements Michelin 30,516 4,162,648Continental AG 22,932 5,177,543Cooper Tire & Rubber Company 21,116 709,498Cooper-Standard Holdings, Inc. (A) 2,955 297,214Dana, Inc. 57,555 1,385,349Delphi Automotive PLC 31,212 3,008,837Denso Corp. 76,216 3,695,582Dorman Products, Inc. (A) 4,941 328,181Fox Factory Holding Corp. (A) 6,574 262,960Fuyao Glass Industry Group
Company, Ltd., H Shares (B) 56,400 180,079Gentex Corp. 63,345 1,157,313Gentherm, Inc. (A) 6,895 214,779GKN PLC 91,744 378,096Hankook Tire Company, Ltd. 13,613 713,972Hanon Systems 33,993 349,346Horizon Global Corp. (A) 4,637 79,756Hyundai Mobis Company, Ltd. 12,458 2,610,415Hyundai Wia Corp. 3,004 186,904Koito Manufacturing Company, Ltd. 17,876 1,114,270LCI Industries 4,319 426,717Linamar Corp. 9,258 516,224Magna International, Inc. 64,805 3,118,424Minth Group, Ltd. 78,000 359,709Modine Manufacturing Company (A) 8,618 139,181Motorcar Parts of America, Inc. (A) 3,385 88,924NGK Spark Plug Company, Ltd. 26,900 512,216NOK Corp. 15,200 341,593Nokian Renkaat OYJ 21,073 890,943Standard Motor Products, Inc. 4,039 178,120Stanley Electric Company, Ltd. 22,200 737,254Stoneridge, Inc. (A) 4,812 79,687Sumitomo Electric Industries, Ltd. 120,600 1,886,918Sumitomo Rubber Industries, Ltd. 28,800 477,645Superior Industries International, Inc. 4,465 65,412Tenneco, Inc. 9,428 510,998The Goodyear Tire & Rubber Company 29,879 905,334The Yokohama Rubber Company, Ltd. 18,800 347,581Tower International, Inc. 3,540 79,473Toyoda Gosei Company, Ltd. 10,100 235,344Toyota Industries Corp. 26,129 1,390,846Valeo SA 42,886 2,870,650
50,097,443Automobiles – 1.3%Astra International Tbk PT 3,638,608 2,150,934Bayerische Motoren Werke AG 69,297 6,444,145
Strategic Equity Allocation Fund (continued)Shares orPrincipalAmount Value
COMMON STOCKS (continued)Automobiles (continued)Brilliance China Automotive
Holdings, Ltd. 358,400 $ 929,139BYD Company, Ltd., H Shares 74,494 444,507Chongqing Changan Automobile
Company, Ltd., B Shares 101,600 133,005Daimler AG 201,183 14,680,708Dongfeng Motor Group Company, Ltd.,
H Shares 312,780 406,827Ferrari NV 18,489 2,117,763Fiat Chrysler Automobiles NV (A) 161,702 2,442,980Ford Motor Company 451,645 4,981,644Ford Otomotiv Sanayi AS 8,854 121,972Geely Automobile Holdings, Ltd. 576,000 1,420,825General Motors Company 159,035 5,811,139Great Wall Motor Company, Ltd.,
H Shares 366,750 461,599Guangzhou Automobile Group
Company, Ltd., H Shares 248,719 491,542Harley-Davidson, Inc. (C) 19,743 928,118Honda Motor Company, Ltd. 274,527 7,689,505Hyundai Motor Company 27,994 3,495,379Isuzu Motors, Ltd. 88,500 1,154,783Kia Motors Corp. 48,101 1,514,842Mazda Motor Corp. 90,980 1,336,350Mitsubishi Motors Corp. 106,500 785,989Nissan Motor Company, Ltd. 370,625 3,689,806Peugeot SA 87,745 1,855,282Renault SA 31,949 2,828,819Subaru Corp. 98,400 3,439,254Suzuki Motor Corp. 54,900 2,756,737Thor Industries, Inc. 10,552 1,146,369Tofas Turk Otomobil Fabrikasi AS 15,456 141,598Toyota Motor Corp. 416,100 23,428,151UMW Holdings BHD (A) 82,100 117,157Volkswagen AG 6,693 1,034,718Winnebago Industries, Inc. 5,903 213,393Yamaha Motor Company, Ltd. 44,700 1,262,290Yulon Motor Company, Ltd. 130,000 112,123
101,969,392Distributors – 0.1%Core-Mark Holding Company, Inc. 8,486 229,631Genuine Parts Company 31,778 2,632,172Imperial Holdings, Ltd. 21,721 348,854Jardine Cycle & Carriage, Ltd. 26,554 783,336LKQ Corp. (A) 67,101 2,325,050Pool Corp. 9,118 908,973Weyco Group, Inc. 1,577 43,446
7,271,462Diversified consumer services – 0.1%Adtalem Global Education, Inc. 23,702 810,608American Public Education, Inc. (A) 3,090 57,011Benesse Holdings, Inc. 11,100 426,861Bridgepoint Education, Inc. (A) 3,469 30,631Capella Education Company 2,204 148,439Career Education Corp. (A) 12,173 116,983Carriage Services, Inc. 2,771 67,862Chegg, Inc. (A) 15,668 222,329Collectors Universe, Inc. 1,619 38,905Graham Holdings Company, Class B 1,026 602,467Grand Canyon Education, Inc. (A) 8,416 690,533H&R Block, Inc. 21,329 570,337Houghton Mifflin Harcourt Company (A) 19,687 200,807K12, Inc. (A) 5,892 105,585Kroton Educacional SA 261,580 1,493,271
John Hancock Funds IIPortfolio of Investments — August 31, 2017 (showing percentage of total net assets)
146
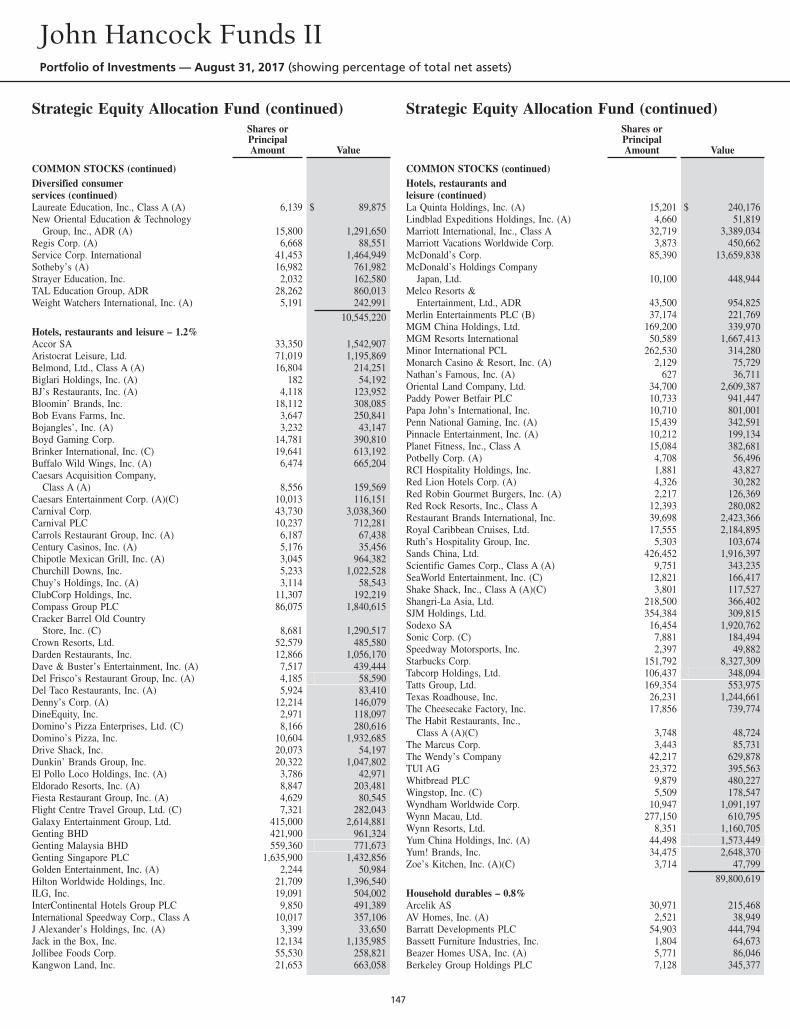
Strategic Equity Allocation Fund (continued)Shares orPrincipalAmount Value
COMMON STOCKS (continued)Diversified consumerservices (continued)Laureate Education, Inc., Class A (A) 6,139 $ 89,875New Oriental Education & Technology
Group, Inc., ADR (A) 15,800 1,291,650Regis Corp. (A) 6,668 88,551Service Corp. International 41,453 1,464,949Sotheby’s (A) 16,982 761,982Strayer Education, Inc. 2,032 162,580TAL Education Group, ADR 28,262 860,013Weight Watchers International, Inc. (A) 5,191 242,991
10,545,220Hotels, restaurants and leisure – 1.2%Accor SA 33,350 1,542,907Aristocrat Leisure, Ltd. 71,019 1,195,869Belmond, Ltd., Class A (A) 16,804 214,251Biglari Holdings, Inc. (A) 182 54,192BJ’s Restaurants, Inc. (A) 4,118 123,952Bloomin’ Brands, Inc. 18,112 308,085Bob Evans Farms, Inc. 3,647 250,841Bojangles’, Inc. (A) 3,232 43,147Boyd Gaming Corp. 14,781 390,810Brinker International, Inc. (C) 19,641 613,192Buffalo Wild Wings, Inc. (A) 6,474 665,204Caesars Acquisition Company,
Class A (A) 8,556 159,569Caesars Entertainment Corp. (A)(C) 10,013 116,151Carnival Corp. 43,730 3,038,360Carnival PLC 10,237 712,281Carrols Restaurant Group, Inc. (A) 6,187 67,438Century Casinos, Inc. (A) 5,176 35,456Chipotle Mexican Grill, Inc. (A) 3,045 964,382Churchill Downs, Inc. 5,233 1,022,528Chuy’s Holdings, Inc. (A) 3,114 58,543ClubCorp Holdings, Inc. 11,307 192,219Compass Group PLC 86,075 1,840,615Cracker Barrel Old Country
Store, Inc. (C) 8,681 1,290,517Crown Resorts, Ltd. 52,579 485,580Darden Restaurants, Inc. 12,866 1,056,170Dave & Buster’s Entertainment, Inc. (A) 7,517 439,444Del Frisco’s Restaurant Group, Inc. (A) 4,185 58,590Del Taco Restaurants, Inc. (A) 5,924 83,410Denny’s Corp. (A) 12,214 146,079DineEquity, Inc. 2,971 118,097Domino’s Pizza Enterprises, Ltd. (C) 8,166 280,616Domino’s Pizza, Inc. 10,604 1,932,685Drive Shack, Inc. 20,073 54,197Dunkin’ Brands Group, Inc. 20,322 1,047,802El Pollo Loco Holdings, Inc. (A) 3,786 42,971Eldorado Resorts, Inc. (A) 8,847 203,481Fiesta Restaurant Group, Inc. (A) 4,629 80,545Flight Centre Travel Group, Ltd. (C) 7,321 282,043Galaxy Entertainment Group, Ltd. 415,000 2,614,881Genting BHD 421,900 961,324Genting Malaysia BHD 559,360 771,673Genting Singapore PLC 1,635,900 1,432,856Golden Entertainment, Inc. (A) 2,244 50,984Hilton Worldwide Holdings, Inc. 21,709 1,396,540ILG, Inc. 19,091 504,002InterContinental Hotels Group PLC 9,850 491,389International Speedway Corp., Class A 10,017 357,106J Alexander’s Holdings, Inc. (A) 3,399 33,650Jack in the Box, Inc. 12,134 1,135,985Jollibee Foods Corp. 55,530 258,821Kangwon Land, Inc. 21,653 663,058
Strategic Equity Allocation Fund (continued)Shares orPrincipalAmount Value
COMMON STOCKS (continued)Hotels, restaurants andleisure (continued)La Quinta Holdings, Inc. (A) 15,201 $ 240,176Lindblad Expeditions Holdings, Inc. (A) 4,660 51,819Marriott International, Inc., Class A 32,719 3,389,034Marriott Vacations Worldwide Corp. 3,873 450,662McDonald’s Corp. 85,390 13,659,838McDonald’s Holdings Company
Japan, Ltd. 10,100 448,944Melco Resorts &
Entertainment, Ltd., ADR 43,500 954,825Merlin Entertainments PLC (B) 37,174 221,769MGM China Holdings, Ltd. 169,200 339,970MGM Resorts International 50,589 1,667,413Minor International PCL 262,530 314,280Monarch Casino & Resort, Inc. (A) 2,129 75,729Nathan’s Famous, Inc. (A) 627 36,711Oriental Land Company, Ltd. 34,700 2,609,387Paddy Power Betfair PLC 10,733 941,447Papa John’s International, Inc. 10,710 801,001Penn National Gaming, Inc. (A) 15,439 342,591Pinnacle Entertainment, Inc. (A) 10,212 199,134Planet Fitness, Inc., Class A 15,084 382,681Potbelly Corp. (A) 4,708 56,496RCI Hospitality Holdings, Inc. 1,881 43,827Red Lion Hotels Corp. (A) 4,326 30,282Red Robin Gourmet Burgers, Inc. (A) 2,217 126,369Red Rock Resorts, Inc., Class A 12,393 280,082Restaurant Brands International, Inc. 39,698 2,423,366Royal Caribbean Cruises, Ltd. 17,555 2,184,895Ruth’s Hospitality Group, Inc. 5,303 103,674Sands China, Ltd. 426,452 1,916,397Scientific Games Corp., Class A (A) 9,751 343,235SeaWorld Entertainment, Inc. (C) 12,821 166,417Shake Shack, Inc., Class A (A)(C) 3,801 117,527Shangri-La Asia, Ltd. 218,500 366,402SJM Holdings, Ltd. 354,384 309,815Sodexo SA 16,454 1,920,762Sonic Corp. (C) 7,881 184,494Speedway Motorsports, Inc. 2,397 49,882Starbucks Corp. 151,792 8,327,309Tabcorp Holdings, Ltd. 106,437 348,094Tatts Group, Ltd. 169,354 553,975Texas Roadhouse, Inc. 26,231 1,244,661The Cheesecake Factory, Inc. 17,856 739,774The Habit Restaurants, Inc.,
Class A (A)(C) 3,748 48,724The Marcus Corp. 3,443 85,731The Wendy’s Company 42,217 629,878TUI AG 23,372 395,563Whitbread PLC 9,879 480,227Wingstop, Inc. (C) 5,509 178,547Wyndham Worldwide Corp. 10,947 1,091,197Wynn Macau, Ltd. 277,150 610,795Wynn Resorts, Ltd. 8,351 1,160,705Yum China Holdings, Inc. (A) 44,498 1,573,449Yum! Brands, Inc. 34,475 2,648,370Zoe’s Kitchen, Inc. (A)(C) 3,714 47,799
89,800,619Household durables – 0.8%Arcelik AS 30,971 215,468AV Homes, Inc. (A) 2,521 38,949Barratt Developments PLC 54,903 444,794Bassett Furniture Industries, Inc. 1,804 64,673Beazer Homes USA, Inc. (A) 5,771 86,046Berkeley Group Holdings PLC 7,128 345,377
John Hancock Funds IIPortfolio of Investments — August 31, 2017 (showing percentage of total net assets)
147
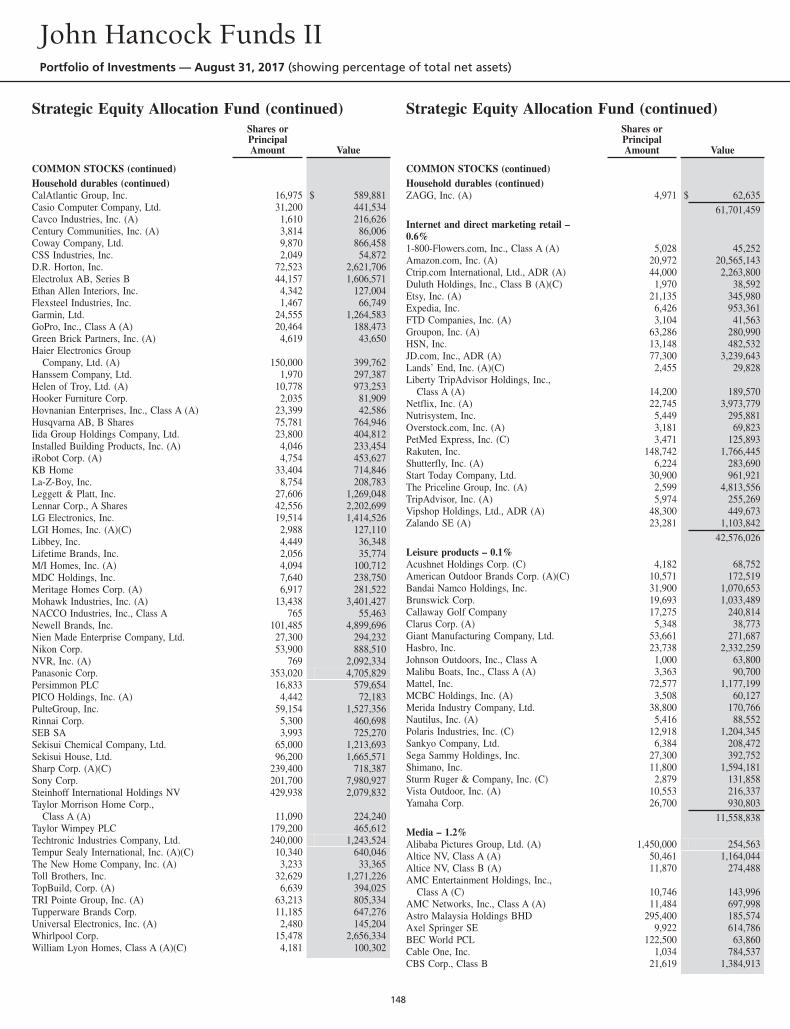
Strategic Equity Allocation Fund (continued)Shares orPrincipalAmount Value
COMMON STOCKS (continued)Household durables (continued)CalAtlantic Group, Inc. 16,975 $ 589,881Casio Computer Company, Ltd. 31,200 441,534Cavco Industries, Inc. (A) 1,610 216,626Century Communities, Inc. (A) 3,814 86,006Coway Company, Ltd. 9,870 866,458CSS Industries, Inc. 2,049 54,872D.R. Horton, Inc. 72,523 2,621,706Electrolux AB, Series B 44,157 1,606,571Ethan Allen Interiors, Inc. 4,342 127,004Flexsteel Industries, Inc. 1,467 66,749Garmin, Ltd. 24,555 1,264,583GoPro, Inc., Class A (A) 20,464 188,473Green Brick Partners, Inc. (A) 4,619 43,650Haier Electronics Group
Company, Ltd. (A) 150,000 399,762Hanssem Company, Ltd. 1,970 297,387Helen of Troy, Ltd. (A) 10,778 973,253Hooker Furniture Corp. 2,035 81,909Hovnanian Enterprises, Inc., Class A (A) 23,399 42,586Husqvarna AB, B Shares 75,781 764,946Iida Group Holdings Company, Ltd. 23,800 404,812Installed Building Products, Inc. (A) 4,046 233,454iRobot Corp. (A) 4,754 453,627KB Home 33,404 714,846La-Z-Boy, Inc. 8,754 208,783Leggett & Platt, Inc. 27,606 1,269,048Lennar Corp., A Shares 42,556 2,202,699LG Electronics, Inc. 19,514 1,414,526LGI Homes, Inc. (A)(C) 2,988 127,110Libbey, Inc. 4,449 36,348Lifetime Brands, Inc. 2,056 35,774M/I Homes, Inc. (A) 4,094 100,712MDC Holdings, Inc. 7,640 238,750Meritage Homes Corp. (A) 6,917 281,522Mohawk Industries, Inc. (A) 13,438 3,401,427NACCO Industries, Inc., Class A 765 55,463Newell Brands, Inc. 101,485 4,899,696Nien Made Enterprise Company, Ltd. 27,300 294,232Nikon Corp. 53,900 888,510NVR, Inc. (A) 769 2,092,334Panasonic Corp. 353,020 4,705,829Persimmon PLC 16,833 579,654PICO Holdings, Inc. (A) 4,442 72,183PulteGroup, Inc. 59,154 1,527,356Rinnai Corp. 5,300 460,698SEB SA 3,993 725,270Sekisui Chemical Company, Ltd. 65,000 1,213,693Sekisui House, Ltd. 96,200 1,665,571Sharp Corp. (A)(C) 239,400 718,387Sony Corp. 201,700 7,980,927Steinhoff International Holdings NV 429,938 2,079,832Taylor Morrison Home Corp.,
Class A (A) 11,090 224,240Taylor Wimpey PLC 179,200 465,612Techtronic Industries Company, Ltd. 240,000 1,243,524Tempur Sealy International, Inc. (A)(C) 10,340 640,046The New Home Company, Inc. (A) 3,233 33,365Toll Brothers, Inc. 32,629 1,271,226TopBuild, Corp. (A) 6,639 394,025TRI Pointe Group, Inc. (A) 63,213 805,334Tupperware Brands Corp. 11,185 647,276Universal Electronics, Inc. (A) 2,480 145,204Whirlpool Corp. 15,478 2,656,334William Lyon Homes, Class A (A)(C) 4,181 100,302
Strategic Equity Allocation Fund (continued)Shares orPrincipalAmount Value
COMMON STOCKS (continued)Household durables (continued)ZAGG, Inc. (A) 4,971 $ 62,635
61,701,459Internet and direct marketing retail –0.6%1-800-Flowers.com, Inc., Class A (A) 5,028 45,252Amazon.com, Inc. (A) 20,972 20,565,143Ctrip.com International, Ltd., ADR (A) 44,000 2,263,800Duluth Holdings, Inc., Class B (A)(C) 1,970 38,592Etsy, Inc. (A) 21,135 345,980Expedia, Inc. 6,426 953,361FTD Companies, Inc. (A) 3,104 41,563Groupon, Inc. (A) 63,286 280,990HSN, Inc. 13,148 482,532JD.com, Inc., ADR (A) 77,300 3,239,643Lands’ End, Inc. (A)(C) 2,455 29,828Liberty TripAdvisor Holdings, Inc.,
Class A (A) 14,200 189,570Netflix, Inc. (A) 22,745 3,973,779Nutrisystem, Inc. 5,449 295,881Overstock.com, Inc. (A) 3,181 69,823PetMed Express, Inc. (C) 3,471 125,893Rakuten, Inc. 148,742 1,766,445Shutterfly, Inc. (A) 6,224 283,690Start Today Company, Ltd. 30,900 961,921The Priceline Group, Inc. (A) 2,599 4,813,556TripAdvisor, Inc. (A) 5,974 255,269Vipshop Holdings, Ltd., ADR (A) 48,300 449,673Zalando SE (A) 23,281 1,103,842
42,576,026Leisure products – 0.1%Acushnet Holdings Corp. (C) 4,182 68,752American Outdoor Brands Corp. (A)(C) 10,571 172,519Bandai Namco Holdings, Inc. 31,900 1,070,653Brunswick Corp. 19,693 1,033,489Callaway Golf Company 17,275 240,814Clarus Corp. (A) 5,348 38,773Giant Manufacturing Company, Ltd. 53,661 271,687Hasbro, Inc. 23,738 2,332,259Johnson Outdoors, Inc., Class A 1,000 63,800Malibu Boats, Inc., Class A (A) 3,363 90,700Mattel, Inc. 72,577 1,177,199MCBC Holdings, Inc. (A) 3,508 60,127Merida Industry Company, Ltd. 38,800 170,766Nautilus, Inc. (A) 5,416 88,552Polaris Industries, Inc. (C) 12,918 1,204,345Sankyo Company, Ltd. 6,384 208,472Sega Sammy Holdings, Inc. 27,300 392,752Shimano, Inc. 11,800 1,594,181Sturm Ruger & Company, Inc. (C) 2,879 131,858Vista Outdoor, Inc. (A) 10,553 216,337Yamaha Corp. 26,700 930,803
11,558,838Media – 1.2%Alibaba Pictures Group, Ltd. (A) 1,450,000 254,563Altice NV, Class A (A) 50,461 1,164,044Altice NV, Class B (A) 11,870 274,488AMC Entertainment Holdings, Inc.,
Class A (C) 10,746 143,996AMC Networks, Inc., Class A (A) 11,484 697,998Astro Malaysia Holdings BHD 295,400 185,574Axel Springer SE 9,922 614,786BEC World PCL 122,500 63,860Cable One, Inc. 1,034 784,537CBS Corp., Class B 21,619 1,384,913
John Hancock Funds IIPortfolio of Investments — August 31, 2017 (showing percentage of total net assets)
148
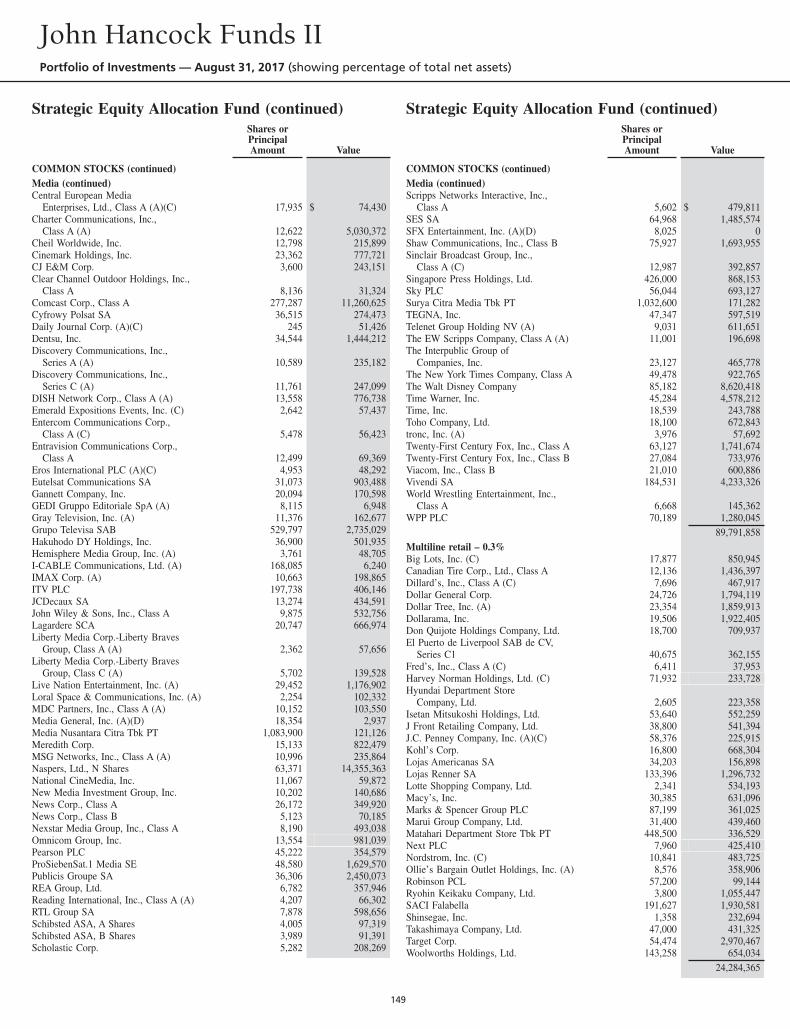
Strategic Equity Allocation Fund (continued)Shares orPrincipalAmount Value
COMMON STOCKS (continued)Media (continued)Central European Media
Enterprises, Ltd., Class A (A)(C) 17,935 $ 74,430Charter Communications, Inc.,
Class A (A) 12,622 5,030,372Cheil Worldwide, Inc. 12,798 215,899Cinemark Holdings, Inc. 23,362 777,721CJ E&M Corp. 3,600 243,151Clear Channel Outdoor Holdings, Inc.,
Class A 8,136 31,324Comcast Corp., Class A 277,287 11,260,625Cyfrowy Polsat SA 36,515 274,473Daily Journal Corp. (A)(C) 245 51,426Dentsu, Inc. 34,544 1,444,212Discovery Communications, Inc.,
Series A (A) 10,589 235,182Discovery Communications, Inc.,
Series C (A) 11,761 247,099DISH Network Corp., Class A (A) 13,558 776,738Emerald Expositions Events, Inc. (C) 2,642 57,437Entercom Communications Corp.,
Class A (C) 5,478 56,423Entravision Communications Corp.,
Class A 12,499 69,369Eros International PLC (A)(C) 4,953 48,292Eutelsat Communications SA 31,073 903,488Gannett Company, Inc. 20,094 170,598GEDI Gruppo Editoriale SpA (A) 8,115 6,948Gray Television, Inc. (A) 11,376 162,677Grupo Televisa SAB 529,797 2,735,029Hakuhodo DY Holdings, Inc. 36,900 501,935Hemisphere Media Group, Inc. (A) 3,761 48,705I-CABLE Communications, Ltd. (A) 168,085 6,240IMAX Corp. (A) 10,663 198,865ITV PLC 197,738 406,146JCDecaux SA 13,274 434,591John Wiley & Sons, Inc., Class A 9,875 532,756Lagardere SCA 20,747 666,974Liberty Media Corp.-Liberty Braves
Group, Class A (A) 2,362 57,656Liberty Media Corp.-Liberty Braves
Group, Class C (A) 5,702 139,528Live Nation Entertainment, Inc. (A) 29,452 1,176,902Loral Space & Communications, Inc. (A) 2,254 102,332MDC Partners, Inc., Class A (A) 10,152 103,550Media General, Inc. (A)(D) 18,354 2,937Media Nusantara Citra Tbk PT 1,083,900 121,126Meredith Corp. 15,133 822,479MSG Networks, Inc., Class A (A) 10,996 235,864Naspers, Ltd., N Shares 63,371 14,355,363National CineMedia, Inc. 11,067 59,872New Media Investment Group, Inc. 10,202 140,686News Corp., Class A 26,172 349,920News Corp., Class B 5,123 70,185Nexstar Media Group, Inc., Class A 8,190 493,038Omnicom Group, Inc. 13,554 981,039Pearson PLC 45,222 354,579ProSiebenSat.1 Media SE 48,580 1,629,570Publicis Groupe SA 36,306 2,450,073REA Group, Ltd. 6,782 357,946Reading International, Inc., Class A (A) 4,207 66,302RTL Group SA 7,878 598,656Schibsted ASA, A Shares 4,005 97,319Schibsted ASA, B Shares 3,989 91,391Scholastic Corp. 5,282 208,269
Strategic Equity Allocation Fund (continued)Shares orPrincipalAmount Value
COMMON STOCKS (continued)Media (continued)Scripps Networks Interactive, Inc.,
Class A 5,602 $ 479,811SES SA 64,968 1,485,574SFX Entertainment, Inc. (A)(D) 8,025 0Shaw Communications, Inc., Class B 75,927 1,693,955Sinclair Broadcast Group, Inc.,
Class A (C) 12,987 392,857Singapore Press Holdings, Ltd. 426,000 868,153Sky PLC 56,044 693,127Surya Citra Media Tbk PT 1,032,600 171,282TEGNA, Inc. 47,347 597,519Telenet Group Holding NV (A) 9,031 611,651The EW Scripps Company, Class A (A) 11,001 196,698The Interpublic Group of
Companies, Inc. 23,127 465,778The New York Times Company, Class A 49,478 922,765The Walt Disney Company 85,182 8,620,418Time Warner, Inc. 45,284 4,578,212Time, Inc. 18,539 243,788Toho Company, Ltd. 18,100 672,843tronc, Inc. (A) 3,976 57,692Twenty-First Century Fox, Inc., Class A 63,127 1,741,674Twenty-First Century Fox, Inc., Class B 27,084 733,976Viacom, Inc., Class B 21,010 600,886Vivendi SA 184,531 4,233,326World Wrestling Entertainment, Inc.,
Class A 6,668 145,362WPP PLC 70,189 1,280,045
89,791,858Multiline retail – 0.3%Big Lots, Inc. (C) 17,877 850,945Canadian Tire Corp., Ltd., Class A 12,136 1,436,397Dillard’s, Inc., Class A (C) 7,696 467,917Dollar General Corp. 24,726 1,794,119Dollar Tree, Inc. (A) 23,354 1,859,913Dollarama, Inc. 19,506 1,922,405Don Quijote Holdings Company, Ltd. 18,700 709,937El Puerto de Liverpool SAB de CV,
Series C1 40,675 362,155Fred’s, Inc., Class A (C) 6,411 37,953Harvey Norman Holdings, Ltd. (C) 71,932 233,728Hyundai Department Store
Company, Ltd. 2,605 223,358Isetan Mitsukoshi Holdings, Ltd. 53,640 552,259J Front Retailing Company, Ltd. 38,800 541,394J.C. Penney Company, Inc. (A)(C) 58,376 225,915Kohl’s Corp. 16,800 668,304Lojas Americanas SA 34,203 156,898Lojas Renner SA 133,396 1,296,732Lotte Shopping Company, Ltd. 2,341 534,193Macy’s, Inc. 30,385 631,096Marks & Spencer Group PLC 87,199 361,025Marui Group Company, Ltd. 31,400 439,460Matahari Department Store Tbk PT 448,500 336,529Next PLC 7,960 425,410Nordstrom, Inc. (C) 10,841 483,725Ollie’s Bargain Outlet Holdings, Inc. (A) 8,576 358,906Robinson PCL 57,200 99,144Ryohin Keikaku Company, Ltd. 3,800 1,055,447SACI Falabella 191,627 1,930,581Shinsegae, Inc. 1,358 232,694Takashimaya Company, Ltd. 47,000 431,325Target Corp. 54,474 2,970,467Woolworths Holdings, Ltd. 143,258 654,034
24,284,365
John Hancock Funds IIPortfolio of Investments — August 31, 2017 (showing percentage of total net assets)
149
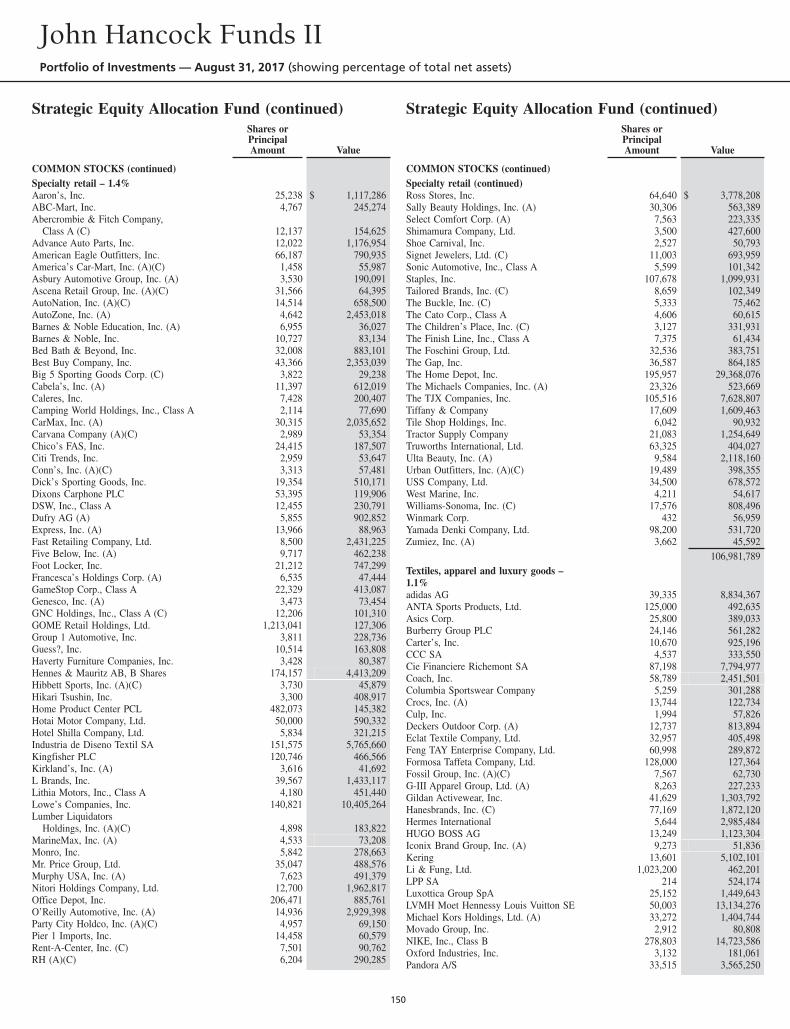
Strategic Equity Allocation Fund (continued)Shares orPrincipalAmount Value
COMMON STOCKS (continued)Specialty retail – 1.4%Aaron’s, Inc. 25,238 $ 1,117,286ABC-Mart, Inc. 4,767 245,274Abercrombie & Fitch Company,
Class A (C) 12,137 154,625Advance Auto Parts, Inc. 12,022 1,176,954American Eagle Outfitters, Inc. 66,187 790,935America’s Car-Mart, Inc. (A)(C) 1,458 55,987Asbury Automotive Group, Inc. (A) 3,530 190,091Ascena Retail Group, Inc. (A)(C) 31,566 64,395AutoNation, Inc. (A)(C) 14,514 658,500AutoZone, Inc. (A) 4,642 2,453,018Barnes & Noble Education, Inc. (A) 6,955 36,027Barnes & Noble, Inc. 10,727 83,134Bed Bath & Beyond, Inc. 32,008 883,101Best Buy Company, Inc. 43,366 2,353,039Big 5 Sporting Goods Corp. (C) 3,822 29,238Cabela’s, Inc. (A) 11,397 612,019Caleres, Inc. 7,428 200,407Camping World Holdings, Inc., Class A 2,114 77,690CarMax, Inc. (A) 30,315 2,035,652Carvana Company (A)(C) 2,989 53,354Chico’s FAS, Inc. 24,415 187,507Citi Trends, Inc. 2,959 53,647Conn’s, Inc. (A)(C) 3,313 57,481Dick’s Sporting Goods, Inc. 19,354 510,171Dixons Carphone PLC 53,395 119,906DSW, Inc., Class A 12,455 230,791Dufry AG (A) 5,855 902,852Express, Inc. (A) 13,966 88,963Fast Retailing Company, Ltd. 8,500 2,431,225Five Below, Inc. (A) 9,717 462,238Foot Locker, Inc. 21,212 747,299Francesca’s Holdings Corp. (A) 6,535 47,444GameStop Corp., Class A 22,329 413,087Genesco, Inc. (A) 3,473 73,454GNC Holdings, Inc., Class A (C) 12,206 101,310GOME Retail Holdings, Ltd. 1,213,041 127,306Group 1 Automotive, Inc. 3,811 228,736Guess?, Inc. 10,514 163,808Haverty Furniture Companies, Inc. 3,428 80,387Hennes & Mauritz AB, B Shares 174,157 4,413,209Hibbett Sports, Inc. (A)(C) 3,730 45,879Hikari Tsushin, Inc. 3,300 408,917Home Product Center PCL 482,073 145,382Hotai Motor Company, Ltd. 50,000 590,332Hotel Shilla Company, Ltd. 5,834 321,215Industria de Diseno Textil SA 151,575 5,765,660Kingfisher PLC 120,746 466,566Kirkland’s, Inc. (A) 3,616 41,692L Brands, Inc. 39,567 1,433,117Lithia Motors, Inc., Class A 4,180 451,440Lowe’s Companies, Inc. 140,821 10,405,264Lumber Liquidators
Holdings, Inc. (A)(C) 4,898 183,822MarineMax, Inc. (A) 4,533 73,208Monro, Inc. 5,842 278,663Mr. Price Group, Ltd. 35,047 488,576Murphy USA, Inc. (A) 7,623 491,379Nitori Holdings Company, Ltd. 12,700 1,962,817Office Depot, Inc. 206,471 885,761O’Reilly Automotive, Inc. (A) 14,936 2,929,398Party City Holdco, Inc. (A)(C) 4,957 69,150Pier 1 Imports, Inc. 14,458 60,579Rent-A-Center, Inc. (C) 7,501 90,762RH (A)(C) 6,204 290,285
Strategic Equity Allocation Fund (continued)Shares orPrincipalAmount Value
COMMON STOCKS (continued)Specialty retail (continued)Ross Stores, Inc. 64,640 $ 3,778,208Sally Beauty Holdings, Inc. (A) 30,306 563,389Select Comfort Corp. (A) 7,563 223,335Shimamura Company, Ltd. 3,500 427,600Shoe Carnival, Inc. 2,527 50,793Signet Jewelers, Ltd. (C) 11,003 693,959Sonic Automotive, Inc., Class A 5,599 101,342Staples, Inc. 107,678 1,099,931Tailored Brands, Inc. (C) 8,659 102,349The Buckle, Inc. (C) 5,333 75,462The Cato Corp., Class A 4,606 60,615The Children’s Place, Inc. (C) 3,127 331,931The Finish Line, Inc., Class A 7,375 61,434The Foschini Group, Ltd. 32,536 383,751The Gap, Inc. 36,587 864,185The Home Depot, Inc. 195,957 29,368,076The Michaels Companies, Inc. (A) 23,326 523,669The TJX Companies, Inc. 105,516 7,628,807Tiffany & Company 17,609 1,609,463Tile Shop Holdings, Inc. 6,042 90,932Tractor Supply Company 21,083 1,254,649Truworths International, Ltd. 63,325 404,027Ulta Beauty, Inc. (A) 9,584 2,118,160Urban Outfitters, Inc. (A)(C) 19,489 398,355USS Company, Ltd. 34,500 678,572West Marine, Inc. 4,211 54,617Williams-Sonoma, Inc. (C) 17,576 808,496Winmark Corp. 432 56,959Yamada Denki Company, Ltd. 98,200 531,720Zumiez, Inc. (A) 3,662 45,592
106,981,789Textiles, apparel and luxury goods –1.1%adidas AG 39,335 8,834,367ANTA Sports Products, Ltd. 125,000 492,635Asics Corp. 25,800 389,033Burberry Group PLC 24,146 561,282Carter’s, Inc. 10,670 925,196CCC SA 4,537 333,550Cie Financiere Richemont SA 87,198 7,794,977Coach, Inc. 58,789 2,451,501Columbia Sportswear Company 5,259 301,288Crocs, Inc. (A) 13,744 122,734Culp, Inc. 1,994 57,826Deckers Outdoor Corp. (A) 12,737 813,894Eclat Textile Company, Ltd. 32,957 405,498Feng TAY Enterprise Company, Ltd. 60,998 289,872Formosa Taffeta Company, Ltd. 128,000 127,364Fossil Group, Inc. (A)(C) 7,567 62,730G-III Apparel Group, Ltd. (A) 8,263 227,233Gildan Activewear, Inc. 41,629 1,303,792Hanesbrands, Inc. (C) 77,169 1,872,120Hermes International 5,644 2,985,484HUGO BOSS AG 13,249 1,123,304Iconix Brand Group, Inc. (A) 9,273 51,836Kering 13,601 5,102,101Li & Fung, Ltd. 1,023,200 462,201LPP SA 214 524,174Luxottica Group SpA 25,152 1,449,643LVMH Moet Hennessy Louis Vuitton SE 50,003 13,134,276Michael Kors Holdings, Ltd. (A) 33,272 1,404,744Movado Group, Inc. 2,912 80,808NIKE, Inc., Class B 278,803 14,723,586Oxford Industries, Inc. 3,132 181,061Pandora A/S 33,515 3,565,250
John Hancock Funds IIPortfolio of Investments — August 31, 2017 (showing percentage of total net assets)
150
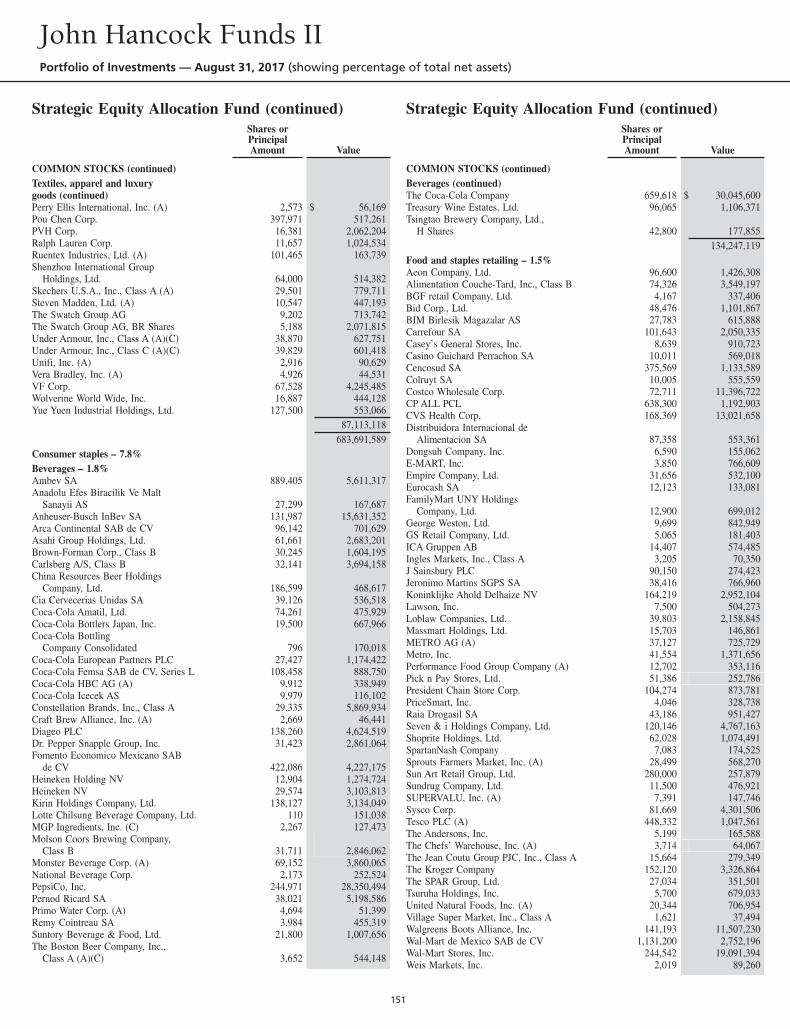
Strategic Equity Allocation Fund (continued)Shares orPrincipalAmount Value
COMMON STOCKS (continued)Textiles, apparel and luxurygoods (continued)Perry Ellis International, Inc. (A) 2,573 $ 56,169Pou Chen Corp. 397,971 517,261PVH Corp. 16,381 2,062,204Ralph Lauren Corp. 11,657 1,024,534Ruentex Industries, Ltd. (A) 101,465 163,739Shenzhou International Group
Holdings, Ltd. 64,000 514,382Skechers U.S.A., Inc., Class A (A) 29,501 779,711Steven Madden, Ltd. (A) 10,547 447,193The Swatch Group AG 9,202 713,742The Swatch Group AG, BR Shares 5,188 2,071,815Under Armour, Inc., Class A (A)(C) 38,870 627,751Under Armour, Inc., Class C (A)(C) 39,829 601,418Unifi, Inc. (A) 2,916 90,629Vera Bradley, Inc. (A) 4,926 44,531VF Corp. 67,528 4,245,485Wolverine World Wide, Inc. 16,887 444,128Yue Yuen Industrial Holdings, Ltd. 127,500 553,066
87,113,118683,691,589
Consumer staples – 7.8%Beverages – 1.8%Ambev SA 889,405 5,611,317Anadolu Efes Biracilik Ve Malt
Sanayii AS 27,299 167,687Anheuser-Busch InBev SA 131,987 15,631,352Arca Continental SAB de CV 96,142 701,629Asahi Group Holdings, Ltd. 61,661 2,683,201Brown-Forman Corp., Class B 30,245 1,604,195Carlsberg A/S, Class B 32,141 3,694,158China Resources Beer Holdings
Company, Ltd. 186,599 468,617Cia Cervecerias Unidas SA 39,126 536,518Coca-Cola Amatil, Ltd. 74,261 475,929Coca-Cola Bottlers Japan, Inc. 19,500 667,966Coca-Cola Bottling
Company Consolidated 796 170,018Coca-Cola European Partners PLC 27,427 1,174,422Coca-Cola Femsa SAB de CV, Series L 108,458 888,750Coca-Cola HBC AG (A) 9,912 338,949Coca-Cola Icecek AS 9,979 116,102Constellation Brands, Inc., Class A 29,335 5,869,934Craft Brew Alliance, Inc. (A) 2,669 46,441Diageo PLC 138,260 4,624,519Dr. Pepper Snapple Group, Inc. 31,423 2,861,064Fomento Economico Mexicano SAB
de CV 422,086 4,227,175Heineken Holding NV 12,904 1,274,724Heineken NV 29,574 3,103,813Kirin Holdings Company, Ltd. 138,127 3,134,049Lotte Chilsung Beverage Company, Ltd. 110 151,038MGP Ingredients, Inc. (C) 2,267 127,473Molson Coors Brewing Company,
Class B 31,711 2,846,062Monster Beverage Corp. (A) 69,152 3,860,065National Beverage Corp. 2,173 252,524PepsiCo, Inc. 244,971 28,350,494Pernod Ricard SA 38,021 5,198,586Primo Water Corp. (A) 4,694 51,399Remy Cointreau SA 3,984 455,319Suntory Beverage & Food, Ltd. 21,800 1,007,656The Boston Beer Company, Inc.,
Class A (A)(C) 3,652 544,148
Strategic Equity Allocation Fund (continued)Shares orPrincipalAmount Value
COMMON STOCKS (continued)Beverages (continued)The Coca-Cola Company 659,618 $ 30,045,600Treasury Wine Estates, Ltd. 96,065 1,106,371Tsingtao Brewery Company, Ltd.,
H Shares 42,800 177,855134,247,119
Food and staples retailing – 1.5%Aeon Company, Ltd. 96,600 1,426,308Alimentation Couche-Tard, Inc., Class B 74,326 3,549,197BGF retail Company, Ltd. 4,167 337,406Bid Corp., Ltd. 48,476 1,101,867BIM Birlesik Magazalar AS 27,783 615,888Carrefour SA 101,643 2,050,335Casey’s General Stores, Inc. 8,639 910,723Casino Guichard Perrachon SA 10,011 569,018Cencosud SA 375,569 1,133,589Colruyt SA 10,005 555,559Costco Wholesale Corp. 72,711 11,396,722CP ALL PCL 638,300 1,192,903CVS Health Corp. 168,369 13,021,658Distribuidora Internacional de
Alimentacion SA 87,358 553,361Dongsuh Company, Inc. 6,590 155,062E-MART, Inc. 3,850 766,609Empire Company, Ltd. 31,656 532,100Eurocash SA 12,123 133,081FamilyMart UNY Holdings
Company, Ltd. 12,900 699,012George Weston, Ltd. 9,699 842,949GS Retail Company, Ltd. 5,065 181,403ICA Gruppen AB 14,407 574,485Ingles Markets, Inc., Class A 3,205 70,350J Sainsbury PLC 90,150 274,423Jeronimo Martins SGPS SA 38,416 766,960Koninklijke Ahold Delhaize NV 164,219 2,952,104Lawson, Inc. 7,500 504,273Loblaw Companies, Ltd. 39,803 2,158,845Massmart Holdings, Ltd. 15,703 146,861METRO AG (A) 37,127 725,729Metro, Inc. 41,554 1,371,656Performance Food Group Company (A) 12,702 353,116Pick n Pay Stores, Ltd. 51,386 252,786President Chain Store Corp. 104,274 873,781PriceSmart, Inc. 4,046 328,738Raia Drogasil SA 43,186 951,427Seven & i Holdings Company, Ltd. 120,146 4,767,163Shoprite Holdings, Ltd. 62,028 1,074,491SpartanNash Company 7,083 174,525Sprouts Farmers Market, Inc. (A) 28,499 568,270Sun Art Retail Group, Ltd. 280,000 257,879Sundrug Company, Ltd. 11,500 476,921SUPERVALU, Inc. (A) 7,391 147,746Sysco Corp. 81,669 4,301,506Tesco PLC (A) 448,332 1,047,561The Andersons, Inc. 5,199 165,588The Chefs’ Warehouse, Inc. (A) 3,714 64,067The Jean Coutu Group PJC, Inc., Class A 15,664 279,349The Kroger Company 152,120 3,326,864The SPAR Group, Ltd. 27,034 351,501Tsuruha Holdings, Inc. 5,700 679,033United Natural Foods, Inc. (A) 20,344 706,954Village Super Market, Inc., Class A 1,621 37,494Walgreens Boots Alliance, Inc. 141,193 11,507,230Wal-Mart de Mexico SAB de CV 1,131,200 2,752,196Wal-Mart Stores, Inc. 244,542 19,091,394Weis Markets, Inc. 2,019 89,260
John Hancock Funds IIPortfolio of Investments — August 31, 2017 (showing percentage of total net assets)
151
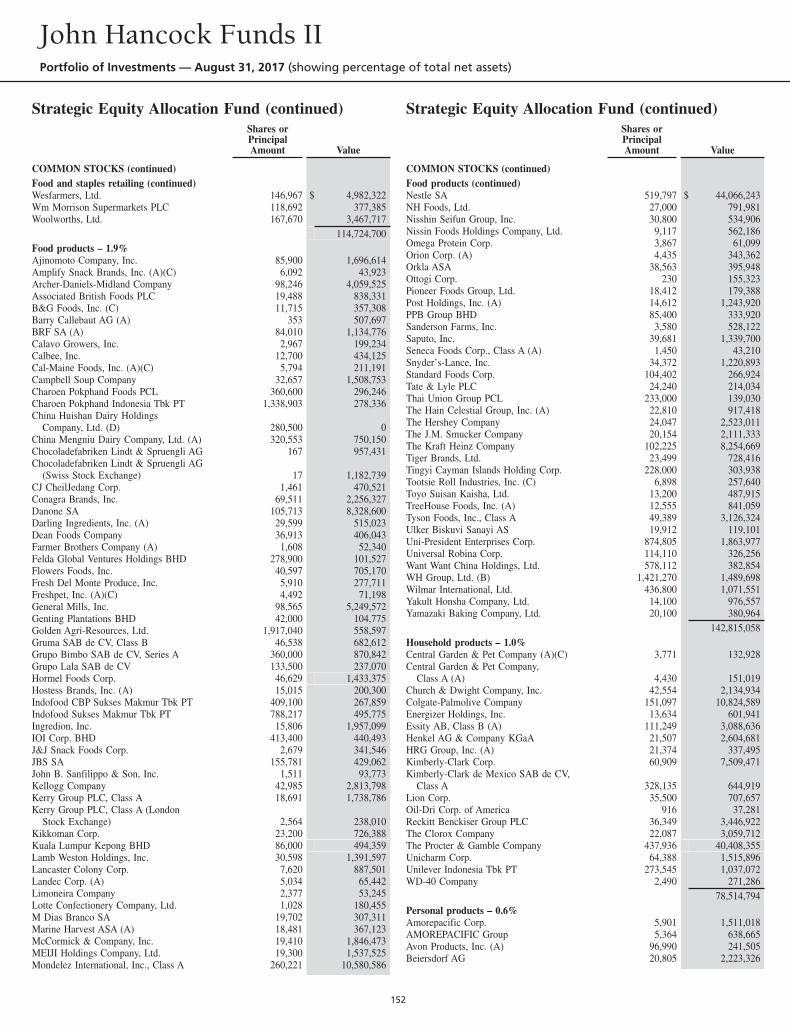
Strategic Equity Allocation Fund (continued)Shares orPrincipalAmount Value
COMMON STOCKS (continued)Food and staples retailing (continued)Wesfarmers, Ltd. 146,967 $ 4,982,322Wm Morrison Supermarkets PLC 118,692 377,385Woolworths, Ltd. 167,670 3,467,717
114,724,700Food products – 1.9%Ajinomoto Company, Inc. 85,900 1,696,614Amplify Snack Brands, Inc. (A)(C) 6,092 43,923Archer-Daniels-Midland Company 98,246 4,059,525Associated British Foods PLC 19,488 838,331B&G Foods, Inc. (C) 11,715 357,308Barry Callebaut AG (A) 353 507,697BRF SA (A) 84,010 1,134,776Calavo Growers, Inc. 2,967 199,234Calbee, Inc. 12,700 434,125Cal-Maine Foods, Inc. (A)(C) 5,794 211,191Campbell Soup Company 32,657 1,508,753Charoen Pokphand Foods PCL 360,600 296,246Charoen Pokphand Indonesia Tbk PT 1,338,903 278,336China Huishan Dairy Holdings
Company, Ltd. (D) 280,500 0China Mengniu Dairy Company, Ltd. (A) 320,553 750,150Chocoladefabriken Lindt & Spruengli AG 167 957,431Chocoladefabriken Lindt & Spruengli AG
(Swiss Stock Exchange) 17 1,182,739CJ CheilJedang Corp. 1,461 470,521Conagra Brands, Inc. 69,511 2,256,327Danone SA 105,713 8,328,600Darling Ingredients, Inc. (A) 29,599 515,023Dean Foods Company 36,913 406,043Farmer Brothers Company (A) 1,608 52,340Felda Global Ventures Holdings BHD 278,900 101,527Flowers Foods, Inc. 40,597 705,170Fresh Del Monte Produce, Inc. 5,910 277,711Freshpet, Inc. (A)(C) 4,492 71,198General Mills, Inc. 98,565 5,249,572Genting Plantations BHD 42,000 104,775Golden Agri-Resources, Ltd. 1,917,040 558,597Gruma SAB de CV, Class B 46,538 682,612Grupo Bimbo SAB de CV, Series A 360,000 870,842Grupo Lala SAB de CV 133,500 237,070Hormel Foods Corp. 46,629 1,433,375Hostess Brands, Inc. (A) 15,015 200,300Indofood CBP Sukses Makmur Tbk PT 409,100 267,859Indofood Sukses Makmur Tbk PT 788,217 495,775Ingredion, Inc. 15,806 1,957,099IOI Corp. BHD 413,400 440,493J&J Snack Foods Corp. 2,679 341,546JBS SA 155,781 429,062John B. Sanfilippo & Son, Inc. 1,511 93,773Kellogg Company 42,985 2,813,798Kerry Group PLC, Class A 18,691 1,738,786Kerry Group PLC, Class A (London
Stock Exchange) 2,564 238,010Kikkoman Corp. 23,200 726,388Kuala Lumpur Kepong BHD 86,000 494,359Lamb Weston Holdings, Inc. 30,598 1,391,597Lancaster Colony Corp. 7,620 887,501Landec Corp. (A) 5,034 65,442Limoneira Company 2,377 53,245Lotte Confectionery Company, Ltd. 1,028 180,455M Dias Branco SA 19,702 307,311Marine Harvest ASA (A) 18,481 367,123McCormick & Company, Inc. 19,410 1,846,473MEIJI Holdings Company, Ltd. 19,300 1,537,525Mondelez International, Inc., Class A 260,221 10,580,586
Strategic Equity Allocation Fund (continued)Shares orPrincipalAmount Value
COMMON STOCKS (continued)Food products (continued)Nestle SA 519,797 $ 44,066,243NH Foods, Ltd. 27,000 791,981Nisshin Seifun Group, Inc. 30,800 534,906Nissin Foods Holdings Company, Ltd. 9,117 562,186Omega Protein Corp. 3,867 61,099Orion Corp. (A) 4,435 343,362Orkla ASA 38,563 395,948Ottogi Corp. 230 155,323Pioneer Foods Group, Ltd. 18,412 179,388Post Holdings, Inc. (A) 14,612 1,243,920PPB Group BHD 85,400 333,920Sanderson Farms, Inc. 3,580 528,122Saputo, Inc. 39,681 1,339,700Seneca Foods Corp., Class A (A) 1,450 43,210Snyder’s-Lance, Inc. 34,372 1,220,893Standard Foods Corp. 104,402 266,924Tate & Lyle PLC 24,240 214,034Thai Union Group PCL 233,000 139,030The Hain Celestial Group, Inc. (A) 22,810 917,418The Hershey Company 24,047 2,523,011The J.M. Smucker Company 20,154 2,111,333The Kraft Heinz Company 102,225 8,254,669Tiger Brands, Ltd. 23,499 728,416Tingyi Cayman Islands Holding Corp. 228,000 303,938Tootsie Roll Industries, Inc. (C) 6,898 257,640Toyo Suisan Kaisha, Ltd. 13,200 487,915TreeHouse Foods, Inc. (A) 12,555 841,059Tyson Foods, Inc., Class A 49,389 3,126,324Ulker Biskuvi Sanayi AS 19,912 119,101Uni-President Enterprises Corp. 874,805 1,863,977Universal Robina Corp. 114,110 326,256Want Want China Holdings, Ltd. 578,112 382,854WH Group, Ltd. (B) 1,421,270 1,489,698Wilmar International, Ltd. 436,800 1,071,551Yakult Honsha Company, Ltd. 14,100 976,557Yamazaki Baking Company, Ltd. 20,100 380,964
142,815,058Household products – 1.0%Central Garden & Pet Company (A)(C) 3,771 132,928Central Garden & Pet Company,
Class A (A) 4,430 151,019Church & Dwight Company, Inc. 42,554 2,134,934Colgate-Palmolive Company 151,097 10,824,589Energizer Holdings, Inc. 13,634 601,941Essity AB, Class B (A) 111,249 3,088,636Henkel AG & Company KGaA 21,507 2,604,681HRG Group, Inc. (A) 21,374 337,495Kimberly-Clark Corp. 60,909 7,509,471Kimberly-Clark de Mexico SAB de CV,
Class A 328,135 644,919Lion Corp. 35,500 707,657Oil-Dri Corp. of America 916 37,281Reckitt Benckiser Group PLC 36,349 3,446,922The Clorox Company 22,087 3,059,712The Procter & Gamble Company 437,936 40,408,355Unicharm Corp. 64,388 1,515,896Unilever Indonesia Tbk PT 273,545 1,037,072WD-40 Company 2,490 271,286
78,514,794Personal products – 0.6%Amorepacific Corp. 5,901 1,511,018AMOREPACIFIC Group 5,364 638,665Avon Products, Inc. (A) 96,990 241,505Beiersdorf AG 20,805 2,223,326
John Hancock Funds IIPortfolio of Investments — August 31, 2017 (showing percentage of total net assets)
152
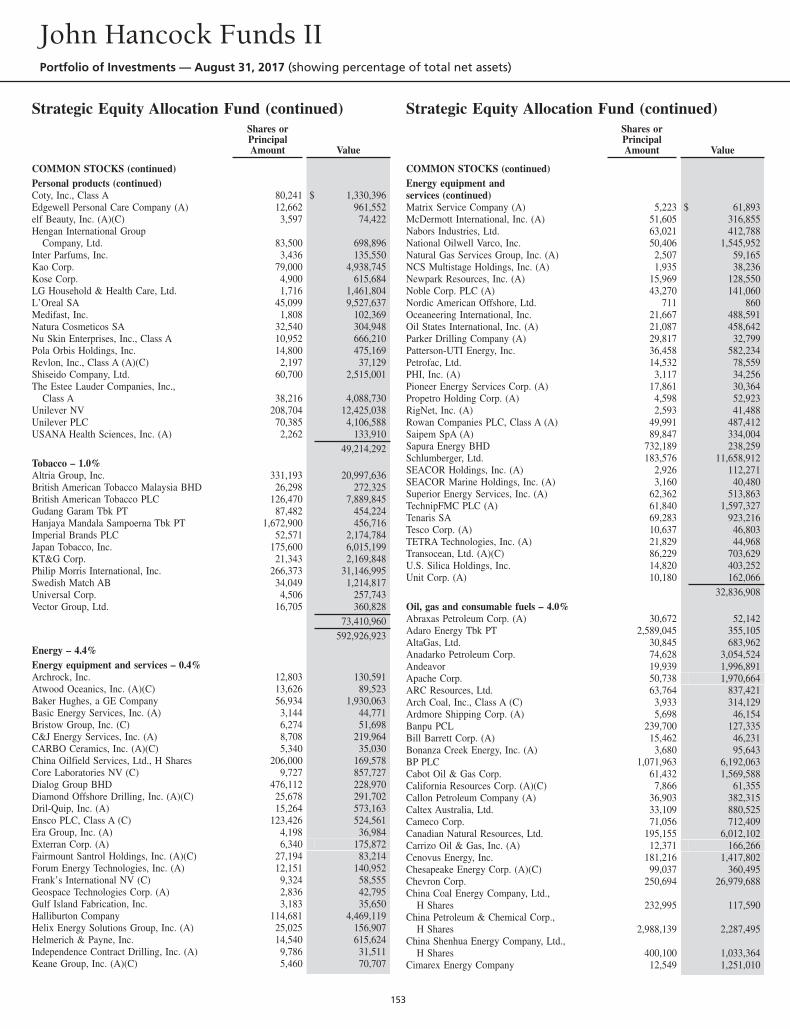
Strategic Equity Allocation Fund (continued)Shares orPrincipalAmount Value
COMMON STOCKS (continued)Personal products (continued)Coty, Inc., Class A 80,241 $ 1,330,396Edgewell Personal Care Company (A) 12,662 961,552elf Beauty, Inc. (A)(C) 3,597 74,422Hengan International Group
Company, Ltd. 83,500 698,896Inter Parfums, Inc. 3,436 135,550Kao Corp. 79,000 4,938,745Kose Corp. 4,900 615,684LG Household & Health Care, Ltd. 1,716 1,461,804L’Oreal SA 45,099 9,527,637Medifast, Inc. 1,808 102,369Natura Cosmeticos SA 32,540 304,948Nu Skin Enterprises, Inc., Class A 10,952 666,210Pola Orbis Holdings, Inc. 14,800 475,169Revlon, Inc., Class A (A)(C) 2,197 37,129Shiseido Company, Ltd. 60,700 2,515,001The Estee Lauder Companies, Inc.,
Class A 38,216 4,088,730Unilever NV 208,704 12,425,038Unilever PLC 70,385 4,106,588USANA Health Sciences, Inc. (A) 2,262 133,910
49,214,292Tobacco – 1.0%Altria Group, Inc. 331,193 20,997,636British American Tobacco Malaysia BHD 26,298 272,325British American Tobacco PLC 126,470 7,889,845Gudang Garam Tbk PT 87,482 454,224Hanjaya Mandala Sampoerna Tbk PT 1,672,900 456,716Imperial Brands PLC 52,571 2,174,784Japan Tobacco, Inc. 175,600 6,015,199KT&G Corp. 21,343 2,169,848Philip Morris International, Inc. 266,373 31,146,995Swedish Match AB 34,049 1,214,817Universal Corp. 4,506 257,743Vector Group, Ltd. 16,705 360,828
73,410,960592,926,923
Energy – 4.4%Energy equipment and services – 0.4%Archrock, Inc. 12,803 130,591Atwood Oceanics, Inc. (A)(C) 13,626 89,523Baker Hughes, a GE Company 56,934 1,930,063Basic Energy Services, Inc. (A) 3,144 44,771Bristow Group, Inc. (C) 6,274 51,698C&J Energy Services, Inc. (A) 8,708 219,964CARBO Ceramics, Inc. (A)(C) 5,340 35,030China Oilfield Services, Ltd., H Shares 206,000 169,578Core Laboratories NV (C) 9,727 857,727Dialog Group BHD 476,112 228,970Diamond Offshore Drilling, Inc. (A)(C) 25,678 291,702Dril-Quip, Inc. (A) 15,264 573,163Ensco PLC, Class A (C) 123,426 524,561Era Group, Inc. (A) 4,198 36,984Exterran Corp. (A) 6,340 175,872Fairmount Santrol Holdings, Inc. (A)(C) 27,194 83,214Forum Energy Technologies, Inc. (A) 12,151 140,952Frank’s International NV (C) 9,324 58,555Geospace Technologies Corp. (A) 2,836 42,795Gulf Island Fabrication, Inc. 3,183 35,650Halliburton Company 114,681 4,469,119Helix Energy Solutions Group, Inc. (A) 25,025 156,907Helmerich & Payne, Inc. 14,540 615,624Independence Contract Drilling, Inc. (A) 9,786 31,511Keane Group, Inc. (A)(C) 5,460 70,707
Strategic Equity Allocation Fund (continued)Shares orPrincipalAmount Value
COMMON STOCKS (continued)Energy equipment andservices (continued)Matrix Service Company (A) 5,223 $ 61,893McDermott International, Inc. (A) 51,605 316,855Nabors Industries, Ltd. 63,021 412,788National Oilwell Varco, Inc. 50,406 1,545,952Natural Gas Services Group, Inc. (A) 2,507 59,165NCS Multistage Holdings, Inc. (A) 1,935 38,236Newpark Resources, Inc. (A) 15,969 128,550Noble Corp. PLC (A) 43,270 141,060Nordic American Offshore, Ltd. 711 860Oceaneering International, Inc. 21,667 488,591Oil States International, Inc. (A) 21,087 458,642Parker Drilling Company (A) 29,817 32,799Patterson-UTI Energy, Inc. 36,458 582,234Petrofac, Ltd. 14,532 78,559PHI, Inc. (A) 3,117 34,256Pioneer Energy Services Corp. (A) 17,861 30,364Propetro Holding Corp. (A) 4,598 52,923RigNet, Inc. (A) 2,593 41,488Rowan Companies PLC, Class A (A) 49,991 487,412Saipem SpA (A) 89,847 334,004Sapura Energy BHD 732,189 238,259Schlumberger, Ltd. 183,576 11,658,912SEACOR Holdings, Inc. (A) 2,926 112,271SEACOR Marine Holdings, Inc. (A) 3,160 40,480Superior Energy Services, Inc. (A) 62,362 513,863TechnipFMC PLC (A) 61,840 1,597,327Tenaris SA 69,283 923,216Tesco Corp. (A) 10,637 46,803TETRA Technologies, Inc. (A) 21,829 44,968Transocean, Ltd. (A)(C) 86,229 703,629U.S. Silica Holdings, Inc. 14,820 403,252Unit Corp. (A) 10,180 162,066
32,836,908Oil, gas and consumable fuels – 4.0%Abraxas Petroleum Corp. (A) 30,672 52,142Adaro Energy Tbk PT 2,589,045 355,105AltaGas, Ltd. 30,845 683,962Anadarko Petroleum Corp. 74,628 3,054,524Andeavor 19,939 1,996,891Apache Corp. 50,738 1,970,664ARC Resources, Ltd. 63,764 837,421Arch Coal, Inc., Class A (C) 3,933 314,129Ardmore Shipping Corp. (A) 5,698 46,154Banpu PCL 239,700 127,335Bill Barrett Corp. (A) 15,462 46,231Bonanza Creek Energy, Inc. (A) 3,680 95,643BP PLC 1,071,963 6,192,063Cabot Oil & Gas Corp. 61,432 1,569,588California Resources Corp. (A)(C) 7,866 61,355Callon Petroleum Company (A) 36,903 382,315Caltex Australia, Ltd. 33,109 880,525Cameco Corp. 71,056 712,409Canadian Natural Resources, Ltd. 195,155 6,012,102Carrizo Oil & Gas, Inc. (A) 12,371 166,266Cenovus Energy, Inc. 181,216 1,417,802Chesapeake Energy Corp. (A)(C) 99,037 360,495Chevron Corp. 250,694 26,979,688China Coal Energy Company, Ltd.,
H Shares 232,995 117,590China Petroleum & Chemical Corp.,
H Shares 2,988,139 2,287,495China Shenhua Energy Company, Ltd.,
H Shares 400,100 1,033,364Cimarex Energy Company 12,549 1,251,010
John Hancock Funds IIPortfolio of Investments — August 31, 2017 (showing percentage of total net assets)
153
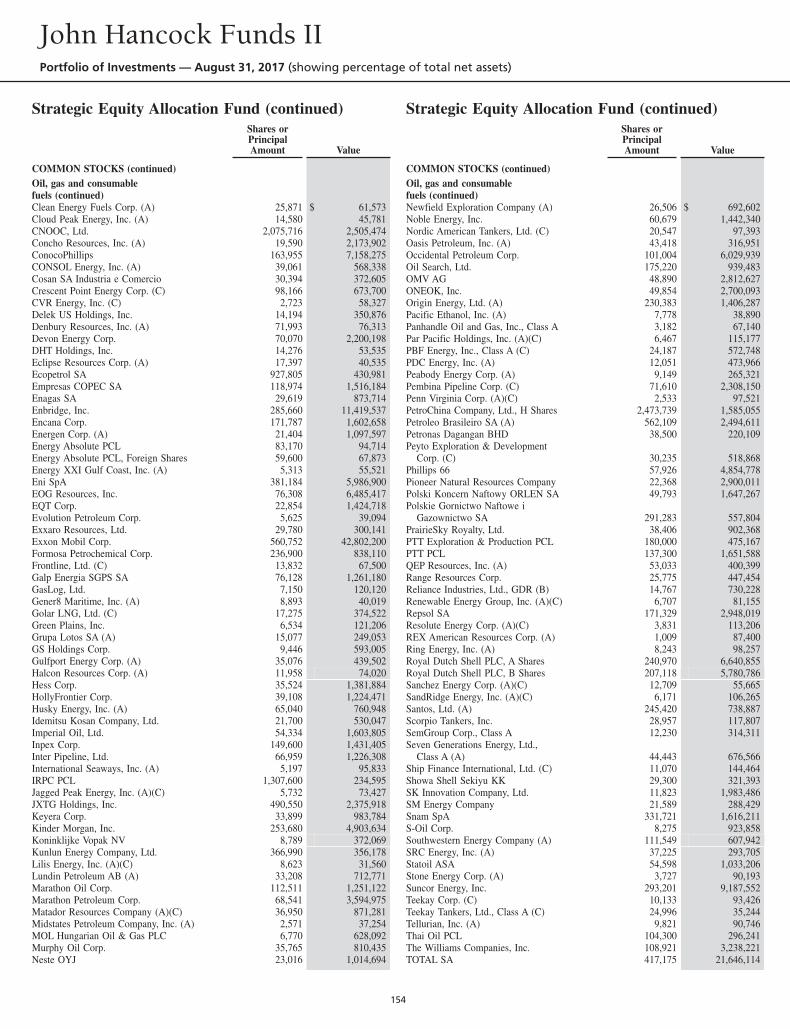
Strategic Equity Allocation Fund (continued)Shares orPrincipalAmount Value
COMMON STOCKS (continued)Oil, gas and consumablefuels (continued)Clean Energy Fuels Corp. (A) 25,871 $ 61,573Cloud Peak Energy, Inc. (A) 14,580 45,781CNOOC, Ltd. 2,075,716 2,505,474Concho Resources, Inc. (A) 19,590 2,173,902ConocoPhillips 163,955 7,158,275CONSOL Energy, Inc. (A) 39,061 568,338Cosan SA Industria e Comercio 30,394 372,605Crescent Point Energy Corp. (C) 98,166 673,700CVR Energy, Inc. (C) 2,723 58,327Delek US Holdings, Inc. 14,194 350,876Denbury Resources, Inc. (A) 71,993 76,313Devon Energy Corp. 70,070 2,200,198DHT Holdings, Inc. 14,276 53,535Eclipse Resources Corp. (A) 17,397 40,535Ecopetrol SA 927,805 430,981Empresas COPEC SA 118,974 1,516,184Enagas SA 29,619 873,714Enbridge, Inc. 285,660 11,419,537Encana Corp. 171,787 1,602,658Energen Corp. (A) 21,404 1,097,597Energy Absolute PCL 83,170 94,714Energy Absolute PCL, Foreign Shares 59,600 67,873Energy XXI Gulf Coast, Inc. (A) 5,313 55,521Eni SpA 381,184 5,986,900EOG Resources, Inc. 76,308 6,485,417EQT Corp. 22,854 1,424,718Evolution Petroleum Corp. 5,625 39,094Exxaro Resources, Ltd. 29,780 300,141Exxon Mobil Corp. 560,752 42,802,200Formosa Petrochemical Corp. 236,900 838,110Frontline, Ltd. (C) 13,832 67,500Galp Energia SGPS SA 76,128 1,261,180GasLog, Ltd. 7,150 120,120Gener8 Maritime, Inc. (A) 8,893 40,019Golar LNG, Ltd. (C) 17,275 374,522Green Plains, Inc. 6,534 121,206Grupa Lotos SA (A) 15,077 249,053GS Holdings Corp. 9,446 593,005Gulfport Energy Corp. (A) 35,076 439,502Halcon Resources Corp. (A) 11,958 74,020Hess Corp. 35,524 1,381,884HollyFrontier Corp. 39,108 1,224,471Husky Energy, Inc. (A) 65,040 760,948Idemitsu Kosan Company, Ltd. 21,700 530,047Imperial Oil, Ltd. 54,334 1,603,805Inpex Corp. 149,600 1,431,405Inter Pipeline, Ltd. 66,959 1,226,308International Seaways, Inc. (A) 5,197 95,833IRPC PCL 1,307,600 234,595Jagged Peak Energy, Inc. (A)(C) 5,732 73,427JXTG Holdings, Inc. 490,550 2,375,918Keyera Corp. 33,899 983,784Kinder Morgan, Inc. 253,680 4,903,634Koninklijke Vopak NV 8,789 372,069Kunlun Energy Company, Ltd. 366,990 356,178Lilis Energy, Inc. (A)(C) 8,623 31,560Lundin Petroleum AB (A) 33,208 712,771Marathon Oil Corp. 112,511 1,251,122Marathon Petroleum Corp. 68,541 3,594,975Matador Resources Company (A)(C) 36,950 871,281Midstates Petroleum Company, Inc. (A) 2,571 37,254MOL Hungarian Oil & Gas PLC 6,770 628,092Murphy Oil Corp. 35,765 810,435Neste OYJ 23,016 1,014,694
Strategic Equity Allocation Fund (continued)Shares orPrincipalAmount Value
COMMON STOCKS (continued)Oil, gas and consumablefuels (continued)Newfield Exploration Company (A) 26,506 $ 692,602Noble Energy, Inc. 60,679 1,442,340Nordic American Tankers, Ltd. (C) 20,547 97,393Oasis Petroleum, Inc. (A) 43,418 316,951Occidental Petroleum Corp. 101,004 6,029,939Oil Search, Ltd. 175,220 939,483OMV AG 48,890 2,812,627ONEOK, Inc. 49,854 2,700,093Origin Energy, Ltd. (A) 230,383 1,406,287Pacific Ethanol, Inc. (A) 7,778 38,890Panhandle Oil and Gas, Inc., Class A 3,182 67,140Par Pacific Holdings, Inc. (A)(C) 6,467 115,177PBF Energy, Inc., Class A (C) 24,187 572,748PDC Energy, Inc. (A) 12,051 473,966Peabody Energy Corp. (A) 9,149 265,321Pembina Pipeline Corp. (C) 71,610 2,308,150Penn Virginia Corp. (A)(C) 2,533 97,521PetroChina Company, Ltd., H Shares 2,473,739 1,585,055Petroleo Brasileiro SA (A) 562,109 2,494,611Petronas Dagangan BHD 38,500 220,109Peyto Exploration & Development
Corp. (C) 30,235 518,868Phillips 66 57,926 4,854,778Pioneer Natural Resources Company 22,368 2,900,011Polski Koncern Naftowy ORLEN SA 49,793 1,647,267Polskie Gornictwo Naftowe i
Gazownictwo SA 291,283 557,804PrairieSky Royalty, Ltd. 38,406 902,368PTT Exploration & Production PCL 180,000 475,167PTT PCL 137,300 1,651,588QEP Resources, Inc. (A) 53,033 400,399Range Resources Corp. 25,775 447,454Reliance Industries, Ltd., GDR (B) 14,767 730,228Renewable Energy Group, Inc. (A)(C) 6,707 81,155Repsol SA 171,329 2,948,019Resolute Energy Corp. (A)(C) 3,831 113,206REX American Resources Corp. (A) 1,009 87,400Ring Energy, Inc. (A) 8,243 98,257Royal Dutch Shell PLC, A Shares 240,970 6,640,855Royal Dutch Shell PLC, B Shares 207,118 5,780,786Sanchez Energy Corp. (A)(C) 12,709 55,665SandRidge Energy, Inc. (A)(C) 6,171 106,265Santos, Ltd. (A) 245,420 738,887Scorpio Tankers, Inc. 28,957 117,807SemGroup Corp., Class A 12,230 314,311Seven Generations Energy, Ltd.,
Class A (A) 44,443 676,566Ship Finance International, Ltd. (C) 11,070 144,464Showa Shell Sekiyu KK 29,300 321,393SK Innovation Company, Ltd. 11,823 1,983,486SM Energy Company 21,589 288,429Snam SpA 331,721 1,616,211S-Oil Corp. 8,275 923,858Southwestern Energy Company (A) 111,549 607,942SRC Energy, Inc. (A) 37,225 293,705Statoil ASA 54,598 1,033,206Stone Energy Corp. (A) 3,727 90,193Suncor Energy, Inc. 293,201 9,187,552Teekay Corp. (C) 10,133 93,426Teekay Tankers, Ltd., Class A (C) 24,996 35,244Tellurian, Inc. (A) 9,821 90,746Thai Oil PCL 104,300 296,241The Williams Companies, Inc. 108,921 3,238,221TOTAL SA 417,175 21,646,114
John Hancock Funds IIPortfolio of Investments — August 31, 2017 (showing percentage of total net assets)
154
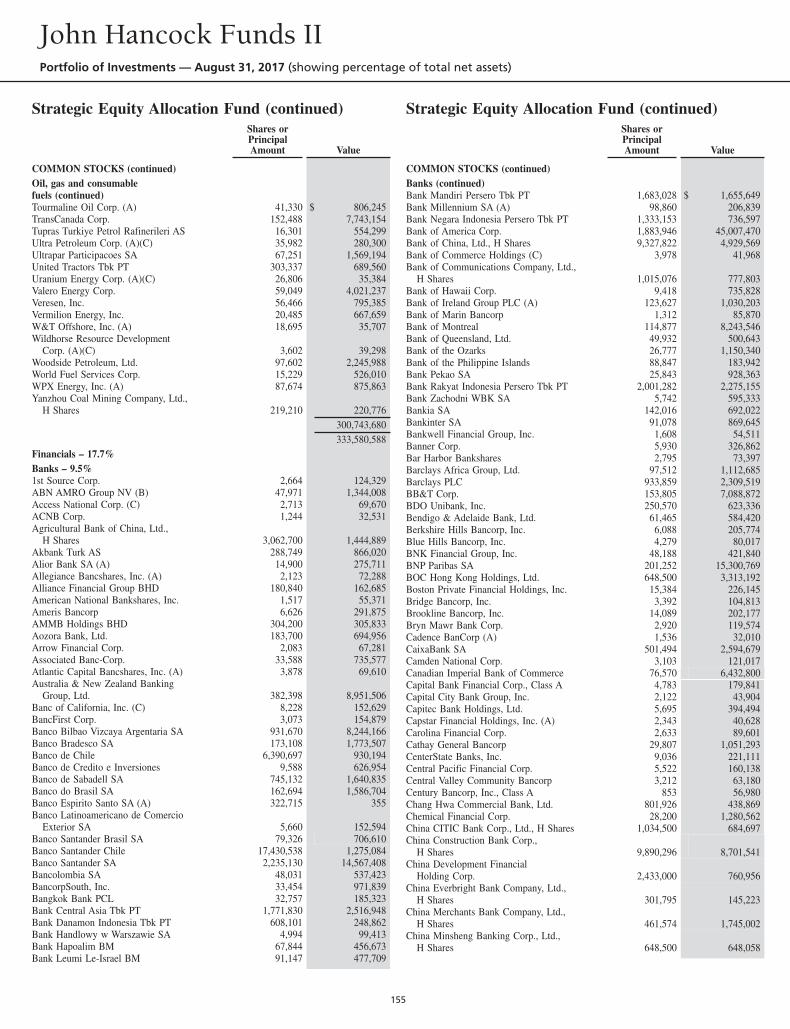
Strategic Equity Allocation Fund (continued)Shares orPrincipalAmount Value
COMMON STOCKS (continued)Oil, gas and consumablefuels (continued)Tourmaline Oil Corp. (A) 41,330 $ 806,245TransCanada Corp. 152,488 7,743,154Tupras Turkiye Petrol Rafinerileri AS 16,301 554,299Ultra Petroleum Corp. (A)(C) 35,982 280,300Ultrapar Participacoes SA 67,251 1,569,194United Tractors Tbk PT 303,337 689,560Uranium Energy Corp. (A)(C) 26,806 35,384Valero Energy Corp. 59,049 4,021,237Veresen, Inc. 56,466 795,385Vermilion Energy, Inc. 20,485 667,659W&T Offshore, Inc. (A) 18,695 35,707Wildhorse Resource Development
Corp. (A)(C) 3,602 39,298Woodside Petroleum, Ltd. 97,602 2,245,988World Fuel Services Corp. 15,229 526,010WPX Energy, Inc. (A) 87,674 875,863Yanzhou Coal Mining Company, Ltd.,
H Shares 219,210 220,776300,743,680333,580,588
Financials – 17.7%Banks – 9.5%1st Source Corp. 2,664 124,329ABN AMRO Group NV (B) 47,971 1,344,008Access National Corp. (C) 2,713 69,670ACNB Corp. 1,244 32,531Agricultural Bank of China, Ltd.,
H Shares 3,062,700 1,444,889Akbank Turk AS 288,749 866,020Alior Bank SA (A) 14,900 275,711Allegiance Bancshares, Inc. (A) 2,123 72,288Alliance Financial Group BHD 180,840 162,685American National Bankshares, Inc. 1,517 55,371Ameris Bancorp 6,626 291,875AMMB Holdings BHD 304,200 305,833Aozora Bank, Ltd. 183,700 694,956Arrow Financial Corp. 2,083 67,281Associated Banc-Corp. 33,588 735,577Atlantic Capital Bancshares, Inc. (A) 3,878 69,610Australia & New Zealand Banking
Group, Ltd. 382,398 8,951,506Banc of California, Inc. (C) 8,228 152,629BancFirst Corp. 3,073 154,879Banco Bilbao Vizcaya Argentaria SA 931,670 8,244,166Banco Bradesco SA 173,108 1,773,507Banco de Chile 6,390,697 930,194Banco de Credito e Inversiones 9,588 626,954Banco de Sabadell SA 745,132 1,640,835Banco do Brasil SA 162,694 1,586,704Banco Espirito Santo SA (A) 322,715 355Banco Latinoamericano de Comercio
Exterior SA 5,660 152,594Banco Santander Brasil SA 79,326 706,610Banco Santander Chile 17,430,538 1,275,084Banco Santander SA 2,235,130 14,567,408Bancolombia SA 48,031 537,423BancorpSouth, Inc. 33,454 971,839Bangkok Bank PCL 32,757 185,323Bank Central Asia Tbk PT 1,771,830 2,516,948Bank Danamon Indonesia Tbk PT 608,101 248,862Bank Handlowy w Warszawie SA 4,994 99,413Bank Hapoalim BM 67,844 456,673Bank Leumi Le-Israel BM 91,147 477,709
Strategic Equity Allocation Fund (continued)Shares orPrincipalAmount Value
COMMON STOCKS (continued)Banks (continued)Bank Mandiri Persero Tbk PT 1,683,028 $ 1,655,649Bank Millennium SA (A) 98,860 206,839Bank Negara Indonesia Persero Tbk PT 1,333,153 736,597Bank of America Corp. 1,883,946 45,007,470Bank of China, Ltd., H Shares 9,327,822 4,929,569Bank of Commerce Holdings (C) 3,978 41,968Bank of Communications Company, Ltd.,
H Shares 1,015,076 777,803Bank of Hawaii Corp. 9,418 735,828Bank of Ireland Group PLC (A) 123,627 1,030,203Bank of Marin Bancorp 1,312 85,870Bank of Montreal 114,877 8,243,546Bank of Queensland, Ltd. 49,932 500,643Bank of the Ozarks 26,777 1,150,340Bank of the Philippine Islands 88,847 183,942Bank Pekao SA 25,843 928,363Bank Rakyat Indonesia Persero Tbk PT 2,001,282 2,275,155Bank Zachodni WBK SA 5,742 595,333Bankia SA 142,016 692,022Bankinter SA 91,078 869,645Bankwell Financial Group, Inc. 1,608 54,511Banner Corp. 5,930 326,862Bar Harbor Bankshares 2,795 73,397Barclays Africa Group, Ltd. 97,512 1,112,685Barclays PLC 933,859 2,309,519BB&T Corp. 153,805 7,088,872BDO Unibank, Inc. 250,570 623,336Bendigo & Adelaide Bank, Ltd. 61,465 584,420Berkshire Hills Bancorp, Inc. 6,088 205,774Blue Hills Bancorp, Inc. 4,279 80,017BNK Financial Group, Inc. 48,188 421,840BNP Paribas SA 201,252 15,300,769BOC Hong Kong Holdings, Ltd. 648,500 3,313,192Boston Private Financial Holdings, Inc. 15,384 226,145Bridge Bancorp, Inc. 3,392 104,813Brookline Bancorp, Inc. 14,089 202,177Bryn Mawr Bank Corp. 2,920 119,574Cadence BanCorp (A) 1,536 32,010CaixaBank SA 501,494 2,594,679Camden National Corp. 3,103 121,017Canadian Imperial Bank of Commerce 76,570 6,432,800Capital Bank Financial Corp., Class A 4,783 179,841Capital City Bank Group, Inc. 2,122 43,904Capitec Bank Holdings, Ltd. 5,695 394,494Capstar Financial Holdings, Inc. (A) 2,343 40,628Carolina Financial Corp. 2,633 89,601Cathay General Bancorp 29,807 1,051,293CenterState Banks, Inc. 9,036 221,111Central Pacific Financial Corp. 5,522 160,138Central Valley Community Bancorp 3,212 63,180Century Bancorp, Inc., Class A 853 56,980Chang Hwa Commercial Bank, Ltd. 801,926 438,869Chemical Financial Corp. 28,200 1,280,562China CITIC Bank Corp., Ltd., H Shares 1,034,500 684,697China Construction Bank Corp.,
H Shares 9,890,296 8,701,541China Development Financial
Holding Corp. 2,433,000 760,956China Everbright Bank Company, Ltd.,
H Shares 301,795 145,223China Merchants Bank Company, Ltd.,
H Shares 461,574 1,745,002China Minsheng Banking Corp., Ltd.,
H Shares 648,500 648,058
John Hancock Funds IIPortfolio of Investments — August 31, 2017 (showing percentage of total net assets)
155
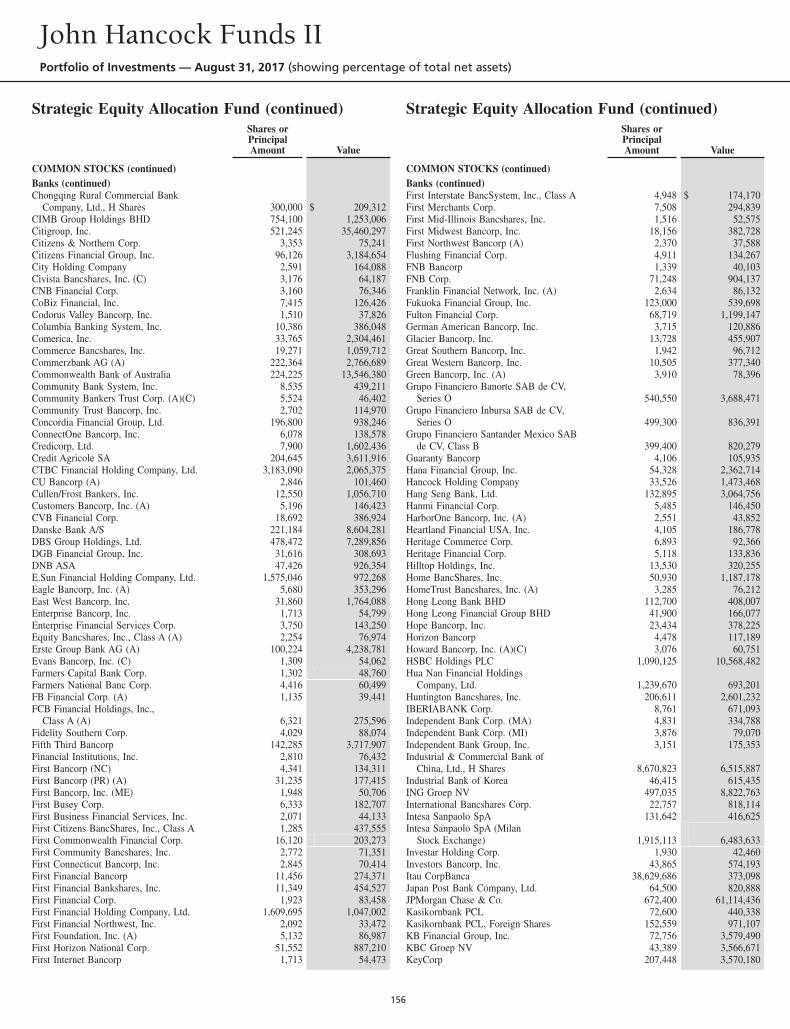
Strategic Equity Allocation Fund (continued)Shares orPrincipalAmount Value
COMMON STOCKS (continued)Banks (continued)Chongqing Rural Commercial Bank
Company, Ltd., H Shares 300,000 $ 209,312CIMB Group Holdings BHD 754,100 1,253,006Citigroup, Inc. 521,245 35,460,297Citizens & Northern Corp. 3,353 75,241Citizens Financial Group, Inc. 96,126 3,184,654City Holding Company 2,591 164,088Civista Bancshares, Inc. (C) 3,176 64,187CNB Financial Corp. 3,160 76,346CoBiz Financial, Inc. 7,415 126,426Codorus Valley Bancorp, Inc. 1,510 37,826Columbia Banking System, Inc. 10,386 386,048Comerica, Inc. 33,765 2,304,461Commerce Bancshares, Inc. 19,271 1,059,712Commerzbank AG (A) 222,364 2,766,689Commonwealth Bank of Australia 224,225 13,546,380Community Bank System, Inc. 8,535 439,211Community Bankers Trust Corp. (A)(C) 5,524 46,402Community Trust Bancorp, Inc. 2,702 114,970Concordia Financial Group, Ltd. 196,800 938,246ConnectOne Bancorp, Inc. 6,078 138,578Credicorp, Ltd. 7,900 1,602,436Credit Agricole SA 204,645 3,611,916CTBC Financial Holding Company, Ltd. 3,183,090 2,065,375CU Bancorp (A) 2,846 101,460Cullen/Frost Bankers, Inc. 12,550 1,056,710Customers Bancorp, Inc. (A) 5,196 146,423CVB Financial Corp. 18,692 386,924Danske Bank A/S 221,184 8,604,281DBS Group Holdings, Ltd. 478,472 7,289,856DGB Financial Group, Inc. 31,616 308,693DNB ASA 47,426 926,354E.Sun Financial Holding Company, Ltd. 1,575,046 972,268Eagle Bancorp, Inc. (A) 5,680 353,296East West Bancorp, Inc. 31,860 1,764,088Enterprise Bancorp, Inc. 1,713 54,799Enterprise Financial Services Corp. 3,750 143,250Equity Bancshares, Inc., Class A (A) 2,254 76,974Erste Group Bank AG (A) 100,224 4,238,781Evans Bancorp, Inc. (C) 1,309 54,062Farmers Capital Bank Corp. 1,302 48,760Farmers National Banc Corp. 4,416 60,499FB Financial Corp. (A) 1,135 39,441FCB Financial Holdings, Inc.,
Class A (A) 6,321 275,596Fidelity Southern Corp. 4,029 88,074Fifth Third Bancorp 142,285 3,717,907Financial Institutions, Inc. 2,810 76,432First Bancorp (NC) 4,341 134,311First Bancorp (PR) (A) 31,235 177,415First Bancorp, Inc. (ME) 1,948 50,706First Busey Corp. 6,333 182,707First Business Financial Services, Inc. 2,071 44,133First Citizens BancShares, Inc., Class A 1,285 437,555First Commonwealth Financial Corp. 16,120 203,273First Community Bancshares, Inc. 2,772 71,351First Connecticut Bancorp, Inc. 2,845 70,414First Financial Bancorp 11,456 274,371First Financial Bankshares, Inc. 11,349 454,527First Financial Corp. 1,923 83,458First Financial Holding Company, Ltd. 1,609,695 1,047,002First Financial Northwest, Inc. 2,092 33,472First Foundation, Inc. (A) 5,132 86,987First Horizon National Corp. 51,552 887,210First Internet Bancorp 1,713 54,473
Strategic Equity Allocation Fund (continued)Shares orPrincipalAmount Value
COMMON STOCKS (continued)Banks (continued)First Interstate BancSystem, Inc., Class A 4,948 $ 174,170First Merchants Corp. 7,508 294,839First Mid-Illinois Bancshares, Inc. 1,516 52,575First Midwest Bancorp, Inc. 18,156 382,728First Northwest Bancorp (A) 2,370 37,588Flushing Financial Corp. 4,911 134,267FNB Bancorp 1,339 40,103FNB Corp. 71,248 904,137Franklin Financial Network, Inc. (A) 2,634 86,132Fukuoka Financial Group, Inc. 123,000 539,698Fulton Financial Corp. 68,719 1,199,147German American Bancorp, Inc. 3,715 120,886Glacier Bancorp, Inc. 13,728 455,907Great Southern Bancorp, Inc. 1,942 96,712Great Western Bancorp, Inc. 10,505 377,340Green Bancorp, Inc. (A) 3,910 78,396Grupo Financiero Banorte SAB de CV,
Series O 540,550 3,688,471Grupo Financiero Inbursa SAB de CV,
Series O 499,300 836,391Grupo Financiero Santander Mexico SAB
de CV, Class B 399,400 820,279Guaranty Bancorp 4,106 105,935Hana Financial Group, Inc. 54,328 2,362,714Hancock Holding Company 33,526 1,473,468Hang Seng Bank, Ltd. 132,895 3,064,756Hanmi Financial Corp. 5,485 146,450HarborOne Bancorp, Inc. (A) 2,551 43,852Heartland Financial USA, Inc. 4,105 186,778Heritage Commerce Corp. 6,893 92,366Heritage Financial Corp. 5,118 133,836Hilltop Holdings, Inc. 13,530 320,255Home BancShares, Inc. 50,930 1,187,178HomeTrust Bancshares, Inc. (A) 3,285 76,212Hong Leong Bank BHD 112,700 408,007Hong Leong Financial Group BHD 41,900 166,077Hope Bancorp, Inc. 23,434 378,225Horizon Bancorp 4,478 117,189Howard Bancorp, Inc. (A)(C) 3,076 60,751HSBC Holdings PLC 1,090,125 10,568,482Hua Nan Financial Holdings
Company, Ltd. 1,239,670 693,201Huntington Bancshares, Inc. 206,611 2,601,232IBERIABANK Corp. 8,761 671,093Independent Bank Corp. (MA) 4,831 334,788Independent Bank Corp. (MI) 3,876 79,070Independent Bank Group, Inc. 3,151 175,353Industrial & Commercial Bank of
China, Ltd., H Shares 8,670,823 6,515,887Industrial Bank of Korea 46,415 615,435ING Groep NV 497,035 8,822,763International Bancshares Corp. 22,757 818,114Intesa Sanpaolo SpA 131,642 416,625Intesa Sanpaolo SpA (Milan
Stock Exchange) 1,915,113 6,483,633Investar Holding Corp. 1,930 42,460Investors Bancorp, Inc. 43,865 574,193Itau CorpBanca 38,629,686 373,098Japan Post Bank Company, Ltd. 64,500 820,888JPMorgan Chase & Co. 672,400 61,114,436Kasikornbank PCL 72,600 440,338Kasikornbank PCL, Foreign Shares 152,559 971,107KB Financial Group, Inc. 72,756 3,579,490KBC Groep NV 43,389 3,566,671KeyCorp 207,448 3,570,180
John Hancock Funds IIPortfolio of Investments — August 31, 2017 (showing percentage of total net assets)
156
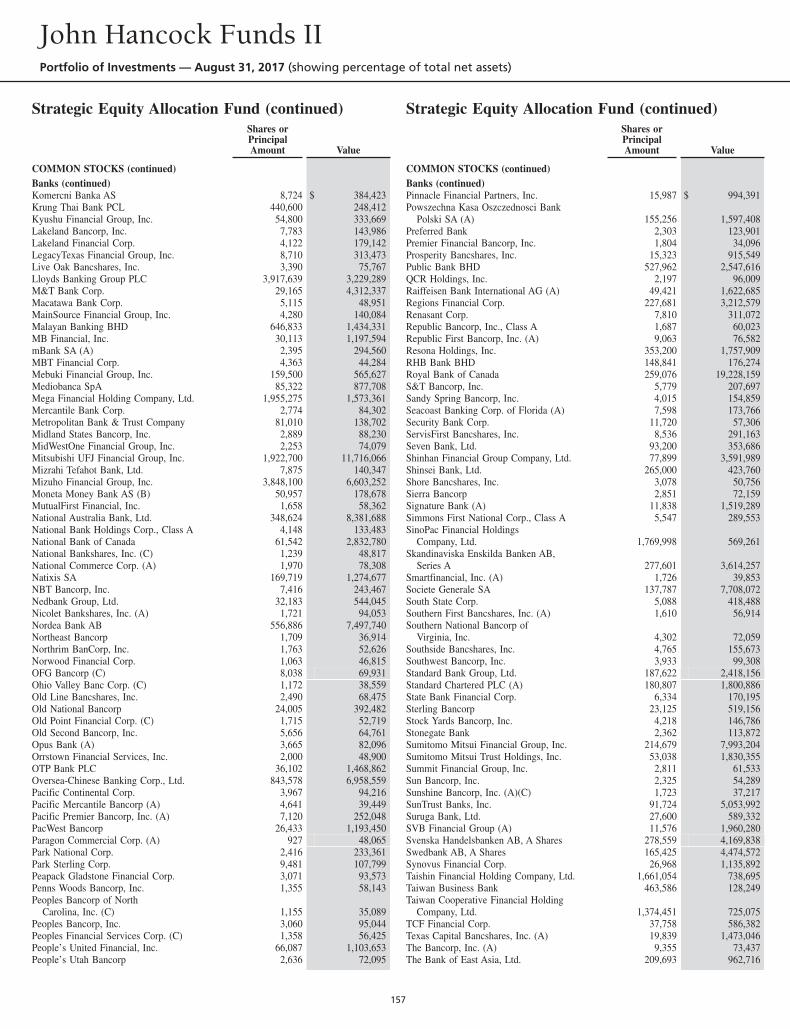
Strategic Equity Allocation Fund (continued)Shares orPrincipalAmount Value
COMMON STOCKS (continued)Banks (continued)Komercni Banka AS 8,724 $ 384,423Krung Thai Bank PCL 440,600 248,412Kyushu Financial Group, Inc. 54,800 333,669Lakeland Bancorp, Inc. 7,783 143,986Lakeland Financial Corp. 4,122 179,142LegacyTexas Financial Group, Inc. 8,710 313,473Live Oak Bancshares, Inc. 3,390 75,767Lloyds Banking Group PLC 3,917,639 3,229,289M&T Bank Corp. 29,165 4,312,337Macatawa Bank Corp. 5,115 48,951MainSource Financial Group, Inc. 4,280 140,084Malayan Banking BHD 646,833 1,434,331MB Financial, Inc. 30,113 1,197,594mBank SA (A) 2,395 294,560MBT Financial Corp. 4,363 44,284Mebuki Financial Group, Inc. 159,500 565,627Mediobanca SpA 85,322 877,708Mega Financial Holding Company, Ltd. 1,955,275 1,573,361Mercantile Bank Corp. 2,774 84,302Metropolitan Bank & Trust Company 81,010 138,702Midland States Bancorp, Inc. 2,889 88,230MidWestOne Financial Group, Inc. 2,253 74,079Mitsubishi UFJ Financial Group, Inc. 1,922,700 11,716,066Mizrahi Tefahot Bank, Ltd. 7,875 140,347Mizuho Financial Group, Inc. 3,848,100 6,603,252Moneta Money Bank AS (B) 50,957 178,678MutualFirst Financial, Inc. 1,658 58,362National Australia Bank, Ltd. 348,624 8,381,688National Bank Holdings Corp., Class A 4,148 133,483National Bank of Canada 61,542 2,832,780National Bankshares, Inc. (C) 1,239 48,817National Commerce Corp. (A) 1,970 78,308Natixis SA 169,719 1,274,677NBT Bancorp, Inc. 7,416 243,467Nedbank Group, Ltd. 32,183 544,045Nicolet Bankshares, Inc. (A) 1,721 94,053Nordea Bank AB 556,886 7,497,740Northeast Bancorp 1,709 36,914Northrim BanCorp, Inc. 1,763 52,626Norwood Financial Corp. 1,063 46,815OFG Bancorp (C) 8,038 69,931Ohio Valley Banc Corp. (C) 1,172 38,559Old Line Bancshares, Inc. 2,490 68,475Old National Bancorp 24,005 392,482Old Point Financial Corp. (C) 1,715 52,719Old Second Bancorp, Inc. 5,656 64,761Opus Bank (A) 3,665 82,096Orrstown Financial Services, Inc. 2,000 48,900OTP Bank PLC 36,102 1,468,862Oversea-Chinese Banking Corp., Ltd. 843,578 6,958,559Pacific Continental Corp. 3,967 94,216Pacific Mercantile Bancorp (A) 4,641 39,449Pacific Premier Bancorp, Inc. (A) 7,120 252,048PacWest Bancorp 26,433 1,193,450Paragon Commercial Corp. (A) 927 48,065Park National Corp. 2,416 233,361Park Sterling Corp. 9,481 107,799Peapack Gladstone Financial Corp. 3,071 93,573Penns Woods Bancorp, Inc. 1,355 58,143Peoples Bancorp of North
Carolina, Inc. (C) 1,155 35,089Peoples Bancorp, Inc. 3,060 95,044Peoples Financial Services Corp. (C) 1,358 56,425People’s United Financial, Inc. 66,087 1,103,653People’s Utah Bancorp 2,636 72,095
Strategic Equity Allocation Fund (continued)Shares orPrincipalAmount Value
COMMON STOCKS (continued)Banks (continued)Pinnacle Financial Partners, Inc. 15,987 $ 994,391Powszechna Kasa Oszczednosci Bank
Polski SA (A) 155,256 1,597,408Preferred Bank 2,303 123,901Premier Financial Bancorp, Inc. 1,804 34,096Prosperity Bancshares, Inc. 15,323 915,549Public Bank BHD 527,962 2,547,616QCR Holdings, Inc. 2,197 96,009Raiffeisen Bank International AG (A) 49,421 1,622,685Regions Financial Corp. 227,681 3,212,579Renasant Corp. 7,810 311,072Republic Bancorp, Inc., Class A 1,687 60,023Republic First Bancorp, Inc. (A) 9,063 76,582Resona Holdings, Inc. 353,200 1,757,909RHB Bank BHD 148,841 176,274Royal Bank of Canada 259,076 19,228,159S&T Bancorp, Inc. 5,779 207,697Sandy Spring Bancorp, Inc. 4,015 154,859Seacoast Banking Corp. of Florida (A) 7,598 173,766Security Bank Corp. 11,720 57,306ServisFirst Bancshares, Inc. 8,536 291,163Seven Bank, Ltd. 93,200 353,686Shinhan Financial Group Company, Ltd. 77,899 3,591,989Shinsei Bank, Ltd. 265,000 423,760Shore Bancshares, Inc. 3,078 50,756Sierra Bancorp 2,851 72,159Signature Bank (A) 11,838 1,519,289Simmons First National Corp., Class A 5,547 289,553SinoPac Financial Holdings
Company, Ltd. 1,769,998 569,261Skandinaviska Enskilda Banken AB,
Series A 277,601 3,614,257Smartfinancial, Inc. (A) 1,726 39,853Societe Generale SA 137,787 7,708,072South State Corp. 5,088 418,488Southern First Bancshares, Inc. (A) 1,610 56,914Southern National Bancorp of
Virginia, Inc. 4,302 72,059Southside Bancshares, Inc. 4,765 155,673Southwest Bancorp, Inc. 3,933 99,308Standard Bank Group, Ltd. 187,622 2,418,156Standard Chartered PLC (A) 180,807 1,800,886State Bank Financial Corp. 6,334 170,195Sterling Bancorp 23,125 519,156Stock Yards Bancorp, Inc. 4,218 146,786Stonegate Bank 2,362 113,872Sumitomo Mitsui Financial Group, Inc. 214,679 7,993,204Sumitomo Mitsui Trust Holdings, Inc. 53,038 1,830,355Summit Financial Group, Inc. 2,811 61,533Sun Bancorp, Inc. 2,325 54,289Sunshine Bancorp, Inc. (A)(C) 1,723 37,217SunTrust Banks, Inc. 91,724 5,053,992Suruga Bank, Ltd. 27,600 589,332SVB Financial Group (A) 11,576 1,960,280Svenska Handelsbanken AB, A Shares 278,559 4,169,838Swedbank AB, A Shares 165,425 4,474,572Synovus Financial Corp. 26,968 1,135,892Taishin Financial Holding Company, Ltd. 1,661,054 738,695Taiwan Business Bank 463,586 128,249Taiwan Cooperative Financial Holding
Company, Ltd. 1,374,451 725,075TCF Financial Corp. 37,758 586,382Texas Capital Bancshares, Inc. (A) 19,839 1,473,046The Bancorp, Inc. (A) 9,355 73,437The Bank of East Asia, Ltd. 209,693 962,716
John Hancock Funds IIPortfolio of Investments — August 31, 2017 (showing percentage of total net assets)
157
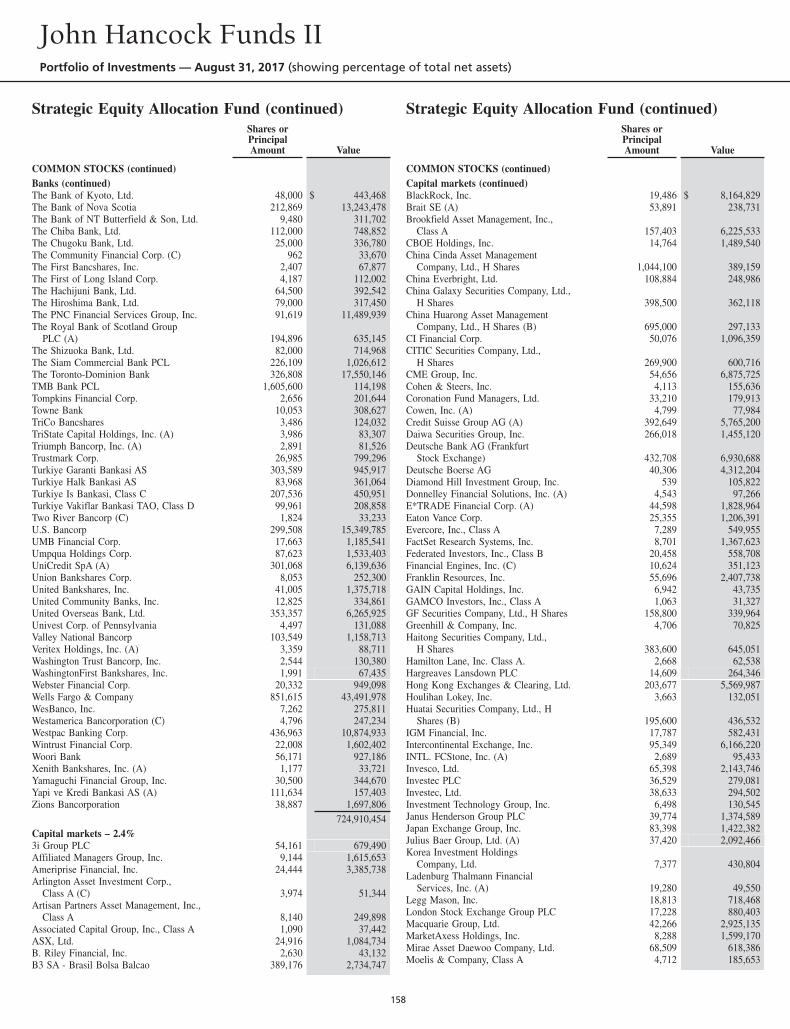
Strategic Equity Allocation Fund (continued)Shares orPrincipalAmount Value
COMMON STOCKS (continued)Banks (continued)The Bank of Kyoto, Ltd. 48,000 $ 443,468The Bank of Nova Scotia 212,869 13,243,478The Bank of NT Butterfield & Son, Ltd. 9,480 311,702The Chiba Bank, Ltd. 112,000 748,852The Chugoku Bank, Ltd. 25,000 336,780The Community Financial Corp. (C) 962 33,670The First Bancshares, Inc. 2,407 67,877The First of Long Island Corp. 4,187 112,002The Hachijuni Bank, Ltd. 64,500 392,542The Hiroshima Bank, Ltd. 79,000 317,450The PNC Financial Services Group, Inc. 91,619 11,489,939The Royal Bank of Scotland Group
PLC (A) 194,896 635,145The Shizuoka Bank, Ltd. 82,000 714,968The Siam Commercial Bank PCL 226,109 1,026,612The Toronto-Dominion Bank 326,808 17,550,146TMB Bank PCL 1,605,600 114,198Tompkins Financial Corp. 2,656 201,644Towne Bank 10,053 308,627TriCo Bancshares 3,486 124,032TriState Capital Holdings, Inc. (A) 3,986 83,307Triumph Bancorp, Inc. (A) 2,891 81,526Trustmark Corp. 26,985 799,296Turkiye Garanti Bankasi AS 303,589 945,917Turkiye Halk Bankasi AS 83,968 361,064Turkiye Is Bankasi, Class C 207,536 450,951Turkiye Vakiflar Bankasi TAO, Class D 99,961 208,858Two River Bancorp (C) 1,824 33,233U.S. Bancorp 299,508 15,349,785UMB Financial Corp. 17,663 1,185,541Umpqua Holdings Corp. 87,623 1,533,403UniCredit SpA (A) 301,068 6,139,636Union Bankshares Corp. 8,053 252,300United Bankshares, Inc. 41,005 1,375,718United Community Banks, Inc. 12,825 334,861United Overseas Bank, Ltd. 353,357 6,265,925Univest Corp. of Pennsylvania 4,497 131,088Valley National Bancorp 103,549 1,158,713Veritex Holdings, Inc. (A) 3,359 88,711Washington Trust Bancorp, Inc. 2,544 130,380WashingtonFirst Bankshares, Inc. 1,991 67,435Webster Financial Corp. 20,332 949,098Wells Fargo & Company 851,615 43,491,978WesBanco, Inc. 7,262 275,811Westamerica Bancorporation (C) 4,796 247,234Westpac Banking Corp. 436,963 10,874,933Wintrust Financial Corp. 22,008 1,602,402Woori Bank 56,171 927,186Xenith Bankshares, Inc. (A) 1,177 33,721Yamaguchi Financial Group, Inc. 30,500 344,670Yapi ve Kredi Bankasi AS (A) 111,634 157,403Zions Bancorporation 38,887 1,697,806
724,910,454Capital markets – 2.4%3i Group PLC 54,161 679,490Affiliated Managers Group, Inc. 9,144 1,615,653Ameriprise Financial, Inc. 24,444 3,385,738Arlington Asset Investment Corp.,
Class A (C) 3,974 51,344Artisan Partners Asset Management, Inc.,
Class A 8,140 249,898Associated Capital Group, Inc., Class A 1,090 37,442ASX, Ltd. 24,916 1,084,734B. Riley Financial, Inc. 2,630 43,132B3 SA - Brasil Bolsa Balcao 389,176 2,734,747
Strategic Equity Allocation Fund (continued)Shares orPrincipalAmount Value
COMMON STOCKS (continued)Capital markets (continued)BlackRock, Inc. 19,486 $ 8,164,829Brait SE (A) 53,891 238,731Brookfield Asset Management, Inc.,
Class A 157,403 6,225,533CBOE Holdings, Inc. 14,764 1,489,540China Cinda Asset Management
Company, Ltd., H Shares 1,044,100 389,159China Everbright, Ltd. 108,884 248,986China Galaxy Securities Company, Ltd.,
H Shares 398,500 362,118China Huarong Asset Management
Company, Ltd., H Shares (B) 695,000 297,133CI Financial Corp. 50,076 1,096,359CITIC Securities Company, Ltd.,
H Shares 269,900 600,716CME Group, Inc. 54,656 6,875,725Cohen & Steers, Inc. 4,113 155,636Coronation Fund Managers, Ltd. 33,210 179,913Cowen, Inc. (A) 4,799 77,984Credit Suisse Group AG (A) 392,649 5,765,200Daiwa Securities Group, Inc. 266,018 1,455,120Deutsche Bank AG (Frankfurt
Stock Exchange) 432,708 6,930,688Deutsche Boerse AG 40,306 4,312,204Diamond Hill Investment Group, Inc. 539 105,822Donnelley Financial Solutions, Inc. (A) 4,543 97,266E*TRADE Financial Corp. (A) 44,598 1,828,964Eaton Vance Corp. 25,355 1,206,391Evercore, Inc., Class A 7,289 549,955FactSet Research Systems, Inc. 8,701 1,367,623Federated Investors, Inc., Class B 20,458 558,708Financial Engines, Inc. (C) 10,624 351,123Franklin Resources, Inc. 55,696 2,407,738GAIN Capital Holdings, Inc. 6,942 43,735GAMCO Investors, Inc., Class A 1,063 31,327GF Securities Company, Ltd., H Shares 158,800 339,964Greenhill & Company, Inc. 4,706 70,825Haitong Securities Company, Ltd.,
H Shares 383,600 645,051Hamilton Lane, Inc. Class A. 2,668 62,538Hargreaves Lansdown PLC 14,609 264,346Hong Kong Exchanges & Clearing, Ltd. 203,677 5,569,987Houlihan Lokey, Inc. 3,663 132,051Huatai Securities Company, Ltd., H
Shares (B) 195,600 436,532IGM Financial, Inc. 17,787 582,431Intercontinental Exchange, Inc. 95,349 6,166,220INTL. FCStone, Inc. (A) 2,689 95,433Invesco, Ltd. 65,398 2,143,746Investec PLC 36,529 279,081Investec, Ltd. 38,633 294,502Investment Technology Group, Inc. 6,498 130,545Janus Henderson Group PLC 39,774 1,374,589Japan Exchange Group, Inc. 83,398 1,422,382Julius Baer Group, Ltd. (A) 37,420 2,092,466Korea Investment Holdings
Company, Ltd. 7,377 430,804Ladenburg Thalmann Financial
Services, Inc. (A) 19,280 49,550Legg Mason, Inc. 18,813 718,468London Stock Exchange Group PLC 17,228 880,403Macquarie Group, Ltd. 42,266 2,925,135MarketAxess Holdings, Inc. 8,288 1,599,170Mirae Asset Daewoo Company, Ltd. 68,509 618,386Moelis & Company, Class A 4,712 185,653
John Hancock Funds IIPortfolio of Investments — August 31, 2017 (showing percentage of total net assets)
158
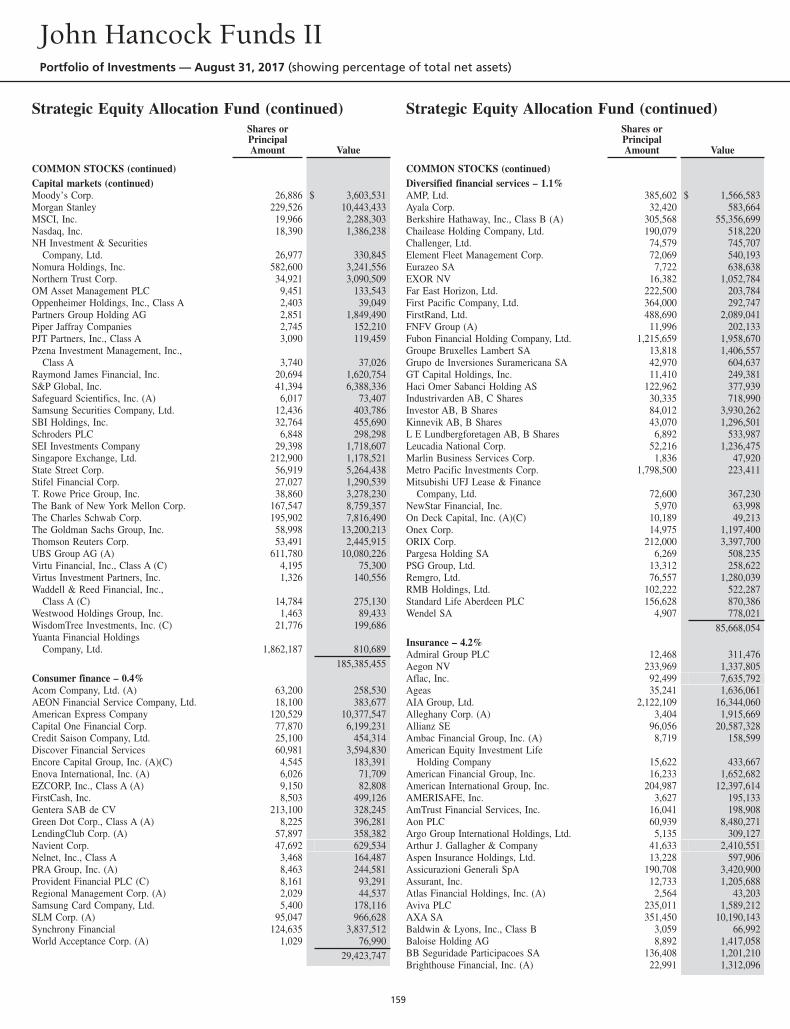
Strategic Equity Allocation Fund (continued)Shares orPrincipalAmount Value
COMMON STOCKS (continued)Capital markets (continued)Moody’s Corp. 26,886 $ 3,603,531Morgan Stanley 229,526 10,443,433MSCI, Inc. 19,966 2,288,303Nasdaq, Inc. 18,390 1,386,238NH Investment & Securities
Company, Ltd. 26,977 330,845Nomura Holdings, Inc. 582,600 3,241,556Northern Trust Corp. 34,921 3,090,509OM Asset Management PLC 9,451 133,543Oppenheimer Holdings, Inc., Class A 2,403 39,049Partners Group Holding AG 2,851 1,849,490Piper Jaffray Companies 2,745 152,210PJT Partners, Inc., Class A 3,090 119,459Pzena Investment Management, Inc.,
Class A 3,740 37,026Raymond James Financial, Inc. 20,694 1,620,754S&P Global, Inc. 41,394 6,388,336Safeguard Scientifics, Inc. (A) 6,017 73,407Samsung Securities Company, Ltd. 12,436 403,786SBI Holdings, Inc. 32,764 455,690Schroders PLC 6,848 298,298SEI Investments Company 29,398 1,718,607Singapore Exchange, Ltd. 212,900 1,178,521State Street Corp. 56,919 5,264,438Stifel Financial Corp. 27,027 1,290,539T. Rowe Price Group, Inc. 38,860 3,278,230The Bank of New York Mellon Corp. 167,547 8,759,357The Charles Schwab Corp. 195,902 7,816,490The Goldman Sachs Group, Inc. 58,998 13,200,213Thomson Reuters Corp. 53,491 2,445,915UBS Group AG (A) 611,780 10,080,226Virtu Financial, Inc., Class A (C) 4,195 75,300Virtus Investment Partners, Inc. 1,326 140,556Waddell & Reed Financial, Inc.,
Class A (C) 14,784 275,130Westwood Holdings Group, Inc. 1,463 89,433WisdomTree Investments, Inc. (C) 21,776 199,686Yuanta Financial Holdings
Company, Ltd. 1,862,187 810,689185,385,455
Consumer finance – 0.4%Acom Company, Ltd. (A) 63,200 258,530AEON Financial Service Company, Ltd. 18,100 383,677American Express Company 120,529 10,377,547Capital One Financial Corp. 77,870 6,199,231Credit Saison Company, Ltd. 25,100 454,314Discover Financial Services 60,981 3,594,830Encore Capital Group, Inc. (A)(C) 4,545 183,391Enova International, Inc. (A) 6,026 71,709EZCORP, Inc., Class A (A) 9,150 82,808FirstCash, Inc. 8,503 499,126Gentera SAB de CV 213,100 328,245Green Dot Corp., Class A (A) 8,225 396,281LendingClub Corp. (A) 57,897 358,382Navient Corp. 47,692 629,534Nelnet, Inc., Class A 3,468 164,487PRA Group, Inc. (A) 8,463 244,581Provident Financial PLC (C) 8,161 93,291Regional Management Corp. (A) 2,029 44,537Samsung Card Company, Ltd. 5,400 178,116SLM Corp. (A) 95,047 966,628Synchrony Financial 124,635 3,837,512World Acceptance Corp. (A) 1,029 76,990
29,423,747
Strategic Equity Allocation Fund (continued)Shares orPrincipalAmount Value
COMMON STOCKS (continued)Diversified financial services – 1.1%AMP, Ltd. 385,602 $ 1,566,583Ayala Corp. 32,420 583,664Berkshire Hathaway, Inc., Class B (A) 305,568 55,356,699Chailease Holding Company, Ltd. 190,079 518,220Challenger, Ltd. 74,579 745,707Element Fleet Management Corp. 72,069 540,193Eurazeo SA 7,722 638,638EXOR NV 16,382 1,052,784Far East Horizon, Ltd. 222,500 203,784First Pacific Company, Ltd. 364,000 292,747FirstRand, Ltd. 488,690 2,089,041FNFV Group (A) 11,996 202,133Fubon Financial Holding Company, Ltd. 1,215,659 1,958,670Groupe Bruxelles Lambert SA 13,818 1,406,557Grupo de Inversiones Suramericana SA 42,970 604,637GT Capital Holdings, Inc. 11,410 249,381Haci Omer Sabanci Holding AS 122,962 377,939Industrivarden AB, C Shares 30,335 718,990Investor AB, B Shares 84,012 3,930,262Kinnevik AB, B Shares 43,070 1,296,501L E Lundbergforetagen AB, B Shares 6,892 533,987Leucadia National Corp. 52,216 1,236,475Marlin Business Services Corp. 1,836 47,920Metro Pacific Investments Corp. 1,798,500 223,411Mitsubishi UFJ Lease & Finance
Company, Ltd. 72,600 367,230NewStar Financial, Inc. 5,970 63,998On Deck Capital, Inc. (A)(C) 10,189 49,213Onex Corp. 14,975 1,197,400ORIX Corp. 212,000 3,397,700Pargesa Holding SA 6,269 508,235PSG Group, Ltd. 13,312 258,622Remgro, Ltd. 76,557 1,280,039RMB Holdings, Ltd. 102,222 522,287Standard Life Aberdeen PLC 156,628 870,386Wendel SA 4,907 778,021
85,668,054Insurance – 4.2%Admiral Group PLC 12,468 311,476Aegon NV 233,969 1,337,805Aflac, Inc. 92,499 7,635,792Ageas 35,241 1,636,061AIA Group, Ltd. 2,122,109 16,344,060Alleghany Corp. (A) 3,404 1,915,669Allianz SE 96,056 20,587,328Ambac Financial Group, Inc. (A) 8,719 158,599American Equity Investment Life
Holding Company 15,622 433,667American Financial Group, Inc. 16,233 1,652,682American International Group, Inc. 204,987 12,397,614AMERISAFE, Inc. 3,627 195,133AmTrust Financial Services, Inc. 16,041 198,908Aon PLC 60,939 8,480,271Argo Group International Holdings, Ltd. 5,135 309,127Arthur J. Gallagher & Company 41,633 2,410,551Aspen Insurance Holdings, Ltd. 13,228 597,906Assicurazioni Generali SpA 190,708 3,420,900Assurant, Inc. 12,733 1,205,688Atlas Financial Holdings, Inc. (A) 2,564 43,203Aviva PLC 235,011 1,589,212AXA SA 351,450 10,190,143Baldwin & Lyons, Inc., Class B 3,059 66,992Baloise Holding AG 8,892 1,417,058BB Seguridade Participacoes SA 136,408 1,201,210Brighthouse Financial, Inc. (A) 22,991 1,312,096
John Hancock Funds IIPortfolio of Investments — August 31, 2017 (showing percentage of total net assets)
159
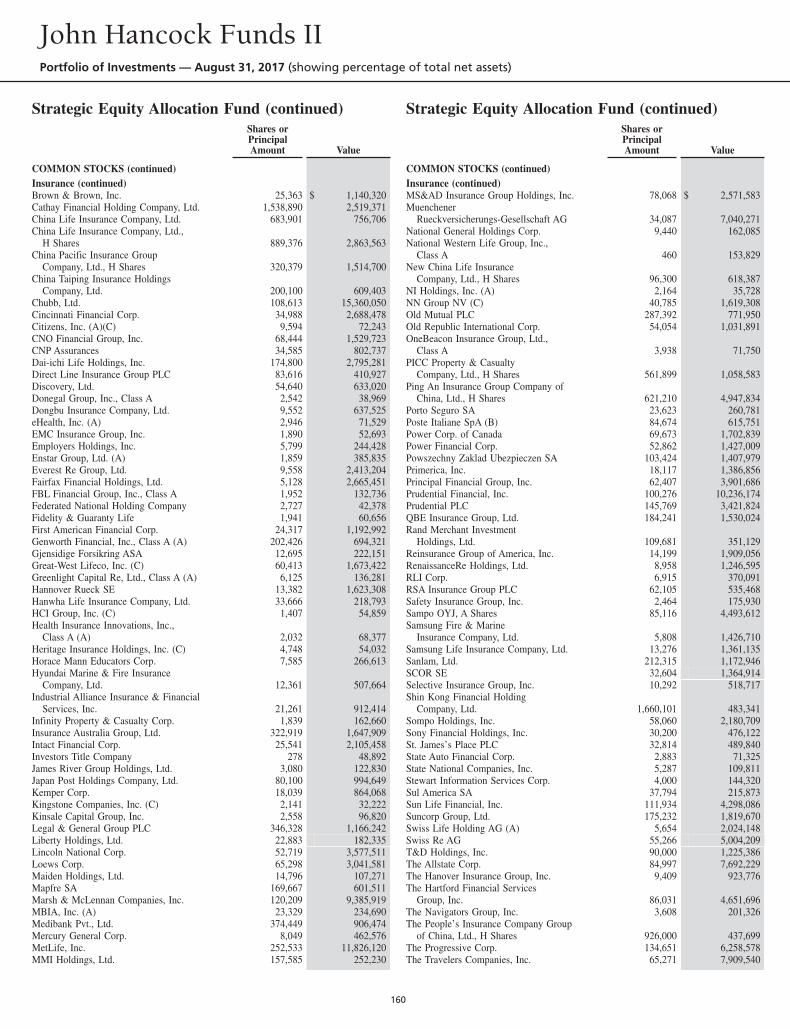
Strategic Equity Allocation Fund (continued)Shares orPrincipalAmount Value
COMMON STOCKS (continued)Insurance (continued)Brown & Brown, Inc. 25,363 $ 1,140,320Cathay Financial Holding Company, Ltd. 1,538,890 2,519,371China Life Insurance Company, Ltd. 683,901 756,706China Life Insurance Company, Ltd.,
H Shares 889,376 2,863,563China Pacific Insurance Group
Company, Ltd., H Shares 320,379 1,514,700China Taiping Insurance Holdings
Company, Ltd. 200,100 609,403Chubb, Ltd. 108,613 15,360,050Cincinnati Financial Corp. 34,988 2,688,478Citizens, Inc. (A)(C) 9,594 72,243CNO Financial Group, Inc. 68,444 1,529,723CNP Assurances 34,585 802,737Dai-ichi Life Holdings, Inc. 174,800 2,795,281Direct Line Insurance Group PLC 83,616 410,927Discovery, Ltd. 54,640 633,020Donegal Group, Inc., Class A 2,542 38,969Dongbu Insurance Company, Ltd. 9,552 637,525eHealth, Inc. (A) 2,946 71,529EMC Insurance Group, Inc. 1,890 52,693Employers Holdings, Inc. 5,799 244,428Enstar Group, Ltd. (A) 1,859 385,835Everest Re Group, Ltd. 9,558 2,413,204Fairfax Financial Holdings, Ltd. 5,128 2,665,451FBL Financial Group, Inc., Class A 1,952 132,736Federated National Holding Company 2,727 42,378Fidelity & Guaranty Life 1,941 60,656First American Financial Corp. 24,317 1,192,992Genworth Financial, Inc., Class A (A) 202,426 694,321Gjensidige Forsikring ASA 12,695 222,151Great-West Lifeco, Inc. (C) 60,413 1,673,422Greenlight Capital Re, Ltd., Class A (A) 6,125 136,281Hannover Rueck SE 13,382 1,623,308Hanwha Life Insurance Company, Ltd. 33,666 218,793HCI Group, Inc. (C) 1,407 54,859Health Insurance Innovations, Inc.,
Class A (A) 2,032 68,377Heritage Insurance Holdings, Inc. (C) 4,748 54,032Horace Mann Educators Corp. 7,585 266,613Hyundai Marine & Fire Insurance
Company, Ltd. 12,361 507,664Industrial Alliance Insurance & Financial
Services, Inc. 21,261 912,414Infinity Property & Casualty Corp. 1,839 162,660Insurance Australia Group, Ltd. 322,919 1,647,909Intact Financial Corp. 25,541 2,105,458Investors Title Company 278 48,892James River Group Holdings, Ltd. 3,080 122,830Japan Post Holdings Company, Ltd. 80,100 994,649Kemper Corp. 18,039 864,068Kingstone Companies, Inc. (C) 2,141 32,222Kinsale Capital Group, Inc. 2,558 96,820Legal & General Group PLC 346,328 1,166,242Liberty Holdings, Ltd. 22,883 182,335Lincoln National Corp. 52,719 3,577,511Loews Corp. 65,298 3,041,581Maiden Holdings, Ltd. 14,796 107,271Mapfre SA 169,667 601,511Marsh & McLennan Companies, Inc. 120,209 9,385,919MBIA, Inc. (A) 23,329 234,690Medibank Pvt., Ltd. 374,449 906,474Mercury General Corp. 8,049 462,576MetLife, Inc. 252,533 11,826,120MMI Holdings, Ltd. 157,585 252,230
Strategic Equity Allocation Fund (continued)Shares orPrincipalAmount Value
COMMON STOCKS (continued)Insurance (continued)MS&AD Insurance Group Holdings, Inc. 78,068 $ 2,571,583Muenchener
Rueckversicherungs-Gesellschaft AG 34,087 7,040,271National General Holdings Corp. 9,440 162,085National Western Life Group, Inc.,
Class A 460 153,829New China Life Insurance
Company, Ltd., H Shares 96,300 618,387NI Holdings, Inc. (A) 2,164 35,728NN Group NV (C) 40,785 1,619,308Old Mutual PLC 287,392 771,950Old Republic International Corp. 54,054 1,031,891OneBeacon Insurance Group, Ltd.,
Class A 3,938 71,750PICC Property & Casualty
Company, Ltd., H Shares 561,899 1,058,583Ping An Insurance Group Company of
China, Ltd., H Shares 621,210 4,947,834Porto Seguro SA 23,623 260,781Poste Italiane SpA (B) 84,674 615,751Power Corp. of Canada 69,673 1,702,839Power Financial Corp. 52,862 1,427,009Powszechny Zaklad Ubezpieczen SA 103,424 1,407,979Primerica, Inc. 18,117 1,386,856Principal Financial Group, Inc. 62,407 3,901,686Prudential Financial, Inc. 100,276 10,236,174Prudential PLC 145,769 3,421,824QBE Insurance Group, Ltd. 184,241 1,530,024Rand Merchant Investment
Holdings, Ltd. 109,681 351,129Reinsurance Group of America, Inc. 14,199 1,909,056RenaissanceRe Holdings, Ltd. 8,958 1,246,595RLI Corp. 6,915 370,091RSA Insurance Group PLC 62,105 535,468Safety Insurance Group, Inc. 2,464 175,930Sampo OYJ, A Shares 85,116 4,493,612Samsung Fire & Marine
Insurance Company, Ltd. 5,808 1,426,710Samsung Life Insurance Company, Ltd. 13,276 1,361,135Sanlam, Ltd. 212,315 1,172,946SCOR SE 32,604 1,364,914Selective Insurance Group, Inc. 10,292 518,717Shin Kong Financial Holding
Company, Ltd. 1,660,101 483,341Sompo Holdings, Inc. 58,060 2,180,709Sony Financial Holdings, Inc. 30,200 476,122St. James’s Place PLC 32,814 489,840State Auto Financial Corp. 2,883 71,325State National Companies, Inc. 5,287 109,811Stewart Information Services Corp. 4,000 144,320Sul America SA 37,794 215,873Sun Life Financial, Inc. 111,934 4,298,086Suncorp Group, Ltd. 175,232 1,819,670Swiss Life Holding AG (A) 5,654 2,024,148Swiss Re AG 55,266 5,004,209T&D Holdings, Inc. 90,000 1,225,386The Allstate Corp. 84,997 7,692,229The Hanover Insurance Group, Inc. 9,409 923,776The Hartford Financial Services
Group, Inc. 86,031 4,651,696The Navigators Group, Inc. 3,608 201,326The People’s Insurance Company Group
of China, Ltd., H Shares 926,000 437,699The Progressive Corp. 134,651 6,258,578The Travelers Companies, Inc. 65,271 7,909,540
John Hancock Funds IIPortfolio of Investments — August 31, 2017 (showing percentage of total net assets)
160
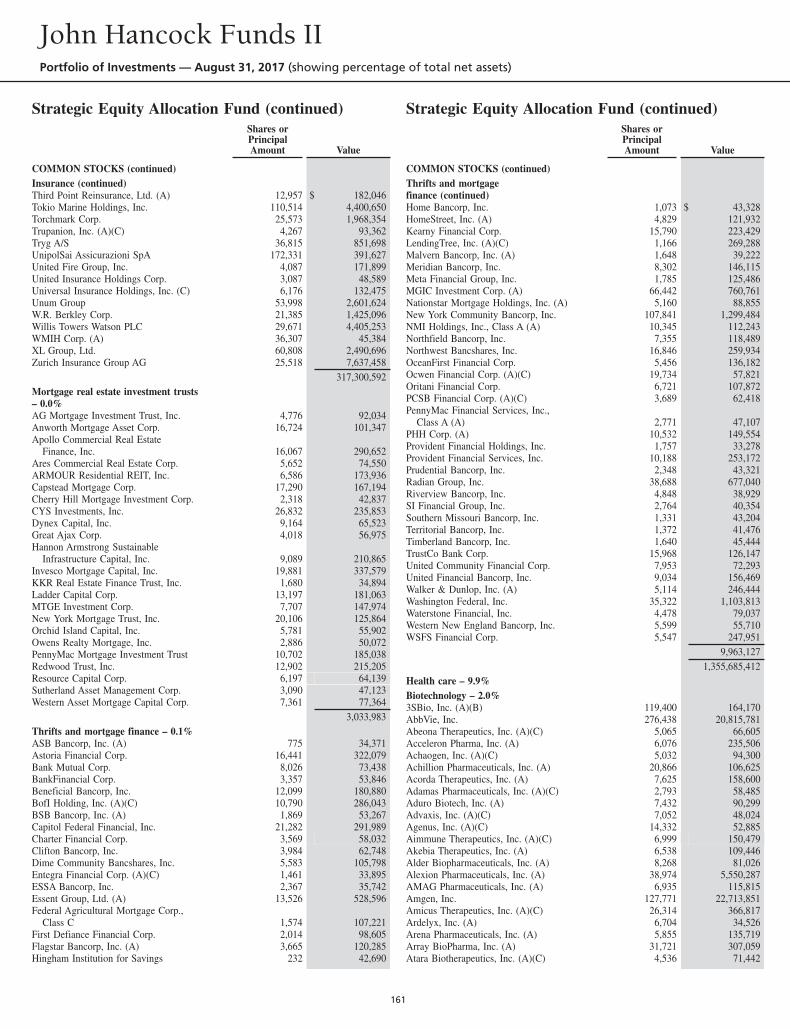
Strategic Equity Allocation Fund (continued)Shares orPrincipalAmount Value
COMMON STOCKS (continued)Insurance (continued)Third Point Reinsurance, Ltd. (A) 12,957 $ 182,046Tokio Marine Holdings, Inc. 110,514 4,400,650Torchmark Corp. 25,573 1,968,354Trupanion, Inc. (A)(C) 4,267 93,362Tryg A/S 36,815 851,698UnipolSai Assicurazioni SpA 172,331 391,627United Fire Group, Inc. 4,087 171,899United Insurance Holdings Corp. 3,087 48,589Universal Insurance Holdings, Inc. (C) 6,176 132,475Unum Group 53,998 2,601,624W.R. Berkley Corp. 21,385 1,425,096Willis Towers Watson PLC 29,671 4,405,253WMIH Corp. (A) 36,307 45,384XL Group, Ltd. 60,808 2,490,696Zurich Insurance Group AG 25,518 7,637,458
317,300,592Mortgage real estate investment trusts– 0.0%AG Mortgage Investment Trust, Inc. 4,776 92,034Anworth Mortgage Asset Corp. 16,724 101,347Apollo Commercial Real Estate
Finance, Inc. 16,067 290,652Ares Commercial Real Estate Corp. 5,652 74,550ARMOUR Residential REIT, Inc. 6,586 173,936Capstead Mortgage Corp. 17,290 167,194Cherry Hill Mortgage Investment Corp. 2,318 42,837CYS Investments, Inc. 26,832 235,853Dynex Capital, Inc. 9,164 65,523Great Ajax Corp. 4,018 56,975Hannon Armstrong Sustainable
Infrastructure Capital, Inc. 9,089 210,865Invesco Mortgage Capital, Inc. 19,881 337,579KKR Real Estate Finance Trust, Inc. 1,680 34,894Ladder Capital Corp. 13,197 181,063MTGE Investment Corp. 7,707 147,974New York Mortgage Trust, Inc. 20,106 125,864Orchid Island Capital, Inc. 5,781 55,902Owens Realty Mortgage, Inc. 2,886 50,072PennyMac Mortgage Investment Trust 10,702 185,038Redwood Trust, Inc. 12,902 215,205Resource Capital Corp. 6,197 64,139Sutherland Asset Management Corp. 3,090 47,123Western Asset Mortgage Capital Corp. 7,361 77,364
3,033,983Thrifts and mortgage finance – 0.1%ASB Bancorp, Inc. (A) 775 34,371Astoria Financial Corp. 16,441 322,079Bank Mutual Corp. 8,026 73,438BankFinancial Corp. 3,357 53,846Beneficial Bancorp, Inc. 12,099 180,880BofI Holding, Inc. (A)(C) 10,790 286,043BSB Bancorp, Inc. (A) 1,869 53,267Capitol Federal Financial, Inc. 21,282 291,989Charter Financial Corp. 3,569 58,032Clifton Bancorp, Inc. 3,984 62,748Dime Community Bancshares, Inc. 5,583 105,798Entegra Financial Corp. (A)(C) 1,461 33,895ESSA Bancorp, Inc. 2,367 35,742Essent Group, Ltd. (A) 13,526 528,596Federal Agricultural Mortgage Corp.,
Class C 1,574 107,221First Defiance Financial Corp. 2,014 98,605Flagstar Bancorp, Inc. (A) 3,665 120,285Hingham Institution for Savings 232 42,690
Strategic Equity Allocation Fund (continued)Shares orPrincipalAmount Value
COMMON STOCKS (continued)Thrifts and mortgagefinance (continued)Home Bancorp, Inc. 1,073 $ 43,328HomeStreet, Inc. (A) 4,829 121,932Kearny Financial Corp. 15,790 223,429LendingTree, Inc. (A)(C) 1,166 269,288Malvern Bancorp, Inc. (A) 1,648 39,222Meridian Bancorp, Inc. 8,302 146,115Meta Financial Group, Inc. 1,785 125,486MGIC Investment Corp. (A) 66,442 760,761Nationstar Mortgage Holdings, Inc. (A) 5,160 88,855New York Community Bancorp, Inc. 107,841 1,299,484NMI Holdings, Inc., Class A (A) 10,345 112,243Northfield Bancorp, Inc. 7,355 118,489Northwest Bancshares, Inc. 16,846 259,934OceanFirst Financial Corp. 5,456 136,182Ocwen Financial Corp. (A)(C) 19,734 57,821Oritani Financial Corp. 6,721 107,872PCSB Financial Corp. (A)(C) 3,689 62,418PennyMac Financial Services, Inc.,
Class A (A) 2,771 47,107PHH Corp. (A) 10,532 149,554Provident Financial Holdings, Inc. 1,757 33,278Provident Financial Services, Inc. 10,188 253,172Prudential Bancorp, Inc. 2,348 43,321Radian Group, Inc. 38,688 677,040Riverview Bancorp, Inc. 4,848 38,929SI Financial Group, Inc. 2,764 40,354Southern Missouri Bancorp, Inc. 1,331 43,204Territorial Bancorp, Inc. 1,372 41,476Timberland Bancorp, Inc. 1,640 45,444TrustCo Bank Corp. 15,968 126,147United Community Financial Corp. 7,953 72,293United Financial Bancorp, Inc. 9,034 156,469Walker & Dunlop, Inc. (A) 5,114 246,444Washington Federal, Inc. 35,322 1,103,813Waterstone Financial, Inc. 4,478 79,037Western New England Bancorp, Inc. 5,599 55,710WSFS Financial Corp. 5,547 247,951
9,963,1271,355,685,412
Health care – 9.9%Biotechnology – 2.0%3SBio, Inc. (A)(B) 119,400 164,170AbbVie, Inc. 276,438 20,815,781Abeona Therapeutics, Inc. (A)(C) 5,065 66,605Acceleron Pharma, Inc. (A) 6,076 235,506Achaogen, Inc. (A)(C) 5,032 94,300Achillion Pharmaceuticals, Inc. (A) 20,866 106,625Acorda Therapeutics, Inc. (A) 7,625 158,600Adamas Pharmaceuticals, Inc. (A)(C) 2,793 58,485Aduro Biotech, Inc. (A) 7,432 90,299Advaxis, Inc. (A)(C) 7,052 48,024Agenus, Inc. (A)(C) 14,332 52,885Aimmune Therapeutics, Inc. (A)(C) 6,999 150,479Akebia Therapeutics, Inc. (A) 6,538 109,446Alder Biopharmaceuticals, Inc. (A) 8,268 81,026Alexion Pharmaceuticals, Inc. (A) 38,974 5,550,287AMAG Pharmaceuticals, Inc. (A) 6,935 115,815Amgen, Inc. 127,771 22,713,851Amicus Therapeutics, Inc. (A)(C) 26,314 366,817Ardelyx, Inc. (A) 6,704 34,526Arena Pharmaceuticals, Inc. (A) 5,855 135,719Array BioPharma, Inc. (A) 31,721 307,059Atara Biotherapeutics, Inc. (A)(C) 4,536 71,442
John Hancock Funds IIPortfolio of Investments — August 31, 2017 (showing percentage of total net assets)
161
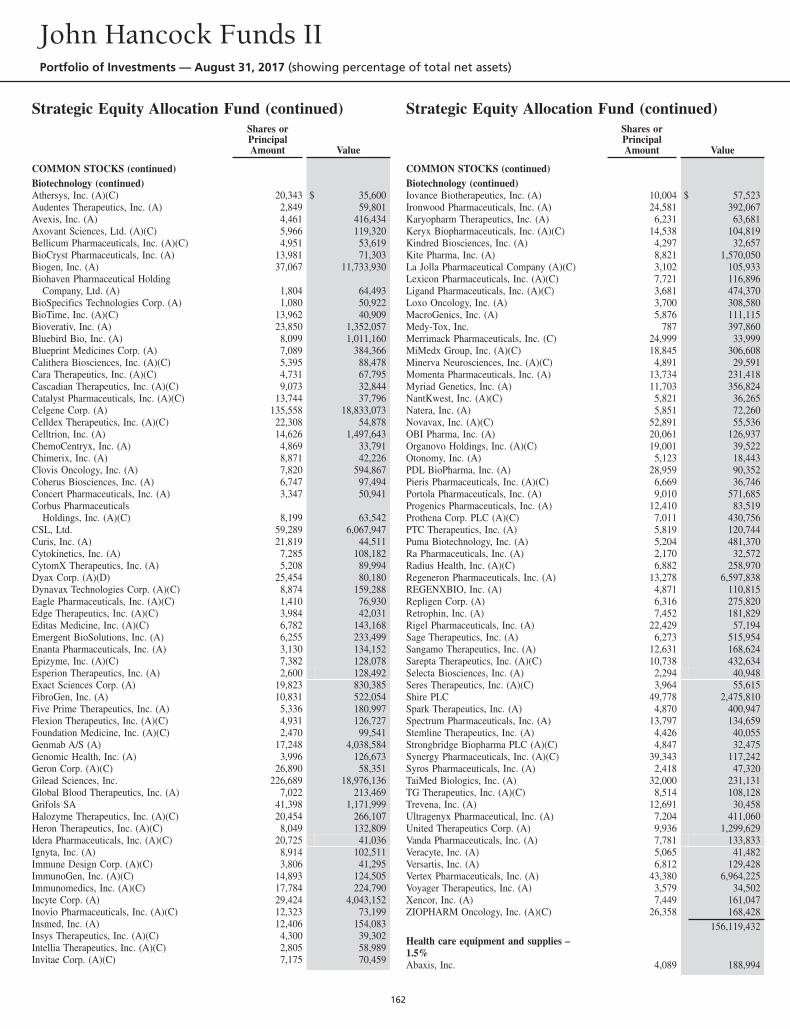
Strategic Equity Allocation Fund (continued)Shares orPrincipalAmount Value
COMMON STOCKS (continued)Biotechnology (continued)Athersys, Inc. (A)(C) 20,343 $ 35,600Audentes Therapeutics, Inc. (A) 2,849 59,801Avexis, Inc. (A) 4,461 416,434Axovant Sciences, Ltd. (A)(C) 5,966 119,320Bellicum Pharmaceuticals, Inc. (A)(C) 4,951 53,619BioCryst Pharmaceuticals, Inc. (A) 13,981 71,303Biogen, Inc. (A) 37,067 11,733,930Biohaven Pharmaceutical Holding
Company, Ltd. (A) 1,804 64,493BioSpecifics Technologies Corp. (A) 1,080 50,922BioTime, Inc. (A)(C) 13,962 40,909Bioverativ, Inc. (A) 23,850 1,352,057Bluebird Bio, Inc. (A) 8,099 1,011,160Blueprint Medicines Corp. (A) 7,089 384,366Calithera Biosciences, Inc. (A)(C) 5,395 88,478Cara Therapeutics, Inc. (A)(C) 4,731 67,795Cascadian Therapeutics, Inc. (A)(C) 9,073 32,844Catalyst Pharmaceuticals, Inc. (A)(C) 13,744 37,796Celgene Corp. (A) 135,558 18,833,073Celldex Therapeutics, Inc. (A)(C) 22,308 54,878Celltrion, Inc. (A) 14,626 1,497,643ChemoCentryx, Inc. (A) 4,869 33,791Chimerix, Inc. (A) 8,871 42,226Clovis Oncology, Inc. (A) 7,820 594,867Coherus Biosciences, Inc. (A) 6,747 97,494Concert Pharmaceuticals, Inc. (A) 3,347 50,941Corbus Pharmaceuticals
Holdings, Inc. (A)(C) 8,199 63,542CSL, Ltd. 59,289 6,067,947Curis, Inc. (A) 21,819 44,511Cytokinetics, Inc. (A) 7,285 108,182CytomX Therapeutics, Inc. (A) 5,208 89,994Dyax Corp. (A)(D) 25,454 80,180Dynavax Technologies Corp. (A)(C) 8,874 159,288Eagle Pharmaceuticals, Inc. (A)(C) 1,410 76,930Edge Therapeutics, Inc. (A)(C) 3,984 42,031Editas Medicine, Inc. (A)(C) 6,782 143,168Emergent BioSolutions, Inc. (A) 6,255 233,499Enanta Pharmaceuticals, Inc. (A) 3,130 134,152Epizyme, Inc. (A)(C) 7,382 128,078Esperion Therapeutics, Inc. (A) 2,600 128,492Exact Sciences Corp. (A) 19,823 830,385FibroGen, Inc. (A) 10,831 522,054Five Prime Therapeutics, Inc. (A) 5,336 180,997Flexion Therapeutics, Inc. (A)(C) 4,931 126,727Foundation Medicine, Inc. (A)(C) 2,470 99,541Genmab A/S (A) 17,248 4,038,584Genomic Health, Inc. (A) 3,996 126,673Geron Corp. (A)(C) 26,890 58,351Gilead Sciences, Inc. 226,689 18,976,136Global Blood Therapeutics, Inc. (A) 7,022 213,469Grifols SA 41,398 1,171,999Halozyme Therapeutics, Inc. (A)(C) 20,454 266,107Heron Therapeutics, Inc. (A)(C) 8,049 132,809Idera Pharmaceuticals, Inc. (A)(C) 20,725 41,036Ignyta, Inc. (A) 8,914 102,511Immune Design Corp. (A)(C) 3,806 41,295ImmunoGen, Inc. (A)(C) 14,893 124,505Immunomedics, Inc. (A)(C) 17,784 224,790Incyte Corp. (A) 29,424 4,043,152Inovio Pharmaceuticals, Inc. (A)(C) 12,323 73,199Insmed, Inc. (A) 12,406 154,083Insys Therapeutics, Inc. (A)(C) 4,300 39,302Intellia Therapeutics, Inc. (A)(C) 2,805 58,989Invitae Corp. (A)(C) 7,175 70,459
Strategic Equity Allocation Fund (continued)Shares orPrincipalAmount Value
COMMON STOCKS (continued)Biotechnology (continued)Iovance Biotherapeutics, Inc. (A) 10,004 $ 57,523Ironwood Pharmaceuticals, Inc. (A) 24,581 392,067Karyopharm Therapeutics, Inc. (A) 6,231 63,681Keryx Biopharmaceuticals, Inc. (A)(C) 14,538 104,819Kindred Biosciences, Inc. (A) 4,297 32,657Kite Pharma, Inc. (A) 8,821 1,570,050La Jolla Pharmaceutical Company (A)(C) 3,102 105,933Lexicon Pharmaceuticals, Inc. (A)(C) 7,721 116,896Ligand Pharmaceuticals, Inc. (A)(C) 3,681 474,370Loxo Oncology, Inc. (A) 3,700 308,580MacroGenics, Inc. (A) 5,876 111,115Medy-Tox, Inc. 787 397,860Merrimack Pharmaceuticals, Inc. (C) 24,999 33,999MiMedx Group, Inc. (A)(C) 18,845 306,608Minerva Neurosciences, Inc. (A)(C) 4,891 29,591Momenta Pharmaceuticals, Inc. (A) 13,734 231,418Myriad Genetics, Inc. (A) 11,703 356,824NantKwest, Inc. (A)(C) 5,821 36,265Natera, Inc. (A) 5,851 72,260Novavax, Inc. (A)(C) 52,891 55,536OBI Pharma, Inc. (A) 20,061 126,937Organovo Holdings, Inc. (A)(C) 19,001 39,522Otonomy, Inc. (A) 5,123 18,443PDL BioPharma, Inc. (A) 28,959 90,352Pieris Pharmaceuticals, Inc. (A)(C) 6,669 36,746Portola Pharmaceuticals, Inc. (A) 9,010 571,685Progenics Pharmaceuticals, Inc. (A) 12,410 83,519Prothena Corp. PLC (A)(C) 7,011 430,756PTC Therapeutics, Inc. (A) 5,819 120,744Puma Biotechnology, Inc. (A) 5,204 481,370Ra Pharmaceuticals, Inc. (A) 2,170 32,572Radius Health, Inc. (A)(C) 6,882 258,970Regeneron Pharmaceuticals, Inc. (A) 13,278 6,597,838REGENXBIO, Inc. (A) 4,871 110,815Repligen Corp. (A) 6,316 275,820Retrophin, Inc. (A) 7,452 181,829Rigel Pharmaceuticals, Inc. (A) 22,429 57,194Sage Therapeutics, Inc. (A) 6,273 515,954Sangamo Therapeutics, Inc. (A) 12,631 168,624Sarepta Therapeutics, Inc. (A)(C) 10,738 432,634Selecta Biosciences, Inc. (A) 2,294 40,948Seres Therapeutics, Inc. (A)(C) 3,964 55,615Shire PLC 49,778 2,475,810Spark Therapeutics, Inc. (A) 4,870 400,947Spectrum Pharmaceuticals, Inc. (A) 13,797 134,659Stemline Therapeutics, Inc. (A) 4,426 40,055Strongbridge Biopharma PLC (A)(C) 4,847 32,475Synergy Pharmaceuticals, Inc. (A)(C) 39,343 117,242Syros Pharmaceuticals, Inc. (A) 2,418 47,320TaiMed Biologics, Inc. (A) 32,000 231,131TG Therapeutics, Inc. (A)(C) 8,514 108,128Trevena, Inc. (A) 12,691 30,458Ultragenyx Pharmaceutical, Inc. (A) 7,204 411,060United Therapeutics Corp. (A) 9,936 1,299,629Vanda Pharmaceuticals, Inc. (A) 7,781 133,833Veracyte, Inc. (A) 5,065 41,482Versartis, Inc. (A) 6,812 129,428Vertex Pharmaceuticals, Inc. (A) 43,380 6,964,225Voyager Therapeutics, Inc. (A) 3,579 34,502Xencor, Inc. (A) 7,449 161,047ZIOPHARM Oncology, Inc. (A)(C) 26,358 168,428
156,119,432Health care equipment and supplies –1.5%Abaxis, Inc. 4,089 188,994
John Hancock Funds IIPortfolio of Investments — August 31, 2017 (showing percentage of total net assets)
162
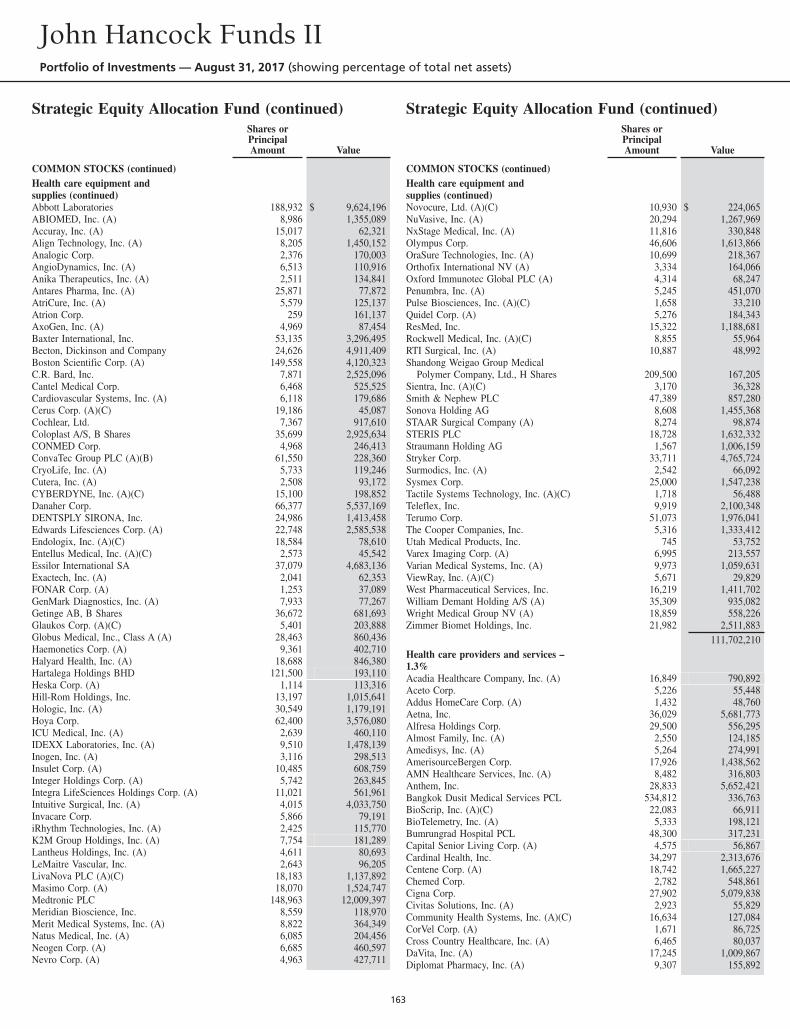
Strategic Equity Allocation Fund (continued)Shares orPrincipalAmount Value
COMMON STOCKS (continued)Health care equipment andsupplies (continued)Abbott Laboratories 188,932 $ 9,624,196ABIOMED, Inc. (A) 8,986 1,355,089Accuray, Inc. (A) 15,017 62,321Align Technology, Inc. (A) 8,205 1,450,152Analogic Corp. 2,376 170,003AngioDynamics, Inc. (A) 6,513 110,916Anika Therapeutics, Inc. (A) 2,511 134,841Antares Pharma, Inc. (A) 25,871 77,872AtriCure, Inc. (A) 5,579 125,137Atrion Corp. 259 161,137AxoGen, Inc. (A) 4,969 87,454Baxter International, Inc. 53,135 3,296,495Becton, Dickinson and Company 24,626 4,911,409Boston Scientific Corp. (A) 149,558 4,120,323C.R. Bard, Inc. 7,871 2,525,096Cantel Medical Corp. 6,468 525,525Cardiovascular Systems, Inc. (A) 6,118 179,686Cerus Corp. (A)(C) 19,186 45,087Cochlear, Ltd. 7,367 917,610Coloplast A/S, B Shares 35,699 2,925,634CONMED Corp. 4,968 246,413ConvaTec Group PLC (A)(B) 61,550 228,360CryoLife, Inc. (A) 5,733 119,246Cutera, Inc. (A) 2,508 93,172CYBERDYNE, Inc. (A)(C) 15,100 198,852Danaher Corp. 66,377 5,537,169DENTSPLY SIRONA, Inc. 24,986 1,413,458Edwards Lifesciences Corp. (A) 22,748 2,585,538Endologix, Inc. (A)(C) 18,584 78,610Entellus Medical, Inc. (A)(C) 2,573 45,542Essilor International SA 37,079 4,683,136Exactech, Inc. (A) 2,041 62,353FONAR Corp. (A) 1,253 37,089GenMark Diagnostics, Inc. (A) 7,933 77,267Getinge AB, B Shares 36,672 681,693Glaukos Corp. (A)(C) 5,401 203,888Globus Medical, Inc., Class A (A) 28,463 860,436Haemonetics Corp. (A) 9,361 402,710Halyard Health, Inc. (A) 18,688 846,380Hartalega Holdings BHD 121,500 193,110Heska Corp. (A) 1,114 113,316Hill-Rom Holdings, Inc. 13,197 1,015,641Hologic, Inc. (A) 30,549 1,179,191Hoya Corp. 62,400 3,576,080ICU Medical, Inc. (A) 2,639 460,110IDEXX Laboratories, Inc. (A) 9,510 1,478,139Inogen, Inc. (A) 3,116 298,513Insulet Corp. (A) 10,485 608,759Integer Holdings Corp. (A) 5,742 263,845Integra LifeSciences Holdings Corp. (A) 11,021 561,961Intuitive Surgical, Inc. (A) 4,015 4,033,750Invacare Corp. 5,866 79,191iRhythm Technologies, Inc. (A) 2,425 115,770K2M Group Holdings, Inc. (A) 7,754 181,289Lantheus Holdings, Inc. (A) 4,611 80,693LeMaitre Vascular, Inc. 2,643 96,205LivaNova PLC (A)(C) 18,183 1,137,892Masimo Corp. (A) 18,070 1,524,747Medtronic PLC 148,963 12,009,397Meridian Bioscience, Inc. 8,559 118,970Merit Medical Systems, Inc. (A) 8,822 364,349Natus Medical, Inc. (A) 6,085 204,456Neogen Corp. (A) 6,685 460,597Nevro Corp. (A) 4,963 427,711
Strategic Equity Allocation Fund (continued)Shares orPrincipalAmount Value
COMMON STOCKS (continued)Health care equipment andsupplies (continued)Novocure, Ltd. (A)(C) 10,930 $ 224,065NuVasive, Inc. (A) 20,294 1,267,969NxStage Medical, Inc. (A) 11,816 330,848Olympus Corp. 46,606 1,613,866OraSure Technologies, Inc. (A) 10,699 218,367Orthofix International NV (A) 3,334 164,066Oxford Immunotec Global PLC (A) 4,314 68,247Penumbra, Inc. (A) 5,245 451,070Pulse Biosciences, Inc. (A)(C) 1,658 33,210Quidel Corp. (A) 5,276 184,343ResMed, Inc. 15,322 1,188,681Rockwell Medical, Inc. (A)(C) 8,855 55,964RTI Surgical, Inc. (A) 10,887 48,992Shandong Weigao Group Medical
Polymer Company, Ltd., H Shares 209,500 167,205Sientra, Inc. (A)(C) 3,170 36,328Smith & Nephew PLC 47,389 857,280Sonova Holding AG 8,608 1,455,368STAAR Surgical Company (A) 8,274 98,874STERIS PLC 18,728 1,632,332Straumann Holding AG 1,567 1,006,159Stryker Corp. 33,711 4,765,724Surmodics, Inc. (A) 2,542 66,092Sysmex Corp. 25,000 1,547,238Tactile Systems Technology, Inc. (A)(C) 1,718 56,488Teleflex, Inc. 9,919 2,100,348Terumo Corp. 51,073 1,976,041The Cooper Companies, Inc. 5,316 1,333,412Utah Medical Products, Inc. 745 53,752Varex Imaging Corp. (A) 6,995 213,557Varian Medical Systems, Inc. (A) 9,973 1,059,631ViewRay, Inc. (A)(C) 5,671 29,829West Pharmaceutical Services, Inc. 16,219 1,411,702William Demant Holding A/S (A) 35,309 935,082Wright Medical Group NV (A) 18,859 558,226Zimmer Biomet Holdings, Inc. 21,982 2,511,883
111,702,210Health care providers and services –1.3%Acadia Healthcare Company, Inc. (A) 16,849 790,892Aceto Corp. 5,226 55,448Addus HomeCare Corp. (A) 1,432 48,760Aetna, Inc. 36,029 5,681,773Alfresa Holdings Corp. 29,500 556,295Almost Family, Inc. (A) 2,550 124,185Amedisys, Inc. (A) 5,264 274,991AmerisourceBergen Corp. 17,926 1,438,562AMN Healthcare Services, Inc. (A) 8,482 316,803Anthem, Inc. 28,833 5,652,421Bangkok Dusit Medical Services PCL 534,812 336,763BioScrip, Inc. (A)(C) 22,083 66,911BioTelemetry, Inc. (A) 5,333 198,121Bumrungrad Hospital PCL 48,300 317,231Capital Senior Living Corp. (A) 4,575 56,867Cardinal Health, Inc. 34,297 2,313,676Centene Corp. (A) 18,742 1,665,227Chemed Corp. 2,782 548,861Cigna Corp. 27,902 5,079,838Civitas Solutions, Inc. (A) 2,923 55,829Community Health Systems, Inc. (A)(C) 16,634 127,084CorVel Corp. (A) 1,671 86,725Cross Country Healthcare, Inc. (A) 6,465 80,037DaVita, Inc. (A) 17,245 1,009,867Diplomat Pharmacy, Inc. (A) 9,307 155,892
John Hancock Funds IIPortfolio of Investments — August 31, 2017 (showing percentage of total net assets)
163
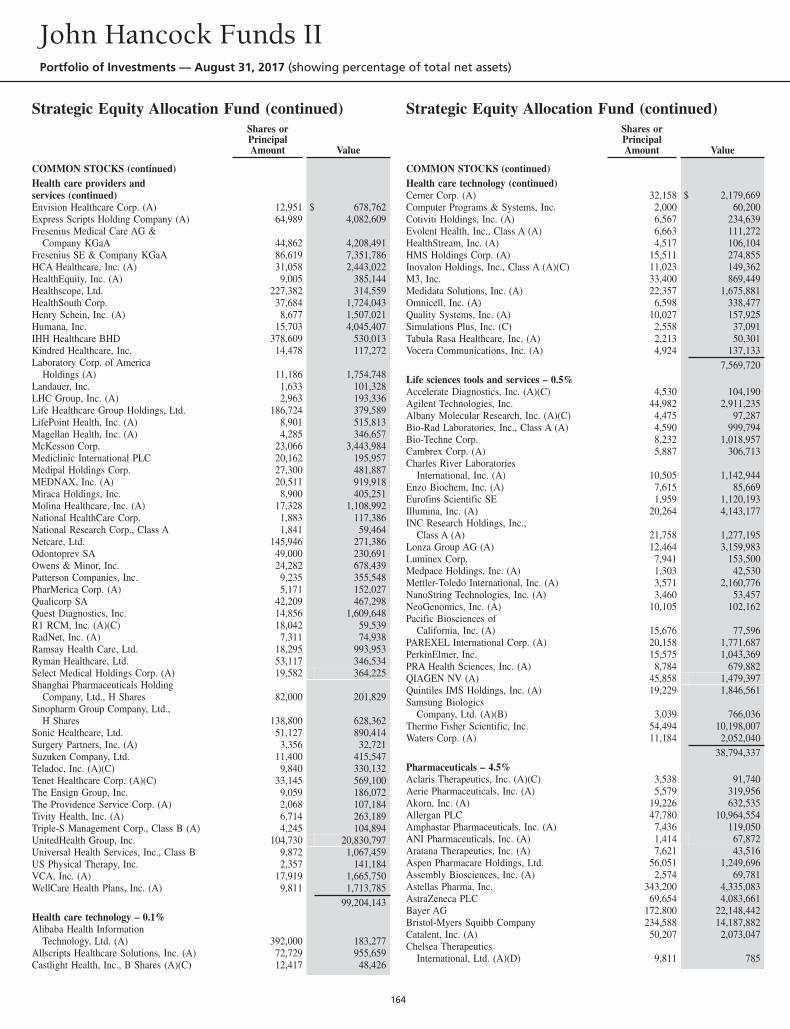
Strategic Equity Allocation Fund (continued)Shares orPrincipalAmount Value
COMMON STOCKS (continued)Health care providers andservices (continued)Envision Healthcare Corp. (A) 12,951 $ 678,762Express Scripts Holding Company (A) 64,989 4,082,609Fresenius Medical Care AG &
Company KGaA 44,862 4,208,491Fresenius SE & Company KGaA 86,619 7,351,786HCA Healthcare, Inc. (A) 31,058 2,443,022HealthEquity, Inc. (A) 9,005 385,144Healthscope, Ltd. 227,382 314,559HealthSouth Corp. 37,684 1,724,043Henry Schein, Inc. (A) 8,677 1,507,021Humana, Inc. 15,703 4,045,407IHH Healthcare BHD 378,609 530,013Kindred Healthcare, Inc. 14,478 117,272Laboratory Corp. of America
Holdings (A) 11,186 1,754,748Landauer, Inc. 1,633 101,328LHC Group, Inc. (A) 2,963 193,336Life Healthcare Group Holdings, Ltd. 186,724 379,589LifePoint Health, Inc. (A) 8,901 515,813Magellan Health, Inc. (A) 4,285 346,657McKesson Corp. 23,066 3,443,984Mediclinic International PLC 20,162 195,957Medipal Holdings Corp. 27,300 481,887MEDNAX, Inc. (A) 20,511 919,918Miraca Holdings, Inc. 8,900 405,251Molina Healthcare, Inc. (A) 17,328 1,108,992National HealthCare Corp. 1,883 117,386National Research Corp., Class A 1,841 59,464Netcare, Ltd. 145,946 271,386Odontoprev SA 49,000 230,691Owens & Minor, Inc. 24,282 678,439Patterson Companies, Inc. 9,235 355,548PharMerica Corp. (A) 5,171 152,027Qualicorp SA 42,209 467,298Quest Diagnostics, Inc. 14,856 1,609,648R1 RCM, Inc. (A)(C) 18,042 59,539RadNet, Inc. (A) 7,311 74,938Ramsay Health Care, Ltd. 18,295 993,953Ryman Healthcare, Ltd. 53,117 346,534Select Medical Holdings Corp. (A) 19,582 364,225Shanghai Pharmaceuticals Holding
Company, Ltd., H Shares 82,000 201,829Sinopharm Group Company, Ltd.,
H Shares 138,800 628,362Sonic Healthcare, Ltd. 51,127 890,414Surgery Partners, Inc. (A) 3,356 32,721Suzuken Company, Ltd. 11,400 415,547Teladoc, Inc. (A)(C) 9,840 330,132Tenet Healthcare Corp. (A)(C) 33,145 569,100The Ensign Group, Inc. 9,059 186,072The Providence Service Corp. (A) 2,068 107,184Tivity Health, Inc. (A) 6,714 263,189Triple-S Management Corp., Class B (A) 4,245 104,894UnitedHealth Group, Inc. 104,730 20,830,797Universal Health Services, Inc., Class B 9,872 1,067,459US Physical Therapy, Inc. 2,357 141,184VCA, Inc. (A) 17,919 1,665,750WellCare Health Plans, Inc. (A) 9,811 1,713,785
99,204,143Health care technology – 0.1%Alibaba Health Information
Technology, Ltd. (A) 392,000 183,277Allscripts Healthcare Solutions, Inc. (A) 72,729 955,659Castlight Health, Inc., B Shares (A)(C) 12,417 48,426
Strategic Equity Allocation Fund (continued)Shares orPrincipalAmount Value
COMMON STOCKS (continued)Health care technology (continued)Cerner Corp. (A) 32,158 $ 2,179,669Computer Programs & Systems, Inc. 2,000 60,200Cotiviti Holdings, Inc. (A) 6,567 234,639Evolent Health, Inc., Class A (A) 6,663 111,272HealthStream, Inc. (A) 4,517 106,104HMS Holdings Corp. (A) 15,511 274,855Inovalon Holdings, Inc., Class A (A)(C) 11,023 149,362M3, Inc. 33,400 869,449Medidata Solutions, Inc. (A) 22,357 1,675,881Omnicell, Inc. (A) 6,598 338,477Quality Systems, Inc. (A) 10,027 157,925Simulations Plus, Inc. (C) 2,558 37,091Tabula Rasa Healthcare, Inc. (A) 2,213 50,301Vocera Communications, Inc. (A) 4,924 137,133
7,569,720Life sciences tools and services – 0.5%Accelerate Diagnostics, Inc. (A)(C) 4,530 104,190Agilent Technologies, Inc. 44,982 2,911,235Albany Molecular Research, Inc. (A)(C) 4,475 97,287Bio-Rad Laboratories, Inc., Class A (A) 4,590 999,794Bio-Techne Corp. 8,232 1,018,957Cambrex Corp. (A) 5,887 306,713Charles River Laboratories
International, Inc. (A) 10,505 1,142,944Enzo Biochem, Inc. (A) 7,615 85,669Eurofins Scientific SE 1,959 1,120,193Illumina, Inc. (A) 20,264 4,143,177INC Research Holdings, Inc.,
Class A (A) 21,758 1,277,195Lonza Group AG (A) 12,464 3,159,983Luminex Corp. 7,941 153,500Medpace Holdings, Inc. (A) 1,303 42,530Mettler-Toledo International, Inc. (A) 3,571 2,160,776NanoString Technologies, Inc. (A) 3,460 53,457NeoGenomics, Inc. (A) 10,105 102,162Pacific Biosciences of
California, Inc. (A) 15,676 77,596PAREXEL International Corp. (A) 20,158 1,771,687PerkinElmer, Inc. 15,575 1,043,369PRA Health Sciences, Inc. (A) 8,784 679,882QIAGEN NV (A) 45,858 1,479,397Quintiles IMS Holdings, Inc. (A) 19,229 1,846,561Samsung Biologics
Company, Ltd. (A)(B) 3,039 766,036Thermo Fisher Scientific, Inc. 54,494 10,198,007Waters Corp. (A) 11,184 2,052,040
38,794,337Pharmaceuticals – 4.5%Aclaris Therapeutics, Inc. (A)(C) 3,538 91,740Aerie Pharmaceuticals, Inc. (A) 5,579 319,956Akorn, Inc. (A) 19,226 632,535Allergan PLC 47,780 10,964,554Amphastar Pharmaceuticals, Inc. (A) 7,436 119,050ANI Pharmaceuticals, Inc. (A) 1,414 67,872Aratana Therapeutics, Inc. (A) 7,621 43,516Aspen Pharmacare Holdings, Ltd. 56,051 1,249,696Assembly Biosciences, Inc. (A) 2,574 69,781Astellas Pharma, Inc. 343,200 4,335,083AstraZeneca PLC 69,654 4,083,661Bayer AG 172,800 22,148,442Bristol-Myers Squibb Company 234,588 14,187,882Catalent, Inc. (A) 50,207 2,073,047Chelsea Therapeutics
International, Ltd. (A)(D) 9,811 785
John Hancock Funds IIPortfolio of Investments — August 31, 2017 (showing percentage of total net assets)
164
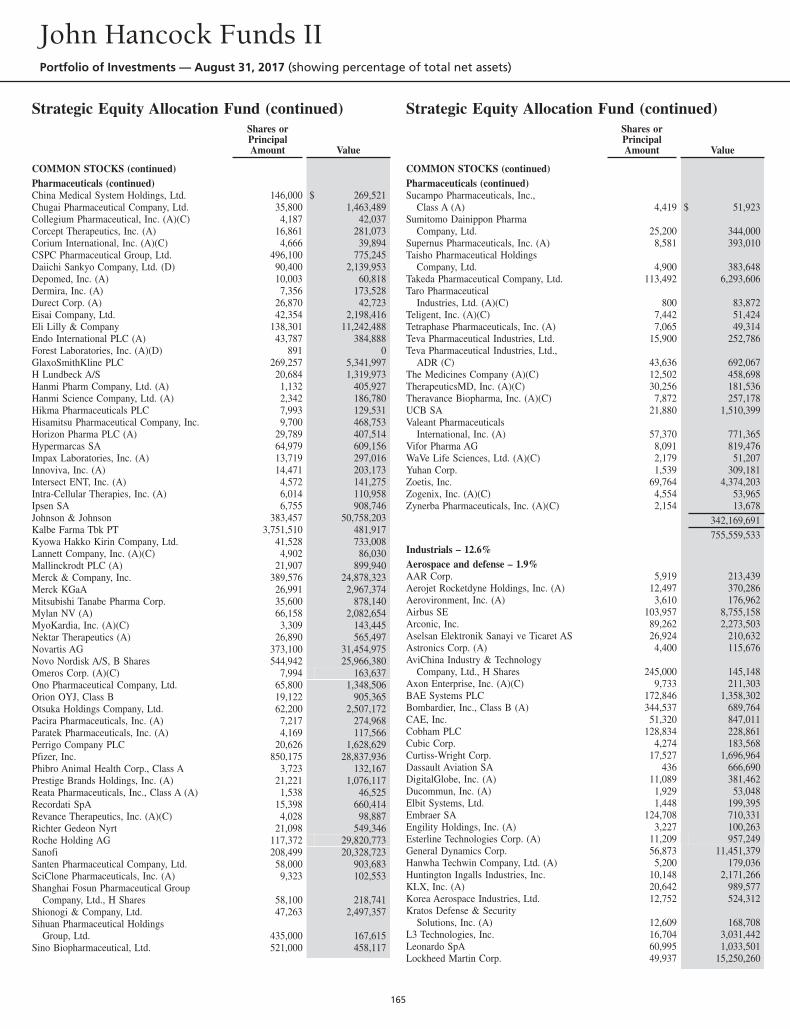
Strategic Equity Allocation Fund (continued)Shares orPrincipalAmount Value
COMMON STOCKS (continued)Pharmaceuticals (continued)China Medical System Holdings, Ltd. 146,000 $ 269,521Chugai Pharmaceutical Company, Ltd. 35,800 1,463,489Collegium Pharmaceutical, Inc. (A)(C) 4,187 42,037Corcept Therapeutics, Inc. (A) 16,861 281,073Corium International, Inc. (A)(C) 4,666 39,894CSPC Pharmaceutical Group, Ltd. 496,100 775,245Daiichi Sankyo Company, Ltd. (D) 90,400 2,139,953Depomed, Inc. (A) 10,003 60,818Dermira, Inc. (A) 7,356 173,528Durect Corp. (A) 26,870 42,723Eisai Company, Ltd. 42,354 2,198,416Eli Lilly & Company 138,301 11,242,488Endo International PLC (A) 43,787 384,888Forest Laboratories, Inc. (A)(D) 891 0GlaxoSmithKline PLC 269,257 5,341,997H Lundbeck A/S 20,684 1,319,973Hanmi Pharm Company, Ltd. (A) 1,132 405,927Hanmi Science Company, Ltd. (A) 2,342 186,780Hikma Pharmaceuticals PLC 7,993 129,531Hisamitsu Pharmaceutical Company, Inc. 9,700 468,753Horizon Pharma PLC (A) 29,789 407,514Hypermarcas SA 64,979 609,156Impax Laboratories, Inc. (A) 13,719 297,016Innoviva, Inc. (A) 14,471 203,173Intersect ENT, Inc. (A) 4,572 141,275Intra-Cellular Therapies, Inc. (A) 6,014 110,958Ipsen SA 6,755 908,746Johnson & Johnson 383,457 50,758,203Kalbe Farma Tbk PT 3,751,510 481,917Kyowa Hakko Kirin Company, Ltd. 41,528 733,008Lannett Company, Inc. (A)(C) 4,902 86,030Mallinckrodt PLC (A) 21,907 899,940Merck & Company, Inc. 389,576 24,878,323Merck KGaA 26,991 2,967,374Mitsubishi Tanabe Pharma Corp. 35,600 878,140Mylan NV (A) 66,158 2,082,654MyoKardia, Inc. (A)(C) 3,309 143,445Nektar Therapeutics (A) 26,890 565,497Novartis AG 373,100 31,454,975Novo Nordisk A/S, B Shares 544,942 25,966,380Omeros Corp. (A)(C) 7,994 163,637Ono Pharmaceutical Company, Ltd. 65,800 1,348,506Orion OYJ, Class B 19,122 905,365Otsuka Holdings Company, Ltd. 62,200 2,507,172Pacira Pharmaceuticals, Inc. (A) 7,217 274,968Paratek Pharmaceuticals, Inc. (A) 4,169 117,566Perrigo Company PLC 20,626 1,628,629Pfizer, Inc. 850,175 28,837,936Phibro Animal Health Corp., Class A 3,723 132,167Prestige Brands Holdings, Inc. (A) 21,221 1,076,117Reata Pharmaceuticals, Inc., Class A (A) 1,538 46,525Recordati SpA 15,398 660,414Revance Therapeutics, Inc. (A)(C) 4,028 98,887Richter Gedeon Nyrt 21,098 549,346Roche Holding AG 117,372 29,820,773Sanofi 208,499 20,328,723Santen Pharmaceutical Company, Ltd. 58,000 903,683SciClone Pharmaceuticals, Inc. (A) 9,323 102,553Shanghai Fosun Pharmaceutical Group
Company, Ltd., H Shares 58,100 218,741Shionogi & Company, Ltd. 47,263 2,497,357Sihuan Pharmaceutical Holdings
Group, Ltd. 435,000 167,615Sino Biopharmaceutical, Ltd. 521,000 458,117
Strategic Equity Allocation Fund (continued)Shares orPrincipalAmount Value
COMMON STOCKS (continued)Pharmaceuticals (continued)Sucampo Pharmaceuticals, Inc.,
Class A (A) 4,419 $ 51,923Sumitomo Dainippon Pharma
Company, Ltd. 25,200 344,000Supernus Pharmaceuticals, Inc. (A) 8,581 393,010Taisho Pharmaceutical Holdings
Company, Ltd. 4,900 383,648Takeda Pharmaceutical Company, Ltd. 113,492 6,293,606Taro Pharmaceutical
Industries, Ltd. (A)(C) 800 83,872Teligent, Inc. (A)(C) 7,442 51,424Tetraphase Pharmaceuticals, Inc. (A) 7,065 49,314Teva Pharmaceutical Industries, Ltd. 15,900 252,786Teva Pharmaceutical Industries, Ltd.,
ADR (C) 43,636 692,067The Medicines Company (A)(C) 12,502 458,698TherapeuticsMD, Inc. (A)(C) 30,256 181,536Theravance Biopharma, Inc. (A)(C) 7,872 257,178UCB SA 21,880 1,510,399Valeant Pharmaceuticals
International, Inc. (A) 57,370 771,365Vifor Pharma AG 8,091 819,476WaVe Life Sciences, Ltd. (A)(C) 2,179 51,207Yuhan Corp. 1,539 309,181Zoetis, Inc. 69,764 4,374,203Zogenix, Inc. (A)(C) 4,554 53,965Zynerba Pharmaceuticals, Inc. (A)(C) 2,154 13,678
342,169,691755,559,533
Industrials – 12.6%Aerospace and defense – 1.9%AAR Corp. 5,919 213,439Aerojet Rocketdyne Holdings, Inc. (A) 12,497 370,286Aerovironment, Inc. (A) 3,610 176,962Airbus SE 103,957 8,755,158Arconic, Inc. 89,262 2,273,503Aselsan Elektronik Sanayi ve Ticaret AS 26,924 210,632Astronics Corp. (A) 4,400 115,676AviChina Industry & Technology
Company, Ltd., H Shares 245,000 145,148Axon Enterprise, Inc. (A)(C) 9,733 211,303BAE Systems PLC 172,846 1,358,302Bombardier, Inc., Class B (A) 344,537 689,764CAE, Inc. 51,320 847,011Cobham PLC 128,834 228,861Cubic Corp. 4,274 183,568Curtiss-Wright Corp. 17,527 1,696,964Dassault Aviation SA 436 666,690DigitalGlobe, Inc. (A) 11,089 381,462Ducommun, Inc. (A) 1,929 53,048Elbit Systems, Ltd. 1,448 199,395Embraer SA 124,708 710,331Engility Holdings, Inc. (A) 3,227 100,263Esterline Technologies Corp. (A) 11,209 957,249General Dynamics Corp. 56,873 11,451,379Hanwha Techwin Company, Ltd. (A) 5,200 179,036Huntington Ingalls Industries, Inc. 10,148 2,171,266KLX, Inc. (A) 20,642 989,577Korea Aerospace Industries, Ltd. 12,752 524,312Kratos Defense & Security
Solutions, Inc. (A) 12,609 168,708L3 Technologies, Inc. 16,704 3,031,442Leonardo SpA 60,995 1,033,501Lockheed Martin Corp. 49,937 15,250,260
John Hancock Funds IIPortfolio of Investments — August 31, 2017 (showing percentage of total net assets)
165
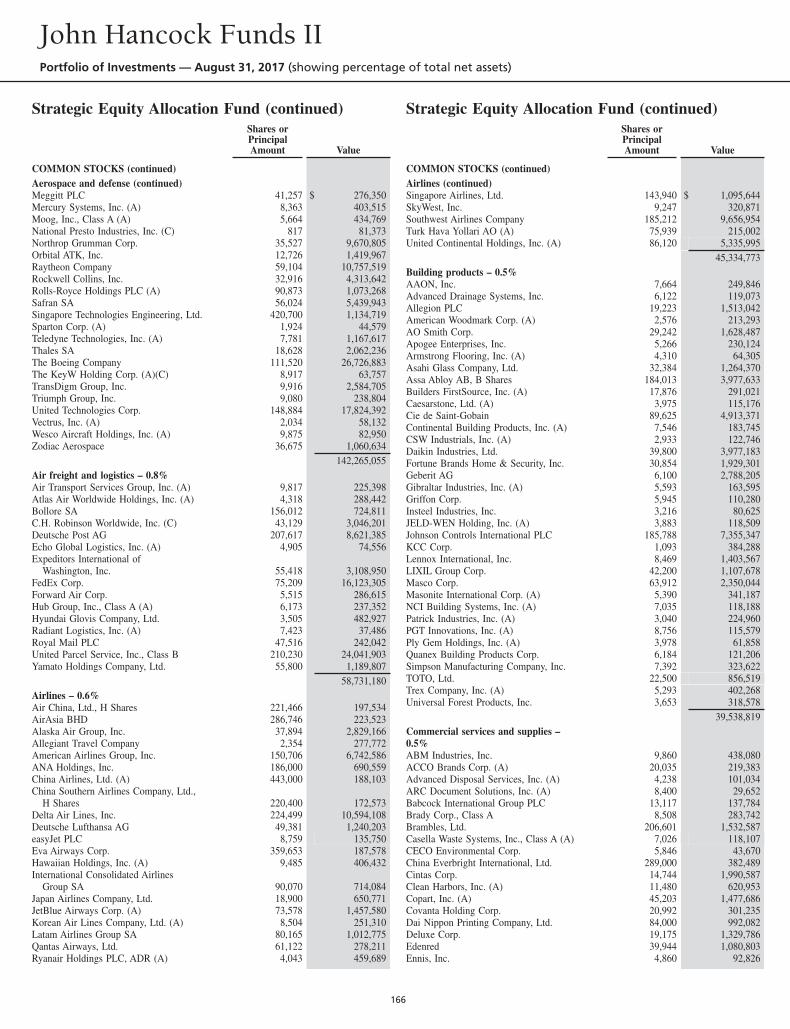
Strategic Equity Allocation Fund (continued)Shares orPrincipalAmount Value
COMMON STOCKS (continued)Aerospace and defense (continued)Meggitt PLC 41,257 $ 276,350Mercury Systems, Inc. (A) 8,363 403,515Moog, Inc., Class A (A) 5,664 434,769National Presto Industries, Inc. (C) 817 81,373Northrop Grumman Corp. 35,527 9,670,805Orbital ATK, Inc. 12,726 1,419,967Raytheon Company 59,104 10,757,519Rockwell Collins, Inc. 32,916 4,313,642Rolls-Royce Holdings PLC (A) 90,873 1,073,268Safran SA 56,024 5,439,943Singapore Technologies Engineering, Ltd. 420,700 1,134,719Sparton Corp. (A) 1,924 44,579Teledyne Technologies, Inc. (A) 7,781 1,167,617Thales SA 18,628 2,062,236The Boeing Company 111,520 26,726,883The KeyW Holding Corp. (A)(C) 8,917 63,757TransDigm Group, Inc. 9,916 2,584,705Triumph Group, Inc. 9,080 238,804United Technologies Corp. 148,884 17,824,392Vectrus, Inc. (A) 2,034 58,132Wesco Aircraft Holdings, Inc. (A) 9,875 82,950Zodiac Aerospace 36,675 1,060,634
142,265,055Air freight and logistics – 0.8%Air Transport Services Group, Inc. (A) 9,817 225,398Atlas Air Worldwide Holdings, Inc. (A) 4,318 288,442Bollore SA 156,012 724,811C.H. Robinson Worldwide, Inc. (C) 43,129 3,046,201Deutsche Post AG 207,617 8,621,385Echo Global Logistics, Inc. (A) 4,905 74,556Expeditors International of
Washington, Inc. 55,418 3,108,950FedEx Corp. 75,209 16,123,305Forward Air Corp. 5,515 286,615Hub Group, Inc., Class A (A) 6,173 237,352Hyundai Glovis Company, Ltd. 3,505 482,927Radiant Logistics, Inc. (A) 7,423 37,486Royal Mail PLC 47,516 242,042United Parcel Service, Inc., Class B 210,230 24,041,903Yamato Holdings Company, Ltd. 55,800 1,189,807
58,731,180Airlines – 0.6%Air China, Ltd., H Shares 221,466 197,534AirAsia BHD 286,746 223,523Alaska Air Group, Inc. 37,894 2,829,166Allegiant Travel Company 2,354 277,772American Airlines Group, Inc. 150,706 6,742,586ANA Holdings, Inc. 186,000 690,559China Airlines, Ltd. (A) 443,000 188,103China Southern Airlines Company, Ltd.,
H Shares 220,400 172,573Delta Air Lines, Inc. 224,499 10,594,108Deutsche Lufthansa AG 49,381 1,240,203easyJet PLC 8,759 135,750Eva Airways Corp. 359,653 187,578Hawaiian Holdings, Inc. (A) 9,485 406,432International Consolidated Airlines
Group SA 90,070 714,084Japan Airlines Company, Ltd. 18,900 650,771JetBlue Airways Corp. (A) 73,578 1,457,580Korean Air Lines Company, Ltd. (A) 8,504 251,310Latam Airlines Group SA 80,165 1,012,775Qantas Airways, Ltd. 61,122 278,211Ryanair Holdings PLC, ADR (A) 4,043 459,689
Strategic Equity Allocation Fund (continued)Shares orPrincipalAmount Value
COMMON STOCKS (continued)Airlines (continued)Singapore Airlines, Ltd. 143,940 $ 1,095,644SkyWest, Inc. 9,247 320,871Southwest Airlines Company 185,212 9,656,954Turk Hava Yollari AO (A) 75,939 215,002United Continental Holdings, Inc. (A) 86,120 5,335,995
45,334,773Building products – 0.5%AAON, Inc. 7,664 249,846Advanced Drainage Systems, Inc. 6,122 119,073Allegion PLC 19,223 1,513,042American Woodmark Corp. (A) 2,576 213,293AO Smith Corp. 29,242 1,628,487Apogee Enterprises, Inc. 5,266 230,124Armstrong Flooring, Inc. (A) 4,310 64,305Asahi Glass Company, Ltd. 32,384 1,264,370Assa Abloy AB, B Shares 184,013 3,977,633Builders FirstSource, Inc. (A) 17,876 291,021Caesarstone, Ltd. (A) 3,975 115,176Cie de Saint-Gobain 89,625 4,913,371Continental Building Products, Inc. (A) 7,546 183,745CSW Industrials, Inc. (A) 2,933 122,746Daikin Industries, Ltd. 39,800 3,977,183Fortune Brands Home & Security, Inc. 30,854 1,929,301Geberit AG 6,100 2,788,205Gibraltar Industries, Inc. (A) 5,593 163,595Griffon Corp. 5,945 110,280Insteel Industries, Inc. 3,216 80,625JELD-WEN Holding, Inc. (A) 3,883 118,509Johnson Controls International PLC 185,788 7,355,347KCC Corp. 1,093 384,288Lennox International, Inc. 8,469 1,403,567LIXIL Group Corp. 42,200 1,107,678Masco Corp. 63,912 2,350,044Masonite International Corp. (A) 5,390 341,187NCI Building Systems, Inc. (A) 7,035 118,188Patrick Industries, Inc. (A) 3,040 224,960PGT Innovations, Inc. (A) 8,756 115,579Ply Gem Holdings, Inc. (A) 3,978 61,858Quanex Building Products Corp. 6,184 121,206Simpson Manufacturing Company, Inc. 7,392 323,622TOTO, Ltd. 22,500 856,519Trex Company, Inc. (A) 5,293 402,268Universal Forest Products, Inc. 3,653 318,578
39,538,819Commercial services and supplies –0.5%ABM Industries, Inc. 9,860 438,080ACCO Brands Corp. (A) 20,035 219,383Advanced Disposal Services, Inc. (A) 4,238 101,034ARC Document Solutions, Inc. (A) 8,400 29,652Babcock International Group PLC 13,117 137,784Brady Corp., Class A 8,508 283,742Brambles, Ltd. 206,601 1,532,587Casella Waste Systems, Inc., Class A (A) 7,026 118,107CECO Environmental Corp. 5,846 43,670China Everbright International, Ltd. 289,000 382,489Cintas Corp. 14,744 1,990,587Clean Harbors, Inc. (A) 11,480 620,953Copart, Inc. (A) 45,203 1,477,686Covanta Holding Corp. 20,992 301,235Dai Nippon Printing Company, Ltd. 84,000 992,082Deluxe Corp. 19,175 1,329,786Edenred 39,944 1,080,803Ennis, Inc. 4,860 92,826
John Hancock Funds IIPortfolio of Investments — August 31, 2017 (showing percentage of total net assets)
166
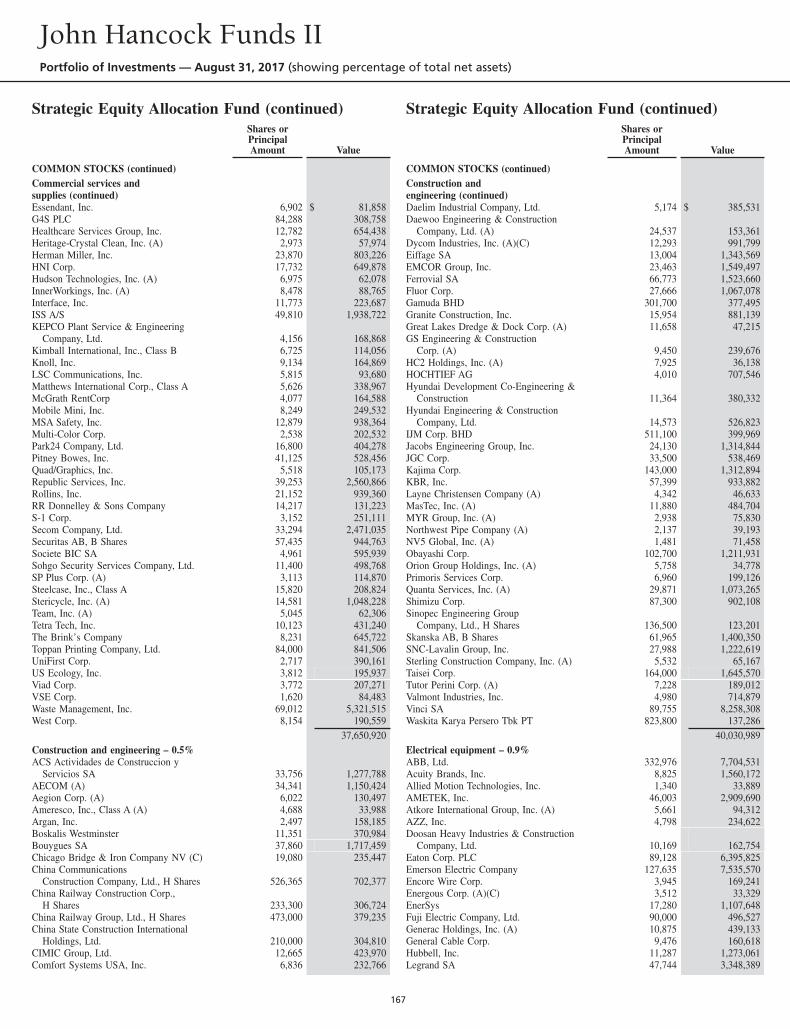
Strategic Equity Allocation Fund (continued)Shares orPrincipalAmount Value
COMMON STOCKS (continued)Commercial services andsupplies (continued)Essendant, Inc. 6,902 $ 81,858G4S PLC 84,288 308,758Healthcare Services Group, Inc. 12,782 654,438Heritage-Crystal Clean, Inc. (A) 2,973 57,974Herman Miller, Inc. 23,870 803,226HNI Corp. 17,732 649,878Hudson Technologies, Inc. (A) 6,975 62,078InnerWorkings, Inc. (A) 8,478 88,765Interface, Inc. 11,773 223,687ISS A/S 49,810 1,938,722KEPCO Plant Service & Engineering
Company, Ltd. 4,156 168,868Kimball International, Inc., Class B 6,725 114,056Knoll, Inc. 9,134 164,869LSC Communications, Inc. 5,815 93,680Matthews International Corp., Class A 5,626 338,967McGrath RentCorp 4,077 164,588Mobile Mini, Inc. 8,249 249,532MSA Safety, Inc. 12,879 938,364Multi-Color Corp. 2,538 202,532Park24 Company, Ltd. 16,800 404,278Pitney Bowes, Inc. 41,125 528,456Quad/Graphics, Inc. 5,518 105,173Republic Services, Inc. 39,253 2,560,866Rollins, Inc. 21,152 939,360RR Donnelley & Sons Company 14,217 131,223S-1 Corp. 3,152 251,111Secom Company, Ltd. 33,294 2,471,035Securitas AB, B Shares 57,435 944,763Societe BIC SA 4,961 595,939Sohgo Security Services Company, Ltd. 11,400 498,768SP Plus Corp. (A) 3,113 114,870Steelcase, Inc., Class A 15,820 208,824Stericycle, Inc. (A) 14,581 1,048,228Team, Inc. (A) 5,045 62,306Tetra Tech, Inc. 10,123 431,240The Brink’s Company 8,231 645,722Toppan Printing Company, Ltd. 84,000 841,506UniFirst Corp. 2,717 390,161US Ecology, Inc. 3,812 195,937Viad Corp. 3,772 207,271VSE Corp. 1,620 84,483Waste Management, Inc. 69,012 5,321,515West Corp. 8,154 190,559
37,650,920Construction and engineering – 0.5%ACS Actividades de Construccion y
Servicios SA 33,756 1,277,788AECOM (A) 34,341 1,150,424Aegion Corp. (A) 6,022 130,497Ameresco, Inc., Class A (A) 4,688 33,988Argan, Inc. 2,497 158,185Boskalis Westminster 11,351 370,984Bouygues SA 37,860 1,717,459Chicago Bridge & Iron Company NV (C) 19,080 235,447China Communications
Construction Company, Ltd., H Shares 526,365 702,377China Railway Construction Corp.,
H Shares 233,300 306,724China Railway Group, Ltd., H Shares 473,000 379,235China State Construction International
Holdings, Ltd. 210,000 304,810CIMIC Group, Ltd. 12,665 423,970Comfort Systems USA, Inc. 6,836 232,766
Strategic Equity Allocation Fund (continued)Shares orPrincipalAmount Value
COMMON STOCKS (continued)Construction andengineering (continued)Daelim Industrial Company, Ltd. 5,174 $ 385,531Daewoo Engineering & Construction
Company, Ltd. (A) 24,537 153,361Dycom Industries, Inc. (A)(C) 12,293 991,799Eiffage SA 13,004 1,343,569EMCOR Group, Inc. 23,463 1,549,497Ferrovial SA 66,773 1,523,660Fluor Corp. 27,666 1,067,078Gamuda BHD 301,700 377,495Granite Construction, Inc. 15,954 881,139Great Lakes Dredge & Dock Corp. (A) 11,658 47,215GS Engineering & Construction
Corp. (A) 9,450 239,676HC2 Holdings, Inc. (A) 7,925 36,138HOCHTIEF AG 4,010 707,546Hyundai Development Co-Engineering &
Construction 11,364 380,332Hyundai Engineering & Construction
Company, Ltd. 14,573 526,823IJM Corp. BHD 511,100 399,969Jacobs Engineering Group, Inc. 24,130 1,314,844JGC Corp. 33,500 538,469Kajima Corp. 143,000 1,312,894KBR, Inc. 57,399 933,882Layne Christensen Company (A) 4,342 46,633MasTec, Inc. (A) 11,880 484,704MYR Group, Inc. (A) 2,938 75,830Northwest Pipe Company (A) 2,137 39,193NV5 Global, Inc. (A) 1,481 71,458Obayashi Corp. 102,700 1,211,931Orion Group Holdings, Inc. (A) 5,758 34,778Primoris Services Corp. 6,960 199,126Quanta Services, Inc. (A) 29,871 1,073,265Shimizu Corp. 87,300 902,108Sinopec Engineering Group
Company, Ltd., H Shares 136,500 123,201Skanska AB, B Shares 61,965 1,400,350SNC-Lavalin Group, Inc. 27,988 1,222,619Sterling Construction Company, Inc. (A) 5,532 65,167Taisei Corp. 164,000 1,645,570Tutor Perini Corp. (A) 7,228 189,012Valmont Industries, Inc. 4,980 714,879Vinci SA 89,755 8,258,308Waskita Karya Persero Tbk PT 823,800 137,286
40,030,989Electrical equipment – 0.9%ABB, Ltd. 332,976 7,704,531Acuity Brands, Inc. 8,825 1,560,172Allied Motion Technologies, Inc. 1,340 33,889AMETEK, Inc. 46,003 2,909,690Atkore International Group, Inc. (A) 5,661 94,312AZZ, Inc. 4,798 234,622Doosan Heavy Industries & Construction
Company, Ltd. 10,169 162,754Eaton Corp. PLC 89,128 6,395,825Emerson Electric Company 127,635 7,535,570Encore Wire Corp. 3,945 169,241Energous Corp. (A)(C) 3,512 33,329EnerSys 17,280 1,107,648Fuji Electric Company, Ltd. 90,000 496,527Generac Holdings, Inc. (A) 10,875 439,133General Cable Corp. 9,476 160,618Hubbell, Inc. 11,287 1,273,061Legrand SA 47,744 3,348,389
John Hancock Funds IIPortfolio of Investments — August 31, 2017 (showing percentage of total net assets)
167
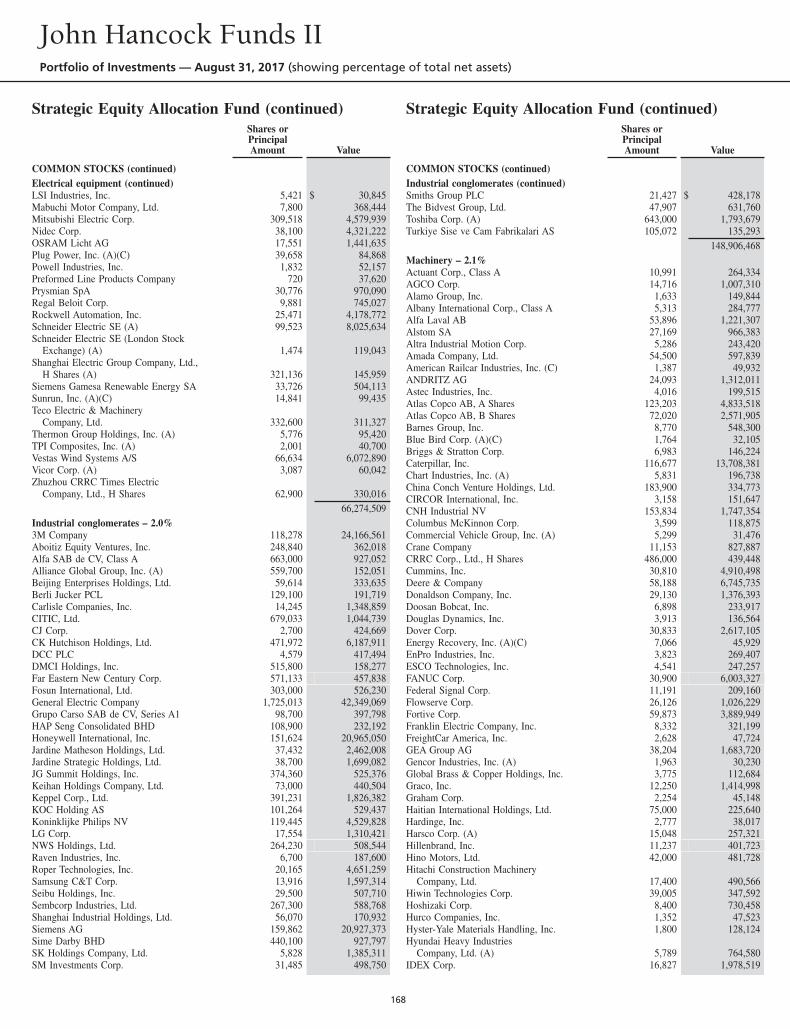
Strategic Equity Allocation Fund (continued)Shares orPrincipalAmount Value
COMMON STOCKS (continued)Electrical equipment (continued)LSI Industries, Inc. 5,421 $ 30,845Mabuchi Motor Company, Ltd. 7,800 368,444Mitsubishi Electric Corp. 309,518 4,579,939Nidec Corp. 38,100 4,321,222OSRAM Licht AG 17,551 1,441,635Plug Power, Inc. (A)(C) 39,658 84,868Powell Industries, Inc. 1,832 52,157Preformed Line Products Company 720 37,620Prysmian SpA 30,776 970,090Regal Beloit Corp. 9,881 745,027Rockwell Automation, Inc. 25,471 4,178,772Schneider Electric SE (A) 99,523 8,025,634Schneider Electric SE (London Stock
Exchange) (A) 1,474 119,043Shanghai Electric Group Company, Ltd.,
H Shares (A) 321,136 145,959Siemens Gamesa Renewable Energy SA 33,726 504,113Sunrun, Inc. (A)(C) 14,841 99,435Teco Electric & Machinery
Company, Ltd. 332,600 311,327Thermon Group Holdings, Inc. (A) 5,776 95,420TPI Composites, Inc. (A) 2,001 40,700Vestas Wind Systems A/S 66,634 6,072,890Vicor Corp. (A) 3,087 60,042Zhuzhou CRRC Times Electric
Company, Ltd., H Shares 62,900 330,01666,274,509
Industrial conglomerates – 2.0%3M Company 118,278 24,166,561Aboitiz Equity Ventures, Inc. 248,840 362,018Alfa SAB de CV, Class A 663,000 927,052Alliance Global Group, Inc. (A) 559,700 152,051Beijing Enterprises Holdings, Ltd. 59,614 333,635Berli Jucker PCL 129,100 191,719Carlisle Companies, Inc. 14,245 1,348,859CITIC, Ltd. 679,033 1,044,739CJ Corp. 2,700 424,669CK Hutchison Holdings, Ltd. 471,972 6,187,911DCC PLC 4,579 417,494DMCI Holdings, Inc. 515,800 158,277Far Eastern New Century Corp. 571,133 457,838Fosun International, Ltd. 303,000 526,230General Electric Company 1,725,013 42,349,069Grupo Carso SAB de CV, Series A1 98,700 397,798HAP Seng Consolidated BHD 108,900 232,192Honeywell International, Inc. 151,624 20,965,050Jardine Matheson Holdings, Ltd. 37,432 2,462,008Jardine Strategic Holdings, Ltd. 38,700 1,699,082JG Summit Holdings, Inc. 374,360 525,376Keihan Holdings Company, Ltd. 73,000 440,504Keppel Corp., Ltd. 391,231 1,826,382KOC Holding AS 101,264 529,437Koninklijke Philips NV 119,445 4,529,828LG Corp. 17,554 1,310,421NWS Holdings, Ltd. 264,230 508,544Raven Industries, Inc. 6,700 187,600Roper Technologies, Inc. 20,165 4,651,259Samsung C&T Corp. 13,916 1,597,314Seibu Holdings, Inc. 29,500 507,710Sembcorp Industries, Ltd. 267,300 588,768Shanghai Industrial Holdings, Ltd. 56,070 170,932Siemens AG 159,862 20,927,373Sime Darby BHD 440,100 927,797SK Holdings Company, Ltd. 5,828 1,385,311SM Investments Corp. 31,485 498,750
Strategic Equity Allocation Fund (continued)Shares orPrincipalAmount Value
COMMON STOCKS (continued)Industrial conglomerates (continued)Smiths Group PLC 21,427 $ 428,178The Bidvest Group, Ltd. 47,907 631,760Toshiba Corp. (A) 643,000 1,793,679Turkiye Sise ve Cam Fabrikalari AS 105,072 135,293
148,906,468Machinery – 2.1%Actuant Corp., Class A 10,991 264,334AGCO Corp. 14,716 1,007,310Alamo Group, Inc. 1,633 149,844Albany International Corp., Class A 5,313 284,777Alfa Laval AB 53,896 1,221,307Alstom SA 27,169 966,383Altra Industrial Motion Corp. 5,286 243,420Amada Company, Ltd. 54,500 597,839American Railcar Industries, Inc. (C) 1,387 49,932ANDRITZ AG 24,093 1,312,011Astec Industries, Inc. 4,016 199,515Atlas Copco AB, A Shares 123,203 4,833,518Atlas Copco AB, B Shares 72,020 2,571,905Barnes Group, Inc. 8,770 548,300Blue Bird Corp. (A)(C) 1,764 32,105Briggs & Stratton Corp. 6,983 146,224Caterpillar, Inc. 116,677 13,708,381Chart Industries, Inc. (A) 5,831 196,738China Conch Venture Holdings, Ltd. 183,900 334,773CIRCOR International, Inc. 3,158 151,647CNH Industrial NV 153,834 1,747,354Columbus McKinnon Corp. 3,599 118,875Commercial Vehicle Group, Inc. (A) 5,299 31,476Crane Company 11,153 827,887CRRC Corp., Ltd., H Shares 486,000 439,448Cummins, Inc. 30,810 4,910,498Deere & Company 58,188 6,745,735Donaldson Company, Inc. 29,130 1,376,393Doosan Bobcat, Inc. 6,898 233,917Douglas Dynamics, Inc. 3,913 136,564Dover Corp. 30,833 2,617,105Energy Recovery, Inc. (A)(C) 7,066 45,929EnPro Industries, Inc. 3,823 269,407ESCO Technologies, Inc. 4,541 247,257FANUC Corp. 30,900 6,003,327Federal Signal Corp. 11,191 209,160Flowserve Corp. 26,126 1,026,229Fortive Corp. 59,873 3,889,949Franklin Electric Company, Inc. 8,332 321,199FreightCar America, Inc. 2,628 47,724GEA Group AG 38,204 1,683,720Gencor Industries, Inc. (A) 1,963 30,230Global Brass & Copper Holdings, Inc. 3,775 112,684Graco, Inc. 12,250 1,414,998Graham Corp. 2,254 45,148Haitian International Holdings, Ltd. 75,000 225,640Hardinge, Inc. 2,777 38,017Harsco Corp. (A) 15,048 257,321Hillenbrand, Inc. 11,237 401,723Hino Motors, Ltd. 42,000 481,728Hitachi Construction Machinery
Company, Ltd. 17,400 490,566Hiwin Technologies Corp. 39,005 347,592Hoshizaki Corp. 8,400 730,458Hurco Companies, Inc. 1,352 47,523Hyster-Yale Materials Handling, Inc. 1,800 128,124Hyundai Heavy Industries
Company, Ltd. (A) 5,789 764,580IDEX Corp. 16,827 1,978,519
John Hancock Funds IIPortfolio of Investments — August 31, 2017 (showing percentage of total net assets)
168
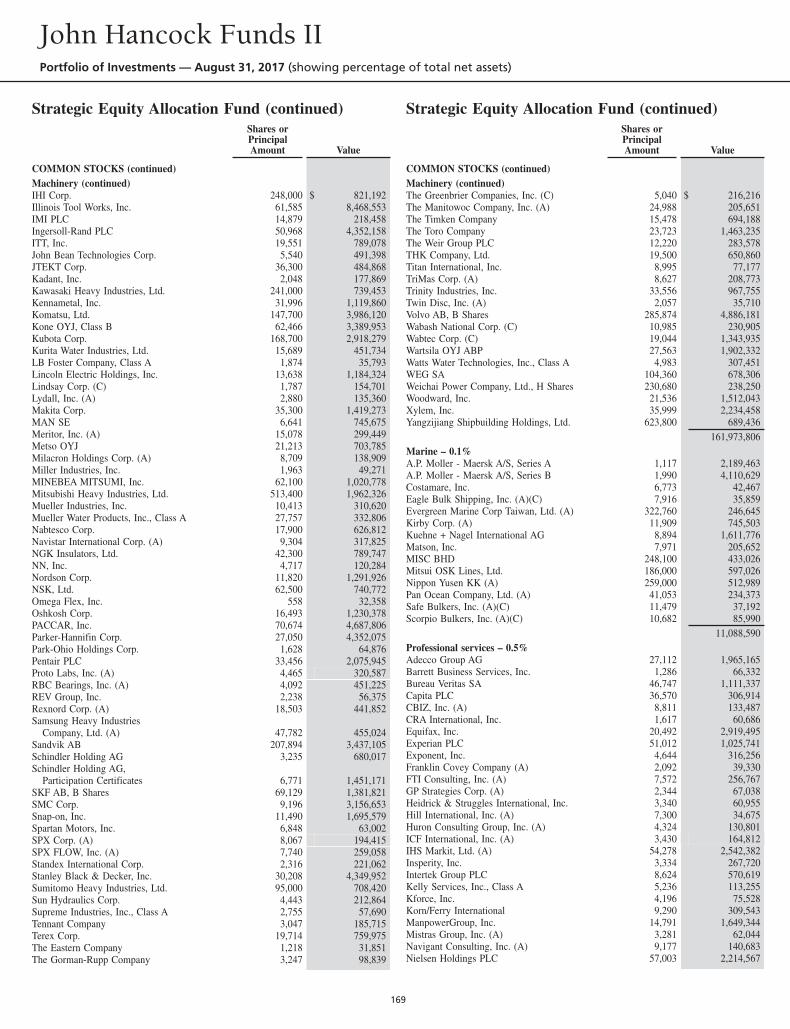
Strategic Equity Allocation Fund (continued)Shares orPrincipalAmount Value
COMMON STOCKS (continued)Machinery (continued)IHI Corp. 248,000 $ 821,192Illinois Tool Works, Inc. 61,585 8,468,553IMI PLC 14,879 218,458Ingersoll-Rand PLC 50,968 4,352,158ITT, Inc. 19,551 789,078John Bean Technologies Corp. 5,540 491,398JTEKT Corp. 36,300 484,868Kadant, Inc. 2,048 177,869Kawasaki Heavy Industries, Ltd. 241,000 739,453Kennametal, Inc. 31,996 1,119,860Komatsu, Ltd. 147,700 3,986,120Kone OYJ, Class B 62,466 3,389,953Kubota Corp. 168,700 2,918,279Kurita Water Industries, Ltd. 15,689 451,734LB Foster Company, Class A 1,874 35,793Lincoln Electric Holdings, Inc. 13,638 1,184,324Lindsay Corp. (C) 1,787 154,701Lydall, Inc. (A) 2,880 135,360Makita Corp. 35,300 1,419,273MAN SE 6,641 745,675Meritor, Inc. (A) 15,078 299,449Metso OYJ 21,213 703,785Milacron Holdings Corp. (A) 8,709 138,909Miller Industries, Inc. 1,963 49,271MINEBEA MITSUMI, Inc. 62,100 1,020,778Mitsubishi Heavy Industries, Ltd. 513,400 1,962,326Mueller Industries, Inc. 10,413 310,620Mueller Water Products, Inc., Class A 27,757 332,806Nabtesco Corp. 17,900 626,812Navistar International Corp. (A) 9,304 317,825NGK Insulators, Ltd. 42,300 789,747NN, Inc. 4,717 120,284Nordson Corp. 11,820 1,291,926NSK, Ltd. 62,500 740,772Omega Flex, Inc. 558 32,358Oshkosh Corp. 16,493 1,230,378PACCAR, Inc. 70,674 4,687,806Parker-Hannifin Corp. 27,050 4,352,075Park-Ohio Holdings Corp. 1,628 64,876Pentair PLC 33,456 2,075,945Proto Labs, Inc. (A) 4,465 320,587RBC Bearings, Inc. (A) 4,092 451,225REV Group, Inc. 2,238 56,375Rexnord Corp. (A) 18,503 441,852Samsung Heavy Industries
Company, Ltd. (A) 47,782 455,024Sandvik AB 207,894 3,437,105Schindler Holding AG 3,235 680,017Schindler Holding AG,
Participation Certificates 6,771 1,451,171SKF AB, B Shares 69,129 1,381,821SMC Corp. 9,196 3,156,653Snap-on, Inc. 11,490 1,695,579Spartan Motors, Inc. 6,848 63,002SPX Corp. (A) 8,067 194,415SPX FLOW, Inc. (A) 7,740 259,058Standex International Corp. 2,316 221,062Stanley Black & Decker, Inc. 30,208 4,349,952Sumitomo Heavy Industries, Ltd. 95,000 708,420Sun Hydraulics Corp. 4,443 212,864Supreme Industries, Inc., Class A 2,755 57,690Tennant Company 3,047 185,715Terex Corp. 19,714 759,975The Eastern Company 1,218 31,851The Gorman-Rupp Company 3,247 98,839
Strategic Equity Allocation Fund (continued)Shares orPrincipalAmount Value
COMMON STOCKS (continued)Machinery (continued)The Greenbrier Companies, Inc. (C) 5,040 $ 216,216The Manitowoc Company, Inc. (A) 24,988 205,651The Timken Company 15,478 694,188The Toro Company 23,723 1,463,235The Weir Group PLC 12,220 283,578THK Company, Ltd. 19,500 650,860Titan International, Inc. 8,995 77,177TriMas Corp. (A) 8,627 208,773Trinity Industries, Inc. 33,556 967,755Twin Disc, Inc. (A) 2,057 35,710Volvo AB, B Shares 285,874 4,886,181Wabash National Corp. (C) 10,985 230,905Wabtec Corp. (C) 19,044 1,343,935Wartsila OYJ ABP 27,563 1,902,332Watts Water Technologies, Inc., Class A 4,983 307,451WEG SA 104,360 678,306Weichai Power Company, Ltd., H Shares 230,680 238,250Woodward, Inc. 21,536 1,512,043Xylem, Inc. 35,999 2,234,458Yangzijiang Shipbuilding Holdings, Ltd. 623,800 689,436
161,973,806Marine – 0.1%A.P. Moller - Maersk A/S, Series A 1,117 2,189,463A.P. Moller - Maersk A/S, Series B 1,990 4,110,629Costamare, Inc. 6,773 42,467Eagle Bulk Shipping, Inc. (A)(C) 7,916 35,859Evergreen Marine Corp Taiwan, Ltd. (A) 322,760 246,645Kirby Corp. (A) 11,909 745,503Kuehne + Nagel International AG 8,894 1,611,776Matson, Inc. 7,971 205,652MISC BHD 248,100 433,026Mitsui OSK Lines, Ltd. 186,000 597,026Nippon Yusen KK (A) 259,000 512,989Pan Ocean Company, Ltd. (A) 41,053 234,373Safe Bulkers, Inc. (A)(C) 11,479 37,192Scorpio Bulkers, Inc. (A)(C) 10,682 85,990
11,088,590Professional services – 0.5%Adecco Group AG 27,112 1,965,165Barrett Business Services, Inc. 1,286 66,332Bureau Veritas SA 46,747 1,111,337Capita PLC 36,570 306,914CBIZ, Inc. (A) 8,811 133,487CRA International, Inc. 1,617 60,686Equifax, Inc. 20,492 2,919,495Experian PLC 51,012 1,025,741Exponent, Inc. 4,644 316,256Franklin Covey Company (A) 2,092 39,330FTI Consulting, Inc. (A) 7,572 256,767GP Strategies Corp. (A) 2,344 67,038Heidrick & Struggles International, Inc. 3,340 60,955Hill International, Inc. (A) 7,300 34,675Huron Consulting Group, Inc. (A) 4,324 130,801ICF International, Inc. (A) 3,430 164,812IHS Markit, Ltd. (A) 54,278 2,542,382Insperity, Inc. 3,334 267,720Intertek Group PLC 8,624 570,619Kelly Services, Inc., Class A 5,236 113,255Kforce, Inc. 4,196 75,528Korn/Ferry International 9,290 309,543ManpowerGroup, Inc. 14,791 1,649,344Mistras Group, Inc. (A) 3,281 62,044Navigant Consulting, Inc. (A) 9,177 140,683Nielsen Holdings PLC 57,003 2,214,567
John Hancock Funds IIPortfolio of Investments — August 31, 2017 (showing percentage of total net assets)
169
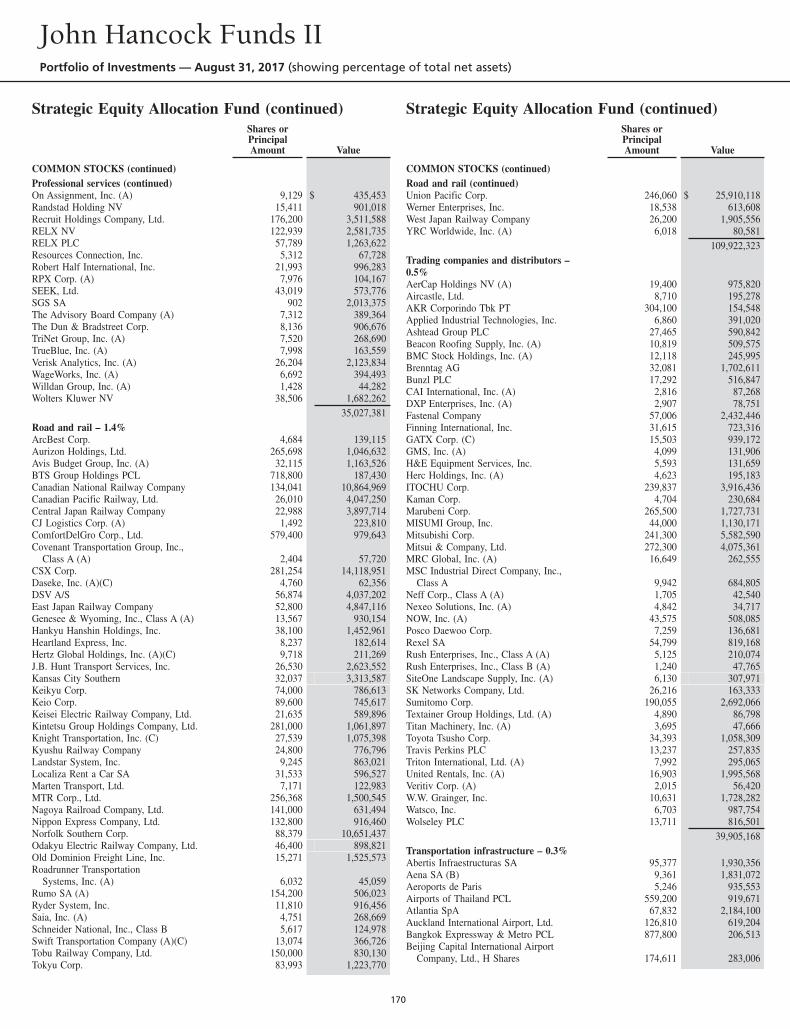
Strategic Equity Allocation Fund (continued)Shares orPrincipalAmount Value
COMMON STOCKS (continued)Professional services (continued)On Assignment, Inc. (A) 9,129 $ 435,453Randstad Holding NV 15,411 901,018Recruit Holdings Company, Ltd. 176,200 3,511,588RELX NV 122,939 2,581,735RELX PLC 57,789 1,263,622Resources Connection, Inc. 5,312 67,728Robert Half International, Inc. 21,993 996,283RPX Corp. (A) 7,976 104,167SEEK, Ltd. 43,019 573,776SGS SA 902 2,013,375The Advisory Board Company (A) 7,312 389,364The Dun & Bradstreet Corp. 8,136 906,676TriNet Group, Inc. (A) 7,520 268,690TrueBlue, Inc. (A) 7,998 163,559Verisk Analytics, Inc. (A) 26,204 2,123,834WageWorks, Inc. (A) 6,692 394,493Willdan Group, Inc. (A) 1,428 44,282Wolters Kluwer NV 38,506 1,682,262
35,027,381Road and rail – 1.4%ArcBest Corp. 4,684 139,115Aurizon Holdings, Ltd. 265,698 1,046,632Avis Budget Group, Inc. (A) 32,115 1,163,526BTS Group Holdings PCL 718,800 187,430Canadian National Railway Company 134,041 10,864,969Canadian Pacific Railway, Ltd. 26,010 4,047,250Central Japan Railway Company 22,988 3,897,714CJ Logistics Corp. (A) 1,492 223,810ComfortDelGro Corp., Ltd. 579,400 979,643Covenant Transportation Group, Inc.,
Class A (A) 2,404 57,720CSX Corp. 281,254 14,118,951Daseke, Inc. (A)(C) 4,760 62,356DSV A/S 56,874 4,037,202East Japan Railway Company 52,800 4,847,116Genesee & Wyoming, Inc., Class A (A) 13,567 930,154Hankyu Hanshin Holdings, Inc. 38,100 1,452,961Heartland Express, Inc. 8,237 182,614Hertz Global Holdings, Inc. (A)(C) 9,718 211,269J.B. Hunt Transport Services, Inc. 26,530 2,623,552Kansas City Southern 32,037 3,313,587Keikyu Corp. 74,000 786,613Keio Corp. 89,600 745,617Keisei Electric Railway Company, Ltd. 21,635 589,896Kintetsu Group Holdings Company, Ltd. 281,000 1,061,897Knight Transportation, Inc. (C) 27,539 1,075,398Kyushu Railway Company 24,800 776,796Landstar System, Inc. 9,245 863,021Localiza Rent a Car SA 31,533 596,527Marten Transport, Ltd. 7,171 122,983MTR Corp., Ltd. 256,368 1,500,545Nagoya Railroad Company, Ltd. 141,000 631,494Nippon Express Company, Ltd. 132,800 916,460Norfolk Southern Corp. 88,379 10,651,437Odakyu Electric Railway Company, Ltd. 46,400 898,821Old Dominion Freight Line, Inc. 15,271 1,525,573Roadrunner Transportation
Systems, Inc. (A) 6,032 45,059Rumo SA (A) 154,200 506,023Ryder System, Inc. 11,810 916,456Saia, Inc. (A) 4,751 268,669Schneider National, Inc., Class B 5,617 124,978Swift Transportation Company (A)(C) 13,074 366,726Tobu Railway Company, Ltd. 150,000 830,130Tokyu Corp. 83,993 1,223,770
Strategic Equity Allocation Fund (continued)Shares orPrincipalAmount Value
COMMON STOCKS (continued)Road and rail (continued)Union Pacific Corp. 246,060 $ 25,910,118Werner Enterprises, Inc. 18,538 613,608West Japan Railway Company 26,200 1,905,556YRC Worldwide, Inc. (A) 6,018 80,581
109,922,323Trading companies and distributors –0.5%AerCap Holdings NV (A) 19,400 975,820Aircastle, Ltd. 8,710 195,278AKR Corporindo Tbk PT 304,100 154,548Applied Industrial Technologies, Inc. 6,860 391,020Ashtead Group PLC 27,465 590,842Beacon Roofing Supply, Inc. (A) 10,819 509,575BMC Stock Holdings, Inc. (A) 12,118 245,995Brenntag AG 32,081 1,702,611Bunzl PLC 17,292 516,847CAI International, Inc. (A) 2,816 87,268DXP Enterprises, Inc. (A) 2,907 78,751Fastenal Company 57,006 2,432,446Finning International, Inc. 31,615 723,316GATX Corp. (C) 15,503 939,172GMS, Inc. (A) 4,099 131,906H&E Equipment Services, Inc. 5,593 131,659Herc Holdings, Inc. (A) 4,623 195,183ITOCHU Corp. 239,837 3,916,436Kaman Corp. 4,704 230,684Marubeni Corp. 265,500 1,727,731MISUMI Group, Inc. 44,000 1,130,171Mitsubishi Corp. 241,300 5,582,590Mitsui & Company, Ltd. 272,300 4,075,361MRC Global, Inc. (A) 16,649 262,555MSC Industrial Direct Company, Inc.,
Class A 9,942 684,805Neff Corp., Class A (A) 1,705 42,540Nexeo Solutions, Inc. (A) 4,842 34,717NOW, Inc. (A) 43,575 508,085Posco Daewoo Corp. 7,259 136,681Rexel SA 54,799 819,168Rush Enterprises, Inc., Class A (A) 5,125 210,074Rush Enterprises, Inc., Class B (A) 1,240 47,765SiteOne Landscape Supply, Inc. (A) 6,130 307,971SK Networks Company, Ltd. 26,216 163,333Sumitomo Corp. 190,055 2,692,066Textainer Group Holdings, Ltd. (A) 4,890 86,798Titan Machinery, Inc. (A) 3,695 47,666Toyota Tsusho Corp. 34,393 1,058,309Travis Perkins PLC 13,237 257,835Triton International, Ltd. (A) 7,992 295,065United Rentals, Inc. (A) 16,903 1,995,568Veritiv Corp. (A) 2,015 56,420W.W. Grainger, Inc. 10,631 1,728,282Watsco, Inc. 6,703 987,754Wolseley PLC 13,711 816,501
39,905,168Transportation infrastructure – 0.3%Abertis Infraestructuras SA 95,377 1,930,356Aena SA (B) 9,361 1,831,072Aeroports de Paris 5,246 935,553Airports of Thailand PCL 559,200 919,671Atlantia SpA 67,832 2,184,100Auckland International Airport, Ltd. 126,810 619,204Bangkok Expressway & Metro PCL 877,800 206,513Beijing Capital International Airport
Company, Ltd., H Shares 174,611 283,006
John Hancock Funds IIPortfolio of Investments — August 31, 2017 (showing percentage of total net assets)
170
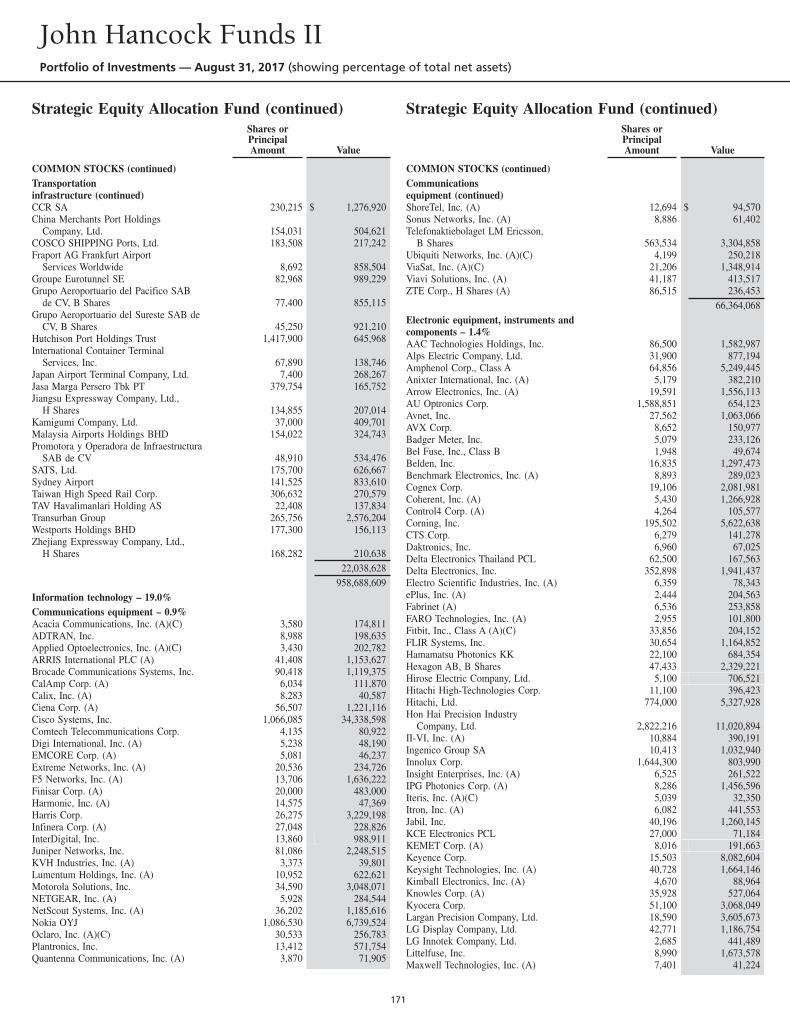
Strategic Equity Allocation Fund (continued)Shares orPrincipalAmount Value
COMMON STOCKS (continued)Transportationinfrastructure (continued)CCR SA 230,215 $ 1,276,920China Merchants Port Holdings
Company, Ltd. 154,031 504,621COSCO SHIPPING Ports, Ltd. 183,508 217,242Fraport AG Frankfurt Airport
Services Worldwide 8,692 858,504Groupe Eurotunnel SE 82,968 989,229Grupo Aeroportuario del Pacifico SAB
de CV, B Shares 77,400 855,115Grupo Aeroportuario del Sureste SAB de
CV, B Shares 45,250 921,210Hutchison Port Holdings Trust 1,417,900 645,968International Container Terminal
Services, Inc. 67,890 138,746Japan Airport Terminal Company, Ltd. 7,400 268,267Jasa Marga Persero Tbk PT 379,754 165,752Jiangsu Expressway Company, Ltd.,
H Shares 134,855 207,014Kamigumi Company, Ltd. 37,000 409,701Malaysia Airports Holdings BHD 154,022 324,743Promotora y Operadora de Infraestructura
SAB de CV 48,910 534,476SATS, Ltd. 175,700 626,667Sydney Airport 141,525 833,610Taiwan High Speed Rail Corp. 306,632 270,579TAV Havalimanlari Holding AS 22,408 137,834Transurban Group 265,756 2,576,204Westports Holdings BHD 177,300 156,113Zhejiang Expressway Company, Ltd.,
H Shares 168,282 210,63822,038,628
958,688,609Information technology – 19.0%Communications equipment – 0.9%Acacia Communications, Inc. (A)(C) 3,580 174,811ADTRAN, Inc. 8,988 198,635Applied Optoelectronics, Inc. (A)(C) 3,430 202,782ARRIS International PLC (A) 41,408 1,153,627Brocade Communications Systems, Inc. 90,418 1,119,375CalAmp Corp. (A) 6,034 111,870Calix, Inc. (A) 8,283 40,587Ciena Corp. (A) 56,507 1,221,116Cisco Systems, Inc. 1,066,085 34,338,598Comtech Telecommunications Corp. 4,135 80,922Digi International, Inc. (A) 5,238 48,190EMCORE Corp. (A) 5,081 46,237Extreme Networks, Inc. (A) 20,536 234,726F5 Networks, Inc. (A) 13,706 1,636,222Finisar Corp. (A) 20,000 483,000Harmonic, Inc. (A) 14,575 47,369Harris Corp. 26,275 3,229,198Infinera Corp. (A) 27,048 228,826InterDigital, Inc. 13,860 988,911Juniper Networks, Inc. 81,086 2,248,515KVH Industries, Inc. (A) 3,373 39,801Lumentum Holdings, Inc. (A) 10,952 622,621Motorola Solutions, Inc. 34,590 3,048,071NETGEAR, Inc. (A) 5,928 284,544NetScout Systems, Inc. (A) 36,202 1,185,616Nokia OYJ 1,086,530 6,739,524Oclaro, Inc. (A)(C) 30,533 256,783Plantronics, Inc. 13,412 571,754Quantenna Communications, Inc. (A) 3,870 71,905
Strategic Equity Allocation Fund (continued)Shares orPrincipalAmount Value
COMMON STOCKS (continued)Communicationsequipment (continued)ShoreTel, Inc. (A) 12,694 $ 94,570Sonus Networks, Inc. (A) 8,886 61,402Telefonaktiebolaget LM Ericsson,
B Shares 563,534 3,304,858Ubiquiti Networks, Inc. (A)(C) 4,199 250,218ViaSat, Inc. (A)(C) 21,206 1,348,914Viavi Solutions, Inc. (A) 41,187 413,517ZTE Corp., H Shares (A) 86,515 236,453
66,364,068Electronic equipment, instruments andcomponents – 1.4%AAC Technologies Holdings, Inc. 86,500 1,582,987Alps Electric Company, Ltd. 31,900 877,194Amphenol Corp., Class A 64,856 5,249,445Anixter International, Inc. (A) 5,179 382,210Arrow Electronics, Inc. (A) 19,591 1,556,113AU Optronics Corp. 1,588,851 654,123Avnet, Inc. 27,562 1,063,066AVX Corp. 8,652 150,977Badger Meter, Inc. 5,079 233,126Bel Fuse, Inc., Class B 1,948 49,674Belden, Inc. 16,835 1,297,473Benchmark Electronics, Inc. (A) 8,893 289,023Cognex Corp. 19,106 2,081,981Coherent, Inc. (A) 5,430 1,266,928Control4 Corp. (A) 4,264 105,577Corning, Inc. 195,502 5,622,638CTS Corp. 6,279 141,278Daktronics, Inc. 6,960 67,025Delta Electronics Thailand PCL 62,500 167,563Delta Electronics, Inc. 352,898 1,941,437Electro Scientific Industries, Inc. (A) 6,359 78,343ePlus, Inc. (A) 2,444 204,563Fabrinet (A) 6,536 253,858FARO Technologies, Inc. (A) 2,955 101,800Fitbit, Inc., Class A (A)(C) 33,856 204,152FLIR Systems, Inc. 30,654 1,164,852Hamamatsu Photonics KK 22,100 684,354Hexagon AB, B Shares 47,433 2,329,221Hirose Electric Company, Ltd. 5,100 706,521Hitachi High-Technologies Corp. 11,100 396,423Hitachi, Ltd. 774,000 5,327,928Hon Hai Precision Industry
Company, Ltd. 2,822,216 11,020,894II-VI, Inc. (A) 10,884 390,191Ingenico Group SA 10,413 1,032,940Innolux Corp. 1,644,300 803,990Insight Enterprises, Inc. (A) 6,525 261,522IPG Photonics Corp. (A) 8,286 1,456,596Iteris, Inc. (A)(C) 5,039 32,350Itron, Inc. (A) 6,082 441,553Jabil, Inc. 40,196 1,260,145KCE Electronics PCL 27,000 71,184KEMET Corp. (A) 8,016 191,663Keyence Corp. 15,503 8,082,604Keysight Technologies, Inc. (A) 40,728 1,664,146Kimball Electronics, Inc. (A) 4,670 88,964Knowles Corp. (A) 35,928 527,064Kyocera Corp. 51,100 3,068,049Largan Precision Company, Ltd. 18,590 3,605,673LG Display Company, Ltd. 42,771 1,186,754LG Innotek Company, Ltd. 2,685 441,489Littelfuse, Inc. 8,990 1,673,578Maxwell Technologies, Inc. (A) 7,401 41,224
John Hancock Funds IIPortfolio of Investments — August 31, 2017 (showing percentage of total net assets)
171
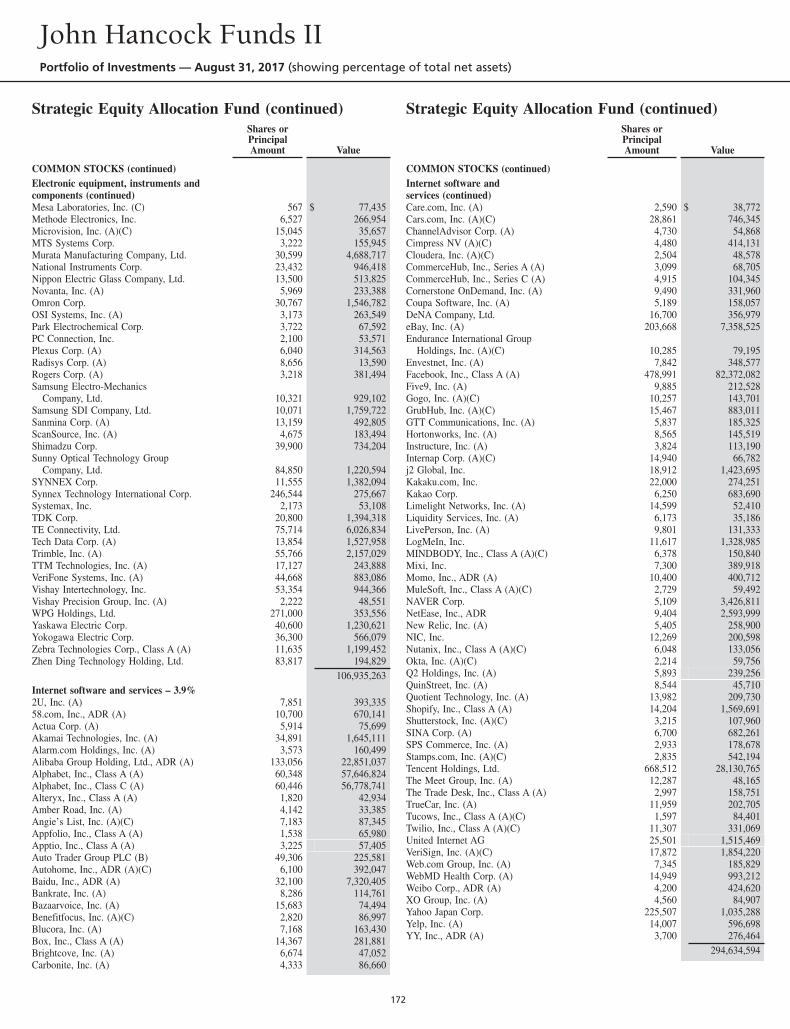
Strategic Equity Allocation Fund (continued)Shares orPrincipalAmount Value
COMMON STOCKS (continued)Electronic equipment, instruments andcomponents (continued)Mesa Laboratories, Inc. (C) 567 $ 77,435Methode Electronics, Inc. 6,527 266,954Microvision, Inc. (A)(C) 15,045 35,657MTS Systems Corp. 3,222 155,945Murata Manufacturing Company, Ltd. 30,599 4,688,717National Instruments Corp. 23,432 946,418Nippon Electric Glass Company, Ltd. 13,500 513,825Novanta, Inc. (A) 5,969 233,388Omron Corp. 30,767 1,546,782OSI Systems, Inc. (A) 3,173 263,549Park Electrochemical Corp. 3,722 67,592PC Connection, Inc. 2,100 53,571Plexus Corp. (A) 6,040 314,563Radisys Corp. (A) 8,656 13,590Rogers Corp. (A) 3,218 381,494Samsung Electro-Mechanics
Company, Ltd. 10,321 929,102Samsung SDI Company, Ltd. 10,071 1,759,722Sanmina Corp. (A) 13,159 492,805ScanSource, Inc. (A) 4,675 183,494Shimadzu Corp. 39,900 734,204Sunny Optical Technology Group
Company, Ltd. 84,850 1,220,594SYNNEX Corp. 11,555 1,382,094Synnex Technology International Corp. 246,544 275,667Systemax, Inc. 2,173 53,108TDK Corp. 20,800 1,394,318TE Connectivity, Ltd. 75,714 6,026,834Tech Data Corp. (A) 13,854 1,527,958Trimble, Inc. (A) 55,766 2,157,029TTM Technologies, Inc. (A) 17,127 243,888VeriFone Systems, Inc. (A) 44,668 883,086Vishay Intertechnology, Inc. 53,354 944,366Vishay Precision Group, Inc. (A) 2,222 48,551WPG Holdings, Ltd. 271,000 353,556Yaskawa Electric Corp. 40,600 1,230,621Yokogawa Electric Corp. 36,300 566,079Zebra Technologies Corp., Class A (A) 11,635 1,199,452Zhen Ding Technology Holding, Ltd. 83,817 194,829
106,935,263Internet software and services – 3.9%2U, Inc. (A) 7,851 393,33558.com, Inc., ADR (A) 10,700 670,141Actua Corp. (A) 5,914 75,699Akamai Technologies, Inc. (A) 34,891 1,645,111Alarm.com Holdings, Inc. (A) 3,573 160,499Alibaba Group Holding, Ltd., ADR (A) 133,056 22,851,037Alphabet, Inc., Class A (A) 60,348 57,646,824Alphabet, Inc., Class C (A) 60,446 56,778,741Alteryx, Inc., Class A (A) 1,820 42,934Amber Road, Inc. (A) 4,142 33,385Angie’s List, Inc. (A)(C) 7,183 87,345Appfolio, Inc., Class A (A) 1,538 65,980Apptio, Inc., Class A (A) 3,225 57,405Auto Trader Group PLC (B) 49,306 225,581Autohome, Inc., ADR (A)(C) 6,100 392,047Baidu, Inc., ADR (A) 32,100 7,320,405Bankrate, Inc. (A) 8,286 114,761Bazaarvoice, Inc. (A) 15,683 74,494Benefitfocus, Inc. (A)(C) 2,820 86,997Blucora, Inc. (A) 7,168 163,430Box, Inc., Class A (A) 14,367 281,881Brightcove, Inc. (A) 6,674 47,052Carbonite, Inc. (A) 4,333 86,660
Strategic Equity Allocation Fund (continued)Shares orPrincipalAmount Value
COMMON STOCKS (continued)Internet software andservices (continued)Care.com, Inc. (A) 2,590 $ 38,772Cars.com, Inc. (A)(C) 28,861 746,345ChannelAdvisor Corp. (A) 4,730 54,868Cimpress NV (A)(C) 4,480 414,131Cloudera, Inc. (A)(C) 2,504 48,578CommerceHub, Inc., Series A (A) 3,099 68,705CommerceHub, Inc., Series C (A) 4,915 104,345Cornerstone OnDemand, Inc. (A) 9,490 331,960Coupa Software, Inc. (A) 5,189 158,057DeNA Company, Ltd. 16,700 356,979eBay, Inc. (A) 203,668 7,358,525Endurance International Group
Holdings, Inc. (A)(C) 10,285 79,195Envestnet, Inc. (A) 7,842 348,577Facebook, Inc., Class A (A) 478,991 82,372,082Five9, Inc. (A) 9,885 212,528Gogo, Inc. (A)(C) 10,257 143,701GrubHub, Inc. (A)(C) 15,467 883,011GTT Communications, Inc. (A) 5,837 185,325Hortonworks, Inc. (A) 8,565 145,519Instructure, Inc. (A) 3,824 113,190Internap Corp. (A)(C) 14,940 66,782j2 Global, Inc. 18,912 1,423,695Kakaku.com, Inc. 22,000 274,251Kakao Corp. 6,250 683,690Limelight Networks, Inc. (A) 14,599 52,410Liquidity Services, Inc. (A) 6,173 35,186LivePerson, Inc. (A) 9,801 131,333LogMeIn, Inc. 11,617 1,328,985MINDBODY, Inc., Class A (A)(C) 6,378 150,840Mixi, Inc. 7,300 389,918Momo, Inc., ADR (A) 10,400 400,712MuleSoft, Inc., Class A (A)(C) 2,729 59,492NAVER Corp. 5,109 3,426,811NetEase, Inc., ADR 9,404 2,593,999New Relic, Inc. (A) 5,405 258,900NIC, Inc. 12,269 200,598Nutanix, Inc., Class A (A)(C) 6,048 133,056Okta, Inc. (A)(C) 2,214 59,756Q2 Holdings, Inc. (A) 5,893 239,256QuinStreet, Inc. (A) 8,544 45,710Quotient Technology, Inc. (A) 13,982 209,730Shopify, Inc., Class A (A) 14,204 1,569,691Shutterstock, Inc. (A)(C) 3,215 107,960SINA Corp. (A) 6,700 682,261SPS Commerce, Inc. (A) 2,933 178,678Stamps.com, Inc. (A)(C) 2,835 542,194Tencent Holdings, Ltd. 668,512 28,130,765The Meet Group, Inc. (A) 12,287 48,165The Trade Desk, Inc., Class A (A) 2,997 158,751TrueCar, Inc. (A) 11,959 202,705Tucows, Inc., Class A (A)(C) 1,597 84,401Twilio, Inc., Class A (A)(C) 11,307 331,069United Internet AG 25,501 1,515,469VeriSign, Inc. (A)(C) 17,872 1,854,220Web.com Group, Inc. (A) 7,345 185,829WebMD Health Corp. (A) 14,949 993,212Weibo Corp., ADR (A) 4,200 424,620XO Group, Inc. (A) 4,560 84,907Yahoo Japan Corp. 225,507 1,035,288Yelp, Inc. (A) 14,007 596,698YY, Inc., ADR (A) 3,700 276,464
294,634,594
John Hancock Funds IIPortfolio of Investments — August 31, 2017 (showing percentage of total net assets)
172
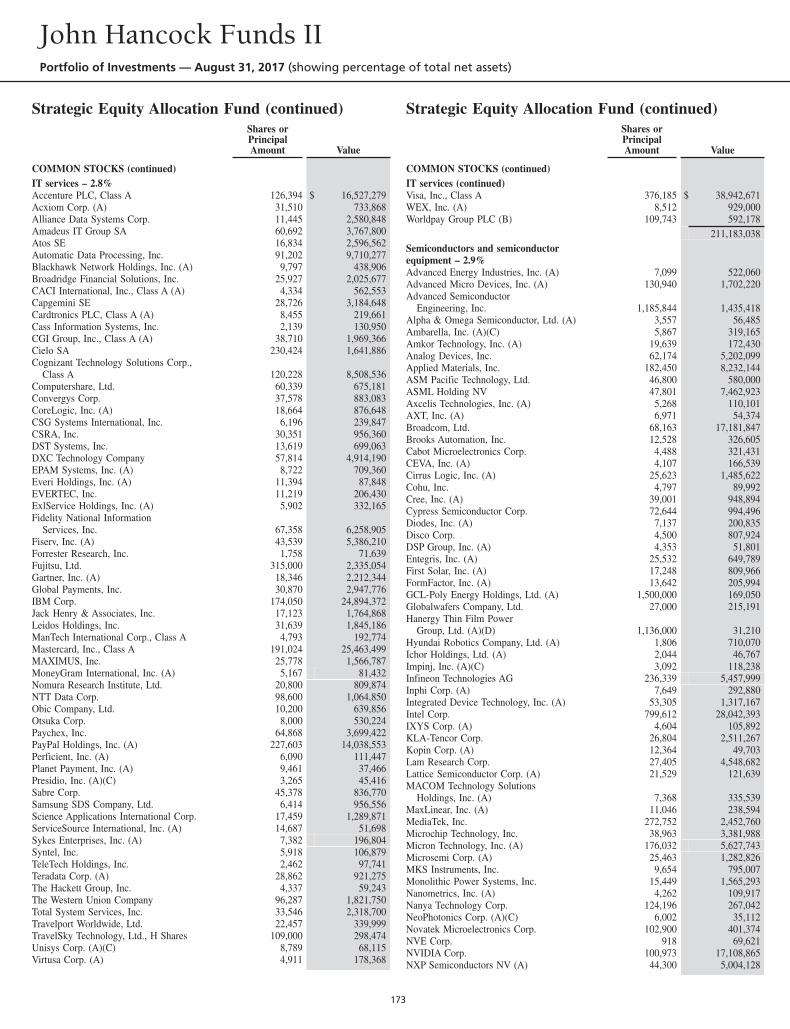
Strategic Equity Allocation Fund (continued)Shares orPrincipalAmount Value
COMMON STOCKS (continued)IT services – 2.8%Accenture PLC, Class A 126,394 $ 16,527,279Acxiom Corp. (A) 31,510 733,868Alliance Data Systems Corp. 11,445 2,580,848Amadeus IT Group SA 60,692 3,767,800Atos SE 16,834 2,596,562Automatic Data Processing, Inc. 91,202 9,710,277Blackhawk Network Holdings, Inc. (A) 9,797 438,906Broadridge Financial Solutions, Inc. 25,927 2,025,677CACI International, Inc., Class A (A) 4,334 562,553Capgemini SE 28,726 3,184,648Cardtronics PLC, Class A (A) 8,455 219,661Cass Information Systems, Inc. 2,139 130,950CGI Group, Inc., Class A (A) 38,710 1,969,366Cielo SA 230,424 1,641,886Cognizant Technology Solutions Corp.,
Class A 120,228 8,508,536Computershare, Ltd. 60,339 675,181Convergys Corp. 37,578 883,083CoreLogic, Inc. (A) 18,664 876,648CSG Systems International, Inc. 6,196 239,847CSRA, Inc. 30,351 956,360DST Systems, Inc. 13,619 699,063DXC Technology Company 57,814 4,914,190EPAM Systems, Inc. (A) 8,722 709,360Everi Holdings, Inc. (A) 11,394 87,848EVERTEC, Inc. 11,219 206,430ExlService Holdings, Inc. (A) 5,902 332,165Fidelity National Information
Services, Inc. 67,358 6,258,905Fiserv, Inc. (A) 43,539 5,386,210Forrester Research, Inc. 1,758 71,639Fujitsu, Ltd. 315,000 2,335,054Gartner, Inc. (A) 18,346 2,212,344Global Payments, Inc. 30,870 2,947,776IBM Corp. 174,050 24,894,372Jack Henry & Associates, Inc. 17,123 1,764,868Leidos Holdings, Inc. 31,639 1,845,186ManTech International Corp., Class A 4,793 192,774Mastercard, Inc., Class A 191,024 25,463,499MAXIMUS, Inc. 25,778 1,566,787MoneyGram International, Inc. (A) 5,167 81,432Nomura Research Institute, Ltd. 20,800 809,874NTT Data Corp. 98,600 1,064,850Obic Company, Ltd. 10,200 639,856Otsuka Corp. 8,000 530,224Paychex, Inc. 64,868 3,699,422PayPal Holdings, Inc. (A) 227,603 14,038,553Perficient, Inc. (A) 6,090 111,447Planet Payment, Inc. (A) 9,461 37,466Presidio, Inc. (A)(C) 3,265 45,416Sabre Corp. 45,378 836,770Samsung SDS Company, Ltd. 6,414 956,556Science Applications International Corp. 17,459 1,289,871ServiceSource International, Inc. (A) 14,687 51,698Sykes Enterprises, Inc. (A) 7,382 196,804Syntel, Inc. 5,918 106,879TeleTech Holdings, Inc. 2,462 97,741Teradata Corp. (A) 28,862 921,275The Hackett Group, Inc. 4,337 59,243The Western Union Company 96,287 1,821,750Total System Services, Inc. 33,546 2,318,700Travelport Worldwide, Ltd. 22,457 339,999TravelSky Technology, Ltd., H Shares 109,000 298,474Unisys Corp. (A)(C) 8,789 68,115Virtusa Corp. (A) 4,911 178,368
Strategic Equity Allocation Fund (continued)Shares orPrincipalAmount Value
COMMON STOCKS (continued)IT services (continued)Visa, Inc., Class A 376,185 $ 38,942,671WEX, Inc. (A) 8,512 929,000Worldpay Group PLC (B) 109,743 592,178
211,183,038Semiconductors and semiconductorequipment – 2.9%Advanced Energy Industries, Inc. (A) 7,099 522,060Advanced Micro Devices, Inc. (A) 130,940 1,702,220Advanced Semiconductor
Engineering, Inc. 1,185,844 1,435,418Alpha & Omega Semiconductor, Ltd. (A) 3,557 56,485Ambarella, Inc. (A)(C) 5,867 319,165Amkor Technology, Inc. (A) 19,639 172,430Analog Devices, Inc. 62,174 5,202,099Applied Materials, Inc. 182,450 8,232,144ASM Pacific Technology, Ltd. 46,800 580,000ASML Holding NV 47,801 7,462,923Axcelis Technologies, Inc. (A) 5,268 110,101AXT, Inc. (A) 6,971 54,374Broadcom, Ltd. 68,163 17,181,847Brooks Automation, Inc. 12,528 326,605Cabot Microelectronics Corp. 4,488 321,431CEVA, Inc. (A) 4,107 166,539Cirrus Logic, Inc. (A) 25,623 1,485,622Cohu, Inc. 4,797 89,992Cree, Inc. (A) 39,001 948,894Cypress Semiconductor Corp. 72,644 994,496Diodes, Inc. (A) 7,137 200,835Disco Corp. 4,500 807,924DSP Group, Inc. (A) 4,353 51,801Entegris, Inc. (A) 25,532 649,789First Solar, Inc. (A) 17,248 809,966FormFactor, Inc. (A) 13,642 205,994GCL-Poly Energy Holdings, Ltd. (A) 1,500,000 169,050Globalwafers Company, Ltd. 27,000 215,191Hanergy Thin Film Power
Group, Ltd. (A)(D) 1,136,000 31,210Hyundai Robotics Company, Ltd. (A) 1,806 710,070Ichor Holdings, Ltd. (A) 2,044 46,767Impinj, Inc. (A)(C) 3,092 118,238Infineon Technologies AG 236,339 5,457,999Inphi Corp. (A) 7,649 292,880Integrated Device Technology, Inc. (A) 53,305 1,317,167Intel Corp. 799,612 28,042,393IXYS Corp. (A) 4,604 105,892KLA-Tencor Corp. 26,804 2,511,267Kopin Corp. (A) 12,364 49,703Lam Research Corp. 27,405 4,548,682Lattice Semiconductor Corp. (A) 21,529 121,639MACOM Technology Solutions
Holdings, Inc. (A) 7,368 335,539MaxLinear, Inc. (A) 11,046 238,594MediaTek, Inc. 272,752 2,452,760Microchip Technology, Inc. 38,963 3,381,988Micron Technology, Inc. (A) 176,032 5,627,743Microsemi Corp. (A) 25,463 1,282,826MKS Instruments, Inc. 9,654 795,007Monolithic Power Systems, Inc. 15,449 1,565,293Nanometrics, Inc. (A) 4,262 109,917Nanya Technology Corp. 124,196 267,042NeoPhotonics Corp. (A)(C) 6,002 35,112Novatek Microelectronics Corp. 102,900 401,374NVE Corp. 918 69,621NVIDIA Corp. 100,973 17,108,865NXP Semiconductors NV (A) 44,300 5,004,128
John Hancock Funds IIPortfolio of Investments — August 31, 2017 (showing percentage of total net assets)
173
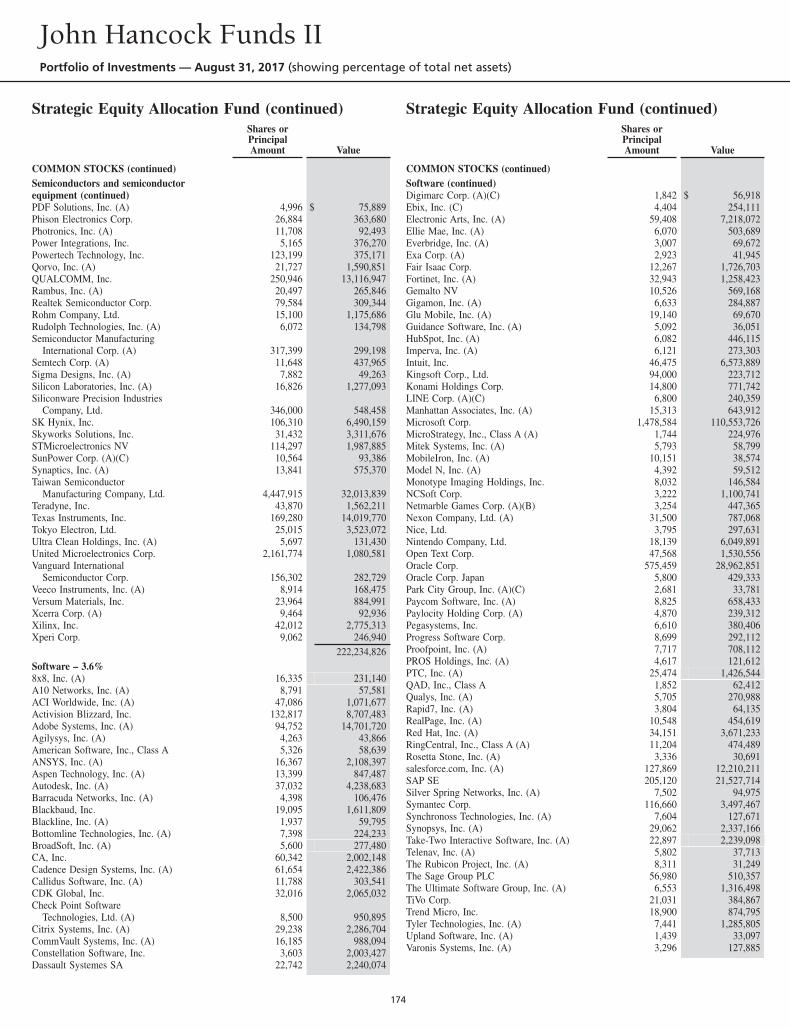
Strategic Equity Allocation Fund (continued)Shares orPrincipalAmount Value
COMMON STOCKS (continued)Semiconductors and semiconductorequipment (continued)PDF Solutions, Inc. (A) 4,996 $ 75,889Phison Electronics Corp. 26,884 363,680Photronics, Inc. (A) 11,708 92,493Power Integrations, Inc. 5,165 376,270Powertech Technology, Inc. 123,199 375,171Qorvo, Inc. (A) 21,727 1,590,851QUALCOMM, Inc. 250,946 13,116,947Rambus, Inc. (A) 20,497 265,846Realtek Semiconductor Corp. 79,584 309,344Rohm Company, Ltd. 15,100 1,175,686Rudolph Technologies, Inc. (A) 6,072 134,798Semiconductor Manufacturing
International Corp. (A) 317,399 299,198Semtech Corp. (A) 11,648 437,965Sigma Designs, Inc. (A) 7,882 49,263Silicon Laboratories, Inc. (A) 16,826 1,277,093Siliconware Precision Industries
Company, Ltd. 346,000 548,458SK Hynix, Inc. 106,310 6,490,159Skyworks Solutions, Inc. 31,432 3,311,676STMicroelectronics NV 114,297 1,987,885SunPower Corp. (A)(C) 10,564 93,386Synaptics, Inc. (A) 13,841 575,370Taiwan Semiconductor
Manufacturing Company, Ltd. 4,447,915 32,013,839Teradyne, Inc. 43,870 1,562,211Texas Instruments, Inc. 169,280 14,019,770Tokyo Electron, Ltd. 25,015 3,523,072Ultra Clean Holdings, Inc. (A) 5,697 131,430United Microelectronics Corp. 2,161,774 1,080,581Vanguard International
Semiconductor Corp. 156,302 282,729Veeco Instruments, Inc. (A) 8,914 168,475Versum Materials, Inc. 23,964 884,991Xcerra Corp. (A) 9,464 92,936Xilinx, Inc. 42,012 2,775,313Xperi Corp. 9,062 246,940
222,234,826Software – 3.6%8x8, Inc. (A) 16,335 231,140A10 Networks, Inc. (A) 8,791 57,581ACI Worldwide, Inc. (A) 47,086 1,071,677Activision Blizzard, Inc. 132,817 8,707,483Adobe Systems, Inc. (A) 94,752 14,701,720Agilysys, Inc. (A) 4,263 43,866American Software, Inc., Class A 5,326 58,639ANSYS, Inc. (A) 16,367 2,108,397Aspen Technology, Inc. (A) 13,399 847,487Autodesk, Inc. (A) 37,032 4,238,683Barracuda Networks, Inc. (A) 4,398 106,476Blackbaud, Inc. 19,095 1,611,809Blackline, Inc. (A) 1,937 59,795Bottomline Technologies, Inc. (A) 7,398 224,233BroadSoft, Inc. (A) 5,600 277,480CA, Inc. 60,342 2,002,148Cadence Design Systems, Inc. (A) 61,654 2,422,386Callidus Software, Inc. (A) 11,788 303,541CDK Global, Inc. 32,016 2,065,032Check Point Software
Technologies, Ltd. (A) 8,500 950,895Citrix Systems, Inc. (A) 29,238 2,286,704CommVault Systems, Inc. (A) 16,185 988,094Constellation Software, Inc. 3,603 2,003,427Dassault Systemes SA 22,742 2,240,074
Strategic Equity Allocation Fund (continued)Shares orPrincipalAmount Value
COMMON STOCKS (continued)Software (continued)Digimarc Corp. (A)(C) 1,842 $ 56,918Ebix, Inc. (C) 4,404 254,111Electronic Arts, Inc. (A) 59,408 7,218,072Ellie Mae, Inc. (A) 6,070 503,689Everbridge, Inc. (A) 3,007 69,672Exa Corp. (A) 2,923 41,945Fair Isaac Corp. 12,267 1,726,703Fortinet, Inc. (A) 32,943 1,258,423Gemalto NV 10,526 569,168Gigamon, Inc. (A) 6,633 284,887Glu Mobile, Inc. (A) 19,140 69,670Guidance Software, Inc. (A) 5,092 36,051HubSpot, Inc. (A) 6,082 446,115Imperva, Inc. (A) 6,121 273,303Intuit, Inc. 46,475 6,573,889Kingsoft Corp., Ltd. 94,000 223,712Konami Holdings Corp. 14,800 771,742LINE Corp. (A)(C) 6,800 240,359Manhattan Associates, Inc. (A) 15,313 643,912Microsoft Corp. 1,478,584 110,553,726MicroStrategy, Inc., Class A (A) 1,744 224,976Mitek Systems, Inc. (A) 5,793 58,799MobileIron, Inc. (A) 10,151 38,574Model N, Inc. (A) 4,392 59,512Monotype Imaging Holdings, Inc. 8,032 146,584NCSoft Corp. 3,222 1,100,741Netmarble Games Corp. (A)(B) 3,254 447,365Nexon Company, Ltd. (A) 31,500 787,068Nice, Ltd. 3,795 297,631Nintendo Company, Ltd. 18,139 6,049,891Open Text Corp. 47,568 1,530,556Oracle Corp. 575,459 28,962,851Oracle Corp. Japan 5,800 429,333Park City Group, Inc. (A)(C) 2,681 33,781Paycom Software, Inc. (A) 8,825 658,433Paylocity Holding Corp. (A) 4,870 239,312Pegasystems, Inc. 6,610 380,406Progress Software Corp. 8,699 292,112Proofpoint, Inc. (A) 7,717 708,112PROS Holdings, Inc. (A) 4,617 121,612PTC, Inc. (A) 25,474 1,426,544QAD, Inc., Class A 1,852 62,412Qualys, Inc. (A) 5,705 270,988Rapid7, Inc. (A) 3,804 64,135RealPage, Inc. (A) 10,548 454,619Red Hat, Inc. (A) 34,151 3,671,233RingCentral, Inc., Class A (A) 11,204 474,489Rosetta Stone, Inc. (A) 3,336 30,691salesforce.com, Inc. (A) 127,869 12,210,211SAP SE 205,120 21,527,714Silver Spring Networks, Inc. (A) 7,502 94,975Symantec Corp. 116,660 3,497,467Synchronoss Technologies, Inc. (A) 7,604 127,671Synopsys, Inc. (A) 29,062 2,337,166Take-Two Interactive Software, Inc. (A) 22,897 2,239,098Telenav, Inc. (A) 5,802 37,713The Rubicon Project, Inc. (A) 8,311 31,249The Sage Group PLC 56,980 510,357The Ultimate Software Group, Inc. (A) 6,553 1,316,498TiVo Corp. 21,031 384,867Trend Micro, Inc. 18,900 874,795Tyler Technologies, Inc. (A) 7,441 1,285,805Upland Software, Inc. (A) 1,439 33,097Varonis Systems, Inc. (A) 3,296 127,885
John Hancock Funds IIPortfolio of Investments — August 31, 2017 (showing percentage of total net assets)
174
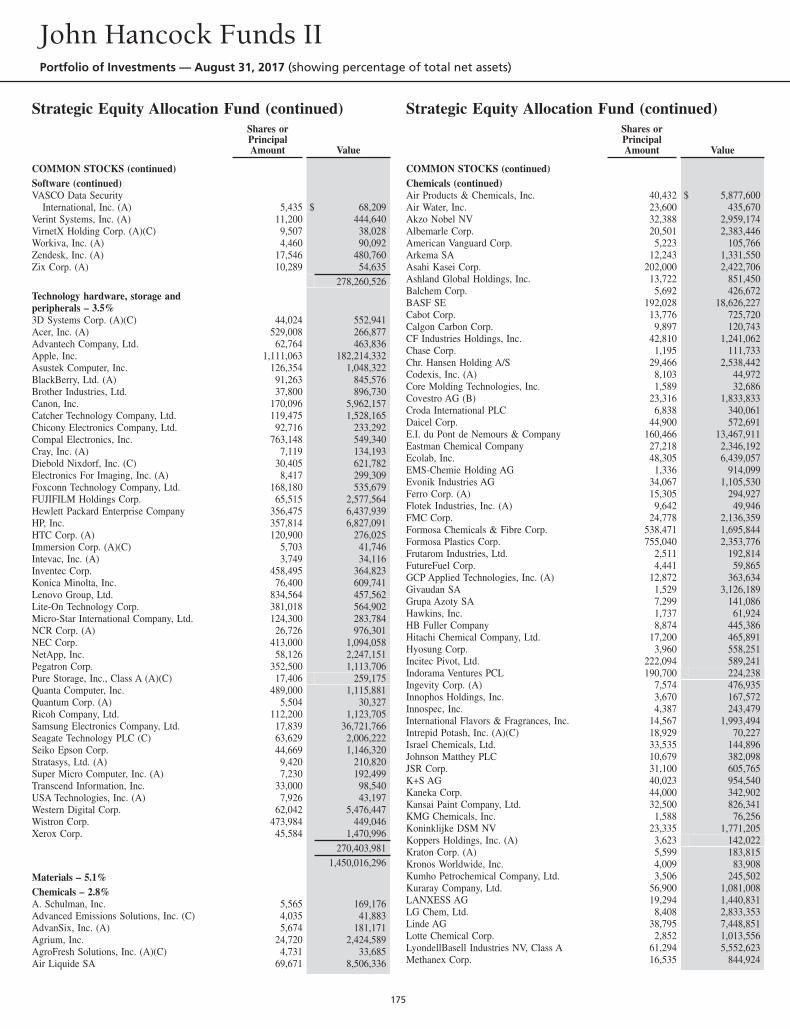
Strategic Equity Allocation Fund (continued)Shares orPrincipalAmount Value
COMMON STOCKS (continued)Software (continued)VASCO Data Security
International, Inc. (A) 5,435 $ 68,209Verint Systems, Inc. (A) 11,200 444,640VirnetX Holding Corp. (A)(C) 9,507 38,028Workiva, Inc. (A) 4,460 90,092Zendesk, Inc. (A) 17,546 480,760Zix Corp. (A) 10,289 54,635
278,260,526Technology hardware, storage andperipherals – 3.5%3D Systems Corp. (A)(C) 44,024 552,941Acer, Inc. (A) 529,008 266,877Advantech Company, Ltd. 62,764 463,836Apple, Inc. 1,111,063 182,214,332Asustek Computer, Inc. 126,354 1,048,322BlackBerry, Ltd. (A) 91,263 845,576Brother Industries, Ltd. 37,800 896,730Canon, Inc. 170,096 5,962,157Catcher Technology Company, Ltd. 119,475 1,528,165Chicony Electronics Company, Ltd. 92,716 233,292Compal Electronics, Inc. 763,148 549,340Cray, Inc. (A) 7,119 134,193Diebold Nixdorf, Inc. (C) 30,405 621,782Electronics For Imaging, Inc. (A) 8,417 299,309Foxconn Technology Company, Ltd. 168,180 535,679FUJIFILM Holdings Corp. 65,515 2,577,564Hewlett Packard Enterprise Company 356,475 6,437,939HP, Inc. 357,814 6,827,091HTC Corp. (A) 120,900 276,025Immersion Corp. (A)(C) 5,703 41,746Intevac, Inc. (A) 3,749 34,116Inventec Corp. 458,495 364,823Konica Minolta, Inc. 76,400 609,741Lenovo Group, Ltd. 834,564 457,562Lite-On Technology Corp. 381,018 564,902Micro-Star International Company, Ltd. 124,300 283,784NCR Corp. (A) 26,726 976,301NEC Corp. 413,000 1,094,058NetApp, Inc. 58,126 2,247,151Pegatron Corp. 352,500 1,113,706Pure Storage, Inc., Class A (A)(C) 17,406 259,175Quanta Computer, Inc. 489,000 1,115,881Quantum Corp. (A) 5,504 30,327Ricoh Company, Ltd. 112,200 1,123,705Samsung Electronics Company, Ltd. 17,839 36,721,766Seagate Technology PLC (C) 63,629 2,006,222Seiko Epson Corp. 44,669 1,146,320Stratasys, Ltd. (A) 9,420 210,820Super Micro Computer, Inc. (A) 7,230 192,499Transcend Information, Inc. 33,000 98,540USA Technologies, Inc. (A) 7,926 43,197Western Digital Corp. 62,042 5,476,447Wistron Corp. 473,984 449,046Xerox Corp. 45,584 1,470,996
270,403,9811,450,016,296
Materials – 5.1%Chemicals – 2.8%A. Schulman, Inc. 5,565 169,176Advanced Emissions Solutions, Inc. (C) 4,035 41,883AdvanSix, Inc. (A) 5,674 181,171Agrium, Inc. 24,720 2,424,589AgroFresh Solutions, Inc. (A)(C) 4,731 33,685Air Liquide SA 69,671 8,506,336
Strategic Equity Allocation Fund (continued)Shares orPrincipalAmount Value
COMMON STOCKS (continued)Chemicals (continued)Air Products & Chemicals, Inc. 40,432 $ 5,877,600Air Water, Inc. 23,600 435,670Akzo Nobel NV 32,388 2,959,174Albemarle Corp. 20,501 2,383,446American Vanguard Corp. 5,223 105,766Arkema SA 12,243 1,331,550Asahi Kasei Corp. 202,000 2,422,706Ashland Global Holdings, Inc. 13,722 851,450Balchem Corp. 5,692 426,672BASF SE 192,028 18,626,227Cabot Corp. 13,776 725,720Calgon Carbon Corp. 9,897 120,743CF Industries Holdings, Inc. 42,810 1,241,062Chase Corp. 1,195 111,733Chr. Hansen Holding A/S 29,466 2,538,442Codexis, Inc. (A) 8,103 44,972Core Molding Technologies, Inc. 1,589 32,686Covestro AG (B) 23,316 1,833,833Croda International PLC 6,838 340,061Daicel Corp. 44,900 572,691E.I. du Pont de Nemours & Company 160,466 13,467,911Eastman Chemical Company 27,218 2,346,192Ecolab, Inc. 48,305 6,439,057EMS-Chemie Holding AG 1,336 914,099Evonik Industries AG 34,067 1,105,530Ferro Corp. (A) 15,305 294,927Flotek Industries, Inc. (A) 9,642 49,946FMC Corp. 24,778 2,136,359Formosa Chemicals & Fibre Corp. 538,471 1,695,844Formosa Plastics Corp. 755,040 2,353,776Frutarom Industries, Ltd. 2,511 192,814FutureFuel Corp. 4,441 59,865GCP Applied Technologies, Inc. (A) 12,872 363,634Givaudan SA 1,529 3,126,189Grupa Azoty SA 7,299 141,086Hawkins, Inc. 1,737 61,924HB Fuller Company 8,874 445,386Hitachi Chemical Company, Ltd. 17,200 465,891Hyosung Corp. 3,960 558,251Incitec Pivot, Ltd. 222,094 589,241Indorama Ventures PCL 190,700 224,238Ingevity Corp. (A) 7,574 476,935Innophos Holdings, Inc. 3,670 167,572Innospec, Inc. 4,387 243,479International Flavors & Fragrances, Inc. 14,567 1,993,494Intrepid Potash, Inc. (A)(C) 18,929 70,227Israel Chemicals, Ltd. 33,535 144,896Johnson Matthey PLC 10,679 382,098JSR Corp. 31,100 605,765K+S AG 40,023 954,540Kaneka Corp. 44,000 342,902Kansai Paint Company, Ltd. 32,500 826,341KMG Chemicals, Inc. 1,588 76,256Koninklijke DSM NV 23,335 1,771,205Koppers Holdings, Inc. (A) 3,623 142,022Kraton Corp. (A) 5,599 183,815Kronos Worldwide, Inc. 4,009 83,908Kumho Petrochemical Company, Ltd. 3,506 245,502Kuraray Company, Ltd. 56,900 1,081,008LANXESS AG 19,294 1,440,831LG Chem, Ltd. 8,408 2,833,353Linde AG 38,795 7,448,851Lotte Chemical Corp. 2,852 1,013,556LyondellBasell Industries NV, Class A 61,294 5,552,623Methanex Corp. 16,535 844,924
John Hancock Funds IIPortfolio of Investments — August 31, 2017 (showing percentage of total net assets)
175
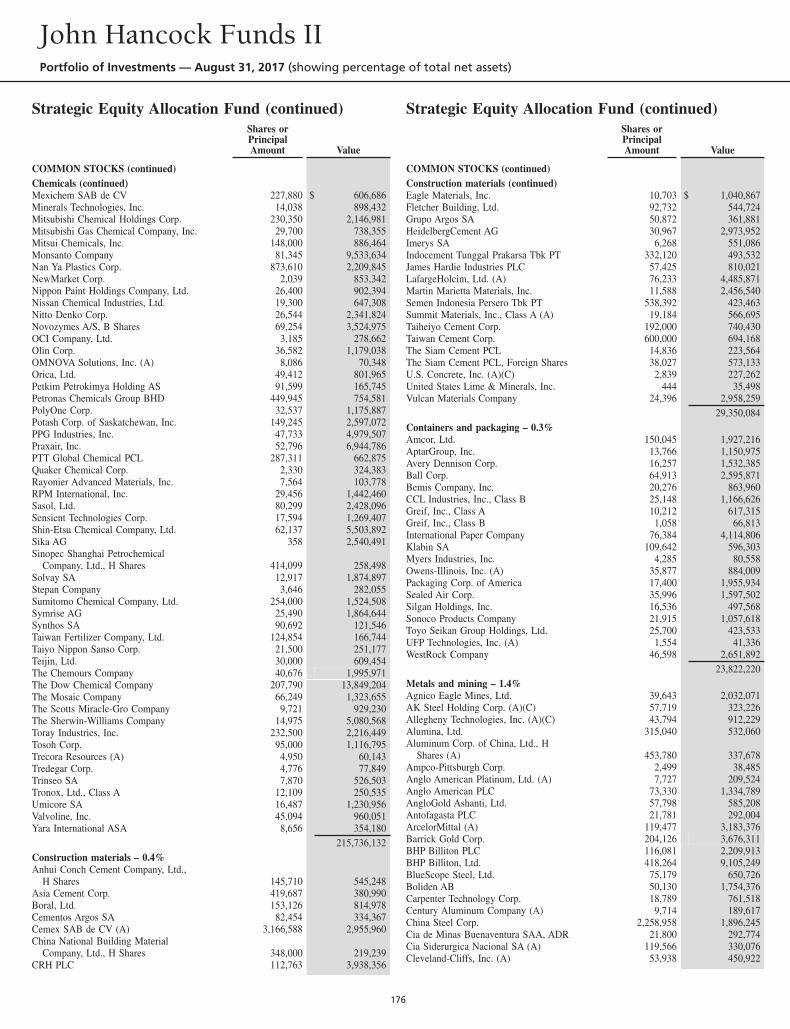
Strategic Equity Allocation Fund (continued)Shares orPrincipalAmount Value
COMMON STOCKS (continued)Chemicals (continued)Mexichem SAB de CV 227,880 $ 606,686Minerals Technologies, Inc. 14,038 898,432Mitsubishi Chemical Holdings Corp. 230,350 2,146,981Mitsubishi Gas Chemical Company, Inc. 29,700 738,355Mitsui Chemicals, Inc. 148,000 886,464Monsanto Company 81,345 9,533,634Nan Ya Plastics Corp. 873,610 2,209,845NewMarket Corp. 2,039 853,342Nippon Paint Holdings Company, Ltd. 26,400 902,394Nissan Chemical Industries, Ltd. 19,300 647,308Nitto Denko Corp. 26,544 2,341,824Novozymes A/S, B Shares 69,254 3,524,975OCI Company, Ltd. 3,185 278,662Olin Corp. 36,582 1,179,038OMNOVA Solutions, Inc. (A) 8,086 70,348Orica, Ltd. 49,412 801,965Petkim Petrokimya Holding AS 91,599 165,745Petronas Chemicals Group BHD 449,945 754,581PolyOne Corp. 32,537 1,175,887Potash Corp. of Saskatchewan, Inc. 149,245 2,597,072PPG Industries, Inc. 47,733 4,979,507Praxair, Inc. 52,796 6,944,786PTT Global Chemical PCL 287,311 662,875Quaker Chemical Corp. 2,330 324,383Rayonier Advanced Materials, Inc. 7,564 103,778RPM International, Inc. 29,456 1,442,460Sasol, Ltd. 80,299 2,428,096Sensient Technologies Corp. 17,594 1,269,407Shin-Etsu Chemical Company, Ltd. 62,137 5,503,892Sika AG 358 2,540,491Sinopec Shanghai Petrochemical
Company, Ltd., H Shares 414,099 258,498Solvay SA 12,917 1,874,897Stepan Company 3,646 282,055Sumitomo Chemical Company, Ltd. 254,000 1,524,508Symrise AG 25,490 1,864,644Synthos SA 90,692 121,546Taiwan Fertilizer Company, Ltd. 124,854 166,744Taiyo Nippon Sanso Corp. 21,500 251,177Teijin, Ltd. 30,000 609,454The Chemours Company 40,676 1,995,971The Dow Chemical Company 207,790 13,849,204The Mosaic Company 66,249 1,323,655The Scotts Miracle-Gro Company 9,721 929,230The Sherwin-Williams Company 14,975 5,080,568Toray Industries, Inc. 232,500 2,216,449Tosoh Corp. 95,000 1,116,795Trecora Resources (A) 4,950 60,143Tredegar Corp. 4,776 77,849Trinseo SA 7,870 526,503Tronox, Ltd., Class A 12,109 250,535Umicore SA 16,487 1,230,956Valvoline, Inc. 45,094 960,051Yara International ASA 8,656 354,180
215,736,132Construction materials – 0.4%Anhui Conch Cement Company, Ltd.,
H Shares 145,710 545,248Asia Cement Corp. 419,687 380,990Boral, Ltd. 153,126 814,978Cementos Argos SA 82,454 334,367Cemex SAB de CV (A) 3,166,588 2,955,960China National Building Material
Company, Ltd., H Shares 348,000 219,239CRH PLC 112,763 3,938,356
Strategic Equity Allocation Fund (continued)Shares orPrincipalAmount Value
COMMON STOCKS (continued)Construction materials (continued)Eagle Materials, Inc. 10,703 $ 1,040,867Fletcher Building, Ltd. 92,732 544,724Grupo Argos SA 50,872 361,881HeidelbergCement AG 30,967 2,973,952Imerys SA 6,268 551,086Indocement Tunggal Prakarsa Tbk PT 332,120 493,532James Hardie Industries PLC 57,425 810,021LafargeHolcim, Ltd. (A) 76,233 4,485,871Martin Marietta Materials, Inc. 11,588 2,456,540Semen Indonesia Persero Tbk PT 538,392 423,463Summit Materials, Inc., Class A (A) 19,184 566,695Taiheiyo Cement Corp. 192,000 740,430Taiwan Cement Corp. 600,000 694,168The Siam Cement PCL 14,836 223,564The Siam Cement PCL, Foreign Shares 38,027 573,133U.S. Concrete, Inc. (A)(C) 2,839 227,262United States Lime & Minerals, Inc. 444 35,498Vulcan Materials Company 24,396 2,958,259
29,350,084Containers and packaging – 0.3%Amcor, Ltd. 150,045 1,927,216AptarGroup, Inc. 13,766 1,150,975Avery Dennison Corp. 16,257 1,532,385Ball Corp. 64,913 2,595,871Bemis Company, Inc. 20,276 863,960CCL Industries, Inc., Class B 25,148 1,166,626Greif, Inc., Class A 10,212 617,315Greif, Inc., Class B 1,058 66,813International Paper Company 76,384 4,114,806Klabin SA 109,642 596,303Myers Industries, Inc. 4,285 80,558Owens-Illinois, Inc. (A) 35,877 884,009Packaging Corp. of America 17,400 1,955,934Sealed Air Corp. 35,996 1,597,502Silgan Holdings, Inc. 16,536 497,568Sonoco Products Company 21,915 1,057,618Toyo Seikan Group Holdings, Ltd. 25,700 423,533UFP Technologies, Inc. (A) 1,554 41,336WestRock Company 46,598 2,651,892
23,822,220Metals and mining – 1.4%Agnico Eagle Mines, Ltd. 39,643 2,032,071AK Steel Holding Corp. (A)(C) 57,719 323,226Allegheny Technologies, Inc. (A)(C) 43,794 912,229Alumina, Ltd. 315,040 532,060Aluminum Corp. of China, Ltd., H
Shares (A) 453,780 337,678Ampco-Pittsburgh Corp. 2,499 38,485Anglo American Platinum, Ltd. (A) 7,727 209,524Anglo American PLC 73,330 1,334,789AngloGold Ashanti, Ltd. 57,798 585,208Antofagasta PLC 21,781 292,004ArcelorMittal (A) 119,477 3,183,376Barrick Gold Corp. 204,126 3,676,311BHP Billiton PLC 116,081 2,209,913BHP Billiton, Ltd. 418,264 9,105,249BlueScope Steel, Ltd. 75,179 650,726Boliden AB 50,130 1,754,376Carpenter Technology Corp. 18,789 761,518Century Aluminum Company (A) 9,714 189,617China Steel Corp. 2,258,958 1,896,245Cia de Minas Buenaventura SAA, ADR 21,800 292,774Cia Siderurgica Nacional SA (A) 119,566 330,076Cleveland-Cliffs, Inc. (A) 53,938 450,922
John Hancock Funds IIPortfolio of Investments — August 31, 2017 (showing percentage of total net assets)
176
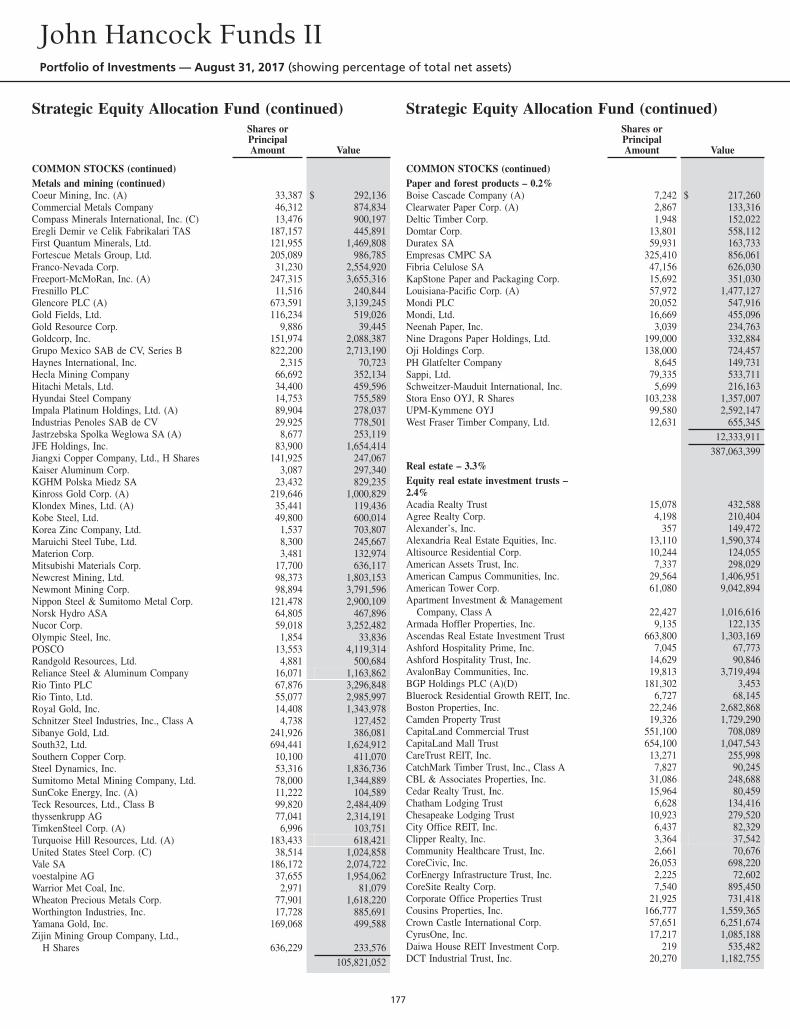
Strategic Equity Allocation Fund (continued)Shares orPrincipalAmount Value
COMMON STOCKS (continued)Metals and mining (continued)Coeur Mining, Inc. (A) 33,387 $ 292,136Commercial Metals Company 46,312 874,834Compass Minerals International, Inc. (C) 13,476 900,197Eregli Demir ve Celik Fabrikalari TAS 187,157 445,891First Quantum Minerals, Ltd. 121,955 1,469,808Fortescue Metals Group, Ltd. 205,089 986,785Franco-Nevada Corp. 31,230 2,554,920Freeport-McMoRan, Inc. (A) 247,315 3,655,316Fresnillo PLC 11,516 240,844Glencore PLC (A) 673,591 3,139,245Gold Fields, Ltd. 116,234 519,026Gold Resource Corp. 9,886 39,445Goldcorp, Inc. 151,974 2,088,387Grupo Mexico SAB de CV, Series B 822,200 2,713,190Haynes International, Inc. 2,315 70,723Hecla Mining Company 66,692 352,134Hitachi Metals, Ltd. 34,400 459,596Hyundai Steel Company 14,753 755,589Impala Platinum Holdings, Ltd. (A) 89,904 278,037Industrias Penoles SAB de CV 29,925 778,501Jastrzebska Spolka Weglowa SA (A) 8,677 253,119JFE Holdings, Inc. 83,900 1,654,414Jiangxi Copper Company, Ltd., H Shares 141,925 247,067Kaiser Aluminum Corp. 3,087 297,340KGHM Polska Miedz SA 23,432 829,235Kinross Gold Corp. (A) 219,646 1,000,829Klondex Mines, Ltd. (A) 35,441 119,436Kobe Steel, Ltd. 49,800 600,014Korea Zinc Company, Ltd. 1,537 703,807Maruichi Steel Tube, Ltd. 8,300 245,667Materion Corp. 3,481 132,974Mitsubishi Materials Corp. 17,700 636,117Newcrest Mining, Ltd. 98,373 1,803,153Newmont Mining Corp. 98,894 3,791,596Nippon Steel & Sumitomo Metal Corp. 121,478 2,900,109Norsk Hydro ASA 64,805 467,896Nucor Corp. 59,018 3,252,482Olympic Steel, Inc. 1,854 33,836POSCO 13,553 4,119,314Randgold Resources, Ltd. 4,881 500,684Reliance Steel & Aluminum Company 16,071 1,163,862Rio Tinto PLC 67,876 3,296,848Rio Tinto, Ltd. 55,077 2,985,997Royal Gold, Inc. 14,408 1,343,978Schnitzer Steel Industries, Inc., Class A 4,738 127,452Sibanye Gold, Ltd. 241,926 386,081South32, Ltd. 694,441 1,624,912Southern Copper Corp. 10,100 411,070Steel Dynamics, Inc. 53,316 1,836,736Sumitomo Metal Mining Company, Ltd. 78,000 1,344,889SunCoke Energy, Inc. (A) 11,222 104,589Teck Resources, Ltd., Class B 99,820 2,484,409thyssenkrupp AG 77,041 2,314,191TimkenSteel Corp. (A) 6,996 103,751Turquoise Hill Resources, Ltd. (A) 183,433 618,421United States Steel Corp. (C) 38,514 1,024,858Vale SA 186,172 2,074,722voestalpine AG 37,655 1,954,062Warrior Met Coal, Inc. 2,971 81,079Wheaton Precious Metals Corp. 77,901 1,618,220Worthington Industries, Inc. 17,728 885,691Yamana Gold, Inc. 169,068 499,588Zijin Mining Group Company, Ltd.,
H Shares 636,229 233,576105,821,052
Strategic Equity Allocation Fund (continued)Shares orPrincipalAmount Value
COMMON STOCKS (continued)Paper and forest products – 0.2%Boise Cascade Company (A) 7,242 $ 217,260Clearwater Paper Corp. (A) 2,867 133,316Deltic Timber Corp. 1,948 152,022Domtar Corp. 13,801 558,112Duratex SA 59,931 163,733Empresas CMPC SA 325,410 856,061Fibria Celulose SA 47,156 626,030KapStone Paper and Packaging Corp. 15,692 351,030Louisiana-Pacific Corp. (A) 57,972 1,477,127Mondi PLC 20,052 547,916Mondi, Ltd. 16,669 455,096Neenah Paper, Inc. 3,039 234,763Nine Dragons Paper Holdings, Ltd. 199,000 332,884Oji Holdings Corp. 138,000 724,457PH Glatfelter Company 8,645 149,731Sappi, Ltd. 79,335 533,711Schweitzer-Mauduit International, Inc. 5,699 216,163Stora Enso OYJ, R Shares 103,238 1,357,007UPM-Kymmene OYJ 99,580 2,592,147West Fraser Timber Company, Ltd. 12,631 655,345
12,333,911387,063,399
Real estate – 3.3%Equity real estate investment trusts –2.4%Acadia Realty Trust 15,078 432,588Agree Realty Corp. 4,198 210,404Alexander’s, Inc. 357 149,472Alexandria Real Estate Equities, Inc. 13,110 1,590,374Altisource Residential Corp. 10,244 124,055American Assets Trust, Inc. 7,337 298,029American Campus Communities, Inc. 29,564 1,406,951American Tower Corp. 61,080 9,042,894Apartment Investment & Management
Company, Class A 22,427 1,016,616Armada Hoffler Properties, Inc. 9,135 122,135Ascendas Real Estate Investment Trust 663,800 1,303,169Ashford Hospitality Prime, Inc. 7,045 67,773Ashford Hospitality Trust, Inc. 14,629 90,846AvalonBay Communities, Inc. 19,813 3,719,494BGP Holdings PLC (A)(D) 181,302 3,453Bluerock Residential Growth REIT, Inc. 6,727 68,145Boston Properties, Inc. 22,246 2,682,868Camden Property Trust 19,326 1,729,290CapitaLand Commercial Trust 551,100 708,089CapitaLand Mall Trust 654,100 1,047,543CareTrust REIT, Inc. 13,271 255,998CatchMark Timber Trust, Inc., Class A 7,827 90,245CBL & Associates Properties, Inc. 31,086 248,688Cedar Realty Trust, Inc. 15,964 80,459Chatham Lodging Trust 6,628 134,416Chesapeake Lodging Trust 10,923 279,520City Office REIT, Inc. 6,437 82,329Clipper Realty, Inc. 3,364 37,542Community Healthcare Trust, Inc. 2,661 70,676CoreCivic, Inc. 26,053 698,220CorEnergy Infrastructure Trust, Inc. 2,225 72,602CoreSite Realty Corp. 7,540 895,450Corporate Office Properties Trust 21,925 731,418Cousins Properties, Inc. 166,777 1,559,365Crown Castle International Corp. 57,651 6,251,674CyrusOne, Inc. 17,217 1,085,188Daiwa House REIT Investment Corp. 219 535,482DCT Industrial Trust, Inc. 20,270 1,182,755
John Hancock Funds IIPortfolio of Investments — August 31, 2017 (showing percentage of total net assets)
177
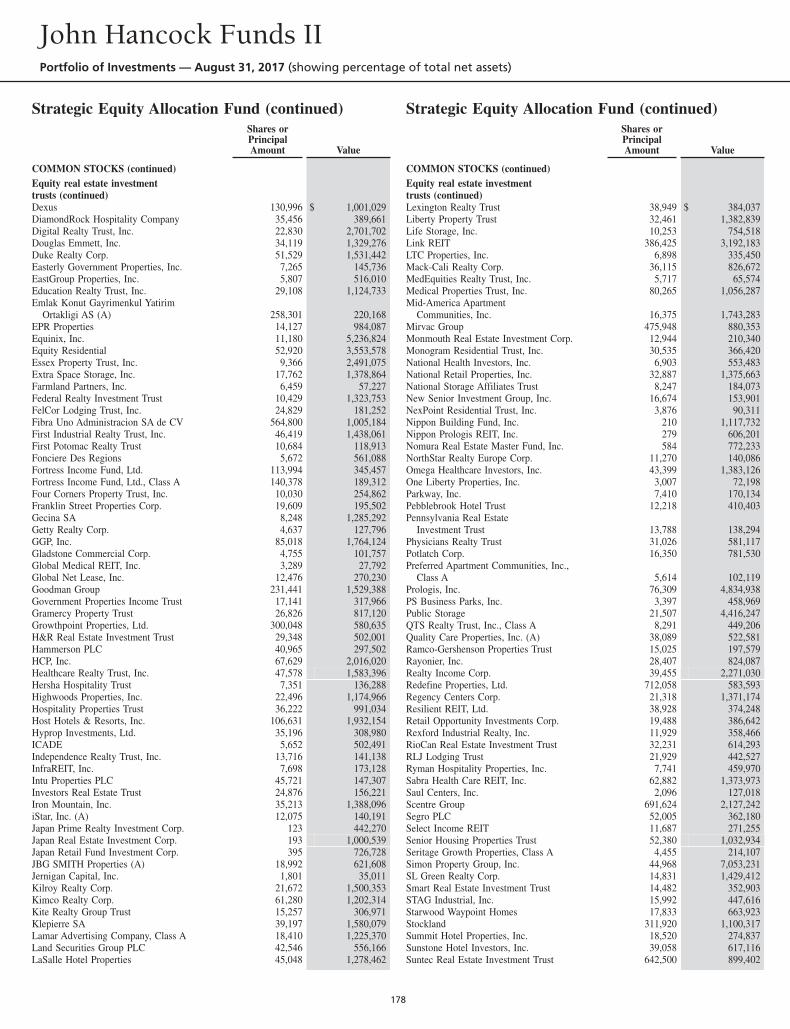
Strategic Equity Allocation Fund (continued)Shares orPrincipalAmount Value
COMMON STOCKS (continued)Equity real estate investmenttrusts (continued)Dexus 130,996 $ 1,001,029DiamondRock Hospitality Company 35,456 389,661Digital Realty Trust, Inc. 22,830 2,701,702Douglas Emmett, Inc. 34,119 1,329,276Duke Realty Corp. 51,529 1,531,442Easterly Government Properties, Inc. 7,265 145,736EastGroup Properties, Inc. 5,807 516,010Education Realty Trust, Inc. 29,108 1,124,733Emlak Konut Gayrimenkul Yatirim
Ortakligi AS (A) 258,301 220,168EPR Properties 14,127 984,087Equinix, Inc. 11,180 5,236,824Equity Residential 52,920 3,553,578Essex Property Trust, Inc. 9,366 2,491,075Extra Space Storage, Inc. 17,762 1,378,864Farmland Partners, Inc. 6,459 57,227Federal Realty Investment Trust 10,429 1,323,753FelCor Lodging Trust, Inc. 24,829 181,252Fibra Uno Administracion SA de CV 564,800 1,005,184First Industrial Realty Trust, Inc. 46,419 1,438,061First Potomac Realty Trust 10,684 118,913Fonciere Des Regions 5,672 561,088Fortress Income Fund, Ltd. 113,994 345,457Fortress Income Fund, Ltd., Class A 140,378 189,312Four Corners Property Trust, Inc. 10,030 254,862Franklin Street Properties Corp. 19,609 195,502Gecina SA 8,248 1,285,292Getty Realty Corp. 4,637 127,796GGP, Inc. 85,018 1,764,124Gladstone Commercial Corp. 4,755 101,757Global Medical REIT, Inc. 3,289 27,792Global Net Lease, Inc. 12,476 270,230Goodman Group 231,441 1,529,388Government Properties Income Trust 17,141 317,966Gramercy Property Trust 26,826 817,120Growthpoint Properties, Ltd. 300,048 580,635H&R Real Estate Investment Trust 29,348 502,001Hammerson PLC 40,965 297,502HCP, Inc. 67,629 2,016,020Healthcare Realty Trust, Inc. 47,578 1,583,396Hersha Hospitality Trust 7,351 136,288Highwoods Properties, Inc. 22,496 1,174,966Hospitality Properties Trust 36,222 991,034Host Hotels & Resorts, Inc. 106,631 1,932,154Hyprop Investments, Ltd. 35,196 308,980ICADE 5,652 502,491Independence Realty Trust, Inc. 13,716 141,138InfraREIT, Inc. 7,698 173,128Intu Properties PLC 45,721 147,307Investors Real Estate Trust 24,876 156,221Iron Mountain, Inc. 35,213 1,388,096iStar, Inc. (A) 12,075 140,191Japan Prime Realty Investment Corp. 123 442,270Japan Real Estate Investment Corp. 193 1,000,539Japan Retail Fund Investment Corp. 395 726,728JBG SMITH Properties (A) 18,992 621,608Jernigan Capital, Inc. 1,801 35,011Kilroy Realty Corp. 21,672 1,500,353Kimco Realty Corp. 61,280 1,202,314Kite Realty Group Trust 15,257 306,971Klepierre SA 39,197 1,580,079Lamar Advertising Company, Class A 18,410 1,225,370Land Securities Group PLC 42,546 556,166LaSalle Hotel Properties 45,048 1,278,462
Strategic Equity Allocation Fund (continued)Shares orPrincipalAmount Value
COMMON STOCKS (continued)Equity real estate investmenttrusts (continued)Lexington Realty Trust 38,949 $ 384,037Liberty Property Trust 32,461 1,382,839Life Storage, Inc. 10,253 754,518Link REIT 386,425 3,192,183LTC Properties, Inc. 6,898 335,450Mack-Cali Realty Corp. 36,115 826,672MedEquities Realty Trust, Inc. 5,717 65,574Medical Properties Trust, Inc. 80,265 1,056,287Mid-America Apartment
Communities, Inc. 16,375 1,743,283Mirvac Group 475,948 880,353Monmouth Real Estate Investment Corp. 12,944 210,340Monogram Residential Trust, Inc. 30,535 366,420National Health Investors, Inc. 6,903 553,483National Retail Properties, Inc. 32,887 1,375,663National Storage Affiliates Trust 8,247 184,073New Senior Investment Group, Inc. 16,674 153,901NexPoint Residential Trust, Inc. 3,876 90,311Nippon Building Fund, Inc. 210 1,117,732Nippon Prologis REIT, Inc. 279 606,201Nomura Real Estate Master Fund, Inc. 584 772,233NorthStar Realty Europe Corp. 11,270 140,086Omega Healthcare Investors, Inc. 43,399 1,383,126One Liberty Properties, Inc. 3,007 72,198Parkway, Inc. 7,410 170,134Pebblebrook Hotel Trust 12,218 410,403Pennsylvania Real Estate
Investment Trust 13,788 138,294Physicians Realty Trust 31,026 581,117Potlatch Corp. 16,350 781,530Preferred Apartment Communities, Inc.,
Class A 5,614 102,119Prologis, Inc. 76,309 4,834,938PS Business Parks, Inc. 3,397 458,969Public Storage 21,507 4,416,247QTS Realty Trust, Inc., Class A 8,291 449,206Quality Care Properties, Inc. (A) 38,089 522,581Ramco-Gershenson Properties Trust 15,025 197,579Rayonier, Inc. 28,407 824,087Realty Income Corp. 39,455 2,271,030Redefine Properties, Ltd. 712,058 583,593Regency Centers Corp. 21,318 1,371,174Resilient REIT, Ltd. 38,928 374,248Retail Opportunity Investments Corp. 19,488 386,642Rexford Industrial Realty, Inc. 11,929 358,466RioCan Real Estate Investment Trust 32,231 614,293RLJ Lodging Trust 21,929 442,527Ryman Hospitality Properties, Inc. 7,741 459,970Sabra Health Care REIT, Inc. 62,882 1,373,973Saul Centers, Inc. 2,096 127,018Scentre Group 691,624 2,127,242Segro PLC 52,005 362,180Select Income REIT 11,687 271,255Senior Housing Properties Trust 52,380 1,032,934Seritage Growth Properties, Class A 4,455 214,107Simon Property Group, Inc. 44,968 7,053,231SL Green Realty Corp. 14,831 1,429,412Smart Real Estate Investment Trust 14,482 352,903STAG Industrial, Inc. 15,992 447,616Starwood Waypoint Homes 17,833 663,923Stockland 311,920 1,100,317Summit Hotel Properties, Inc. 18,520 274,837Sunstone Hotel Investors, Inc. 39,058 617,116Suntec Real Estate Investment Trust 642,500 899,402
John Hancock Funds IIPortfolio of Investments — August 31, 2017 (showing percentage of total net assets)
178
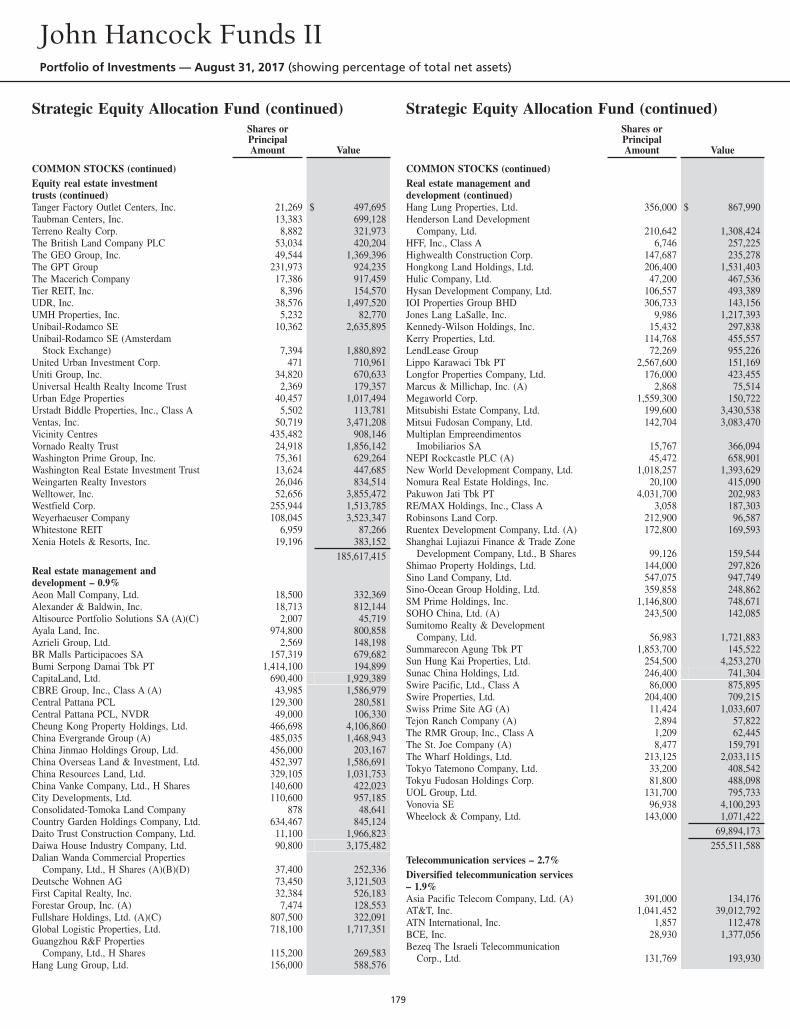
Strategic Equity Allocation Fund (continued)Shares orPrincipalAmount Value
COMMON STOCKS (continued)Equity real estate investmenttrusts (continued)Tanger Factory Outlet Centers, Inc. 21,269 $ 497,695Taubman Centers, Inc. 13,383 699,128Terreno Realty Corp. 8,882 321,973The British Land Company PLC 53,034 420,204The GEO Group, Inc. 49,544 1,369,396The GPT Group 231,973 924,235The Macerich Company 17,386 917,459Tier REIT, Inc. 8,396 154,570UDR, Inc. 38,576 1,497,520UMH Properties, Inc. 5,232 82,770Unibail-Rodamco SE 10,362 2,635,895Unibail-Rodamco SE (Amsterdam
Stock Exchange) 7,394 1,880,892United Urban Investment Corp. 471 710,961Uniti Group, Inc. 34,820 670,633Universal Health Realty Income Trust 2,369 179,357Urban Edge Properties 40,457 1,017,494Urstadt Biddle Properties, Inc., Class A 5,502 113,781Ventas, Inc. 50,719 3,471,208Vicinity Centres 435,482 908,146Vornado Realty Trust 24,918 1,856,142Washington Prime Group, Inc. 75,361 629,264Washington Real Estate Investment Trust 13,624 447,685Weingarten Realty Investors 26,046 834,514Welltower, Inc. 52,656 3,855,472Westfield Corp. 255,944 1,513,785Weyerhaeuser Company 108,045 3,523,347Whitestone REIT 6,959 87,266Xenia Hotels & Resorts, Inc. 19,196 383,152
185,617,415Real estate management anddevelopment – 0.9%Aeon Mall Company, Ltd. 18,500 332,369Alexander & Baldwin, Inc. 18,713 812,144Altisource Portfolio Solutions SA (A)(C) 2,007 45,719Ayala Land, Inc. 974,800 800,858Azrieli Group, Ltd. 2,569 148,198BR Malls Participacoes SA 157,319 679,682Bumi Serpong Damai Tbk PT 1,414,100 194,899CapitaLand, Ltd. 690,400 1,929,389CBRE Group, Inc., Class A (A) 43,985 1,586,979Central Pattana PCL 129,300 280,581Central Pattana PCL, NVDR 49,000 106,330Cheung Kong Property Holdings, Ltd. 466,698 4,106,860China Evergrande Group (A) 485,035 1,468,943China Jinmao Holdings Group, Ltd. 456,000 203,167China Overseas Land & Investment, Ltd. 452,397 1,586,691China Resources Land, Ltd. 329,105 1,031,753China Vanke Company, Ltd., H Shares 140,600 422,023City Developments, Ltd. 110,600 957,185Consolidated-Tomoka Land Company 878 48,641Country Garden Holdings Company, Ltd. 634,467 845,124Daito Trust Construction Company, Ltd. 11,100 1,966,823Daiwa House Industry Company, Ltd. 90,800 3,175,482Dalian Wanda Commercial Properties
Company, Ltd., H Shares (A)(B)(D) 37,400 252,336Deutsche Wohnen AG 73,450 3,121,503First Capital Realty, Inc. 32,384 526,183Forestar Group, Inc. (A) 7,474 128,553Fullshare Holdings, Ltd. (A)(C) 807,500 322,091Global Logistic Properties, Ltd. 718,100 1,717,351Guangzhou R&F Properties
Company, Ltd., H Shares 115,200 269,583Hang Lung Group, Ltd. 156,000 588,576
Strategic Equity Allocation Fund (continued)Shares orPrincipalAmount Value
COMMON STOCKS (continued)Real estate management anddevelopment (continued)Hang Lung Properties, Ltd. 356,000 $ 867,990Henderson Land Development
Company, Ltd. 210,642 1,308,424HFF, Inc., Class A 6,746 257,225Highwealth Construction Corp. 147,687 235,278Hongkong Land Holdings, Ltd. 206,400 1,531,403Hulic Company, Ltd. 47,200 467,536Hysan Development Company, Ltd. 106,557 493,389IOI Properties Group BHD 306,733 143,156Jones Lang LaSalle, Inc. 9,986 1,217,393Kennedy-Wilson Holdings, Inc. 15,432 297,838Kerry Properties, Ltd. 114,768 455,557LendLease Group 72,269 955,226Lippo Karawaci Tbk PT 2,567,600 151,169Longfor Properties Company, Ltd. 176,000 423,455Marcus & Millichap, Inc. (A) 2,868 75,514Megaworld Corp. 1,559,300 150,722Mitsubishi Estate Company, Ltd. 199,600 3,430,538Mitsui Fudosan Company, Ltd. 142,704 3,083,470Multiplan Empreendimentos
Imobiliarios SA 15,767 366,094NEPI Rockcastle PLC (A) 45,472 658,901New World Development Company, Ltd. 1,018,257 1,393,629Nomura Real Estate Holdings, Inc. 20,100 415,090Pakuwon Jati Tbk PT 4,031,700 202,983RE/MAX Holdings, Inc., Class A 3,058 187,303Robinsons Land Corp. 212,900 96,587Ruentex Development Company, Ltd. (A) 172,800 169,593Shanghai Lujiazui Finance & Trade Zone
Development Company, Ltd., B Shares 99,126 159,544Shimao Property Holdings, Ltd. 144,000 297,826Sino Land Company, Ltd. 547,075 947,749Sino-Ocean Group Holding, Ltd. 359,858 248,862SM Prime Holdings, Inc. 1,146,800 748,671SOHO China, Ltd. (A) 243,500 142,085Sumitomo Realty & Development
Company, Ltd. 56,983 1,721,883Summarecon Agung Tbk PT 1,853,700 145,522Sun Hung Kai Properties, Ltd. 254,500 4,253,270Sunac China Holdings, Ltd. 246,400 741,304Swire Pacific, Ltd., Class A 86,000 875,895Swire Properties, Ltd. 204,400 709,215Swiss Prime Site AG (A) 11,424 1,033,607Tejon Ranch Company (A) 2,894 57,822The RMR Group, Inc., Class A 1,209 62,445The St. Joe Company (A) 8,477 159,791The Wharf Holdings, Ltd. 213,125 2,033,115Tokyo Tatemono Company, Ltd. 33,200 408,542Tokyu Fudosan Holdings Corp. 81,800 488,098UOL Group, Ltd. 131,700 795,733Vonovia SE 96,938 4,100,293Wheelock & Company, Ltd. 143,000 1,071,422
69,894,173255,511,588
Telecommunication services – 2.7%Diversified telecommunication services– 1.9%Asia Pacific Telecom Company, Ltd. (A) 391,000 134,176AT&T, Inc. 1,041,452 39,012,792ATN International, Inc. 1,857 112,478BCE, Inc. 28,930 1,377,056Bezeq The Israeli Telecommunication
Corp., Ltd. 131,769 193,930
John Hancock Funds IIPortfolio of Investments — August 31, 2017 (showing percentage of total net assets)
179
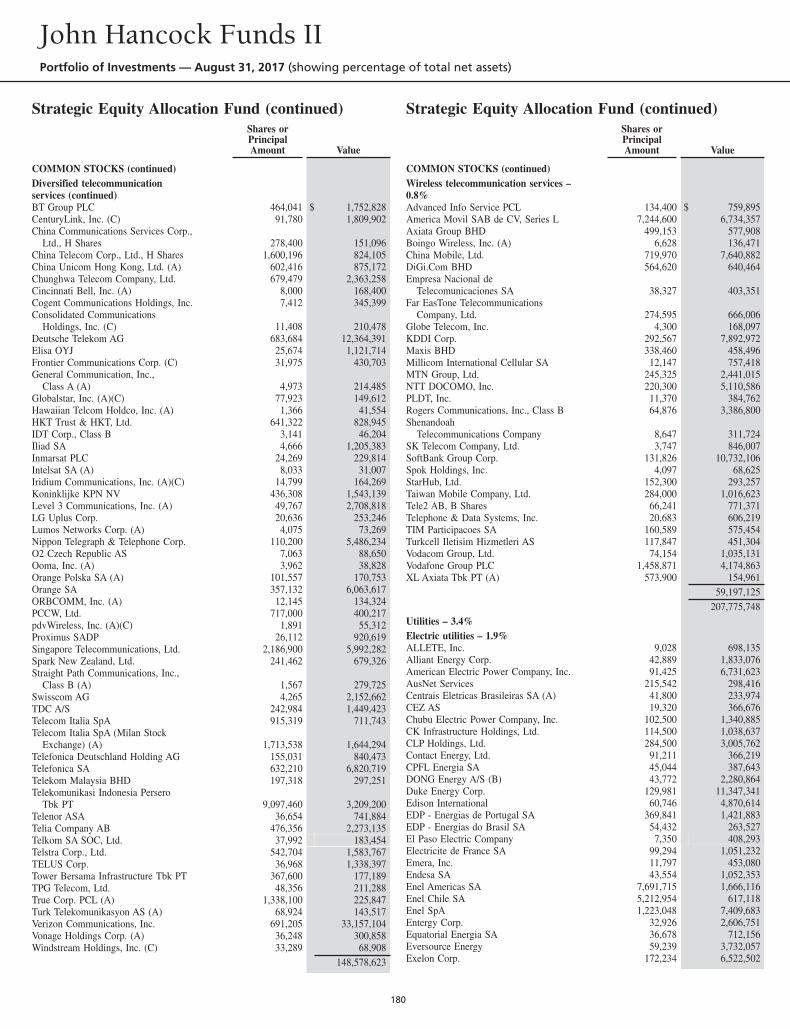
Strategic Equity Allocation Fund (continued)Shares orPrincipalAmount Value
COMMON STOCKS (continued)Diversified telecommunicationservices (continued)BT Group PLC 464,041 $ 1,752,828CenturyLink, Inc. (C) 91,780 1,809,902China Communications Services Corp.,
Ltd., H Shares 278,400 151,096China Telecom Corp., Ltd., H Shares 1,600,196 824,105China Unicom Hong Kong, Ltd. (A) 602,416 875,172Chunghwa Telecom Company, Ltd. 679,479 2,363,258Cincinnati Bell, Inc. (A) 8,000 168,400Cogent Communications Holdings, Inc. 7,412 345,399Consolidated Communications
Holdings, Inc. (C) 11,408 210,478Deutsche Telekom AG 683,684 12,364,391Elisa OYJ 25,674 1,121,714Frontier Communications Corp. (C) 31,975 430,703General Communication, Inc.,
Class A (A) 4,973 214,485Globalstar, Inc. (A)(C) 77,923 149,612Hawaiian Telcom Holdco, Inc. (A) 1,366 41,554HKT Trust & HKT, Ltd. 641,322 828,945IDT Corp., Class B 3,141 46,204Iliad SA 4,666 1,205,383Inmarsat PLC 24,269 229,814Intelsat SA (A) 8,033 31,007Iridium Communications, Inc. (A)(C) 14,799 164,269Koninklijke KPN NV 436,308 1,543,139Level 3 Communications, Inc. (A) 49,767 2,708,818LG Uplus Corp. 20,636 253,246Lumos Networks Corp. (A) 4,075 73,269Nippon Telegraph & Telephone Corp. 110,200 5,486,234O2 Czech Republic AS 7,063 88,650Ooma, Inc. (A) 3,962 38,828Orange Polska SA (A) 101,557 170,753Orange SA 357,132 6,063,617ORBCOMM, Inc. (A) 12,145 134,324PCCW, Ltd. 717,000 400,217pdvWireless, Inc. (A)(C) 1,891 55,312Proximus SADP 26,112 920,619Singapore Telecommunications, Ltd. 2,186,900 5,992,282Spark New Zealand, Ltd. 241,462 679,326Straight Path Communications, Inc.,
Class B (A) 1,567 279,725Swisscom AG 4,265 2,152,662TDC A/S 242,984 1,449,423Telecom Italia SpA 915,319 711,743Telecom Italia SpA (Milan Stock
Exchange) (A) 1,713,538 1,644,294Telefonica Deutschland Holding AG 155,031 840,473Telefonica SA 632,210 6,820,719Telekom Malaysia BHD 197,318 297,251Telekomunikasi Indonesia Persero
Tbk PT 9,097,460 3,209,200Telenor ASA 36,654 741,884Telia Company AB 476,356 2,273,135Telkom SA SOC, Ltd. 37,992 183,454Telstra Corp., Ltd. 542,704 1,583,767TELUS Corp. 36,968 1,338,397Tower Bersama Infrastructure Tbk PT 367,600 177,189TPG Telecom, Ltd. 48,356 211,288True Corp. PCL (A) 1,338,100 225,847Turk Telekomunikasyon AS (A) 68,924 143,517Verizon Communications, Inc. 691,205 33,157,104Vonage Holdings Corp. (A) 36,248 300,858Windstream Holdings, Inc. (C) 33,289 68,908
148,578,623
Strategic Equity Allocation Fund (continued)Shares orPrincipalAmount Value
COMMON STOCKS (continued)Wireless telecommunication services –0.8%Advanced Info Service PCL 134,400 $ 759,895America Movil SAB de CV, Series L 7,244,600 6,734,357Axiata Group BHD 499,153 577,908Boingo Wireless, Inc. (A) 6,628 136,471China Mobile, Ltd. 719,970 7,640,882DiGi.Com BHD 564,620 640,464Empresa Nacional de
Telecomunicaciones SA 38,327 403,351Far EasTone Telecommunications
Company, Ltd. 274,595 666,006Globe Telecom, Inc. 4,300 168,097KDDI Corp. 292,567 7,892,972Maxis BHD 338,460 458,496Millicom International Cellular SA 12,147 757,418MTN Group, Ltd. 245,325 2,441,015NTT DOCOMO, Inc. 220,300 5,110,586PLDT, Inc. 11,370 384,762Rogers Communications, Inc., Class B 64,876 3,386,800Shenandoah
Telecommunications Company 8,647 311,724SK Telecom Company, Ltd. 3,747 846,007SoftBank Group Corp. 131,826 10,732,106Spok Holdings, Inc. 4,097 68,625StarHub, Ltd. 152,300 293,257Taiwan Mobile Company, Ltd. 284,000 1,016,623Tele2 AB, B Shares 66,241 771,371Telephone & Data Systems, Inc. 20,683 606,219TIM Participacoes SA 160,589 575,454Turkcell Iletisim Hizmetleri AS 117,847 451,304Vodacom Group, Ltd. 74,154 1,035,131Vodafone Group PLC 1,458,871 4,174,863XL Axiata Tbk PT (A) 573,900 154,961
59,197,125207,775,748
Utilities – 3.4%Electric utilities – 1.9%ALLETE, Inc. 9,028 698,135Alliant Energy Corp. 42,889 1,833,076American Electric Power Company, Inc. 91,425 6,731,623AusNet Services 215,542 298,416Centrais Eletricas Brasileiras SA (A) 41,800 233,974CEZ AS 19,320 366,676Chubu Electric Power Company, Inc. 102,500 1,340,885CK Infrastructure Holdings, Ltd. 114,500 1,038,637CLP Holdings, Ltd. 284,500 3,005,762Contact Energy, Ltd. 91,211 366,219CPFL Energia SA 45,044 387,643DONG Energy A/S (B) 43,772 2,280,864Duke Energy Corp. 129,981 11,347,341Edison International 60,746 4,870,614EDP - Energias de Portugal SA 369,841 1,421,883EDP - Energias do Brasil SA 54,432 263,527El Paso Electric Company 7,350 408,293Electricite de France SA 99,294 1,051,232Emera, Inc. 11,797 453,080Endesa SA 43,554 1,052,353Enel Americas SA 7,691,715 1,666,116Enel Chile SA 5,212,954 617,118Enel SpA 1,223,048 7,409,683Entergy Corp. 32,926 2,606,751Equatorial Energia SA 36,678 712,156Eversource Energy 59,239 3,732,057Exelon Corp. 172,234 6,522,502
John Hancock Funds IIPortfolio of Investments — August 31, 2017 (showing percentage of total net assets)
180
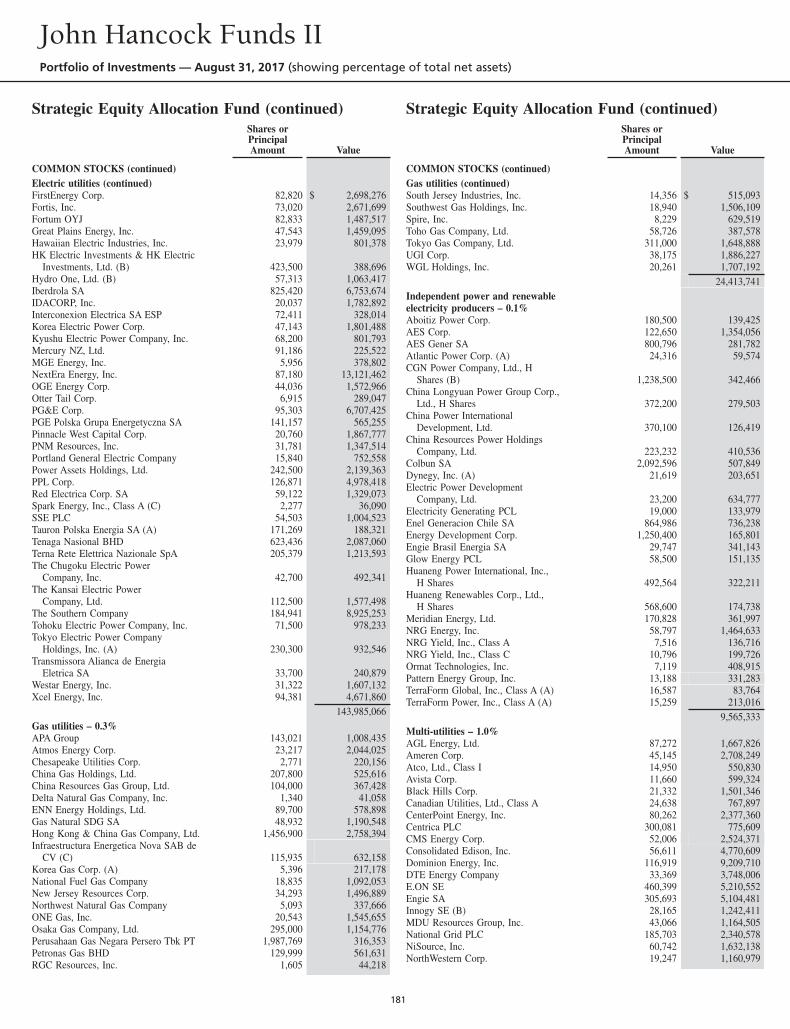
Strategic Equity Allocation Fund (continued)Shares orPrincipalAmount Value
COMMON STOCKS (continued)Electric utilities (continued)FirstEnergy Corp. 82,820 $ 2,698,276Fortis, Inc. 73,020 2,671,699Fortum OYJ 82,833 1,487,517Great Plains Energy, Inc. 47,543 1,459,095Hawaiian Electric Industries, Inc. 23,979 801,378HK Electric Investments & HK Electric
Investments, Ltd. (B) 423,500 388,696Hydro One, Ltd. (B) 57,313 1,063,417Iberdrola SA 825,420 6,753,674IDACORP, Inc. 20,037 1,782,892Interconexion Electrica SA ESP 72,411 328,014Korea Electric Power Corp. 47,143 1,801,488Kyushu Electric Power Company, Inc. 68,200 801,793Mercury NZ, Ltd. 91,186 225,522MGE Energy, Inc. 5,956 378,802NextEra Energy, Inc. 87,180 13,121,462OGE Energy Corp. 44,036 1,572,966Otter Tail Corp. 6,915 289,047PG&E Corp. 95,303 6,707,425PGE Polska Grupa Energetyczna SA 141,157 565,255Pinnacle West Capital Corp. 20,760 1,867,777PNM Resources, Inc. 31,781 1,347,514Portland General Electric Company 15,840 752,558Power Assets Holdings, Ltd. 242,500 2,139,363PPL Corp. 126,871 4,978,418Red Electrica Corp. SA 59,122 1,329,073Spark Energy, Inc., Class A (C) 2,277 36,090SSE PLC 54,503 1,004,523Tauron Polska Energia SA (A) 171,269 188,321Tenaga Nasional BHD 623,436 2,087,060Terna Rete Elettrica Nazionale SpA 205,379 1,213,593The Chugoku Electric Power
Company, Inc. 42,700 492,341The Kansai Electric Power
Company, Ltd. 112,500 1,577,498The Southern Company 184,941 8,925,253Tohoku Electric Power Company, Inc. 71,500 978,233Tokyo Electric Power Company
Holdings, Inc. (A) 230,300 932,546Transmissora Alianca de Energia
Eletrica SA 33,700 240,879Westar Energy, Inc. 31,322 1,607,132Xcel Energy, Inc. 94,381 4,671,860
143,985,066Gas utilities – 0.3%APA Group 143,021 1,008,435Atmos Energy Corp. 23,217 2,044,025Chesapeake Utilities Corp. 2,771 220,156China Gas Holdings, Ltd. 207,800 525,616China Resources Gas Group, Ltd. 104,000 367,428Delta Natural Gas Company, Inc. 1,340 41,058ENN Energy Holdings, Ltd. 89,700 578,898Gas Natural SDG SA 48,932 1,190,548Hong Kong & China Gas Company, Ltd. 1,456,900 2,758,394Infraestructura Energetica Nova SAB de
CV (C) 115,935 632,158Korea Gas Corp. (A) 5,396 217,178National Fuel Gas Company 18,835 1,092,053New Jersey Resources Corp. 34,293 1,496,889Northwest Natural Gas Company 5,093 337,666ONE Gas, Inc. 20,543 1,545,655Osaka Gas Company, Ltd. 295,000 1,154,776Perusahaan Gas Negara Persero Tbk PT 1,987,769 316,353Petronas Gas BHD 129,999 561,631RGC Resources, Inc. 1,605 44,218
Strategic Equity Allocation Fund (continued)Shares orPrincipalAmount Value
COMMON STOCKS (continued)Gas utilities (continued)South Jersey Industries, Inc. 14,356 $ 515,093Southwest Gas Holdings, Inc. 18,940 1,506,109Spire, Inc. 8,229 629,519Toho Gas Company, Ltd. 58,726 387,578Tokyo Gas Company, Ltd. 311,000 1,648,888UGI Corp. 38,175 1,886,227WGL Holdings, Inc. 20,261 1,707,192
24,413,741Independent power and renewableelectricity producers – 0.1%Aboitiz Power Corp. 180,500 139,425AES Corp. 122,650 1,354,056AES Gener SA 800,796 281,782Atlantic Power Corp. (A) 24,316 59,574CGN Power Company, Ltd., H
Shares (B) 1,238,500 342,466China Longyuan Power Group Corp.,
Ltd., H Shares 372,200 279,503China Power International
Development, Ltd. 370,100 126,419China Resources Power Holdings
Company, Ltd. 223,232 410,536Colbun SA 2,092,596 507,849Dynegy, Inc. (A) 21,619 203,651Electric Power Development
Company, Ltd. 23,200 634,777Electricity Generating PCL 19,000 133,979Enel Generacion Chile SA 864,986 736,238Energy Development Corp. 1,250,400 165,801Engie Brasil Energia SA 29,747 341,143Glow Energy PCL 58,500 151,135Huaneng Power International, Inc.,
H Shares 492,564 322,211Huaneng Renewables Corp., Ltd.,
H Shares 568,600 174,738Meridian Energy, Ltd. 170,828 361,997NRG Energy, Inc. 58,797 1,464,633NRG Yield, Inc., Class A 7,516 136,716NRG Yield, Inc., Class C 10,796 199,726Ormat Technologies, Inc. 7,119 408,915Pattern Energy Group, Inc. 13,188 331,283TerraForm Global, Inc., Class A (A) 16,587 83,764TerraForm Power, Inc., Class A (A) 15,259 213,016
9,565,333Multi-utilities – 1.0%AGL Energy, Ltd. 87,272 1,667,826Ameren Corp. 45,145 2,708,249Atco, Ltd., Class I 14,950 550,830Avista Corp. 11,660 599,324Black Hills Corp. 21,332 1,501,346Canadian Utilities, Ltd., Class A 24,638 767,897CenterPoint Energy, Inc. 80,262 2,377,360Centrica PLC 300,081 775,609CMS Energy Corp. 52,006 2,524,371Consolidated Edison, Inc. 56,611 4,770,609Dominion Energy, Inc. 116,919 9,209,710DTE Energy Company 33,369 3,748,006E.ON SE 460,399 5,210,552Engie SA 305,693 5,104,481Innogy SE (B) 28,165 1,242,411MDU Resources Group, Inc. 43,066 1,164,505National Grid PLC 185,703 2,340,578NiSource, Inc. 60,742 1,632,138NorthWestern Corp. 19,247 1,160,979
John Hancock Funds IIPortfolio of Investments — August 31, 2017 (showing percentage of total net assets)
181
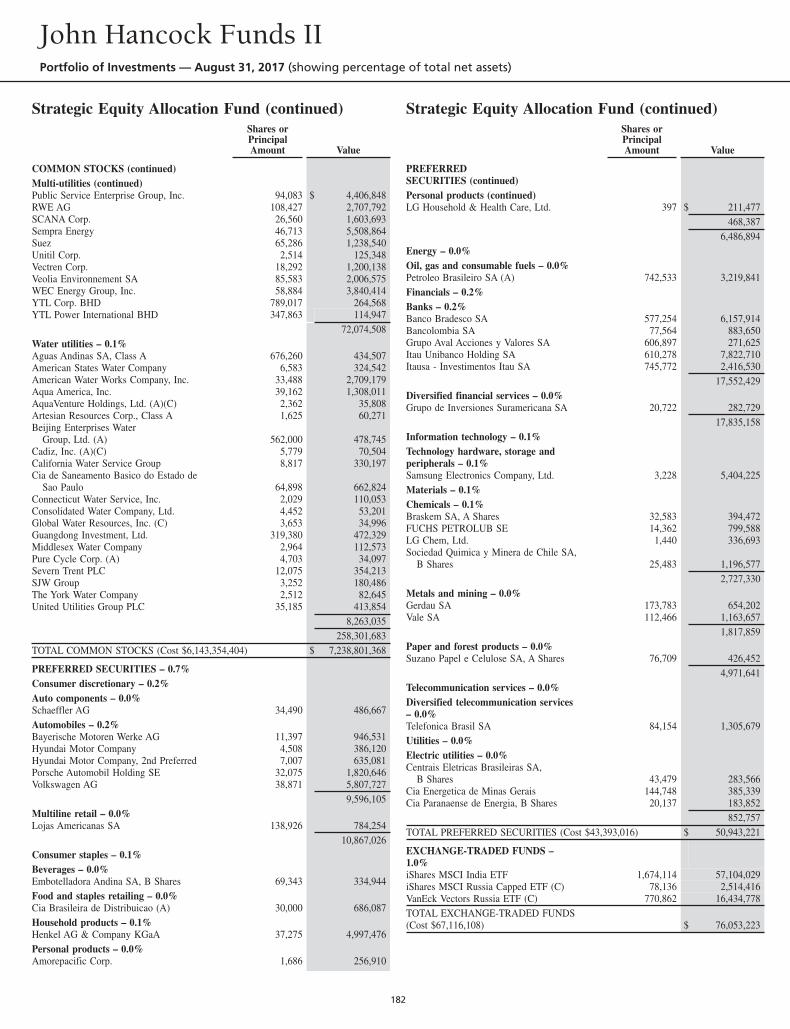
Strategic Equity Allocation Fund (continued)Shares orPrincipalAmount Value
COMMON STOCKS (continued)Multi-utilities (continued)Public Service Enterprise Group, Inc. 94,083 $ 4,406,848RWE AG 108,427 2,707,792SCANA Corp. 26,560 1,603,693Sempra Energy 46,713 5,508,864Suez 65,286 1,238,540Unitil Corp. 2,514 125,348Vectren Corp. 18,292 1,200,138Veolia Environnement SA 85,583 2,006,575WEC Energy Group, Inc. 58,884 3,840,414YTL Corp. BHD 789,017 264,568YTL Power International BHD 347,863 114,947
72,074,508Water utilities – 0.1%Aguas Andinas SA, Class A 676,260 434,507American States Water Company 6,583 324,542American Water Works Company, Inc. 33,488 2,709,179Aqua America, Inc. 39,162 1,308,011AquaVenture Holdings, Ltd. (A)(C) 2,362 35,808Artesian Resources Corp., Class A 1,625 60,271Beijing Enterprises Water
Group, Ltd. (A) 562,000 478,745Cadiz, Inc. (A)(C) 5,779 70,504California Water Service Group 8,817 330,197Cia de Saneamento Basico do Estado de
Sao Paulo 64,898 662,824Connecticut Water Service, Inc. 2,029 110,053Consolidated Water Company, Ltd. 4,452 53,201Global Water Resources, Inc. (C) 3,653 34,996Guangdong Investment, Ltd. 319,380 472,329Middlesex Water Company 2,964 112,573Pure Cycle Corp. (A) 4,703 34,097Severn Trent PLC 12,075 354,213SJW Group 3,252 180,486The York Water Company 2,512 82,645United Utilities Group PLC 35,185 413,854
8,263,035258,301,683
TOTAL COMMON STOCKS (Cost $6,143,354,404) $ 7,238,801,368
PREFERRED SECURITIES – 0.7%Consumer discretionary – 0.2%Auto components – 0.0%Schaeffler AG 34,490 486,667Automobiles – 0.2%Bayerische Motoren Werke AG 11,397 946,531Hyundai Motor Company 4,508 386,120Hyundai Motor Company, 2nd Preferred 7,007 635,081Porsche Automobil Holding SE 32,075 1,820,646Volkswagen AG 38,871 5,807,727
9,596,105Multiline retail – 0.0%Lojas Americanas SA 138,926 784,254
10,867,026Consumer staples – 0.1%Beverages – 0.0%Embotelladora Andina SA, B Shares 69,343 334,944Food and staples retailing – 0.0%Cia Brasileira de Distribuicao (A) 30,000 686,087Household products – 0.1%Henkel AG & Company KGaA 37,275 4,997,476Personal products – 0.0%Amorepacific Corp. 1,686 256,910
Strategic Equity Allocation Fund (continued)Shares orPrincipalAmount Value
PREFERREDSECURITIES (continued)Personal products (continued)LG Household & Health Care, Ltd. 397 $ 211,477
468,3876,486,894
Energy – 0.0%Oil, gas and consumable fuels – 0.0%Petroleo Brasileiro SA (A) 742,533 3,219,841Financials – 0.2%Banks – 0.2%Banco Bradesco SA 577,254 6,157,914Bancolombia SA 77,564 883,650Grupo Aval Acciones y Valores SA 606,897 271,625Itau Unibanco Holding SA 610,278 7,822,710Itausa - Investimentos Itau SA 745,772 2,416,530
17,552,429Diversified financial services – 0.0%Grupo de Inversiones Suramericana SA 20,722 282,729
17,835,158Information technology – 0.1%Technology hardware, storage andperipherals – 0.1%Samsung Electronics Company, Ltd. 3,228 5,404,225Materials – 0.1%Chemicals – 0.1%Braskem SA, A Shares 32,583 394,472FUCHS PETROLUB SE 14,362 799,588LG Chem, Ltd. 1,440 336,693Sociedad Quimica y Minera de Chile SA,
B Shares 25,483 1,196,5772,727,330
Metals and mining – 0.0%Gerdau SA 173,783 654,202Vale SA 112,466 1,163,657
1,817,859Paper and forest products – 0.0%Suzano Papel e Celulose SA, A Shares 76,709 426,452
4,971,641Telecommunication services – 0.0%Diversified telecommunication services– 0.0%Telefonica Brasil SA 84,154 1,305,679Utilities – 0.0%Electric utilities – 0.0%Centrais Eletricas Brasileiras SA,
B Shares 43,479 283,566Cia Energetica de Minas Gerais 144,748 385,339Cia Paranaense de Energia, B Shares 20,137 183,852
852,757TOTAL PREFERRED SECURITIES (Cost $43,393,016) $ 50,943,221
EXCHANGE-TRADED FUNDS –1.0%iShares MSCI India ETF 1,674,114 57,104,029iShares MSCI Russia Capped ETF (C) 78,136 2,514,416VanEck Vectors Russia ETF (C) 770,862 16,434,778TOTAL EXCHANGE-TRADED FUNDS(Cost $67,116,108) $ 76,053,223
John Hancock Funds IIPortfolio of Investments — August 31, 2017 (showing percentage of total net assets)
182
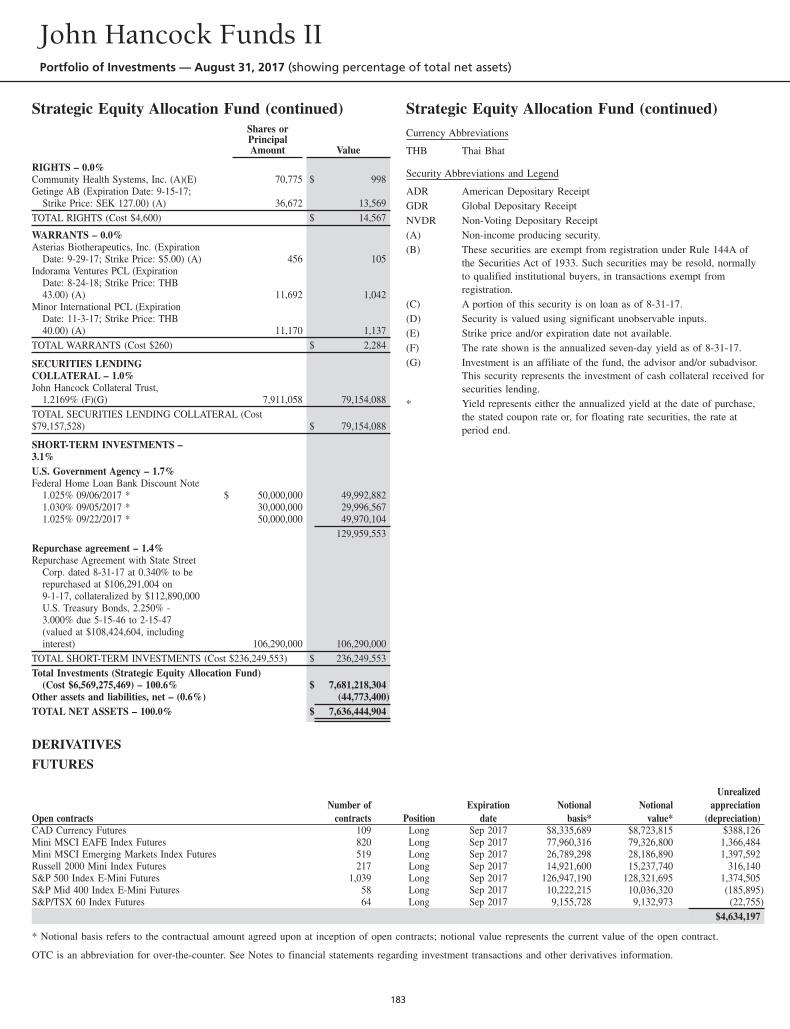
Strategic Equity Allocation Fund (continued)Shares orPrincipalAmount Value
RIGHTS – 0.0%Community Health Systems, Inc. (A)(E) 70,775 $ 998Getinge AB (Expiration Date: 9-15-17;
Strike Price: SEK 127.00) (A) 36,672 13,569TOTAL RIGHTS (Cost $4,600) $ 14,567
WARRANTS – 0.0%Asterias Biotherapeutics, Inc. (Expiration
Date: 9-29-17; Strike Price: $5.00) (A) 456 105Indorama Ventures PCL (Expiration
Date: 8-24-18; Strike Price: THB43.00) (A) 11,692 1,042
Minor International PCL (ExpirationDate: 11-3-17; Strike Price: THB40.00) (A) 11,170 1,137
TOTAL WARRANTS (Cost $260) $ 2,284
SECURITIES LENDINGCOLLATERAL – 1.0%John Hancock Collateral Trust,
1.2169% (F)(G) 7,911,058 79,154,088TOTAL SECURITIES LENDING COLLATERAL (Cost$79,157,528) $ 79,154,088
SHORT-TERM INVESTMENTS –3.1%U.S. Government Agency – 1.7%Federal Home Loan Bank Discount Note
1.025% 09/06/2017 * $ 50,000,000 49,992,8821.030% 09/05/2017 * 30,000,000 29,996,5671.025% 09/22/2017 * 50,000,000 49,970,104
129,959,553Repurchase agreement – 1.4%Repurchase Agreement with State Street
Corp. dated 8-31-17 at 0.340% to berepurchased at $106,291,004 on9-1-17, collateralized by $112,890,000U.S. Treasury Bonds, 2.250% -3.000% due 5-15-46 to 2-15-47(valued at $108,424,604, includinginterest) 106,290,000 106,290,000
TOTAL SHORT-TERM INVESTMENTS (Cost $236,249,553) $ 236,249,553Total Investments (Strategic Equity Allocation Fund)
(Cost $6,569,275,469) – 100.6% $ 7,681,218,304Other assets and liabilities, net – (0.6%) (44,773,400)TOTAL NET ASSETS – 100.0% $ 7,636,444,904
Strategic Equity Allocation Fund (continued)Currency Abbreviations
THB Thai Bhat
Security Abbreviations and Legend
ADR American Depositary ReceiptGDR Global Depositary ReceiptNVDR Non-Voting Depositary Receipt(A) Non-income producing security.(B) These securities are exempt from registration under Rule 144A of
the Securities Act of 1933. Such securities may be resold, normallyto qualified institutional buyers, in transactions exempt fromregistration.
(C) A portion of this security is on loan as of 8-31-17.(D) Security is valued using significant unobservable inputs.(E) Strike price and/or expiration date not available.(F) The rate shown is the annualized seven-day yield as of 8-31-17.(G) Investment is an affiliate of the fund, the advisor and/or subadvisor.
This security represents the investment of cash collateral received forsecurities lending.
* Yield represents either the annualized yield at the date of purchase,the stated coupon rate or, for floating rate securities, the rate atperiod end.
DERIVATIVES
FUTURES
Open contractsNumber of
contracts PositionExpiration
dateNotional
basis*Notional
value*
Unrealizedappreciation
(depreciation)CAD Currency Futures 109 Long Sep 2017 $8,335,689 $8,723,815 $388,126Mini MSCI EAFE Index Futures 820 Long Sep 2017 77,960,316 79,326,800 1,366,484Mini MSCI Emerging Markets Index Futures 519 Long Sep 2017 26,789,298 28,186,890 1,397,592Russell 2000 Mini Index Futures 217 Long Sep 2017 14,921,600 15,237,740 316,140S&P 500 Index E-Mini Futures 1,039 Long Sep 2017 126,947,190 128,321,695 1,374,505S&P Mid 400 Index E-Mini Futures 58 Long Sep 2017 10,222,215 10,036,320 (185,895)S&P/TSX 60 Index Futures 64 Long Sep 2017 9,155,728 9,132,973 (22,755)
$4,634,197
* Notional basis refers to the contractual amount agreed upon at inception of open contracts; notional value represents the current value of the open contract.
OTC is an abbreviation for over-the-counter. See Notes to financial statements regarding investment transactions and other derivatives information.
John Hancock Funds IIPortfolio of Investments — August 31, 2017 (showing percentage of total net assets)
183
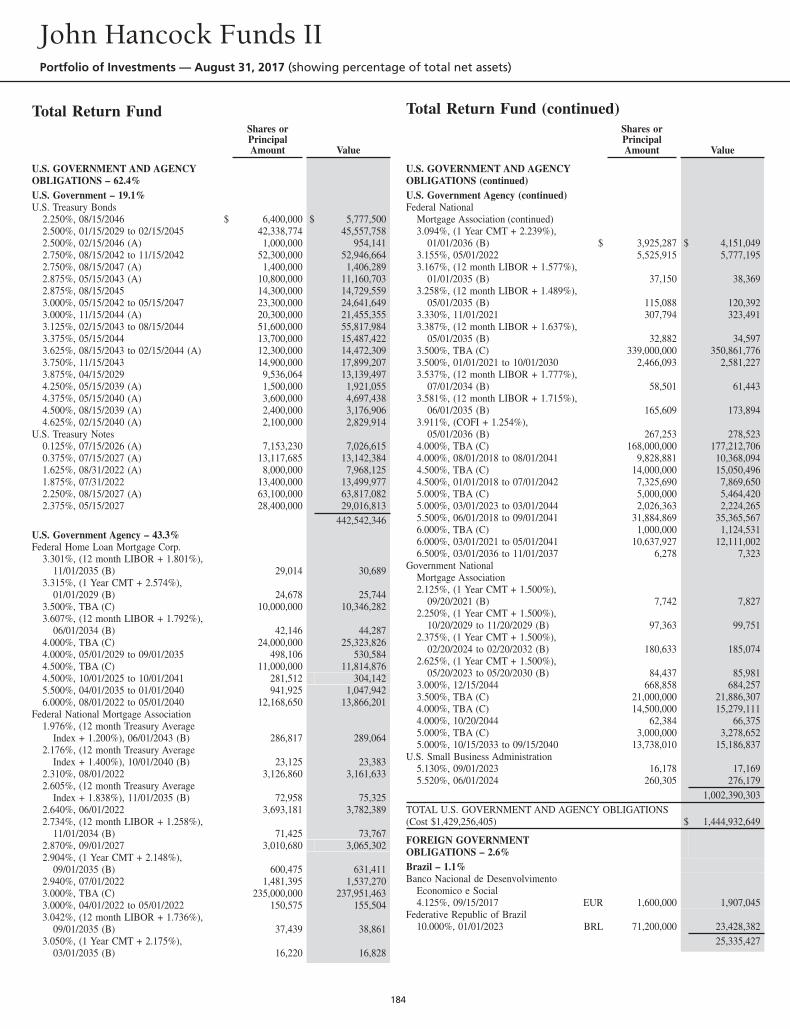
Total Return FundShares orPrincipalAmount Value
U.S. GOVERNMENT AND AGENCYOBLIGATIONS – 62.4%U.S. Government – 19.1%U.S. Treasury Bonds
2.250%, 08/15/2046 $ 6,400,000 $ 5,777,5002.500%, 01/15/2029 to 02/15/2045 42,338,774 45,557,7582.500%, 02/15/2046 (A) 1,000,000 954,1412.750%, 08/15/2042 to 11/15/2042 52,300,000 52,946,6642.750%, 08/15/2047 (A) 1,400,000 1,406,2892.875%, 05/15/2043 (A) 10,800,000 11,160,7032.875%, 08/15/2045 14,300,000 14,729,5593.000%, 05/15/2042 to 05/15/2047 23,300,000 24,641,6493.000%, 11/15/2044 (A) 20,300,000 21,455,3553.125%, 02/15/2043 to 08/15/2044 51,600,000 55,817,9843.375%, 05/15/2044 13,700,000 15,487,4223.625%, 08/15/2043 to 02/15/2044 (A) 12,300,000 14,472,3093.750%, 11/15/2043 14,900,000 17,899,2073.875%, 04/15/2029 9,536,064 13,139,4974.250%, 05/15/2039 (A) 1,500,000 1,921,0554.375%, 05/15/2040 (A) 3,600,000 4,697,4384.500%, 08/15/2039 (A) 2,400,000 3,176,9064.625%, 02/15/2040 (A) 2,100,000 2,829,914
U.S. Treasury Notes0.125%, 07/15/2026 (A) 7,153,230 7,026,6150.375%, 07/15/2027 (A) 13,117,685 13,142,3841.625%, 08/31/2022 (A) 8,000,000 7,968,1251.875%, 07/31/2022 13,400,000 13,499,9772.250%, 08/15/2027 (A) 63,100,000 63,817,0822.375%, 05/15/2027 28,400,000 29,016,813
442,542,346U.S. Government Agency – 43.3%Federal Home Loan Mortgage Corp.
3.301%, (12 month LIBOR + 1.801%),11/01/2035 (B) 29,014 30,689
3.315%, (1 Year CMT + 2.574%),01/01/2029 (B) 24,678 25,744
3.500%, TBA (C) 10,000,000 10,346,2823.607%, (12 month LIBOR + 1.792%),
06/01/2034 (B) 42,146 44,2874.000%, TBA (C) 24,000,000 25,323,8264.000%, 05/01/2029 to 09/01/2035 498,106 530,5844.500%, TBA (C) 11,000,000 11,814,8764.500%, 10/01/2025 to 10/01/2041 281,512 304,1425.500%, 04/01/2035 to 01/01/2040 941,925 1,047,9426.000%, 08/01/2022 to 05/01/2040 12,168,650 13,866,201
Federal National Mortgage Association1.976%, (12 month Treasury Average
Index + 1.200%), 06/01/2043 (B) 286,817 289,0642.176%, (12 month Treasury Average
Index + 1.400%), 10/01/2040 (B) 23,125 23,3832.310%, 08/01/2022 3,126,860 3,161,6332.605%, (12 month Treasury Average
Index + 1.838%), 11/01/2035 (B) 72,958 75,3252.640%, 06/01/2022 3,693,181 3,782,3892.734%, (12 month LIBOR + 1.258%),
11/01/2034 (B) 71,425 73,7672.870%, 09/01/2027 3,010,680 3,065,3022.904%, (1 Year CMT + 2.148%),
09/01/2035 (B) 600,475 631,4112.940%, 07/01/2022 1,481,395 1,537,2703.000%, TBA (C) 235,000,000 237,951,4633.000%, 04/01/2022 to 05/01/2022 150,575 155,5043.042%, (12 month LIBOR + 1.736%),
09/01/2035 (B) 37,439 38,8613.050%, (1 Year CMT + 2.175%),
03/01/2035 (B) 16,220 16,828
Total Return Fund (continued)Shares orPrincipalAmount Value
U.S. GOVERNMENT AND AGENCYOBLIGATIONS (continued)U.S. Government Agency (continued)Federal National
Mortgage Association (continued)3.094%, (1 Year CMT + 2.239%),
01/01/2036 (B) $ 3,925,287 $ 4,151,0493.155%, 05/01/2022 5,525,915 5,777,1953.167%, (12 month LIBOR + 1.577%),
01/01/2035 (B) 37,150 38,3693.258%, (12 month LIBOR + 1.489%),
05/01/2035 (B) 115,088 120,3923.330%, 11/01/2021 307,794 323,4913.387%, (12 month LIBOR + 1.637%),
05/01/2035 (B) 32,882 34,5973.500%, TBA (C) 339,000,000 350,861,7763.500%, 01/01/2021 to 10/01/2030 2,466,093 2,581,2273.537%, (12 month LIBOR + 1.777%),
07/01/2034 (B) 58,501 61,4433.581%, (12 month LIBOR + 1.715%),
06/01/2035 (B) 165,609 173,8943.911%, (COFI + 1.254%),
05/01/2036 (B) 267,253 278,5234.000%, TBA (C) 168,000,000 177,212,7064.000%, 08/01/2018 to 08/01/2041 9,828,881 10,368,0944.500%, TBA (C) 14,000,000 15,050,4964.500%, 01/01/2018 to 07/01/2042 7,325,690 7,869,6505.000%, TBA (C) 5,000,000 5,464,4205.000%, 03/01/2023 to 03/01/2044 2,026,363 2,224,2655.500%, 06/01/2018 to 09/01/2041 31,884,869 35,365,5676.000%, TBA (C) 1,000,000 1,124,5316.000%, 03/01/2021 to 05/01/2041 10,637,927 12,111,0026.500%, 03/01/2036 to 11/01/2037 6,278 7,323
Government NationalMortgage Association2.125%, (1 Year CMT + 1.500%),
09/20/2021 (B) 7,742 7,8272.250%, (1 Year CMT + 1.500%),
10/20/2029 to 11/20/2029 (B) 97,363 99,7512.375%, (1 Year CMT + 1.500%),
02/20/2024 to 02/20/2032 (B) 180,633 185,0742.625%, (1 Year CMT + 1.500%),
05/20/2023 to 05/20/2030 (B) 84,437 85,9813.000%, 12/15/2044 668,858 684,2573.500%, TBA (C) 21,000,000 21,886,3074.000%, TBA (C) 14,500,000 15,279,1114.000%, 10/20/2044 62,384 66,3755.000%, TBA (C) 3,000,000 3,278,6525.000%, 10/15/2033 to 09/15/2040 13,738,010 15,186,837
U.S. Small Business Administration5.130%, 09/01/2023 16,178 17,1695.520%, 06/01/2024 260,305 276,179
1,002,390,303TOTAL U.S. GOVERNMENT AND AGENCY OBLIGATIONS(Cost $1,429,256,405) $ 1,444,932,649
FOREIGN GOVERNMENTOBLIGATIONS – 2.6%Brazil – 1.1%Banco Nacional de Desenvolvimento
Economico e Social4.125%, 09/15/2017 EUR 1,600,000 1,907,045
Federative Republic of Brazil10.000%, 01/01/2023 BRL 71,200,000 23,428,382
25,335,427
John Hancock Funds IIPortfolio of Investments — August 31, 2017 (showing percentage of total net assets)
184
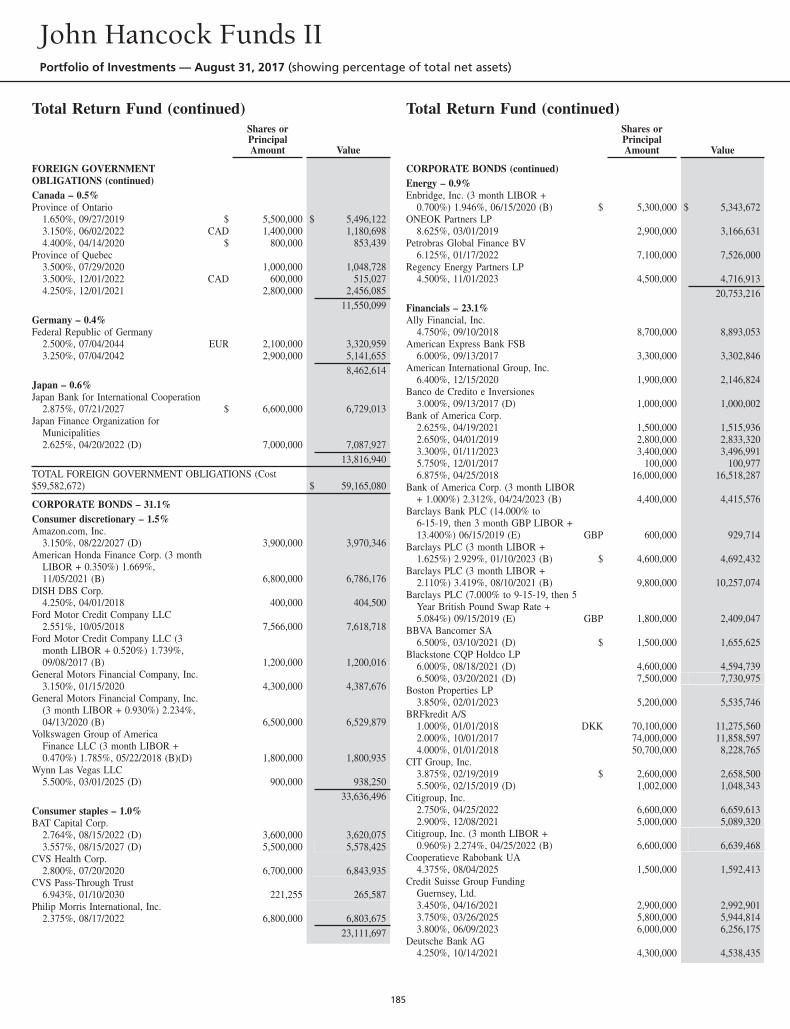
Total Return Fund (continued)Shares orPrincipalAmount Value
FOREIGN GOVERNMENTOBLIGATIONS (continued)Canada – 0.5%Province of Ontario
1.650%, 09/27/2019 $ 5,500,000 $ 5,496,1223.150%, 06/02/2022 CAD 1,400,000 1,180,6984.400%, 04/14/2020 $ 800,000 853,439
Province of Quebec3.500%, 07/29/2020 1,000,000 1,048,7283.500%, 12/01/2022 CAD 600,000 515,0274.250%, 12/01/2021 2,800,000 2,456,085
11,550,099Germany – 0.4%Federal Republic of Germany
2.500%, 07/04/2044 EUR 2,100,000 3,320,9593.250%, 07/04/2042 2,900,000 5,141,655
8,462,614Japan – 0.6%Japan Bank for International Cooperation
2.875%, 07/21/2027 $ 6,600,000 6,729,013Japan Finance Organization for
Municipalities2.625%, 04/20/2022 (D) 7,000,000 7,087,927
13,816,940TOTAL FOREIGN GOVERNMENT OBLIGATIONS (Cost$59,582,672) $ 59,165,080
CORPORATE BONDS – 31.1%Consumer discretionary – 1.5%Amazon.com, Inc.
3.150%, 08/22/2027 (D) 3,900,000 3,970,346American Honda Finance Corp. (3 month
LIBOR + 0.350%) 1.669%,11/05/2021 (B) 6,800,000 6,786,176
DISH DBS Corp.4.250%, 04/01/2018 400,000 404,500
Ford Motor Credit Company LLC2.551%, 10/05/2018 7,566,000 7,618,718
Ford Motor Credit Company LLC (3month LIBOR + 0.520%) 1.739%,09/08/2017 (B) 1,200,000 1,200,016
General Motors Financial Company, Inc.3.150%, 01/15/2020 4,300,000 4,387,676
General Motors Financial Company, Inc.(3 month LIBOR + 0.930%) 2.234%,04/13/2020 (B) 6,500,000 6,529,879
Volkswagen Group of AmericaFinance LLC (3 month LIBOR +0.470%) 1.785%, 05/22/2018 (B)(D) 1,800,000 1,800,935
Wynn Las Vegas LLC5.500%, 03/01/2025 (D) 900,000 938,250
33,636,496Consumer staples – 1.0%BAT Capital Corp.
2.764%, 08/15/2022 (D) 3,600,000 3,620,0753.557%, 08/15/2027 (D) 5,500,000 5,578,425
CVS Health Corp.2.800%, 07/20/2020 6,700,000 6,843,935
CVS Pass-Through Trust6.943%, 01/10/2030 221,255 265,587
Philip Morris International, Inc.2.375%, 08/17/2022 6,800,000 6,803,675
23,111,697
Total Return Fund (continued)Shares orPrincipalAmount Value
CORPORATE BONDS (continued)Energy – 0.9%Enbridge, Inc. (3 month LIBOR +
0.700%) 1.946%, 06/15/2020 (B) $ 5,300,000 $ 5,343,672ONEOK Partners LP
8.625%, 03/01/2019 2,900,000 3,166,631Petrobras Global Finance BV
6.125%, 01/17/2022 7,100,000 7,526,000Regency Energy Partners LP
4.500%, 11/01/2023 4,500,000 4,716,91320,753,216
Financials – 23.1%Ally Financial, Inc.
4.750%, 09/10/2018 8,700,000 8,893,053American Express Bank FSB
6.000%, 09/13/2017 3,300,000 3,302,846American International Group, Inc.
6.400%, 12/15/2020 1,900,000 2,146,824Banco de Credito e Inversiones
3.000%, 09/13/2017 (D) 1,000,000 1,000,002Bank of America Corp.
2.625%, 04/19/2021 1,500,000 1,515,9362.650%, 04/01/2019 2,800,000 2,833,3203.300%, 01/11/2023 3,400,000 3,496,9915.750%, 12/01/2017 100,000 100,9776.875%, 04/25/2018 16,000,000 16,518,287
Bank of America Corp. (3 month LIBOR+ 1.000%) 2.312%, 04/24/2023 (B) 4,400,000 4,415,576
Barclays Bank PLC (14.000% to6-15-19, then 3 month GBP LIBOR +13.400%) 06/15/2019 (E) GBP 600,000 929,714
Barclays PLC (3 month LIBOR +1.625%) 2.929%, 01/10/2023 (B) $ 4,600,000 4,692,432
Barclays PLC (3 month LIBOR +2.110%) 3.419%, 08/10/2021 (B) 9,800,000 10,257,074
Barclays PLC (7.000% to 9-15-19, then 5Year British Pound Swap Rate +5.084%) 09/15/2019 (E) GBP 1,800,000 2,409,047
BBVA Bancomer SA6.500%, 03/10/2021 (D) $ 1,500,000 1,655,625
Blackstone CQP Holdco LP6.000%, 08/18/2021 (D) 4,600,000 4,594,7396.500%, 03/20/2021 (D) 7,500,000 7,730,975
Boston Properties LP3.850%, 02/01/2023 5,200,000 5,535,746
BRFkredit A/S1.000%, 01/01/2018 DKK 70,100,000 11,275,5602.000%, 10/01/2017 74,000,000 11,858,5974.000%, 01/01/2018 50,700,000 8,228,765
CIT Group, Inc.3.875%, 02/19/2019 $ 2,600,000 2,658,5005.500%, 02/15/2019 (D) 1,002,000 1,048,343
Citigroup, Inc.2.750%, 04/25/2022 6,600,000 6,659,6132.900%, 12/08/2021 5,000,000 5,089,320
Citigroup, Inc. (3 month LIBOR +0.960%) 2.274%, 04/25/2022 (B) 6,600,000 6,639,468
Cooperatieve Rabobank UA4.375%, 08/04/2025 1,500,000 1,592,413
Credit Suisse Group FundingGuernsey, Ltd.3.450%, 04/16/2021 2,900,000 2,992,9013.750%, 03/26/2025 5,800,000 5,944,8143.800%, 06/09/2023 6,000,000 6,256,175
Deutsche Bank AG4.250%, 10/14/2021 4,300,000 4,538,435
John Hancock Funds IIPortfolio of Investments — August 31, 2017 (showing percentage of total net assets)
185
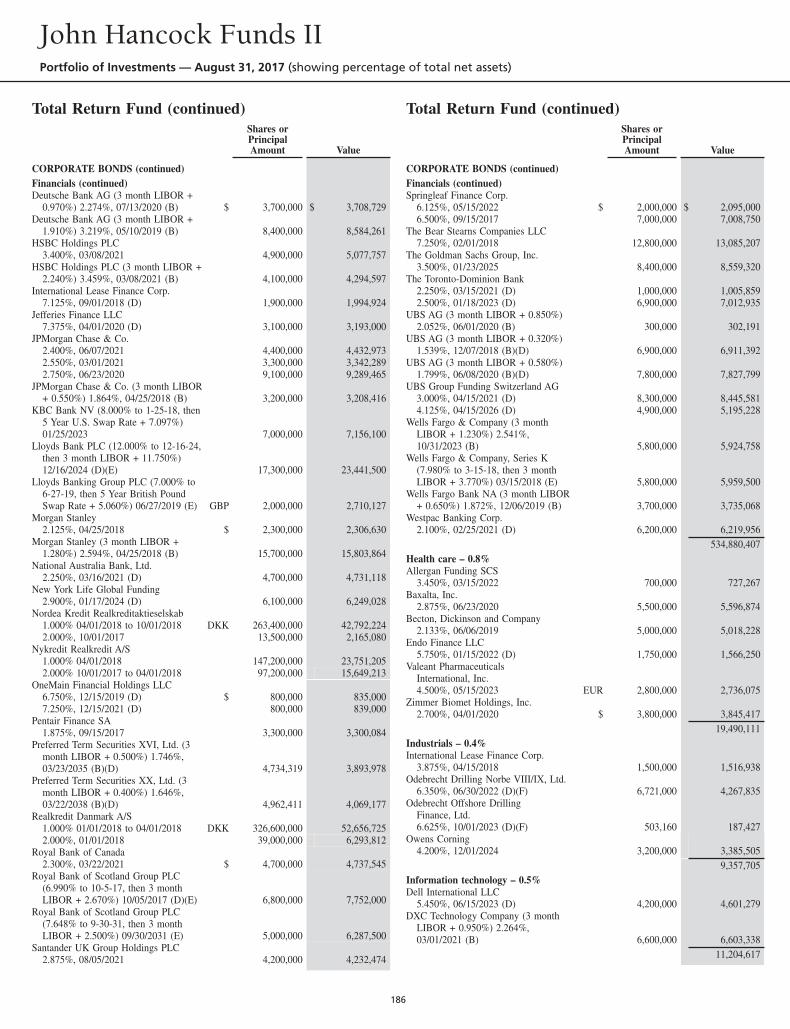
Total Return Fund (continued)Shares orPrincipalAmount Value
CORPORATE BONDS (continued)Financials (continued)Deutsche Bank AG (3 month LIBOR +
0.970%) 2.274%, 07/13/2020 (B) $ 3,700,000 $ 3,708,729Deutsche Bank AG (3 month LIBOR +
1.910%) 3.219%, 05/10/2019 (B) 8,400,000 8,584,261HSBC Holdings PLC
3.400%, 03/08/2021 4,900,000 5,077,757HSBC Holdings PLC (3 month LIBOR +
2.240%) 3.459%, 03/08/2021 (B) 4,100,000 4,294,597International Lease Finance Corp.
7.125%, 09/01/2018 (D) 1,900,000 1,994,924Jefferies Finance LLC
7.375%, 04/01/2020 (D) 3,100,000 3,193,000JPMorgan Chase & Co.
2.400%, 06/07/2021 4,400,000 4,432,9732.550%, 03/01/2021 3,300,000 3,342,2892.750%, 06/23/2020 9,100,000 9,289,465
JPMorgan Chase & Co. (3 month LIBOR+ 0.550%) 1.864%, 04/25/2018 (B) 3,200,000 3,208,416
KBC Bank NV (8.000% to 1-25-18, then5 Year U.S. Swap Rate + 7.097%)01/25/2023 7,000,000 7,156,100
Lloyds Bank PLC (12.000% to 12-16-24,then 3 month LIBOR + 11.750%)12/16/2024 (D)(E) 17,300,000 23,441,500
Lloyds Banking Group PLC (7.000% to6-27-19, then 5 Year British PoundSwap Rate + 5.060%) 06/27/2019 (E) GBP 2,000,000 2,710,127
Morgan Stanley2.125%, 04/25/2018 $ 2,300,000 2,306,630
Morgan Stanley (3 month LIBOR +1.280%) 2.594%, 04/25/2018 (B) 15,700,000 15,803,864
National Australia Bank, Ltd.2.250%, 03/16/2021 (D) 4,700,000 4,731,118
New York Life Global Funding2.900%, 01/17/2024 (D) 6,100,000 6,249,028
Nordea Kredit Realkreditaktieselskab1.000% 04/01/2018 to 10/01/2018 DKK 263,400,000 42,792,2242.000%, 10/01/2017 13,500,000 2,165,080
Nykredit Realkredit A/S1.000% 04/01/2018 147,200,000 23,751,2052.000% 10/01/2017 to 04/01/2018 97,200,000 15,649,213
OneMain Financial Holdings LLC6.750%, 12/15/2019 (D) $ 800,000 835,0007.250%, 12/15/2021 (D) 800,000 839,000
Pentair Finance SA1.875%, 09/15/2017 3,300,000 3,300,084
Preferred Term Securities XVI, Ltd. (3month LIBOR + 0.500%) 1.746%,03/23/2035 (B)(D) 4,734,319 3,893,978
Preferred Term Securities XX, Ltd. (3month LIBOR + 0.400%) 1.646%,03/22/2038 (B)(D) 4,962,411 4,069,177
Realkredit Danmark A/S1.000% 01/01/2018 to 04/01/2018 DKK 326,600,000 52,656,7252.000%, 01/01/2018 39,000,000 6,293,812
Royal Bank of Canada2.300%, 03/22/2021 $ 4,700,000 4,737,545
Royal Bank of Scotland Group PLC(6.990% to 10-5-17, then 3 monthLIBOR + 2.670%) 10/05/2017 (D)(E) 6,800,000 7,752,000
Royal Bank of Scotland Group PLC(7.648% to 9-30-31, then 3 monthLIBOR + 2.500%) 09/30/2031 (E) 5,000,000 6,287,500
Santander UK Group Holdings PLC2.875%, 08/05/2021 4,200,000 4,232,474
Total Return Fund (continued)Shares orPrincipalAmount Value
CORPORATE BONDS (continued)Financials (continued)Springleaf Finance Corp.
6.125%, 05/15/2022 $ 2,000,000 $ 2,095,0006.500%, 09/15/2017 7,000,000 7,008,750
The Bear Stearns Companies LLC7.250%, 02/01/2018 12,800,000 13,085,207
The Goldman Sachs Group, Inc.3.500%, 01/23/2025 8,400,000 8,559,320
The Toronto-Dominion Bank2.250%, 03/15/2021 (D) 1,000,000 1,005,8592.500%, 01/18/2023 (D) 6,900,000 7,012,935
UBS AG (3 month LIBOR + 0.850%)2.052%, 06/01/2020 (B) 300,000 302,191
UBS AG (3 month LIBOR + 0.320%)1.539%, 12/07/2018 (B)(D) 6,900,000 6,911,392
UBS AG (3 month LIBOR + 0.580%)1.799%, 06/08/2020 (B)(D) 7,800,000 7,827,799
UBS Group Funding Switzerland AG3.000%, 04/15/2021 (D) 8,300,000 8,445,5814.125%, 04/15/2026 (D) 4,900,000 5,195,228
Wells Fargo & Company (3 monthLIBOR + 1.230%) 2.541%,10/31/2023 (B) 5,800,000 5,924,758
Wells Fargo & Company, Series K(7.980% to 3-15-18, then 3 monthLIBOR + 3.770%) 03/15/2018 (E) 5,800,000 5,959,500
Wells Fargo Bank NA (3 month LIBOR+ 0.650%) 1.872%, 12/06/2019 (B) 3,700,000 3,735,068
Westpac Banking Corp.2.100%, 02/25/2021 (D) 6,200,000 6,219,956
534,880,407Health care – 0.8%Allergan Funding SCS
3.450%, 03/15/2022 700,000 727,267Baxalta, Inc.
2.875%, 06/23/2020 5,500,000 5,596,874Becton, Dickinson and Company
2.133%, 06/06/2019 5,000,000 5,018,228Endo Finance LLC
5.750%, 01/15/2022 (D) 1,750,000 1,566,250Valeant Pharmaceuticals
International, Inc.4.500%, 05/15/2023 EUR 2,800,000 2,736,075
Zimmer Biomet Holdings, Inc.2.700%, 04/01/2020 $ 3,800,000 3,845,417
19,490,111Industrials – 0.4%International Lease Finance Corp.
3.875%, 04/15/2018 1,500,000 1,516,938Odebrecht Drilling Norbe VIII/IX, Ltd.
6.350%, 06/30/2022 (D)(F) 6,721,000 4,267,835Odebrecht Offshore Drilling
Finance, Ltd.6.625%, 10/01/2023 (D)(F) 503,160 187,427
Owens Corning4.200%, 12/01/2024 3,200,000 3,385,505
9,357,705Information technology – 0.5%Dell International LLC
5.450%, 06/15/2023 (D) 4,200,000 4,601,279DXC Technology Company (3 month
LIBOR + 0.950%) 2.264%,03/01/2021 (B) 6,600,000 6,603,338
11,204,617
John Hancock Funds IIPortfolio of Investments — August 31, 2017 (showing percentage of total net assets)
186
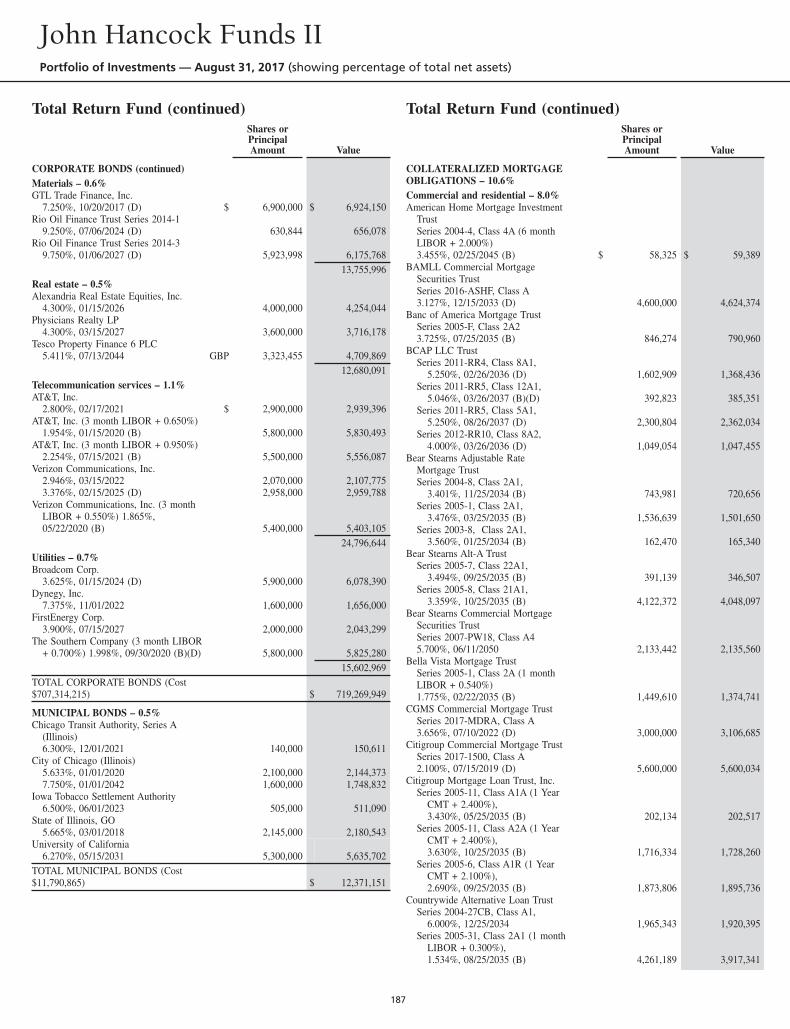
Total Return Fund (continued)Shares orPrincipalAmount Value
CORPORATE BONDS (continued)Materials – 0.6%GTL Trade Finance, Inc.
7.250%, 10/20/2017 (D) $ 6,900,000 $ 6,924,150Rio Oil Finance Trust Series 2014-1
9.250%, 07/06/2024 (D) 630,844 656,078Rio Oil Finance Trust Series 2014-3
9.750%, 01/06/2027 (D) 5,923,998 6,175,76813,755,996
Real estate – 0.5%Alexandria Real Estate Equities, Inc.
4.300%, 01/15/2026 4,000,000 4,254,044Physicians Realty LP
4.300%, 03/15/2027 3,600,000 3,716,178Tesco Property Finance 6 PLC
5.411%, 07/13/2044 GBP 3,323,455 4,709,86912,680,091
Telecommunication services – 1.1%AT&T, Inc.
2.800%, 02/17/2021 $ 2,900,000 2,939,396AT&T, Inc. (3 month LIBOR + 0.650%)
1.954%, 01/15/2020 (B) 5,800,000 5,830,493AT&T, Inc. (3 month LIBOR + 0.950%)
2.254%, 07/15/2021 (B) 5,500,000 5,556,087Verizon Communications, Inc.
2.946%, 03/15/2022 2,070,000 2,107,7753.376%, 02/15/2025 (D) 2,958,000 2,959,788
Verizon Communications, Inc. (3 monthLIBOR + 0.550%) 1.865%,05/22/2020 (B) 5,400,000 5,403,105
24,796,644Utilities – 0.7%Broadcom Corp.
3.625%, 01/15/2024 (D) 5,900,000 6,078,390Dynegy, Inc.
7.375%, 11/01/2022 1,600,000 1,656,000FirstEnergy Corp.
3.900%, 07/15/2027 2,000,000 2,043,299The Southern Company (3 month LIBOR
+ 0.700%) 1.998%, 09/30/2020 (B)(D) 5,800,000 5,825,28015,602,969
TOTAL CORPORATE BONDS (Cost$707,314,215) $ 719,269,949
MUNICIPAL BONDS – 0.5%Chicago Transit Authority, Series A
(Illinois)6.300%, 12/01/2021 140,000 150,611
City of Chicago (Illinois)5.633%, 01/01/2020 2,100,000 2,144,3737.750%, 01/01/2042 1,600,000 1,748,832
Iowa Tobacco Settlement Authority6.500%, 06/01/2023 505,000 511,090
State of Illinois, GO5.665%, 03/01/2018 2,145,000 2,180,543
University of California6.270%, 05/15/2031 5,300,000 5,635,702
TOTAL MUNICIPAL BONDS (Cost$11,790,865) $ 12,371,151
Total Return Fund (continued)Shares orPrincipalAmount Value
COLLATERALIZED MORTGAGEOBLIGATIONS – 10.6%Commercial and residential – 8.0%American Home Mortgage Investment
TrustSeries 2004-4, Class 4A (6 monthLIBOR + 2.000%)3.455%, 02/25/2045 (B) $ 58,325 $ 59,389
BAMLL Commercial MortgageSecurities TrustSeries 2016-ASHF, Class A3.127%, 12/15/2033 (D) 4,600,000 4,624,374
Banc of America Mortgage TrustSeries 2005-F, Class 2A23.725%, 07/25/2035 (B) 846,274 790,960
BCAP LLC TrustSeries 2011-RR4, Class 8A1,
5.250%, 02/26/2036 (D) 1,602,909 1,368,436Series 2011-RR5, Class 12A1,
5.046%, 03/26/2037 (B)(D) 392,823 385,351Series 2011-RR5, Class 5A1,
5.250%, 08/26/2037 (D) 2,300,804 2,362,034Series 2012-RR10, Class 8A2,
4.000%, 03/26/2036 (D) 1,049,054 1,047,455Bear Stearns Adjustable Rate
Mortgage TrustSeries 2004-8, Class 2A1,
3.401%, 11/25/2034 (B) 743,981 720,656Series 2005-1, Class 2A1,
3.476%, 03/25/2035 (B) 1,536,639 1,501,650Series 2003-8, Class 2A1,
3.560%, 01/25/2034 (B) 162,470 165,340Bear Stearns Alt-A Trust
Series 2005-7, Class 22A1,3.494%, 09/25/2035 (B) 391,139 346,507
Series 2005-8, Class 21A1,3.359%, 10/25/2035 (B) 4,122,372 4,048,097
Bear Stearns Commercial MortgageSecurities TrustSeries 2007-PW18, Class A45.700%, 06/11/2050 2,133,442 2,135,560
Bella Vista Mortgage TrustSeries 2005-1, Class 2A (1 monthLIBOR + 0.540%)1.775%, 02/22/2035 (B) 1,449,610 1,374,741
CGMS Commercial Mortgage TrustSeries 2017-MDRA, Class A3.656%, 07/10/2022 (D) 3,000,000 3,106,685
Citigroup Commercial Mortgage TrustSeries 2017-1500, Class A2.100%, 07/15/2019 (D) 5,600,000 5,600,034
Citigroup Mortgage Loan Trust, Inc.Series 2005-11, Class A1A (1 Year
CMT + 2.400%),3.430%, 05/25/2035 (B) 202,134 202,517
Series 2005-11, Class A2A (1 YearCMT + 2.400%),3.630%, 10/25/2035 (B) 1,716,334 1,728,260
Series 2005-6, Class A1R (1 YearCMT + 2.100%),2.690%, 09/25/2035 (B) 1,873,806 1,895,736
Countrywide Alternative Loan TrustSeries 2004-27CB, Class A1,
6.000%, 12/25/2034 1,965,343 1,920,395Series 2005-31, Class 2A1 (1 month
LIBOR + 0.300%),1.534%, 08/25/2035 (B) 4,261,189 3,917,341
John Hancock Funds IIPortfolio of Investments — August 31, 2017 (showing percentage of total net assets)
187
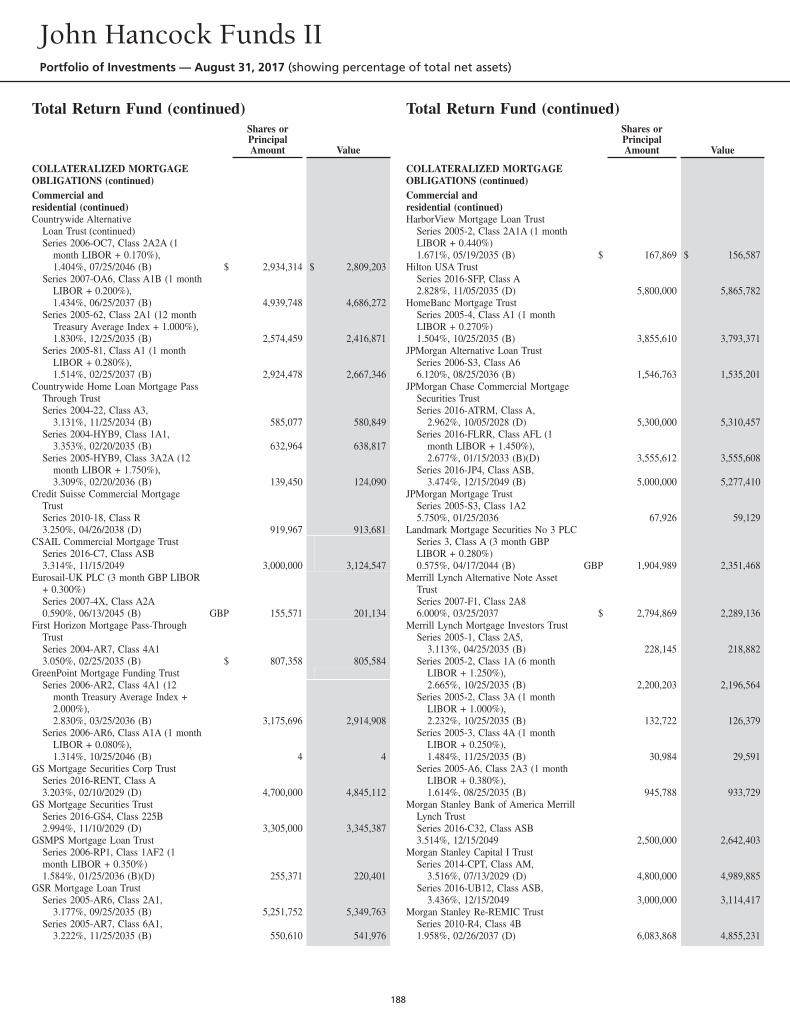
Total Return Fund (continued)Shares orPrincipalAmount Value
COLLATERALIZED MORTGAGEOBLIGATIONS (continued)Commercial andresidential (continued)Countrywide Alternative
Loan Trust (continued)Series 2006-OC7, Class 2A2A (1
month LIBOR + 0.170%),1.404%, 07/25/2046 (B) $ 2,934,314 $ 2,809,203
Series 2007-OA6, Class A1B (1 monthLIBOR + 0.200%),1.434%, 06/25/2037 (B) 4,939,748 4,686,272
Series 2005-62, Class 2A1 (12 monthTreasury Average Index + 1.000%),1.830%, 12/25/2035 (B) 2,574,459 2,416,871
Series 2005-81, Class A1 (1 monthLIBOR + 0.280%),1.514%, 02/25/2037 (B) 2,924,478 2,667,346
Countrywide Home Loan Mortgage PassThrough TrustSeries 2004-22, Class A3,
3.131%, 11/25/2034 (B) 585,077 580,849Series 2004-HYB9, Class 1A1,
3.353%, 02/20/2035 (B) 632,964 638,817Series 2005-HYB9, Class 3A2A (12
month LIBOR + 1.750%),3.309%, 02/20/2036 (B) 139,450 124,090
Credit Suisse Commercial MortgageTrustSeries 2010-18, Class R3.250%, 04/26/2038 (D) 919,967 913,681
CSAIL Commercial Mortgage TrustSeries 2016-C7, Class ASB3.314%, 11/15/2049 3,000,000 3,124,547
Eurosail-UK PLC (3 month GBP LIBOR+ 0.300%)Series 2007-4X, Class A2A0.590%, 06/13/2045 (B) GBP 155,571 201,134
First Horizon Mortgage Pass-ThroughTrustSeries 2004-AR7, Class 4A13.050%, 02/25/2035 (B) $ 807,358 805,584
GreenPoint Mortgage Funding TrustSeries 2006-AR2, Class 4A1 (12
month Treasury Average Index +2.000%),2.830%, 03/25/2036 (B) 3,175,696 2,914,908
Series 2006-AR6, Class A1A (1 monthLIBOR + 0.080%),1.314%, 10/25/2046 (B) 4 4
GS Mortgage Securities Corp TrustSeries 2016-RENT, Class A3.203%, 02/10/2029 (D) 4,700,000 4,845,112
GS Mortgage Securities TrustSeries 2016-GS4, Class 225B2.994%, 11/10/2029 (D) 3,305,000 3,345,387
GSMPS Mortgage Loan TrustSeries 2006-RP1, Class 1AF2 (1month LIBOR + 0.350%)1.584%, 01/25/2036 (B)(D) 255,371 220,401
GSR Mortgage Loan TrustSeries 2005-AR6, Class 2A1,
3.177%, 09/25/2035 (B) 5,251,752 5,349,763Series 2005-AR7, Class 6A1,
3.222%, 11/25/2035 (B) 550,610 541,976
Total Return Fund (continued)Shares orPrincipalAmount Value
COLLATERALIZED MORTGAGEOBLIGATIONS (continued)Commercial andresidential (continued)HarborView Mortgage Loan Trust
Series 2005-2, Class 2A1A (1 monthLIBOR + 0.440%)1.671%, 05/19/2035 (B) $ 167,869 $ 156,587
Hilton USA TrustSeries 2016-SFP, Class A2.828%, 11/05/2035 (D) 5,800,000 5,865,782
HomeBanc Mortgage TrustSeries 2005-4, Class A1 (1 monthLIBOR + 0.270%)1.504%, 10/25/2035 (B) 3,855,610 3,793,371
JPMorgan Alternative Loan TrustSeries 2006-S3, Class A66.120%, 08/25/2036 (B) 1,546,763 1,535,201
JPMorgan Chase Commercial MortgageSecurities TrustSeries 2016-ATRM, Class A,
2.962%, 10/05/2028 (D) 5,300,000 5,310,457Series 2016-FLRR, Class AFL (1
month LIBOR + 1.450%),2.677%, 01/15/2033 (B)(D) 3,555,612 3,555,608
Series 2016-JP4, Class ASB,3.474%, 12/15/2049 (B) 5,000,000 5,277,410
JPMorgan Mortgage TrustSeries 2005-S3, Class 1A25.750%, 01/25/2036 67,926 59,129
Landmark Mortgage Securities No 3 PLCSeries 3, Class A (3 month GBPLIBOR + 0.280%)0.575%, 04/17/2044 (B) GBP 1,904,989 2,351,468
Merrill Lynch Alternative Note AssetTrustSeries 2007-F1, Class 2A86.000%, 03/25/2037 $ 2,794,869 2,289,136
Merrill Lynch Mortgage Investors TrustSeries 2005-1, Class 2A5,
3.113%, 04/25/2035 (B) 228,145 218,882Series 2005-2, Class 1A (6 month
LIBOR + 1.250%),2.665%, 10/25/2035 (B) 2,200,203 2,196,564
Series 2005-2, Class 3A (1 monthLIBOR + 1.000%),2.232%, 10/25/2035 (B) 132,722 126,379
Series 2005-3, Class 4A (1 monthLIBOR + 0.250%),1.484%, 11/25/2035 (B) 30,984 29,591
Series 2005-A6, Class 2A3 (1 monthLIBOR + 0.380%),1.614%, 08/25/2035 (B) 945,788 933,729
Morgan Stanley Bank of America MerrillLynch TrustSeries 2016-C32, Class ASB3.514%, 12/15/2049 2,500,000 2,642,403
Morgan Stanley Capital I TrustSeries 2014-CPT, Class AM,
3.516%, 07/13/2029 (D) 4,800,000 4,989,885Series 2016-UB12, Class ASB,
3.436%, 12/15/2049 3,000,000 3,114,417Morgan Stanley Re-REMIC Trust
Series 2010-R4, Class 4B1.958%, 02/26/2037 (D) 6,083,868 4,855,231
John Hancock Funds IIPortfolio of Investments — August 31, 2017 (showing percentage of total net assets)
188
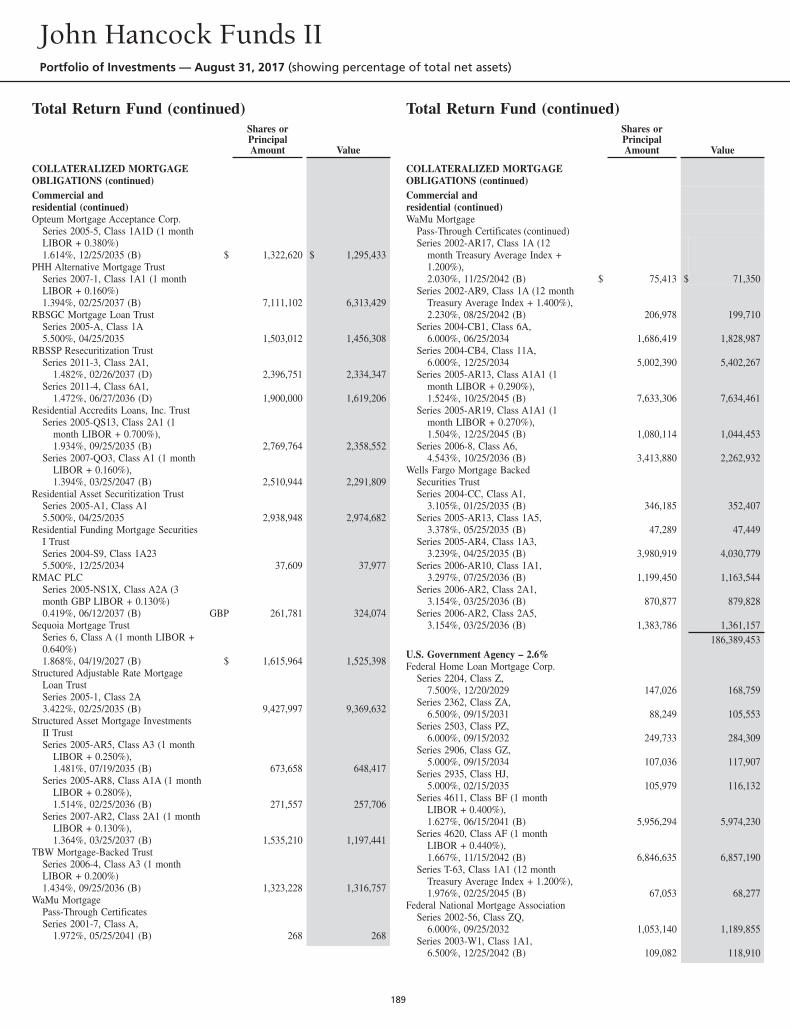
Total Return Fund (continued)Shares orPrincipalAmount Value
COLLATERALIZED MORTGAGEOBLIGATIONS (continued)Commercial andresidential (continued)Opteum Mortgage Acceptance Corp.
Series 2005-5, Class 1A1D (1 monthLIBOR + 0.380%)1.614%, 12/25/2035 (B) $ 1,322,620 $ 1,295,433
PHH Alternative Mortgage TrustSeries 2007-1, Class 1A1 (1 monthLIBOR + 0.160%)1.394%, 02/25/2037 (B) 7,111,102 6,313,429
RBSGC Mortgage Loan TrustSeries 2005-A, Class 1A5.500%, 04/25/2035 1,503,012 1,456,308
RBSSP Resecuritization TrustSeries 2011-3, Class 2A1,
1.482%, 02/26/2037 (D) 2,396,751 2,334,347Series 2011-4, Class 6A1,
1.472%, 06/27/2036 (D) 1,900,000 1,619,206Residential Accredits Loans, Inc. Trust
Series 2005-QS13, Class 2A1 (1month LIBOR + 0.700%),1.934%, 09/25/2035 (B) 2,769,764 2,358,552
Series 2007-QO3, Class A1 (1 monthLIBOR + 0.160%),1.394%, 03/25/2047 (B) 2,510,944 2,291,809
Residential Asset Securitization TrustSeries 2005-A1, Class A15.500%, 04/25/2035 2,938,948 2,974,682
Residential Funding Mortgage SecuritiesI TrustSeries 2004-S9, Class 1A235.500%, 12/25/2034 37,609 37,977
RMAC PLCSeries 2005-NS1X, Class A2A (3month GBP LIBOR + 0.130%)0.419%, 06/12/2037 (B) GBP 261,781 324,074
Sequoia Mortgage TrustSeries 6, Class A (1 month LIBOR +0.640%)1.868%, 04/19/2027 (B) $ 1,615,964 1,525,398
Structured Adjustable Rate MortgageLoan TrustSeries 2005-1, Class 2A3.422%, 02/25/2035 (B) 9,427,997 9,369,632
Structured Asset Mortgage InvestmentsII TrustSeries 2005-AR5, Class A3 (1 month
LIBOR + 0.250%),1.481%, 07/19/2035 (B) 673,658 648,417
Series 2005-AR8, Class A1A (1 monthLIBOR + 0.280%),1.514%, 02/25/2036 (B) 271,557 257,706
Series 2007-AR2, Class 2A1 (1 monthLIBOR + 0.130%),1.364%, 03/25/2037 (B) 1,535,210 1,197,441
TBW Mortgage-Backed TrustSeries 2006-4, Class A3 (1 monthLIBOR + 0.200%)1.434%, 09/25/2036 (B) 1,323,228 1,316,757
WaMu MortgagePass-Through CertificatesSeries 2001-7, Class A,
1.972%, 05/25/2041 (B) 268 268
Total Return Fund (continued)Shares orPrincipalAmount Value
COLLATERALIZED MORTGAGEOBLIGATIONS (continued)Commercial andresidential (continued)WaMu Mortgage
Pass-Through Certificates (continued)Series 2002-AR17, Class 1A (12
month Treasury Average Index +1.200%),2.030%, 11/25/2042 (B) $ 75,413 $ 71,350
Series 2002-AR9, Class 1A (12 monthTreasury Average Index + 1.400%),2.230%, 08/25/2042 (B) 206,978 199,710
Series 2004-CB1, Class 6A,6.000%, 06/25/2034 1,686,419 1,828,987
Series 2004-CB4, Class 11A,6.000%, 12/25/2034 5,002,390 5,402,267
Series 2005-AR13, Class A1A1 (1month LIBOR + 0.290%),1.524%, 10/25/2045 (B) 7,633,306 7,634,461
Series 2005-AR19, Class A1A1 (1month LIBOR + 0.270%),1.504%, 12/25/2045 (B) 1,080,114 1,044,453
Series 2006-8, Class A6,4.543%, 10/25/2036 (B) 3,413,880 2,262,932
Wells Fargo Mortgage BackedSecurities TrustSeries 2004-CC, Class A1,
3.105%, 01/25/2035 (B) 346,185 352,407Series 2005-AR13, Class 1A5,
3.378%, 05/25/2035 (B) 47,289 47,449Series 2005-AR4, Class 1A3,
3.239%, 04/25/2035 (B) 3,980,919 4,030,779Series 2006-AR10, Class 1A1,
3.297%, 07/25/2036 (B) 1,199,450 1,163,544Series 2006-AR2, Class 2A1,
3.154%, 03/25/2036 (B) 870,877 879,828Series 2006-AR2, Class 2A5,
3.154%, 03/25/2036 (B) 1,383,786 1,361,157186,389,453
U.S. Government Agency – 2.6%Federal Home Loan Mortgage Corp.
Series 2204, Class Z,7.500%, 12/20/2029 147,026 168,759
Series 2362, Class ZA,6.500%, 09/15/2031 88,249 105,553
Series 2503, Class PZ,6.000%, 09/15/2032 249,733 284,309
Series 2906, Class GZ,5.000%, 09/15/2034 107,036 117,907
Series 2935, Class HJ,5.000%, 02/15/2035 105,979 116,132
Series 4611, Class BF (1 monthLIBOR + 0.400%),1.627%, 06/15/2041 (B) 5,956,294 5,974,230
Series 4620, Class AF (1 monthLIBOR + 0.440%),1.667%, 11/15/2042 (B) 6,846,635 6,857,190
Series T-63, Class 1A1 (12 monthTreasury Average Index + 1.200%),1.976%, 02/25/2045 (B) 67,053 68,277
Federal National Mortgage AssociationSeries 2002-56, Class ZQ,
6.000%, 09/25/2032 1,053,140 1,189,855Series 2003-W1, Class 1A1,
6.500%, 12/25/2042 (B) 109,082 118,910
John Hancock Funds IIPortfolio of Investments — August 31, 2017 (showing percentage of total net assets)
189
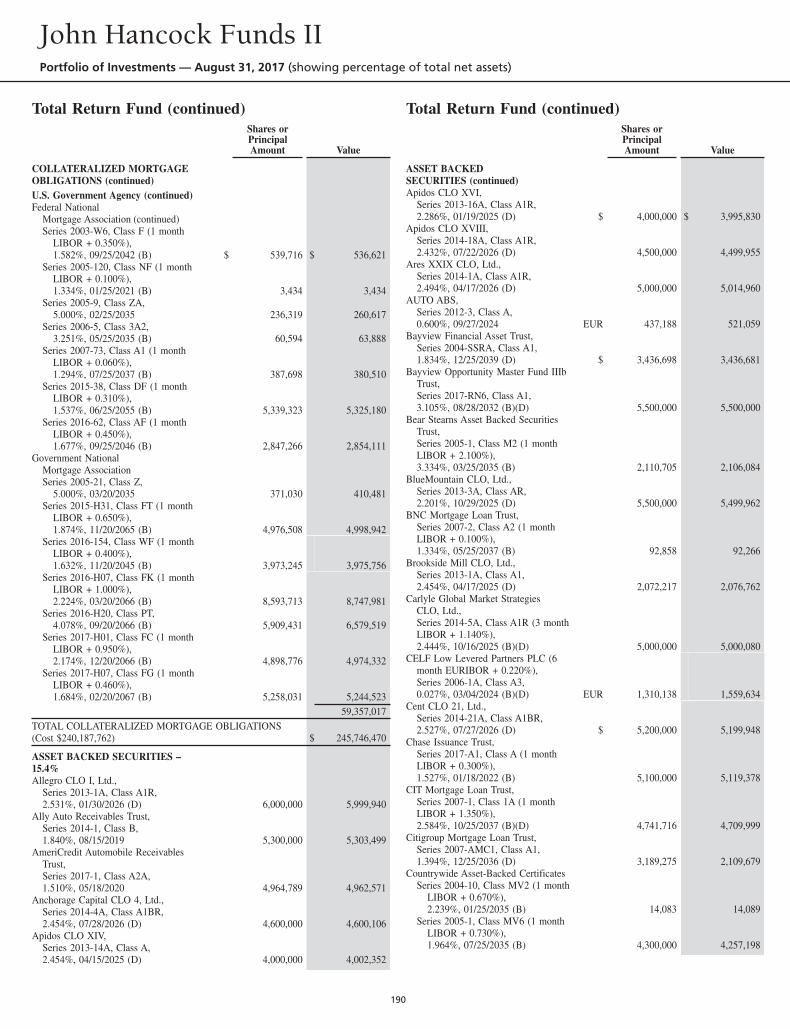
Total Return Fund (continued)Shares orPrincipalAmount Value
COLLATERALIZED MORTGAGEOBLIGATIONS (continued)U.S. Government Agency (continued)Federal National
Mortgage Association (continued)Series 2003-W6, Class F (1 month
LIBOR + 0.350%),1.582%, 09/25/2042 (B) $ 539,716 $ 536,621
Series 2005-120, Class NF (1 monthLIBOR + 0.100%),1.334%, 01/25/2021 (B) 3,434 3,434
Series 2005-9, Class ZA,5.000%, 02/25/2035 236,319 260,617
Series 2006-5, Class 3A2,3.251%, 05/25/2035 (B) 60,594 63,888
Series 2007-73, Class A1 (1 monthLIBOR + 0.060%),1.294%, 07/25/2037 (B) 387,698 380,510
Series 2015-38, Class DF (1 monthLIBOR + 0.310%),1.537%, 06/25/2055 (B) 5,339,323 5,325,180
Series 2016-62, Class AF (1 monthLIBOR + 0.450%),1.677%, 09/25/2046 (B) 2,847,266 2,854,111
Government NationalMortgage AssociationSeries 2005-21, Class Z,
5.000%, 03/20/2035 371,030 410,481Series 2015-H31, Class FT (1 month
LIBOR + 0.650%),1.874%, 11/20/2065 (B) 4,976,508 4,998,942
Series 2016-154, Class WF (1 monthLIBOR + 0.400%),1.632%, 11/20/2045 (B) 3,973,245 3,975,756
Series 2016-H07, Class FK (1 monthLIBOR + 1.000%),2.224%, 03/20/2066 (B) 8,593,713 8,747,981
Series 2016-H20, Class PT,4.078%, 09/20/2066 (B) 5,909,431 6,579,519
Series 2017-H01, Class FC (1 monthLIBOR + 0.950%),2.174%, 12/20/2066 (B) 4,898,776 4,974,332
Series 2017-H07, Class FG (1 monthLIBOR + 0.460%),1.684%, 02/20/2067 (B) 5,258,031 5,244,523
59,357,017TOTAL COLLATERALIZED MORTGAGE OBLIGATIONS(Cost $240,187,762) $ 245,746,470
ASSET BACKED SECURITIES –15.4%Allegro CLO I, Ltd.,
Series 2013-1A, Class A1R,2.531%, 01/30/2026 (D) 6,000,000 5,999,940
Ally Auto Receivables Trust,Series 2014-1, Class B,1.840%, 08/15/2019 5,300,000 5,303,499
AmeriCredit Automobile ReceivablesTrust,Series 2017-1, Class A2A,1.510%, 05/18/2020 4,964,789 4,962,571
Anchorage Capital CLO 4, Ltd.,Series 2014-4A, Class A1BR,2.454%, 07/28/2026 (D) 4,600,000 4,600,106
Apidos CLO XIV,Series 2013-14A, Class A,2.454%, 04/15/2025 (D) 4,000,000 4,002,352
Total Return Fund (continued)Shares orPrincipalAmount Value
ASSET BACKEDSECURITIES (continued)Apidos CLO XVI,
Series 2013-16A, Class A1R,2.286%, 01/19/2025 (D) $ 4,000,000 $ 3,995,830
Apidos CLO XVIII,Series 2014-18A, Class A1R,2.432%, 07/22/2026 (D) 4,500,000 4,499,955
Ares XXIX CLO, Ltd.,Series 2014-1A, Class A1R,2.494%, 04/17/2026 (D) 5,000,000 5,014,960
AUTO ABS,Series 2012-3, Class A,0.600%, 09/27/2024 EUR 437,188 521,059
Bayview Financial Asset Trust,Series 2004-SSRA, Class A1,1.834%, 12/25/2039 (D) $ 3,436,698 3,436,681
Bayview Opportunity Master Fund IIIbTrust,Series 2017-RN6, Class A1,3.105%, 08/28/2032 (B)(D) 5,500,000 5,500,000
Bear Stearns Asset Backed SecuritiesTrust,Series 2005-1, Class M2 (1 monthLIBOR + 2.100%),3.334%, 03/25/2035 (B) 2,110,705 2,106,084
BlueMountain CLO, Ltd.,Series 2013-3A, Class AR,2.201%, 10/29/2025 (D) 5,500,000 5,499,962
BNC Mortgage Loan Trust,Series 2007-2, Class A2 (1 monthLIBOR + 0.100%),1.334%, 05/25/2037 (B) 92,858 92,266
Brookside Mill CLO, Ltd.,Series 2013-1A, Class A1,2.454%, 04/17/2025 (D) 2,072,217 2,076,762
Carlyle Global Market StrategiesCLO, Ltd.,Series 2014-5A, Class A1R (3 monthLIBOR + 1.140%),2.444%, 10/16/2025 (B)(D) 5,000,000 5,000,080
CELF Low Levered Partners PLC (6month EURIBOR + 0.220%),Series 2006-1A, Class A3,0.027%, 03/04/2024 (B)(D) EUR 1,310,138 1,559,634
Cent CLO 21, Ltd.,Series 2014-21A, Class A1BR,2.527%, 07/27/2026 (D) $ 5,200,000 5,199,948
Chase Issuance Trust,Series 2017-A1, Class A (1 monthLIBOR + 0.300%),1.527%, 01/18/2022 (B) 5,100,000 5,119,378
CIT Mortgage Loan Trust,Series 2007-1, Class 1A (1 monthLIBOR + 1.350%),2.584%, 10/25/2037 (B)(D) 4,741,716 4,709,999
Citigroup Mortgage Loan Trust,Series 2007-AMC1, Class A1,1.394%, 12/25/2036 (D) 3,189,275 2,109,679
Countrywide Asset-Backed CertificatesSeries 2004-10, Class MV2 (1 month
LIBOR + 0.670%),2.239%, 01/25/2035 (B) 14,083 14,089
Series 2005-1, Class MV6 (1 monthLIBOR + 0.730%),1.964%, 07/25/2035 (B) 4,300,000 4,257,198
John Hancock Funds IIPortfolio of Investments — August 31, 2017 (showing percentage of total net assets)
190
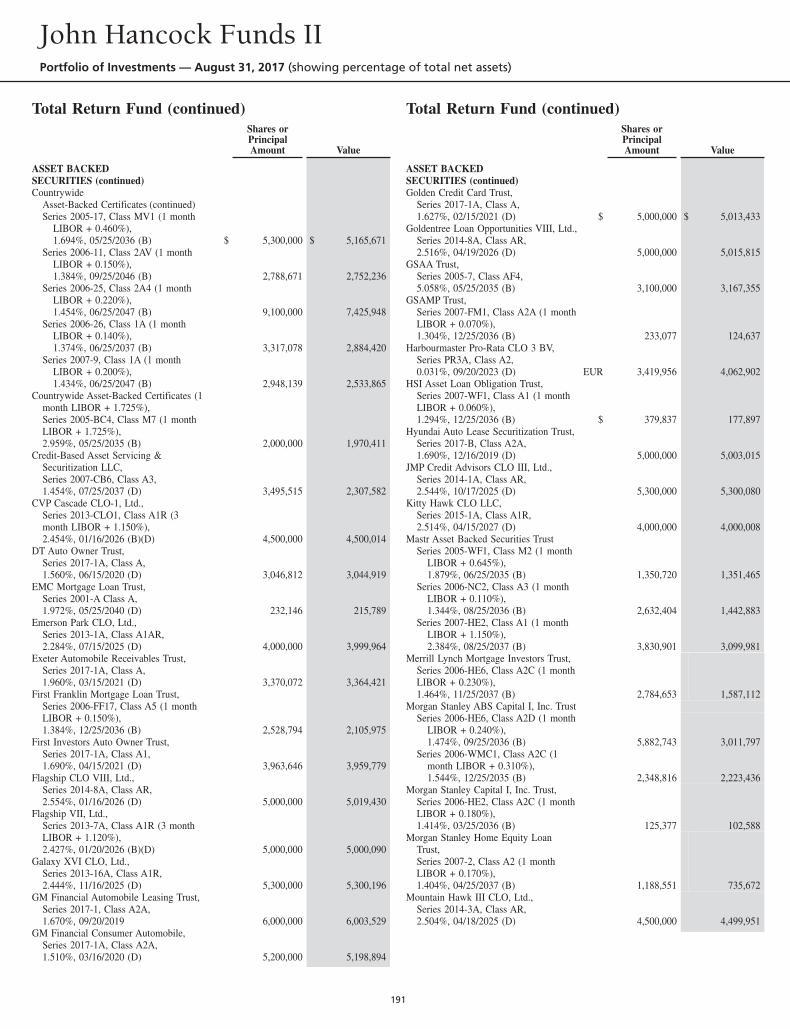
Total Return Fund (continued)Shares orPrincipalAmount Value
ASSET BACKEDSECURITIES (continued)Countrywide
Asset-Backed Certificates (continued)Series 2005-17, Class MV1 (1 month
LIBOR + 0.460%),1.694%, 05/25/2036 (B) $ 5,300,000 $ 5,165,671
Series 2006-11, Class 2AV (1 monthLIBOR + 0.150%),1.384%, 09/25/2046 (B) 2,788,671 2,752,236
Series 2006-25, Class 2A4 (1 monthLIBOR + 0.220%),1.454%, 06/25/2047 (B) 9,100,000 7,425,948
Series 2006-26, Class 1A (1 monthLIBOR + 0.140%),1.374%, 06/25/2037 (B) 3,317,078 2,884,420
Series 2007-9, Class 1A (1 monthLIBOR + 0.200%),1.434%, 06/25/2047 (B) 2,948,139 2,533,865
Countrywide Asset-Backed Certificates (1month LIBOR + 1.725%),Series 2005-BC4, Class M7 (1 monthLIBOR + 1.725%),2.959%, 05/25/2035 (B) 2,000,000 1,970,411
Credit-Based Asset Servicing &Securitization LLC,Series 2007-CB6, Class A3,1.454%, 07/25/2037 (D) 3,495,515 2,307,582
CVP Cascade CLO-1, Ltd.,Series 2013-CLO1, Class A1R (3month LIBOR + 1.150%),2.454%, 01/16/2026 (B)(D) 4,500,000 4,500,014
DT Auto Owner Trust,Series 2017-1A, Class A,1.560%, 06/15/2020 (D) 3,046,812 3,044,919
EMC Mortgage Loan Trust,Series 2001-A Class A,1.972%, 05/25/2040 (D) 232,146 215,789
Emerson Park CLO, Ltd.,Series 2013-1A, Class A1AR,2.284%, 07/15/2025 (D) 4,000,000 3,999,964
Exeter Automobile Receivables Trust,Series 2017-1A, Class A,1.960%, 03/15/2021 (D) 3,370,072 3,364,421
First Franklin Mortgage Loan Trust,Series 2006-FF17, Class A5 (1 monthLIBOR + 0.150%),1.384%, 12/25/2036 (B) 2,528,794 2,105,975
First Investors Auto Owner Trust,Series 2017-1A, Class A1,1.690%, 04/15/2021 (D) 3,963,646 3,959,779
Flagship CLO VIII, Ltd.,Series 2014-8A, Class AR,2.554%, 01/16/2026 (D) 5,000,000 5,019,430
Flagship VII, Ltd.,Series 2013-7A, Class A1R (3 monthLIBOR + 1.120%),2.427%, 01/20/2026 (B)(D) 5,000,000 5,000,090
Galaxy XVI CLO, Ltd.,Series 2013-16A, Class A1R,2.444%, 11/16/2025 (D) 5,300,000 5,300,196
GM Financial Automobile Leasing Trust,Series 2017-1, Class A2A,1.670%, 09/20/2019 6,000,000 6,003,529
GM Financial Consumer Automobile,Series 2017-1A, Class A2A,1.510%, 03/16/2020 (D) 5,200,000 5,198,894
Total Return Fund (continued)Shares orPrincipalAmount Value
ASSET BACKEDSECURITIES (continued)Golden Credit Card Trust,
Series 2017-1A, Class A,1.627%, 02/15/2021 (D) $ 5,000,000 $ 5,013,433
Goldentree Loan Opportunities VIII, Ltd.,Series 2014-8A, Class AR,2.516%, 04/19/2026 (D) 5,000,000 5,015,815
GSAA Trust,Series 2005-7, Class AF4,5.058%, 05/25/2035 (B) 3,100,000 3,167,355
GSAMP Trust,Series 2007-FM1, Class A2A (1 monthLIBOR + 0.070%),1.304%, 12/25/2036 (B) 233,077 124,637
Harbourmaster Pro-Rata CLO 3 BV,Series PR3A, Class A2,0.031%, 09/20/2023 (D) EUR 3,419,956 4,062,902
HSI Asset Loan Obligation Trust,Series 2007-WF1, Class A1 (1 monthLIBOR + 0.060%),1.294%, 12/25/2036 (B) $ 379,837 177,897
Hyundai Auto Lease Securitization Trust,Series 2017-B, Class A2A,1.690%, 12/16/2019 (D) 5,000,000 5,003,015
JMP Credit Advisors CLO III, Ltd.,Series 2014-1A, Class AR,2.544%, 10/17/2025 (D) 5,300,000 5,300,080
Kitty Hawk CLO LLC,Series 2015-1A, Class A1R,2.514%, 04/15/2027 (D) 4,000,000 4,000,008
Mastr Asset Backed Securities TrustSeries 2005-WF1, Class M2 (1 month
LIBOR + 0.645%),1.879%, 06/25/2035 (B) 1,350,720 1,351,465
Series 2006-NC2, Class A3 (1 monthLIBOR + 0.110%),1.344%, 08/25/2036 (B) 2,632,404 1,442,883
Series 2007-HE2, Class A1 (1 monthLIBOR + 1.150%),2.384%, 08/25/2037 (B) 3,830,901 3,099,981
Merrill Lynch Mortgage Investors Trust,Series 2006-HE6, Class A2C (1 monthLIBOR + 0.230%),1.464%, 11/25/2037 (B) 2,784,653 1,587,112
Morgan Stanley ABS Capital I, Inc. TrustSeries 2006-HE6, Class A2D (1 month
LIBOR + 0.240%),1.474%, 09/25/2036 (B) 5,882,743 3,011,797
Series 2006-WMC1, Class A2C (1month LIBOR + 0.310%),1.544%, 12/25/2035 (B) 2,348,816 2,223,436
Morgan Stanley Capital I, Inc. Trust,Series 2006-HE2, Class A2C (1 monthLIBOR + 0.180%),1.414%, 03/25/2036 (B) 125,377 102,588
Morgan Stanley Home Equity LoanTrust,Series 2007-2, Class A2 (1 monthLIBOR + 0.170%),1.404%, 04/25/2037 (B) 1,188,551 735,672
Mountain Hawk III CLO, Ltd.,Series 2014-3A, Class AR,2.504%, 04/18/2025 (D) 4,500,000 4,499,951
John Hancock Funds IIPortfolio of Investments — August 31, 2017 (showing percentage of total net assets)
191
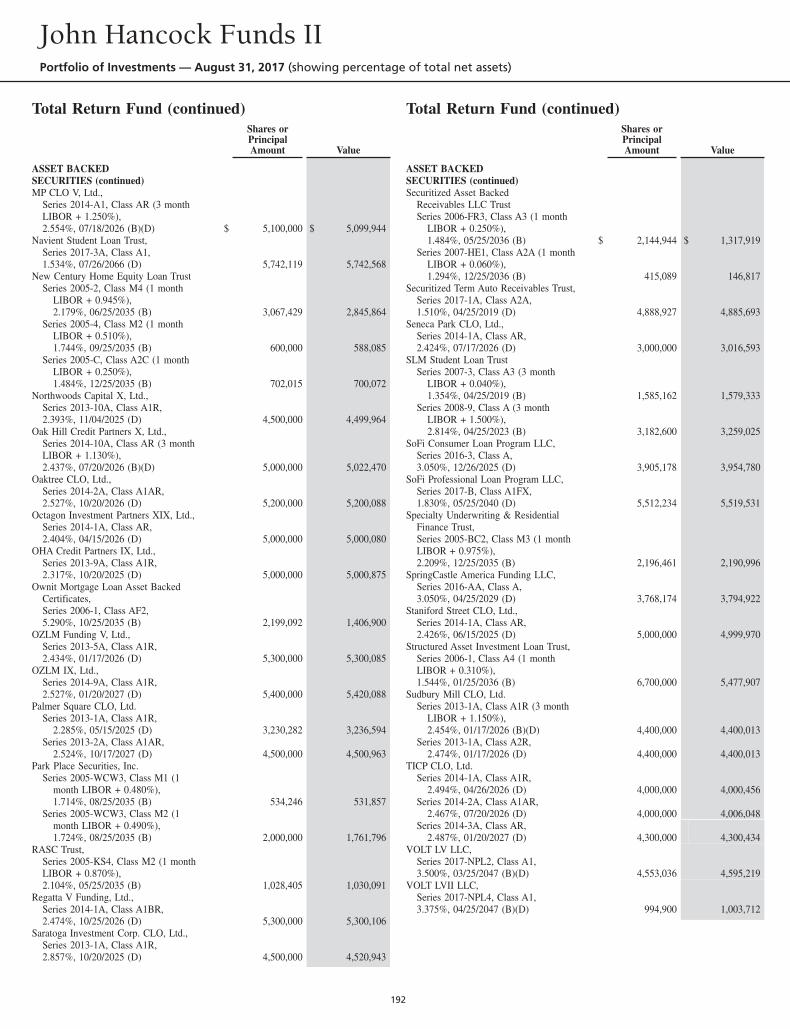
Total Return Fund (continued)Shares orPrincipalAmount Value
ASSET BACKEDSECURITIES (continued)MP CLO V, Ltd.,
Series 2014-A1, Class AR (3 monthLIBOR + 1.250%),2.554%, 07/18/2026 (B)(D) $ 5,100,000 $ 5,099,944
Navient Student Loan Trust,Series 2017-3A, Class A1,1.534%, 07/26/2066 (D) 5,742,119 5,742,568
New Century Home Equity Loan TrustSeries 2005-2, Class M4 (1 month
LIBOR + 0.945%),2.179%, 06/25/2035 (B) 3,067,429 2,845,864
Series 2005-4, Class M2 (1 monthLIBOR + 0.510%),1.744%, 09/25/2035 (B) 600,000 588,085
Series 2005-C, Class A2C (1 monthLIBOR + 0.250%),1.484%, 12/25/2035 (B) 702,015 700,072
Northwoods Capital X, Ltd.,Series 2013-10A, Class A1R,2.393%, 11/04/2025 (D) 4,500,000 4,499,964
Oak Hill Credit Partners X, Ltd.,Series 2014-10A, Class AR (3 monthLIBOR + 1.130%),2.437%, 07/20/2026 (B)(D) 5,000,000 5,022,470
Oaktree CLO, Ltd.,Series 2014-2A, Class A1AR,2.527%, 10/20/2026 (D) 5,200,000 5,200,088
Octagon Investment Partners XIX, Ltd.,Series 2014-1A, Class AR,2.404%, 04/15/2026 (D) 5,000,000 5,000,080
OHA Credit Partners IX, Ltd.,Series 2013-9A, Class A1R,2.317%, 10/20/2025 (D) 5,000,000 5,000,875
Ownit Mortgage Loan Asset BackedCertificates,Series 2006-1, Class AF2,5.290%, 10/25/2035 (B) 2,199,092 1,406,900
OZLM Funding V, Ltd.,Series 2013-5A, Class A1R,2.434%, 01/17/2026 (D) 5,300,000 5,300,085
OZLM IX, Ltd.,Series 2014-9A, Class A1R,2.527%, 01/20/2027 (D) 5,400,000 5,420,088
Palmer Square CLO, Ltd.Series 2013-1A, Class A1R,
2.285%, 05/15/2025 (D) 3,230,282 3,236,594Series 2013-2A, Class A1AR,
2.524%, 10/17/2027 (D) 4,500,000 4,500,963Park Place Securities, Inc.
Series 2005-WCW3, Class M1 (1month LIBOR + 0.480%),1.714%, 08/25/2035 (B) 534,246 531,857
Series 2005-WCW3, Class M2 (1month LIBOR + 0.490%),1.724%, 08/25/2035 (B) 2,000,000 1,761,796
RASC Trust,Series 2005-KS4, Class M2 (1 monthLIBOR + 0.870%),2.104%, 05/25/2035 (B) 1,028,405 1,030,091
Regatta V Funding, Ltd.,Series 2014-1A, Class A1BR,2.474%, 10/25/2026 (D) 5,300,000 5,300,106
Saratoga Investment Corp. CLO, Ltd.,Series 2013-1A, Class A1R,2.857%, 10/20/2025 (D) 4,500,000 4,520,943
Total Return Fund (continued)Shares orPrincipalAmount Value
ASSET BACKEDSECURITIES (continued)Securitized Asset Backed
Receivables LLC TrustSeries 2006-FR3, Class A3 (1 month
LIBOR + 0.250%),1.484%, 05/25/2036 (B) $ 2,144,944 $ 1,317,919
Series 2007-HE1, Class A2A (1 monthLIBOR + 0.060%),1.294%, 12/25/2036 (B) 415,089 146,817
Securitized Term Auto Receivables Trust,Series 2017-1A, Class A2A,1.510%, 04/25/2019 (D) 4,888,927 4,885,693
Seneca Park CLO, Ltd.,Series 2014-1A, Class AR,2.424%, 07/17/2026 (D) 3,000,000 3,016,593
SLM Student Loan TrustSeries 2007-3, Class A3 (3 month
LIBOR + 0.040%),1.354%, 04/25/2019 (B) 1,585,162 1,579,333
Series 2008-9, Class A (3 monthLIBOR + 1.500%),2.814%, 04/25/2023 (B) 3,182,600 3,259,025
SoFi Consumer Loan Program LLC,Series 2016-3, Class A,3.050%, 12/26/2025 (D) 3,905,178 3,954,780
SoFi Professional Loan Program LLC,Series 2017-B, Class A1FX,1.830%, 05/25/2040 (D) 5,512,234 5,519,531
Specialty Underwriting & ResidentialFinance Trust,Series 2005-BC2, Class M3 (1 monthLIBOR + 0.975%),2.209%, 12/25/2035 (B) 2,196,461 2,190,996
SpringCastle America Funding LLC,Series 2016-AA, Class A,3.050%, 04/25/2029 (D) 3,768,174 3,794,922
Staniford Street CLO, Ltd.,Series 2014-1A, Class AR,2.426%, 06/15/2025 (D) 5,000,000 4,999,970
Structured Asset Investment Loan Trust,Series 2006-1, Class A4 (1 monthLIBOR + 0.310%),1.544%, 01/25/2036 (B) 6,700,000 5,477,907
Sudbury Mill CLO, Ltd.Series 2013-1A, Class A1R (3 month
LIBOR + 1.150%),2.454%, 01/17/2026 (B)(D) 4,400,000 4,400,013
Series 2013-1A, Class A2R,2.474%, 01/17/2026 (D) 4,400,000 4,400,013
TICP CLO, Ltd.Series 2014-1A, Class A1R,
2.494%, 04/26/2026 (D) 4,000,000 4,000,456Series 2014-2A, Class A1AR,
2.467%, 07/20/2026 (D) 4,000,000 4,006,048Series 2014-3A, Class AR,
2.487%, 01/20/2027 (D) 4,300,000 4,300,434VOLT LV LLC,
Series 2017-NPL2, Class A1,3.500%, 03/25/2047 (B)(D) 4,553,036 4,595,219
VOLT LVII LLC,Series 2017-NPL4, Class A1,3.375%, 04/25/2047 (B)(D) 994,900 1,003,712
John Hancock Funds IIPortfolio of Investments — August 31, 2017 (showing percentage of total net assets)
192
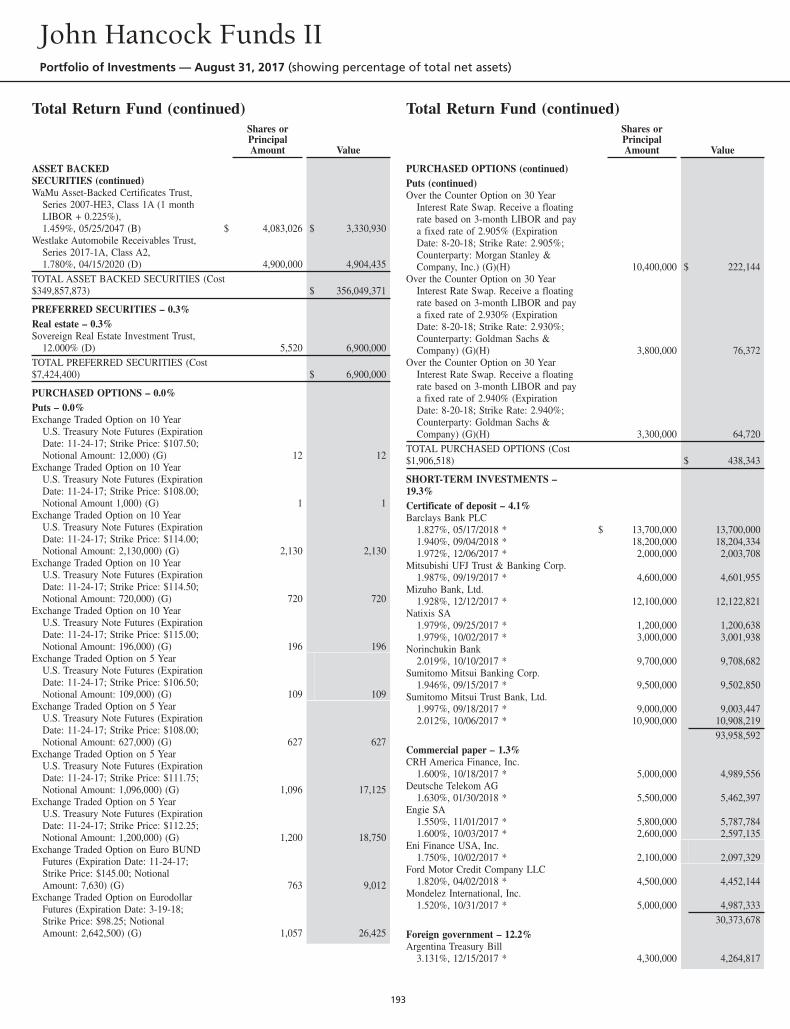
Total Return Fund (continued)Shares orPrincipalAmount Value
ASSET BACKEDSECURITIES (continued)WaMu Asset-Backed Certificates Trust,
Series 2007-HE3, Class 1A (1 monthLIBOR + 0.225%),1.459%, 05/25/2047 (B) $ 4,083,026 $ 3,330,930
Westlake Automobile Receivables Trust,Series 2017-1A, Class A2,1.780%, 04/15/2020 (D) 4,900,000 4,904,435
TOTAL ASSET BACKED SECURITIES (Cost$349,857,873) $ 356,049,371
PREFERRED SECURITIES – 0.3%Real estate – 0.3%Sovereign Real Estate Investment Trust,
12.000% (D) 5,520 6,900,000TOTAL PREFERRED SECURITIES (Cost$7,424,400) $ 6,900,000
PURCHASED OPTIONS – 0.0%Puts – 0.0%Exchange Traded Option on 10 Year
U.S. Treasury Note Futures (ExpirationDate: 11-24-17; Strike Price: $107.50;Notional Amount: 12,000) (G) 12 12
Exchange Traded Option on 10 YearU.S. Treasury Note Futures (ExpirationDate: 11-24-17; Strike Price: $108.00;Notional Amount 1,000) (G) 1 1
Exchange Traded Option on 10 YearU.S. Treasury Note Futures (ExpirationDate: 11-24-17; Strike Price: $114.00;Notional Amount: 2,130,000) (G) 2,130 2,130
Exchange Traded Option on 10 YearU.S. Treasury Note Futures (ExpirationDate: 11-24-17; Strike Price: $114.50;Notional Amount: 720,000) (G) 720 720
Exchange Traded Option on 10 YearU.S. Treasury Note Futures (ExpirationDate: 11-24-17; Strike Price: $115.00;Notional Amount: 196,000) (G) 196 196
Exchange Traded Option on 5 YearU.S. Treasury Note Futures (ExpirationDate: 11-24-17; Strike Price: $106.50;Notional Amount: 109,000) (G) 109 109
Exchange Traded Option on 5 YearU.S. Treasury Note Futures (ExpirationDate: 11-24-17; Strike Price: $108.00;Notional Amount: 627,000) (G) 627 627
Exchange Traded Option on 5 YearU.S. Treasury Note Futures (ExpirationDate: 11-24-17; Strike Price: $111.75;Notional Amount: 1,096,000) (G) 1,096 17,125
Exchange Traded Option on 5 YearU.S. Treasury Note Futures (ExpirationDate: 11-24-17; Strike Price: $112.25;Notional Amount: 1,200,000) (G) 1,200 18,750
Exchange Traded Option on Euro BUNDFutures (Expiration Date: 11-24-17;Strike Price: $145.00; NotionalAmount: 7,630) (G) 763 9,012
Exchange Traded Option on EurodollarFutures (Expiration Date: 3-19-18;Strike Price: $98.25; NotionalAmount: 2,642,500) (G) 1,057 26,425
Total Return Fund (continued)Shares orPrincipalAmount Value
PURCHASED OPTIONS (continued)Puts (continued)Over the Counter Option on 30 Year
Interest Rate Swap. Receive a floatingrate based on 3-month LIBOR and paya fixed rate of 2.905% (ExpirationDate: 8-20-18; Strike Rate: 2.905%;Counterparty: Morgan Stanley &Company, Inc.) (G)(H) 10,400,000 $ 222,144
Over the Counter Option on 30 YearInterest Rate Swap. Receive a floatingrate based on 3-month LIBOR and paya fixed rate of 2.930% (ExpirationDate: 8-20-18; Strike Rate: 2.930%;Counterparty: Goldman Sachs &Company) (G)(H) 3,800,000 76,372
Over the Counter Option on 30 YearInterest Rate Swap. Receive a floatingrate based on 3-month LIBOR and paya fixed rate of 2.940% (ExpirationDate: 8-20-18; Strike Rate: 2.940%;Counterparty: Goldman Sachs &Company) (G)(H) 3,300,000 64,720
TOTAL PURCHASED OPTIONS (Cost$1,906,518) $ 438,343
SHORT-TERM INVESTMENTS –19.3%Certificate of deposit – 4.1%Barclays Bank PLC
1.827%, 05/17/2018 * $ 13,700,000 13,700,0001.940%, 09/04/2018 * 18,200,000 18,204,3341.972%, 12/06/2017 * 2,000,000 2,003,708
Mitsubishi UFJ Trust & Banking Corp.1.987%, 09/19/2017 * 4,600,000 4,601,955
Mizuho Bank, Ltd.1.928%, 12/12/2017 * 12,100,000 12,122,821
Natixis SA1.979%, 09/25/2017 * 1,200,000 1,200,6381.979%, 10/02/2017 * 3,000,000 3,001,938
Norinchukin Bank2.019%, 10/10/2017 * 9,700,000 9,708,682
Sumitomo Mitsui Banking Corp.1.946%, 09/15/2017 * 9,500,000 9,502,850
Sumitomo Mitsui Trust Bank, Ltd.1.997%, 09/18/2017 * 9,000,000 9,003,4472.012%, 10/06/2017 * 10,900,000 10,908,219
93,958,592Commercial paper – 1.3%CRH America Finance, Inc.
1.600%, 10/18/2017 * 5,000,000 4,989,556Deutsche Telekom AG
1.630%, 01/30/2018 * 5,500,000 5,462,397Engie SA
1.550%, 11/01/2017 * 5,800,000 5,787,7841.600%, 10/03/2017 * 2,600,000 2,597,135
Eni Finance USA, Inc.1.750%, 10/02/2017 * 2,100,000 2,097,329
Ford Motor Credit Company LLC1.820%, 04/02/2018 * 4,500,000 4,452,144
Mondelez International, Inc.1.520%, 10/31/2017 * 5,000,000 4,987,333
30,373,678Foreign government – 12.2%Argentina Treasury Bill
3.131%, 12/15/2017 * 4,300,000 4,264,817
John Hancock Funds IIPortfolio of Investments — August 31, 2017 (showing percentage of total net assets)
193
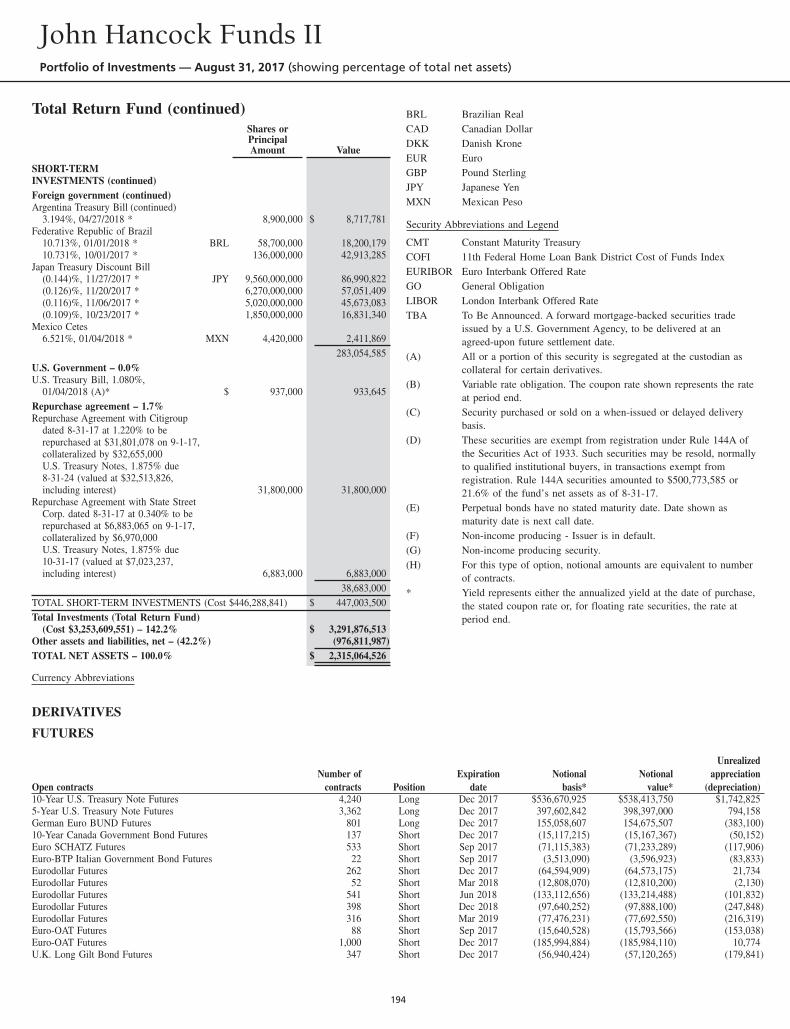
Total Return Fund (continued)Shares orPrincipalAmount Value
SHORT-TERMINVESTMENTS (continued)Foreign government (continued)Argentina Treasury Bill (continued)
3.194%, 04/27/2018 * 8,900,000 $ 8,717,781Federative Republic of Brazil
10.713%, 01/01/2018 * BRL 58,700,000 18,200,17910.731%, 10/01/2017 * 136,000,000 42,913,285
Japan Treasury Discount Bill(0.144)%, 11/27/2017 * JPY 9,560,000,000 86,990,822(0.126)%, 11/20/2017 * 6,270,000,000 57,051,409(0.116)%, 11/06/2017 * 5,020,000,000 45,673,083(0.109)%, 10/23/2017 * 1,850,000,000 16,831,340
Mexico Cetes6.521%, 01/04/2018 * MXN 4,420,000 2,411,869
283,054,585U.S. Government – 0.0%U.S. Treasury Bill, 1.080%,
01/04/2018 (A)* $ 937,000 933,645Repurchase agreement – 1.7%Repurchase Agreement with Citigroup
dated 8-31-17 at 1.220% to berepurchased at $31,801,078 on 9-1-17,collateralized by $32,655,000U.S. Treasury Notes, 1.875% due8-31-24 (valued at $32,513,826,including interest) 31,800,000 31,800,000
Repurchase Agreement with State StreetCorp. dated 8-31-17 at 0.340% to berepurchased at $6,883,065 on 9-1-17,collateralized by $6,970,000U.S. Treasury Notes, 1.875% due10-31-17 (valued at $7,023,237,including interest) 6,883,000 6,883,000
38,683,000TOTAL SHORT-TERM INVESTMENTS (Cost $446,288,841) $ 447,003,500Total Investments (Total Return Fund)
(Cost $3,253,609,551) – 142.2% $ 3,291,876,513Other assets and liabilities, net – (42.2%) (976,811,987)TOTAL NET ASSETS – 100.0% $ 2,315,064,526
Currency Abbreviations
BRL Brazilian RealCAD Canadian DollarDKK Danish KroneEUR EuroGBP Pound SterlingJPY Japanese YenMXN Mexican Peso
Security Abbreviations and Legend
CMT Constant Maturity TreasuryCOFI 11th Federal Home Loan Bank District Cost of Funds IndexEURIBOR Euro Interbank Offered RateGO General ObligationLIBOR London Interbank Offered RateTBA To Be Announced. A forward mortgage-backed securities trade
issued by a U.S. Government Agency, to be delivered at anagreed-upon future settlement date.
(A) All or a portion of this security is segregated at the custodian ascollateral for certain derivatives.
(B) Variable rate obligation. The coupon rate shown represents the rateat period end.
(C) Security purchased or sold on a when-issued or delayed deliverybasis.
(D) These securities are exempt from registration under Rule 144A ofthe Securities Act of 1933. Such securities may be resold, normallyto qualified institutional buyers, in transactions exempt fromregistration. Rule 144A securities amounted to $500,773,585 or21.6% of the fund’s net assets as of 8-31-17.
(E) Perpetual bonds have no stated maturity date. Date shown asmaturity date is next call date.
(F) Non-income producing - Issuer is in default.(G) Non-income producing security.(H) For this type of option, notional amounts are equivalent to number
of contracts.* Yield represents either the annualized yield at the date of purchase,
the stated coupon rate or, for floating rate securities, the rate atperiod end.
DERIVATIVES
FUTURES
Open contractsNumber of
contracts PositionExpiration
dateNotional
basis*Notional
value*
Unrealizedappreciation
(depreciation)10-Year U.S. Treasury Note Futures 4,240 Long Dec 2017 $536,670,925 $538,413,750 $1,742,8255-Year U.S. Treasury Note Futures 3,362 Long Dec 2017 397,602,842 398,397,000 794,158German Euro BUND Futures 801 Long Dec 2017 155,058,607 154,675,507 (383,100)10-Year Canada Government Bond Futures 137 Short Dec 2017 (15,117,215) (15,167,367) (50,152)Euro SCHATZ Futures 533 Short Sep 2017 (71,115,383) (71,233,289) (117,906)Euro-BTP Italian Government Bond Futures 22 Short Sep 2017 (3,513,090) (3,596,923) (83,833)Eurodollar Futures 262 Short Dec 2017 (64,594,909) (64,573,175) 21,734Eurodollar Futures 52 Short Mar 2018 (12,808,070) (12,810,200) (2,130)Eurodollar Futures 541 Short Jun 2018 (133,112,656) (133,214,488) (101,832)Eurodollar Futures 398 Short Dec 2018 (97,640,252) (97,888,100) (247,848)Eurodollar Futures 316 Short Mar 2019 (77,476,231) (77,692,550) (216,319)Euro-OAT Futures 88 Short Sep 2017 (15,640,528) (15,793,566) (153,038)Euro-OAT Futures 1,000 Short Dec 2017 (185,994,884) (185,984,110) 10,774U.K. Long Gilt Bond Futures 347 Short Dec 2017 (56,940,424) (57,120,265) (179,841)
John Hancock Funds IIPortfolio of Investments — August 31, 2017 (showing percentage of total net assets)
194
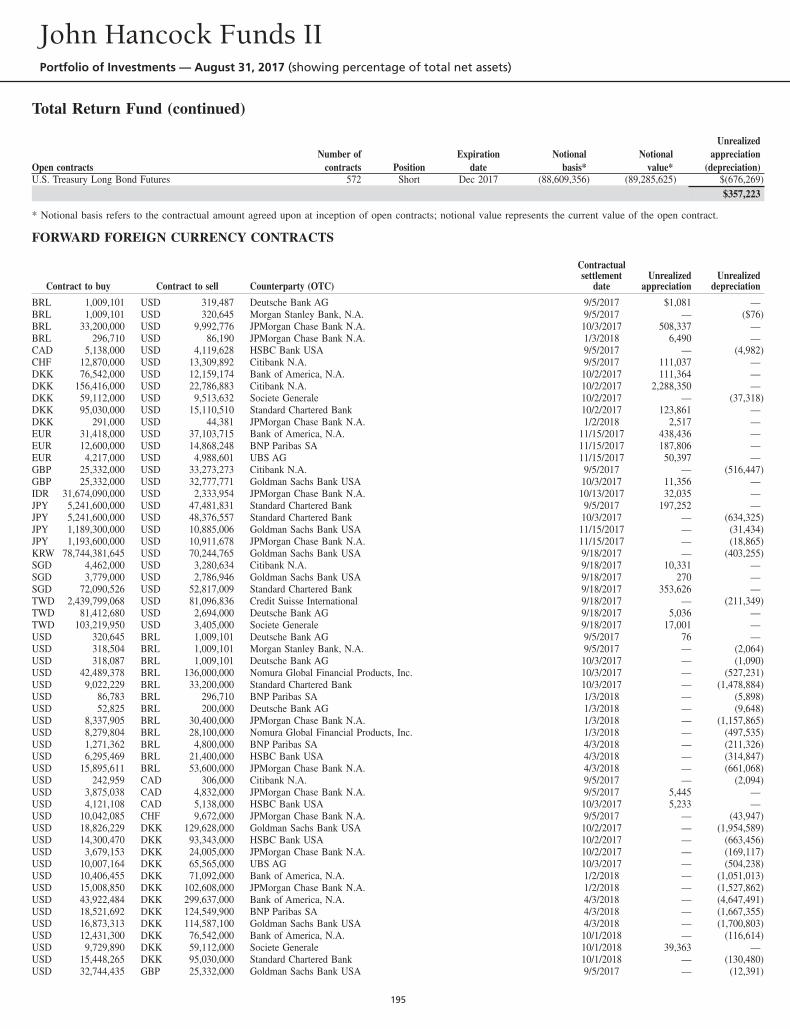
Total Return Fund (continued)
Open contractsNumber of
contracts PositionExpiration
dateNotional
basis*Notional
value*
Unrealizedappreciation
(depreciation)U.S. Treasury Long Bond Futures 572 Short Dec 2017 (88,609,356) (89,285,625) $(676,269)
$357,223
* Notional basis refers to the contractual amount agreed upon at inception of open contracts; notional value represents the current value of the open contract.
FORWARD FOREIGN CURRENCY CONTRACTS
Contract to buy Contract to sell Counterparty (OTC)
Contractualsettlement
dateUnrealized
appreciationUnrealized
depreciation
BRL 1,009,101 USD 319,487 Deutsche Bank AG 9/5/2017 $1,081 —BRL 1,009,101 USD 320,645 Morgan Stanley Bank, N.A. 9/5/2017 — ($76)BRL 33,200,000 USD 9,992,776 JPMorgan Chase Bank N.A. 10/3/2017 508,337 —BRL 296,710 USD 86,190 JPMorgan Chase Bank N.A. 1/3/2018 6,490 —CAD 5,138,000 USD 4,119,628 HSBC Bank USA 9/5/2017 — (4,982)CHF 12,870,000 USD 13,309,892 Citibank N.A. 9/5/2017 111,037 —DKK 76,542,000 USD 12,159,174 Bank of America, N.A. 10/2/2017 111,364 —DKK 156,416,000 USD 22,786,883 Citibank N.A. 10/2/2017 2,288,350 —DKK 59,112,000 USD 9,513,632 Societe Generale 10/2/2017 — (37,318)DKK 95,030,000 USD 15,110,510 Standard Chartered Bank 10/2/2017 123,861 —DKK 291,000 USD 44,381 JPMorgan Chase Bank N.A. 1/2/2018 2,517 —EUR 31,418,000 USD 37,103,715 Bank of America, N.A. 11/15/2017 438,436 —EUR 12,600,000 USD 14,868,248 BNP Paribas SA 11/15/2017 187,806 —EUR 4,217,000 USD 4,988,601 UBS AG 11/15/2017 50,397 —GBP 25,332,000 USD 33,273,273 Citibank N.A. 9/5/2017 — (516,447)GBP 25,332,000 USD 32,777,771 Goldman Sachs Bank USA 10/3/2017 11,356 —IDR 31,674,090,000 USD 2,333,954 JPMorgan Chase Bank N.A. 10/13/2017 32,035 —JPY 5,241,600,000 USD 47,481,831 Standard Chartered Bank 9/5/2017 197,252 —JPY 5,241,600,000 USD 48,376,557 Standard Chartered Bank 10/3/2017 — (634,325)JPY 1,189,300,000 USD 10,885,006 Goldman Sachs Bank USA 11/15/2017 — (31,434)JPY 1,193,600,000 USD 10,911,678 JPMorgan Chase Bank N.A. 11/15/2017 — (18,865)KRW 78,744,381,645 USD 70,244,765 Goldman Sachs Bank USA 9/18/2017 — (403,255)SGD 4,462,000 USD 3,280,634 Citibank N.A. 9/18/2017 10,331 —SGD 3,779,000 USD 2,786,946 Goldman Sachs Bank USA 9/18/2017 270 —SGD 72,090,526 USD 52,817,009 Standard Chartered Bank 9/18/2017 353,626 —TWD 2,439,799,068 USD 81,096,836 Credit Suisse International 9/18/2017 — (211,349)TWD 81,412,680 USD 2,694,000 Deutsche Bank AG 9/18/2017 5,036 —TWD 103,219,950 USD 3,405,000 Societe Generale 9/18/2017 17,001 —USD 320,645 BRL 1,009,101 Deutsche Bank AG 9/5/2017 76 —USD 318,504 BRL 1,009,101 Morgan Stanley Bank, N.A. 9/5/2017 — (2,064)USD 318,087 BRL 1,009,101 Deutsche Bank AG 10/3/2017 — (1,090)USD 42,489,378 BRL 136,000,000 Nomura Global Financial Products, Inc. 10/3/2017 — (527,231)USD 9,022,229 BRL 33,200,000 Standard Chartered Bank 10/3/2017 — (1,478,884)USD 86,783 BRL 296,710 BNP Paribas SA 1/3/2018 — (5,898)USD 52,825 BRL 200,000 Deutsche Bank AG 1/3/2018 — (9,648)USD 8,337,905 BRL 30,400,000 JPMorgan Chase Bank N.A. 1/3/2018 — (1,157,865)USD 8,279,804 BRL 28,100,000 Nomura Global Financial Products, Inc. 1/3/2018 — (497,535)USD 1,271,362 BRL 4,800,000 BNP Paribas SA 4/3/2018 — (211,326)USD 6,295,469 BRL 21,400,000 HSBC Bank USA 4/3/2018 — (314,847)USD 15,895,611 BRL 53,600,000 JPMorgan Chase Bank N.A. 4/3/2018 — (661,068)USD 242,959 CAD 306,000 Citibank N.A. 9/5/2017 — (2,094)USD 3,875,038 CAD 4,832,000 JPMorgan Chase Bank N.A. 9/5/2017 5,445 —USD 4,121,108 CAD 5,138,000 HSBC Bank USA 10/3/2017 5,233 —USD 10,042,085 CHF 9,672,000 JPMorgan Chase Bank N.A. 9/5/2017 — (43,947)USD 18,826,229 DKK 129,628,000 Goldman Sachs Bank USA 10/2/2017 — (1,954,589)USD 14,300,470 DKK 93,343,000 HSBC Bank USA 10/2/2017 — (663,456)USD 3,679,153 DKK 24,005,000 JPMorgan Chase Bank N.A. 10/2/2017 — (169,117)USD 10,007,164 DKK 65,565,000 UBS AG 10/3/2017 — (504,238)USD 10,406,455 DKK 71,092,000 Bank of America, N.A. 1/2/2018 — (1,051,013)USD 15,008,850 DKK 102,608,000 JPMorgan Chase Bank N.A. 1/2/2018 — (1,527,862)USD 43,922,484 DKK 299,637,000 Bank of America, N.A. 4/3/2018 — (4,647,491)USD 18,521,692 DKK 124,549,900 BNP Paribas SA 4/3/2018 — (1,667,355)USD 16,873,313 DKK 114,587,100 Goldman Sachs Bank USA 4/3/2018 — (1,700,803)USD 12,431,300 DKK 76,542,000 Bank of America, N.A. 10/1/2018 — (116,614)USD 9,729,890 DKK 59,112,000 Societe Generale 10/1/2018 39,363 —USD 15,448,265 DKK 95,030,000 Standard Chartered Bank 10/1/2018 — (130,480)USD 32,744,435 GBP 25,332,000 Goldman Sachs Bank USA 9/5/2017 — (12,391)
John Hancock Funds IIPortfolio of Investments — August 31, 2017 (showing percentage of total net assets)
195
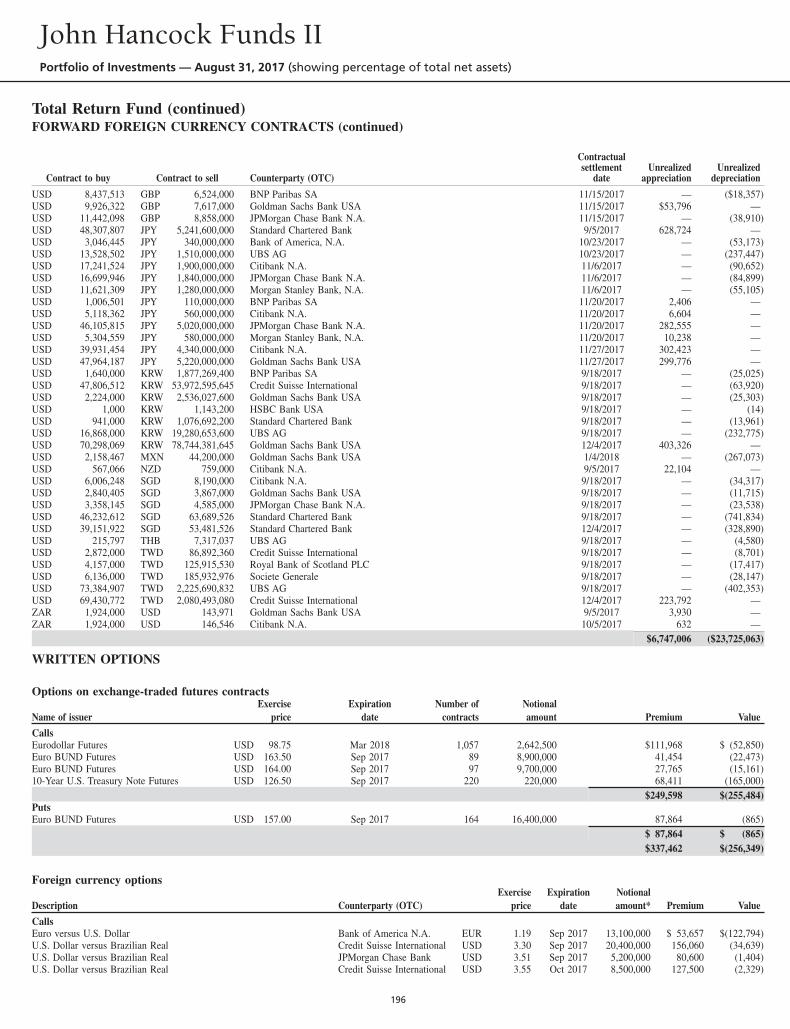
Total Return Fund (continued)FORWARD FOREIGN CURRENCY CONTRACTS (continued)
Contract to buy Contract to sell Counterparty (OTC)
Contractualsettlement
dateUnrealized
appreciationUnrealized
depreciation
USD 8,437,513 GBP 6,524,000 BNP Paribas SA 11/15/2017 — ($18,357)USD 9,926,322 GBP 7,617,000 Goldman Sachs Bank USA 11/15/2017 $53,796 —USD 11,442,098 GBP 8,858,000 JPMorgan Chase Bank N.A. 11/15/2017 — (38,910)USD 48,307,807 JPY 5,241,600,000 Standard Chartered Bank 9/5/2017 628,724 —USD 3,046,445 JPY 340,000,000 Bank of America, N.A. 10/23/2017 — (53,173)USD 13,528,502 JPY 1,510,000,000 UBS AG 10/23/2017 — (237,447)USD 17,241,524 JPY 1,900,000,000 Citibank N.A. 11/6/2017 — (90,652)USD 16,699,946 JPY 1,840,000,000 JPMorgan Chase Bank N.A. 11/6/2017 — (84,899)USD 11,621,309 JPY 1,280,000,000 Morgan Stanley Bank, N.A. 11/6/2017 — (55,105)USD 1,006,501 JPY 110,000,000 BNP Paribas SA 11/20/2017 2,406 —USD 5,118,362 JPY 560,000,000 Citibank N.A. 11/20/2017 6,604 —USD 46,105,815 JPY 5,020,000,000 JPMorgan Chase Bank N.A. 11/20/2017 282,555 —USD 5,304,559 JPY 580,000,000 Morgan Stanley Bank, N.A. 11/20/2017 10,238 —USD 39,931,454 JPY 4,340,000,000 Citibank N.A. 11/27/2017 302,423 —USD 47,964,187 JPY 5,220,000,000 Goldman Sachs Bank USA 11/27/2017 299,776 —USD 1,640,000 KRW 1,877,269,400 BNP Paribas SA 9/18/2017 — (25,025)USD 47,806,512 KRW 53,972,595,645 Credit Suisse International 9/18/2017 — (63,920)USD 2,224,000 KRW 2,536,027,600 Goldman Sachs Bank USA 9/18/2017 — (25,303)USD 1,000 KRW 1,143,200 HSBC Bank USA 9/18/2017 — (14)USD 941,000 KRW 1,076,692,200 Standard Chartered Bank 9/18/2017 — (13,961)USD 16,868,000 KRW 19,280,653,600 UBS AG 9/18/2017 — (232,775)USD 70,298,069 KRW 78,744,381,645 Goldman Sachs Bank USA 12/4/2017 403,326 —USD 2,158,467 MXN 44,200,000 Goldman Sachs Bank USA 1/4/2018 — (267,073)USD 567,066 NZD 759,000 Citibank N.A. 9/5/2017 22,104 —USD 6,006,248 SGD 8,190,000 Citibank N.A. 9/18/2017 — (34,317)USD 2,840,405 SGD 3,867,000 Goldman Sachs Bank USA 9/18/2017 — (11,715)USD 3,358,145 SGD 4,585,000 JPMorgan Chase Bank N.A. 9/18/2017 — (23,538)USD 46,232,612 SGD 63,689,526 Standard Chartered Bank 9/18/2017 — (741,834)USD 39,151,922 SGD 53,481,526 Standard Chartered Bank 12/4/2017 — (328,890)USD 215,797 THB 7,317,037 UBS AG 9/18/2017 — (4,580)USD 2,872,000 TWD 86,892,360 Credit Suisse International 9/18/2017 — (8,701)USD 4,157,000 TWD 125,915,530 Royal Bank of Scotland PLC 9/18/2017 — (17,417)USD 6,136,000 TWD 185,932,976 Societe Generale 9/18/2017 — (28,147)USD 73,384,907 TWD 2,225,690,832 UBS AG 9/18/2017 — (402,353)USD 69,430,772 TWD 2,080,493,080 Credit Suisse International 12/4/2017 223,792 —ZAR 1,924,000 USD 143,971 Goldman Sachs Bank USA 9/5/2017 3,930 —ZAR 1,924,000 USD 146,546 Citibank N.A. 10/5/2017 632 —
$6,747,006 ($23,725,063)
WRITTEN OPTIONS
Options on exchange-traded futures contracts
Name of issuerExercise
priceExpiration
dateNumber of
contractsNotionalamount Premium Value
CallsEurodollar Futures USD 98.75 Mar 2018 1,057 2,642,500 $111,968 $ (52,850)Euro BUND Futures USD 163.50 Sep 2017 89 8,900,000 41,454 (22,473)Euro BUND Futures USD 164.00 Sep 2017 97 9,700,000 27,765 (15,161)10-Year U.S. Treasury Note Futures USD 126.50 Sep 2017 220 220,000 68,411 (165,000)
$249,598 $(255,484)PutsEuro BUND Futures USD 157.00 Sep 2017 164 16,400,000 87,864 (865)
$ 87,864 $ (865)$337,462 $(256,349)
Foreign currency options
Description Counterparty (OTC)Exercise
priceExpiration
dateNotionalamount* Premium Value
CallsEuro versus U.S. Dollar Bank of America N.A. EUR 1.19 Sep 2017 13,100,000 $ 53,657 $(122,794)U.S. Dollar versus Brazilian Real Credit Suisse International USD 3.30 Sep 2017 20,400,000 156,060 (34,639)U.S. Dollar versus Brazilian Real JPMorgan Chase Bank USD 3.51 Sep 2017 5,200,000 80,600 (1,404)U.S. Dollar versus Brazilian Real Credit Suisse International USD 3.55 Oct 2017 8,500,000 127,500 (2,329)
John Hancock Funds IIPortfolio of Investments — August 31, 2017 (showing percentage of total net assets)
196
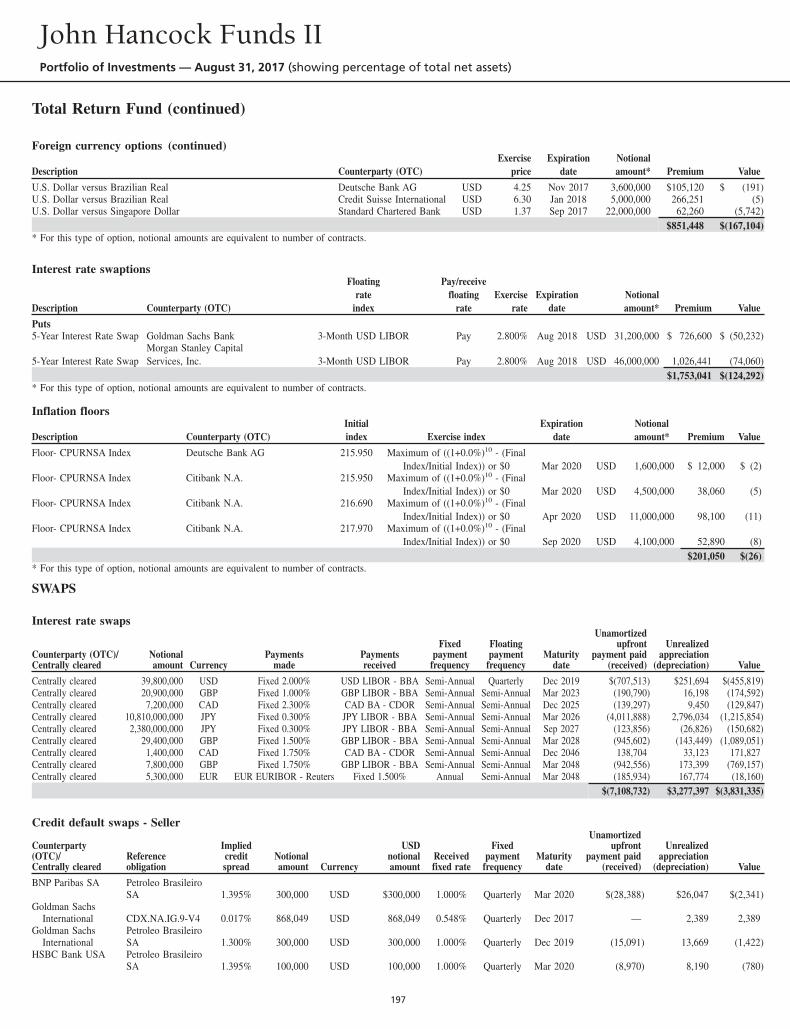
Total Return Fund (continued)
Foreign currency options (continued)
Description Counterparty (OTC)Exercise
priceExpiration
dateNotionalamount* Premium Value
U.S. Dollar versus Brazilian Real Deutsche Bank AG USD 4.25 Nov 2017 3,600,000 $105,120 $ (191)U.S. Dollar versus Brazilian Real Credit Suisse International USD 6.30 Jan 2018 5,000,000 266,251 (5)U.S. Dollar versus Singapore Dollar Standard Chartered Bank USD 1.37 Sep 2017 22,000,000 62,260 (5,742)
$851,448 $(167,104)* For this type of option, notional amounts are equivalent to number of contracts.
Interest rate swaptions
Description Counterparty (OTC)
Floatingrate
index
Pay/receivefloating
rateExercise
rateExpiration
dateNotionalamount* Premium Value
Puts5-Year Interest Rate Swap Goldman Sachs Bank 3-Month USD LIBOR Pay 2.800% Aug 2018 USD 31,200,000 $ 726,600 $ (50,232)
5-Year Interest Rate SwapMorgan Stanley CapitalServices, Inc. 3-Month USD LIBOR Pay 2.800% Aug 2018 USD 46,000,000 1,026,441 (74,060)
$1,753,041 $(124,292)* For this type of option, notional amounts are equivalent to number of contracts.
Inflation floors
Description Counterparty (OTC)Initialindex Exercise index
Expirationdate
Notionalamount* Premium Value
Floor- CPURNSA Index Deutsche Bank AG 215.950 Maximum of ((1+0.0%)10 - (FinalIndex/Initial Index)) or $0 Mar 2020 USD 1,600,000 $ 12,000 $ (2)
Floor- CPURNSA Index Citibank N.A. 215.950 Maximum of ((1+0.0%)10 - (FinalIndex/Initial Index)) or $0 Mar 2020 USD 4,500,000 38,060 (5)
Floor- CPURNSA Index Citibank N.A. 216.690 Maximum of ((1+0.0%)10 - (FinalIndex/Initial Index)) or $0 Apr 2020 USD 11,000,000 98,100 (11)
Floor- CPURNSA Index Citibank N.A. 217.970 Maximum of ((1+0.0%)10 - (FinalIndex/Initial Index)) or $0 Sep 2020 USD 4,100,000 52,890 (8)
$201,050 $(26)* For this type of option, notional amounts are equivalent to number of contracts.
SWAPS
Interest rate swaps
Counterparty (OTC)/Centrally cleared
Notionalamount Currency
Paymentsmade
Paymentsreceived
Fixedpayment
frequency
Floatingpayment
frequencyMaturity
date
Unamortizedupfront
payment paid(received)
Unrealizedappreciation
(depreciation) Value
Centrally cleared 39,800,000 USD Fixed 2.000% USD LIBOR - BBA Semi-Annual Quarterly Dec 2019 $(707,513) $251,694 $(455,819)Centrally cleared 20,900,000 GBP Fixed 1.000% GBP LIBOR - BBA Semi-Annual Semi-Annual Mar 2023 (190,790) 16,198 (174,592)Centrally cleared 7,200,000 CAD Fixed 2.300% CAD BA - CDOR Semi-Annual Semi-Annual Dec 2025 (139,297) 9,450 (129,847)Centrally cleared 10,810,000,000 JPY Fixed 0.300% JPY LIBOR - BBA Semi-Annual Semi-Annual Mar 2026 (4,011,888) 2,796,034 (1,215,854)Centrally cleared 2,380,000,000 JPY Fixed 0.300% JPY LIBOR - BBA Semi-Annual Semi-Annual Sep 2027 (123,856) (26,826) (150,682)Centrally cleared 29,400,000 GBP Fixed 1.500% GBP LIBOR - BBA Semi-Annual Semi-Annual Mar 2028 (945,602) (143,449) (1,089,051)Centrally cleared 1,400,000 CAD Fixed 1.750% CAD BA - CDOR Semi-Annual Semi-Annual Dec 2046 138,704 33,123 171,827Centrally cleared 7,800,000 GBP Fixed 1.750% GBP LIBOR - BBA Semi-Annual Semi-Annual Mar 2048 (942,556) 173,399 (769,157)Centrally cleared 5,300,000 EUR EUR EURIBOR - Reuters Fixed 1.500% Annual Semi-Annual Mar 2048 (185,934) 167,774 (18,160)
$(7,108,732) $3,277,397 $(3,831,335)
Credit default swaps - Seller
Counterparty(OTC)/Centrally cleared
Referenceobligation
Impliedcreditspread
Notionalamount Currency
USDnotionalamount
Receivedfixed rate
Fixedpayment
frequencyMaturity
date
Unamortizedupfront
payment paid(received)
Unrealizedappreciation
(depreciation) Value
BNP Paribas SA Petroleo BrasileiroSA 1.395% 300,000 USD $300,000 1.000% Quarterly Mar 2020 $(28,388) $26,047 $(2,341)
Goldman SachsInternational CDX.NA.IG.9-V4 0.017% 868,049 USD 868,049 0.548% Quarterly Dec 2017 — 2,389 2,389
Goldman SachsInternational
Petroleo BrasileiroSA 1.300% 300,000 USD 300,000 1.000% Quarterly Dec 2019 (15,091) 13,669 (1,422)
HSBC Bank USA Petroleo BrasileiroSA 1.395% 100,000 USD 100,000 1.000% Quarterly Mar 2020 (8,970) 8,190 (780)
John Hancock Funds IIPortfolio of Investments — August 31, 2017 (showing percentage of total net assets)
197
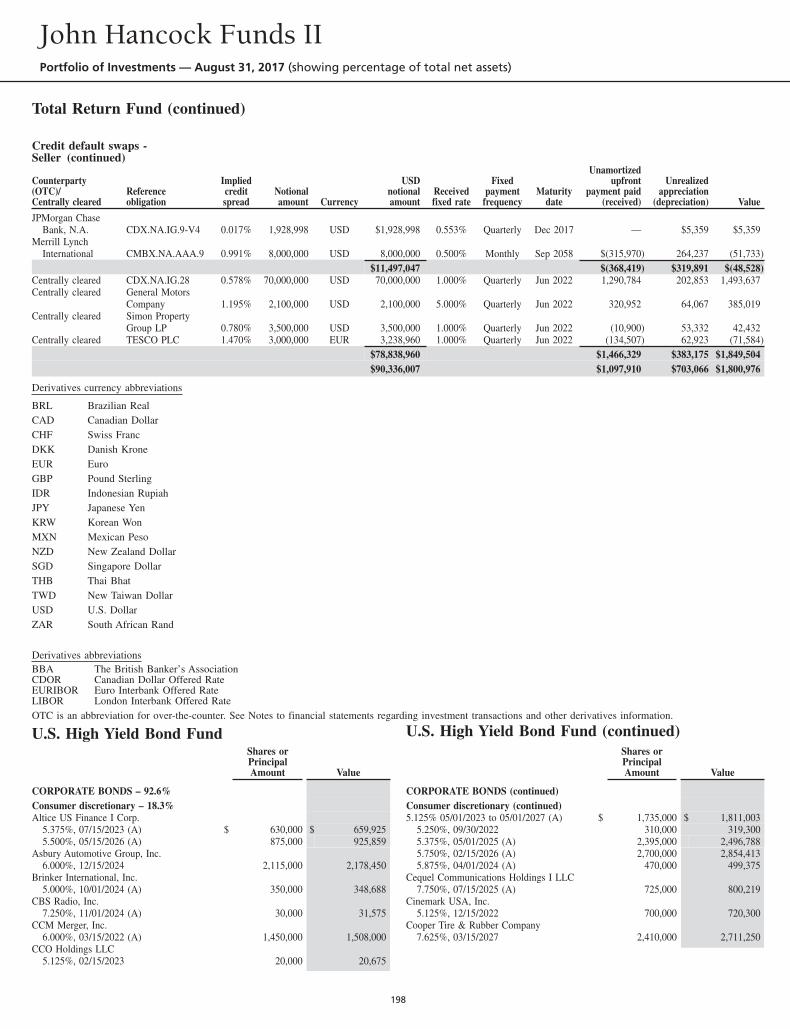
Total Return Fund (continued)
Credit default swaps -Seller (continued)
Counterparty(OTC)/Centrally cleared
Referenceobligation
Impliedcreditspread
Notionalamount Currency
USDnotionalamount
Receivedfixed rate
Fixedpayment
frequencyMaturity
date
Unamortizedupfront
payment paid(received)
Unrealizedappreciation
(depreciation) Value
JPMorgan ChaseBank, N.A. CDX.NA.IG.9-V4 0.017% 1,928,998 USD $1,928,998 0.553% Quarterly Dec 2017 — $5,359 $5,359
Merrill LynchInternational CMBX.NA.AAA.9 0.991% 8,000,000 USD 8,000,000 0.500% Monthly Sep 2058 $(315,970) 264,237 (51,733)
$11,497,047 $(368,419) $319,891 $(48,528)Centrally cleared CDX.NA.IG.28 0.578% 70,000,000 USD 70,000,000 1.000% Quarterly Jun 2022 1,290,784 202,853 1,493,637Centrally cleared General Motors
Company 1.195% 2,100,000 USD 2,100,000 5.000% Quarterly Jun 2022 320,952 64,067 385,019Centrally cleared Simon Property
Group LP 0.780% 3,500,000 USD 3,500,000 1.000% Quarterly Jun 2022 (10,900) 53,332 42,432Centrally cleared TESCO PLC 1.470% 3,000,000 EUR 3,238,960 1.000% Quarterly Jun 2022 (134,507) 62,923 (71,584)
$78,838,960 $1,466,329 $383,175 $1,849,504$90,336,007 $1,097,910 $703,066 $1,800,976
Derivatives currency abbreviations
BRL Brazilian RealCAD Canadian DollarCHF Swiss FrancDKK Danish KroneEUR EuroGBP Pound SterlingIDR Indonesian RupiahJPY Japanese YenKRW Korean WonMXN Mexican PesoNZD New Zealand DollarSGD Singapore DollarTHB Thai BhatTWD New Taiwan DollarUSD U.S. DollarZAR South African Rand
Derivatives abbreviationsBBA The British Banker’s AssociationCDOR Canadian Dollar Offered RateEURIBOR Euro Interbank Offered RateLIBOR London Interbank Offered RateOTC is an abbreviation for over-the-counter. See Notes to financial statements regarding investment transactions and other derivatives information.
U.S. High Yield Bond FundShares orPrincipalAmount Value
CORPORATE BONDS – 92.6%Consumer discretionary – 18.3%Altice US Finance I Corp.
5.375%, 07/15/2023 (A) $ 630,000 $ 659,9255.500%, 05/15/2026 (A) 875,000 925,859
Asbury Automotive Group, Inc.6.000%, 12/15/2024 2,115,000 2,178,450
Brinker International, Inc.5.000%, 10/01/2024 (A) 350,000 348,688
CBS Radio, Inc.7.250%, 11/01/2024 (A) 30,000 31,575
CCM Merger, Inc.6.000%, 03/15/2022 (A) 1,450,000 1,508,000
CCO Holdings LLC5.125%, 02/15/2023 20,000 20,675
U.S. High Yield Bond Fund (continued)Shares orPrincipalAmount Value
CORPORATE BONDS (continued)Consumer discretionary (continued)5.125% 05/01/2023 to 05/01/2027 (A) $ 1,735,000 $ 1,811,003
5.250%, 09/30/2022 310,000 319,3005.375%, 05/01/2025 (A) 2,395,000 2,496,7885.750%, 02/15/2026 (A) 2,700,000 2,854,4135.875%, 04/01/2024 (A) 470,000 499,375
Cequel Communications Holdings I LLC7.750%, 07/15/2025 (A) 725,000 800,219
Cinemark USA, Inc.5.125%, 12/15/2022 700,000 720,300
Cooper Tire & Rubber Company7.625%, 03/15/2027 2,410,000 2,711,250
John Hancock Funds IIPortfolio of Investments — August 31, 2017 (showing percentage of total net assets)
198
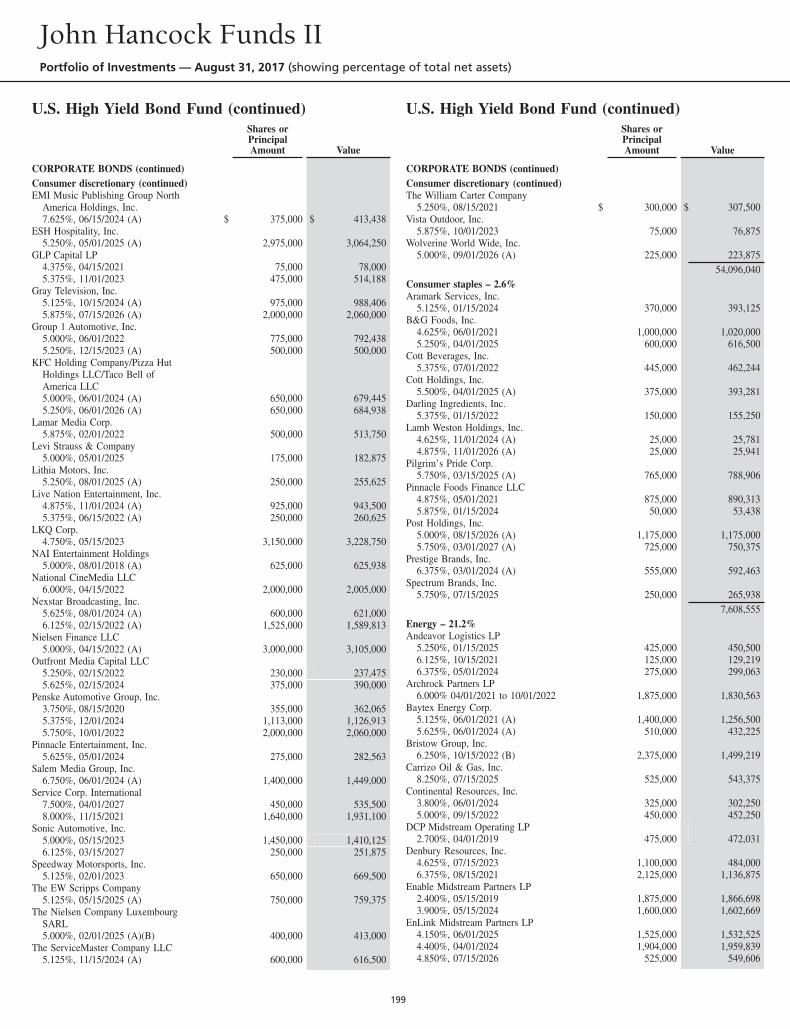
U.S. High Yield Bond Fund (continued)Shares orPrincipalAmount Value
CORPORATE BONDS (continued)Consumer discretionary (continued)EMI Music Publishing Group North
America Holdings, Inc.7.625%, 06/15/2024 (A) $ 375,000 $ 413,438
ESH Hospitality, Inc.5.250%, 05/01/2025 (A) 2,975,000 3,064,250
GLP Capital LP4.375%, 04/15/2021 75,000 78,0005.375%, 11/01/2023 475,000 514,188
Gray Television, Inc.5.125%, 10/15/2024 (A) 975,000 988,4065.875%, 07/15/2026 (A) 2,000,000 2,060,000
Group 1 Automotive, Inc.5.000%, 06/01/2022 775,000 792,4385.250%, 12/15/2023 (A) 500,000 500,000
KFC Holding Company/Pizza HutHoldings LLC/Taco Bell ofAmerica LLC5.000%, 06/01/2024 (A) 650,000 679,4455.250%, 06/01/2026 (A) 650,000 684,938
Lamar Media Corp.5.875%, 02/01/2022 500,000 513,750
Levi Strauss & Company5.000%, 05/01/2025 175,000 182,875
Lithia Motors, Inc.5.250%, 08/01/2025 (A) 250,000 255,625
Live Nation Entertainment, Inc.4.875%, 11/01/2024 (A) 925,000 943,5005.375%, 06/15/2022 (A) 250,000 260,625
LKQ Corp.4.750%, 05/15/2023 3,150,000 3,228,750
NAI Entertainment Holdings5.000%, 08/01/2018 (A) 625,000 625,938
National CineMedia LLC6.000%, 04/15/2022 2,000,000 2,005,000
Nexstar Broadcasting, Inc.5.625%, 08/01/2024 (A) 600,000 621,0006.125%, 02/15/2022 (A) 1,525,000 1,589,813
Nielsen Finance LLC5.000%, 04/15/2022 (A) 3,000,000 3,105,000
Outfront Media Capital LLC5.250%, 02/15/2022 230,000 237,4755.625%, 02/15/2024 375,000 390,000
Penske Automotive Group, Inc.3.750%, 08/15/2020 355,000 362,0655.375%, 12/01/2024 1,113,000 1,126,9135.750%, 10/01/2022 2,000,000 2,060,000
Pinnacle Entertainment, Inc.5.625%, 05/01/2024 275,000 282,563
Salem Media Group, Inc.6.750%, 06/01/2024 (A) 1,400,000 1,449,000
Service Corp. International7.500%, 04/01/2027 450,000 535,5008.000%, 11/15/2021 1,640,000 1,931,100
Sonic Automotive, Inc.5.000%, 05/15/2023 1,450,000 1,410,1256.125%, 03/15/2027 250,000 251,875
Speedway Motorsports, Inc.5.125%, 02/01/2023 650,000 669,500
The EW Scripps Company5.125%, 05/15/2025 (A) 750,000 759,375
The Nielsen Company LuxembourgSARL5.000%, 02/01/2025 (A)(B) 400,000 413,000
The ServiceMaster Company LLC5.125%, 11/15/2024 (A) 600,000 616,500
U.S. High Yield Bond Fund (continued)Shares orPrincipalAmount Value
CORPORATE BONDS (continued)Consumer discretionary (continued)The William Carter Company
5.250%, 08/15/2021 $ 300,000 $ 307,500Vista Outdoor, Inc.
5.875%, 10/01/2023 75,000 76,875Wolverine World Wide, Inc.
5.000%, 09/01/2026 (A) 225,000 223,87554,096,040
Consumer staples – 2.6%Aramark Services, Inc.
5.125%, 01/15/2024 370,000 393,125B&G Foods, Inc.
4.625%, 06/01/2021 1,000,000 1,020,0005.250%, 04/01/2025 600,000 616,500
Cott Beverages, Inc.5.375%, 07/01/2022 445,000 462,244
Cott Holdings, Inc.5.500%, 04/01/2025 (A) 375,000 393,281
Darling Ingredients, Inc.5.375%, 01/15/2022 150,000 155,250
Lamb Weston Holdings, Inc.4.625%, 11/01/2024 (A) 25,000 25,7814.875%, 11/01/2026 (A) 25,000 25,941
Pilgrim’s Pride Corp.5.750%, 03/15/2025 (A) 765,000 788,906
Pinnacle Foods Finance LLC4.875%, 05/01/2021 875,000 890,3135.875%, 01/15/2024 50,000 53,438
Post Holdings, Inc.5.000%, 08/15/2026 (A) 1,175,000 1,175,0005.750%, 03/01/2027 (A) 725,000 750,375
Prestige Brands, Inc.6.375%, 03/01/2024 (A) 555,000 592,463
Spectrum Brands, Inc.5.750%, 07/15/2025 250,000 265,938
7,608,555Energy – 21.2%Andeavor Logistics LP
5.250%, 01/15/2025 425,000 450,5006.125%, 10/15/2021 125,000 129,2196.375%, 05/01/2024 275,000 299,063
Archrock Partners LP6.000% 04/01/2021 to 10/01/2022 1,875,000 1,830,563
Baytex Energy Corp.5.125%, 06/01/2021 (A) 1,400,000 1,256,5005.625%, 06/01/2024 (A) 510,000 432,225
Bristow Group, Inc.6.250%, 10/15/2022 (B) 2,375,000 1,499,219
Carrizo Oil & Gas, Inc.8.250%, 07/15/2025 525,000 543,375
Continental Resources, Inc.3.800%, 06/01/2024 325,000 302,2505.000%, 09/15/2022 450,000 452,250
DCP Midstream Operating LP2.700%, 04/01/2019 475,000 472,031
Denbury Resources, Inc.4.625%, 07/15/2023 1,100,000 484,0006.375%, 08/15/2021 2,125,000 1,136,875
Enable Midstream Partners LP2.400%, 05/15/2019 1,875,000 1,866,6983.900%, 05/15/2024 1,600,000 1,602,669
EnLink Midstream Partners LP4.150%, 06/01/2025 1,525,000 1,532,5254.400%, 04/01/2024 1,904,000 1,959,8394.850%, 07/15/2026 525,000 549,606
John Hancock Funds IIPortfolio of Investments — August 31, 2017 (showing percentage of total net assets)
199
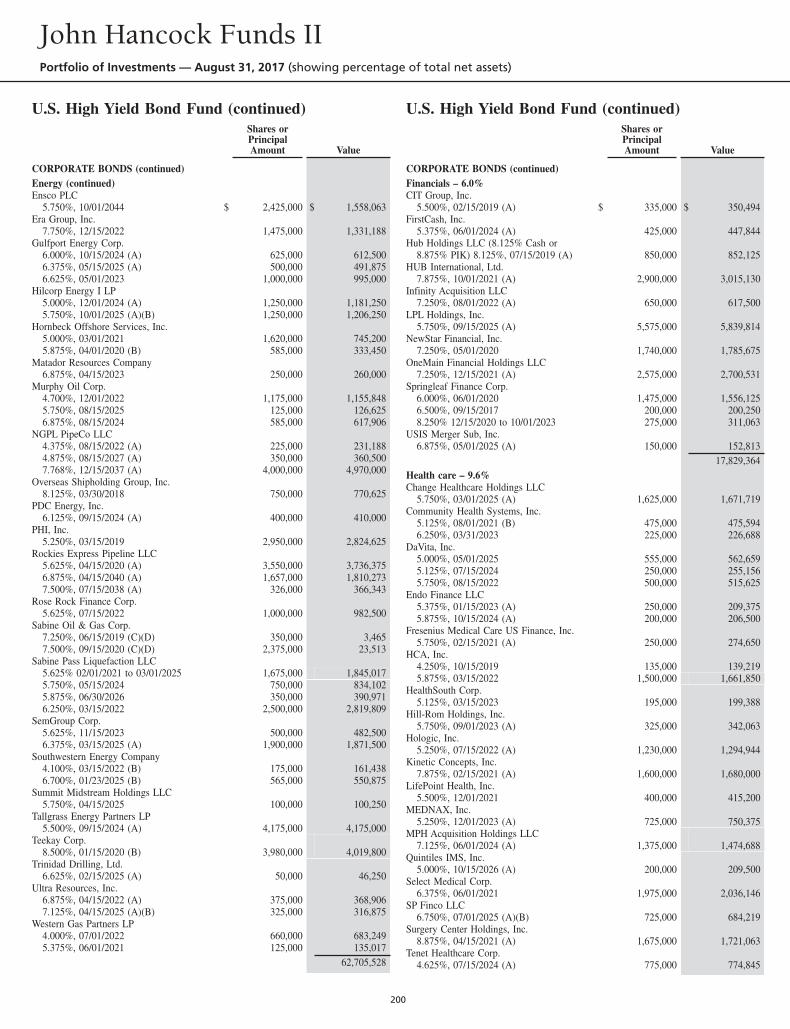
U.S. High Yield Bond Fund (continued)Shares orPrincipalAmount Value
CORPORATE BONDS (continued)Energy (continued)Ensco PLC
5.750%, 10/01/2044 $ 2,425,000 $ 1,558,063Era Group, Inc.
7.750%, 12/15/2022 1,475,000 1,331,188Gulfport Energy Corp.
6.000%, 10/15/2024 (A) 625,000 612,5006.375%, 05/15/2025 (A) 500,000 491,8756.625%, 05/01/2023 1,000,000 995,000
Hilcorp Energy I LP5.000%, 12/01/2024 (A) 1,250,000 1,181,2505.750%, 10/01/2025 (A)(B) 1,250,000 1,206,250
Hornbeck Offshore Services, Inc.5.000%, 03/01/2021 1,620,000 745,2005.875%, 04/01/2020 (B) 585,000 333,450
Matador Resources Company6.875%, 04/15/2023 250,000 260,000
Murphy Oil Corp.4.700%, 12/01/2022 1,175,000 1,155,8485.750%, 08/15/2025 125,000 126,6256.875%, 08/15/2024 585,000 617,906
NGPL PipeCo LLC4.375%, 08/15/2022 (A) 225,000 231,1884.875%, 08/15/2027 (A) 350,000 360,5007.768%, 12/15/2037 (A) 4,000,000 4,970,000
Overseas Shipholding Group, Inc.8.125%, 03/30/2018 750,000 770,625
PDC Energy, Inc.6.125%, 09/15/2024 (A) 400,000 410,000
PHI, Inc.5.250%, 03/15/2019 2,950,000 2,824,625
Rockies Express Pipeline LLC5.625%, 04/15/2020 (A) 3,550,000 3,736,3756.875%, 04/15/2040 (A) 1,657,000 1,810,2737.500%, 07/15/2038 (A) 326,000 366,343
Rose Rock Finance Corp.5.625%, 07/15/2022 1,000,000 982,500
Sabine Oil & Gas Corp.7.250%, 06/15/2019 (C)(D) 350,000 3,4657.500%, 09/15/2020 (C)(D) 2,375,000 23,513
Sabine Pass Liquefaction LLC5.625% 02/01/2021 to 03/01/2025 1,675,000 1,845,0175.750%, 05/15/2024 750,000 834,1025.875%, 06/30/2026 350,000 390,9716.250%, 03/15/2022 2,500,000 2,819,809
SemGroup Corp.5.625%, 11/15/2023 500,000 482,5006.375%, 03/15/2025 (A) 1,900,000 1,871,500
Southwestern Energy Company4.100%, 03/15/2022 (B) 175,000 161,4386.700%, 01/23/2025 (B) 565,000 550,875
Summit Midstream Holdings LLC5.750%, 04/15/2025 100,000 100,250
Tallgrass Energy Partners LP5.500%, 09/15/2024 (A) 4,175,000 4,175,000
Teekay Corp.8.500%, 01/15/2020 (B) 3,980,000 4,019,800
Trinidad Drilling, Ltd.6.625%, 02/15/2025 (A) 50,000 46,250
Ultra Resources, Inc.6.875%, 04/15/2022 (A) 375,000 368,9067.125%, 04/15/2025 (A)(B) 325,000 316,875
Western Gas Partners LP4.000%, 07/01/2022 660,000 683,2495.375%, 06/01/2021 125,000 135,017
62,705,528
U.S. High Yield Bond Fund (continued)Shares orPrincipalAmount Value
CORPORATE BONDS (continued)Financials – 6.0%CIT Group, Inc.
5.500%, 02/15/2019 (A) $ 335,000 $ 350,494FirstCash, Inc.
5.375%, 06/01/2024 (A) 425,000 447,844Hub Holdings LLC (8.125% Cash or
8.875% PIK) 8.125%, 07/15/2019 (A) 850,000 852,125HUB International, Ltd.
7.875%, 10/01/2021 (A) 2,900,000 3,015,130Infinity Acquisition LLC
7.250%, 08/01/2022 (A) 650,000 617,500LPL Holdings, Inc.
5.750%, 09/15/2025 (A) 5,575,000 5,839,814NewStar Financial, Inc.
7.250%, 05/01/2020 1,740,000 1,785,675OneMain Financial Holdings LLC
7.250%, 12/15/2021 (A) 2,575,000 2,700,531Springleaf Finance Corp.
6.000%, 06/01/2020 1,475,000 1,556,1256.500%, 09/15/2017 200,000 200,2508.250% 12/15/2020 to 10/01/2023 275,000 311,063
USIS Merger Sub, Inc.6.875%, 05/01/2025 (A) 150,000 152,813
17,829,364Health care – 9.6%Change Healthcare Holdings LLC
5.750%, 03/01/2025 (A) 1,625,000 1,671,719Community Health Systems, Inc.
5.125%, 08/01/2021 (B) 475,000 475,5946.250%, 03/31/2023 225,000 226,688
DaVita, Inc.5.000%, 05/01/2025 555,000 562,6595.125%, 07/15/2024 250,000 255,1565.750%, 08/15/2022 500,000 515,625
Endo Finance LLC5.375%, 01/15/2023 (A) 250,000 209,3755.875%, 10/15/2024 (A) 200,000 206,500
Fresenius Medical Care US Finance, Inc.5.750%, 02/15/2021 (A) 250,000 274,650
HCA, Inc.4.250%, 10/15/2019 135,000 139,2195.875%, 03/15/2022 1,500,000 1,661,850
HealthSouth Corp.5.125%, 03/15/2023 195,000 199,388
Hill-Rom Holdings, Inc.5.750%, 09/01/2023 (A) 325,000 342,063
Hologic, Inc.5.250%, 07/15/2022 (A) 1,230,000 1,294,944
Kinetic Concepts, Inc.7.875%, 02/15/2021 (A) 1,600,000 1,680,000
LifePoint Health, Inc.5.500%, 12/01/2021 400,000 415,200
MEDNAX, Inc.5.250%, 12/01/2023 (A) 725,000 750,375
MPH Acquisition Holdings LLC7.125%, 06/01/2024 (A) 1,375,000 1,474,688
Quintiles IMS, Inc.5.000%, 10/15/2026 (A) 200,000 209,500
Select Medical Corp.6.375%, 06/01/2021 1,975,000 2,036,146
SP Finco LLC6.750%, 07/01/2025 (A)(B) 725,000 684,219
Surgery Center Holdings, Inc.8.875%, 04/15/2021 (A) 1,675,000 1,721,063
Tenet Healthcare Corp.4.625%, 07/15/2024 (A) 775,000 774,845
John Hancock Funds IIPortfolio of Investments — August 31, 2017 (showing percentage of total net assets)
200
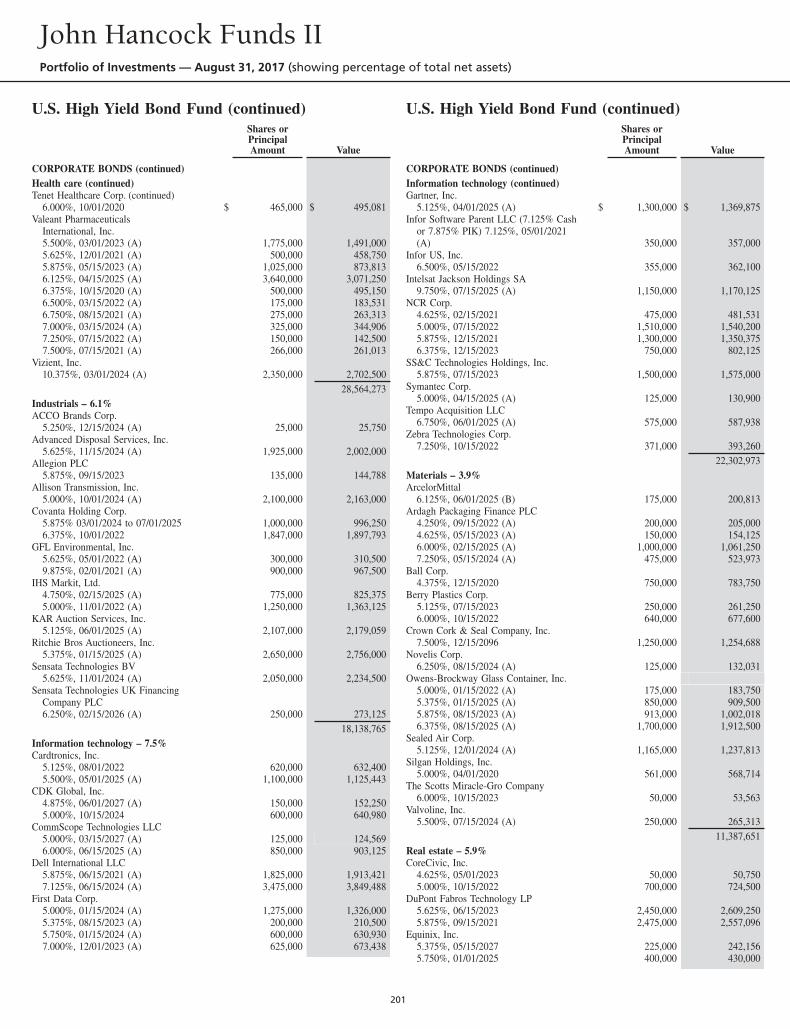
U.S. High Yield Bond Fund (continued)Shares orPrincipalAmount Value
CORPORATE BONDS (continued)Health care (continued)Tenet Healthcare Corp. (continued)
6.000%, 10/01/2020 $ 465,000 $ 495,081Valeant Pharmaceuticals
International, Inc.5.500%, 03/01/2023 (A) 1,775,000 1,491,0005.625%, 12/01/2021 (A) 500,000 458,7505.875%, 05/15/2023 (A) 1,025,000 873,8136.125%, 04/15/2025 (A) 3,640,000 3,071,2506.375%, 10/15/2020 (A) 500,000 495,1506.500%, 03/15/2022 (A) 175,000 183,5316.750%, 08/15/2021 (A) 275,000 263,3137.000%, 03/15/2024 (A) 325,000 344,9067.250%, 07/15/2022 (A) 150,000 142,5007.500%, 07/15/2021 (A) 266,000 261,013
Vizient, Inc.10.375%, 03/01/2024 (A) 2,350,000 2,702,500
28,564,273Industrials – 6.1%ACCO Brands Corp.
5.250%, 12/15/2024 (A) 25,000 25,750Advanced Disposal Services, Inc.
5.625%, 11/15/2024 (A) 1,925,000 2,002,000Allegion PLC
5.875%, 09/15/2023 135,000 144,788Allison Transmission, Inc.
5.000%, 10/01/2024 (A) 2,100,000 2,163,000Covanta Holding Corp.
5.875% 03/01/2024 to 07/01/2025 1,000,000 996,2506.375%, 10/01/2022 1,847,000 1,897,793
GFL Environmental, Inc.5.625%, 05/01/2022 (A) 300,000 310,5009.875%, 02/01/2021 (A) 900,000 967,500
IHS Markit, Ltd.4.750%, 02/15/2025 (A) 775,000 825,3755.000%, 11/01/2022 (A) 1,250,000 1,363,125
KAR Auction Services, Inc.5.125%, 06/01/2025 (A) 2,107,000 2,179,059
Ritchie Bros Auctioneers, Inc.5.375%, 01/15/2025 (A) 2,650,000 2,756,000
Sensata Technologies BV5.625%, 11/01/2024 (A) 2,050,000 2,234,500
Sensata Technologies UK FinancingCompany PLC6.250%, 02/15/2026 (A) 250,000 273,125
18,138,765Information technology – 7.5%Cardtronics, Inc.
5.125%, 08/01/2022 620,000 632,4005.500%, 05/01/2025 (A) 1,100,000 1,125,443
CDK Global, Inc.4.875%, 06/01/2027 (A) 150,000 152,2505.000%, 10/15/2024 600,000 640,980
CommScope Technologies LLC5.000%, 03/15/2027 (A) 125,000 124,5696.000%, 06/15/2025 (A) 850,000 903,125
Dell International LLC5.875%, 06/15/2021 (A) 1,825,000 1,913,4217.125%, 06/15/2024 (A) 3,475,000 3,849,488
First Data Corp.5.000%, 01/15/2024 (A) 1,275,000 1,326,0005.375%, 08/15/2023 (A) 200,000 210,5005.750%, 01/15/2024 (A) 600,000 630,9307.000%, 12/01/2023 (A) 625,000 673,438
U.S. High Yield Bond Fund (continued)Shares orPrincipalAmount Value
CORPORATE BONDS (continued)Information technology (continued)Gartner, Inc.
5.125%, 04/01/2025 (A) $ 1,300,000 $ 1,369,875Infor Software Parent LLC (7.125% Cash
or 7.875% PIK) 7.125%, 05/01/2021(A) 350,000 357,000
Infor US, Inc.6.500%, 05/15/2022 355,000 362,100
Intelsat Jackson Holdings SA9.750%, 07/15/2025 (A) 1,150,000 1,170,125
NCR Corp.4.625%, 02/15/2021 475,000 481,5315.000%, 07/15/2022 1,510,000 1,540,2005.875%, 12/15/2021 1,300,000 1,350,3756.375%, 12/15/2023 750,000 802,125
SS&C Technologies Holdings, Inc.5.875%, 07/15/2023 1,500,000 1,575,000
Symantec Corp.5.000%, 04/15/2025 (A) 125,000 130,900
Tempo Acquisition LLC6.750%, 06/01/2025 (A) 575,000 587,938
Zebra Technologies Corp.7.250%, 10/15/2022 371,000 393,260
22,302,973Materials – 3.9%ArcelorMittal
6.125%, 06/01/2025 (B) 175,000 200,813Ardagh Packaging Finance PLC
4.250%, 09/15/2022 (A) 200,000 205,0004.625%, 05/15/2023 (A) 150,000 154,1256.000%, 02/15/2025 (A) 1,000,000 1,061,2507.250%, 05/15/2024 (A) 475,000 523,973
Ball Corp.4.375%, 12/15/2020 750,000 783,750
Berry Plastics Corp.5.125%, 07/15/2023 250,000 261,2506.000%, 10/15/2022 640,000 677,600
Crown Cork & Seal Company, Inc.7.500%, 12/15/2096 1,250,000 1,254,688
Novelis Corp.6.250%, 08/15/2024 (A) 125,000 132,031
Owens-Brockway Glass Container, Inc.5.000%, 01/15/2022 (A) 175,000 183,7505.375%, 01/15/2025 (A) 850,000 909,5005.875%, 08/15/2023 (A) 913,000 1,002,0186.375%, 08/15/2025 (A) 1,700,000 1,912,500
Sealed Air Corp.5.125%, 12/01/2024 (A) 1,165,000 1,237,813
Silgan Holdings, Inc.5.000%, 04/01/2020 561,000 568,714
The Scotts Miracle-Gro Company6.000%, 10/15/2023 50,000 53,563
Valvoline, Inc.5.500%, 07/15/2024 (A) 250,000 265,313
11,387,651Real estate – 5.9%CoreCivic, Inc.
4.625%, 05/01/2023 50,000 50,7505.000%, 10/15/2022 700,000 724,500
DuPont Fabros Technology LP5.625%, 06/15/2023 2,450,000 2,609,2505.875%, 09/15/2021 2,475,000 2,557,096
Equinix, Inc.5.375%, 05/15/2027 225,000 242,1565.750%, 01/01/2025 400,000 430,000
John Hancock Funds IIPortfolio of Investments — August 31, 2017 (showing percentage of total net assets)
201
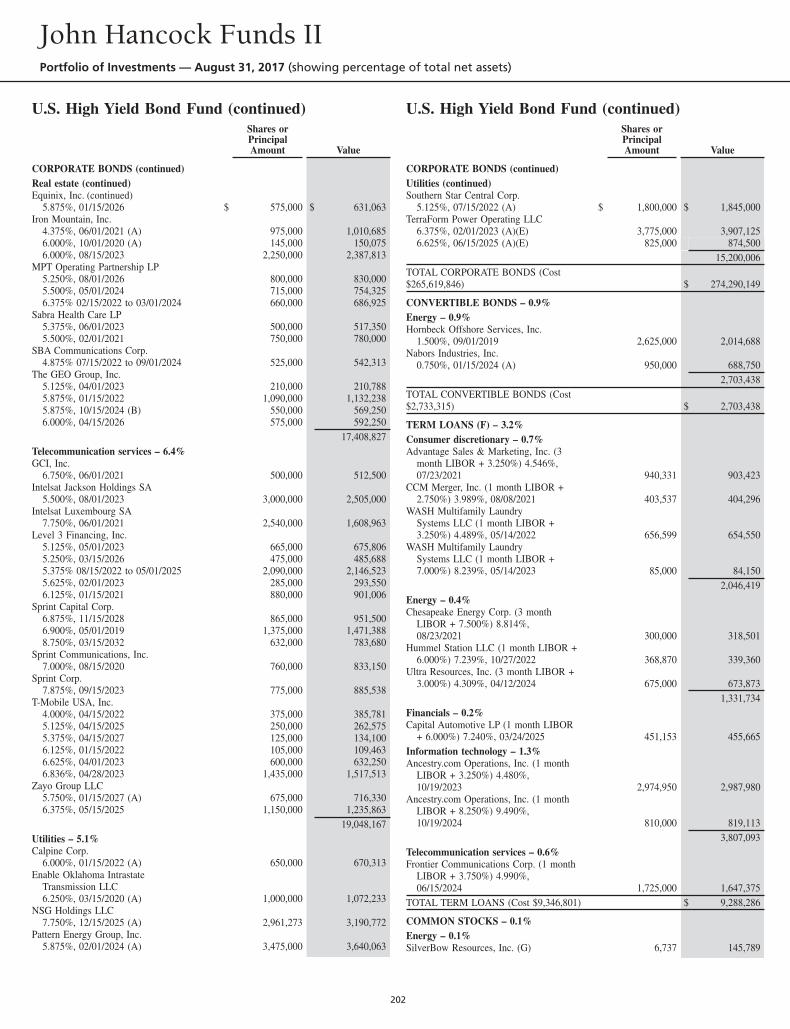
U.S. High Yield Bond Fund (continued)Shares orPrincipalAmount Value
CORPORATE BONDS (continued)Real estate (continued)Equinix, Inc. (continued)
5.875%, 01/15/2026 $ 575,000 $ 631,063Iron Mountain, Inc.
4.375%, 06/01/2021 (A) 975,000 1,010,6856.000%, 10/01/2020 (A) 145,000 150,0756.000%, 08/15/2023 2,250,000 2,387,813
MPT Operating Partnership LP5.250%, 08/01/2026 800,000 830,0005.500%, 05/01/2024 715,000 754,3256.375% 02/15/2022 to 03/01/2024 660,000 686,925
Sabra Health Care LP5.375%, 06/01/2023 500,000 517,3505.500%, 02/01/2021 750,000 780,000
SBA Communications Corp.4.875% 07/15/2022 to 09/01/2024 525,000 542,313
The GEO Group, Inc.5.125%, 04/01/2023 210,000 210,7885.875%, 01/15/2022 1,090,000 1,132,2385.875%, 10/15/2024 (B) 550,000 569,2506.000%, 04/15/2026 575,000 592,250
17,408,827Telecommunication services – 6.4%GCI, Inc.
6.750%, 06/01/2021 500,000 512,500Intelsat Jackson Holdings SA
5.500%, 08/01/2023 3,000,000 2,505,000Intelsat Luxembourg SA
7.750%, 06/01/2021 2,540,000 1,608,963Level 3 Financing, Inc.
5.125%, 05/01/2023 665,000 675,8065.250%, 03/15/2026 475,000 485,6885.375% 08/15/2022 to 05/01/2025 2,090,000 2,146,5235.625%, 02/01/2023 285,000 293,5506.125%, 01/15/2021 880,000 901,006
Sprint Capital Corp.6.875%, 11/15/2028 865,000 951,5006.900%, 05/01/2019 1,375,000 1,471,3888.750%, 03/15/2032 632,000 783,680
Sprint Communications, Inc.7.000%, 08/15/2020 760,000 833,150
Sprint Corp.7.875%, 09/15/2023 775,000 885,538
T-Mobile USA, Inc.4.000%, 04/15/2022 375,000 385,7815.125%, 04/15/2025 250,000 262,5755.375%, 04/15/2027 125,000 134,1006.125%, 01/15/2022 105,000 109,4636.625%, 04/01/2023 600,000 632,2506.836%, 04/28/2023 1,435,000 1,517,513
Zayo Group LLC5.750%, 01/15/2027 (A) 675,000 716,3306.375%, 05/15/2025 1,150,000 1,235,863
19,048,167Utilities – 5.1%Calpine Corp.
6.000%, 01/15/2022 (A) 650,000 670,313Enable Oklahoma Intrastate
Transmission LLC6.250%, 03/15/2020 (A) 1,000,000 1,072,233
NSG Holdings LLC7.750%, 12/15/2025 (A) 2,961,273 3,190,772
Pattern Energy Group, Inc.5.875%, 02/01/2024 (A) 3,475,000 3,640,063
U.S. High Yield Bond Fund (continued)Shares orPrincipalAmount Value
CORPORATE BONDS (continued)Utilities (continued)Southern Star Central Corp.
5.125%, 07/15/2022 (A) $ 1,800,000 $ 1,845,000TerraForm Power Operating LLC
6.375%, 02/01/2023 (A)(E) 3,775,000 3,907,1256.625%, 06/15/2025 (A)(E) 825,000 874,500
15,200,006TOTAL CORPORATE BONDS (Cost$265,619,846) $ 274,290,149
CONVERTIBLE BONDS – 0.9%Energy – 0.9%Hornbeck Offshore Services, Inc.
1.500%, 09/01/2019 2,625,000 2,014,688Nabors Industries, Inc.
0.750%, 01/15/2024 (A) 950,000 688,7502,703,438
TOTAL CONVERTIBLE BONDS (Cost$2,733,315) $ 2,703,438
TERM LOANS (F) – 3.2%Consumer discretionary – 0.7%Advantage Sales & Marketing, Inc. (3
month LIBOR + 3.250%) 4.546%,07/23/2021 940,331 903,423
CCM Merger, Inc. (1 month LIBOR +2.750%) 3.989%, 08/08/2021 403,537 404,296
WASH Multifamily LaundrySystems LLC (1 month LIBOR +3.250%) 4.489%, 05/14/2022 656,599 654,550
WASH Multifamily LaundrySystems LLC (1 month LIBOR +7.000%) 8.239%, 05/14/2023 85,000 84,150
2,046,419Energy – 0.4%Chesapeake Energy Corp. (3 month
LIBOR + 7.500%) 8.814%,08/23/2021 300,000 318,501
Hummel Station LLC (1 month LIBOR +6.000%) 7.239%, 10/27/2022 368,870 339,360
Ultra Resources, Inc. (3 month LIBOR +3.000%) 4.309%, 04/12/2024 675,000 673,873
1,331,734Financials – 0.2%Capital Automotive LP (1 month LIBOR
+ 6.000%) 7.240%, 03/24/2025 451,153 455,665Information technology – 1.3%Ancestry.com Operations, Inc. (1 month
LIBOR + 3.250%) 4.480%,10/19/2023 2,974,950 2,987,980
Ancestry.com Operations, Inc. (1 monthLIBOR + 8.250%) 9.490%,10/19/2024 810,000 819,113
3,807,093Telecommunication services – 0.6%Frontier Communications Corp. (1 month
LIBOR + 3.750%) 4.990%,06/15/2024 1,725,000 1,647,375
TOTAL TERM LOANS (Cost $9,346,801) $ 9,288,286
COMMON STOCKS – 0.1%Energy – 0.1%SilverBow Resources, Inc. (G) 6,737 145,789
John Hancock Funds IIPortfolio of Investments — August 31, 2017 (showing percentage of total net assets)
202
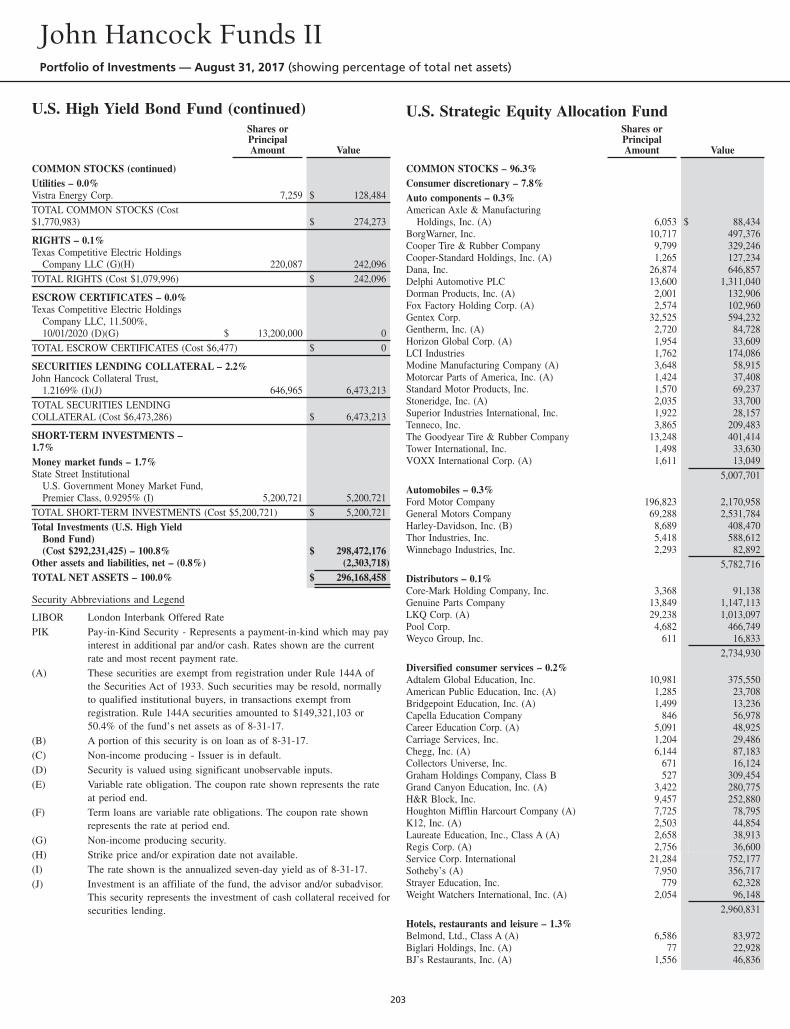
U.S. High Yield Bond Fund (continued)Shares orPrincipalAmount Value
COMMON STOCKS (continued)Utilities – 0.0%Vistra Energy Corp. 7,259 $ 128,484TOTAL COMMON STOCKS (Cost$1,770,983) $ 274,273
RIGHTS – 0.1%Texas Competitive Electric Holdings
Company LLC (G)(H) 220,087 242,096TOTAL RIGHTS (Cost $1,079,996) $ 242,096
ESCROW CERTIFICATES – 0.0%Texas Competitive Electric Holdings
Company LLC, 11.500%,10/01/2020 (D)(G) $ 13,200,000 0
TOTAL ESCROW CERTIFICATES (Cost $6,477) $ 0
SECURITIES LENDING COLLATERAL – 2.2%John Hancock Collateral Trust,
1.2169% (I)(J) 646,965 6,473,213TOTAL SECURITIES LENDINGCOLLATERAL (Cost $6,473,286) $ 6,473,213
SHORT-TERM INVESTMENTS –1.7%Money market funds – 1.7%State Street Institutional
U.S. Government Money Market Fund,Premier Class, 0.9295% (I) 5,200,721 5,200,721
TOTAL SHORT-TERM INVESTMENTS (Cost $5,200,721) $ 5,200,721Total Investments (U.S. High Yield
Bond Fund)(Cost $292,231,425) – 100.8% $ 298,472,176
Other assets and liabilities, net – (0.8%) (2,303,718)TOTAL NET ASSETS – 100.0% $ 296,168,458
Security Abbreviations and Legend
LIBOR London Interbank Offered RatePIK Pay-in-Kind Security - Represents a payment-in-kind which may pay
interest in additional par and/or cash. Rates shown are the currentrate and most recent payment rate.
(A) These securities are exempt from registration under Rule 144A ofthe Securities Act of 1933. Such securities may be resold, normallyto qualified institutional buyers, in transactions exempt fromregistration. Rule 144A securities amounted to $149,321,103 or50.4% of the fund’s net assets as of 8-31-17.
(B) A portion of this security is on loan as of 8-31-17.(C) Non-income producing - Issuer is in default.(D) Security is valued using significant unobservable inputs.(E) Variable rate obligation. The coupon rate shown represents the rate
at period end.(F) Term loans are variable rate obligations. The coupon rate shown
represents the rate at period end.(G) Non-income producing security.(H) Strike price and/or expiration date not available.(I) The rate shown is the annualized seven-day yield as of 8-31-17.(J) Investment is an affiliate of the fund, the advisor and/or subadvisor.
This security represents the investment of cash collateral received forsecurities lending.
U.S. Strategic Equity Allocation FundShares orPrincipalAmount Value
COMMON STOCKS – 96.3%Consumer discretionary – 7.8%Auto components – 0.3%American Axle & Manufacturing
Holdings, Inc. (A) 6,053 $ 88,434BorgWarner, Inc. 10,717 497,376Cooper Tire & Rubber Company 9,799 329,246Cooper-Standard Holdings, Inc. (A) 1,265 127,234Dana, Inc. 26,874 646,857Delphi Automotive PLC 13,600 1,311,040Dorman Products, Inc. (A) 2,001 132,906Fox Factory Holding Corp. (A) 2,574 102,960Gentex Corp. 32,525 594,232Gentherm, Inc. (A) 2,720 84,728Horizon Global Corp. (A) 1,954 33,609LCI Industries 1,762 174,086Modine Manufacturing Company (A) 3,648 58,915Motorcar Parts of America, Inc. (A) 1,424 37,408Standard Motor Products, Inc. 1,570 69,237Stoneridge, Inc. (A) 2,035 33,700Superior Industries International, Inc. 1,922 28,157Tenneco, Inc. 3,865 209,483The Goodyear Tire & Rubber Company 13,248 401,414Tower International, Inc. 1,498 33,630VOXX International Corp. (A) 1,611 13,049
5,007,701Automobiles – 0.3%Ford Motor Company 196,823 2,170,958General Motors Company 69,288 2,531,784Harley-Davidson, Inc. (B) 8,689 408,470Thor Industries, Inc. 5,418 588,612Winnebago Industries, Inc. 2,293 82,892
5,782,716Distributors – 0.1%Core-Mark Holding Company, Inc. 3,368 91,138Genuine Parts Company 13,849 1,147,113LKQ Corp. (A) 29,238 1,013,097Pool Corp. 4,682 466,749Weyco Group, Inc. 611 16,833
2,734,930Diversified consumer services – 0.2%Adtalem Global Education, Inc. 10,981 375,550American Public Education, Inc. (A) 1,285 23,708Bridgepoint Education, Inc. (A) 1,499 13,236Capella Education Company 846 56,978Career Education Corp. (A) 5,091 48,925Carriage Services, Inc. 1,204 29,486Chegg, Inc. (A) 6,144 87,183Collectors Universe, Inc. 671 16,124Graham Holdings Company, Class B 527 309,454Grand Canyon Education, Inc. (A) 3,422 280,775H&R Block, Inc. 9,457 252,880Houghton Mifflin Harcourt Company (A) 7,725 78,795K12, Inc. (A) 2,503 44,854Laureate Education, Inc., Class A (A) 2,658 38,913Regis Corp. (A) 2,756 36,600Service Corp. International 21,284 752,177Sotheby’s (A) 7,950 356,717Strayer Education, Inc. 779 62,328Weight Watchers International, Inc. (A) 2,054 96,148
2,960,831Hotels, restaurants and leisure – 1.3%Belmond, Ltd., Class A (A) 6,586 83,972Biglari Holdings, Inc. (A) 77 22,928BJ’s Restaurants, Inc. (A) 1,556 46,836
John Hancock Funds IIPortfolio of Investments — August 31, 2017 (showing percentage of total net assets)
203
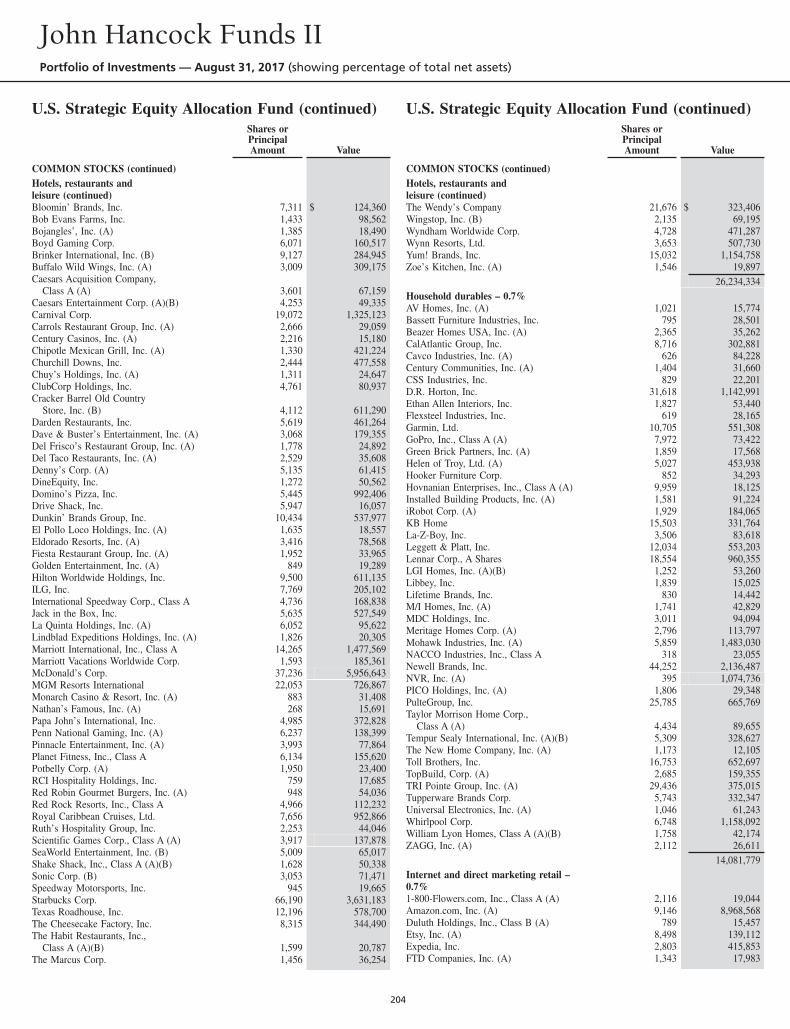
U.S. Strategic Equity Allocation Fund (continued)Shares orPrincipalAmount Value
COMMON STOCKS (continued)Hotels, restaurants andleisure (continued)Bloomin’ Brands, Inc. 7,311 $ 124,360Bob Evans Farms, Inc. 1,433 98,562Bojangles’, Inc. (A) 1,385 18,490Boyd Gaming Corp. 6,071 160,517Brinker International, Inc. (B) 9,127 284,945Buffalo Wild Wings, Inc. (A) 3,009 309,175Caesars Acquisition Company,
Class A (A) 3,601 67,159Caesars Entertainment Corp. (A)(B) 4,253 49,335Carnival Corp. 19,072 1,325,123Carrols Restaurant Group, Inc. (A) 2,666 29,059Century Casinos, Inc. (A) 2,216 15,180Chipotle Mexican Grill, Inc. (A) 1,330 421,224Churchill Downs, Inc. 2,444 477,558Chuy’s Holdings, Inc. (A) 1,311 24,647ClubCorp Holdings, Inc. 4,761 80,937Cracker Barrel Old Country
Store, Inc. (B) 4,112 611,290Darden Restaurants, Inc. 5,619 461,264Dave & Buster’s Entertainment, Inc. (A) 3,068 179,355Del Frisco’s Restaurant Group, Inc. (A) 1,778 24,892Del Taco Restaurants, Inc. (A) 2,529 35,608Denny’s Corp. (A) 5,135 61,415DineEquity, Inc. 1,272 50,562Domino’s Pizza, Inc. 5,445 992,406Drive Shack, Inc. 5,947 16,057Dunkin’ Brands Group, Inc. 10,434 537,977El Pollo Loco Holdings, Inc. (A) 1,635 18,557Eldorado Resorts, Inc. (A) 3,416 78,568Fiesta Restaurant Group, Inc. (A) 1,952 33,965Golden Entertainment, Inc. (A) 849 19,289Hilton Worldwide Holdings, Inc. 9,500 611,135ILG, Inc. 7,769 205,102International Speedway Corp., Class A 4,736 168,838Jack in the Box, Inc. 5,635 527,549La Quinta Holdings, Inc. (A) 6,052 95,622Lindblad Expeditions Holdings, Inc. (A) 1,826 20,305Marriott International, Inc., Class A 14,265 1,477,569Marriott Vacations Worldwide Corp. 1,593 185,361McDonald’s Corp. 37,236 5,956,643MGM Resorts International 22,053 726,867Monarch Casino & Resort, Inc. (A) 883 31,408Nathan’s Famous, Inc. (A) 268 15,691Papa John’s International, Inc. 4,985 372,828Penn National Gaming, Inc. (A) 6,237 138,399Pinnacle Entertainment, Inc. (A) 3,993 77,864Planet Fitness, Inc., Class A 6,134 155,620Potbelly Corp. (A) 1,950 23,400RCI Hospitality Holdings, Inc. 759 17,685Red Robin Gourmet Burgers, Inc. (A) 948 54,036Red Rock Resorts, Inc., Class A 4,966 112,232Royal Caribbean Cruises, Ltd. 7,656 952,866Ruth’s Hospitality Group, Inc. 2,253 44,046Scientific Games Corp., Class A (A) 3,917 137,878SeaWorld Entertainment, Inc. (B) 5,009 65,017Shake Shack, Inc., Class A (A)(B) 1,628 50,338Sonic Corp. (B) 3,053 71,471Speedway Motorsports, Inc. 945 19,665Starbucks Corp. 66,190 3,631,183Texas Roadhouse, Inc. 12,196 578,700The Cheesecake Factory, Inc. 8,315 344,490The Habit Restaurants, Inc.,
Class A (A)(B) 1,599 20,787The Marcus Corp. 1,456 36,254
U.S. Strategic Equity Allocation Fund (continued)Shares orPrincipalAmount Value
COMMON STOCKS (continued)Hotels, restaurants andleisure (continued)The Wendy’s Company 21,676 $ 323,406Wingstop, Inc. (B) 2,135 69,195Wyndham Worldwide Corp. 4,728 471,287Wynn Resorts, Ltd. 3,653 507,730Yum! Brands, Inc. 15,032 1,154,758Zoe’s Kitchen, Inc. (A) 1,546 19,897
26,234,334Household durables – 0.7%AV Homes, Inc. (A) 1,021 15,774Bassett Furniture Industries, Inc. 795 28,501Beazer Homes USA, Inc. (A) 2,365 35,262CalAtlantic Group, Inc. 8,716 302,881Cavco Industries, Inc. (A) 626 84,228Century Communities, Inc. (A) 1,404 31,660CSS Industries, Inc. 829 22,201D.R. Horton, Inc. 31,618 1,142,991Ethan Allen Interiors, Inc. 1,827 53,440Flexsteel Industries, Inc. 619 28,165Garmin, Ltd. 10,705 551,308GoPro, Inc., Class A (A) 7,972 73,422Green Brick Partners, Inc. (A) 1,859 17,568Helen of Troy, Ltd. (A) 5,027 453,938Hooker Furniture Corp. 852 34,293Hovnanian Enterprises, Inc., Class A (A) 9,959 18,125Installed Building Products, Inc. (A) 1,581 91,224iRobot Corp. (A) 1,929 184,065KB Home 15,503 331,764La-Z-Boy, Inc. 3,506 83,618Leggett & Platt, Inc. 12,034 553,203Lennar Corp., A Shares 18,554 960,355LGI Homes, Inc. (A)(B) 1,252 53,260Libbey, Inc. 1,839 15,025Lifetime Brands, Inc. 830 14,442M/I Homes, Inc. (A) 1,741 42,829MDC Holdings, Inc. 3,011 94,094Meritage Homes Corp. (A) 2,796 113,797Mohawk Industries, Inc. (A) 5,859 1,483,030NACCO Industries, Inc., Class A 318 23,055Newell Brands, Inc. 44,252 2,136,487NVR, Inc. (A) 395 1,074,736PICO Holdings, Inc. (A) 1,806 29,348PulteGroup, Inc. 25,785 665,769Taylor Morrison Home Corp.,
Class A (A) 4,434 89,655Tempur Sealy International, Inc. (A)(B) 5,309 328,627The New Home Company, Inc. (A) 1,173 12,105Toll Brothers, Inc. 16,753 652,697TopBuild, Corp. (A) 2,685 159,355TRI Pointe Group, Inc. (A) 29,436 375,015Tupperware Brands Corp. 5,743 332,347Universal Electronics, Inc. (A) 1,046 61,243Whirlpool Corp. 6,748 1,158,092William Lyon Homes, Class A (A)(B) 1,758 42,174ZAGG, Inc. (A) 2,112 26,611
14,081,779Internet and direct marketing retail –0.7%1-800-Flowers.com, Inc., Class A (A) 2,116 19,044Amazon.com, Inc. (A) 9,146 8,968,568Duluth Holdings, Inc., Class B (A) 789 15,457Etsy, Inc. (A) 8,498 139,112Expedia, Inc. 2,803 415,853FTD Companies, Inc. (A) 1,343 17,983
John Hancock Funds IIPortfolio of Investments — August 31, 2017 (showing percentage of total net assets)
204
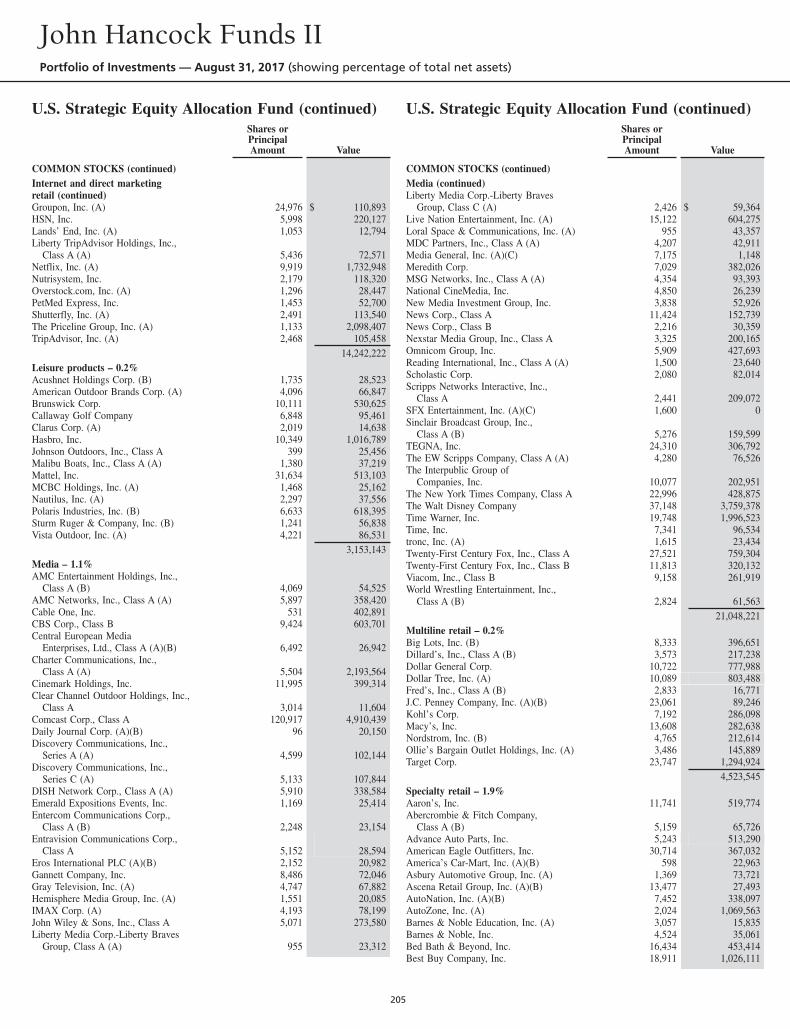
U.S. Strategic Equity Allocation Fund (continued)Shares orPrincipalAmount Value
COMMON STOCKS (continued)Internet and direct marketingretail (continued)Groupon, Inc. (A) 24,976 $ 110,893HSN, Inc. 5,998 220,127Lands’ End, Inc. (A) 1,053 12,794Liberty TripAdvisor Holdings, Inc.,
Class A (A) 5,436 72,571Netflix, Inc. (A) 9,919 1,732,948Nutrisystem, Inc. 2,179 118,320Overstock.com, Inc. (A) 1,296 28,447PetMed Express, Inc. 1,453 52,700Shutterfly, Inc. (A) 2,491 113,540The Priceline Group, Inc. (A) 1,133 2,098,407TripAdvisor, Inc. (A) 2,468 105,458
14,242,222Leisure products – 0.2%Acushnet Holdings Corp. (B) 1,735 28,523American Outdoor Brands Corp. (A) 4,096 66,847Brunswick Corp. 10,111 530,625Callaway Golf Company 6,848 95,461Clarus Corp. (A) 2,019 14,638Hasbro, Inc. 10,349 1,016,789Johnson Outdoors, Inc., Class A 399 25,456Malibu Boats, Inc., Class A (A) 1,380 37,219Mattel, Inc. 31,634 513,103MCBC Holdings, Inc. (A) 1,468 25,162Nautilus, Inc. (A) 2,297 37,556Polaris Industries, Inc. (B) 6,633 618,395Sturm Ruger & Company, Inc. (B) 1,241 56,838Vista Outdoor, Inc. (A) 4,221 86,531
3,153,143Media – 1.1%AMC Entertainment Holdings, Inc.,
Class A (B) 4,069 54,525AMC Networks, Inc., Class A (A) 5,897 358,420Cable One, Inc. 531 402,891CBS Corp., Class B 9,424 603,701Central European Media
Enterprises, Ltd., Class A (A)(B) 6,492 26,942Charter Communications, Inc.,
Class A (A) 5,504 2,193,564Cinemark Holdings, Inc. 11,995 399,314Clear Channel Outdoor Holdings, Inc.,
Class A 3,014 11,604Comcast Corp., Class A 120,917 4,910,439Daily Journal Corp. (A)(B) 96 20,150Discovery Communications, Inc.,
Series A (A) 4,599 102,144Discovery Communications, Inc.,
Series C (A) 5,133 107,844DISH Network Corp., Class A (A) 5,910 338,584Emerald Expositions Events, Inc. 1,169 25,414Entercom Communications Corp.,
Class A (B) 2,248 23,154Entravision Communications Corp.,
Class A 5,152 28,594Eros International PLC (A)(B) 2,152 20,982Gannett Company, Inc. 8,486 72,046Gray Television, Inc. (A) 4,747 67,882Hemisphere Media Group, Inc. (A) 1,551 20,085IMAX Corp. (A) 4,193 78,199John Wiley & Sons, Inc., Class A 5,071 273,580Liberty Media Corp.-Liberty Braves
Group, Class A (A) 955 23,312
U.S. Strategic Equity Allocation Fund (continued)Shares orPrincipalAmount Value
COMMON STOCKS (continued)Media (continued)Liberty Media Corp.-Liberty Braves
Group, Class C (A) 2,426 $ 59,364Live Nation Entertainment, Inc. (A) 15,122 604,275Loral Space & Communications, Inc. (A) 955 43,357MDC Partners, Inc., Class A (A) 4,207 42,911Media General, Inc. (A)(C) 7,175 1,148Meredith Corp. 7,029 382,026MSG Networks, Inc., Class A (A) 4,354 93,393National CineMedia, Inc. 4,850 26,239New Media Investment Group, Inc. 3,838 52,926News Corp., Class A 11,424 152,739News Corp., Class B 2,216 30,359Nexstar Media Group, Inc., Class A 3,325 200,165Omnicom Group, Inc. 5,909 427,693Reading International, Inc., Class A (A) 1,500 23,640Scholastic Corp. 2,080 82,014Scripps Networks Interactive, Inc.,
Class A 2,441 209,072SFX Entertainment, Inc. (A)(C) 1,600 0Sinclair Broadcast Group, Inc.,
Class A (B) 5,276 159,599TEGNA, Inc. 24,310 306,792The EW Scripps Company, Class A (A) 4,280 76,526The Interpublic Group of
Companies, Inc. 10,077 202,951The New York Times Company, Class A 22,996 428,875The Walt Disney Company 37,148 3,759,378Time Warner, Inc. 19,748 1,996,523Time, Inc. 7,341 96,534tronc, Inc. (A) 1,615 23,434Twenty-First Century Fox, Inc., Class A 27,521 759,304Twenty-First Century Fox, Inc., Class B 11,813 320,132Viacom, Inc., Class B 9,158 261,919World Wrestling Entertainment, Inc.,
Class A (B) 2,824 61,56321,048,221
Multiline retail – 0.2%Big Lots, Inc. (B) 8,333 396,651Dillard’s, Inc., Class A (B) 3,573 217,238Dollar General Corp. 10,722 777,988Dollar Tree, Inc. (A) 10,089 803,488Fred’s, Inc., Class A (B) 2,833 16,771J.C. Penney Company, Inc. (A)(B) 23,061 89,246Kohl’s Corp. 7,192 286,098Macy’s, Inc. 13,608 282,638Nordstrom, Inc. (B) 4,765 212,614Ollie’s Bargain Outlet Holdings, Inc. (A) 3,486 145,889Target Corp. 23,747 1,294,924
4,523,545Specialty retail – 1.9%Aaron’s, Inc. 11,741 519,774Abercrombie & Fitch Company,
Class A (B) 5,159 65,726Advance Auto Parts, Inc. 5,243 513,290American Eagle Outfitters, Inc. 30,714 367,032America’s Car-Mart, Inc. (A)(B) 598 22,963Asbury Automotive Group, Inc. (A) 1,369 73,721Ascena Retail Group, Inc. (A)(B) 13,477 27,493AutoNation, Inc. (A)(B) 7,452 338,097AutoZone, Inc. (A) 2,024 1,069,563Barnes & Noble Education, Inc. (A) 3,057 15,835Barnes & Noble, Inc. 4,524 35,061Bed Bath & Beyond, Inc. 16,434 453,414Best Buy Company, Inc. 18,911 1,026,111
John Hancock Funds IIPortfolio of Investments — August 31, 2017 (showing percentage of total net assets)
205
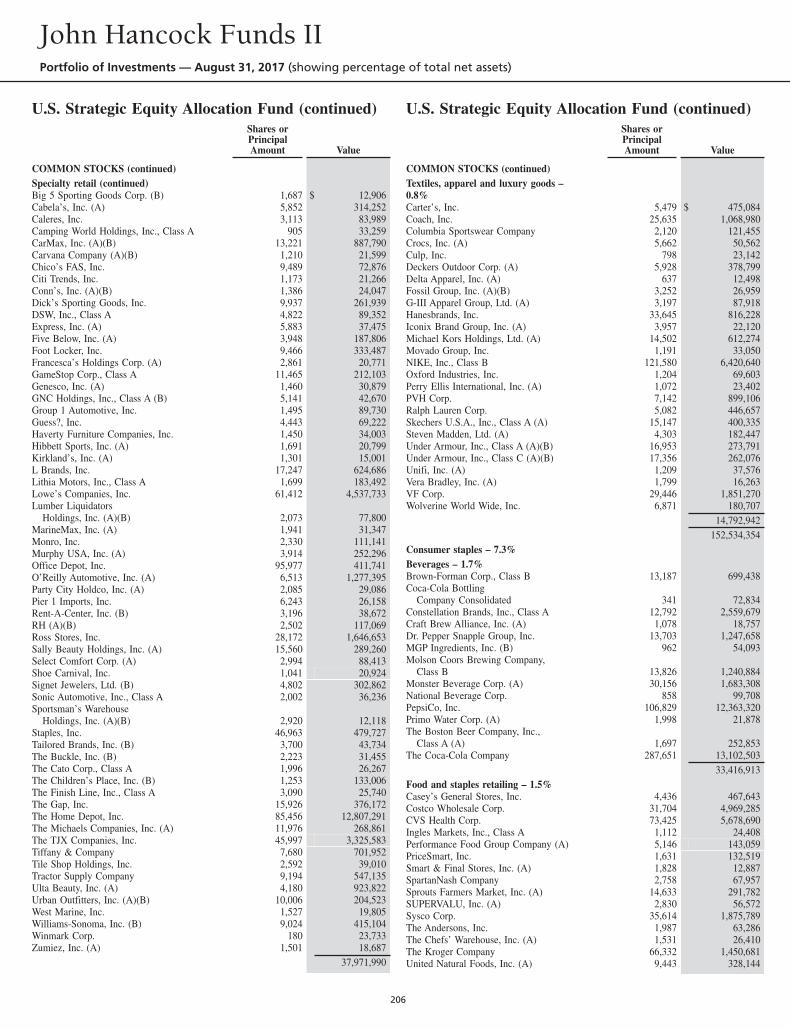
U.S. Strategic Equity Allocation Fund (continued)Shares orPrincipalAmount Value
COMMON STOCKS (continued)Specialty retail (continued)Big 5 Sporting Goods Corp. (B) 1,687 $ 12,906Cabela’s, Inc. (A) 5,852 314,252Caleres, Inc. 3,113 83,989Camping World Holdings, Inc., Class A 905 33,259CarMax, Inc. (A)(B) 13,221 887,790Carvana Company (A)(B) 1,210 21,599Chico’s FAS, Inc. 9,489 72,876Citi Trends, Inc. 1,173 21,266Conn’s, Inc. (A)(B) 1,386 24,047Dick’s Sporting Goods, Inc. 9,937 261,939DSW, Inc., Class A 4,822 89,352Express, Inc. (A) 5,883 37,475Five Below, Inc. (A) 3,948 187,806Foot Locker, Inc. 9,466 333,487Francesca’s Holdings Corp. (A) 2,861 20,771GameStop Corp., Class A 11,465 212,103Genesco, Inc. (A) 1,460 30,879GNC Holdings, Inc., Class A (B) 5,141 42,670Group 1 Automotive, Inc. 1,495 89,730Guess?, Inc. 4,443 69,222Haverty Furniture Companies, Inc. 1,450 34,003Hibbett Sports, Inc. (A) 1,691 20,799Kirkland’s, Inc. (A) 1,301 15,001L Brands, Inc. 17,247 624,686Lithia Motors, Inc., Class A 1,699 183,492Lowe’s Companies, Inc. 61,412 4,537,733Lumber Liquidators
Holdings, Inc. (A)(B) 2,073 77,800MarineMax, Inc. (A) 1,941 31,347Monro, Inc. 2,330 111,141Murphy USA, Inc. (A) 3,914 252,296Office Depot, Inc. 95,977 411,741O’Reilly Automotive, Inc. (A) 6,513 1,277,395Party City Holdco, Inc. (A) 2,085 29,086Pier 1 Imports, Inc. 6,243 26,158Rent-A-Center, Inc. (B) 3,196 38,672RH (A)(B) 2,502 117,069Ross Stores, Inc. 28,172 1,646,653Sally Beauty Holdings, Inc. (A) 15,560 289,260Select Comfort Corp. (A) 2,994 88,413Shoe Carnival, Inc. 1,041 20,924Signet Jewelers, Ltd. (B) 4,802 302,862Sonic Automotive, Inc., Class A 2,002 36,236Sportsman’s Warehouse
Holdings, Inc. (A)(B) 2,920 12,118Staples, Inc. 46,963 479,727Tailored Brands, Inc. (B) 3,700 43,734The Buckle, Inc. (B) 2,223 31,455The Cato Corp., Class A 1,996 26,267The Children’s Place, Inc. (B) 1,253 133,006The Finish Line, Inc., Class A 3,090 25,740The Gap, Inc. 15,926 376,172The Home Depot, Inc. 85,456 12,807,291The Michaels Companies, Inc. (A) 11,976 268,861The TJX Companies, Inc. 45,997 3,325,583Tiffany & Company 7,680 701,952Tile Shop Holdings, Inc. 2,592 39,010Tractor Supply Company 9,194 547,135Ulta Beauty, Inc. (A) 4,180 923,822Urban Outfitters, Inc. (A)(B) 10,006 204,523West Marine, Inc. 1,527 19,805Williams-Sonoma, Inc. (B) 9,024 415,104Winmark Corp. 180 23,733Zumiez, Inc. (A) 1,501 18,687
37,971,990
U.S. Strategic Equity Allocation Fund (continued)Shares orPrincipalAmount Value
COMMON STOCKS (continued)Textiles, apparel and luxury goods –0.8%Carter’s, Inc. 5,479 $ 475,084Coach, Inc. 25,635 1,068,980Columbia Sportswear Company 2,120 121,455Crocs, Inc. (A) 5,662 50,562Culp, Inc. 798 23,142Deckers Outdoor Corp. (A) 5,928 378,799Delta Apparel, Inc. (A) 637 12,498Fossil Group, Inc. (A)(B) 3,252 26,959G-III Apparel Group, Ltd. (A) 3,197 87,918Hanesbrands, Inc. 33,645 816,228Iconix Brand Group, Inc. (A) 3,957 22,120Michael Kors Holdings, Ltd. (A) 14,502 612,274Movado Group, Inc. 1,191 33,050NIKE, Inc., Class B 121,580 6,420,640Oxford Industries, Inc. 1,204 69,603Perry Ellis International, Inc. (A) 1,072 23,402PVH Corp. 7,142 899,106Ralph Lauren Corp. 5,082 446,657Skechers U.S.A., Inc., Class A (A) 15,147 400,335Steven Madden, Ltd. (A) 4,303 182,447Under Armour, Inc., Class A (A)(B) 16,953 273,791Under Armour, Inc., Class C (A)(B) 17,356 262,076Unifi, Inc. (A) 1,209 37,576Vera Bradley, Inc. (A) 1,799 16,263VF Corp. 29,446 1,851,270Wolverine World Wide, Inc. 6,871 180,707
14,792,942152,534,354
Consumer staples – 7.3%Beverages – 1.7%Brown-Forman Corp., Class B 13,187 699,438Coca-Cola Bottling
Company Consolidated 341 72,834Constellation Brands, Inc., Class A 12,792 2,559,679Craft Brew Alliance, Inc. (A) 1,078 18,757Dr. Pepper Snapple Group, Inc. 13,703 1,247,658MGP Ingredients, Inc. (B) 962 54,093Molson Coors Brewing Company,
Class B 13,826 1,240,884Monster Beverage Corp. (A) 30,156 1,683,308National Beverage Corp. 858 99,708PepsiCo, Inc. 106,829 12,363,320Primo Water Corp. (A) 1,998 21,878The Boston Beer Company, Inc.,
Class A (A) 1,697 252,853The Coca-Cola Company 287,651 13,102,503
33,416,913Food and staples retailing – 1.5%Casey’s General Stores, Inc. 4,436 467,643Costco Wholesale Corp. 31,704 4,969,285CVS Health Corp. 73,425 5,678,690Ingles Markets, Inc., Class A 1,112 24,408Performance Food Group Company (A) 5,146 143,059PriceSmart, Inc. 1,631 132,519Smart & Final Stores, Inc. (A) 1,828 12,887SpartanNash Company 2,758 67,957Sprouts Farmers Market, Inc. (A) 14,633 291,782SUPERVALU, Inc. (A) 2,830 56,572Sysco Corp. 35,614 1,875,789The Andersons, Inc. 1,987 63,286The Chefs’ Warehouse, Inc. (A) 1,531 26,410The Kroger Company 66,332 1,450,681United Natural Foods, Inc. (A) 9,443 328,144
John Hancock Funds IIPortfolio of Investments — August 31, 2017 (showing percentage of total net assets)
206
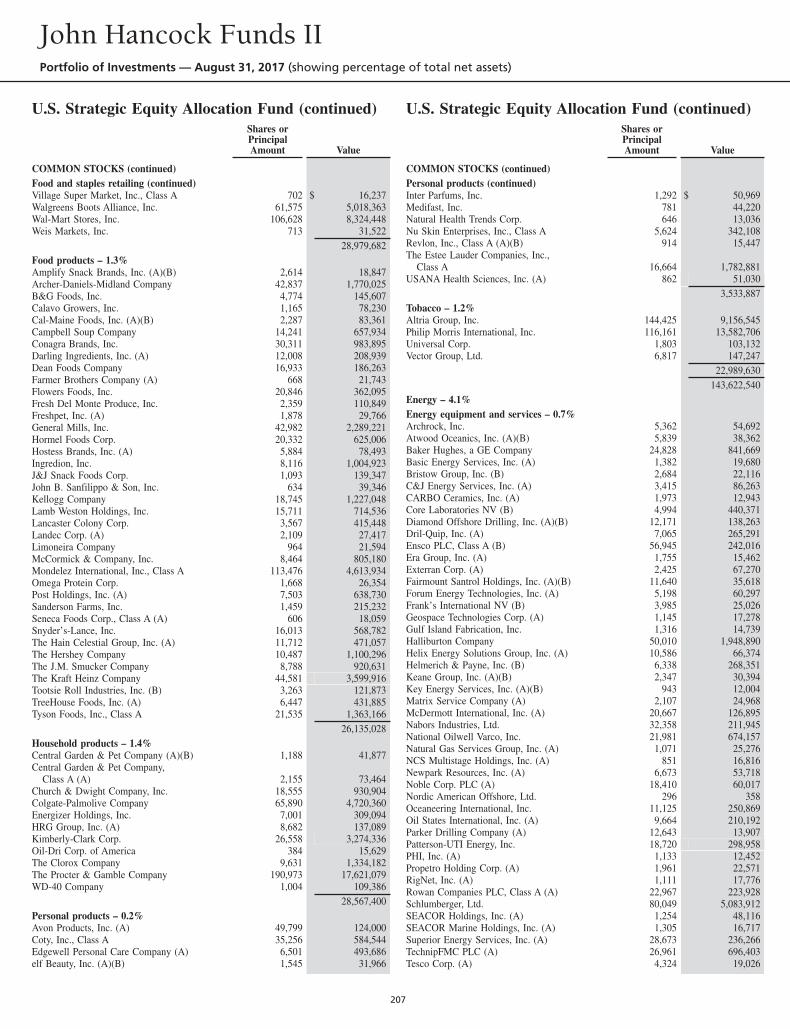
U.S. Strategic Equity Allocation Fund (continued)Shares orPrincipalAmount Value
COMMON STOCKS (continued)Food and staples retailing (continued)Village Super Market, Inc., Class A 702 $ 16,237Walgreens Boots Alliance, Inc. 61,575 5,018,363Wal-Mart Stores, Inc. 106,628 8,324,448Weis Markets, Inc. 713 31,522
28,979,682Food products – 1.3%Amplify Snack Brands, Inc. (A)(B) 2,614 18,847Archer-Daniels-Midland Company 42,837 1,770,025B&G Foods, Inc. 4,774 145,607Calavo Growers, Inc. 1,165 78,230Cal-Maine Foods, Inc. (A)(B) 2,287 83,361Campbell Soup Company 14,241 657,934Conagra Brands, Inc. 30,311 983,895Darling Ingredients, Inc. (A) 12,008 208,939Dean Foods Company 16,933 186,263Farmer Brothers Company (A) 668 21,743Flowers Foods, Inc. 20,846 362,095Fresh Del Monte Produce, Inc. 2,359 110,849Freshpet, Inc. (A) 1,878 29,766General Mills, Inc. 42,982 2,289,221Hormel Foods Corp. 20,332 625,006Hostess Brands, Inc. (A) 5,884 78,493Ingredion, Inc. 8,116 1,004,923J&J Snack Foods Corp. 1,093 139,347John B. Sanfilippo & Son, Inc. 634 39,346Kellogg Company 18,745 1,227,048Lamb Weston Holdings, Inc. 15,711 714,536Lancaster Colony Corp. 3,567 415,448Landec Corp. (A) 2,109 27,417Limoneira Company 964 21,594McCormick & Company, Inc. 8,464 805,180Mondelez International, Inc., Class A 113,476 4,613,934Omega Protein Corp. 1,668 26,354Post Holdings, Inc. (A) 7,503 638,730Sanderson Farms, Inc. 1,459 215,232Seneca Foods Corp., Class A (A) 606 18,059Snyder’s-Lance, Inc. 16,013 568,782The Hain Celestial Group, Inc. (A) 11,712 471,057The Hershey Company 10,487 1,100,296The J.M. Smucker Company 8,788 920,631The Kraft Heinz Company 44,581 3,599,916Tootsie Roll Industries, Inc. (B) 3,263 121,873TreeHouse Foods, Inc. (A) 6,447 431,885Tyson Foods, Inc., Class A 21,535 1,363,166
26,135,028Household products – 1.4%Central Garden & Pet Company (A)(B) 1,188 41,877Central Garden & Pet Company,
Class A (A) 2,155 73,464Church & Dwight Company, Inc. 18,555 930,904Colgate-Palmolive Company 65,890 4,720,360Energizer Holdings, Inc. 7,001 309,094HRG Group, Inc. (A) 8,682 137,089Kimberly-Clark Corp. 26,558 3,274,336Oil-Dri Corp. of America 384 15,629The Clorox Company 9,631 1,334,182The Procter & Gamble Company 190,973 17,621,079WD-40 Company 1,004 109,386
28,567,400Personal products – 0.2%Avon Products, Inc. (A) 49,799 124,000Coty, Inc., Class A 35,256 584,544Edgewell Personal Care Company (A) 6,501 493,686elf Beauty, Inc. (A)(B) 1,545 31,966
U.S. Strategic Equity Allocation Fund (continued)Shares orPrincipalAmount Value
COMMON STOCKS (continued)Personal products (continued)Inter Parfums, Inc. 1,292 $ 50,969Medifast, Inc. 781 44,220Natural Health Trends Corp. 646 13,036Nu Skin Enterprises, Inc., Class A 5,624 342,108Revlon, Inc., Class A (A)(B) 914 15,447The Estee Lauder Companies, Inc.,
Class A 16,664 1,782,881USANA Health Sciences, Inc. (A) 862 51,030
3,533,887Tobacco – 1.2%Altria Group, Inc. 144,425 9,156,545Philip Morris International, Inc. 116,161 13,582,706Universal Corp. 1,803 103,132Vector Group, Ltd. 6,817 147,247
22,989,630143,622,540
Energy – 4.1%Energy equipment and services – 0.7%Archrock, Inc. 5,362 54,692Atwood Oceanics, Inc. (A)(B) 5,839 38,362Baker Hughes, a GE Company 24,828 841,669Basic Energy Services, Inc. (A) 1,382 19,680Bristow Group, Inc. (B) 2,684 22,116C&J Energy Services, Inc. (A) 3,415 86,263CARBO Ceramics, Inc. (A) 1,973 12,943Core Laboratories NV (B) 4,994 440,371Diamond Offshore Drilling, Inc. (A)(B) 12,171 138,263Dril-Quip, Inc. (A) 7,065 265,291Ensco PLC, Class A (B) 56,945 242,016Era Group, Inc. (A) 1,755 15,462Exterran Corp. (A) 2,425 67,270Fairmount Santrol Holdings, Inc. (A)(B) 11,640 35,618Forum Energy Technologies, Inc. (A) 5,198 60,297Frank’s International NV (B) 3,985 25,026Geospace Technologies Corp. (A) 1,145 17,278Gulf Island Fabrication, Inc. 1,316 14,739Halliburton Company 50,010 1,948,890Helix Energy Solutions Group, Inc. (A) 10,586 66,374Helmerich & Payne, Inc. (B) 6,338 268,351Keane Group, Inc. (A)(B) 2,347 30,394Key Energy Services, Inc. (A)(B) 943 12,004Matrix Service Company (A) 2,107 24,968McDermott International, Inc. (A) 20,667 126,895Nabors Industries, Ltd. 32,358 211,945National Oilwell Varco, Inc. 21,981 674,157Natural Gas Services Group, Inc. (A) 1,071 25,276NCS Multistage Holdings, Inc. (A) 851 16,816Newpark Resources, Inc. (A) 6,673 53,718Noble Corp. PLC (A) 18,410 60,017Nordic American Offshore, Ltd. 296 358Oceaneering International, Inc. 11,125 250,869Oil States International, Inc. (A) 9,664 210,192Parker Drilling Company (A) 12,643 13,907Patterson-UTI Energy, Inc. 18,720 298,958PHI, Inc. (A) 1,133 12,452Propetro Holding Corp. (A) 1,961 22,571RigNet, Inc. (A) 1,111 17,776Rowan Companies PLC, Class A (A) 22,967 223,928Schlumberger, Ltd. 80,049 5,083,912SEACOR Holdings, Inc. (A) 1,254 48,116SEACOR Marine Holdings, Inc. (A) 1,305 16,717Superior Energy Services, Inc. (A) 28,673 236,266TechnipFMC PLC (A) 26,961 696,403Tesco Corp. (A) 4,324 19,026
John Hancock Funds IIPortfolio of Investments — August 31, 2017 (showing percentage of total net assets)
207
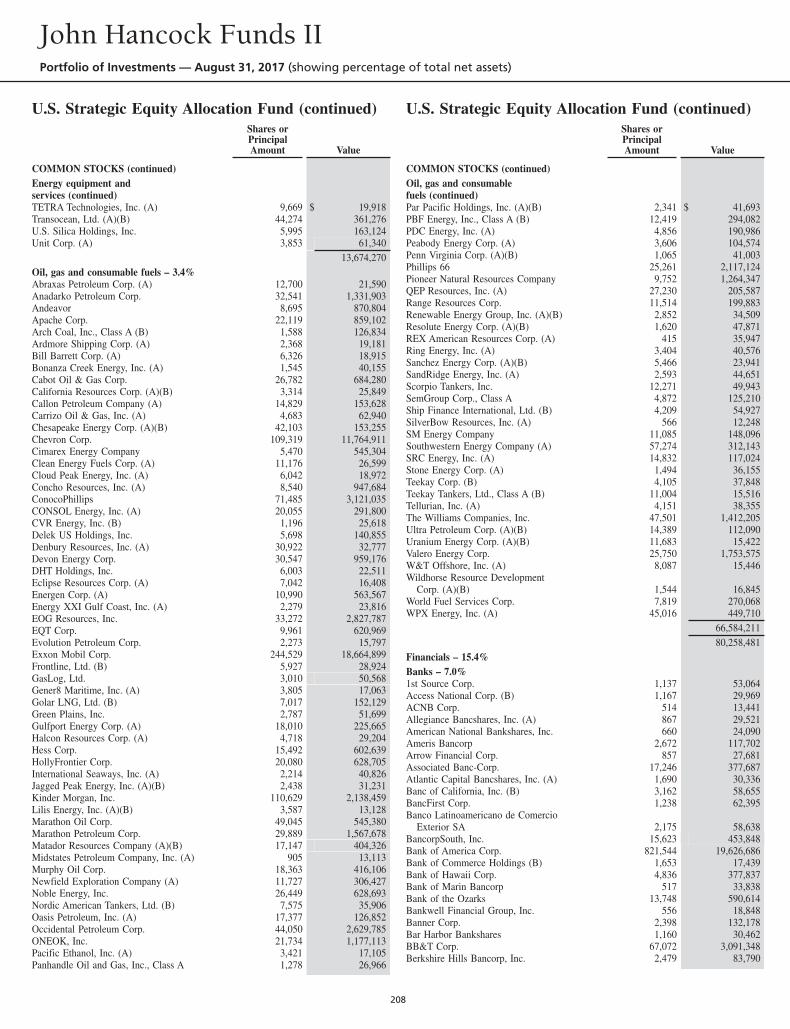
U.S. Strategic Equity Allocation Fund (continued)Shares orPrincipalAmount Value
COMMON STOCKS (continued)Energy equipment andservices (continued)TETRA Technologies, Inc. (A) 9,669 $ 19,918Transocean, Ltd. (A)(B) 44,274 361,276U.S. Silica Holdings, Inc. 5,995 163,124Unit Corp. (A) 3,853 61,340
13,674,270Oil, gas and consumable fuels – 3.4%Abraxas Petroleum Corp. (A) 12,700 21,590Anadarko Petroleum Corp. 32,541 1,331,903Andeavor 8,695 870,804Apache Corp. 22,119 859,102Arch Coal, Inc., Class A (B) 1,588 126,834Ardmore Shipping Corp. (A) 2,368 19,181Bill Barrett Corp. (A) 6,326 18,915Bonanza Creek Energy, Inc. (A) 1,545 40,155Cabot Oil & Gas Corp. 26,782 684,280California Resources Corp. (A)(B) 3,314 25,849Callon Petroleum Company (A) 14,829 153,628Carrizo Oil & Gas, Inc. (A) 4,683 62,940Chesapeake Energy Corp. (A)(B) 42,103 153,255Chevron Corp. 109,319 11,764,911Cimarex Energy Company 5,470 545,304Clean Energy Fuels Corp. (A) 11,176 26,599Cloud Peak Energy, Inc. (A) 6,042 18,972Concho Resources, Inc. (A) 8,540 947,684ConocoPhillips 71,485 3,121,035CONSOL Energy, Inc. (A) 20,055 291,800CVR Energy, Inc. (B) 1,196 25,618Delek US Holdings, Inc. 5,698 140,855Denbury Resources, Inc. (A) 30,922 32,777Devon Energy Corp. 30,547 959,176DHT Holdings, Inc. 6,003 22,511Eclipse Resources Corp. (A) 7,042 16,408Energen Corp. (A) 10,990 563,567Energy XXI Gulf Coast, Inc. (A) 2,279 23,816EOG Resources, Inc. 33,272 2,827,787EQT Corp. 9,961 620,969Evolution Petroleum Corp. 2,273 15,797Exxon Mobil Corp. 244,529 18,664,899Frontline, Ltd. (B) 5,927 28,924GasLog, Ltd. 3,010 50,568Gener8 Maritime, Inc. (A) 3,805 17,063Golar LNG, Ltd. (B) 7,017 152,129Green Plains, Inc. 2,787 51,699Gulfport Energy Corp. (A) 18,010 225,665Halcon Resources Corp. (A) 4,718 29,204Hess Corp. 15,492 602,639HollyFrontier Corp. 20,080 628,705International Seaways, Inc. (A) 2,214 40,826Jagged Peak Energy, Inc. (A)(B) 2,438 31,231Kinder Morgan, Inc. 110,629 2,138,459Lilis Energy, Inc. (A)(B) 3,587 13,128Marathon Oil Corp. 49,045 545,380Marathon Petroleum Corp. 29,889 1,567,678Matador Resources Company (A)(B) 17,147 404,326Midstates Petroleum Company, Inc. (A) 905 13,113Murphy Oil Corp. 18,363 416,106Newfield Exploration Company (A) 11,727 306,427Noble Energy, Inc. 26,449 628,693Nordic American Tankers, Ltd. (B) 7,575 35,906Oasis Petroleum, Inc. (A) 17,377 126,852Occidental Petroleum Corp. 44,050 2,629,785ONEOK, Inc. 21,734 1,177,113Pacific Ethanol, Inc. (A) 3,421 17,105Panhandle Oil and Gas, Inc., Class A 1,278 26,966
U.S. Strategic Equity Allocation Fund (continued)Shares orPrincipalAmount Value
COMMON STOCKS (continued)Oil, gas and consumablefuels (continued)Par Pacific Holdings, Inc. (A)(B) 2,341 $ 41,693PBF Energy, Inc., Class A (B) 12,419 294,082PDC Energy, Inc. (A) 4,856 190,986Peabody Energy Corp. (A) 3,606 104,574Penn Virginia Corp. (A)(B) 1,065 41,003Phillips 66 25,261 2,117,124Pioneer Natural Resources Company 9,752 1,264,347QEP Resources, Inc. (A) 27,230 205,587Range Resources Corp. 11,514 199,883Renewable Energy Group, Inc. (A)(B) 2,852 34,509Resolute Energy Corp. (A)(B) 1,620 47,871REX American Resources Corp. (A) 415 35,947Ring Energy, Inc. (A) 3,404 40,576Sanchez Energy Corp. (A)(B) 5,466 23,941SandRidge Energy, Inc. (A) 2,593 44,651Scorpio Tankers, Inc. 12,271 49,943SemGroup Corp., Class A 4,872 125,210Ship Finance International, Ltd. (B) 4,209 54,927SilverBow Resources, Inc. (A) 566 12,248SM Energy Company 11,085 148,096Southwestern Energy Company (A) 57,274 312,143SRC Energy, Inc. (A) 14,832 117,024Stone Energy Corp. (A) 1,494 36,155Teekay Corp. (B) 4,105 37,848Teekay Tankers, Ltd., Class A (B) 11,004 15,516Tellurian, Inc. (A) 4,151 38,355The Williams Companies, Inc. 47,501 1,412,205Ultra Petroleum Corp. (A)(B) 14,389 112,090Uranium Energy Corp. (A)(B) 11,683 15,422Valero Energy Corp. 25,750 1,753,575W&T Offshore, Inc. (A) 8,087 15,446Wildhorse Resource Development
Corp. (A)(B) 1,544 16,845World Fuel Services Corp. 7,819 270,068WPX Energy, Inc. (A) 45,016 449,710
66,584,21180,258,481
Financials – 15.4%Banks – 7.0%1st Source Corp. 1,137 53,064Access National Corp. (B) 1,167 29,969ACNB Corp. 514 13,441Allegiance Bancshares, Inc. (A) 867 29,521American National Bankshares, Inc. 660 24,090Ameris Bancorp 2,672 117,702Arrow Financial Corp. 857 27,681Associated Banc-Corp. 17,246 377,687Atlantic Capital Bancshares, Inc. (A) 1,690 30,336Banc of California, Inc. (B) 3,162 58,655BancFirst Corp. 1,238 62,395Banco Latinoamericano de Comercio
Exterior SA 2,175 58,638BancorpSouth, Inc. 15,623 453,848Bank of America Corp. 821,544 19,626,686Bank of Commerce Holdings (B) 1,653 17,439Bank of Hawaii Corp. 4,836 377,837Bank of Marin Bancorp 517 33,838Bank of the Ozarks 13,748 590,614Bankwell Financial Group, Inc. 556 18,848Banner Corp. 2,398 132,178Bar Harbor Bankshares 1,160 30,462BB&T Corp. 67,072 3,091,348Berkshire Hills Bancorp, Inc. 2,479 83,790
John Hancock Funds IIPortfolio of Investments — August 31, 2017 (showing percentage of total net assets)
208
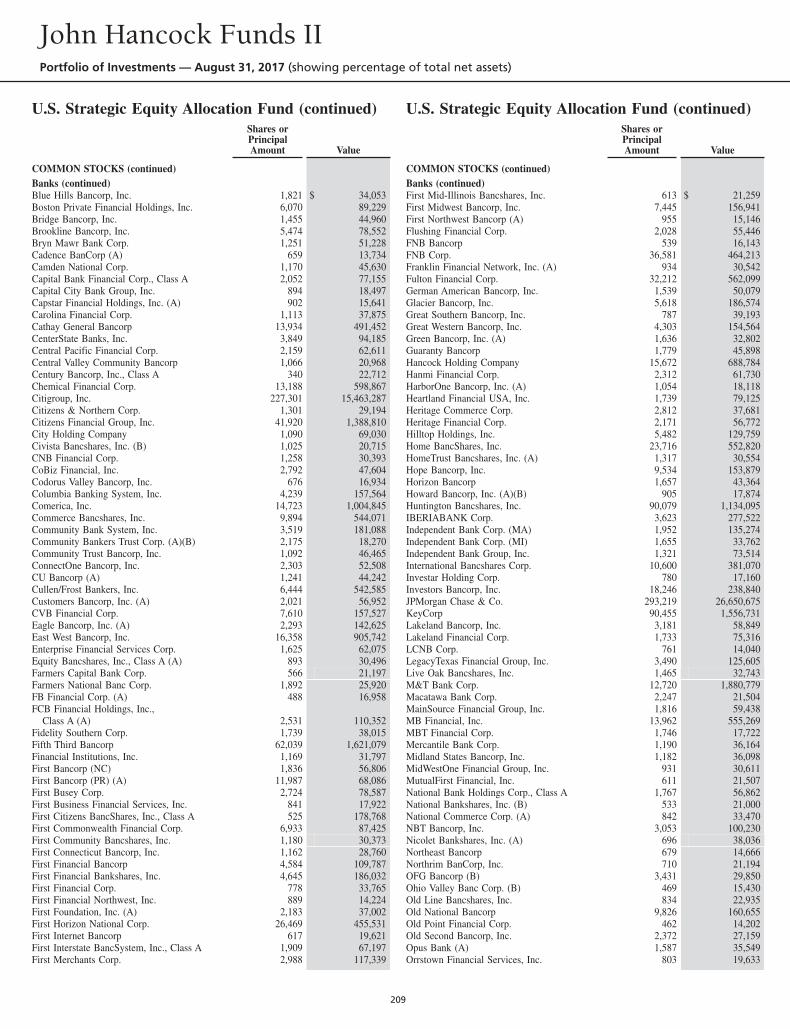
U.S. Strategic Equity Allocation Fund (continued)Shares orPrincipalAmount Value
COMMON STOCKS (continued)Banks (continued)Blue Hills Bancorp, Inc. 1,821 $ 34,053Boston Private Financial Holdings, Inc. 6,070 89,229Bridge Bancorp, Inc. 1,455 44,960Brookline Bancorp, Inc. 5,474 78,552Bryn Mawr Bank Corp. 1,251 51,228Cadence BanCorp (A) 659 13,734Camden National Corp. 1,170 45,630Capital Bank Financial Corp., Class A 2,052 77,155Capital City Bank Group, Inc. 894 18,497Capstar Financial Holdings, Inc. (A) 902 15,641Carolina Financial Corp. 1,113 37,875Cathay General Bancorp 13,934 491,452CenterState Banks, Inc. 3,849 94,185Central Pacific Financial Corp. 2,159 62,611Central Valley Community Bancorp 1,066 20,968Century Bancorp, Inc., Class A 340 22,712Chemical Financial Corp. 13,188 598,867Citigroup, Inc. 227,301 15,463,287Citizens & Northern Corp. 1,301 29,194Citizens Financial Group, Inc. 41,920 1,388,810City Holding Company 1,090 69,030Civista Bancshares, Inc. (B) 1,025 20,715CNB Financial Corp. 1,258 30,393CoBiz Financial, Inc. 2,792 47,604Codorus Valley Bancorp, Inc. 676 16,934Columbia Banking System, Inc. 4,239 157,564Comerica, Inc. 14,723 1,004,845Commerce Bancshares, Inc. 9,894 544,071Community Bank System, Inc. 3,519 181,088Community Bankers Trust Corp. (A)(B) 2,175 18,270Community Trust Bancorp, Inc. 1,092 46,465ConnectOne Bancorp, Inc. 2,303 52,508CU Bancorp (A) 1,241 44,242Cullen/Frost Bankers, Inc. 6,444 542,585Customers Bancorp, Inc. (A) 2,021 56,952CVB Financial Corp. 7,610 157,527Eagle Bancorp, Inc. (A) 2,293 142,625East West Bancorp, Inc. 16,358 905,742Enterprise Financial Services Corp. 1,625 62,075Equity Bancshares, Inc., Class A (A) 893 30,496Farmers Capital Bank Corp. 566 21,197Farmers National Banc Corp. 1,892 25,920FB Financial Corp. (A) 488 16,958FCB Financial Holdings, Inc.,
Class A (A) 2,531 110,352Fidelity Southern Corp. 1,739 38,015Fifth Third Bancorp 62,039 1,621,079Financial Institutions, Inc. 1,169 31,797First Bancorp (NC) 1,836 56,806First Bancorp (PR) (A) 11,987 68,086First Busey Corp. 2,724 78,587First Business Financial Services, Inc. 841 17,922First Citizens BancShares, Inc., Class A 525 178,768First Commonwealth Financial Corp. 6,933 87,425First Community Bancshares, Inc. 1,180 30,373First Connecticut Bancorp, Inc. 1,162 28,760First Financial Bancorp 4,584 109,787First Financial Bankshares, Inc. 4,645 186,032First Financial Corp. 778 33,765First Financial Northwest, Inc. 889 14,224First Foundation, Inc. (A) 2,183 37,002First Horizon National Corp. 26,469 455,531First Internet Bancorp 617 19,621First Interstate BancSystem, Inc., Class A 1,909 67,197First Merchants Corp. 2,988 117,339
U.S. Strategic Equity Allocation Fund (continued)Shares orPrincipalAmount Value
COMMON STOCKS (continued)Banks (continued)First Mid-Illinois Bancshares, Inc. 613 $ 21,259First Midwest Bancorp, Inc. 7,445 156,941First Northwest Bancorp (A) 955 15,146Flushing Financial Corp. 2,028 55,446FNB Bancorp 539 16,143FNB Corp. 36,581 464,213Franklin Financial Network, Inc. (A) 934 30,542Fulton Financial Corp. 32,212 562,099German American Bancorp, Inc. 1,539 50,079Glacier Bancorp, Inc. 5,618 186,574Great Southern Bancorp, Inc. 787 39,193Great Western Bancorp, Inc. 4,303 154,564Green Bancorp, Inc. (A) 1,636 32,802Guaranty Bancorp 1,779 45,898Hancock Holding Company 15,672 688,784Hanmi Financial Corp. 2,312 61,730HarborOne Bancorp, Inc. (A) 1,054 18,118Heartland Financial USA, Inc. 1,739 79,125Heritage Commerce Corp. 2,812 37,681Heritage Financial Corp. 2,171 56,772Hilltop Holdings, Inc. 5,482 129,759Home BancShares, Inc. 23,716 552,820HomeTrust Bancshares, Inc. (A) 1,317 30,554Hope Bancorp, Inc. 9,534 153,879Horizon Bancorp 1,657 43,364Howard Bancorp, Inc. (A)(B) 905 17,874Huntington Bancshares, Inc. 90,079 1,134,095IBERIABANK Corp. 3,623 277,522Independent Bank Corp. (MA) 1,952 135,274Independent Bank Corp. (MI) 1,655 33,762Independent Bank Group, Inc. 1,321 73,514International Bancshares Corp. 10,600 381,070Investar Holding Corp. 780 17,160Investors Bancorp, Inc. 18,246 238,840JPMorgan Chase & Co. 293,219 26,650,675KeyCorp 90,455 1,556,731Lakeland Bancorp, Inc. 3,181 58,849Lakeland Financial Corp. 1,733 75,316LCNB Corp. 761 14,040LegacyTexas Financial Group, Inc. 3,490 125,605Live Oak Bancshares, Inc. 1,465 32,743M&T Bank Corp. 12,720 1,880,779Macatawa Bank Corp. 2,247 21,504MainSource Financial Group, Inc. 1,816 59,438MB Financial, Inc. 13,962 555,269MBT Financial Corp. 1,746 17,722Mercantile Bank Corp. 1,190 36,164Midland States Bancorp, Inc. 1,182 36,098MidWestOne Financial Group, Inc. 931 30,611MutualFirst Financial, Inc. 611 21,507National Bank Holdings Corp., Class A 1,767 56,862National Bankshares, Inc. (B) 533 21,000National Commerce Corp. (A) 842 33,470NBT Bancorp, Inc. 3,053 100,230Nicolet Bankshares, Inc. (A) 696 38,036Northeast Bancorp 679 14,666Northrim BanCorp, Inc. 710 21,194OFG Bancorp (B) 3,431 29,850Ohio Valley Banc Corp. (B) 469 15,430Old Line Bancshares, Inc. 834 22,935Old National Bancorp 9,826 160,655Old Point Financial Corp. 462 14,202Old Second Bancorp, Inc. 2,372 27,159Opus Bank (A) 1,587 35,549Orrstown Financial Services, Inc. 803 19,633
John Hancock Funds IIPortfolio of Investments — August 31, 2017 (showing percentage of total net assets)
209
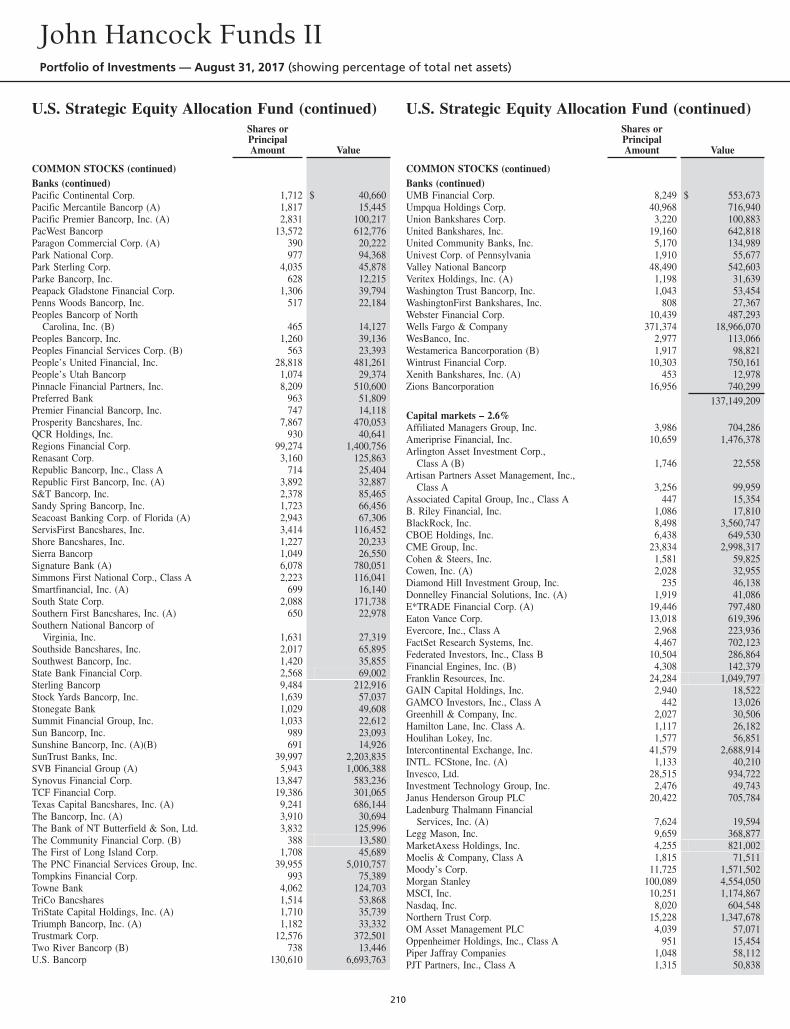
U.S. Strategic Equity Allocation Fund (continued)Shares orPrincipalAmount Value
COMMON STOCKS (continued)Banks (continued)Pacific Continental Corp. 1,712 $ 40,660Pacific Mercantile Bancorp (A) 1,817 15,445Pacific Premier Bancorp, Inc. (A) 2,831 100,217PacWest Bancorp 13,572 612,776Paragon Commercial Corp. (A) 390 20,222Park National Corp. 977 94,368Park Sterling Corp. 4,035 45,878Parke Bancorp, Inc. 628 12,215Peapack Gladstone Financial Corp. 1,306 39,794Penns Woods Bancorp, Inc. 517 22,184Peoples Bancorp of North
Carolina, Inc. (B) 465 14,127Peoples Bancorp, Inc. 1,260 39,136Peoples Financial Services Corp. (B) 563 23,393People’s United Financial, Inc. 28,818 481,261People’s Utah Bancorp 1,074 29,374Pinnacle Financial Partners, Inc. 8,209 510,600Preferred Bank 963 51,809Premier Financial Bancorp, Inc. 747 14,118Prosperity Bancshares, Inc. 7,867 470,053QCR Holdings, Inc. 930 40,641Regions Financial Corp. 99,274 1,400,756Renasant Corp. 3,160 125,863Republic Bancorp, Inc., Class A 714 25,404Republic First Bancorp, Inc. (A) 3,892 32,887S&T Bancorp, Inc. 2,378 85,465Sandy Spring Bancorp, Inc. 1,723 66,456Seacoast Banking Corp. of Florida (A) 2,943 67,306ServisFirst Bancshares, Inc. 3,414 116,452Shore Bancshares, Inc. 1,227 20,233Sierra Bancorp 1,049 26,550Signature Bank (A) 6,078 780,051Simmons First National Corp., Class A 2,223 116,041Smartfinancial, Inc. (A) 699 16,140South State Corp. 2,088 171,738Southern First Bancshares, Inc. (A) 650 22,978Southern National Bancorp of
Virginia, Inc. 1,631 27,319Southside Bancshares, Inc. 2,017 65,895Southwest Bancorp, Inc. 1,420 35,855State Bank Financial Corp. 2,568 69,002Sterling Bancorp 9,484 212,916Stock Yards Bancorp, Inc. 1,639 57,037Stonegate Bank 1,029 49,608Summit Financial Group, Inc. 1,033 22,612Sun Bancorp, Inc. 989 23,093Sunshine Bancorp, Inc. (A)(B) 691 14,926SunTrust Banks, Inc. 39,997 2,203,835SVB Financial Group (A) 5,943 1,006,388Synovus Financial Corp. 13,847 583,236TCF Financial Corp. 19,386 301,065Texas Capital Bancshares, Inc. (A) 9,241 686,144The Bancorp, Inc. (A) 3,910 30,694The Bank of NT Butterfield & Son, Ltd. 3,832 125,996The Community Financial Corp. (B) 388 13,580The First of Long Island Corp. 1,708 45,689The PNC Financial Services Group, Inc. 39,955 5,010,757Tompkins Financial Corp. 993 75,389Towne Bank 4,062 124,703TriCo Bancshares 1,514 53,868TriState Capital Holdings, Inc. (A) 1,710 35,739Triumph Bancorp, Inc. (A) 1,182 33,332Trustmark Corp. 12,576 372,501Two River Bancorp (B) 738 13,446U.S. Bancorp 130,610 6,693,763
U.S. Strategic Equity Allocation Fund (continued)Shares orPrincipalAmount Value
COMMON STOCKS (continued)Banks (continued)UMB Financial Corp. 8,249 $ 553,673Umpqua Holdings Corp. 40,968 716,940Union Bankshares Corp. 3,220 100,883United Bankshares, Inc. 19,160 642,818United Community Banks, Inc. 5,170 134,989Univest Corp. of Pennsylvania 1,910 55,677Valley National Bancorp 48,490 542,603Veritex Holdings, Inc. (A) 1,198 31,639Washington Trust Bancorp, Inc. 1,043 53,454WashingtonFirst Bankshares, Inc. 808 27,367Webster Financial Corp. 10,439 487,293Wells Fargo & Company 371,374 18,966,070WesBanco, Inc. 2,977 113,066Westamerica Bancorporation (B) 1,917 98,821Wintrust Financial Corp. 10,303 750,161Xenith Bankshares, Inc. (A) 453 12,978Zions Bancorporation 16,956 740,299
137,149,209Capital markets – 2.6%Affiliated Managers Group, Inc. 3,986 704,286Ameriprise Financial, Inc. 10,659 1,476,378Arlington Asset Investment Corp.,
Class A (B) 1,746 22,558Artisan Partners Asset Management, Inc.,
Class A 3,256 99,959Associated Capital Group, Inc., Class A 447 15,354B. Riley Financial, Inc. 1,086 17,810BlackRock, Inc. 8,498 3,560,747CBOE Holdings, Inc. 6,438 649,530CME Group, Inc. 23,834 2,998,317Cohen & Steers, Inc. 1,581 59,825Cowen, Inc. (A) 2,028 32,955Diamond Hill Investment Group, Inc. 235 46,138Donnelley Financial Solutions, Inc. (A) 1,919 41,086E*TRADE Financial Corp. (A) 19,446 797,480Eaton Vance Corp. 13,018 619,396Evercore, Inc., Class A 2,968 223,936FactSet Research Systems, Inc. 4,467 702,123Federated Investors, Inc., Class B 10,504 286,864Financial Engines, Inc. (B) 4,308 142,379Franklin Resources, Inc. 24,284 1,049,797GAIN Capital Holdings, Inc. 2,940 18,522GAMCO Investors, Inc., Class A 442 13,026Greenhill & Company, Inc. 2,027 30,506Hamilton Lane, Inc. Class A. 1,117 26,182Houlihan Lokey, Inc. 1,577 56,851Intercontinental Exchange, Inc. 41,579 2,688,914INTL. FCStone, Inc. (A) 1,133 40,210Invesco, Ltd. 28,515 934,722Investment Technology Group, Inc. 2,476 49,743Janus Henderson Group PLC 20,422 705,784Ladenburg Thalmann Financial
Services, Inc. (A) 7,624 19,594Legg Mason, Inc. 9,659 368,877MarketAxess Holdings, Inc. 4,255 821,002Moelis & Company, Class A 1,815 71,511Moody’s Corp. 11,725 1,571,502Morgan Stanley 100,089 4,554,050MSCI, Inc. 10,251 1,174,867Nasdaq, Inc. 8,020 604,548Northern Trust Corp. 15,228 1,347,678OM Asset Management PLC 4,039 57,071Oppenheimer Holdings, Inc., Class A 951 15,454Piper Jaffray Companies 1,048 58,112PJT Partners, Inc., Class A 1,315 50,838
John Hancock Funds IIPortfolio of Investments — August 31, 2017 (showing percentage of total net assets)
210
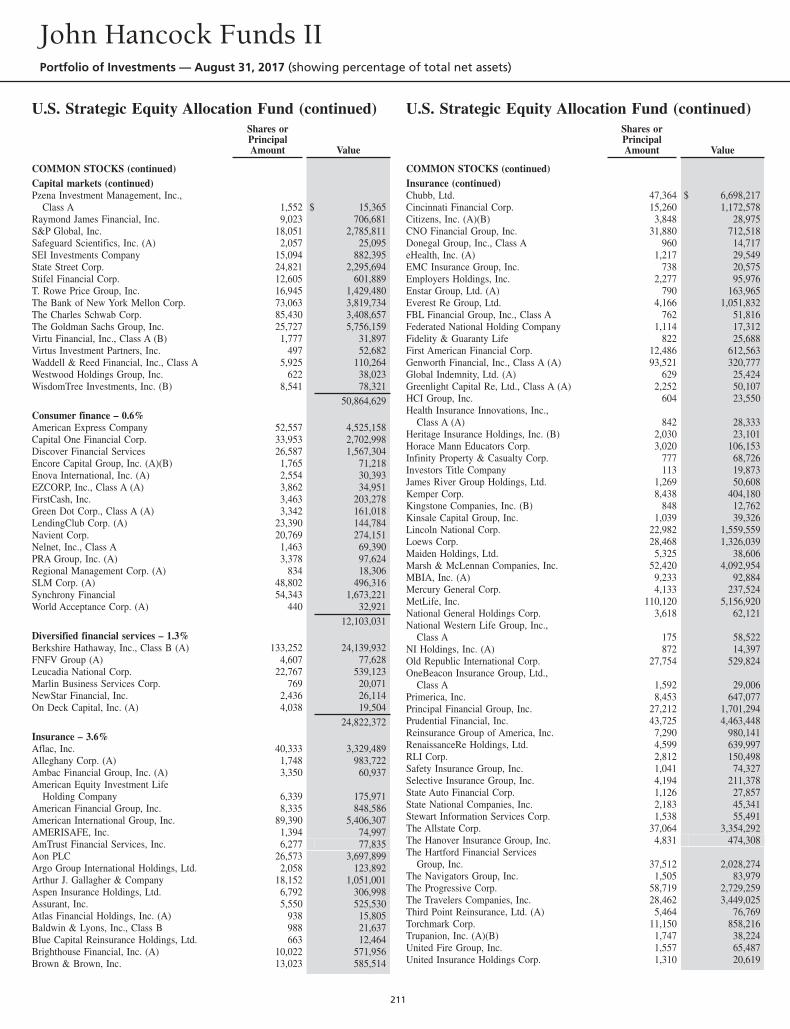
U.S. Strategic Equity Allocation Fund (continued)Shares orPrincipalAmount Value
COMMON STOCKS (continued)Capital markets (continued)Pzena Investment Management, Inc.,
Class A 1,552 $ 15,365Raymond James Financial, Inc. 9,023 706,681S&P Global, Inc. 18,051 2,785,811Safeguard Scientifics, Inc. (A) 2,057 25,095SEI Investments Company 15,094 882,395State Street Corp. 24,821 2,295,694Stifel Financial Corp. 12,605 601,889T. Rowe Price Group, Inc. 16,945 1,429,480The Bank of New York Mellon Corp. 73,063 3,819,734The Charles Schwab Corp. 85,430 3,408,657The Goldman Sachs Group, Inc. 25,727 5,756,159Virtu Financial, Inc., Class A (B) 1,777 31,897Virtus Investment Partners, Inc. 497 52,682Waddell & Reed Financial, Inc., Class A 5,925 110,264Westwood Holdings Group, Inc. 622 38,023WisdomTree Investments, Inc. (B) 8,541 78,321
50,864,629Consumer finance – 0.6%American Express Company 52,557 4,525,158Capital One Financial Corp. 33,953 2,702,998Discover Financial Services 26,587 1,567,304Encore Capital Group, Inc. (A)(B) 1,765 71,218Enova International, Inc. (A) 2,554 30,393EZCORP, Inc., Class A (A) 3,862 34,951FirstCash, Inc. 3,463 203,278Green Dot Corp., Class A (A) 3,342 161,018LendingClub Corp. (A) 23,390 144,784Navient Corp. 20,769 274,151Nelnet, Inc., Class A 1,463 69,390PRA Group, Inc. (A) 3,378 97,624Regional Management Corp. (A) 834 18,306SLM Corp. (A) 48,802 496,316Synchrony Financial 54,343 1,673,221World Acceptance Corp. (A) 440 32,921
12,103,031Diversified financial services – 1.3%Berkshire Hathaway, Inc., Class B (A) 133,252 24,139,932FNFV Group (A) 4,607 77,628Leucadia National Corp. 22,767 539,123Marlin Business Services Corp. 769 20,071NewStar Financial, Inc. 2,436 26,114On Deck Capital, Inc. (A) 4,038 19,504
24,822,372Insurance – 3.6%Aflac, Inc. 40,333 3,329,489Alleghany Corp. (A) 1,748 983,722Ambac Financial Group, Inc. (A) 3,350 60,937American Equity Investment Life
Holding Company 6,339 175,971American Financial Group, Inc. 8,335 848,586American International Group, Inc. 89,390 5,406,307AMERISAFE, Inc. 1,394 74,997AmTrust Financial Services, Inc. 6,277 77,835Aon PLC 26,573 3,697,899Argo Group International Holdings, Ltd. 2,058 123,892Arthur J. Gallagher & Company 18,152 1,051,001Aspen Insurance Holdings, Ltd. 6,792 306,998Assurant, Inc. 5,550 525,530Atlas Financial Holdings, Inc. (A) 938 15,805Baldwin & Lyons, Inc., Class B 988 21,637Blue Capital Reinsurance Holdings, Ltd. 663 12,464Brighthouse Financial, Inc. (A) 10,022 571,956Brown & Brown, Inc. 13,023 585,514
U.S. Strategic Equity Allocation Fund (continued)Shares orPrincipalAmount Value
COMMON STOCKS (continued)Insurance (continued)Chubb, Ltd. 47,364 $ 6,698,217Cincinnati Financial Corp. 15,260 1,172,578Citizens, Inc. (A)(B) 3,848 28,975CNO Financial Group, Inc. 31,880 712,518Donegal Group, Inc., Class A 960 14,717eHealth, Inc. (A) 1,217 29,549EMC Insurance Group, Inc. 738 20,575Employers Holdings, Inc. 2,277 95,976Enstar Group, Ltd. (A) 790 163,965Everest Re Group, Ltd. 4,166 1,051,832FBL Financial Group, Inc., Class A 762 51,816Federated National Holding Company 1,114 17,312Fidelity & Guaranty Life 822 25,688First American Financial Corp. 12,486 612,563Genworth Financial, Inc., Class A (A) 93,521 320,777Global Indemnity, Ltd. (A) 629 25,424Greenlight Capital Re, Ltd., Class A (A) 2,252 50,107HCI Group, Inc. 604 23,550Health Insurance Innovations, Inc.,
Class A (A) 842 28,333Heritage Insurance Holdings, Inc. (B) 2,030 23,101Horace Mann Educators Corp. 3,020 106,153Infinity Property & Casualty Corp. 777 68,726Investors Title Company 113 19,873James River Group Holdings, Ltd. 1,269 50,608Kemper Corp. 8,438 404,180Kingstone Companies, Inc. (B) 848 12,762Kinsale Capital Group, Inc. 1,039 39,326Lincoln National Corp. 22,982 1,559,559Loews Corp. 28,468 1,326,039Maiden Holdings, Ltd. 5,325 38,606Marsh & McLennan Companies, Inc. 52,420 4,092,954MBIA, Inc. (A) 9,233 92,884Mercury General Corp. 4,133 237,524MetLife, Inc. 110,120 5,156,920National General Holdings Corp. 3,618 62,121National Western Life Group, Inc.,
Class A 175 58,522NI Holdings, Inc. (A) 872 14,397Old Republic International Corp. 27,754 529,824OneBeacon Insurance Group, Ltd.,
Class A 1,592 29,006Primerica, Inc. 8,453 647,077Principal Financial Group, Inc. 27,212 1,701,294Prudential Financial, Inc. 43,725 4,463,448Reinsurance Group of America, Inc. 7,290 980,141RenaissanceRe Holdings, Ltd. 4,599 639,997RLI Corp. 2,812 150,498Safety Insurance Group, Inc. 1,041 74,327Selective Insurance Group, Inc. 4,194 211,378State Auto Financial Corp. 1,126 27,857State National Companies, Inc. 2,183 45,341Stewart Information Services Corp. 1,538 55,491The Allstate Corp. 37,064 3,354,292The Hanover Insurance Group, Inc. 4,831 474,308The Hartford Financial Services
Group, Inc. 37,512 2,028,274The Navigators Group, Inc. 1,505 83,979The Progressive Corp. 58,719 2,729,259The Travelers Companies, Inc. 28,462 3,449,025Third Point Reinsurance, Ltd. (A) 5,464 76,769Torchmark Corp. 11,150 858,216Trupanion, Inc. (A)(B) 1,747 38,224United Fire Group, Inc. 1,557 65,487United Insurance Holdings Corp. 1,310 20,619
John Hancock Funds IIPortfolio of Investments — August 31, 2017 (showing percentage of total net assets)
211
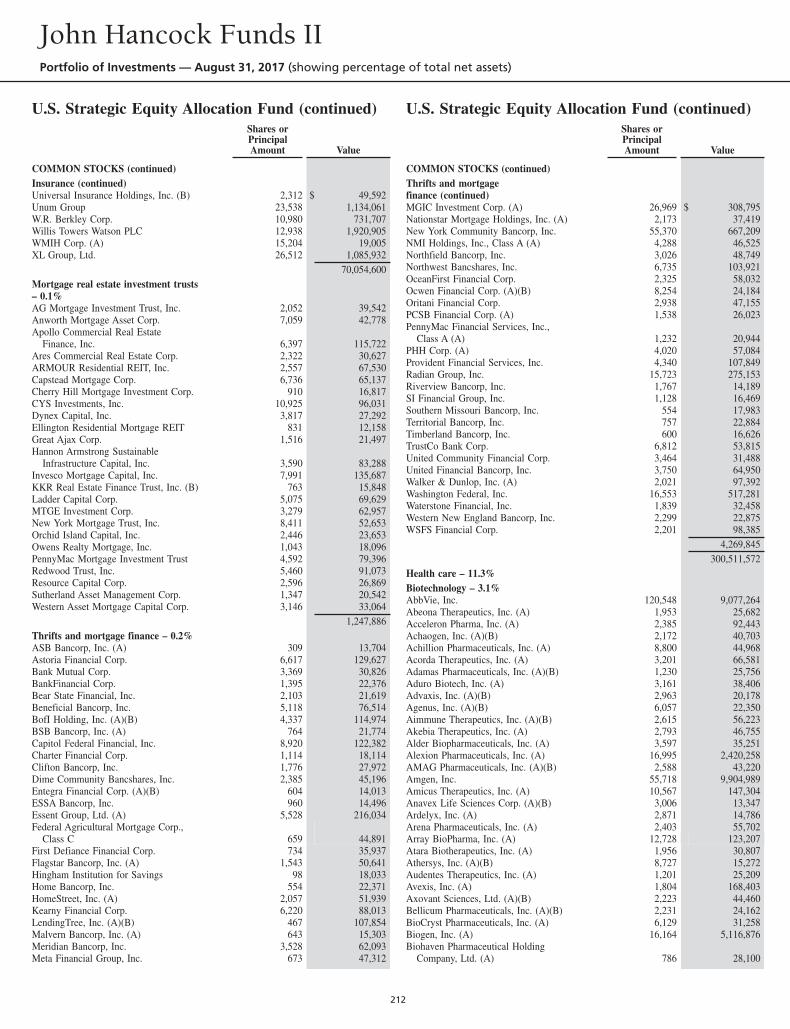
U.S. Strategic Equity Allocation Fund (continued)Shares orPrincipalAmount Value
COMMON STOCKS (continued)Insurance (continued)Universal Insurance Holdings, Inc. (B) 2,312 $ 49,592Unum Group 23,538 1,134,061W.R. Berkley Corp. 10,980 731,707Willis Towers Watson PLC 12,938 1,920,905WMIH Corp. (A) 15,204 19,005XL Group, Ltd. 26,512 1,085,932
70,054,600Mortgage real estate investment trusts– 0.1%AG Mortgage Investment Trust, Inc. 2,052 39,542Anworth Mortgage Asset Corp. 7,059 42,778Apollo Commercial Real Estate
Finance, Inc. 6,397 115,722Ares Commercial Real Estate Corp. 2,322 30,627ARMOUR Residential REIT, Inc. 2,557 67,530Capstead Mortgage Corp. 6,736 65,137Cherry Hill Mortgage Investment Corp. 910 16,817CYS Investments, Inc. 10,925 96,031Dynex Capital, Inc. 3,817 27,292Ellington Residential Mortgage REIT 831 12,158Great Ajax Corp. 1,516 21,497Hannon Armstrong Sustainable
Infrastructure Capital, Inc. 3,590 83,288Invesco Mortgage Capital, Inc. 7,991 135,687KKR Real Estate Finance Trust, Inc. (B) 763 15,848Ladder Capital Corp. 5,075 69,629MTGE Investment Corp. 3,279 62,957New York Mortgage Trust, Inc. 8,411 52,653Orchid Island Capital, Inc. 2,446 23,653Owens Realty Mortgage, Inc. 1,043 18,096PennyMac Mortgage Investment Trust 4,592 79,396Redwood Trust, Inc. 5,460 91,073Resource Capital Corp. 2,596 26,869Sutherland Asset Management Corp. 1,347 20,542Western Asset Mortgage Capital Corp. 3,146 33,064
1,247,886Thrifts and mortgage finance – 0.2%ASB Bancorp, Inc. (A) 309 13,704Astoria Financial Corp. 6,617 129,627Bank Mutual Corp. 3,369 30,826BankFinancial Corp. 1,395 22,376Bear State Financial, Inc. 2,103 21,619Beneficial Bancorp, Inc. 5,118 76,514BofI Holding, Inc. (A)(B) 4,337 114,974BSB Bancorp, Inc. (A) 764 21,774Capitol Federal Financial, Inc. 8,920 122,382Charter Financial Corp. 1,114 18,114Clifton Bancorp, Inc. 1,776 27,972Dime Community Bancshares, Inc. 2,385 45,196Entegra Financial Corp. (A)(B) 604 14,013ESSA Bancorp, Inc. 960 14,496Essent Group, Ltd. (A) 5,528 216,034Federal Agricultural Mortgage Corp.,
Class C 659 44,891First Defiance Financial Corp. 734 35,937Flagstar Bancorp, Inc. (A) 1,543 50,641Hingham Institution for Savings 98 18,033Home Bancorp, Inc. 554 22,371HomeStreet, Inc. (A) 2,057 51,939Kearny Financial Corp. 6,220 88,013LendingTree, Inc. (A)(B) 467 107,854Malvern Bancorp, Inc. (A) 643 15,303Meridian Bancorp, Inc. 3,528 62,093Meta Financial Group, Inc. 673 47,312
U.S. Strategic Equity Allocation Fund (continued)Shares orPrincipalAmount Value
COMMON STOCKS (continued)Thrifts and mortgagefinance (continued)MGIC Investment Corp. (A) 26,969 $ 308,795Nationstar Mortgage Holdings, Inc. (A) 2,173 37,419New York Community Bancorp, Inc. 55,370 667,209NMI Holdings, Inc., Class A (A) 4,288 46,525Northfield Bancorp, Inc. 3,026 48,749Northwest Bancshares, Inc. 6,735 103,921OceanFirst Financial Corp. 2,325 58,032Ocwen Financial Corp. (A)(B) 8,254 24,184Oritani Financial Corp. 2,938 47,155PCSB Financial Corp. (A) 1,538 26,023PennyMac Financial Services, Inc.,
Class A (A) 1,232 20,944PHH Corp. (A) 4,020 57,084Provident Financial Services, Inc. 4,340 107,849Radian Group, Inc. 15,723 275,153Riverview Bancorp, Inc. 1,767 14,189SI Financial Group, Inc. 1,128 16,469Southern Missouri Bancorp, Inc. 554 17,983Territorial Bancorp, Inc. 757 22,884Timberland Bancorp, Inc. 600 16,626TrustCo Bank Corp. 6,812 53,815United Community Financial Corp. 3,464 31,488United Financial Bancorp, Inc. 3,750 64,950Walker & Dunlop, Inc. (A) 2,021 97,392Washington Federal, Inc. 16,553 517,281Waterstone Financial, Inc. 1,839 32,458Western New England Bancorp, Inc. 2,299 22,875WSFS Financial Corp. 2,201 98,385
4,269,845300,511,572
Health care – 11.3%Biotechnology – 3.1%AbbVie, Inc. 120,548 9,077,264Abeona Therapeutics, Inc. (A) 1,953 25,682Acceleron Pharma, Inc. (A) 2,385 92,443Achaogen, Inc. (A)(B) 2,172 40,703Achillion Pharmaceuticals, Inc. (A) 8,800 44,968Acorda Therapeutics, Inc. (A) 3,201 66,581Adamas Pharmaceuticals, Inc. (A)(B) 1,230 25,756Aduro Biotech, Inc. (A) 3,161 38,406Advaxis, Inc. (A)(B) 2,963 20,178Agenus, Inc. (A)(B) 6,057 22,350Aimmune Therapeutics, Inc. (A)(B) 2,615 56,223Akebia Therapeutics, Inc. (A) 2,793 46,755Alder Biopharmaceuticals, Inc. (A) 3,597 35,251Alexion Pharmaceuticals, Inc. (A) 16,995 2,420,258AMAG Pharmaceuticals, Inc. (A)(B) 2,588 43,220Amgen, Inc. 55,718 9,904,989Amicus Therapeutics, Inc. (A) 10,567 147,304Anavex Life Sciences Corp. (A)(B) 3,006 13,347Ardelyx, Inc. (A) 2,871 14,786Arena Pharmaceuticals, Inc. (A) 2,403 55,702Array BioPharma, Inc. (A) 12,728 123,207Atara Biotherapeutics, Inc. (A) 1,956 30,807Athersys, Inc. (A)(B) 8,727 15,272Audentes Therapeutics, Inc. (A) 1,201 25,209Avexis, Inc. (A) 1,804 168,403Axovant Sciences, Ltd. (A)(B) 2,223 44,460Bellicum Pharmaceuticals, Inc. (A)(B) 2,231 24,162BioCryst Pharmaceuticals, Inc. (A) 6,129 31,258Biogen, Inc. (A) 16,164 5,116,876Biohaven Pharmaceutical Holding
Company, Ltd. (A) 786 28,100
John Hancock Funds IIPortfolio of Investments — August 31, 2017 (showing percentage of total net assets)
212
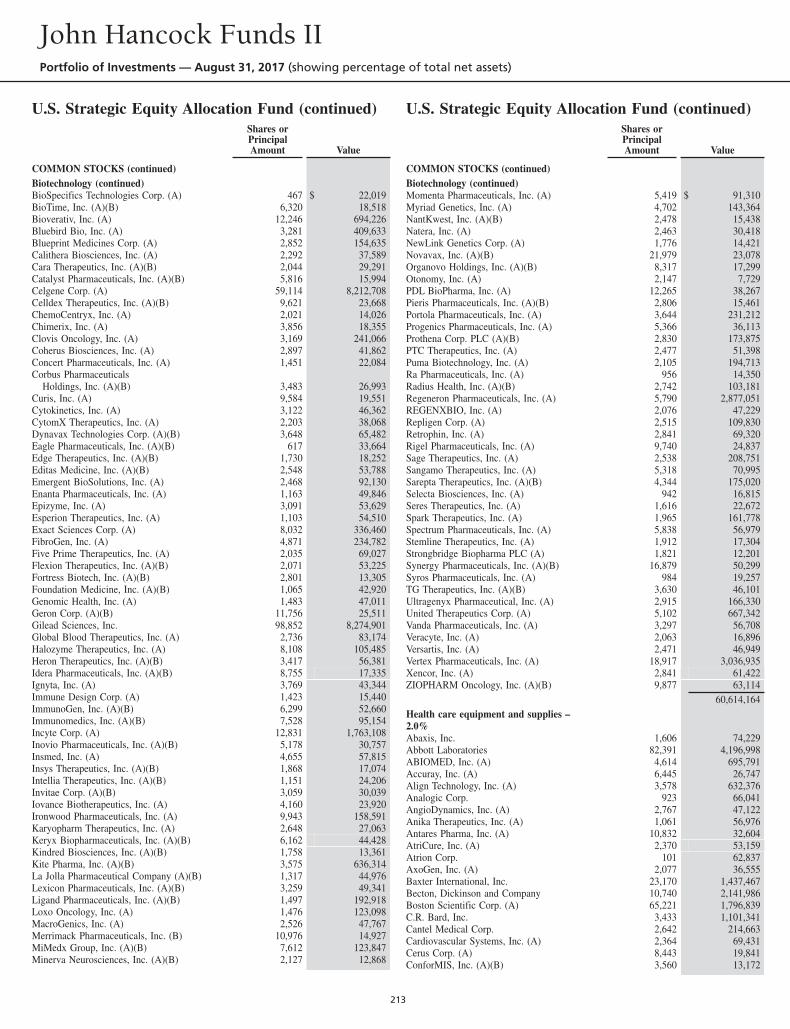
U.S. Strategic Equity Allocation Fund (continued)Shares orPrincipalAmount Value
COMMON STOCKS (continued)Biotechnology (continued)BioSpecifics Technologies Corp. (A) 467 $ 22,019BioTime, Inc. (A)(B) 6,320 18,518Bioverativ, Inc. (A) 12,246 694,226Bluebird Bio, Inc. (A) 3,281 409,633Blueprint Medicines Corp. (A) 2,852 154,635Calithera Biosciences, Inc. (A) 2,292 37,589Cara Therapeutics, Inc. (A)(B) 2,044 29,291Catalyst Pharmaceuticals, Inc. (A)(B) 5,816 15,994Celgene Corp. (A) 59,114 8,212,708Celldex Therapeutics, Inc. (A)(B) 9,621 23,668ChemoCentryx, Inc. (A) 2,021 14,026Chimerix, Inc. (A) 3,856 18,355Clovis Oncology, Inc. (A) 3,169 241,066Coherus Biosciences, Inc. (A) 2,897 41,862Concert Pharmaceuticals, Inc. (A) 1,451 22,084Corbus Pharmaceuticals
Holdings, Inc. (A)(B) 3,483 26,993Curis, Inc. (A) 9,584 19,551Cytokinetics, Inc. (A) 3,122 46,362CytomX Therapeutics, Inc. (A) 2,203 38,068Dynavax Technologies Corp. (A)(B) 3,648 65,482Eagle Pharmaceuticals, Inc. (A)(B) 617 33,664Edge Therapeutics, Inc. (A)(B) 1,730 18,252Editas Medicine, Inc. (A)(B) 2,548 53,788Emergent BioSolutions, Inc. (A) 2,468 92,130Enanta Pharmaceuticals, Inc. (A) 1,163 49,846Epizyme, Inc. (A) 3,091 53,629Esperion Therapeutics, Inc. (A) 1,103 54,510Exact Sciences Corp. (A) 8,032 336,460FibroGen, Inc. (A) 4,871 234,782Five Prime Therapeutics, Inc. (A) 2,035 69,027Flexion Therapeutics, Inc. (A)(B) 2,071 53,225Fortress Biotech, Inc. (A)(B) 2,801 13,305Foundation Medicine, Inc. (A)(B) 1,065 42,920Genomic Health, Inc. (A) 1,483 47,011Geron Corp. (A)(B) 11,756 25,511Gilead Sciences, Inc. 98,852 8,274,901Global Blood Therapeutics, Inc. (A) 2,736 83,174Halozyme Therapeutics, Inc. (A) 8,108 105,485Heron Therapeutics, Inc. (A)(B) 3,417 56,381Idera Pharmaceuticals, Inc. (A)(B) 8,755 17,335Ignyta, Inc. (A) 3,769 43,344Immune Design Corp. (A) 1,423 15,440ImmunoGen, Inc. (A)(B) 6,299 52,660Immunomedics, Inc. (A)(B) 7,528 95,154Incyte Corp. (A) 12,831 1,763,108Inovio Pharmaceuticals, Inc. (A)(B) 5,178 30,757Insmed, Inc. (A) 4,655 57,815Insys Therapeutics, Inc. (A)(B) 1,868 17,074Intellia Therapeutics, Inc. (A)(B) 1,151 24,206Invitae Corp. (A)(B) 3,059 30,039Iovance Biotherapeutics, Inc. (A) 4,160 23,920Ironwood Pharmaceuticals, Inc. (A) 9,943 158,591Karyopharm Therapeutics, Inc. (A) 2,648 27,063Keryx Biopharmaceuticals, Inc. (A)(B) 6,162 44,428Kindred Biosciences, Inc. (A)(B) 1,758 13,361Kite Pharma, Inc. (A)(B) 3,575 636,314La Jolla Pharmaceutical Company (A)(B) 1,317 44,976Lexicon Pharmaceuticals, Inc. (A)(B) 3,259 49,341Ligand Pharmaceuticals, Inc. (A)(B) 1,497 192,918Loxo Oncology, Inc. (A) 1,476 123,098MacroGenics, Inc. (A) 2,526 47,767Merrimack Pharmaceuticals, Inc. (B) 10,976 14,927MiMedx Group, Inc. (A)(B) 7,612 123,847Minerva Neurosciences, Inc. (A)(B) 2,127 12,868
U.S. Strategic Equity Allocation Fund (continued)Shares orPrincipalAmount Value
COMMON STOCKS (continued)Biotechnology (continued)Momenta Pharmaceuticals, Inc. (A) 5,419 $ 91,310Myriad Genetics, Inc. (A) 4,702 143,364NantKwest, Inc. (A)(B) 2,478 15,438Natera, Inc. (A) 2,463 30,418NewLink Genetics Corp. (A) 1,776 14,421Novavax, Inc. (A)(B) 21,979 23,078Organovo Holdings, Inc. (A)(B) 8,317 17,299Otonomy, Inc. (A) 2,147 7,729PDL BioPharma, Inc. (A) 12,265 38,267Pieris Pharmaceuticals, Inc. (A)(B) 2,806 15,461Portola Pharmaceuticals, Inc. (A) 3,644 231,212Progenics Pharmaceuticals, Inc. (A) 5,366 36,113Prothena Corp. PLC (A)(B) 2,830 173,875PTC Therapeutics, Inc. (A) 2,477 51,398Puma Biotechnology, Inc. (A) 2,105 194,713Ra Pharmaceuticals, Inc. (A) 956 14,350Radius Health, Inc. (A)(B) 2,742 103,181Regeneron Pharmaceuticals, Inc. (A) 5,790 2,877,051REGENXBIO, Inc. (A) 2,076 47,229Repligen Corp. (A) 2,515 109,830Retrophin, Inc. (A) 2,841 69,320Rigel Pharmaceuticals, Inc. (A) 9,740 24,837Sage Therapeutics, Inc. (A) 2,538 208,751Sangamo Therapeutics, Inc. (A) 5,318 70,995Sarepta Therapeutics, Inc. (A)(B) 4,344 175,020Selecta Biosciences, Inc. (A) 942 16,815Seres Therapeutics, Inc. (A) 1,616 22,672Spark Therapeutics, Inc. (A) 1,965 161,778Spectrum Pharmaceuticals, Inc. (A) 5,838 56,979Stemline Therapeutics, Inc. (A) 1,912 17,304Strongbridge Biopharma PLC (A) 1,821 12,201Synergy Pharmaceuticals, Inc. (A)(B) 16,879 50,299Syros Pharmaceuticals, Inc. (A) 984 19,257TG Therapeutics, Inc. (A)(B) 3,630 46,101Ultragenyx Pharmaceutical, Inc. (A) 2,915 166,330United Therapeutics Corp. (A) 5,102 667,342Vanda Pharmaceuticals, Inc. (A) 3,297 56,708Veracyte, Inc. (A) 2,063 16,896Versartis, Inc. (A) 2,471 46,949Vertex Pharmaceuticals, Inc. (A) 18,917 3,036,935Xencor, Inc. (A) 2,841 61,422ZIOPHARM Oncology, Inc. (A)(B) 9,877 63,114
60,614,164Health care equipment and supplies –2.0%Abaxis, Inc. 1,606 74,229Abbott Laboratories 82,391 4,196,998ABIOMED, Inc. (A) 4,614 695,791Accuray, Inc. (A) 6,445 26,747Align Technology, Inc. (A) 3,578 632,376Analogic Corp. 923 66,041AngioDynamics, Inc. (A) 2,767 47,122Anika Therapeutics, Inc. (A) 1,061 56,976Antares Pharma, Inc. (A) 10,832 32,604AtriCure, Inc. (A) 2,370 53,159Atrion Corp. 101 62,837AxoGen, Inc. (A) 2,077 36,555Baxter International, Inc. 23,170 1,437,467Becton, Dickinson and Company 10,740 2,141,986Boston Scientific Corp. (A) 65,221 1,796,839C.R. Bard, Inc. 3,433 1,101,341Cantel Medical Corp. 2,642 214,663Cardiovascular Systems, Inc. (A) 2,364 69,431Cerus Corp. (A) 8,443 19,841ConforMIS, Inc. (A)(B) 3,560 13,172
John Hancock Funds IIPortfolio of Investments — August 31, 2017 (showing percentage of total net assets)
213
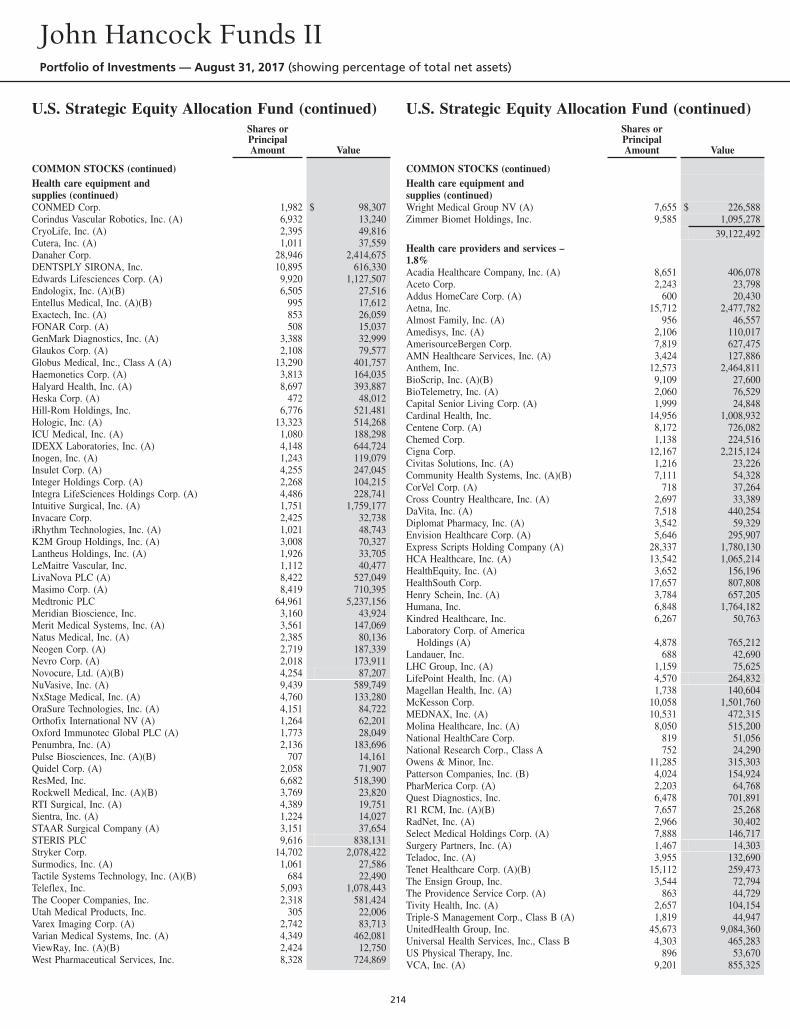
U.S. Strategic Equity Allocation Fund (continued)Shares orPrincipalAmount Value
COMMON STOCKS (continued)Health care equipment andsupplies (continued)CONMED Corp. 1,982 $ 98,307Corindus Vascular Robotics, Inc. (A) 6,932 13,240CryoLife, Inc. (A) 2,395 49,816Cutera, Inc. (A) 1,011 37,559Danaher Corp. 28,946 2,414,675DENTSPLY SIRONA, Inc. 10,895 616,330Edwards Lifesciences Corp. (A) 9,920 1,127,507Endologix, Inc. (A)(B) 6,505 27,516Entellus Medical, Inc. (A)(B) 995 17,612Exactech, Inc. (A) 853 26,059FONAR Corp. (A) 508 15,037GenMark Diagnostics, Inc. (A) 3,388 32,999Glaukos Corp. (A) 2,108 79,577Globus Medical, Inc., Class A (A) 13,290 401,757Haemonetics Corp. (A) 3,813 164,035Halyard Health, Inc. (A) 8,697 393,887Heska Corp. (A) 472 48,012Hill-Rom Holdings, Inc. 6,776 521,481Hologic, Inc. (A) 13,323 514,268ICU Medical, Inc. (A) 1,080 188,298IDEXX Laboratories, Inc. (A) 4,148 644,724Inogen, Inc. (A) 1,243 119,079Insulet Corp. (A) 4,255 247,045Integer Holdings Corp. (A) 2,268 104,215Integra LifeSciences Holdings Corp. (A) 4,486 228,741Intuitive Surgical, Inc. (A) 1,751 1,759,177Invacare Corp. 2,425 32,738iRhythm Technologies, Inc. (A) 1,021 48,743K2M Group Holdings, Inc. (A) 3,008 70,327Lantheus Holdings, Inc. (A) 1,926 33,705LeMaitre Vascular, Inc. 1,112 40,477LivaNova PLC (A) 8,422 527,049Masimo Corp. (A) 8,419 710,395Medtronic PLC 64,961 5,237,156Meridian Bioscience, Inc. 3,160 43,924Merit Medical Systems, Inc. (A) 3,561 147,069Natus Medical, Inc. (A) 2,385 80,136Neogen Corp. (A) 2,719 187,339Nevro Corp. (A) 2,018 173,911Novocure, Ltd. (A)(B) 4,254 87,207NuVasive, Inc. (A) 9,439 589,749NxStage Medical, Inc. (A) 4,760 133,280OraSure Technologies, Inc. (A) 4,151 84,722Orthofix International NV (A) 1,264 62,201Oxford Immunotec Global PLC (A) 1,773 28,049Penumbra, Inc. (A) 2,136 183,696Pulse Biosciences, Inc. (A)(B) 707 14,161Quidel Corp. (A) 2,058 71,907ResMed, Inc. 6,682 518,390Rockwell Medical, Inc. (A)(B) 3,769 23,820RTI Surgical, Inc. (A) 4,389 19,751Sientra, Inc. (A) 1,224 14,027STAAR Surgical Company (A) 3,151 37,654STERIS PLC 9,616 838,131Stryker Corp. 14,702 2,078,422Surmodics, Inc. (A) 1,061 27,586Tactile Systems Technology, Inc. (A)(B) 684 22,490Teleflex, Inc. 5,093 1,078,443The Cooper Companies, Inc. 2,318 581,424Utah Medical Products, Inc. 305 22,006Varex Imaging Corp. (A) 2,742 83,713Varian Medical Systems, Inc. (A) 4,349 462,081ViewRay, Inc. (A)(B) 2,424 12,750West Pharmaceutical Services, Inc. 8,328 724,869
U.S. Strategic Equity Allocation Fund (continued)Shares orPrincipalAmount Value
COMMON STOCKS (continued)Health care equipment andsupplies (continued)Wright Medical Group NV (A) 7,655 $ 226,588Zimmer Biomet Holdings, Inc. 9,585 1,095,278
39,122,492Health care providers and services –1.8%Acadia Healthcare Company, Inc. (A) 8,651 406,078Aceto Corp. 2,243 23,798Addus HomeCare Corp. (A) 600 20,430Aetna, Inc. 15,712 2,477,782Almost Family, Inc. (A) 956 46,557Amedisys, Inc. (A) 2,106 110,017AmerisourceBergen Corp. 7,819 627,475AMN Healthcare Services, Inc. (A) 3,424 127,886Anthem, Inc. 12,573 2,464,811BioScrip, Inc. (A)(B) 9,109 27,600BioTelemetry, Inc. (A) 2,060 76,529Capital Senior Living Corp. (A) 1,999 24,848Cardinal Health, Inc. 14,956 1,008,932Centene Corp. (A) 8,172 726,082Chemed Corp. 1,138 224,516Cigna Corp. 12,167 2,215,124Civitas Solutions, Inc. (A) 1,216 23,226Community Health Systems, Inc. (A)(B) 7,111 54,328CorVel Corp. (A) 718 37,264Cross Country Healthcare, Inc. (A) 2,697 33,389DaVita, Inc. (A) 7,518 440,254Diplomat Pharmacy, Inc. (A) 3,542 59,329Envision Healthcare Corp. (A) 5,646 295,907Express Scripts Holding Company (A) 28,337 1,780,130HCA Healthcare, Inc. (A) 13,542 1,065,214HealthEquity, Inc. (A) 3,652 156,196HealthSouth Corp. 17,657 807,808Henry Schein, Inc. (A) 3,784 657,205Humana, Inc. 6,848 1,764,182Kindred Healthcare, Inc. 6,267 50,763Laboratory Corp. of America
Holdings (A) 4,878 765,212Landauer, Inc. 688 42,690LHC Group, Inc. (A) 1,159 75,625LifePoint Health, Inc. (A) 4,570 264,832Magellan Health, Inc. (A) 1,738 140,604McKesson Corp. 10,058 1,501,760MEDNAX, Inc. (A) 10,531 472,315Molina Healthcare, Inc. (A) 8,050 515,200National HealthCare Corp. 819 51,056National Research Corp., Class A 752 24,290Owens & Minor, Inc. 11,285 315,303Patterson Companies, Inc. (B) 4,024 154,924PharMerica Corp. (A) 2,203 64,768Quest Diagnostics, Inc. 6,478 701,891R1 RCM, Inc. (A)(B) 7,657 25,268RadNet, Inc. (A) 2,966 30,402Select Medical Holdings Corp. (A) 7,888 146,717Surgery Partners, Inc. (A) 1,467 14,303Teladoc, Inc. (A) 3,955 132,690Tenet Healthcare Corp. (A)(B) 15,112 259,473The Ensign Group, Inc. 3,544 72,794The Providence Service Corp. (A) 863 44,729Tivity Health, Inc. (A) 2,657 104,154Triple-S Management Corp., Class B (A) 1,819 44,947UnitedHealth Group, Inc. 45,673 9,084,360Universal Health Services, Inc., Class B 4,303 465,283US Physical Therapy, Inc. 896 53,670VCA, Inc. (A) 9,201 855,325
John Hancock Funds IIPortfolio of Investments — August 31, 2017 (showing percentage of total net assets)
214
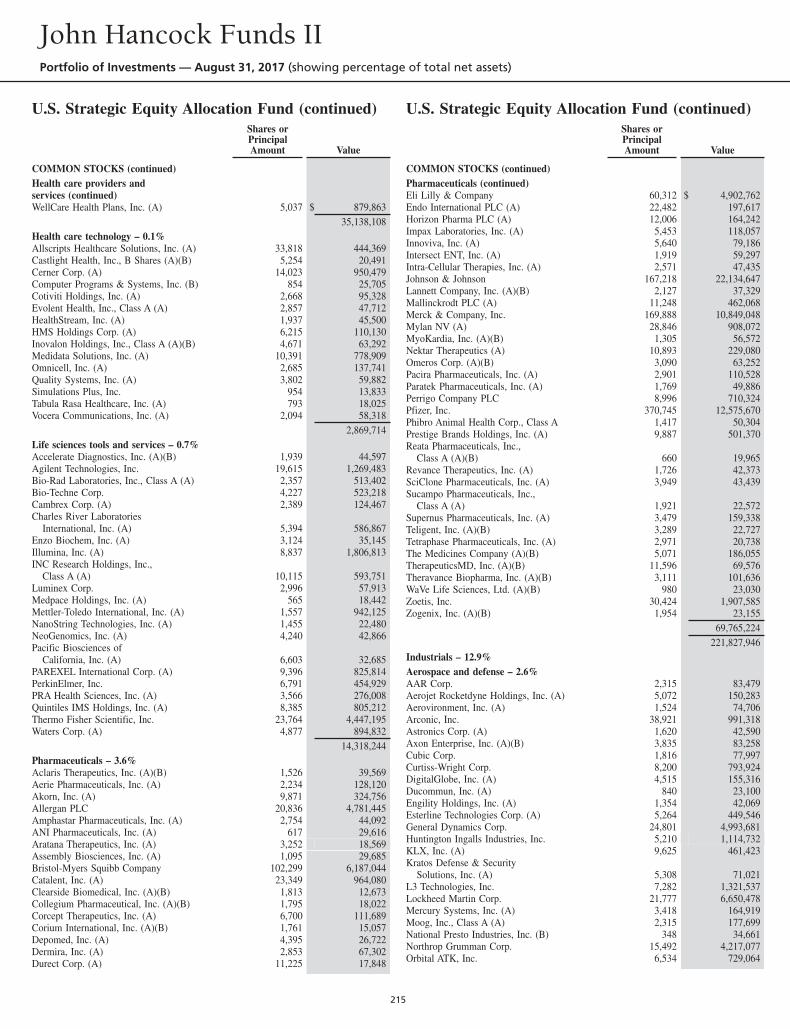
U.S. Strategic Equity Allocation Fund (continued)Shares orPrincipalAmount Value
COMMON STOCKS (continued)Health care providers andservices (continued)WellCare Health Plans, Inc. (A) 5,037 $ 879,863
35,138,108Health care technology – 0.1%Allscripts Healthcare Solutions, Inc. (A) 33,818 444,369Castlight Health, Inc., B Shares (A)(B) 5,254 20,491Cerner Corp. (A) 14,023 950,479Computer Programs & Systems, Inc. (B) 854 25,705Cotiviti Holdings, Inc. (A) 2,668 95,328Evolent Health, Inc., Class A (A) 2,857 47,712HealthStream, Inc. (A) 1,937 45,500HMS Holdings Corp. (A) 6,215 110,130Inovalon Holdings, Inc., Class A (A)(B) 4,671 63,292Medidata Solutions, Inc. (A) 10,391 778,909Omnicell, Inc. (A) 2,685 137,741Quality Systems, Inc. (A) 3,802 59,882Simulations Plus, Inc. 954 13,833Tabula Rasa Healthcare, Inc. (A) 793 18,025Vocera Communications, Inc. (A) 2,094 58,318
2,869,714Life sciences tools and services – 0.7%Accelerate Diagnostics, Inc. (A)(B) 1,939 44,597Agilent Technologies, Inc. 19,615 1,269,483Bio-Rad Laboratories, Inc., Class A (A) 2,357 513,402Bio-Techne Corp. 4,227 523,218Cambrex Corp. (A) 2,389 124,467Charles River Laboratories
International, Inc. (A) 5,394 586,867Enzo Biochem, Inc. (A) 3,124 35,145Illumina, Inc. (A) 8,837 1,806,813INC Research Holdings, Inc.,
Class A (A) 10,115 593,751Luminex Corp. 2,996 57,913Medpace Holdings, Inc. (A) 565 18,442Mettler-Toledo International, Inc. (A) 1,557 942,125NanoString Technologies, Inc. (A) 1,455 22,480NeoGenomics, Inc. (A) 4,240 42,866Pacific Biosciences of
California, Inc. (A) 6,603 32,685PAREXEL International Corp. (A) 9,396 825,814PerkinElmer, Inc. 6,791 454,929PRA Health Sciences, Inc. (A) 3,566 276,008Quintiles IMS Holdings, Inc. (A) 8,385 805,212Thermo Fisher Scientific, Inc. 23,764 4,447,195Waters Corp. (A) 4,877 894,832
14,318,244Pharmaceuticals – 3.6%Aclaris Therapeutics, Inc. (A)(B) 1,526 39,569Aerie Pharmaceuticals, Inc. (A) 2,234 128,120Akorn, Inc. (A) 9,871 324,756Allergan PLC 20,836 4,781,445Amphastar Pharmaceuticals, Inc. (A) 2,754 44,092ANI Pharmaceuticals, Inc. (A) 617 29,616Aratana Therapeutics, Inc. (A) 3,252 18,569Assembly Biosciences, Inc. (A) 1,095 29,685Bristol-Myers Squibb Company 102,299 6,187,044Catalent, Inc. (A) 23,349 964,080Clearside Biomedical, Inc. (A)(B) 1,813 12,673Collegium Pharmaceutical, Inc. (A)(B) 1,795 18,022Corcept Therapeutics, Inc. (A) 6,700 111,689Corium International, Inc. (A)(B) 1,761 15,057Depomed, Inc. (A) 4,395 26,722Dermira, Inc. (A) 2,853 67,302Durect Corp. (A) 11,225 17,848
U.S. Strategic Equity Allocation Fund (continued)Shares orPrincipalAmount Value
COMMON STOCKS (continued)Pharmaceuticals (continued)Eli Lilly & Company 60,312 $ 4,902,762Endo International PLC (A) 22,482 197,617Horizon Pharma PLC (A) 12,006 164,242Impax Laboratories, Inc. (A) 5,453 118,057Innoviva, Inc. (A) 5,640 79,186Intersect ENT, Inc. (A) 1,919 59,297Intra-Cellular Therapies, Inc. (A) 2,571 47,435Johnson & Johnson 167,218 22,134,647Lannett Company, Inc. (A)(B) 2,127 37,329Mallinckrodt PLC (A) 11,248 462,068Merck & Company, Inc. 169,888 10,849,048Mylan NV (A) 28,846 908,072MyoKardia, Inc. (A)(B) 1,305 56,572Nektar Therapeutics (A) 10,893 229,080Omeros Corp. (A)(B) 3,090 63,252Pacira Pharmaceuticals, Inc. (A) 2,901 110,528Paratek Pharmaceuticals, Inc. (A) 1,769 49,886Perrigo Company PLC 8,996 710,324Pfizer, Inc. 370,745 12,575,670Phibro Animal Health Corp., Class A 1,417 50,304Prestige Brands Holdings, Inc. (A) 9,887 501,370Reata Pharmaceuticals, Inc.,
Class A (A)(B) 660 19,965Revance Therapeutics, Inc. (A) 1,726 42,373SciClone Pharmaceuticals, Inc. (A) 3,949 43,439Sucampo Pharmaceuticals, Inc.,
Class A (A) 1,921 22,572Supernus Pharmaceuticals, Inc. (A) 3,479 159,338Teligent, Inc. (A)(B) 3,289 22,727Tetraphase Pharmaceuticals, Inc. (A) 2,971 20,738The Medicines Company (A)(B) 5,071 186,055TherapeuticsMD, Inc. (A)(B) 11,596 69,576Theravance Biopharma, Inc. (A)(B) 3,111 101,636WaVe Life Sciences, Ltd. (A)(B) 980 23,030Zoetis, Inc. 30,424 1,907,585Zogenix, Inc. (A)(B) 1,954 23,155
69,765,224221,827,946
Industrials – 12.9%Aerospace and defense – 2.6%AAR Corp. 2,315 83,479Aerojet Rocketdyne Holdings, Inc. (A) 5,072 150,283Aerovironment, Inc. (A) 1,524 74,706Arconic, Inc. 38,921 991,318Astronics Corp. (A) 1,620 42,590Axon Enterprise, Inc. (A)(B) 3,835 83,258Cubic Corp. 1,816 77,997Curtiss-Wright Corp. 8,200 793,924DigitalGlobe, Inc. (A) 4,515 155,316Ducommun, Inc. (A) 840 23,100Engility Holdings, Inc. (A) 1,354 42,069Esterline Technologies Corp. (A) 5,264 449,546General Dynamics Corp. 24,801 4,993,681Huntington Ingalls Industries, Inc. 5,210 1,114,732KLX, Inc. (A) 9,625 461,423Kratos Defense & Security
Solutions, Inc. (A) 5,308 71,021L3 Technologies, Inc. 7,282 1,321,537Lockheed Martin Corp. 21,777 6,650,478Mercury Systems, Inc. (A) 3,418 164,919Moog, Inc., Class A (A) 2,315 177,699National Presto Industries, Inc. (B) 348 34,661Northrop Grumman Corp. 15,492 4,217,077Orbital ATK, Inc. 6,534 729,064
John Hancock Funds IIPortfolio of Investments — August 31, 2017 (showing percentage of total net assets)
215
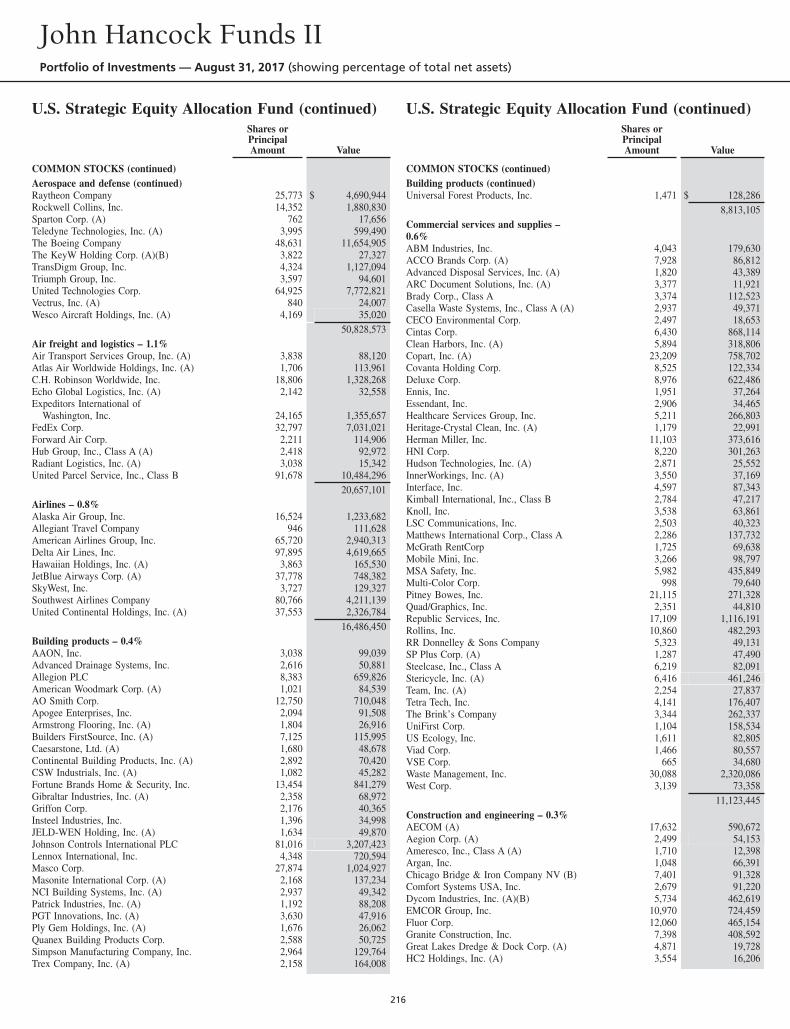
U.S. Strategic Equity Allocation Fund (continued)Shares orPrincipalAmount Value
COMMON STOCKS (continued)Aerospace and defense (continued)Raytheon Company 25,773 $ 4,690,944Rockwell Collins, Inc. 14,352 1,880,830Sparton Corp. (A) 762 17,656Teledyne Technologies, Inc. (A) 3,995 599,490The Boeing Company 48,631 11,654,905The KeyW Holding Corp. (A)(B) 3,822 27,327TransDigm Group, Inc. 4,324 1,127,094Triumph Group, Inc. 3,597 94,601United Technologies Corp. 64,925 7,772,821Vectrus, Inc. (A) 840 24,007Wesco Aircraft Holdings, Inc. (A) 4,169 35,020
50,828,573Air freight and logistics – 1.1%Air Transport Services Group, Inc. (A) 3,838 88,120Atlas Air Worldwide Holdings, Inc. (A) 1,706 113,961C.H. Robinson Worldwide, Inc. 18,806 1,328,268Echo Global Logistics, Inc. (A) 2,142 32,558Expeditors International of
Washington, Inc. 24,165 1,355,657FedEx Corp. 32,797 7,031,021Forward Air Corp. 2,211 114,906Hub Group, Inc., Class A (A) 2,418 92,972Radiant Logistics, Inc. (A) 3,038 15,342United Parcel Service, Inc., Class B 91,678 10,484,296
20,657,101Airlines – 0.8%Alaska Air Group, Inc. 16,524 1,233,682Allegiant Travel Company 946 111,628American Airlines Group, Inc. 65,720 2,940,313Delta Air Lines, Inc. 97,895 4,619,665Hawaiian Holdings, Inc. (A) 3,863 165,530JetBlue Airways Corp. (A) 37,778 748,382SkyWest, Inc. 3,727 129,327Southwest Airlines Company 80,766 4,211,139United Continental Holdings, Inc. (A) 37,553 2,326,784
16,486,450Building products – 0.4%AAON, Inc. 3,038 99,039Advanced Drainage Systems, Inc. 2,616 50,881Allegion PLC 8,383 659,826American Woodmark Corp. (A) 1,021 84,539AO Smith Corp. 12,750 710,048Apogee Enterprises, Inc. 2,094 91,508Armstrong Flooring, Inc. (A) 1,804 26,916Builders FirstSource, Inc. (A) 7,125 115,995Caesarstone, Ltd. (A) 1,680 48,678Continental Building Products, Inc. (A) 2,892 70,420CSW Industrials, Inc. (A) 1,082 45,282Fortune Brands Home & Security, Inc. 13,454 841,279Gibraltar Industries, Inc. (A) 2,358 68,972Griffon Corp. 2,176 40,365Insteel Industries, Inc. 1,396 34,998JELD-WEN Holding, Inc. (A) 1,634 49,870Johnson Controls International PLC 81,016 3,207,423Lennox International, Inc. 4,348 720,594Masco Corp. 27,874 1,024,927Masonite International Corp. (A) 2,168 137,234NCI Building Systems, Inc. (A) 2,937 49,342Patrick Industries, Inc. (A) 1,192 88,208PGT Innovations, Inc. (A) 3,630 47,916Ply Gem Holdings, Inc. (A) 1,676 26,062Quanex Building Products Corp. 2,588 50,725Simpson Manufacturing Company, Inc. 2,964 129,764Trex Company, Inc. (A) 2,158 164,008
U.S. Strategic Equity Allocation Fund (continued)Shares orPrincipalAmount Value
COMMON STOCKS (continued)Building products (continued)Universal Forest Products, Inc. 1,471 $ 128,286
8,813,105Commercial services and supplies –0.6%ABM Industries, Inc. 4,043 179,630ACCO Brands Corp. (A) 7,928 86,812Advanced Disposal Services, Inc. (A) 1,820 43,389ARC Document Solutions, Inc. (A) 3,377 11,921Brady Corp., Class A 3,374 112,523Casella Waste Systems, Inc., Class A (A) 2,937 49,371CECO Environmental Corp. 2,497 18,653Cintas Corp. 6,430 868,114Clean Harbors, Inc. (A) 5,894 318,806Copart, Inc. (A) 23,209 758,702Covanta Holding Corp. 8,525 122,334Deluxe Corp. 8,976 622,486Ennis, Inc. 1,951 37,264Essendant, Inc. 2,906 34,465Healthcare Services Group, Inc. 5,211 266,803Heritage-Crystal Clean, Inc. (A) 1,179 22,991Herman Miller, Inc. 11,103 373,616HNI Corp. 8,220 301,263Hudson Technologies, Inc. (A) 2,871 25,552InnerWorkings, Inc. (A) 3,550 37,169Interface, Inc. 4,597 87,343Kimball International, Inc., Class B 2,784 47,217Knoll, Inc. 3,538 63,861LSC Communications, Inc. 2,503 40,323Matthews International Corp., Class A 2,286 137,732McGrath RentCorp 1,725 69,638Mobile Mini, Inc. 3,266 98,797MSA Safety, Inc. 5,982 435,849Multi-Color Corp. 998 79,640Pitney Bowes, Inc. 21,115 271,328Quad/Graphics, Inc. 2,351 44,810Republic Services, Inc. 17,109 1,116,191Rollins, Inc. 10,860 482,293RR Donnelley & Sons Company 5,323 49,131SP Plus Corp. (A) 1,287 47,490Steelcase, Inc., Class A 6,219 82,091Stericycle, Inc. (A) 6,416 461,246Team, Inc. (A) 2,254 27,837Tetra Tech, Inc. 4,141 176,407The Brink’s Company 3,344 262,337UniFirst Corp. 1,104 158,534US Ecology, Inc. 1,611 82,805Viad Corp. 1,466 80,557VSE Corp. 665 34,680Waste Management, Inc. 30,088 2,320,086West Corp. 3,139 73,358
11,123,445Construction and engineering – 0.3%AECOM (A) 17,632 590,672Aegion Corp. (A) 2,499 54,153Ameresco, Inc., Class A (A) 1,710 12,398Argan, Inc. 1,048 66,391Chicago Bridge & Iron Company NV (B) 7,401 91,328Comfort Systems USA, Inc. 2,679 91,220Dycom Industries, Inc. (A)(B) 5,734 462,619EMCOR Group, Inc. 10,970 724,459Fluor Corp. 12,060 465,154Granite Construction, Inc. 7,398 408,592Great Lakes Dredge & Dock Corp. (A) 4,871 19,728HC2 Holdings, Inc. (A) 3,554 16,206
John Hancock Funds IIPortfolio of Investments — August 31, 2017 (showing percentage of total net assets)
216
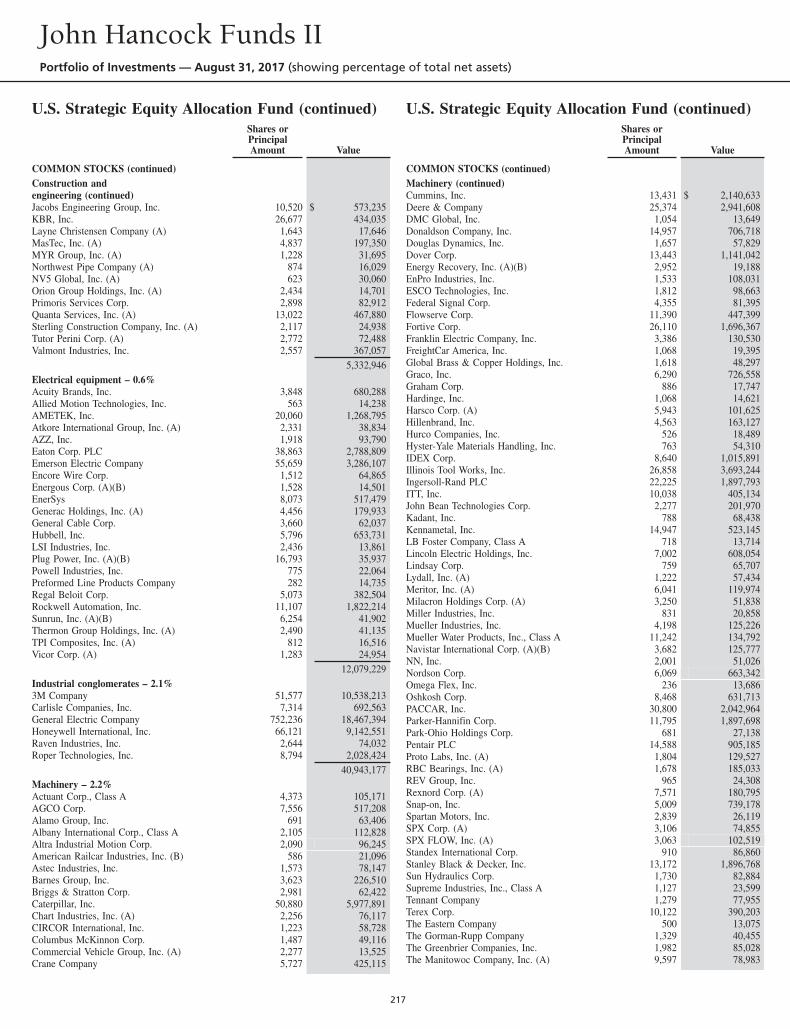
U.S. Strategic Equity Allocation Fund (continued)Shares orPrincipalAmount Value
COMMON STOCKS (continued)Construction andengineering (continued)Jacobs Engineering Group, Inc. 10,520 $ 573,235KBR, Inc. 26,677 434,035Layne Christensen Company (A) 1,643 17,646MasTec, Inc. (A) 4,837 197,350MYR Group, Inc. (A) 1,228 31,695Northwest Pipe Company (A) 874 16,029NV5 Global, Inc. (A) 623 30,060Orion Group Holdings, Inc. (A) 2,434 14,701Primoris Services Corp. 2,898 82,912Quanta Services, Inc. (A) 13,022 467,880Sterling Construction Company, Inc. (A) 2,117 24,938Tutor Perini Corp. (A) 2,772 72,488Valmont Industries, Inc. 2,557 367,057
5,332,946Electrical equipment – 0.6%Acuity Brands, Inc. 3,848 680,288Allied Motion Technologies, Inc. 563 14,238AMETEK, Inc. 20,060 1,268,795Atkore International Group, Inc. (A) 2,331 38,834AZZ, Inc. 1,918 93,790Eaton Corp. PLC 38,863 2,788,809Emerson Electric Company 55,659 3,286,107Encore Wire Corp. 1,512 64,865Energous Corp. (A)(B) 1,528 14,501EnerSys 8,073 517,479Generac Holdings, Inc. (A) 4,456 179,933General Cable Corp. 3,660 62,037Hubbell, Inc. 5,796 653,731LSI Industries, Inc. 2,436 13,861Plug Power, Inc. (A)(B) 16,793 35,937Powell Industries, Inc. 775 22,064Preformed Line Products Company 282 14,735Regal Beloit Corp. 5,073 382,504Rockwell Automation, Inc. 11,107 1,822,214Sunrun, Inc. (A)(B) 6,254 41,902Thermon Group Holdings, Inc. (A) 2,490 41,135TPI Composites, Inc. (A) 812 16,516Vicor Corp. (A) 1,283 24,954
12,079,229Industrial conglomerates – 2.1%3M Company 51,577 10,538,213Carlisle Companies, Inc. 7,314 692,563General Electric Company 752,236 18,467,394Honeywell International, Inc. 66,121 9,142,551Raven Industries, Inc. 2,644 74,032Roper Technologies, Inc. 8,794 2,028,424
40,943,177Machinery – 2.2%Actuant Corp., Class A 4,373 105,171AGCO Corp. 7,556 517,208Alamo Group, Inc. 691 63,406Albany International Corp., Class A 2,105 112,828Altra Industrial Motion Corp. 2,090 96,245American Railcar Industries, Inc. (B) 586 21,096Astec Industries, Inc. 1,573 78,147Barnes Group, Inc. 3,623 226,510Briggs & Stratton Corp. 2,981 62,422Caterpillar, Inc. 50,880 5,977,891Chart Industries, Inc. (A) 2,256 76,117CIRCOR International, Inc. 1,223 58,728Columbus McKinnon Corp. 1,487 49,116Commercial Vehicle Group, Inc. (A) 2,277 13,525Crane Company 5,727 425,115
U.S. Strategic Equity Allocation Fund (continued)Shares orPrincipalAmount Value
COMMON STOCKS (continued)Machinery (continued)Cummins, Inc. 13,431 $ 2,140,633Deere & Company 25,374 2,941,608DMC Global, Inc. 1,054 13,649Donaldson Company, Inc. 14,957 706,718Douglas Dynamics, Inc. 1,657 57,829Dover Corp. 13,443 1,141,042Energy Recovery, Inc. (A)(B) 2,952 19,188EnPro Industries, Inc. 1,533 108,031ESCO Technologies, Inc. 1,812 98,663Federal Signal Corp. 4,355 81,395Flowserve Corp. 11,390 447,399Fortive Corp. 26,110 1,696,367Franklin Electric Company, Inc. 3,386 130,530FreightCar America, Inc. 1,068 19,395Global Brass & Copper Holdings, Inc. 1,618 48,297Graco, Inc. 6,290 726,558Graham Corp. 886 17,747Hardinge, Inc. 1,068 14,621Harsco Corp. (A) 5,943 101,625Hillenbrand, Inc. 4,563 163,127Hurco Companies, Inc. 526 18,489Hyster-Yale Materials Handling, Inc. 763 54,310IDEX Corp. 8,640 1,015,891Illinois Tool Works, Inc. 26,858 3,693,244Ingersoll-Rand PLC 22,225 1,897,793ITT, Inc. 10,038 405,134John Bean Technologies Corp. 2,277 201,970Kadant, Inc. 788 68,438Kennametal, Inc. 14,947 523,145LB Foster Company, Class A 718 13,714Lincoln Electric Holdings, Inc. 7,002 608,054Lindsay Corp. 759 65,707Lydall, Inc. (A) 1,222 57,434Meritor, Inc. (A) 6,041 119,974Milacron Holdings Corp. (A) 3,250 51,838Miller Industries, Inc. 831 20,858Mueller Industries, Inc. 4,198 125,226Mueller Water Products, Inc., Class A 11,242 134,792Navistar International Corp. (A)(B) 3,682 125,777NN, Inc. 2,001 51,026Nordson Corp. 6,069 663,342Omega Flex, Inc. 236 13,686Oshkosh Corp. 8,468 631,713PACCAR, Inc. 30,800 2,042,964Parker-Hannifin Corp. 11,795 1,897,698Park-Ohio Holdings Corp. 681 27,138Pentair PLC 14,588 905,185Proto Labs, Inc. (A) 1,804 129,527RBC Bearings, Inc. (A) 1,678 185,033REV Group, Inc. 965 24,308Rexnord Corp. (A) 7,571 180,795Snap-on, Inc. 5,009 739,178Spartan Motors, Inc. 2,839 26,119SPX Corp. (A) 3,106 74,855SPX FLOW, Inc. (A) 3,063 102,519Standex International Corp. 910 86,860Stanley Black & Decker, Inc. 13,172 1,896,768Sun Hydraulics Corp. 1,730 82,884Supreme Industries, Inc., Class A 1,127 23,599Tennant Company 1,279 77,955Terex Corp. 10,122 390,203The Eastern Company 500 13,075The Gorman-Rupp Company 1,329 40,455The Greenbrier Companies, Inc. 1,982 85,028The Manitowoc Company, Inc. (A) 9,597 78,983
John Hancock Funds IIPortfolio of Investments — August 31, 2017 (showing percentage of total net assets)
217
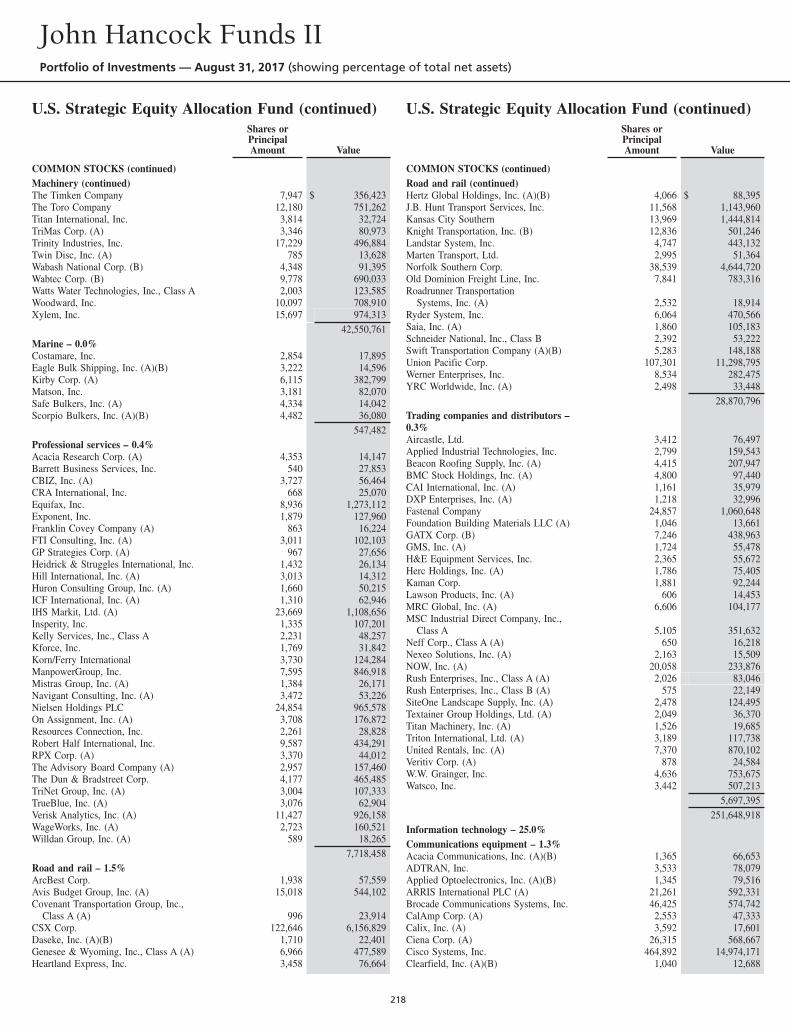
U.S. Strategic Equity Allocation Fund (continued)Shares orPrincipalAmount Value
COMMON STOCKS (continued)Machinery (continued)The Timken Company 7,947 $ 356,423The Toro Company 12,180 751,262Titan International, Inc. 3,814 32,724TriMas Corp. (A) 3,346 80,973Trinity Industries, Inc. 17,229 496,884Twin Disc, Inc. (A) 785 13,628Wabash National Corp. (B) 4,348 91,395Wabtec Corp. (B) 9,778 690,033Watts Water Technologies, Inc., Class A 2,003 123,585Woodward, Inc. 10,097 708,910Xylem, Inc. 15,697 974,313
42,550,761Marine – 0.0%Costamare, Inc. 2,854 17,895Eagle Bulk Shipping, Inc. (A)(B) 3,222 14,596Kirby Corp. (A) 6,115 382,799Matson, Inc. 3,181 82,070Safe Bulkers, Inc. (A) 4,334 14,042Scorpio Bulkers, Inc. (A)(B) 4,482 36,080
547,482Professional services – 0.4%Acacia Research Corp. (A) 4,353 14,147Barrett Business Services, Inc. 540 27,853CBIZ, Inc. (A) 3,727 56,464CRA International, Inc. 668 25,070Equifax, Inc. 8,936 1,273,112Exponent, Inc. 1,879 127,960Franklin Covey Company (A) 863 16,224FTI Consulting, Inc. (A) 3,011 102,103GP Strategies Corp. (A) 967 27,656Heidrick & Struggles International, Inc. 1,432 26,134Hill International, Inc. (A) 3,013 14,312Huron Consulting Group, Inc. (A) 1,660 50,215ICF International, Inc. (A) 1,310 62,946IHS Markit, Ltd. (A) 23,669 1,108,656Insperity, Inc. 1,335 107,201Kelly Services, Inc., Class A 2,231 48,257Kforce, Inc. 1,769 31,842Korn/Ferry International 3,730 124,284ManpowerGroup, Inc. 7,595 846,918Mistras Group, Inc. (A) 1,384 26,171Navigant Consulting, Inc. (A) 3,472 53,226Nielsen Holdings PLC 24,854 965,578On Assignment, Inc. (A) 3,708 176,872Resources Connection, Inc. 2,261 28,828Robert Half International, Inc. 9,587 434,291RPX Corp. (A) 3,370 44,012The Advisory Board Company (A) 2,957 157,460The Dun & Bradstreet Corp. 4,177 465,485TriNet Group, Inc. (A) 3,004 107,333TrueBlue, Inc. (A) 3,076 62,904Verisk Analytics, Inc. (A) 11,427 926,158WageWorks, Inc. (A) 2,723 160,521Willdan Group, Inc. (A) 589 18,265
7,718,458Road and rail – 1.5%ArcBest Corp. 1,938 57,559Avis Budget Group, Inc. (A) 15,018 544,102Covenant Transportation Group, Inc.,
Class A (A) 996 23,914CSX Corp. 122,646 6,156,829Daseke, Inc. (A)(B) 1,710 22,401Genesee & Wyoming, Inc., Class A (A) 6,966 477,589Heartland Express, Inc. 3,458 76,664
U.S. Strategic Equity Allocation Fund (continued)Shares orPrincipalAmount Value
COMMON STOCKS (continued)Road and rail (continued)Hertz Global Holdings, Inc. (A)(B) 4,066 $ 88,395J.B. Hunt Transport Services, Inc. 11,568 1,143,960Kansas City Southern 13,969 1,444,814Knight Transportation, Inc. (B) 12,836 501,246Landstar System, Inc. 4,747 443,132Marten Transport, Ltd. 2,995 51,364Norfolk Southern Corp. 38,539 4,644,720Old Dominion Freight Line, Inc. 7,841 783,316Roadrunner Transportation
Systems, Inc. (A) 2,532 18,914Ryder System, Inc. 6,064 470,566Saia, Inc. (A) 1,860 105,183Schneider National, Inc., Class B 2,392 53,222Swift Transportation Company (A)(B) 5,283 148,188Union Pacific Corp. 107,301 11,298,795Werner Enterprises, Inc. 8,534 282,475YRC Worldwide, Inc. (A) 2,498 33,448
28,870,796Trading companies and distributors –0.3%Aircastle, Ltd. 3,412 76,497Applied Industrial Technologies, Inc. 2,799 159,543Beacon Roofing Supply, Inc. (A) 4,415 207,947BMC Stock Holdings, Inc. (A) 4,800 97,440CAI International, Inc. (A) 1,161 35,979DXP Enterprises, Inc. (A) 1,218 32,996Fastenal Company 24,857 1,060,648Foundation Building Materials LLC (A) 1,046 13,661GATX Corp. (B) 7,246 438,963GMS, Inc. (A) 1,724 55,478H&E Equipment Services, Inc. 2,365 55,672Herc Holdings, Inc. (A) 1,786 75,405Kaman Corp. 1,881 92,244Lawson Products, Inc. (A) 606 14,453MRC Global, Inc. (A) 6,606 104,177MSC Industrial Direct Company, Inc.,
Class A 5,105 351,632Neff Corp., Class A (A) 650 16,218Nexeo Solutions, Inc. (A) 2,163 15,509NOW, Inc. (A) 20,058 233,876Rush Enterprises, Inc., Class A (A) 2,026 83,046Rush Enterprises, Inc., Class B (A) 575 22,149SiteOne Landscape Supply, Inc. (A) 2,478 124,495Textainer Group Holdings, Ltd. (A) 2,049 36,370Titan Machinery, Inc. (A) 1,526 19,685Triton International, Ltd. (A) 3,189 117,738United Rentals, Inc. (A) 7,370 870,102Veritiv Corp. (A) 878 24,584W.W. Grainger, Inc. 4,636 753,675Watsco, Inc. 3,442 507,213
5,697,395251,648,918
Information technology – 25.0%Communications equipment – 1.3%Acacia Communications, Inc. (A)(B) 1,365 66,653ADTRAN, Inc. 3,533 78,079Applied Optoelectronics, Inc. (A)(B) 1,345 79,516ARRIS International PLC (A) 21,261 592,331Brocade Communications Systems, Inc. 46,425 574,742CalAmp Corp. (A) 2,553 47,333Calix, Inc. (A) 3,592 17,601Ciena Corp. (A) 26,315 568,667Cisco Systems, Inc. 464,892 14,974,171Clearfield, Inc. (A)(B) 1,040 12,688
John Hancock Funds IIPortfolio of Investments — August 31, 2017 (showing percentage of total net assets)
218
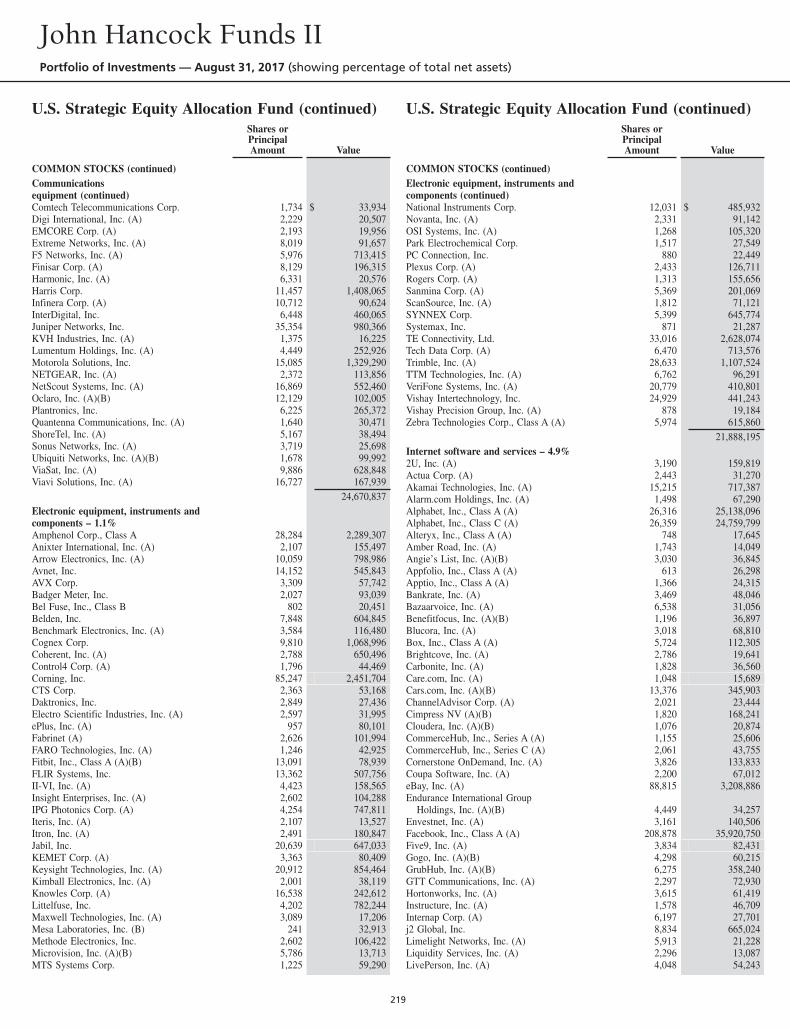
U.S. Strategic Equity Allocation Fund (continued)Shares orPrincipalAmount Value
COMMON STOCKS (continued)Communicationsequipment (continued)Comtech Telecommunications Corp. 1,734 $ 33,934Digi International, Inc. (A) 2,229 20,507EMCORE Corp. (A) 2,193 19,956Extreme Networks, Inc. (A) 8,019 91,657F5 Networks, Inc. (A) 5,976 713,415Finisar Corp. (A) 8,129 196,315Harmonic, Inc. (A) 6,331 20,576Harris Corp. 11,457 1,408,065Infinera Corp. (A) 10,712 90,624InterDigital, Inc. 6,448 460,065Juniper Networks, Inc. 35,354 980,366KVH Industries, Inc. (A) 1,375 16,225Lumentum Holdings, Inc. (A) 4,449 252,926Motorola Solutions, Inc. 15,085 1,329,290NETGEAR, Inc. (A) 2,372 113,856NetScout Systems, Inc. (A) 16,869 552,460Oclaro, Inc. (A)(B) 12,129 102,005Plantronics, Inc. 6,225 265,372Quantenna Communications, Inc. (A) 1,640 30,471ShoreTel, Inc. (A) 5,167 38,494Sonus Networks, Inc. (A) 3,719 25,698Ubiquiti Networks, Inc. (A)(B) 1,678 99,992ViaSat, Inc. (A) 9,886 628,848Viavi Solutions, Inc. (A) 16,727 167,939
24,670,837Electronic equipment, instruments andcomponents – 1.1%Amphenol Corp., Class A 28,284 2,289,307Anixter International, Inc. (A) 2,107 155,497Arrow Electronics, Inc. (A) 10,059 798,986Avnet, Inc. 14,152 545,843AVX Corp. 3,309 57,742Badger Meter, Inc. 2,027 93,039Bel Fuse, Inc., Class B 802 20,451Belden, Inc. 7,848 604,845Benchmark Electronics, Inc. (A) 3,584 116,480Cognex Corp. 9,810 1,068,996Coherent, Inc. (A) 2,788 650,496Control4 Corp. (A) 1,796 44,469Corning, Inc. 85,247 2,451,704CTS Corp. 2,363 53,168Daktronics, Inc. 2,849 27,436Electro Scientific Industries, Inc. (A) 2,597 31,995ePlus, Inc. (A) 957 80,101Fabrinet (A) 2,626 101,994FARO Technologies, Inc. (A) 1,246 42,925Fitbit, Inc., Class A (A)(B) 13,091 78,939FLIR Systems, Inc. 13,362 507,756II-VI, Inc. (A) 4,423 158,565Insight Enterprises, Inc. (A) 2,602 104,288IPG Photonics Corp. (A) 4,254 747,811Iteris, Inc. (A) 2,107 13,527Itron, Inc. (A) 2,491 180,847Jabil, Inc. 20,639 647,033KEMET Corp. (A) 3,363 80,409Keysight Technologies, Inc. (A) 20,912 854,464Kimball Electronics, Inc. (A) 2,001 38,119Knowles Corp. (A) 16,538 242,612Littelfuse, Inc. 4,202 782,244Maxwell Technologies, Inc. (A) 3,089 17,206Mesa Laboratories, Inc. (B) 241 32,913Methode Electronics, Inc. 2,602 106,422Microvision, Inc. (A)(B) 5,786 13,713MTS Systems Corp. 1,225 59,290
U.S. Strategic Equity Allocation Fund (continued)Shares orPrincipalAmount Value
COMMON STOCKS (continued)Electronic equipment, instruments andcomponents (continued)National Instruments Corp. 12,031 $ 485,932Novanta, Inc. (A) 2,331 91,142OSI Systems, Inc. (A) 1,268 105,320Park Electrochemical Corp. 1,517 27,549PC Connection, Inc. 880 22,449Plexus Corp. (A) 2,433 126,711Rogers Corp. (A) 1,313 155,656Sanmina Corp. (A) 5,369 201,069ScanSource, Inc. (A) 1,812 71,121SYNNEX Corp. 5,399 645,774Systemax, Inc. 871 21,287TE Connectivity, Ltd. 33,016 2,628,074Tech Data Corp. (A) 6,470 713,576Trimble, Inc. (A) 28,633 1,107,524TTM Technologies, Inc. (A) 6,762 96,291VeriFone Systems, Inc. (A) 20,779 410,801Vishay Intertechnology, Inc. 24,929 441,243Vishay Precision Group, Inc. (A) 878 19,184Zebra Technologies Corp., Class A (A) 5,974 615,860
21,888,195Internet software and services – 4.9%2U, Inc. (A) 3,190 159,819Actua Corp. (A) 2,443 31,270Akamai Technologies, Inc. (A) 15,215 717,387Alarm.com Holdings, Inc. (A) 1,498 67,290Alphabet, Inc., Class A (A) 26,316 25,138,096Alphabet, Inc., Class C (A) 26,359 24,759,799Alteryx, Inc., Class A (A) 748 17,645Amber Road, Inc. (A) 1,743 14,049Angie’s List, Inc. (A)(B) 3,030 36,845Appfolio, Inc., Class A (A) 613 26,298Apptio, Inc., Class A (A) 1,366 24,315Bankrate, Inc. (A) 3,469 48,046Bazaarvoice, Inc. (A) 6,538 31,056Benefitfocus, Inc. (A)(B) 1,196 36,897Blucora, Inc. (A) 3,018 68,810Box, Inc., Class A (A) 5,724 112,305Brightcove, Inc. (A) 2,786 19,641Carbonite, Inc. (A) 1,828 36,560Care.com, Inc. (A) 1,048 15,689Cars.com, Inc. (A)(B) 13,376 345,903ChannelAdvisor Corp. (A) 2,021 23,444Cimpress NV (A)(B) 1,820 168,241Cloudera, Inc. (A)(B) 1,076 20,874CommerceHub, Inc., Series A (A) 1,155 25,606CommerceHub, Inc., Series C (A) 2,061 43,755Cornerstone OnDemand, Inc. (A) 3,826 133,833Coupa Software, Inc. (A) 2,200 67,012eBay, Inc. (A) 88,815 3,208,886Endurance International Group
Holdings, Inc. (A)(B) 4,449 34,257Envestnet, Inc. (A) 3,161 140,506Facebook, Inc., Class A (A) 208,878 35,920,750Five9, Inc. (A) 3,834 82,431Gogo, Inc. (A)(B) 4,298 60,215GrubHub, Inc. (A)(B) 6,275 358,240GTT Communications, Inc. (A) 2,297 72,930Hortonworks, Inc. (A) 3,615 61,419Instructure, Inc. (A) 1,578 46,709Internap Corp. (A) 6,197 27,701j2 Global, Inc. 8,834 665,024Limelight Networks, Inc. (A) 5,913 21,228Liquidity Services, Inc. (A) 2,296 13,087LivePerson, Inc. (A) 4,048 54,243
John Hancock Funds IIPortfolio of Investments — August 31, 2017 (showing percentage of total net assets)
219
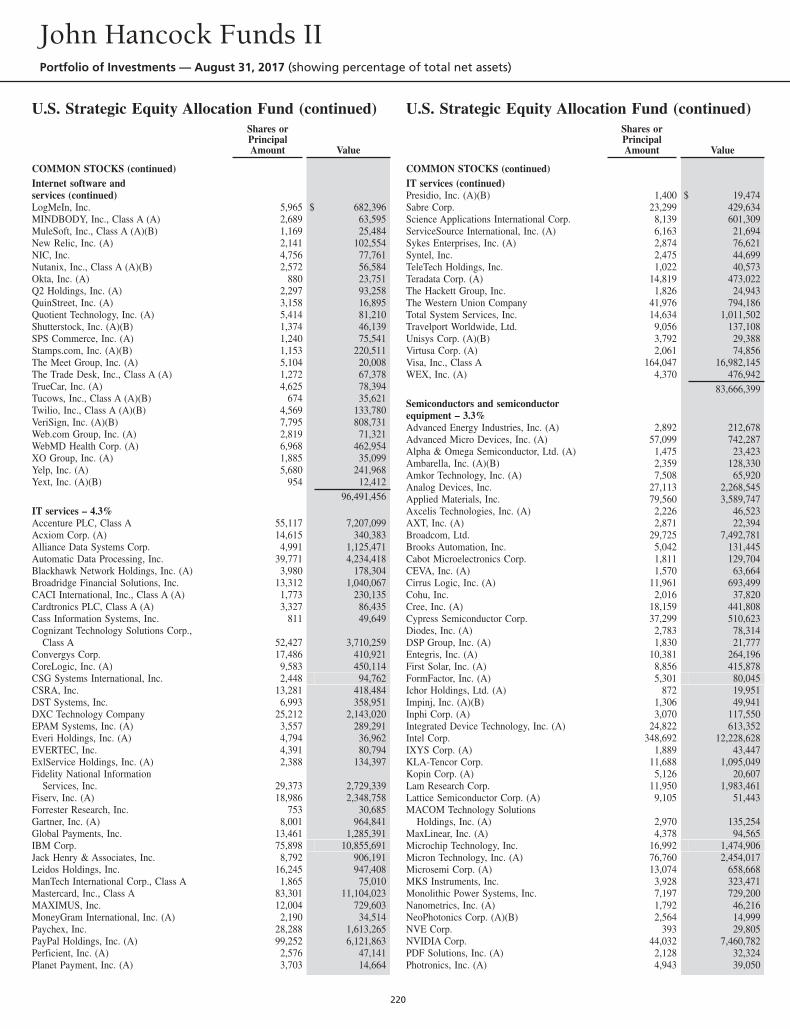
U.S. Strategic Equity Allocation Fund (continued)Shares orPrincipalAmount Value
COMMON STOCKS (continued)Internet software andservices (continued)LogMeIn, Inc. 5,965 $ 682,396MINDBODY, Inc., Class A (A) 2,689 63,595MuleSoft, Inc., Class A (A)(B) 1,169 25,484New Relic, Inc. (A) 2,141 102,554NIC, Inc. 4,756 77,761Nutanix, Inc., Class A (A)(B) 2,572 56,584Okta, Inc. (A) 880 23,751Q2 Holdings, Inc. (A) 2,297 93,258QuinStreet, Inc. (A) 3,158 16,895Quotient Technology, Inc. (A) 5,414 81,210Shutterstock, Inc. (A)(B) 1,374 46,139SPS Commerce, Inc. (A) 1,240 75,541Stamps.com, Inc. (A)(B) 1,153 220,511The Meet Group, Inc. (A) 5,104 20,008The Trade Desk, Inc., Class A (A) 1,272 67,378TrueCar, Inc. (A) 4,625 78,394Tucows, Inc., Class A (A)(B) 674 35,621Twilio, Inc., Class A (A)(B) 4,569 133,780VeriSign, Inc. (A)(B) 7,795 808,731Web.com Group, Inc. (A) 2,819 71,321WebMD Health Corp. (A) 6,968 462,954XO Group, Inc. (A) 1,885 35,099Yelp, Inc. (A) 5,680 241,968Yext, Inc. (A)(B) 954 12,412
96,491,456IT services – 4.3%Accenture PLC, Class A 55,117 7,207,099Acxiom Corp. (A) 14,615 340,383Alliance Data Systems Corp. 4,991 1,125,471Automatic Data Processing, Inc. 39,771 4,234,418Blackhawk Network Holdings, Inc. (A) 3,980 178,304Broadridge Financial Solutions, Inc. 13,312 1,040,067CACI International, Inc., Class A (A) 1,773 230,135Cardtronics PLC, Class A (A) 3,327 86,435Cass Information Systems, Inc. 811 49,649Cognizant Technology Solutions Corp.,
Class A 52,427 3,710,259Convergys Corp. 17,486 410,921CoreLogic, Inc. (A) 9,583 450,114CSG Systems International, Inc. 2,448 94,762CSRA, Inc. 13,281 418,484DST Systems, Inc. 6,993 358,951DXC Technology Company 25,212 2,143,020EPAM Systems, Inc. (A) 3,557 289,291Everi Holdings, Inc. (A) 4,794 36,962EVERTEC, Inc. 4,391 80,794ExlService Holdings, Inc. (A) 2,388 134,397Fidelity National Information
Services, Inc. 29,373 2,729,339Fiserv, Inc. (A) 18,986 2,348,758Forrester Research, Inc. 753 30,685Gartner, Inc. (A) 8,001 964,841Global Payments, Inc. 13,461 1,285,391IBM Corp. 75,898 10,855,691Jack Henry & Associates, Inc. 8,792 906,191Leidos Holdings, Inc. 16,245 947,408ManTech International Corp., Class A 1,865 75,010Mastercard, Inc., Class A 83,301 11,104,023MAXIMUS, Inc. 12,004 729,603MoneyGram International, Inc. (A) 2,190 34,514Paychex, Inc. 28,288 1,613,265PayPal Holdings, Inc. (A) 99,252 6,121,863Perficient, Inc. (A) 2,576 47,141Planet Payment, Inc. (A) 3,703 14,664
U.S. Strategic Equity Allocation Fund (continued)Shares orPrincipalAmount Value
COMMON STOCKS (continued)IT services (continued)Presidio, Inc. (A)(B) 1,400 $ 19,474Sabre Corp. 23,299 429,634Science Applications International Corp. 8,139 601,309ServiceSource International, Inc. (A) 6,163 21,694Sykes Enterprises, Inc. (A) 2,874 76,621Syntel, Inc. 2,475 44,699TeleTech Holdings, Inc. 1,022 40,573Teradata Corp. (A) 14,819 473,022The Hackett Group, Inc. 1,826 24,943The Western Union Company 41,976 794,186Total System Services, Inc. 14,634 1,011,502Travelport Worldwide, Ltd. 9,056 137,108Unisys Corp. (A)(B) 3,792 29,388Virtusa Corp. (A) 2,061 74,856Visa, Inc., Class A 164,047 16,982,145WEX, Inc. (A) 4,370 476,942
83,666,399Semiconductors and semiconductorequipment – 3.3%Advanced Energy Industries, Inc. (A) 2,892 212,678Advanced Micro Devices, Inc. (A) 57,099 742,287Alpha & Omega Semiconductor, Ltd. (A) 1,475 23,423Ambarella, Inc. (A)(B) 2,359 128,330Amkor Technology, Inc. (A) 7,508 65,920Analog Devices, Inc. 27,113 2,268,545Applied Materials, Inc. 79,560 3,589,747Axcelis Technologies, Inc. (A) 2,226 46,523AXT, Inc. (A) 2,871 22,394Broadcom, Ltd. 29,725 7,492,781Brooks Automation, Inc. 5,042 131,445Cabot Microelectronics Corp. 1,811 129,704CEVA, Inc. (A) 1,570 63,664Cirrus Logic, Inc. (A) 11,961 693,499Cohu, Inc. 2,016 37,820Cree, Inc. (A) 18,159 441,808Cypress Semiconductor Corp. 37,299 510,623Diodes, Inc. (A) 2,783 78,314DSP Group, Inc. (A) 1,830 21,777Entegris, Inc. (A) 10,381 264,196First Solar, Inc. (A) 8,856 415,878FormFactor, Inc. (A) 5,301 80,045Ichor Holdings, Ltd. (A) 872 19,951Impinj, Inc. (A)(B) 1,306 49,941Inphi Corp. (A) 3,070 117,550Integrated Device Technology, Inc. (A) 24,822 613,352Intel Corp. 348,692 12,228,628IXYS Corp. (A) 1,889 43,447KLA-Tencor Corp. 11,688 1,095,049Kopin Corp. (A) 5,126 20,607Lam Research Corp. 11,950 1,983,461Lattice Semiconductor Corp. (A) 9,105 51,443MACOM Technology Solutions
Holdings, Inc. (A) 2,970 135,254MaxLinear, Inc. (A) 4,378 94,565Microchip Technology, Inc. 16,992 1,474,906Micron Technology, Inc. (A) 76,760 2,454,017Microsemi Corp. (A) 13,074 658,668MKS Instruments, Inc. 3,928 323,471Monolithic Power Systems, Inc. 7,197 729,200Nanometrics, Inc. (A) 1,792 46,216NeoPhotonics Corp. (A)(B) 2,564 14,999NVE Corp. 393 29,805NVIDIA Corp. 44,032 7,460,782PDF Solutions, Inc. (A) 2,128 32,324Photronics, Inc. (A) 4,943 39,050
John Hancock Funds IIPortfolio of Investments — August 31, 2017 (showing percentage of total net assets)
220
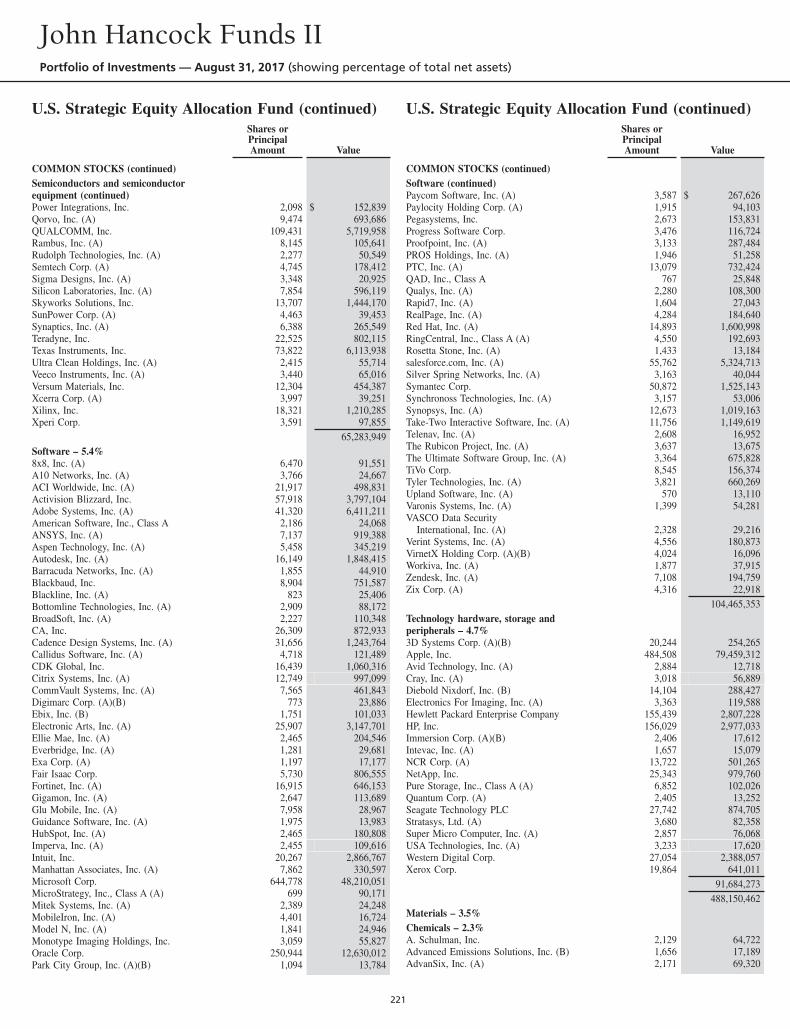
U.S. Strategic Equity Allocation Fund (continued)Shares orPrincipalAmount Value
COMMON STOCKS (continued)Semiconductors and semiconductorequipment (continued)Power Integrations, Inc. 2,098 $ 152,839Qorvo, Inc. (A) 9,474 693,686QUALCOMM, Inc. 109,431 5,719,958Rambus, Inc. (A) 8,145 105,641Rudolph Technologies, Inc. (A) 2,277 50,549Semtech Corp. (A) 4,745 178,412Sigma Designs, Inc. (A) 3,348 20,925Silicon Laboratories, Inc. (A) 7,854 596,119Skyworks Solutions, Inc. 13,707 1,444,170SunPower Corp. (A) 4,463 39,453Synaptics, Inc. (A) 6,388 265,549Teradyne, Inc. 22,525 802,115Texas Instruments, Inc. 73,822 6,113,938Ultra Clean Holdings, Inc. (A) 2,415 55,714Veeco Instruments, Inc. (A) 3,440 65,016Versum Materials, Inc. 12,304 454,387Xcerra Corp. (A) 3,997 39,251Xilinx, Inc. 18,321 1,210,285Xperi Corp. 3,591 97,855
65,283,949Software – 5.4%8x8, Inc. (A) 6,470 91,551A10 Networks, Inc. (A) 3,766 24,667ACI Worldwide, Inc. (A) 21,917 498,831Activision Blizzard, Inc. 57,918 3,797,104Adobe Systems, Inc. (A) 41,320 6,411,211American Software, Inc., Class A 2,186 24,068ANSYS, Inc. (A) 7,137 919,388Aspen Technology, Inc. (A) 5,458 345,219Autodesk, Inc. (A) 16,149 1,848,415Barracuda Networks, Inc. (A) 1,855 44,910Blackbaud, Inc. 8,904 751,587Blackline, Inc. (A) 823 25,406Bottomline Technologies, Inc. (A) 2,909 88,172BroadSoft, Inc. (A) 2,227 110,348CA, Inc. 26,309 872,933Cadence Design Systems, Inc. (A) 31,656 1,243,764Callidus Software, Inc. (A) 4,718 121,489CDK Global, Inc. 16,439 1,060,316Citrix Systems, Inc. (A) 12,749 997,099CommVault Systems, Inc. (A) 7,565 461,843Digimarc Corp. (A)(B) 773 23,886Ebix, Inc. (B) 1,751 101,033Electronic Arts, Inc. (A) 25,907 3,147,701Ellie Mae, Inc. (A) 2,465 204,546Everbridge, Inc. (A) 1,281 29,681Exa Corp. (A) 1,197 17,177Fair Isaac Corp. 5,730 806,555Fortinet, Inc. (A) 16,915 646,153Gigamon, Inc. (A) 2,647 113,689Glu Mobile, Inc. (A) 7,958 28,967Guidance Software, Inc. (A) 1,975 13,983HubSpot, Inc. (A) 2,465 180,808Imperva, Inc. (A) 2,455 109,616Intuit, Inc. 20,267 2,866,767Manhattan Associates, Inc. (A) 7,862 330,597Microsoft Corp. 644,778 48,210,051MicroStrategy, Inc., Class A (A) 699 90,171Mitek Systems, Inc. (A) 2,389 24,248MobileIron, Inc. (A) 4,401 16,724Model N, Inc. (A) 1,841 24,946Monotype Imaging Holdings, Inc. 3,059 55,827Oracle Corp. 250,944 12,630,012Park City Group, Inc. (A)(B) 1,094 13,784
U.S. Strategic Equity Allocation Fund (continued)Shares orPrincipalAmount Value
COMMON STOCKS (continued)Software (continued)Paycom Software, Inc. (A) 3,587 $ 267,626Paylocity Holding Corp. (A) 1,915 94,103Pegasystems, Inc. 2,673 153,831Progress Software Corp. 3,476 116,724Proofpoint, Inc. (A) 3,133 287,484PROS Holdings, Inc. (A) 1,946 51,258PTC, Inc. (A) 13,079 732,424QAD, Inc., Class A 767 25,848Qualys, Inc. (A) 2,280 108,300Rapid7, Inc. (A) 1,604 27,043RealPage, Inc. (A) 4,284 184,640Red Hat, Inc. (A) 14,893 1,600,998RingCentral, Inc., Class A (A) 4,550 192,693Rosetta Stone, Inc. (A) 1,433 13,184salesforce.com, Inc. (A) 55,762 5,324,713Silver Spring Networks, Inc. (A) 3,163 40,044Symantec Corp. 50,872 1,525,143Synchronoss Technologies, Inc. (A) 3,157 53,006Synopsys, Inc. (A) 12,673 1,019,163Take-Two Interactive Software, Inc. (A) 11,756 1,149,619Telenav, Inc. (A) 2,608 16,952The Rubicon Project, Inc. (A) 3,637 13,675The Ultimate Software Group, Inc. (A) 3,364 675,828TiVo Corp. 8,545 156,374Tyler Technologies, Inc. (A) 3,821 660,269Upland Software, Inc. (A) 570 13,110Varonis Systems, Inc. (A) 1,399 54,281VASCO Data Security
International, Inc. (A) 2,328 29,216Verint Systems, Inc. (A) 4,556 180,873VirnetX Holding Corp. (A)(B) 4,024 16,096Workiva, Inc. (A) 1,877 37,915Zendesk, Inc. (A) 7,108 194,759Zix Corp. (A) 4,316 22,918
104,465,353Technology hardware, storage andperipherals – 4.7%3D Systems Corp. (A)(B) 20,244 254,265Apple, Inc. 484,508 79,459,312Avid Technology, Inc. (A) 2,884 12,718Cray, Inc. (A) 3,018 56,889Diebold Nixdorf, Inc. (B) 14,104 288,427Electronics For Imaging, Inc. (A) 3,363 119,588Hewlett Packard Enterprise Company 155,439 2,807,228HP, Inc. 156,029 2,977,033Immersion Corp. (A)(B) 2,406 17,612Intevac, Inc. (A) 1,657 15,079NCR Corp. (A) 13,722 501,265NetApp, Inc. 25,343 979,760Pure Storage, Inc., Class A (A) 6,852 102,026Quantum Corp. (A) 2,405 13,252Seagate Technology PLC 27,742 874,705Stratasys, Ltd. (A) 3,680 82,358Super Micro Computer, Inc. (A) 2,857 76,068USA Technologies, Inc. (A) 3,233 17,620Western Digital Corp. 27,054 2,388,057Xerox Corp. 19,864 641,011
91,684,273488,150,462
Materials – 3.5%Chemicals – 2.3%A. Schulman, Inc. 2,129 64,722Advanced Emissions Solutions, Inc. (B) 1,656 17,189AdvanSix, Inc. (A) 2,171 69,320
John Hancock Funds IIPortfolio of Investments — August 31, 2017 (showing percentage of total net assets)
221
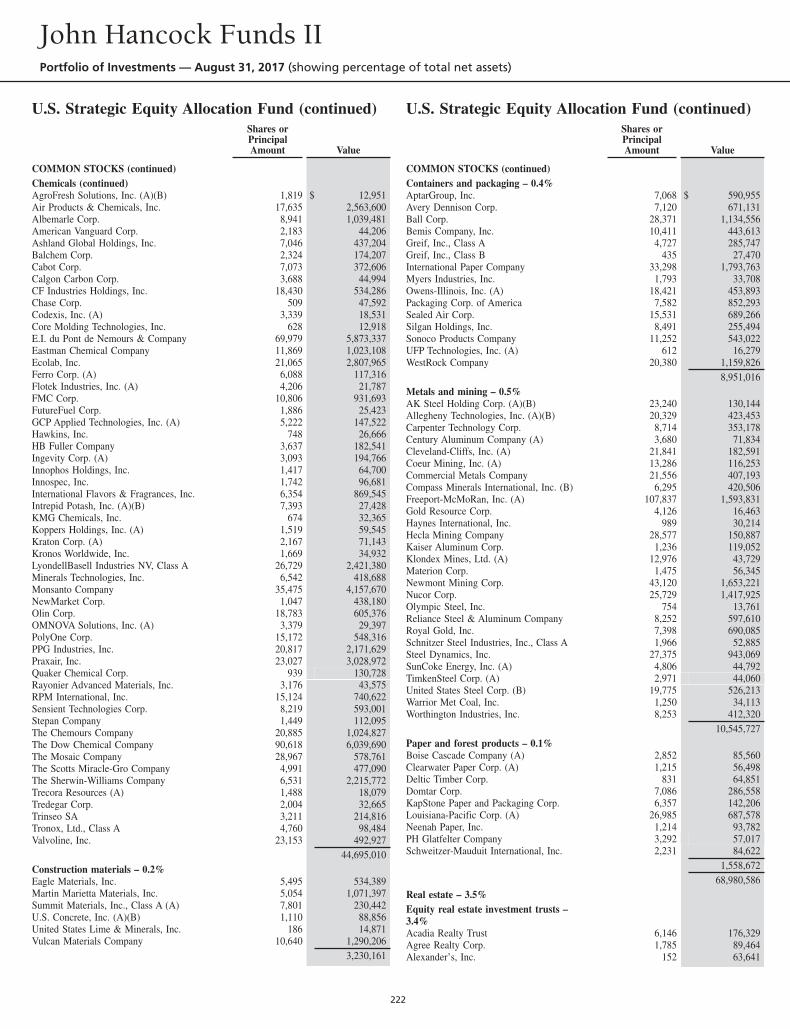
U.S. Strategic Equity Allocation Fund (continued)Shares orPrincipalAmount Value
COMMON STOCKS (continued)Chemicals (continued)AgroFresh Solutions, Inc. (A)(B) 1,819 $ 12,951Air Products & Chemicals, Inc. 17,635 2,563,600Albemarle Corp. 8,941 1,039,481American Vanguard Corp. 2,183 44,206Ashland Global Holdings, Inc. 7,046 437,204Balchem Corp. 2,324 174,207Cabot Corp. 7,073 372,606Calgon Carbon Corp. 3,688 44,994CF Industries Holdings, Inc. 18,430 534,286Chase Corp. 509 47,592Codexis, Inc. (A) 3,339 18,531Core Molding Technologies, Inc. 628 12,918E.I. du Pont de Nemours & Company 69,979 5,873,337Eastman Chemical Company 11,869 1,023,108Ecolab, Inc. 21,065 2,807,965Ferro Corp. (A) 6,088 117,316Flotek Industries, Inc. (A) 4,206 21,787FMC Corp. 10,806 931,693FutureFuel Corp. 1,886 25,423GCP Applied Technologies, Inc. (A) 5,222 147,522Hawkins, Inc. 748 26,666HB Fuller Company 3,637 182,541Ingevity Corp. (A) 3,093 194,766Innophos Holdings, Inc. 1,417 64,700Innospec, Inc. 1,742 96,681International Flavors & Fragrances, Inc. 6,354 869,545Intrepid Potash, Inc. (A)(B) 7,393 27,428KMG Chemicals, Inc. 674 32,365Koppers Holdings, Inc. (A) 1,519 59,545Kraton Corp. (A) 2,167 71,143Kronos Worldwide, Inc. 1,669 34,932LyondellBasell Industries NV, Class A 26,729 2,421,380Minerals Technologies, Inc. 6,542 418,688Monsanto Company 35,475 4,157,670NewMarket Corp. 1,047 438,180Olin Corp. 18,783 605,376OMNOVA Solutions, Inc. (A) 3,379 29,397PolyOne Corp. 15,172 548,316PPG Industries, Inc. 20,817 2,171,629Praxair, Inc. 23,027 3,028,972Quaker Chemical Corp. 939 130,728Rayonier Advanced Materials, Inc. 3,176 43,575RPM International, Inc. 15,124 740,622Sensient Technologies Corp. 8,219 593,001Stepan Company 1,449 112,095The Chemours Company 20,885 1,024,827The Dow Chemical Company 90,618 6,039,690The Mosaic Company 28,967 578,761The Scotts Miracle-Gro Company 4,991 477,090The Sherwin-Williams Company 6,531 2,215,772Trecora Resources (A) 1,488 18,079Tredegar Corp. 2,004 32,665Trinseo SA 3,211 214,816Tronox, Ltd., Class A 4,760 98,484Valvoline, Inc. 23,153 492,927
44,695,010Construction materials – 0.2%Eagle Materials, Inc. 5,495 534,389Martin Marietta Materials, Inc. 5,054 1,071,397Summit Materials, Inc., Class A (A) 7,801 230,442U.S. Concrete, Inc. (A)(B) 1,110 88,856United States Lime & Minerals, Inc. 186 14,871Vulcan Materials Company 10,640 1,290,206
3,230,161
U.S. Strategic Equity Allocation Fund (continued)Shares orPrincipalAmount Value
COMMON STOCKS (continued)Containers and packaging – 0.4%AptarGroup, Inc. 7,068 $ 590,955Avery Dennison Corp. 7,120 671,131Ball Corp. 28,371 1,134,556Bemis Company, Inc. 10,411 443,613Greif, Inc., Class A 4,727 285,747Greif, Inc., Class B 435 27,470International Paper Company 33,298 1,793,763Myers Industries, Inc. 1,793 33,708Owens-Illinois, Inc. (A) 18,421 453,893Packaging Corp. of America 7,582 852,293Sealed Air Corp. 15,531 689,266Silgan Holdings, Inc. 8,491 255,494Sonoco Products Company 11,252 543,022UFP Technologies, Inc. (A) 612 16,279WestRock Company 20,380 1,159,826
8,951,016Metals and mining – 0.5%AK Steel Holding Corp. (A)(B) 23,240 130,144Allegheny Technologies, Inc. (A)(B) 20,329 423,453Carpenter Technology Corp. 8,714 353,178Century Aluminum Company (A) 3,680 71,834Cleveland-Cliffs, Inc. (A) 21,841 182,591Coeur Mining, Inc. (A) 13,286 116,253Commercial Metals Company 21,556 407,193Compass Minerals International, Inc. (B) 6,295 420,506Freeport-McMoRan, Inc. (A) 107,837 1,593,831Gold Resource Corp. 4,126 16,463Haynes International, Inc. 989 30,214Hecla Mining Company 28,577 150,887Kaiser Aluminum Corp. 1,236 119,052Klondex Mines, Ltd. (A) 12,976 43,729Materion Corp. 1,475 56,345Newmont Mining Corp. 43,120 1,653,221Nucor Corp. 25,729 1,417,925Olympic Steel, Inc. 754 13,761Reliance Steel & Aluminum Company 8,252 597,610Royal Gold, Inc. 7,398 690,085Schnitzer Steel Industries, Inc., Class A 1,966 52,885Steel Dynamics, Inc. 27,375 943,069SunCoke Energy, Inc. (A) 4,806 44,792TimkenSteel Corp. (A) 2,971 44,060United States Steel Corp. (B) 19,775 526,213Warrior Met Coal, Inc. 1,250 34,113Worthington Industries, Inc. 8,253 412,320
10,545,727Paper and forest products – 0.1%Boise Cascade Company (A) 2,852 85,560Clearwater Paper Corp. (A) 1,215 56,498Deltic Timber Corp. 831 64,851Domtar Corp. 7,086 286,558KapStone Paper and Packaging Corp. 6,357 142,206Louisiana-Pacific Corp. (A) 26,985 687,578Neenah Paper, Inc. 1,214 93,782PH Glatfelter Company 3,292 57,017Schweitzer-Mauduit International, Inc. 2,231 84,622
1,558,67268,980,586
Real estate – 3.5%Equity real estate investment trusts –3.4%Acadia Realty Trust 6,146 176,329Agree Realty Corp. 1,785 89,464Alexander’s, Inc. 152 63,641
John Hancock Funds IIPortfolio of Investments — August 31, 2017 (showing percentage of total net assets)
222
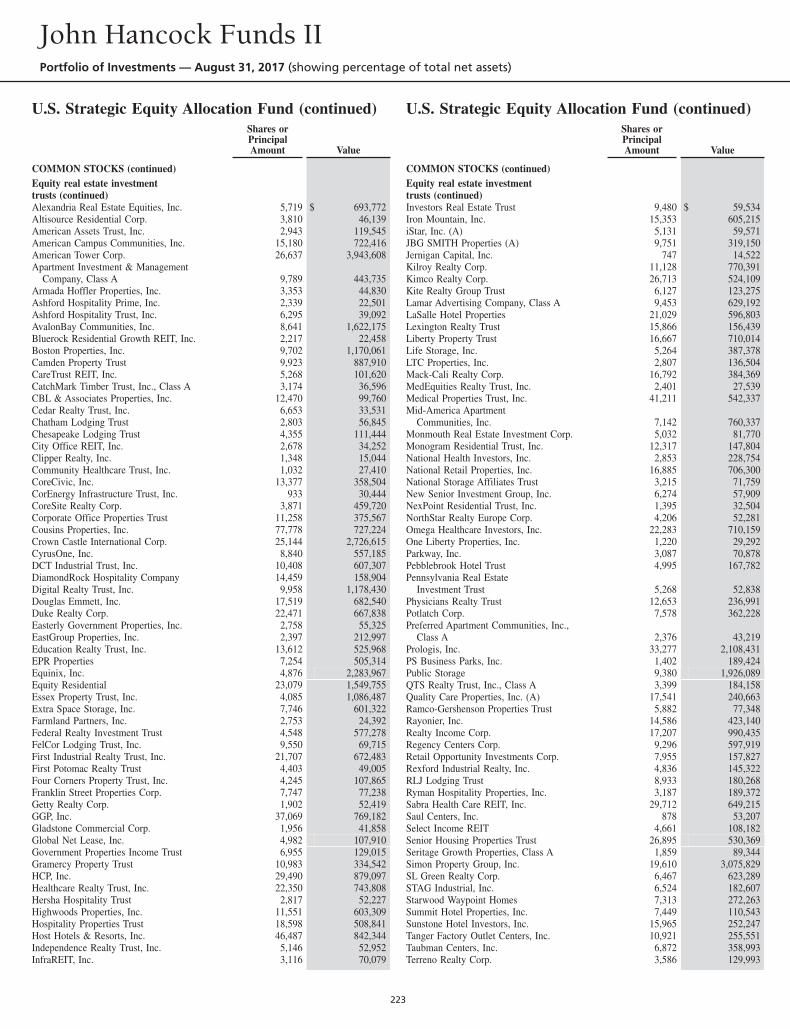
U.S. Strategic Equity Allocation Fund (continued)Shares orPrincipalAmount Value
COMMON STOCKS (continued)Equity real estate investmenttrusts (continued)Alexandria Real Estate Equities, Inc. 5,719 $ 693,772Altisource Residential Corp. 3,810 46,139American Assets Trust, Inc. 2,943 119,545American Campus Communities, Inc. 15,180 722,416American Tower Corp. 26,637 3,943,608Apartment Investment & Management
Company, Class A 9,789 443,735Armada Hoffler Properties, Inc. 3,353 44,830Ashford Hospitality Prime, Inc. 2,339 22,501Ashford Hospitality Trust, Inc. 6,295 39,092AvalonBay Communities, Inc. 8,641 1,622,175Bluerock Residential Growth REIT, Inc. 2,217 22,458Boston Properties, Inc. 9,702 1,170,061Camden Property Trust 9,923 887,910CareTrust REIT, Inc. 5,268 101,620CatchMark Timber Trust, Inc., Class A 3,174 36,596CBL & Associates Properties, Inc. 12,470 99,760Cedar Realty Trust, Inc. 6,653 33,531Chatham Lodging Trust 2,803 56,845Chesapeake Lodging Trust 4,355 111,444City Office REIT, Inc. 2,678 34,252Clipper Realty, Inc. 1,348 15,044Community Healthcare Trust, Inc. 1,032 27,410CoreCivic, Inc. 13,377 358,504CorEnergy Infrastructure Trust, Inc. 933 30,444CoreSite Realty Corp. 3,871 459,720Corporate Office Properties Trust 11,258 375,567Cousins Properties, Inc. 77,778 727,224Crown Castle International Corp. 25,144 2,726,615CyrusOne, Inc. 8,840 557,185DCT Industrial Trust, Inc. 10,408 607,307DiamondRock Hospitality Company 14,459 158,904Digital Realty Trust, Inc. 9,958 1,178,430Douglas Emmett, Inc. 17,519 682,540Duke Realty Corp. 22,471 667,838Easterly Government Properties, Inc. 2,758 55,325EastGroup Properties, Inc. 2,397 212,997Education Realty Trust, Inc. 13,612 525,968EPR Properties 7,254 505,314Equinix, Inc. 4,876 2,283,967Equity Residential 23,079 1,549,755Essex Property Trust, Inc. 4,085 1,086,487Extra Space Storage, Inc. 7,746 601,322Farmland Partners, Inc. 2,753 24,392Federal Realty Investment Trust 4,548 577,278FelCor Lodging Trust, Inc. 9,550 69,715First Industrial Realty Trust, Inc. 21,707 672,483First Potomac Realty Trust 4,403 49,005Four Corners Property Trust, Inc. 4,245 107,865Franklin Street Properties Corp. 7,747 77,238Getty Realty Corp. 1,902 52,419GGP, Inc. 37,069 769,182Gladstone Commercial Corp. 1,956 41,858Global Net Lease, Inc. 4,982 107,910Government Properties Income Trust 6,955 129,015Gramercy Property Trust 10,983 334,542HCP, Inc. 29,490 879,097Healthcare Realty Trust, Inc. 22,350 743,808Hersha Hospitality Trust 2,817 52,227Highwoods Properties, Inc. 11,551 603,309Hospitality Properties Trust 18,598 508,841Host Hotels & Resorts, Inc. 46,487 842,344Independence Realty Trust, Inc. 5,146 52,952InfraREIT, Inc. 3,116 70,079
U.S. Strategic Equity Allocation Fund (continued)Shares orPrincipalAmount Value
COMMON STOCKS (continued)Equity real estate investmenttrusts (continued)Investors Real Estate Trust 9,480 $ 59,534Iron Mountain, Inc. 15,353 605,215iStar, Inc. (A) 5,131 59,571JBG SMITH Properties (A) 9,751 319,150Jernigan Capital, Inc. 747 14,522Kilroy Realty Corp. 11,128 770,391Kimco Realty Corp. 26,713 524,109Kite Realty Group Trust 6,127 123,275Lamar Advertising Company, Class A 9,453 629,192LaSalle Hotel Properties 21,029 596,803Lexington Realty Trust 15,866 156,439Liberty Property Trust 16,667 710,014Life Storage, Inc. 5,264 387,378LTC Properties, Inc. 2,807 136,504Mack-Cali Realty Corp. 16,792 384,369MedEquities Realty Trust, Inc. 2,401 27,539Medical Properties Trust, Inc. 41,211 542,337Mid-America Apartment
Communities, Inc. 7,142 760,337Monmouth Real Estate Investment Corp. 5,032 81,770Monogram Residential Trust, Inc. 12,317 147,804National Health Investors, Inc. 2,853 228,754National Retail Properties, Inc. 16,885 706,300National Storage Affiliates Trust 3,215 71,759New Senior Investment Group, Inc. 6,274 57,909NexPoint Residential Trust, Inc. 1,395 32,504NorthStar Realty Europe Corp. 4,206 52,281Omega Healthcare Investors, Inc. 22,283 710,159One Liberty Properties, Inc. 1,220 29,292Parkway, Inc. 3,087 70,878Pebblebrook Hotel Trust 4,995 167,782Pennsylvania Real Estate
Investment Trust 5,268 52,838Physicians Realty Trust 12,653 236,991Potlatch Corp. 7,578 362,228Preferred Apartment Communities, Inc.,
Class A 2,376 43,219Prologis, Inc. 33,277 2,108,431PS Business Parks, Inc. 1,402 189,424Public Storage 9,380 1,926,089QTS Realty Trust, Inc., Class A 3,399 184,158Quality Care Properties, Inc. (A) 17,541 240,663Ramco-Gershenson Properties Trust 5,882 77,348Rayonier, Inc. 14,586 423,140Realty Income Corp. 17,207 990,435Regency Centers Corp. 9,296 597,919Retail Opportunity Investments Corp. 7,955 157,827Rexford Industrial Realty, Inc. 4,836 145,322RLJ Lodging Trust 8,933 180,268Ryman Hospitality Properties, Inc. 3,187 189,372Sabra Health Care REIT, Inc. 29,712 649,215Saul Centers, Inc. 878 53,207Select Income REIT 4,661 108,182Senior Housing Properties Trust 26,895 530,369Seritage Growth Properties, Class A 1,859 89,344Simon Property Group, Inc. 19,610 3,075,829SL Green Realty Corp. 6,467 623,289STAG Industrial, Inc. 6,524 182,607Starwood Waypoint Homes 7,313 272,263Summit Hotel Properties, Inc. 7,449 110,543Sunstone Hotel Investors, Inc. 15,965 252,247Tanger Factory Outlet Centers, Inc. 10,921 255,551Taubman Centers, Inc. 6,872 358,993Terreno Realty Corp. 3,586 129,993
John Hancock Funds IIPortfolio of Investments — August 31, 2017 (showing percentage of total net assets)
223
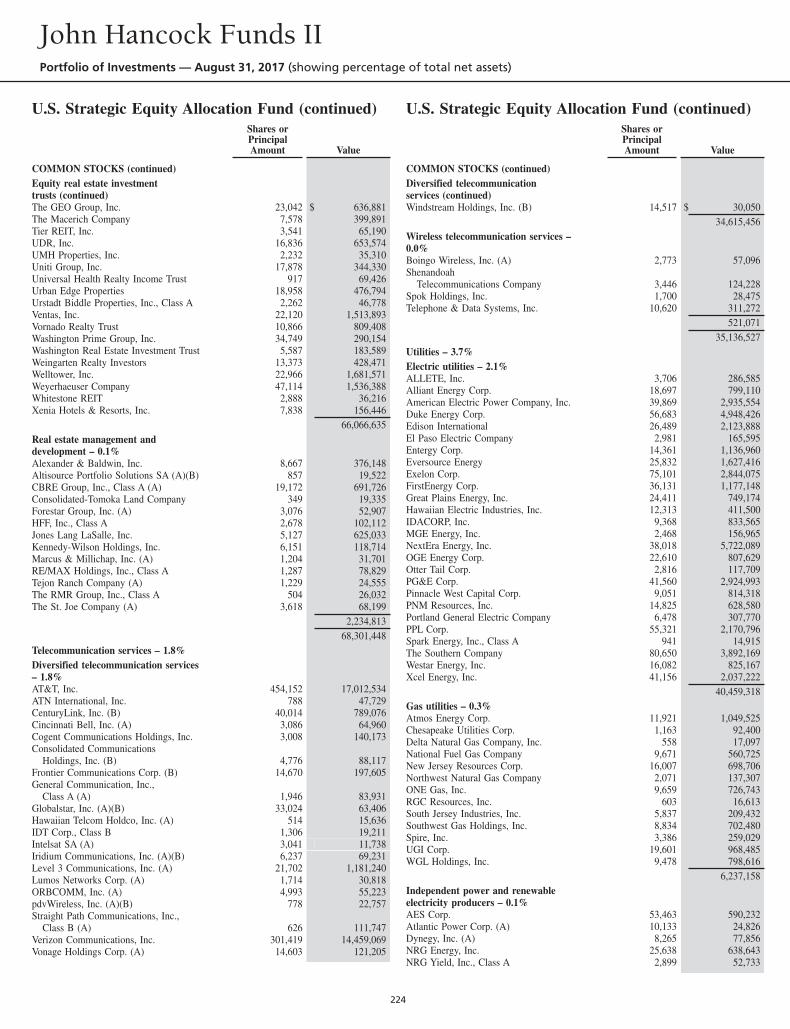
U.S. Strategic Equity Allocation Fund (continued)Shares orPrincipalAmount Value
COMMON STOCKS (continued)Equity real estate investmenttrusts (continued)The GEO Group, Inc. 23,042 $ 636,881The Macerich Company 7,578 399,891Tier REIT, Inc. 3,541 65,190UDR, Inc. 16,836 653,574UMH Properties, Inc. 2,232 35,310Uniti Group, Inc. 17,878 344,330Universal Health Realty Income Trust 917 69,426Urban Edge Properties 18,958 476,794Urstadt Biddle Properties, Inc., Class A 2,262 46,778Ventas, Inc. 22,120 1,513,893Vornado Realty Trust 10,866 809,408Washington Prime Group, Inc. 34,749 290,154Washington Real Estate Investment Trust 5,587 183,589Weingarten Realty Investors 13,373 428,471Welltower, Inc. 22,966 1,681,571Weyerhaeuser Company 47,114 1,536,388Whitestone REIT 2,888 36,216Xenia Hotels & Resorts, Inc. 7,838 156,446
66,066,635Real estate management anddevelopment – 0.1%Alexander & Baldwin, Inc. 8,667 376,148Altisource Portfolio Solutions SA (A)(B) 857 19,522CBRE Group, Inc., Class A (A) 19,172 691,726Consolidated-Tomoka Land Company 349 19,335Forestar Group, Inc. (A) 3,076 52,907HFF, Inc., Class A 2,678 102,112Jones Lang LaSalle, Inc. 5,127 625,033Kennedy-Wilson Holdings, Inc. 6,151 118,714Marcus & Millichap, Inc. (A) 1,204 31,701RE/MAX Holdings, Inc., Class A 1,287 78,829Tejon Ranch Company (A) 1,229 24,555The RMR Group, Inc., Class A 504 26,032The St. Joe Company (A) 3,618 68,199
2,234,81368,301,448
Telecommunication services – 1.8%Diversified telecommunication services– 1.8%AT&T, Inc. 454,152 17,012,534ATN International, Inc. 788 47,729CenturyLink, Inc. (B) 40,014 789,076Cincinnati Bell, Inc. (A) 3,086 64,960Cogent Communications Holdings, Inc. 3,008 140,173Consolidated Communications
Holdings, Inc. (B) 4,776 88,117Frontier Communications Corp. (B) 14,670 197,605General Communication, Inc.,
Class A (A) 1,946 83,931Globalstar, Inc. (A)(B) 33,024 63,406Hawaiian Telcom Holdco, Inc. (A) 514 15,636IDT Corp., Class B 1,306 19,211Intelsat SA (A) 3,041 11,738Iridium Communications, Inc. (A)(B) 6,237 69,231Level 3 Communications, Inc. (A) 21,702 1,181,240Lumos Networks Corp. (A) 1,714 30,818ORBCOMM, Inc. (A) 4,993 55,223pdvWireless, Inc. (A)(B) 778 22,757Straight Path Communications, Inc.,
Class B (A) 626 111,747Verizon Communications, Inc. 301,419 14,459,069Vonage Holdings Corp. (A) 14,603 121,205
U.S. Strategic Equity Allocation Fund (continued)Shares orPrincipalAmount Value
COMMON STOCKS (continued)Diversified telecommunicationservices (continued)Windstream Holdings, Inc. (B) 14,517 $ 30,050
34,615,456Wireless telecommunication services –0.0%Boingo Wireless, Inc. (A) 2,773 57,096Shenandoah
Telecommunications Company 3,446 124,228Spok Holdings, Inc. 1,700 28,475Telephone & Data Systems, Inc. 10,620 311,272
521,07135,136,527
Utilities – 3.7%Electric utilities – 2.1%ALLETE, Inc. 3,706 286,585Alliant Energy Corp. 18,697 799,110American Electric Power Company, Inc. 39,869 2,935,554Duke Energy Corp. 56,683 4,948,426Edison International 26,489 2,123,888El Paso Electric Company 2,981 165,595Entergy Corp. 14,361 1,136,960Eversource Energy 25,832 1,627,416Exelon Corp. 75,101 2,844,075FirstEnergy Corp. 36,131 1,177,148Great Plains Energy, Inc. 24,411 749,174Hawaiian Electric Industries, Inc. 12,313 411,500IDACORP, Inc. 9,368 833,565MGE Energy, Inc. 2,468 156,965NextEra Energy, Inc. 38,018 5,722,089OGE Energy Corp. 22,610 807,629Otter Tail Corp. 2,816 117,709PG&E Corp. 41,560 2,924,993Pinnacle West Capital Corp. 9,051 814,318PNM Resources, Inc. 14,825 628,580Portland General Electric Company 6,478 307,770PPL Corp. 55,321 2,170,796Spark Energy, Inc., Class A 941 14,915The Southern Company 80,650 3,892,169Westar Energy, Inc. 16,082 825,167Xcel Energy, Inc. 41,156 2,037,222
40,459,318Gas utilities – 0.3%Atmos Energy Corp. 11,921 1,049,525Chesapeake Utilities Corp. 1,163 92,400Delta Natural Gas Company, Inc. 558 17,097National Fuel Gas Company 9,671 560,725New Jersey Resources Corp. 16,007 698,706Northwest Natural Gas Company 2,071 137,307ONE Gas, Inc. 9,659 726,743RGC Resources, Inc. 603 16,613South Jersey Industries, Inc. 5,837 209,432Southwest Gas Holdings, Inc. 8,834 702,480Spire, Inc. 3,386 259,029UGI Corp. 19,601 968,485WGL Holdings, Inc. 9,478 798,616
6,237,158Independent power and renewableelectricity producers – 0.1%AES Corp. 53,463 590,232Atlantic Power Corp. (A) 10,133 24,826Dynegy, Inc. (A) 8,265 77,856NRG Energy, Inc. 25,638 638,643NRG Yield, Inc., Class A 2,899 52,733
John Hancock Funds IIPortfolio of Investments — August 31, 2017 (showing percentage of total net assets)
224
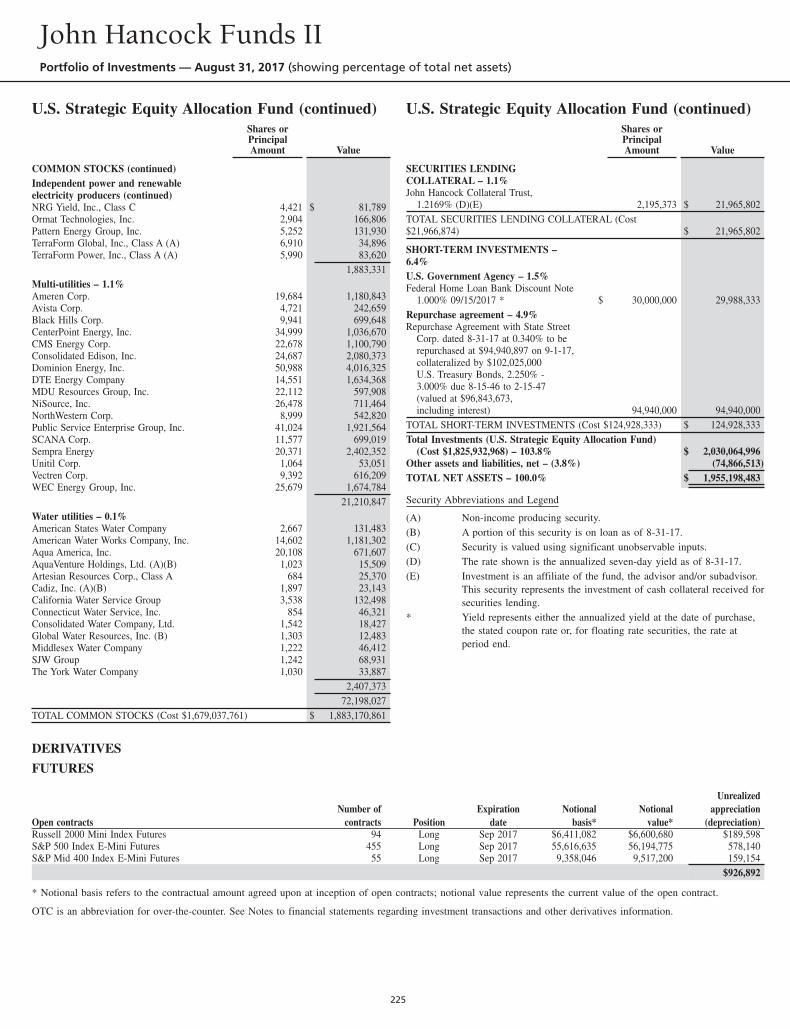
U.S. Strategic Equity Allocation Fund (continued)Shares orPrincipalAmount Value
COMMON STOCKS (continued)Independent power and renewableelectricity producers (continued)NRG Yield, Inc., Class C 4,421 $ 81,789Ormat Technologies, Inc. 2,904 166,806Pattern Energy Group, Inc. 5,252 131,930TerraForm Global, Inc., Class A (A) 6,910 34,896TerraForm Power, Inc., Class A (A) 5,990 83,620
1,883,331Multi-utilities – 1.1%Ameren Corp. 19,684 1,180,843Avista Corp. 4,721 242,659Black Hills Corp. 9,941 699,648CenterPoint Energy, Inc. 34,999 1,036,670CMS Energy Corp. 22,678 1,100,790Consolidated Edison, Inc. 24,687 2,080,373Dominion Energy, Inc. 50,988 4,016,325DTE Energy Company 14,551 1,634,368MDU Resources Group, Inc. 22,112 597,908NiSource, Inc. 26,478 711,464NorthWestern Corp. 8,999 542,820Public Service Enterprise Group, Inc. 41,024 1,921,564SCANA Corp. 11,577 699,019Sempra Energy 20,371 2,402,352Unitil Corp. 1,064 53,051Vectren Corp. 9,392 616,209WEC Energy Group, Inc. 25,679 1,674,784
21,210,847Water utilities – 0.1%American States Water Company 2,667 131,483American Water Works Company, Inc. 14,602 1,181,302Aqua America, Inc. 20,108 671,607AquaVenture Holdings, Ltd. (A)(B) 1,023 15,509Artesian Resources Corp., Class A 684 25,370Cadiz, Inc. (A)(B) 1,897 23,143California Water Service Group 3,538 132,498Connecticut Water Service, Inc. 854 46,321Consolidated Water Company, Ltd. 1,542 18,427Global Water Resources, Inc. (B) 1,303 12,483Middlesex Water Company 1,222 46,412SJW Group 1,242 68,931The York Water Company 1,030 33,887
2,407,37372,198,027
TOTAL COMMON STOCKS (Cost $1,679,037,761) $ 1,883,170,861
U.S. Strategic Equity Allocation Fund (continued)Shares orPrincipalAmount Value
SECURITIES LENDINGCOLLATERAL – 1.1%John Hancock Collateral Trust,
1.2169% (D)(E) 2,195,373 $ 21,965,802TOTAL SECURITIES LENDING COLLATERAL (Cost$21,966,874) $ 21,965,802
SHORT-TERM INVESTMENTS –6.4%U.S. Government Agency – 1.5%Federal Home Loan Bank Discount Note
1.000% 09/15/2017 * $ 30,000,000 29,988,333Repurchase agreement – 4.9%Repurchase Agreement with State Street
Corp. dated 8-31-17 at 0.340% to berepurchased at $94,940,897 on 9-1-17,collateralized by $102,025,000U.S. Treasury Bonds, 2.250% -3.000% due 8-15-46 to 2-15-47(valued at $96,843,673,including interest) 94,940,000 94,940,000
TOTAL SHORT-TERM INVESTMENTS (Cost $124,928,333) $ 124,928,333Total Investments (U.S. Strategic Equity Allocation Fund)
(Cost $1,825,932,968) – 103.8% $ 2,030,064,996Other assets and liabilities, net – (3.8%) (74,866,513)TOTAL NET ASSETS – 100.0% $ 1,955,198,483
Security Abbreviations and Legend
(A) Non-income producing security.(B) A portion of this security is on loan as of 8-31-17.(C) Security is valued using significant unobservable inputs.(D) The rate shown is the annualized seven-day yield as of 8-31-17.(E) Investment is an affiliate of the fund, the advisor and/or subadvisor.
This security represents the investment of cash collateral received forsecurities lending.
* Yield represents either the annualized yield at the date of purchase,the stated coupon rate or, for floating rate securities, the rate atperiod end.
DERIVATIVES
FUTURES
Open contractsNumber of
contracts PositionExpiration
dateNotional
basis*Notional
value*
Unrealizedappreciation
(depreciation)Russell 2000 Mini Index Futures 94 Long Sep 2017 $6,411,082 $6,600,680 $189,598S&P 500 Index E-Mini Futures 455 Long Sep 2017 55,616,635 56,194,775 578,140S&P Mid 400 Index E-Mini Futures 55 Long Sep 2017 9,358,046 9,517,200 159,154
$926,892
* Notional basis refers to the contractual amount agreed upon at inception of open contracts; notional value represents the current value of the open contract.
OTC is an abbreviation for over-the-counter. See Notes to financial statements regarding investment transactions and other derivatives information.
John Hancock Funds IIPortfolio of Investments — August 31, 2017 (showing percentage of total net assets)
225
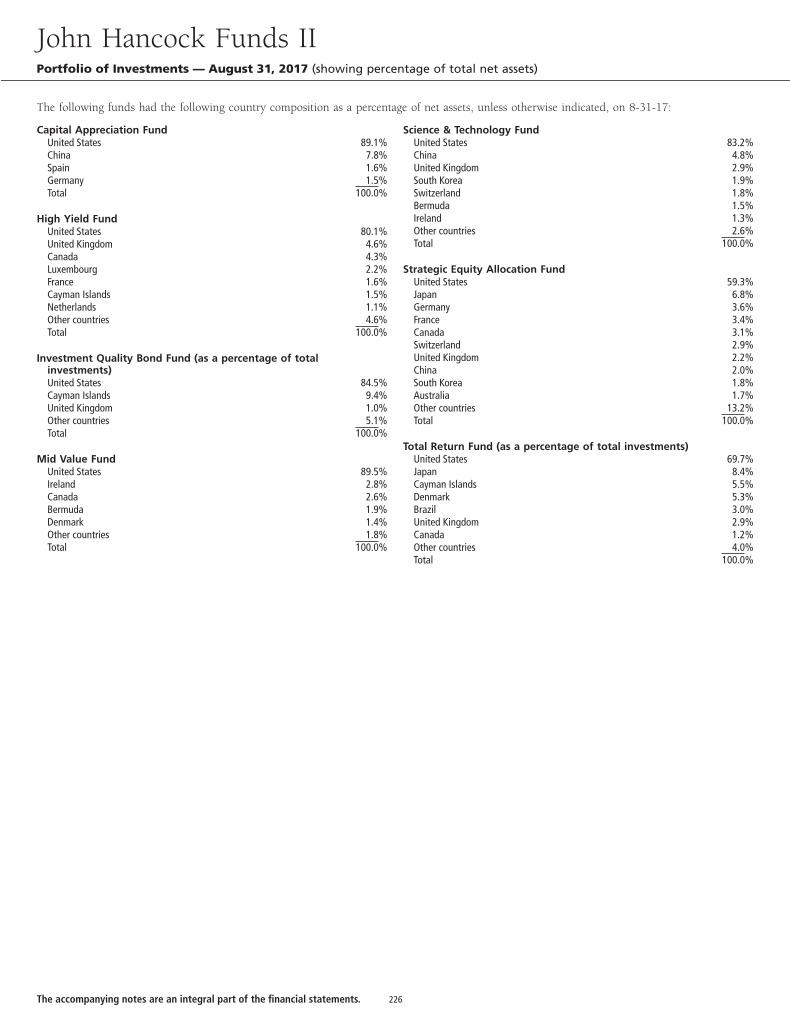
The following funds had the following country composition as a percentage of net assets, unless otherwise indicated, on 8-31-17:
Capital Appreciation FundUnited States 89.1%China 7.8%Spain 1.6%Germany 1.5%Total 100.0%
High Yield FundUnited States 80.1%United Kingdom 4.6%Canada 4.3%Luxembourg 2.2%France 1.6%Cayman Islands 1.5%Netherlands 1.1%Other countries 4.6%Total 100.0%
Investment Quality Bond Fund (as a percentage of totalinvestments)United States 84.5%Cayman Islands 9.4%United Kingdom 1.0%Other countries 5.1%Total 100.0%
Mid Value FundUnited States 89.5%Ireland 2.8%Canada 2.6%Bermuda 1.9%Denmark 1.4%Other countries 1.8%Total 100.0%
Science & Technology FundUnited States 83.2%China 4.8%United Kingdom 2.9%South Korea 1.9%Switzerland 1.8%Bermuda 1.5%Ireland 1.3%Other countries 2.6%Total 100.0%
Strategic Equity Allocation FundUnited States 59.3%Japan 6.8%Germany 3.6%France 3.4%Canada 3.1%Switzerland 2.9%United Kingdom 2.2%China 2.0%South Korea 1.8%Australia 1.7%Other countries 13.2%Total 100.0%
Total Return Fund (as a percentage of total investments)United States 69.7%Japan 8.4%Cayman Islands 5.5%Denmark 5.3%Brazil 3.0%United Kingdom 2.9%Canada 1.2%Other countries 4.0%Total 100.0%
John Hancock Funds IIPortfolio of Investments — August 31, 2017 (showing percentage of total net assets)
The accompanying notes are an integral part of the financial statements. 226
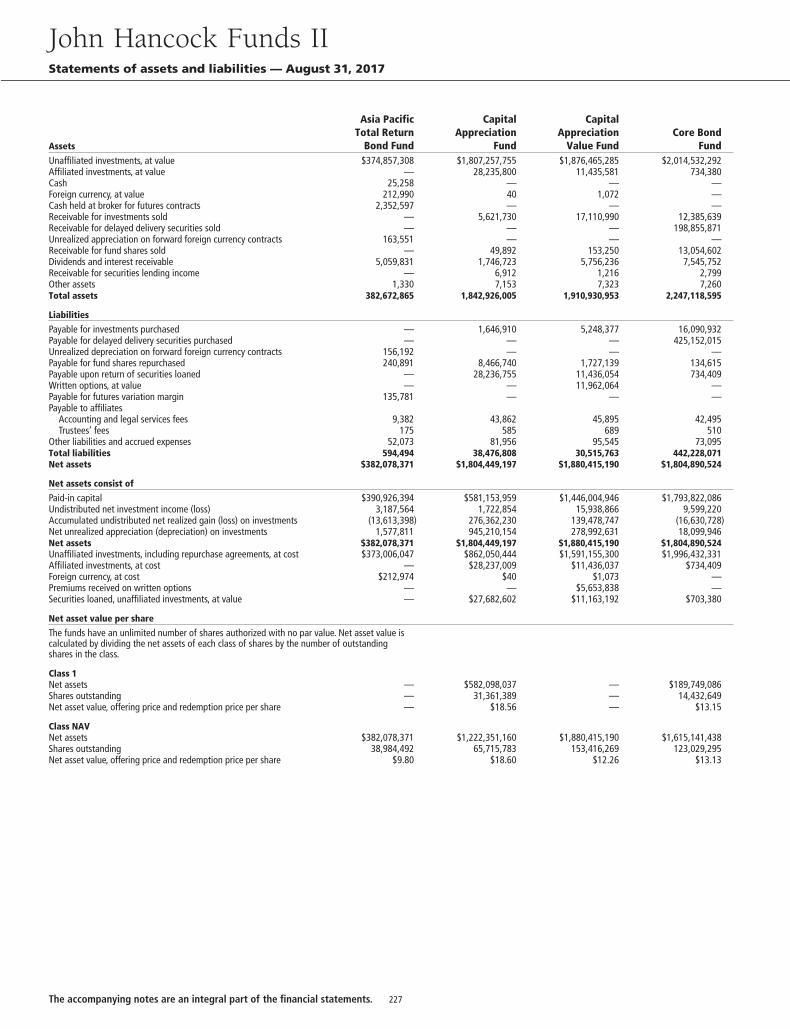
Assets
Asia PacificTotal Return
Bond Fund
CapitalAppreciation
Fund
CapitalAppreciation
Value FundCore Bond
FundUnaffiliated investments, at value $374,857,308 $1,807,257,755 $1,876,465,285 $2,014,532,292Affiliated investments, at value — 28,235,800 11,435,581 734,380Cash 25,258 — — —Foreign currency, at value 212,990 40 1,072 —Cash held at broker for futures contracts 2,352,597 — — —Receivable for investments sold — 5,621,730 17,110,990 12,385,639Receivable for delayed delivery securities sold — — — 198,855,871Unrealized appreciation on forward foreign currency contracts 163,551 — — —Receivable for fund shares sold — 49,892 153,250 13,054,602Dividends and interest receivable 5,059,831 1,746,723 5,756,236 7,545,752Receivable for securities lending income — 6,912 1,216 2,799Other assets 1,330 7,153 7,323 7,260Total assets 382,672,865 1,842,926,005 1,910,930,953 2,247,118,595
Liabilities
Payable for investments purchased — 1,646,910 5,248,377 16,090,932Payable for delayed delivery securities purchased — — — 425,152,015Unrealized depreciation on forward foreign currency contracts 156,192 — — —Payable for fund shares repurchased 240,891 8,466,740 1,727,139 134,615Payable upon return of securities loaned — 28,236,755 11,436,054 734,409Written options, at value — — 11,962,064 —Payable for futures variation margin 135,781 — — —Payable to affiliates
Accounting and legal services fees 9,382 43,862 45,895 42,495Trustees’ fees 175 585 689 510
Other liabilities and accrued expenses 52,073 81,956 95,545 73,095Total liabilities 594,494 38,476,808 30,515,763 442,228,071Net assets $382,078,371 $1,804,449,197 $1,880,415,190 $1,804,890,524
Net assets consist of
Paid-in capital $390,926,394 $581,153,959 $1,446,004,946 $1,793,822,086Undistributed net investment income (loss) 3,187,564 1,722,854 15,938,866 9,599,220Accumulated undistributed net realized gain (loss) on investments (13,613,398) 276,362,230 139,478,747 (16,630,728)Net unrealized appreciation (depreciation) on investments 1,577,811 945,210,154 278,992,631 18,099,946Net assets $382,078,371 $1,804,449,197 $1,880,415,190 $1,804,890,524Unaffiliated investments, including repurchase agreements, at cost $373,006,047 $862,050,444 $1,591,155,300 $1,996,432,331Affiliated investments, at cost — $28,237,009 $11,436,037 $734,409Foreign currency, at cost $212,974 $40 $1,073 —Premiums received on written options — — $5,653,838 —Securities loaned, unaffiliated investments, at value — $27,682,602 $11,163,192 $703,380
Net asset value per share
The funds have an unlimited number of shares authorized with no par value. Net asset value iscalculated by dividing the net assets of each class of shares by the number of outstandingshares in the class.
Class 1Net assets — $582,098,037 — $189,749,086Shares outstanding — 31,361,389 — 14,432,649Net asset value, offering price and redemption price per share — $18.56 — $13.15
Class NAVNet assets $382,078,371 $1,222,351,160 $1,880,415,190 $1,615,141,438Shares outstanding 38,984,492 65,715,783 153,416,269 123,029,295Net asset value, offering price and redemption price per share $9.80 $18.60 $12.26 $13.13
John Hancock Funds IIStatements of assets and liabilities — August 31, 2017
227The accompanying notes are an integral part of the financial statements.
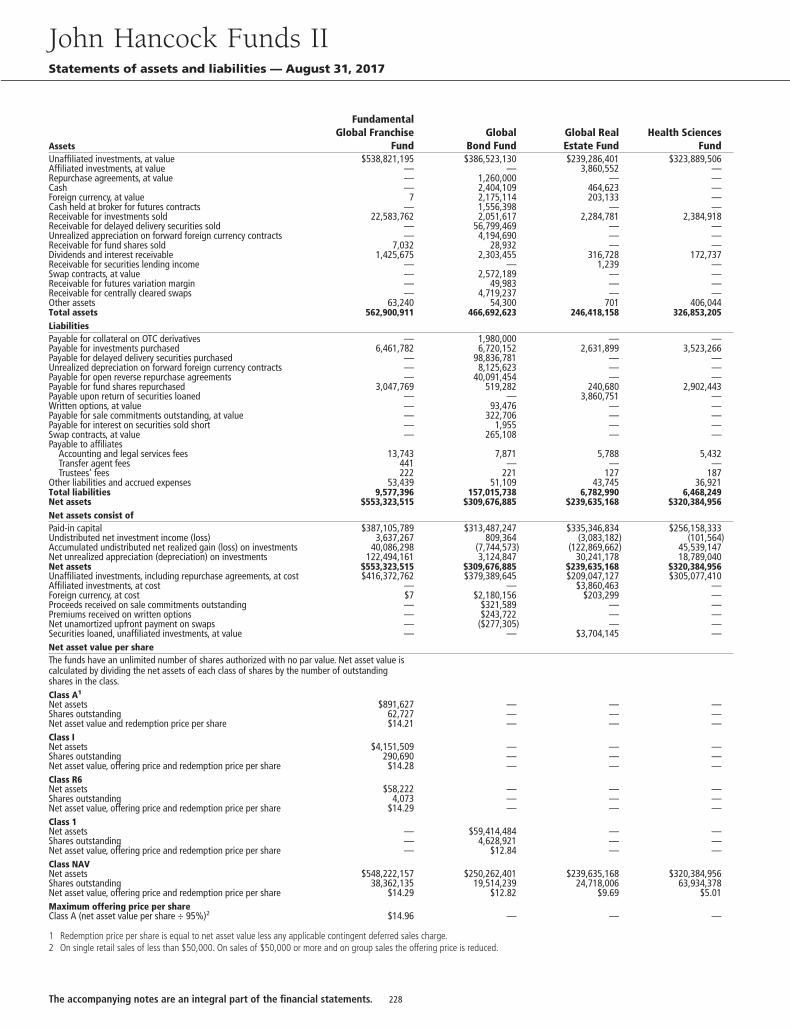
Assets
FundamentalGlobal Franchise
FundGlobal
Bond FundGlobal RealEstate Fund
Health SciencesFund
Unaffiliated investments, at value $538,821,195 $386,523,130 $239,286,401 $323,889,506Affiliated investments, at value — — 3,860,552 —Repurchase agreements, at value — 1,260,000 — —Cash — 2,404,109 464,623 —Foreign currency, at value 7 2,175,114 203,133 —Cash held at broker for futures contracts — 1,556,398 — —Receivable for investments sold 22,583,762 2,051,617 2,284,781 2,384,918Receivable for delayed delivery securities sold — 56,799,469 — —Unrealized appreciation on forward foreign currency contracts — 4,194,690 — —Receivable for fund shares sold 7,032 28,932 — —Dividends and interest receivable 1,425,675 2,303,455 316,728 172,737Receivable for securities lending income — — 1,239 —Swap contracts, at value — 2,572,189 — —Receivable for futures variation margin — 49,983 — —Receivable for centrally cleared swaps — 4,719,237 — —Other assets 63,240 54,300 701 406,044Total assets 562,900,911 466,692,623 246,418,158 326,853,205LiabilitiesPayable for collateral on OTC derivatives — 1,980,000 — —Payable for investments purchased 6,461,782 6,720,152 2,631,899 3,523,266Payable for delayed delivery securities purchased — 98,836,781 — —Unrealized depreciation on forward foreign currency contracts — 8,125,623 — —Payable for open reverse repurchase agreements — 40,091,454 — —Payable for fund shares repurchased 3,047,769 519,282 240,680 2,902,443Payable upon return of securities loaned — — 3,860,751 —Written options, at value — 93,476 — —Payable for sale commitments outstanding, at value — 322,706 — —Payable for interest on securities sold short — 1,955 — —Swap contracts, at value — 265,108 — —Payable to affiliates
Accounting and legal services fees 13,743 7,871 5,788 5,432Transfer agent fees 441 — — —Trustees’ fees 222 221 127 187
Other liabilities and accrued expenses 53,439 51,109 43,745 36,921Total liabilities 9,577,396 157,015,738 6,782,990 6,468,249Net assets $553,323,515 $309,676,885 $239,635,168 $320,384,956Net assets consist ofPaid-in capital $387,105,789 $313,487,247 $335,346,834 $256,158,333Undistributed net investment income (loss) 3,637,267 809,364 (3,083,182) (101,564)Accumulated undistributed net realized gain (loss) on investments 40,086,298 (7,744,573) (122,869,662) 45,539,147Net unrealized appreciation (depreciation) on investments 122,494,161 3,124,847 30,241,178 18,789,040Net assets $553,323,515 $309,676,885 $239,635,168 $320,384,956Unaffiliated investments, including repurchase agreements, at cost $416,372,762 $379,389,645 $209,047,127 $305,077,410Affiliated investments, at cost — — $3,860,463 —Foreign currency, at cost $7 $2,180,156 $203,299 —Proceeds received on sale commitments outstanding — $321,589 — —Premiums received on written options — $243,722 — —Net unamortized upfront payment on swaps — ($277,305) — —Securities loaned, unaffiliated investments, at value — — $3,704,145 —Net asset value per shareThe funds have an unlimited number of shares authorized with no par value. Net asset value iscalculated by dividing the net assets of each class of shares by the number of outstandingshares in the class.Class A1
Net assets $891,627 — — —Shares outstanding 62,727 — — —Net asset value and redemption price per share $14.21 — — —Class INet assets $4,151,509 — — —Shares outstanding 290,690 — — —Net asset value, offering price and redemption price per share $14.28 — — —Class R6Net assets $58,222 — — —Shares outstanding 4,073 — — —Net asset value, offering price and redemption price per share $14.29 — — —Class 1Net assets — $59,414,484 — —Shares outstanding — 4,628,921 — —Net asset value, offering price and redemption price per share — $12.84 — —Class NAVNet assets $548,222,157 $250,262,401 $239,635,168 $320,384,956Shares outstanding 38,362,135 19,514,239 24,718,006 63,934,378Net asset value, offering price and redemption price per share $14.29 $12.82 $9.69 $5.01Maximum offering price per shareClass A (net asset value per share ÷ 95%)2 $14.96 — — —
1 Redemption price per share is equal to net asset value less any applicable contingent deferred sales charge.2 On single retail sales of less than $50,000. On sales of $50,000 or more and on group sales the offering price is reduced.
John Hancock Funds IIStatements of assets and liabilities — August 31, 2017
228The accompanying notes are an integral part of the financial statements.
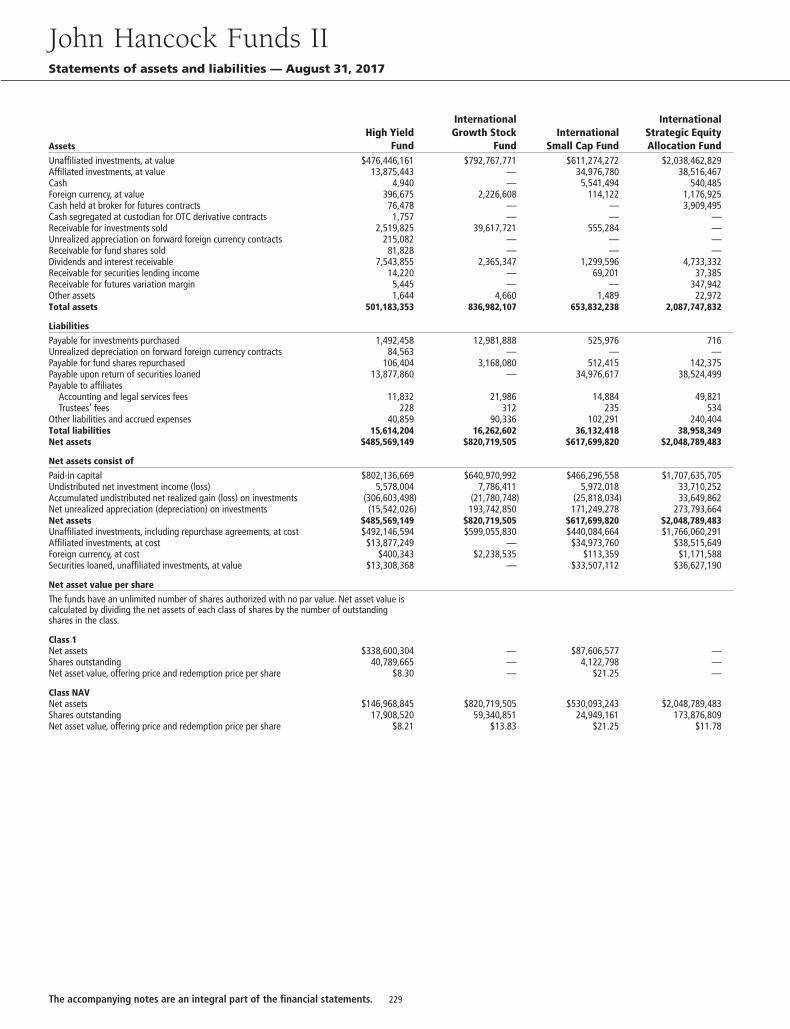
AssetsHigh Yield
Fund
InternationalGrowth Stock
FundInternational
Small Cap Fund
InternationalStrategic EquityAllocation Fund
Unaffiliated investments, at value $476,446,161 $792,767,771 $611,274,272 $2,038,462,829Affiliated investments, at value 13,875,443 — 34,976,780 38,516,467Cash 4,940 — 5,541,494 540,485Foreign currency, at value 396,675 2,226,608 114,122 1,176,925Cash held at broker for futures contracts 76,478 — — 3,909,495Cash segregated at custodian for OTC derivative contracts 1,757 — — —Receivable for investments sold 2,519,825 39,617,721 555,284 —Unrealized appreciation on forward foreign currency contracts 215,082 — — —Receivable for fund shares sold 81,828 — — —Dividends and interest receivable 7,543,855 2,365,347 1,299,596 4,733,332Receivable for securities lending income 14,220 — 69,201 37,385Receivable for futures variation margin 5,445 — — 347,942Other assets 1,644 4,660 1,489 22,972Total assets 501,183,353 836,982,107 653,832,238 2,087,747,832
Liabilities
Payable for investments purchased 1,492,458 12,981,888 525,976 716Unrealized depreciation on forward foreign currency contracts 84,563 — — —Payable for fund shares repurchased 106,404 3,168,080 512,415 142,375Payable upon return of securities loaned 13,877,860 — 34,976,617 38,524,499Payable to affiliates
Accounting and legal services fees 11,832 21,986 14,884 49,821Trustees’ fees 228 312 235 534
Other liabilities and accrued expenses 40,859 90,336 102,291 240,404Total liabilities 15,614,204 16,262,602 36,132,418 38,958,349Net assets $485,569,149 $820,719,505 $617,699,820 $2,048,789,483
Net assets consist of
Paid-in capital $802,136,669 $640,970,992 $466,296,558 $1,707,635,705Undistributed net investment income (loss) 5,578,004 7,786,411 5,972,018 33,710,252Accumulated undistributed net realized gain (loss) on investments (306,603,498) (21,780,748) (25,818,034) 33,649,862Net unrealized appreciation (depreciation) on investments (15,542,026) 193,742,850 171,249,278 273,793,664Net assets $485,569,149 $820,719,505 $617,699,820 $2,048,789,483Unaffiliated investments, including repurchase agreements, at cost $492,146,594 $599,055,830 $440,084,664 $1,766,060,291Affiliated investments, at cost $13,877,249 — $34,973,760 $38,515,649Foreign currency, at cost $400,343 $2,238,535 $113,359 $1,171,588Securities loaned, unaffiliated investments, at value $13,308,368 — $33,507,112 $36,627,190
Net asset value per share
The funds have an unlimited number of shares authorized with no par value. Net asset value iscalculated by dividing the net assets of each class of shares by the number of outstandingshares in the class.
Class 1Net assets $338,600,304 — $87,606,577 —Shares outstanding 40,789,665 — 4,122,798 —Net asset value, offering price and redemption price per share $8.30 — $21.25 —
Class NAVNet assets $146,968,845 $820,719,505 $530,093,243 $2,048,789,483Shares outstanding 17,908,520 59,340,851 24,949,161 173,876,809Net asset value, offering price and redemption price per share $8.21 $13.83 $21.25 $11.78
John Hancock Funds IIStatements of assets and liabilities — August 31, 2017
229The accompanying notes are an integral part of the financial statements.
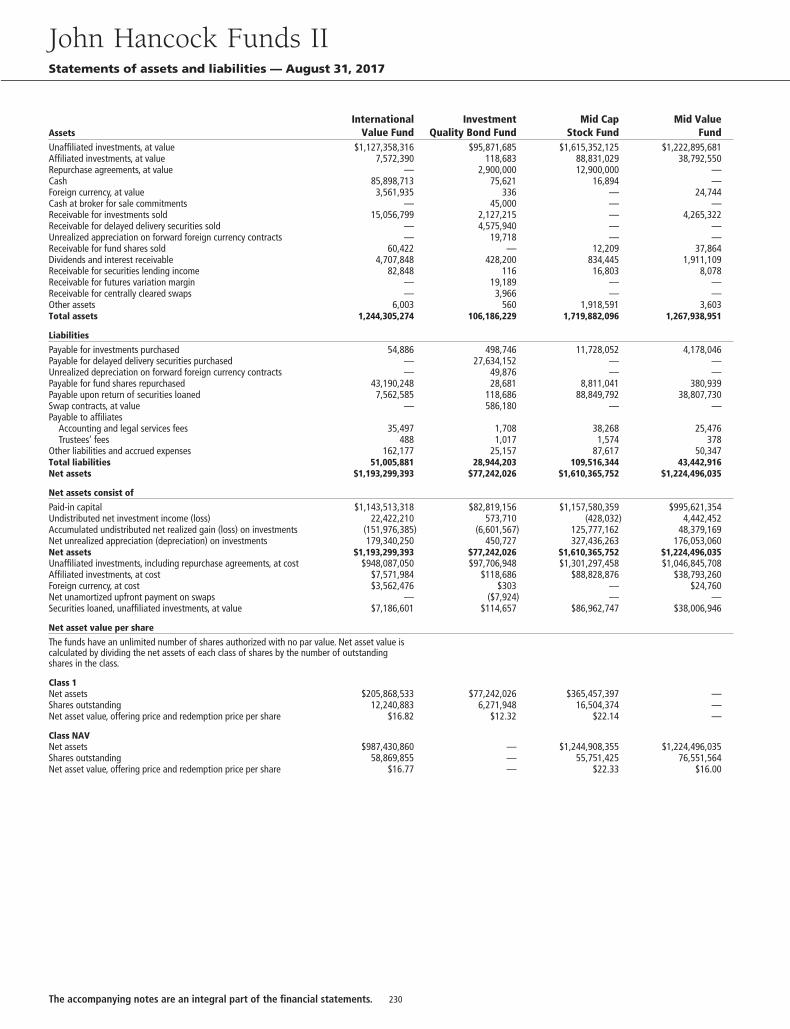
AssetsInternational
Value FundInvestment
Quality Bond FundMid Cap
Stock FundMid Value
FundUnaffiliated investments, at value $1,127,358,316 $95,871,685 $1,615,352,125 $1,222,895,681Affiliated investments, at value 7,572,390 118,683 88,831,029 38,792,550Repurchase agreements, at value — 2,900,000 12,900,000 —Cash 85,898,713 75,621 16,894 —Foreign currency, at value 3,561,935 336 — 24,744Cash at broker for sale commitments — 45,000 — —Receivable for investments sold 15,056,799 2,127,215 — 4,265,322Receivable for delayed delivery securities sold — 4,575,940 — —Unrealized appreciation on forward foreign currency contracts — 19,718 — —Receivable for fund shares sold 60,422 — 12,209 37,864Dividends and interest receivable 4,707,848 428,200 834,445 1,911,109Receivable for securities lending income 82,848 116 16,803 8,078Receivable for futures variation margin — 19,189 — —Receivable for centrally cleared swaps — 3,966 — —Other assets 6,003 560 1,918,591 3,603Total assets 1,244,305,274 106,186,229 1,719,882,096 1,267,938,951
Liabilities
Payable for investments purchased 54,886 498,746 11,728,052 4,178,046Payable for delayed delivery securities purchased — 27,634,152 — —Unrealized depreciation on forward foreign currency contracts — 49,876 — —Payable for fund shares repurchased 43,190,248 28,681 8,811,041 380,939Payable upon return of securities loaned 7,562,585 118,686 88,849,792 38,807,730Swap contracts, at value — 586,180 — —Payable to affiliates
Accounting and legal services fees 35,497 1,708 38,268 25,476Trustees’ fees 488 1,017 1,574 378
Other liabilities and accrued expenses 162,177 25,157 87,617 50,347Total liabilities 51,005,881 28,944,203 109,516,344 43,442,916Net assets $1,193,299,393 $77,242,026 $1,610,365,752 $1,224,496,035
Net assets consist of
Paid-in capital $1,143,513,318 $82,819,156 $1,157,580,359 $995,621,354Undistributed net investment income (loss) 22,422,210 573,710 (428,032) 4,442,452Accumulated undistributed net realized gain (loss) on investments (151,976,385) (6,601,567) 125,777,162 48,379,169Net unrealized appreciation (depreciation) on investments 179,340,250 450,727 327,436,263 176,053,060Net assets $1,193,299,393 $77,242,026 $1,610,365,752 $1,224,496,035Unaffiliated investments, including repurchase agreements, at cost $948,087,050 $97,706,948 $1,301,297,458 $1,046,845,708Affiliated investments, at cost $7,571,984 $118,686 $88,828,876 $38,793,260Foreign currency, at cost $3,562,476 $303 — $24,760Net unamortized upfront payment on swaps — ($7,924) — —Securities loaned, unaffiliated investments, at value $7,186,601 $114,657 $86,962,747 $38,006,946
Net asset value per share
The funds have an unlimited number of shares authorized with no par value. Net asset value iscalculated by dividing the net assets of each class of shares by the number of outstandingshares in the class.
Class 1Net assets $205,868,533 $77,242,026 $365,457,397 —Shares outstanding 12,240,883 6,271,948 16,504,374 —Net asset value, offering price and redemption price per share $16.82 $12.32 $22.14 —
Class NAVNet assets $987,430,860 — $1,244,908,355 $1,224,496,035Shares outstanding 58,869,855 — 55,751,425 76,551,564Net asset value, offering price and redemption price per share $16.77 — $22.33 $16.00
John Hancock Funds IIStatements of assets and liabilities — August 31, 2017
230The accompanying notes are an integral part of the financial statements.
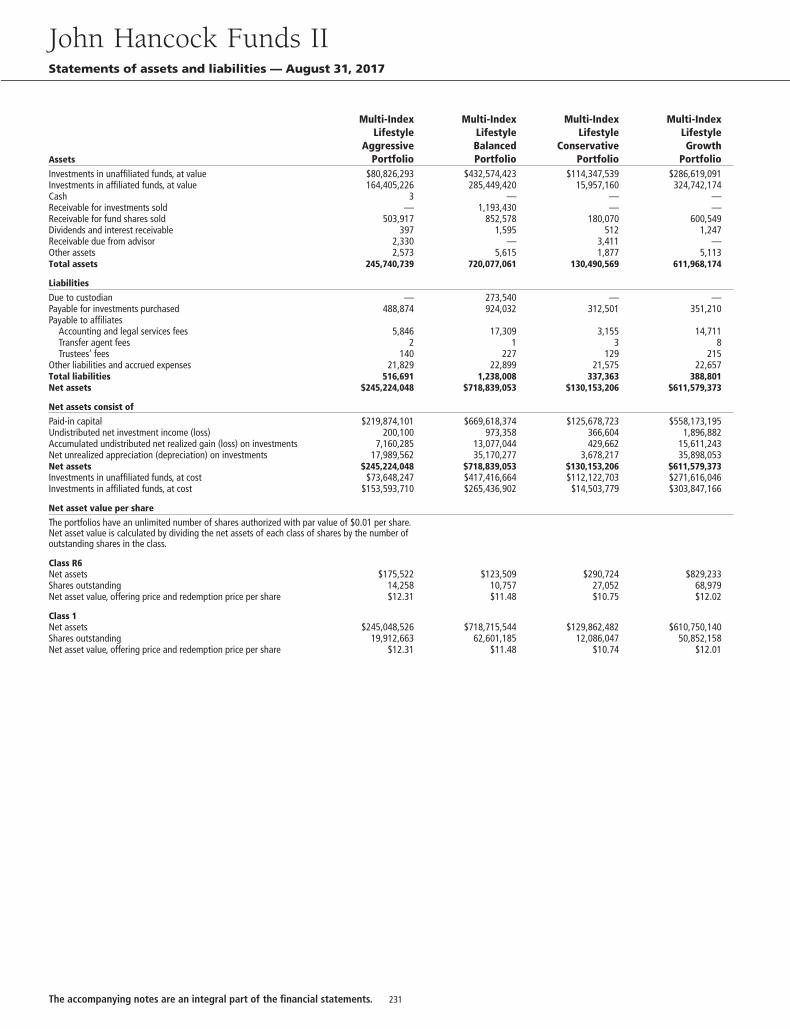
Assets
Multi-IndexLifestyle
AggressivePortfolio
Multi-IndexLifestyleBalancedPortfolio
Multi-IndexLifestyle
ConservativePortfolio
Multi-IndexLifestyleGrowth
PortfolioInvestments in unaffiliated funds, at value $80,826,293 $432,574,423 $114,347,539 $286,619,091Investments in affiliated funds, at value 164,405,226 285,449,420 15,957,160 324,742,174Cash 3 — — —Receivable for investments sold — 1,193,430 — —Receivable for fund shares sold 503,917 852,578 180,070 600,549Dividends and interest receivable 397 1,595 512 1,247Receivable due from advisor 2,330 — 3,411 —Other assets 2,573 5,615 1,877 5,113Total assets 245,740,739 720,077,061 130,490,569 611,968,174
Liabilities
Due to custodian — 273,540 — —Payable for investments purchased 488,874 924,032 312,501 351,210Payable to affiliates
Accounting and legal services fees 5,846 17,309 3,155 14,711Transfer agent fees 2 1 3 8Trustees’ fees 140 227 129 215
Other liabilities and accrued expenses 21,829 22,899 21,575 22,657Total liabilities 516,691 1,238,008 337,363 388,801Net assets $245,224,048 $718,839,053 $130,153,206 $611,579,373
Net assets consist of
Paid-in capital $219,874,101 $669,618,374 $125,678,723 $558,173,195Undistributed net investment income (loss) 200,100 973,358 366,604 1,896,882Accumulated undistributed net realized gain (loss) on investments 7,160,285 13,077,044 429,662 15,611,243Net unrealized appreciation (depreciation) on investments 17,989,562 35,170,277 3,678,217 35,898,053Net assets $245,224,048 $718,839,053 $130,153,206 $611,579,373Investments in unaffiliated funds, at cost $73,648,247 $417,416,664 $112,122,703 $271,616,046Investments in affiliated funds, at cost $153,593,710 $265,436,902 $14,503,779 $303,847,166
Net asset value per share
The portfolios have an unlimited number of shares authorized with par value of $0.01 per share.Net asset value is calculated by dividing the net assets of each class of shares by the number ofoutstanding shares in the class.
Class R6Net assets $175,522 $123,509 $290,724 $829,233Shares outstanding 14,258 10,757 27,052 68,979Net asset value, offering price and redemption price per share $12.31 $11.48 $10.75 $12.02
Class 1Net assets $245,048,526 $718,715,544 $129,862,482 $610,750,140Shares outstanding 19,912,663 62,601,185 12,086,047 50,852,158Net asset value, offering price and redemption price per share $12.31 $11.48 $10.74 $12.01
John Hancock Funds IIStatements of assets and liabilities — August 31, 2017
231The accompanying notes are an integral part of the financial statements.
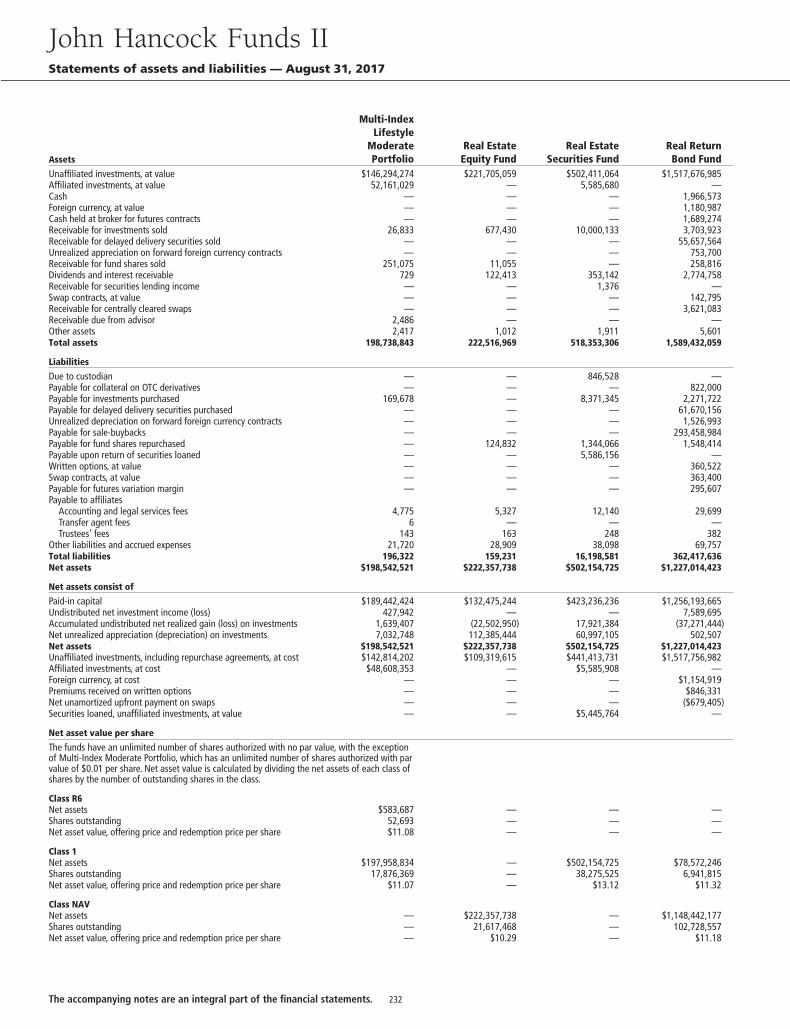
Assets
Multi-IndexLifestyle
ModeratePortfolio
Real EstateEquity Fund
Real EstateSecurities Fund
Real ReturnBond Fund
Unaffiliated investments, at value $146,294,274 $221,705,059 $502,411,064 $1,517,676,985Affiliated investments, at value 52,161,029 — 5,585,680 —Cash — — — 1,966,573Foreign currency, at value — — — 1,180,987Cash held at broker for futures contracts — — — 1,689,274Receivable for investments sold 26,833 677,430 10,000,133 3,703,923Receivable for delayed delivery securities sold — — — 55,657,564Unrealized appreciation on forward foreign currency contracts — — — 753,700Receivable for fund shares sold 251,075 11,055 — 258,816Dividends and interest receivable 729 122,413 353,142 2,774,758Receivable for securities lending income — — 1,376 —Swap contracts, at value — — — 142,795Receivable for centrally cleared swaps — — — 3,621,083Receivable due from advisor 2,486 — — —Other assets 2,417 1,012 1,911 5,601Total assets 198,738,843 222,516,969 518,353,306 1,589,432,059
Liabilities
Due to custodian — — 846,528 —Payable for collateral on OTC derivatives — — — 822,000Payable for investments purchased 169,678 — 8,371,345 2,271,722Payable for delayed delivery securities purchased — — — 61,670,156Unrealized depreciation on forward foreign currency contracts — — — 1,526,993Payable for sale-buybacks — — — 293,458,984Payable for fund shares repurchased — 124,832 1,344,066 1,548,414Payable upon return of securities loaned — — 5,586,156 —Written options, at value — — — 360,522Swap contracts, at value — — — 363,400Payable for futures variation margin — — — 295,607Payable to affiliates
Accounting and legal services fees 4,775 5,327 12,140 29,699Transfer agent fees 6 — — —Trustees’ fees 143 163 248 382
Other liabilities and accrued expenses 21,720 28,909 38,098 69,757Total liabilities 196,322 159,231 16,198,581 362,417,636Net assets $198,542,521 $222,357,738 $502,154,725 $1,227,014,423
Net assets consist of
Paid-in capital $189,442,424 $132,475,244 $423,236,236 $1,256,193,665Undistributed net investment income (loss) 427,942 — — 7,589,695Accumulated undistributed net realized gain (loss) on investments 1,639,407 (22,502,950) 17,921,384 (37,271,444)Net unrealized appreciation (depreciation) on investments 7,032,748 112,385,444 60,997,105 502,507Net assets $198,542,521 $222,357,738 $502,154,725 $1,227,014,423Unaffiliated investments, including repurchase agreements, at cost $142,814,202 $109,319,615 $441,413,731 $1,517,756,982Affiliated investments, at cost $48,608,353 — $5,585,908 —Foreign currency, at cost — — — $1,154,919Premiums received on written options — — — $846,331Net unamortized upfront payment on swaps — — — ($679,405)Securities loaned, unaffiliated investments, at value — — $5,445,764 —
Net asset value per share
The funds have an unlimited number of shares authorized with no par value, with the exceptionof Multi-Index Moderate Portfolio, which has an unlimited number of shares authorized with parvalue of $0.01 per share. Net asset value is calculated by dividing the net assets of each class ofshares by the number of outstanding shares in the class.
Class R6Net assets $583,687 — — —Shares outstanding 52,693 — — —Net asset value, offering price and redemption price per share $11.08 — — —
Class 1Net assets $197,958,834 — $502,154,725 $78,572,246Shares outstanding 17,876,369 — 38,275,525 6,941,815Net asset value, offering price and redemption price per share $11.07 — $13.12 $11.32
Class NAVNet assets — $222,357,738 — $1,148,442,177Shares outstanding — 21,617,468 — 102,728,557Net asset value, offering price and redemption price per share — $10.29 — $11.18
John Hancock Funds IIStatements of assets and liabilities — August 31, 2017
232The accompanying notes are an integral part of the financial statements.
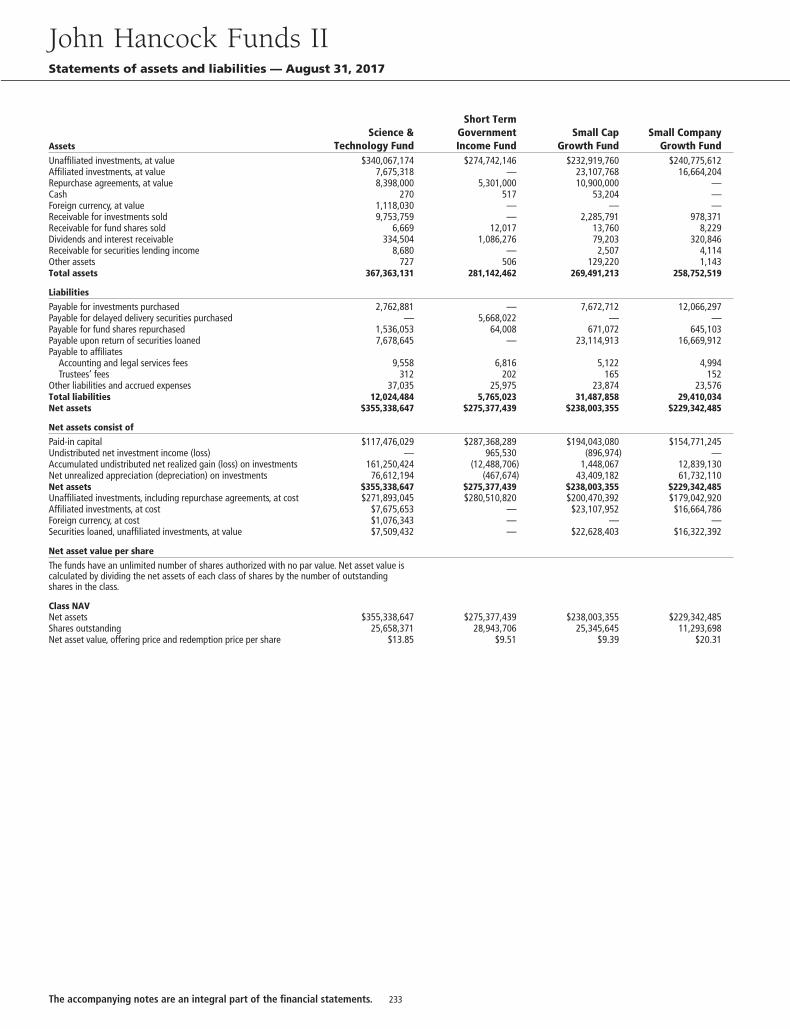
AssetsScience &
Technology Fund
Short TermGovernmentIncome Fund
Small CapGrowth Fund
Small CompanyGrowth Fund
Unaffiliated investments, at value $340,067,174 $274,742,146 $232,919,760 $240,775,612Affiliated investments, at value 7,675,318 — 23,107,768 16,664,204Repurchase agreements, at value 8,398,000 5,301,000 10,900,000 —Cash 270 517 53,204 —Foreign currency, at value 1,118,030 — — —Receivable for investments sold 9,753,759 — 2,285,791 978,371Receivable for fund shares sold 6,669 12,017 13,760 8,229Dividends and interest receivable 334,504 1,086,276 79,203 320,846Receivable for securities lending income 8,680 — 2,507 4,114Other assets 727 506 129,220 1,143Total assets 367,363,131 281,142,462 269,491,213 258,752,519
Liabilities
Payable for investments purchased 2,762,881 — 7,672,712 12,066,297Payable for delayed delivery securities purchased — 5,668,022 — —Payable for fund shares repurchased 1,536,053 64,008 671,072 645,103Payable upon return of securities loaned 7,678,645 — 23,114,913 16,669,912Payable to affiliates
Accounting and legal services fees 9,558 6,816 5,122 4,994Trustees’ fees 312 202 165 152
Other liabilities and accrued expenses 37,035 25,975 23,874 23,576Total liabilities 12,024,484 5,765,023 31,487,858 29,410,034Net assets $355,338,647 $275,377,439 $238,003,355 $229,342,485
Net assets consist of
Paid-in capital $117,476,029 $287,368,289 $194,043,080 $154,771,245Undistributed net investment income (loss) — 965,530 (896,974) —Accumulated undistributed net realized gain (loss) on investments 161,250,424 (12,488,706) 1,448,067 12,839,130Net unrealized appreciation (depreciation) on investments 76,612,194 (467,674) 43,409,182 61,732,110Net assets $355,338,647 $275,377,439 $238,003,355 $229,342,485Unaffiliated investments, including repurchase agreements, at cost $271,893,045 $280,510,820 $200,470,392 $179,042,920Affiliated investments, at cost $7,675,653 — $23,107,952 $16,664,786Foreign currency, at cost $1,076,343 — — —Securities loaned, unaffiliated investments, at value $7,509,432 — $22,628,403 $16,322,392
Net asset value per share
The funds have an unlimited number of shares authorized with no par value. Net asset value iscalculated by dividing the net assets of each class of shares by the number of outstandingshares in the class.
Class NAVNet assets $355,338,647 $275,377,439 $238,003,355 $229,342,485Shares outstanding 25,658,371 28,943,706 25,345,645 11,293,698Net asset value, offering price and redemption price per share $13.85 $9.51 $9.39 $20.31
John Hancock Funds IIStatements of assets and liabilities — August 31, 2017
233The accompanying notes are an integral part of the financial statements.
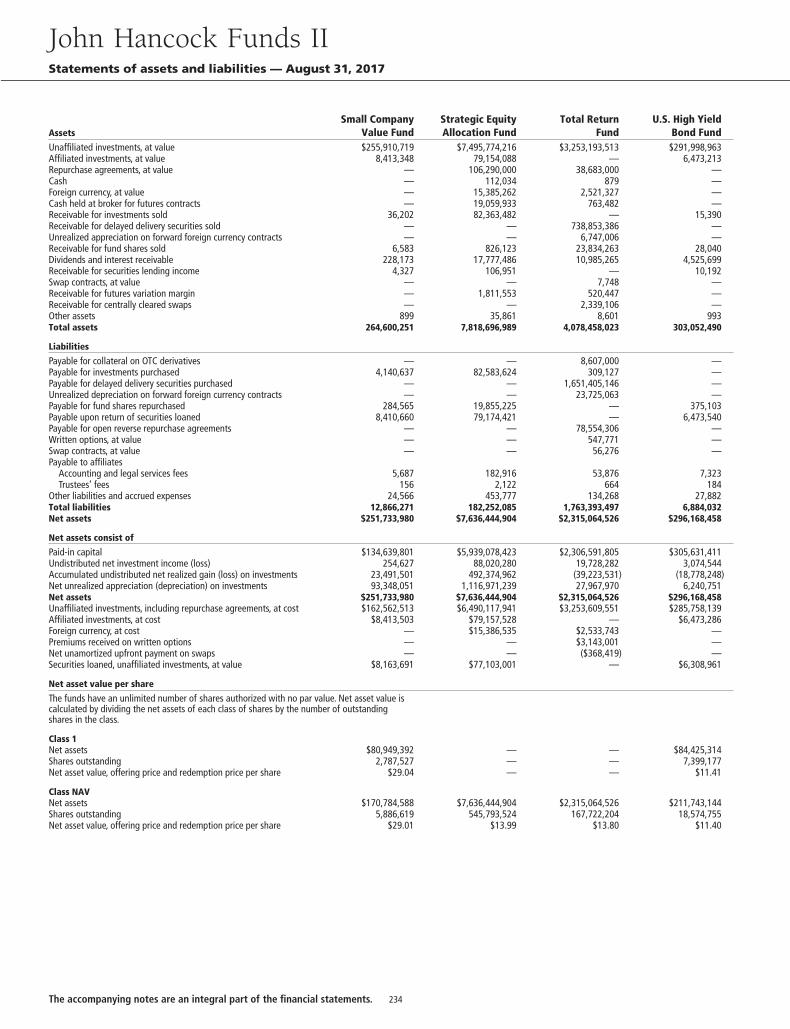
AssetsSmall Company
Value FundStrategic EquityAllocation Fund
Total ReturnFund
U.S. High YieldBond Fund
Unaffiliated investments, at value $255,910,719 $7,495,774,216 $3,253,193,513 $291,998,963Affiliated investments, at value 8,413,348 79,154,088 — 6,473,213Repurchase agreements, at value — 106,290,000 38,683,000 —Cash — 112,034 879 —Foreign currency, at value — 15,385,262 2,521,327 —Cash held at broker for futures contracts — 19,059,933 763,482 —Receivable for investments sold 36,202 82,363,482 — 15,390Receivable for delayed delivery securities sold — — 738,853,386 —Unrealized appreciation on forward foreign currency contracts — — 6,747,006 —Receivable for fund shares sold 6,583 826,123 23,834,263 28,040Dividends and interest receivable 228,173 17,777,486 10,985,265 4,525,699Receivable for securities lending income 4,327 106,951 — 10,192Swap contracts, at value — — 7,748 —Receivable for futures variation margin — 1,811,553 520,447 —Receivable for centrally cleared swaps — — 2,339,106 —Other assets 899 35,861 8,601 993Total assets 264,600,251 7,818,696,989 4,078,458,023 303,052,490
Liabilities
Payable for collateral on OTC derivatives — — 8,607,000 —Payable for investments purchased 4,140,637 82,583,624 309,127 —Payable for delayed delivery securities purchased — — 1,651,405,146 —Unrealized depreciation on forward foreign currency contracts — — 23,725,063 —Payable for fund shares repurchased 284,565 19,855,225 — 375,103Payable upon return of securities loaned 8,410,660 79,174,421 — 6,473,540Payable for open reverse repurchase agreements — — 78,554,306 —Written options, at value — — 547,771 —Swap contracts, at value — — 56,276 —Payable to affiliates
Accounting and legal services fees 5,687 182,916 53,876 7,323Trustees’ fees 156 2,122 664 184
Other liabilities and accrued expenses 24,566 453,777 134,268 27,882Total liabilities 12,866,271 182,252,085 1,763,393,497 6,884,032Net assets $251,733,980 $7,636,444,904 $2,315,064,526 $296,168,458
Net assets consist of
Paid-in capital $134,639,801 $5,939,078,423 $2,306,591,805 $305,631,411Undistributed net investment income (loss) 254,627 88,020,280 19,728,282 3,074,544Accumulated undistributed net realized gain (loss) on investments 23,491,501 492,374,962 (39,223,531) (18,778,248)Net unrealized appreciation (depreciation) on investments 93,348,051 1,116,971,239 27,967,970 6,240,751Net assets $251,733,980 $7,636,444,904 $2,315,064,526 $296,168,458Unaffiliated investments, including repurchase agreements, at cost $162,562,513 $6,490,117,941 $3,253,609,551 $285,758,139Affiliated investments, at cost $8,413,503 $79,157,528 — $6,473,286Foreign currency, at cost — $15,386,535 $2,533,743 —Premiums received on written options — — $3,143,001 —Net unamortized upfront payment on swaps — — ($368,419) —Securities loaned, unaffiliated investments, at value $8,163,691 $77,103,001 — $6,308,961
Net asset value per share
The funds have an unlimited number of shares authorized with no par value. Net asset value iscalculated by dividing the net assets of each class of shares by the number of outstandingshares in the class.
Class 1Net assets $80,949,392 — — $84,425,314Shares outstanding 2,787,527 — — 7,399,177Net asset value, offering price and redemption price per share $29.04 — — $11.41
Class NAVNet assets $170,784,588 $7,636,444,904 $2,315,064,526 $211,743,144Shares outstanding 5,886,619 545,793,524 167,722,204 18,574,755Net asset value, offering price and redemption price per share $29.01 $13.99 $13.80 $11.40
John Hancock Funds IIStatements of assets and liabilities — August 31, 2017
234The accompanying notes are an integral part of the financial statements.
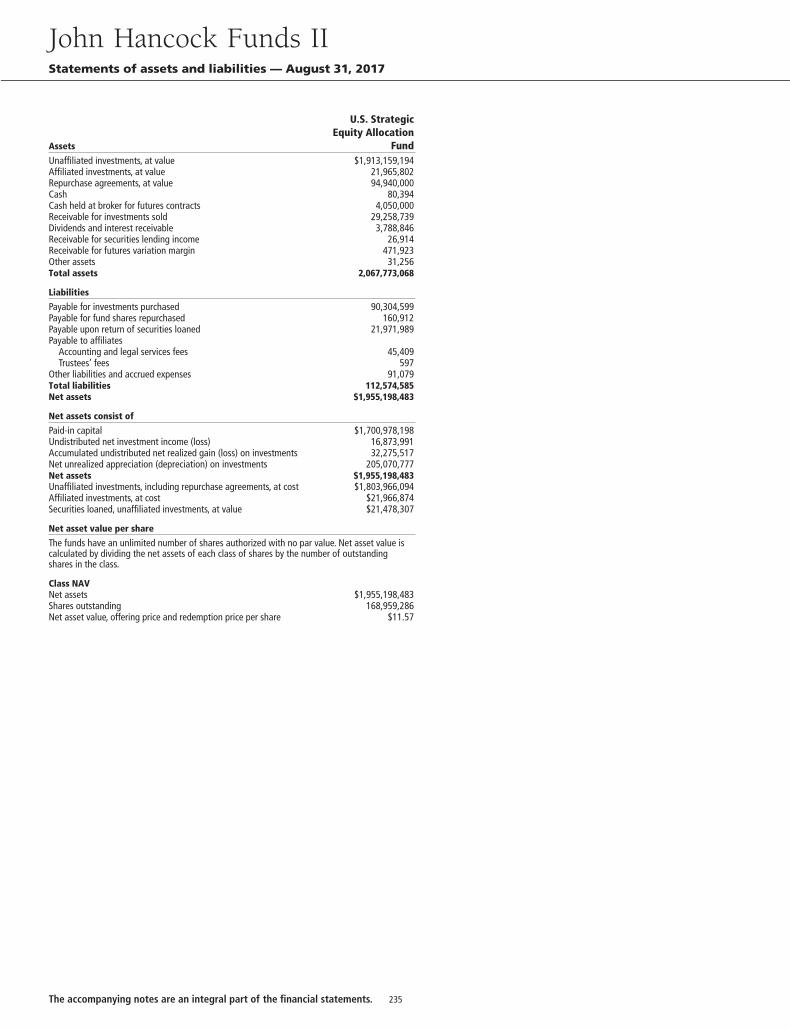
Assets
U.S. StrategicEquity Allocation
FundUnaffiliated investments, at value $1,913,159,194Affiliated investments, at value 21,965,802Repurchase agreements, at value 94,940,000Cash 80,394Cash held at broker for futures contracts 4,050,000Receivable for investments sold 29,258,739Dividends and interest receivable 3,788,846Receivable for securities lending income 26,914Receivable for futures variation margin 471,923Other assets 31,256Total assets 2,067,773,068
Liabilities
Payable for investments purchased 90,304,599Payable for fund shares repurchased 160,912Payable upon return of securities loaned 21,971,989Payable to affiliates
Accounting and legal services fees 45,409Trustees’ fees 597
Other liabilities and accrued expenses 91,079Total liabilities 112,574,585Net assets $1,955,198,483
Net assets consist of
Paid-in capital $1,700,978,198Undistributed net investment income (loss) 16,873,991Accumulated undistributed net realized gain (loss) on investments 32,275,517Net unrealized appreciation (depreciation) on investments 205,070,777Net assets $1,955,198,483Unaffiliated investments, including repurchase agreements, at cost $1,803,966,094Affiliated investments, at cost $21,966,874Securities loaned, unaffiliated investments, at value $21,478,307
Net asset value per share
The funds have an unlimited number of shares authorized with no par value. Net asset value iscalculated by dividing the net assets of each class of shares by the number of outstandingshares in the class.
Class NAVNet assets $1,955,198,483Shares outstanding 168,959,286Net asset value, offering price and redemption price per share $11.57
John Hancock Funds IIStatements of assets and liabilities — August 31, 2017
235The accompanying notes are an integral part of the financial statements.
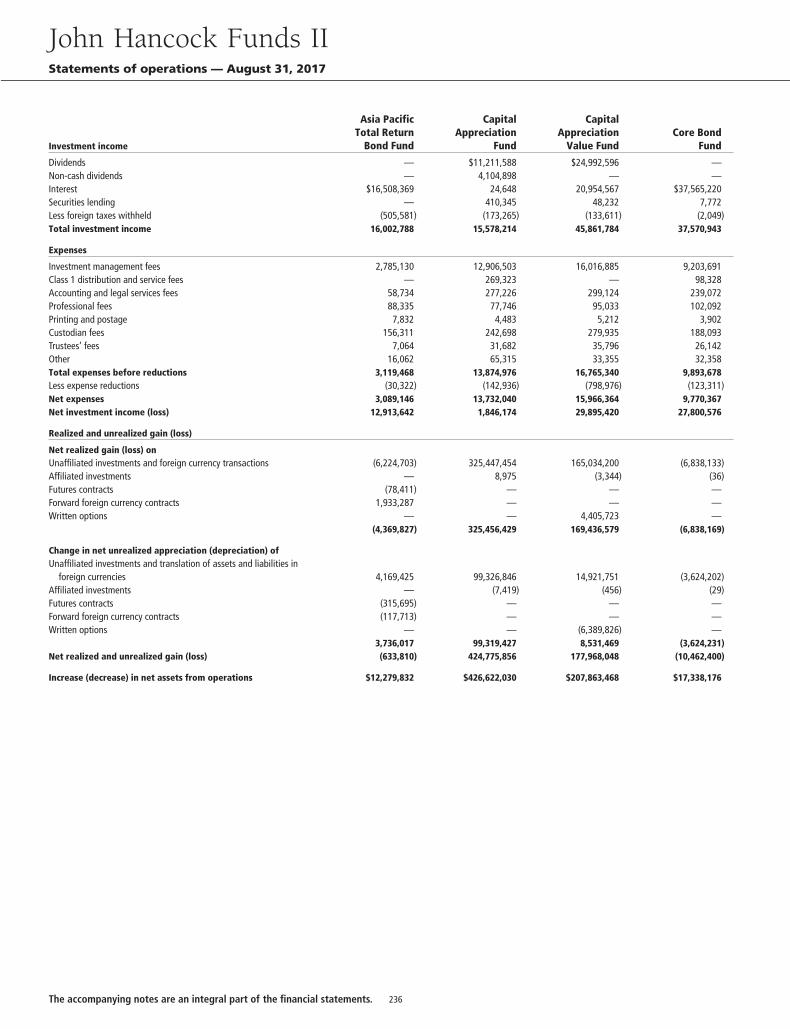
Investment income
Asia PacificTotal Return
Bond Fund
CapitalAppreciation
Fund
CapitalAppreciation
Value FundCore Bond
Fund
Dividends — $11,211,588 $24,992,596 —Non-cash dividends — 4,104,898 — —Interest $16,508,369 24,648 20,954,567 $37,565,220Securities lending — 410,345 48,232 7,772Less foreign taxes withheld (505,581) (173,265) (133,611) (2,049)Total investment income 16,002,788 15,578,214 45,861,784 37,570,943
Expenses
Investment management fees 2,785,130 12,906,503 16,016,885 9,203,691Class 1 distribution and service fees — 269,323 — 98,328Accounting and legal services fees 58,734 277,226 299,124 239,072Professional fees 88,335 77,746 95,033 102,092Printing and postage 7,832 4,483 5,212 3,902Custodian fees 156,311 242,698 279,935 188,093Trustees’ fees 7,064 31,682 35,796 26,142Other 16,062 65,315 33,355 32,358Total expenses before reductions 3,119,468 13,874,976 16,765,340 9,893,678Less expense reductions (30,322) (142,936) (798,976) (123,311)Net expenses 3,089,146 13,732,040 15,966,364 9,770,367Net investment income (loss) 12,913,642 1,846,174 29,895,420 27,800,576
Realized and unrealized gain (loss)
Net realized gain (loss) onUnaffiliated investments and foreign currency transactions (6,224,703) 325,447,454 165,034,200 (6,838,133)Affiliated investments — 8,975 (3,344) (36)Futures contracts (78,411) — — —Forward foreign currency contracts 1,933,287 — — —Written options — — 4,405,723 —
(4,369,827) 325,456,429 169,436,579 (6,838,169)
Change in net unrealized appreciation (depreciation) ofUnaffiliated investments and translation of assets and liabilities in
foreign currencies 4,169,425 99,326,846 14,921,751 (3,624,202)Affiliated investments — (7,419) (456) (29)Futures contracts (315,695) — — —Forward foreign currency contracts (117,713) — — —Written options — — (6,389,826) —
3,736,017 99,319,427 8,531,469 (3,624,231)Net realized and unrealized gain (loss) (633,810) 424,775,856 177,968,048 (10,462,400)
Increase (decrease) in net assets from operations $12,279,832 $426,622,030 $207,863,468 $17,338,176
John Hancock Funds IIStatements of operations — August 31, 2017
236The accompanying notes are an integral part of the financial statements.
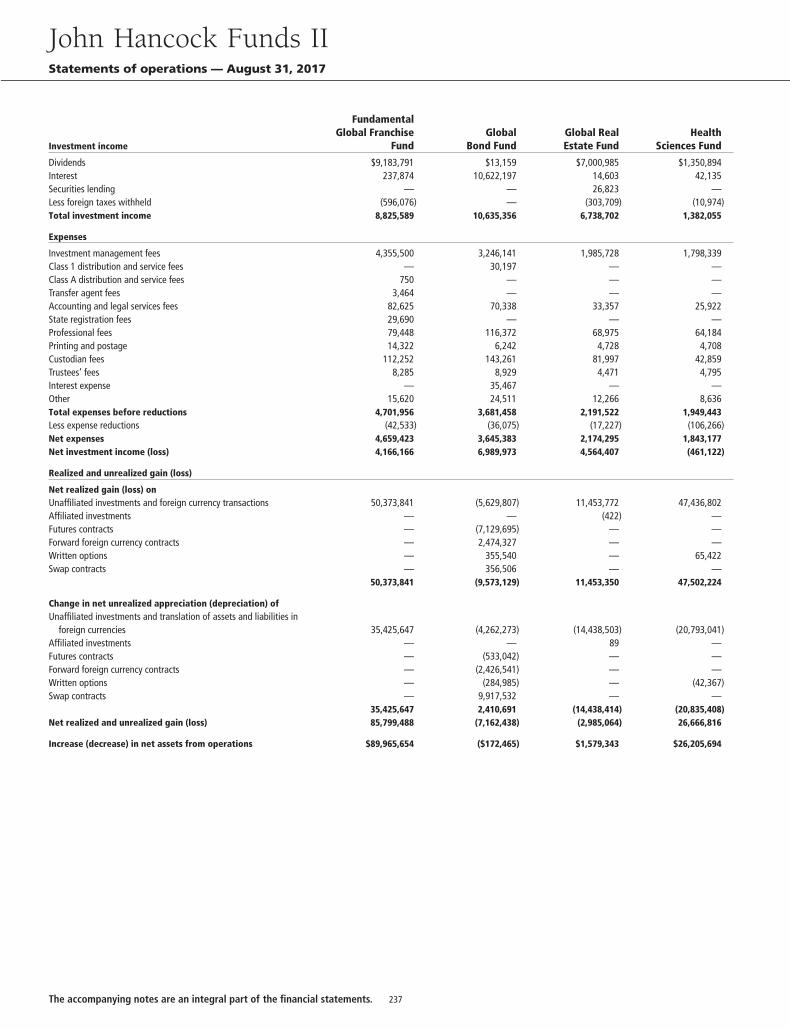
Investment income
FundamentalGlobal Franchise
FundGlobal
Bond FundGlobal RealEstate Fund
HealthSciences Fund
Dividends $9,183,791 $13,159 $7,000,985 $1,350,894Interest 237,874 10,622,197 14,603 42,135Securities lending — — 26,823 —Less foreign taxes withheld (596,076) — (303,709) (10,974)Total investment income 8,825,589 10,635,356 6,738,702 1,382,055
Expenses
Investment management fees 4,355,500 3,246,141 1,985,728 1,798,339Class 1 distribution and service fees — 30,197 — —Class A distribution and service fees 750 — — —Transfer agent fees 3,464 — — —Accounting and legal services fees 82,625 70,338 33,357 25,922State registration fees 29,690 — — —Professional fees 79,448 116,372 68,975 64,184Printing and postage 14,322 6,242 4,728 4,708Custodian fees 112,252 143,261 81,997 42,859Trustees’ fees 8,285 8,929 4,471 4,795Interest expense — 35,467 — —Other 15,620 24,511 12,266 8,636Total expenses before reductions 4,701,956 3,681,458 2,191,522 1,949,443Less expense reductions (42,533) (36,075) (17,227) (106,266)Net expenses 4,659,423 3,645,383 2,174,295 1,843,177Net investment income (loss) 4,166,166 6,989,973 4,564,407 (461,122)
Realized and unrealized gain (loss)
Net realized gain (loss) onUnaffiliated investments and foreign currency transactions 50,373,841 (5,629,807) 11,453,772 47,436,802Affiliated investments — — (422) —Futures contracts — (7,129,695) — —Forward foreign currency contracts — 2,474,327 — —Written options — 355,540 — 65,422Swap contracts — 356,506 — —
50,373,841 (9,573,129) 11,453,350 47,502,224
Change in net unrealized appreciation (depreciation) ofUnaffiliated investments and translation of assets and liabilities in
foreign currencies 35,425,647 (4,262,273) (14,438,503) (20,793,041)Affiliated investments — — 89 —Futures contracts — (533,042) — —Forward foreign currency contracts — (2,426,541) — —Written options — (284,985) — (42,367)Swap contracts — 9,917,532 — —
35,425,647 2,410,691 (14,438,414) (20,835,408)Net realized and unrealized gain (loss) 85,799,488 (7,162,438) (2,985,064) 26,666,816
Increase (decrease) in net assets from operations $89,965,654 ($172,465) $1,579,343 $26,205,694
John Hancock Funds IIStatements of operations — August 31, 2017
237The accompanying notes are an integral part of the financial statements.
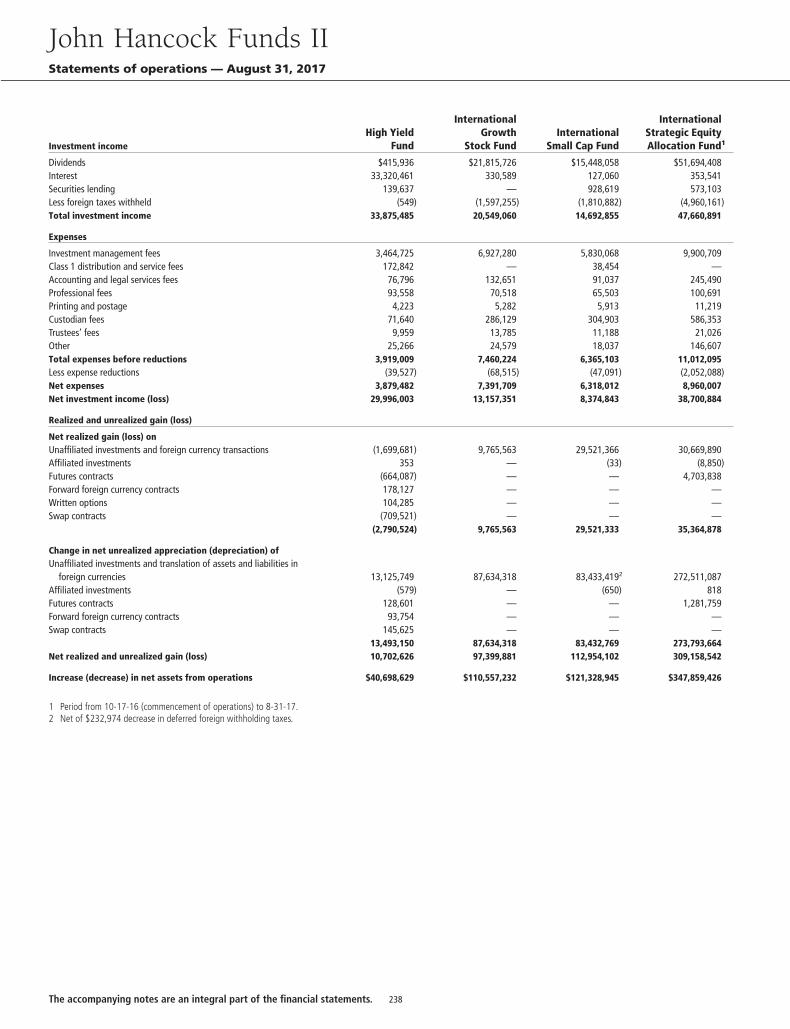
Investment incomeHigh Yield
Fund
InternationalGrowth
Stock FundInternational
Small Cap Fund
InternationalStrategic EquityAllocation Fund1
Dividends $415,936 $21,815,726 $15,448,058 $51,694,408Interest 33,320,461 330,589 127,060 353,541Securities lending 139,637 — 928,619 573,103Less foreign taxes withheld (549) (1,597,255) (1,810,882) (4,960,161)Total investment income 33,875,485 20,549,060 14,692,855 47,660,891
Expenses
Investment management fees 3,464,725 6,927,280 5,830,068 9,900,709Class 1 distribution and service fees 172,842 — 38,454 —Accounting and legal services fees 76,796 132,651 91,037 245,490Professional fees 93,558 70,518 65,503 100,691Printing and postage 4,223 5,282 5,913 11,219Custodian fees 71,640 286,129 304,903 586,353Trustees’ fees 9,959 13,785 11,188 21,026Other 25,266 24,579 18,037 146,607Total expenses before reductions 3,919,009 7,460,224 6,365,103 11,012,095Less expense reductions (39,527) (68,515) (47,091) (2,052,088)Net expenses 3,879,482 7,391,709 6,318,012 8,960,007Net investment income (loss) 29,996,003 13,157,351 8,374,843 38,700,884
Realized and unrealized gain (loss)
Net realized gain (loss) onUnaffiliated investments and foreign currency transactions (1,699,681) 9,765,563 29,521,366 30,669,890Affiliated investments 353 — (33) (8,850)Futures contracts (664,087) — — 4,703,838Forward foreign currency contracts 178,127 — — —Written options 104,285 — — —Swap contracts (709,521) — — —
(2,790,524) 9,765,563 29,521,333 35,364,878
Change in net unrealized appreciation (depreciation) ofUnaffiliated investments and translation of assets and liabilities in
foreign currencies 13,125,749 87,634,318 83,433,4192 272,511,087Affiliated investments (579) — (650) 818Futures contracts 128,601 — — 1,281,759Forward foreign currency contracts 93,754 — — —Swap contracts 145,625 — — —
13,493,150 87,634,318 83,432,769 273,793,664Net realized and unrealized gain (loss) 10,702,626 97,399,881 112,954,102 309,158,542
Increase (decrease) in net assets from operations $40,698,629 $110,557,232 $121,328,945 $347,859,426
1 Period from 10-17-16 (commencement of operations) to 8-31-17.2 Net of $232,974 decrease in deferred foreign withholding taxes.
John Hancock Funds IIStatements of operations — August 31, 2017
238The accompanying notes are an integral part of the financial statements.
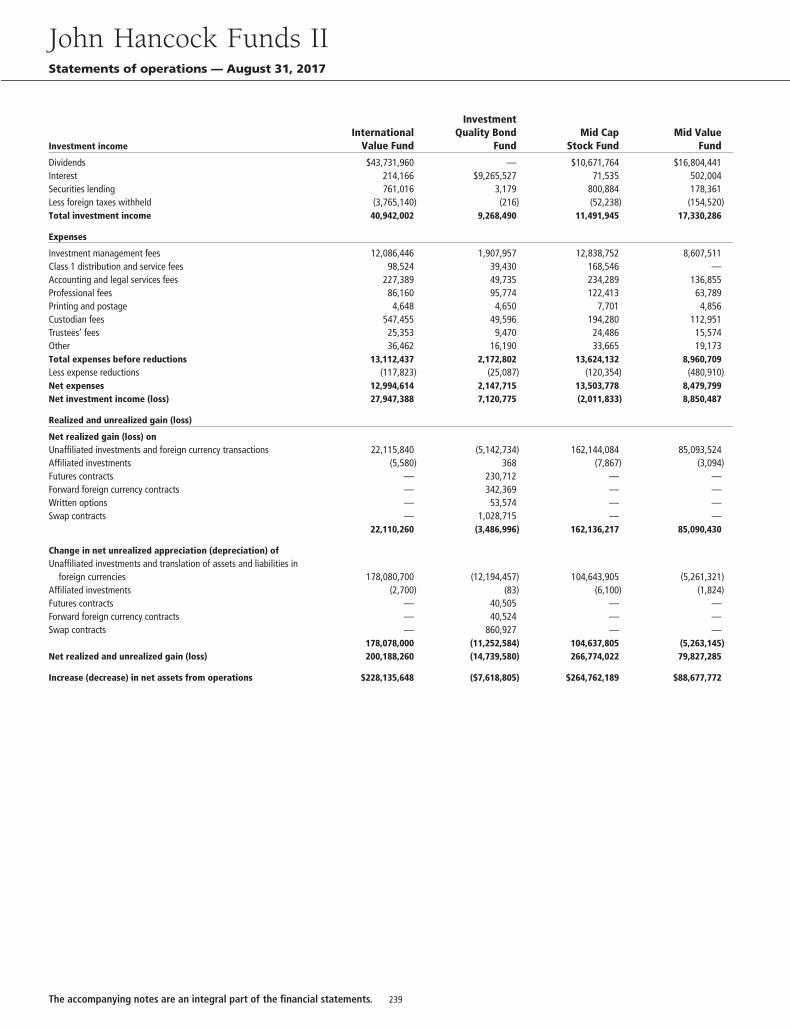
Investment incomeInternational
Value Fund
InvestmentQuality Bond
FundMid Cap
Stock FundMid Value
Fund
Dividends $43,731,960 — $10,671,764 $16,804,441Interest 214,166 $9,265,527 71,535 502,004Securities lending 761,016 3,179 800,884 178,361Less foreign taxes withheld (3,765,140) (216) (52,238) (154,520)Total investment income 40,942,002 9,268,490 11,491,945 17,330,286
Expenses
Investment management fees 12,086,446 1,907,957 12,838,752 8,607,511Class 1 distribution and service fees 98,524 39,430 168,546 —Accounting and legal services fees 227,389 49,735 234,289 136,855Professional fees 86,160 95,774 122,413 63,789Printing and postage 4,648 4,650 7,701 4,856Custodian fees 547,455 49,596 194,280 112,951Trustees’ fees 25,353 9,470 24,486 15,574Other 36,462 16,190 33,665 19,173Total expenses before reductions 13,112,437 2,172,802 13,624,132 8,960,709Less expense reductions (117,823) (25,087) (120,354) (480,910)Net expenses 12,994,614 2,147,715 13,503,778 8,479,799Net investment income (loss) 27,947,388 7,120,775 (2,011,833) 8,850,487
Realized and unrealized gain (loss)
Net realized gain (loss) onUnaffiliated investments and foreign currency transactions 22,115,840 (5,142,734) 162,144,084 85,093,524Affiliated investments (5,580) 368 (7,867) (3,094)Futures contracts — 230,712 — —Forward foreign currency contracts — 342,369 — —Written options — 53,574 — —Swap contracts — 1,028,715 — —
22,110,260 (3,486,996) 162,136,217 85,090,430
Change in net unrealized appreciation (depreciation) ofUnaffiliated investments and translation of assets and liabilities in
foreign currencies 178,080,700 (12,194,457) 104,643,905 (5,261,321)Affiliated investments (2,700) (83) (6,100) (1,824)Futures contracts — 40,505 — —Forward foreign currency contracts — 40,524 — —Swap contracts — 860,927 — —
178,078,000 (11,252,584) 104,637,805 (5,263,145)Net realized and unrealized gain (loss) 200,188,260 (14,739,580) 266,774,022 79,827,285
Increase (decrease) in net assets from operations $228,135,648 ($7,618,805) $264,762,189 $88,677,772
John Hancock Funds IIStatements of operations — August 31, 2017
239The accompanying notes are an integral part of the financial statements.
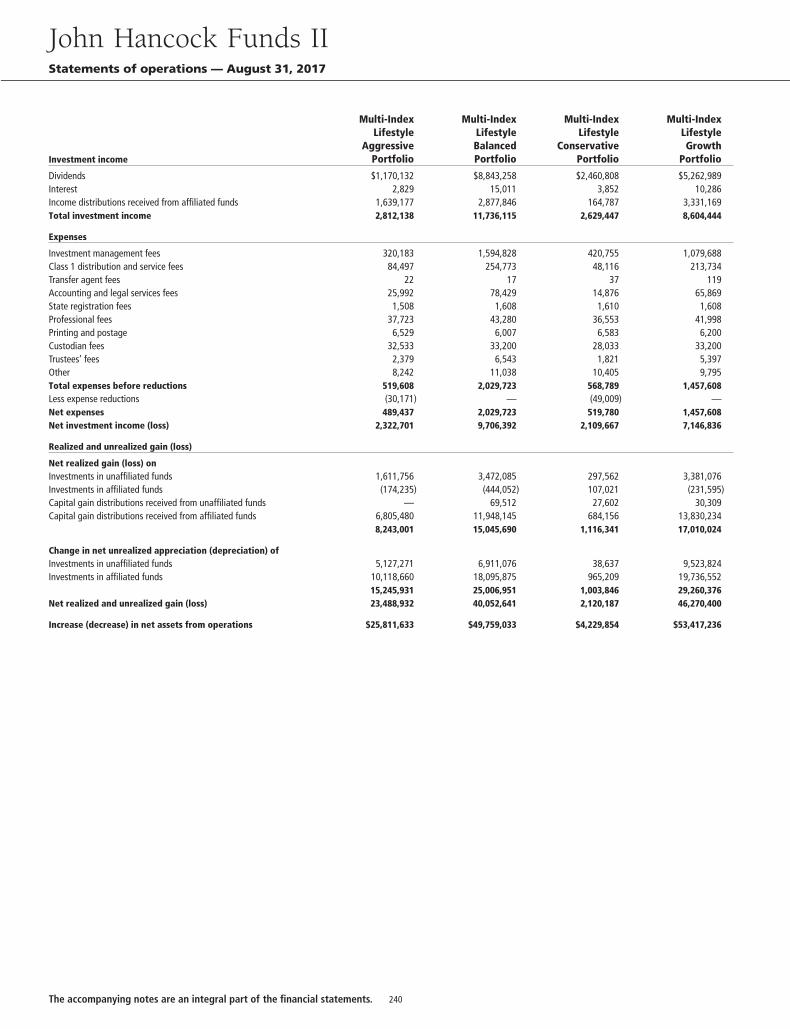
Investment income
Multi-IndexLifestyle
AggressivePortfolio
Multi-IndexLifestyleBalancedPortfolio
Multi-IndexLifestyle
ConservativePortfolio
Multi-IndexLifestyleGrowth
Portfolio
Dividends $1,170,132 $8,843,258 $2,460,808 $5,262,989Interest 2,829 15,011 3,852 10,286Income distributions received from affiliated funds 1,639,177 2,877,846 164,787 3,331,169Total investment income 2,812,138 11,736,115 2,629,447 8,604,444
Expenses
Investment management fees 320,183 1,594,828 420,755 1,079,688Class 1 distribution and service fees 84,497 254,773 48,116 213,734Transfer agent fees 22 17 37 119Accounting and legal services fees 25,992 78,429 14,876 65,869State registration fees 1,508 1,608 1,610 1,608Professional fees 37,723 43,280 36,553 41,998Printing and postage 6,529 6,007 6,583 6,200Custodian fees 32,533 33,200 28,033 33,200Trustees’ fees 2,379 6,543 1,821 5,397Other 8,242 11,038 10,405 9,795Total expenses before reductions 519,608 2,029,723 568,789 1,457,608Less expense reductions (30,171) — (49,009) —Net expenses 489,437 2,029,723 519,780 1,457,608Net investment income (loss) 2,322,701 9,706,392 2,109,667 7,146,836
Realized and unrealized gain (loss)
Net realized gain (loss) onInvestments in unaffiliated funds 1,611,756 3,472,085 297,562 3,381,076Investments in affiliated funds (174,235) (444,052) 107,021 (231,595)Capital gain distributions received from unaffiliated funds — 69,512 27,602 30,309Capital gain distributions received from affiliated funds 6,805,480 11,948,145 684,156 13,830,234
8,243,001 15,045,690 1,116,341 17,010,024
Change in net unrealized appreciation (depreciation) ofInvestments in unaffiliated funds 5,127,271 6,911,076 38,637 9,523,824Investments in affiliated funds 10,118,660 18,095,875 965,209 19,736,552
15,245,931 25,006,951 1,003,846 29,260,376Net realized and unrealized gain (loss) 23,488,932 40,052,641 2,120,187 46,270,400
Increase (decrease) in net assets from operations $25,811,633 $49,759,033 $4,229,854 $53,417,236
John Hancock Funds IIStatements of operations — August 31, 2017
240The accompanying notes are an integral part of the financial statements.
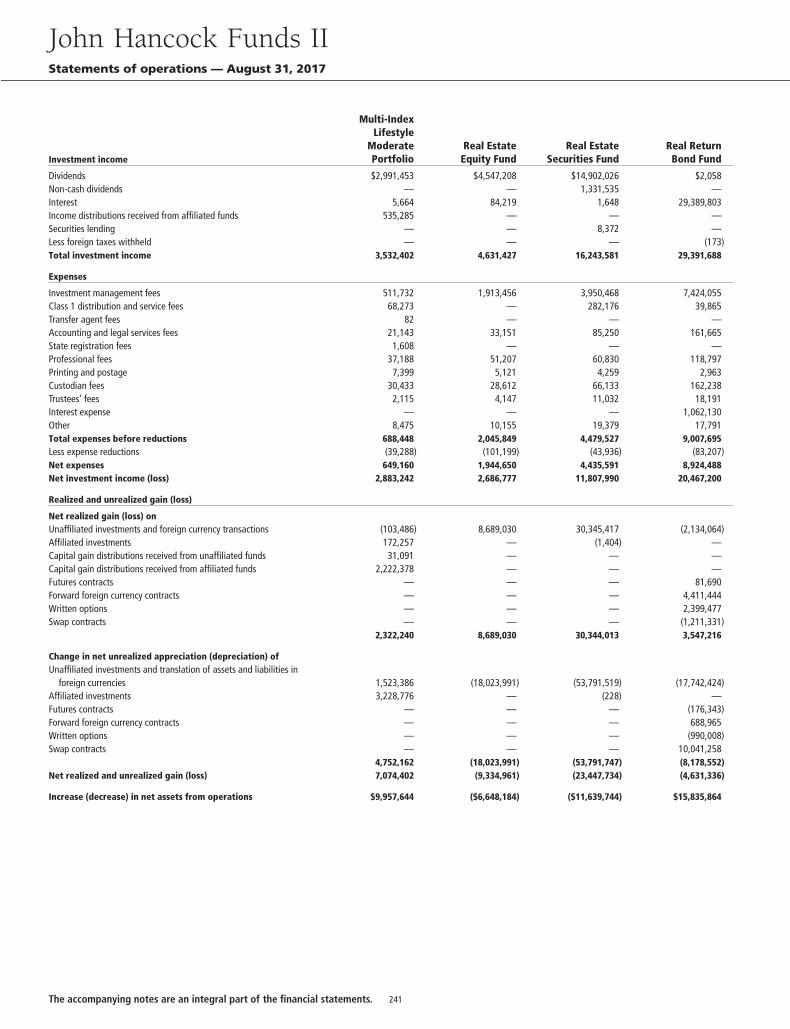
Investment income
Multi-IndexLifestyle
ModeratePortfolio
Real EstateEquity Fund
Real EstateSecurities Fund
Real ReturnBond Fund
Dividends $2,991,453 $4,547,208 $14,902,026 $2,058Non-cash dividends — — 1,331,535 —Interest 5,664 84,219 1,648 29,389,803Income distributions received from affiliated funds 535,285 — — —Securities lending — — 8,372 —Less foreign taxes withheld — — — (173)Total investment income 3,532,402 4,631,427 16,243,581 29,391,688
Expenses
Investment management fees 511,732 1,913,456 3,950,468 7,424,055Class 1 distribution and service fees 68,273 — 282,176 39,865Transfer agent fees 82 — — —Accounting and legal services fees 21,143 33,151 85,250 161,665State registration fees 1,608 — — —Professional fees 37,188 51,207 60,830 118,797Printing and postage 7,399 5,121 4,259 2,963Custodian fees 30,433 28,612 66,133 162,238Trustees’ fees 2,115 4,147 11,032 18,191Interest expense — — — 1,062,130Other 8,475 10,155 19,379 17,791Total expenses before reductions 688,448 2,045,849 4,479,527 9,007,695Less expense reductions (39,288) (101,199) (43,936) (83,207)Net expenses 649,160 1,944,650 4,435,591 8,924,488Net investment income (loss) 2,883,242 2,686,777 11,807,990 20,467,200
Realized and unrealized gain (loss)
Net realized gain (loss) onUnaffiliated investments and foreign currency transactions (103,486) 8,689,030 30,345,417 (2,134,064)Affiliated investments 172,257 — (1,404) —Capital gain distributions received from unaffiliated funds 31,091 — — —Capital gain distributions received from affiliated funds 2,222,378 — — —Futures contracts — — — 81,690Forward foreign currency contracts — — — 4,411,444Written options — — — 2,399,477Swap contracts — — — (1,211,331)
2,322,240 8,689,030 30,344,013 3,547,216
Change in net unrealized appreciation (depreciation) ofUnaffiliated investments and translation of assets and liabilities in
foreign currencies 1,523,386 (18,023,991) (53,791,519) (17,742,424)Affiliated investments 3,228,776 — (228) —Futures contracts — — — (176,343)Forward foreign currency contracts — — — 688,965Written options — — — (990,008)Swap contracts — — — 10,041,258
4,752,162 (18,023,991) (53,791,747) (8,178,552)Net realized and unrealized gain (loss) 7,074,402 (9,334,961) (23,447,734) (4,631,336)
Increase (decrease) in net assets from operations $9,957,644 ($6,648,184) ($11,639,744) $15,835,864
John Hancock Funds IIStatements of operations — August 31, 2017
241The accompanying notes are an integral part of the financial statements.
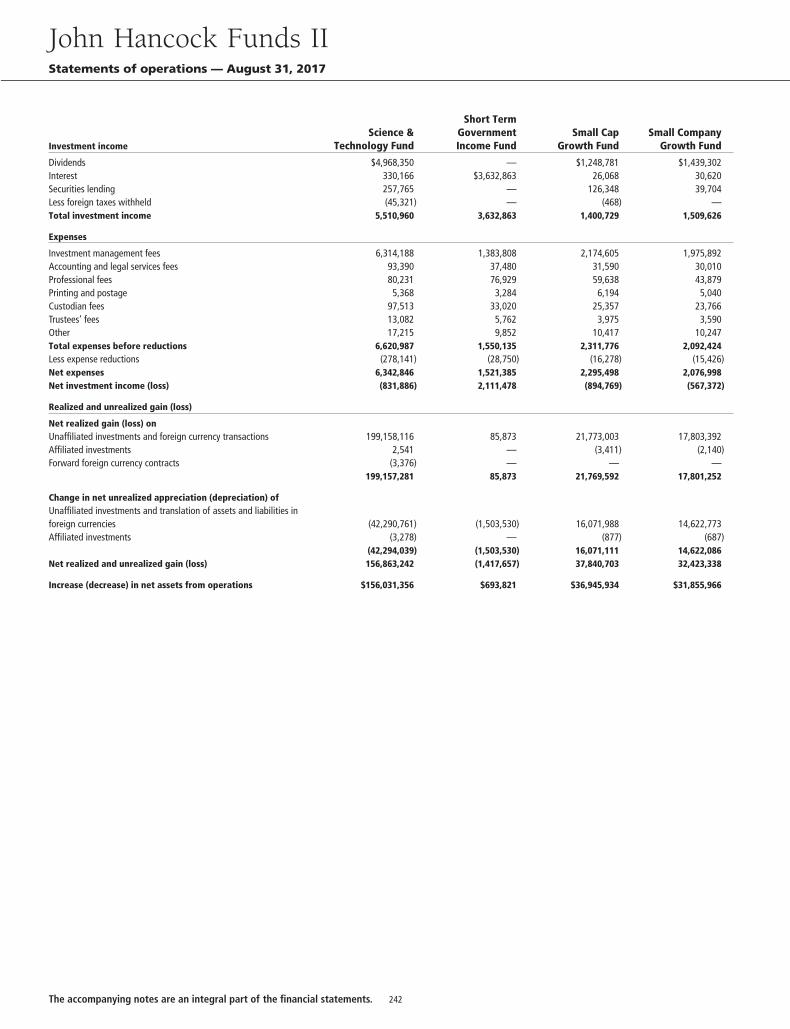
Investment incomeScience &
Technology Fund
Short TermGovernmentIncome Fund
Small CapGrowth Fund
Small CompanyGrowth Fund
Dividends $4,968,350 — $1,248,781 $1,439,302Interest 330,166 $3,632,863 26,068 30,620Securities lending 257,765 — 126,348 39,704Less foreign taxes withheld (45,321) — (468) —Total investment income 5,510,960 3,632,863 1,400,729 1,509,626
Expenses
Investment management fees 6,314,188 1,383,808 2,174,605 1,975,892Accounting and legal services fees 93,390 37,480 31,590 30,010Professional fees 80,231 76,929 59,638 43,879Printing and postage 5,368 3,284 6,194 5,040Custodian fees 97,513 33,020 25,357 23,766Trustees’ fees 13,082 5,762 3,975 3,590Other 17,215 9,852 10,417 10,247Total expenses before reductions 6,620,987 1,550,135 2,311,776 2,092,424Less expense reductions (278,141) (28,750) (16,278) (15,426)Net expenses 6,342,846 1,521,385 2,295,498 2,076,998Net investment income (loss) (831,886) 2,111,478 (894,769) (567,372)
Realized and unrealized gain (loss)
Net realized gain (loss) onUnaffiliated investments and foreign currency transactions 199,158,116 85,873 21,773,003 17,803,392Affiliated investments 2,541 — (3,411) (2,140)Forward foreign currency contracts (3,376) — — —
199,157,281 85,873 21,769,592 17,801,252
Change in net unrealized appreciation (depreciation) ofUnaffiliated investments and translation of assets and liabilities inforeign currencies (42,290,761) (1,503,530) 16,071,988 14,622,773Affiliated investments (3,278) — (877) (687)
(42,294,039) (1,503,530) 16,071,111 14,622,086Net realized and unrealized gain (loss) 156,863,242 (1,417,657) 37,840,703 32,423,338
Increase (decrease) in net assets from operations $156,031,356 $693,821 $36,945,934 $31,855,966
John Hancock Funds IIStatements of operations — August 31, 2017
242The accompanying notes are an integral part of the financial statements.
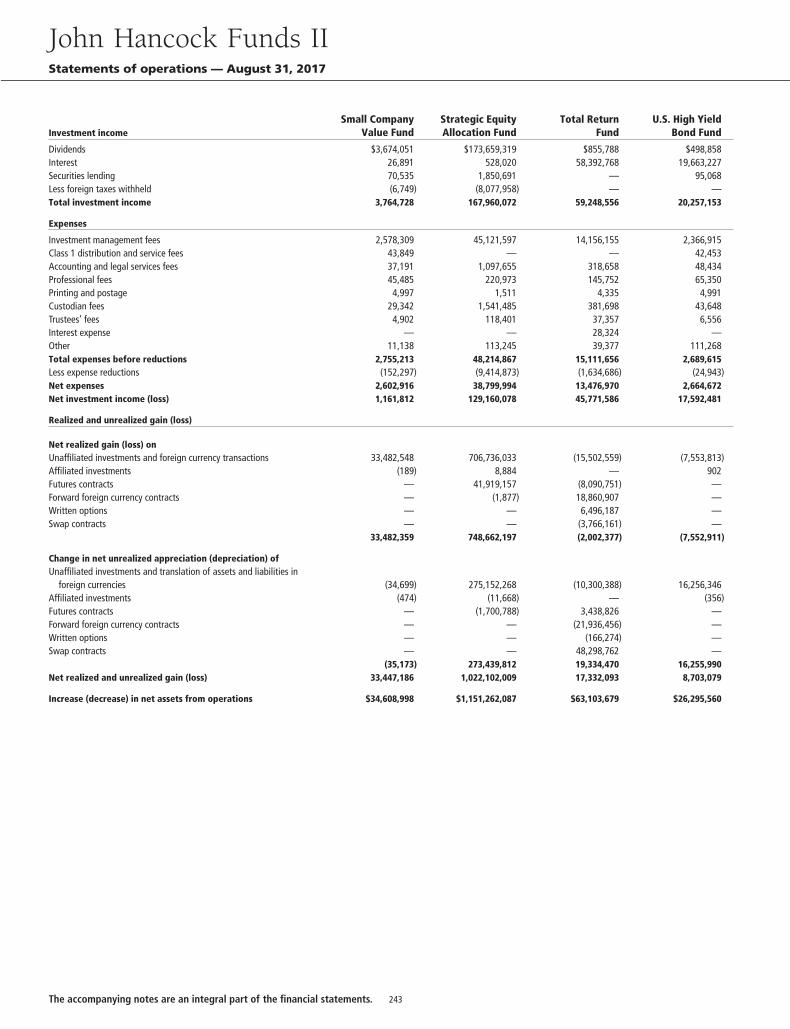
Investment incomeSmall Company
Value FundStrategic EquityAllocation Fund
Total ReturnFund
U.S. High YieldBond Fund
Dividends $3,674,051 $173,659,319 $855,788 $498,858Interest 26,891 528,020 58,392,768 19,663,227Securities lending 70,535 1,850,691 — 95,068Less foreign taxes withheld (6,749) (8,077,958) — —Total investment income 3,764,728 167,960,072 59,248,556 20,257,153
Expenses
Investment management fees 2,578,309 45,121,597 14,156,155 2,366,915Class 1 distribution and service fees 43,849 — — 42,453Accounting and legal services fees 37,191 1,097,655 318,658 48,434Professional fees 45,485 220,973 145,752 65,350Printing and postage 4,997 1,511 4,335 4,991Custodian fees 29,342 1,541,485 381,698 43,648Trustees’ fees 4,902 118,401 37,357 6,556Interest expense — — 28,324 —Other 11,138 113,245 39,377 111,268Total expenses before reductions 2,755,213 48,214,867 15,111,656 2,689,615Less expense reductions (152,297) (9,414,873) (1,634,686) (24,943)Net expenses 2,602,916 38,799,994 13,476,970 2,664,672Net investment income (loss) 1,161,812 129,160,078 45,771,586 17,592,481
Realized and unrealized gain (loss)
Net realized gain (loss) onUnaffiliated investments and foreign currency transactions 33,482,548 706,736,033 (15,502,559) (7,553,813)Affiliated investments (189) 8,884 — 902Futures contracts — 41,919,157 (8,090,751) —Forward foreign currency contracts — (1,877) 18,860,907 —Written options — — 6,496,187 —Swap contracts — — (3,766,161) —
33,482,359 748,662,197 (2,002,377) (7,552,911)
Change in net unrealized appreciation (depreciation) ofUnaffiliated investments and translation of assets and liabilities in
foreign currencies (34,699) 275,152,268 (10,300,388) 16,256,346Affiliated investments (474) (11,668) — (356)Futures contracts — (1,700,788) 3,438,826 —Forward foreign currency contracts — — (21,936,456) —Written options — — (166,274) —Swap contracts — — 48,298,762 —
(35,173) 273,439,812 19,334,470 16,255,990Net realized and unrealized gain (loss) 33,447,186 1,022,102,009 17,332,093 8,703,079
Increase (decrease) in net assets from operations $34,608,998 $1,151,262,087 $63,103,679 $26,295,560
John Hancock Funds IIStatements of operations — August 31, 2017
243The accompanying notes are an integral part of the financial statements.
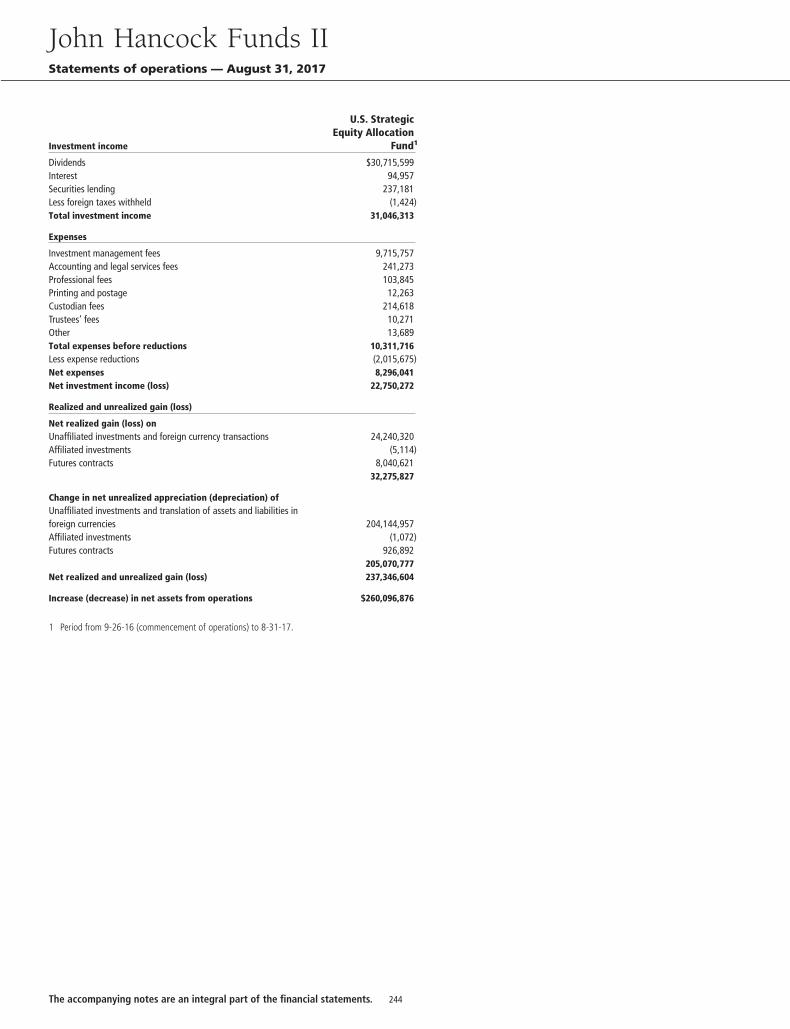
Investment income
U.S. StrategicEquity Allocation
Fund1
Dividends $30,715,599Interest 94,957Securities lending 237,181Less foreign taxes withheld (1,424)Total investment income 31,046,313
Expenses
Investment management fees 9,715,757Accounting and legal services fees 241,273Professional fees 103,845Printing and postage 12,263Custodian fees 214,618Trustees’ fees 10,271Other 13,689Total expenses before reductions 10,311,716Less expense reductions (2,015,675)Net expenses 8,296,041Net investment income (loss) 22,750,272
Realized and unrealized gain (loss)
Net realized gain (loss) onUnaffiliated investments and foreign currency transactions 24,240,320Affiliated investments (5,114)Futures contracts 8,040,621
32,275,827
Change in net unrealized appreciation (depreciation) ofUnaffiliated investments and translation of assets and liabilities inforeign currencies 204,144,957Affiliated investments (1,072)Futures contracts 926,892
205,070,777Net realized and unrealized gain (loss) 237,346,604
Increase (decrease) in net assets from operations $260,096,876
1 Period from 9-26-16 (commencement of operations) to 8-31-17.
John Hancock Funds IIStatements of operations — August 31, 2017
244The accompanying notes are an integral part of the financial statements.
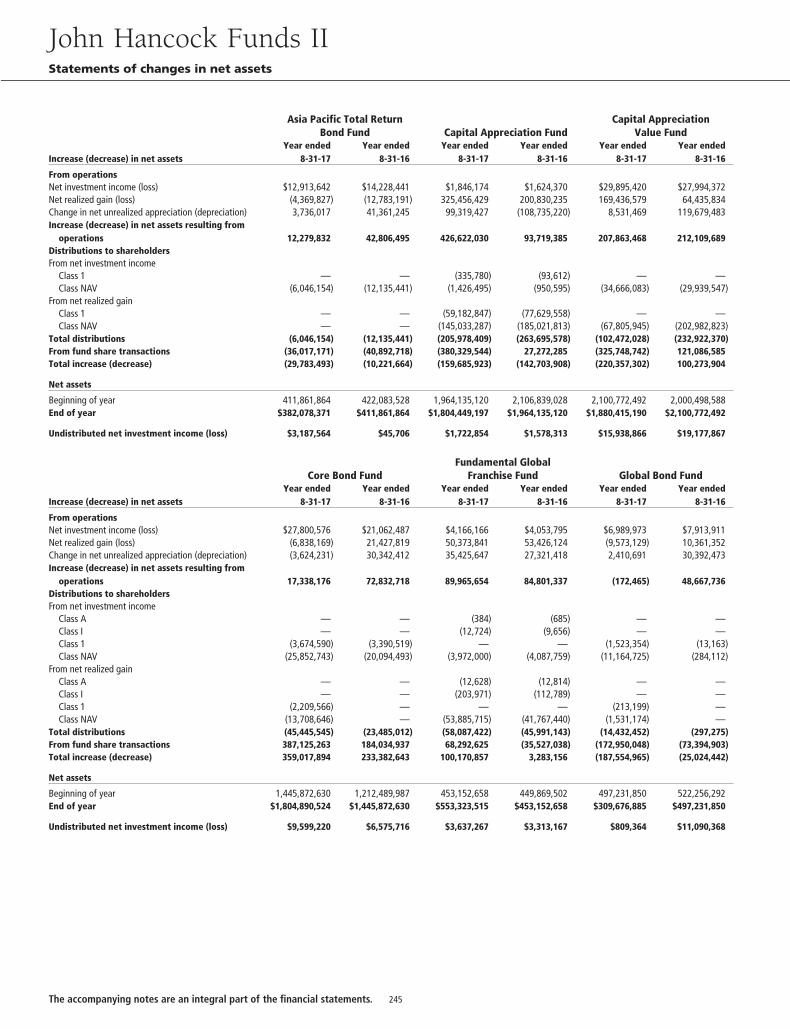
Asia Pacific Total ReturnBond Fund Capital Appreciation Fund
Capital AppreciationValue Fund
Increase (decrease) in net assetsYear ended
8-31-17Year ended
8-31-16Year ended
8-31-17Year ended
8-31-16Year ended
8-31-17Year ended
8-31-16
From operationsNet investment income (loss) $12,913,642 $14,228,441 $1,846,174 $1,624,370 $29,895,420 $27,994,372Net realized gain (loss) (4,369,827) (12,783,191) 325,456,429 200,830,235 169,436,579 64,435,834Change in net unrealized appreciation (depreciation) 3,736,017 41,361,245 99,319,427 (108,735,220) 8,531,469 119,679,483Increase (decrease) in net assets resulting from
operations 12,279,832 42,806,495 426,622,030 93,719,385 207,863,468 212,109,689Distributions to shareholdersFrom net investment income
Class 1 — — (335,780) (93,612) — —Class NAV (6,046,154) (12,135,441) (1,426,495) (950,595) (34,666,083) (29,939,547)
From net realized gainClass 1 — — (59,182,847) (77,629,558) — —Class NAV — — (145,033,287) (185,021,813) (67,805,945) (202,982,823)
Total distributions (6,046,154) (12,135,441) (205,978,409) (263,695,578) (102,472,028) (232,922,370)From fund share transactions (36,017,171) (40,892,718) (380,329,544) 27,272,285 (325,748,742) 121,086,585Total increase (decrease) (29,783,493) (10,221,664) (159,685,923) (142,703,908) (220,357,302) 100,273,904
Net assets
Beginning of year 411,861,864 422,083,528 1,964,135,120 2,106,839,028 2,100,772,492 2,000,498,588End of year $382,078,371 $411,861,864 $1,804,449,197 $1,964,135,120 $1,880,415,190 $2,100,772,492
Undistributed net investment income (loss) $3,187,564 $45,706 $1,722,854 $1,578,313 $15,938,866 $19,177,867
Core Bond FundFundamental Global
Franchise Fund Global Bond Fund
Increase (decrease) in net assetsYear ended
8-31-17Year ended
8-31-16Year ended
8-31-17Year ended
8-31-16Year ended
8-31-17Year ended
8-31-16
From operationsNet investment income (loss) $27,800,576 $21,062,487 $4,166,166 $4,053,795 $6,989,973 $7,913,911Net realized gain (loss) (6,838,169) 21,427,819 50,373,841 53,426,124 (9,573,129) 10,361,352Change in net unrealized appreciation (depreciation) (3,624,231) 30,342,412 35,425,647 27,321,418 2,410,691 30,392,473Increase (decrease) in net assets resulting from
operations 17,338,176 72,832,718 89,965,654 84,801,337 (172,465) 48,667,736Distributions to shareholdersFrom net investment income
Class A — — (384) (685) — —Class I — — (12,724) (9,656) — —Class 1 (3,674,590) (3,390,519) — — (1,523,354) (13,163)Class NAV (25,852,743) (20,094,493) (3,972,000) (4,087,759) (11,164,725) (284,112)
From net realized gainClass A — — (12,628) (12,814) — —Class I — — (203,971) (112,789) — —Class 1 (2,209,566) — — — (213,199) —Class NAV (13,708,646) — (53,885,715) (41,767,440) (1,531,174) —
Total distributions (45,445,545) (23,485,012) (58,087,422) (45,991,143) (14,432,452) (297,275)From fund share transactions 387,125,263 184,034,937 68,292,625 (35,527,038) (172,950,048) (73,394,903)Total increase (decrease) 359,017,894 233,382,643 100,170,857 3,283,156 (187,554,965) (25,024,442)
Net assets
Beginning of year 1,445,872,630 1,212,489,987 453,152,658 449,869,502 497,231,850 522,256,292End of year $1,804,890,524 $1,445,872,630 $553,323,515 $453,152,658 $309,676,885 $497,231,850
Undistributed net investment income (loss) $9,599,220 $6,575,716 $3,637,267 $3,313,167 $809,364 $11,090,368
John Hancock Funds IIStatements of changes in net assets
245The accompanying notes are an integral part of the financial statements.
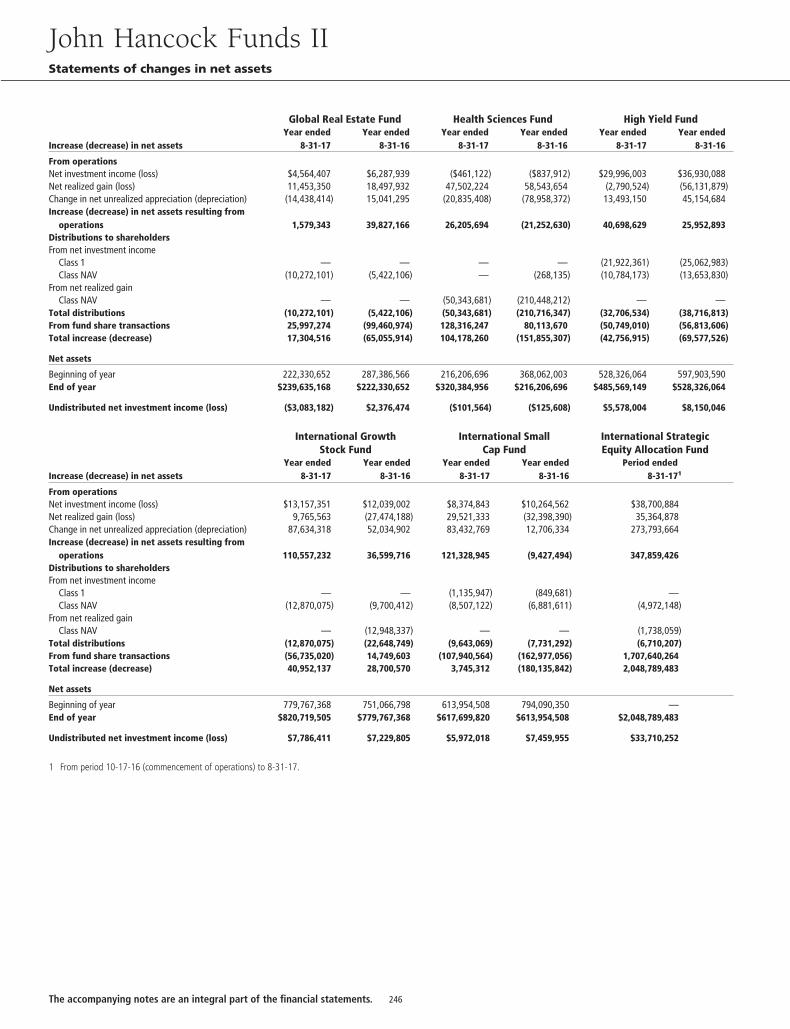
Global Real Estate Fund Health Sciences Fund High Yield Fund
Increase (decrease) in net assetsYear ended
8-31-17Year ended
8-31-16Year ended
8-31-17Year ended
8-31-16Year ended
8-31-17Year ended
8-31-16
From operationsNet investment income (loss) $4,564,407 $6,287,939 ($461,122) ($837,912) $29,996,003 $36,930,088Net realized gain (loss) 11,453,350 18,497,932 47,502,224 58,543,654 (2,790,524) (56,131,879)Change in net unrealized appreciation (depreciation) (14,438,414) 15,041,295 (20,835,408) (78,958,372) 13,493,150 45,154,684Increase (decrease) in net assets resulting from
operations 1,579,343 39,827,166 26,205,694 (21,252,630) 40,698,629 25,952,893Distributions to shareholdersFrom net investment income
Class 1 — — — — (21,922,361) (25,062,983)Class NAV (10,272,101) (5,422,106) — (268,135) (10,784,173) (13,653,830)
From net realized gainClass NAV — — (50,343,681) (210,448,212) — —
Total distributions (10,272,101) (5,422,106) (50,343,681) (210,716,347) (32,706,534) (38,716,813)From fund share transactions 25,997,274 (99,460,974) 128,316,247 80,113,670 (50,749,010) (56,813,606)Total increase (decrease) 17,304,516 (65,055,914) 104,178,260 (151,855,307) (42,756,915) (69,577,526)
Net assets
Beginning of year 222,330,652 287,386,566 216,206,696 368,062,003 528,326,064 597,903,590End of year $239,635,168 $222,330,652 $320,384,956 $216,206,696 $485,569,149 $528,326,064
Undistributed net investment income (loss) ($3,083,182) $2,376,474 ($101,564) ($125,608) $5,578,004 $8,150,046
International GrowthStock Fund
International SmallCap Fund
International StrategicEquity Allocation Fund
Increase (decrease) in net assetsYear ended
8-31-17Year ended
8-31-16Year ended
8-31-17Year ended
8-31-16Period ended
8-31-171
From operationsNet investment income (loss) $13,157,351 $12,039,002 $8,374,843 $10,264,562 $38,700,884Net realized gain (loss) 9,765,563 (27,474,188) 29,521,333 (32,398,390) 35,364,878Change in net unrealized appreciation (depreciation) 87,634,318 52,034,902 83,432,769 12,706,334 273,793,664Increase (decrease) in net assets resulting from
operations 110,557,232 36,599,716 121,328,945 (9,427,494) 347,859,426Distributions to shareholdersFrom net investment income
Class 1 — — (1,135,947) (849,681) —Class NAV (12,870,075) (9,700,412) (8,507,122) (6,881,611) (4,972,148)
From net realized gainClass NAV — (12,948,337) — — (1,738,059)
Total distributions (12,870,075) (22,648,749) (9,643,069) (7,731,292) (6,710,207)From fund share transactions (56,735,020) 14,749,603 (107,940,564) (162,977,056) 1,707,640,264Total increase (decrease) 40,952,137 28,700,570 3,745,312 (180,135,842) 2,048,789,483
Net assets
Beginning of year 779,767,368 751,066,798 613,954,508 794,090,350 —End of year $820,719,505 $779,767,368 $617,699,820 $613,954,508 $2,048,789,483
Undistributed net investment income (loss) $7,786,411 $7,229,805 $5,972,018 $7,459,955 $33,710,252
1 From period 10-17-16 (commencement of operations) to 8-31-17.
John Hancock Funds IIStatements of changes in net assets
246The accompanying notes are an integral part of the financial statements.
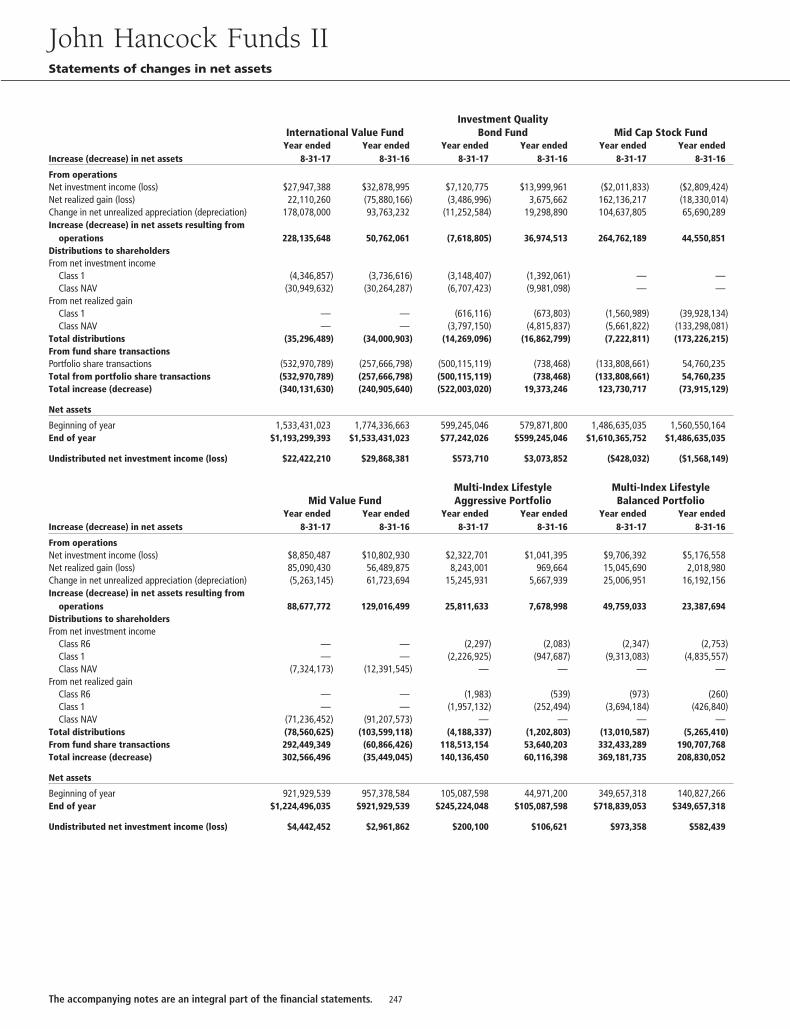
International Value FundInvestment Quality
Bond Fund Mid Cap Stock Fund
Increase (decrease) in net assetsYear ended
8-31-17Year ended
8-31-16Year ended
8-31-17Year ended
8-31-16Year ended
8-31-17Year ended
8-31-16
From operationsNet investment income (loss) $27,947,388 $32,878,995 $7,120,775 $13,999,961 ($2,011,833) ($2,809,424)Net realized gain (loss) 22,110,260 (75,880,166) (3,486,996) 3,675,662 162,136,217 (18,330,014)Change in net unrealized appreciation (depreciation) 178,078,000 93,763,232 (11,252,584) 19,298,890 104,637,805 65,690,289Increase (decrease) in net assets resulting from
operations 228,135,648 50,762,061 (7,618,805) 36,974,513 264,762,189 44,550,851Distributions to shareholdersFrom net investment income
Class 1 (4,346,857) (3,736,616) (3,148,407) (1,392,061) — —Class NAV (30,949,632) (30,264,287) (6,707,423) (9,981,098) — —
From net realized gainClass 1 — — (616,116) (673,803) (1,560,989) (39,928,134)Class NAV — — (3,797,150) (4,815,837) (5,661,822) (133,298,081)
Total distributions (35,296,489) (34,000,903) (14,269,096) (16,862,799) (7,222,811) (173,226,215)From fund share transactionsPortfolio share transactions (532,970,789) (257,666,798) (500,115,119) (738,468) (133,808,661) 54,760,235Total from portfolio share transactions (532,970,789) (257,666,798) (500,115,119) (738,468) (133,808,661) 54,760,235Total increase (decrease) (340,131,630) (240,905,640) (522,003,020) 19,373,246 123,730,717 (73,915,129)
Net assets
Beginning of year 1,533,431,023 1,774,336,663 599,245,046 579,871,800 1,486,635,035 1,560,550,164End of year $1,193,299,393 $1,533,431,023 $77,242,026 $599,245,046 $1,610,365,752 $1,486,635,035
Undistributed net investment income (loss) $22,422,210 $29,868,381 $573,710 $3,073,852 ($428,032) ($1,568,149)
Mid Value FundMulti-Index LifestyleAggressive Portfolio
Multi-Index LifestyleBalanced Portfolio
Increase (decrease) in net assetsYear ended
8-31-17Year ended
8-31-16Year ended
8-31-17Year ended
8-31-16Year ended
8-31-17Year ended
8-31-16
From operationsNet investment income (loss) $8,850,487 $10,802,930 $2,322,701 $1,041,395 $9,706,392 $5,176,558Net realized gain (loss) 85,090,430 56,489,875 8,243,001 969,664 15,045,690 2,018,980Change in net unrealized appreciation (depreciation) (5,263,145) 61,723,694 15,245,931 5,667,939 25,006,951 16,192,156Increase (decrease) in net assets resulting from
operations 88,677,772 129,016,499 25,811,633 7,678,998 49,759,033 23,387,694Distributions to shareholdersFrom net investment income
Class R6 — — (2,297) (2,083) (2,347) (2,753)Class 1 — — (2,226,925) (947,687) (9,313,083) (4,835,557)Class NAV (7,324,173) (12,391,545) — — — —
From net realized gainClass R6 — — (1,983) (539) (973) (260)Class 1 — — (1,957,132) (252,494) (3,694,184) (426,840)Class NAV (71,236,452) (91,207,573) — — — —
Total distributions (78,560,625) (103,599,118) (4,188,337) (1,202,803) (13,010,587) (5,265,410)From fund share transactions 292,449,349 (60,866,426) 118,513,154 53,640,203 332,433,289 190,707,768Total increase (decrease) 302,566,496 (35,449,045) 140,136,450 60,116,398 369,181,735 208,830,052
Net assets
Beginning of year 921,929,539 957,378,584 105,087,598 44,971,200 349,657,318 140,827,266End of year $1,224,496,035 $921,929,539 $245,224,048 $105,087,598 $718,839,053 $349,657,318
Undistributed net investment income (loss) $4,442,452 $2,961,862 $200,100 $106,621 $973,358 $582,439
John Hancock Funds IIStatements of changes in net assets
247The accompanying notes are an integral part of the financial statements.
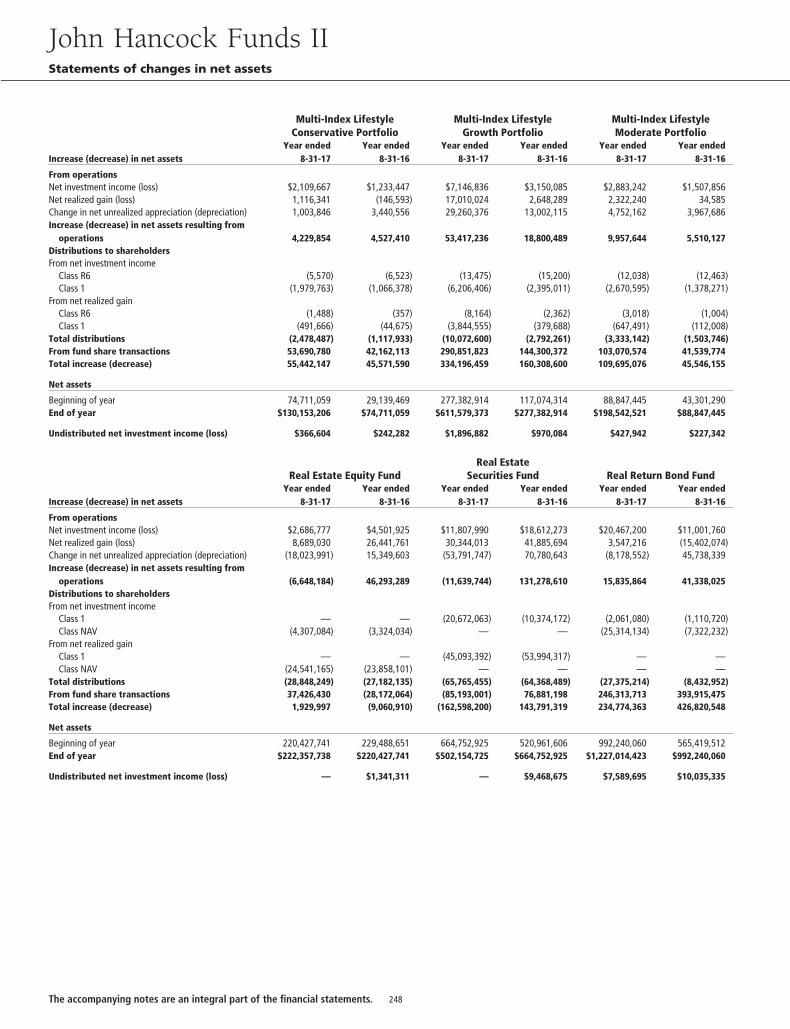
Multi-Index LifestyleConservative Portfolio
Multi-Index LifestyleGrowth Portfolio
Multi-Index LifestyleModerate Portfolio
Increase (decrease) in net assetsYear ended
8-31-17Year ended
8-31-16Year ended
8-31-17Year ended
8-31-16Year ended
8-31-17Year ended
8-31-16
From operationsNet investment income (loss) $2,109,667 $1,233,447 $7,146,836 $3,150,085 $2,883,242 $1,507,856Net realized gain (loss) 1,116,341 (146,593) 17,010,024 2,648,289 2,322,240 34,585Change in net unrealized appreciation (depreciation) 1,003,846 3,440,556 29,260,376 13,002,115 4,752,162 3,967,686Increase (decrease) in net assets resulting from
operations 4,229,854 4,527,410 53,417,236 18,800,489 9,957,644 5,510,127Distributions to shareholdersFrom net investment income
Class R6 (5,570) (6,523) (13,475) (15,200) (12,038) (12,463)Class 1 (1,979,763) (1,066,378) (6,206,406) (2,395,011) (2,670,595) (1,378,271)
From net realized gainClass R6 (1,488) (357) (8,164) (2,362) (3,018) (1,004)Class 1 (491,666) (44,675) (3,844,555) (379,688) (647,491) (112,008)
Total distributions (2,478,487) (1,117,933) (10,072,600) (2,792,261) (3,333,142) (1,503,746)From fund share transactions 53,690,780 42,162,113 290,851,823 144,300,372 103,070,574 41,539,774Total increase (decrease) 55,442,147 45,571,590 334,196,459 160,308,600 109,695,076 45,546,155
Net assets
Beginning of year 74,711,059 29,139,469 277,382,914 117,074,314 88,847,445 43,301,290End of year $130,153,206 $74,711,059 $611,579,373 $277,382,914 $198,542,521 $88,847,445
Undistributed net investment income (loss) $366,604 $242,282 $1,896,882 $970,084 $427,942 $227,342
Real Estate Equity FundReal Estate
Securities Fund Real Return Bond Fund
Increase (decrease) in net assetsYear ended
8-31-17Year ended
8-31-16Year ended
8-31-17Year ended
8-31-16Year ended
8-31-17Year ended
8-31-16
From operationsNet investment income (loss) $2,686,777 $4,501,925 $11,807,990 $18,612,273 $20,467,200 $11,001,760Net realized gain (loss) 8,689,030 26,441,761 30,344,013 41,885,694 3,547,216 (15,402,074)Change in net unrealized appreciation (depreciation) (18,023,991) 15,349,603 (53,791,747) 70,780,643 (8,178,552) 45,738,339Increase (decrease) in net assets resulting from
operations (6,648,184) 46,293,289 (11,639,744) 131,278,610 15,835,864 41,338,025Distributions to shareholdersFrom net investment income
Class 1 — — (20,672,063) (10,374,172) (2,061,080) (1,110,720)Class NAV (4,307,084) (3,324,034) — — (25,314,134) (7,322,232)
From net realized gainClass 1 — — (45,093,392) (53,994,317) — —Class NAV (24,541,165) (23,858,101) — — — —
Total distributions (28,848,249) (27,182,135) (65,765,455) (64,368,489) (27,375,214) (8,432,952)From fund share transactions 37,426,430 (28,172,064) (85,193,001) 76,881,198 246,313,713 393,915,475Total increase (decrease) 1,929,997 (9,060,910) (162,598,200) 143,791,319 234,774,363 426,820,548
Net assets
Beginning of year 220,427,741 229,488,651 664,752,925 520,961,606 992,240,060 565,419,512End of year $222,357,738 $220,427,741 $502,154,725 $664,752,925 $1,227,014,423 $992,240,060
Undistributed net investment income (loss) — $1,341,311 — $9,468,675 $7,589,695 $10,035,335
John Hancock Funds IIStatements of changes in net assets
248The accompanying notes are an integral part of the financial statements.
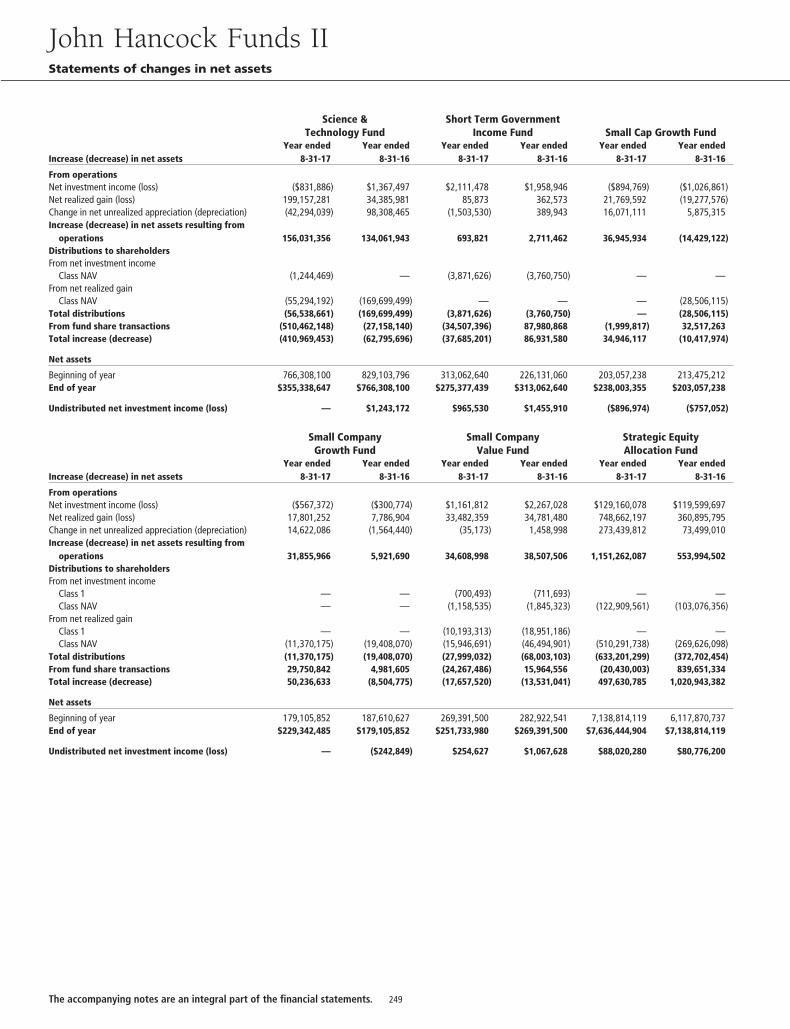
Science &Technology Fund
Short Term GovernmentIncome Fund Small Cap Growth Fund
Increase (decrease) in net assetsYear ended
8-31-17Year ended
8-31-16Year ended
8-31-17Year ended
8-31-16Year ended
8-31-17Year ended
8-31-16
From operationsNet investment income (loss) ($831,886) $1,367,497 $2,111,478 $1,958,946 ($894,769) ($1,026,861)Net realized gain (loss) 199,157,281 34,385,981 85,873 362,573 21,769,592 (19,277,576)Change in net unrealized appreciation (depreciation) (42,294,039) 98,308,465 (1,503,530) 389,943 16,071,111 5,875,315Increase (decrease) in net assets resulting from
operations 156,031,356 134,061,943 693,821 2,711,462 36,945,934 (14,429,122)Distributions to shareholdersFrom net investment income
Class NAV (1,244,469) — (3,871,626) (3,760,750) — —From net realized gain
Class NAV (55,294,192) (169,699,499) — — — (28,506,115)Total distributions (56,538,661) (169,699,499) (3,871,626) (3,760,750) — (28,506,115)From fund share transactions (510,462,148) (27,158,140) (34,507,396) 87,980,868 (1,999,817) 32,517,263Total increase (decrease) (410,969,453) (62,795,696) (37,685,201) 86,931,580 34,946,117 (10,417,974)
Net assets
Beginning of year 766,308,100 829,103,796 313,062,640 226,131,060 203,057,238 213,475,212End of year $355,338,647 $766,308,100 $275,377,439 $313,062,640 $238,003,355 $203,057,238
Undistributed net investment income (loss) — $1,243,172 $965,530 $1,455,910 ($896,974) ($757,052)
Small CompanyGrowth Fund
Small CompanyValue Fund
Strategic EquityAllocation Fund
Increase (decrease) in net assetsYear ended
8-31-17Year ended
8-31-16Year ended
8-31-17Year ended
8-31-16Year ended
8-31-17Year ended
8-31-16
From operationsNet investment income (loss) ($567,372) ($300,774) $1,161,812 $2,267,028 $129,160,078 $119,599,697Net realized gain (loss) 17,801,252 7,786,904 33,482,359 34,781,480 748,662,197 360,895,795Change in net unrealized appreciation (depreciation) 14,622,086 (1,564,440) (35,173) 1,458,998 273,439,812 73,499,010Increase (decrease) in net assets resulting from
operations 31,855,966 5,921,690 34,608,998 38,507,506 1,151,262,087 553,994,502Distributions to shareholdersFrom net investment income
Class 1 — — (700,493) (711,693) — —Class NAV — — (1,158,535) (1,845,323) (122,909,561) (103,076,356)
From net realized gainClass 1 — — (10,193,313) (18,951,186) — —Class NAV (11,370,175) (19,408,070) (15,946,691) (46,494,901) (510,291,738) (269,626,098)
Total distributions (11,370,175) (19,408,070) (27,999,032) (68,003,103) (633,201,299) (372,702,454)From fund share transactions 29,750,842 4,981,605 (24,267,486) 15,964,556 (20,430,003) 839,651,334Total increase (decrease) 50,236,633 (8,504,775) (17,657,520) (13,531,041) 497,630,785 1,020,943,382
Net assets
Beginning of year 179,105,852 187,610,627 269,391,500 282,922,541 7,138,814,119 6,117,870,737End of year $229,342,485 $179,105,852 $251,733,980 $269,391,500 $7,636,444,904 $7,138,814,119
Undistributed net investment income (loss) — ($242,849) $254,627 $1,067,628 $88,020,280 $80,776,200
John Hancock Funds IIStatements of changes in net assets
249The accompanying notes are an integral part of the financial statements.
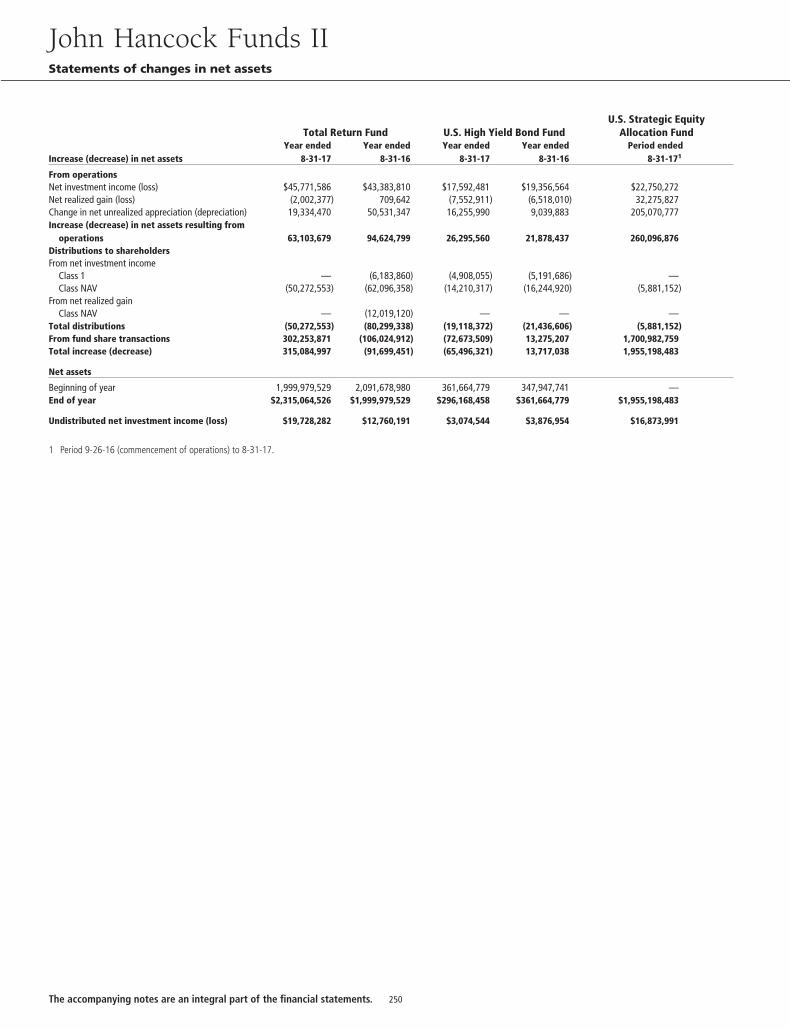
Total Return Fund U.S. High Yield Bond FundU.S. Strategic Equity
Allocation Fund
Increase (decrease) in net assetsYear ended
8-31-17Year ended
8-31-16Year ended
8-31-17Year ended
8-31-16Period ended
8-31-171
From operationsNet investment income (loss) $45,771,586 $43,383,810 $17,592,481 $19,356,564 $22,750,272Net realized gain (loss) (2,002,377) 709,642 (7,552,911) (6,518,010) 32,275,827Change in net unrealized appreciation (depreciation) 19,334,470 50,531,347 16,255,990 9,039,883 205,070,777Increase (decrease) in net assets resulting from
operations 63,103,679 94,624,799 26,295,560 21,878,437 260,096,876Distributions to shareholdersFrom net investment income
Class 1 — (6,183,860) (4,908,055) (5,191,686) —Class NAV (50,272,553) (62,096,358) (14,210,317) (16,244,920) (5,881,152)
From net realized gainClass NAV — (12,019,120) — — —
Total distributions (50,272,553) (80,299,338) (19,118,372) (21,436,606) (5,881,152)From fund share transactions 302,253,871 (106,024,912) (72,673,509) 13,275,207 1,700,982,759Total increase (decrease) 315,084,997 (91,699,451) (65,496,321) 13,717,038 1,955,198,483
Net assets
Beginning of year 1,999,979,529 2,091,678,980 361,664,779 347,947,741 —End of year $2,315,064,526 $1,999,979,529 $296,168,458 $361,664,779 $1,955,198,483
Undistributed net investment income (loss) $19,728,282 $12,760,191 $3,074,544 $3,876,954 $16,873,991
1 Period 9-26-16 (commencement of operations) to 8-31-17.
John Hancock Funds IIStatements of changes in net assets
250The accompanying notes are an integral part of the financial statements.
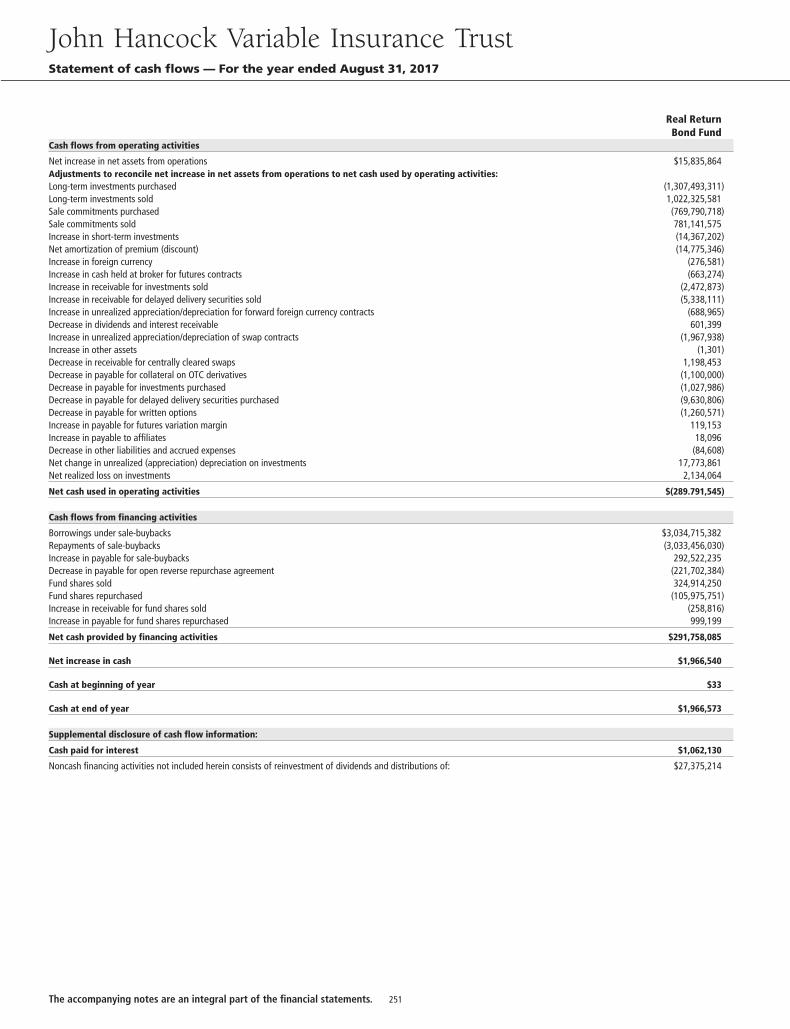
Real ReturnBond Fund
Cash flows from operating activities
Net increase in net assets from operations $15,835,864Adjustments to reconcile net increase in net assets from operations to net cash used by operating activities:Long-term investments purchased (1,307,493,311)Long-term investments sold 1,022,325,581Sale commitments purchased (769,790,718)Sale commitments sold 781,141,575Increase in short-term investments (14,367,202)Net amortization of premium (discount) (14,775,346)Increase in foreign currency (276,581)Increase in cash held at broker for futures contracts (663,274)Increase in receivable for investments sold (2,472,873)Increase in receivable for delayed delivery securities sold (5,338,111)Increase in unrealized appreciation/depreciation for forward foreign currency contracts (688,965)Decrease in dividends and interest receivable 601,399Increase in unrealized appreciation/depreciation of swap contracts (1,967,938)Increase in other assets (1,301)Decrease in receivable for centrally cleared swaps 1,198,453Decrease in payable for collateral on OTC derivatives (1,100,000)Decrease in payable for investments purchased (1,027,986)Decrease in payable for delayed delivery securities purchased (9,630,806)Decrease in payable for written options (1,260,571)Increase in payable for futures variation margin 119,153Increase in payable to affiliates 18,096Decrease in other liabilities and accrued expenses (84,608)Net change in unrealized (appreciation) depreciation on investments 17,773,861Net realized loss on investments 2,134,064
Net cash used in operating activities $(289.791,545)
Cash flows from financing activities
Borrowings under sale-buybacks $3,034,715,382Repayments of sale-buybacks (3,033,456,030)Increase in payable for sale-buybacks 292,522,235Decrease in payable for open reverse repurchase agreement (221,702,384)Fund shares sold 324,914,250Fund shares repurchased (105,975,751)Increase in receivable for fund shares sold (258,816)Increase in payable for fund shares repurchased 999,199
Net cash provided by financing activities $291,758,085
Net increase in cash $1,966,540
Cash at beginning of year $33
Cash at end of year $1,966,573
Supplemental disclosure of cash flow information:
Cash paid for interest $1,062,130
Noncash financing activities not included herein consists of reinvestment of dividends and distributions of: $27,375,214
John Hancock Variable Insurance TrustStatement of cash flows — For the year ended August 31, 2017
251The accompanying notes are an integral part of the financial statements.
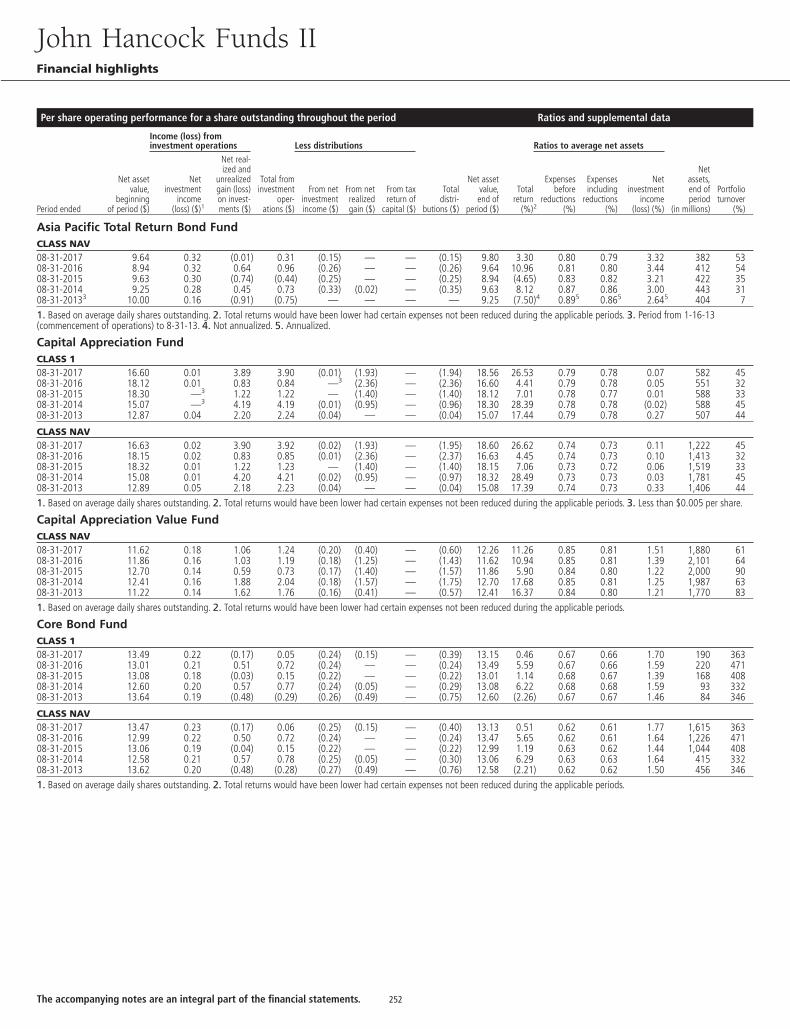
Per share operating performance for a share outstanding throughout the period Ratios and supplemental data
Income (loss) frominvestment operations Less distributions Ratios to average net assets
Period ended
Net assetvalue,
beginningof period ($)
Netinvestment
income(loss) ($)1
Net real-ized and
unrealizedgain (loss)on invest-ments ($)
Total frominvestment
oper-ations ($)
From netinvestmentincome ($)
From netrealizedgain ($)
From taxreturn of
capital ($)
Totaldistri-
butions ($)
Net assetvalue,end of
period ($)
Totalreturn
(%)2
Expensesbefore
reductions(%)
Expensesincluding
reductions(%)
Netinvestment
income(loss) (%)
Netassets,end ofperiod
(in millions)
Portfolioturnover
(%)
Asia Pacific Total Return Bond FundCLASS NAV08-31-2017 9.64 0.32 (0.01) 0.31 (0.15) — — (0.15) 9.80 3.30 0.80 0.79 3.32 382 5308-31-2016 8.94 0.32 0.64 0.96 (0.26) — — (0.26) 9.64 10.96 0.81 0.80 3.44 412 5408-31-2015 9.63 0.30 (0.74) (0.44) (0.25) — — (0.25) 8.94 (4.65) 0.83 0.82 3.21 422 3508-31-2014 9.25 0.28 0.45 0.73 (0.33) (0.02) — (0.35) 9.63 8.12 0.87 0.86 3.00 443 3108-31-20133 10.00 0.16 (0.91) (0.75) — — — — 9.25 (7.50)4 0.895 0.865 2.645 404 71. Based on average daily shares outstanding. 2. Total returns would have been lower had certain expenses not been reduced during the applicable periods. 3. Period from 1-16-13(commencement of operations) to 8-31-13. 4. Not annualized. 5. Annualized.
Capital Appreciation FundCLASS 108-31-2017 16.60 0.01 3.89 3.90 (0.01) (1.93) — (1.94) 18.56 26.53 0.79 0.78 0.07 582 4508-31-2016 18.12 0.01 0.83 0.84 —3 (2.36) — (2.36) 16.60 4.41 0.79 0.78 0.05 551 3208-31-2015 18.30 —3 1.22 1.22 — (1.40) — (1.40) 18.12 7.01 0.78 0.77 0.01 588 3308-31-2014 15.07 —3 4.19 4.19 (0.01) (0.95) — (0.96) 18.30 28.39 0.78 0.78 (0.02) 588 4508-31-2013 12.87 0.04 2.20 2.24 (0.04) — — (0.04) 15.07 17.44 0.79 0.78 0.27 507 44
CLASS NAV08-31-2017 16.63 0.02 3.90 3.92 (0.02) (1.93) — (1.95) 18.60 26.62 0.74 0.73 0.11 1,222 4508-31-2016 18.15 0.02 0.83 0.85 (0.01) (2.36) — (2.37) 16.63 4.45 0.74 0.73 0.10 1,413 3208-31-2015 18.32 0.01 1.22 1.23 — (1.40) — (1.40) 18.15 7.06 0.73 0.72 0.06 1,519 3308-31-2014 15.08 0.01 4.20 4.21 (0.02) (0.95) — (0.97) 18.32 28.49 0.73 0.73 0.03 1,781 4508-31-2013 12.89 0.05 2.18 2.23 (0.04) — — (0.04) 15.08 17.39 0.74 0.73 0.33 1,406 441. Based on average daily shares outstanding. 2. Total returns would have been lower had certain expenses not been reduced during the applicable periods. 3. Less than $0.005 per share.
Capital Appreciation Value FundCLASS NAV08-31-2017 11.62 0.18 1.06 1.24 (0.20) (0.40) — (0.60) 12.26 11.26 0.85 0.81 1.51 1,880 6108-31-2016 11.86 0.16 1.03 1.19 (0.18) (1.25) — (1.43) 11.62 10.94 0.85 0.81 1.39 2,101 6408-31-2015 12.70 0.14 0.59 0.73 (0.17) (1.40) — (1.57) 11.86 5.90 0.84 0.80 1.22 2,000 9008-31-2014 12.41 0.16 1.88 2.04 (0.18) (1.57) — (1.75) 12.70 17.68 0.85 0.81 1.25 1,987 6308-31-2013 11.22 0.14 1.62 1.76 (0.16) (0.41) — (0.57) 12.41 16.37 0.84 0.80 1.21 1,770 831. Based on average daily shares outstanding. 2. Total returns would have been lower had certain expenses not been reduced during the applicable periods.
Core Bond FundCLASS 108-31-2017 13.49 0.22 (0.17) 0.05 (0.24) (0.15) — (0.39) 13.15 0.46 0.67 0.66 1.70 190 36308-31-2016 13.01 0.21 0.51 0.72 (0.24) — — (0.24) 13.49 5.59 0.67 0.66 1.59 220 47108-31-2015 13.08 0.18 (0.03) 0.15 (0.22) — — (0.22) 13.01 1.14 0.68 0.67 1.39 168 40808-31-2014 12.60 0.20 0.57 0.77 (0.24) (0.05) — (0.29) 13.08 6.22 0.68 0.68 1.59 93 33208-31-2013 13.64 0.19 (0.48) (0.29) (0.26) (0.49) — (0.75) 12.60 (2.26) 0.67 0.67 1.46 84 346
CLASS NAV08-31-2017 13.47 0.23 (0.17) 0.06 (0.25) (0.15) — (0.40) 13.13 0.51 0.62 0.61 1.77 1,615 36308-31-2016 12.99 0.22 0.50 0.72 (0.24) — — (0.24) 13.47 5.65 0.62 0.61 1.64 1,226 47108-31-2015 13.06 0.19 (0.04) 0.15 (0.22) — — (0.22) 12.99 1.19 0.63 0.62 1.44 1,044 40808-31-2014 12.58 0.21 0.57 0.78 (0.25) (0.05) — (0.30) 13.06 6.29 0.63 0.63 1.64 415 33208-31-2013 13.62 0.20 (0.48) (0.28) (0.27) (0.49) — (0.76) 12.58 (2.21) 0.62 0.62 1.50 456 3461. Based on average daily shares outstanding. 2. Total returns would have been lower had certain expenses not been reduced during the applicable periods.
John Hancock Funds IIFinancial highlights
252The accompanying notes are an integral part of the financial statements.
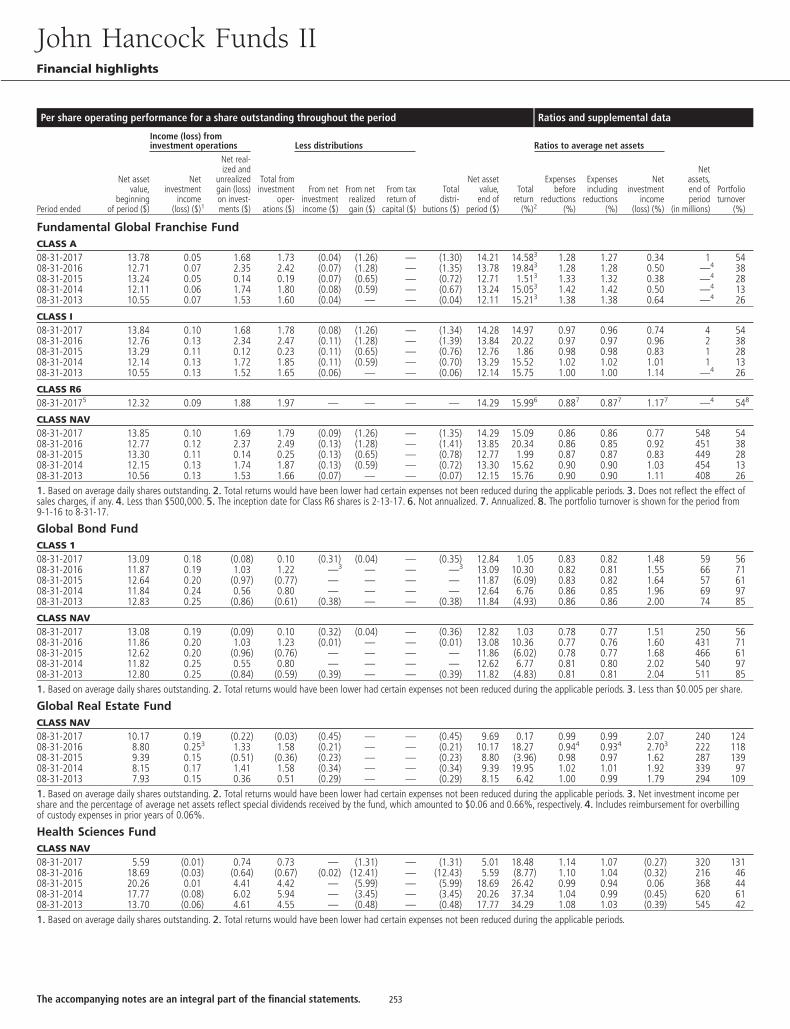
Per share operating performance for a share outstanding throughout the period Ratios and supplemental data
Income (loss) frominvestment operations Less distributions Ratios to average net assets
Period ended
Net assetvalue,
beginningof period ($)
Netinvestment
income(loss) ($)1
Net real-ized and
unrealizedgain (loss)on invest-ments ($)
Total frominvestment
oper-ations ($)
From netinvestmentincome ($)
From netrealizedgain ($)
From taxreturn of
capital ($)
Totaldistri-
butions ($)
Net assetvalue,end of
period ($)
Totalreturn
(%)2
Expensesbefore
reductions(%)
Expensesincluding
reductions(%)
Netinvestment
income(loss) (%)
Netassets,end ofperiod
(in millions)
Portfolioturnover
(%)
Fundamental Global Franchise FundCLASS A08-31-2017 13.78 0.05 1.68 1.73 (0.04) (1.26) — (1.30) 14.21 14.583 1.28 1.27 0.34 1 5408-31-2016 12.71 0.07 2.35 2.42 (0.07) (1.28) — (1.35) 13.78 19.843 1.28 1.28 0.50 —4 3808-31-2015 13.24 0.05 0.14 0.19 (0.07) (0.65) — (0.72) 12.71 1.513 1.33 1.32 0.38 —4 2808-31-2014 12.11 0.06 1.74 1.80 (0.08) (0.59) — (0.67) 13.24 15.053 1.42 1.42 0.50 —4 1308-31-2013 10.55 0.07 1.53 1.60 (0.04) — — (0.04) 12.11 15.213 1.38 1.38 0.64 —4 26
CLASS I08-31-2017 13.84 0.10 1.68 1.78 (0.08) (1.26) — (1.34) 14.28 14.97 0.97 0.96 0.74 4 5408-31-2016 12.76 0.13 2.34 2.47 (0.11) (1.28) — (1.39) 13.84 20.22 0.97 0.97 0.96 2 3808-31-2015 13.29 0.11 0.12 0.23 (0.11) (0.65) — (0.76) 12.76 1.86 0.98 0.98 0.83 1 2808-31-2014 12.14 0.13 1.72 1.85 (0.11) (0.59) — (0.70) 13.29 15.52 1.02 1.02 1.01 1 1308-31-2013 10.55 0.13 1.52 1.65 (0.06) — — (0.06) 12.14 15.75 1.00 1.00 1.14 —4 26
CLASS R608-31-20175 12.32 0.09 1.88 1.97 — — — — 14.29 15.996 0.887 0.877 1.177 —4 548
CLASS NAV08-31-2017 13.85 0.10 1.69 1.79 (0.09) (1.26) — (1.35) 14.29 15.09 0.86 0.86 0.77 548 5408-31-2016 12.77 0.12 2.37 2.49 (0.13) (1.28) — (1.41) 13.85 20.34 0.86 0.85 0.92 451 3808-31-2015 13.30 0.11 0.14 0.25 (0.13) (0.65) — (0.78) 12.77 1.99 0.87 0.87 0.83 449 2808-31-2014 12.15 0.13 1.74 1.87 (0.13) (0.59) — (0.72) 13.30 15.62 0.90 0.90 1.03 454 1308-31-2013 10.56 0.13 1.53 1.66 (0.07) — — (0.07) 12.15 15.76 0.90 0.90 1.11 408 261. Based on average daily shares outstanding. 2. Total returns would have been lower had certain expenses not been reduced during the applicable periods. 3. Does not reflect the effect ofsales charges, if any. 4. Less than $500,000. 5. The inception date for Class R6 shares is 2-13-17. 6. Not annualized. 7. Annualized. 8. The portfolio turnover is shown for the period from9-1-16 to 8-31-17.
Global Bond FundCLASS 108-31-2017 13.09 0.18 (0.08) 0.10 (0.31) (0.04) — (0.35) 12.84 1.05 0.83 0.82 1.48 59 5608-31-2016 11.87 0.19 1.03 1.22 —3 — — —3 13.09 10.30 0.82 0.81 1.55 66 7108-31-2015 12.64 0.20 (0.97) (0.77) — — — — 11.87 (6.09) 0.83 0.82 1.64 57 6108-31-2014 11.84 0.24 0.56 0.80 — — — — 12.64 6.76 0.86 0.85 1.96 69 9708-31-2013 12.83 0.25 (0.86) (0.61) (0.38) — — (0.38) 11.84 (4.93) 0.86 0.86 2.00 74 85
CLASS NAV08-31-2017 13.08 0.19 (0.09) 0.10 (0.32) (0.04) — (0.36) 12.82 1.03 0.78 0.77 1.51 250 5608-31-2016 11.86 0.20 1.03 1.23 (0.01) — — (0.01) 13.08 10.36 0.77 0.76 1.60 431 7108-31-2015 12.62 0.20 (0.96) (0.76) — — — — 11.86 (6.02) 0.78 0.77 1.68 466 6108-31-2014 11.82 0.25 0.55 0.80 — — — — 12.62 6.77 0.81 0.80 2.02 540 9708-31-2013 12.80 0.25 (0.84) (0.59) (0.39) — — (0.39) 11.82 (4.83) 0.81 0.81 2.04 511 851. Based on average daily shares outstanding. 2. Total returns would have been lower had certain expenses not been reduced during the applicable periods. 3. Less than $0.005 per share.
Global Real Estate FundCLASS NAV08-31-2017 10.17 0.19 (0.22) (0.03) (0.45) — — (0.45) 9.69 0.17 0.99 0.99 2.07 240 12408-31-2016 8.80 0.253 1.33 1.58 (0.21) — — (0.21) 10.17 18.27 0.944 0.934 2.703 222 11808-31-2015 9.39 0.15 (0.51) (0.36) (0.23) — — (0.23) 8.80 (3.96) 0.98 0.97 1.62 287 13908-31-2014 8.15 0.17 1.41 1.58 (0.34) — — (0.34) 9.39 19.95 1.02 1.01 1.92 339 9708-31-2013 7.93 0.15 0.36 0.51 (0.29) — — (0.29) 8.15 6.42 1.00 0.99 1.79 294 1091. Based on average daily shares outstanding. 2. Total returns would have been lower had certain expenses not been reduced during the applicable periods. 3. Net investment income pershare and the percentage of average net assets reflect special dividends received by the fund, which amounted to $0.06 and 0.66%, respectively. 4. Includes reimbursement for overbillingof custody expenses in prior years of 0.06%.
Health Sciences FundCLASS NAV08-31-2017 5.59 (0.01) 0.74 0.73 — (1.31) — (1.31) 5.01 18.48 1.14 1.07 (0.27) 320 13108-31-2016 18.69 (0.03) (0.64) (0.67) (0.02) (12.41) — (12.43) 5.59 (8.77) 1.10 1.04 (0.32) 216 4608-31-2015 20.26 0.01 4.41 4.42 — (5.99) — (5.99) 18.69 26.42 0.99 0.94 0.06 368 4408-31-2014 17.77 (0.08) 6.02 5.94 — (3.45) — (3.45) 20.26 37.34 1.04 0.99 (0.45) 620 6108-31-2013 13.70 (0.06) 4.61 4.55 — (0.48) — (0.48) 17.77 34.29 1.08 1.03 (0.39) 545 421. Based on average daily shares outstanding. 2. Total returns would have been lower had certain expenses not been reduced during the applicable periods.
John Hancock Funds IIFinancial highlights
253The accompanying notes are an integral part of the financial statements.
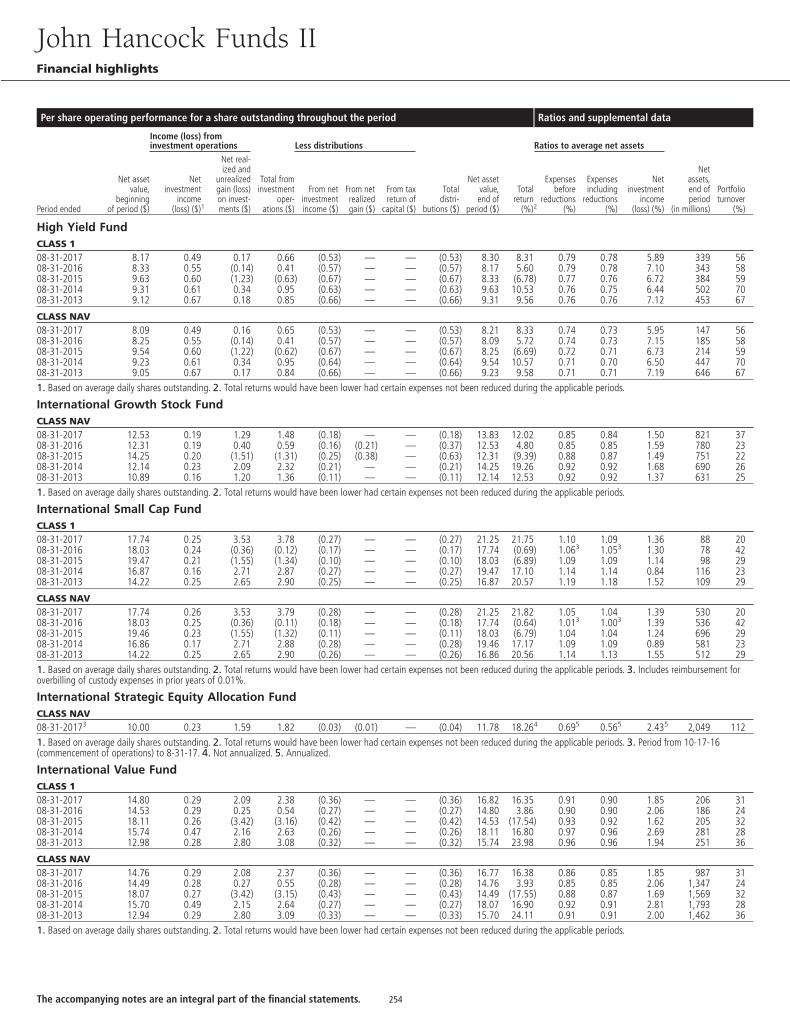
Per share operating performance for a share outstanding throughout the period Ratios and supplemental data
Income (loss) frominvestment operations Less distributions Ratios to average net assets
Period ended
Net assetvalue,
beginningof period ($)
Netinvestment
income(loss) ($)1
Net real-ized and
unrealizedgain (loss)on invest-ments ($)
Total frominvestment
oper-ations ($)
From netinvestmentincome ($)
From netrealizedgain ($)
From taxreturn of
capital ($)
Totaldistri-
butions ($)
Net assetvalue,end of
period ($)
Totalreturn
(%)2
Expensesbefore
reductions(%)
Expensesincluding
reductions(%)
Netinvestment
income(loss) (%)
Netassets,end ofperiod
(in millions)
Portfolioturnover
(%)
High Yield FundCLASS 108-31-2017 8.17 0.49 0.17 0.66 (0.53) — — (0.53) 8.30 8.31 0.79 0.78 5.89 339 5608-31-2016 8.33 0.55 (0.14) 0.41 (0.57) — — (0.57) 8.17 5.60 0.79 0.78 7.10 343 5808-31-2015 9.63 0.60 (1.23) (0.63) (0.67) — — (0.67) 8.33 (6.78) 0.77 0.76 6.72 384 5908-31-2014 9.31 0.61 0.34 0.95 (0.63) — — (0.63) 9.63 10.53 0.76 0.75 6.44 502 7008-31-2013 9.12 0.67 0.18 0.85 (0.66) — — (0.66) 9.31 9.56 0.76 0.76 7.12 453 67
CLASS NAV08-31-2017 8.09 0.49 0.16 0.65 (0.53) — — (0.53) 8.21 8.33 0.74 0.73 5.95 147 5608-31-2016 8.25 0.55 (0.14) 0.41 (0.57) — — (0.57) 8.09 5.72 0.74 0.73 7.15 185 5808-31-2015 9.54 0.60 (1.22) (0.62) (0.67) — — (0.67) 8.25 (6.69) 0.72 0.71 6.73 214 5908-31-2014 9.23 0.61 0.34 0.95 (0.64) — — (0.64) 9.54 10.57 0.71 0.70 6.50 447 7008-31-2013 9.05 0.67 0.17 0.84 (0.66) — — (0.66) 9.23 9.58 0.71 0.71 7.19 646 671. Based on average daily shares outstanding. 2. Total returns would have been lower had certain expenses not been reduced during the applicable periods.
International Growth Stock FundCLASS NAV08-31-2017 12.53 0.19 1.29 1.48 (0.18) — — (0.18) 13.83 12.02 0.85 0.84 1.50 821 3708-31-2016 12.31 0.19 0.40 0.59 (0.16) (0.21) — (0.37) 12.53 4.80 0.85 0.85 1.59 780 2308-31-2015 14.25 0.20 (1.51) (1.31) (0.25) (0.38) — (0.63) 12.31 (9.39) 0.88 0.87 1.49 751 2208-31-2014 12.14 0.23 2.09 2.32 (0.21) — — (0.21) 14.25 19.26 0.92 0.92 1.68 690 2608-31-2013 10.89 0.16 1.20 1.36 (0.11) — — (0.11) 12.14 12.53 0.92 0.92 1.37 631 251. Based on average daily shares outstanding. 2. Total returns would have been lower had certain expenses not been reduced during the applicable periods.
International Small Cap FundCLASS 108-31-2017 17.74 0.25 3.53 3.78 (0.27) — — (0.27) 21.25 21.75 1.10 1.09 1.36 88 2008-31-2016 18.03 0.24 (0.36) (0.12) (0.17) — — (0.17) 17.74 (0.69) 1.063 1.053 1.30 78 4208-31-2015 19.47 0.21 (1.55) (1.34) (0.10) — — (0.10) 18.03 (6.89) 1.09 1.09 1.14 98 2908-31-2014 16.87 0.16 2.71 2.87 (0.27) — — (0.27) 19.47 17.10 1.14 1.14 0.84 116 2308-31-2013 14.22 0.25 2.65 2.90 (0.25) — — (0.25) 16.87 20.57 1.19 1.18 1.52 109 29
CLASS NAV08-31-2017 17.74 0.26 3.53 3.79 (0.28) — — (0.28) 21.25 21.82 1.05 1.04 1.39 530 2008-31-2016 18.03 0.25 (0.36) (0.11) (0.18) — — (0.18) 17.74 (0.64) 1.013 1.003 1.39 536 4208-31-2015 19.46 0.23 (1.55) (1.32) (0.11) — — (0.11) 18.03 (6.79) 1.04 1.04 1.24 696 2908-31-2014 16.86 0.17 2.71 2.88 (0.28) — — (0.28) 19.46 17.17 1.09 1.09 0.89 581 2308-31-2013 14.22 0.25 2.65 2.90 (0.26) — — (0.26) 16.86 20.56 1.14 1.13 1.55 512 291. Based on average daily shares outstanding. 2. Total returns would have been lower had certain expenses not been reduced during the applicable periods. 3. Includes reimbursement foroverbilling of custody expenses in prior years of 0.01%.
International Strategic Equity Allocation FundCLASS NAV08-31-20173 10.00 0.23 1.59 1.82 (0.03) (0.01) — (0.04) 11.78 18.264 0.695 0.565 2.435 2,049 1121. Based on average daily shares outstanding. 2. Total returns would have been lower had certain expenses not been reduced during the applicable periods. 3. Period from 10-17-16(commencement of operations) to 8-31-17. 4. Not annualized. 5. Annualized.
International Value FundCLASS 108-31-2017 14.80 0.29 2.09 2.38 (0.36) — — (0.36) 16.82 16.35 0.91 0.90 1.85 206 3108-31-2016 14.53 0.29 0.25 0.54 (0.27) — — (0.27) 14.80 3.86 0.90 0.90 2.06 186 2408-31-2015 18.11 0.26 (3.42) (3.16) (0.42) — — (0.42) 14.53 (17.54) 0.93 0.92 1.62 205 3208-31-2014 15.74 0.47 2.16 2.63 (0.26) — — (0.26) 18.11 16.80 0.97 0.96 2.69 281 2808-31-2013 12.98 0.28 2.80 3.08 (0.32) — — (0.32) 15.74 23.98 0.96 0.96 1.94 251 36
CLASS NAV08-31-2017 14.76 0.29 2.08 2.37 (0.36) — — (0.36) 16.77 16.38 0.86 0.85 1.85 987 3108-31-2016 14.49 0.28 0.27 0.55 (0.28) — — (0.28) 14.76 3.93 0.85 0.85 2.06 1,347 2408-31-2015 18.07 0.27 (3.42) (3.15) (0.43) — — (0.43) 14.49 (17.55) 0.88 0.87 1.69 1,569 3208-31-2014 15.70 0.49 2.15 2.64 (0.27) — — (0.27) 18.07 16.90 0.92 0.91 2.81 1,793 2808-31-2013 12.94 0.29 2.80 3.09 (0.33) — — (0.33) 15.70 24.11 0.91 0.91 2.00 1,462 361. Based on average daily shares outstanding. 2. Total returns would have been lower had certain expenses not been reduced during the applicable periods.
John Hancock Funds IIFinancial highlights
254The accompanying notes are an integral part of the financial statements.
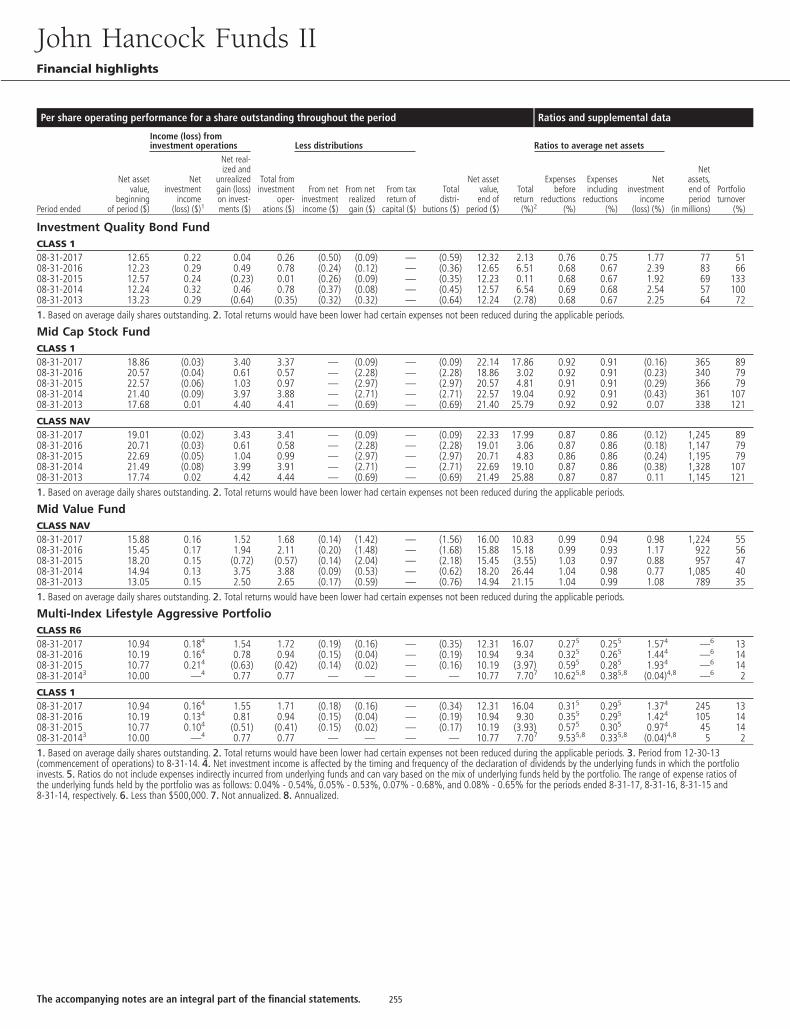
Per share operating performance for a share outstanding throughout the period Ratios and supplemental data
Income (loss) frominvestment operations Less distributions Ratios to average net assets
Period ended
Net assetvalue,
beginningof period ($)
Netinvestment
income(loss) ($)1
Net real-ized and
unrealizedgain (loss)on invest-ments ($)
Total frominvestment
oper-ations ($)
From netinvestmentincome ($)
From netrealizedgain ($)
From taxreturn of
capital ($)
Totaldistri-
butions ($)
Net assetvalue,end of
period ($)
Totalreturn
(%)2
Expensesbefore
reductions(%)
Expensesincluding
reductions(%)
Netinvestment
income(loss) (%)
Netassets,end ofperiod
(in millions)
Portfolioturnover
(%)
Investment Quality Bond FundCLASS 108-31-2017 12.65 0.22 0.04 0.26 (0.50) (0.09) — (0.59) 12.32 2.13 0.76 0.75 1.77 77 5108-31-2016 12.23 0.29 0.49 0.78 (0.24) (0.12) — (0.36) 12.65 6.51 0.68 0.67 2.39 83 6608-31-2015 12.57 0.24 (0.23) 0.01 (0.26) (0.09) — (0.35) 12.23 0.11 0.68 0.67 1.92 69 13308-31-2014 12.24 0.32 0.46 0.78 (0.37) (0.08) — (0.45) 12.57 6.54 0.69 0.68 2.54 57 10008-31-2013 13.23 0.29 (0.64) (0.35) (0.32) (0.32) — (0.64) 12.24 (2.78) 0.68 0.67 2.25 64 721. Based on average daily shares outstanding. 2. Total returns would have been lower had certain expenses not been reduced during the applicable periods.
Mid Cap Stock FundCLASS 108-31-2017 18.86 (0.03) 3.40 3.37 — (0.09) — (0.09) 22.14 17.86 0.92 0.91 (0.16) 365 8908-31-2016 20.57 (0.04) 0.61 0.57 — (2.28) — (2.28) 18.86 3.02 0.92 0.91 (0.23) 340 7908-31-2015 22.57 (0.06) 1.03 0.97 — (2.97) — (2.97) 20.57 4.81 0.91 0.91 (0.29) 366 7908-31-2014 21.40 (0.09) 3.97 3.88 — (2.71) — (2.71) 22.57 19.04 0.92 0.91 (0.43) 361 10708-31-2013 17.68 0.01 4.40 4.41 — (0.69) — (0.69) 21.40 25.79 0.92 0.92 0.07 338 121
CLASS NAV08-31-2017 19.01 (0.02) 3.43 3.41 — (0.09) — (0.09) 22.33 17.99 0.87 0.86 (0.12) 1,245 8908-31-2016 20.71 (0.03) 0.61 0.58 — (2.28) — (2.28) 19.01 3.06 0.87 0.86 (0.18) 1,147 7908-31-2015 22.69 (0.05) 1.04 0.99 — (2.97) — (2.97) 20.71 4.83 0.86 0.86 (0.24) 1,195 7908-31-2014 21.49 (0.08) 3.99 3.91 — (2.71) — (2.71) 22.69 19.10 0.87 0.86 (0.38) 1,328 10708-31-2013 17.74 0.02 4.42 4.44 — (0.69) — (0.69) 21.49 25.88 0.87 0.87 0.11 1,145 1211. Based on average daily shares outstanding. 2. Total returns would have been lower had certain expenses not been reduced during the applicable periods.
Mid Value FundCLASS NAV08-31-2017 15.88 0.16 1.52 1.68 (0.14) (1.42) — (1.56) 16.00 10.83 0.99 0.94 0.98 1,224 5508-31-2016 15.45 0.17 1.94 2.11 (0.20) (1.48) — (1.68) 15.88 15.18 0.99 0.93 1.17 922 5608-31-2015 18.20 0.15 (0.72) (0.57) (0.14) (2.04) — (2.18) 15.45 (3.55) 1.03 0.97 0.88 957 4708-31-2014 14.94 0.13 3.75 3.88 (0.09) (0.53) — (0.62) 18.20 26.44 1.04 0.98 0.77 1,085 4008-31-2013 13.05 0.15 2.50 2.65 (0.17) (0.59) — (0.76) 14.94 21.15 1.04 0.99 1.08 789 351. Based on average daily shares outstanding. 2. Total returns would have been lower had certain expenses not been reduced during the applicable periods.
Multi-Index Lifestyle Aggressive PortfolioCLASS R608-31-2017 10.94 0.184 1.54 1.72 (0.19) (0.16) — (0.35) 12.31 16.07 0.275 0.255 1.574 —6 1308-31-2016 10.19 0.164 0.78 0.94 (0.15) (0.04) — (0.19) 10.94 9.34 0.325 0.265 1.444 —6 1408-31-2015 10.77 0.214 (0.63) (0.42) (0.14) (0.02) — (0.16) 10.19 (3.97) 0.595 0.285 1.934 —6 1408-31-20143 10.00 —4 0.77 0.77 — — — — 10.77 7.707 10.625,8 0.385,8 (0.04)4,8 —6 2
CLASS 108-31-2017 10.94 0.164 1.55 1.71 (0.18) (0.16) — (0.34) 12.31 16.04 0.315 0.295 1.374 245 1308-31-2016 10.19 0.134 0.81 0.94 (0.15) (0.04) — (0.19) 10.94 9.30 0.355 0.295 1.424 105 1408-31-2015 10.77 0.104 (0.51) (0.41) (0.15) (0.02) — (0.17) 10.19 (3.93) 0.575 0.305 0.974 45 1408-31-20143 10.00 —4 0.77 0.77 — — — — 10.77 7.707 9.535,8 0.335,8 (0.04)4,8 5 21. Based on average daily shares outstanding. 2. Total returns would have been lower had certain expenses not been reduced during the applicable periods. 3. Period from 12-30-13(commencement of operations) to 8-31-14. 4. Net investment income is affected by the timing and frequency of the declaration of dividends by the underlying funds in which the portfolioinvests. 5. Ratios do not include expenses indirectly incurred from underlying funds and can vary based on the mix of underlying funds held by the portfolio. The range of expense ratios ofthe underlying funds held by the portfolio was as follows: 0.04% - 0.54%, 0.05% - 0.53%, 0.07% - 0.68%, and 0.08% - 0.65% for the periods ended 8-31-17, 8-31-16, 8-31-15 and8-31-14, respectively. 6. Less than $500,000. 7. Not annualized. 8. Annualized.
John Hancock Funds IIFinancial highlights
255The accompanying notes are an integral part of the financial statements.
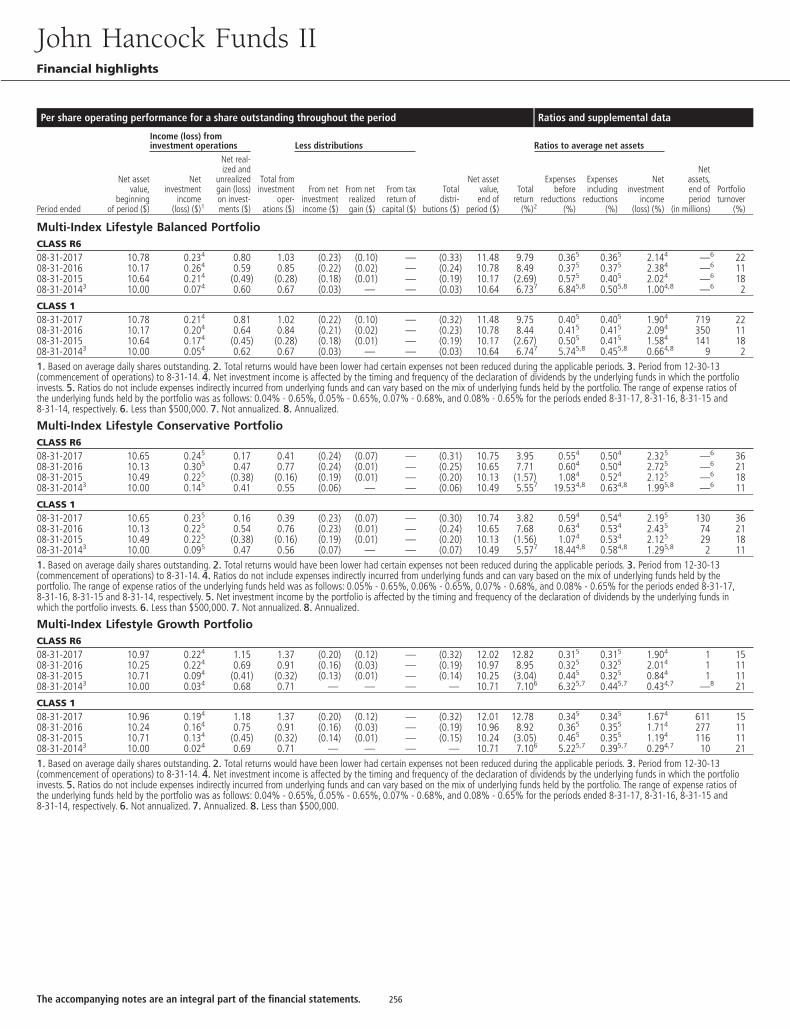
Per share operating performance for a share outstanding throughout the period Ratios and supplemental data
Income (loss) frominvestment operations Less distributions Ratios to average net assets
Period ended
Net assetvalue,
beginningof period ($)
Netinvestment
income(loss) ($)1
Net real-ized and
unrealizedgain (loss)on invest-ments ($)
Total frominvestment
oper-ations ($)
From netinvestmentincome ($)
From netrealizedgain ($)
From taxreturn of
capital ($)
Totaldistri-
butions ($)
Net assetvalue,end of
period ($)
Totalreturn
(%)2
Expensesbefore
reductions(%)
Expensesincluding
reductions(%)
Netinvestment
income(loss) (%)
Netassets,end ofperiod
(in millions)
Portfolioturnover
(%)
Multi-Index Lifestyle Balanced PortfolioCLASS R608-31-2017 10.78 0.234 0.80 1.03 (0.23) (0.10) — (0.33) 11.48 9.79 0.365 0.365 2.144 —6 2208-31-2016 10.17 0.264 0.59 0.85 (0.22) (0.02) — (0.24) 10.78 8.49 0.375 0.375 2.384 —6 1108-31-2015 10.64 0.214 (0.49) (0.28) (0.18) (0.01) — (0.19) 10.17 (2.69) 0.575 0.405 2.024 —6 1808-31-20143 10.00 0.074 0.60 0.67 (0.03) — — (0.03) 10.64 6.737 6.845,8 0.505,8 1.004,8 —6 2
CLASS 108-31-2017 10.78 0.214 0.81 1.02 (0.22) (0.10) — (0.32) 11.48 9.75 0.405 0.405 1.904 719 2208-31-2016 10.17 0.204 0.64 0.84 (0.21) (0.02) — (0.23) 10.78 8.44 0.415 0.415 2.094 350 1108-31-2015 10.64 0.174 (0.45) (0.28) (0.18) (0.01) — (0.19) 10.17 (2.67) 0.505 0.415 1.584 141 1808-31-20143 10.00 0.054 0.62 0.67 (0.03) — — (0.03) 10.64 6.747 5.745,8 0.455,8 0.664,8 9 21. Based on average daily shares outstanding. 2. Total returns would have been lower had certain expenses not been reduced during the applicable periods. 3. Period from 12-30-13(commencement of operations) to 8-31-14. 4. Net investment income is affected by the timing and frequency of the declaration of dividends by the underlying funds in which the portfolioinvests. 5. Ratios do not include expenses indirectly incurred from underlying funds and can vary based on the mix of underlying funds held by the portfolio. The range of expense ratios ofthe underlying funds held by the portfolio was as follows: 0.04% - 0.65%, 0.05% - 0.65%, 0.07% - 0.68%, and 0.08% - 0.65% for the periods ended 8-31-17, 8-31-16, 8-31-15 and8-31-14, respectively. 6. Less than $500,000. 7. Not annualized. 8. Annualized.
Multi-Index Lifestyle Conservative PortfolioCLASS R608-31-2017 10.65 0.245 0.17 0.41 (0.24) (0.07) — (0.31) 10.75 3.95 0.554 0.504 2.325 —6 3608-31-2016 10.13 0.305 0.47 0.77 (0.24) (0.01) — (0.25) 10.65 7.71 0.604 0.504 2.725 —6 2108-31-2015 10.49 0.225 (0.38) (0.16) (0.19) (0.01) — (0.20) 10.13 (1.57) 1.084 0.524 2.125 —6 1808-31-20143 10.00 0.145 0.41 0.55 (0.06) — — (0.06) 10.49 5.557 19.534,8 0.634,8 1.995,8 —6 11
CLASS 108-31-2017 10.65 0.235 0.16 0.39 (0.23) (0.07) — (0.30) 10.74 3.82 0.594 0.544 2.195 130 3608-31-2016 10.13 0.225 0.54 0.76 (0.23) (0.01) — (0.24) 10.65 7.68 0.634 0.534 2.435 74 2108-31-2015 10.49 0.225 (0.38) (0.16) (0.19) (0.01) — (0.20) 10.13 (1.56) 1.074 0.534 2.125 29 1808-31-20143 10.00 0.095 0.47 0.56 (0.07) — — (0.07) 10.49 5.577 18.444,8 0.584,8 1.295,8 2 111. Based on average daily shares outstanding. 2. Total returns would have been lower had certain expenses not been reduced during the applicable periods. 3. Period from 12-30-13(commencement of operations) to 8-31-14. 4. Ratios do not include expenses indirectly incurred from underlying funds and can vary based on the mix of underlying funds held by theportfolio. The range of expense ratios of the underlying funds held was as follows: 0.05% - 0.65%, 0.06% - 0.65%, 0.07% - 0.68%, and 0.08% - 0.65% for the periods ended 8-31-17,8-31-16, 8-31-15 and 8-31-14, respectively. 5. Net investment income by the portfolio is affected by the timing and frequency of the declaration of dividends by the underlying funds inwhich the portfolio invests. 6. Less than $500,000. 7. Not annualized. 8. Annualized.
Multi-Index Lifestyle Growth PortfolioCLASS R608-31-2017 10.97 0.224 1.15 1.37 (0.20) (0.12) — (0.32) 12.02 12.82 0.315 0.315 1.904 1 1508-31-2016 10.25 0.224 0.69 0.91 (0.16) (0.03) — (0.19) 10.97 8.95 0.325 0.325 2.014 1 1108-31-2015 10.71 0.094 (0.41) (0.32) (0.13) (0.01) — (0.14) 10.25 (3.04) 0.445 0.325 0.844 1 1108-31-20143 10.00 0.034 0.68 0.71 — — — — 10.71 7.106 6.325,7 0.445,7 0.434,7 —8 21
CLASS 108-31-2017 10.96 0.194 1.18 1.37 (0.20) (0.12) — (0.32) 12.01 12.78 0.345 0.345 1.674 611 1508-31-2016 10.24 0.164 0.75 0.91 (0.16) (0.03) — (0.19) 10.96 8.92 0.365 0.355 1.714 277 1108-31-2015 10.71 0.134 (0.45) (0.32) (0.14) (0.01) — (0.15) 10.24 (3.05) 0.465 0.355 1.194 116 1108-31-20143 10.00 0.024 0.69 0.71 — — — — 10.71 7.106 5.225,7 0.395,7 0.294,7 10 211. Based on average daily shares outstanding. 2. Total returns would have been lower had certain expenses not been reduced during the applicable periods. 3. Period from 12-30-13(commencement of operations) to 8-31-14. 4. Net investment income is affected by the timing and frequency of the declaration of dividends by the underlying funds in which the portfolioinvests. 5. Ratios do not include expenses indirectly incurred from underlying funds and can vary based on the mix of underlying funds held by the portfolio. The range of expense ratios ofthe underlying funds held by the portfolio was as follows: 0.04% - 0.65%, 0.05% - 0.65%, 0.07% - 0.68%, and 0.08% - 0.65% for the periods ended 8-31-17, 8-31-16, 8-31-15 and8-31-14, respectively. 6. Not annualized. 7. Annualized. 8. Less than $500,000.
John Hancock Funds IIFinancial highlights
256The accompanying notes are an integral part of the financial statements.
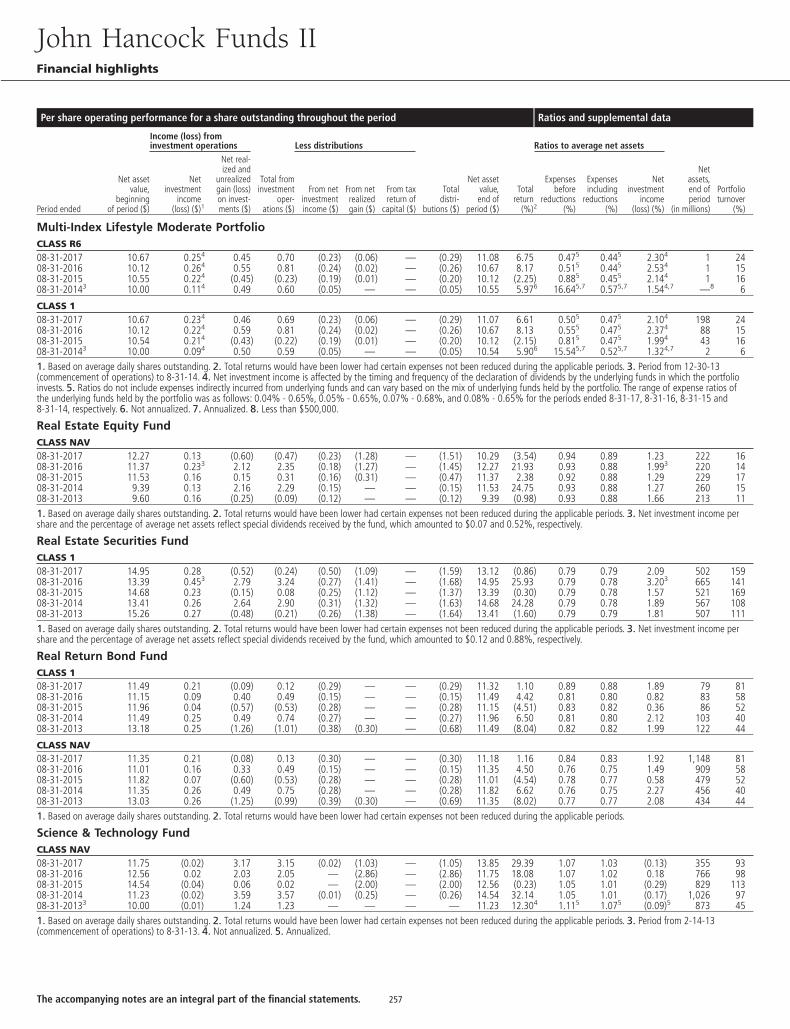
Per share operating performance for a share outstanding throughout the period Ratios and supplemental data
Income (loss) frominvestment operations Less distributions Ratios to average net assets
Period ended
Net assetvalue,
beginningof period ($)
Netinvestment
income(loss) ($)1
Net real-ized and
unrealizedgain (loss)on invest-ments ($)
Total frominvestment
oper-ations ($)
From netinvestmentincome ($)
From netrealizedgain ($)
From taxreturn of
capital ($)
Totaldistri-
butions ($)
Net assetvalue,end of
period ($)
Totalreturn
(%)2
Expensesbefore
reductions(%)
Expensesincluding
reductions(%)
Netinvestment
income(loss) (%)
Netassets,end ofperiod
(in millions)
Portfolioturnover
(%)
Multi-Index Lifestyle Moderate PortfolioCLASS R608-31-2017 10.67 0.254 0.45 0.70 (0.23) (0.06) — (0.29) 11.08 6.75 0.475 0.445 2.304 1 2408-31-2016 10.12 0.264 0.55 0.81 (0.24) (0.02) — (0.26) 10.67 8.17 0.515 0.445 2.534 1 1508-31-2015 10.55 0.224 (0.45) (0.23) (0.19) (0.01) — (0.20) 10.12 (2.25) 0.885 0.455 2.144 1 1608-31-20143 10.00 0.114 0.49 0.60 (0.05) — — (0.05) 10.55 5.976 16.645,7 0.575,7 1.544,7 —8 6
CLASS 108-31-2017 10.67 0.234 0.46 0.69 (0.23) (0.06) — (0.29) 11.07 6.61 0.505 0.475 2.104 198 2408-31-2016 10.12 0.224 0.59 0.81 (0.24) (0.02) — (0.26) 10.67 8.13 0.555 0.475 2.374 88 1508-31-2015 10.54 0.214 (0.43) (0.22) (0.19) (0.01) — (0.20) 10.12 (2.15) 0.815 0.475 1.994 43 1608-31-20143 10.00 0.094 0.50 0.59 (0.05) — — (0.05) 10.54 5.906 15.545,7 0.525,7 1.324,7 2 61. Based on average daily shares outstanding. 2. Total returns would have been lower had certain expenses not been reduced during the applicable periods. 3. Period from 12-30-13(commencement of operations) to 8-31-14. 4. Net investment income is affected by the timing and frequency of the declaration of dividends by the underlying funds in which the portfolioinvests. 5. Ratios do not include expenses indirectly incurred from underlying funds and can vary based on the mix of underlying funds held by the portfolio. The range of expense ratios ofthe underlying funds held by the portfolio was as follows: 0.04% - 0.65%, 0.05% - 0.65%, 0.07% - 0.68%, and 0.08% - 0.65% for the periods ended 8-31-17, 8-31-16, 8-31-15 and8-31-14, respectively. 6. Not annualized. 7. Annualized. 8. Less than $500,000.
Real Estate Equity FundCLASS NAV08-31-2017 12.27 0.13 (0.60) (0.47) (0.23) (1.28) — (1.51) 10.29 (3.54) 0.94 0.89 1.23 222 1608-31-2016 11.37 0.233 2.12 2.35 (0.18) (1.27) — (1.45) 12.27 21.93 0.93 0.88 1.993 220 1408-31-2015 11.53 0.16 0.15 0.31 (0.16) (0.31) — (0.47) 11.37 2.38 0.92 0.88 1.29 229 1708-31-2014 9.39 0.13 2.16 2.29 (0.15) — — (0.15) 11.53 24.75 0.93 0.88 1.27 260 1508-31-2013 9.60 0.16 (0.25) (0.09) (0.12) — — (0.12) 9.39 (0.98) 0.93 0.88 1.66 213 111. Based on average daily shares outstanding. 2. Total returns would have been lower had certain expenses not been reduced during the applicable periods. 3. Net investment income pershare and the percentage of average net assets reflect special dividends received by the fund, which amounted to $0.07 and 0.52%, respectively.
Real Estate Securities FundCLASS 108-31-2017 14.95 0.28 (0.52) (0.24) (0.50) (1.09) — (1.59) 13.12 (0.86) 0.79 0.79 2.09 502 15908-31-2016 13.39 0.453 2.79 3.24 (0.27) (1.41) — (1.68) 14.95 25.93 0.79 0.78 3.203 665 14108-31-2015 14.68 0.23 (0.15) 0.08 (0.25) (1.12) — (1.37) 13.39 (0.30) 0.79 0.78 1.57 521 16908-31-2014 13.41 0.26 2.64 2.90 (0.31) (1.32) — (1.63) 14.68 24.28 0.79 0.78 1.89 567 10808-31-2013 15.26 0.27 (0.48) (0.21) (0.26) (1.38) — (1.64) 13.41 (1.60) 0.79 0.79 1.81 507 1111. Based on average daily shares outstanding. 2. Total returns would have been lower had certain expenses not been reduced during the applicable periods. 3. Net investment income pershare and the percentage of average net assets reflect special dividends received by the fund, which amounted to $0.12 and 0.88%, respectively.
Real Return Bond FundCLASS 108-31-2017 11.49 0.21 (0.09) 0.12 (0.29) — — (0.29) 11.32 1.10 0.89 0.88 1.89 79 8108-31-2016 11.15 0.09 0.40 0.49 (0.15) — — (0.15) 11.49 4.42 0.81 0.80 0.82 83 5808-31-2015 11.96 0.04 (0.57) (0.53) (0.28) — — (0.28) 11.15 (4.51) 0.83 0.82 0.36 86 5208-31-2014 11.49 0.25 0.49 0.74 (0.27) — — (0.27) 11.96 6.50 0.81 0.80 2.12 103 4008-31-2013 13.18 0.25 (1.26) (1.01) (0.38) (0.30) — (0.68) 11.49 (8.04) 0.82 0.82 1.99 122 44
CLASS NAV08-31-2017 11.35 0.21 (0.08) 0.13 (0.30) — — (0.30) 11.18 1.16 0.84 0.83 1.92 1,148 8108-31-2016 11.01 0.16 0.33 0.49 (0.15) — — (0.15) 11.35 4.50 0.76 0.75 1.49 909 5808-31-2015 11.82 0.07 (0.60) (0.53) (0.28) — — (0.28) 11.01 (4.54) 0.78 0.77 0.58 479 5208-31-2014 11.35 0.26 0.49 0.75 (0.28) — — (0.28) 11.82 6.62 0.76 0.75 2.27 456 4008-31-2013 13.03 0.26 (1.25) (0.99) (0.39) (0.30) — (0.69) 11.35 (8.02) 0.77 0.77 2.08 434 441. Based on average daily shares outstanding. 2. Total returns would have been lower had certain expenses not been reduced during the applicable periods.
Science & Technology FundCLASS NAV08-31-2017 11.75 (0.02) 3.17 3.15 (0.02) (1.03) — (1.05) 13.85 29.39 1.07 1.03 (0.13) 355 9308-31-2016 12.56 0.02 2.03 2.05 — (2.86) — (2.86) 11.75 18.08 1.07 1.02 0.18 766 9808-31-2015 14.54 (0.04) 0.06 0.02 — (2.00) — (2.00) 12.56 (0.23) 1.05 1.01 (0.29) 829 11308-31-2014 11.23 (0.02) 3.59 3.57 (0.01) (0.25) — (0.26) 14.54 32.14 1.05 1.01 (0.17) 1,026 9708-31-20133 10.00 (0.01) 1.24 1.23 — — — — 11.23 12.304 1.115 1.075 (0.09)5 873 451. Based on average daily shares outstanding. 2. Total returns would have been lower had certain expenses not been reduced during the applicable periods. 3. Period from 2-14-13(commencement of operations) to 8-31-13. 4. Not annualized. 5. Annualized.
John Hancock Funds IIFinancial highlights
257The accompanying notes are an integral part of the financial statements.
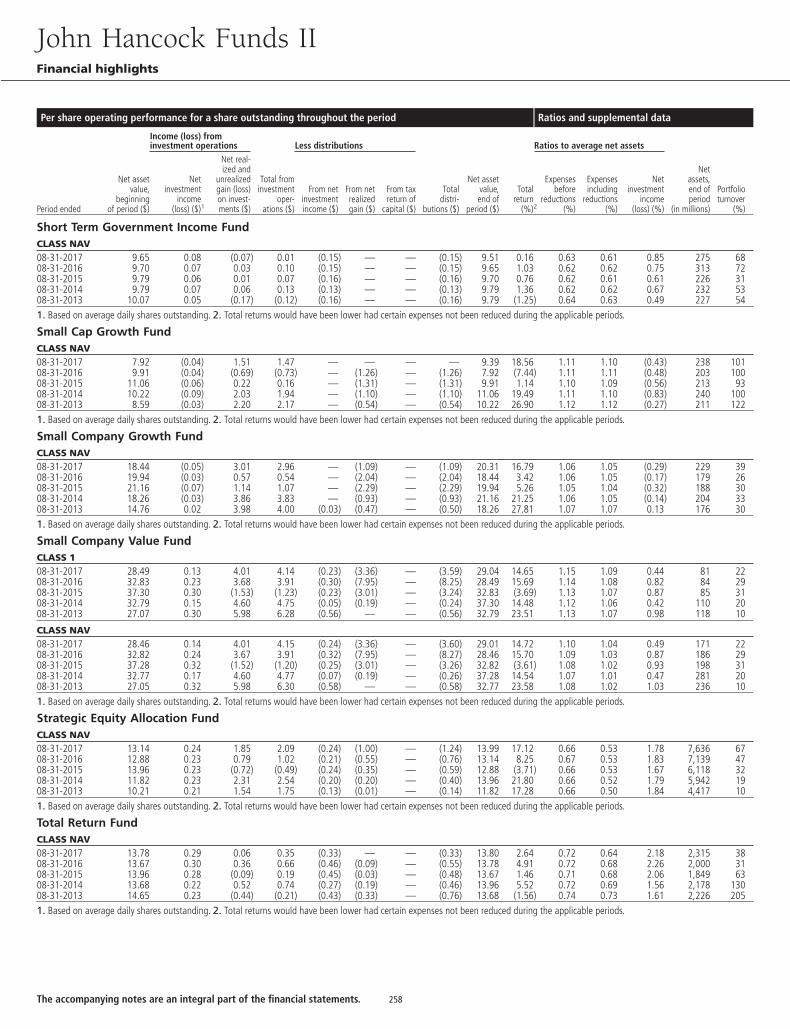
Per share operating performance for a share outstanding throughout the period Ratios and supplemental data
Income (loss) frominvestment operations Less distributions Ratios to average net assets
Period ended
Net assetvalue,
beginningof period ($)
Netinvestment
income(loss) ($)1
Net real-ized and
unrealizedgain (loss)on invest-ments ($)
Total frominvestment
oper-ations ($)
From netinvestmentincome ($)
From netrealizedgain ($)
From taxreturn of
capital ($)
Totaldistri-
butions ($)
Net assetvalue,end of
period ($)
Totalreturn
(%)2
Expensesbefore
reductions(%)
Expensesincluding
reductions(%)
Netinvestment
income(loss) (%)
Netassets,end ofperiod
(in millions)
Portfolioturnover
(%)
Short Term Government Income FundCLASS NAV08-31-2017 9.65 0.08 (0.07) 0.01 (0.15) — — (0.15) 9.51 0.16 0.63 0.61 0.85 275 6808-31-2016 9.70 0.07 0.03 0.10 (0.15) — — (0.15) 9.65 1.03 0.62 0.62 0.75 313 7208-31-2015 9.79 0.06 0.01 0.07 (0.16) — — (0.16) 9.70 0.76 0.62 0.61 0.61 226 3108-31-2014 9.79 0.07 0.06 0.13 (0.13) — — (0.13) 9.79 1.36 0.62 0.62 0.67 232 5308-31-2013 10.07 0.05 (0.17) (0.12) (0.16) — — (0.16) 9.79 (1.25) 0.64 0.63 0.49 227 541. Based on average daily shares outstanding. 2. Total returns would have been lower had certain expenses not been reduced during the applicable periods.
Small Cap Growth FundCLASS NAV08-31-2017 7.92 (0.04) 1.51 1.47 — — — — 9.39 18.56 1.11 1.10 (0.43) 238 10108-31-2016 9.91 (0.04) (0.69) (0.73) — (1.26) — (1.26) 7.92 (7.44) 1.11 1.11 (0.48) 203 10008-31-2015 11.06 (0.06) 0.22 0.16 — (1.31) — (1.31) 9.91 1.14 1.10 1.09 (0.56) 213 9308-31-2014 10.22 (0.09) 2.03 1.94 — (1.10) — (1.10) 11.06 19.49 1.11 1.10 (0.83) 240 10008-31-2013 8.59 (0.03) 2.20 2.17 — (0.54) — (0.54) 10.22 26.90 1.12 1.12 (0.27) 211 1221. Based on average daily shares outstanding. 2. Total returns would have been lower had certain expenses not been reduced during the applicable periods.
Small Company Growth FundCLASS NAV08-31-2017 18.44 (0.05) 3.01 2.96 — (1.09) — (1.09) 20.31 16.79 1.06 1.05 (0.29) 229 3908-31-2016 19.94 (0.03) 0.57 0.54 — (2.04) — (2.04) 18.44 3.42 1.06 1.05 (0.17) 179 2608-31-2015 21.16 (0.07) 1.14 1.07 — (2.29) — (2.29) 19.94 5.26 1.05 1.04 (0.32) 188 3008-31-2014 18.26 (0.03) 3.86 3.83 — (0.93) — (0.93) 21.16 21.25 1.06 1.05 (0.14) 204 3308-31-2013 14.76 0.02 3.98 4.00 (0.03) (0.47) — (0.50) 18.26 27.81 1.07 1.07 0.13 176 301. Based on average daily shares outstanding. 2. Total returns would have been lower had certain expenses not been reduced during the applicable periods.
Small Company Value FundCLASS 108-31-2017 28.49 0.13 4.01 4.14 (0.23) (3.36) — (3.59) 29.04 14.65 1.15 1.09 0.44 81 2208-31-2016 32.83 0.23 3.68 3.91 (0.30) (7.95) — (8.25) 28.49 15.69 1.14 1.08 0.82 84 2908-31-2015 37.30 0.30 (1.53) (1.23) (0.23) (3.01) — (3.24) 32.83 (3.69) 1.13 1.07 0.87 85 3108-31-2014 32.79 0.15 4.60 4.75 (0.05) (0.19) — (0.24) 37.30 14.48 1.12 1.06 0.42 110 2008-31-2013 27.07 0.30 5.98 6.28 (0.56) — — (0.56) 32.79 23.51 1.13 1.07 0.98 118 10
CLASS NAV08-31-2017 28.46 0.14 4.01 4.15 (0.24) (3.36) — (3.60) 29.01 14.72 1.10 1.04 0.49 171 2208-31-2016 32.82 0.24 3.67 3.91 (0.32) (7.95) — (8.27) 28.46 15.70 1.09 1.03 0.87 186 2908-31-2015 37.28 0.32 (1.52) (1.20) (0.25) (3.01) — (3.26) 32.82 (3.61) 1.08 1.02 0.93 198 3108-31-2014 32.77 0.17 4.60 4.77 (0.07) (0.19) — (0.26) 37.28 14.54 1.07 1.01 0.47 281 2008-31-2013 27.05 0.32 5.98 6.30 (0.58) — — (0.58) 32.77 23.58 1.08 1.02 1.03 236 101. Based on average daily shares outstanding. 2. Total returns would have been lower had certain expenses not been reduced during the applicable periods.
Strategic Equity Allocation FundCLASS NAV08-31-2017 13.14 0.24 1.85 2.09 (0.24) (1.00) — (1.24) 13.99 17.12 0.66 0.53 1.78 7,636 6708-31-2016 12.88 0.23 0.79 1.02 (0.21) (0.55) — (0.76) 13.14 8.25 0.67 0.53 1.83 7,139 4708-31-2015 13.96 0.23 (0.72) (0.49) (0.24) (0.35) — (0.59) 12.88 (3.71) 0.66 0.53 1.67 6,118 3208-31-2014 11.82 0.23 2.31 2.54 (0.20) (0.20) — (0.40) 13.96 21.80 0.66 0.52 1.79 5,942 1908-31-2013 10.21 0.21 1.54 1.75 (0.13) (0.01) — (0.14) 11.82 17.28 0.66 0.50 1.84 4,417 101. Based on average daily shares outstanding. 2. Total returns would have been lower had certain expenses not been reduced during the applicable periods.
Total Return FundCLASS NAV08-31-2017 13.78 0.29 0.06 0.35 (0.33) — — (0.33) 13.80 2.64 0.72 0.64 2.18 2,315 3808-31-2016 13.67 0.30 0.36 0.66 (0.46) (0.09) — (0.55) 13.78 4.91 0.72 0.68 2.26 2,000 3108-31-2015 13.96 0.28 (0.09) 0.19 (0.45) (0.03) — (0.48) 13.67 1.46 0.71 0.68 2.06 1,849 6308-31-2014 13.68 0.22 0.52 0.74 (0.27) (0.19) — (0.46) 13.96 5.52 0.72 0.69 1.56 2,178 13008-31-2013 14.65 0.23 (0.44) (0.21) (0.43) (0.33) — (0.76) 13.68 (1.56) 0.74 0.73 1.61 2,226 2051. Based on average daily shares outstanding. 2. Total returns would have been lower had certain expenses not been reduced during the applicable periods.
John Hancock Funds IIFinancial highlights
258The accompanying notes are an integral part of the financial statements.
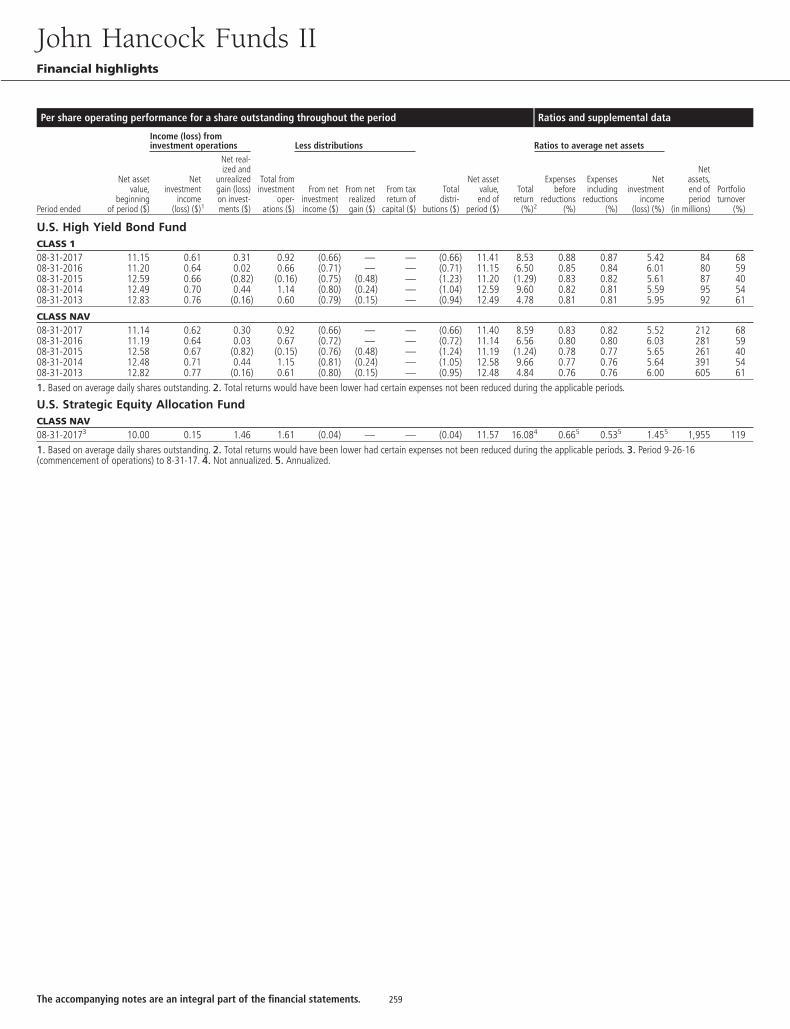
Per share operating performance for a share outstanding throughout the period Ratios and supplemental data
Income (loss) frominvestment operations Less distributions Ratios to average net assets
Period ended
Net assetvalue,
beginningof period ($)
Netinvestment
income(loss) ($)1
Net real-ized and
unrealizedgain (loss)on invest-ments ($)
Total frominvestment
oper-ations ($)
From netinvestmentincome ($)
From netrealizedgain ($)
From taxreturn of
capital ($)
Totaldistri-
butions ($)
Net assetvalue,end of
period ($)
Totalreturn
(%)2
Expensesbefore
reductions(%)
Expensesincluding
reductions(%)
Netinvestment
income(loss) (%)
Netassets,end ofperiod
(in millions)
Portfolioturnover
(%)
U.S. High Yield Bond FundCLASS 108-31-2017 11.15 0.61 0.31 0.92 (0.66) — — (0.66) 11.41 8.53 0.88 0.87 5.42 84 6808-31-2016 11.20 0.64 0.02 0.66 (0.71) — — (0.71) 11.15 6.50 0.85 0.84 6.01 80 5908-31-2015 12.59 0.66 (0.82) (0.16) (0.75) (0.48) — (1.23) 11.20 (1.29) 0.83 0.82 5.61 87 4008-31-2014 12.49 0.70 0.44 1.14 (0.80) (0.24) — (1.04) 12.59 9.60 0.82 0.81 5.59 95 5408-31-2013 12.83 0.76 (0.16) 0.60 (0.79) (0.15) — (0.94) 12.49 4.78 0.81 0.81 5.95 92 61
CLASS NAV08-31-2017 11.14 0.62 0.30 0.92 (0.66) — — (0.66) 11.40 8.59 0.83 0.82 5.52 212 6808-31-2016 11.19 0.64 0.03 0.67 (0.72) — — (0.72) 11.14 6.56 0.80 0.80 6.03 281 5908-31-2015 12.58 0.67 (0.82) (0.15) (0.76) (0.48) — (1.24) 11.19 (1.24) 0.78 0.77 5.65 261 4008-31-2014 12.48 0.71 0.44 1.15 (0.81) (0.24) — (1.05) 12.58 9.66 0.77 0.76 5.64 391 5408-31-2013 12.82 0.77 (0.16) 0.61 (0.80) (0.15) — (0.95) 12.48 4.84 0.76 0.76 6.00 605 611. Based on average daily shares outstanding. 2. Total returns would have been lower had certain expenses not been reduced during the applicable periods.
U.S. Strategic Equity Allocation FundCLASS NAV08-31-20173 10.00 0.15 1.46 1.61 (0.04) — — (0.04) 11.57 16.084 0.665 0.535 1.455 1,955 1191. Based on average daily shares outstanding. 2. Total returns would have been lower had certain expenses not been reduced during the applicable periods. 3. Period 9-26-16(commencement of operations) to 8-31-17. 4. Not annualized. 5. Annualized.
John Hancock Funds IIFinancial highlights
259The accompanying notes are an integral part of the financial statements.
1. ORGANIZATION John Hancock Funds II (the Trust) is an open-end management investment company organized as a Massachusetts business trust and registeredunder the Investment Company Act of 1940, as amended (the 1940 Act). It is a series company with multiple investment series (the funds), thirty-three of which arepresented in this report.
Multi-Index Lifestyle Aggressive Portfolio, Multi-Index Lifestyle Balanced Portfolio, Multi-Index Lifestyle Conservative Portfolio, Multi-Index Lifestyle Growth Portfolioand Multi-Index Lifestyle Moderate Portfolio (collectively, the Multi-Index Lifestyle Portfolios, formerly, Lifestyle II Portfolios) operate as “funds-of-funds” investing inshares of mutual funds (underlying funds). The accounting policies of the John Hancock underlying funds in which the funds invest are outlined in the underlyingfunds’ shareholder reports, which include the underlying funds’ financial statements, available without charge by calling 800-344-1029 or visiting jhinvestments.com, onthe Securities and Exchange Commission (SEC) website at sec.gov or at the SEC’s public reference room in Washington, D.C.
The funds may offer multiple classes of shares. The shares currently offered by the Trust are detailed in the Statements of assets and liabilities. Class A shares are offeredto all investors. Class I shares are offered to institutions and certain investors. Class R6 shares are only available to certain retirement plans, institutions and other inves-tors. Class 1 shares are offered only to certain affiliates of Manulife Financial Corporation (MFC). Class NAV shares are offered to John Hancock affiliated funds of fundsand certain 529 plans. Shareholders of each class have exclusive voting rights to matters that affect that class. The distribution and service fees, if any, and transfer agentfees for each class may differ.
Investment Quality Bond Fund liquidated Class NAV shares on March 15, 2017.
Effective September 26, 2016, U.S. Strategic Equity Allocation commenced operations.
Effective October 17, 2016, International Strategic Equity Allocation commenced operations.
Effective February 1, 2017, the Lifestyle II Portfolios changed their name as follows:
New Portfolio Name Former Portfolio Name
Multi-Index Lifestyle Aggressive Portfolio Lifestyle II Aggressive PortfolioMulti-Index Lifestyle Balanced Portfolio Lifestyle II Balanced PortfolioMulti-Index Lifestyle Conservative Portfolio Lifestyle II Conservative PortfolioMulti-Index Lifestyle Growth Portfolio Lifestyle II Growth PortfolioMulti-Index Lifestyle Moderate Portfolio Lifestyle II Moderate Portfolio
2. SIGNIFICANT ACCOUNTING POLICIES The financial statements have been prepared in conformity with accounting principles generally accepted in theUnited States of America (US GAAP), which require management to make certain estimates and assumptions as of the date of the financial statements. Actual resultscould differ from those estimates and those differences could be significant. The funds qualify as investment companies under Topic 946 of Accounting StandardsCodification of US GAAP.
Events or transactions occurring after the end of the fiscal period through the date that the financial statements were issued have been evaluated in the preparation of thefinancial statements. The following summarizes the significant accounting policies of the funds:
Security valuation. Investments are stated at value as of the scheduled close of regular trading on the New York Stock Exchange (NYSE), normally at 4:00 p.m.,Eastern Time. In case of emergency or other disruption resulting in the NYSE not opening for trading or the NYSE closing at a time other than the regularly scheduledclose, the net asset value (NAV) may be determined as of the regularly scheduled close of the NYSE pursuant to the funds’ Valuation Policies and Procedures.
In order to value the securities, the funds use the following valuation techniques: Equity securities, including exchange-traded funds (ETFs), held by the funds are typi-cally valued at the last sale price or official closing price on the exchange or principal market where the security trades. In the event there were no sales during the dayor closing prices are not available, the securities are valued using the last available bid price. Except for investments in ETFs, investments by the funds in open-endmutual funds, including John Hancock Collateral Trust (JHCT), are valued at their respective NAVs each business day. Debt obligations are valued based on the evaluatedprices provided by an independent pricing vendor or from broker-dealers. Independent pricing vendors utilize matrix pricing which takes into account factors such asinstitutional-size trading in similar groups of securities, yield, quality, coupon rate, maturity, type of issue, trading characteristics and other market data, as well as brokersupplied prices. Options listed on an exchange are valued at the mean of the most recent bid and ask prices from the exchange where the option trades. Swaps andunlisted options are valued using evaluated prices obtained from an independent pricing vendor. Futures contracts are valued at settlement prices, which are the officialclosing prices published by the exchange on which they trade. Foreign index futures that trade in the electronic trading market subsequent to the close of regular tradingand have sufficient liquidity will be valued at the last traded price in the electronic trading market as of 4:00 p.m. ET. Foreign securities and currencies, including for-ward foreign currency contracts, are valued in U.S. dollars based on foreign currency exchange rates supplied by an independent pricing vendor.
In certain instances, the Pricing Committee may determine to value equity securities using prices obtained from another exchange or market if trading on the exchangeor market on which prices are typically obtained did not open for trading as scheduled, or if trading closed earlier than scheduled, and trading occurred as normal onanother exchange or market.
Other portfolio securities and assets, for which reliable market quotations are not readily available, are valued at fair value as determined in good faith by the funds’Pricing Committee following procedures established by the Board of Trustees. The frequency with which these fair valuation procedures are used cannot be predicted andfair value of securities may differ significantly from the value that would have been used had a ready market for such securities existed. Trading in foreign securities maybe completed before the scheduled daily close of trading on the NYSE. Significant events at the issuer or market level may affect the values of securities between the timewhen the valuation of the securities is generally determined and the close of the NYSE. If a significant event occurs, these securities may be fair valued, as determined ingood faith by the funds’ Pricing Committee, following procedures established by the Board of Trustees. The funds use fair value adjustment factors provided by an inde-pendent pricing vendor to value certain foreign securities in order to adjust for events that may occur between the close of foreign exchanges or markets and the close ofthe NYSE.
The funds use a three-tier hierarchy to prioritize the pricing assumptions, referred to as inputs, used in valuation techniques to measure fair value. Level 1 includes secu-rities valued using quoted prices in active markets for identical securities. Level 2 includes securities valued using other significant observable inputs. Observable inputsmay include quoted prices for similar securities, interest rates, prepayment speeds and credit risk. Prices for securities valued using these inputs are received from inde-pendent pricing vendors and brokers and are based on an evaluation of the inputs described. Level 3 includes securities valued using significant unobservable inputs
John Hancock Funds IINotes to financial statements
260
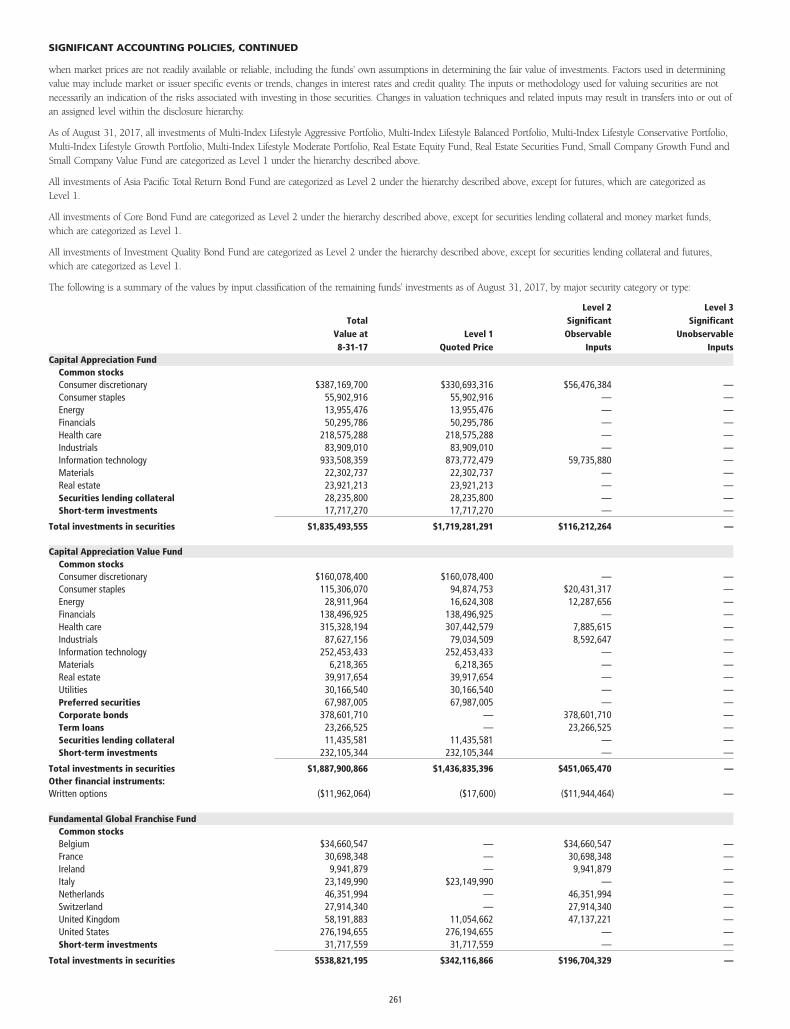
when market prices are not readily available or reliable, including the funds’ own assumptions in determining the fair value of investments. Factors used in determiningvalue may include market or issuer specific events or trends, changes in interest rates and credit quality. The inputs or methodology used for valuing securities are notnecessarily an indication of the risks associated with investing in those securities. Changes in valuation techniques and related inputs may result in transfers into or out ofan assigned level within the disclosure hierarchy.
As of August 31, 2017, all investments of Multi-Index Lifestyle Aggressive Portfolio, Multi-Index Lifestyle Balanced Portfolio, Multi-Index Lifestyle Conservative Portfolio,Multi-Index Lifestyle Growth Portfolio, Multi-Index Lifestyle Moderate Portfolio, Real Estate Equity Fund, Real Estate Securities Fund, Small Company Growth Fund andSmall Company Value Fund are categorized as Level 1 under the hierarchy described above.
All investments of Asia Pacific Total Return Bond Fund are categorized as Level 2 under the hierarchy described above, except for futures, which are categorized asLevel 1.
All investments of Core Bond Fund are categorized as Level 2 under the hierarchy described above, except for securities lending collateral and money market funds,which are categorized as Level 1.
All investments of Investment Quality Bond Fund are categorized as Level 2 under the hierarchy described above, except for securities lending collateral and futures,which are categorized as Level 1.
The following is a summary of the values by input classification of the remaining funds’ investments as of August 31, 2017, by major security category or type:
TotalValue at8-31-17
Level 1Quoted Price
Level 2SignificantObservable
Inputs
Level 3Significant
UnobservableInputs
Capital Appreciation FundCommon stocksConsumer discretionary $387,169,700 $330,693,316 $56,476,384 —Consumer staples 55,902,916 55,902,916 — —Energy 13,955,476 13,955,476 — —Financials 50,295,786 50,295,786 — —Health care 218,575,288 218,575,288 — —Industrials 83,909,010 83,909,010 — —Information technology 933,508,359 873,772,479 59,735,880 —Materials 22,302,737 22,302,737 — —Real estate 23,921,213 23,921,213 — —Securities lending collateral 28,235,800 28,235,800 — —Short-term investments 17,717,270 17,717,270 — —
Total investments in securities $1,835,493,555 $1,719,281,291 $116,212,264 —
Capital Appreciation Value FundCommon stocksConsumer discretionary $160,078,400 $160,078,400 — —Consumer staples 115,306,070 94,874,753 $20,431,317 —Energy 28,911,964 16,624,308 12,287,656 —Financials 138,496,925 138,496,925 — —Health care 315,328,194 307,442,579 7,885,615 —Industrials 87,627,156 79,034,509 8,592,647 —Information technology 252,453,433 252,453,433 — —Materials 6,218,365 6,218,365 — —Real estate 39,917,654 39,917,654 — —Utilities 30,166,540 30,166,540 — —Preferred securities 67,987,005 67,987,005 — —Corporate bonds 378,601,710 — 378,601,710 —Term loans 23,266,525 — 23,266,525 —Securities lending collateral 11,435,581 11,435,581 — —Short-term investments 232,105,344 232,105,344 — —
Total investments in securities $1,887,900,866 $1,436,835,396 $451,065,470 —Other financial instruments:Written options ($11,962,064) ($17,600) ($11,944,464) —
Fundamental Global Franchise FundCommon stocksBelgium $34,660,547 — $34,660,547 —France 30,698,348 — 30,698,348 —Ireland 9,941,879 — 9,941,879 —Italy 23,149,990 $23,149,990 — —Netherlands 46,351,994 — 46,351,994 —Switzerland 27,914,340 — 27,914,340 —United Kingdom 58,191,883 11,054,662 47,137,221 —United States 276,194,655 276,194,655 — —Short-term investments 31,717,559 31,717,559 — —
Total investments in securities $538,821,195 $342,116,866 $196,704,329 —
SIGNIFICANT ACCOUNTING POLICIES, CONTINUED
261
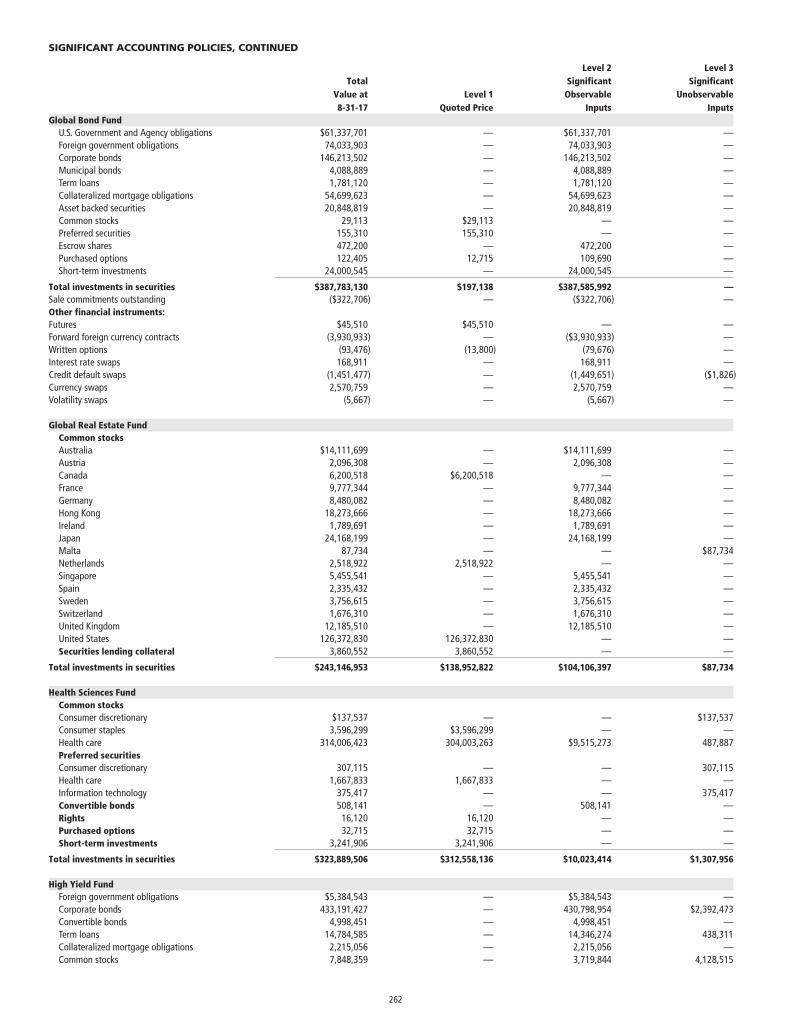
TotalValue at8-31-17
Level 1Quoted Price
Level 2SignificantObservable
Inputs
Level 3Significant
UnobservableInputs
Global Bond FundU.S. Government and Agency obligations $61,337,701 — $61,337,701 —Foreign government obligations 74,033,903 — 74,033,903 —Corporate bonds 146,213,502 — 146,213,502 —Municipal bonds 4,088,889 — 4,088,889 —Term loans 1,781,120 — 1,781,120 —Collateralized mortgage obligations 54,699,623 — 54,699,623 —Asset backed securities 20,848,819 — 20,848,819 —Common stocks 29,113 $29,113 — —Preferred securities 155,310 155,310 — —Escrow shares 472,200 — 472,200 —Purchased options 122,405 12,715 109,690 —Short-term investments 24,000,545 — 24,000,545 —
Total investments in securities $387,783,130 $197,138 $387,585,992 —Sale commitments outstanding ($322,706) — ($322,706) —Other financial instruments:Futures $45,510 $45,510 — —Forward foreign currency contracts (3,930,933) — ($3,930,933) —Written options (93,476) (13,800) (79,676) —Interest rate swaps 168,911 — 168,911 —Credit default swaps (1,451,477) — (1,449,651) ($1,826)Currency swaps 2,570,759 — 2,570,759 —Volatility swaps (5,667) — (5,667) —
Global Real Estate FundCommon stocksAustralia $14,111,699 — $14,111,699 —Austria 2,096,308 — 2,096,308 —Canada 6,200,518 $6,200,518 — —France 9,777,344 — 9,777,344 —Germany 8,480,082 — 8,480,082 —Hong Kong 18,273,666 — 18,273,666 —Ireland 1,789,691 — 1,789,691 —Japan 24,168,199 — 24,168,199 —Malta 87,734 — — $87,734Netherlands 2,518,922 2,518,922 — —Singapore 5,455,541 — 5,455,541 —Spain 2,335,432 — 2,335,432 —Sweden 3,756,615 — 3,756,615 —Switzerland 1,676,310 — 1,676,310 —United Kingdom 12,185,510 — 12,185,510 —United States 126,372,830 126,372,830 — —Securities lending collateral 3,860,552 3,860,552 — —
Total investments in securities $243,146,953 $138,952,822 $104,106,397 $87,734
Health Sciences FundCommon stocksConsumer discretionary $137,537 — — $137,537Consumer staples 3,596,299 $3,596,299 — —Health care 314,006,423 304,003,263 $9,515,273 487,887Preferred securitiesConsumer discretionary 307,115 — — 307,115Health care 1,667,833 1,667,833 — —Information technology 375,417 — — 375,417Convertible bonds 508,141 — 508,141 —Rights 16,120 16,120 — —Purchased options 32,715 32,715 — —Short-term investments 3,241,906 3,241,906 — —
Total investments in securities $323,889,506 $312,558,136 $10,023,414 $1,307,956
High Yield FundForeign government obligations $5,384,543 — $5,384,543 —Corporate bonds 433,191,427 — 430,798,954 $2,392,473Convertible bonds 4,998,451 — 4,998,451 —Term loans 14,784,585 — 14,346,274 438,311Collateralized mortgage obligations 2,215,056 — 2,215,056 —Common stocks 7,848,359 — 3,719,844 4,128,515
SIGNIFICANT ACCOUNTING POLICIES, CONTINUED
262
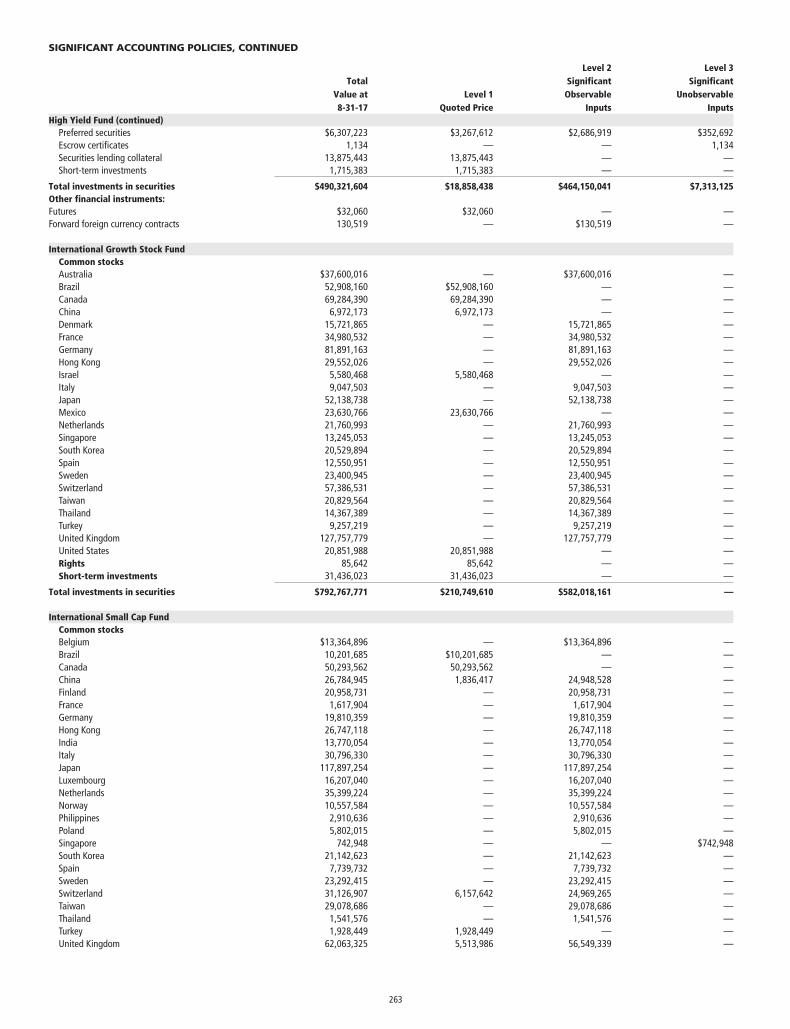
TotalValue at8-31-17
Level 1Quoted Price
Level 2SignificantObservable
Inputs
Level 3Significant
UnobservableInputs
High Yield Fund (continued)Preferred securities $6,307,223 $3,267,612 $2,686,919 $352,692Escrow certificates 1,134 — — 1,134Securities lending collateral 13,875,443 13,875,443 — —Short-term investments 1,715,383 1,715,383 — —
Total investments in securities $490,321,604 $18,858,438 $464,150,041 $7,313,125Other financial instruments:Futures $32,060 $32,060 — —Forward foreign currency contracts 130,519 — $130,519 —
International Growth Stock FundCommon stocksAustralia $37,600,016 — $37,600,016 —Brazil 52,908,160 $52,908,160 — —Canada 69,284,390 69,284,390 — —China 6,972,173 6,972,173 — —Denmark 15,721,865 — 15,721,865 —France 34,980,532 — 34,980,532 —Germany 81,891,163 — 81,891,163 —Hong Kong 29,552,026 — 29,552,026 —Israel 5,580,468 5,580,468 — —Italy 9,047,503 — 9,047,503 —Japan 52,138,738 — 52,138,738 —Mexico 23,630,766 23,630,766 — —Netherlands 21,760,993 — 21,760,993 —Singapore 13,245,053 — 13,245,053 —South Korea 20,529,894 — 20,529,894 —Spain 12,550,951 — 12,550,951 —Sweden 23,400,945 — 23,400,945 —Switzerland 57,386,531 — 57,386,531 —Taiwan 20,829,564 — 20,829,564 —Thailand 14,367,389 — 14,367,389 —Turkey 9,257,219 — 9,257,219 —United Kingdom 127,757,779 — 127,757,779 —United States 20,851,988 20,851,988 — —Rights 85,642 85,642 — —Short-term investments 31,436,023 31,436,023 — —
Total investments in securities $792,767,771 $210,749,610 $582,018,161 —
International Small Cap FundCommon stocksBelgium $13,364,896 — $13,364,896 —Brazil 10,201,685 $10,201,685 — —Canada 50,293,562 50,293,562 — —China 26,784,945 1,836,417 24,948,528 —Finland 20,958,731 — 20,958,731 —France 1,617,904 — 1,617,904 —Germany 19,810,359 — 19,810,359 —Hong Kong 26,747,118 — 26,747,118 —India 13,770,054 — 13,770,054 —Italy 30,796,330 — 30,796,330 —Japan 117,897,254 — 117,897,254 —Luxembourg 16,207,040 — 16,207,040 —Netherlands 35,399,224 — 35,399,224 —Norway 10,557,584 — 10,557,584 —Philippines 2,910,636 — 2,910,636 —Poland 5,802,015 — 5,802,015 —Singapore 742,948 — — $742,948South Korea 21,142,623 — 21,142,623 —Spain 7,739,732 — 7,739,732 —Sweden 23,292,415 — 23,292,415 —Switzerland 31,126,907 6,157,642 24,969,265 —Taiwan 29,078,686 — 29,078,686 —Thailand 1,541,576 — 1,541,576 —Turkey 1,928,449 1,928,449 — —United Kingdom 62,063,325 5,513,986 56,549,339 —
SIGNIFICANT ACCOUNTING POLICIES, CONTINUED
263
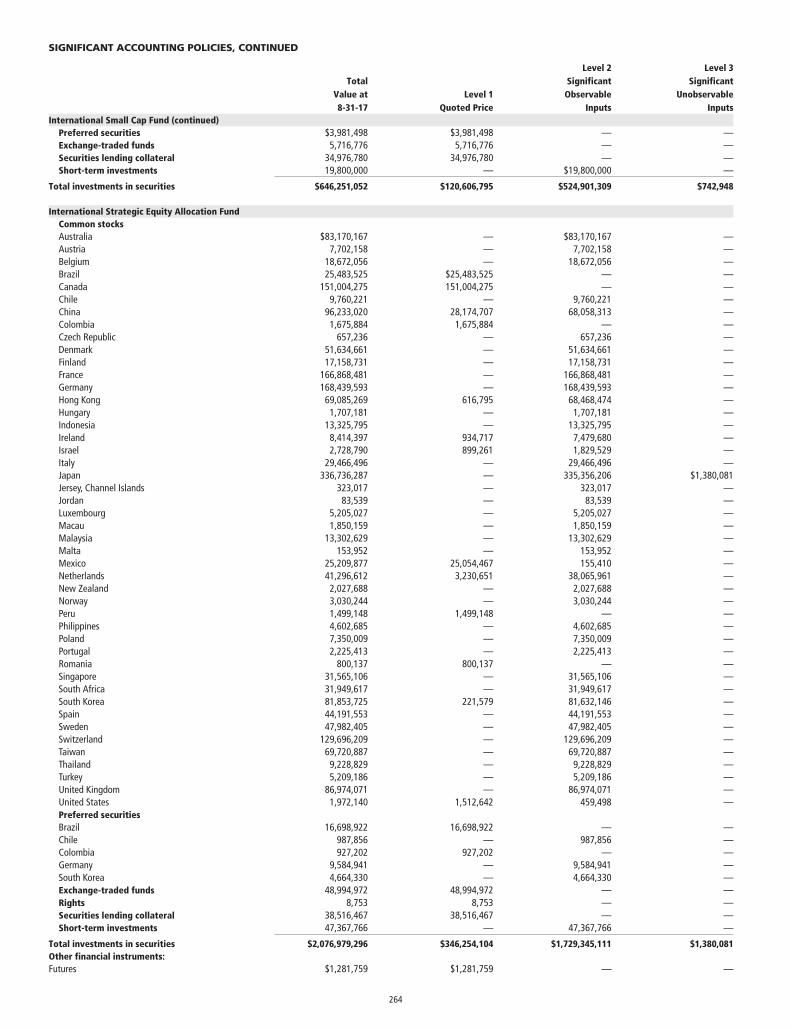
TotalValue at8-31-17
Level 1Quoted Price
Level 2SignificantObservable
Inputs
Level 3Significant
UnobservableInputs
International Small Cap Fund (continued)Preferred securities $3,981,498 $3,981,498 — —Exchange-traded funds 5,716,776 5,716,776 — —Securities lending collateral 34,976,780 34,976,780 — —Short-term investments 19,800,000 — $19,800,000 —
Total investments in securities $646,251,052 $120,606,795 $524,901,309 $742,948
International Strategic Equity Allocation FundCommon stocksAustralia $83,170,167 — $83,170,167 —Austria 7,702,158 — 7,702,158 —Belgium 18,672,056 — 18,672,056 —Brazil 25,483,525 $25,483,525 — —Canada 151,004,275 151,004,275 — —Chile 9,760,221 — 9,760,221 —China 96,233,020 28,174,707 68,058,313 —Colombia 1,675,884 1,675,884 — —Czech Republic 657,236 — 657,236 —Denmark 51,634,661 — 51,634,661 —Finland 17,158,731 — 17,158,731 —France 166,868,481 — 166,868,481 —Germany 168,439,593 — 168,439,593 —Hong Kong 69,085,269 616,795 68,468,474 —Hungary 1,707,181 — 1,707,181 —Indonesia 13,325,795 — 13,325,795 —Ireland 8,414,397 934,717 7,479,680 —Israel 2,728,790 899,261 1,829,529 —Italy 29,466,496 — 29,466,496 —Japan 336,736,287 — 335,356,206 $1,380,081Jersey, Channel Islands 323,017 — 323,017 —Jordan 83,539 — 83,539 —Luxembourg 5,205,027 — 5,205,027 —Macau 1,850,159 — 1,850,159 —Malaysia 13,302,629 — 13,302,629 —Malta 153,952 — 153,952 —Mexico 25,209,877 25,054,467 155,410 —Netherlands 41,296,612 3,230,651 38,065,961 —New Zealand 2,027,688 — 2,027,688 —Norway 3,030,244 — 3,030,244 —Peru 1,499,148 1,499,148 — —Philippines 4,602,685 — 4,602,685 —Poland 7,350,009 — 7,350,009 —Portugal 2,225,413 — 2,225,413 —Romania 800,137 800,137 — —Singapore 31,565,106 — 31,565,106 —South Africa 31,949,617 — 31,949,617 —South Korea 81,853,725 221,579 81,632,146 —Spain 44,191,553 — 44,191,553 —Sweden 47,982,405 — 47,982,405 —Switzerland 129,696,209 — 129,696,209 —Taiwan 69,720,887 — 69,720,887 —Thailand 9,228,829 — 9,228,829 —Turkey 5,209,186 — 5,209,186 —United Kingdom 86,974,071 — 86,974,071 —United States 1,972,140 1,512,642 459,498 —Preferred securitiesBrazil 16,698,922 16,698,922 — —Chile 987,856 — 987,856 —Colombia 927,202 927,202 — —Germany 9,584,941 — 9,584,941 —South Korea 4,664,330 — 4,664,330 —Exchange-traded funds 48,994,972 48,994,972 — —Rights 8,753 8,753 — —Securities lending collateral 38,516,467 38,516,467 — —Short-term investments 47,367,766 — 47,367,766 —
Total investments in securities $2,076,979,296 $346,254,104 $1,729,345,111 $1,380,081Other financial instruments:Futures $1,281,759 $1,281,759 — —
SIGNIFICANT ACCOUNTING POLICIES, CONTINUED
264
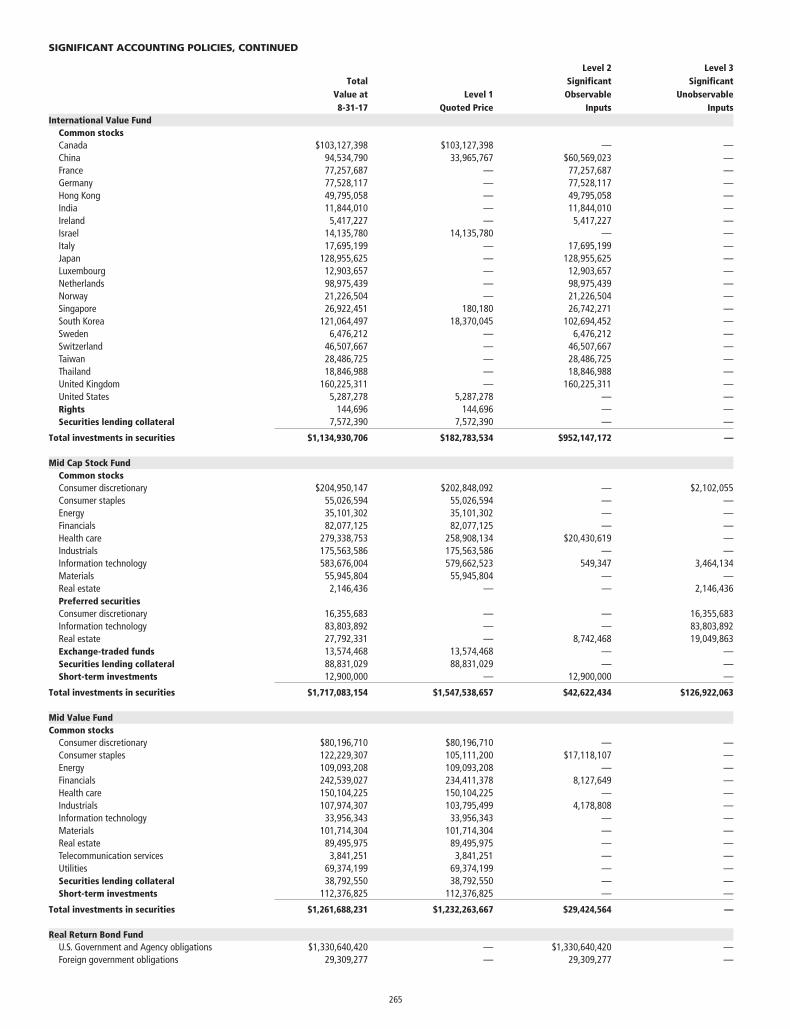
TotalValue at8-31-17
Level 1Quoted Price
Level 2SignificantObservable
Inputs
Level 3Significant
UnobservableInputs
International Value FundCommon stocksCanada $103,127,398 $103,127,398 — —China 94,534,790 33,965,767 $60,569,023 —France 77,257,687 — 77,257,687 —Germany 77,528,117 — 77,528,117 —Hong Kong 49,795,058 — 49,795,058 —India 11,844,010 — 11,844,010 —Ireland 5,417,227 — 5,417,227 —Israel 14,135,780 14,135,780 — —Italy 17,695,199 — 17,695,199 —Japan 128,955,625 — 128,955,625 —Luxembourg 12,903,657 — 12,903,657 —Netherlands 98,975,439 — 98,975,439 —Norway 21,226,504 — 21,226,504 —Singapore 26,922,451 180,180 26,742,271 —South Korea 121,064,497 18,370,045 102,694,452 —Sweden 6,476,212 — 6,476,212 —Switzerland 46,507,667 — 46,507,667 —Taiwan 28,486,725 — 28,486,725 —Thailand 18,846,988 — 18,846,988 —United Kingdom 160,225,311 — 160,225,311 —United States 5,287,278 5,287,278 — —Rights 144,696 144,696 — —Securities lending collateral 7,572,390 7,572,390 — —
Total investments in securities $1,134,930,706 $182,783,534 $952,147,172 —
Mid Cap Stock FundCommon stocksConsumer discretionary $204,950,147 $202,848,092 — $2,102,055Consumer staples 55,026,594 55,026,594 — —Energy 35,101,302 35,101,302 — —Financials 82,077,125 82,077,125 — —Health care 279,338,753 258,908,134 $20,430,619 —Industrials 175,563,586 175,563,586 — —Information technology 583,676,004 579,662,523 549,347 3,464,134Materials 55,945,804 55,945,804 — —Real estate 2,146,436 — — 2,146,436Preferred securitiesConsumer discretionary 16,355,683 — — 16,355,683Information technology 83,803,892 — — 83,803,892Real estate 27,792,331 — 8,742,468 19,049,863Exchange-traded funds 13,574,468 13,574,468 — —Securities lending collateral 88,831,029 88,831,029 — —Short-term investments 12,900,000 — 12,900,000 —
Total investments in securities $1,717,083,154 $1,547,538,657 $42,622,434 $126,922,063
Mid Value FundCommon stocks
Consumer discretionary $80,196,710 $80,196,710 — —Consumer staples 122,229,307 105,111,200 $17,118,107 —Energy 109,093,208 109,093,208 — —Financials 242,539,027 234,411,378 8,127,649 —Health care 150,104,225 150,104,225 — —Industrials 107,974,307 103,795,499 4,178,808 —Information technology 33,956,343 33,956,343 — —Materials 101,714,304 101,714,304 — —Real estate 89,495,975 89,495,975 — —Telecommunication services 3,841,251 3,841,251 — —Utilities 69,374,199 69,374,199 — —Securities lending collateral 38,792,550 38,792,550 — —Short-term investments 112,376,825 112,376,825 — —
Total investments in securities $1,261,688,231 $1,232,263,667 $29,424,564 —
Real Return Bond FundU.S. Government and Agency obligations $1,330,640,420 — $1,330,640,420 —Foreign government obligations 29,309,277 — 29,309,277 —
SIGNIFICANT ACCOUNTING POLICIES, CONTINUED
265
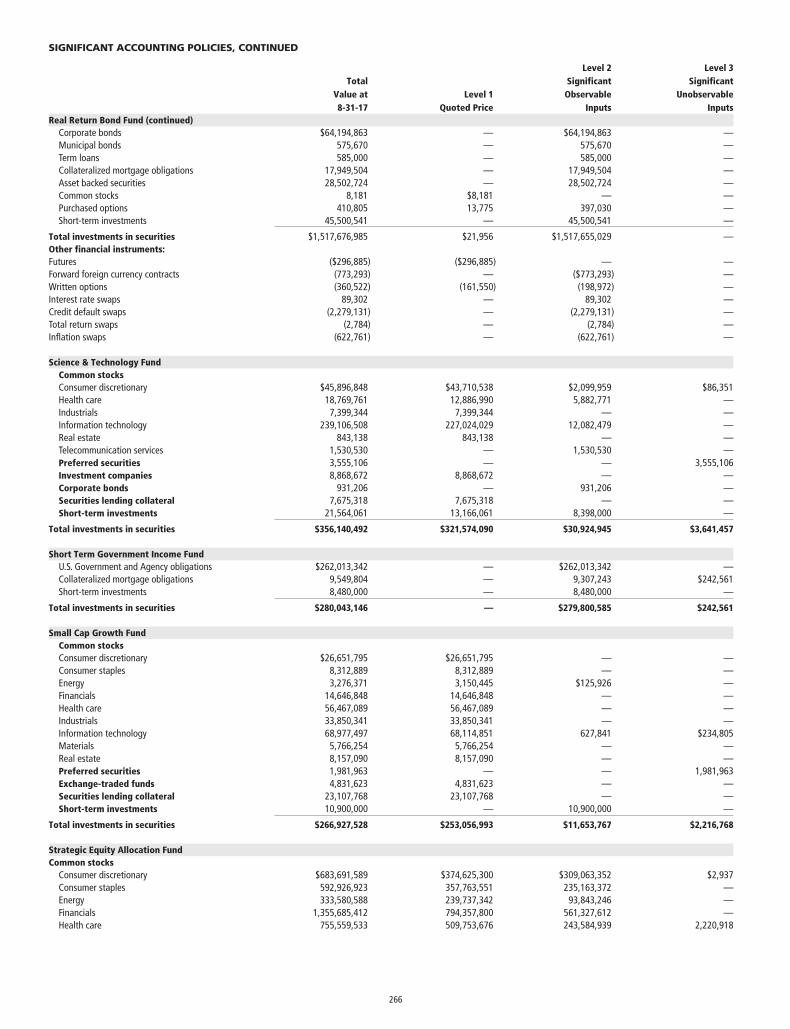
TotalValue at8-31-17
Level 1Quoted Price
Level 2SignificantObservable
Inputs
Level 3Significant
UnobservableInputs
Real Return Bond Fund (continued)Corporate bonds $64,194,863 — $64,194,863 —Municipal bonds 575,670 — 575,670 —Term loans 585,000 — 585,000 —Collateralized mortgage obligations 17,949,504 — 17,949,504 —Asset backed securities 28,502,724 — 28,502,724 —Common stocks 8,181 $8,181 — —Purchased options 410,805 13,775 397,030 —Short-term investments 45,500,541 — 45,500,541 —
Total investments in securities $1,517,676,985 $21,956 $1,517,655,029 —Other financial instruments:Futures ($296,885) ($296,885) — —Forward foreign currency contracts (773,293) — ($773,293) —Written options (360,522) (161,550) (198,972) —Interest rate swaps 89,302 — 89,302 —Credit default swaps (2,279,131) — (2,279,131) —Total return swaps (2,784) — (2,784) —Inflation swaps (622,761) — (622,761) —
Science & Technology FundCommon stocksConsumer discretionary $45,896,848 $43,710,538 $2,099,959 $86,351Health care 18,769,761 12,886,990 5,882,771 —Industrials 7,399,344 7,399,344 — —Information technology 239,106,508 227,024,029 12,082,479 —Real estate 843,138 843,138 — —Telecommunication services 1,530,530 — 1,530,530 —Preferred securities 3,555,106 — — 3,555,106Investment companies 8,868,672 8,868,672 — —Corporate bonds 931,206 — 931,206 —Securities lending collateral 7,675,318 7,675,318 — —Short-term investments 21,564,061 13,166,061 8,398,000 —
Total investments in securities $356,140,492 $321,574,090 $30,924,945 $3,641,457
Short Term Government Income FundU.S. Government and Agency obligations $262,013,342 — $262,013,342 —Collateralized mortgage obligations 9,549,804 — 9,307,243 $242,561Short-term investments 8,480,000 — 8,480,000 —
Total investments in securities $280,043,146 — $279,800,585 $242,561
Small Cap Growth FundCommon stocksConsumer discretionary $26,651,795 $26,651,795 — —Consumer staples 8,312,889 8,312,889 — —Energy 3,276,371 3,150,445 $125,926 —Financials 14,646,848 14,646,848 — —Health care 56,467,089 56,467,089 — —Industrials 33,850,341 33,850,341 — —Information technology 68,977,497 68,114,851 627,841 $234,805Materials 5,766,254 5,766,254 — —Real estate 8,157,090 8,157,090 — —Preferred securities 1,981,963 — — 1,981,963Exchange-traded funds 4,831,623 4,831,623 — —Securities lending collateral 23,107,768 23,107,768 — —Short-term investments 10,900,000 — 10,900,000 —
Total investments in securities $266,927,528 $253,056,993 $11,653,767 $2,216,768
Strategic Equity Allocation FundCommon stocks
Consumer discretionary $683,691,589 $374,625,300 $309,063,352 $2,937Consumer staples 592,926,923 357,763,551 235,163,372 —Energy 333,580,588 239,737,342 93,843,246 —Financials 1,355,685,412 794,357,800 561,327,612 —Health care 755,559,533 509,753,676 243,584,939 2,220,918
SIGNIFICANT ACCOUNTING POLICIES, CONTINUED
266
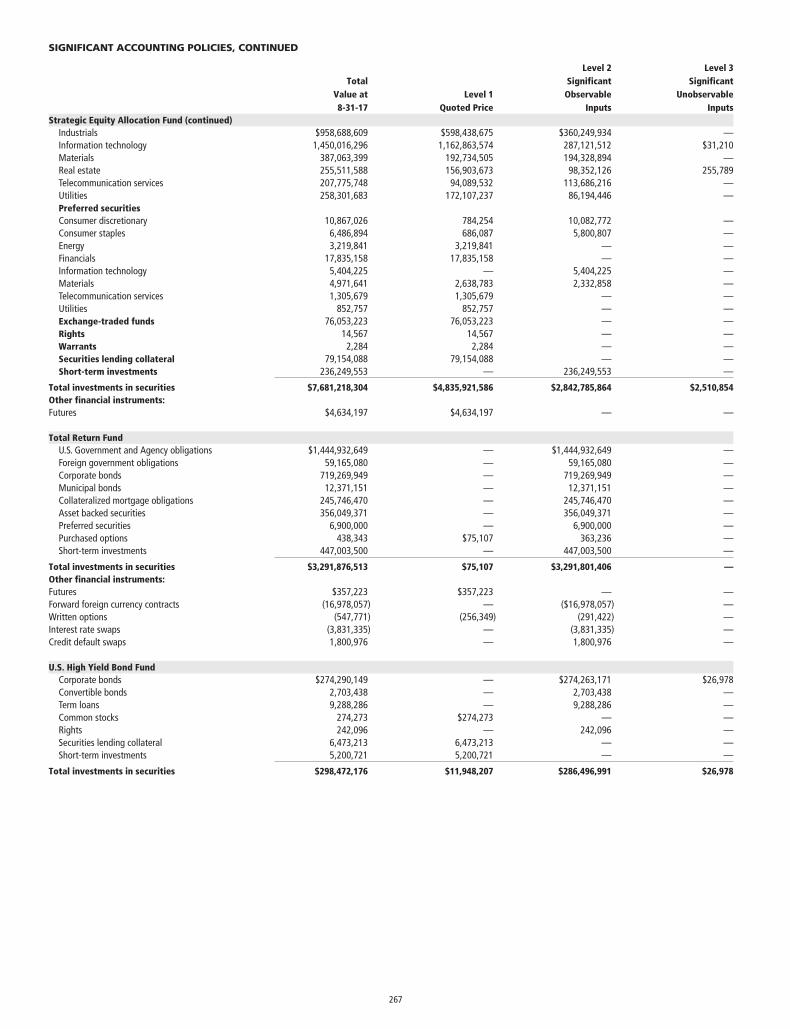
TotalValue at8-31-17
Level 1Quoted Price
Level 2SignificantObservable
Inputs
Level 3Significant
UnobservableInputs
Strategic Equity Allocation Fund (continued)Industrials $958,688,609 $598,438,675 $360,249,934 —Information technology 1,450,016,296 1,162,863,574 287,121,512 $31,210Materials 387,063,399 192,734,505 194,328,894 —Real estate 255,511,588 156,903,673 98,352,126 255,789Telecommunication services 207,775,748 94,089,532 113,686,216 —Utilities 258,301,683 172,107,237 86,194,446 —Preferred securitiesConsumer discretionary 10,867,026 784,254 10,082,772 —Consumer staples 6,486,894 686,087 5,800,807 —Energy 3,219,841 3,219,841 — —Financials 17,835,158 17,835,158 — —Information technology 5,404,225 — 5,404,225 —Materials 4,971,641 2,638,783 2,332,858 —Telecommunication services 1,305,679 1,305,679 — —Utilities 852,757 852,757 — —Exchange-traded funds 76,053,223 76,053,223 — —Rights 14,567 14,567 — —Warrants 2,284 2,284 — —Securities lending collateral 79,154,088 79,154,088 — —Short-term investments 236,249,553 — 236,249,553 —
Total investments in securities $7,681,218,304 $4,835,921,586 $2,842,785,864 $2,510,854Other financial instruments:Futures $4,634,197 $4,634,197 — —
Total Return FundU.S. Government and Agency obligations $1,444,932,649 — $1,444,932,649 —Foreign government obligations 59,165,080 — 59,165,080 —Corporate bonds 719,269,949 — 719,269,949 —Municipal bonds 12,371,151 — 12,371,151 —Collateralized mortgage obligations 245,746,470 — 245,746,470 —Asset backed securities 356,049,371 — 356,049,371 —Preferred securities 6,900,000 — 6,900,000 —Purchased options 438,343 $75,107 363,236 —Short-term investments 447,003,500 — 447,003,500 —
Total investments in securities $3,291,876,513 $75,107 $3,291,801,406 —Other financial instruments:Futures $357,223 $357,223 — —Forward foreign currency contracts (16,978,057) — ($16,978,057) —Written options (547,771) (256,349) (291,422) —Interest rate swaps (3,831,335) — (3,831,335) —Credit default swaps 1,800,976 — 1,800,976 —
U.S. High Yield Bond FundCorporate bonds $274,290,149 — $274,263,171 $26,978Convertible bonds 2,703,438 — 2,703,438 —Term loans 9,288,286 — 9,288,286 —Common stocks 274,273 $274,273 — —Rights 242,096 — 242,096 —Securities lending collateral 6,473,213 6,473,213 — —Short-term investments 5,200,721 5,200,721 — —
Total investments in securities $298,472,176 $11,948,207 $286,496,991 $26,978
SIGNIFICANT ACCOUNTING POLICIES, CONTINUED
267
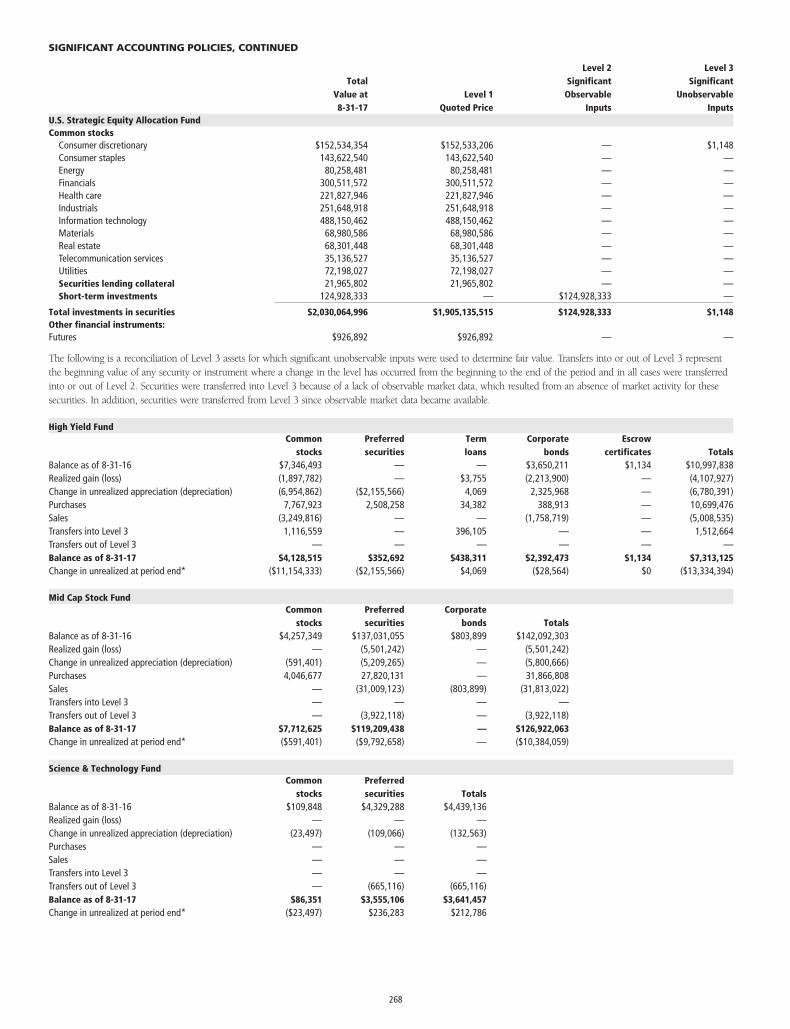
TotalValue at8-31-17
Level 1Quoted Price
Level 2SignificantObservable
Inputs
Level 3Significant
UnobservableInputs
U.S. Strategic Equity Allocation FundCommon stocks
Consumer discretionary $152,534,354 $152,533,206 — $1,148Consumer staples 143,622,540 143,622,540 — —Energy 80,258,481 80,258,481 — —Financials 300,511,572 300,511,572 — —Health care 221,827,946 221,827,946 — —Industrials 251,648,918 251,648,918 — —Information technology 488,150,462 488,150,462 — —Materials 68,980,586 68,980,586 — —Real estate 68,301,448 68,301,448 — —Telecommunication services 35,136,527 35,136,527 — —Utilities 72,198,027 72,198,027 — —Securities lending collateral 21,965,802 21,965,802 — —Short-term investments 124,928,333 — $124,928,333 —
Total investments in securities $2,030,064,996 $1,905,135,515 $124,928,333 $1,148Other financial instruments:Futures $926,892 $926,892 — —
The following is a reconciliation of Level 3 assets for which significant unobservable inputs were used to determine fair value. Transfers into or out of Level 3 representthe beginning value of any security or instrument where a change in the level has occurred from the beginning to the end of the period and in all cases were transferredinto or out of Level 2. Securities were transferred into Level 3 because of a lack of observable market data, which resulted from an absence of market activity for thesesecurities. In addition, securities were transferred from Level 3 since observable market data became available.
High Yield FundCommon
stocksPreferredsecurities
Termloans
Corporatebonds
Escrowcertificates Totals
Balance as of 8-31-16 $7,346,493 — — $3,650,211 $1,134 $10,997,838Realized gain (loss) (1,897,782) — $3,755 (2,213,900) — (4,107,927)Change in unrealized appreciation (depreciation) (6,954,862) ($2,155,566) 4,069 2,325,968 — (6,780,391)Purchases 7,767,923 2,508,258 34,382 388,913 — 10,699,476Sales (3,249,816) — — (1,758,719) — (5,008,535)Transfers into Level 3 1,116,559 — 396,105 — — 1,512,664Transfers out of Level 3 — — — — — —Balance as of 8-31-17 $4,128,515 $352,692 $438,311 $2,392,473 $1,134 $7,313,125Change in unrealized at period end* ($11,154,333) ($2,155,566) $4,069 ($28,564) $0 ($13,334,394)
Mid Cap Stock FundCommon
stocksPreferredsecurities
Corporatebonds Totals
Balance as of 8-31-16 $4,257,349 $137,031,055 $803,899 $142,092,303Realized gain (loss) — (5,501,242) — (5,501,242)Change in unrealized appreciation (depreciation) (591,401) (5,209,265) — (5,800,666)Purchases 4,046,677 27,820,131 — 31,866,808Sales — (31,009,123) (803,899) (31,813,022)Transfers into Level 3 — — — —Transfers out of Level 3 — (3,922,118) — (3,922,118)Balance as of 8-31-17 $7,712,625 $119,209,438 — $126,922,063Change in unrealized at period end* ($591,401) ($9,792,658) — ($10,384,059)
Science & Technology FundCommon
stocksPreferredsecurities Totals
Balance as of 8-31-16 $109,848 $4,329,288 $4,439,136Realized gain (loss) — — —Change in unrealized appreciation (depreciation) (23,497) (109,066) (132,563)Purchases — — —Sales — — —Transfers into Level 3 — — —Transfers out of Level 3 — (665,116) (665,116)Balance as of 8-31-17 $86,351 $3,555,106 $3,641,457Change in unrealized at period end* ($23,497) $236,283 $212,786
SIGNIFICANT ACCOUNTING POLICIES, CONTINUED
268
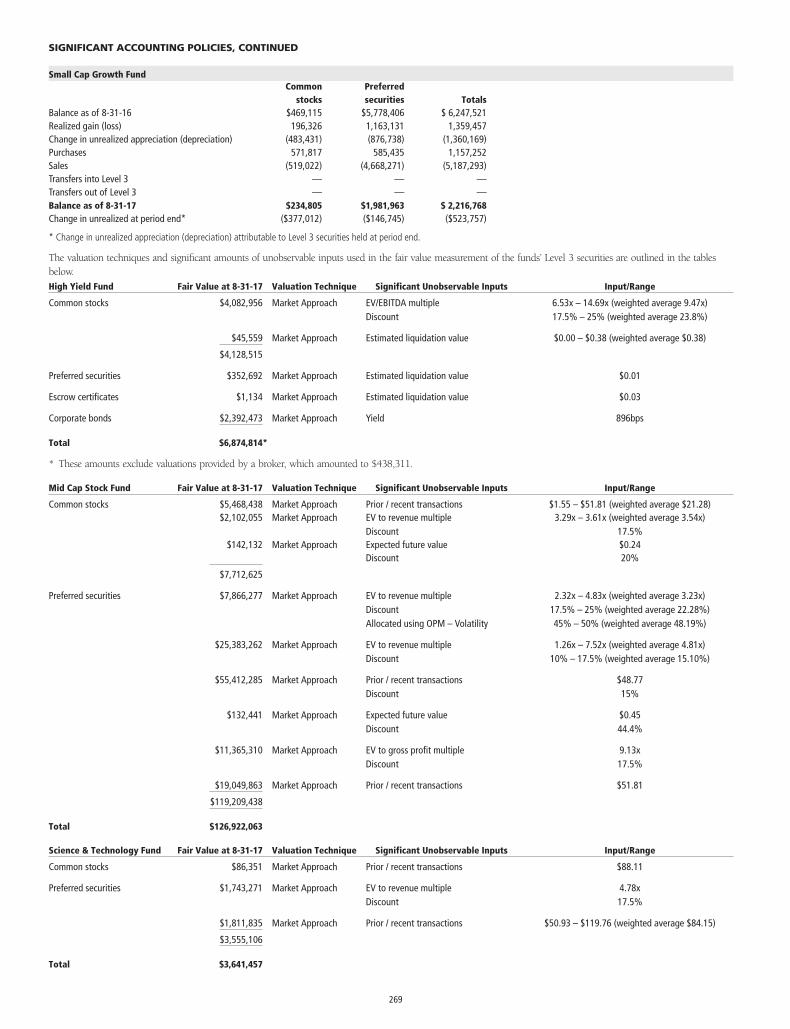
Small Cap Growth FundCommon
stocksPreferredsecurities Totals
Balance as of 8-31-16 $469,115 $5,778,406 $ 6,247,521Realized gain (loss) 196,326 1,163,131 1,359,457Change in unrealized appreciation (depreciation) (483,431) (876,738) (1,360,169)Purchases 571,817 585,435 1,157,252Sales (519,022) (4,668,271) (5,187,293)Transfers into Level 3 — — —Transfers out of Level 3 — — —Balance as of 8-31-17 $234,805 $1,981,963 $ 2,216,768Change in unrealized at period end* ($377,012) ($146,745) ($523,757)
* Change in unrealized appreciation (depreciation) attributable to Level 3 securities held at period end.
The valuation techniques and significant amounts of unobservable inputs used in the fair value measurement of the funds’ Level 3 securities are outlined in the tablesbelow.
High Yield Fund Fair Value at 8-31-17 Valuation Technique Significant Unobservable Inputs Input/Range
Common stocks $4,082,956 Market Approach EV/EBITDA multipleDiscount
6.53x – 14.69x (weighted average 9.47x)17.5% – 25% (weighted average 23.8%)
$45,559 Market Approach Estimated liquidation value $0.00 – $0.38 (weighted average $0.38)
$4,128,515
Preferred securities $352,692 Market Approach Estimated liquidation value $0.01
Escrow certificates $1,134 Market Approach Estimated liquidation value $0.03
Corporate bonds $2,392,473 Market Approach Yield 896bps
Total $6,874,814*
* These amounts exclude valuations provided by a broker, which amounted to $438,311.
Mid Cap Stock Fund Fair Value at 8-31-17 Valuation Technique Significant Unobservable Inputs Input/Range
Common stocks $5,468,438 Market Approach Prior / recent transactions $1.55 – $51.81 (weighted average $21.28)$2,102,055 Market Approach EV to revenue multiple
Discount3.29x – 3.61x (weighted average 3.54x)
17.5%$142,132 Market Approach Expected future value $0.24
Discount 20%
$7,712,625
Preferred securities $7,866,277 Market Approach EV to revenue multipleDiscountAllocated using OPM – Volatility
2.32x – 4.83x (weighted average 3.23x)17.5% – 25% (weighted average 22.28%)45% – 50% (weighted average 48.19%)
$25,383,262 Market Approach EV to revenue multipleDiscount
1.26x – 7.52x (weighted average 4.81x)10% – 17.5% (weighted average 15.10%)
$55,412,285 Market Approach Prior / recent transactionsDiscount
$48.7715%
$132,441 Market Approach Expected future valueDiscount
$0.4544.4%
$11,365,310 Market Approach EV to gross profit multipleDiscount
9.13x17.5%
$19,049,863 Market Approach Prior / recent transactions $51.81
$119,209,438
Total $126,922,063
Science & Technology Fund Fair Value at 8-31-17 Valuation Technique Significant Unobservable Inputs Input/Range
Common stocks $86,351 Market Approach Prior / recent transactions $88.11
Preferred securities $1,743,271 Market Approach EV to revenue multipleDiscount
4.78x17.5%
$1,811,835 Market Approach Prior / recent transactions $50.93 – $119.76 (weighted average $84.15)
$3,555,106
Total $3,641,457
SIGNIFICANT ACCOUNTING POLICIES, CONTINUED
269
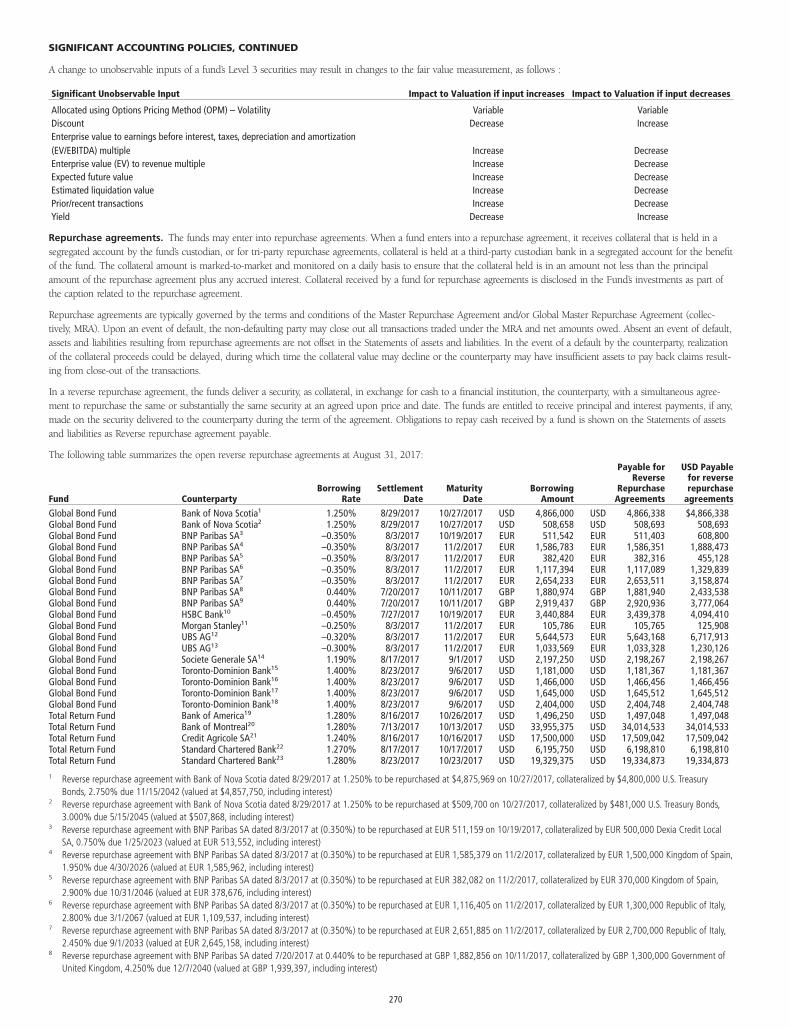
A change to unobservable inputs of a fund’s Level 3 securities may result in changes to the fair value measurement, as follows :
Significant Unobservable Input Impact to Valuation if input increases Impact to Valuation if input decreases
Allocated using Options Pricing Method (OPM) – Volatility Variable VariableDiscount Decrease IncreaseEnterprise value to earnings before interest, taxes, depreciation and amortization(EV/EBITDA) multiple Increase DecreaseEnterprise value (EV) to revenue multiple Increase DecreaseExpected future value Increase DecreaseEstimated liquidation value Increase DecreasePrior/recent transactions Increase DecreaseYield Decrease Increase
Repurchase agreements. The funds may enter into repurchase agreements. When a fund enters into a repurchase agreement, it receives collateral that is held in asegregated account by the fund’s custodian, or for tri-party repurchase agreements, collateral is held at a third-party custodian bank in a segregated account for the benefitof the fund. The collateral amount is marked-to-market and monitored on a daily basis to ensure that the collateral held is in an amount not less than the principalamount of the repurchase agreement plus any accrued interest. Collateral received by a fund for repurchase agreements is disclosed in the Fund’s investments as part ofthe caption related to the repurchase agreement.
Repurchase agreements are typically governed by the terms and conditions of the Master Repurchase Agreement and/or Global Master Repurchase Agreement (collec-tively, MRA). Upon an event of default, the non-defaulting party may close out all transactions traded under the MRA and net amounts owed. Absent an event of default,assets and liabilities resulting from repurchase agreements are not offset in the Statements of assets and liabilities. In the event of a default by the counterparty, realizationof the collateral proceeds could be delayed, during which time the collateral value may decline or the counterparty may have insufficient assets to pay back claims result-ing from close-out of the transactions.
In a reverse repurchase agreement, the funds deliver a security, as collateral, in exchange for cash to a financial institution, the counterparty, with a simultaneous agree-ment to repurchase the same or substantially the same security at an agreed upon price and date. The funds are entitled to receive principal and interest payments, if any,made on the security delivered to the counterparty during the term of the agreement. Obligations to repay cash received by a fund is shown on the Statements of assetsand liabilities as Reverse repurchase agreement payable.
The following table summarizes the open reverse repurchase agreements at August 31, 2017:
Fund CounterpartyBorrowing
RateSettlement
DateMaturity
DateBorrowing
Amount
Payable forReverse
RepurchaseAgreements
USD Payablefor reverserepurchase
agreements
Global Bond Fund Bank of Nova Scotia1 1.250% 8/29/2017 10/27/2017 USD 4,866,000 USD 4,866,338 $4,866,338Global Bond Fund Bank of Nova Scotia2 1.250% 8/29/2017 10/27/2017 USD 508,658 USD 508,693 508,693Global Bond Fund BNP Paribas SA3 –0.350% 8/3/2017 10/19/2017 EUR 511,542 EUR 511,403 608,800Global Bond Fund BNP Paribas SA4 –0.350% 8/3/2017 11/2/2017 EUR 1,586,783 EUR 1,586,351 1,888,473Global Bond Fund BNP Paribas SA5 –0.350% 8/3/2017 11/2/2017 EUR 382,420 EUR 382,316 455,128Global Bond Fund BNP Paribas SA6 –0.350% 8/3/2017 11/2/2017 EUR 1,117,394 EUR 1,117,089 1,329,839Global Bond Fund BNP Paribas SA7 –0.350% 8/3/2017 11/2/2017 EUR 2,654,233 EUR 2,653,511 3,158,874Global Bond Fund BNP Paribas SA8 0.440% 7/20/2017 10/11/2017 GBP 1,880,974 GBP 1,881,940 2,433,538Global Bond Fund BNP Paribas SA9 0.440% 7/20/2017 10/11/2017 GBP 2,919,437 GBP 2,920,936 3,777,064Global Bond Fund HSBC Bank10 –0.450% 7/27/2017 10/19/2017 EUR 3,440,884 EUR 3,439,378 4,094,410Global Bond Fund Morgan Stanley11 –0.250% 8/3/2017 11/2/2017 EUR 105,786 EUR 105,765 125,908Global Bond Fund UBS AG12 –0.320% 8/3/2017 11/2/2017 EUR 5,644,573 EUR 5,643,168 6,717,913Global Bond Fund UBS AG13 –0.300% 8/3/2017 11/2/2017 EUR 1,033,569 EUR 1,033,328 1,230,126Global Bond Fund Societe Generale SA14 1.190% 8/17/2017 9/1/2017 USD 2,197,250 USD 2,198,267 2,198,267Global Bond Fund Toronto-Dominion Bank15 1.400% 8/23/2017 9/6/2017 USD 1,181,000 USD 1,181,367 1,181,367Global Bond Fund Toronto-Dominion Bank16 1.400% 8/23/2017 9/6/2017 USD 1,466,000 USD 1,466,456 1,466,456Global Bond Fund Toronto-Dominion Bank17 1.400% 8/23/2017 9/6/2017 USD 1,645,000 USD 1,645,512 1,645,512Global Bond Fund Toronto-Dominion Bank18 1.400% 8/23/2017 9/6/2017 USD 2,404,000 USD 2,404,748 2,404,748Total Return Fund Bank of America19 1.280% 8/16/2017 10/26/2017 USD 1,496,250 USD 1,497,048 1,497,048Total Return Fund Bank of Montreal20 1.280% 7/13/2017 10/13/2017 USD 33,955,375 USD 34,014,533 34,014,533Total Return Fund Credit Agricole SA21 1.240% 8/16/2017 10/16/2017 USD 17,500,000 USD 17,509,042 17,509,042Total Return Fund Standard Chartered Bank22 1.270% 8/17/2017 10/17/2017 USD 6,195,750 USD 6,198,810 6,198,810Total Return Fund Standard Chartered Bank23 1.280% 8/23/2017 10/23/2017 USD 19,329,375 USD 19,334,873 19,334,8731 Reverse repurchase agreement with Bank of Nova Scotia dated 8/29/2017 at 1.250% to be repurchased at $4,875,969 on 10/27/2017, collateralized by $4,800,000 U.S. Treasury
Bonds, 2.750% due 11/15/2042 (valued at $4,857,750, including interest)2 Reverse repurchase agreement with Bank of Nova Scotia dated 8/29/2017 at 1.250% to be repurchased at $509,700 on 10/27/2017, collateralized by $481,000 U.S. Treasury Bonds,
3.000% due 5/15/2045 (valued at $507,868, including interest)3 Reverse repurchase agreement with BNP Paribas SA dated 8/3/2017 at (0.350%) to be repurchased at EUR 511,159 on 10/19/2017, collateralized by EUR 500,000 Dexia Credit Local
SA, 0.750% due 1/25/2023 (valued at EUR 513,552, including interest)4 Reverse repurchase agreement with BNP Paribas SA dated 8/3/2017 at (0.350%) to be repurchased at EUR 1,585,379 on 11/2/2017, collateralized by EUR 1,500,000 Kingdom of Spain,
1.950% due 4/30/2026 (valued at EUR 1,585,962, including interest)5 Reverse repurchase agreement with BNP Paribas SA dated 8/3/2017 at (0.350%) to be repurchased at EUR 382,082 on 11/2/2017, collateralized by EUR 370,000 Kingdom of Spain,
2.900% due 10/31/2046 (valued at EUR 378,676, including interest)6 Reverse repurchase agreement with BNP Paribas SA dated 8/3/2017 at (0.350%) to be repurchased at EUR 1,116,405 on 11/2/2017, collateralized by EUR 1,300,000 Republic of Italy,
2.800% due 3/1/2067 (valued at EUR 1,109,537, including interest)7 Reverse repurchase agreement with BNP Paribas SA dated 8/3/2017 at (0.350%) to be repurchased at EUR 2,651,885 on 11/2/2017, collateralized by EUR 2,700,000 Republic of Italy,
2.450% due 9/1/2033 (valued at EUR 2,645,158, including interest)8 Reverse repurchase agreement with BNP Paribas SA dated 7/20/2017 at 0.440% to be repurchased at GBP 1,882,856 on 10/11/2017, collateralized by GBP 1,300,000 Government of
United Kingdom, 4.250% due 12/7/2040 (valued at GBP 1,939,397, including interest)
SIGNIFICANT ACCOUNTING POLICIES, CONTINUED
270
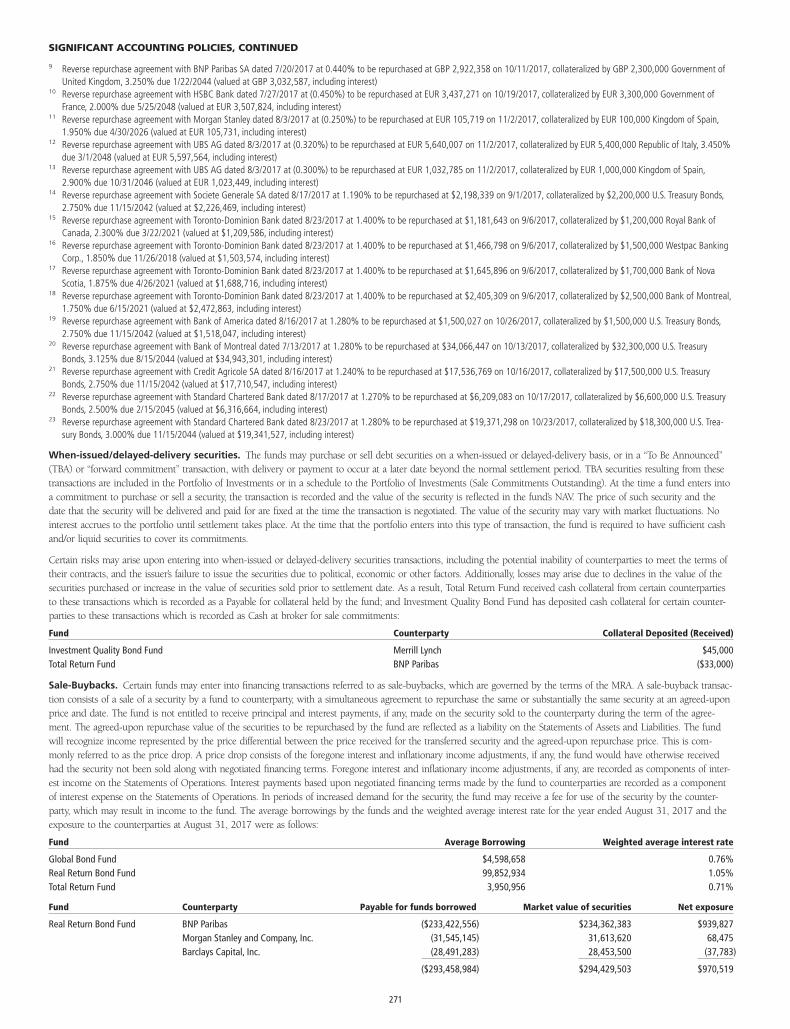
9 Reverse repurchase agreement with BNP Paribas SA dated 7/20/2017 at 0.440% to be repurchased at GBP 2,922,358 on 10/11/2017, collateralized by GBP 2,300,000 Government ofUnited Kingdom, 3.250% due 1/22/2044 (valued at GBP 3,032,587, including interest)
10 Reverse repurchase agreement with HSBC Bank dated 7/27/2017 at (0.450%) to be repurchased at EUR 3,437,271 on 10/19/2017, collateralized by EUR 3,300,000 Government ofFrance, 2.000% due 5/25/2048 (valued at EUR 3,507,824, including interest)
11 Reverse repurchase agreement with Morgan Stanley dated 8/3/2017 at (0.250%) to be repurchased at EUR 105,719 on 11/2/2017, collateralized by EUR 100,000 Kingdom of Spain,1.950% due 4/30/2026 (valued at EUR 105,731, including interest)
12 Reverse repurchase agreement with UBS AG dated 8/3/2017 at (0.320%) to be repurchased at EUR 5,640,007 on 11/2/2017, collateralized by EUR 5,400,000 Republic of Italy, 3.450%due 3/1/2048 (valued at EUR 5,597,564, including interest)
13 Reverse repurchase agreement with UBS AG dated 8/3/2017 at (0.300%) to be repurchased at EUR 1,032,785 on 11/2/2017, collateralized by EUR 1,000,000 Kingdom of Spain,2.900% due 10/31/2046 (valued at EUR 1,023,449, including interest)
14 Reverse repurchase agreement with Societe Generale SA dated 8/17/2017 at 1.190% to be repurchased at $2,198,339 on 9/1/2017, collateralized by $2,200,000 U.S. Treasury Bonds,2.750% due 11/15/2042 (valued at $2,226,469, including interest)
15 Reverse repurchase agreement with Toronto-Dominion Bank dated 8/23/2017 at 1.400% to be repurchased at $1,181,643 on 9/6/2017, collateralized by $1,200,000 Royal Bank ofCanada, 2.300% due 3/22/2021 (valued at $1,209,586, including interest)
16 Reverse repurchase agreement with Toronto-Dominion Bank dated 8/23/2017 at 1.400% to be repurchased at $1,466,798 on 9/6/2017, collateralized by $1,500,000 Westpac BankingCorp., 1.850% due 11/26/2018 (valued at $1,503,574, including interest)
17 Reverse repurchase agreement with Toronto-Dominion Bank dated 8/23/2017 at 1.400% to be repurchased at $1,645,896 on 9/6/2017, collateralized by $1,700,000 Bank of NovaScotia, 1.875% due 4/26/2021 (valued at $1,688,716, including interest)
18 Reverse repurchase agreement with Toronto-Dominion Bank dated 8/23/2017 at 1.400% to be repurchased at $2,405,309 on 9/6/2017, collateralized by $2,500,000 Bank of Montreal,1.750% due 6/15/2021 (valued at $2,472,863, including interest)
19 Reverse repurchase agreement with Bank of America dated 8/16/2017 at 1.280% to be repurchased at $1,500,027 on 10/26/2017, collateralized by $1,500,000 U.S. Treasury Bonds,2.750% due 11/15/2042 (valued at $1,518,047, including interest)
20 Reverse repurchase agreement with Bank of Montreal dated 7/13/2017 at 1.280% to be repurchased at $34,066,447 on 10/13/2017, collateralized by $32,300,000 U.S. TreasuryBonds, 3.125% due 8/15/2044 (valued at $34,943,301, including interest)
21 Reverse repurchase agreement with Credit Agricole SA dated 8/16/2017 at 1.240% to be repurchased at $17,536,769 on 10/16/2017, collateralized by $17,500,000 U.S. TreasuryBonds, 2.750% due 11/15/2042 (valued at $17,710,547, including interest)
22 Reverse repurchase agreement with Standard Chartered Bank dated 8/17/2017 at 1.270% to be repurchased at $6,209,083 on 10/17/2017, collateralized by $6,600,000 U.S. TreasuryBonds, 2.500% due 2/15/2045 (valued at $6,316,664, including interest)
23 Reverse repurchase agreement with Standard Chartered Bank dated 8/23/2017 at 1.280% to be repurchased at $19,371,298 on 10/23/2017, collateralized by $18,300,000 U.S. Trea-sury Bonds, 3.000% due 11/15/2044 (valued at $19,341,527, including interest)
When-issued/delayed-delivery securities. The funds may purchase or sell debt securities on a when-issued or delayed-delivery basis, or in a “To Be Announced”(TBA) or “forward commitment” transaction, with delivery or payment to occur at a later date beyond the normal settlement period. TBA securities resulting from thesetransactions are included in the Portfolio of Investments or in a schedule to the Portfolio of Investments (Sale Commitments Outstanding). At the time a fund enters intoa commitment to purchase or sell a security, the transaction is recorded and the value of the security is reflected in the fund’s NAV. The price of such security and thedate that the security will be delivered and paid for are fixed at the time the transaction is negotiated. The value of the security may vary with market fluctuations. Nointerest accrues to the portfolio until settlement takes place. At the time that the portfolio enters into this type of transaction, the fund is required to have sufficient cashand/or liquid securities to cover its commitments.
Certain risks may arise upon entering into when-issued or delayed-delivery securities transactions, including the potential inability of counterparties to meet the terms oftheir contracts, and the issuer’s failure to issue the securities due to political, economic or other factors. Additionally, losses may arise due to declines in the value of thesecurities purchased or increase in the value of securities sold prior to settlement date. As a result, Total Return Fund received cash collateral from certain counterpartiesto these transactions which is recorded as a Payable for collateral held by the fund; and Investment Quality Bond Fund has deposited cash collateral for certain counter-parties to these transactions which is recorded as Cash at broker for sale commitments:
Fund Counterparty Collateral Deposited (Received)
Investment Quality Bond Fund Merrill Lynch $45,000Total Return Fund BNP Paribas ($33,000)
Sale-Buybacks. Certain funds may enter into financing transactions referred to as sale-buybacks, which are governed by the terms of the MRA. A sale-buyback transac-tion consists of a sale of a security by a fund to counterparty, with a simultaneous agreement to repurchase the same or substantially the same security at an agreed-uponprice and date. The fund is not entitled to receive principal and interest payments, if any, made on the security sold to the counterparty during the term of the agree-ment. The agreed-upon repurchase value of the securities to be repurchased by the fund are reflected as a liability on the Statements of Assets and Liabilities. The fundwill recognize income represented by the price differential between the price received for the transferred security and the agreed-upon repurchase price. This is com-monly referred to as the price drop. A price drop consists of the foregone interest and inflationary income adjustments, if any, the fund would have otherwise receivedhad the security not been sold along with negotiated financing terms. Foregone interest and inflationary income adjustments, if any, are recorded as components of inter-est income on the Statements of Operations. Interest payments based upon negotiated financing terms made by the fund to counterparties are recorded as a componentof interest expense on the Statements of Operations. In periods of increased demand for the security, the fund may receive a fee for use of the security by the counter-party, which may result in income to the fund. The average borrowings by the funds and the weighted average interest rate for the year ended August 31, 2017 and theexposure to the counterparties at August 31, 2017 were as follows:
Fund Average Borrowing Weighted average interest rate
Global Bond Fund $4,598,658 0.76%Real Return Bond Fund 99,852,934 1.05%Total Return Fund 3,950,956 0.71%
Fund Counterparty Payable for funds borrowed Market value of securities Net exposure
Real Return Bond Fund BNP Paribas ($233,422,556) $234,362,383 $939,827Morgan Stanley and Company, Inc. (31,545,145) 31,613,620 68,475Barclays Capital, Inc. (28,491,283) 28,453,500 (37,783)
($293,458,984) $294,429,503 $970,519
SIGNIFICANT ACCOUNTING POLICIES, CONTINUED
271
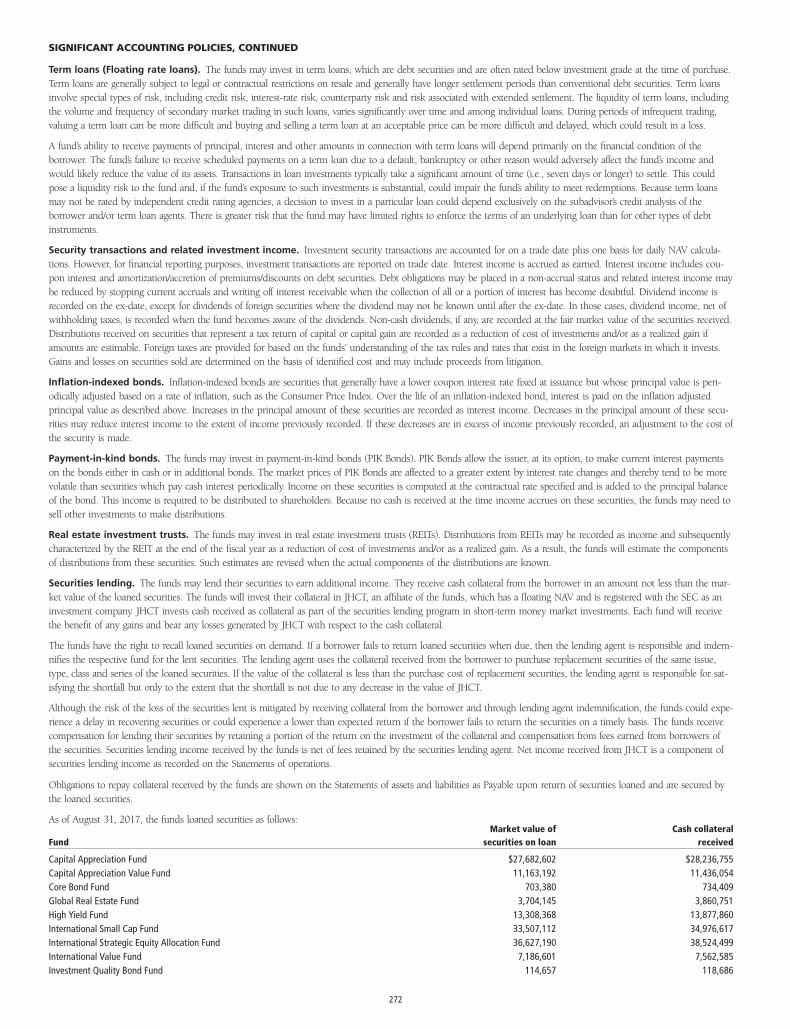
Term loans (Floating rate loans). The funds may invest in term loans, which are debt securities and are often rated below investment grade at the time of purchase.Term loans are generally subject to legal or contractual restrictions on resale and generally have longer settlement periods than conventional debt securities. Term loansinvolve special types of risk, including credit risk, interest-rate risk, counterparty risk and risk associated with extended settlement. The liquidity of term loans, includingthe volume and frequency of secondary market trading in such loans, varies significantly over time and among individual loans. During periods of infrequent trading,valuing a term loan can be more difficult and buying and selling a term loan at an acceptable price can be more difficult and delayed, which could result in a loss.
A fund’s ability to receive payments of principal, interest and other amounts in connection with term loans will depend primarily on the financial condition of theborrower. The fund’s failure to receive scheduled payments on a term loan due to a default, bankruptcy or other reason would adversely affect the fund’s income andwould likely reduce the value of its assets. Transactions in loan investments typically take a significant amount of time (i.e., seven days or longer) to settle. This couldpose a liquidity risk to the fund and, if the fund’s exposure to such investments is substantial, could impair the fund’s ability to meet redemptions. Because term loansmay not be rated by independent credit rating agencies, a decision to invest in a particular loan could depend exclusively on the subadvisor’s credit analysis of theborrower and/or term loan agents. There is greater risk that the fund may have limited rights to enforce the terms of an underlying loan than for other types of debtinstruments.
Security transactions and related investment income. Investment security transactions are accounted for on a trade date plus one basis for daily NAV calcula-tions. However, for financial reporting purposes, investment transactions are reported on trade date. Interest income is accrued as earned. Interest income includes cou-pon interest and amortization/accretion of premiums/discounts on debt securities. Debt obligations may be placed in a non-accrual status and related interest income maybe reduced by stopping current accruals and writing off interest receivable when the collection of all or a portion of interest has become doubtful. Dividend income isrecorded on the ex-date, except for dividends of foreign securities where the dividend may not be known until after the ex-date. In those cases, dividend income, net ofwithholding taxes, is recorded when the fund becomes aware of the dividends. Non-cash dividends, if any, are recorded at the fair market value of the securities received.Distributions received on securities that represent a tax return of capital or capital gain are recorded as a reduction of cost of investments and/or as a realized gain ifamounts are estimable. Foreign taxes are provided for based on the funds’ understanding of the tax rules and rates that exist in the foreign markets in which it invests.Gains and losses on securities sold are determined on the basis of identified cost and may include proceeds from litigation.
Inflation-indexed bonds. Inflation-indexed bonds are securities that generally have a lower coupon interest rate fixed at issuance but whose principal value is peri-odically adjusted based on a rate of inflation, such as the Consumer Price Index. Over the life of an inflation-indexed bond, interest is paid on the inflation adjustedprincipal value as described above. Increases in the principal amount of these securities are recorded as interest income. Decreases in the principal amount of these secu-rities may reduce interest income to the extent of income previously recorded. If these decreases are in excess of income previously recorded, an adjustment to the cost ofthe security is made.
Payment-in-kind bonds. The funds may invest in payment-in-kind bonds (PIK Bonds). PIK Bonds allow the issuer, at its option, to make current interest paymentson the bonds either in cash or in additional bonds. The market prices of PIK Bonds are affected to a greater extent by interest rate changes and thereby tend to be morevolatile than securities which pay cash interest periodically. Income on these securities is computed at the contractual rate specified and is added to the principal balanceof the bond. This income is required to be distributed to shareholders. Because no cash is received at the time income accrues on these securities, the funds may need tosell other investments to make distributions.
Real estate investment trusts. The funds may invest in real estate investment trusts (REITs). Distributions from REITs may be recorded as income and subsequentlycharacterized by the REIT at the end of the fiscal year as a reduction of cost of investments and/or as a realized gain. As a result, the funds will estimate the componentsof distributions from these securities. Such estimates are revised when the actual components of the distributions are known.
Securities lending. The funds may lend their securities to earn additional income. They receive cash collateral from the borrower in an amount not less than the mar-ket value of the loaned securities. The funds will invest their collateral in JHCT, an affiliate of the funds, which has a floating NAV and is registered with the SEC as aninvestment company. JHCT invests cash received as collateral as part of the securities lending program in short-term money market investments. Each fund will receivethe benefit of any gains and bear any losses generated by JHCT with respect to the cash collateral.
The funds have the right to recall loaned securities on demand. If a borrower fails to return loaned securities when due, then the lending agent is responsible and indem-nifies the respective fund for the lent securities. The lending agent uses the collateral received from the borrower to purchase replacement securities of the same issue,type, class and series of the loaned securities. If the value of the collateral is less than the purchase cost of replacement securities, the lending agent is responsible for sat-isfying the shortfall but only to the extent that the shortfall is not due to any decrease in the value of JHCT.
Although the risk of the loss of the securities lent is mitigated by receiving collateral from the borrower and through lending agent indemnification, the funds could expe-rience a delay in recovering securities or could experience a lower than expected return if the borrower fails to return the securities on a timely basis. The funds receivecompensation for lending their securities by retaining a portion of the return on the investment of the collateral and compensation from fees earned from borrowers ofthe securities. Securities lending income received by the funds is net of fees retained by the securities lending agent. Net income received from JHCT is a component ofsecurities lending income as recorded on the Statements of operations.
Obligations to repay collateral received by the funds are shown on the Statements of assets and liabilities as Payable upon return of securities loaned and are secured bythe loaned securities.
As of August 31, 2017, the funds loaned securities as follows:
FundMarket value of
securities on loanCash collateral
received
Capital Appreciation Fund $27,682,602 $28,236,755Capital Appreciation Value Fund 11,163,192 11,436,054Core Bond Fund 703,380 734,409Global Real Estate Fund 3,704,145 3,860,751High Yield Fund 13,308,368 13,877,860International Small Cap Fund 33,507,112 34,976,617International Strategic Equity Allocation Fund 36,627,190 38,524,499International Value Fund 7,186,601 7,562,585Investment Quality Bond Fund 114,657 118,686
SIGNIFICANT ACCOUNTING POLICIES, CONTINUED
272
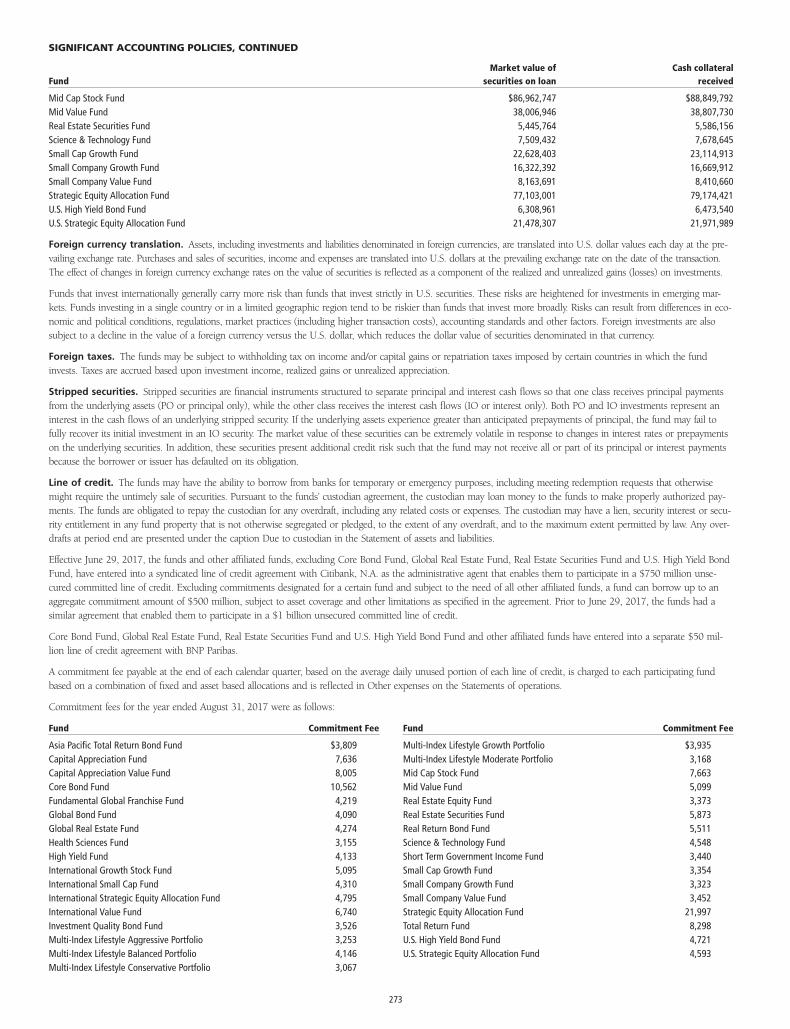
FundMarket value of
securities on loanCash collateral
received
Mid Cap Stock Fund $86,962,747 $88,849,792Mid Value Fund 38,006,946 38,807,730Real Estate Securities Fund 5,445,764 5,586,156Science & Technology Fund 7,509,432 7,678,645Small Cap Growth Fund 22,628,403 23,114,913Small Company Growth Fund 16,322,392 16,669,912Small Company Value Fund 8,163,691 8,410,660Strategic Equity Allocation Fund 77,103,001 79,174,421U.S. High Yield Bond Fund 6,308,961 6,473,540U.S. Strategic Equity Allocation Fund 21,478,307 21,971,989
Foreign currency translation. Assets, including investments and liabilities denominated in foreign currencies, are translated into U.S. dollar values each day at the pre-vailing exchange rate. Purchases and sales of securities, income and expenses are translated into U.S. dollars at the prevailing exchange rate on the date of the transaction.The effect of changes in foreign currency exchange rates on the value of securities is reflected as a component of the realized and unrealized gains (losses) on investments.
Funds that invest internationally generally carry more risk than funds that invest strictly in U.S. securities. These risks are heightened for investments in emerging mar-kets. Funds investing in a single country or in a limited geographic region tend to be riskier than funds that invest more broadly. Risks can result from differences in eco-nomic and political conditions, regulations, market practices (including higher transaction costs), accounting standards and other factors. Foreign investments are alsosubject to a decline in the value of a foreign currency versus the U.S. dollar, which reduces the dollar value of securities denominated in that currency.
Foreign taxes. The funds may be subject to withholding tax on income and/or capital gains or repatriation taxes imposed by certain countries in which the fundinvests. Taxes are accrued based upon investment income, realized gains or unrealized appreciation.
Stripped securities. Stripped securities are financial instruments structured to separate principal and interest cash flows so that one class receives principal paymentsfrom the underlying assets (PO or principal only), while the other class receives the interest cash flows (IO or interest only). Both PO and IO investments represent aninterest in the cash flows of an underlying stripped security. If the underlying assets experience greater than anticipated prepayments of principal, the fund may fail tofully recover its initial investment in an IO security. The market value of these securities can be extremely volatile in response to changes in interest rates or prepaymentson the underlying securities. In addition, these securities present additional credit risk such that the fund may not receive all or part of its principal or interest paymentsbecause the borrower or issuer has defaulted on its obligation.
Line of credit. The funds may have the ability to borrow from banks for temporary or emergency purposes, including meeting redemption requests that otherwisemight require the untimely sale of securities. Pursuant to the funds’ custodian agreement, the custodian may loan money to the funds to make properly authorized pay-ments. The funds are obligated to repay the custodian for any overdraft, including any related costs or expenses. The custodian may have a lien, security interest or secu-rity entitlement in any fund property that is not otherwise segregated or pledged, to the extent of any overdraft, and to the maximum extent permitted by law. Any over-drafts at period end are presented under the caption Due to custodian in the Statement of assets and liabilities.
Effective June 29, 2017, the funds and other affiliated funds, excluding Core Bond Fund, Global Real Estate Fund, Real Estate Securities Fund and U.S. High Yield BondFund, have entered into a syndicated line of credit agreement with Citibank, N.A. as the administrative agent that enables them to participate in a $750 million unse-cured committed line of credit. Excluding commitments designated for a certain fund and subject to the need of all other affiliated funds, a fund can borrow up to anaggregate commitment amount of $500 million, subject to asset coverage and other limitations as specified in the agreement. Prior to June 29, 2017, the funds had asimilar agreement that enabled them to participate in a $1 billion unsecured committed line of credit.
Core Bond Fund, Global Real Estate Fund, Real Estate Securities Fund and U.S. High Yield Bond Fund and other affiliated funds have entered into a separate $50 mil-lion line of credit agreement with BNP Paribas.
A commitment fee payable at the end of each calendar quarter, based on the average daily unused portion of each line of credit, is charged to each participating fundbased on a combination of fixed and asset based allocations and is reflected in Other expenses on the Statements of operations.
Commitment fees for the year ended August 31, 2017 were as follows:
Fund Commitment Fee
Asia Pacific Total Return Bond Fund $3,809Capital Appreciation Fund 7,636Capital Appreciation Value Fund 8,005Core Bond Fund 10,562Fundamental Global Franchise Fund 4,219Global Bond Fund 4,090Global Real Estate Fund 4,274Health Sciences Fund 3,155High Yield Fund 4,133International Growth Stock Fund 5,095International Small Cap Fund 4,310International Strategic Equity Allocation Fund 4,795International Value Fund 6,740Investment Quality Bond Fund 3,526Multi-Index Lifestyle Aggressive Portfolio 3,253Multi-Index Lifestyle Balanced Portfolio 4,146Multi-Index Lifestyle Conservative Portfolio 3,067
Fund Commitment Fee
Multi-Index Lifestyle Growth Portfolio $3,935Multi-Index Lifestyle Moderate Portfolio 3,168Mid Cap Stock Fund 7,663Mid Value Fund 5,099Real Estate Equity Fund 3,373Real Estate Securities Fund 5,873Real Return Bond Fund 5,511Science & Technology Fund 4,548Short Term Government Income Fund 3,440Small Cap Growth Fund 3,354Small Company Growth Fund 3,323Small Company Value Fund 3,452Strategic Equity Allocation Fund 21,997Total Return Fund 8,298U.S. High Yield Bond Fund 4,721U.S. Strategic Equity Allocation Fund 4,593
SIGNIFICANT ACCOUNTING POLICIES, CONTINUED
273
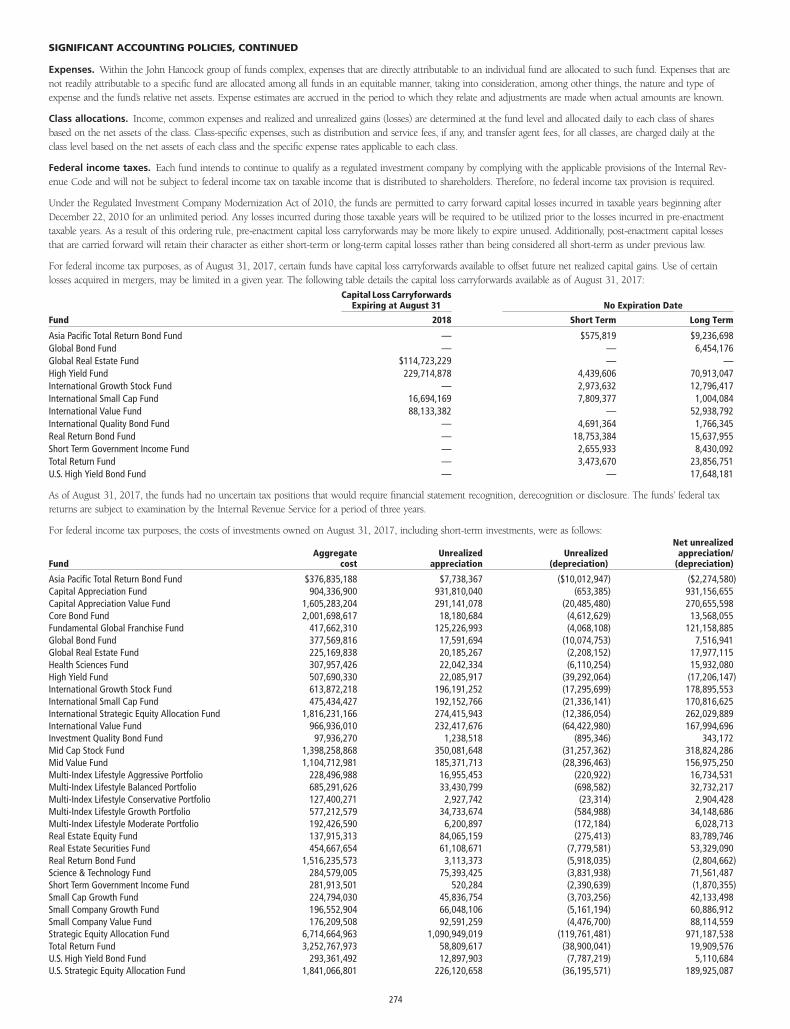
Expenses. Within the John Hancock group of funds complex, expenses that are directly attributable to an individual fund are allocated to such fund. Expenses that arenot readily attributable to a specific fund are allocated among all funds in an equitable manner, taking into consideration, among other things, the nature and type ofexpense and the fund’s relative net assets. Expense estimates are accrued in the period to which they relate and adjustments are made when actual amounts are known.
Class allocations. Income, common expenses and realized and unrealized gains (losses) are determined at the fund level and allocated daily to each class of sharesbased on the net assets of the class. Class-specific expenses, such as distribution and service fees, if any, and transfer agent fees, for all classes, are charged daily at theclass level based on the net assets of each class and the specific expense rates applicable to each class.
Federal income taxes. Each fund intends to continue to qualify as a regulated investment company by complying with the applicable provisions of the Internal Rev-enue Code and will not be subject to federal income tax on taxable income that is distributed to shareholders. Therefore, no federal income tax provision is required.
Under the Regulated Investment Company Modernization Act of 2010, the funds are permitted to carry forward capital losses incurred in taxable years beginning afterDecember 22, 2010 for an unlimited period. Any losses incurred during those taxable years will be required to be utilized prior to the losses incurred in pre-enactmenttaxable years. As a result of this ordering rule, pre-enactment capital loss carryforwards may be more likely to expire unused. Additionally, post-enactment capital lossesthat are carried forward will retain their character as either short-term or long-term capital losses rather than being considered all short-term as under previous law.
For federal income tax purposes, as of August 31, 2017, certain funds have capital loss carryforwards available to offset future net realized capital gains. Use of certainlosses acquired in mergers, may be limited in a given year. The following table details the capital loss carryforwards available as of August 31, 2017:
Capital Loss CarryforwardsExpiring at August 31 No Expiration Date
Fund 2018 Short Term Long Term
Asia Pacific Total Return Bond Fund — $575,819 $9,236,698Global Bond Fund — — 6,454,176Global Real Estate Fund $114,723,229 — —High Yield Fund 229,714,878 4,439,606 70,913,047International Growth Stock Fund — 2,973,632 12,796,417International Small Cap Fund 16,694,169 7,809,377 1,004,084International Value Fund 88,133,382 — 52,938,792International Quality Bond Fund — 4,691,364 1,766,345Real Return Bond Fund — 18,753,384 15,637,955Short Term Government Income Fund — 2,655,933 8,430,092Total Return Fund — 3,473,670 23,856,751U.S. High Yield Bond Fund — — 17,648,181
As of August 31, 2017, the funds had no uncertain tax positions that would require financial statement recognition, derecognition or disclosure. The funds’ federal taxreturns are subject to examination by the Internal Revenue Service for a period of three years.
For federal income tax purposes, the costs of investments owned on August 31, 2017, including short-term investments, were as follows:
FundAggregate
costUnrealized
appreciationUnrealized
(depreciation)
Net unrealizedappreciation/
(depreciation)
Asia Pacific Total Return Bond Fund $376,835,188 $7,738,367 ($10,012,947) ($2,274,580)Capital Appreciation Fund 904,336,900 931,810,040 (653,385) 931,156,655Capital Appreciation Value Fund 1,605,283,204 291,141,078 (20,485,480) 270,655,598Core Bond Fund 2,001,698,617 18,180,684 (4,612,629) 13,568,055Fundamental Global Franchise Fund 417,662,310 125,226,993 (4,068,108) 121,158,885Global Bond Fund 377,569,816 17,591,694 (10,074,753) 7,516,941Global Real Estate Fund 225,169,838 20,185,267 (2,208,152) 17,977,115Health Sciences Fund 307,957,426 22,042,334 (6,110,254) 15,932,080High Yield Fund 507,690,330 22,085,917 (39,292,064) (17,206,147)International Growth Stock Fund 613,872,218 196,191,252 (17,295,699) 178,895,553International Small Cap Fund 475,434,427 192,152,766 (21,336,141) 170,816,625International Strategic Equity Allocation Fund 1,816,231,166 274,415,943 (12,386,054) 262,029,889International Value Fund 966,936,010 232,417,676 (64,422,980) 167,994,696Investment Quality Bond Fund 97,936,270 1,238,518 (895,346) 343,172Mid Cap Stock Fund 1,398,258,868 350,081,648 (31,257,362) 318,824,286Mid Value Fund 1,104,712,981 185,371,713 (28,396,463) 156,975,250Multi-Index Lifestyle Aggressive Portfolio 228,496,988 16,955,453 (220,922) 16,734,531Multi-Index Lifestyle Balanced Portfolio 685,291,626 33,430,799 (698,582) 32,732,217Multi-Index Lifestyle Conservative Portfolio 127,400,271 2,927,742 (23,314) 2,904,428Multi-Index Lifestyle Growth Portfolio 577,212,579 34,733,674 (584,988) 34,148,686Multi-Index Lifestyle Moderate Portfolio 192,426,590 6,200,897 (172,184) 6,028,713Real Estate Equity Fund 137,915,313 84,065,159 (275,413) 83,789,746Real Estate Securities Fund 454,667,654 61,108,671 (7,779,581) 53,329,090Real Return Bond Fund 1,516,235,573 3,113,373 (5,918,035) (2,804,662)Science & Technology Fund 284,579,005 75,393,425 (3,831,938) 71,561,487Short Term Government Income Fund 281,913,501 520,284 (2,390,639) (1,870,355)Small Cap Growth Fund 224,794,030 45,836,754 (3,703,256) 42,133,498Small Company Growth Fund 196,552,904 66,048,106 (5,161,194) 60,886,912Small Company Value Fund 176,209,508 92,591,259 (4,476,700) 88,114,559Strategic Equity Allocation Fund 6,714,664,963 1,090,949,019 (119,761,481) 971,187,538Total Return Fund 3,252,767,973 58,809,617 (38,900,041) 19,909,576U.S. High Yield Bond Fund 293,361,492 12,897,903 (7,787,219) 5,110,684U.S. Strategic Equity Allocation Fund 1,841,066,801 226,120,658 (36,195,571) 189,925,087
SIGNIFICANT ACCOUNTING POLICIES, CONTINUED
274
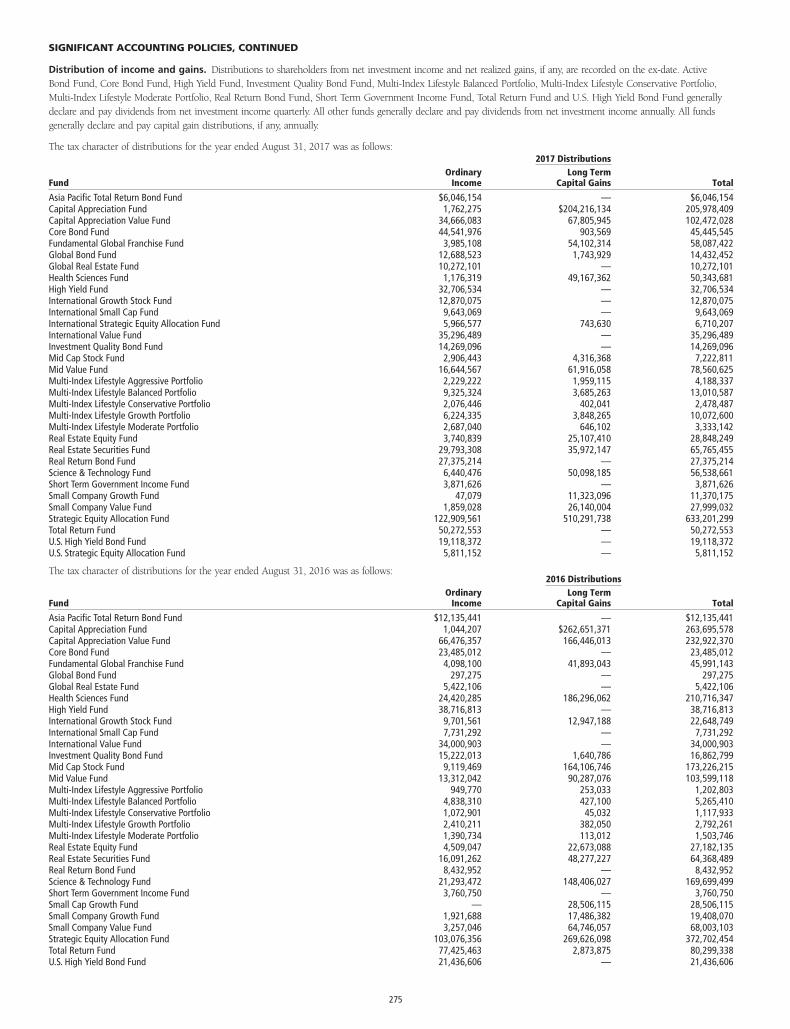
Distribution of income and gains. Distributions to shareholders from net investment income and net realized gains, if any, are recorded on the ex-date. ActiveBond Fund, Core Bond Fund, High Yield Fund, Investment Quality Bond Fund, Multi-Index Lifestyle Balanced Portfolio, Multi-Index Lifestyle Conservative Portfolio,Multi-Index Lifestyle Moderate Portfolio, Real Return Bond Fund, Short Term Government Income Fund, Total Return Fund and U.S. High Yield Bond Fund generallydeclare and pay dividends from net investment income quarterly. All other funds generally declare and pay dividends from net investment income annually. All fundsgenerally declare and pay capital gain distributions, if any, annually.
The tax character of distributions for the year ended August 31, 2017 was as follows:2017 Distributions
FundOrdinary
IncomeLong Term
Capital Gains Total
Asia Pacific Total Return Bond Fund $6,046,154 — $6,046,154Capital Appreciation Fund 1,762,275 $204,216,134 205,978,409Capital Appreciation Value Fund 34,666,083 67,805,945 102,472,028Core Bond Fund 44,541,976 903,569 45,445,545Fundamental Global Franchise Fund 3,985,108 54,102,314 58,087,422Global Bond Fund 12,688,523 1,743,929 14,432,452Global Real Estate Fund 10,272,101 — 10,272,101Health Sciences Fund 1,176,319 49,167,362 50,343,681High Yield Fund 32,706,534 — 32,706,534International Growth Stock Fund 12,870,075 — 12,870,075International Small Cap Fund 9,643,069 — 9,643,069International Strategic Equity Allocation Fund 5,966,577 743,630 6,710,207International Value Fund 35,296,489 — 35,296,489Investment Quality Bond Fund 14,269,096 — 14,269,096Mid Cap Stock Fund 2,906,443 4,316,368 7,222,811Mid Value Fund 16,644,567 61,916,058 78,560,625Multi-Index Lifestyle Aggressive Portfolio 2,229,222 1,959,115 4,188,337Multi-Index Lifestyle Balanced Portfolio 9,325,324 3,685,263 13,010,587Multi-Index Lifestyle Conservative Portfolio 2,076,446 402,041 2,478,487Multi-Index Lifestyle Growth Portfolio 6,224,335 3,848,265 10,072,600Multi-Index Lifestyle Moderate Portfolio 2,687,040 646,102 3,333,142Real Estate Equity Fund 3,740,839 25,107,410 28,848,249Real Estate Securities Fund 29,793,308 35,972,147 65,765,455Real Return Bond Fund 27,375,214 — 27,375,214Science & Technology Fund 6,440,476 50,098,185 56,538,661Short Term Government Income Fund 3,871,626 — 3,871,626Small Company Growth Fund 47,079 11,323,096 11,370,175Small Company Value Fund 1,859,028 26,140,004 27,999,032Strategic Equity Allocation Fund 122,909,561 510,291,738 633,201,299Total Return Fund 50,272,553 — 50,272,553U.S. High Yield Bond Fund 19,118,372 — 19,118,372U.S. Strategic Equity Allocation Fund 5,811,152 — 5,811,152
The tax character of distributions for the year ended August 31, 2016 was as follows:2016 Distributions
FundOrdinary
IncomeLong Term
Capital Gains Total
Asia Pacific Total Return Bond Fund $12,135,441 — $12,135,441Capital Appreciation Fund 1,044,207 $262,651,371 263,695,578Capital Appreciation Value Fund 66,476,357 166,446,013 232,922,370Core Bond Fund 23,485,012 — 23,485,012Fundamental Global Franchise Fund 4,098,100 41,893,043 45,991,143Global Bond Fund 297,275 — 297,275Global Real Estate Fund 5,422,106 — 5,422,106Health Sciences Fund 24,420,285 186,296,062 210,716,347High Yield Fund 38,716,813 — 38,716,813International Growth Stock Fund 9,701,561 12,947,188 22,648,749International Small Cap Fund 7,731,292 — 7,731,292International Value Fund 34,000,903 — 34,000,903Investment Quality Bond Fund 15,222,013 1,640,786 16,862,799Mid Cap Stock Fund 9,119,469 164,106,746 173,226,215Mid Value Fund 13,312,042 90,287,076 103,599,118Multi-Index Lifestyle Aggressive Portfolio 949,770 253,033 1,202,803Multi-Index Lifestyle Balanced Portfolio 4,838,310 427,100 5,265,410Multi-Index Lifestyle Conservative Portfolio 1,072,901 45,032 1,117,933Multi-Index Lifestyle Growth Portfolio 2,410,211 382,050 2,792,261Multi-Index Lifestyle Moderate Portfolio 1,390,734 113,012 1,503,746Real Estate Equity Fund 4,509,047 22,673,088 27,182,135Real Estate Securities Fund 16,091,262 48,277,227 64,368,489Real Return Bond Fund 8,432,952 — 8,432,952Science & Technology Fund 21,293,472 148,406,027 169,699,499Short Term Government Income Fund 3,760,750 — 3,760,750Small Cap Growth Fund — 28,506,115 28,506,115Small Company Growth Fund 1,921,688 17,486,382 19,408,070Small Company Value Fund 3,257,046 64,746,057 68,003,103Strategic Equity Allocation Fund 103,076,356 269,626,098 372,702,454Total Return Fund 77,425,463 2,873,875 80,299,338U.S. High Yield Bond Fund 21,436,606 — 21,436,606
SIGNIFICANT ACCOUNTING POLICIES, CONTINUED
275
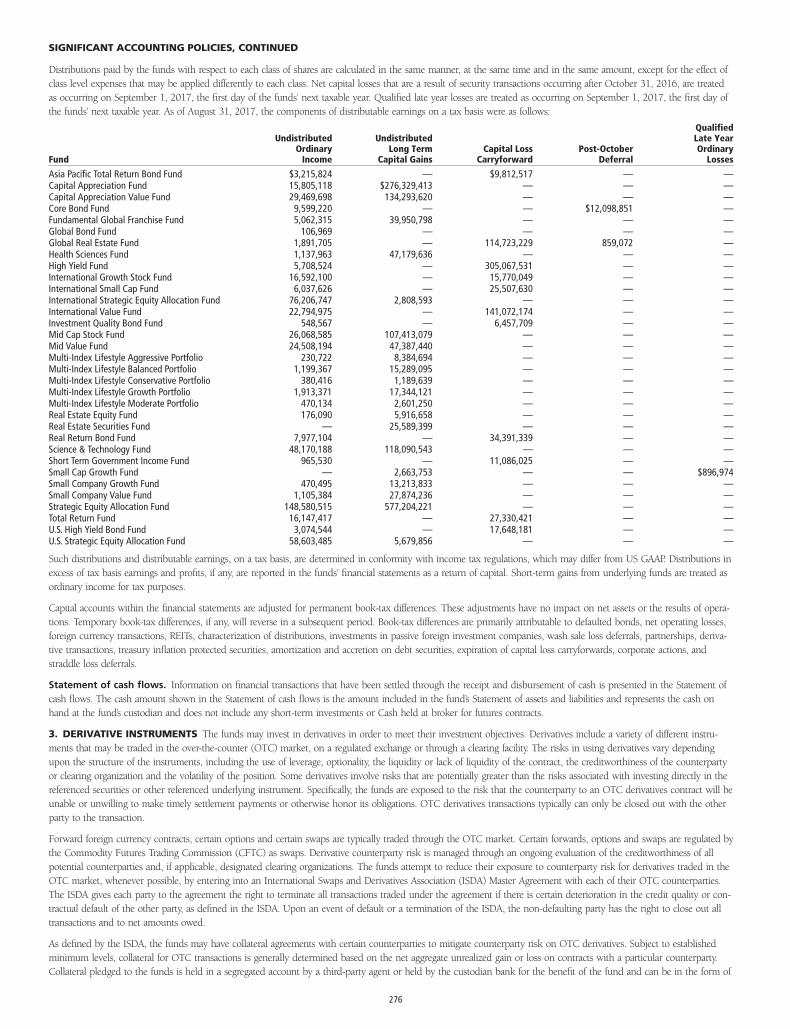
Distributions paid by the funds with respect to each class of shares are calculated in the same manner, at the same time and in the same amount, except for the effect ofclass level expenses that may be applied differently to each class. Net capital losses that are a result of security transactions occurring after October 31, 2016, are treatedas occurring on September 1, 2017, the first day of the funds’ next taxable year. Qualified late year losses are treated as occurring on September 1, 2017, the first day ofthe funds’ next taxable year. As of August 31, 2017, the components of distributable earnings on a tax basis were as follows:
Fund
UndistributedOrdinary
Income
UndistributedLong Term
Capital GainsCapital Loss
CarryforwardPost-October
Deferral
QualifiedLate YearOrdinary
Losses
Asia Pacific Total Return Bond Fund $3,215,824 — $9,812,517 — —Capital Appreciation Fund 15,805,118 $276,329,413 — — —Capital Appreciation Value Fund 29,469,698 134,293,620 — — —Core Bond Fund 9,599,220 — — $12,098,851 —Fundamental Global Franchise Fund 5,062,315 39,950,798 — — —Global Bond Fund 106,969 — — — —Global Real Estate Fund 1,891,705 — 114,723,229 859,072 —Health Sciences Fund 1,137,963 47,179,636 — — —High Yield Fund 5,708,524 — 305,067,531 — —International Growth Stock Fund 16,592,100 — 15,770,049 — —International Small Cap Fund 6,037,626 — 25,507,630 — —International Strategic Equity Allocation Fund 76,206,747 2,808,593 — — —International Value Fund 22,794,975 — 141,072,174 — —Investment Quality Bond Fund 548,567 — 6,457,709 — —Mid Cap Stock Fund 26,068,585 107,413,079 — — —Mid Value Fund 24,508,194 47,387,440 — — —Multi-Index Lifestyle Aggressive Portfolio 230,722 8,384,694 — — —Multi-Index Lifestyle Balanced Portfolio 1,199,367 15,289,095 — — —Multi-Index Lifestyle Conservative Portfolio 380,416 1,189,639 — — —Multi-Index Lifestyle Growth Portfolio 1,913,371 17,344,121 — — —Multi-Index Lifestyle Moderate Portfolio 470,134 2,601,250 — — —Real Estate Equity Fund 176,090 5,916,658 — — —Real Estate Securities Fund — 25,589,399 — — —Real Return Bond Fund 7,977,104 — 34,391,339 — —Science & Technology Fund 48,170,188 118,090,543 — — —Short Term Government Income Fund 965,530 — 11,086,025 — —Small Cap Growth Fund — 2,663,753 — — $896,974Small Company Growth Fund 470,495 13,213,833 — — —Small Company Value Fund 1,105,384 27,874,236 — — —Strategic Equity Allocation Fund 148,580,515 577,204,221 — — —Total Return Fund 16,147,417 — 27,330,421 — —U.S. High Yield Bond Fund 3,074,544 — 17,648,181 — —U.S. Strategic Equity Allocation Fund 58,603,485 5,679,856 — — —
Such distributions and distributable earnings, on a tax basis, are determined in conformity with income tax regulations, which may differ from US GAAP. Distributions inexcess of tax basis earnings and profits, if any, are reported in the funds’ financial statements as a return of capital. Short-term gains from underlying funds are treated asordinary income for tax purposes.
Capital accounts within the financial statements are adjusted for permanent book-tax differences. These adjustments have no impact on net assets or the results of opera-tions. Temporary book-tax differences, if any, will reverse in a subsequent period. Book-tax differences are primarily attributable to defaulted bonds, net operating losses,foreign currency transactions, REITs, characterization of distributions, investments in passive foreign investment companies, wash sale loss deferrals, partnerships, deriva-tive transactions, treasury inflation protected securities, amortization and accretion on debt securities, expiration of capital loss carryforwards, corporate actions, andstraddle loss deferrals.
Statement of cash flows. Information on financial transactions that have been settled through the receipt and disbursement of cash is presented in the Statement ofcash flows. The cash amount shown in the Statement of cash flows is the amount included in the fund’s Statement of assets and liabilities and represents the cash onhand at the fund’s custodian and does not include any short-term investments or Cash held at broker for futures contracts.
3. DERIVATIVE INSTRUMENTS The funds may invest in derivatives in order to meet their investment objectives. Derivatives include a variety of different instru-ments that may be traded in the over-the-counter (OTC) market, on a regulated exchange or through a clearing facility. The risks in using derivatives vary dependingupon the structure of the instruments, including the use of leverage, optionality, the liquidity or lack of liquidity of the contract, the creditworthiness of the counterpartyor clearing organization and the volatility of the position. Some derivatives involve risks that are potentially greater than the risks associated with investing directly in thereferenced securities or other referenced underlying instrument. Specifically, the funds are exposed to the risk that the counterparty to an OTC derivatives contract will beunable or unwilling to make timely settlement payments or otherwise honor its obligations. OTC derivatives transactions typically can only be closed out with the otherparty to the transaction.
Forward foreign currency contracts, certain options and certain swaps are typically traded through the OTC market. Certain forwards, options and swaps are regulated bythe Commodity Futures Trading Commission (CFTC) as swaps. Derivative counterparty risk is managed through an ongoing evaluation of the creditworthiness of allpotential counterparties and, if applicable, designated clearing organizations. The funds attempt to reduce their exposure to counterparty risk for derivatives traded in theOTC market, whenever possible, by entering into an International Swaps and Derivatives Association (ISDA) Master Agreement with each of their OTC counterparties.The ISDA gives each party to the agreement the right to terminate all transactions traded under the agreement if there is certain deterioration in the credit quality or con-tractual default of the other party, as defined in the ISDA. Upon an event of default or a termination of the ISDA, the non-defaulting party has the right to close out alltransactions and to net amounts owed.
As defined by the ISDA, the funds may have collateral agreements with certain counterparties to mitigate counterparty risk on OTC derivatives. Subject to establishedminimum levels, collateral for OTC transactions is generally determined based on the net aggregate unrealized gain or loss on contracts with a particular counterparty.Collateral pledged to the funds is held in a segregated account by a third-party agent or held by the custodian bank for the benefit of the fund and can be in the form of
SIGNIFICANT ACCOUNTING POLICIES, CONTINUED
276
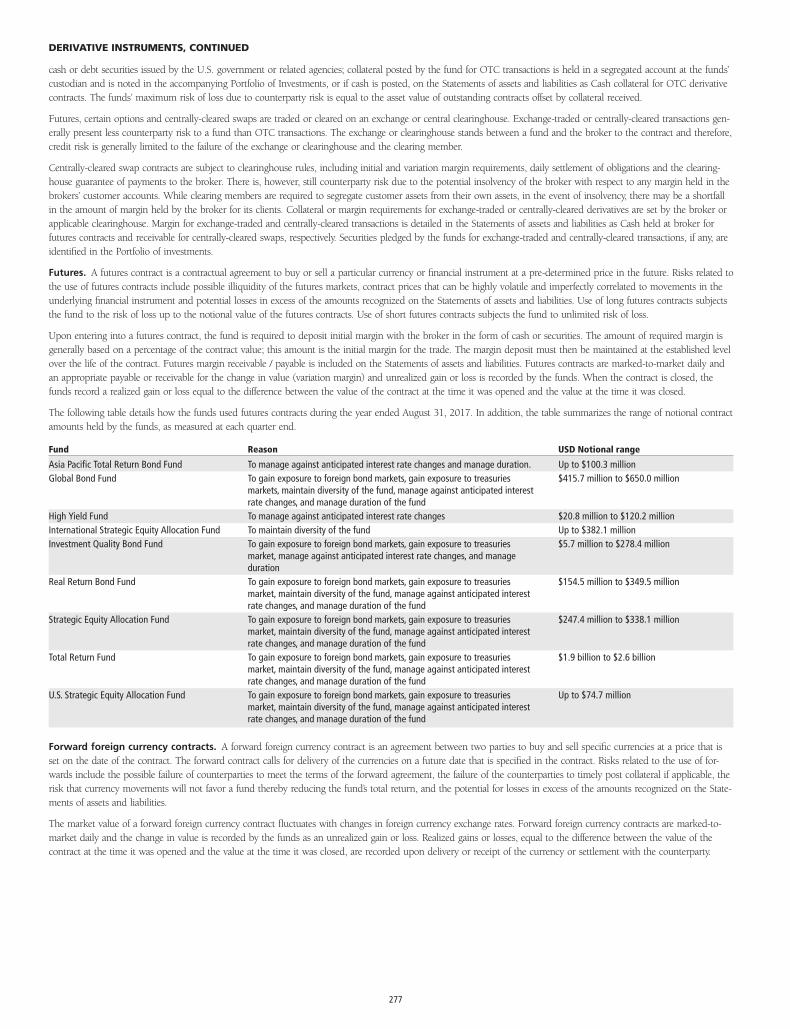
cash or debt securities issued by the U.S. government or related agencies; collateral posted by the fund for OTC transactions is held in a segregated account at the funds’custodian and is noted in the accompanying Portfolio of Investments, or if cash is posted, on the Statements of assets and liabilities as Cash collateral for OTC derivativecontracts. The funds’ maximum risk of loss due to counterparty risk is equal to the asset value of outstanding contracts offset by collateral received.
Futures, certain options and centrally-cleared swaps are traded or cleared on an exchange or central clearinghouse. Exchange-traded or centrally-cleared transactions gen-erally present less counterparty risk to a fund than OTC transactions. The exchange or clearinghouse stands between a fund and the broker to the contract and therefore,credit risk is generally limited to the failure of the exchange or clearinghouse and the clearing member.
Centrally-cleared swap contracts are subject to clearinghouse rules, including initial and variation margin requirements, daily settlement of obligations and the clearing-house guarantee of payments to the broker. There is, however, still counterparty risk due to the potential insolvency of the broker with respect to any margin held in thebrokers’ customer accounts. While clearing members are required to segregate customer assets from their own assets, in the event of insolvency, there may be a shortfallin the amount of margin held by the broker for its clients. Collateral or margin requirements for exchange-traded or centrally-cleared derivatives are set by the broker orapplicable clearinghouse. Margin for exchange-traded and centrally-cleared transactions is detailed in the Statements of assets and liabilities as Cash held at broker forfutures contracts and receivable for centrally-cleared swaps, respectively. Securities pledged by the funds for exchange-traded and centrally-cleared transactions, if any, areidentified in the Portfolio of investments.
Futures. A futures contract is a contractual agreement to buy or sell a particular currency or financial instrument at a pre-determined price in the future. Risks related tothe use of futures contracts include possible illiquidity of the futures markets, contract prices that can be highly volatile and imperfectly correlated to movements in theunderlying financial instrument and potential losses in excess of the amounts recognized on the Statements of assets and liabilities. Use of long futures contracts subjectsthe fund to the risk of loss up to the notional value of the futures contracts. Use of short futures contracts subjects the fund to unlimited risk of loss.
Upon entering into a futures contract, the fund is required to deposit initial margin with the broker in the form of cash or securities. The amount of required margin isgenerally based on a percentage of the contract value; this amount is the initial margin for the trade. The margin deposit must then be maintained at the established levelover the life of the contract. Futures margin receivable / payable is included on the Statements of assets and liabilities. Futures contracts are marked-to-market daily andan appropriate payable or receivable for the change in value (variation margin) and unrealized gain or loss is recorded by the funds. When the contract is closed, thefunds record a realized gain or loss equal to the difference between the value of the contract at the time it was opened and the value at the time it was closed.
The following table details how the funds used futures contracts during the year ended August 31, 2017. In addition, the table summarizes the range of notional contractamounts held by the funds, as measured at each quarter end.
Fund Reason USD Notional range
Asia Pacific Total Return Bond Fund To manage against anticipated interest rate changes and manage duration. Up to $100.3 millionGlobal Bond Fund To gain exposure to foreign bond markets, gain exposure to treasuries
markets, maintain diversity of the fund, manage against anticipated interestrate changes, and manage duration of the fund
$415.7 million to $650.0 million
High Yield Fund To manage against anticipated interest rate changes $20.8 million to $120.2 millionInternational Strategic Equity Allocation Fund To maintain diversity of the fund Up to $382.1 millionInvestment Quality Bond Fund To gain exposure to foreign bond markets, gain exposure to treasuries
market, manage against anticipated interest rate changes, and manageduration
$5.7 million to $278.4 million
Real Return Bond Fund To gain exposure to foreign bond markets, gain exposure to treasuriesmarket, maintain diversity of the fund, manage against anticipated interestrate changes, and manage duration of the fund
$154.5 million to $349.5 million
Strategic Equity Allocation Fund To gain exposure to foreign bond markets, gain exposure to treasuriesmarket, maintain diversity of the fund, manage against anticipated interestrate changes, and manage duration of the fund
$247.4 million to $338.1 million
Total Return Fund To gain exposure to foreign bond markets, gain exposure to treasuriesmarket, maintain diversity of the fund, manage against anticipated interestrate changes, and manage duration of the fund
$1.9 billion to $2.6 billion
U.S. Strategic Equity Allocation Fund To gain exposure to foreign bond markets, gain exposure to treasuriesmarket, maintain diversity of the fund, manage against anticipated interestrate changes, and manage duration of the fund
Up to $74.7 million
Forward foreign currency contracts. A forward foreign currency contract is an agreement between two parties to buy and sell specific currencies at a price that isset on the date of the contract. The forward contract calls for delivery of the currencies on a future date that is specified in the contract. Risks related to the use of for-wards include the possible failure of counterparties to meet the terms of the forward agreement, the failure of the counterparties to timely post collateral if applicable, therisk that currency movements will not favor a fund thereby reducing the fund’s total return, and the potential for losses in excess of the amounts recognized on the State-ments of assets and liabilities.
The market value of a forward foreign currency contract fluctuates with changes in foreign currency exchange rates. Forward foreign currency contracts are marked-to-market daily and the change in value is recorded by the funds as an unrealized gain or loss. Realized gains or losses, equal to the difference between the value of thecontract at the time it was opened and the value at the time it was closed, are recorded upon delivery or receipt of the currency or settlement with the counterparty.
DERIVATIVE INSTRUMENTS, CONTINUED
277
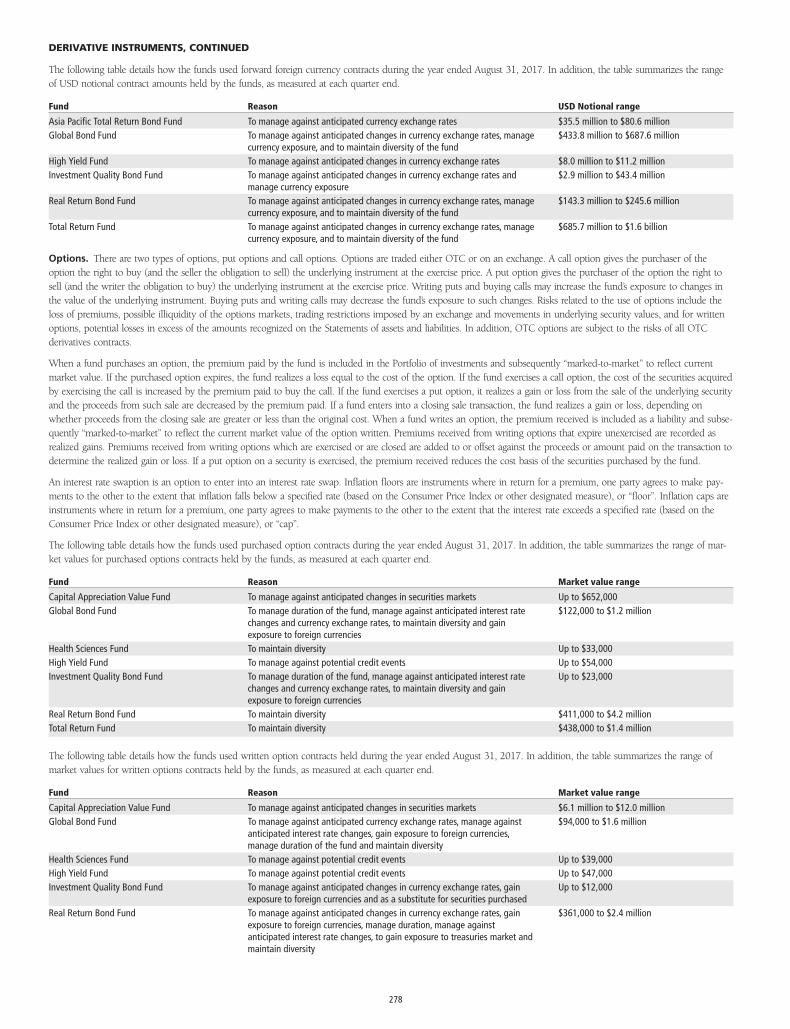
The following table details how the funds used forward foreign currency contracts during the year ended August 31, 2017. In addition, the table summarizes the rangeof USD notional contract amounts held by the funds, as measured at each quarter end.
Fund Reason USD Notional range
Asia Pacific Total Return Bond Fund To manage against anticipated currency exchange rates $35.5 million to $80.6 millionGlobal Bond Fund To manage against anticipated changes in currency exchange rates, manage
currency exposure, and to maintain diversity of the fund$433.8 million to $687.6 million
High Yield Fund To manage against anticipated changes in currency exchange rates $8.0 million to $11.2 millionInvestment Quality Bond Fund To manage against anticipated changes in currency exchange rates and
manage currency exposure$2.9 million to $43.4 million
Real Return Bond Fund To manage against anticipated changes in currency exchange rates, managecurrency exposure, and to maintain diversity of the fund
$143.3 million to $245.6 million
Total Return Fund To manage against anticipated changes in currency exchange rates, managecurrency exposure, and to maintain diversity of the fund
$685.7 million to $1.6 billion
Options. There are two types of options, put options and call options. Options are traded either OTC or on an exchange. A call option gives the purchaser of theoption the right to buy (and the seller the obligation to sell) the underlying instrument at the exercise price. A put option gives the purchaser of the option the right tosell (and the writer the obligation to buy) the underlying instrument at the exercise price. Writing puts and buying calls may increase the fund’s exposure to changes inthe value of the underlying instrument. Buying puts and writing calls may decrease the fund’s exposure to such changes. Risks related to the use of options include theloss of premiums, possible illiquidity of the options markets, trading restrictions imposed by an exchange and movements in underlying security values, and for writtenoptions, potential losses in excess of the amounts recognized on the Statements of assets and liabilities. In addition, OTC options are subject to the risks of all OTCderivatives contracts.
When a fund purchases an option, the premium paid by the fund is included in the Portfolio of investments and subsequently “marked-to-market” to reflect currentmarket value. If the purchased option expires, the fund realizes a loss equal to the cost of the option. If the fund exercises a call option, the cost of the securities acquiredby exercising the call is increased by the premium paid to buy the call. If the fund exercises a put option, it realizes a gain or loss from the sale of the underlying securityand the proceeds from such sale are decreased by the premium paid. If a fund enters into a closing sale transaction, the fund realizes a gain or loss, depending onwhether proceeds from the closing sale are greater or less than the original cost. When a fund writes an option, the premium received is included as a liability and subse-quently “marked-to-market” to reflect the current market value of the option written. Premiums received from writing options that expire unexercised are recorded asrealized gains. Premiums received from writing options which are exercised or are closed are added to or offset against the proceeds or amount paid on the transaction todetermine the realized gain or loss. If a put option on a security is exercised, the premium received reduces the cost basis of the securities purchased by the fund.
An interest rate swaption is an option to enter into an interest rate swap. Inflation floors are instruments where in return for a premium, one party agrees to make pay-ments to the other to the extent that inflation falls below a specified rate (based on the Consumer Price Index or other designated measure), or “floor”. Inflation caps areinstruments where in return for a premium, one party agrees to make payments to the other to the extent that the interest rate exceeds a specified rate (based on theConsumer Price Index or other designated measure), or “cap”.
The following table details how the funds used purchased option contracts during the year ended August 31, 2017. In addition, the table summarizes the range of mar-ket values for purchased options contracts held by the funds, as measured at each quarter end.
Fund Reason Market value range
Capital Appreciation Value Fund To manage against anticipated changes in securities markets Up to $652,000Global Bond Fund To manage duration of the fund, manage against anticipated interest rate
changes and currency exchange rates, to maintain diversity and gainexposure to foreign currencies
$122,000 to $1.2 million
Health Sciences Fund To maintain diversity Up to $33,000High Yield Fund To manage against potential credit events Up to $54,000Investment Quality Bond Fund To manage duration of the fund, manage against anticipated interest rate
changes and currency exchange rates, to maintain diversity and gainexposure to foreign currencies
Up to $23,000
Real Return Bond Fund To maintain diversity $411,000 to $4.2 millionTotal Return Fund To maintain diversity $438,000 to $1.4 million
The following table details how the funds used written option contracts held during the year ended August 31, 2017. In addition, the table summarizes the range ofmarket values for written options contracts held by the funds, as measured at each quarter end.
Fund Reason Market value range
Capital Appreciation Value Fund To manage against anticipated changes in securities markets $6.1 million to $12.0 millionGlobal Bond Fund To manage against anticipated currency exchange rates, manage against
anticipated interest rate changes, gain exposure to foreign currencies,manage duration of the fund and maintain diversity
$94,000 to $1.6 million
Health Sciences Fund To manage against potential credit events Up to $39,000High Yield Fund To manage against potential credit events Up to $47,000Investment Quality Bond Fund To manage against anticipated changes in currency exchange rates, gain
exposure to foreign currencies and as a substitute for securities purchasedUp to $12,000
Real Return Bond Fund To manage against anticipated changes in currency exchange rates, gainexposure to foreign currencies, manage duration, manage againstanticipated interest rate changes, to gain exposure to treasuries market andmaintain diversity
$361,000 to $2.4 million
DERIVATIVE INSTRUMENTS, CONTINUED
278
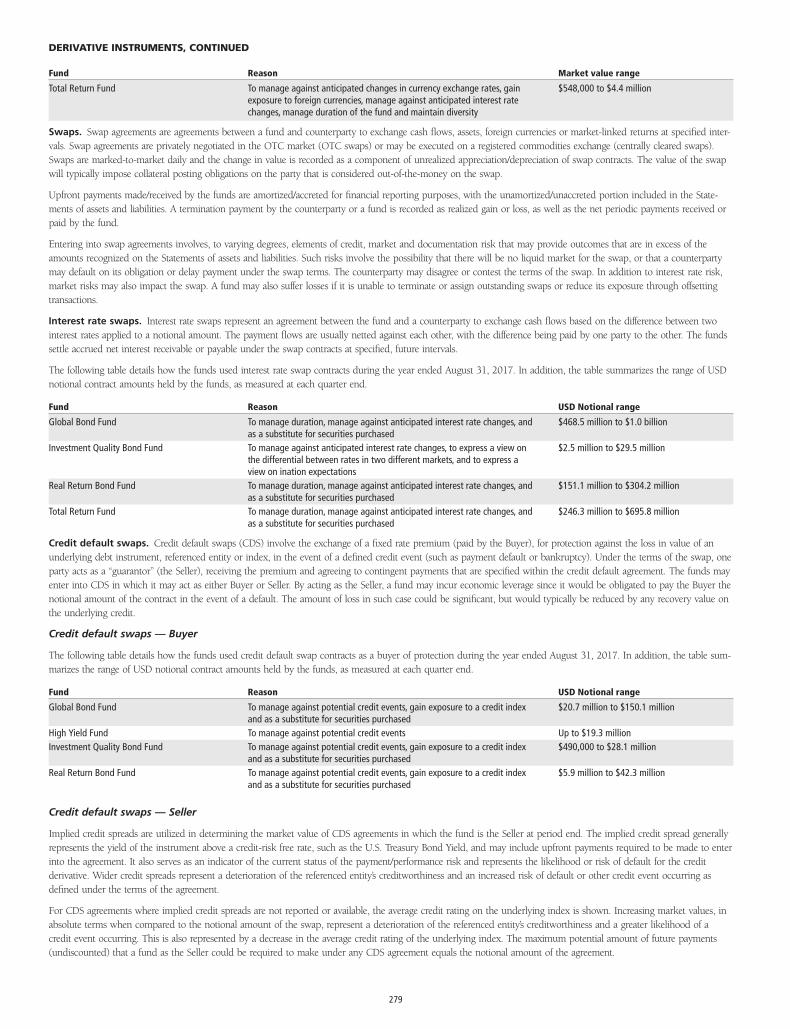
Fund Reason Market value range
Total Return Fund To manage against anticipated changes in currency exchange rates, gainexposure to foreign currencies, manage against anticipated interest ratechanges, manage duration of the fund and maintain diversity
$548,000 to $4.4 million
Swaps. Swap agreements are agreements between a fund and counterparty to exchange cash flows, assets, foreign currencies or market-linked returns at specified inter-vals. Swap agreements are privately negotiated in the OTC market (OTC swaps) or may be executed on a registered commodities exchange (centrally cleared swaps).Swaps are marked-to-market daily and the change in value is recorded as a component of unrealized appreciation/depreciation of swap contracts. The value of the swapwill typically impose collateral posting obligations on the party that is considered out-of-the-money on the swap.
Upfront payments made/received by the funds are amortized/accreted for financial reporting purposes, with the unamortized/unaccreted portion included in the State-ments of assets and liabilities. A termination payment by the counterparty or a fund is recorded as realized gain or loss, as well as the net periodic payments received orpaid by the fund.
Entering into swap agreements involves, to varying degrees, elements of credit, market and documentation risk that may provide outcomes that are in excess of theamounts recognized on the Statements of assets and liabilities. Such risks involve the possibility that there will be no liquid market for the swap, or that a counterpartymay default on its obligation or delay payment under the swap terms. The counterparty may disagree or contest the terms of the swap. In addition to interest rate risk,market risks may also impact the swap. A fund may also suffer losses if it is unable to terminate or assign outstanding swaps or reduce its exposure through offsettingtransactions.
Interest rate swaps. Interest rate swaps represent an agreement between the fund and a counterparty to exchange cash flows based on the difference between twointerest rates applied to a notional amount. The payment flows are usually netted against each other, with the difference being paid by one party to the other. The fundssettle accrued net interest receivable or payable under the swap contracts at specified, future intervals.
The following table details how the funds used interest rate swap contracts during the year ended August 31, 2017. In addition, the table summarizes the range of USDnotional contract amounts held by the funds, as measured at each quarter end.
Fund Reason USD Notional range
Global Bond Fund To manage duration, manage against anticipated interest rate changes, andas a substitute for securities purchased
$468.5 million to $1.0 billion
Investment Quality Bond Fund To manage against anticipated interest rate changes, to express a view onthe differential between rates in two different markets, and to express aview on ination expectations
$2.5 million to $29.5 million
Real Return Bond Fund To manage duration, manage against anticipated interest rate changes, andas a substitute for securities purchased
$151.1 million to $304.2 million
Total Return Fund To manage duration, manage against anticipated interest rate changes, andas a substitute for securities purchased
$246.3 million to $695.8 million
Credit default swaps. Credit default swaps (CDS) involve the exchange of a fixed rate premium (paid by the Buyer), for protection against the loss in value of anunderlying debt instrument, referenced entity or index, in the event of a defined credit event (such as payment default or bankruptcy). Under the terms of the swap, oneparty acts as a “guarantor” (the Seller), receiving the premium and agreeing to contingent payments that are specified within the credit default agreement. The funds mayenter into CDS in which it may act as either Buyer or Seller. By acting as the Seller, a fund may incur economic leverage since it would be obligated to pay the Buyer thenotional amount of the contract in the event of a default. The amount of loss in such case could be significant, but would typically be reduced by any recovery value onthe underlying credit.
Credit default swaps — Buyer
The following table details how the funds used credit default swap contracts as a buyer of protection during the year ended August 31, 2017. In addition, the table sum-marizes the range of USD notional contract amounts held by the funds, as measured at each quarter end.
Fund Reason USD Notional range
Global Bond Fund To manage against potential credit events, gain exposure to a credit indexand as a substitute for securities purchased
$20.7 million to $150.1 million
High Yield Fund To manage against potential credit events Up to $19.3 millionInvestment Quality Bond Fund To manage against potential credit events, gain exposure to a credit index
and as a substitute for securities purchased$490,000 to $28.1 million
Real Return Bond Fund To manage against potential credit events, gain exposure to a credit indexand as a substitute for securities purchased
$5.9 million to $42.3 million
Credit default swaps — Seller
Implied credit spreads are utilized in determining the market value of CDS agreements in which the fund is the Seller at period end. The implied credit spread generallyrepresents the yield of the instrument above a credit-risk free rate, such as the U.S. Treasury Bond Yield, and may include upfront payments required to be made to enterinto the agreement. It also serves as an indicator of the current status of the payment/performance risk and represents the likelihood or risk of default for the creditderivative. Wider credit spreads represent a deterioration of the referenced entity’s creditworthiness and an increased risk of default or other credit event occurring asdefined under the terms of the agreement.
For CDS agreements where implied credit spreads are not reported or available, the average credit rating on the underlying index is shown. Increasing market values, inabsolute terms when compared to the notional amount of the swap, represent a deterioration of the referenced entity’s creditworthiness and a greater likelihood of acredit event occurring. This is also represented by a decrease in the average credit rating of the underlying index. The maximum potential amount of future payments(undiscounted) that a fund as the Seller could be required to make under any CDS agreement equals the notional amount of the agreement.
DERIVATIVE INSTRUMENTS, CONTINUED
279
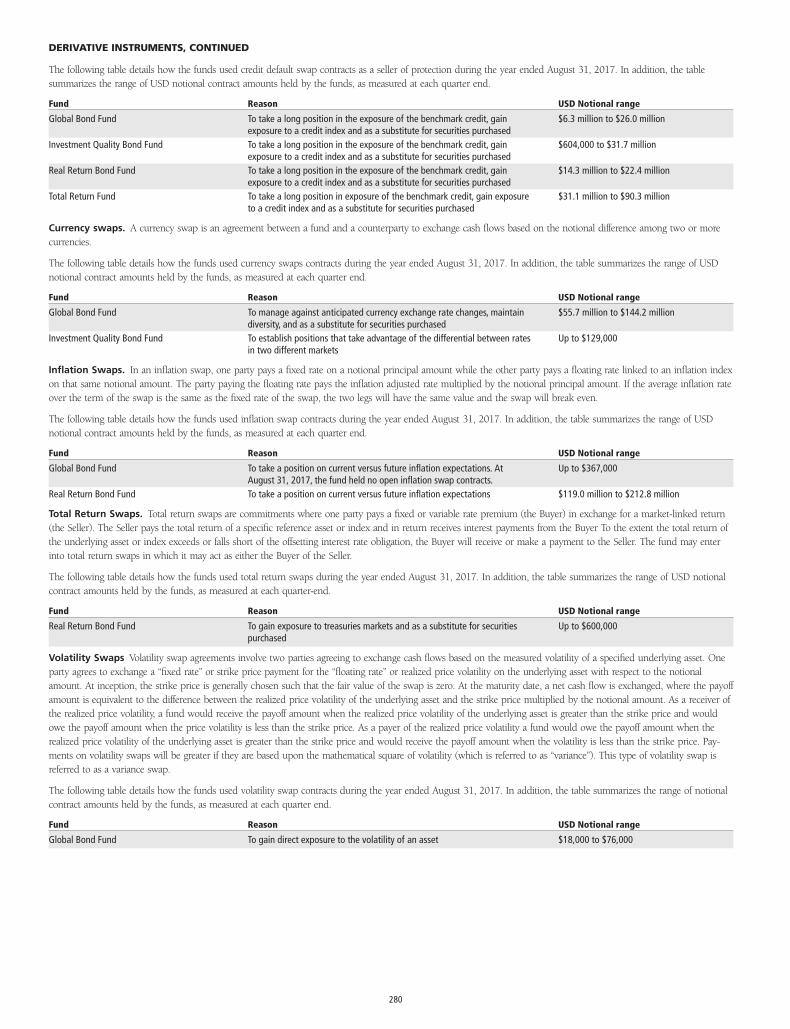
The following table details how the funds used credit default swap contracts as a seller of protection during the year ended August 31, 2017. In addition, the tablesummarizes the range of USD notional contract amounts held by the funds, as measured at each quarter end.
Fund Reason USD Notional range
Global Bond Fund To take a long position in the exposure of the benchmark credit, gainexposure to a credit index and as a substitute for securities purchased
$6.3 million to $26.0 million
Investment Quality Bond Fund To take a long position in the exposure of the benchmark credit, gainexposure to a credit index and as a substitute for securities purchased
$604,000 to $31.7 million
Real Return Bond Fund To take a long position in the exposure of the benchmark credit, gainexposure to a credit index and as a substitute for securities purchased
$14.3 million to $22.4 million
Total Return Fund To take a long position in exposure of the benchmark credit, gain exposureto a credit index and as a substitute for securities purchased
$31.1 million to $90.3 million
Currency swaps. A currency swap is an agreement between a fund and a counterparty to exchange cash flows based on the notional difference among two or morecurrencies.
The following table details how the funds used currency swaps contracts during the year ended August 31, 2017. In addition, the table summarizes the range of USDnotional contract amounts held by the funds, as measured at each quarter end.
Fund Reason USD Notional range
Global Bond Fund To manage against anticipated currency exchange rate changes, maintaindiversity, and as a substitute for securities purchased
$55.7 million to $144.2 million
Investment Quality Bond Fund To establish positions that take advantage of the differential between ratesin two different markets
Up to $129,000
Inflation Swaps. In an inflation swap, one party pays a fixed rate on a notional principal amount while the other party pays a floating rate linked to an inflation indexon that same notional amount. The party paying the floating rate pays the inflation adjusted rate multiplied by the notional principal amount. If the average inflation rateover the term of the swap is the same as the fixed rate of the swap, the two legs will have the same value and the swap will break even.
The following table details how the funds used inflation swap contracts during the year ended August 31, 2017. In addition, the table summarizes the range of USDnotional contract amounts held by the funds, as measured at each quarter end.
Fund Reason USD Notional range
Global Bond Fund To take a position on current versus future inflation expectations. AtAugust 31, 2017, the fund held no open inflation swap contracts.
Up to $367,000
Real Return Bond Fund To take a position on current versus future inflation expectations $119.0 million to $212.8 million
Total Return Swaps. Total return swaps are commitments where one party pays a fixed or variable rate premium (the Buyer) in exchange for a market-linked return(the Seller). The Seller pays the total return of a specific reference asset or index and in return receives interest payments from the Buyer To the extent the total return ofthe underlying asset or index exceeds or falls short of the offsetting interest rate obligation, the Buyer will receive or make a payment to the Seller. The fund may enterinto total return swaps in which it may act as either the Buyer of the Seller.
The following table details how the funds used total return swaps during the year ended August 31, 2017. In addition, the table summarizes the range of USD notionalcontract amounts held by the funds, as measured at each quarter-end.
Fund Reason USD Notional range
Real Return Bond Fund To gain exposure to treasuries markets and as a substitute for securitiespurchased
Up to $600,000
Volatility Swaps Volatility swap agreements involve two parties agreeing to exchange cash flows based on the measured volatility of a specified underlying asset. Oneparty agrees to exchange a “fixed rate” or strike price payment for the “floating rate” or realized price volatility on the underlying asset with respect to the notionalamount. At inception, the strike price is generally chosen such that the fair value of the swap is zero. At the maturity date, a net cash flow is exchanged, where the payoffamount is equivalent to the difference between the realized price volatility of the underlying asset and the strike price multiplied by the notional amount. As a receiver ofthe realized price volatility, a fund would receive the payoff amount when the realized price volatility of the underlying asset is greater than the strike price and wouldowe the payoff amount when the price volatility is less than the strike price. As a payer of the realized price volatility a fund would owe the payoff amount when therealized price volatility of the underlying asset is greater than the strike price and would receive the payoff amount when the volatility is less than the strike price. Pay-ments on volatility swaps will be greater if they are based upon the mathematical square of volatility (which is referred to as “variance”). This type of volatility swap isreferred to as a variance swap.
The following table details how the funds used volatility swap contracts during the year ended August 31, 2017. In addition, the table summarizes the range of notionalcontract amounts held by the funds, as measured at each quarter end.
Fund Reason USD Notional range
Global Bond Fund To gain direct exposure to the volatility of an asset $18,000 to $76,000
DERIVATIVE INSTRUMENTS, CONTINUED
280
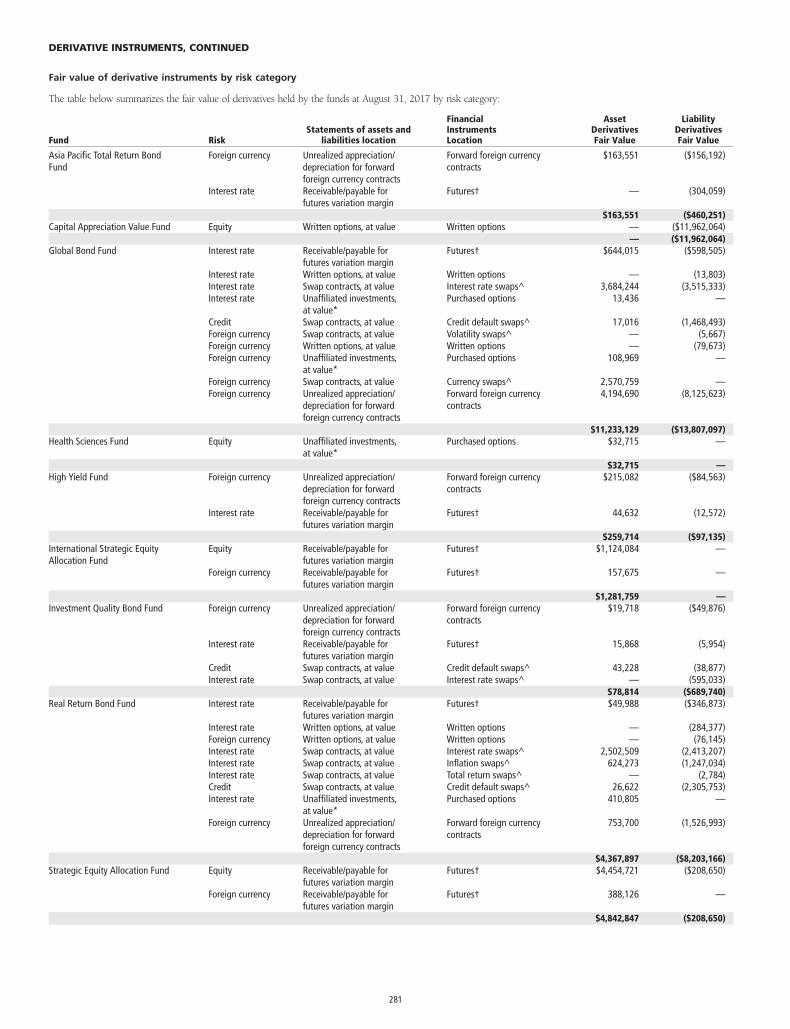
Fair value of derivative instruments by risk category
The table below summarizes the fair value of derivatives held by the funds at August 31, 2017 by risk category:
Fund RiskStatements of assets and
liabilities location
FinancialInstrumentsLocation
AssetDerivativesFair Value
LiabilityDerivativesFair Value
Asia Pacific Total Return BondFund
Foreign currency Unrealized appreciation/depreciation for forwardforeign currency contracts
Forward foreign currencycontracts
$163,551 ($156,192)
Interest rate Receivable/payable forfutures variation margin
Futures† — (304,059)
$163,551 ($460,251)Capital Appreciation Value Fund Equity Written options, at value Written options — ($11,962,064)
— ($11,962,064)Global Bond Fund Interest rate Receivable/payable for
futures variation marginFutures† $644,015 ($598,505)
Interest rate Written options, at value Written options — (13,803)Interest rate Swap contracts, at value Interest rate swaps^ 3,684,244 (3,515,333)Interest rate Unaffiliated investments,
at value*Purchased options 13,436 —
Credit Swap contracts, at value Credit default swaps^ 17,016 (1,468,493)Foreign currency Swap contracts, at value Volatility swaps^ — (5,667)Foreign currency Written options, at value Written options — (79,673)Foreign currency Unaffiliated investments,
at value*Purchased options 108,969 —
Foreign currency Swap contracts, at value Currency swaps^ 2,570,759 —Foreign currency Unrealized appreciation/
depreciation for forwardforeign currency contracts
Forward foreign currencycontracts
4,194,690 (8,125,623)
$11,233,129 ($13,807,097)Health Sciences Fund Equity Unaffiliated investments,
at value*Purchased options $32,715 —
$32,715 —High Yield Fund Foreign currency Unrealized appreciation/
depreciation for forwardforeign currency contracts
Forward foreign currencycontracts
$215,082 ($84,563)
Interest rate Receivable/payable forfutures variation margin
Futures† 44,632 (12,572)
$259,714 ($97,135)International Strategic EquityAllocation Fund
Equity Receivable/payable forfutures variation margin
Futures† $1,124,084 —
Foreign currency Receivable/payable forfutures variation margin
Futures† 157,675 —
$1,281,759 —Investment Quality Bond Fund Foreign currency Unrealized appreciation/
depreciation for forwardforeign currency contracts
Forward foreign currencycontracts
$19,718 ($49,876)
Interest rate Receivable/payable forfutures variation margin
Futures† 15,868 (5,954)
Credit Swap contracts, at value Credit default swaps^ 43,228 (38,877)Interest rate Swap contracts, at value Interest rate swaps^ — (595,033)
$78,814 ($689,740)Real Return Bond Fund Interest rate Receivable/payable for
futures variation marginFutures† $49,988 ($346,873)
Interest rate Written options, at value Written options — (284,377)Foreign currency Written options, at value Written options — (76,145)Interest rate Swap contracts, at value Interest rate swaps^ 2,502,509 (2,413,207)Interest rate Swap contracts, at value Inflation swaps^ 624,273 (1,247,034)Interest rate Swap contracts, at value Total return swaps^ — (2,784)Credit Swap contracts, at value Credit default swaps^ 26,622 (2,305,753)Interest rate Unaffiliated investments,
at value*Purchased options 410,805 —
Foreign currency Unrealized appreciation/depreciation for forwardforeign currency contracts
Forward foreign currencycontracts
753,700 (1,526,993)
$4,367,897 ($8,203,166)Strategic Equity Allocation Fund Equity Receivable/payable for
futures variation marginFutures† $4,454,721 ($208,650)
Foreign currency Receivable/payable forfutures variation margin
Futures† 388,126 —
$4,842,847 ($208,650)
DERIVATIVE INSTRUMENTS, CONTINUED
281
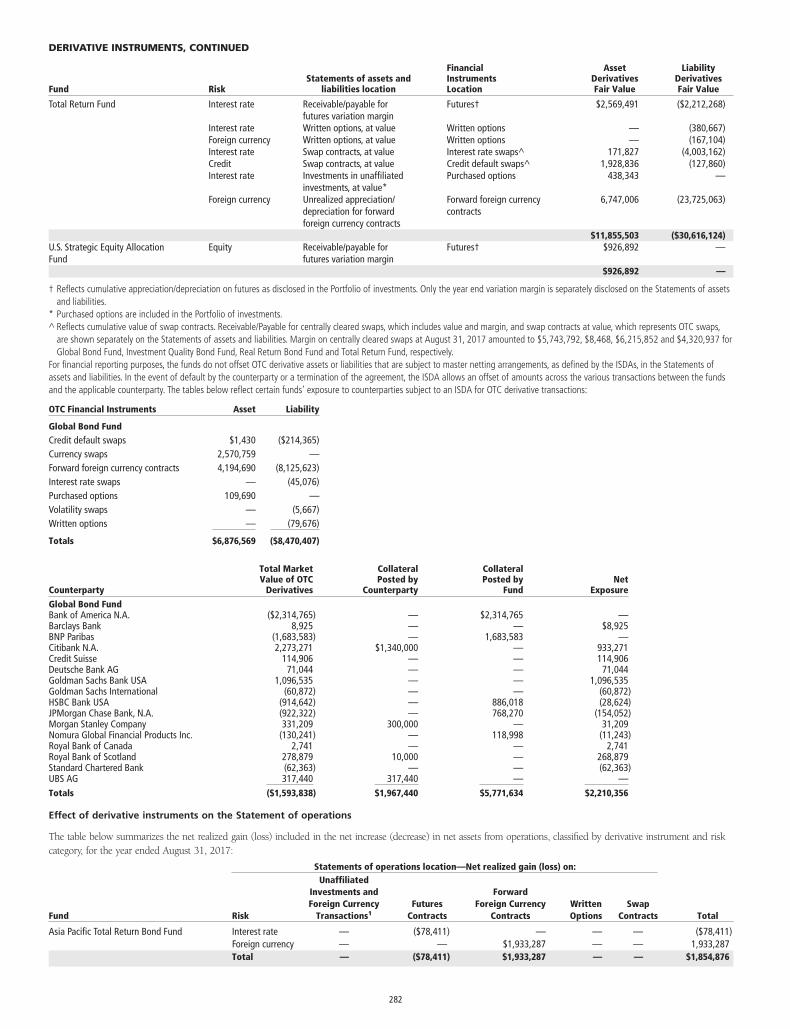
Fund RiskStatements of assets and
liabilities location
FinancialInstrumentsLocation
AssetDerivativesFair Value
LiabilityDerivativesFair Value
Total Return Fund Interest rate Receivable/payable forfutures variation margin
Futures† $2,569,491 ($2,212,268)
Interest rate Written options, at value Written options — (380,667)Foreign currency Written options, at value Written options — (167,104)Interest rate Swap contracts, at value Interest rate swaps^ 171,827 (4,003,162)Credit Swap contracts, at value Credit default swaps^ 1,928,836 (127,860)Interest rate Investments in unaffiliated
investments, at value*Purchased options 438,343 —
Foreign currency Unrealized appreciation/depreciation for forwardforeign currency contracts
Forward foreign currencycontracts
6,747,006 (23,725,063)
$11,855,503 ($30,616,124)U.S. Strategic Equity AllocationFund
Equity Receivable/payable forfutures variation margin
Futures† $926,892 —
$926,892 —
† Reflects cumulative appreciation/depreciation on futures as disclosed in the Portfolio of investments. Only the year end variation margin is separately disclosed on the Statements of assetsand liabilities.
* Purchased options are included in the Portfolio of investments.^ Reflects cumulative value of swap contracts. Receivable/Payable for centrally cleared swaps, which includes value and margin, and swap contracts at value, which represents OTC swaps,
are shown separately on the Statements of assets and liabilities. Margin on centrally cleared swaps at August 31, 2017 amounted to $5,743,792, $8,468, $6,215,852 and $4,320,937 forGlobal Bond Fund, Investment Quality Bond Fund, Real Return Bond Fund and Total Return Fund, respectively.
For financial reporting purposes, the funds do not offset OTC derivative assets or liabilities that are subject to master netting arrangements, as defined by the ISDAs, in the Statements ofassets and liabilities. In the event of default by the counterparty or a termination of the agreement, the ISDA allows an offset of amounts across the various transactions between the fundsand the applicable counterparty. The tables below reflect certain funds’ exposure to counterparties subject to an ISDA for OTC derivative transactions:
OTC Financial Instruments Asset Liability
Global Bond FundCredit default swaps $1,430 ($214,365)Currency swaps 2,570,759 —Forward foreign currency contracts 4,194,690 (8,125,623)Interest rate swaps — (45,076)Purchased options 109,690 —Volatility swaps — (5,667)Written options — (79,676)
Totals $6,876,569 ($8,470,407)
Counterparty
Total MarketValue of OTC
Derivatives
CollateralPosted by
Counterparty
CollateralPosted by
FundNet
Exposure
Global Bond FundBank of America N.A. ($2,314,765) — $2,314,765 —Barclays Bank 8,925 — — $8,925BNP Paribas (1,683,583) — 1,683,583 —Citibank N.A. 2,273,271 $1,340,000 — 933,271Credit Suisse 114,906 — — 114,906Deutsche Bank AG 71,044 — — 71,044Goldman Sachs Bank USA 1,096,535 — — 1,096,535Goldman Sachs International (60,872) — — (60,872)HSBC Bank USA (914,642) — 886,018 (28,624)JPMorgan Chase Bank, N.A. (922,322) — 768,270 (154,052)Morgan Stanley Company 331,209 300,000 — 31,209Nomura Global Financial Products Inc. (130,241) — 118,998 (11,243)Royal Bank of Canada 2,741 — — 2,741Royal Bank of Scotland 278,879 10,000 — 268,879Standard Chartered Bank (62,363) — — (62,363)UBS AG 317,440 317,440 — —Totals ($1,593,838) $1,967,440 $5,771,634 $2,210,356
Effect of derivative instruments on the Statement of operations
The table below summarizes the net realized gain (loss) included in the net increase (decrease) in net assets from operations, classified by derivative instrument and riskcategory, for the year ended August 31, 2017:
Statements of operations location—Net realized gain (loss) on:
Fund Risk
UnaffiliatedInvestments andForeign Currency
Transactions1Futures
Contracts
ForwardForeign Currency
ContractsWrittenOptions
SwapContracts Total
Asia Pacific Total Return Bond Fund Interest rate — ($78,411) — — — ($78,411)Foreign currency — — $1,933,287 — — 1,933,287Total — ($78,411) $1,933,287 — — $1,854,876
DERIVATIVE INSTRUMENTS, CONTINUED
282
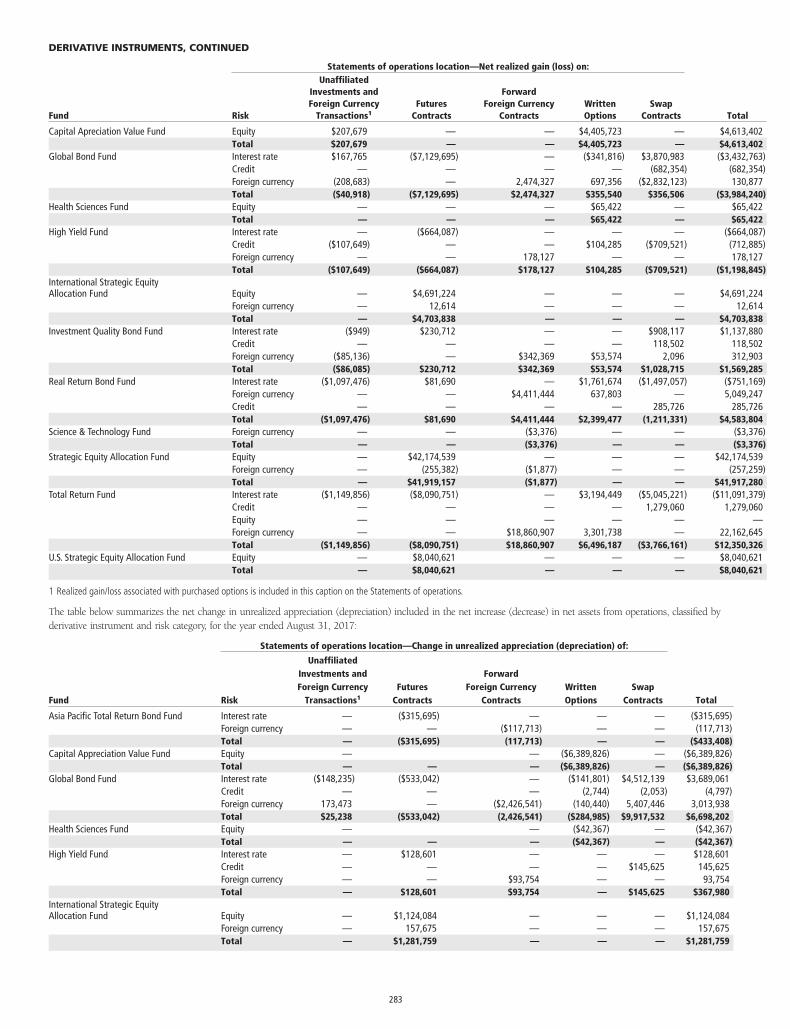
Statements of operations location—Net realized gain (loss) on:
Fund Risk
UnaffiliatedInvestments andForeign Currency
Transactions1Futures
Contracts
ForwardForeign Currency
ContractsWrittenOptions
SwapContracts Total
Capital Apreciation Value Fund Equity $207,679 — — $4,405,723 — $4,613,402Total $207,679 — — $4,405,723 — $4,613,402
Global Bond Fund Interest rate $167,765 ($7,129,695) — ($341,816) $3,870,983 ($3,432,763)Credit — — — — (682,354) (682,354)Foreign currency (208,683) — 2,474,327 697,356 ($2,832,123) 130,877Total ($40,918) ($7,129,695) $2,474,327 $355,540 $356,506 ($3,984,240)
Health Sciences Fund Equity — — — $65,422 — $65,422Total — — — $65,422 — $65,422
High Yield Fund Interest rate — ($664,087) — — — ($664,087)Credit ($107,649) — — $104,285 ($709,521) (712,885)Foreign currency — — 178,127 — — 178,127Total ($107,649) ($664,087) $178,127 $104,285 ($709,521) ($1,198,845)
International Strategic EquityAllocation Fund Equity — $4,691,224 — — — $4,691,224
Foreign currency — 12,614 — — — 12,614Total — $4,703,838 — — — $4,703,838
Investment Quality Bond Fund Interest rate ($949) $230,712 — — $908,117 $1,137,880Credit — — — — 118,502 118,502Foreign currency ($85,136) — $342,369 $53,574 2,096 312,903Total ($86,085) $230,712 $342,369 $53,574 $1,028,715 $1,569,285
Real Return Bond Fund Interest rate ($1,097,476) $81,690 — $1,761,674 ($1,497,057) ($751,169)Foreign currency — — $4,411,444 637,803 — 5,049,247Credit — — — — 285,726 285,726Total ($1,097,476) $81,690 $4,411,444 $2,399,477 (1,211,331) $4,583,804
Science & Technology Fund Foreign currency — — ($3,376) — — ($3,376)Total — — ($3,376) — — ($3,376)
Strategic Equity Allocation Fund Equity — $42,174,539 — — — $42,174,539Foreign currency — (255,382) ($1,877) — — (257,259)Total — $41,919,157 ($1,877) — — $41,917,280
Total Return Fund Interest rate ($1,149,856) ($8,090,751) — $3,194,449 ($5,045,221) ($11,091,379)Credit — — — — 1,279,060 1,279,060Equity — — — — — —Foreign currency — — $18,860,907 3,301,738 — 22,162,645Total ($1,149,856) ($8,090,751) $18,860,907 $6,496,187 ($3,766,161) $12,350,326
U.S. Strategic Equity Allocation Fund Equity — $8,040,621 — — — $8,040,621Total — $8,040,621 — — — $8,040,621
1 Realized gain/loss associated with purchased options is included in this caption on the Statements of operations.
The table below summarizes the net change in unrealized appreciation (depreciation) included in the net increase (decrease) in net assets from operations, classified byderivative instrument and risk category, for the year ended August 31, 2017:
Statements of operations location—Change in unrealized appreciation (depreciation) of:
Fund Risk
UnaffiliatedInvestments andForeign Currency
Transactions1
FuturesContracts
ForwardForeign Currency
ContractsWrittenOptions
SwapContracts Total
Asia Pacific Total Return Bond Fund Interest rate — ($315,695) — — — ($315,695)Foreign currency — — ($117,713) — — (117,713)Total — ($315,695) (117,713) — — ($433,408)
Capital Appreciation Value Fund Equity — — ($6,389,826) — ($6,389,826)Total — — — ($6,389,826) — ($6,389,826)
Global Bond Fund Interest rate ($148,235) ($533,042) — ($141,801) $4,512,139 $3,689,061Credit — — — (2,744) (2,053) (4,797)Foreign currency 173,473 — ($2,426,541) (140,440) 5,407,446 3,013,938Total $25,238 ($533,042) (2,426,541) ($284,985) $9,917,532 $6,698,202
Health Sciences Fund Equity — — ($42,367) — ($42,367)Total — — — ($42,367) — ($42,367)
High Yield Fund Interest rate — $128,601 — — — $128,601Credit — — — — $145,625 145,625Foreign currency — — $93,754 — — 93,754Total — $128,601 $93,754 — $145,625 $367,980
International Strategic EquityAllocation Fund Equity — $1,124,084 — — — $1,124,084
Foreign currency — 157,675 — — — 157,675Total — $1,281,759 — — — $1,281,759
DERIVATIVE INSTRUMENTS, CONTINUED
283
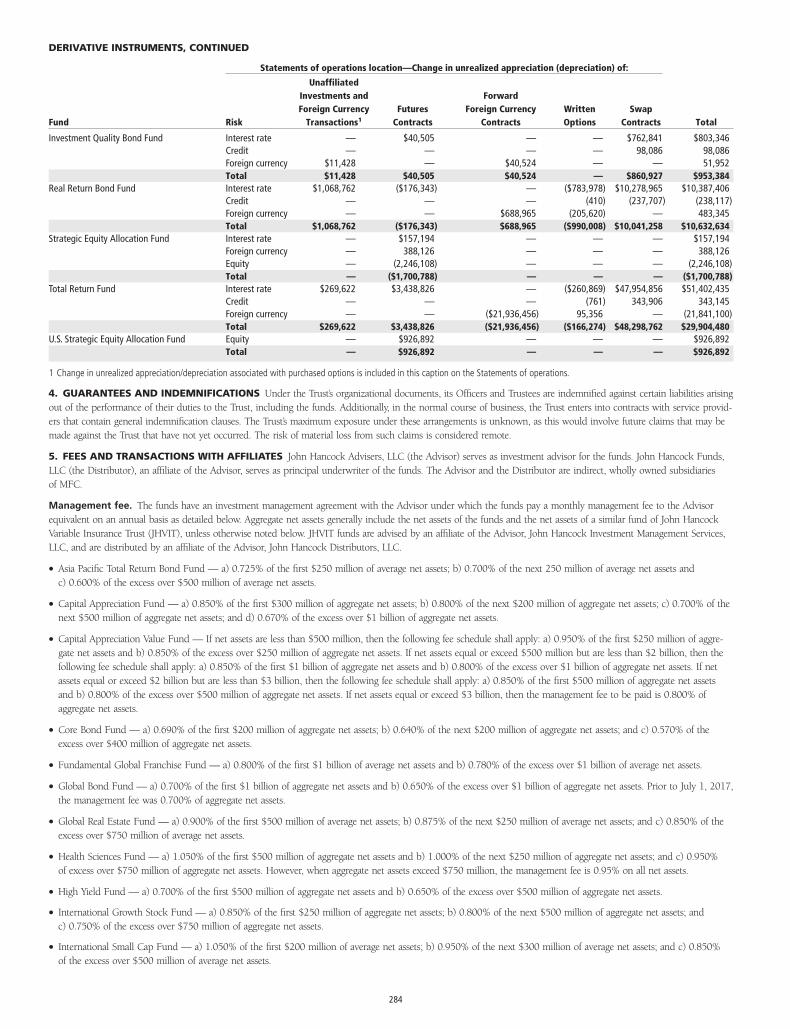
Statements of operations location—Change in unrealized appreciation (depreciation) of:
Fund Risk
UnaffiliatedInvestments andForeign Currency
Transactions1
FuturesContracts
ForwardForeign Currency
ContractsWrittenOptions
SwapContracts Total
Investment Quality Bond Fund Interest rate — $40,505 — — $762,841 $803,346Credit — — — — 98,086 98,086Foreign currency $11,428 — $40,524 — — 51,952Total $11,428 $40,505 $40,524 — $860,927 $953,384
Real Return Bond Fund Interest rate $1,068,762 ($176,343) — ($783,978) $10,278,965 $10,387,406Credit — — — (410) (237,707) (238,117)Foreign currency — — $688,965 (205,620) — 483,345Total $1,068,762 ($176,343) $688,965 ($990,008) $10,041,258 $10,632,634
Strategic Equity Allocation Fund Interest rate — $157,194 — — — $157,194Foreign currency — 388,126 — — — 388,126Equity — (2,246,108) — — — (2,246,108)Total — ($1,700,788) — — — ($1,700,788)
Total Return Fund Interest rate $269,622 $3,438,826 — ($260,869) $47,954,856 $51,402,435Credit — — — (761) 343,906 343,145Foreign currency — — ($21,936,456) 95,356 — (21,841,100)Total $269,622 $3,438,826 ($21,936,456) ($166,274) $48,298,762 $29,904,480
U.S. Strategic Equity Allocation Fund Equity — $926,892 — — — $926,892Total — $926,892 — — — $926,892
1 Change in unrealized appreciation/depreciation associated with purchased options is included in this caption on the Statements of operations.
4. GUARANTEES AND INDEMNIFICATIONS Under the Trust’s organizational documents, its Officers and Trustees are indemnified against certain liabilities arisingout of the performance of their duties to the Trust, including the funds. Additionally, in the normal course of business, the Trust enters into contracts with service provid-ers that contain general indemnification clauses. The Trust’s maximum exposure under these arrangements is unknown, as this would involve future claims that may bemade against the Trust that have not yet occurred. The risk of material loss from such claims is considered remote.
5. FEES AND TRANSACTIONS WITH AFFILIATES John Hancock Advisers, LLC (the Advisor) serves as investment advisor for the funds. John Hancock Funds,LLC (the Distributor), an affiliate of the Advisor, serves as principal underwriter of the funds. The Advisor and the Distributor are indirect, wholly owned subsidiariesof MFC.
Management fee. The funds have an investment management agreement with the Advisor under which the funds pay a monthly management fee to the Advisorequivalent on an annual basis as detailed below. Aggregate net assets generally include the net assets of the funds and the net assets of a similar fund of John HancockVariable Insurance Trust (JHVIT), unless otherwise noted below. JHVIT funds are advised by an affiliate of the Advisor, John Hancock Investment Management Services,LLC, and are distributed by an affiliate of the Advisor, John Hancock Distributors, LLC.
• Asia Pacific Total Return Bond Fund — a) 0.725% of the first $250 million of average net assets; b) 0.700% of the next 250 million of average net assets andc) 0.600% of the excess over $500 million of average net assets.
• Capital Appreciation Fund — a) 0.850% of the first $300 million of aggregate net assets; b) 0.800% of the next $200 million of aggregate net assets; c) 0.700% of thenext $500 million of aggregate net assets; and d) 0.670% of the excess over $1 billion of aggregate net assets.
• Capital Appreciation Value Fund — If net assets are less than $500 million, then the following fee schedule shall apply: a) 0.950% of the first $250 million of aggre-gate net assets and b) 0.850% of the excess over $250 million of aggregate net assets. If net assets equal or exceed $500 million but are less than $2 billion, then thefollowing fee schedule shall apply: a) 0.850% of the first $1 billion of aggregate net assets and b) 0.800% of the excess over $1 billion of aggregate net assets. If netassets equal or exceed $2 billion but are less than $3 billion, then the following fee schedule shall apply: a) 0.850% of the first $500 million of aggregate net assetsand b) 0.800% of the excess over $500 million of aggregate net assets. If net assets equal or exceed $3 billion, then the management fee to be paid is 0.800% ofaggregate net assets.
• Core Bond Fund — a) 0.690% of the first $200 million of aggregate net assets; b) 0.640% of the next $200 million of aggregate net assets; and c) 0.570% of theexcess over $400 million of aggregate net assets.
• Fundamental Global Franchise Fund — a) 0.800% of the first $1 billion of average net assets and b) 0.780% of the excess over $1 billion of average net assets.
• Global Bond Fund — a) 0.700% of the first $1 billion of aggregate net assets and b) 0.650% of the excess over $1 billion of aggregate net assets. Prior to July 1, 2017,the management fee was 0.700% of aggregate net assets.
• Global Real Estate Fund — a) 0.900% of the first $500 million of average net assets; b) 0.875% of the next $250 million of average net assets; and c) 0.850% of theexcess over $750 million of average net assets.
• Health Sciences Fund — a) 1.050% of the first $500 million of aggregate net assets and b) 1.000% of the next $250 million of aggregate net assets; and c) 0.950%of excess over $750 million of aggregate net assets. However, when aggregate net assets exceed $750 million, the management fee is 0.95% on all net assets.
• High Yield Fund — a) 0.700% of the first $500 million of aggregate net assets and b) 0.650% of the excess over $500 million of aggregate net assets.
• International Growth Stock Fund — a) 0.850% of the first $250 million of aggregate net assets; b) 0.800% of the next $500 million of aggregate net assets; andc) 0.750% of the excess over $750 million of aggregate net assets.
• International Small Cap Fund — a) 1.050% of the first $200 million of average net assets; b) 0.950% of the next $300 million of average net assets; and c) 0.850%of the excess over $500 million of average net assets.
DERIVATIVE INSTRUMENTS, CONTINUED
284
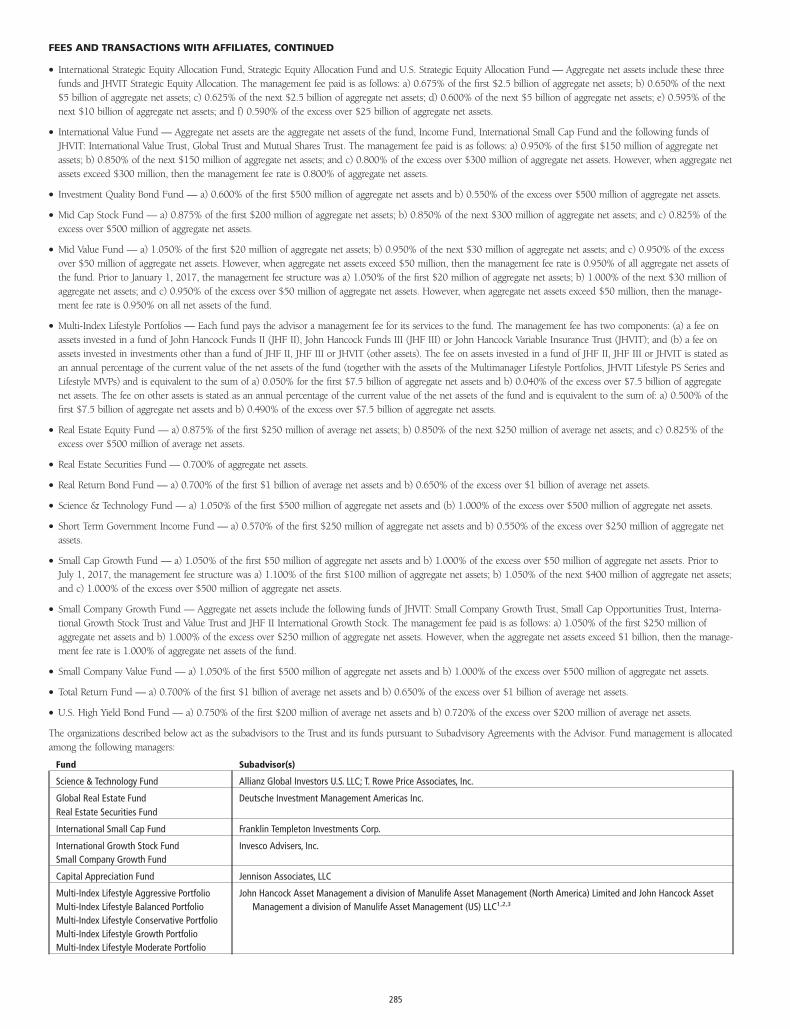
• International Strategic Equity Allocation Fund, Strategic Equity Allocation Fund and U.S. Strategic Equity Allocation Fund — Aggregate net assets include these threefunds and JHVIT Strategic Equity Allocation. The management fee paid is as follows: a) 0.675% of the first $2.5 billion of aggregate net assets; b) 0.650% of the next$5 billion of aggregate net assets; c) 0.625% of the next $2.5 billion of aggregate net assets; d) 0.600% of the next $5 billion of aggregate net assets; e) 0.595% of thenext $10 billion of aggregate net assets; and f) 0.590% of the excess over $25 billion of aggregate net assets.
• International Value Fund — Aggregate net assets are the aggregate net assets of the fund, Income Fund, International Small Cap Fund and the following funds ofJHVIT: International Value Trust, Global Trust and Mutual Shares Trust. The management fee paid is as follows: a) 0.950% of the first $150 million of aggregate netassets; b) 0.850% of the next $150 million of aggregate net assets; and c) 0.800% of the excess over $300 million of aggregate net assets. However, when aggregate netassets exceed $300 million, then the management fee rate is 0.800% of aggregate net assets.
• Investment Quality Bond Fund — a) 0.600% of the first $500 million of aggregate net assets and b) 0.550% of the excess over $500 million of aggregate net assets.
• Mid Cap Stock Fund — a) 0.875% of the first $200 million of aggregate net assets; b) 0.850% of the next $300 million of aggregate net assets; and c) 0.825% of theexcess over $500 million of aggregate net assets.
• Mid Value Fund — a) 1.050% of the first $20 million of aggregate net assets; b) 0.950% of the next $30 million of aggregate net assets; and c) 0.950% of the excessover $50 million of aggregate net assets. However, when aggregate net assets exceed $50 million, then the management fee rate is 0.950% of all aggregate net assets ofthe fund. Prior to January 1, 2017, the management fee structure was a) 1.050% of the first $20 million of aggregate net assets; b) 1.000% of the next $30 million ofaggregate net assets; and c) 0.950% of the excess over $50 million of aggregate net assets. However, when aggregate net assets exceed $50 million, then the manage-ment fee rate is 0.950% on all net assets of the fund.
• Multi-Index Lifestyle Portfolios — Each fund pays the advisor a management fee for its services to the fund. The management fee has two components: (a) a fee onassets invested in a fund of John Hancock Funds II (JHF II), John Hancock Funds III (JHF III) or John Hancock Variable Insurance Trust (JHVIT); and (b) a fee onassets invested in investments other than a fund of JHF II, JHF III or JHVIT (other assets). The fee on assets invested in a fund of JHF II, JHF III or JHVIT is stated asan annual percentage of the current value of the net assets of the fund (together with the assets of the Multimanager Lifestyle Portfolios, JHVIT Lifestyle PS Series andLifestyle MVPs) and is equivalent to the sum of a) 0.050% for the first $7.5 billion of aggregate net assets and b) 0.040% of the excess over $7.5 billion of aggregatenet assets. The fee on other assets is stated as an annual percentage of the current value of the net assets of the fund and is equivalent to the sum of: a) 0.500% of thefirst $7.5 billion of aggregate net assets and b) 0.490% of the excess over $7.5 billion of aggregate net assets.
• Real Estate Equity Fund — a) 0.875% of the first $250 million of average net assets; b) 0.850% of the next $250 million of average net assets; and c) 0.825% of theexcess over $500 million of average net assets.
• Real Estate Securities Fund — 0.700% of aggregate net assets.
• Real Return Bond Fund — a) 0.700% of the first $1 billion of average net assets and b) 0.650% of the excess over $1 billion of average net assets.
• Science & Technology Fund — a) 1.050% of the first $500 million of aggregate net assets and (b) 1.000% of the excess over $500 million of aggregate net assets.
• Short Term Government Income Fund — a) 0.570% of the first $250 million of aggregate net assets and b) 0.550% of the excess over $250 million of aggregate netassets.
• Small Cap Growth Fund — a) 1.050% of the first $50 million of aggregate net assets and b) 1.000% of the excess over $50 million of aggregate net assets. Prior toJuly 1, 2017, the management fee structure was a) 1.100% of the first $100 million of aggregate net assets; b) 1.050% of the next $400 million of aggregate net assets;and c) 1.000% of the excess over $500 million of aggregate net assets.
• Small Company Growth Fund — Aggregate net assets include the following funds of JHVIT: Small Company Growth Trust, Small Cap Opportunities Trust, Interna-tional Growth Stock Trust and Value Trust and JHF II International Growth Stock. The management fee paid is as follows: a) 1.050% of the first $250 million ofaggregate net assets and b) 1.000% of the excess over $250 million of aggregate net assets. However, when the aggregate net assets exceed $1 billion, then the manage-ment fee rate is 1.000% of aggregate net assets of the fund.
• Small Company Value Fund — a) 1.050% of the first $500 million of aggregate net assets and b) 1.000% of the excess over $500 million of aggregate net assets.
• Total Return Fund — a) 0.700% of the first $1 billion of average net assets and b) 0.650% of the excess over $1 billion of average net assets.
• U.S. High Yield Bond Fund — a) 0.750% of the first $200 million of average net assets and b) 0.720% of the excess over $200 million of average net assets.
The organizations described below act as the subadvisors to the Trust and its funds pursuant to Subadvisory Agreements with the Advisor. Fund management is allocatedamong the following managers:
Fund Subadvisor(s)
Science & Technology Fund Allianz Global Investors U.S. LLC; T. Rowe Price Associates, Inc.
Global Real Estate FundReal Estate Securities Fund
Deutsche Investment Management Americas Inc.
International Small Cap Fund Franklin Templeton Investments Corp.
International Growth Stock Fund Invesco Advisers, Inc.Small Company Growth Fund
Capital Appreciation Fund Jennison Associates, LLC
Multi-Index Lifestyle Aggressive Portfolio John Hancock Asset Management a division of Manulife Asset Management (North America) Limited and John Hancock AssetMulti-Index Lifestyle Balanced Portfolio Management a division of Manulife Asset Management (US) LLC1,2,3
Multi-Index Lifestyle Conservative PortfolioMulti-Index Lifestyle Growth PortfolioMulti-Index Lifestyle Moderate Portfolio
FEES AND TRANSACTIONS WITH AFFILIATES, CONTINUED
285
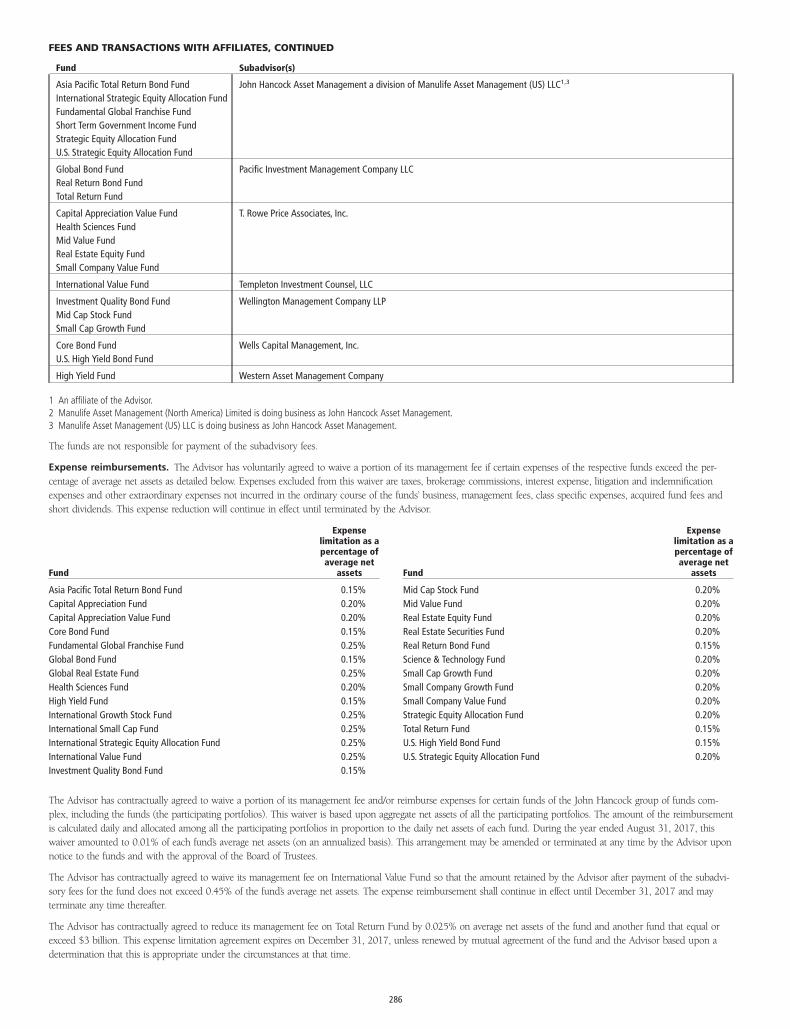
Fund Subadvisor(s)
Asia Pacific Total Return Bond Fund John Hancock Asset Management a division of Manulife Asset Management (US) LLC1,3
International Strategic Equity Allocation FundFundamental Global Franchise FundShort Term Government Income FundStrategic Equity Allocation FundU.S. Strategic Equity Allocation Fund
Global Bond Fund Pacific Investment Management Company LLCReal Return Bond FundTotal Return Fund
Capital Appreciation Value Fund T. Rowe Price Associates, Inc.Health Sciences FundMid Value FundReal Estate Equity FundSmall Company Value Fund
International Value Fund Templeton Investment Counsel, LLC
Investment Quality Bond Fund Wellington Management Company LLPMid Cap Stock FundSmall Cap Growth Fund
Core Bond Fund Wells Capital Management, Inc.U.S. High Yield Bond Fund
High Yield Fund Western Asset Management Company
1 An affiliate of the Advisor.2 Manulife Asset Management (North America) Limited is doing business as John Hancock Asset Management.3 Manulife Asset Management (US) LLC is doing business as John Hancock Asset Management.
The funds are not responsible for payment of the subadvisory fees.
Expense reimbursements. The Advisor has voluntarily agreed to waive a portion of its management fee if certain expenses of the respective funds exceed the per-centage of average net assets as detailed below. Expenses excluded from this waiver are taxes, brokerage commissions, interest expense, litigation and indemnificationexpenses and other extraordinary expenses not incurred in the ordinary course of the funds’ business, management fees, class specific expenses, acquired fund fees andshort dividends. This expense reduction will continue in effect until terminated by the Advisor.
Fund
Expenselimitation as apercentage ofaverage net
assets
Asia Pacific Total Return Bond Fund 0.15%Capital Appreciation Fund 0.20%Capital Appreciation Value Fund 0.20%Core Bond Fund 0.15%Fundamental Global Franchise Fund 0.25%Global Bond Fund 0.15%Global Real Estate Fund 0.25%Health Sciences Fund 0.20%High Yield Fund 0.15%International Growth Stock Fund 0.25%International Small Cap Fund 0.25%International Strategic Equity Allocation Fund 0.25%International Value Fund 0.25%Investment Quality Bond Fund 0.15%
Fund
Expenselimitation as apercentage ofaverage net
assets
Mid Cap Stock Fund 0.20%Mid Value Fund 0.20%Real Estate Equity Fund 0.20%Real Estate Securities Fund 0.20%Real Return Bond Fund 0.15%Science & Technology Fund 0.20%Small Cap Growth Fund 0.20%Small Company Growth Fund 0.20%Small Company Value Fund 0.20%Strategic Equity Allocation Fund 0.20%Total Return Fund 0.15%U.S. High Yield Bond Fund 0.15%U.S. Strategic Equity Allocation Fund 0.20%
The Advisor has contractually agreed to waive a portion of its management fee and/or reimburse expenses for certain funds of the John Hancock group of funds com-plex, including the funds (the participating portfolios). This waiver is based upon aggregate net assets of all the participating portfolios. The amount of the reimbursementis calculated daily and allocated among all the participating portfolios in proportion to the daily net assets of each fund. During the year ended August 31, 2017, thiswaiver amounted to 0.01% of each fund’s average net assets (on an annualized basis). This arrangement may be amended or terminated at any time by the Advisor uponnotice to the funds and with the approval of the Board of Trustees.
The Advisor has contractually agreed to waive its management fee on International Value Fund so that the amount retained by the Advisor after payment of the subadvi-sory fees for the fund does not exceed 0.45% of the fund’s average net assets. The expense reimbursement shall continue in effect until December 31, 2017 and mayterminate any time thereafter.
The Advisor has contractually agreed to reduce its management fee on Total Return Fund by 0.025% on average net assets of the fund and another fund that equal orexceed $3 billion. This expense limitation agreement expires on December 31, 2017, unless renewed by mutual agreement of the fund and the Advisor based upon adetermination that this is appropriate under the circumstances at that time.
FEES AND TRANSACTIONS WITH AFFILIATES, CONTINUED
286
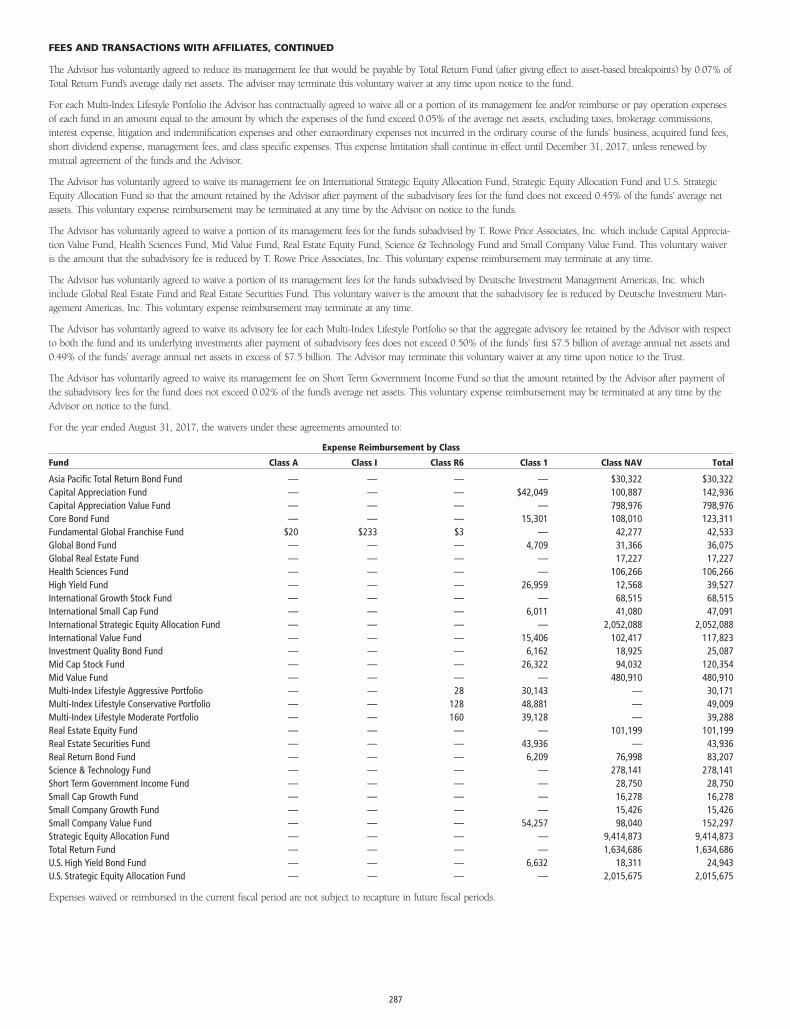
The Advisor has voluntarily agreed to reduce its management fee that would be payable by Total Return Fund (after giving effect to asset-based breakpoints) by 0.07% ofTotal Return Fund’s average daily net assets. The advisor may terminate this voluntary waiver at any time upon notice to the fund.
For each Multi-Index Lifestyle Portfolio the Advisor has contractually agreed to waive all or a portion of its management fee and/or reimburse or pay operation expensesof each fund in an amount equal to the amount by which the expenses of the fund exceed 0.05% of the average net assets, excluding taxes, brokerage commissions,interest expense, litigation and indemnification expenses and other extraordinary expenses not incurred in the ordinary course of the funds’ business, acquired fund fees,short dividend expense, management fees, and class specific expenses. This expense limitation shall continue in effect until December 31, 2017, unless renewed bymutual agreement of the funds and the Advisor.
The Advisor has voluntarily agreed to waive its management fee on International Strategic Equity Allocation Fund, Strategic Equity Allocation Fund and U.S. StrategicEquity Allocation Fund so that the amount retained by the Advisor after payment of the subadvisory fees for the fund does not exceed 0.45% of the funds’ average netassets. This voluntary expense reimbursement may be terminated at any time by the Advisor on notice to the funds.
The Advisor has voluntarily agreed to waive a portion of its management fees for the funds subadvised by T. Rowe Price Associates, Inc. which include Capital Apprecia-tion Value Fund, Health Sciences Fund, Mid Value Fund, Real Estate Equity Fund, Science & Technology Fund and Small Company Value Fund. This voluntary waiveris the amount that the subadvisory fee is reduced by T. Rowe Price Associates, Inc. This voluntary expense reimbursement may terminate at any time.
The Advisor has voluntarily agreed to waive a portion of its management fees for the funds subadvised by Deutsche Investment Management Americas, Inc. whichinclude Global Real Estate Fund and Real Estate Securities Fund. This voluntary waiver is the amount that the subadvisory fee is reduced by Deutsche Investment Man-agement Americas, Inc. This voluntary expense reimbursement may terminate at any time.
The Advisor has voluntarily agreed to waive its advisory fee for each Multi-Index Lifestyle Portfolio so that the aggregate advisory fee retained by the Advisor with respectto both the fund and its underlying investments after payment of subadvisory fees does not exceed 0.50% of the funds’ first $7.5 billion of average annual net assets and0.49% of the funds’ average annual net assets in excess of $7.5 billion. The Advisor may terminate this voluntary waiver at any time upon notice to the Trust.
The Advisor has voluntarily agreed to waive its management fee on Short Term Government Income Fund so that the amount retained by the Advisor after payment ofthe subadvisory fees for the fund does not exceed 0.02% of the fund’s average net assets. This voluntary expense reimbursement may be terminated at any time by theAdvisor on notice to the fund.
For the year ended August 31, 2017, the waivers under these agreements amounted to:
Expense Reimbursement by Class
Fund Class A Class I Class R6 Class 1 Class NAV Total
Asia Pacific Total Return Bond Fund — — — — $30,322 $30,322Capital Appreciation Fund — — — $42,049 100,887 142,936Capital Appreciation Value Fund — — — — 798,976 798,976Core Bond Fund — — — 15,301 108,010 123,311Fundamental Global Franchise Fund $20 $233 $3 — 42,277 42,533Global Bond Fund — — — 4,709 31,366 36,075Global Real Estate Fund — — — — 17,227 17,227Health Sciences Fund — — — — 106,266 106,266High Yield Fund — — — 26,959 12,568 39,527International Growth Stock Fund — — — — 68,515 68,515International Small Cap Fund — — — 6,011 41,080 47,091International Strategic Equity Allocation Fund — — — — 2,052,088 2,052,088International Value Fund — — — 15,406 102,417 117,823Investment Quality Bond Fund — — — 6,162 18,925 25,087Mid Cap Stock Fund — — — 26,322 94,032 120,354Mid Value Fund — — — — 480,910 480,910Multi-Index Lifestyle Aggressive Portfolio — — 28 30,143 — 30,171Multi-Index Lifestyle Conservative Portfolio — — 128 48,881 — 49,009Multi-Index Lifestyle Moderate Portfolio — — 160 39,128 — 39,288Real Estate Equity Fund — — — — 101,199 101,199Real Estate Securities Fund — — — 43,936 — 43,936Real Return Bond Fund — — — 6,209 76,998 83,207Science & Technology Fund — — — — 278,141 278,141Short Term Government Income Fund — — — — 28,750 28,750Small Cap Growth Fund — — — — 16,278 16,278Small Company Growth Fund — — — — 15,426 15,426Small Company Value Fund — — — 54,257 98,040 152,297Strategic Equity Allocation Fund — — — — 9,414,873 9,414,873Total Return Fund — — — — 1,634,686 1,634,686U.S. High Yield Bond Fund — — — 6,632 18,311 24,943U.S. Strategic Equity Allocation Fund — — — — 2,015,675 2,015,675
Expenses waived or reimbursed in the current fiscal period are not subject to recapture in future fiscal periods.
FEES AND TRANSACTIONS WITH AFFILIATES, CONTINUED
287
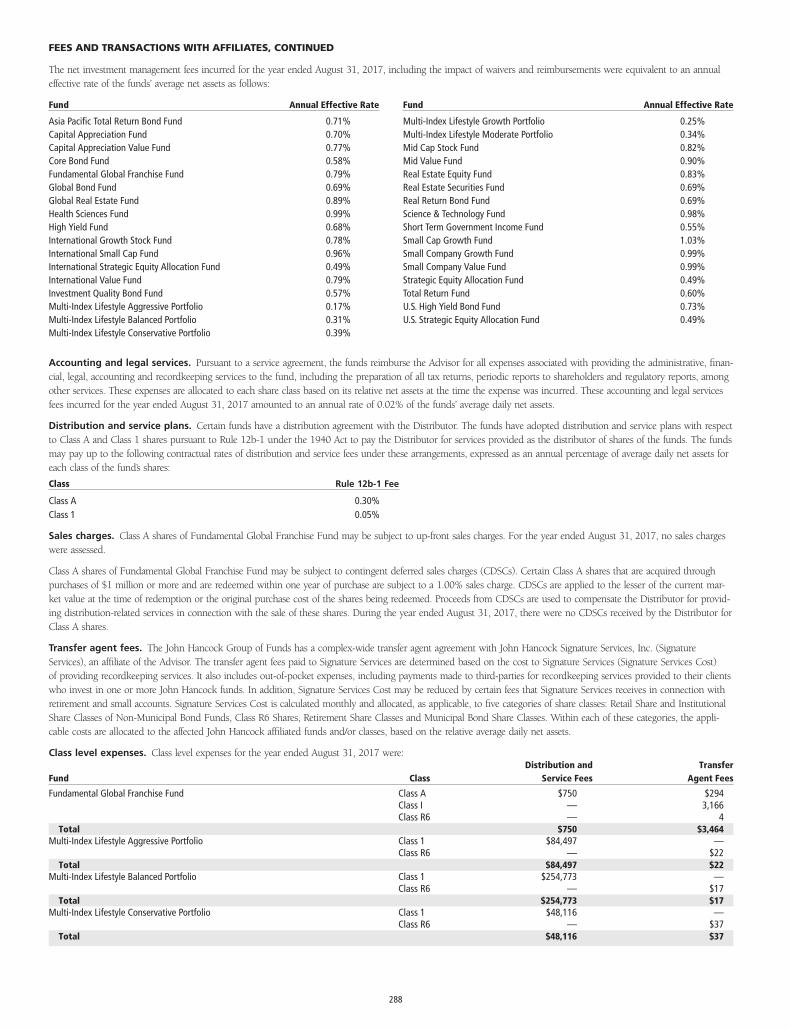
The net investment management fees incurred for the year ended August 31, 2017, including the impact of waivers and reimbursements were equivalent to an annualeffective rate of the funds’ average net assets as follows:
Fund Annual Effective Rate
Asia Pacific Total Return Bond Fund 0.71%Capital Appreciation Fund 0.70%Capital Appreciation Value Fund 0.77%Core Bond Fund 0.58%Fundamental Global Franchise Fund 0.79%Global Bond Fund 0.69%Global Real Estate Fund 0.89%Health Sciences Fund 0.99%High Yield Fund 0.68%International Growth Stock Fund 0.78%International Small Cap Fund 0.96%International Strategic Equity Allocation Fund 0.49%International Value Fund 0.79%Investment Quality Bond Fund 0.57%Multi-Index Lifestyle Aggressive Portfolio 0.17%Multi-Index Lifestyle Balanced Portfolio 0.31%Multi-Index Lifestyle Conservative Portfolio 0.39%
Fund Annual Effective Rate
Multi-Index Lifestyle Growth Portfolio 0.25%Multi-Index Lifestyle Moderate Portfolio 0.34%Mid Cap Stock Fund 0.82%Mid Value Fund 0.90%Real Estate Equity Fund 0.83%Real Estate Securities Fund 0.69%Real Return Bond Fund 0.69%Science & Technology Fund 0.98%Short Term Government Income Fund 0.55%Small Cap Growth Fund 1.03%Small Company Growth Fund 0.99%Small Company Value Fund 0.99%Strategic Equity Allocation Fund 0.49%Total Return Fund 0.60%U.S. High Yield Bond Fund 0.73%U.S. Strategic Equity Allocation Fund 0.49%
Accounting and legal services. Pursuant to a service agreement, the funds reimburse the Advisor for all expenses associated with providing the administrative, finan-cial, legal, accounting and recordkeeping services to the fund, including the preparation of all tax returns, periodic reports to shareholders and regulatory reports, amongother services. These expenses are allocated to each share class based on its relative net assets at the time the expense was incurred. These accounting and legal servicesfees incurred for the year ended August 31, 2017 amounted to an annual rate of 0.02% of the funds’ average daily net assets.
Distribution and service plans. Certain funds have a distribution agreement with the Distributor. The funds have adopted distribution and service plans with respectto Class A and Class 1 shares pursuant to Rule 12b-1 under the 1940 Act to pay the Distributor for services provided as the distributor of shares of the funds. The fundsmay pay up to the following contractual rates of distribution and service fees under these arrangements, expressed as an annual percentage of average daily net assets foreach class of the fund’s shares:
Class Rule 12b-1 Fee
Class A 0.30%Class 1 0.05%
Sales charges. Class A shares of Fundamental Global Franchise Fund may be subject to up-front sales charges. For the year ended August 31, 2017, no sales chargeswere assessed.
Class A shares of Fundamental Global Franchise Fund may be subject to contingent deferred sales charges (CDSCs). Certain Class A shares that are acquired throughpurchases of $1 million or more and are redeemed within one year of purchase are subject to a 1.00% sales charge. CDSCs are applied to the lesser of the current mar-ket value at the time of redemption or the original purchase cost of the shares being redeemed. Proceeds from CDSCs are used to compensate the Distributor for provid-ing distribution-related services in connection with the sale of these shares. During the year ended August 31, 2017, there were no CDSCs received by the Distributor forClass A shares.
Transfer agent fees. The John Hancock Group of Funds has a complex-wide transfer agent agreement with John Hancock Signature Services, Inc. (SignatureServices), an affiliate of the Advisor. The transfer agent fees paid to Signature Services are determined based on the cost to Signature Services (Signature Services Cost)of providing recordkeeping services. It also includes out-of-pocket expenses, including payments made to third-parties for recordkeeping services provided to their clientswho invest in one or more John Hancock funds. In addition, Signature Services Cost may be reduced by certain fees that Signature Services receives in connection withretirement and small accounts. Signature Services Cost is calculated monthly and allocated, as applicable, to five categories of share classes: Retail Share and InstitutionalShare Classes of Non-Municipal Bond Funds, Class R6 Shares, Retirement Share Classes and Municipal Bond Share Classes. Within each of these categories, the appli-cable costs are allocated to the affected John Hancock affiliated funds and/or classes, based on the relative average daily net assets.
Class level expenses. Class level expenses for the year ended August 31, 2017 were:
Fund ClassDistribution and
Service FeesTransfer
Agent Fees
Fundamental Global Franchise Fund Class A $750 $294Class I — 3,166Class R6 — 4
Total $750 $3,464Multi-Index Lifestyle Aggressive Portfolio Class 1 $84,497 —
Class R6 — $22Total $84,497 $22
Multi-Index Lifestyle Balanced Portfolio Class 1 $254,773 —Class R6 — $17
Total $254,773 $17Multi-Index Lifestyle Conservative Portfolio Class 1 $48,116 —
Class R6 — $37Total $48,116 $37
FEES AND TRANSACTIONS WITH AFFILIATES, CONTINUED
288
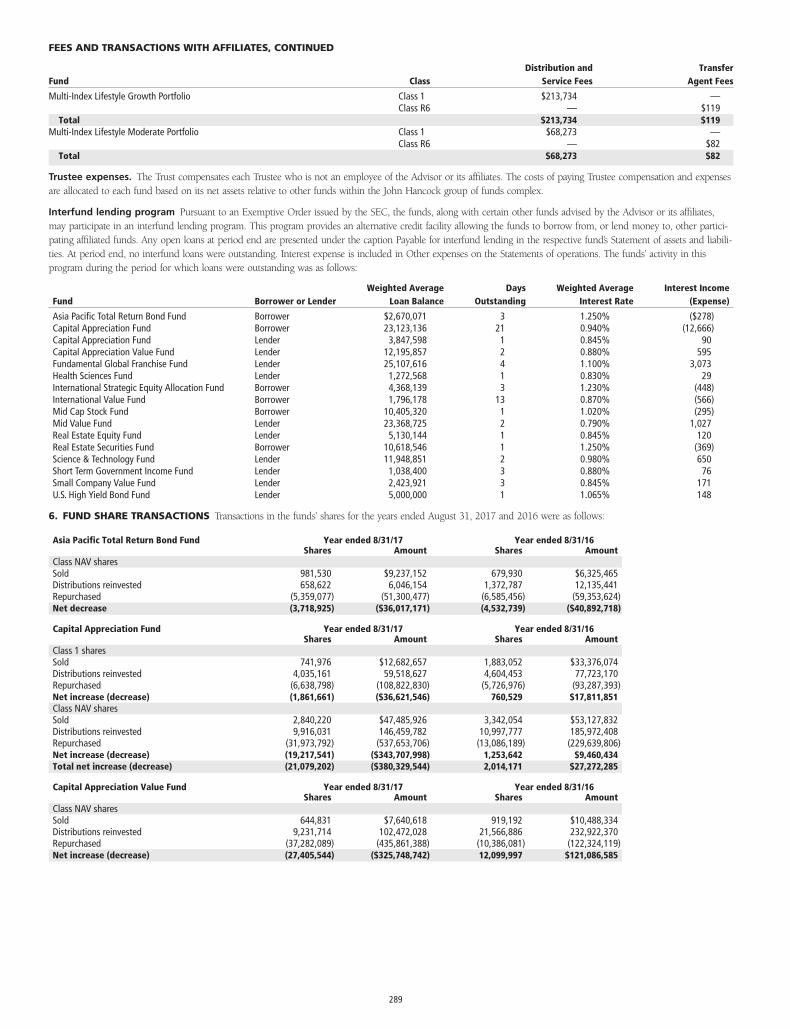
Fund ClassDistribution and
Service FeesTransfer
Agent Fees
Multi-Index Lifestyle Growth Portfolio Class 1 $213,734 —Class R6 — $119
Total $213,734 $119Multi-Index Lifestyle Moderate Portfolio Class 1 $68,273 —
Class R6 — $82Total $68,273 $82
Trustee expenses. The Trust compensates each Trustee who is not an employee of the Advisor or its affiliates. The costs of paying Trustee compensation and expensesare allocated to each fund based on its net assets relative to other funds within the John Hancock group of funds complex.
Interfund lending program Pursuant to an Exemptive Order issued by the SEC, the funds, along with certain other funds advised by the Advisor or its affiliates,may participate in an interfund lending program. This program provides an alternative credit facility allowing the funds to borrow from, or lend money to, other partici-pating affiliated funds. Any open loans at period end are presented under the caption Payable for interfund lending in the respective fund’s Statement of assets and liabili-ties. At period end, no interfund loans were outstanding. Interest expense is included in Other expenses on the Statements of operations. The funds’ activity in thisprogram during the period for which loans were outstanding was as follows:
Fund Borrower or LenderWeighted Average
Loan BalanceDays
OutstandingWeighted Average
Interest RateInterest Income
(Expense)
Asia Pacific Total Return Bond Fund Borrower $2,670,071 3 1.250% ($278)Capital Appreciation Fund Borrower 23,123,136 21 0.940% (12,666)Capital Appreciation Fund Lender 3,847,598 1 0.845% 90Capital Appreciation Value Fund Lender 12,195,857 2 0.880% 595Fundamental Global Franchise Fund Lender 25,107,616 4 1.100% 3,073Health Sciences Fund Lender 1,272,568 1 0.830% 29International Strategic Equity Allocation Fund Borrower 4,368,139 3 1.230% (448)International Value Fund Borrower 1,796,178 13 0.870% (566)Mid Cap Stock Fund Borrower 10,405,320 1 1.020% (295)Mid Value Fund Lender 23,368,725 2 0.790% 1,027Real Estate Equity Fund Lender 5,130,144 1 0.845% 120Real Estate Securities Fund Borrower 10,618,546 1 1.250% (369)Science & Technology Fund Lender 11,948,851 2 0.980% 650Short Term Government Income Fund Lender 1,038,400 3 0.880% 76Small Company Value Fund Lender 2,423,921 3 0.845% 171U.S. High Yield Bond Fund Lender 5,000,000 1 1.065% 148
6. FUND SHARE TRANSACTIONS Transactions in the funds’ shares for the years ended August 31, 2017 and 2016 were as follows:
Asia Pacific Total Return Bond Fund Year ended 8/31/17 Year ended 8/31/16Shares Amount Shares Amount
Class NAV sharesSold 981,530 $9,237,152 679,930 $6,325,465Distributions reinvested 658,622 6,046,154 1,372,787 12,135,441Repurchased (5,359,077) (51,300,477) (6,585,456) (59,353,624)Net decrease (3,718,925) ($36,017,171) (4,532,739) ($40,892,718)
Capital Appreciation Fund Year ended 8/31/17 Year ended 8/31/16Shares Amount Shares Amount
Class 1 sharesSold 741,976 $12,682,657 1,883,052 $33,376,074Distributions reinvested 4,035,161 59,518,627 4,604,453 77,723,170Repurchased (6,638,798) (108,822,830) (5,726,976) (93,287,393)Net increase (decrease) (1,861,661) ($36,621,546) 760,529 $17,811,851Class NAV sharesSold 2,840,220 $47,485,926 3,342,054 $53,127,832Distributions reinvested 9,916,031 146,459,782 10,997,777 185,972,408Repurchased (31,973,792) (537,653,706) (13,086,189) (229,639,806)Net increase (decrease) (19,217,541) ($343,707,998) 1,253,642 $9,460,434Total net increase (decrease) (21,079,202) ($380,329,544) 2,014,171 $27,272,285
Capital Appreciation Value Fund Year ended 8/31/17 Year ended 8/31/16Shares Amount Shares Amount
Class NAV sharesSold 644,831 $7,640,618 919,192 $10,488,334Distributions reinvested 9,231,714 102,472,028 21,566,886 232,922,370Repurchased (37,282,089) (435,861,388) (10,386,081) (122,324,119)Net increase (decrease) (27,405,544) ($325,748,742) 12,099,997 $121,086,585
FEES AND TRANSACTIONS WITH AFFILIATES, CONTINUED
289
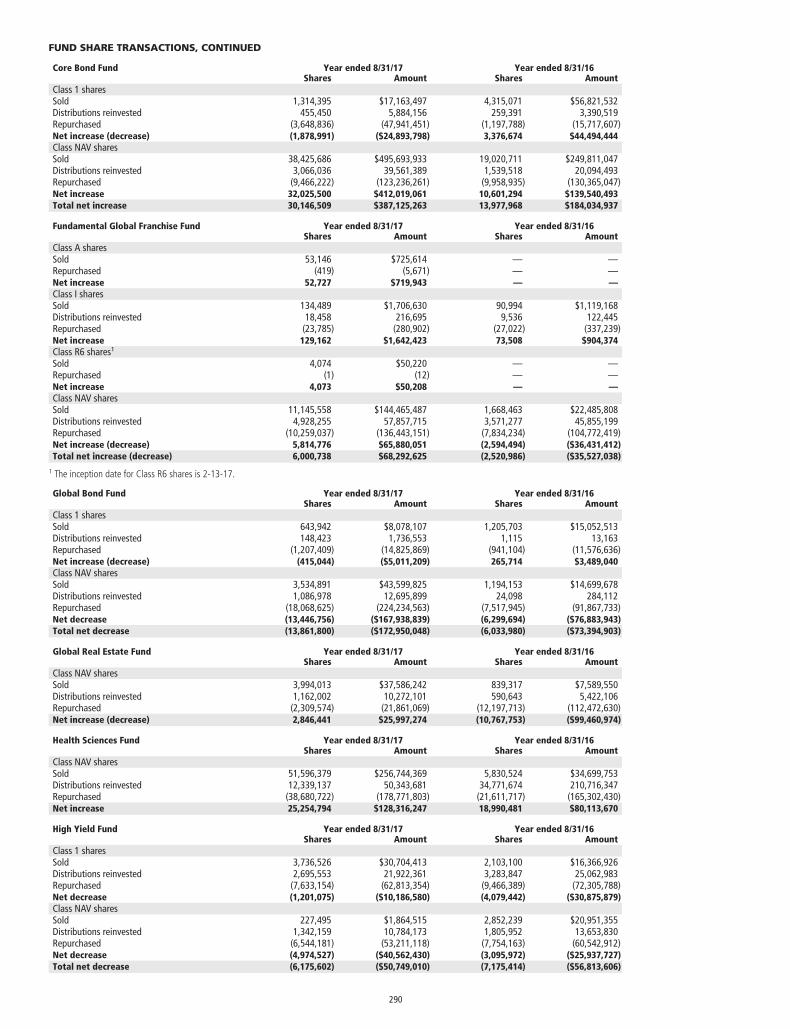
Core Bond Fund Year ended 8/31/17 Year ended 8/31/16Shares Amount Shares Amount
Class 1 sharesSold 1,314,395 $17,163,497 4,315,071 $56,821,532Distributions reinvested 455,450 5,884,156 259,391 3,390,519Repurchased (3,648,836) (47,941,451) (1,197,788) (15,717,607)Net increase (decrease) (1,878,991) ($24,893,798) 3,376,674 $44,494,444Class NAV sharesSold 38,425,686 $495,693,933 19,020,711 $249,811,047Distributions reinvested 3,066,036 39,561,389 1,539,518 20,094,493Repurchased (9,466,222) (123,236,261) (9,958,935) (130,365,047)Net increase 32,025,500 $412,019,061 10,601,294 $139,540,493Total net increase 30,146,509 $387,125,263 13,977,968 $184,034,937
Fundamental Global Franchise Fund Year ended 8/31/17 Year ended 8/31/16Shares Amount Shares Amount
Class A sharesSold 53,146 $725,614 — —Repurchased (419) (5,671) — —Net increase 52,727 $719,943 — —Class I sharesSold 134,489 $1,706,630 90,994 $1,119,168Distributions reinvested 18,458 216,695 9,536 122,445Repurchased (23,785) (280,902) (27,022) (337,239)Net increase 129,162 $1,642,423 73,508 $904,374Class R6 shares1
Sold 4,074 $50,220 — —Repurchased (1) (12) — —Net increase 4,073 $50,208 — —Class NAV sharesSold 11,145,558 $144,465,487 1,668,463 $22,485,808Distributions reinvested 4,928,255 57,857,715 3,571,277 45,855,199Repurchased (10,259,037) (136,443,151) (7,834,234) (104,772,419)Net increase (decrease) 5,814,776 $65,880,051 (2,594,494) ($36,431,412)Total net increase (decrease) 6,000,738 $68,292,625 (2,520,986) ($35,527,038)
1 The inception date for Class R6 shares is 2-13-17.
Global Bond Fund Year ended 8/31/17 Year ended 8/31/16Shares Amount Shares Amount
Class 1 sharesSold 643,942 $8,078,107 1,205,703 $15,052,513Distributions reinvested 148,423 1,736,553 1,115 13,163Repurchased (1,207,409) (14,825,869) (941,104) (11,576,636)Net increase (decrease) (415,044) ($5,011,209) 265,714 $3,489,040Class NAV sharesSold 3,534,891 $43,599,825 1,194,153 $14,699,678Distributions reinvested 1,086,978 12,695,899 24,098 284,112Repurchased (18,068,625) (224,234,563) (7,517,945) (91,867,733)Net decrease (13,446,756) ($167,938,839) (6,299,694) ($76,883,943)Total net decrease (13,861,800) ($172,950,048) (6,033,980) ($73,394,903)
Global Real Estate Fund Year ended 8/31/17 Year ended 8/31/16Shares Amount Shares Amount
Class NAV sharesSold 3,994,013 $37,586,242 839,317 $7,589,550Distributions reinvested 1,162,002 10,272,101 590,643 5,422,106Repurchased (2,309,574) (21,861,069) (12,197,713) (112,472,630)Net increase (decrease) 2,846,441 $25,997,274 (10,767,753) ($99,460,974)
Health Sciences Fund Year ended 8/31/17 Year ended 8/31/16Shares Amount Shares Amount
Class NAV sharesSold 51,596,379 $256,744,369 5,830,524 $34,699,753Distributions reinvested 12,339,137 50,343,681 34,771,674 210,716,347Repurchased (38,680,722) (178,771,803) (21,611,717) (165,302,430)Net increase 25,254,794 $128,316,247 18,990,481 $80,113,670
High Yield Fund Year ended 8/31/17 Year ended 8/31/16Shares Amount Shares Amount
Class 1 sharesSold 3,736,526 $30,704,413 2,103,100 $16,366,926Distributions reinvested 2,695,553 21,922,361 3,283,847 25,062,983Repurchased (7,633,154) (62,813,354) (9,466,389) (72,305,788)Net decrease (1,201,075) ($10,186,580) (4,079,442) ($30,875,879)Class NAV sharesSold 227,495 $1,864,515 2,852,239 $20,951,355Distributions reinvested 1,342,159 10,784,173 1,805,952 13,653,830Repurchased (6,544,181) (53,211,118) (7,754,163) (60,542,912)Net decrease (4,974,527) ($40,562,430) (3,095,972) ($25,937,727)Total net decrease (6,175,602) ($50,749,010) (7,175,414) ($56,813,606)
FUND SHARE TRANSACTIONS, CONTINUED
290
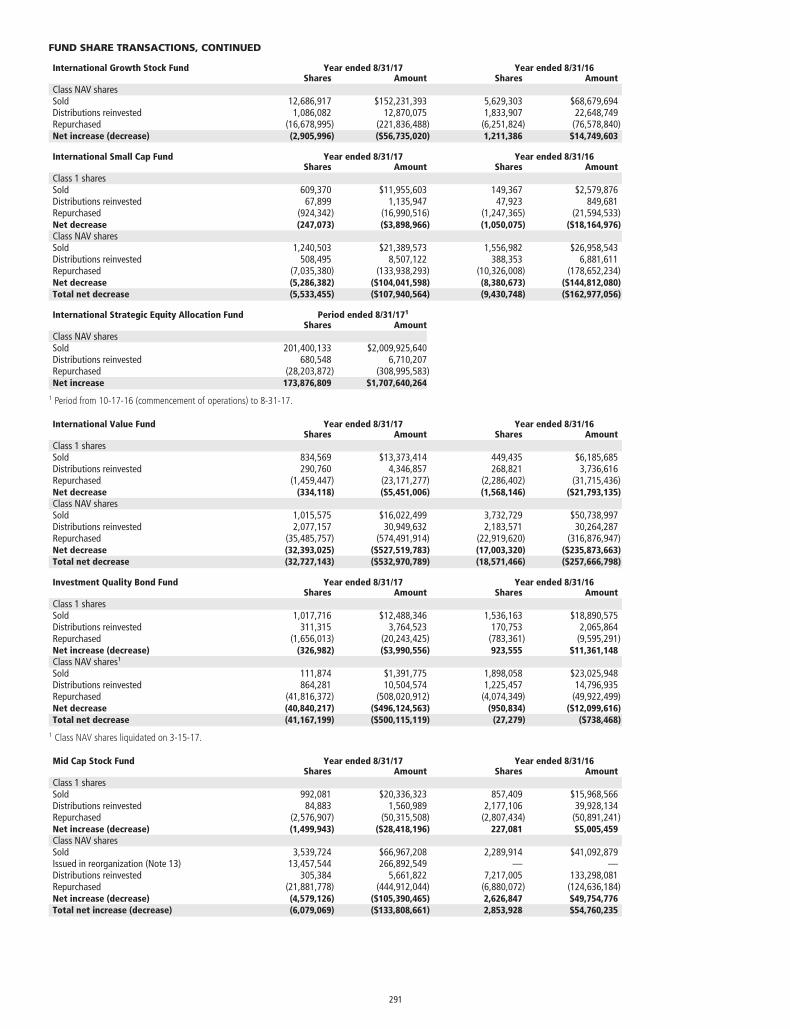
International Growth Stock Fund Year ended 8/31/17 Year ended 8/31/16Shares Amount Shares Amount
Class NAV sharesSold 12,686,917 $152,231,393 5,629,303 $68,679,694Distributions reinvested 1,086,082 12,870,075 1,833,907 22,648,749Repurchased (16,678,995) (221,836,488) (6,251,824) (76,578,840)Net increase (decrease) (2,905,996) ($56,735,020) 1,211,386 $14,749,603
International Small Cap Fund Year ended 8/31/17 Year ended 8/31/16Shares Amount Shares Amount
Class 1 sharesSold 609,370 $11,955,603 149,367 $2,579,876Distributions reinvested 67,899 1,135,947 47,923 849,681Repurchased (924,342) (16,990,516) (1,247,365) (21,594,533)Net decrease (247,073) ($3,898,966) (1,050,075) ($18,164,976)Class NAV sharesSold 1,240,503 $21,389,573 1,556,982 $26,958,543Distributions reinvested 508,495 8,507,122 388,353 6,881,611Repurchased (7,035,380) (133,938,293) (10,326,008) (178,652,234)Net decrease (5,286,382) ($104,041,598) (8,380,673) ($144,812,080)Total net decrease (5,533,455) ($107,940,564) (9,430,748) ($162,977,056)
International Strategic Equity Allocation Fund Period ended 8/31/171
Shares AmountClass NAV sharesSold 201,400,133 $2,009,925,640Distributions reinvested 680,548 6,710,207Repurchased (28,203,872) (308,995,583)Net increase 173,876,809 $1,707,640,264
1 Period from 10-17-16 (commencement of operations) to 8-31-17.
International Value Fund Year ended 8/31/17 Year ended 8/31/16Shares Amount Shares Amount
Class 1 sharesSold 834,569 $13,373,414 449,435 $6,185,685Distributions reinvested 290,760 4,346,857 268,821 3,736,616Repurchased (1,459,447) (23,171,277) (2,286,402) (31,715,436)Net decrease (334,118) ($5,451,006) (1,568,146) ($21,793,135)Class NAV sharesSold 1,015,575 $16,022,499 3,732,729 $50,738,997Distributions reinvested 2,077,157 30,949,632 2,183,571 30,264,287Repurchased (35,485,757) (574,491,914) (22,919,620) (316,876,947)Net decrease (32,393,025) ($527,519,783) (17,003,320) ($235,873,663)Total net decrease (32,727,143) ($532,970,789) (18,571,466) ($257,666,798)
Investment Quality Bond Fund Year ended 8/31/17 Year ended 8/31/16Shares Amount Shares Amount
Class 1 sharesSold 1,017,716 $12,488,346 1,536,163 $18,890,575Distributions reinvested 311,315 3,764,523 170,753 2,065,864Repurchased (1,656,013) (20,243,425) (783,361) (9,595,291)Net increase (decrease) (326,982) ($3,990,556) 923,555 $11,361,148Class NAV shares1
Sold 111,874 $1,391,775 1,898,058 $23,025,948Distributions reinvested 864,281 10,504,574 1,225,457 14,796,935Repurchased (41,816,372) (508,020,912) (4,074,349) (49,922,499)Net decrease (40,840,217) ($496,124,563) (950,834) ($12,099,616)Total net decrease (41,167,199) ($500,115,119) (27,279) ($738,468)
1 Class NAV shares liquidated on 3-15-17.
Mid Cap Stock Fund Year ended 8/31/17 Year ended 8/31/16Shares Amount Shares Amount
Class 1 sharesSold 992,081 $20,336,323 857,409 $15,968,566Distributions reinvested 84,883 1,560,989 2,177,106 39,928,134Repurchased (2,576,907) (50,315,508) (2,807,434) (50,891,241)Net increase (decrease) (1,499,943) ($28,418,196) 227,081 $5,005,459Class NAV sharesSold 3,539,724 $66,967,208 2,289,914 $41,092,879Issued in reorganization (Note 13) 13,457,544 266,892,549 — —Distributions reinvested 305,384 5,661,822 7,217,005 133,298,081Repurchased (21,881,778) (444,912,044) (6,880,072) (124,636,184)Net increase (decrease) (4,579,126) ($105,390,465) 2,626,847 $49,754,776Total net increase (decrease) (6,079,069) ($133,808,661) 2,853,928 $54,760,235
FUND SHARE TRANSACTIONS, CONTINUED
291
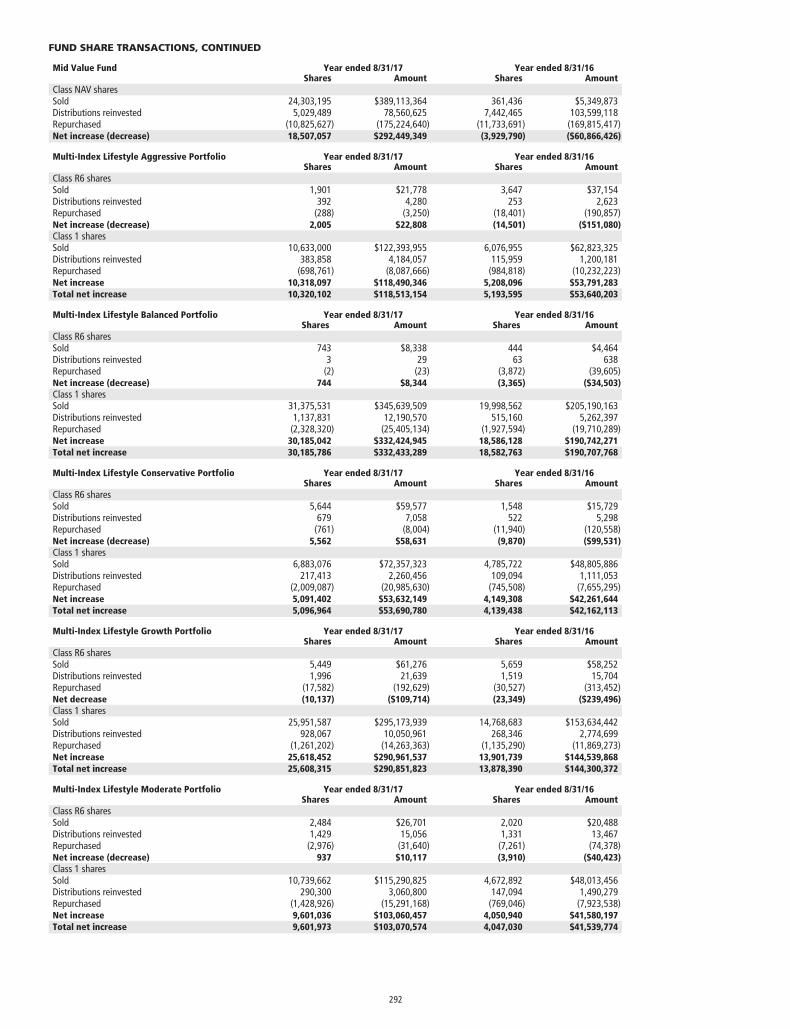
Mid Value Fund Year ended 8/31/17 Year ended 8/31/16Shares Amount Shares Amount
Class NAV sharesSold 24,303,195 $389,113,364 361,436 $5,349,873Distributions reinvested 5,029,489 78,560,625 7,442,465 103,599,118Repurchased (10,825,627) (175,224,640) (11,733,691) (169,815,417)Net increase (decrease) 18,507,057 $292,449,349 (3,929,790) ($60,866,426)
Multi-Index Lifestyle Aggressive Portfolio Year ended 8/31/17 Year ended 8/31/16Shares Amount Shares Amount
Class R6 sharesSold 1,901 $21,778 3,647 $37,154Distributions reinvested 392 4,280 253 2,623Repurchased (288) (3,250) (18,401) (190,857)Net increase (decrease) 2,005 $22,808 (14,501) ($151,080)Class 1 sharesSold 10,633,000 $122,393,955 6,076,955 $62,823,325Distributions reinvested 383,858 4,184,057 115,959 1,200,181Repurchased (698,761) (8,087,666) (984,818) (10,232,223)Net increase 10,318,097 $118,490,346 5,208,096 $53,791,283Total net increase 10,320,102 $118,513,154 5,193,595 $53,640,203
Multi-Index Lifestyle Balanced Portfolio Year ended 8/31/17 Year ended 8/31/16Shares Amount Shares Amount
Class R6 sharesSold 743 $8,338 444 $4,464Distributions reinvested 3 29 63 638Repurchased (2) (23) (3,872) (39,605)Net increase (decrease) 744 $8,344 (3,365) ($34,503)Class 1 sharesSold 31,375,531 $345,639,509 19,998,562 $205,190,163Distributions reinvested 1,137,831 12,190,570 515,160 5,262,397Repurchased (2,328,320) (25,405,134) (1,927,594) (19,710,289)Net increase 30,185,042 $332,424,945 18,586,128 $190,742,271Total net increase 30,185,786 $332,433,289 18,582,763 $190,707,768
Multi-Index Lifestyle Conservative Portfolio Year ended 8/31/17 Year ended 8/31/16Shares Amount Shares Amount
Class R6 sharesSold 5,644 $59,577 1,548 $15,729Distributions reinvested 679 7,058 522 5,298Repurchased (761) (8,004) (11,940) (120,558)Net increase (decrease) 5,562 $58,631 (9,870) ($99,531)Class 1 sharesSold 6,883,076 $72,357,323 4,785,722 $48,805,886Distributions reinvested 217,413 2,260,456 109,094 1,111,053Repurchased (2,009,087) (20,985,630) (745,508) (7,655,295)Net increase 5,091,402 $53,632,149 4,149,308 $42,261,644Total net increase 5,096,964 $53,690,780 4,139,438 $42,162,113
Multi-Index Lifestyle Growth Portfolio Year ended 8/31/17 Year ended 8/31/16Shares Amount Shares Amount
Class R6 sharesSold 5,449 $61,276 5,659 $58,252Distributions reinvested 1,996 21,639 1,519 15,704Repurchased (17,582) (192,629) (30,527) (313,452)Net decrease (10,137) ($109,714) (23,349) ($239,496)Class 1 sharesSold 25,951,587 $295,173,939 14,768,683 $153,634,442Distributions reinvested 928,067 10,050,961 268,346 2,774,699Repurchased (1,261,202) (14,263,363) (1,135,290) (11,869,273)Net increase 25,618,452 $290,961,537 13,901,739 $144,539,868Total net increase 25,608,315 $290,851,823 13,878,390 $144,300,372
Multi-Index Lifestyle Moderate Portfolio Year ended 8/31/17 Year ended 8/31/16Shares Amount Shares Amount
Class R6 sharesSold 2,484 $26,701 2,020 $20,488Distributions reinvested 1,429 15,056 1,331 13,467Repurchased (2,976) (31,640) (7,261) (74,378)Net increase (decrease) 937 $10,117 (3,910) ($40,423)Class 1 sharesSold 10,739,662 $115,290,825 4,672,892 $48,013,456Distributions reinvested 290,300 3,060,800 147,094 1,490,279Repurchased (1,428,926) (15,291,168) (769,046) (7,923,538)Net increase 9,601,036 $103,060,457 4,050,940 $41,580,197Total net increase 9,601,973 $103,070,574 4,047,030 $41,539,774
FUND SHARE TRANSACTIONS, CONTINUED
292
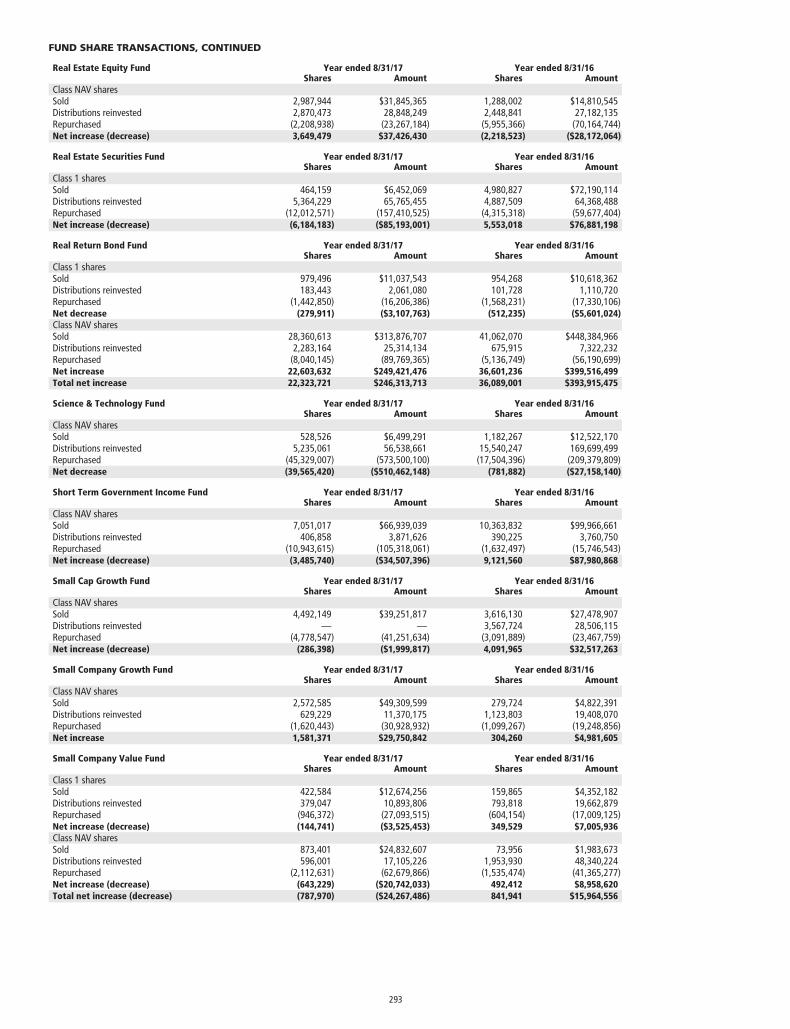
Real Estate Equity Fund Year ended 8/31/17 Year ended 8/31/16Shares Amount Shares Amount
Class NAV sharesSold 2,987,944 $31,845,365 1,288,002 $14,810,545Distributions reinvested 2,870,473 28,848,249 2,448,841 27,182,135Repurchased (2,208,938) (23,267,184) (5,955,366) (70,164,744)Net increase (decrease) 3,649,479 $37,426,430 (2,218,523) ($28,172,064)
Real Estate Securities Fund Year ended 8/31/17 Year ended 8/31/16Shares Amount Shares Amount
Class 1 sharesSold 464,159 $6,452,069 4,980,827 $72,190,114Distributions reinvested 5,364,229 65,765,455 4,887,509 64,368,488Repurchased (12,012,571) (157,410,525) (4,315,318) (59,677,404)Net increase (decrease) (6,184,183) ($85,193,001) 5,553,018 $76,881,198
Real Return Bond Fund Year ended 8/31/17 Year ended 8/31/16Shares Amount Shares Amount
Class 1 sharesSold 979,496 $11,037,543 954,268 $10,618,362Distributions reinvested 183,443 2,061,080 101,728 1,110,720Repurchased (1,442,850) (16,206,386) (1,568,231) (17,330,106)Net decrease (279,911) ($3,107,763) (512,235) ($5,601,024)Class NAV sharesSold 28,360,613 $313,876,707 41,062,070 $448,384,966Distributions reinvested 2,283,164 25,314,134 675,915 7,322,232Repurchased (8,040,145) (89,769,365) (5,136,749) (56,190,699)Net increase 22,603,632 $249,421,476 36,601,236 $399,516,499Total net increase 22,323,721 $246,313,713 36,089,001 $393,915,475
Science & Technology Fund Year ended 8/31/17 Year ended 8/31/16Shares Amount Shares Amount
Class NAV sharesSold 528,526 $6,499,291 1,182,267 $12,522,170Distributions reinvested 5,235,061 56,538,661 15,540,247 169,699,499Repurchased (45,329,007) (573,500,100) (17,504,396) (209,379,809)Net decrease (39,565,420) ($510,462,148) (781,882) ($27,158,140)
Short Term Government Income Fund Year ended 8/31/17 Year ended 8/31/16Shares Amount Shares Amount
Class NAV sharesSold 7,051,017 $66,939,039 10,363,832 $99,966,661Distributions reinvested 406,858 3,871,626 390,225 3,760,750Repurchased (10,943,615) (105,318,061) (1,632,497) (15,746,543)Net increase (decrease) (3,485,740) ($34,507,396) 9,121,560 $87,980,868
Small Cap Growth Fund Year ended 8/31/17 Year ended 8/31/16Shares Amount Shares Amount
Class NAV sharesSold 4,492,149 $39,251,817 3,616,130 $27,478,907Distributions reinvested — — 3,567,724 28,506,115Repurchased (4,778,547) (41,251,634) (3,091,889) (23,467,759)Net increase (decrease) (286,398) ($1,999,817) 4,091,965 $32,517,263
Small Company Growth Fund Year ended 8/31/17 Year ended 8/31/16Shares Amount Shares Amount
Class NAV sharesSold 2,572,585 $49,309,599 279,724 $4,822,391Distributions reinvested 629,229 11,370,175 1,123,803 19,408,070Repurchased (1,620,443) (30,928,932) (1,099,267) (19,248,856)Net increase 1,581,371 $29,750,842 304,260 $4,981,605
Small Company Value Fund Year ended 8/31/17 Year ended 8/31/16Shares Amount Shares Amount
Class 1 sharesSold 422,584 $12,674,256 159,865 $4,352,182Distributions reinvested 379,047 10,893,806 793,818 19,662,879Repurchased (946,372) (27,093,515) (604,154) (17,009,125)Net increase (decrease) (144,741) ($3,525,453) 349,529 $7,005,936Class NAV sharesSold 873,401 $24,832,607 73,956 $1,983,673Distributions reinvested 596,001 17,105,226 1,953,930 48,340,224Repurchased (2,112,631) (62,679,866) (1,535,474) (41,365,277)Net increase (decrease) (643,229) ($20,742,033) 492,412 $8,958,620Total net increase (decrease) (787,970) ($24,267,486) 841,941 $15,964,556
FUND SHARE TRANSACTIONS, CONTINUED
293
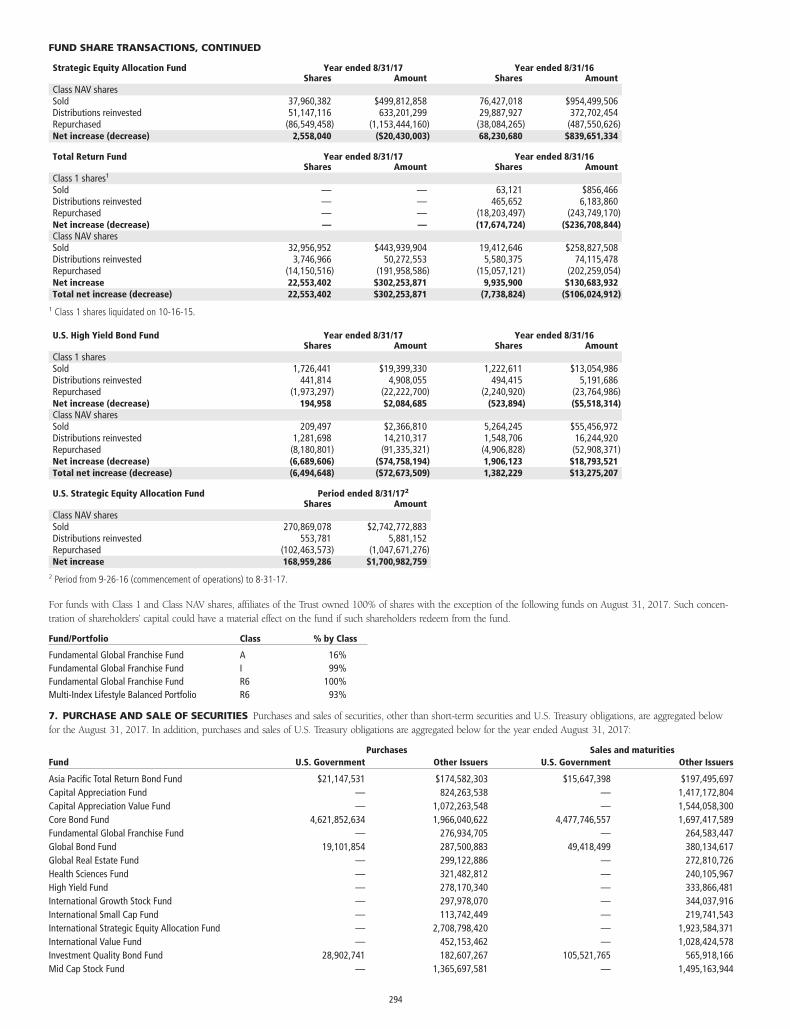
Strategic Equity Allocation Fund Year ended 8/31/17 Year ended 8/31/16Shares Amount Shares Amount
Class NAV sharesSold 37,960,382 $499,812,858 76,427,018 $954,499,506Distributions reinvested 51,147,116 633,201,299 29,887,927 372,702,454Repurchased (86,549,458) (1,153,444,160) (38,084,265) (487,550,626)Net increase (decrease) 2,558,040 ($20,430,003) 68,230,680 $839,651,334
Total Return Fund Year ended 8/31/17 Year ended 8/31/16Shares Amount Shares Amount
Class 1 shares1
Sold — — 63,121 $856,466Distributions reinvested — — 465,652 6,183,860Repurchased — — (18,203,497) (243,749,170)Net increase (decrease) — — (17,674,724) ($236,708,844)Class NAV sharesSold 32,956,952 $443,939,904 19,412,646 $258,827,508Distributions reinvested 3,746,966 50,272,553 5,580,375 74,115,478Repurchased (14,150,516) (191,958,586) (15,057,121) (202,259,054)Net increase 22,553,402 $302,253,871 9,935,900 $130,683,932Total net increase (decrease) 22,553,402 $302,253,871 (7,738,824) ($106,024,912)
1 Class 1 shares liquidated on 10-16-15.
U.S. High Yield Bond Fund Year ended 8/31/17 Year ended 8/31/16Shares Amount Shares Amount
Class 1 sharesSold 1,726,441 $19,399,330 1,222,611 $13,054,986Distributions reinvested 441,814 4,908,055 494,415 5,191,686Repurchased (1,973,297) (22,222,700) (2,240,920) (23,764,986)Net increase (decrease) 194,958 $2,084,685 (523,894) ($5,518,314)Class NAV sharesSold 209,497 $2,366,810 5,264,245 $55,456,972Distributions reinvested 1,281,698 14,210,317 1,548,706 16,244,920Repurchased (8,180,801) (91,335,321) (4,906,828) (52,908,371)Net increase (decrease) (6,689,606) ($74,758,194) 1,906,123 $18,793,521Total net increase (decrease) (6,494,648) ($72,673,509) 1,382,229 $13,275,207
U.S. Strategic Equity Allocation Fund Period ended 8/31/172
Shares AmountClass NAV sharesSold 270,869,078 $2,742,772,883Distributions reinvested 553,781 5,881,152Repurchased (102,463,573) (1,047,671,276)Net increase 168,959,286 $1,700,982,759
2 Period from 9-26-16 (commencement of operations) to 8-31-17.
For funds with Class 1 and Class NAV shares, affiliates of the Trust owned 100% of shares with the exception of the following funds on August 31, 2017. Such concen-tration of shareholders’ capital could have a material effect on the fund if such shareholders redeem from the fund.
Fund/Portfolio Class % by Class
Fundamental Global Franchise Fund A 16%Fundamental Global Franchise Fund I 99%Fundamental Global Franchise Fund R6 100%Multi-Index Lifestyle Balanced Portfolio R6 93%
7. PURCHASE AND SALE OF SECURITIES Purchases and sales of securities, other than short-term securities and U.S. Treasury obligations, are aggregated belowfor the August 31, 2017. In addition, purchases and sales of U.S. Treasury obligations are aggregated below for the year ended August 31, 2017:
Purchases Sales and maturitiesFund U.S. Government Other Issuers U.S. Government Other Issuers
Asia Pacific Total Return Bond Fund $21,147,531 $174,582,303 $15,647,398 $197,495,697Capital Appreciation Fund — 824,263,538 — 1,417,172,804Capital Appreciation Value Fund — 1,072,263,548 — 1,544,058,300Core Bond Fund 4,621,852,634 1,966,040,622 4,477,746,557 1,697,417,589Fundamental Global Franchise Fund — 276,934,705 — 264,583,447Global Bond Fund 19,101,854 287,500,883 49,418,499 380,134,617Global Real Estate Fund — 299,122,886 — 272,810,726Health Sciences Fund — 321,482,812 — 240,105,967High Yield Fund — 278,170,340 — 333,866,481International Growth Stock Fund — 297,978,070 — 344,037,916International Small Cap Fund — 113,742,449 — 219,741,543International Strategic Equity Allocation Fund — 2,708,798,420 — 1,923,584,371International Value Fund — 452,153,462 — 1,028,424,578Investment Quality Bond Fund 28,902,741 182,607,267 105,521,765 565,918,166Mid Cap Stock Fund — 1,365,697,581 — 1,495,163,944
FUND SHARE TRANSACTIONS, CONTINUED
294
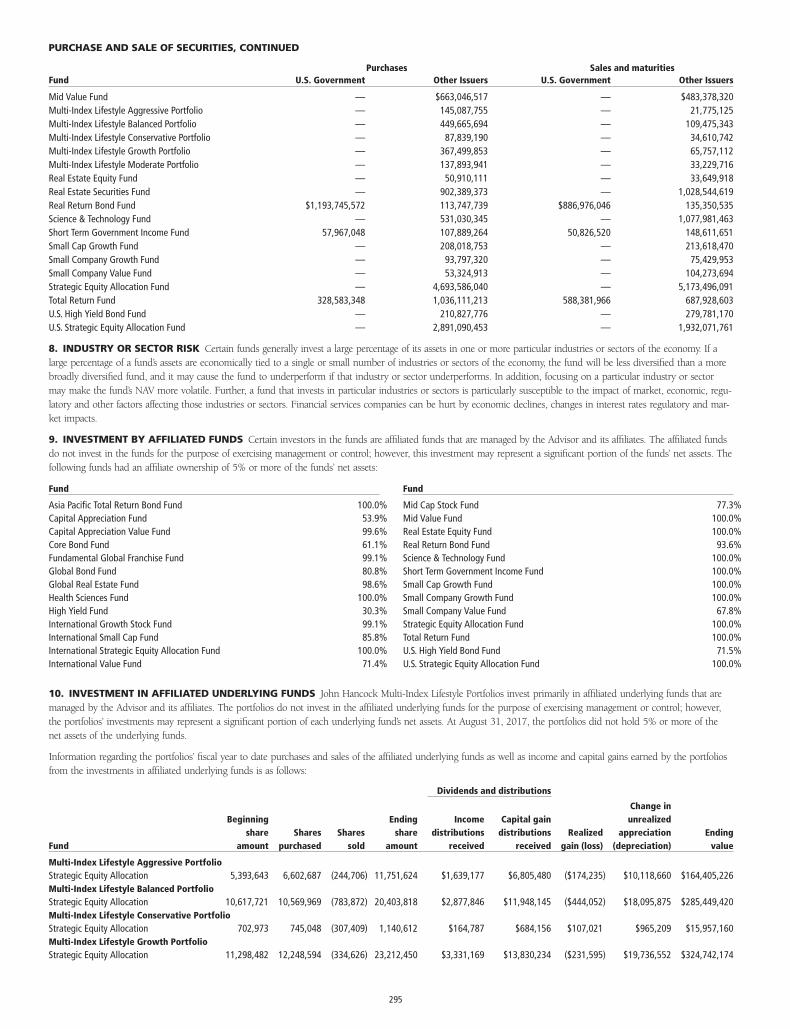
Purchases Sales and maturitiesFund U.S. Government Other Issuers U.S. Government Other Issuers
Mid Value Fund — $663,046,517 — $483,378,320Multi-Index Lifestyle Aggressive Portfolio — 145,087,755 — 21,775,125Multi-Index Lifestyle Balanced Portfolio — 449,665,694 — 109,475,343Multi-Index Lifestyle Conservative Portfolio — 87,839,190 — 34,610,742Multi-Index Lifestyle Growth Portfolio — 367,499,853 — 65,757,112Multi-Index Lifestyle Moderate Portfolio — 137,893,941 — 33,229,716Real Estate Equity Fund — 50,910,111 — 33,649,918Real Estate Securities Fund — 902,389,373 — 1,028,544,619Real Return Bond Fund $1,193,745,572 113,747,739 $886,976,046 135,350,535Science & Technology Fund — 531,030,345 — 1,077,981,463Short Term Government Income Fund 57,967,048 107,889,264 50,826,520 148,611,651Small Cap Growth Fund — 208,018,753 — 213,618,470Small Company Growth Fund — 93,797,320 — 75,429,953Small Company Value Fund — 53,324,913 — 104,273,694Strategic Equity Allocation Fund — 4,693,586,040 — 5,173,496,091Total Return Fund 328,583,348 1,036,111,213 588,381,966 687,928,603U.S. High Yield Bond Fund — 210,827,776 — 279,781,170U.S. Strategic Equity Allocation Fund — 2,891,090,453 — 1,932,071,761
8. INDUSTRY OR SECTOR RISK Certain funds generally invest a large percentage of its assets in one or more particular industries or sectors of the economy. If alarge percentage of a fund’s assets are economically tied to a single or small number of industries or sectors of the economy, the fund will be less diversified than a morebroadly diversified fund, and it may cause the fund to underperform if that industry or sector underperforms. In addition, focusing on a particular industry or sectormay make the fund’s NAV more volatile. Further, a fund that invests in particular industries or sectors is particularly susceptible to the impact of market, economic, regu-latory and other factors affecting those industries or sectors. Financial services companies can be hurt by economic declines, changes in interest rates regulatory and mar-ket impacts.
9. INVESTMENT BY AFFILIATED FUNDS Certain investors in the funds are affiliated funds that are managed by the Advisor and its affiliates. The affiliated fundsdo not invest in the funds for the purpose of exercising management or control; however, this investment may represent a significant portion of the funds’ net assets. Thefollowing funds had an affiliate ownership of 5% or more of the funds’ net assets:
Fund
Asia Pacific Total Return Bond Fund 100.0%Capital Appreciation Fund 53.9%Capital Appreciation Value Fund 99.6%Core Bond Fund 61.1%Fundamental Global Franchise Fund 99.1%Global Bond Fund 80.8%Global Real Estate Fund 98.6%Health Sciences Fund 100.0%High Yield Fund 30.3%International Growth Stock Fund 99.1%International Small Cap Fund 85.8%International Strategic Equity Allocation Fund 100.0%International Value Fund 71.4%
Fund
Mid Cap Stock Fund 77.3%Mid Value Fund 100.0%Real Estate Equity Fund 100.0%Real Return Bond Fund 93.6%Science & Technology Fund 100.0%Short Term Government Income Fund 100.0%Small Cap Growth Fund 100.0%Small Company Growth Fund 100.0%Small Company Value Fund 67.8%Strategic Equity Allocation Fund 100.0%Total Return Fund 100.0%U.S. High Yield Bond Fund 71.5%U.S. Strategic Equity Allocation Fund 100.0%
10. INVESTMENT IN AFFILIATED UNDERLYING FUNDS John Hancock Multi-Index Lifestyle Portfolios invest primarily in affiliated underlying funds that aremanaged by the Advisor and its affiliates. The portfolios do not invest in the affiliated underlying funds for the purpose of exercising management or control; however,the portfolios’ investments may represent a significant portion of each underlying fund’s net assets. At August 31, 2017, the portfolios did not hold 5% or more of thenet assets of the underlying funds.
Information regarding the portfolios’ fiscal year to date purchases and sales of the affiliated underlying funds as well as income and capital gains earned by the portfoliosfrom the investments in affiliated underlying funds is as follows:
Dividends and distributions
Fund
Beginningshare
amountShares
purchasedShares
sold
Endingshare
amount
Incomedistributions
received
Capital gaindistributions
receivedRealized
gain (loss)
Change inunrealized
appreciation(depreciation)
Endingvalue
Multi-Index Lifestyle Aggressive PortfolioStrategic Equity Allocation 5,393,643 6,602,687 (244,706) 11,751,624 $1,639,177 $6,805,480 ($174,235) $10,118,660 $164,405,226Multi-Index Lifestyle Balanced PortfolioStrategic Equity Allocation 10,617,721 10,569,969 (783,872) 20,403,818 $2,877,846 $11,948,145 ($444,052) $18,095,875 $285,449,420Multi-Index Lifestyle Conservative PortfolioStrategic Equity Allocation 702,973 745,048 (307,409) 1,140,612 $164,787 $684,156 $107,021 $965,209 $15,957,160Multi-Index Lifestyle Growth PortfolioStrategic Equity Allocation 11,298,482 12,248,594 (334,626) 23,212,450 $3,331,169 $13,830,234 ($231,595) $19,736,552 $324,742,174
PURCHASE AND SALE OF SECURITIES, CONTINUED
295
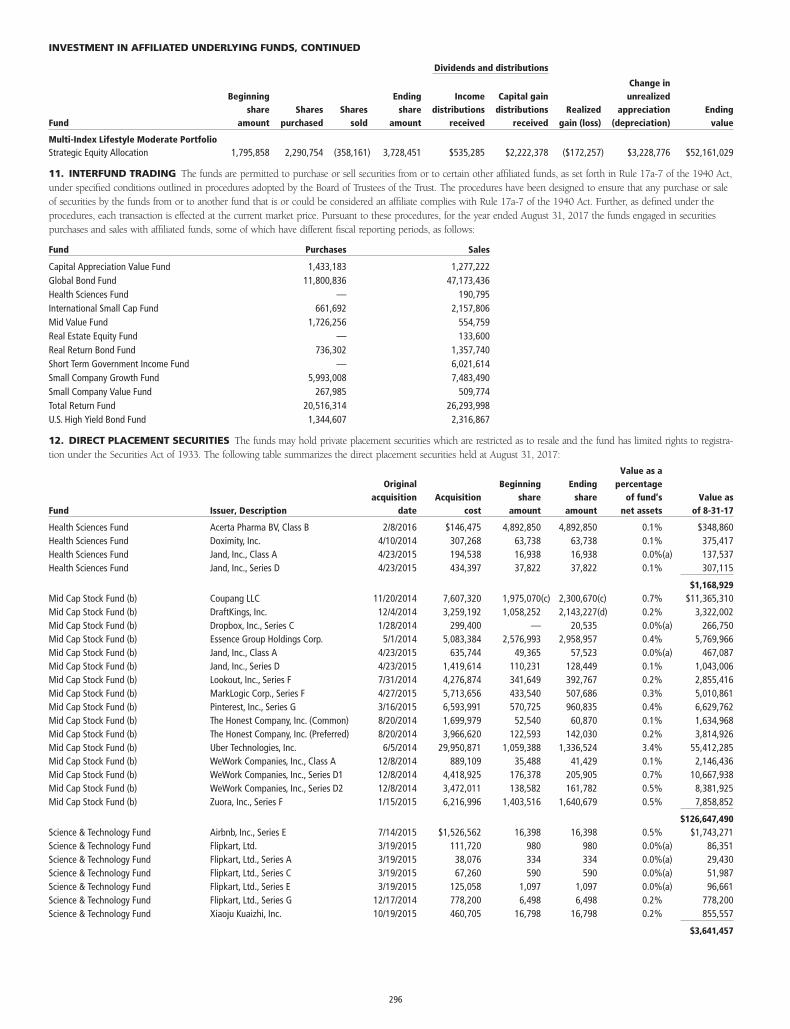
Dividends and distributions
Fund
Beginningshare
amountShares
purchasedShares
sold
Endingshare
amount
Incomedistributions
received
Capital gaindistributions
receivedRealized
gain (loss)
Change inunrealized
appreciation(depreciation)
Endingvalue
Multi-Index Lifestyle Moderate PortfolioStrategic Equity Allocation 1,795,858 2,290,754 (358,161) 3,728,451 $535,285 $2,222,378 ($172,257) $3,228,776 $52,161,029
11. INTERFUND TRADING The funds are permitted to purchase or sell securities from or to certain other affiliated funds, as set forth in Rule 17a-7 of the 1940 Act,under specified conditions outlined in procedures adopted by the Board of Trustees of the Trust. The procedures have been designed to ensure that any purchase or saleof securities by the funds from or to another fund that is or could be considered an affiliate complies with Rule 17a-7 of the 1940 Act. Further, as defined under theprocedures, each transaction is effected at the current market price. Pursuant to these procedures, for the year ended August 31, 2017 the funds engaged in securitiespurchases and sales with affiliated funds, some of which have different fiscal reporting periods, as follows:
Fund Purchases Sales
Capital Appreciation Value Fund 1,433,183 1,277,222Global Bond Fund 11,800,836 47,173,436Health Sciences Fund — 190,795International Small Cap Fund 661,692 2,157,806Mid Value Fund 1,726,256 554,759Real Estate Equity Fund — 133,600Real Return Bond Fund 736,302 1,357,740Short Term Government Income Fund — 6,021,614Small Company Growth Fund 5,993,008 7,483,490Small Company Value Fund 267,985 509,774Total Return Fund 20,516,314 26,293,998U.S. High Yield Bond Fund 1,344,607 2,316,867
12. DIRECT PLACEMENT SECURITIES The funds may hold private placement securities which are restricted as to resale and the fund has limited rights to registra-tion under the Securities Act of 1933. The following table summarizes the direct placement securities held at August 31, 2017:
Fund Issuer, Description
Originalacquisition
dateAcquisition
cost
Beginningshare
amount
Endingshare
amount
Value as apercentage
of fund’snet assets
Value asof 8-31-17
Health Sciences Fund Acerta Pharma BV, Class B 2/8/2016 $146,475 4,892,850 4,892,850 0.1% $348,860Health Sciences Fund Doximity, Inc. 4/10/2014 307,268 63,738 63,738 0.1% 375,417Health Sciences Fund Jand, Inc., Class A 4/23/2015 194,538 16,938 16,938 0.0%(a) 137,537Health Sciences Fund Jand, Inc., Series D 4/23/2015 434,397 37,822 37,822 0.1% 307,115
$1,168,929Mid Cap Stock Fund (b) Coupang LLC 11/20/2014 7,607,320 1,975,070(c) 2,300,670(c) 0.7% $11,365,310Mid Cap Stock Fund (b) DraftKings, Inc. 12/4/2014 3,259,192 1,058,252 2,143,227(d) 0.2% 3,322,002Mid Cap Stock Fund (b) Dropbox, Inc., Series C 1/28/2014 299,400 — 20,535 0.0%(a) 266,750Mid Cap Stock Fund (b) Essence Group Holdings Corp. 5/1/2014 5,083,384 2,576,993 2,958,957 0.4% 5,769,966Mid Cap Stock Fund (b) Jand, Inc., Class A 4/23/2015 635,744 49,365 57,523 0.0%(a) 467,087Mid Cap Stock Fund (b) Jand, Inc., Series D 4/23/2015 1,419,614 110,231 128,449 0.1% 1,043,006Mid Cap Stock Fund (b) Lookout, Inc., Series F 7/31/2014 4,276,874 341,649 392,767 0.2% 2,855,416Mid Cap Stock Fund (b) MarkLogic Corp., Series F 4/27/2015 5,713,656 433,540 507,686 0.3% 5,010,861Mid Cap Stock Fund (b) Pinterest, Inc., Series G 3/16/2015 6,593,991 570,725 960,835 0.4% 6,629,762Mid Cap Stock Fund (b) The Honest Company, Inc. (Common) 8/20/2014 1,699,979 52,540 60,870 0.1% 1,634,968Mid Cap Stock Fund (b) The Honest Company, Inc. (Preferred) 8/20/2014 3,966,620 122,593 142,030 0.2% 3,814,926Mid Cap Stock Fund (b) Uber Technologies, Inc. 6/5/2014 29,950,871 1,059,388 1,336,524 3.4% 55,412,285Mid Cap Stock Fund (b) WeWork Companies, Inc., Class A 12/8/2014 889,109 35,488 41,429 0.1% 2,146,436Mid Cap Stock Fund (b) WeWork Companies, Inc., Series D1 12/8/2014 4,418,925 176,378 205,905 0.7% 10,667,938Mid Cap Stock Fund (b) WeWork Companies, Inc., Series D2 12/8/2014 3,472,011 138,582 161,782 0.5% 8,381,925Mid Cap Stock Fund (b) Zuora, Inc., Series F 1/15/2015 6,216,996 1,403,516 1,640,679 0.5% 7,858,852
$126,647,490Science & Technology Fund Airbnb, Inc., Series E 7/14/2015 $1,526,562 16,398 16,398 0.5% $1,743,271Science & Technology Fund Flipkart, Ltd. 3/19/2015 111,720 980 980 0.0%(a) 86,351Science & Technology Fund Flipkart, Ltd., Series A 3/19/2015 38,076 334 334 0.0%(a) 29,430Science & Technology Fund Flipkart, Ltd., Series C 3/19/2015 67,260 590 590 0.0%(a) 51,987Science & Technology Fund Flipkart, Ltd., Series E 3/19/2015 125,058 1,097 1,097 0.0%(a) 96,661Science & Technology Fund Flipkart, Ltd., Series G 12/17/2014 778,200 6,498 6,498 0.2% 778,200Science & Technology Fund Xiaoju Kuaizhi, Inc. 10/19/2015 460,705 16,798 16,798 0.2% 855,557
$3,641,457
INVESTMENT IN AFFILIATED UNDERLYING FUNDS, CONTINUED
296
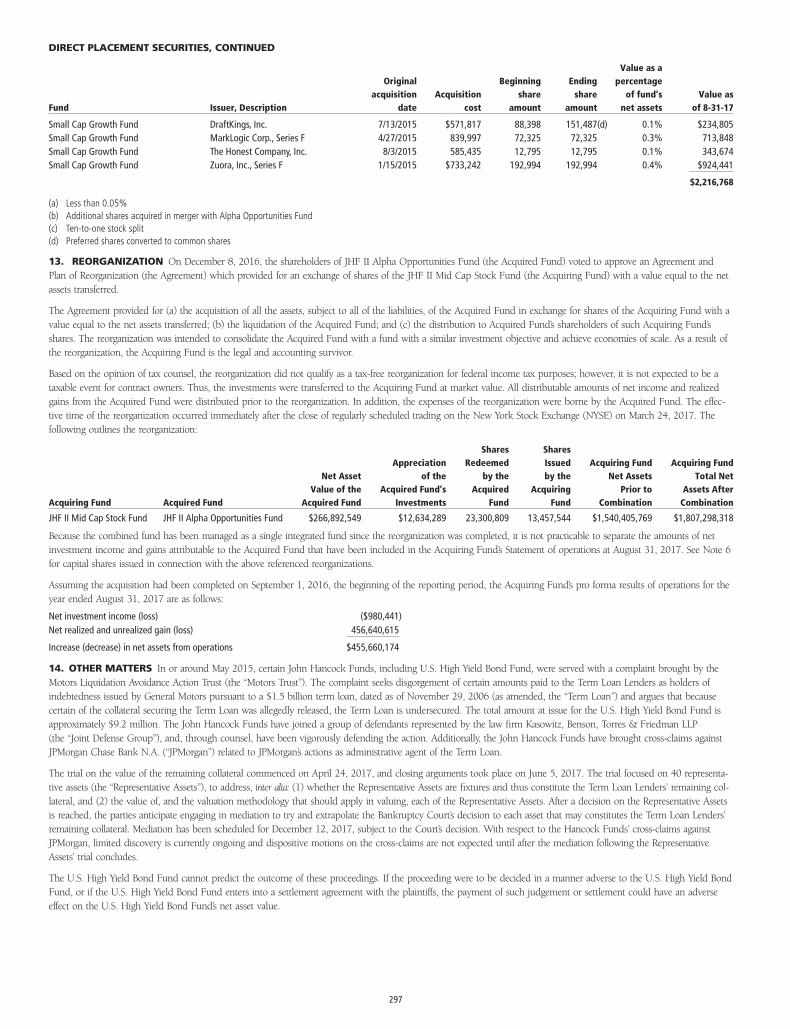
Fund Issuer, Description
Originalacquisition
dateAcquisition
cost
Beginningshare
amount
Endingshare
amount
Value as apercentage
of fund’snet assets
Value asof 8-31-17
Small Cap Growth Fund DraftKings, Inc. 7/13/2015 $571,817 88,398 151,487(d) 0.1% $234,805Small Cap Growth Fund MarkLogic Corp., Series F 4/27/2015 839,997 72,325 72,325 0.3% 713,848Small Cap Growth Fund The Honest Company, Inc. 8/3/2015 585,435 12,795 12,795 0.1% 343,674Small Cap Growth Fund Zuora, Inc., Series F 1/15/2015 $733,242 192,994 192,994 0.4% $924,441
$2,216,768
(a) Less than 0.05%(b) Additional shares acquired in merger with Alpha Opportunities Fund(c) Ten-to-one stock split(d) Preferred shares converted to common shares
13. REORGANIZATION On December 8, 2016, the shareholders of JHF II Alpha Opportunities Fund (the Acquired Fund) voted to approve an Agreement andPlan of Reorganization (the Agreement) which provided for an exchange of shares of the JHF II Mid Cap Stock Fund (the Acquiring Fund) with a value equal to the netassets transferred.
The Agreement provided for (a) the acquisition of all the assets, subject to all of the liabilities, of the Acquired Fund in exchange for shares of the Acquiring Fund with avalue equal to the net assets transferred; (b) the liquidation of the Acquired Fund; and (c) the distribution to Acquired Fund’s shareholders of such Acquiring Fund’sshares. The reorganization was intended to consolidate the Acquired Fund with a fund with a similar investment objective and achieve economies of scale. As a result ofthe reorganization, the Acquiring Fund is the legal and accounting survivor.
Based on the opinion of tax counsel, the reorganization did not qualify as a tax-free reorganization for federal income tax purposes; however, it is not expected to be ataxable event for contract owners. Thus, the investments were transferred to the Acquiring Fund at market value. All distributable amounts of net income and realizedgains from the Acquired Fund were distributed prior to the reorganization. In addition, the expenses of the reorganization were borne by the Acquired Fund. The effec-tive time of the reorganization occurred immediately after the close of regularly scheduled trading on the New York Stock Exchange (NYSE) on March 24, 2017. Thefollowing outlines the reorganization:
Acquiring Fund Acquired Fund
Net AssetValue of the
Acquired Fund
Appreciationof the
Acquired Fund’sInvestments
SharesRedeemed
by theAcquired
Fund
SharesIssuedby the
AcquiringFund
Acquiring FundNet Assets
Prior toCombination
Acquiring FundTotal Net
Assets AfterCombination
JHF II Mid Cap Stock Fund JHF II Alpha Opportunities Fund $266,892,549 $12,634,289 23,300,809 13,457,544 $1,540,405,769 $1,807,298,318
Because the combined fund has been managed as a single integrated fund since the reorganization was completed, it is not practicable to separate the amounts of netinvestment income and gains attributable to the Acquired Fund that have been included in the Acquiring Fund’s Statement of operations at August 31, 2017. See Note 6for capital shares issued in connection with the above referenced reorganizations.
Assuming the acquisition had been completed on September 1, 2016, the beginning of the reporting period, the Acquiring Fund’s pro forma results of operations for theyear ended August 31, 2017 are as follows:
Net investment income (loss) ($980,441)Net realized and unrealized gain (loss) 456,640,615
Increase (decrease) in net assets from operations $455,660,174
14. OTHER MATTERS In or around May 2015, certain John Hancock Funds, including U.S. High Yield Bond Fund, were served with a complaint brought by theMotors Liquidation Avoidance Action Trust (the “Motors Trust”). The complaint seeks disgorgement of certain amounts paid to the Term Loan Lenders as holders ofindebtedness issued by General Motors pursuant to a $1.5 billion term loan, dated as of November 29, 2006 (as amended, the “Term Loan”) and argues that becausecertain of the collateral securing the Term Loan was allegedly released, the Term Loan is undersecured. The total amount at issue for the U.S. High Yield Bond Fund isapproximately $9.2 million. The John Hancock Funds have joined a group of defendants represented by the law firm Kasowitz, Benson, Torres & Friedman LLP(the “Joint Defense Group”), and, through counsel, have been vigorously defending the action. Additionally, the John Hancock Funds have brought cross-claims againstJPMorgan Chase Bank N.A. (“JPMorgan”) related to JPMorgan’s actions as administrative agent of the Term Loan.
The trial on the value of the remaining collateral commenced on April 24, 2017, and closing arguments took place on June 5, 2017. The trial focused on 40 representa-tive assets (the “Representative Assets”), to address, inter alia: (1) whether the Representative Assets are fixtures and thus constitute the Term Loan Lenders’ remaining col-lateral, and (2) the value of, and the valuation methodology that should apply in valuing, each of the Representative Assets. After a decision on the Representative Assetsis reached, the parties anticipate engaging in mediation to try and extrapolate the Bankruptcy Court’s decision to each asset that may constitutes the Term Loan Lenders’remaining collateral. Mediation has been scheduled for December 12, 2017, subject to the Court’s decision. With respect to the Hancock Funds’ cross-claims againstJPMorgan, limited discovery is currently ongoing and dispositive motions on the cross-claims are not expected until after the mediation following the RepresentativeAssets’ trial concludes.
The U.S. High Yield Bond Fund cannot predict the outcome of these proceedings. If the proceeding were to be decided in a manner adverse to the U.S. High Yield BondFund, or if the U.S. High Yield Bond Fund enters into a settlement agreement with the plaintiffs, the payment of such judgement or settlement could have an adverseeffect on the U.S. High Yield Bond Fund’s net asset value.
DIRECT PLACEMENT SECURITIES, CONTINUED
297
To the Board of Trustees and Shareholders of John Hancock Funds II:
In our opinion, the accompanying statements of assets and liabilities, including the portfolios’ of investments, and the related statements of operations, of changes in netassets, and of cash flows (statement of cash flows only for the John Hancock Real Return Bond Fund) and the financial highlights present fairly, in all material respects,the financial position of the John Hancock Asia Pacific Total Return Bond Fund, the John Hancock Capital Appreciation Fund, the John Hancock Capital AppreciationValue Fund, the John Hancock Core Bond Fund, the John Hancock Fundamental Global Franchise Fund, the John Hancock Global Bond Fund, the John HancockGlobal Real Estate Fund, the John Hancock Health Sciences Fund, the John Hancock High Yield Fund, the John Hancock International Growth Stock Fund, theJohn Hancock International Small Cap Fund, the John Hancock International Strategic Equity Allocation Fund, the John Hancock International Value Fund, theJohn Hancock Investment Quality Bond Fund, the John Hancock Mid Cap Stock Fund, the John Hancock Mid Value Fund, the John Hancock Multi-Index LifestyleAggressive Portfolio (formerly known as the John Hancock Lifestyle II Aggressive Portfolio), the John Hancock Multi-Index Lifestyle Balanced Portfolio (formerly knownas the John Hancock Lifestyle II Balanced Portfolio), the John Hancock Multi-Index Lifestyle Conservative Portfolio (formerly known as the John Hancock Lifestyle IIConservative Portfolio), the John Hancock Multi-Index Lifestyle Growth Portfolio (formerly known as the John Hancock Lifestyle II Growth Portfolio), the John HancockMulti-Index Lifestyle Moderate Portfolio (formerly known as the John Hancock Lifestyle II Moderate Portfolio), the John Hancock Real Estate Equity Fund, the JohnHancock Real Estate Securities Fund, the John Hancock Real Return Bond Fund, the John Hancock Science & Technology Fund, the John Hancock Short TermGovernment Income Fund, the John Hancock Small Cap Growth Fund, the John Hancock Small Company Growth Fund, the John Hancock Small Company ValueFund, the John Hancock Strategic Equity Allocation Fund, the John Hancock Total Return Fund, the John Hancock U.S. High Yield Bond Fund, and the John HancockU.S. Strategic Equity Allocation Fund (the “Funds”) as of August 31, 2017, the results of each of their operations for the periods then ended, the cash flows for theJohn Hancock Real Return Bond Fund for the year then ended, the changes in each of their net assets for each of the periods indicated and the financial highlights foreach of the periods indicated, in conformity with accounting principles generally accepted in the United States of America. These financial statements and financialhighlights (hereafter referred to as “financial statements”) are the responsibility of the Funds’ management. Our responsibility is to express an opinion on these financialstatements based on our audits. We conducted our audits of these financial statements in accordance with the standards of the Public Company Accounting OversightBoard (United States). Those standards require that we plan and perform the audit to obtain reasonable assurance about whether the financial statements are freeof material misstatement. An audit includes examining, on a test basis, evidence supporting the amounts and disclosures in the financial statements, assessing theaccounting principles used and significant estimates made by management, and evaluating the overall financial statement presentation. We believe that our audits,which included confirmation of securities as of August 31, 2017 by correspondence with the custodians, brokers, transfer agent, and agent banks, and the applicationof alternative auditing procedures where securities purchased confirmations had not been received, provide a reasonable basis for our opinion.
PricewaterhouseCoopers LLPBoston, MassachusettsOctober 26, 2017
John Hancock Funds IIReport of independent registered public accounting firm
298
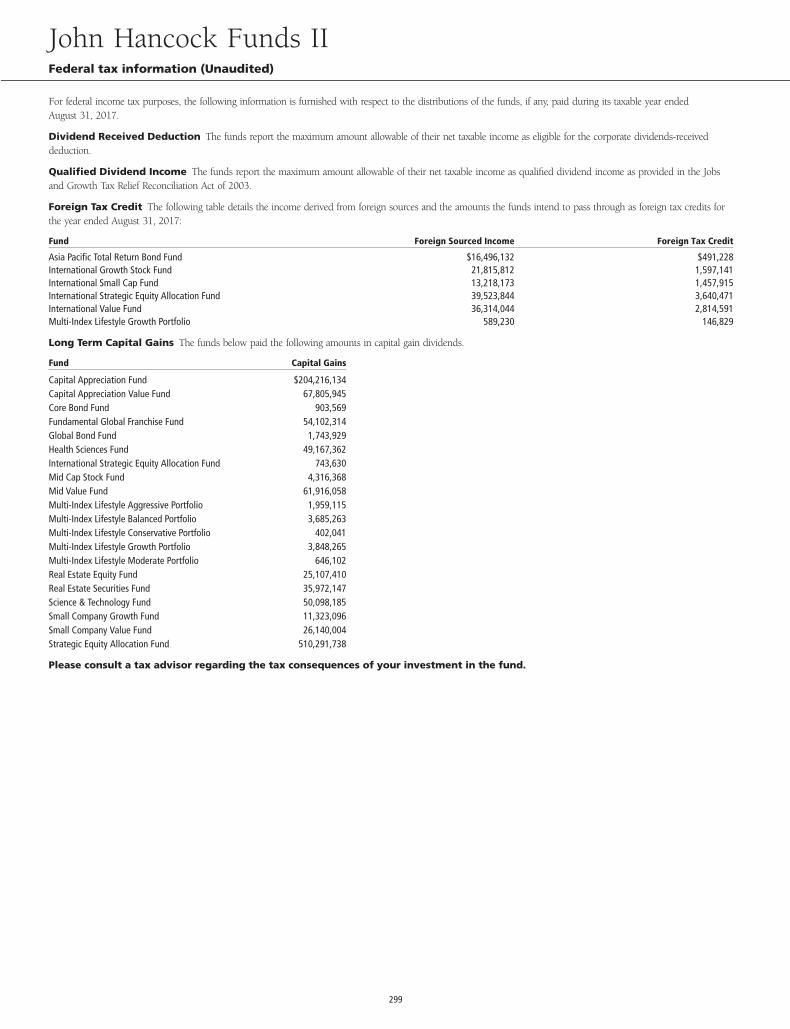
For federal income tax purposes, the following information is furnished with respect to the distributions of the funds, if any, paid during its taxable year endedAugust 31, 2017.
Dividend Received Deduction The funds report the maximum amount allowable of their net taxable income as eligible for the corporate dividends-receiveddeduction.
Qualified Dividend Income The funds report the maximum amount allowable of their net taxable income as qualified dividend income as provided in the Jobsand Growth Tax Relief Reconciliation Act of 2003.
Foreign Tax Credit The following table details the income derived from foreign sources and the amounts the funds intend to pass through as foreign tax credits forthe year ended August 31, 2017:
Fund Foreign Sourced Income Foreign Tax Credit
Asia Pacific Total Return Bond Fund $16,496,132 $491,228International Growth Stock Fund 21,815,812 1,597,141International Small Cap Fund 13,218,173 1,457,915International Strategic Equity Allocation Fund 39,523,844 3,640,471International Value Fund 36,314,044 2,814,591Multi-Index Lifestyle Growth Portfolio 589,230 146,829
Long Term Capital Gains The funds below paid the following amounts in capital gain dividends.
Fund Capital Gains
Capital Appreciation Fund $204,216,134Capital Appreciation Value Fund 67,805,945Core Bond Fund 903,569Fundamental Global Franchise Fund 54,102,314Global Bond Fund 1,743,929Health Sciences Fund 49,167,362International Strategic Equity Allocation Fund 743,630Mid Cap Stock Fund 4,316,368Mid Value Fund 61,916,058Multi-Index Lifestyle Aggressive Portfolio 1,959,115Multi-Index Lifestyle Balanced Portfolio 3,685,263Multi-Index Lifestyle Conservative Portfolio 402,041Multi-Index Lifestyle Growth Portfolio 3,848,265Multi-Index Lifestyle Moderate Portfolio 646,102Real Estate Equity Fund 25,107,410Real Estate Securities Fund 35,972,147Science & Technology Fund 50,098,185Small Company Growth Fund 11,323,096Small Company Value Fund 26,140,004Strategic Equity Allocation Fund 510,291,738
Please consult a tax advisor regarding the tax consequences of your investment in the fund.
John Hancock Funds IIFederal tax information (Unaudited)
299
Approval of Advisory and Subadvisory Agreements
At in-person meetings held on September 12-15, 2016, the Board of Trustees(the Board) of John Hancock Investment Trust (the Trust), including all of theTrustees who are not considered to be interested persons of the Trust under theInvestment Company Act of 1940, as amended (the 1940 Act) (the IndependentTrustees), approved the establishment of John Hancock U.S. Strategic EquityAllocation Fund and John Hancock International Strategic Equity AllocationFund (the New Funds).
This section describes the evaluation by the Board of:
(a) an amendment to the advisory agreement between the Trust and JohnHancock Advisers, LLC (the Advisor) (the Advisory Agreement); and
(b) a subadvisory agreement between the Advisor and John HancockAsset Management a division of Manulife Asset Management (US) LLC(the Subadvisor) with respect to the New Funds (the Subadvisory Agreement).
In considering the Advisory Agreement and the Subadvisory Agreement withrespect to the New Funds, the Board received in advance of the meetings a vari-ety of materials relating to the New Funds, the Advisor and the Subadvisor,including comparative fee and expense information for a peer group of similarmutual funds, and including with respect to the Subadvisor, performance infor-mation for comparatively managed accounts, as applicable, and other informationprovided by the Advisor and the Subadvisor regarding the nature, extent, andquality of services to be provided by the Advisor and the Subadvisor under theirrespective Agreements, as well as information regarding the Advisor’s anticipatedrevenues and costs of providing services to the New Funds and any compensa-tion paid to affiliates of the Advisor. The Board also took into account discussionswith management and information provided to the Board (including its variouscommittees) at prior meetings with respect to the services provided by theAdvisor to the John Hancock Funds (the Funds), including quarterly perfor-mance reports prepared by management containing reviews of investment results.The Board noted the affiliation of the Subadvisor with the Advisor, noting anypotential conflicts of interest. The Board also considered information regardingthe New Funds presented at the June 2016 meeting. The Board also consideredthe nature, quality, and extent of the non-advisory services, if any, to be providedto the New Funds by the Advisor’s affiliates, including distribution services. TheBoard considered the Advisory Agreement and Subadvisory Agreement separatelyin the course of its review. In doing so, the Board noted the respective roles of theAdvisor and Subadvisor in providing services to the New Funds.
Throughout the process, the Board asked questions of and were afforded theopportunity to request additional information from management. The Board isassisted by legal counsel for the Trust and the Independent Trustees are alsoseparately assisted by independent legal counsel throughout the process. TheIndependent Trustees also received a memorandum from their independent legalcounsel discussing the legal standards for their consideration of the proposedAdvisory Agreement and Subadvisory Agreement and discussed the proposedAdvisory Agreement and Subadvisory Agreement in private sessions withtheir independent legal counsel at which no representatives of managementwere present.
Approval of Advisory Agreement
In approving the Advisory Agreement with respect to the New Funds, the Board,including the Independent Trustees, considered a variety of factors, includingthose discussed below. The Board also considered other factors (including condi-tions and trends prevailing generally in the economy, the securities markets andthe industry) and did not treat any single factor as determinative, and eachTrustee may have attributed different weights to different factors. The Board’sconclusions may be based in part on its consideration of the advisory andsubadvisory arrangements in prior years.
Nature, extent, and quality of services. Among the informationreceived by the Board from the Advisor relating to the nature, extent and qualityof services to be provided to the New Funds, the Board reviewed information
provided by the Advisor relating to its operations and personnel, descriptionsof its organizational and management structure, and information regardingthe Advisor’s compliance and regulatory history. The Board also noted that,on a regular basis, it receives and reviews information from the Trust’s ChiefCompliance Officer (CCO) regarding the Funds’ compliance policies andprocedures established pursuant to Rule 38a-1 under the 1940 Act. The Boardobserved that the scope of services provided by the Advisor, and of the undertak-ings required of the Advisor in connection with those services, including main-taining and monitoring its own and the New Funds’ compliance programs, riskmanagement programs, liquidity management programs and cybersecurity pro-grams, had expanded over time as a result of regulatory, market and otherdevelopments. The Board considered that the Advisor will be responsible for themanagement of the day-to-day operations of the New Funds, including but notlimited to, general supervision of and coordination of the services to be providedby the Subadvisor, and also will be responsible for monitoring and reviewing theactivities of the Subadvisor and third-party service providers. The Board alsoconsidered the significant risks assumed by the Advisor in connection with theservices provided to the fund including entrepreneurial risk in sponsoring theNew Funds and ongoing risks including investment, operational, enterprise,litigation, regulatory and compliance with respect to all funds.
In considering the nature, extent and quality of the services to be provided bythe Advisor, the Trustees also took into account their knowledge of the Advisor’smanagement and the quality of the performance of the Advisor’s duties, throughBoard meetings, discussions and reports during the preceding year and througheach Trustee’s experience as a Trustee of the Trust and of the other trusts inthe complex.
In the course of its deliberations regarding the Advisory Agreement, the Boardconsidered, among other things:
(a) the skills and competency with which the Advisor has in the past managedthe Trust’s affairs and its subadvisory relationships, the Advisor’s oversight andmonitoring of the Subadvisor’s investment performance and compliance pro-grams, such as the Subadvisor’s compliance with fund policies and objectives;review of brokerage matters, including with respect to trade allocation and bestexecution; and the Advisor’s timeliness in responding to performance issues;
(b) the background, qualifications, and skills of the Advisor’s personnel;
(c) the Advisor’s compliance policies and procedures and its responsiveness toregulatory changes and mutual fund industry developments;
(d) the Advisor’s administrative capabilities, including its ability to supervise theother service providers for the New Funds;
(e) the financial condition of the Advisor and whether it has the financial where-withal to provide a high level and quality of services to the New Funds;
(f) the Advisor’s initiatives intended to improve various aspects of the Trust’soperations and investor experience with the New Funds; and
(g) the Advisor’s reputation and experience in serving as an investment advisor tothe Trust, and the benefit to shareholders of investing in funds that are part of afamily of funds offering a variety of investments.
The Board concluded that Advisor may reasonably be expected to provide a highquality of services under the Advisory Agreement with respect to the New Funds.
Investment performance. In connection with its consideration of theAdvisory Agreement, the Board considered, at this and at prior meetings, theperformance of other comparable funds or accounts, if any, managed by theAdvisor and Subadvisor and the performance of their respective benchmarksand/or peer groups. The Board also noted that it reviews at its regularly sched-uled meetings information about the performance of other John Hancock Fundsmanaged by the Advisor and the Subadvisor.
Fees and Expenses. The Board reviewed comparative information including,among other data, the New Funds’ anticipated management fees and net total
John Hancock Funds IIEvaluation of advisory and subadvisory agreements by the board of trustees
300
expenses as compared to similarly situated investment companies deemed to becomparable to the New Funds. The Board also noted that the New Funds’ antici-pated net total expenses were lower the peer group average. The Board took intoaccount management’s discussion of the New Funds’ anticipated expenses. TheBoard reviewed information provided by the Advisor concerning investment advi-sory fees charged to other clients (including other funds in the complex) havingsimilar investment mandates, if any. The Board considered any differencesbetween the Advisor’s and Subadvisor’s services to the New Funds and theservices they provide to other such comparable clients or funds.
The Board took into account management’s discussion of the New Funds’expenses. The Board also took into account management’s discussion with respectto the overall management fee, the fees of the Subadvisor, including the amountof the advisory fee to be retained by the Advisor after payment of the subadvisoryfee, in each case in light of the services rendered for those amount and the risksundertaken by the Advisor. The Board also noted that the Advisor, and not theNew Funds, pays the subadvisory fees. The Board also took into account thatmanagement has agreed to implement an overall fee waiver across a number offunds in the complex, including the New Funds, which is discussed furtherbelow. The Board also noted that the Advisor has agreed to waive fees and/orreimburse expenses with respect to the New Funds. The Board also noted man-agement’s discussion of certain actions taken over the past several years to reducethe funds’ operating expenses.
The Board concluded that the advisory fees to be paid by the New Funds arereasonable in light of the nature, extent and quality of the services to be providedto the New Funds under the Advisory Agreement.
Profitability/Fall out benefits. In considering the costs of the services tobe provided and the profits to be realized by the Advisor and its affiliates fromthe Advisor’s relationship with the New Funds, the Board:
(a) reviewed financial information of the Advisor;
(b) reviewed and considered information presented by the Advisor regarding theanticipated net profitability to the Advisor and its affiliates with respect to theNew Funds;
(c) received and reviewed profitability information with respect to the John Han-cock Fund Complex as a whole and with respect to the New Funds;
(d) received information with respect to the Advisor’s allocation methodologiesused in preparing the profitability data;
(e) considered that the John Hancock insurance companies that are affiliates ofthe Advisor, as shareholders of the Trust directly or through their separateaccounts, receive certain tax credits or deductions relating to foreign taxes paidand dividends received by certain funds of the Trust and noted that these taxbenefits, which are not available to participants in qualified retirement plansunder applicable income tax law, are reflected in the profitability informationreviewed by the Board;
(f) considered that the Advisor will also provide administrative services to theNew Funds on a cost basis pursuant to an administrative services agreement;
(g) noted that affiliates of the Advisor will provide transfer agency services anddistribution services to the New Funds;
(h) noted that the New Funds’ subadvisor is an affiliate of the Advisor;
(i) noted that the Advisor will derive reputational and other indirect benefitsfrom providing advisory services to the New Funds;
(j) noted that the subadvisory fee for the New Funds will be paid by Advisor;
(k) considered the Advisor’s ongoing costs and expenditures necessary toimprove services, meet new regulatory and compliance requirements, and adaptto other challenges impacting the mutual fund industry; and
(l) considered that the Advisor should be entitled to earn a reasonable level ofprofits in exchange for the level of services it will provide to the New Funds and
risks that it assumes as Advisor, including entrepreneurial, operational, reputa-tional, litigation and regulatory risk.
Based upon its review, the Board concluded that the anticipated level of profitabil-ity, if any, of the Advisor and its affiliates from their relationship with the NewFunds is reasonable and not excessive.
Economies of Scale. In considering the extent to which economies of scalewould be realized if the New Funds grow and whether fee levels reflect theseeconomies of scale for the benefit of fund shareholders, the Board: (a) consideredthat the Advisor has contractually agreed to waive a portion of its managementfee for certain funds of the John Hancock Fund Complex, including the NewFunds (the participating portfolios) or otherwise reimburse the expenses of theparticipating portfolios (the reimbursement). This waiver is based upon aggregatenet assets of all the participating portfolios. The amount of the reimbursement iscalculated daily and allocated among all the participating portfolios in proportionto the daily net assets of each fund;
(b) reviewed the New Funds’ advisory fee structure and concluded that: (i) theNew Funds’ fee structure contains breakpoints at the subadvisory fee level andthat such breakpoints are reflected as breakpoints in the advisory fees for theNew Funds; and (ii) although economies of scale cannot be measured with preci-sion, these arrangements will permit shareholders of the New Funds to benefitfrom economies of scale if the New Funds grow. The Board also took intoaccount management’s discussion of the New Funds’ advisory fee structure; and
(c) the Board also considered the potential effect of the New Funds’ futuregrowth in size on their performance and fees. The Board also noted that if theNew Funds’ assets increase over time, the New Funds may realize other econo-mies of scale.
Approval of Subadvisory Agreement
In making its determination with respect to approval of the SubadvisoryAgreement, the Board reviewed:
(a) information relating to the Subadvisor’s business;
(b) the performance of comparable funds, as applicable, managed by theNew Funds’ Subadvisor; and
(c) the proposed subadvisory fee for the New Funds.
Nature, Extent, and Quality of Services. With respect to the servicesto be provided by the Subadvisor, the Board received information provided to theBoard by the Subadvisor. The Board considered the Subadvisor’s current levelof staffing and its overall resources, as well received information relating to theSubadvisor’s compensation program. The Board reviewed the Subadvisor’s historyand investment experience, as well as information regarding the qualifications,background, and responsibilities of the Subadvisor’s investment and compliancepersonnel who will provide services to the New Funds. The Board also consid-ered, among other things, the Subadvisor’s compliance program and any disci-plinary history. The Board also considered the Subadvisor’s risk assessment andmonitoring processes. The Board reviewed the Subadvisor’s regulatory history,including whether it was currently involved in any regulatory actions or investiga-tions as well as material litigation, and any settlements and amelioratory actionsundertaken, as appropriate. The Board noted that the Advisor conducts regularperiodic reviews of the Subadvisor and its operations in regard to the Funds,including regarding investment processes and organizational and staffing matters.The Board also noted that the Trust’s CCO and his staff conduct regular, periodiccompliance reviews with the Subadvisor and present reports to the IndependentTrustees regarding the same, which include evaluating the regulatory compliancesystems of the Subadvisor and procedures reasonably designed by it to assurecompliance with the federal securities laws. The Board also took into account thefinancial condition of the Subadvisor.
The Board considered the Subadvisor’s investment processes and philosophies.The Board took into account that the Subadvisor’s responsibilities will include thedevelopment and maintenance of an investment program for the New Funds that
John Hancock Funds IIEvaluation of advisory and subadvisory agreements by the board of trustees
301
is consistent with the New Funds’ investment objectives, the selection of invest-ment securities and the placement of orders for the purchase and sale of suchsecurities, as well as the implementation of compliance controls related to perfor-mance of these services. The Board also received information with respect to theSubadvisor’s brokerage policies and practices, including with respect to bestexecution and soft dollars.
Subadvisor compensation. In considering the cost of services to be pro-vided by the Subadvisor and the profitability to the Subadvisor of its relationshipto the New Funds, the Board noted that the fees under the Subadvisory Agree-ment are paid by the Advisor and not the New Funds.
The Board also received information and took into account any other potentialconflicts of interest that Advisor might have in connection with the SubadvisoryAgreement.
In addition, the Board considered other potential indirect benefits that theSubadvisor and its affiliates may receive from the Subadvisor’s relationship withthe New Funds, such as the opportunity to provide advisory services to addi-tional John Hancock Funds and reputational benefits.
Subadvisory fees. The Board considered that the New Funds will pay advi-sory fees to the Advisor and that, in turn, the Advisor will pay subadvisory feesto the Subadvisor. The Board considered the New Funds’ subadvisory fee com-pared to similarly situated investment companies deemed to be comparable tothe New Funds, as applicable. The Board noted the limited size of the peergroup. The Board also took into account the subadvisory fees paid by the Advisorto fees charged by the Subadvisor to manage other subadvised portfolios andportfolios not subject to regulation under the 1940 Act, as applicable.
Subadvisor performance. The Board considered performance results ofcomparable funds managed by the Subadvisor against an applicable benchmark.The Board also noted that it reviews at its regularly scheduled meetings informa-tion about the performance of other John Hancock Funds managed by theAdvisor and the Subadvisor. The Board noted the Advisor’s expertise andresources in monitoring the performance, investment style and risk-adjustedperformance of the Subadvisor. The Board was mindful of the Advisor’s focus onthe Subadvisor’s performance. The Board also noted the Subadvisor’s long-termperformance record for similar accounts, as applicable.
The Board’s decision to approve the Subadvisory Agreement was based on anumber of determinations, including the following:
(1) the Subadvisor has extensive experience and demonstrated skills as a man-ager, and may reasonably be expected to provide a high quality of investmentmanagement services to the New Funds;
(2) the proposed subadvisory fees are reasonable in relation to the level and qual-ity of services to be provided under the Subadvisory Agreement; and
(3) that the subadvisory fees will be paid by the Advisor not the New Funds’ andthat the subadvisory fee breakpoints are reflected as breakpoints in the advi-sory fees for the New Funds in order to permit shareholders to benefit fromeconomies of scale if the New Funds grows.
* * *
Based on the Board’s evaluation of all factors that it deemed to be material,including those factors described above, the Board, including the IndependentTrustees, concluded that approval of the Advisory Agreement and the Subadvi-sory Agreement would be in the best interest of the New Funds and its share-holders. Accordingly, the Board, and the Independent Trustees voting separately,approved the amendments to the Advisory Agreement and SubadvisoryAgreement.
This section describes the evaluation by the Board of Trustees (the “Board”) ofJohn Hancock Funds II (the “Trust”) of the Advisory Agreement (the “AdvisoryAgreement”) with John Hancock Advisers, LLC (the “Advisor”) and each of theSubadvisory Agreements (collectively, the “Subadvisory Agreements”) with respectto each of the portfolios of the Trust included in this report except those other-wise noted below (the “Funds”). The Advisory Agreement and SubadvisoryAgreements are collectively referred to as the Agreements. Prior to theJune 19–22, 2017 in-person meeting at which the Agreements were approved,the Board also discussed and considered information regarding the proposed con-tinuation of the Agreements at an in-person meeting held on May 22–24, 2017.
Approval of Advisory and Subadvisory Agreements
At in-person meetings held on June 19-22, 2017, the Board, including theTrustees who are not parties to any Agreement or considered to be interestedpersons of the Trust under the Investment Company Act of 1940, as amended(the “1940 Act”) (the “Independent Trustees”), reapproved for an annual period,the continuation of the Advisory Agreement between the Trust and the Advisorand the applicable Subadvisory Agreements between the Advisor and the invest-ment subadvisors (each, a “Subadvisor” and collectively, the “Subadvisors”) withrespect to each of the Funds identified below in Appendix A. In addition, thefollowing Funds are funds-of-funds and are covered in a separate report: LifestyleAggressive Portfolio, Lifestyle Balanced Portfolio, Lifestyle Conservative Portfolio,Lifestyle Growth Portfolio and Lifestyle Moderate Portfolio.
In considering the Advisory Agreement and the Subadvisory Agreements withrespect to each Fund, the Board received in advance of the meetings a variety ofmaterials relating to each Fund, the Advisor and each Subadvisor, including com-parative performance, fee and expense information for peer groups of similarmutual funds prepared by an independent third-party provider of mutual funddata; performance information for the Funds’ benchmark indices; and, withrespect to each Subadvisor, comparative performance information for comparablymanaged accounts, as applicable; and other information provided by the Advisorand the Subadvisors regarding the nature, extent and quality of services providedby the Advisor and the Subadvisors under their respective Agreements, as well asinformation regarding the Advisor’s revenues and costs of providing services tothe Funds and any compensation paid to affiliates of the Advisor. At the meetingsat which the renewal of the Advisory Agreement and Subadvisory Agreements areconsidered, particular focus is given to information concerning Fund perfor-mance, comparability of fees and total expenses, and profitability. However, theBoard notes that the evaluation process with respect to the Advisor and theSubadvisors is an ongoing one. In this regard, the Board also took into accountdiscussions with management and information provided to the Board (includingits various committees) at prior meetings with respect to the services provided bythe Advisor and the Subadvisors to the Funds, including quarterly performancereports prepared by management containing reviews of investment results, andprior presentations from the Subadvisors with respect to the Funds they manage.The Board noted the affiliation of certain of the Subadvisors with the Advisor,noting any potential conflicts of interest. The Board also considered the nature,quality, and extent of the services, if any, to be provided to the Funds by theAdvisor’s affiliates, including distribution services. The Board considered theAdvisory Agreement and the Subadvisory Agreement separately in the course ofits review. In doing so, the Board noted the respective roles of the Advisor andSubadvisor in providing services to the Funds. In addition, although the Boardapproved the renewal of the Agreements for all the Funds at the June meeting,the Board considered each Fund separately.
Throughout the process, the Board asked questions of and requested additionalinformation from management. The Board is assisted by counsel for the Trust andthe Independent Trustees are also separately assisted by independent legal counselthroughout the process. The Independent Trustees also received a memorandumfrom their independent legal counsel discussing the legal standards for their con-sideration of the proposed continuation of the Agreements and discussed theproposed continuation of the Agreements in private sessions with their indepen-dent legal counsel at which no representatives of management were present.
John Hancock Funds IIEvaluation of advisory and subadvisory agreements by the board of trustees
302
Approval of Advisory Agreement
In approving the Advisory Agreement with respect to each Fund, the Board,including the Independent Trustees, considered a variety of factors, includingthose discussed below. The Board also considered other factors (including condi-tions and trends prevailing generally in the economy, the securities markets andthe industry) and did not treat any single factor as determinative, and eachTrustee may have attributed different weights to different factors. The Board’sconclusions may be based in part on its consideration of the advisory andsubadvisory arrangements in prior years and on the Board’s ongoing regularreview of Fund performance and operations throughout the year.
Nature, Extent and Quality of Services. Among the informationreceived by the Board from the Advisor relating to the nature, extent and qualityof services provided to the Funds, the Board reviewed information providedby the Advisor relating to its operations and personnel, descriptions of its organi-zational and management structure, and information regarding the Advisor’scompliance and regulatory history, including its Form ADV. The Board also notedthat on a regular basis it receives and reviews information from the Trust’s ChiefCompliance Officer (“CCO”) regarding the Funds’ compliance policies andprocedures established pursuant to Rule 38a-1 under the 1940 Act. The Boardobserved that the scope of services provided by the Advisor, and of the under-takings required of the Advisor in connection with those services, includingmaintaining and monitoring its own and the fund’s compliance programs, riskmanagement programs, liquidity management programs and cybersecurityprograms, had expanded over time as a result of regulatory, market and otherdevelopments. The Board considered that the Advisor is responsible for themanagement of the day-to-day operations of the Funds, including but not limitedto, general supervision of and coordination of the services provided by theSubadvisors, and is also responsible for monitoring and reviewing the activitiesof the Subadvisors and other third-party service providers. The Board also consid-ered the significant risk assumed by the Advisor in connection with the servicesprovided to the Funds including entrepreneurial risk in sponsoring new Fundsand ongoing risks including investment, operational, enterprise, litigation, regula-tory and compliance risks with respect to all Funds.
In considering the nature, extent and quality of the services provided by theAdvisor, the Trustees also took into account their knowledge of the Advisor’smanagement and the quality of the performance of the Advisor’s duties, throughBoard meetings, discussions and reports during the preceding year and througheach Trustee’s experience as a Trustee of the Trust and of the other trusts inthe complex.
In the course of their deliberations regarding the Advisory Agreement, the Boardconsidered, among other things:
(a) the skills and competency with which the Advisor has in the past managedthe Trust’s affairs and its subadvisory relationships, the Advisor’s oversight andmonitoring of the Subadvisors’ investment performance and compliance pro-grams, such as the Subadvisors’ compliance with fund policies and objectives,review of brokerage matters including with respect to trade allocation and bestexecution, and the Advisor’s timeliness in responding to performance issues;
(b) the background, qualifications and skills of the Advisor’s personnel;
(c) the Advisor’s compliance policies and procedures and its responsiveness toregulatory changes and mutual fund industry developments;
(d) the Advisor’s administrative capabilities, including its ability to supervise theother service providers for the Funds;
(e) the financial condition of the Advisor and whether it has the financial where-withal to provide a high level and quality of services to the Funds;
(f) the Advisor’s initiative intended to improve various aspects of the Trust’soperations and investor experience with the Funds; and
(g) the Advisor’s reputation and experience in serving as an investment adviser tothe Trust and the benefit to shareholders of investing in funds that are part of afamily of funds offering a variety of investments.
The Board concluded that the Advisor may reasonably be expected to continue toprovide a high quality of services under the Advisory Agreement with respect tothe Funds.
Investment Performance. In considering each Fund’s performance, theBoard noted that it reviews at its regularly scheduled meetings informationabout the Funds’ performance results. In connection with the consideration ofthe Advisory Agreement, the Board:
(a) reviewed information prepared by management regarding the Funds’performance;
(b) considered the comparative performance of each Fund’s respectivebenchmark;
(c) considered the performance of comparable funds, if any, as included in thereport prepared by an independent third-party provider of mutual fund data; and
(d) took into account the Advisor’s analysis of each Fund’s performance and itsplans and recommendations regarding the Trust’s subadvisory arrangements gen-erally and with respect to particular Funds.
The Board noted that while it found the data provided by the independent third-party generally useful it recognized its limitations, including in particular that thedata may vary depending on the end date selected and that the results of theperformance comparisons may vary depending on the selection of the peergroup. The Board reviewed Fund performance against each Fund’s respectivebenchmarks and also concluded that the performance of each of the Funds hasgenerally been in line with or generally outperformed the historical performanceof comparable funds and/or each Fund’s respective benchmark, with certainexceptions noted in Appendix A. In such cases, the Board concluded that suchperformance is being monitored and reasonably addressed, where appropriate.
Fees and Expenses. The Board reviewed comparative information preparedby an independent third-party provider of mutual fund data including, amongother data, each Fund’s contractual and net management fees (and subadvisoryfees, to the extent available) and total expenses as compared to similarly situatedinvestment companies deemed to be comparable to the Fund in light of thenature, extent and quality of the management and advisory and subadvisory ser-vices provided by the Advisor and the Subadvisor. The Board considered eachFund’s ranking within a smaller group of peer funds chosen by the independentthird-party provider, as well as the Fund’s ranking within broader groups offunds. In comparing each Fund’s contractual and net management fees to thatof comparable funds, the Board noted that such fees include both advisory andadministrative costs.
The Board took into account management’s discussion with respect to the overallmanagement fee, the fees of the Subadvisor, including the amount of the advisoryfee retained by the Advisor after payment of the subadvisory fee, in each case inlight of the services rendered for those amounts and the risks undertaken by theAdvisor. The Board also noted that the Advisor pays the subadvisory fees of theFunds. The Board also took into account that management had agreed to imple-ment an overall fee waiver across the complex, which is discussed further below.The Board also noted management’s discussion of the Funds’ expenses, as well asany actions taken over the past several years to reduce the Funds’ operatingexpenses. The Board reviewed information provided by the Advisor concerninginvestment advisory fee charged by the Advisor or one of its advisory affiliates toother clients (including other funds in the complex) having similar investmentmandates, if any. The Board considered any differences between the Advisor’s andeach Subadvisor’s services to a Fund and the services they provide to other com-parable clients or funds. The Board concluded that the advisory fee paid withrespect to each of the Funds is reasonable in light of the nature, extent and qual-ity of the services provided to the Funds under the Advisory Agreement.
John Hancock Funds IIEvaluation of advisory and subadvisory agreements by the board of trustees
303
In addition, in the case of the Lifestyle Funds (each a “Fund of Funds”), theTrustees reviewed the advisory fee to be paid to the Advisor for each Fund ofFunds, and concluded that such fee is based on services provided that are inaddition to, rather than duplicative of, the services provided pursuant to the advi-sory agreements for the underlying portfolios of the Fund of Funds, and that theadditional services are necessary because of the differences between the invest-ment policies, strategies and techniques of a Fund of Funds and those of itsunderlying portfolios.
Profitability/Fall out benefits. In considering the costs of the servicesto be provided and the profits to be realized by the Advisor and its affiliates(including the Subadvisors that are affiliated with the Advisor) from the Advisor’srelationship with the Trust, the Board:
(a) reviewed financial information of the Advisor;
(b) reviewed and considered information presented by the Advisor regardingthe net profitability to the Advisor and its affiliates, of each Fund;
(c) received and reviewed profitability information with respect to the JohnHancock fund complex as a whole and with respect to each Fund;
(d) received information with respect to the Advisor’s allocation methodologiesused in preparing the profitability data and considered that the Advisor hired anindependent third-party consultant to provide an analysis of the Advisor’s alloca-tion methodologies;
(e) considered that the John Hancock insurance companies that are affiliatesof the Advisor, as shareholders of the Trust directly or through their separateaccounts, receive certain tax credits or deductions relating to foreign taxes paidand dividends received by certain Funds of the Trust and noted that these taxbenefits, which are not available to participants in qualified retirement plansunder applicable income tax law, are reflected in the profitability analysisreviewed by the Board;
(f) considered that the Advisor also provides administrative services to the Fundson a cost basis pursuant to an administrative services agreement;
(g) noted that certain of the Funds’ Subadvisors are affiliates of the Advisor;
(h) noted that affiliates of the Advisor provide transfer agency services anddistribution services to the Funds, and that the Trust’s distributor also receivesRule 12b-1 payments to support distribution of the products;
(i) noted that the Advisor also derives reputational and other indirect benefitsfrom providing advisory services to the Funds;
(j) noted that the subadvisory fees for the Funds are paid by the Advisor and arenegotiated at arms’ length with respect to the unaffiliated Subadvisors;
(k) with respect to each Fund of the Funds, the Board noted that the advisoryfee is in addition to the fees received by the Advisor and its affiliates with regardto the underlying portfolios in which each Fund of Funds may invest;
(k) considered the Advisor’s ongoing costs and expenditures necessary toimprove services, meet new regulatory and compliance requirements, and adaptto other challenges impacting the mutual fund industry; and
(l) considered that the Advisor should be entitled to earn a reasonable level ofprofits in exchange for the level of services it provides to each Fund and theentrepreneurial risk that it assumes as Advisor.
Based upon its review, the Board concluded that the level of profitability, if any, ofthe Advisor and its affiliates (including any Subadvisors that are affiliated with theAdvisor), from their relationship with each Fund was reasonable and notexcessive.
Economies of Scale. In considering the extent to which a Fund may realizeany economies of scale and whether fee levels reflect these economies of scale forthe benefit of Fund shareholders, the Board:
(a) considered that with respect to the John Hancock underlying portfolios inwhich the Funds invest, the Advisor has agreed to waive a portion of its manage-ment fee for such funds and for each of the other John Hancock funds in thecomplex (except as discussed below) (the Participating Portfolios) or otherwisereimburse the expenses of the Participating Portfolios (the Reimbursement). Thiswaiver is based upon the aggregate net assets of all the Participating Portfolios.(The funds that are not Participating Portfolios are each of the funds of funds ofthe Trust and John Hancock Variable Insurance Trust. The Funds of Funds alsobenefit from such overall management fee waiver through their investment inunderlying portfolios that include certain of the Participating Portfolios, whichare subject to the Reimbursement);
(b) reviewed the Trust’s advisory fee structure and the incorporation therein ofany subadvisory fee breakpoints in the advisory fees charged and concludedthat (i) most of the Funds’ fee structures contain breakpoints at the subadvisoryfee level and that such breakpoints are reflected as breakpoints in the advisoryfees for Funds and (ii) although economies of scale cannot be measured withprecision, these arrangements permit shareholders of Funds with advisory feebreakpoints to benefit from economies of scale if those Funds grow. The Boardalso took into account management’s discussion of the Funds’ advisory feestructure, including with respect to those Funds that did not currently havebreakpoints; and
(c) considered the effect of the Funds’ growth in size on their performance andfees. The Board also noted that if the Funds’ assets increase over time, the Fundsmay realize other economies of scale.
Approval of Subadvisory Agreements
In making its determination with respect to approval of the SubadvisoryAgreements, the Board reviewed:
(1) information relating to each Subadvisor’s business, including current sub-advisory services to the Trust (and other funds in the John Hancock familyof funds);
(2) the historical and current performance of each Fund and comparative perfor-mance information relating to the Fund’s benchmark and comparable funds;
(3) the subadvisory fee for each Fund, and comparative fee information, whereavailable, prepared by an independent third party provider of mutual funddata; and
(4) information relating to the nature and scope of any material relationships andtheir significance to the Trust’s Advisor and unaffiliated Subadvisors.
Nature, Extent and Quality of Services. With respect to the servicesprovided by each of the Subadvisors with respect to each Fund, the Boardreceived information provided to the Board by each Subadvisor, including eachSubadvisor’s Form ADV, as well as took into account information presentedthroughout the past year. The Board considered each Subadvisor’s current levelof staffing and its overall resources, as well as received information relating toa Subadvisor’s compensation program. The Board reviewed each Subadvisor’shistory and investment experience, as well as information regarding the qualifica-tions, background and responsibilities of each Subadvisor’s investment and com-pliance personnel who provide services to the Funds. The Board also considered,among other things, each Subadvisor’s compliance program and any disciplinaryhistory. The Board also considered each Subadvisor’s risk assessment and monitor-ing process. The Board reviewed each Subadvisor’s regulatory history, includingwhether it was involved in any regulatory actions or investigations as well asmaterial litigation, and any settlements and amelioratory actions undertaken, asappropriate. The Board noted that the Advisor conducts regular, periodic reviewsof each Subadvisor and its operations, including regarding investment processesand organizational and staffing matters. The Board also noted that the CCO andhis staff conduct regular, periodic compliance reviews with each of the Subadvi-sors and present reports to the Independent Trustees regarding the same, whichincludes evaluating the regulatory compliance systems of the Subadvisors andprocedures reasonably designed by them to assure compliance with the federal
John Hancock Funds IIEvaluation of advisory and subadvisory agreements by the board of trustees
304
securities laws. The Board also took into account the financial condition ofeach Subadvisor.
The Board considered each Subadvisor’s investment process and philosophy. TheBoard took into account that each Subadvisor’s responsibilities include the devel-opment and maintenance of an investment program for the applicable Fund thatis consistent with the Fund’s investment objective, the selection of investmentsecurities and the placement of orders for the purchase and sale of such securi-ties, as well as the implementation of compliance controls related to performanceof these services. The Board also received information with respect to eachSubadvisor’s brokerage policies and practices, including with respect to bestexecution and soft dollars.
Subadvisor Compensation. In considering the cost of services to beprovided by each Subadvisor and the profitability to that Subadvisor of its rela-tionship with the Fund, the Board noted that the fees under the SubadvisoryAgreements are paid by the Advisor and not the Funds. The Board also receivedinformation and took into account any other potential conflicts of interest theAdvisor might have in connection with the Subadvisory Agreements. The Boardalso relied on the ability of the Advisor to negotiate each Subadvisory Agreementwith Subadvisors that are not affiliated with the Advisor and the fees thereunderat arm’s length. As a result, the costs of the services to be provided and theprofits to be realized by unaffiliated Subadvisors from their relationshipwith the Trust were not a material factor in the Board’s consideration of theSubadvisory Agreements.
The Board also received information regarding the nature and scope (includingtheir significance to the Advisor and its affiliates and to unaffiliated Subadvisors)of any material relationships with respect to the unaffiliated Subadvisors, whichinclude arrangements in which unaffiliated Subadvisors or their affiliates provideadvisory, distribution or management services in connection with financialproducts sponsored by the Trust’s Advisor or its affiliates, and may include sharesof the Trust, other registered investment companies, a 529 education savingsplan, managed separate accounts and exempt group annuity contracts sold toqualified plans.
In addition, the Board considered other potential indirect benefits that theSubadvisors and their affiliates may receive from a Subadvisor’s relationship withthe Fund, such as the opportunity to provide advisory services to additionalfunds in the John Hancock fund complex and reputational benefits.
Subadvisory Fees. The Board considered that the Fund pays an advisoryfee to the Advisor and that, in turn, the Advisor pays subadvisory fees to eachSubadvisor. As noted above, the Board also considered, if available, each Fund’ssubadvisory fees as compared to similarly situated investment companies deemedto be comparable to the Fund as included in the report prepared by the indepen-dent third party provider of fund data, to the extent applicable. The Board alsotook into account the subadvisory fees paid by the Advisor to a Subadvisor withrespect to the Funds to fees charged by each Fund’s Subadvisor to manage othersubadvised portfolios and portfolios not subject to regulation under the 1940 Act,as applicable.
Subadvisor Performance. As noted above, the Board considered eachFund’s performance as compared to the Fund’s respective peer group and the
benchmark index and noted that the Board reviews information about the Fund’sperformance results at its regularly scheduled meetings. The Board noted theAdvisor’s expertise and resources in monitoring the performance, investment style,and risk-adjusted performance of each Subadvisor. The Board was mindful of theAdvisor’s focus on each Subadvisor’s performance. The Board also noted eachSubadvisor’s long-term performance record for similar accounts, as applicable.
The Board’s decision to approve the Subadvisory Agreements with respect to eachFund was based on a number of determinations, including the following:
(1) each Subadvisor has extensive experience and demonstrated skills as amanager;
(2) although not without variation, the performance of each Fund managed by aSubadvisor generally has been in line with or outperformed the historicalperformance of comparable funds and/or each Fund’s respective benchmark,with the exceptions noted in Appendix A (with respect to such exceptions,the Board concluded that performance is being monitored and reasonablyaddressed);
(3) the subadvisory fees are reasonable in relation to the level and quality ofservices being provided; and
(4) the subadvisory fees are paid by the Advisor and not the Funds, and thatthe fee structure for certain of the Funds contains breakpoints, certainbreakpoints are reflected as breakpoints in the advisory fees for the Fundsin order to permit shareholders to benefit from economies of scale if thoseFunds grow.
In addition, in the case of each Fund of Funds, the Trustees reviewed the subad-visory fee to be paid to the Subadvisor for the Fund of Funds and concluded thatthe subadvisory fee to be paid to the Subadvisor with respect to each Fund ofFunds is based on services provided that are in addition to, rather than duplica-tive of, the services provided pursuant to the subadvisory agreements for theunderlying portfolios of the Fund of Funds and that the additional services arenecessary because of the differences between the investment policies, strategiesand techniques of a Fund of Funds and those of its underlying portfolios.Additional information relating to each Fund’s fees and expenses and perfor-mance that the Board considered in approving the Advisory Agreement andSubadvisory Agreements for a particular Fund is set forth in Appendix A.
* * *
Based on the Board’s evaluation of all factors that the Board deemed to bematerial, including those factors described above, the Board, including theIndependent Trustees, concluded that renewal of the Advisory Agreement andeach of the Subadvisory Agreements with respect to each Fund would be in thebest interest of each of the respective Funds and its shareholders. Accordingly,the Board, and the Independent Trustees voting separately, approved the AdvisoryAgreement and Subadvisory Agreements with respect to each Fund for an addi-tional one-year period.
John Hancock Funds IIEvaluation of advisory and subadvisory agreements by the board of trustees
305
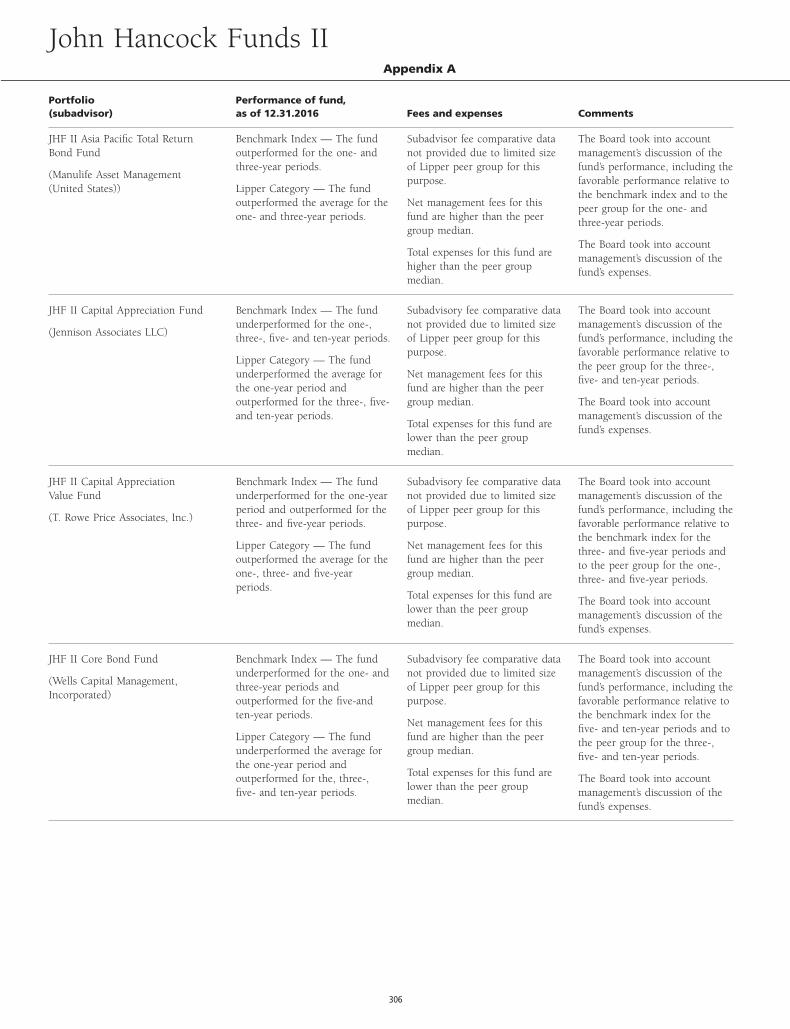
Portfolio(subadvisor)
Performance of fund,as of 12.31.2016 Fees and expenses Comments
JHF II Asia Pacific Total ReturnBond Fund
(Manulife Asset Management(United States))
Benchmark Index — The fundoutperformed for the one- andthree-year periods.
Lipper Category — The fundoutperformed the average for theone- and three-year periods.
Subadvisor fee comparative datanot provided due to limited sizeof Lipper peer group for thispurpose.
Net management fees for thisfund are higher than the peergroup median.
Total expenses for this fund arehigher than the peer groupmedian.
The Board took into accountmanagement’s discussion of thefund’s performance, including thefavorable performance relative tothe benchmark index and to thepeer group for the one- andthree-year periods.
The Board took into accountmanagement’s discussion of thefund’s expenses.
JHF II Capital Appreciation Fund
(Jennison Associates LLC)
Benchmark Index — The fundunderperformed for the one-,three-, five- and ten-year periods.
Lipper Category — The fundunderperformed the average forthe one-year period andoutperformed for the three-, five-and ten-year periods.
Subadvisory fee comparative datanot provided due to limited sizeof Lipper peer group for thispurpose.
Net management fees for thisfund are higher than the peergroup median.
Total expenses for this fund arelower than the peer groupmedian.
The Board took into accountmanagement’s discussion of thefund’s performance, including thefavorable performance relative tothe peer group for the three-,five- and ten-year periods.
The Board took into accountmanagement’s discussion of thefund’s expenses.
JHF II Capital AppreciationValue Fund
(T. Rowe Price Associates, Inc.)
Benchmark Index — The fundunderperformed for the one-yearperiod and outperformed for thethree- and five-year periods.
Lipper Category — The fundoutperformed the average for theone-, three- and five-yearperiods.
Subadvisory fee comparative datanot provided due to limited sizeof Lipper peer group for thispurpose.
Net management fees for thisfund are higher than the peergroup median.
Total expenses for this fund arelower than the peer groupmedian.
The Board took into accountmanagement’s discussion of thefund’s performance, including thefavorable performance relative tothe benchmark index for thethree- and five-year periods andto the peer group for the one-,three- and five-year periods.
The Board took into accountmanagement’s discussion of thefund’s expenses.
JHF II Core Bond Fund
(Wells Capital Management,Incorporated)
Benchmark Index — The fundunderperformed for the one- andthree-year periods andoutperformed for the five-andten-year periods.
Lipper Category — The fundunderperformed the average forthe one-year period andoutperformed for the, three-,five- and ten-year periods.
Subadvisory fee comparative datanot provided due to limited sizeof Lipper peer group for thispurpose.
Net management fees for thisfund are higher than the peergroup median.
Total expenses for this fund arelower than the peer groupmedian.
The Board took into accountmanagement’s discussion of thefund’s performance, including thefavorable performance relative tothe benchmark index for thefive- and ten-year periods and tothe peer group for the three-,five- and ten-year periods.
The Board took into accountmanagement’s discussion of thefund’s expenses.
John Hancock Funds IIAppendix A
306
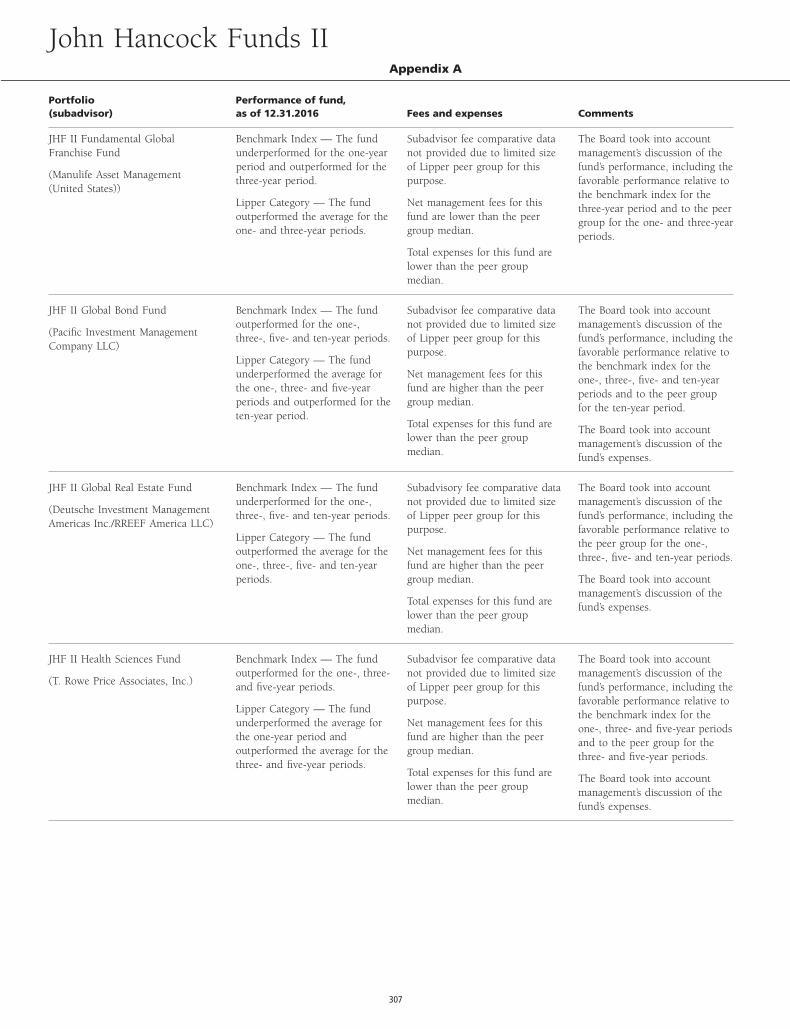
Portfolio(subadvisor)
Performance of fund,as of 12.31.2016 Fees and expenses Comments
JHF II Fundamental GlobalFranchise Fund
(Manulife Asset Management(United States))
Benchmark Index — The fundunderperformed for the one-yearperiod and outperformed for thethree-year period.
Lipper Category — The fundoutperformed the average for theone- and three-year periods.
Subadvisor fee comparative datanot provided due to limited sizeof Lipper peer group for thispurpose.
Net management fees for thisfund are lower than the peergroup median.
Total expenses for this fund arelower than the peer groupmedian.
The Board took into accountmanagement’s discussion of thefund’s performance, including thefavorable performance relative tothe benchmark index for thethree-year period and to the peergroup for the one- and three-yearperiods.
JHF II Global Bond Fund
(Pacific Investment ManagementCompany LLC)
Benchmark Index — The fundoutperformed for the one-,three-, five- and ten-year periods.
Lipper Category — The fundunderperformed the average forthe one-, three- and five-yearperiods and outperformed for theten-year period.
Subadvisor fee comparative datanot provided due to limited sizeof Lipper peer group for thispurpose.
Net management fees for thisfund are higher than the peergroup median.
Total expenses for this fund arelower than the peer groupmedian.
The Board took into accountmanagement’s discussion of thefund’s performance, including thefavorable performance relative tothe benchmark index for theone-, three-, five- and ten-yearperiods and to the peer groupfor the ten-year period.
The Board took into accountmanagement’s discussion of thefund’s expenses.
JHF II Global Real Estate Fund
(Deutsche Investment ManagementAmericas Inc./RREEF America LLC)
Benchmark Index — The fundunderperformed for the one-,three-, five- and ten-year periods.
Lipper Category — The fundoutperformed the average for theone-, three-, five- and ten-yearperiods.
Subadvisory fee comparative datanot provided due to limited sizeof Lipper peer group for thispurpose.
Net management fees for thisfund are higher than the peergroup median.
Total expenses for this fund arelower than the peer groupmedian.
The Board took into accountmanagement’s discussion of thefund’s performance, including thefavorable performance relative tothe peer group for the one-,three-, five- and ten-year periods.
The Board took into accountmanagement’s discussion of thefund’s expenses.
JHF II Health Sciences Fund
(T. Rowe Price Associates, Inc.)
Benchmark Index — The fundoutperformed for the one-, three-and five-year periods.
Lipper Category — The fundunderperformed the average forthe one-year period andoutperformed the average for thethree- and five-year periods.
Subadvisor fee comparative datanot provided due to limited sizeof Lipper peer group for thispurpose.
Net management fees for thisfund are higher than the peergroup median.
Total expenses for this fund arelower than the peer groupmedian.
The Board took into accountmanagement’s discussion of thefund’s performance, including thefavorable performance relative tothe benchmark index for theone-, three- and five-year periodsand to the peer group for thethree- and five-year periods.
The Board took into accountmanagement’s discussion of thefund’s expenses.
John Hancock Funds IIAppendix A
307
Portfolio(subadvisor)
Performance of fund,as of 12.31.2016 Fees and expenses Comments
JHF II High Yield Fund
(Western Asset ManagementCompany)
Benchmark Index — The fundunderperformed for the one-,three-, five- and ten-year periods.
Lipper Category — The fundunderperformed the average forthe three-year period andoutperformed the average for theone- , five- and ten-year periods.
Subadvisory fee comparative datanot provided due to limited sizeof Lipper peer group for thispurpose.
Net management fees for thisfund are higher than the peergroup median.
Total expenses for this fund arelower than the peer groupmedian.
The Board took into accountmanagement’s discussion of thefund’s performance, including thefavorable performance relative tothe peer group for the one-, five-and ten-year periods.
The Board took into accountmanagement’s discussion of thefund’s expenses.
JHF II International GrowthStock Fund
(Invesco Advisers, Inc.)
Benchmark Index — The fundunderperformed for the one-yearperiod and outperformed for thethree- and five-year periods.
Lipper Category — The fundunderperformed the average forthe one-year period andoutperformed the average for thethree- and five-year periods.
Subadvisory fee comparative datanot provided due to limited sizeof Lipper peer group for thispurpose.
Net management fees for thisfund are lower than the peergroup median.
Total expenses for this fund arelower than the peer groupmedian.
The Board took into accountmanagement’s discussion of thefund’s performance, including thefavorable performance relative tothe benchmark and to the peergroup peer group for the three-and five-year periods.
JHF II International Small Cap Fund
(Franklin TempletonInvestments Corp.)
Benchmark Index — The fundunderperformed for the one-,three-, five- and ten-year periods.
Lipper Category — The fundunderperformed the average forthe one-, three- and five-yearperiods and outperformed for theten-year period.
Subadvisor fee comparative datanot provided due to limited sizeof Lipper peer group for thispurpose.
Net management fees for thisfund are higher than the peergroup median.
Total expenses for this fund arelower than the peer groupmedian.
The Board took into accountmanagement’s discussion of thefund’s performance, including thefavorable performance relative tothe peer group for the ten-yearperiod.
The Board took into accountmanagement’s discussion of thefund’s expenses.
JHF II International Value Fund
(Templeton InvestmentCounsel, LLC)
Benchmark Index — The fundunderperformed for the three-and five-year periods andoutperformed for the one- andten-year periods.
Lipper Category — The fundunderperformed the average forthe three-year period andoutperformed the average for theone-, five- and ten-year periods.
Subadvisor fee comparative datanot provided due to limited sizeof Lipper peer group for thispurpose.
Net management fees for thisfund are equal to the peer groupmedian.
Total expenses for this fund arelower than the peer groupmedian.
The Board took into accountmanagement’s discussion of thefund’s performance, including thefavorable performance relative tothe benchmark index for theone- and ten-year periods and tothe peer group for the one-, five-and ten-year periods.
John Hancock Funds IIAppendix A
308
Portfolio(subadvisor)
Performance of fund,as of 12.31.2016 Fees and expenses Comments
JHF II Investment QualityBond Fund
(Wellington ManagementCompany LLP)
Benchmark Index — The fundunderperformed for the three-year period and outperformedfor the one-, five- and ten-yearperiods.
Lipper Category — The fundoutperformed the average for theone-, three-, five- and ten-yearperiods.
Subadvisor fee comparative datanot provided due to limited sizeof Lipper peer group for thispurpose.
Net management fees for thisfund are higher than the peergroup median.
Total expenses for this fund areequal to the peer group median.
The Board took into accountmanagement’s discussion of thefund’s performance, including thefavorable performance relative tothe benchmark index for theone-, five- and ten-year periodsand to the peer group for theone-, three-, five- and ten-yearperiods.
The Board took into accountmanagement’s discussion of thefund’s expenses.
JHF II Multi-Index LifestyleAggressive Portfolio
(Manulife Asset Management(United States))
(Manulife Asset Management(North America))
Benchmark Index — The fundunderperformed for the three-year period and outperformedfor the one-year period.
Lipper Category — The fundoutperformed the average for theone- and three-year periods.
Subadvisor fee comparative datanot provided due to limited sizeof Lipper peer group for thispurpose.
Net management fees for thisfund are higher than the peergroup median.
Total expenses for this fund arelower than the peer groupmedian.
The Board took into accountmanagement’s discussion of thefund’s performance, including thefavorable performance relative tothe benchmark index for theone-year period and to the peergroup for the one- and three-yearperiods.
The Board took into accountmanagement’s discussion of thefund’s expenses.
JHF II Multi-Index LifestyleBalanced Portfolio
(Manulife Asset Management(United States))
(Manulife Asset Management(North America))
Benchmark Index — The fundunderperformed for the three-year period and outperformedfor the one-year period.
Lipper Category — The fundoutperformed the average for theone- and three-year periods.
Subadvisor fee comparative datanot provided due to limited sizeof Lipper peer group for thispurpose.
Net management fees for thisfund are higher than the peergroup median.
Total expenses for this fund arelower than the peer groupmedian.
The Board took into accountmanagement’s discussion of thefund’s performance, including thefavorable performance relative tothe benchmark index for theone-year period and to the peergroup for the one- and three-yearperiods.
The Board took into accountmanagement’s discussion of thefund’s expenses.
JHF II Multi-Index LifestyleConservative Portfolio
(Manulife Asset Management(United States))
(Manulife Asset Management(North America))
Benchmark Index — The fundunderperformed for the one- andthree-year periods.
Lipper Category — The fundoutperformed the average for theone- and three-year periods.
Subadvisor fee comparative datanot provided due to limited sizeof Lipper peer group for thispurpose.
Net management fees for thisfund are higher than the peergroup median.
Total expenses for this fund arelower than the peer groupmedian.
The Board took into accountmanagement’s discussion of thefund’s performance, including thefavorable performance relative tothe peer group for the one- andthree-year periods.
The Board took into accountmanagement’s discussion of thefund’s expenses.
John Hancock Funds IIAppendix A
309
Portfolio(subadvisor)
Performance of fund,as of 12.31.2016 Fees and expenses Comments
JHF II Multi-Index LifestyleGrowth Portfolio
(Manulife Asset Management(United States))
(Manulife Asset Management(North America))
Benchmark Index — The fundunderperformed for the one- andthree-year periods.
Lipper Category — The fundoutperformed the average for theone- and three-year periods.
Subadvisor fee comparative datanot provided due to limited sizeof Lipper peer group for thispurpose.
Net management fees for thisfund are higher than the peergroup median.
Total expenses for this fund arelower than the peer groupmedian.
The Board took into accountmanagement’s discussion of thefund’s performance, including thefavorable performance relative tothe peer group for the one- andthree-year periods.
The Board took into accountmanagement’s discussion of thefund’s expenses.
JHF II Multi-Index LifestyleModerate Portfolio
(Manulife Asset Management(United States))
(Manulife Asset Management(North America))
Benchmark Index — The fundunderperformed for the three-year period and outperformedfor the one-year period.
Lipper Category — The fundoutperformed the average for theone- and three-year periods.
Subadvisor fee comparative datanot provided due to limited sizeof Lipper peer group for thispurpose.
Net management fees for thisfund are higher than the peergroup median.
Total expenses for this fund arelower than the peer groupmedian.
The Board took into accountmanagement’s discussion of thefund’s performance, including thefavorable performance relative tothe benchmark index for theone-year period and to the peergroup for the one- and three-yearperiods.
The Board took into accountmanagement’s discussion of thefund’s expenses.
JHF II Mid Cap Stock Fund
(Wellington ManagementCompany, LLP)
Benchmark Index — The fundunderperformed for the one-,three-, five- and ten-year periods.
Lipper Category — The fundunderperformed the average forthe one-, three- and ten-yearperiods and outperformed theaverage for the five-year period.
Subadvisor fee comparative datanot provided due to limited sizeof Lipper peer group for thispurpose.
Net management fees for thisfund are equal to the peer groupmedian.
Total expenses for this fund arelower than the peer groupmedian.
The Board took into accountmanagement’s discussion of thefund’s performance, including thefavorable performance relative tothe peer group for the five-yearperiod.
JHF II Mid Value Fund
(T. Rowe Price Associates, Inc.)
Benchmark Index — The fundoutperformed for the one-, three-and five-year periods.
Lipper Category — The fundoutperformed for the average forthe one-, three- and five-yearperiods.
Subadvisor fee comparative datanot provided due to limited sizeof Lipper peer group for thispurpose.
Net management fees for thisfund are higher than the peergroup median.
Total expenses for this fund arehigher than the peer groupmedian.
The Board took into accountmanagement’s discussion of thefund’s performance, including thefavorable performance relative tothe benchmark index and to thepeer group for the one-, three-and five-year periods.
The Board took into accountmanagement’s discussion of thefund’s expenses.
JHF II Real Estate Equity Fund
(T. Rowe Price Associates, Inc.)
Benchmark Index — The fundunderperformed for the one-,three-, five- and ten-year periods.
Lipper Category — The fundunderperformed the average forthe one- and ten-year periodsand outperformed the average forthe three- and five-year periods.
Subadvisor fee comparative datanot provided due to limited sizeof Lipper peer group for thispurpose.
Net management fees for thisfund are higher than the peergroup median.
Total expenses for this fund arelower than the peer groupmedian.
The Board took into accountmanagement’s discussion of thefund’s performance, including thefavorable performance relative tothe peer group for the three- andfive-year periods.
The Board took into accountmanagement’s discussion of thefund’s expenses.
John Hancock Funds IIAppendix A
310
Portfolio(subadvisor)
Performance of fund,as of 12.31.2016 Fees and expenses Comments
JHF II Real Estate Securities Fund
(Deutsche Investment ManagementAmericas Inc./RREEF America LLC)
Benchmark Index — The fundunderperformed for the one-,three-, five- and ten-year periods.
Lipper Category — The fundunderperformed the average forthe one-year period andoutperformed the average forthree-, five- and ten-year periods.
Subadvisory fee comparative datanot provided due to limited sizeof Lipper peer group for thispurpose.
Net management fees for thisfund are lower than the peergroup median.
Total expenses for this fund arelower than the peer groupmedian.
The Board took into accountmanagement’s discussion of thefund’s performance, including thefavorable performance relative tothe peer group for the three-,five- and ten-year periods.
JHF II Real Return Bond Fund
(Pacific Investment ManagementCompany LLC)
Benchmark Index — The fundunderperformed for the three-,five- and ten-year periods andoutperformed for the one-yearperiod.
Lipper Category — The fundoutperformed the average for theone-, three-, five- and ten-yearperiods.
Subadvisor fee comparative datanot provided due to limited sizeof Lipper peer group for thispurpose.
Net management fees for thisfund are higher than the peergroup median.
Total expenses for this fund arelower than the peer groupmedian.
The Board took into accountmanagement’s discussion of thefund’s performance, including thefavorable performance relative tothe benchmark index for theone-year period and to the peergroup for the one-, three-, five-and ten-year periods.
The Board took into accountmanagement’s discussion of thefund’s expenses.
JHF II Science & Technology Fund
(Allianz Global Investors U.S. LLC)
(T. Rowe Price Associates, Inc.)
Benchmark Index — The fundunderperformed for the one-yearperiod and outperformed for thethree-year period.
Lipper Category — The fundunderperformed the average forthe one-year period andoutperformed the average for thethree-year period.
Subadvisor fee comparative datanot provided due to limited sizeof Lipper peer group for thispurpose.
Net management fees for thisfund are higher than the peergroup median.
Total expenses for this fund arehigher than the peer groupmedian.
The Board took into accountmanagement’s discussion of thefund’s performance, including thefavorable performance relative tothe benchmark index and to thepeer group for the three- yearperiod.
The Board took into accountmanagement’s discussion of thefund’s expenses.
JHF II Short Term GovernmentIncome Fund
(Manulife Asset Management(United States))
Benchmark Index — The fundunderperformed for the one-,three- and five-year periods.
Lipper Category — The fundunderperformed the average forthe one-year period andoutperformed the average for thethree- and five-year periods.
Subadvisor fee comparative datanot provided due to limited sizeof Lipper peer group for thispurpose.
Net management fees for thisfund are higher than the peergroup median.
Total expenses for this fund arehigher than the peer groupmedian.
The Board took into accountmanagement’s discussion of thefund’s performance, including thefavorable performance relative tothe peer group for the three- andfive-year periods.
The Board took into accountmanagement’s discussion of thefund’s expenses.
JHF II Small Cap Growth Fund
(Wellington ManagementCompany LLP)
Benchmark Index — The fundunderperformed for the one-,three- and five-year periods.
Lipper Category — The fundunderperformed the average forthe one-, three- and five-yearperiods.
Subadvisor fee comparative datanot provided due to limited sizeof Lipper peer group for thispurpose.
Net management fees for thisfund are higher than the peergroup median.
Total expenses for this fund arehigher than the peer groupmedian.
The Board took into accountmanagement’s discussion of thefund’s performance.
The Board took into accountmanagement’s discussion of thefund’s expenses.
John Hancock Funds IIAppendix A
311
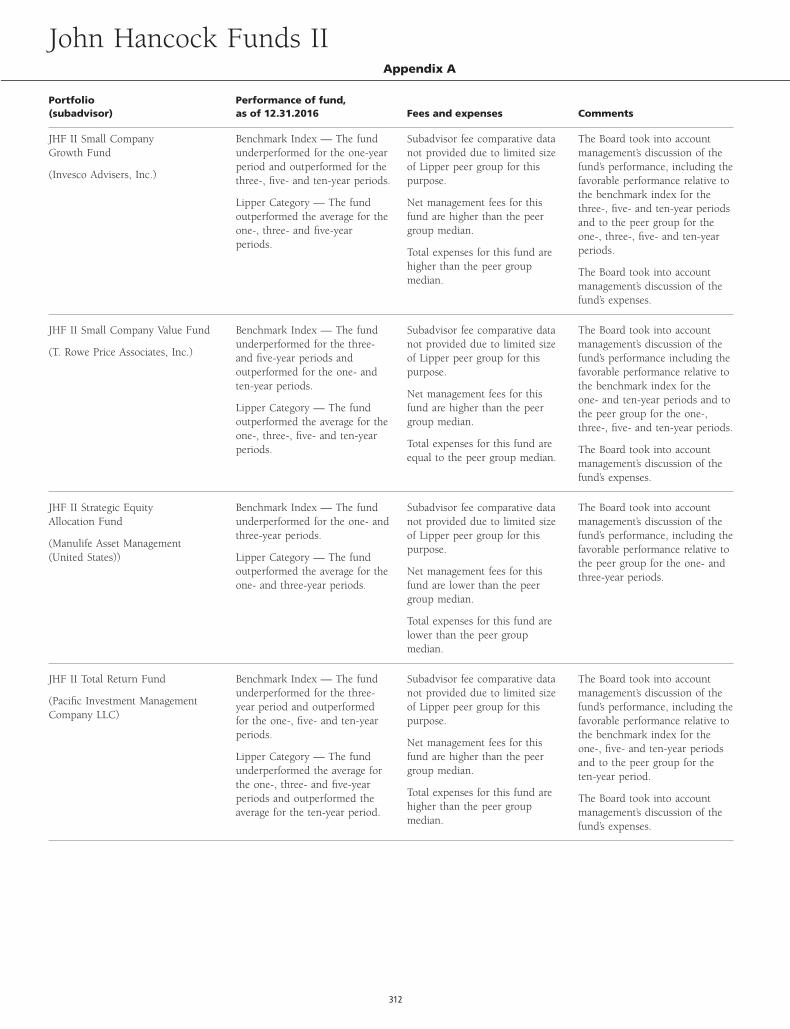
Portfolio(subadvisor)
Performance of fund,as of 12.31.2016 Fees and expenses Comments
JHF II Small CompanyGrowth Fund
(Invesco Advisers, Inc.)
Benchmark Index — The fundunderperformed for the one-yearperiod and outperformed for thethree-, five- and ten-year periods.
Lipper Category — The fundoutperformed the average for theone-, three- and five-yearperiods.
Subadvisor fee comparative datanot provided due to limited sizeof Lipper peer group for thispurpose.
Net management fees for thisfund are higher than the peergroup median.
Total expenses for this fund arehigher than the peer groupmedian.
The Board took into accountmanagement’s discussion of thefund’s performance, including thefavorable performance relative tothe benchmark index for thethree-, five- and ten-year periodsand to the peer group for theone-, three-, five- and ten-yearperiods.
The Board took into accountmanagement’s discussion of thefund’s expenses.
JHF II Small Company Value Fund
(T. Rowe Price Associates, Inc.)
Benchmark Index — The fundunderperformed for the three-and five-year periods andoutperformed for the one- andten-year periods.
Lipper Category — The fundoutperformed the average for theone-, three-, five- and ten-yearperiods.
Subadvisor fee comparative datanot provided due to limited sizeof Lipper peer group for thispurpose.
Net management fees for thisfund are higher than the peergroup median.
Total expenses for this fund areequal to the peer group median.
The Board took into accountmanagement’s discussion of thefund’s performance including thefavorable performance relative tothe benchmark index for theone- and ten-year periods and tothe peer group for the one-,three-, five- and ten-year periods.
The Board took into accountmanagement’s discussion of thefund’s expenses.
JHF II Strategic EquityAllocation Fund
(Manulife Asset Management(United States))
Benchmark Index — The fundunderperformed for the one- andthree-year periods.
Lipper Category — The fundoutperformed the average for theone- and three-year periods.
Subadvisor fee comparative datanot provided due to limited sizeof Lipper peer group for thispurpose.
Net management fees for thisfund are lower than the peergroup median.
Total expenses for this fund arelower than the peer groupmedian.
The Board took into accountmanagement’s discussion of thefund’s performance, including thefavorable performance relative tothe peer group for the one- andthree-year periods.
JHF II Total Return Fund
(Pacific Investment ManagementCompany LLC)
Benchmark Index — The fundunderperformed for the three-year period and outperformedfor the one-, five- and ten-yearperiods.
Lipper Category — The fundunderperformed the average forthe one-, three- and five-yearperiods and outperformed theaverage for the ten-year period.
Subadvisor fee comparative datanot provided due to limited sizeof Lipper peer group for thispurpose.
Net management fees for thisfund are higher than the peergroup median.
Total expenses for this fund arehigher than the peer groupmedian.
The Board took into accountmanagement’s discussion of thefund’s performance, including thefavorable performance relative tothe benchmark index for theone-, five- and ten-year periodsand to the peer group for theten-year period.
The Board took into accountmanagement’s discussion of thefund’s expenses.
John Hancock Funds IIAppendix A
312
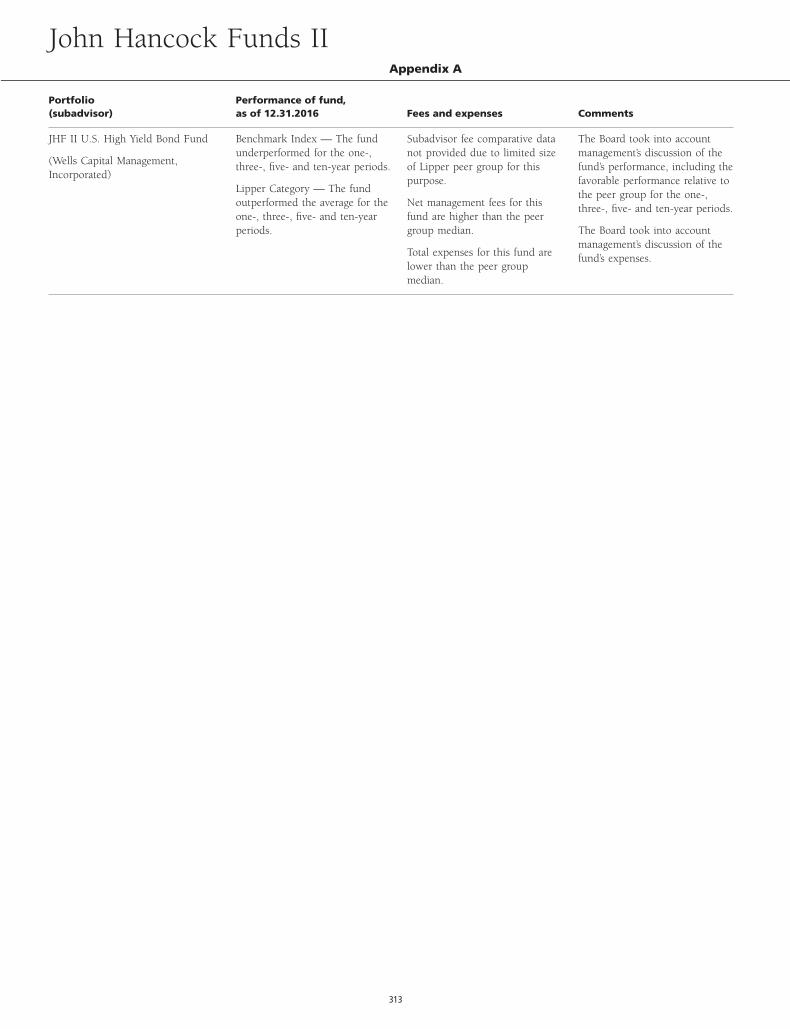
Portfolio(subadvisor)
Performance of fund,as of 12.31.2016 Fees and expenses Comments
JHF II U.S. High Yield Bond Fund
(Wells Capital Management,Incorporated)
Benchmark Index — The fundunderperformed for the one-,three-, five- and ten-year periods.
Lipper Category — The fundoutperformed the average for theone-, three-, five- and ten-yearperiods.
Subadvisor fee comparative datanot provided due to limited sizeof Lipper peer group for thispurpose.
Net management fees for thisfund are higher than the peergroup median.
Total expenses for this fund arelower than the peer groupmedian.
The Board took into accountmanagement’s discussion of thefund’s performance, including thefavorable performance relative tothe peer group for the one-,three-, five- and ten-year periods.
The Board took into accountmanagement’s discussion of thefund’s expenses.
John Hancock Funds IIAppendix A
313
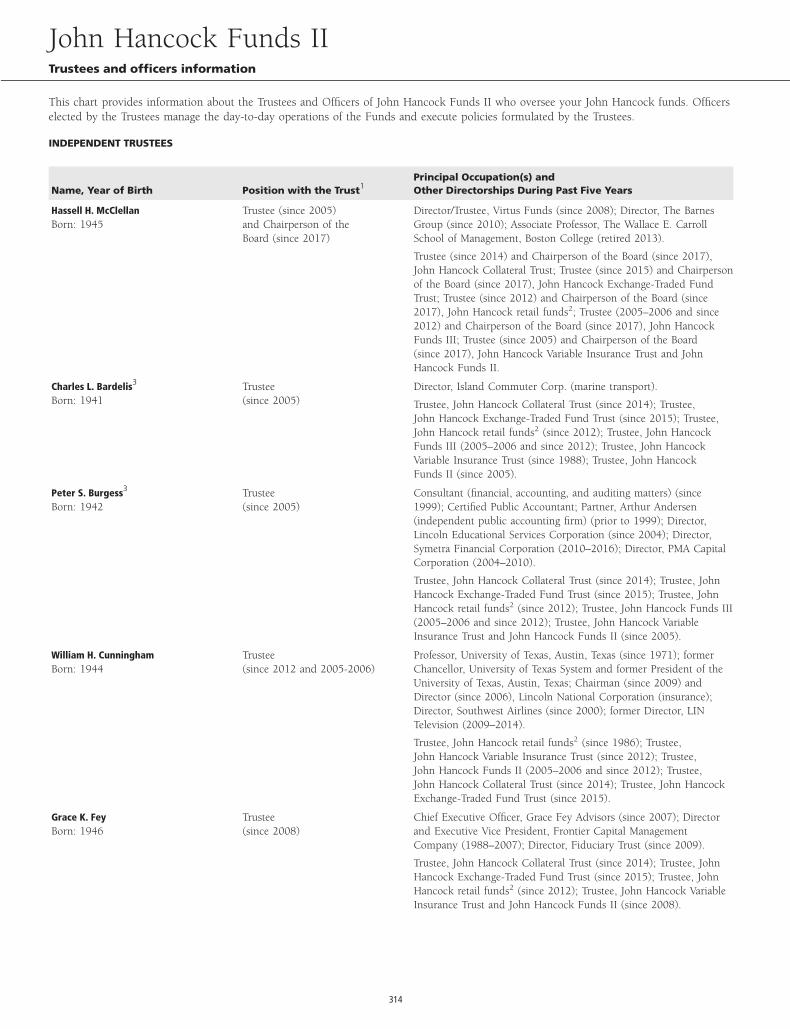
This chart provides information about the Trustees and Officers of John Hancock Funds II who oversee your John Hancock funds. Officerselected by the Trustees manage the day-to-day operations of the Funds and execute policies formulated by the Trustees.
INDEPENDENT TRUSTEES
Name, Year of Birth Position with the Trust1Principal Occupation(s) andOther Directorships During Past Five Years
Hassell H. McClellanBorn: 1945
Trustee (since 2005)and Chairperson of theBoard (since 2017)
Director/Trustee, Virtus Funds (since 2008); Director, The BarnesGroup (since 2010); Associate Professor, The Wallace E. CarrollSchool of Management, Boston College (retired 2013).
Trustee (since 2014) and Chairperson of the Board (since 2017),John Hancock Collateral Trust; Trustee (since 2015) and Chairpersonof the Board (since 2017), John Hancock Exchange-Traded FundTrust; Trustee (since 2012) and Chairperson of the Board (since2017), John Hancock retail funds2; Trustee (2005–2006 and since2012) and Chairperson of the Board (since 2017), John HancockFunds III; Trustee (since 2005) and Chairperson of the Board(since 2017), John Hancock Variable Insurance Trust and JohnHancock Funds II.
Charles L. Bardelis3
Born: 1941Trustee(since 2005)
Director, Island Commuter Corp. (marine transport).
Trustee, John Hancock Collateral Trust (since 2014); Trustee,John Hancock Exchange-Traded Fund Trust (since 2015); Trustee,John Hancock retail funds2 (since 2012); Trustee, John HancockFunds III (2005–2006 and since 2012); Trustee, John HancockVariable Insurance Trust (since 1988); Trustee, John HancockFunds II (since 2005).
Peter S. Burgess3
Born: 1942Trustee(since 2005)
Consultant (financial, accounting, and auditing matters) (since1999); Certified Public Accountant; Partner, Arthur Andersen(independent public accounting firm) (prior to 1999); Director,Lincoln Educational Services Corporation (since 2004); Director,Symetra Financial Corporation (2010–2016); Director, PMA CapitalCorporation (2004–2010).
Trustee, John Hancock Collateral Trust (since 2014); Trustee, JohnHancock Exchange-Traded Fund Trust (since 2015); Trustee, JohnHancock retail funds2 (since 2012); Trustee, John Hancock Funds III(2005–2006 and since 2012); Trustee, John Hancock VariableInsurance Trust and John Hancock Funds II (since 2005).
William H. CunninghamBorn: 1944
Trustee(since 2012 and 2005-2006)
Professor, University of Texas, Austin, Texas (since 1971); formerChancellor, University of Texas System and former President of theUniversity of Texas, Austin, Texas; Chairman (since 2009) andDirector (since 2006), Lincoln National Corporation (insurance);Director, Southwest Airlines (since 2000); former Director, LINTelevision (2009–2014).
Trustee, John Hancock retail funds2 (since 1986); Trustee,John Hancock Variable Insurance Trust (since 2012); Trustee,John Hancock Funds II (2005–2006 and since 2012); Trustee,John Hancock Collateral Trust (since 2014); Trustee, John HancockExchange-Traded Fund Trust (since 2015).
Grace K. FeyBorn: 1946
Trustee(since 2008)
Chief Executive Officer, Grace Fey Advisors (since 2007); Directorand Executive Vice President, Frontier Capital ManagementCompany (1988–2007); Director, Fiduciary Trust (since 2009).
Trustee, John Hancock Collateral Trust (since 2014); Trustee, JohnHancock Exchange-Traded Fund Trust (since 2015); Trustee, JohnHancock retail funds2 (since 2012); Trustee, John Hancock VariableInsurance Trust and John Hancock Funds II (since 2008).
John Hancock Funds IITrustees and officers information
314
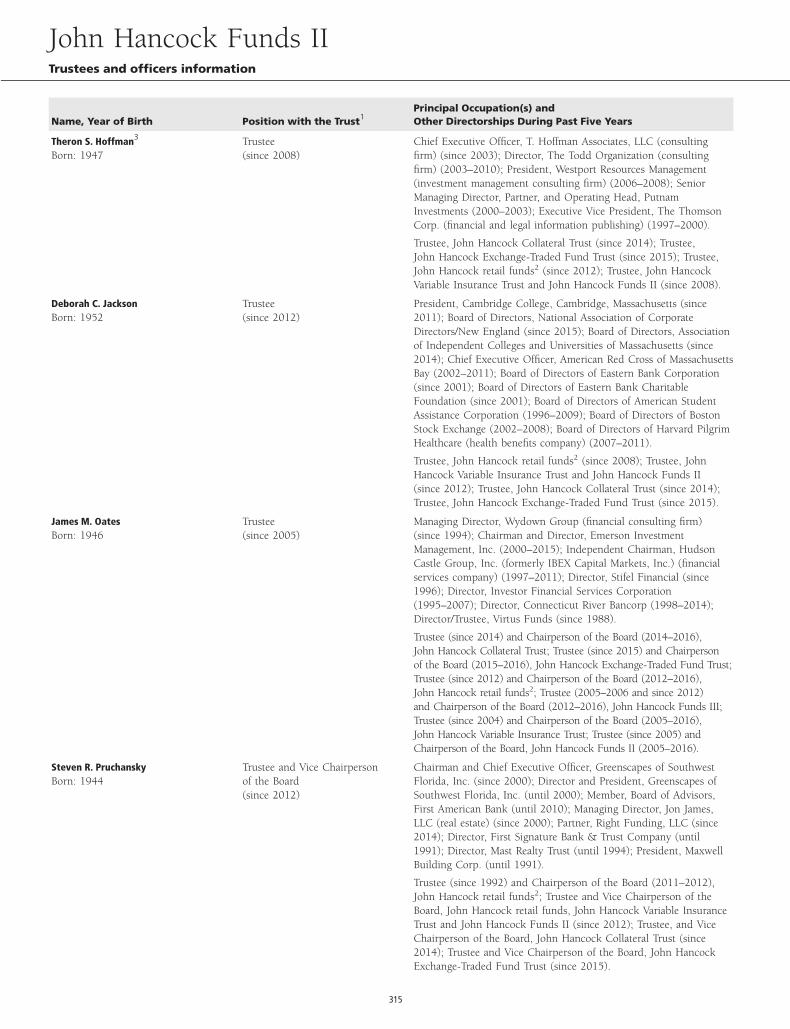
Name, Year of Birth Position with the Trust1Principal Occupation(s) andOther Directorships During Past Five Years
Theron S. Hoffman3
Born: 1947Trustee(since 2008)
Chief Executive Officer, T. Hoffman Associates, LLC (consultingfirm) (since 2003); Director, The Todd Organization (consultingfirm) (2003–2010); President, Westport Resources Management(investment management consulting firm) (2006–2008); SeniorManaging Director, Partner, and Operating Head, PutnamInvestments (2000–2003); Executive Vice President, The ThomsonCorp. (financial and legal information publishing) (1997–2000).
Trustee, John Hancock Collateral Trust (since 2014); Trustee,John Hancock Exchange-Traded Fund Trust (since 2015); Trustee,John Hancock retail funds2 (since 2012); Trustee, John HancockVariable Insurance Trust and John Hancock Funds II (since 2008).
Deborah C. JacksonBorn: 1952
Trustee(since 2012)
President, Cambridge College, Cambridge, Massachusetts (since2011); Board of Directors, National Association of CorporateDirectors/New England (since 2015); Board of Directors, Associationof Independent Colleges and Universities of Massachusetts (since2014); Chief Executive Officer, American Red Cross of MassachusettsBay (2002–2011); Board of Directors of Eastern Bank Corporation(since 2001); Board of Directors of Eastern Bank CharitableFoundation (since 2001); Board of Directors of American StudentAssistance Corporation (1996–2009); Board of Directors of BostonStock Exchange (2002–2008); Board of Directors of Harvard PilgrimHealthcare (health benefits company) (2007–2011).
Trustee, John Hancock retail funds2 (since 2008); Trustee, JohnHancock Variable Insurance Trust and John Hancock Funds II(since 2012); Trustee, John Hancock Collateral Trust (since 2014);Trustee, John Hancock Exchange-Traded Fund Trust (since 2015).
James M. OatesBorn: 1946
Trustee(since 2005)
Managing Director, Wydown Group (financial consulting firm)(since 1994); Chairman and Director, Emerson InvestmentManagement, Inc. (2000–2015); Independent Chairman, HudsonCastle Group, Inc. (formerly IBEX Capital Markets, Inc.) (financialservices company) (1997–2011); Director, Stifel Financial (since1996); Director, Investor Financial Services Corporation(1995–2007); Director, Connecticut River Bancorp (1998–2014);Director/Trustee, Virtus Funds (since 1988).
Trustee (since 2014) and Chairperson of the Board (2014–2016),John Hancock Collateral Trust; Trustee (since 2015) and Chairpersonof the Board (2015–2016), John Hancock Exchange-Traded Fund Trust;Trustee (since 2012) and Chairperson of the Board (2012–2016),John Hancock retail funds2; Trustee (2005–2006 and since 2012)and Chairperson of the Board (2012–2016), John Hancock Funds III;Trustee (since 2004) and Chairperson of the Board (2005–2016),John Hancock Variable Insurance Trust; Trustee (since 2005) andChairperson of the Board, John Hancock Funds II (2005–2016).
Steven R. PruchanskyBorn: 1944
Trustee and Vice Chairpersonof the Board(since 2012)
Chairman and Chief Executive Officer, Greenscapes of SouthwestFlorida, Inc. (since 2000); Director and President, Greenscapes ofSouthwest Florida, Inc. (until 2000); Member, Board of Advisors,First American Bank (until 2010); Managing Director, Jon James,LLC (real estate) (since 2000); Partner, Right Funding, LLC (since2014); Director, First Signature Bank & Trust Company (until1991); Director, Mast Realty Trust (until 1994); President, MaxwellBuilding Corp. (until 1991).
Trustee (since 1992) and Chairperson of the Board (2011–2012),John Hancock retail funds2; Trustee and Vice Chairperson of theBoard, John Hancock retail funds, John Hancock Variable InsuranceTrust and John Hancock Funds II (since 2012); Trustee, and ViceChairperson of the Board, John Hancock Collateral Trust (since2014); Trustee and Vice Chairperson of the Board, John HancockExchange-Traded Fund Trust (since 2015).
John Hancock Funds IITrustees and officers information
315
Name, Year of Birth Position with the Trust1Principal Occupation(s) andOther Directorships During Past Five Years
Gregory A RussoBorn: 1949
Trustee(since 2012)
Director and Audit Committee Chairman (since 2012), and Member,Audit Committee and Finance Committee (since 2011), NCHHealthcare System, Inc. (holding company for multi-entity healthcaresystem); Director and Member (since 2012), and Finance CommitteeChairman (since 2014), The Moorings, Inc. (nonprofit continuingcare community); Vice Chairman, Risk & Regulatory Matters, KPMGLLP (KPMG) (2002–2006); Vice Chairman, Industrial Markets,KPMG (1998–2002); Chairman and Treasurer, Westchester County,New York, Chamber of Commerce (1986–1992); Director, Treasurerand Chairman of Audit and Finance Committees, Putnam HospitalCenter (1989–1995); Director and Chairman of FundraisingCampaign, United Way of Westchester and Putnam Counties,New York (1990–1995).
Trustee, John Hancock retail funds2 (since 2008); Trustee, JohnHancock Variable Insurance Trust and John Hancock Funds II(since 2012); Trustee, John Hancock Collateral Trust (since 2014);Trustee, John Hancock Exchange-Traded Fund Trust (since 2015).
NON-INDEPENDENT TRUSTEES4
Name, Year of Birth Position with the Trust1Principal Occupation(s) andOther Directorships During Past Five Years
Andrew G. ArnottBorn: 1971
President and Trustee(Since 2017)
Executive Vice President, John Hancock Financial Services (since 2009,including prior positions); Director and Executive Vice President, JohnHancock Advisers, LLC (since 2005, including prior positions); Directorand Executive Vice President, John Hancock Investment ManagementServices, LLC (since 2006, including prior positions); President, JohnHancock Funds, LLC (since 2004, including prior positions); President,John Hancock retail funds2, John Hancock Variable Insurance Trustand John Hancock Funds II (since 2007, including prior positions);President, John Hancock Collateral Trust and John Hancock Exchange-Traded Fund Trust (since 2014).
Trustee, John Hancock Collateral Trust, John Hancock Exchange-TradedFund Trust, John Hancock retail funds2, John Hancock VariableInsurance Trust, and John Hancock Funds II (since 2017).
James R. Boyle*Born: 1959
Trustee(since 2015)
Chairman and Chief Executive Officer, Zillion Group, Inc. (formerlyHealthFleet, Inc.) (healthcare) (since 2014); Executive Vice Presidentand Chief Executive Officer, U.S. Life Insurance Division of GenworthFinancial, Inc. (insurance) (January 2014–July 2014); Senior ExecutiveVice President, Manulife Financial Corporation, President and ChiefExecutive Officer, John Hancock (1999–2012); Chairman and Director,John Hancock Advisers, LLC, John Hancock Funds, LLC, and JohnHancock Investment Management Services, LLC (2005–2010).
Trustee, John Hancock Collateral Trust and John Hancock Exchange-Traded Fund Trust (since 2015); Trustee, John Hancock retail funds2
(2005–2010; 2012–2014 and since 2015); Trustee, John HancockVariable Insurance Trust and John Hancock Funds II (2005–2014 andsince 2015).
Warren A. ThomsonBorn: 1955
Trustee(since 2012)
Senior Executive Vice President and Chief Investment Officer, ManulifeFinancial Corporation and The Manufacturers Life Insurance Company(since 2009); Chairman, Manulife Asset Management (since 2001,including prior positions); Director and Chairman, Manulife AssetManagement Limited (since 2006); Director and Chairman, HancockNatural Resources Group, Inc. (since 2013).
Trustee, John Hancock retail funds2, John Hancock Variable InsuranceTrust and John Hancock Funds II (since 2012); Trustee, John HancockCollateral Trust (since 2014); Trustee, John Hancock Exchange-TradedFund Trust (since 2015).
John Hancock Funds IITrustees and officers information
316
PRINCIPAL OFFICERS WHO ARE NOT TRUSTEES
Name, Year of Birth Position with the TrustPrincipal Occupation(s) andOther Directorships During Past Five Years
John J. DanelloBorn: 1955
Senior Vice President(since 2006, includingprior positions); andSecretary and Chief Legal Officer(since 2014)
Vice President and Chief Counsel, John Hancock WealthManagement (since 2005); Senior Vice President (since 2007) andChief Legal Counsel (2007–2010), John Hancock Funds, LLC andThe Berkeley Financial Group, LLC; Senior Vice President (since2006, including prior positions) and Chief Legal Officer andSecretary (since 2014), John Hancock retail funds2, John HancockFunds II and John Hancock Variable Insurance Trust; Senior VicePresident, Secretary and Chief Legal Officer, John Hancock CollateralTrust and John Hancock Exchange-Traded Fund Trust (since 2014);Vice President, John Hancock Life & Health Insurance Company(since 2009); Vice President, John Hancock Life Insurance Company(USA) and John Hancock Life Insurance Company of New York(since 2010); and Senior Vice President, Secretary and ChiefLegal Counsel (2007–2014, including prior positions) of JohnHancock Advisers, LLC and John Hancock Investment ManagementServices, LLC.
Francis V. Knox, Jr.Born: 1947
Chief Compliance Officer(since 2005)
Vice President, John Hancock Financial Services (since 2005); ChiefCompliance Officer, John Hancock retail funds2, John HancockVariable Insurance Trust, John Hancock Funds II, John HancockAdvisers, LLC, and John Hancock Investment Management Services,LLC (since 2005); Chief Compliance Officer, John HancockCollateral Trust and John Hancock Exchange-Traded Fund Trust(since 2014).
Charles A. RizzoBorn: 1957
Chief Financial Officer(since 2007)
Vice President, John Hancock Financial Services (since 2008); SeniorVice President, John Hancock Advisers, LLC and John HancockInvestment Management Services, LLC (since 2008); Chief FinancialOfficer, John Hancock retail funds2, John Hancock VariableInsurance Trust and John Hancock Funds II (since 2007); ChiefFinancial Officer, John Hancock Collateral Trust and John HancockExchange-Traded Fund Trust (since 2014).
Salvatore SchiavoneBorn: 1965
Treasurer(2007-2009 and since 2010,including prior positions)
Assistant Vice President, John Hancock Financial Services (since2007); Vice President, John Hancock Advisers, LLC and JohnHancock Investment Management Services, LLC (since 2007);Treasurer, John Hancock retail funds2 (since 2007, including priorpositions); Treasurer, John Hancock Variable Insurance Trust andJohn Hancock Funds II (2007–2009 and since 2010, including priorpositions); Treasurer, John Hancock Collateral Trust and JohnHancock Exchange-Traded Fund Trust (since 2014).
1 Because the Trust does not hold regular annual shareholders meetings, each Trustee holds office for an indefinite term until his/her successor is duly elected and qualified or until he/shedies, retires, resigns, is removed or becomes disqualified.
2 John Hancock retail funds currently is composed of John Hancock Funds III and 36 other John Hancock funds consisting of 26 series of other John Hancock trusts and 10 closed-end funds.The information for the John Hancock retail funds category relates to service as a Trustee or Officer for any of these funds for the stated period.
3 Member of the audit committee.
4 Because Mr. Thomson is a senior executive or director of the advisor and/or its affiliates, he is considered an “interested person” of the Trust, as defined in the Investment CompanyAct of 1940.
* Non-Independent Trustee, effective 3-10-15.
The business address for all Trustees and Officers is 601 Congress Street, Boston, Massachusetts 02210-2805.
The Statement of Additional Information of the fund includes additional information about members of the Board of Trustees of the Trust and is available without charge, upon request, bycalling 1-800-225-5291.
John Hancock Funds IITrustees and officers information
317

The Statement of Additional Information, a separate document with supplemental information not contained in the prospectus, includes additional information on the Board of Trusteesand can be obtained without charge by calling 800-344-1029 or on the Securities and Exchange Commission (SEC) website at sec.gov.
PROXY VOTING POLICY A description of the trust’s proxy voting policies and procedures and information regarding how the trust voted proxies relating to portfolio securities duringthe most recent twelve-month period ended June 30 is available without charge, upon request, by calling 800-344-1029 or on the SEC website at sec.gov.
QUARTERLY PORTFOLIO DISCLOSURE The trust files a complete schedule of portfolio holdings with the SEC for the first and third quarters of each fiscal year on Form N-Q. The trust’sForm N-Q is available electronically on the SEC website (sec.gov); hard copies may be reviewed and copied at the SEC’s Public Reference Room, 450 Fifth Street, N.W., Washington, DC20549. For more information on the Public Reference Room, call 800-SEC-0330.
The report is certified under the Sarbanes-Oxley Act, which requires mutual funds and other public companies to affirm that, to the best of their knowledge, the information in their financialreports is fairly and accurately stated in all material respects.
John Hancock Funds IIFor more information
318

Management of the trust
Trustees
Hassell H. McClellan, ChairpersonSteven R. Pruchansky, Vice ChairpersonAndrew G. Arnott†#
Charles L. Bardelis*James R. Boyle†Peter S. Burgess*William H. CunninghamGrace K. FeyTheron S. Hoffman*Deborah C. JacksonJames M. OatesGregory A. RussoWarren A. Thomson†* Member of the Audit Committee† Non-Independent Trustee# Effective 6-20-17
OfficersAndrew G. Arnott. PresidentJohn J. Danello, Senior Vice President, Secretary,and Chief Legal OfficerFrancis V. Knox, Jr., Chief Compliance OfficerCharles A. Rizzo, Chief Financial OfficerSalvatore Schiavone, Treasurer
Investment advisorJohn Hancock Advisers, LLCBoston, Massachusetts
Principal distributor
John Hancock Distributors, LLC
Custodians
Citibank, N.A.State Street Bank and Trust Company
Transfer agent
John Hancock Signature Services, Inc.
Legal counsel
K&L Gates LLP
Independent registered publicaccounting firm
PricewaterhouseCoopers LLP
601 Congress StreetBoston MA 02210-2805
JHF2A 9/1711/17