Embed Size (px)
Citation preview
Int. J. Electrochem. Sci., 14 (2019) 10819 – 10834, doi: 10.20964/2019.12.76
International Journal of
ELECTROCHEMICAL
SCIENCE www.electrochemsci.org
Activation of Methane on PdZn/C Electrocatalysts in an Acidic
Electrolyte at Low Temperatures
J. Nandenha1,*, I.H.F. Nagahama1,2, J.Y. Yamashita1,2, E.H. Fontes1, J.M.S. Ayoub1, R.F.B. de Souza1,
F.C. Fonseca1, A.O. Neto1,*
1 Instituto de Pesquisas Energéticas e Nucleares, IPEN/CNEN-SP, Av. Prof. Lineu Prestes, 2242
Cidade Universitária, CEP 05508-000, São Paulo, SP, Brazil 2 Faculdades Osvaldo Cruz, FOC, Rua Brigadeiro Galvão, 540 Barra Funda, CEP 01151-000, São
Paulo, SP, Brazil *E-mail: [email protected]
Received: 5 March 2019 / Accepted: 30 April 2019 / Published: 29 October 2019
PdZn/C electrocatalysts were prepared by sodium borohydride utilized as reducing agent for activation
methane in an acidic medium at room temperature and in a proton exchange membrane fuel cell
(PEMFC) at 80°C. The materials prepared were characterized by X-ray diffraction (XRD),
transmission electron microscopy (TEM) and X-ray photoelectron spectroscopy (XPS). The
diffractograms of the PdZn/C electrocatalysts showed only peaks associated with Pd face-centered
cubic (fcc) structure. Cyclic voltammograms (CV) of all electrocatalysts after adsorption of methane
shown an increment in current during the anodic scan, this effect was more pronounced for
Pd(70)Zn(30)/C. In situ ATR-FTIR (Attenuated Total Reflectance-Fourier Transform Infrared)
experiments was not observed the formation of intermediates adsorbed for PdZn/C electrocatalysts,
this behavior indicated that the methane oxidation occurs by parallel mechanisms. Polarization curves
at 80°C in PEMFC show that Pd(90)Zn(10)/C has superior performance over the other electrocatalysts in
methane oxidation.
Keywords: sodium borohydride reduction process; PdZn/C electrocatalysts; methane oxidation; acidic
electrolytes; polarization curves
1. INTRODUCTION
Methane is a constituent of natural gas. It has higher energy per mass unit (55.7 kJ g-1)
compared to other hydrocarbons or combustible. Consequently, the use of methane as combustible in
SOFC fuel cell has attracted attention [1]. The advances in drilling technologies have expanded access
to natural gas and reduced the expense of process [1, 2]. The use of methane in the energy sector has
Int. J. Electrochem. Sci., Vol. 14, 2019
10820
been via combustion. However, a new alternative is to use methane in a Proton Exchange Membrane
Fuel Cells (PEMFCs).
The Fuel cells are more efficient than heat engines at the lower temperature, and their exhaust
is composed of only CO2 and water making them attractive, and clean energy conversion devices [1].
In the fuel cell technology, methane it is used after steam reforming or directly in Solid Oxide Fuel
Cell (SOFC) [3]. Nevertheless, the high operating temperature (600 - 1,100oC) of a SOFC leads to
problems, like carbon deposition, and requires high startup time. Therefore, the use of methane directly
in a PEMFC could be more attractive [4].
Proton Exchange Membrane Fuel Cells (PEMFCs) has the advantage to much higher power
densities, operating flexibility (faster start up and shut down), and has the potential to be used in
different scales, i.e., from micro to large-scale distributed power generation. This operation makes the
activation of methane extremely challenging under the operating conditions of the PEMFC, where the
development of new nanomaterials is fundamental [1, 4].
The inherent chemical properties of methane, including low electron and proton affinity, low
polarizability, weak acidity, high C-H bond energy (439 kJ mol-1) as well as high ionization energy [5,
6], make it very inert. One of the biggest challenges concerning the use of methane in a PEMFCs is the
development of catalysts that provide sufficient rates of C-H activation at operating temperatures in the
range of 60 to 100°C [1, 7-9].
The activation of C-H and C-C bonds in hydrocarbons by various transition-metal oxide ions
has been investigated experimentally and theoretically by several authors [4, 10-13]. The
electrochemical oxidation of methane at low-temperature fuel cell is a slow process that has been
received little attention by the scientific community in recent years [14, 15].
Joglekar et al. [1] showed that the development of a platinum organometallic complexes
covalently anchored to ordered mesoporous carbon (OMC) for electrochemical oxidation of methane
in a PEMFC at 80°C, in which was obtained a power density of 403 W/mg. Pt organometallic was
five times higher than the power density observed from a modern commercial catalyst and two orders
of magnitude higher than that from a Pt black catalyst.
Platinum (Pt) and Pt-based electrocatalysts are the essential materials for both anode and
cathode fuel cells in acidic media. However, some challenges associated with Pt, such as high-cost and
scarcity of Pt, poisoning by CO, and slow kinetics limit their use [4, 16-18]. An alternative to Pt is the
use of Pd, which it is relatively more abundant in the earth's crust [16, 19]. Pd and Pd alloys exhibit
lower CO poisoning in alkaline media; therefore their use would reduce the cost of the electrode
materials [16, 20-22]. Nevertheless, the direct electrochemical oxidation of methane at ambient
temperatures has been experimentally demonstrated by some works with palladium [14, 23]. The Pd or
other metals of Pd group metals are frequently employed as anodic electrodes for the activation of
methane operating with polymer electrolyte membranes [14, 24], alkaline [25, 26] or acid electrolytes
[23].
Nandenha et al. [4] synthesized Pt/C, Pt/C-ATO, Pd/C and Pd/C-ATO electrocatalysts for
methane oxidation in an acidic electrolyte at 25°C and in a direct methane proton exchange membrane
fuel cell at 80°C. They observed the presence of oxygenated species, like CO or -CHO, which
indicates the formation of carbon dioxide species coming from methane oxidation. They have
Int. J. Electrochem. Sci., Vol. 14, 2019
10821
concluded that Pd/C and Pt/C showed superior performance for methane oxidation in Direct Methane
Fuel Cell (DMEFC), while Pd/C-ATO and Pt/C-ATO indicated a decrease in kinetics reaction showing
that why Pd/C has a better open circuit voltage when was compared to the other materials above-
mentioned.
Matin et al. [16] prepared PdZn/C for methanol oxidation reaction in an alkaline medium and
observed that PdZn/C showed an improved electrocatalytic activity by a factor of ~1.4 - 1.9 in
comparison with Pd/C synthesized using the same method. The methanol oxidation reaction in PdZn/C
started at an earlier onset potential and has a higher current density than for Pd/C [16].
Zhang et al. [27] prepared a Pd-Zn nanocrystals with particle diameters
of approximately 5.0 - 6.5 nm. The electrochemical measurements showed that the PdxZn1-x
nanocrystals exhibit superior performance (activity and stability) for the formic acid oxidation reaction
compared with commercial Pd/C. These authors concluded that the better performance of PdxZn1-x
could be attributed to the synergistic effect between Pd and Zn in Pd-Zn nanocrystals.
Li et al. [28] synthesized palladium nanoparticles (PdNPs) using n-alkylamines (Cn-NH2) as a
stabilizing ligand. These authors showed that the PdNPs were more activity and stable to CH4 when
compared to the bare Pd electrodes.
The aim of our work was to synthesize Pd/C, Zn/C, Pd(90)Zn(10)/C, Pd(70)Zn(30)/C and
Pd(50)Zn(50)/C electrocatalysts by sodium borohydride reduction process for activation of methane in
acidic electrolytes, where the electrochemical activity and the mechanism were studied in the
temperature room, and, finally the electrocatalysts were also applied in the Proton Exchange
Membrane Fuel Cells (PEMFC).
2. EXPERIMENTAL METHODS
2.1. Chemicals
The reagents palladium(II) nitrate hydrate (Pd(NO3)2.2H2O, 97%) and zinc nitrate hydrate
(Zn(NO3)2.xH2O, 99.999%) were purchased from Sigma-Aldrich, and 2-propanol (C3H7OH, 99.5%)
was purchased from Alphatec. Sodium borohydride (NaBH4, ≥ 98,0%), Sodium hydroxide (NaOH,
98%) and Vulcan XC72 carbon black (BET surface area = 250 m2 g-1) were purchased from Aldrich,
Alphatec and Cabot Corporation, respectively. All the reagents were used without any further
purification. Ultrapure water (Millipore, 18.2 MΩ cm) was used for the entire study.
2.2. Synthesis
Pd/C, Zn/C, Pd(90)Zn(10)/C, Pd(70)Zn(30)/C and Pd(50)Zn(50)/C electrocatalysts with 20% of metal
loading, were prepared using Pd(NO3)2.2H2O (Fluka) and Zn(NO3)2·xH2O (Sigma-Aldrich) as metal
sources and sodium borohydride (NaBH4, Aldrich) as reducing agent and Vulcan Carbon XC72
(Cabot) was used as support [29]. The Vulcan XC72 was dispersed into a solution of water/2-propanol
(50/50, v/v), containing metal ions of Pd or Zn. The solution resulting was submitted to an ultrasonic
Int. J. Electrochem. Sci., Vol. 14, 2019
10822
bath by 10 minutes, and then the NaBH4 solution in 0.01 mol L-1 NaOH was added. The resulting
solution was then maintained under stirring for an additional 1 hour. Finally, the material was filtered,
and washed with ultrapure water and dried at 70oC for 2 hours [4, 30].
2.3. X-ray Diffraction (XRD) and Transmission Electron Microscopy (TEM)
Pd/C, Zn/C, Pd(90)Zn(10)/C, Pd(70)Zn(30)/C and Pd(50)Zn(50)/C electrocatalysts were characterized
by X-ray diffraction analysis using CuKα radiation source (λ = 0.15406 nm). The diffractograms were
recorded in the range of 2θ = 20° to 90° with a step size of 0.05o and a scan time of 2 seconds per step
[4, 31, 32]. The morphology and nanoparticle distribution of electrocatalysts were determined by
transmission electron microscopy using a JEOL electron microscope model JEM-2100 operated at 200
kV. After, the mean nanoparticle sizes were measured over 300 nanoparticles from 10 micrographs.
2.4. X-ray Photoelectron Spectroscopy (XPS)
X-ray Photoelectron Spectroscopy was performed using the X-ray Photoelectron Spectrometer
K-Alpha (Thermo Scientific) at LNNANO (Laboratório Nacional de Nanotecnologia) facility held in
Campinas/SP and maintained by CNPEM (Centro Nacional de Pesquisa em Energia e Materiais). The
X-ray spot size was set to 400 𝜇m. The powder samples were held in a copper ribbon. The final core
XPS spectra were an average of three random areas at the surface of the electrocatalysts. To
characterize the metals and its oxidation states we used the most intense band corresponding to a
singlet or doublet states.
2.5. Cyclic Voltammetry (CV)
The cyclic voltammetry of electrocatalysts were carried out with an AutoLab PGSTAT30
Potentiostat/Galvanostat, at 25ºC in a 0.5 mol L-1 H2SO4 solution using a three-electrodes conventional
cell. The reversible hydrogen electrode (RHE) was used as a reference electrode, a Pt wire as a counter
electrode and a thin porous coating technique as working electrode as previously reported [4]. The
cyclic voltammetry experiments were done at a scan rate of 10 mV s-1 for the potential range of 0.05 to
1.2 V with the presence or absence of methane. The adsorption of methane was realized at 0.05 V with
bubbling for 1,800 seconds in 0.5 mol L-1 H2SO4 [4].
2.6. Atennuated Total Reflection - Fourier Transform Infrared (ATR-FTIR)
The ATR-FTIR measurements were performed on a spectrometer equipped with an MCT
detector cooled with liquid N2. The ATR accessory with internal reflection element Diamond/ZnSe is
coupled to the spectrometer [33], where an electrochemical cell is connected above the internal
reflection element. The working electrode was an ultrathin porous coating technique in the presence of
Int. J. Electrochem. Sci., Vol. 14, 2019
10823
CH4 gas saturated in 0.5 mol L-1 H2SO4 for 1,800 seconds. The background spectra were collected
following Nandenha works [4].
2.7. Fuel Cell Experiment
The methane studies in the PEMFC were made in a single cell with an area of
5 cm2. The temperatures were set to 80ºC for the fuel cell and 85ºC for the methane humidifier and
85oC for the oxygen humidifier. The fuel was 500 mL of 99% methane gas at approximately 150 mL
min-1, the oxygen flow was regulated at 200 mL min-1 and pressure atmospheric was also set.
Polarization curves were obtained using an AutoLab PGSTAT302N Potentiostat/Galvanostat with
Software NOVA 2.1.2 coupled, and connected in the fuel cell. Membrane Electrode Assemblies
(MEAs) were prepared by hot pressing at 125°C for 5 min under pressure of 225 kgf cm-2 using a
pretreated Nafion® 117 membranes placed between anode (Pd/C, Zn/C, Pd(90)Zn(10)/C, Pd(70)Zn(30)/C
and Pd(50)Zn(50)/C) and cathode with Pt/C BASF electrocatalysts. The binary anode electrodes and the
cathode prepared in this work were made with 1 mg Pd cm-2 or 1 mg Pt cm-2 electrocatalyst loading,
respectively [29, 32].
3. RESULTS AND DISCUSSION
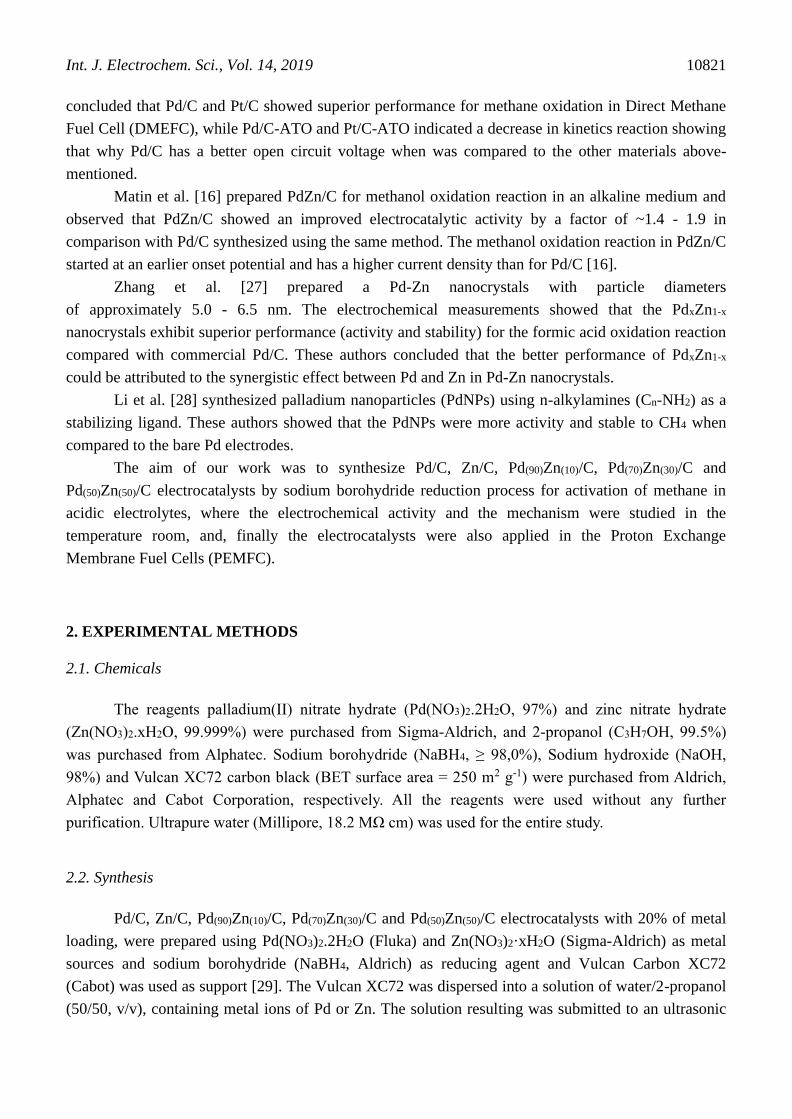
Figure 1 shows the X-ray diffractograms of the Pd/C, Zn/C, Pd(90)Zn(10)/C, Pd(70)Zn(30)/C and
Pd(50)Zn(50)/C electrocatalysts. For all electrocatalysts prepared are observed a broad peak at about 2θ ≈
25° that are associated with the Vulcan Carbon XC72 support material. For Pd/C and PdZn/C
electrocatalysts were observed four peaks at about 2 ≈ 40°, 47°, 67° and 82°, which are associated
with the (111), (200), (220) and (311) crystal planes, respectively, characteristic of the face-centered
cubic structure (fcc) of palladium (Pd) JCPDS #46-1043 [4, 34]. The presence of other seven peaks in
the Zn/C patterns at 2 values of 32o, 34o, 36o, 48o, 57o, 63o and 68o were attributed to the (100),
(002), (101), (102), (110), (103) and (112) planes, respectively, which are characteristic of the
hexagonal structure of ZnO JCPDS #36-1451 [16, 35].
For Zn/C electrocatalyst no peaks related to Zn were observed, therefore the presence of Zn in
small amounts and amorphous forms cannot be discarded; however, XPS results may indicate its
presence. All PdZn/C electrocatalysts showed a shift to higher angles of the peak associated to the
(200), (220) and (311) planes compared to those of Pd/C (see Fig. 1). This indicates that after
incorporation of Zn into the Pd lattice to form the Pd-Zn alloys, there were significant shifts in the
diffraction peak positions due to the smaller ion radius of Zn, following the results of Zhang et al. and
Conant et al. works [27, 36].
Int. J. Electrochem. Sci., Vol. 14, 2019
10824
20 30 40 50 60 70 80 90
0
250
500
750
1000
1250
1500
1750
2000
2250
2500
Inte
nsity / (
a. u
)
2 (degree)
Pd/C
Zn/C
Pd(90)
Zn(10)
/C
Pd(70)
Zn(30)
/C
Pd(50)
Zn(50)
/CC
(0
02
)
Pd
(1
11
)
Pd
(2
00
)
Pd
(2
20
)
Pd
(3
11
)
Figure 1. X-ray diffractograms of the Pd/C, Zn/C, Pd(90)Zn(10)/C, Pd(70)Zn(30)/C and Pd(50)Zn(50)/C
electrocatalysts prepared by borohydride reduction process.
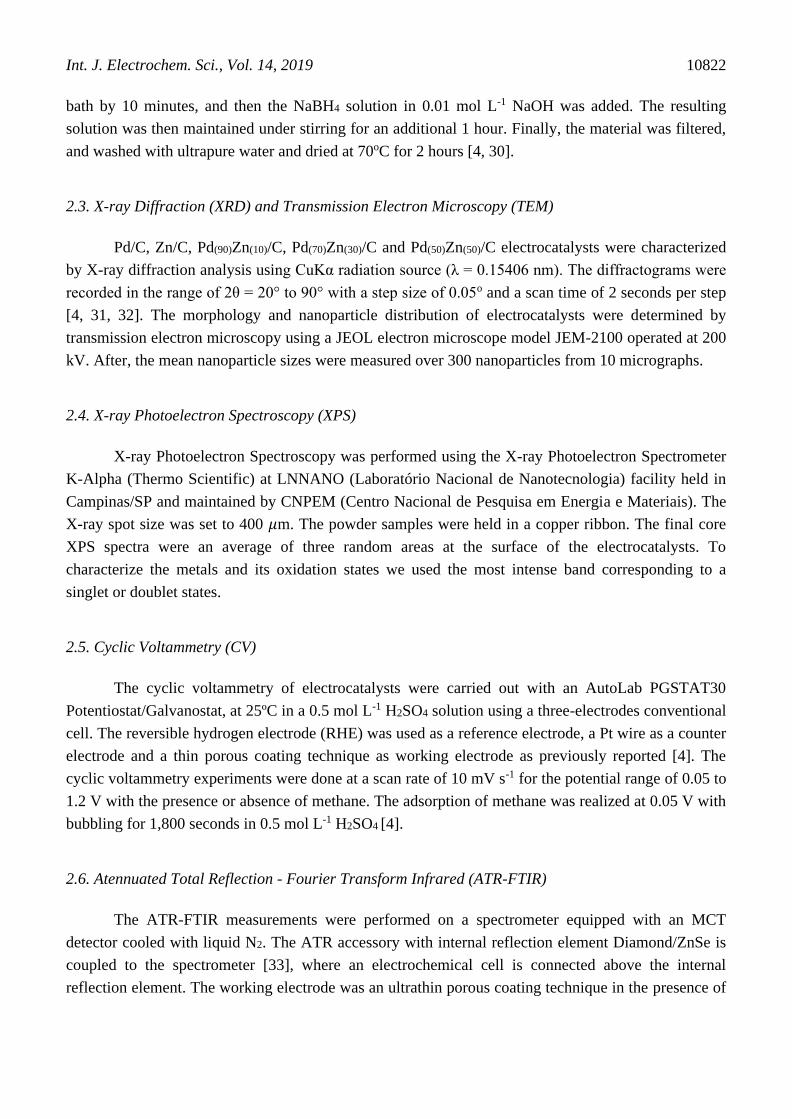
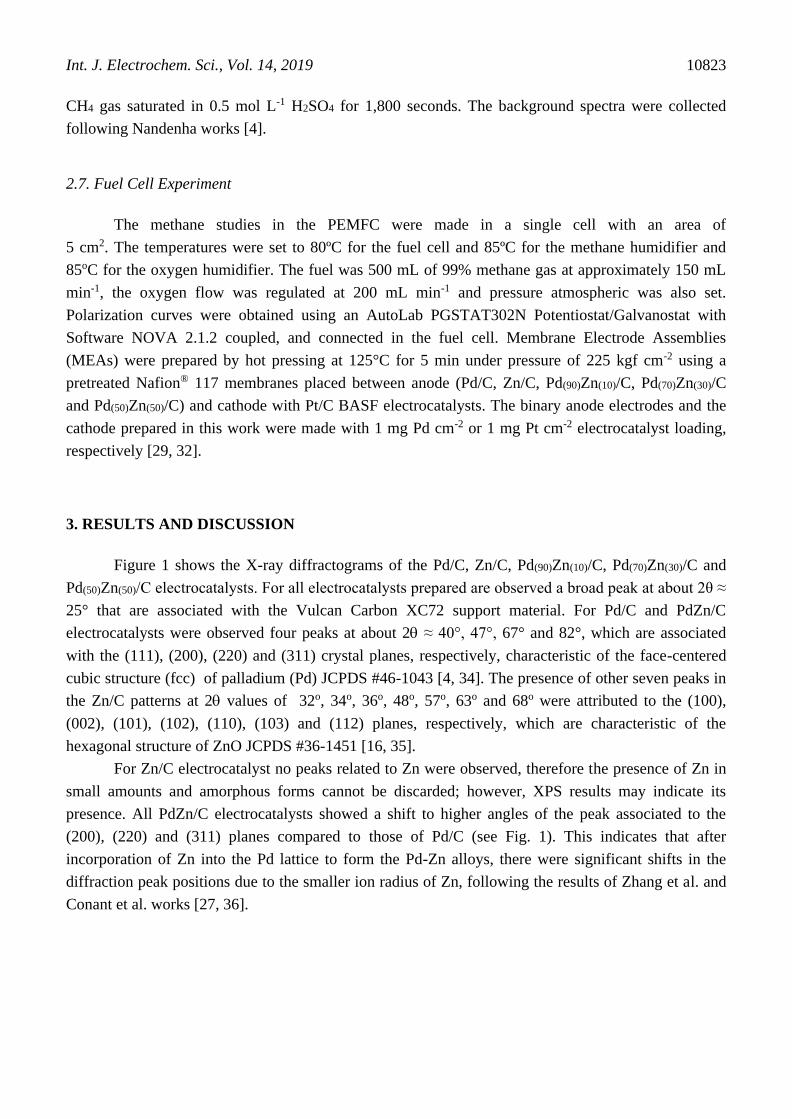
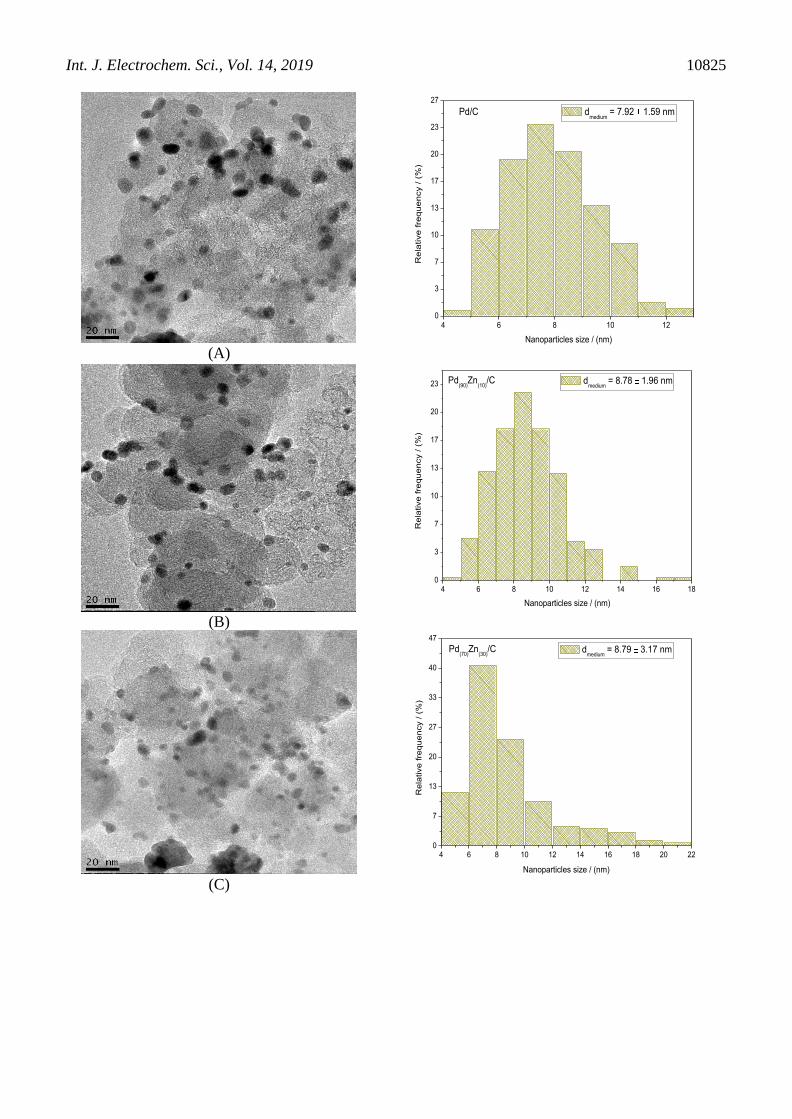
TEM micrographs and histograms of the nanoparticle diameters distribution of Pd/C and
PdZn/C electrocatalysts are shown in Figure 2. All images showed that the nanoparticles where well
dispersed on the support, but some agglomerates were present. The mean nanoparticle diameters of
Pd/C, Pd(90)Zn(10)/C, Pd(70)Zn(30)/C and Pd(50)Zn(50)/C electrocatalysts were 7.92, 8.78, 8.79, and 8.78
nm, respectively (Fig. 2). The insertion of Zn content in Pd/C electrocatalysts increased mean
nanoparticle diameter. This increase is due to the electrocatalyst sintering, and also due to the presence
of the second metal Zn in the whole nanoparticle incorporated into the lattice structure, confirmed by
XRD. This behavior has also been observed by Conant et al. and Nandenha et al. [36, 37].
Int. J. Electrochem. Sci., Vol. 14, 2019
10825
(A)
4 6 8 10 120
3
7
10
13
17
20
23
27
Re
lative
fre
qu
en
cy / (
%)
Nanoparticles size / (nm)
dmedium
= 7.92 1.59 nmPd/C
(B)
4 6 8 10 12 14 16 180
3
7
10
13
17
20
23
Re
lative
fre
qu
en
cy / (
%)
Nanoparticles size / (nm)
dmedium
= 8.78 1.96 nmPd(90)
Zn(10)
/C
(C)
4 6 8 10 12 14 16 18 20 220
7
13
20
27
33
40
47
Rela
tive fre
que
ncy / (
%)
Nanoparticles size / (nm)
dmedium
= 8.79 3.17 nmPd(70)
Zn(30)
/C
Int. J. Electrochem. Sci., Vol. 14, 2019
10826
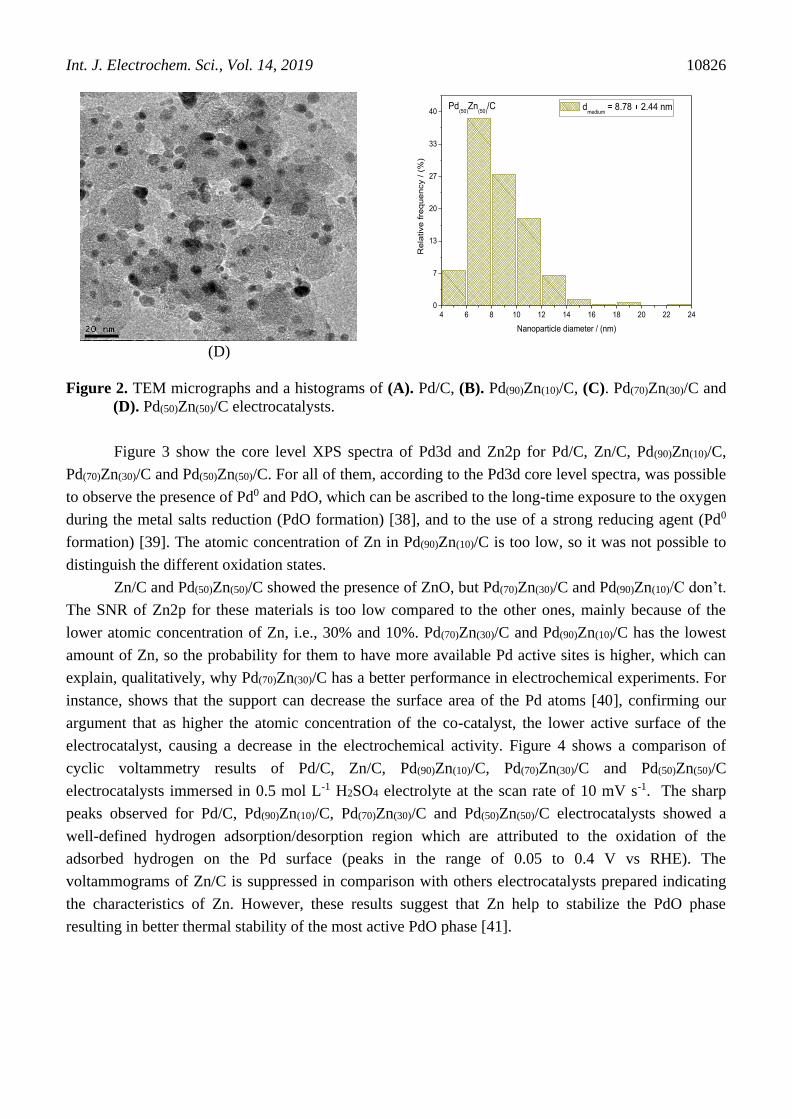
(D)
4 6 8 10 12 14 16 18 20 22 240
7
13
20
27
33
40
Rela
tive fre
que
ncy / (
%)
Nanoparticle diameter / (nm)
dmedium
= 8.78 2.44 nmPd(50)
Zn(50)
/C
Figure 2. TEM micrographs and a histograms of (A). Pd/C, (B). Pd(90)Zn(10)/C, (C). Pd(70)Zn(30)/C and
(D). Pd(50)Zn(50)/C electrocatalysts.
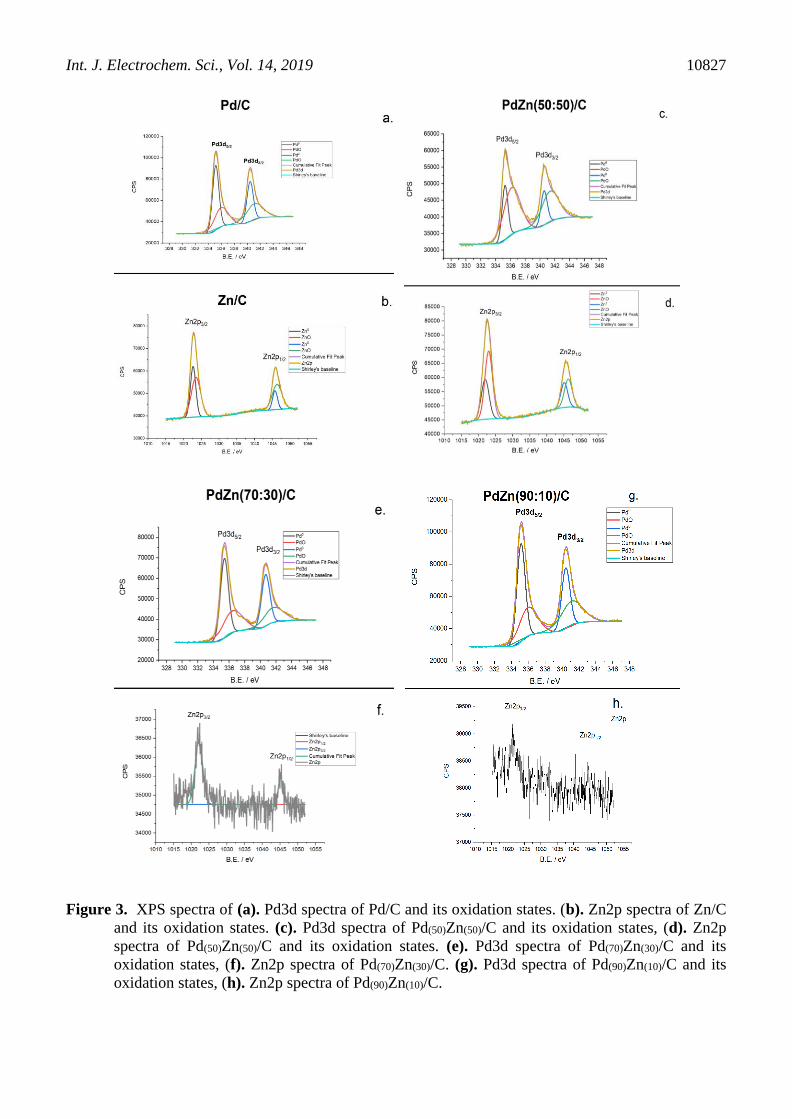
Figure 3 show the core level XPS spectra of Pd3d and Zn2p for Pd/C, Zn/C, Pd(90)Zn(10)/C,
Pd(70)Zn(30)/C and Pd(50)Zn(50)/C. For all of them, according to the Pd3d core level spectra, was possible
to observe the presence of Pd0 and PdO, which can be ascribed to the long-time exposure to the oxygen
during the metal salts reduction (PdO formation) [38], and to the use of a strong reducing agent (Pd0
formation) [39]. The atomic concentration of Zn in Pd(90)Zn(10)/C is too low, so it was not possible to
distinguish the different oxidation states.
Zn/C and Pd(50)Zn(50)/C showed the presence of ZnO, but Pd(70)Zn(30)/C and Pd(90)Zn(10)/C don’t.
The SNR of Zn2p for these materials is too low compared to the other ones, mainly because of the
lower atomic concentration of Zn, i.e., 30% and 10%. Pd(70)Zn(30)/C and Pd(90)Zn(10)/C has the lowest
amount of Zn, so the probability for them to have more available Pd active sites is higher, which can
explain, qualitatively, why Pd(70)Zn(30)/C has a better performance in electrochemical experiments. For
instance, shows that the support can decrease the surface area of the Pd atoms [40], confirming our
argument that as higher the atomic concentration of the co-catalyst, the lower active surface of the
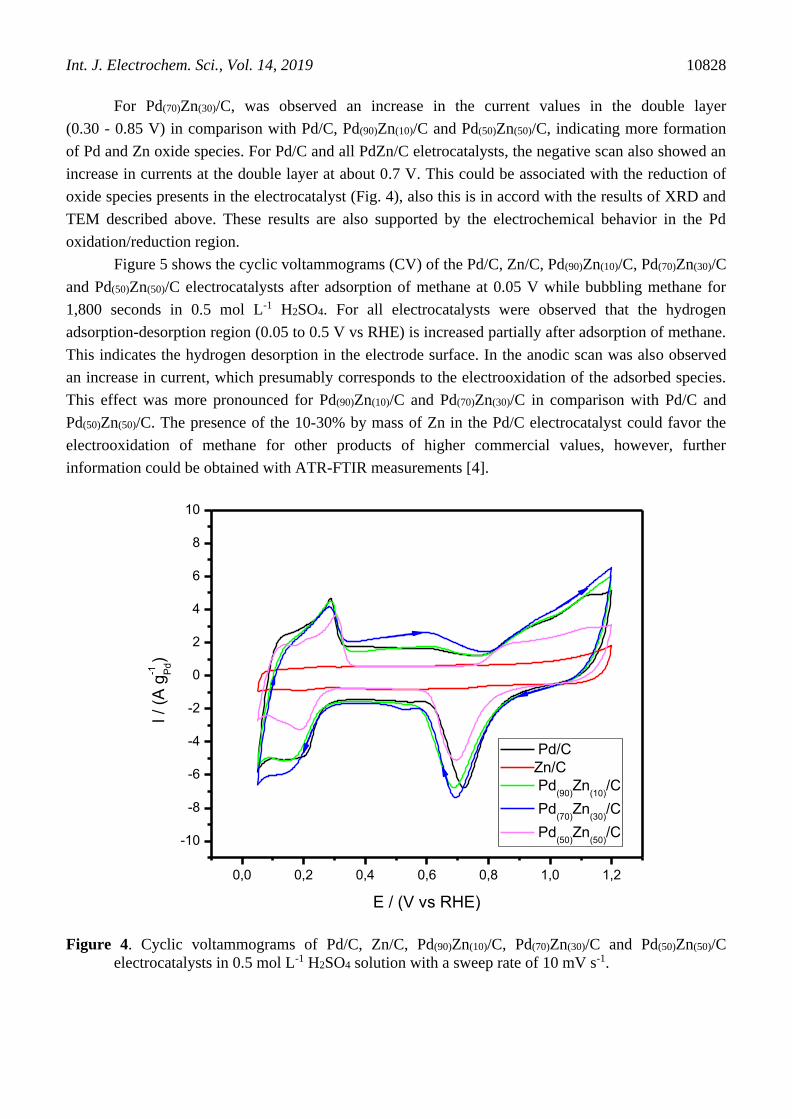
electrocatalyst, causing a decrease in the electrochemical activity. Figure 4 shows a comparison of
cyclic voltammetry results of Pd/C, Zn/C, Pd(90)Zn(10)/C, Pd(70)Zn(30)/C and Pd(50)Zn(50)/C
electrocatalysts immersed in 0.5 mol L-1 H2SO4 electrolyte at the scan rate of 10 mV s-1. The sharp
peaks observed for Pd/C, Pd(90)Zn(10)/C, Pd(70)Zn(30)/C and Pd(50)Zn(50)/C electrocatalysts showed a
well-defined hydrogen adsorption/desorption region which are attributed to the oxidation of the
adsorbed hydrogen on the Pd surface (peaks in the range of 0.05 to 0.4 V vs RHE). The
voltammograms of Zn/C is suppressed in comparison with others electrocatalysts prepared indicating
the characteristics of Zn. However, these results suggest that Zn help to stabilize the PdO phase
resulting in better thermal stability of the most active PdO phase [41].
Int. J. Electrochem. Sci., Vol. 14, 2019
10827
Figure 3. XPS spectra of (a). Pd3d spectra of Pd/C and its oxidation states. (b). Zn2p spectra of Zn/C
and its oxidation states. (c). Pd3d spectra of Pd(50)Zn(50)/C and its oxidation states, (d). Zn2p
spectra of Pd(50)Zn(50)/C and its oxidation states. (e). Pd3d spectra of Pd(70)Zn(30)/C and its
oxidation states, (f). Zn2p spectra of Pd(70)Zn(30)/C. (g). Pd3d spectra of Pd(90)Zn(10)/C and its
oxidation states, (h). Zn2p spectra of Pd(90)Zn(10)/C.
Int. J. Electrochem. Sci., Vol. 14, 2019
10828
For Pd(70)Zn(30)/C, was observed an increase in the current values in the double layer
(0.30 - 0.85 V) in comparison with Pd/C, Pd(90)Zn(10)/C and Pd(50)Zn(50)/C, indicating more formation
of Pd and Zn oxide species. For Pd/C and all PdZn/C eletrocatalysts, the negative scan also showed an
increase in currents at the double layer at about 0.7 V. This could be associated with the reduction of
oxide species presents in the electrocatalyst (Fig. 4), also this is in accord with the results of XRD and
TEM described above. These results are also supported by the electrochemical behavior in the Pd
oxidation/reduction region.
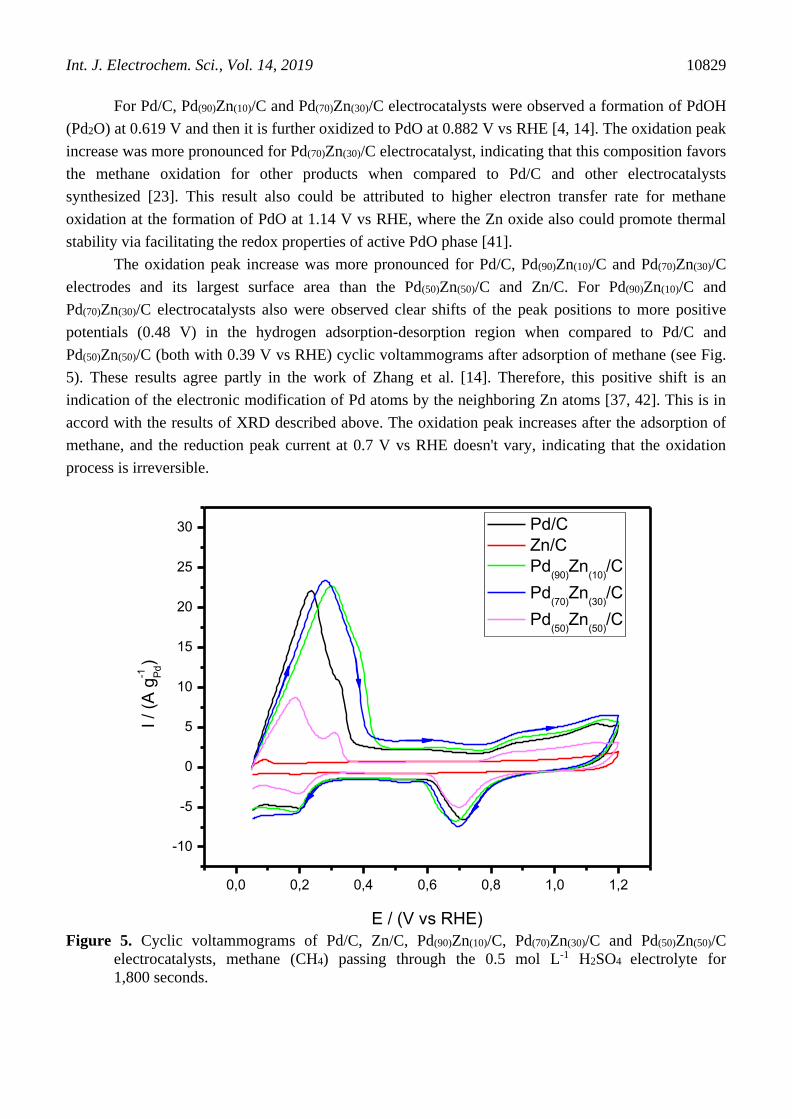
Figure 5 shows the cyclic voltammograms (CV) of the Pd/C, Zn/C, Pd(90)Zn(10)/C, Pd(70)Zn(30)/C
and Pd(50)Zn(50)/C electrocatalysts after adsorption of methane at 0.05 V while bubbling methane for
1,800 seconds in 0.5 mol L-1 H2SO4. For all electrocatalysts were observed that the hydrogen
adsorption-desorption region (0.05 to 0.5 V vs RHE) is increased partially after adsorption of methane.
This indicates the hydrogen desorption in the electrode surface. In the anodic scan was also observed
an increase in current, which presumably corresponds to the electrooxidation of the adsorbed species.
This effect was more pronounced for Pd(90)Zn(10)/C and Pd(70)Zn(30)/C in comparison with Pd/C and
Pd(50)Zn(50)/C. The presence of the 10-30% by mass of Zn in the Pd/C electrocatalyst could favor the
electrooxidation of methane for other products of higher commercial values, however, further
information could be obtained with ATR-FTIR measurements [4].
0,0 0,2 0,4 0,6 0,8 1,0 1,2
-10
-8
-6
-4
-2
0
2
4
6
8
10
I / (A
g-1 P
d)
E / (V vs RHE)
Pd/C
Zn/C
Pd(90)
Zn(10)
/C
Pd(70)
Zn(30)
/C
Pd(50)
Zn(50)
/C
Figure 4. Cyclic voltammograms of Pd/C, Zn/C, Pd(90)Zn(10)/C, Pd(70)Zn(30)/C and Pd(50)Zn(50)/C
electrocatalysts in 0.5 mol L-1 H2SO4 solution with a sweep rate of 10 mV s-1.
Int. J. Electrochem. Sci., Vol. 14, 2019
10829
For Pd/C, Pd(90)Zn(10)/C and Pd(70)Zn(30)/C electrocatalysts were observed a formation of PdOH
(Pd2O) at 0.619 V and then it is further oxidized to PdO at 0.882 V vs RHE [4, 14]. The oxidation peak
increase was more pronounced for Pd(70)Zn(30)/C electrocatalyst, indicating that this composition favors
the methane oxidation for other products when compared to Pd/C and other electrocatalysts
synthesized [23]. This result also could be attributed to higher electron transfer rate for methane
oxidation at the formation of PdO at 1.14 V vs RHE, where the Zn oxide also could promote thermal
stability via facilitating the redox properties of active PdO phase [41].
The oxidation peak increase was more pronounced for Pd/C, Pd(90)Zn(10)/C and Pd(70)Zn(30)/C
electrodes and its largest surface area than the Pd(50)Zn(50)/C and Zn/C. For Pd(90)Zn(10)/C and
Pd(70)Zn(30)/C electrocatalysts also were observed clear shifts of the peak positions to more positive
potentials (0.48 V) in the hydrogen adsorption-desorption region when compared to Pd/C and
Pd(50)Zn(50)/C (both with 0.39 V vs RHE) cyclic voltammograms after adsorption of methane (see Fig.
5). These results agree partly in the work of Zhang et al. [14]. Therefore, this positive shift is an
indication of the electronic modification of Pd atoms by the neighboring Zn atoms [37, 42]. This is in
accord with the results of XRD described above. The oxidation peak increases after the adsorption of
methane, and the reduction peak current at 0.7 V vs RHE doesn't vary, indicating that the oxidation
process is irreversible.
0,0 0,2 0,4 0,6 0,8 1,0 1,2
-10
-5
0
5
10
15
20
25
30
I / (A
g-1 P
d)
E / (V vs RHE)
Pd/C
Zn/C
Pd(90)
Zn(10)
/C
Pd(70)
Zn(30)
/C
Pd(50)
Zn(50)
/C
Figure 5. Cyclic voltammograms of Pd/C, Zn/C, Pd(90)Zn(10)/C, Pd(70)Zn(30)/C and Pd(50)Zn(50)/C
electrocatalysts, methane (CH4) passing through the 0.5 mol L-1 H2SO4 electrolyte for
1,800 seconds.
Int. J. Electrochem. Sci., Vol. 14, 2019
10830
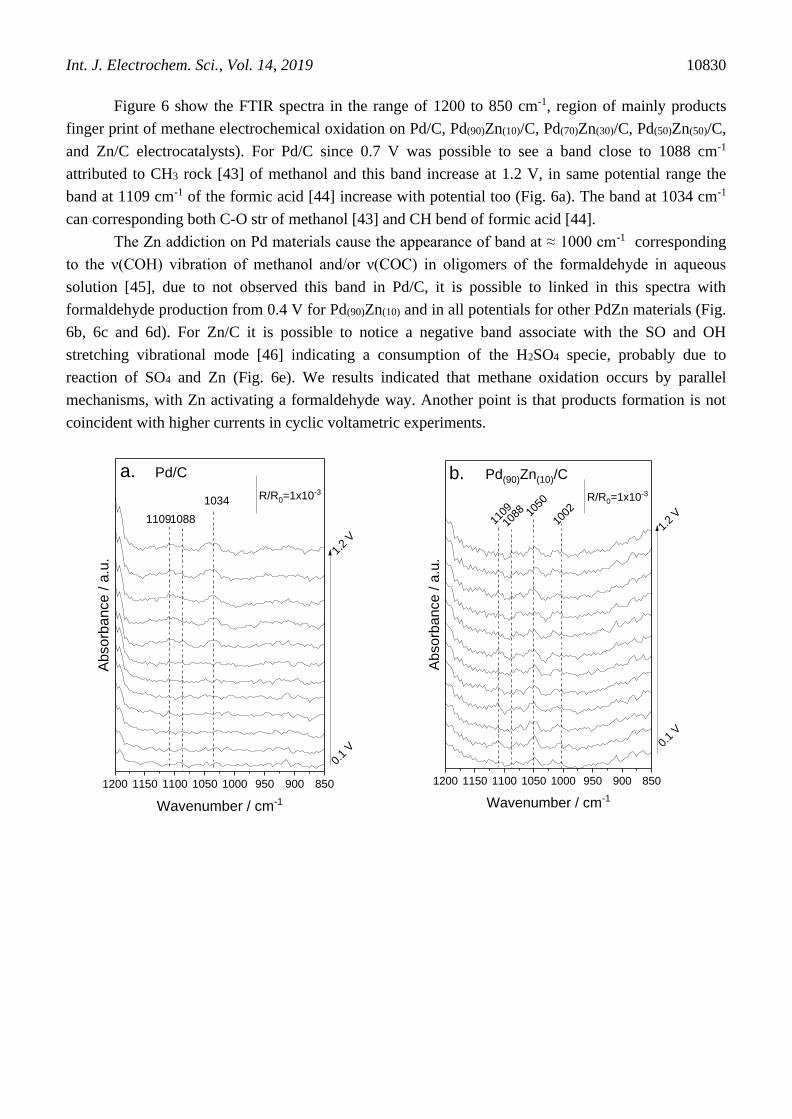
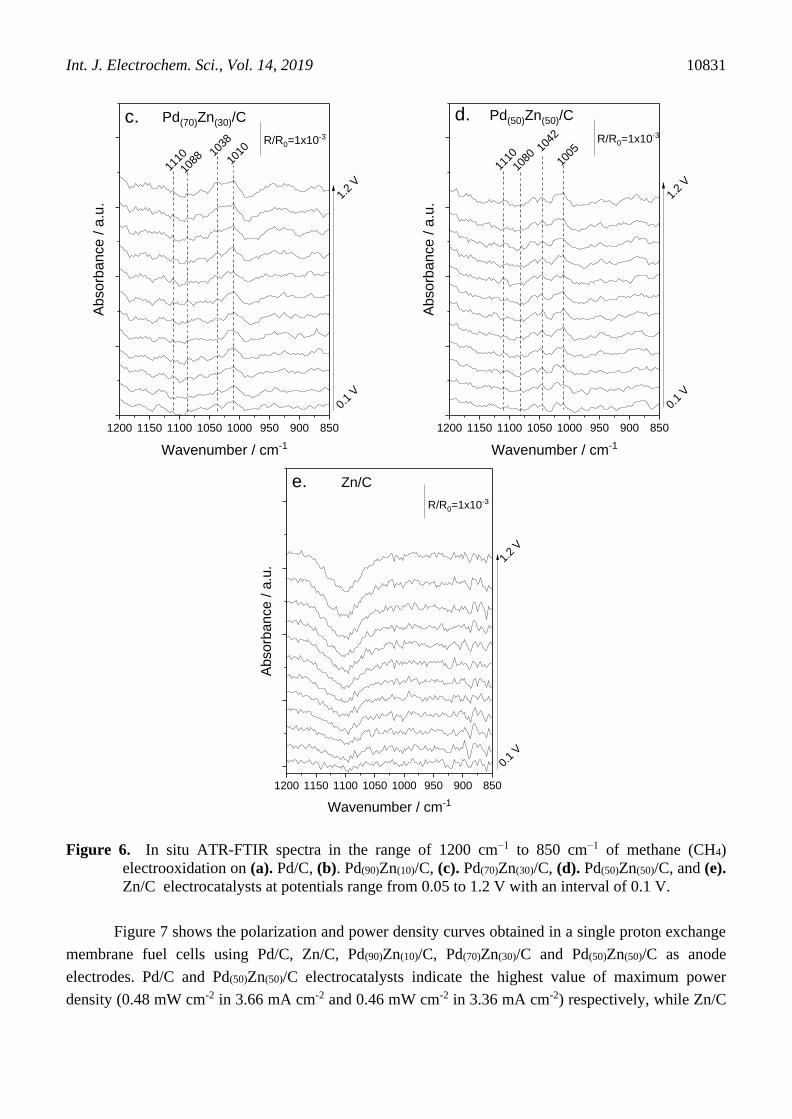
Figure 6 show the FTIR spectra in the range of 1200 to 850 cm-1, region of mainly products
finger print of methane electrochemical oxidation on Pd/C, Pd(90)Zn(10)/C, Pd(70)Zn(30)/C, Pd(50)Zn(50)/C,
and Zn/C electrocatalysts). For Pd/C since 0.7 V was possible to see a band close to 1088 cm-1
attributed to CH3 rock [43] of methanol and this band increase at 1.2 V, in same potential range the
band at 1109 cm-1 of the formic acid [44] increase with potential too (Fig. 6a). The band at 1034 cm-1
can corresponding both C-O str of methanol [43] and CH bend of formic acid [44].
The Zn addiction on Pd materials cause the appearance of band at ≈ 1000 cm-1 corresponding
to the ν(COH) vibration of methanol and/or ν(COC) in oligomers of the formaldehyde in aqueous
solution [45], due to not observed this band in Pd/C, it is possible to linked in this spectra with
formaldehyde production from 0.4 V for Pd(90)Zn(10) and in all potentials for other PdZn materials (Fig.
6b, 6c and 6d). For Zn/C it is possible to notice a negative band associate with the SO and OH
stretching vibrational mode [46] indicating a consumption of the H2SO4 specie, probably due to
reaction of SO4 and Zn (Fig. 6e). We results indicated that methane oxidation occurs by parallel
mechanisms, with Zn activating a formaldehyde way. Another point is that products formation is not
coincident with higher currents in cyclic voltametric experiments.
1200 1150 1100 1050 1000 950 900 850
Abso
rban
ce
/ a
.u.
Wavenumber / cm-1
1034
1109
Pd/C
0.1
V
1.2
V
a.
R/R0=1x10-3
1088
1200 1150 1100 1050 1000 950 900 850
Abso
rban
ce
/ a
.u.
Wavenumber / cm-1
1109
Pd(90)Zn(10)/C
0.1
V
1.2
V10
02
b.
R/R0=1x10-3
1050
1088
Int. J. Electrochem. Sci., Vol. 14, 2019
10831
1200 1150 1100 1050 1000 950 900 850
Ab
so
rba
nce
/ a
.u.
Wavenumber / cm-1
101010
38
1110
Pd(70)Zn(30)/C
0.1
V
1.2
V
c.R/R0=1x10-3
1088
1200 1150 1100 1050 1000 950 900 850A
bso
rba
nce
/ a
.u.
Wavenumber / cm-1
100510
42
1110
Pd(50)Zn(50)/C
0.1
V
1.2
V
1080
R/R0=1x10-3
d.
1200 1150 1100 1050 1000 950 900 850
Ab
so
rba
nce
/ a
.u.
Wavenumber / cm-1
Zn/C
0.1
V
1.2
V
e.
R/R0=1x10-3
Figure 6. In situ ATR-FTIR spectra in the range of 1200 cm−1 to 850 cm−1 of methane (CH4)
electrooxidation on (a). Pd/C, (b). Pd(90)Zn(10)/C, (c). Pd(70)Zn(30)/C, (d). Pd(50)Zn(50)/C, and (e).
Zn/C electrocatalysts at potentials range from 0.05 to 1.2 V with an interval of 0.1 V.
Figure 7 shows the polarization and power density curves obtained in a single proton exchange
membrane fuel cells using Pd/C, Zn/C, Pd(90)Zn(10)/C, Pd(70)Zn(30)/C and Pd(50)Zn(50)/C as anode
electrodes. Pd/C and Pd(50)Zn(50)/C electrocatalysts indicate the highest value of maximum power
density (0.48 mW cm-2 in 3.66 mA cm-2 and 0.46 mW cm-2 in 3.36 mA cm-2) respectively, while Zn/C

Int. J. Electrochem. Sci., Vol. 14, 2019
10832
and Pd(70)Zn(30)/C (0.32 mW cm-2 in 2.31 mA cm-2 and 0.38 mW cm-2 in 3.16 mA cm-2), respectively.
The experiments at 80°C showed that the addition of 10% Zn into Pd/C electrocatalyst promote
methane electrooxidation. Pd(90)Zn(10)/C showed superior performance for methane oxidation (0.53
mW cm-2 in 3.51 mA cm-2), while Zn/C and Pd(70)Zn(30)/C indicated a decrease in kinetics reaction.
1 2 3 4 5 6 7 8
-0,05
0,00
0,05
0,10
0,15
0,20
0,25
0,30
Current density / (mA cm-2)
Ce
ll vo
lta
ge
/ (
V)
Pd/C
Zn/C
Pd(90)
Zn(10)
/C
Pd(70)
Zn(30)
/C
Pd(50)
Zn(50)
/C
(a1)
1 2 3 4 5 6 7 8
-0,1
0,0
0,1
0,2
0,3
0,4
0,5
0,6
Current density / (mA cm-2)
Po
we
r d
en
sity / (
mW
cm
-2)
Pd/C
Zn/C
Pd(90)
Zn(10)
/C
Pd(70)
Zn(30)
/C
Pd(50)
Zn(50)
/C
(a2)
Figure 7. (a1). Polarization and (a2). power density curves of a 5 cm2 direct methane fuel cell using
20 wt.% PdZn materials in anode and Pt/C at the cathode (1 mg Pt cm−2) and Nafion® 117 as a
membrane at 80°C using 150 mL min-1 of methane (CH4).
4. CONCLUSIONS
Binaries PdZn/C prepared by sodium borohydride reduction method were an efficient
electroctrocatalysts for methane activation. For PdZn/C electrocatalysts were observed four peaks at
about 2θ ≈ 40°, 47°, 67° and 82°, which are associated with the (111), (200), (220) and (311) crystal
planes, respectively, characteristic of the face-centered cubic structure (fcc) of palladium (Pd);
however, a presence of Zn is not observed. For XPS results, Zn/C and Pd(50)Zn(50)/C showed the
presence of ZnO, but Pd(90)Zn(10)/C and Pd(70)Zn(30)/C don't mainly because of the lower atomic
concentration. Also, all electrocatalysts, except Pd/C, have the presence of Zn0.
In the scan anodic of PdZn/C electrocatalysts were observed an increase in current in the
hydrogen desorption region, however does not correspond to product formation potentials indicating
that methane oxidation occurs by parallel mechanisms, as a observed by ATR-FTIR in situ.
The experiments at 80°C in PEMFC showed that the addition of 10% Zn into Pd/C
electrocatalyst promote methane activation. Pd(90)Zn(10)/C showed superior performance for methane
oxidation, while Zn/C and Pd(70)Zn(30)/C indicated a decrease in kinetics reaction.
Further research is necessary to investigate the mechanisms of methane activation in alkaline
electrolytes using PdZn/C electrocatalysts.
ACKNOWLEDGEMENTS
The authors thank the FAPESP (2014/09087-4, 2014/50279-4 and 2017/11937-4) and CNPq
(300816/2016-2) for the financial support.
Int. J. Electrochem. Sci., Vol. 14, 2019
10833
References
1. M. Joglekar, V. Nguyen, S. Pylypenko, C. Ngo, Q. Li, M. E. O’Reilly, T. S. Gray, W. A. Hubbard,
T. B. Gunnoe, A. M. Herring and B. G. Trewyn, J. Am. Chem. Soc., 138 (2016) 116.
2. R. A. Kerr, Science, 328 (2010) 1624.
3. S. Tyagia, A. Ganesh and P. Aghalayam, ECS Transactions, 6 (2008) 371.
4. J. Nandenha, E. H. Fontes, R. M. Piasentin, F.C. Fonseca and A. O. Neto, J Fuel Chem Technol, 46
(2018) 1137.
5. S. Xie, S. Lin, Q. Zhang, Z. Tian and Y. Wang, J. Energ. Chem., 27 (2018) 1629.
6. N. J. Gunsalus, A. Koppaka, S. H. Park, S. M. Bischof, B. G. Hashiguchi, and R. A. Periana, Chem.
Rev., 117 (2017) 8521.
7. M. Joglekar, S. Pylypenko, M. M. Otting, J. S. Valenstein and B. G. Trewyn, Chem. Mater., 26
(2014) 2873.
8. M. Lersch and M. Tilset, Chem. Rev., 105 (2005) 2471.
9. J. A. Labinger, J. Mol. Catal. A: Chem., 220 (2004) 27.
10. A. M. C. Wittborn, M. Costas, M. R. A. Blomberg and P. E. M. Siegbahn, J. Chem. Phys., 107
(1997) 4318.
11. P. E. M. Siegbahn, J. Am. Chem. Soc., 118 (1996) 1487.
12. D. Schrӧder, H. Schwarz, Angew. Angew. Chem., Int. Ed. Engl., 34 (1995) 1973.
13. Y.-H. (C). Chin, C. Buda, M. Neurock and E. Iglesia, J. Am. Chem. Soc., 135 (2013) 15425.
14. Y. Zhang, L. Zhang, S. Shuang, F. Feng, J. Qiao, Y. Guo, M. M. F. Choi and C. Dong, Anal. Lett.,
43 (2010) 1055.
15. G. Psofogiannakis, A. St-Amant and M. Ternan, J. Phys. Chem. B, 110 (2006) 24593.
16. M. A. Matin, A. Kumar, R. R. Bhosale, M. A. H. Saleh Saad, F. A. Almomani and M. J. Al-Marri,
RSC Adv., 7 (2017) 42709.
17. K. Eid, Y. H. Ahmad, S. Y. AlQaradawi and N. K. Allam, Catal. Sci. Technol., 7 (2017) 2819.
18. M. A. Matin, E. Lee, H. Kim, W.-S. Yoon, and Y.-U. Kwon, J. Mater. Chem. A, 3 (2015) 17154.
19. Z. J. Mellinger, T. G. Kelly and J. G. Chen, ACS Catal., 2 (2012) 751.
20. C.-T. Hsieh, P.-Y. Yu, D.-Y. Tzou, J.-P. Hsu and Y.-R. Chiu, J. Electroanal. Chem., 761 (2016)
28.
21. Y. Ren, S. Zhang and H. Li, Int. J. Hydrogen Energy, 39 (2014) 288.
22. Y. Song, X. Zhang, S. Yang, X. Wei and Z. Sun, Fuel, 181 (2016) 269.
23. F. Hahn and C. A. Melendres, Electrochim. Acta, 46 (2001) 3525.
24. P. Jacquinot, B. Müller, B. Wehrli and P. C. Hauser, Anal. Chim. Acta, 432 (2001) 1.
25. K. W. Frese, Langmuir, 7 (1991) 13.
26. M. Jafarian, M. G. Mahjani, H. Heli, F. Gobal and M. Heydarpoor, Electrochem. Commun., 5
(2003) 184.
27. X. Zhang, H. Fan, J. Zheng, S. Duan, Y. Huang, Y. Cui and R. Wang, Catal. Sci. Technol., 8 (2018)
4757.
28. Z. Li, J. Gao, X. Xing, S. Wu, S. Shuang, C. Dong, M. C. Paau and M. M. F. Choi, J. Phys. Chem.
C, 114 (2010) 723.
29. A. O. Neto, M. Brandalise, R. R. Dias, J. M. S. Ayoub, A. C. Silva, J. C. Penteado, M. Linardi, E.
V. Spinacé, Int. J. Hydrogen Energy, 35 (2010) 9177.
30. S. G. Da Silva, E. H. Fontes, M. H. M. T. Assumpção, M. Linardi, E. V. Spinacé, J. C. M. Silva and
A. O. Neto, Ionics, 23 (2017) 2367.
31. M. C. L. Santos, J. Nandenha, J. M. S. Ayoub, M. H. M. T. Assumpção and A. O. Neto, J Fuel
Chem Technol, 46 (2018) 1462.
32. C. V. Pereira, E. H. Fontes, J. Nandenha, M. H. M. T. Assumpção and A. O. Neto, Int. J.
Electrochem. Sci., 13 (2018) 10587.
Int. J. Electrochem. Sci., Vol. 14, 2019
10834
33. M. H. M. T. Assumpção, J. Nandenha, G. S. Buzzo, J. C. M. Silva, E. V. Spinacé, A. O. Neto and
R. F. B. De Souza, J. Power Sources, 253 (2014) 392.
34. J. Guo, R. Chen, F.-C. Zhu, S.-G. Sun and H. M. Villullas, Appl. Catal., B: Environ., 224 (2018)
602.
35. C. Xia, Z. Qiao, C. Feng, J.-S. Kim, B. Wang and B. Zhu, Materials, 11 (2018) 40.
36. T. Conant, A. M. Karim, V. Lebarbier, Y. Wang, F. Girgsdies, R. Schlögl and A. Datye, J. Catal.,
257 (2008) 64.
37. J. Nandenha, R. F. B. De Souza, M. H. M. T. Assumpção, E. V. Spinacé and A. O. Neto, Ionics, 19
(2013) 1207.
38. E. H. Fontes, C. E. D. Ramos, J. Nandenha, R. M. Piasentin, A. O. Neto and R. Landers, Int. J.
Hydrogen Energy, 44 (2019) 937.
39. H. W. Xiao-Zi Yuan and J. Zhang, Springer-Verlag London Springer, 2008.
40. B. S. Solanki and C. V. Rode, J. Saudi Chem. Soc., (2018) doi:
https://doi.org/10.1016/j.jscs.2018.08.009.
41. J. J. Willis, E. D. Goodman, L. Wu, A. R. Riscoe, P. Martins, C. J. Tassone and M. Cargnello, J.
Am. Chem. Soc., 139 (2017) 11989.
42. M. D. Obradović, J. R. Rogan, B. M. Babić, A. V. Tripković, A. R. S. Gautam, V. R. Radmilović
and S. Lj. Gojković, J. Power Sources, 197 (2012) 72.
43. K. Hamada and H. Morishita, Sci. Bull. Fac. Educ. Nagasaki Univ., 26 (1975) 39.
44. B. S. Beckingham, N. A. Lynd and D. J. Miller, J. Membr. Sci., 550 (2018) 348.
45. K. Z. Gaca-Zając, B. R. Smith, A. Nordon, A. J. Fletcher, K. Johnston, J. Sefcik, Vib. Spectrosc, 97
(2018) 44.
46. M. Yamaguchi and A. Ohira, Comput. Theor. Chem., 1089 (2016) 54.
© 2019 The Authors. Published by ESG (www.electrochemsci.org). This article is an open access
article distributed under the terms and conditions of the Creative Commons Attribution license
(http://creativecommons.org/licenses/by/4.0/).