Embed Size (px)
Citation preview

Activation in Ireland: Are we on the Right Path?
Elish Kelly (ESRI)Seamus McGuinness (ESRI) Philip O’Connell (UCD Geary Institute)
Conference on Irish Economic Policy Programme1st February 2013

Outline
Background Objectives Data Descriptives Econometrics Active Labour Market Policy: What Works? Impact of Pathways to Work
Background
Ireland’s unemployment rate has increased from 4.4% in 2006 to 14.8% today.
Long-term unemployment is a growing problem, and currently accounts for almost 60% of total unemployment.
Many of the long-term unemployed are also structurally unemployed having been previously engaged in industries, such as construction, with limited growth potential.
The composition of unemployed has changed since the recession e.g. growth in unemployed males with post-leaving cert qualifications and females with third-level.
Objectives
We use new data to examine the nature and rates of labour market transitions among the unemployed in 2006 and 2011.
We consider the extent to which unemployed persons transition to employment and inactivity, and the degree to which the factors determining the transition to employment have changed.
We consider the implications of our evidence for activation policy in Ireland.

Data Quarterly National Household Survey (QNHS) Longitudinal Data
Pre-Recession: Q2 2006 – Q2 2007 Post-Recession: Q2 2011- Q2 2012
Balanced Panel: Focus on individuals unemployed on entering the panel who are present in the panel for five consecutive quarters (e.g. Q2 2006 through to Q2 2007)
Eradicate the impacts of migration from using balanced panel
We examine the impacts of age, gender, nationality, education and unemployment duration on escaping to employment
Transition Rates
Continuously
Unemployed
Into Employment
Into Inactivit
y
Into/Out of Employment/Inactivit
y
2006
21.3 33.9 29.3 15.5
2011
49.0 19.9 26.6 4.6
Gender Profile
Continuously
Unemployed
Into Employme
nt
Into Inactivity
Into/Out of Employment/Inactivi
ty
Males
2006
29.2
2011
64.2
2006
40.5
2011
18.9
2006
23.5
2011
14.9
2006
6.8
2011
2.1
Females
2006
10.9
2011
27.6
2006
25.2
2011
21.3
2006
36.9
2011
43.1
2006
27.0
2011
8.1
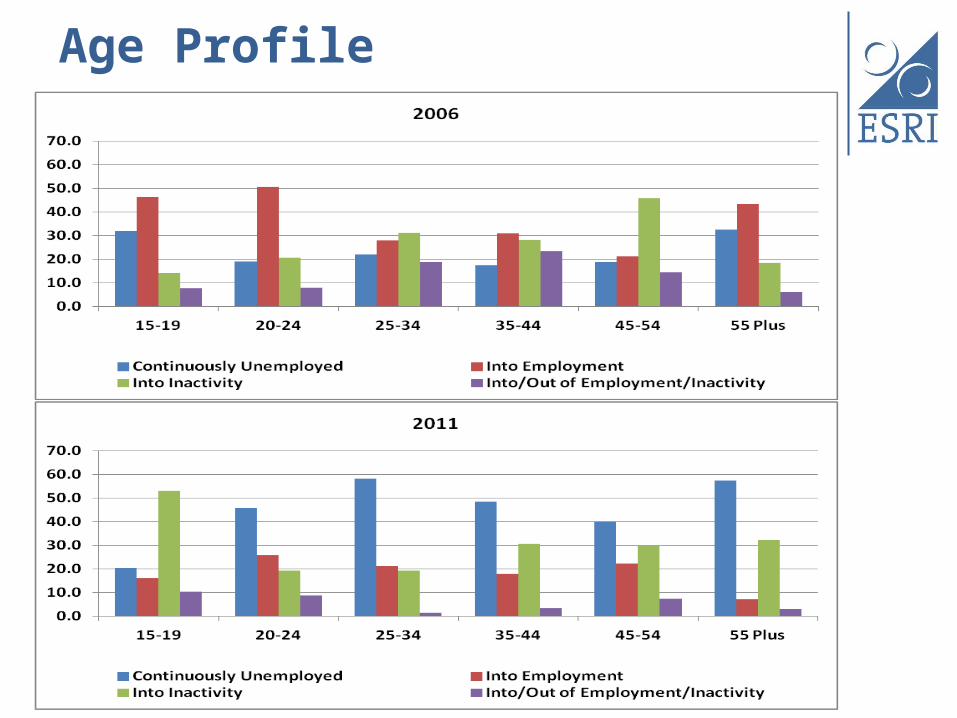
Age Profile
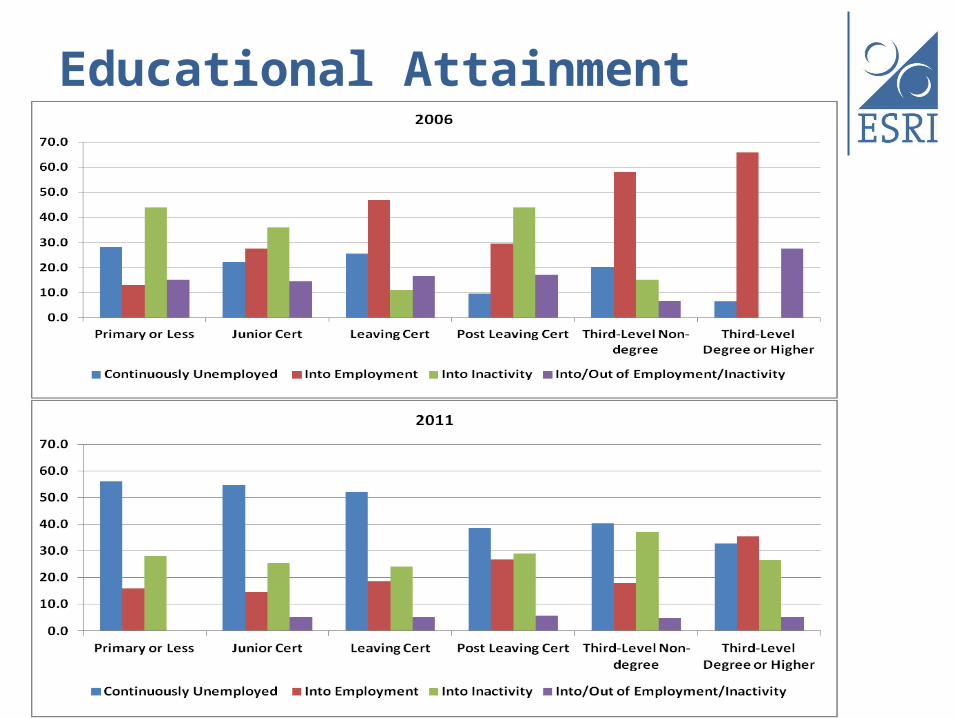
Educational Attainment
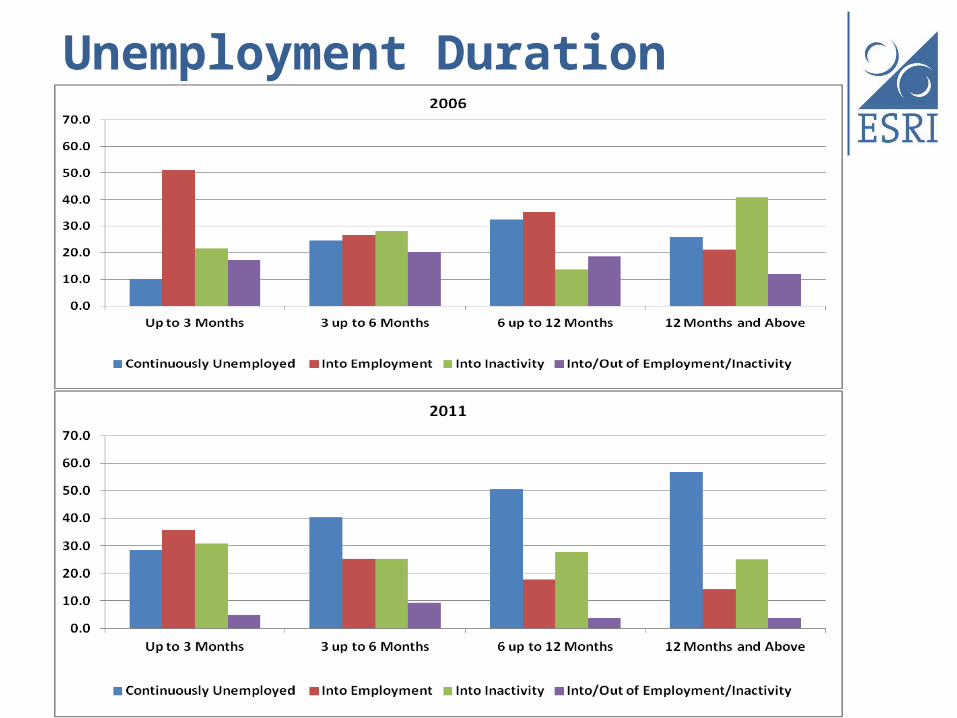
Unemployment Duration
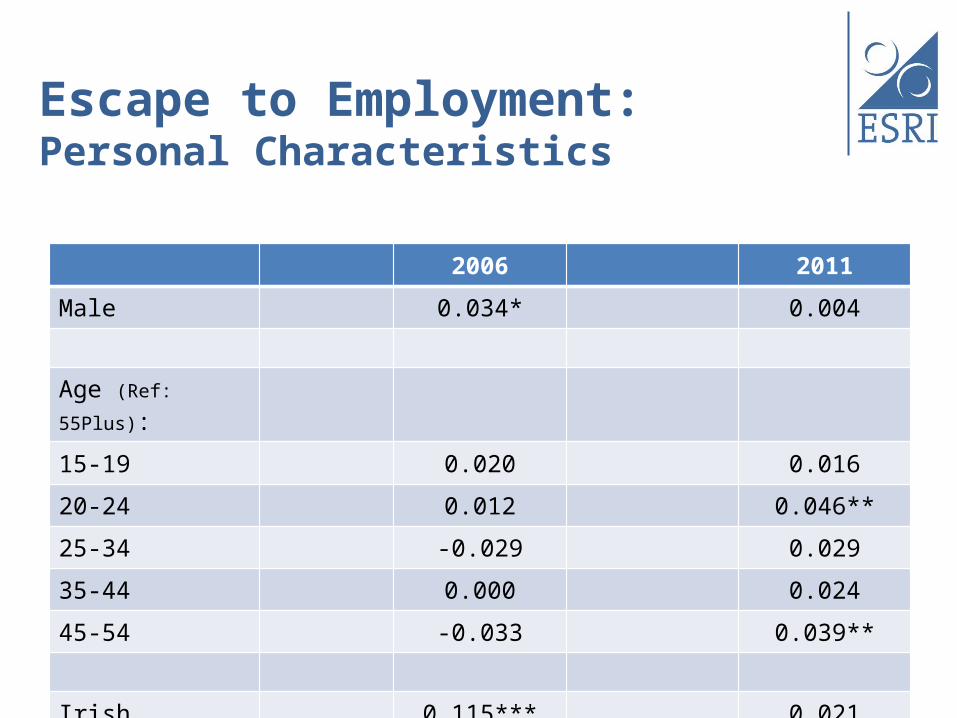
Escape to Employment: Personal Characteristics
2006 2011
Male 0.034* 0.004
Age (Ref: 55Plus):
15-19 0.020 0.016
20-24 0.012 0.046**
25-34 -0.029 0.029
35-44 0.000 0.024
45-54 -0.033 0.039**
Irish 0.115*** 0.021
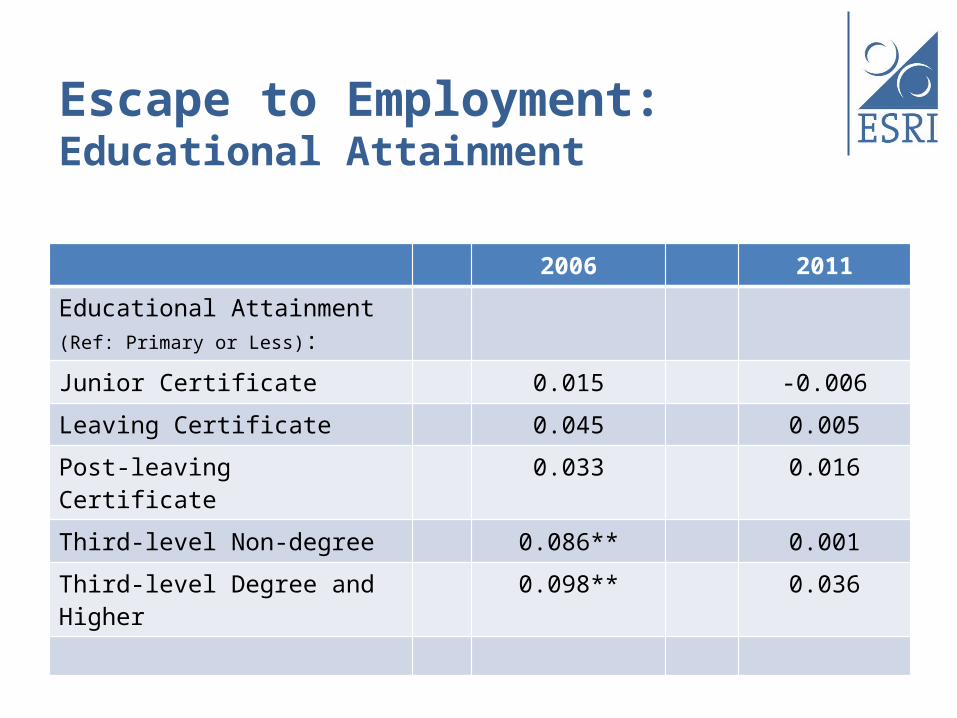
Escape to Employment:Educational Attainment
2006 2011
Educational Attainment (Ref: Primary or Less):
Junior Certificate 0.015 -0.006
Leaving Certificate 0.045 0.005
Post-leaving Certificate 0.033 0.016
Third-level Non-degree 0.086** 0.001
Third-level Degree and Higher
0.098** 0.036
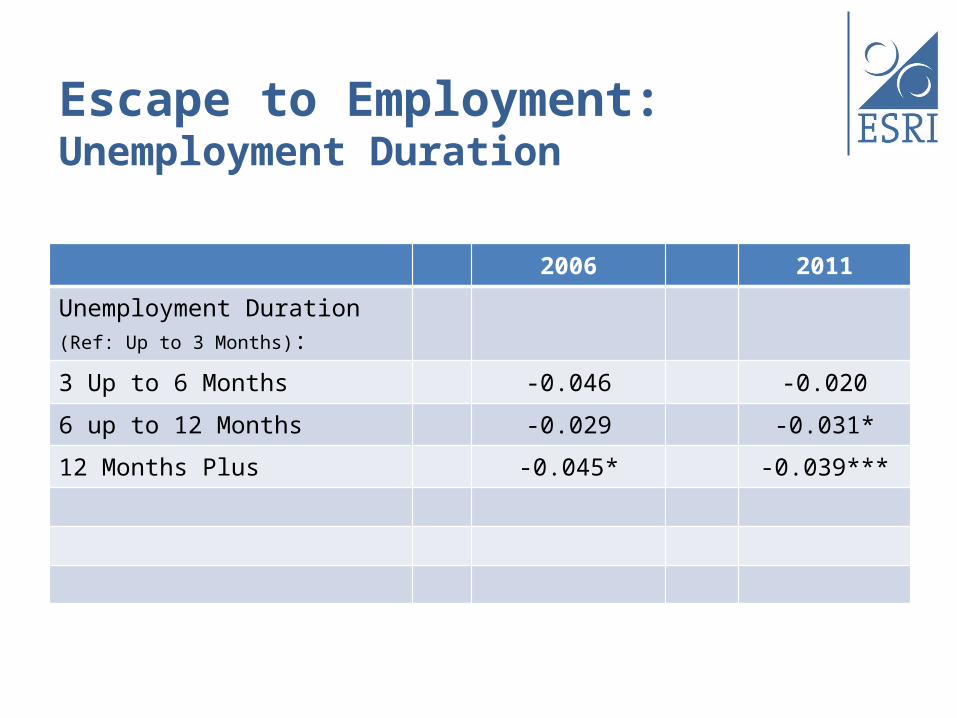
Escape to Employment:Unemployment Duration
2006 2011
Unemployment Duration(Ref: Up to 3 Months):
3 Up to 6 Months -0.046 -0.020
6 up to 12 Months -0.029 -0.031*
12 Months Plus -0.045* -0.039***
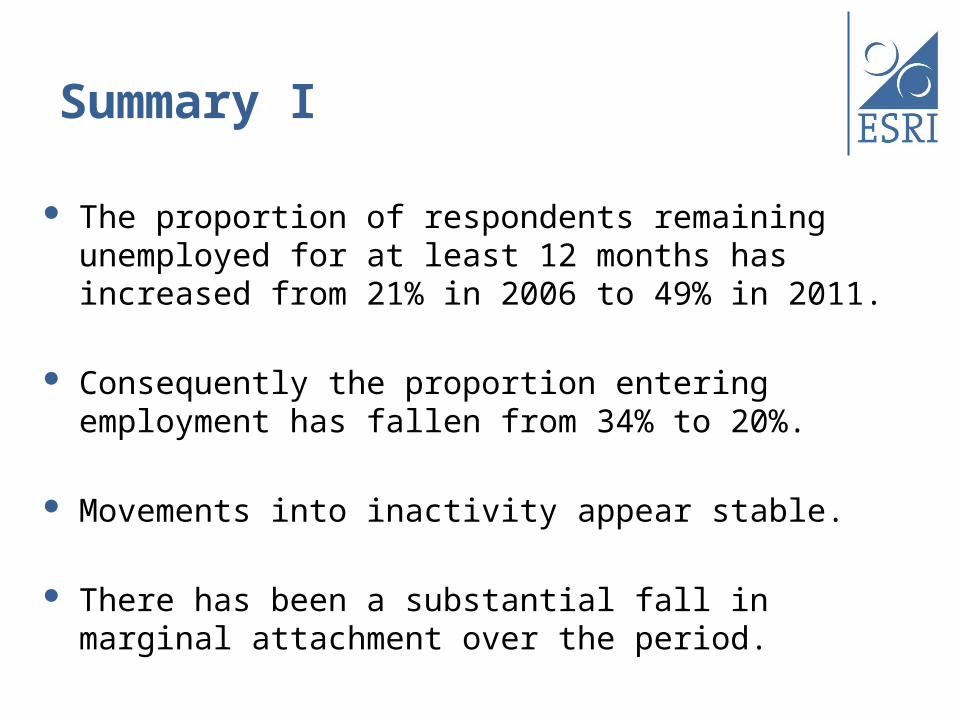
Summary I
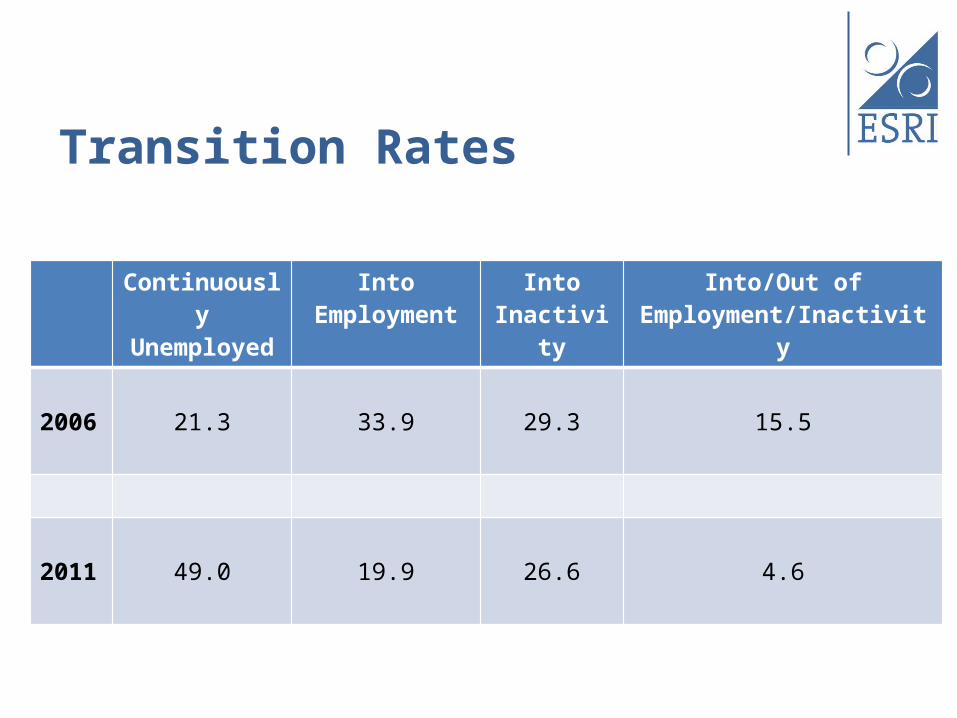
The proportion of respondents remaining unemployed for at least 12 months has increased from 21% in 2006 to 49% in 2011.
Consequently the proportion entering employment has fallen from 34% to 20%.
Movements into inactivity appear stable.
There has been a substantial fall in marginal attachment over the period.
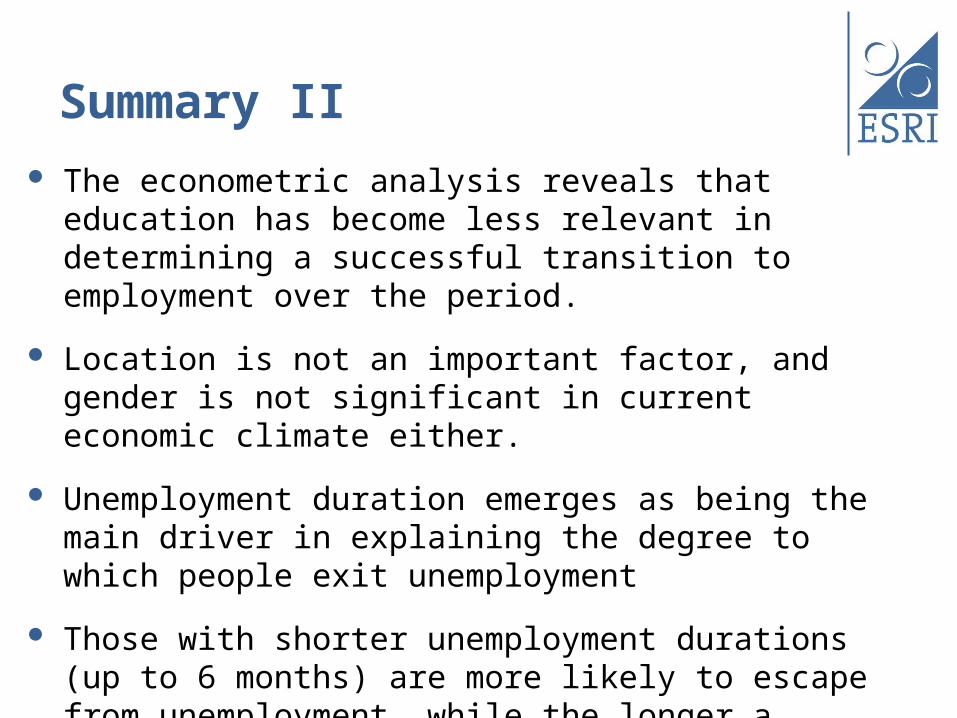
Summary II The econometric analysis reveals that education has become
less relevant in determining a successful transition to employment over the period.
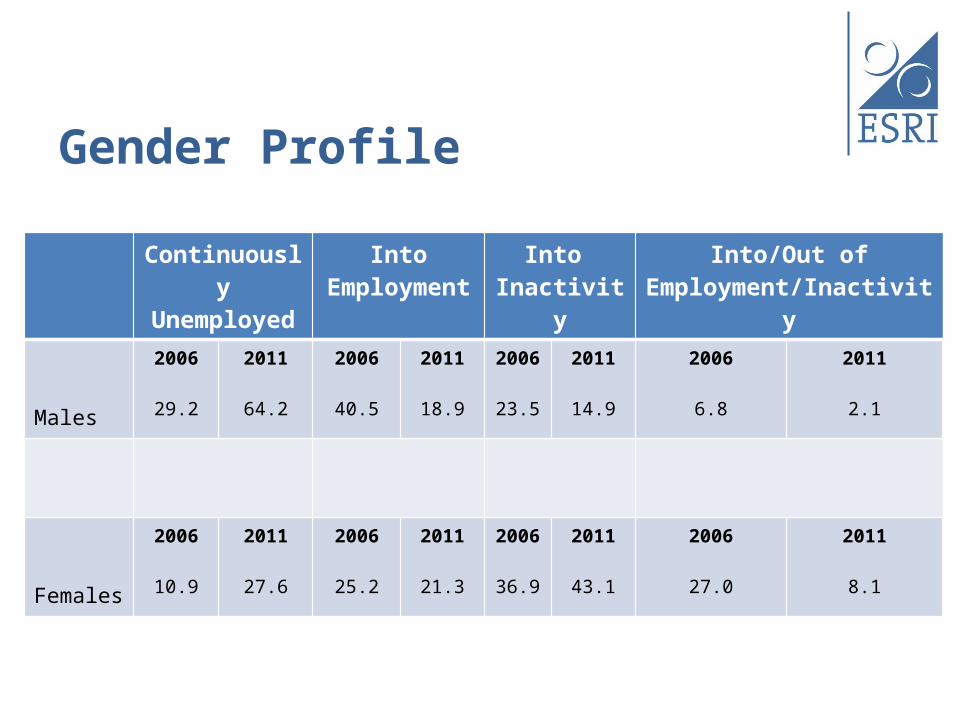
Location is not an important factor, and gender is not significant in current economic climate either.
Unemployment duration emerges as being the main driver in explaining the degree to which people exit unemployment
Those with shorter unemployment durations (up to 6 months) are more likely to escape from unemployment, while the longer a person remains unemployed the less likely he/she is to leave unemployment, especially since the most recent recession.
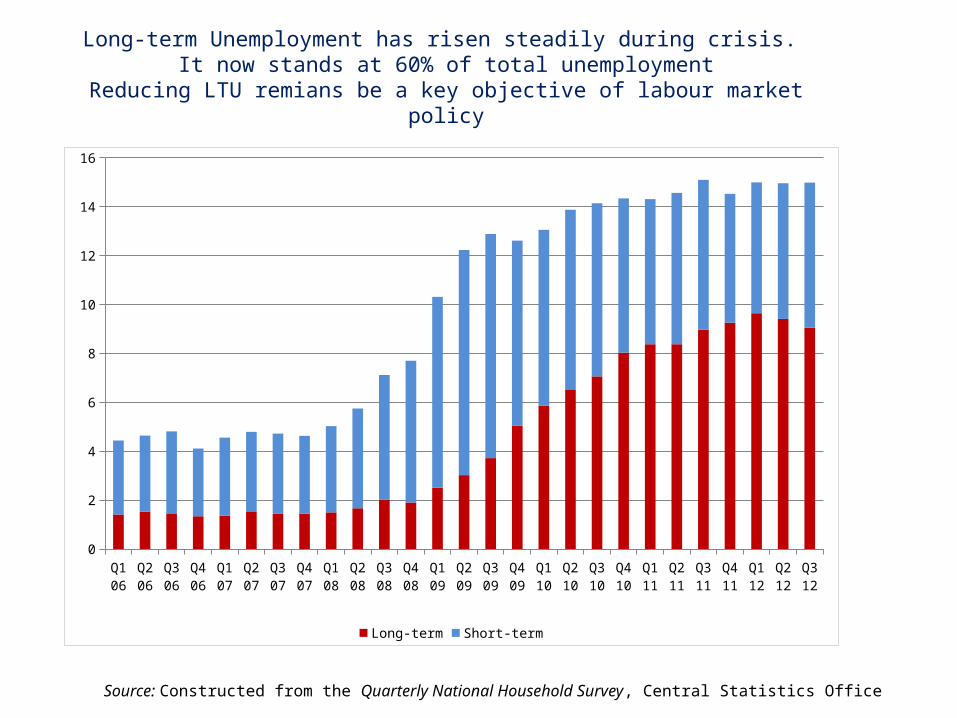
Long-term Unemployment has risen steadily during crisis. It now stands at 60% of total unemployment
Reducing LTU remians be a key objective of labour market policy
Source: Constructed from the Quarterly National Household Survey, Central Statistics Office
Q1 06
Q2 06
Q3 06
Q4 06
Q1 07
Q2 07
Q3 07
Q4 07
Q1 08
Q2 08
Q3 08
Q4 08
Q1 09
Q2 09
Q3 09
Q4 09
Q1 10
Q2 10
Q3 10
Q4 10
Q1 11
Q2 11
Q3 11
Q4 11
Q1 12
Q2 12
Q3 12
0
2
4
6
8
10
12
14
16
Long-term Short-term

Active Labour Market Programmes
• Supply side– Job Search Assistance/Encouragement
• Interviews/counselling, job placement services, etc• Increase effectiveness of job search + monitoring & sanctions
– Training• Enhance skills and employment prospects
• Demand Side– Public-sector Employment schemes
• Retain contact with labour market
– Incentives to employers or self-employment• Encourage employers to create new jobs or retain existing jobs
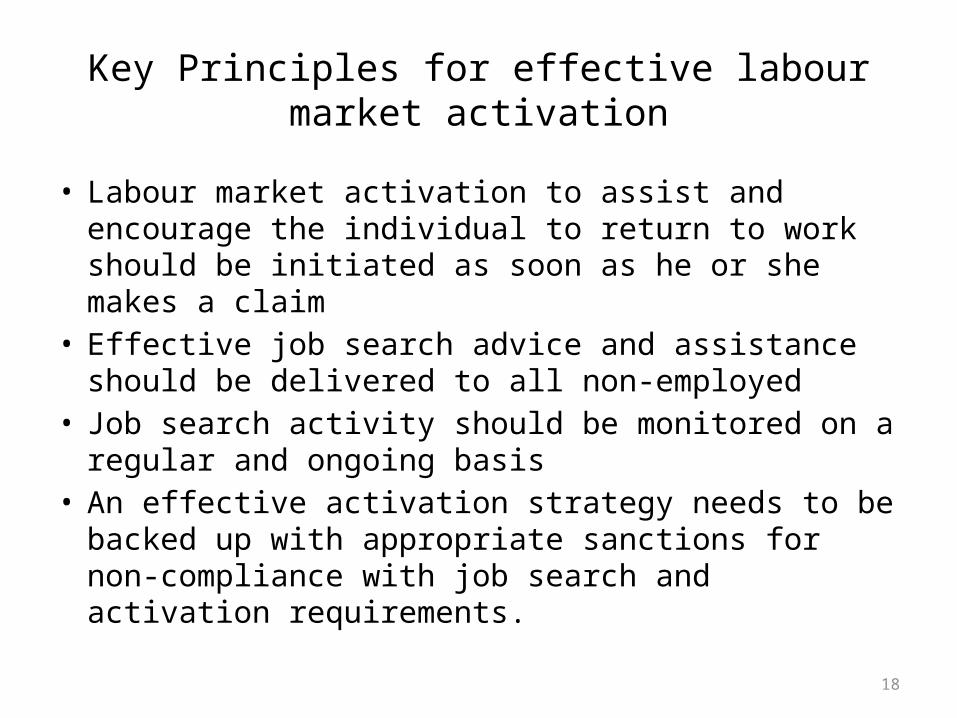
Key Principles for effective labour market activation
• Labour market activation to assist and encourage the individual to return to work should be initiated as soon as he or she makes a claim
• Effective job search advice and assistance should be delivered to all non-employed
• Job search activity should be monitored on a regular and ongoing basis
• An effective activation strategy needs to be backed up with appropriate sanctions for non-compliance with job search and activation requirements.
18
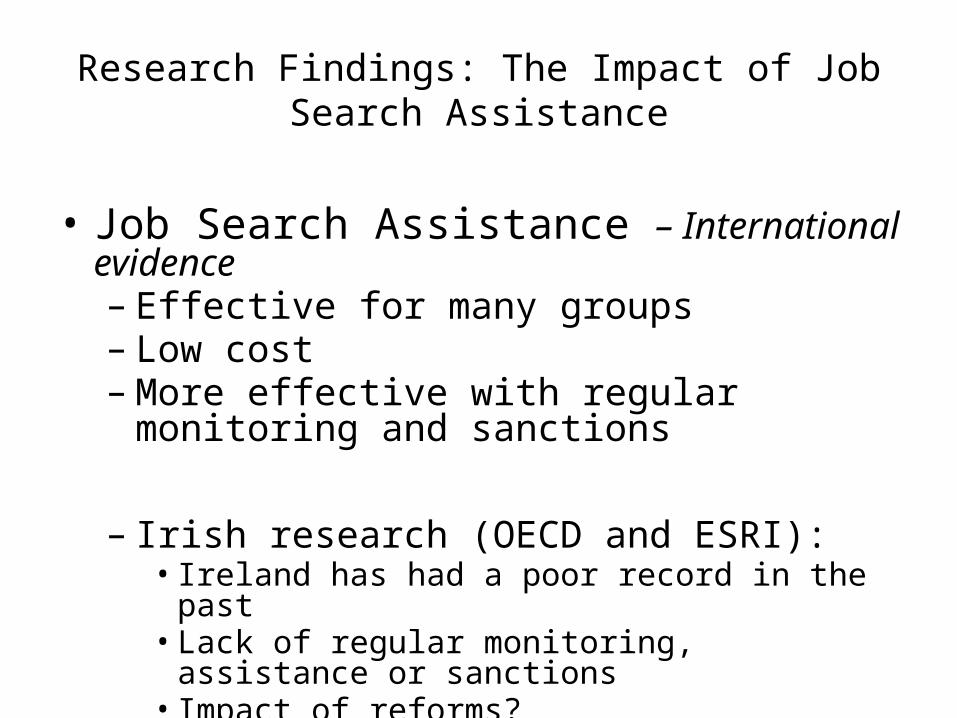
Research Findings: The Impact of Job Search Assistance
• Job Search Assistance – International evidence– Effective for many groups– Low cost– More effective with regular monitoring and
sanctions
– Irish research (OECD and ESRI):• Ireland has had a poor record in the past• Lack of regular monitoring, assistance or sanctions• Impact of reforms?
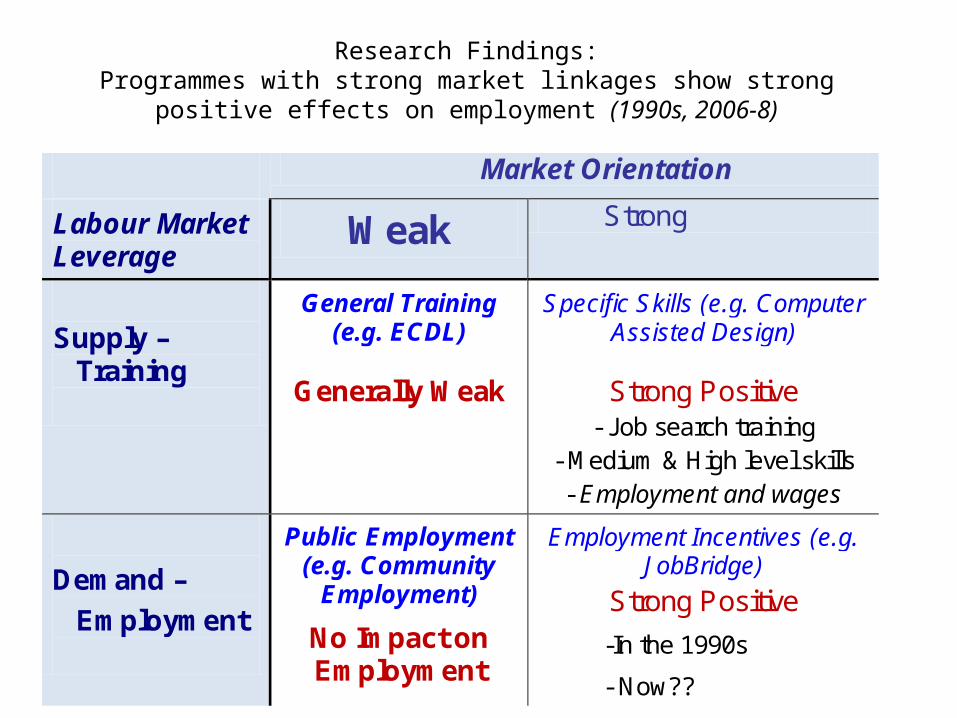
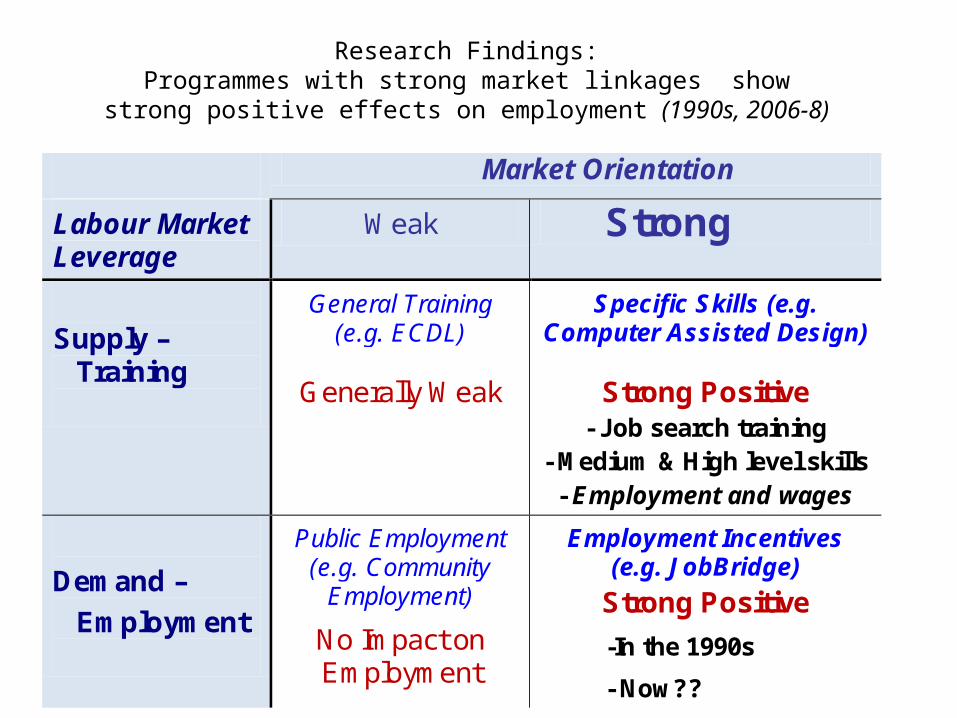
Research Findings:Programmes with strong market linkages show strong
positive effects on employment (1990s, 2006-8)
Market Orientation
Labour Market Leverage
Weak Strong
Supply – Training
General Training (e.g. ECDL)
Generally Weak
Specific Skills (e.g. Computer Assisted Design)
Strong Positive - Job search training
- Medium & High level skills - Employment and wages
Demand –
Employment
Public Employment (e.g. Community
Employment)
No Impact on Employment
Employment Incentives (e.g. JobBridge)
Strong Positive
-In the 1990s
- Now??
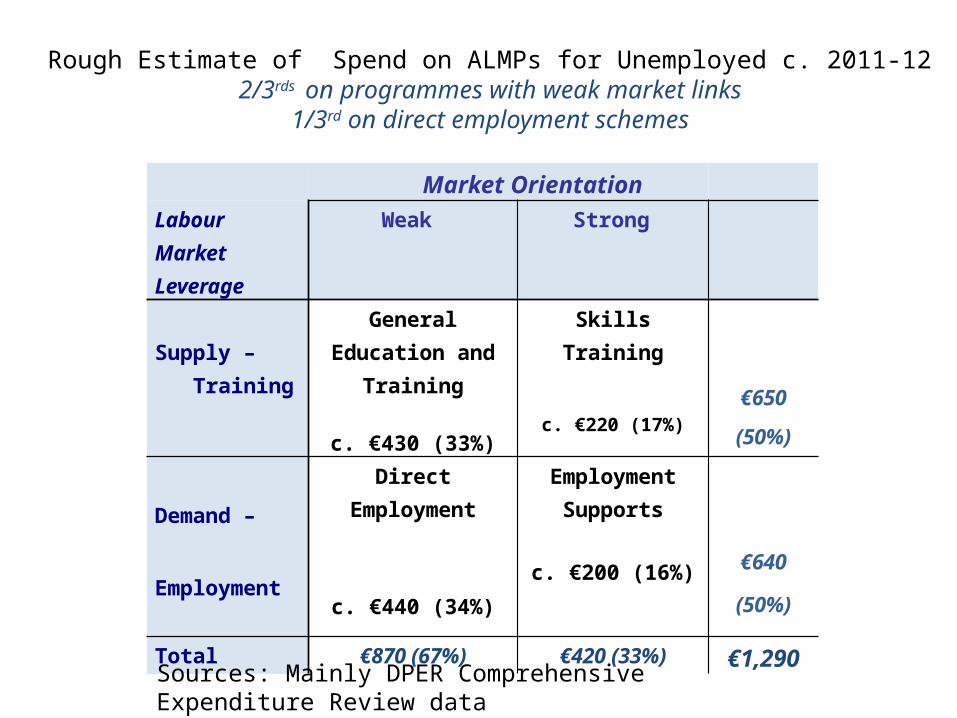
Rough Estimate of Spend on ALMPs for Unemployed c. 2011-122/3rds on programmes with weak market links
1/3rd on direct employment schemes
Market Orientation
Labour Market Leverage
Weak Strong
Supply – Training
General Education and Training
c. €430 (33%)
Skills Training
c. €220 (17%)
€650
(50%)
Demand –
Employment
Direct Employment
c. €440 (34%)
Employment Supports
c. €200 (16%)
€640
(50%)
Total €870 (67%) €420 (33%) €1,290
Sources: Mainly DPER Comprehensive Expenditure Review data

Content and quality of education & training is vital
• Education and training programmes should be demand led– driven by the needs of growth sectors– strongly connected with real jobs
• Content of training should be driven by needs of enterprises– need to develop up-to-date intelligence of skill needs.
• Training initiatives should broadly reflect the education profile of the unemployed. – In the current crisis, the educational and skills profile of the
unemployed has increased: training programmes should reflect that.
• Training providers should be chosen on the basis of their ability to deliver high quality effective and relevant training.
24
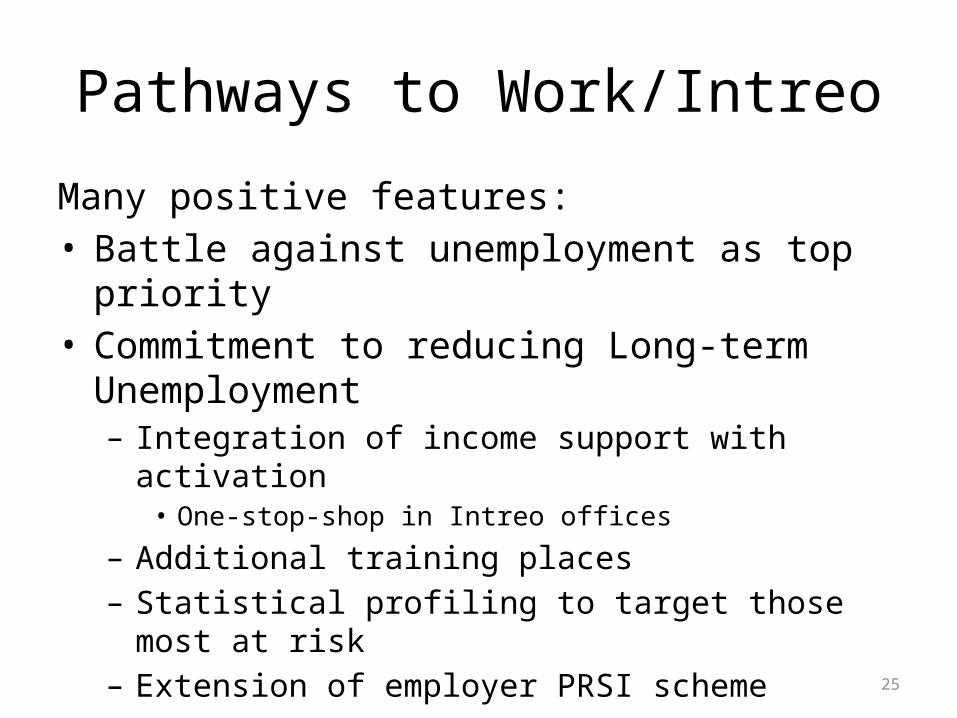
Pathways to Work/Intreo
Many positive features:• Battle against unemployment as top priority • Commitment to reducing Long-term Unemployment
– Integration of income support with activation• One-stop-shop in Intreo offices
– Additional training places– Statistical profiling to target those most at risk– Extension of employer PRSI scheme
25
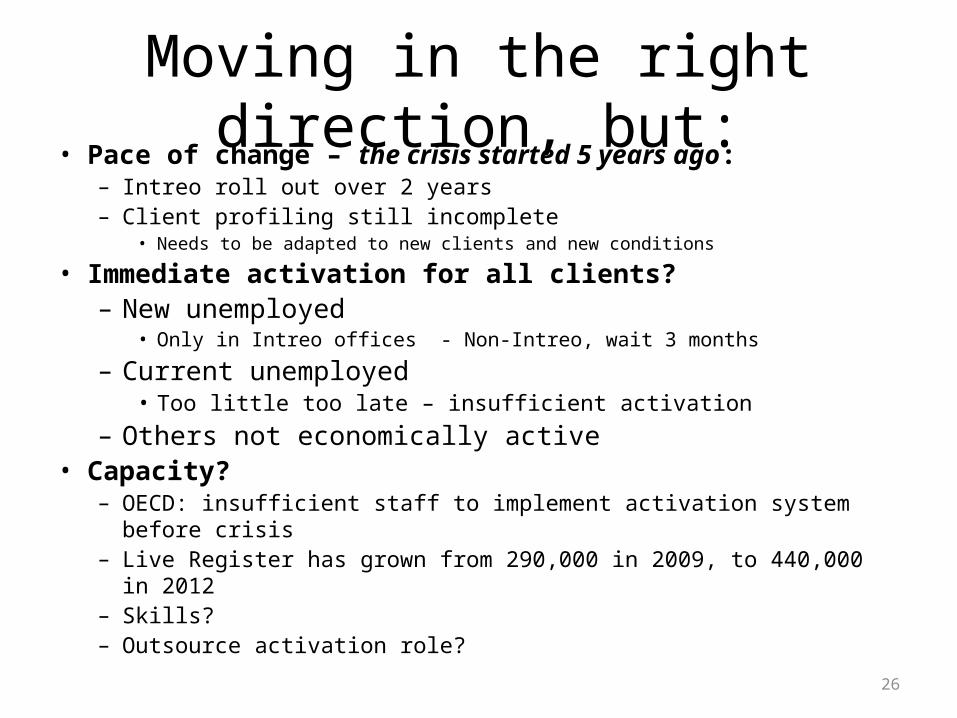
Moving in the right direction, but:• Pace of change – the crisis started 5 years ago:
– Intreo roll out over 2 years– Client profiling still incomplete
• Needs to be adapted to new clients and new conditions
• Immediate activation for all clients?– New unemployed
• Only in Intreo offices - Non-Intreo, wait 3 months
– Current unemployed• Too little too late – insufficient activation
– Others not economically active • Capacity?
– OECD: insufficient staff to implement activation system before crisis– Live Register has grown from 290,000 in 2009, to 440,000 in 2012– Skills?– Outsource activation role?
26

The Way Forward: Demand and Supply
Demand• Pathways recognises the importance of programmes to match labour
market needs– Can Expert Group on Future Skill Needs + FAS Skills and Labour Market
Research Unit meet that challenge?– Need for ongoing and up-to-date information– Specific sector skills councils – Ensure nature and content of education and skills are market relevant
• Training programmes should include job placement component
Supply• Respond to upward shift in educational profile of unemployed• Provide intensive retraining to tackle structural unemployment among former
construction workers
27

The Way Forward: Providers• Education and Training is excessively provider driven
– Not designed to meet training needs of unemployed or skill needs of employers– Need to evaluate impact of 2nd chance education
• Can SOLAS + Local Education and Training Boards meet training needs?– Experience, expertise, priority focus?– DSP as broker/coordinator of training?
• Providers should be chosen on basis of ability to deliver quality training– Provision could be incentivised according to results (job placements)– Does the academic calender meet the need of the unemployed?
• Ensure progression from programmes with weak to strong market links • All education, training and employment schemes should be subject to rigorous
evaluation:– identify effective interventions– timely restructuring/closure of ineffective interventions– 0.04% of the ALMP budget = €500,000 for evaluation….
28