Embed Size (px)
Citation preview

Activated Sludge Design for Industrial Wastewaters
Presented by AquAeTer, Inc.y q ,W. Wesley Eckenfelder, Jr. D.Sc., P.E.

F t ff ti th A ti t d Sl dFactors affecting the Activated Sludge Design for Industrial Wastewaters:
1. Aeration Power Density affects floc size and active masssize and active mass
2. MLVSS composition, active and inactive biomass, degradable and non-inactive biomass, degradable and nondegradable influent VSS
3. Reaction coefficient K, a function of3. Reaction coefficient K, a function of wastewater composition
4. Biological reaction, a function of4. Biological reaction, a function of temperature
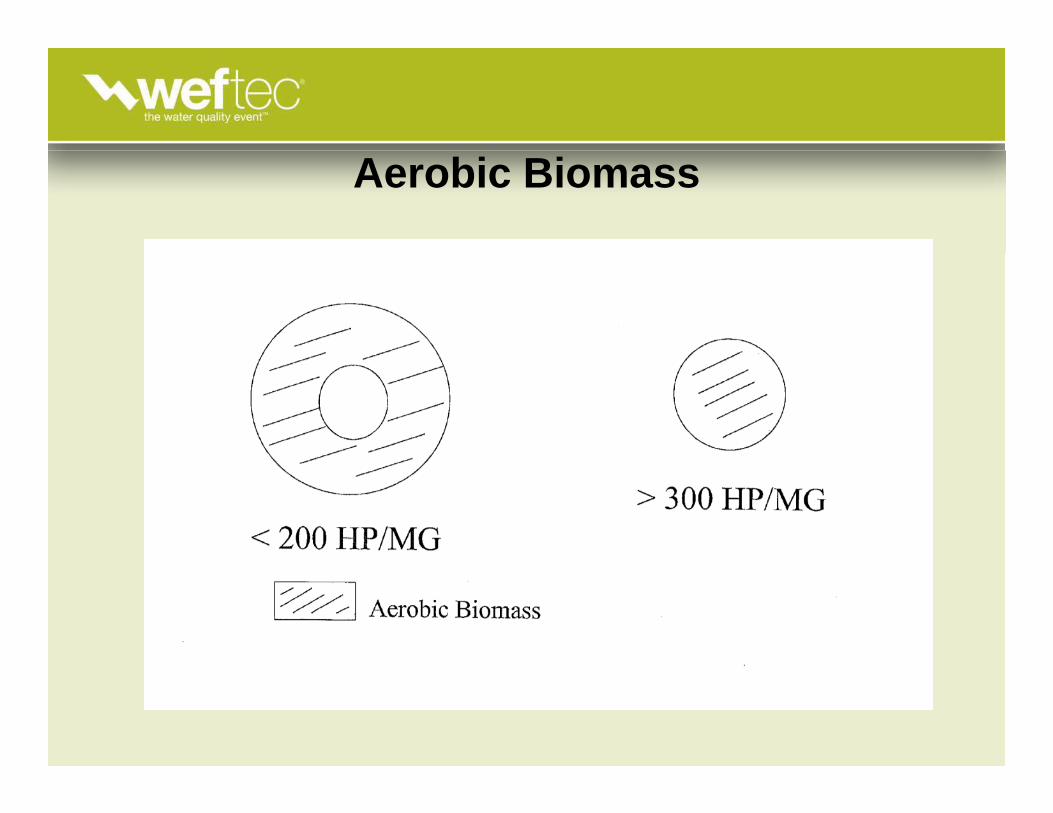
Aerobic Biomass
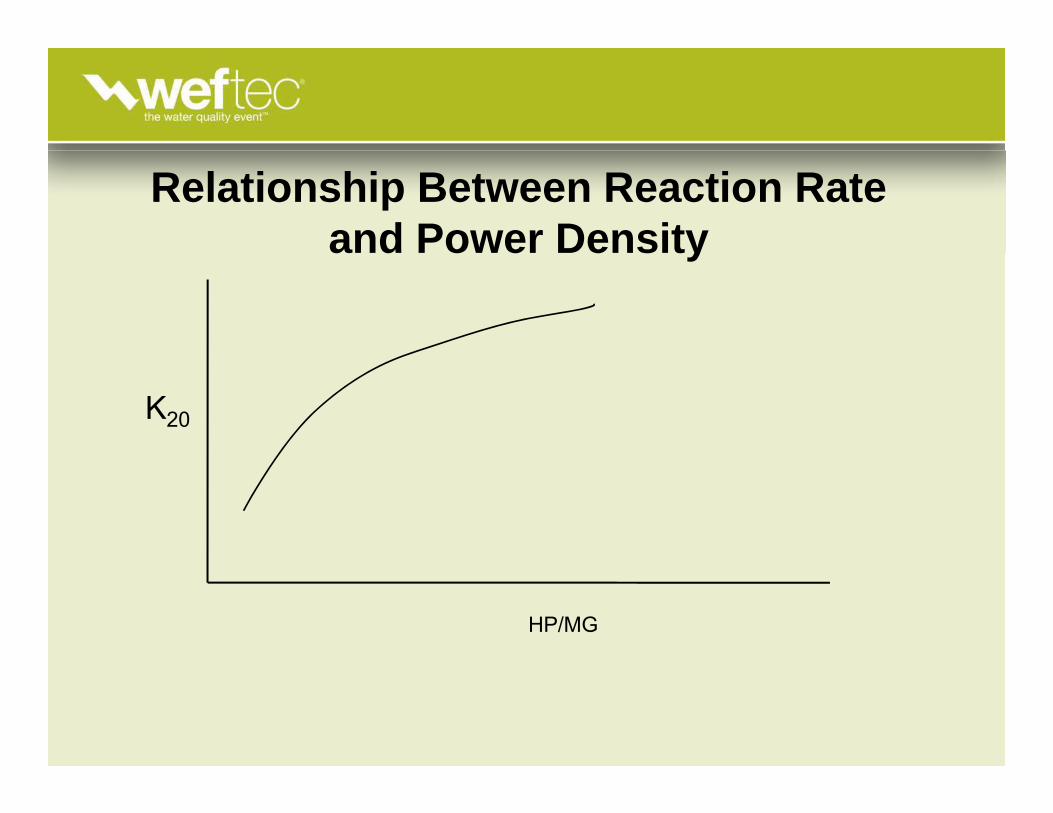
Relationship Between Reaction Rate and Power Densitya d o e e s ty
K20
HP/MG
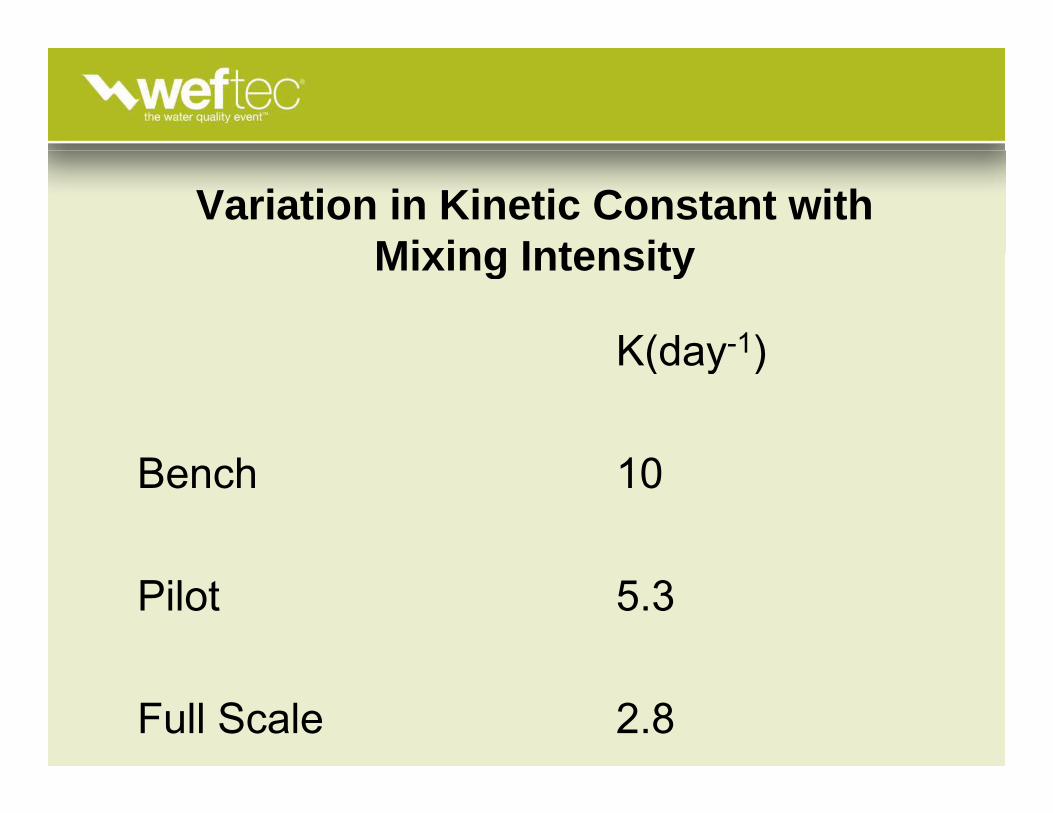
Variation in Kinetic Constant with Mixing IntensityMixing Intensity
K(day-1)K(day )
B h 10Bench 10
Pilot 5.3
Full Scale 2.8

Activated Sludge Kinetics
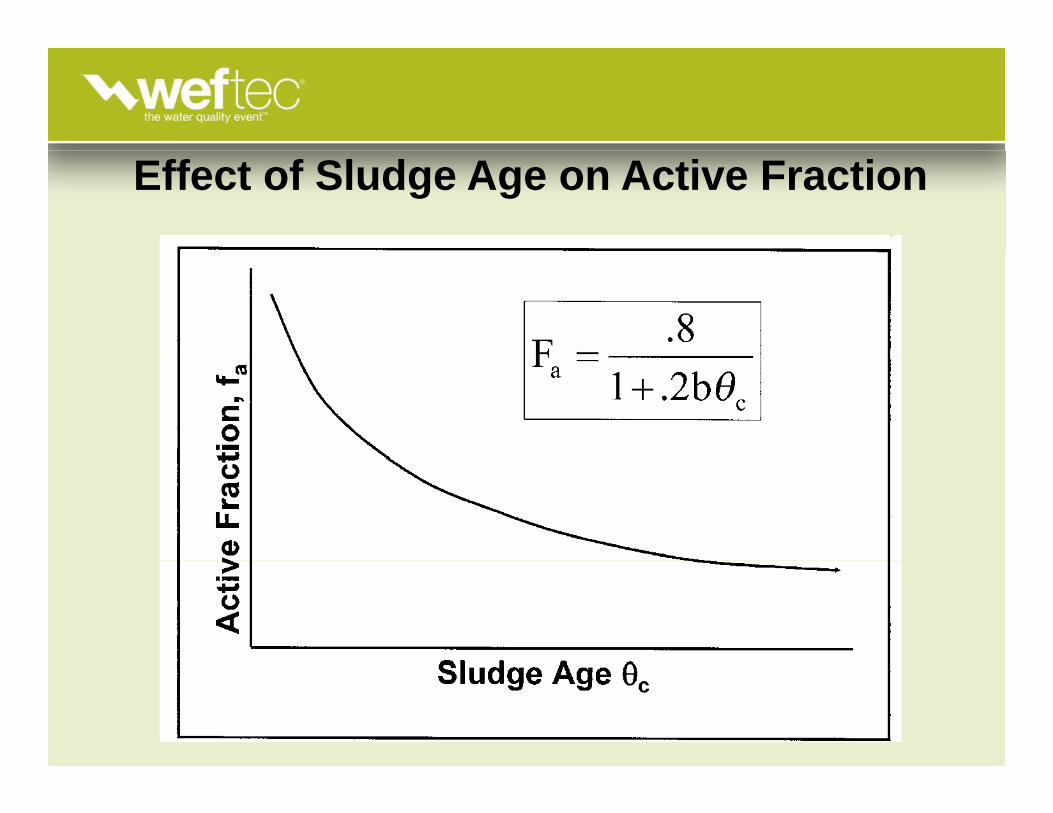
• Conventionally related to the mixed and lower volatile solids, MLVSS.
• The MLVSS however is comprised of active and inactive biomass non degradableand inactive biomass, non-degradable influent VSS and residual degradable VSS.
• Only the Active biomass contributes to the organic removal.

• The active fraction of the biomass can be computed: p
a bf
θ2011
=c
a bf
θ2.01+
This is shown in the following figure.

Degradable and Non-degradable Fractions
Effect of Sludge Age on Active Fraction
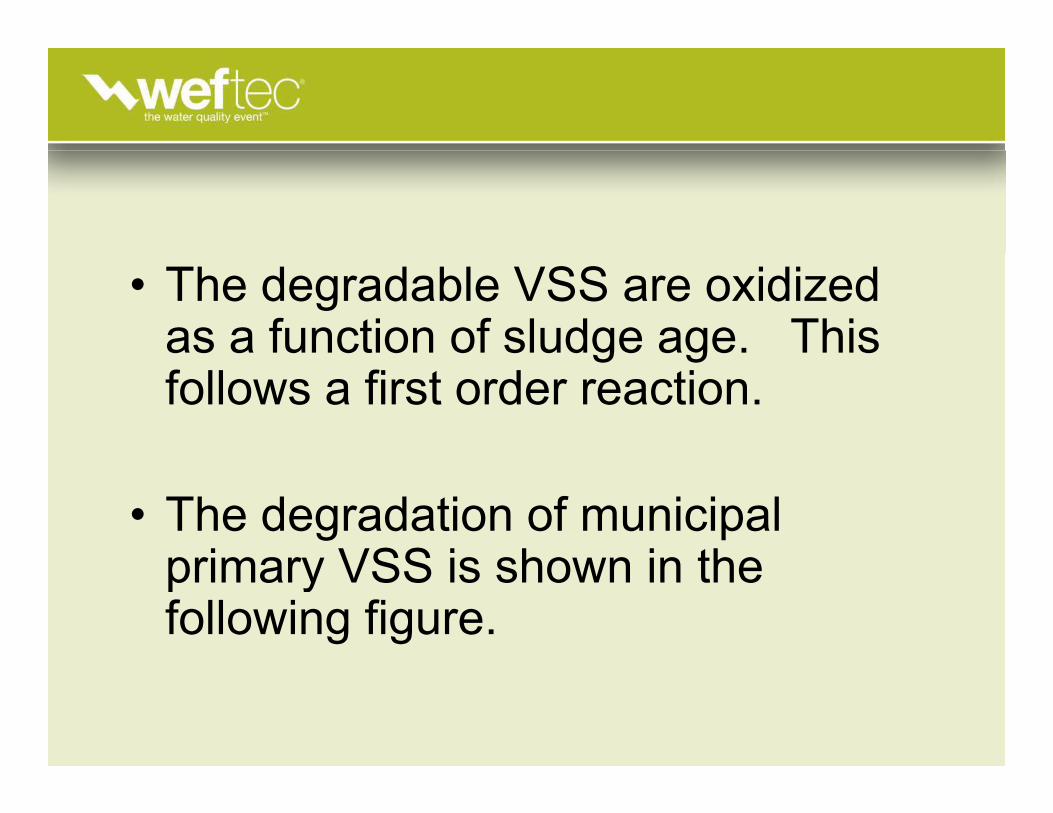
• The degradable VSS are oxidized as a function of sludge age. This g gfollows a first order reaction.
• The degradation of municipal primary VSS is shown in theprimary VSS is shown in the following figure.
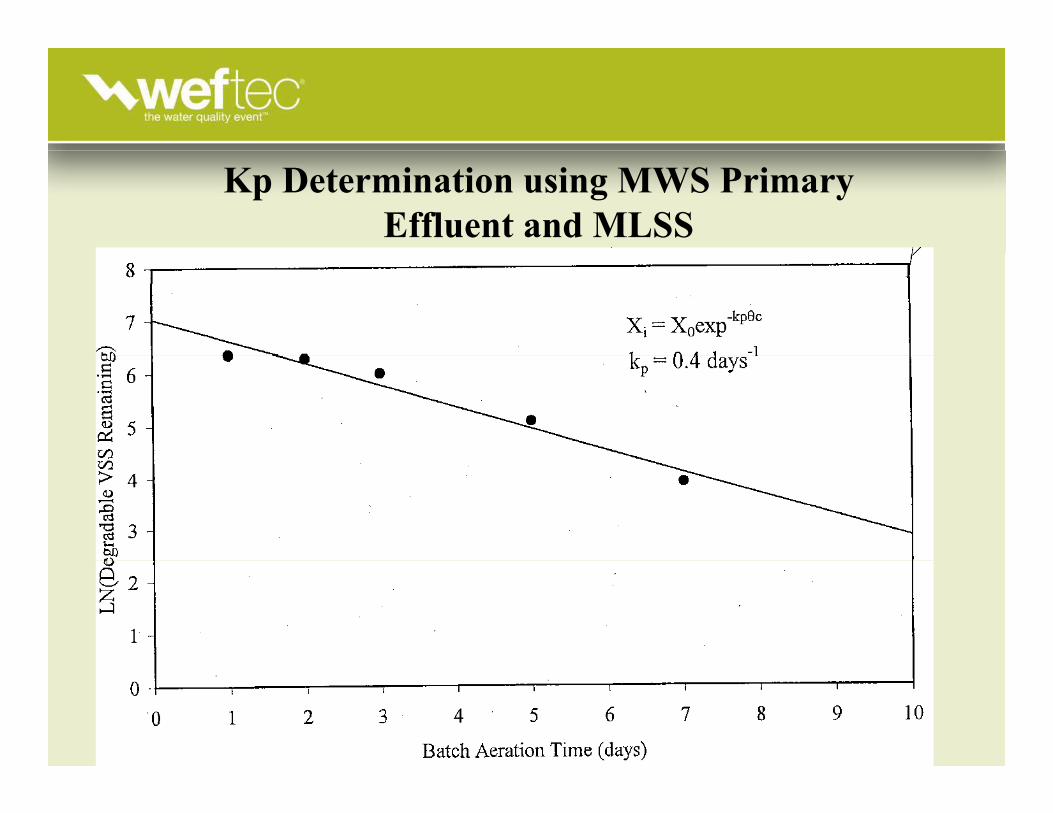
Kp Determination using MWS Primary Effluent and MLSS
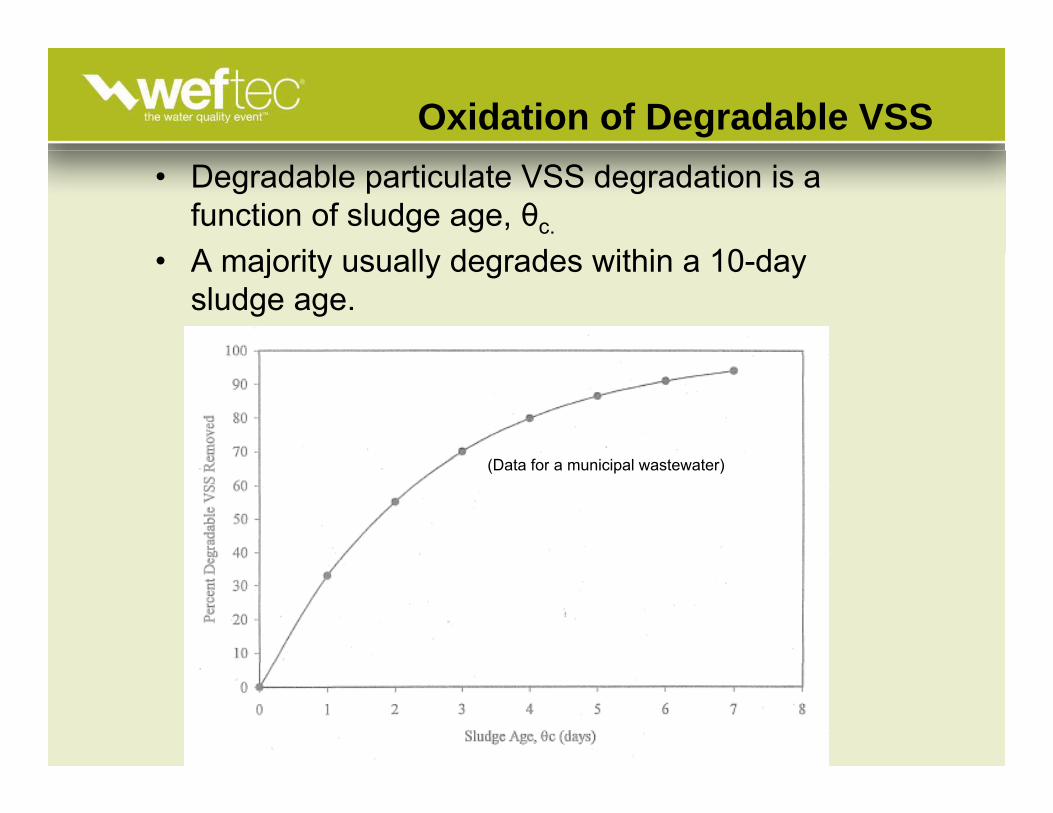
Oxidation of Degradable VSS• Degradable particulate VSS degradation is a
function of sludge age, θc.
A j it ll d d ithi 10 d• A majority usually degrades within a 10-day sludge age.
(Data for a municipal wastewater)
• The VSS are completely degraded with a sludge age of 10 days. The degradation properties of industrial VSS would have to be experimentally determineddetermined.
• Non-degradable primary VSS will accumulate in the ML.
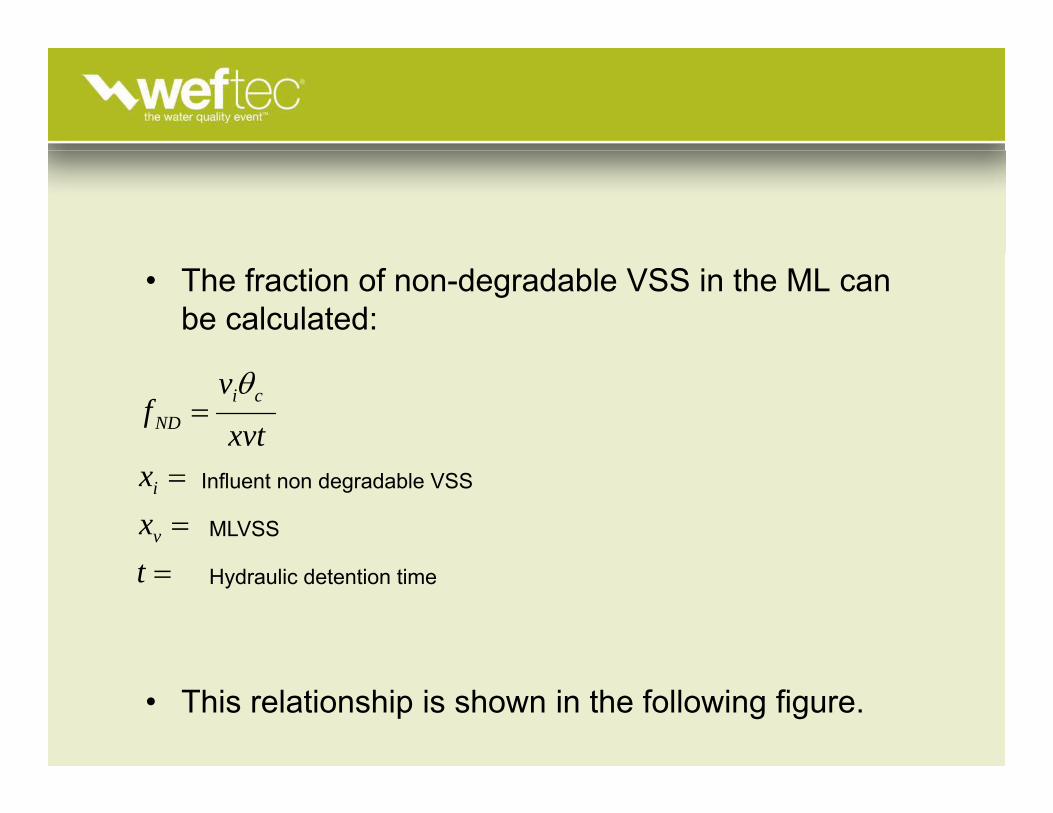
• The fraction of non-degradable VSS in the ML can be calculated:
=xvt
vf ci
ND
θ
==
xx
v
i Influent non degradable VSS
MLVSS
=t Hydraulic detention time
• This relationship is shown in the following figure.
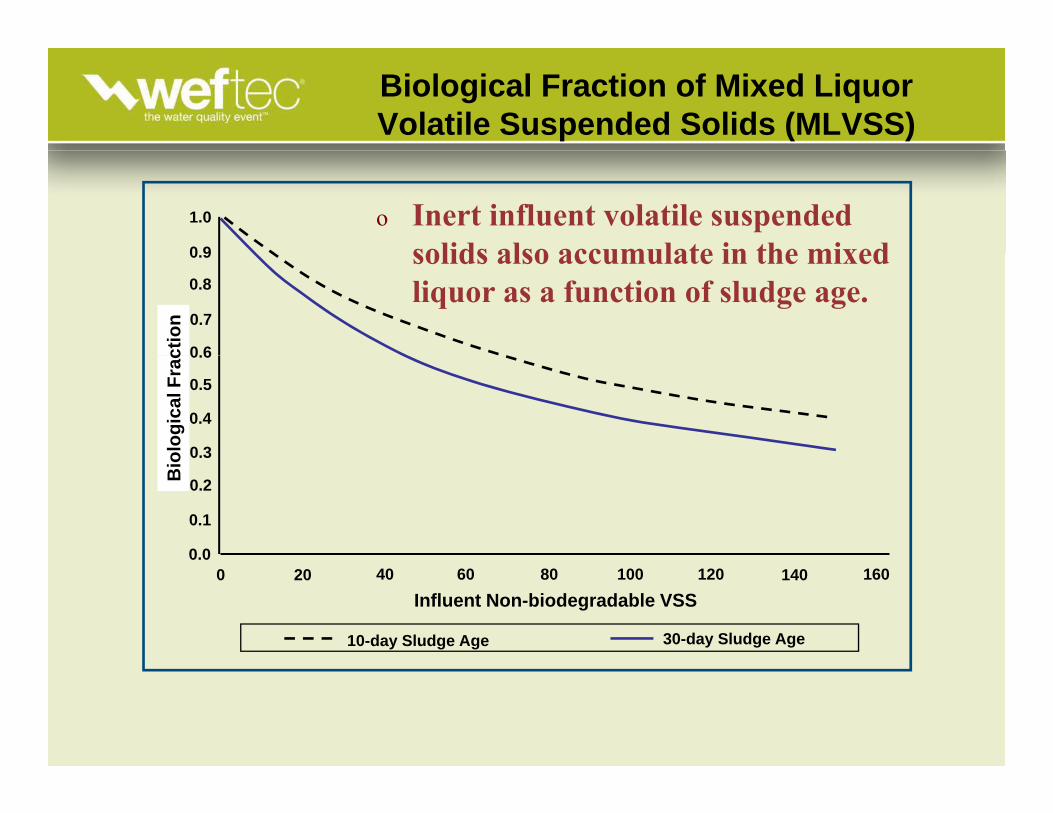
Biological Fraction of Mixed Liquor Volatile Suspended Solids (MLVSS)
1.0
0 9
o Inert influent volatile suspended solids also accumulate in the mixed
ctio
n
0.9
0.7
0.8
0.6
solids also accumulate in the mixed liquor as a function of sludge age.
olog
ical
Frac
0.5
0.6
0.3
0.4
Bio
0.2
0.1
0.0
Influent Non-biodegradable VSS
10-day Sludge Age 30-day Sludge Age
0 20 40 60 80 100 120 140 160
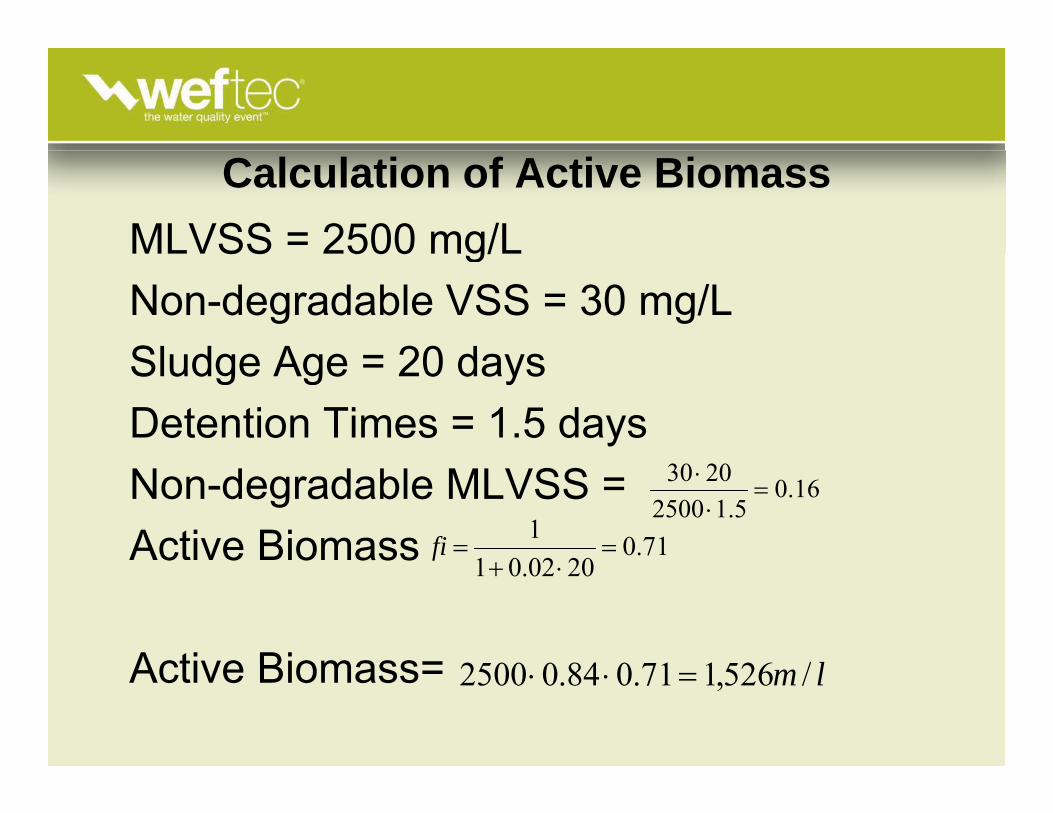
Calculation of Active BiomassMLVSS = 2500 mg/LMLVSS 2500 mg/LNon-degradable VSS = 30 mg/LSludge Age = 20 daysSludge Age = 20 daysDetention Times = 1.5 daysNon-degradable MLVSS =Active Biomass
16.05.12500
2030=
⋅⋅
71.0200201
1==fic e o ass
Active Biomass=
2002.01 ⋅+f
l/52617108402500Active Biomass= lm /526,171.084.02500 =⋅⋅
• Most wastewaters consist of multiple organics of variable degradation rates.g g
• In an acclimated system most of these• In an acclimated system most of these organics are degraded simultaneously, but at different ratesbut at different rates.
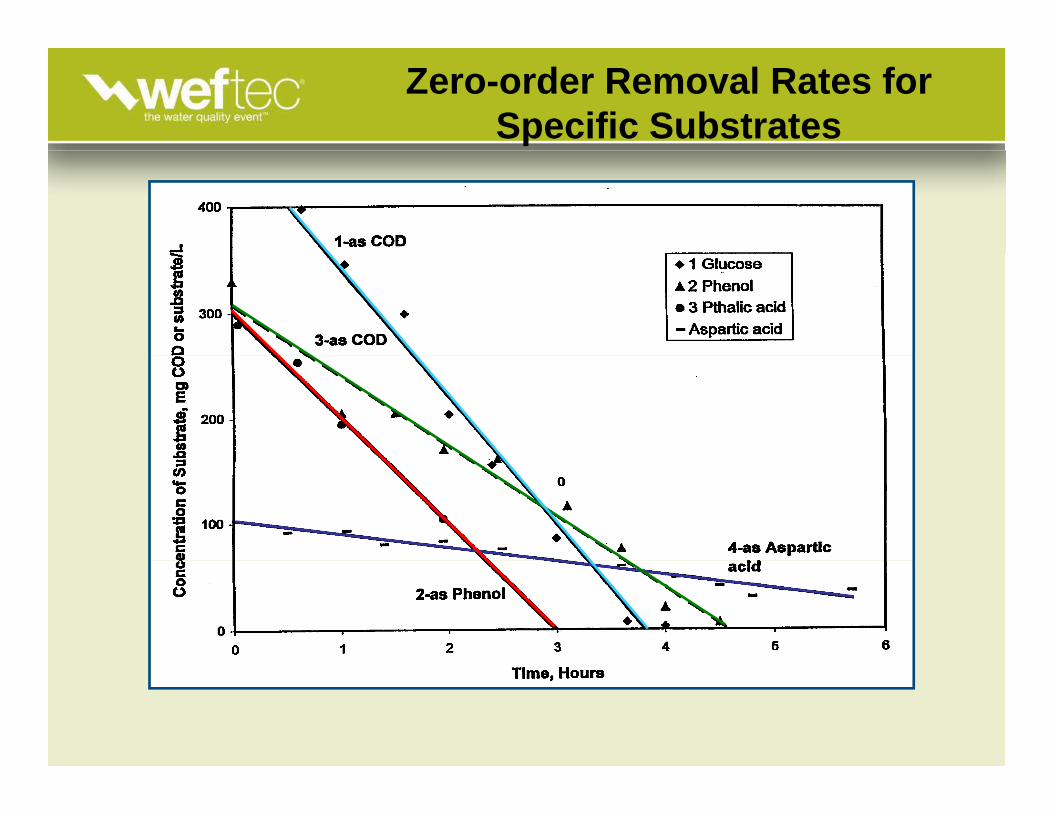
Zero-order Removal Rates for Specific Substrates

Schematic Representation of Multi-component Substrate Removal
A
tion A + B + C
(a) (b)
B
CCon
cent
rat
CO
D
B + C
C
Timet1 t2
C
t1 t2Time
(c)
gC
OD
(c)
Log
Xvb*t
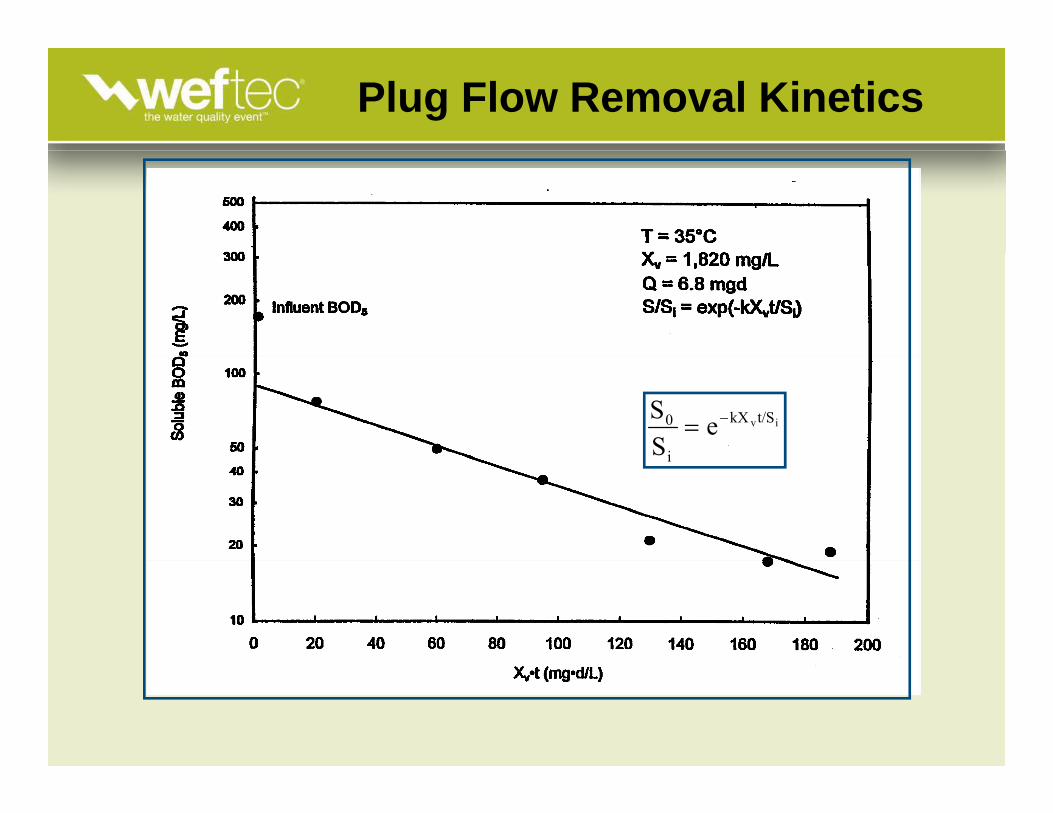
Plug Flow Removal Kinetics
iv t/SkX
i
0 eSS −=
i

Biodegradation Coefficient (K)(Complete Mix System)
tXS
bv
r
erS
SK tX
S=
bv
obvStX
oe
SS
do
e
c
bX - SSK a
θ1
=
• In a batch or plug flow system the degradation follows a pseudo first order reaction.
• In a complete mix process the organic removal rate is a function of the fraction or
i i i i th biorganic remaining, since the biomass removes the more readily degradable first.
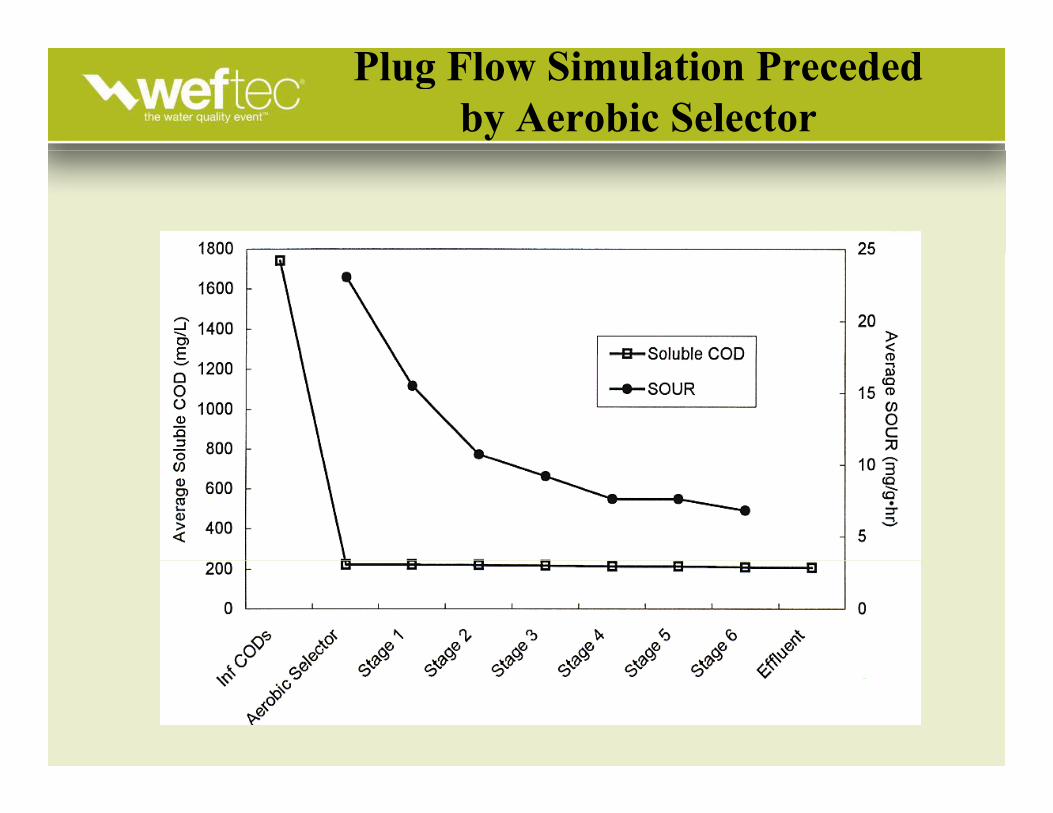
Plug Flow Simulation Precededby Aerobic Selector
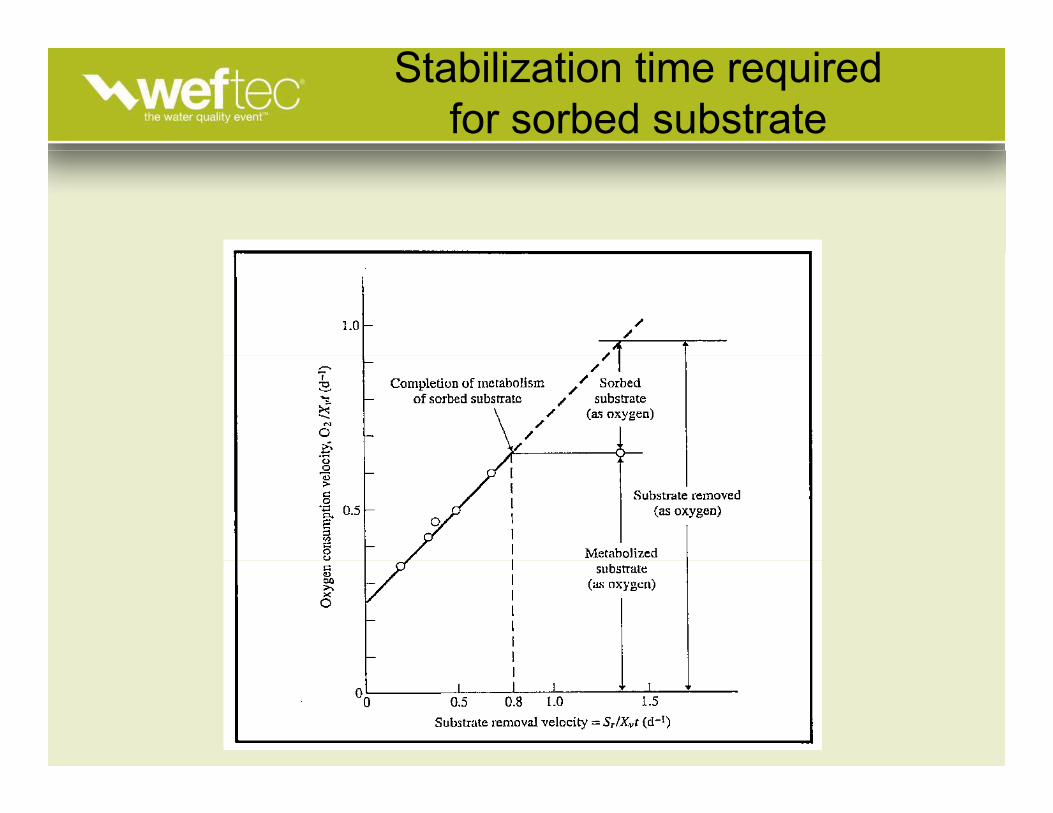
Stabilization time requiredfor sorbed substrate

• This relationship is :
seksr=
soaktvax=
va
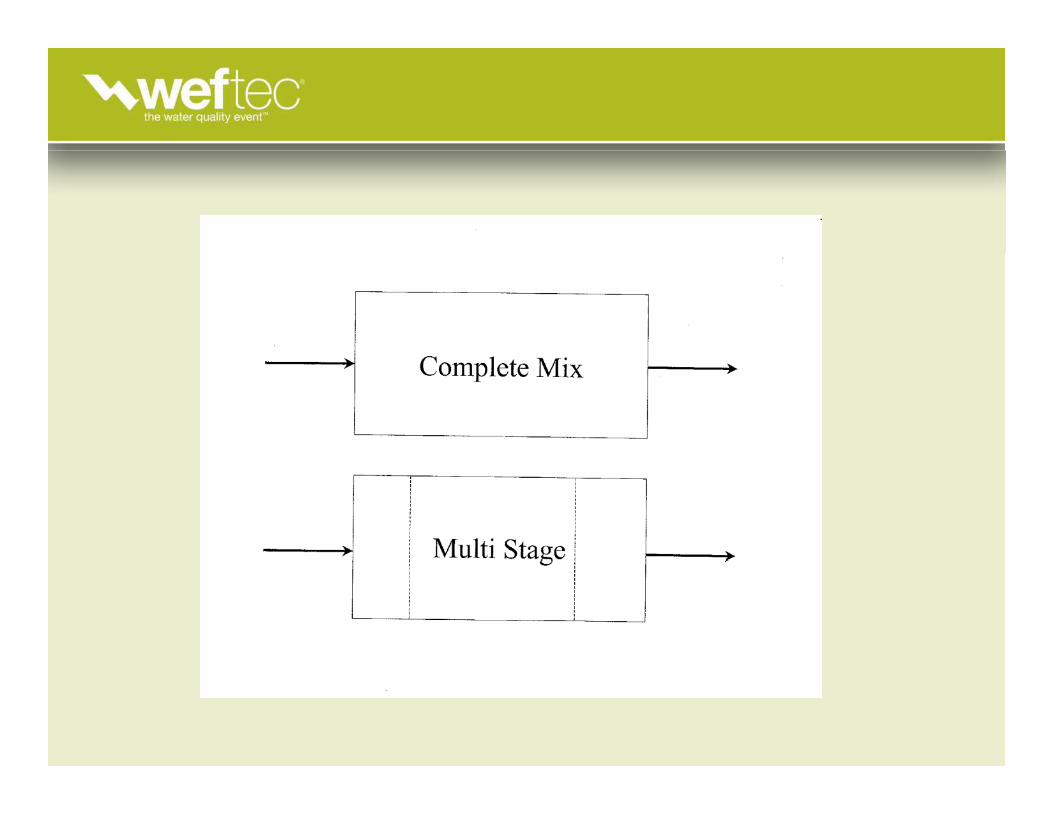
• Optimal design of activated sludge for industrial wastewater is a multistage gsystem. A maximum removal rate is achieved in the first stage at high g gorganic concentration. The limitation is a maximum power density of 750 p yHP/mg of aeration volume.
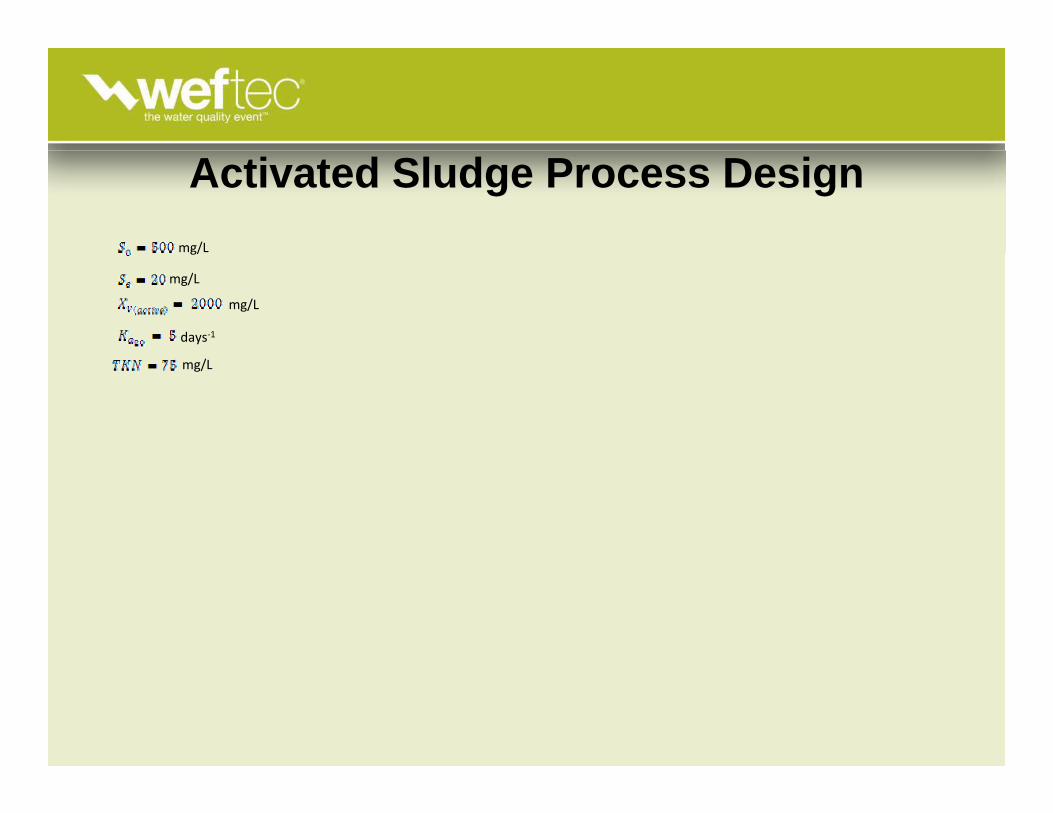
Activated Sludge Process Designmg/Lg/
mg/L
mg/L
days‐1
mg/L
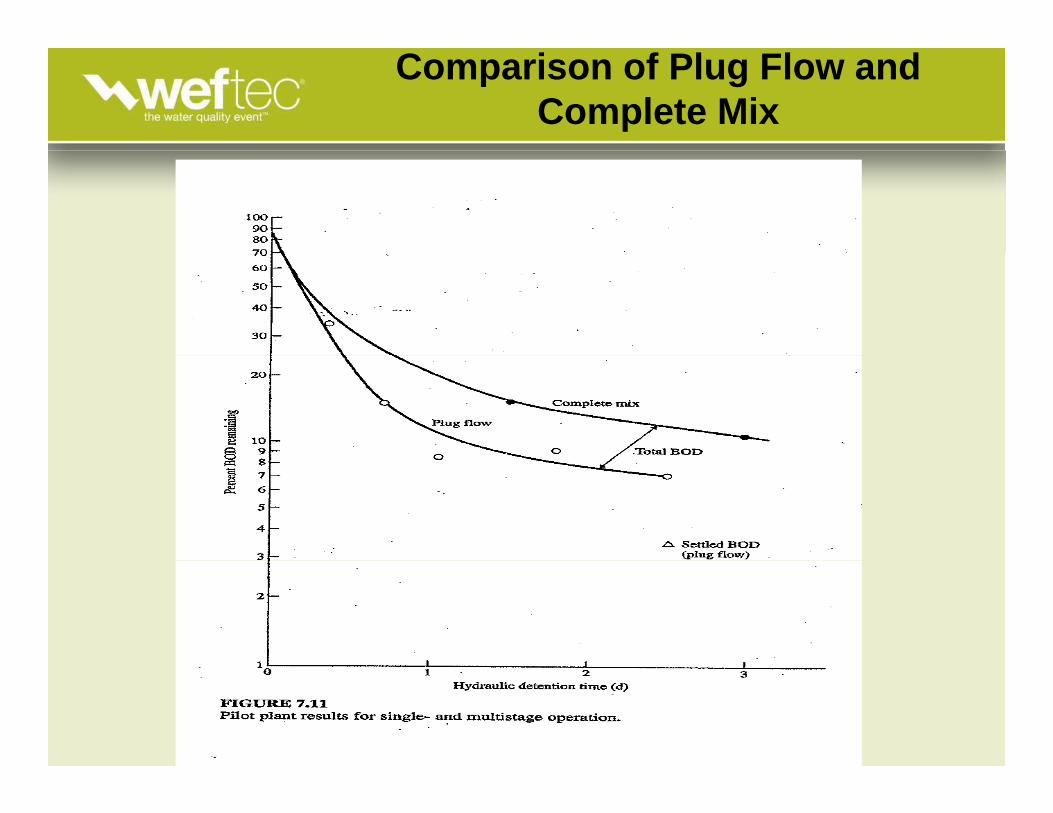
Comparison of Plug Flow and Complete Mix

Effect of Temperature on Biological Oxidation Rate Constant, K
)20(TC20T θKK −°=
Fl Di iffici
ent,
K
Floc Dispersion
onR
ate
Coe
IncreasedEffluent TSS
Rea
ctio
Mixed Liquor Temperature, °C4 32 39

Temperature Coefficient
Industrial Wastewaters 1 065 1 10Industrial Wastewaters 1.065 – 1.10Municipal Wastewaters 1.015
Endogenous 1.04
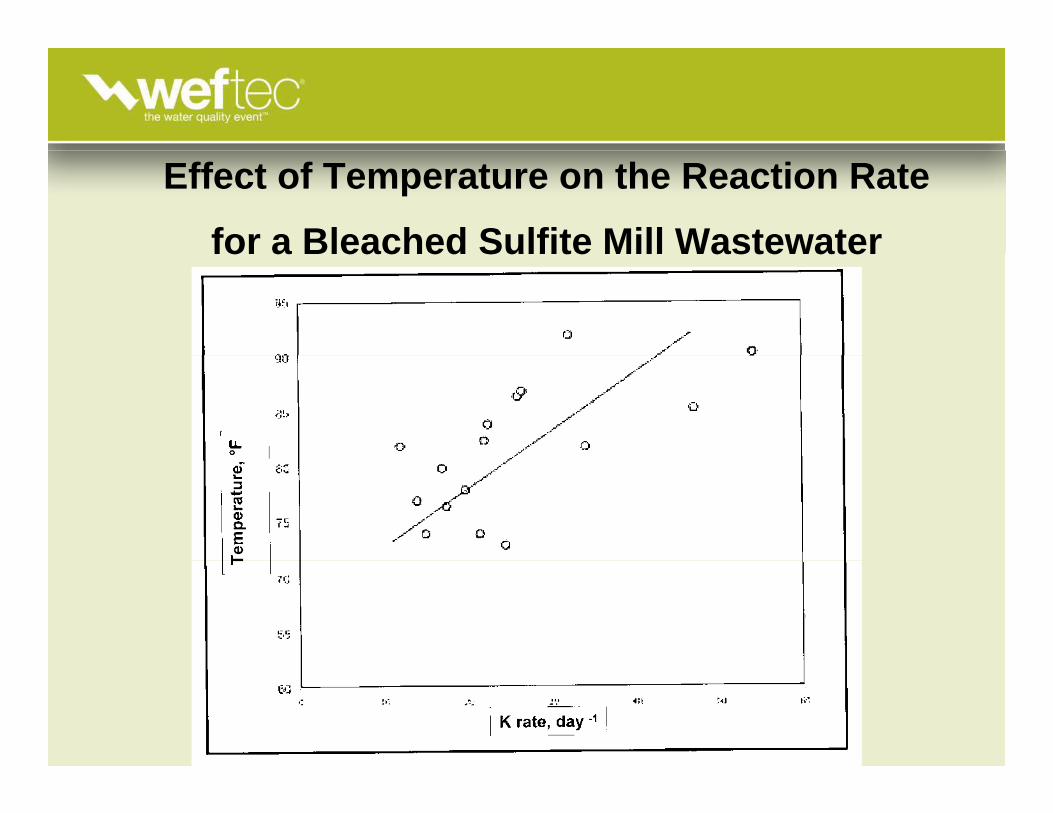
Effect of Temperature on the Reaction Rate
for a Bleached Sulfite Mill Wastewaterfor a Bleached Sulfite Mill Wastewater
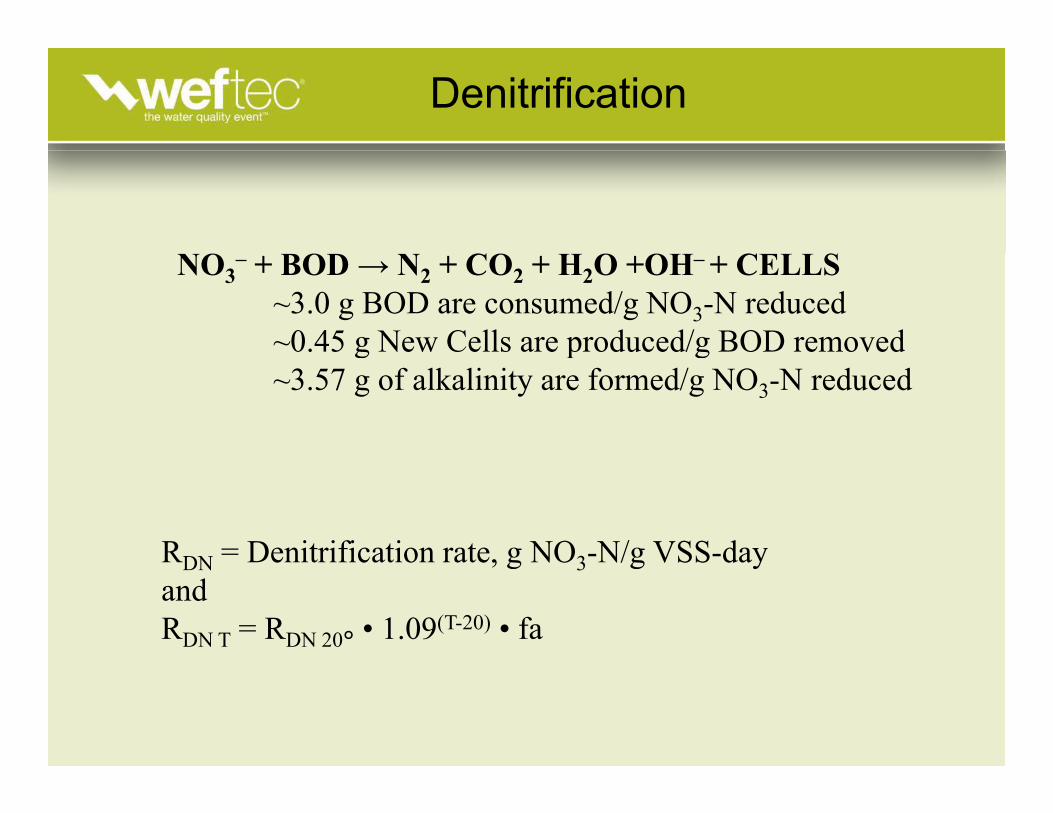
Denitrification
NO3– + BOD → N2 + CO2 + H2O +OH– + CELLS
~3.0 g BOD are consumed/g NO3-N reduced~0.45 g New Cells are produced/g BOD removedg p g~3.57 g of alkalinity are formed/g NO3-N reduced
RDN = Denitrification rate, g NO3-N/g VSS-dayRDN Denitrification rate, g NO3 N/g VSS dayandRDN T = RDN 20° • 1.09(T-20) • fa
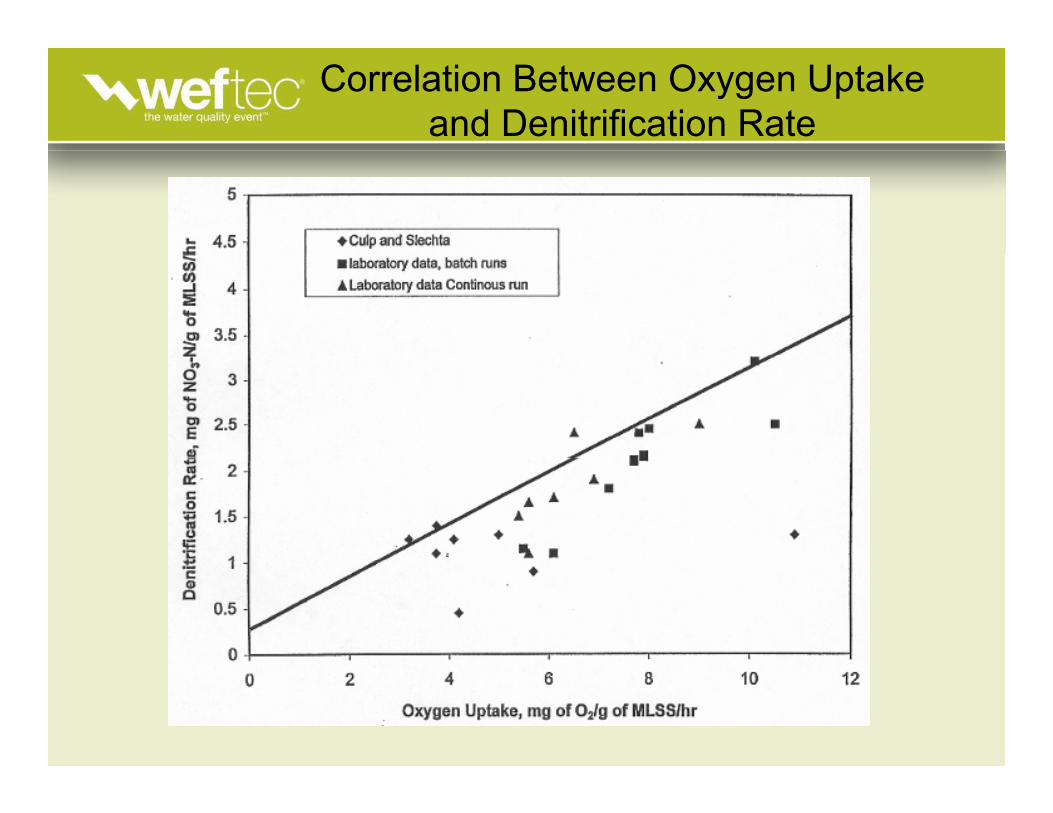
Correlation Between Oxygen Uptakeand Denitrification Rate

ODN
V
R
SeSK
tXS
•=• OV StX •
S = BOD removedSR = BOD removedXV = MLVSS
t = detention timeS ffl BODSe = effluent BODSo = influent BOD
KDN = anoxic reaction rate coefficientDN
9
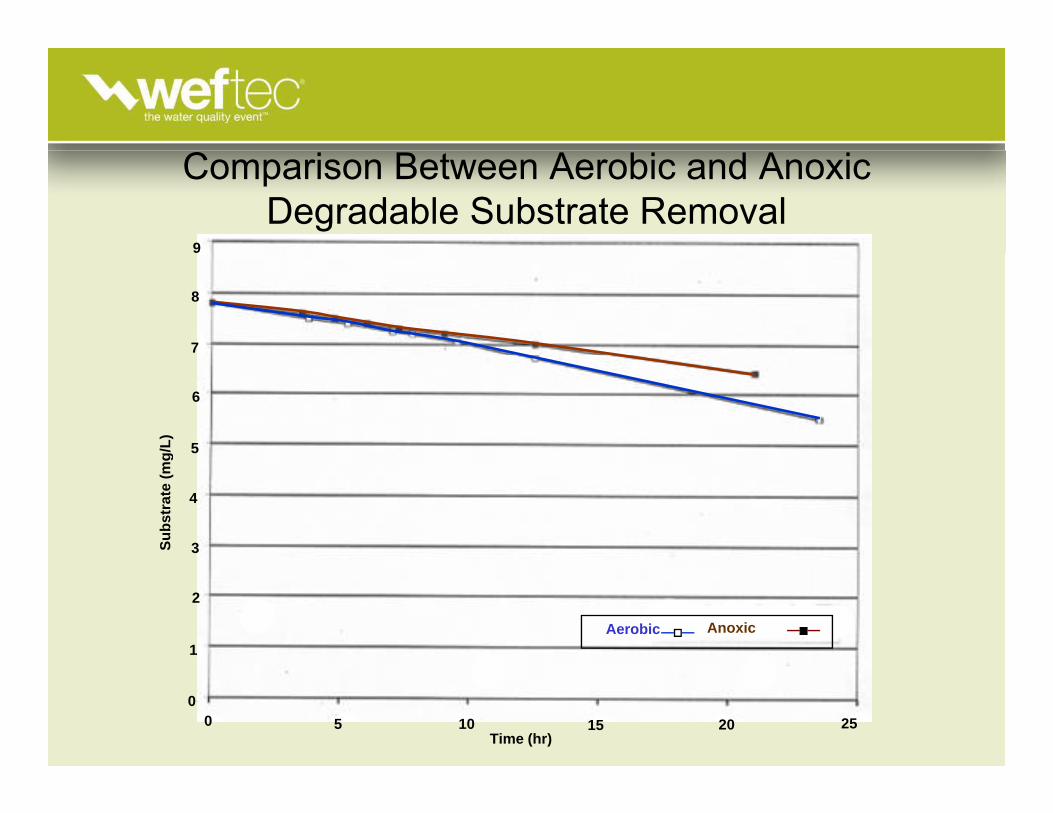
Comparison Between Aerobic and Anoxic Degradable Substrate Removal
9
8
7
g/L)
6
5
Subs
trat
e (m
g
4
3
2
1Aerobic Anoxic
Time (hr)
00 5 10 15 20 25

C i f A bi d A i Ki i
Anoxic Aerobic
Comparison of Aerobic and Anoxic Kinetic Coefficients (d-1)
Anoxic Aerobic
Pharmaceutical 9 2 21 0Pharmaceutical 9.2 21.0
E d 4 4 6 3Endogenous 4.4 6.3
6 0Pulp and Paper 6.0 --
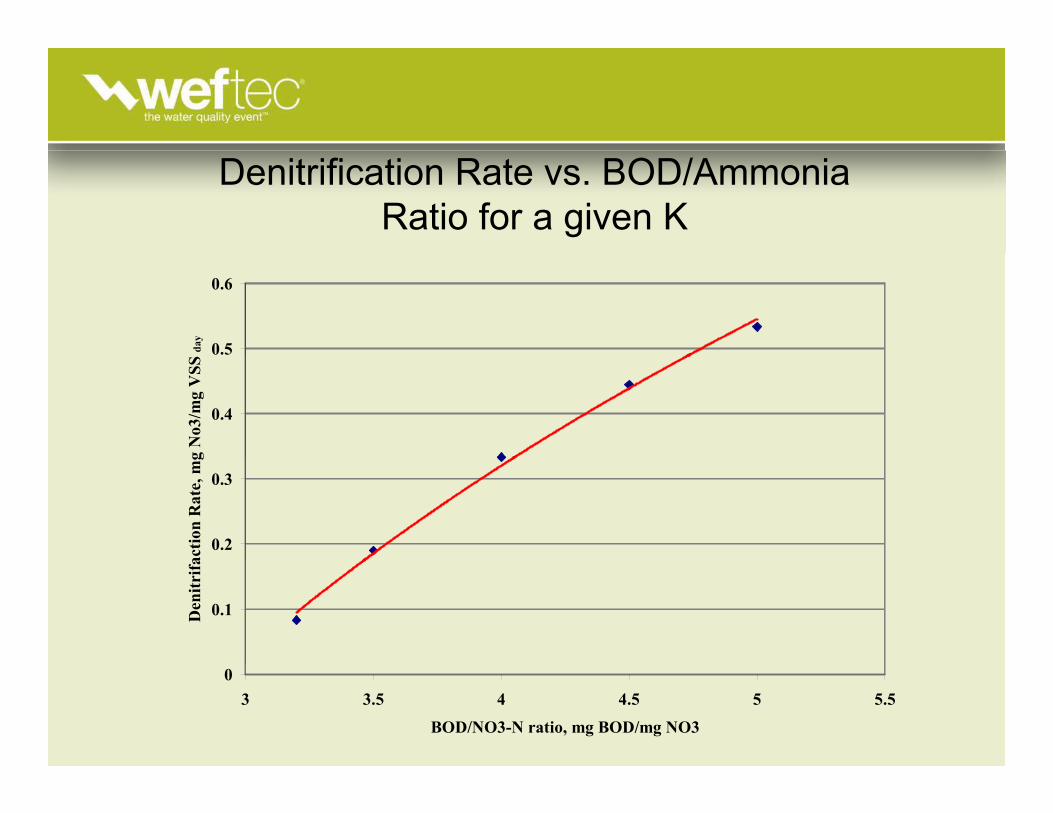
Denitrification Rate vs. BOD/Ammonia Ratio for a given K
0.5
0.6
day
0.4
g N
o3/m
g V
SS
0.2
0.3
actio
n R
ate,
mg
0.1Den
itrifa
03 3.5 4 4.5 5 5.5
BOD/NO3-N ratio, mg BOD/mg NO3

AquAeTer, Inc.215 Jamestown Park, Suite 100
Brentwood, TN 37027(615) 373-8532
AquAeTer, Inc.optimizing resources – water, air, earth
For a copy of today’s presentation please visit our website at
www.aquaeter.com/downloads.htm
For More Information Contact Wes at:[email protected] call (615) 373-8532