Embed Size (px)
Citation preview

1
ACTION PLAN OF BULGARIA FOR
CO2 EMISSIONS REDUCTION FROM CIVIL AVIATION
(IMPLEMENTATION OF ICAO RESOLUTION A-38/18 ON CLIMATE CHANGE)
Edition August 2016
Directorate General Civil Aviation Administration The Republic of Bulgaria

2
Contact info:
Directorate General "Civil Aviation Administration" 9 Diakon Ignatii Str., Sofia 1000, Bulgaria
Phone: /+359 2 / 937-1047 Fax: /+359 2 / 980 – 5337 AFTN LBSFYAYX, SITA SOFTOYA
E-mail: [email protected]
Mariya Kantareva International Cooperation Department
[email protected] Phone: + 359893335535
Anna Angelova
Airports and Airport Operations Licensing Department
[email protected] Phone: +359889299081
Lazar Iliev Legal Services and Economic
Regulations Department [email protected]
Phone: +359886899094
Marina Efthymiou Consultant
[email protected] Phone: +32489825656

3
CONTENT:
I. INTRODUCTION
1. PREAMBLE
II. CURRENT STATE OF AVIATION IN THE REPUBLIC OF
BULGARIA
1. IMPROVED AIR TRAFFIC MANAGEMENT AND INFRASTRUCTURE
USE IMPLEMENTATION OF DANUBE FUNCTIONAL AIRSPACE BLOCK (DANUBE FAB)
III. ECAC BASELINE SCENARIO
IV. ACTIONS TAKEN AT THE SUPRA NATIONAL LEVEL
1. AIRCRAFT - RELATED TECHNOLOGY DEVELOPMENT
2. ALTERNATIVE FUELS
3. IMPROVED AIR TRAFFIC MANAGEMENT AND INFRASTRUCTURE
USE
4. ECONOMIC/MARKET-BASED MEASURES
5. EU INITIATIVES IN THIRD COUNTRIES
6. SUPPORT TO VOLUNTARY ACTIONS
V. NATIONAL ACTIONS IN BULGARIA
1. ICAO ACTION PLAN BUDDY PROGRAMME
CONCLUSION
LIST OF ABBREVIATIONS
This Action Plan was finalised in August 2016, and shall be considered as subject to update after that date.
4
1. Preamble
a) The Republic of Bulgaria is a member of Central European Rotation Group 1 (CERG), European Union and of the European Civil Aviation
Conference (ECAC)2. ECAC is an intergovernmental organisation covering
the widest grouping of Member States1 of any European organisation dealing with civil aviation. It is currently composed of 44 Member States,
and was created in 1955. b) ECAC States share the view that environmental concerns represent a
potential constraint on the future development of the international aviation sector, and together they fully support ICAO’s on-going efforts to
address the full range of these concerns, including the key strategic challenge posed by climate change, for the sustainable development of
international air transport. c) The Republic of Bulgaria, like all of ECAC’s forty-four States, is fully
committed to and involved in the fight against climate change, and works towards a resource-efficient, competitive and sustainable multimodal
transport system. d) The Republic of Bulgaria recognises the value of each State preparing and
submitting to ICAO an updated State Action Plan for emissions reductions,
as an important step towards the achievement of the global collective goals agreed at the 38th Session of the ICAO Assembly in 2013.
e) In that context, it is the intention that all ECAC States submit to ICAO an Action Plan3. This is the Action Plan of The Republic of Bulgaria.
f) The Republic of Bulgaria shares the view of all ECAC States that a comprehensive approach to reducing aviation emissions is necessary, and
that this should include: i. emission reductions at source, including European support to CAEP work
ii. research and development on emission reductions technologies, including public-private partnerships
iii. the development and deployment of low-carbon sustainable alternative fuels, including research and operational initiatives undertaken jointly
with stakeholders
1. The Republic of Bulgaria, the Republic of Cyprus, the Czech Republic, the Republic of Lithuania, the Hellenic Republic,
Hungary, the Republic of Poland, Romania, the Slovak Republic, the Republic of Slovenia
2. Albania, Armenia, Austria, Azerbaijan, Belgium, Bosnia and Herzegovina, Bulgaria, Croatia, Cyprus, Czech Republic, Denmark, Estonia, Finland, France, Georgia, Germany, Greece, Hungary, Iceland, Ireland, Italy, Latvia, Lithuania,
Luxembourg, Malta, Moldova, Monaco, Montenegro, Netherlands, Norway, Poland, Portugal, Romania, San Marino,
Serbia, Slovakia, Slovenia, Spain, Sweden, Switzerland, The former Yugoslav Republic of Macedonia, Turkey, Ukraine, and the United Kingdom
3. ICAO Assembly Resolution A38-18 also encourages States to submit an annual reporting on international aviation CO2
emissions, which is a task different in nature and purpose to that of Action Plans, strategic in their nature. Also this
requirement is subject to different deadlines for submission and updates as annual updates are expected. For that reason, the
reporting to ICAO on international aviation CO2 emissions referred to at paragraph 11 of ICAO Resolution A38/18 is not necessarily part of this Action Plan, and may be provided separately, as part of routine provision of data to ICAO, or in
future updates of this action plan.
I. INTRODUCTION

5
iv. the optimisation and improvement of Air Traffic Management, and
infrastructure use within Europe, in particular through the Single European Sky ATM Research (SESAR), and also beyond European
borders, through the Atlantic Initiative for the Reduction of Emissions (AIRE) in cooperation with the US FAA.
v. Market-based measures, which allow the sector to continue to grow in a sustainable and efficient manner, recognizing that the measures at (i) to
(iv) above cannot, even in aggregate, deliver in time the emissions reductions necessary to meet the global goals. This growth becomes
possible through the purchase of carbon units that foster emission reductions in other sectors of the economy, where abatement costs are
lower than within the aviation sector. g) In Europe, many of the actions which are undertaken within the
framework of this comprehensive approach are in practice taken at a supra-national level, most of them led by the European Union. They are
reported in Section 1 of this Action Plan, where The Republic of Bulgaria
involvement in them is described, as well as that of stakeholders. h) In the Republic of Bulgaria a number of actions are undertaken at the
national level, including by stakeholders, in addition to those of a supra-national nature. These national actions are reported in Section 2 of this
Plan. i) In relation to actions which are taken at a supranational level, it is
important to note that: i. The extent of participation will vary from one State and another, reflecting
the priorities and circumstances of each State (economic situation, size of its aviation market, historical and institutional context, such as EU/ non
EU). The ECAC States are thus involved to different degrees and on different timelines in the delivery of these common actions. When an
additional State joins a collective action, including at a later stage, this broadens the effect of the measure, thus increasing the European
contribution to meeting the global goals.
ii. Nonetheless, acting together, the ECAC States have undertaken to reduce the region’s emissions through a comprehensive approach which uses
each of the pillars of that approach. Some of the component measures, although implemented by some but not all of ECAC’s 44 States,
nonetheless yield emission reduction benefits across the whole of the region (thus for example research, ETS).

6
II. CURRENT STATE OF AVIATION IN THE REPUBLIC OF BULGARIA
Transport plays a major role in the development of every modern society
as a means for economic development and a prerequisite for achieving social and regional cohesion. The transport sector in Bulgaria is of an
exceptional importance for raising the competitiveness of national
economy and for providing services to its citizens. 11.7% of the gross value added in the country and directly employ
Favorable geographic location of Bulgaria provides opportunities for the development of transit transport along the five Pan-European
transport corridors, crossing the country, and favorable conditions for communication between Western and Eastern Europe and the Middle
East, Western and Central Asia. The harmonisation of Bulgaria’s legislation with the legislation of the
European Communities, and achieving a full compliance, was the main prerequisite for Bulgaria’s accession and establishment as a full EU
member state. Currently, Bulgaria’s regulatory instruments are fully harmonised with the Community legislation.
The Minister of Transport, Information Technology and Communications, assisted by the staff at the Ministry, is in charge of
implementing the state policy in the field of transport, and coordinates
the process of drafting and implementation of a strategy for development and restructuring of transport. Executive agencies have been established
within the Ministry of Transport, Information Technology and Communications, which function as regulatory bodies for the individual
transport modes: The DG CAA is a state budget supported legal entity within the
Ministry of Transport, Information Technology and Communications , headquarters in Sofia, and a secondary principal of
budgetary loans. Directorate General "Civil Aviation Administration" shall constitute of five regional departments - airport administrations as
provided for in Article 48a, par.4 of the Civil Aviation Act.The DG CAA performs the functions of a Civil Aviation Administration in accordance
with the Civil Aviation Act and the International Conventions and Arrangements, which the Republic of Bulgaria is party to.
Bulgarian Air Traffic Services Authority (BULATSA) performs the
functions delegated by the state related to the management of air traffic and providing air navigation services within the serviced civil airspace in
compliance with the Civil Aviation Act and the international agreements in the sphere of air navigation ratified by the Republic of Bulgaria. The main
line of business of BULATSA is related to air traffic management with the objective to assure safety, efficiency and on-schedule flights within the
serviced civil air space. The market of international passenger services is dominated by air
carriers and bus operators.

7
As a result of a dedicated investment policy carried out over the
last several years, Bulgaria’s aircraft fleet is being progressively renewed, and the Bulgarian air carriers are progressively increasing their
competitiveness, both on the market of chartered flights and of regular destinations.
AIRPORT TRAFFIC (2006-2014)
Year Aircraft
Movements Total
Passengers
Embarked and Disembarked
Total
Freight and Mail
(Tonnes) Total
2014 77 418 5 291 590 21 822
2013 75 170 7 363 068 24 978
2012 77 650 7 125 613 27 503
2011 84 787 6 944 834 22 313
2010 81 430 6 388 771 21 478
2009 83 724 6 043 392 18 604
2008 86 392 6 644 971 21 779
2007 84 346 6 262 057 21 519
2006 75 279 5 619 416 18 469
TO
TAL
726 196 57 683 712 198 465
7 YEAR FORECAST 2015-2021 MTF15 RESULTS ARR/DEP
Growth
Scenario 2015 2016 2017 2018 2019 2020 2021
1. High Scenario
2.90% 4.90% 7.50% 7.10% 6.60% 6.80% 6.10%
2. Base
Scenario
1.10% 2.80% 4.50% 4.90% 4.40% 4.60% 3.90%
3. Low
Scenario
-
0.60%
0.90% 1.70% 2.90% 2.50% 2.60% 2.00%

8
ENERGY CONSUMPTION OF TRANSPORT IN BULGARIA
Commonly Railway transport Road transport Air
transport
GREENHOUSE GAS EMISSIONS FROM TRANSPORT IN BULGARIA
(1000 t- equivalent СО2)
Railway transport other transport
GREENHOUSE GAS EMISSIONS FROM TRANSPORT (1000 t- equivalent СО2)
Bulgaria Czech Republic and Slovak Republic Hungary Austria

9
BULGARIA CO2 emmissions from transport (% of total fuel combustions)
2005-2009 17,4%
2010-2014 16 %
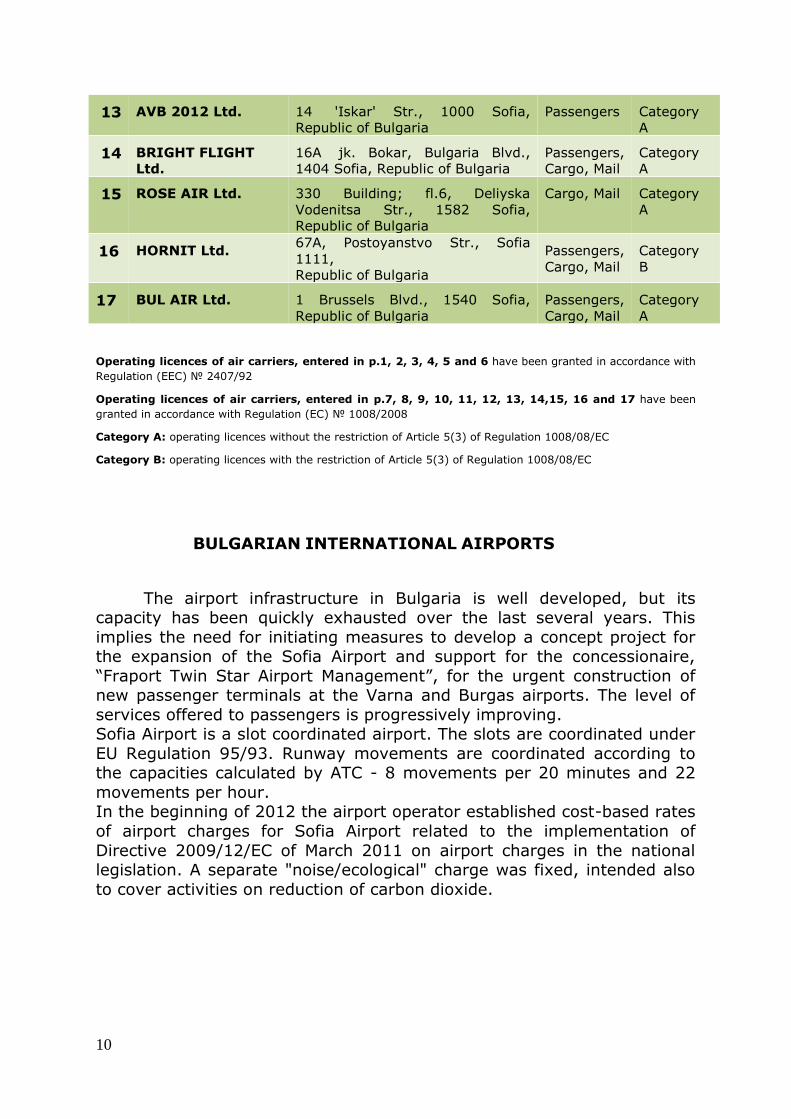
AIR CARRIERS
List of the air carriers with a valid Operating Licence of
Community air carrier
Name of Air
Carrier
Address of Air Carrier Permited
to carry
Category
1 BULGARIA AIR Jsc. Sofia Airport, Sofia 1540, Republic
of Bulgaria
Passengers,
Cargo, Mail
Category
A
2 AIR VIA Ltd. 4bl.Rila, vh.A, app.5, 6600
Kardjali, Bulgaria
Passengers,
Cargo, Mail
Category
A
3 BH AIR Ltd. 7 Dyakon Ignatii Str., Sofia 1000,
Bulgaria
Passengers,
Cargo, Mail
Category
A
4 BULGARIAN AIR
CHARTER Ltd.
35 Pavel Krasov Str., Gorubliane,
1138 Sofia, Bulgaria
Passengers,
Cargo, Mail
Category
A
5 CARGO AIR Ltd. 17 Angelov vrah Str., Obshtina
Ovcha Kupel, Sofia 1618, Bulgaria
Cargo, Mail Category
A
6 HELI AIR
SERVICES Jsc.
Sofia Airport - North, 1540 Sofia,
Republic of Bulgaria
Passengers,
Cargo, Mail
Category
A
7 AVIOSTART Ltd. 13 Tsvetna gradina Str., 1421
Sofia, Republic of Bulgaria
Passengers,
Cargo, Mail
Category
B
8 AVIO DELTA Ltd. off.10, fl.7, Jessika Office Centre,
229, Botevgradsko shosse Blvd,
1517, Sofia, Republic of Bulgaria
Passengers,
Cargo, Mail
Category
B
9 VICTORIA AIR Ltd. 8, Maria Luisa Blvd, 4000 Plovdiv,
Republic of Bulgaria
Passengers Category
B
10 ALK Jsc. 2А 'Acad.Nikola Obreshkov' Str.,
1113 Sofia, Republic of Bulgaria
Passengers,
Cargo, Mail
Category
A
11 JET OPS EUROPE
Ltd.
app.2, 14 'Karnigradska' Str.,
1000 Sofia, Republic of Bulgaria
Passengers,
Cargo, Mail
Category
B
12 AIR VOLTA Ltd. 3A 'Nikolay Haytov' Str., 1113
Sofia, Republic of Bulgaria
Passengers,
Cargo, Mail
Category
А
10
13 AVB 2012 Ltd. 14 'Iskar' Str., 1000 Sofia,
Republic of Bulgaria
Passengers Category
A
14 BRIGHT FLIGHT
Ltd.
16A jk. Bokar, Bulgaria Blvd.,
1404 Sofia, Republic of Bulgaria
Passengers,
Cargo, Mail
Category
А
15 ROSE AIR Ltd. 330 Building; fl.6, Deliyska
Vodenitsa Str., 1582 Sofia,
Republic of Bulgaria
Cargo, Mail Category
A
16 HORNIT Ltd. 67A, Postoyanstvo Str., Sofia
1111,
Republic of Bulgaria
Passengers,
Cargo, Mail
Category
B
17 BUL AIR Ltd. 1 Brussels Blvd., 1540 Sofia,
Republic of Bulgaria
Passengers,
Cargo, Mail
Category
А
Operating licences of air carriers, entered in p.1, 2, 3, 4, 5 and 6 have been granted in accordance with
Regulation (EEC) № 2407/92
Operating licences of air carriers, entered in p.7, 8, 9, 10, 11, 12, 13, 14,15, 16 and 17 have been
granted in accordance with Regulation (EC) № 1008/2008
Category A: operating licences without the restriction of Article 5(3) of Regulation 1008/08/EC
Category B: operating licences with the restriction of Article 5(3) of Regulation 1008/08/EC
BULGARIAN INTERNATIONAL AIRPORTS
The airport infrastructure in Bulgaria is well developed, but its capacity has been quickly exhausted over the last several years. This
implies the need for initiating measures to develop a concept project for the expansion of the Sofia Airport and support for the concessionaire,
“Fraport Twin Star Airport Management”, for the urgent construction of new passenger terminals at the Varna and Burgas airports. The level of
services offered to passengers is progressively improving. Sofia Airport is a slot coordinated airport. The slots are coordinated under
EU Regulation 95/93. Runway movements are coordinated according to the capacities calculated by ATC - 8 movements per 20 minutes and 22
movements per hour. In the beginning of 2012 the airport operator established cost-based rates
of airport charges for Sofia Airport related to the implementation of
Directive 2009/12/EC of March 2011 on airport charges in the national legislation. A separate "noise/ecological" charge was fixed, intended also
to cover activities on reduction of carbon dioxide.

11
INTERNATIONAL AIRPORTS IN BULGARIA
There are 5 /five/ international airports in Bulgaria:
Sofia Airport
Varna Airport
Bourgas Airport
Plovdiv Airport
Gorna Oriahovitza Airport
12
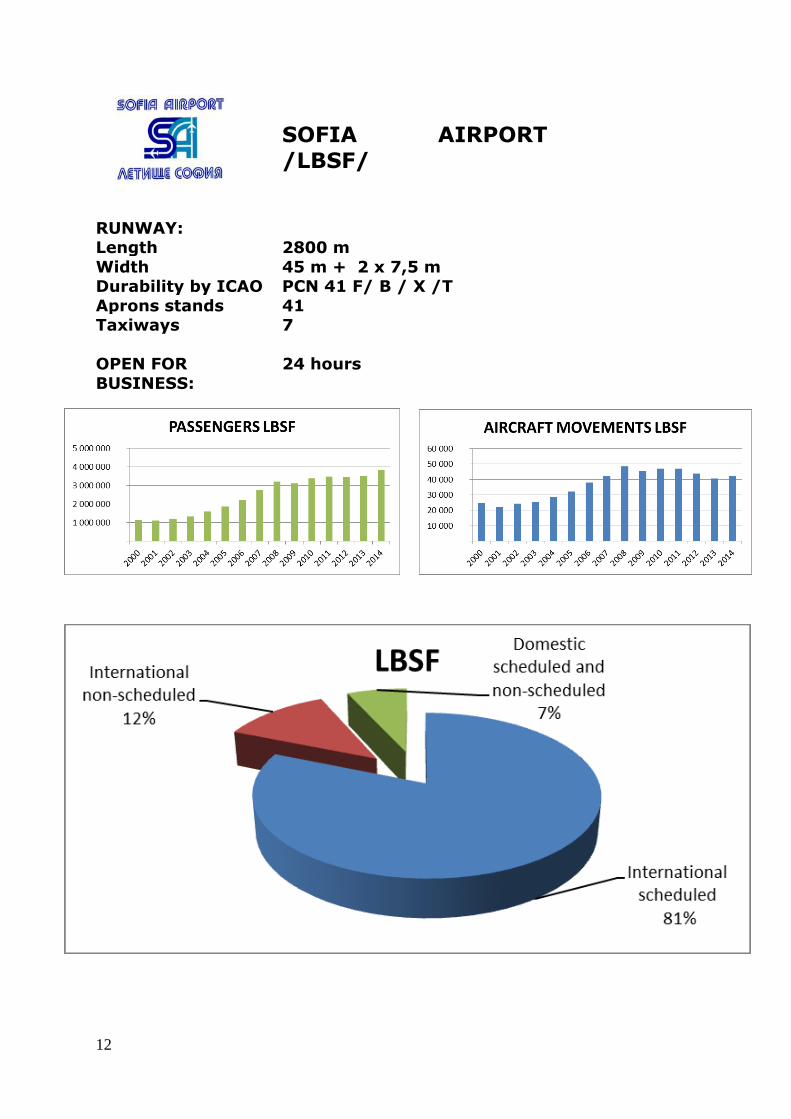
SOFIA AIRPORT
/LBSF/
RUNWAY:
Length 2800 m
Width 45 m + 2 x 7,5 m Durability by ICAO PCN 41 F/ B / X /T
Aprons stands 41 Taxiways 7
OPEN FOR
BUSINESS:
24 hours

13
VARNA AIRPORT
/LBWN/
RUNWAY
Length 2500 m
Width 45 m + 2 x 5 m Durability by ICAO PCN 60 F/ B / X / T
Aprons stands 24 Taxiways 5
OPEN FOR
BUSINESS:
24 hours

14
BURGAS AIRPORT /LBBG/
RUNWAY:
Length 3200 m
Width 45 m + 2 x 7,5 m Durability by ICAO PCN 60 F/ B / X / T
Aprons stands 20 Taxiways 6
OPEN FOR
BUSINESS:
24 hours

15
IMPROVED AIR TRAFFIC MANAGEMENT AND INFRASTRUCTURE USE
IMPLEMENTATION OF DANUBE FUNCTIONAL AIRSPACE BLOCK
(DANUBE FAB)
DANUBE FAB is being developed and is under implementation in
accordance with EU legislation between Republic of Bulgaria and Romania. The principal focus during the development of the DANUBE FAB has
been to re-design airspace, taking due account of operational improvements and ensuring optimisation is achieved. The DANUBE FAB
fixed route network is included in and compliant with the European ATS Route Network Version-7 (ARN v.7) and has been developed to easily
ensure further integration into the future European Route Network Improvement Plan ARN V8.
In terms of horizontal flight efficiency, the proposed route network is in line with the Network Manager plans and is expected to deliver
substantial benefits to airspace users. The introduction of the new ATS routes enables airspace users to flight-plan shorter flights. This is
expected to result in reduced track miles for the transition of aircraft through the Danube FAB airspace.
As detailed in the DANUBE FAB Cost Benefit Analysis, by 2015 each
flight is expected to save more than 0.5 minutes of flying time, increasing to beyond a minute per flight in 2020 following the introduction of free
routes. The gain in flight efficiency in terms of reduced track miles is directly linked to an equivalent gain in reduced environmental impact as a
result of reduced fuel burn and hence CO2 emission. A dedicated DANUBE FAB Environmental Impact Assessment Study
was performed by EUROCONTROL to analyse this environmental impact. The study was carried out using the System for traffic Assignment and
Analysis at a Macroscopic level (SAAM) fast-time simulation tool. This incorporates the EUROCONTROL Advanced Emissions Model (AEM) which
allows fuel and emissions to be calculated for each trajectory processed. AEM has been endorsed by ICAO following extensive stress testing by its
Committee on Aviation Environmental Protection (CAEP).
The assessment was limited to changes in fuel use and the
greenhouse gas Carbon Dioxide (CO2) in the Danube FAB airspace above FL095. It took place between October and December 2011. The following
scenarios were simulated:

16
Route Network (RN)
Traffic
scenario years
Base case (withOUT FAB)
Future case (with FAB)
2015 (A2) Bulgaria and Romania RN (APR 2009)
(B2) Danube FAB RN (2015)
2020 (A3) Bulgaria and Romania RN (APR 2009)
(B3) Danube FAB Free Route Airspace (2020)
2030 (A4) Bulgaria and Romania RN (APR
2009)
(B4) Danube FAB Free Route
Airspace (2020)
DANUBE FAB environmental assessment scenarios
The study determined annual fuel and emissions savings as shown
in the table below:
2015 2020 2030
Fuel savings
(tonnes)
22000 45000 80000
CO2 savings
(tonnes)
70000 143000 255000
NOx savings (kg)
280000 550000 960000
DANUBE FAB environmental impact
Danube FAB can be considered to contribute to the global need to conserve increasingly scare oil stocks by reducing aviation fuel use by
around 80K tonnes per annum by 2050.

17
III. ECAC BASELINE SCENARIO
The baseline scenario of ECAC States presents the following sets of
data (in 2010) and forecast (in 2020 and 2035), which were provided by
EUROCONTROL:
- European air traffic (includes all international and national passenger flight departures from ECAC airports, in number of
flights, and RPK calculated purely from passenger numbers, which are based on EUROSTAT figures. Belly freight and
dedicated cargo flights are not included), - its associated aggregated fuel consumption (in million tonnes)
- its associated emissions (in million tonnes of CO2), and - average fuel efficiency (in kg/10RPK).
The sets of forecasts correspond to projected traffic volumes and
emissions, in a scenario of “regulated growth”.
Scenario “Regulated Growth”, Most-likely/Baseline scenario
As in all 20-year forecasts produced by EUROCONTROL, various scenarios
are built with a specific storyline and a mix of characteristics. The aim is
to improve the understanding of factors that will influence future traffic
growth and the risks that lie ahead. In the 20-year forecast published in

18
2013 by EUROCONTROL, the scenario called ‘Regulated Growth’ was
constructed as the ‘most-likely’ or ‘baseline’ scenario, most closely
following the current trends. It considers a moderate economic growth,
with regulation reconciling the environmental, social and economic
demands.
Table 1. Summary characteristics of EUROCONTROL scenarios:
The table above presents a summary of the social, economic and air
traffic-related characteristics of the different scenarios developed by
EUROCONTROL for the purposes of EUROCONTROL 20-year forecast of
IFR movements1.
1 The characteristics of the different scenarios can be found in Task 4: European Air Traffic in 2035,
Challenges of Growth 2013, EUROCONTROL, June 2013 available at ECAC website

19
ECAC BASELINE SCENARIO
The ECAC baseline scenario presented in the following tables was
generated by EUROCONTROL for all ECAC States including the Canary
Islands. Over-flights of the ECAC area have not been included.
The baseline scenario, which is presented in the following tables, does not
include business and dedicated cargo traffic. It covers only commercial
passenger flight movements for the area of scope outlined in the previous
paragraph, using data for airport pairs, which allows for the generation of
fuel efficiency data (in kg/RPK). Historical fuel burn (2010) and emission
calculations are based on the actual flight plans from the PRISME data
warehouse, including the actual flight distance and the cruise altitude by
airport pair. Future year fuel burn and emissions (2020, 2035) are
modelled based on actual flight distances and cruise altitudes by airport
pair in 2014. Taxi times are not included. The baseline is presented along
a scenario of engine-technology freeze, as of 2014, so aircraft not in
service at that date are modelled with the fuel efficiency of comparable-
role in-service aircraft (but with their own seating capacities).
The future fleet has been generated using the Aircraft Assignment Tool
(AAT) developed collaboratively by EUROCONTROL, the European Aviation
Safety Agency and the European Commission. The retirement process of
the Aircraft Assignment Tool is performed year by year, allowing the
determination of the amount of new aircraft required each year. This way,
the entry into service year (EISY) can be derived for the replacement
aircraft. The Growth and Replacement (G&R) Database used is largely
based on the Flightglobal Fleet Forecast - Deliveries by Region 2014 to
2033. This forecast provides the number of deliveries for each type in
each of the future years, which are re-scaled to match the EUROCONTROL
forecast.
The data and forecasts for Europe show two distinct phases, of rapid
improvement followed by continuing, but much slower improvement after
2020. The optimism behind the forecast for the first decade is partly
driven by statistics: in the 4 years 2010-2014, the average annual
improvement in fuel efficiency for domestic and international flights was
around 2%, [Source: EUROCONTROL] so this is already achieved.
Underlying reasons for this include gains through improvements in load
factors (e.g. more than 3% in total between 2010 and 2014), and use of
slimmer seats allowing more seats on the same aircraft. However, neither
of these can be projected indefinitely into the future as a continuing
benefit, since they will hit diminishing returns. In their place we have
technology transitions to A320neo, B737max, C-series, B787 and A350

20
for example, especially over the next 5 years or so. Here this affects seat
capacity, but in addition, as we exit from the long economic downturn, we
see an acceleration of retirement of old, fuel-inefficient aircraft, as airline
finances improve, and new models become available. After that, Europe
believes that the rate of improvement would be much slower, and this is
reflected in the ‘technology freeze’ scenario, which is presented here.
Table 2. Total fuel burn for passenger domestic and international flights
(ECAC)
Year
Traffic
(millions of
departing
flights)
Total Fuel burn
(in million
tonnes)
2010 7,12 40,34
2020 8,48 48,33
2035 11,51 73,10
Table 3. CO2 emissions forecast
Year
CO2 emissions
(in million
tonnes)
2010 127,47
2020 152,72
2035 231,00

21
Table 4. Traffic in RPK (domestic and international departing flights from
ECAC airports, PAX only, no freight and dedicated cargo flights)
Year
Traffic (in
billion RPK)
2010 1 329,6
2020 1 958,7
2035 3 128,2
Table 5. Fuel efficiency (kg/10RPK)
Year Fuel efficiency
(in kg/10 RPK)
2010 0,3034
2020 0,2468
2035 0,2337
Table 6. Average annual fuel efficiency improvement
Period Fuel efficiency
improvement
2020 -
2010 -2,05%
2035 -
2020 -0,36%
2035 -
2010 -1,04%

22
In order to further improve fuel efficiency and to reduce future air traffic
emissions beyond the projections in the baseline scenario, ECAC States
have taken further action. Supranational measures in order to achieve
such additional improvement will be described in the following sections.
It should be noted, however, that a quantification of the effects of many
measures is difficult. As a consequence, no aggregated quantification of potential effects of the supranational measures can be presented in this
action plan.
IV. ACTIONS TAKEN AT THE SUPRA NATIONAL LEVEL
1. AIRCRAFT-RELATED TECHNOLOGY DEVELOPMENT
2. ALTERNATIVE FUELS
3. IMPROVED AIR TRAFFIC MANAGEMENT AND
INRASTRUCTURE USE
4. ECONOMIC/MARKET-BASED MEASURES
5. EU INITIATIVES IN THIRD COUNTRIES
6. SUPPORT TO VOLUNTARY ACTIONS

23
1.1. Aircraft emissions standards (Europe's contribution to the
development of the aeroplane CO2 standard in CAEP)
European Member States fully supported the work achieved in ICAO’s
Committee on Aviation Environmental Protection (CAEP), which resulted
in an agreement on the new aeroplane CO2 Standard at CAEP/10 meeting
in February 2016, applicable to new aeroplane type designs from 2020
and to aeroplane type designs that are already in-production in 2023.
Europe significantly contributed to this task, notably through the
European Aviation Safety Agency (EASA) which co-led the CO2 Task
Group within CAEP’s Working Group 3, and which provided extensive
technical and analytical support.
The assessment of the benefits provided by this measure in terms of
reduction in European emissions is not provided in this action plan. Nonetheless, elements of assessment of the overall contribution of the
CO2 standard towards the global aspirational goals are available in CAEP.
1.2. Research and development
Clean Sky is an EU Joint Technology Initiative (JTI) that aims to develop
and mature breakthrough “clean technologies” for air transport. By
accelerating their deployment, the JTI will contribute to Europe’s strategic
1. AIRCRAFT-RELATED TECHNOLOGY DEVELOPMENT

24
environmental and social priorities, and simultaneously promote
competitiveness and sustainable economic growth.
Joint Technology Initiatives are specific large-scale EU research projects
created by the European Commission within the 7th Framework
Programme (FP7) and continued within the Horizon 2020 Framework
Programme. Set up as a Public Private Partnership between the European
Commission and the European aeronautical industry, Clean Sky pulls
together the research and technology resources of the European Union in
a coherent programme, and contribute significantly to the ’greening’ of
aviation.
The first Clean Sky programme (Clean Sky 1 - 2011-2017) has a budget
of € 1,6 billion, equally shared between the European Commission and
the aeronautics industry. It aims to develop environmental friendly
technologies impacting all flying-segments of commercial aviation. The
objectives are to reduce CO2 aircraft emissions by 20-40%, NOx by
around 60% and noise by up to 10dB compared to year 2000 aircraft.
What has the current JTI achieved so far?
It is estimated that Clean Sky resulted in a reduction of aviation CO2 emissions by more
than 20% with respect to baseline levels (in
2000), which represents an aggregate reduction of 2 to 3 billion tonnes of CO2
over the next 35 years
This was followed up by a second programme (Clean Sky 2 – 2014-
2024) with the objective to reduce aircraft emissions and noise by 20 to
30% with respect to the latest technologies entering into service in 2014.
The current budget for the programme is approximately €4 billion.
The two Interim Evaluations of Clean Sky in 2011 and 2013 acknowledged that the programme is successfully stimulating
developments towards environmental targets. These preliminary assessments confirm the capability of achieving the overall targets at
completion of the programme.
Main remaining areas for RTD efforts under Clean Sky 2 are:
25
Large Passenger Aircraft: demonstration of best technologies to
achieve the environmental goals while fulfilling future market needs and improving the competitiveness of future products.
Regional Aircraft: demonstrating and validating key technologies that will enable a 90-seat class turboprop aircraft to deliver
breakthrough economic and environmental performance and superior passenger experience.
Fast Rotorcraft: demonstrating new rotorcraft concepts (tilt-rotor and FastCraft compound helicopter) technologies to deliver superior
vehicle versatility and performance. Airframe: demonstrating the benefits of advanced and innovative
airframe structures (like a more efficient wing with natural laminar flow, optimised control surfaces, control systems and embedded
systems, highly integrated in metallic and advanced composites structures). In addition, novel engine integration strategies and
investigate innovative fuselage structures will be tested.
Engines: validating advanced and more radical engine architectures.
Systems: demonstrating the advantages of applying new technologies in major areas such as power management, cockpit,
wing, landing gear, to address the needs of future generation aircraft in terms of maturation, demonstration and Innovation.
Small Air Transport: demonstrating the advantages of applying key technologies on small aircraft demonstrators and to revitalise
an important segment of the aeronautics sector that can bring key new mobility solutions.
Eco-Design: coordinating research geared towards high eco-compliance in air vehicles over their product life and heightening
the stewardship in intelligent Re-use, Recycling and advanced services.
In addition, the Technology Evaluator will continue and be upgraded to
assess technological progress routinely and evaluate the performance
potential of Clean Sky 2 technologies at both vehicle and aggregate levels
(airports and air traffic systems). More details on Clean Sky can be found
at the following link:
http://www.cleansky.eu/
26
2.1. European Advanced Biofuels Flightpath
Within the European Union, Directive 2009/28/EC on the promotion of the
use of energy from renewable sources (“the Renewable Energy Directive”
– RED) established mandatory targets to be achieved by 2020 for a 20%
overall share of renewable energy in the EU and a 10% share for
renewable energy in the transport sector. Furthermore, sustainability
criteria for biofuels to be counted towards that target were established.3
In February 2009, the European Commission's Directorate General for
Energy and Transport initiated the SWAFEA (Sustainable Ways for
Alternative Fuels and Energy for Aviation) study to investigate the
feasibility and the impact of the use of alternative fuels in aviation.
The SWAFEA final report was published in July 20114 . It provides a
comprehensive analysis on the prospects for alternative fuels in aviation,
including an integrated analysis of technical feasibility, environmental
sustainability (based on the sustainability criteria of the EU Directive on
3 Directive 2009/28/EC of the European Parliament and of the Council of 23/04/2009 on the promotion of the
use of energy from renewable sources and amending and subsequently repealing Directives 2001/77/EC and
2003/30/EC, Article 17 Sustainability criteria for biofuels and bioliquids, at pp. EU Official Journal L140/36-
L140/38.
4http://www.icao.int/environmental-
protection/GFAAF/Documents/SW_WP9_D.9.1%20Final%20report_released%20July2011.pdf
2. ALTERNATIVE FUELS

27
renewable energy 5 ) and economic aspects. It includes a number of
recommendations on the steps that should be taken to promote the take-
up of sustainable biofuels for aviation in Europe.
In March 2011, the European Commission published a White Paper on
transport6. In the context of an overall goal of achieving a reduction of at
least 60% in greenhouse gas emissions from transport by 2050 with
respect to 1990, the White Paper established a goal of low-carbon
sustainable fuels in aviation reaching 40% by 2050.
Source: ACARE Strategic Research and Innovation Agenda, Volume 2
As a first step towards delivering this goal, in June 2011 the European
Commission, in close coordination with Airbus, leading European airlines
(Lufthansa, Air France/KLM, & British Airways) and key European biofuel
producers (Choren Industries, Neste Oil, Biomass Technology Group and
UOP), launched the European Advanced Biofuels Flight-path. This
industry-wide initiative aims to speed up the commercialisation of aviation
biofuels in Europe, with the objective of achieving the
commercialisation of sustainably produced paraffinic biofuels in
the aviation sector by reaching a 2 million tonnes consumption by
2020.
5 Directive 2009/28/EC of the European Parliament and of the Council of 23 April 2009 on the promotion of the
use of energy from renewable sources and amending and subsequently repealing Directives 2001/77/EC and
2003/30/EC
6 Roadmap to a Single European Transport Area – Towards a competitive and resource efficient transport
system, COM (2011) 144 final
ACARE Roadmap targets regarding share
alternative sustainable fuels:
Aviation to use:
- at minimum 2% sustainable alternative
fuels in 2020;
- at minimum 25% sustainable alternative
fuels in 2035;
- at minimum 40% sustainable alternative
fuels in 2050

28
This initiative is a shared and voluntary commitment by its members to
support and promote the production, storage and distribution of
sustainably produced drop-in biofuels for use in aviation. It also targets
establishing appropriate financial mechanisms to support the construction
of industrial "first of a kind" advanced biofuel production plants. The
Biofuels Flight path is explained in a technical paper, which sets out in
more detail the challenges and required actions7.
More specifically, the initiative focuses on the following:
1. Facilitate the development of standards for drop-in biofuels and their certification for use in commercial aircraft;
2. Work together with the full supply chain to further develop worldwide accepted sustainability certification frameworks
3. Agree on biofuel take-off arrangements over a defined period of time and at a reasonable cost;
4. Promote appropriate public and private actions to ensure the market uptake of paraffinic biofuels by the aviation sector;
5. Establish financing structures to facilitate the realisation of 2nd
Generation biofuel projects;
6. Accelerate targeted research and innovation for advanced biofuel
technologies, and especially algae.
7. Take concrete actions to inform the European citizen of the benefits
of replacing kerosene by certified sustainable biofuels.
The following “Flight Path” provides an overview about the objectives,
tasks, and milestones of the initiative.
Time
horizons
(Base
year -
2011)
Action Aim/Result
Short-
term
(next 0-3
years)
Announcement of action at
International Paris Air
Show
To mobilise all
stakeholders including
Member States.
7 http://ec.europa.eu/energy/technology/initiatives/doc/20110622_biofuels_flight_path_technical_paper.pdf
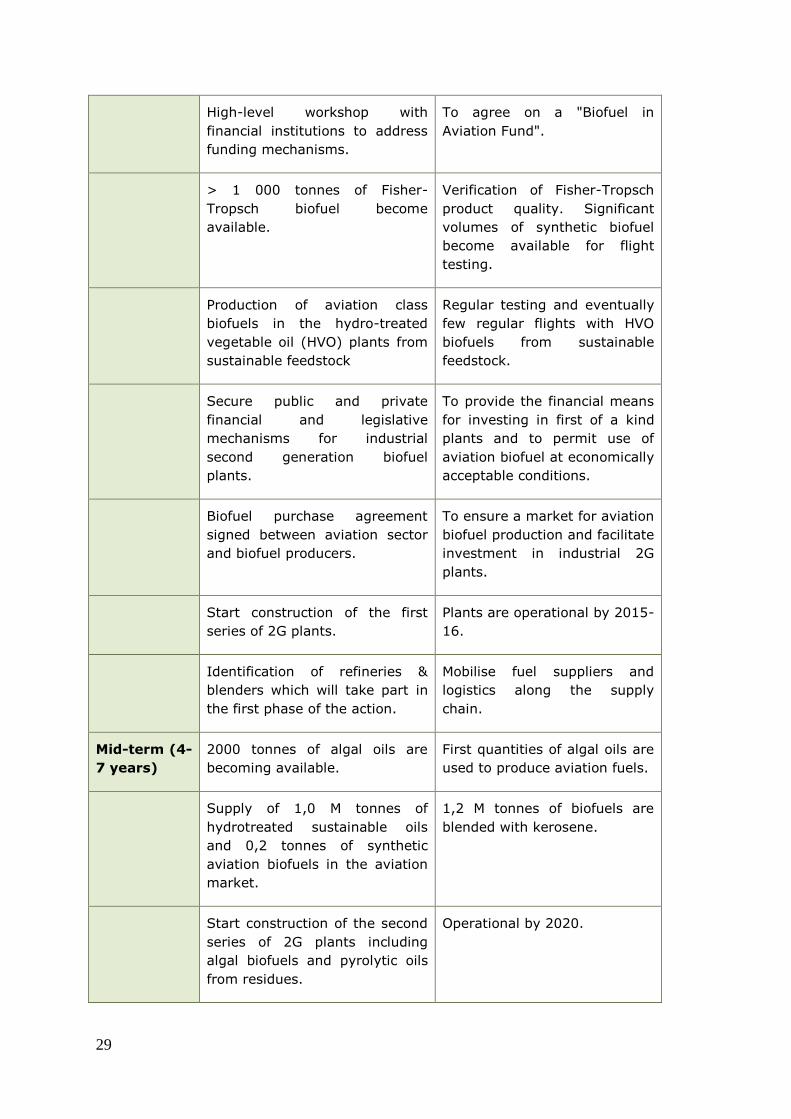
29
High-level workshop with
financial institutions to address
funding mechanisms.
To agree on a "Biofuel in
Aviation Fund".
> 1 000 tonnes of Fisher-
Tropsch biofuel become
available.
Verification of Fisher-Tropsch
product quality. Significant
volumes of synthetic biofuel
become available for flight
testing.
Production of aviation class
biofuels in the hydro-treated
vegetable oil (HVO) plants from
sustainable feedstock
Regular testing and eventually
few regular flights with HVO
biofuels from sustainable
feedstock.
Secure public and private
financial and legislative
mechanisms for industrial
second generation biofuel
plants.
To provide the financial means
for investing in first of a kind
plants and to permit use of
aviation biofuel at economically
acceptable conditions.
Biofuel purchase agreement
signed between aviation sector
and biofuel producers.
To ensure a market for aviation
biofuel production and facilitate
investment in industrial 2G
plants.
Start construction of the first
series of 2G plants.
Plants are operational by 2015-
16.
Identification of refineries &
blenders which will take part in
the first phase of the action.
Mobilise fuel suppliers and
logistics along the supply
chain.
Mid-term (4-
7 years)
2000 tonnes of algal oils are
becoming available.
First quantities of algal oils are
used to produce aviation fuels.
Supply of 1,0 M tonnes of
hydrotreated sustainable oils
and 0,2 tonnes of synthetic
aviation biofuels in the aviation
market.
1,2 M tonnes of biofuels are
blended with kerosene.
Start construction of the second
series of 2G plants including
algal biofuels and pyrolytic oils
from residues.
Operational by 2020.

30
Long-term
(up to 2020)
Supply of an additional 0,8 M
tons of aviation biofuels based
on synthetic biofuels, pyrolytic
oils and algal biofuels.
2,0 M tonnes of biofuels are
blended with kerosene.
Further supply of biofuels for
aviation, biofuels are used in
most EU airports.
Commercialisation of aviation
biofuels is achieved.
When the Flight-path 2020 initiative began in 2010, only one production
pathway was approved for aviation use; no renewable kerosene had
actually been produced except at very small scale, and only a handful of
test and demonstration flights had been conducted using it. Since then,
worldwide technical and operational progress of the industry has been
remarkable. Four different pathways for the production of renewable
kerosene are now approved and several more are expected to be
certified. A significant number of flights using renewable kerosene have
been conducted, most of them revenue flights carrying passengers.
Production has been demonstrated at demonstration and even industrial
scale for some of the pathways. Use of renewable kerosene within an
airport hydrant system was demonstrated in Oslo in 2015.
Performed flights using bio-kerosene
IATA: 2000 flights worldwide using bio-kerosene
blends performed by 22 airlines between June 2011
and December 2015
Lufthansa: 1189 flights Frankfurt-Hamburg using
800 tonnes of bio-kerosene (during 6 months – June/December 2011)
KLM: a series of 200 flights Amsterdam-Paris from September 2011 to December 2014, 26 flights New
York-Amsterdam in 2013, and 20 flights Amsterdam-Aruba in 2014 using bio-kerosene
Production (EU)
Neste (Finland): by batches
- Frankfurt-Hamburg (6 months) 1189 flights operated by
Lufthansa: 800 tonnes of bio-kerosene

31
- Itaka: €10m EU funding (2012-2015): > 1 000 tonnes
Biorefly: €13,7m EU funding: 2000 tonnes per year –
second generation (2015) – BioChemtex (Italy)
BSFJ Swedish Biofuels: €27,8m EU funding (2014-2019)
2.2. data gathered in lab experiments, gathering experiences on related
certification, distribution and on economical aspects. As feedstock, ITAKA
targets European camelina oil and used cooking oil, in order to meet a
minimum of 60% GHG emissions savings compared to the fossil
fuel jetA1.
SOLAR-JET: this project has demonstrated the possibility of producing
jet-fuel from CO2 and water. This was done by coupling a two-step solar
thermochemical cycle based on non-stoichiometric ceria redox reactions
with the Fischer-Tropsch process. This successful demonstration is further
complemented by assessments of the chemical suitability of the solar
kerosene, identification of technological gaps, and determination of the
technological and economical potentials.
Core-JetFuel: €1,2m EU funding (2013-2017) this action evaluates the
research and innovation “landscape” in order to develop and implement a
strategy for sharing information, for coordinating initiatives, projects and
results and to identify needs in research, standardisation,
innovation/deployment, and policy measures at European level.
Bottlenecks of research and innovation will be identified and, where
appropriate, recommendations for the European Commission will be
elaborated with respect to re-orientation and re-definition of priorities in
the funding strategy. The consortium covers the entire alternative fuel
production chain in four domains: Feedstock and sustainability;
conversion technologies and radical concepts; technical compatibility,
certification and deployment; policies, incentives and regulation. CORE-
JetFuel ensures cooperation with other European, international and
national initiatives and with the key stakeholders in the field. The
expected benefits are enhanced knowledge of decision makers, support
for maintaining coherent research policies and the promotion of a better
understanding of future investments in aviation fuel research and
innovation.

32
In 2015, the European Commission launched projects under the
Horizon 2020 research programme with capacities of the order of
several 1000 tonnes per year.
Research and Development projects on alternative fuels in
aviation
In the time frame 2011-2016, 3 projects have been funded by the FP7
Research and Innovation program of the EU.
ITAKA: €10m EU funding (2012-2015) with the aim of assessing the
potential of a specific crop (camelina) for providing jet fuel. The project
aims entail the testing of the whole chain from field to fly, assessing the
potential beyond the
33
3.1. The EU's Single European Sky Initiative and SESAR
SESAR Project
The European Union's Single European Sky (SES) policy aims to
reform Air Traffic Management (ATM) in Europe in order to enhance
its performance in terms of its capacity to manage larger volume
of flights in a safer, more cost-efficient and environmental friendly
manner.
The SES aims at achieving 4 high level performance objectives
(referred to 2005 context):
Triple capacity of ATM systems
Reduce ATM costs by 50%
Increase safety by a factor of 10
Reduce the environmental impact by 10% per
flight
SESAR, the technological pillar of the Single European Sky,
contributes to the Single Sky's performance targets by defining,
developing, validating and deploying innovative technological and
3. IMPROVED AIR TRAFFIC MANAGEMENT AND INFRASTRUCTURE USE
34
operational solutions for managing air traffic in a more efficient
manner.
SESAR contribution to the SES high-level goals set by the
Commission are continuously reviewed by the SESAR JU and kept
up to date in the ATM Master Plan.
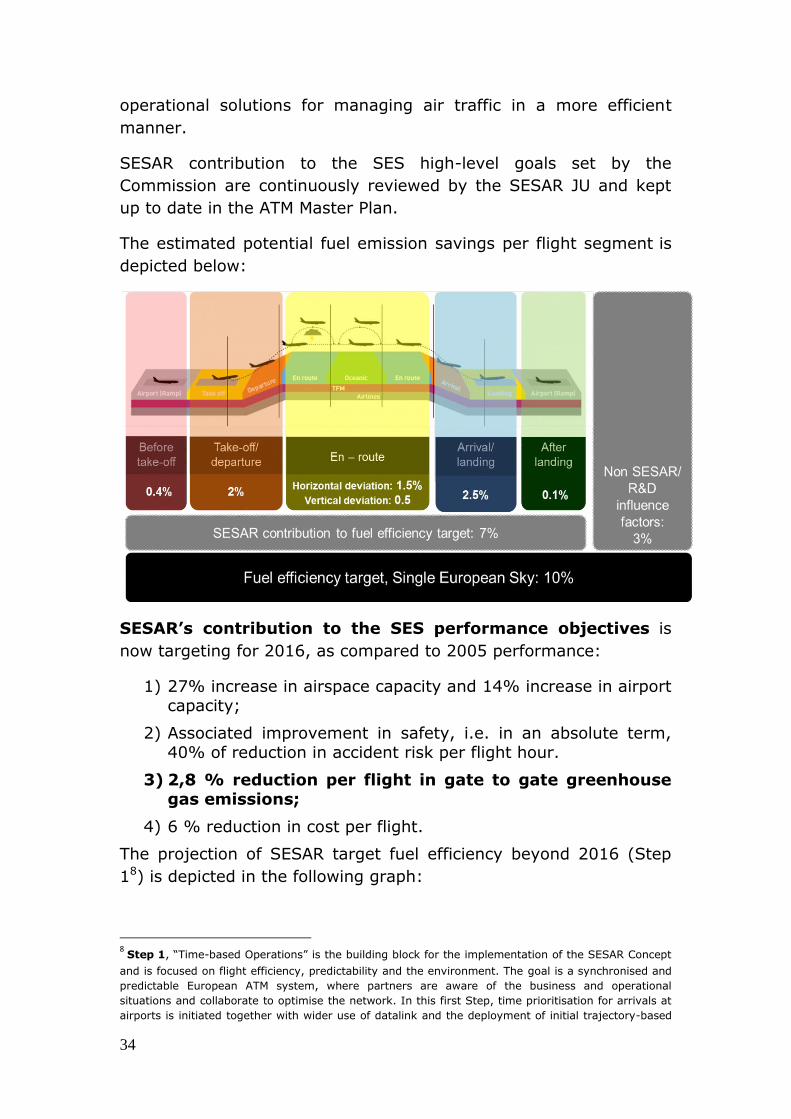
The estimated potential fuel emission savings per flight segment is
depicted below:
SESAR’s contribution to the SES performance objectives is
now targeting for 2016, as compared to 2005 performance:
1) 27% increase in airspace capacity and 14% increase in airport capacity;
2) Associated improvement in safety, i.e. in an absolute term, 40% of reduction in accident risk per flight hour.
3) 2,8 % reduction per flight in gate to gate greenhouse gas emissions;
4) 6 % reduction in cost per flight.
The projection of SESAR target fuel efficiency beyond 2016 (Step
18) is depicted in the following graph:
8 Step 1, “Time-based Operations” is the building block for the implementation of the SESAR Concept
and is focused on flight efficiency, predictability and the environment. The goal is a synchronised and
predictable European ATM system, where partners are aware of the business and operational
situations and collaborate to optimise the network. In this first Step, time prioritisation for arrivals at
airports is initiated together with wider use of datalink and the deployment of initial trajectory-based

35
It is expected that there will be an ongoing performance
contribution from non-R&D initiatives through the Step 1 and Step 2
developments, e.g. from improvements related to FABs and
Network Management: the intermediate allocation to Step 1
development has been set at -4%, with the ultimate capability
enhancement (Step 3) being -10%. 30% of Step 1 target will be
provided through non-R&D improvements (-1,2% out of -4%) and
therefore -2,8% will come from SESAR improvements. Step 2 target
is still under discussion in the range of 4,5% to 6%.
The SESAR concept of operations is defined in the European ATM
Master Plan and translated into SESAR solutions that are developed,
validated and demonstrated by the SESAR Joint Undertaking and
then pushed towards deployment through the SESAR deployment
framework established by the Commission.
operations through the use of airborne trajectories by the ground systems and a controlled time of
arrival to sequence traffic and manage queues.
Step 2, “Trajectory-based Operations” is focused on flight efficiency, predictability, environment and
capacity, which becomes an important target. The goal is a trajectory-based ATM system where
partners optimise “business and mission trajectories” through common 4D trajectory information and
users define priorities in the network. “Trajectory-based Operations” initiates 4D-based
business/mission trajectory management using System Wide Information Management (SWIM) and
air/ground trajectory exchange to enable tactical planning and conflict-free route segments.
Step 3, “Performance-based Operations” will achieve the high performance required to satisfy the
SESAR target concept. The goal is the implementation of a European high-performance, integrated,
network-centric, collaborative and seamless air/ground ATM system. “Performance-based Operations”
is realised through the achievement of SWIM and collaboratively planned network operations with
User Driven Prioritisation Processes (UDPP).

36
SESAR Research Projects (environmental focus)
Within the SESAR R&D activities, environmental aspects have
mainly been addressed under two types of projects: Environmental
research projects which are considered as a transversal activity and
therefore primarily contribute to the validation of the SESAR
solutions and SESAR demonstration projects, which are pre-
implementation activities. Environment aspects, in particular fuel
efficiency, are also a core objective of approximately 80% of
SESAR’s primary projects.
Environmental Research Projects:
Four Environmental research projects are now completed:
Project 16.03.01 dealing with Development of the Environment validation framework (Models and Tools);
Project 16.03.02 dealing with the Development of environmental metrics;
Project 16.03.03 dealing with the Development of a framework to establish interdependencies and trade-off
with other performance areas;
Project 16.03.07 dealing with Future regulatory scenarios
and risks.
In the context of Project 16.03.01 the IMPACT tool was developed
providing SESAR primary projects with the means to conduct fuel
efficiency, aircraft emissions and noise assessments at the same
time, from a web based platform, using the same aircraft
performance assumptions. IMPACT successfully passed the CAEP
MDG V&V process (Modelling and Database Group Verification and
Validation process). Project 16.06.03 has also ensured the
continuous development/maintenance of other tools covering
aircraft GHG assessment (AEM), and local air quality issues (Open-
ALAQS). It should be noted that these tools have been developed
for covering the research and the future deployment phase of
SESAR.
In the context of Project 16.03.02 a set of metrics for assessing
GHG emissions, noise and airport local air quality has been
documented. The metrics identified by Project 16.03.02 and not
subject of specific IPRs will be gradually implemented into IMPACT.

37
Project 16.03.03 has produced a comprehensive analysis on the
issues related to environmental interdependencies and trade-offs.
Project 16.03.07 has conducted a review of current environmental
regulatory measures as applicable to ATM and SESAR deployment,
and another report presenting an analysis of environmental
regulatory and physical risk scenarios in the form of user guidance.
It identifies both those Operation Focus Areas (OFA) and Key
Performance Areas which are most affected by these risks and
those OFAs which can contribute to mitigating them. It also
provides a gap analysis identifying knowledge gaps or uncertainties
which require further monitoring, research or analysis.
The only Environmental Research project that is still on-going in the
current SESAR project is the SESAR Environment support and
coordination project which ensures the coordination and facilitation
of all the Environmental research projects activities while supporting
the SESAR/AIRE/DEMO projects in the application of the material
produced by the research projects. In particular, this project
delivered an Environment Impact Assessment methodology
providing guidance on how to conduct an assessment, which
metrics to use and do and don’ts for each type of validation exercise
with specific emphasis on flight trials.
New environmental research projects will be defined in the scope of
SESAR 2020 work programme to meet the SESAR environmental
targets in accordance to the ATM Master Plan.
Other Research Projects which contribute to SESAR's
environmental target:
A large number of SESAR research concepts and projects from
exploratory research to preindustrial phase can bring environmental
benefits. Full 4D trajectory taking due account of meteorological
conditions, integrated departure, surface and arrival manager,
airport optimised green taxiing trajectories, combined xLS RNAV
operations in particular should bring significant reduction in fuel
consumption. Also to be further investigated the potential for
remote control towers to contribute positively to the aviation
environmental footprint.
Remotely Piloted Aircraft (RPAS) systems integration in control
airspace will be an important area of SESAR 2020 work programme
and although the safety aspects are considered to be the most
38
challenging ones and will therefore mobilise most of research effort,
the environmental aspects of these new operations operating from
and to non-airport locations would also deserve specific attention in
terms of emissions, noise and potentially visual annoyance.
SESAR demonstration projects:
In addition to its core activities, the SESAR JU co-finances projects
where ATM stakeholders work collaboratively to perform integrated
flight trials and demonstrations validating solutions for the reduction
of CO2 emissions for surface, terminal and oceanic operations to
substantially accelerate the pace of change. Since 2009, the SJU
has co-financed a total 33 “green” projects in collaboration with
global partners, under the Atlantic Interoperability Initiative to
Reduce Emissions (AIRE), demonstrating solutions on commercial
flights.
A total of 15767 flight trials were conducted under the AIRE
initiative involving more than 100 stakeholders, demonstrating
savings ranging from 20 to 1000kg fuel per flight (or 63 to 3150 kg
of CO2), and improvements to day-to-day operations. Other 9
demonstration projects took place from 2012 to 2014 focusing also
on environment and during 2015 and 2016 the SESAR JU is co-
financing 15 additional large-scale demonstrations projects more
ambitious in geographic scale and technology. More information can
be found at http://www.sesarju.eu
AIRE – Achieving environmental benefits in real operations
AIRE was designed specifically to improve energy efficiency and
lower engine emissions and aircraft noise in cooperation with the US
FAA, using existing technologies by the European Commission in
2007. SESAR JU has been managing the programme from an
European perspective since 2008. 3 AIRE demonstration campaigns
took place between 2009 and 2014.
A key feature leading to the success of AIRE is that it focused
strongly on operational and procedural techniques rather than new
technologies. AIRE trials have almost entirely used technology
which is already in place, but until the relevant AIRE project came
along, air traffic controllers and other users hadn’t necessarily
thought deeply about how to make the best use operationally of
that technology. In New York and St Maria oceanic airspace lateral
[separation] optimisation is given for any flight that requests it

39
because of the AIRE initiative and the specific good cooperation
between NAV Portugal and FAA.
Specific trials have been carried for the following improvement
areas/solutions as part of the AIRE initiative:
a. Use of GDL/DMAN systems (pre departure sequencing system / Departure Manager) in Amsterdam, Paris and Zurich;
b. Issue of Target-Off Block time (TOBT), calculation of variable taxi out time and issue of Target-Start-up Arrival Time (TSAT)
in Vienna;
c. Continuous Descent Operations (CDOs or CDAs) in
Amsterdam, Brussels, Cologne, Madrid, New York, Paris, Prague, Pointe a Pitre, Toulouse, and Zurich;
d. CDOs in Stockholm, Gothenburg, Riga, La Palma; Budapest
and Palma de Majorca airports using RNP-AR procedures;
e. lateral and vertical flight profile changes in the NAT taking
benefit of the implementation of Automatic Dependent Surveillance-Broadcast (ADS-B) surveillance in the North
Atlantic;
f. Calculation of Estimated Times of Arrival (ETA) allowing time
based operations in Amsterdam;
g. Precision Area Navigation - Global Navigation Satellite System
(PRNAV GNSS) Approaches in Sweden;
h. Free route in Lisbon and Casablanca, over Germany, Belgium,
Luxembourg, Netherlands in the EURO-SAM corridor, France, and Italy;
i. Global information sharing and exchange of actual position and updated meteorological data between the ATM system
and Airline AOCs for the vertical and lateral optimisation of
oceanic flights using a new interface;
The AIRE 1 campaign (2008-2009) has demonstrated, with 1152
trials performed, that significant savings can already be achieved
using existing technology. CO2 savings per flight ranged from
90kg to 1250kg and the accumulated savings during trials
were equivalent to 400 tonnes of CO2. This first set of trials
represented not only substantial improvements for the greening of
air transport, but high motivation and commitment of the teams
involved creating momentum to continue to make progress on
reducing aviation emissions.

40
Domain Location
Trials
performed
CO2
benefit/flight
Surface Paris, France 353 190-1200 kg
Terminal Paris, France 82 100-1250 kg
Stockholm, Sweden 11 450-950 kg
Madrid, Spain 620 250-800 kg
Oceanic Santa Maria, Portugal 48 90-650 kg
Reykjavik, Iceland 48 250-1050 kg
Total 1152
The AIRE 2 campaign (2010-2011) showed a doubling in demand
for projects and a high transition rate from R&D to day-to-day
operations. 18 projects involving 40 airlines, airports, ANSPs and
industry partners were conducted in which surface, terminal,
oceanic and gate-to-gate operations were tackled. 9416 flight trials
took place. Table 2 summarises AIRE 2 projects operational aims
and results.
Table 6: Summary of AIRE 2 projects
Project
name Location Operation Objective
CO2 and
Noise
benefits
per flight
(kg)
Nb of
flights
CDM at
Vienna Airport
Austria CDM notably
pre-departure
sequence
CO2 &
Ground
Operational
efficiency
54 208
Greener
airport
operations
under adverse
conditions
France CDM notably
pre-departure
sequence
CO2 &
Ground
Operational
efficiency
79 1800

41
B3 Belgium CDO in a
complex radar
vectoring
environment
Noise & CO2 160-315;
-2dB
(between
10 to 25
Nm from
touchdown)
3094
DoWo - Down
Wind
Optimisation
France Green STAR &
Green IA in
busy TMA
CO2 158-315 219
REACT-CR Czech
republic
CDO CO2 205-302 204
Flight Trials
for less CO2
emission
during
transition
from en-route
to final
approach
Germany Arrival
vertical profile
optimisation
in high
density traffic
CO2 110-650 362
RETA-CDA2 Spain CDO from
ToD
CO2 250-800 210
DORIS Spain Oceanic:
Flight
optimisation
with ATC
coordination
& Data link
(ACARS,
FANS CPDLC)
CO2 3134 110
ONATAP Portugal Free and
Direct Routes
CO2 526 999
ENGAGE UK Optimisation
of cruise
altitude
and/or Mach
number
CO2 1310 23
RlongSM
(Reduced
longitudinal
UK Optimisation
of cruise
altitude
CO2 441 533
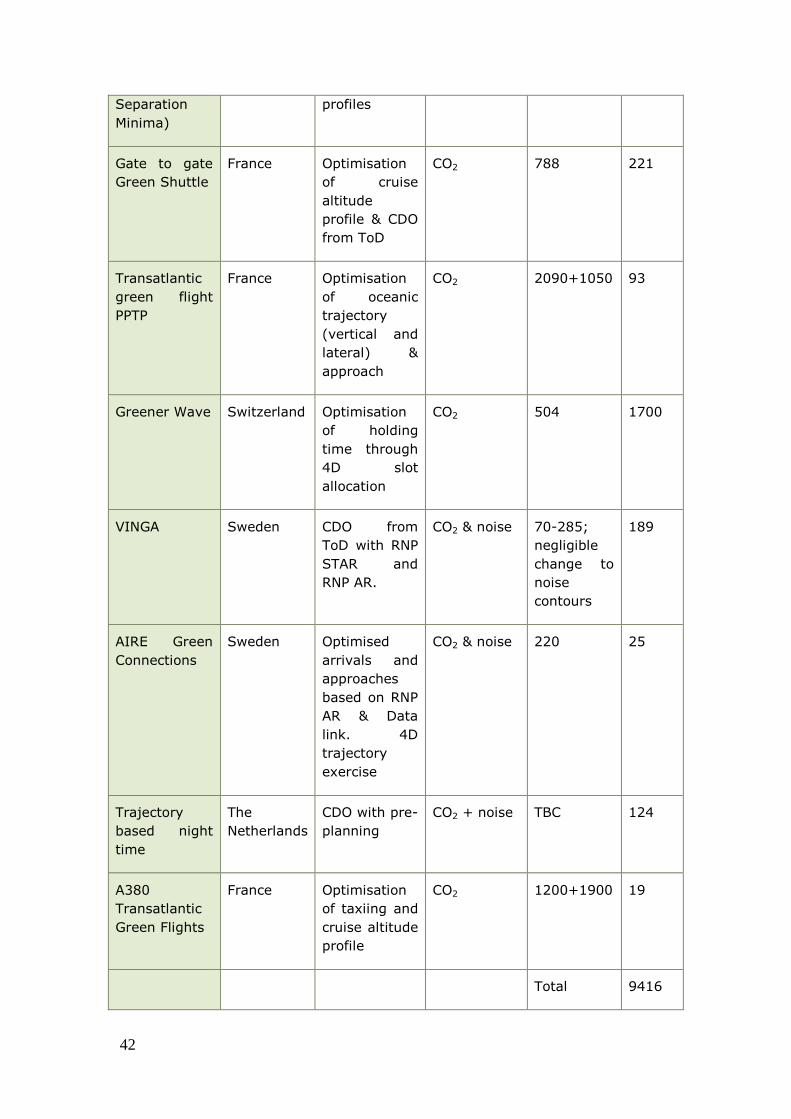
42
Separation
Minima)
profiles
Gate to gate
Green Shuttle
France Optimisation
of cruise
altitude
profile & CDO
from ToD
CO2 788 221
Transatlantic
green flight
PPTP
France Optimisation
of oceanic
trajectory
(vertical and
lateral) &
approach
CO2 2090+1050 93
Greener Wave Switzerland Optimisation
of holding
time through
4D slot
allocation
CO2 504 1700
VINGA Sweden CDO from
ToD with RNP
STAR and
RNP AR.
CO2 & noise 70-285;
negligible
change to
noise
contours
189
AIRE Green
Connections
Sweden Optimised
arrivals and
approaches
based on RNP
AR & Data
link. 4D
trajectory
exercise
CO2 & noise 220 25
Trajectory
based night
time
The
Netherlands
CDO with pre-
planning
CO2 + noise TBC 124
A380
Transatlantic
Green Flights
France Optimisation
of taxiing and
cruise altitude
profile
CO2 1200+1900 19
Total 9416

43
CDOs were demonstrated in busy and complex TMAs although some operational
measures to maintain safety, efficiency and capacity at an acceptable level had to
developed.
The AIRE 3 campaign comprised 9 projects (2012-2014) and 5199 trials
summarised in table 3
Project name Location Operation Number
of Trials
Benefits per
flight
AMBER Riga
International
Airport
turboprop aircraft
to fly tailored
Required
Navigation
Performance –
Authorisation
Required (RNP-AR)
approaches
together with
Continuous Descent
Operations (CDO),
124 230 kg reduction
in CO2 emissions
per approach; A
reduction in noise
impact of 0.6
decibels (dBA)
CANARIAS La Palma and
Lanzarote
airports
CCDs and CDOs 8 Area Navigation-
Standard
Terminal Arrival
Route (RNAV
STAR) and RNP-
AR approaches
34-38 NM and
292-313 kg of
fuel for La Palma
and 14 NM and
100 kg of fuel for
Lanzarote saved.
OPTA-IN Palma de
Mallorca Airport
CDOs 101 Potential
reduction of 7-
12% in fuel burn
and related
CO2 emissions

44
REACT plus Budapest
Airport
CDOs and CCOs 4113 102 kg of fuel
conserved during
each CDO
ENGAGE
Phase II
North Atlantic –
between
Canada &
Europe
Optimisation of
cruise altitude
and/or Mach
number
210 200-400 litres of
fuel savings;
An average of 1-
2% of fuel
conserved
SATISFIED EUR-SAM
Oceanic corridor
Free routing 165 1578 kg in CO2
emissions
SMART Lisbon flight
information
region (FIR),
New York
Oceanic and
Santa Maria FIR
Oceanic: Flight
optimisation
250 3134 kg CO2 per
flight
WE-FREE Paris CDG,
Venice, Verona,
Milano Linate,
Pisa, Bologna,
Torino, Genoa
airports
free routing 128 693 Kg of CO2 for
CDG-Roma
Fiumicino ; 504
kg of CO2 for
CDG Milano
Linate
MAGGO* Santa Maria FIR
and TMA
Several enablers 100* *
*The MAGGO project couldn’t be concluded
SESAR solutions and Common Projects for deployment
SESAR Solutions are operational and technological improvements
that aim to contribute to the modernisation of the European and
global ATM system. These solutions are systematically validated in
real operational environments, which allow demonstrating clear
business benefits for the ATM sector when they are deployed
including the reduction by up to 500 kg of fuel burned per
flight by 2035 which corresponds to up to 1,6 tonnes of CO2
emissions per flight, split across operating environments.
By end of 2015 twenty-five SESAR Solutions were validated
targeting the full range of ATM operational environments including
airports. These solutions are made public on the SESAR JU website

45
in a datapack form including all necessary technical documents to
allow implementation. One such solution is the integration of pre-
departure management within departure management (DMAN) at
Paris Charles de Gaulle, resulting in a 10% reduction of taxi time, 4
000-tonne fuel savings annually and a 10% increase of Calculated
Take Off Time (CTOT) adherence and the Implementation. Another
solution is Time Based Separation at London Heathrow, allowing up
to five more aircraft per hour to land in strong wind conditions and
thus reduces holding times by up to 10 minutes, and fuel
consumption by 10% per flight. By the end of SESAR1 fifty-seven
solutions will be produced.
The deployment of the SESAR solutions which are expected to bring
the most benefits, sufficiently mature and which require a
synchronised deployment is mandated by the Commission through
legally binding instruments called Common Projects.
The first Common Projects identify six ATM functionalities, namely
Extended Arrival Management and Performance Based Navigation in
the High Density Terminal Manoeuvring Areas; Airport Integration
and Throughput; Flexible Airspace Management and Free Route;
Network Collaborative Management; Initial System Wide
Information Management; and Initial Trajectory Information
Sharing. The deployment of those six ATM functionalities should be
made mandatory.
The Extended Arrival Management and Performance Based Navigation in the High Density Terminal Manoeuvring
Areas functionality is expected to improve the precision of approach trajectory as well as facilitate traffic sequencing
at an earlier stage, thus allowing reducing fuel consumption and environmental impact in
descent/arrival phases.
The Airport Integration and Throughput functionality is
expected to improve runway safety and throughput, ensuring benefits in terms of fuel consumption and
delay reduction as well as airport capacity.
The Flexible Airspace Management and Free Route
functionality is expected to enable a more efficient use of airspace, thus providing significant benefits linked to
fuel consumption and delay reduction.
The Network Collaborative Management functionality is expected to improve the quality and the timeliness of the
network information shared by all ATM stakeholders, thus

46
ensuring significant benefits in terms of Air Navigation
Services productivity gains and delay cost savings.
The Initial System Wide Information Management
functionality, consisting of a set of services that are delivered and consumed through an internet protocol-
based network by System Wide Information Management (SWIM) enabled systems, is expected to bring significant
benefits in terms of ANS productivity.
The Initial Trajectory Information Sharing functionality
with enhanced flight data processing performances is expected to improve predictability of aircraft trajectory for
the benefit of airspace users, the network manager and ANS providers, implying less tactical interventions and
improved de-confliction situation. This is expected to have a positive impact on ANS productivity, fuel saving and
delay variability.
SESAR 2020 programme
SESAR next programme (SESAR 2020) includes in addition to
exploratory and industrial research, very large scale demonstrations
which should include more environmental flight demonstrations and
goes one step further demonstrating the environmental benefits of
the new SESAR solutions.

47
4.1. The EU Emissions Trading System
The EU Emissions Trading System (EU ETS) is the cornerstone of the European Union's policy to tackle climate change, and a key tool for reducing greenhouse gas emissions cost-effectively, including from the aviation sector. It operates in 31 countries: the 28 EU Member States, Iceland, Liechtenstein and Norway. The EU ETS is the first and so far the biggest international system capping greenhouse gas emissions; it currently covers half of the EU's CO2 emissions, encompassing those from around 12 000 power stations and industrial plants in 31 countries, and, under its current scope, around 640 commercial and non-commercial aircraft operators that have flown between airports in the European Economic Area (EEA).
The EU ETS began operation in 2005; a series of important changes to the way it works took effect in 2013, strengthening the system. The EU ETS works on the "cap and trade" principle. This means there is a "cap", or limit, on the total amount of certain greenhouse gases that can be emitted by the factories, power plants, other installations and aircraft operators in the system. Within this cap, companies can sell to or buy emission allowances from one another. The limit on allowances available provides certainty that the environmental objective is achieved and gives allowances a market value.
4. ECONOMIC/MARKET-BASED MEASURES
48
By the 30th April each year, companies, including aircraft operators, have to surrender allowances to cover their emissions from the previous calendar year. If a company reduces its emissions, it can keep the spare allowances to cover its future needs or sell them to another company that is short of allowances. The flexibility that trading brings ensures that emissions are cut where it costs least to do so. The number of allowances reduces over time so that total emissions fall.
As regards aviation, legislation to include aviation in the EU ETS was adopted in 2008 by the European Parliament and the Council9. The 2006 proposal to include aviation in the EU ETS was accompanied by detailed impact assessment10. After careful analysis of the different options, it was concluded that this was the most cost-efficient and environmentally effective option for addressing aviation emissions.
In October 2013, the Assembly of the International Civil Aviation Organization (ICAO) decided to develop a global market-based mechanism (MBM) for international aviation emissions. The global MBM design is to be decided at the next ICAO Assembly in 2016, including the mechanisms for the implementation of the scheme from 2020. In order to sustain momentum towards the establishment of the global MBM, the European Parliament and Council have decided to temporarily limit the scope of the aviation activities covered by the EU ETS, to intra-European flights11. The temporary limitation applies for 2013-2016, following on from the April 2013 'stop the clock' Decision12 adopted to promote progress on global action at the 2013 ICAO Assembly.
The legislation requires the European Commission to report to the European Parliament and Council regularly on the progress of ICAO discussions as well as of its efforts to promote the international acceptance of market-based mechanisms among third countries. Following the 2016 ICAO Assembly, the Commission shall report to
9
Directive 2008/101/EC of the European Parliament and of the Council of 19 November 2008
amending Directive 2003/87/EC so as to include aviation activities in the scheme for greenhouse gas
emission allowance trading within the Community, http://eur-lex.europa.eu/legal-
content/EN/TXT/?uri=CELEX:32008L0101
10 http://ec.europa.eu/clima/policies/transport/aviation/documentation_en.htm
11 Regulation (EU) No 421/2014 of the European Parliament and of the Council of 16 April 2014
amending Directive 2003/87/EC establishing a scheme for greenhouse gas emission allowance trading
within the Community, in view of the implementation by 2020 of an international agreement applying
a single global market-based measure to international aviation emissions http://eur-
lex.europa.eu/legal-content/EN/ALL/?uri=CELEX:32014R0421
12 Decision No. 377/2013/EU derogating temporarily from Directive 2003/87/EC establishing a scheme
for greenhouse gas emission allowance trading within the Community, http://eur-
lex.europa.eu/LexUriServ/LexUriServ.do?uri=CELEX:32013D0377:EN:NOT

49
the European Parliament and to the Council on actions to implement an international agreement on a global market-based measure from 2020, that will reduce greenhouse gas emissions from aviation in a non-discriminatory manner. In its report, the Commission shall consider, and, if appropriate, include proposals on the appropriate scope for coverage of aviation within the EU ETS from 2017 onwards.
Between 2013 and 2016, the EU ETS only covers emissions from flights between airports which are both in the EEA. Some flight routes within the EEA are also exempted, notably flights involving outermost regions.
The complete, consistent, transparent and accurate monitoring, reporting and verification of greenhouse gas emissions remain fundamental for the effective operation of the EU ETS. Aviation operators, verifiers and competent authorities have already gained experience with monitoring and reporting during the first aviation trading period; detailed rules are prescribed by Regulations (EU) N°600/201213 and 601/2012.14
The EU legislation establishes exemptions and simplifications to avoid excessive administrative burden for the smallest aircraft operators. Since the EU ETS for aviation took effect in 2012 a de minimis exemption for commercial operators – with either fewer than 243 flights per period for three consecutive four-month periods or flights with total annual emissions lower than 10 000 tonnes CO2 per year –applies, which means that many aircraft operators from developing countries are exempted from the EU ETS. Indeed, over 90 States have no commercial aircraft operators included in the scope of the EU ETS. From 2013 also flights by non-commercial aircraft operators with total annual emissions lower than 1 000 tonnes CO2 per year are excluded from the EU ETS up to 2020. A further administrative simplification applies to small aircraft operators emitting less than 25 000 tonnes of CO2 per year, who can choose to use the small emitter`s tool rather than independent verification of their emissions. In addition, small emitter aircraft operators can use the simplified reporting procedures under the existing legislation.
13
Commission Regulation (EU) No 600/2012 of 21 June 2012 on the verification of greenhouse gas
emission reports and tonne-kilometre reports and the accreditation of verifiers pursuant to Directive
2003/87/EC of the European Parliament and of the Council, http://eur-lex.europa.eu/legal-
content/EN/TXT/PDF/?uri=CELEX:32012R0600&from=EN
14 Regulation (EU) No 601/2012 of the European Parliament and of the Council of 21 June 2012 on the
monitoring and reporting of greenhouse gas emissions pursuant to Directive 2003/87/EC of the
European Parliament and of the Council, http://eur-lex.europa.eu/legal-
content/EN/ALL/?uri=CELEX:32012R0601
50
The EU legislation foresees that, where a third country takes measures to reduce the climate change impact of flights departing from its airports, the EU will consider options available in order to provide for optimal interaction between the EU scheme and that country’s measures. In such a case, flights arriving from the third country could be excluded from the scope of the EU ETS. The EU therefore encourages other countries to adopt measures of their own and is ready to engage in bilateral discussions with any country that has done so. The legislation also makes it clear that if there is agreement on global measures, the EU shall consider whether amendments to the EU legislation regarding aviation under the EU ETS are necessary.
Impact on fuel consumption and/or CO2 emissions
The environmental outcome of an emissions trading system is determined by the emissions cap. Aircraft operators are able to use allowances from outside the aviation sector to cover their emissions. The absolute level of CO2 emissions from the aviation sector itself can exceed the number of allowances allocated to it, as the increase is offset by CO2 emissions reductions in other sectors of the economy covered by the EU ETS.
Over 2013-16, with the inclusion of only intra-European flights in the EU ETS, the total amount of annual allowances to be issued will be around 39 million. Verified CO2 emissions from aviation activities carried out between aerodromes located in the EEA amounted to 56,9 million tonnes of CO2 in 2015. This means that the EU ETS will contribute to achieve more than 17 million tonnes of emission reductions annually, or around 68 million over 2013-2016, partly within the sector (airlines reduce their emissions to avoid paying for additional units) or in other sectors (airlines purchase units from other ETS sectors, which would have to reduce their emissions consistently). While some reductions are likely to be within the aviation sector, encouraged by the EU ETS's economic incentive for limiting emissions or use of aviation biofuels 15 , the majority of reductions are expected to occur in other sectors.
Putting a price on greenhouse gas emissions is important to harness market forces and achieve cost-effective emission reductions. In parallel to providing a carbon price which incentivises emission reductions, the EU ETS also supports the reduction of greenhouse gas emissions through €2,1 billion funding for the deployment of innovative renewables and carbon capture and storage. This funding has been raised from the sale of 300 million emission allowances from the New Entrants' Reserve of the third phase of the EU ETS.
15
The actual amount of CO2 emissions savings from biofuels reported under the EU ETS from 2012 to
2014 was 2 tonnes

51
This includes over €900 million for supporting bioenergy projects, including advanced biofuels16.
In addition, through Member States' use of EU ETS auction revenue in 2013, over €3 billion has been reported by them as being used to address climate change17. The purposes for which revenues from allowances should be used encompass mitigation of greenhouse gas emissions and adaptation to the inevitable impacts of climate change in the EU and third countries, to reduce emissions through low-emission transport, to fund research and development, including in particular in the fields of aeronautics and air transport, to fund contributions to the Global Energy Efficiency and Renewable Energy Fund, and measures to avoid deforestation.
In terms of contribution towards the ICAO global goals, the States implementing the EU ETS will together deliver, in “net” terms, a reduction of at least 5% below 2005 levels of aviation CO2 emissions for the scope that is covered. Other emissions reduction measures taken, either at supra-national level in Europe or by any of the 31 individual states implementing the EU ETS, will also contribute towards the ICAO global goals. Such measures are likely to moderate the anticipated growth in aviation emissions.
Estimated emissions reductions resulting from the EU-ETS
Year Reduction in CO2 emissions
2013-2016 65 million tonnes
The table presents projected benefits of the EU-ETS based on the current scope (intra-European flights).
16
For further information, see http://ec.europa.eu/clima/policies/lowcarbon/ner300/index_en.htm
17 For further information, see http://ec.europa.eu/clima/news/articles/news_2014102801_en.htm

52
5.1. Multilateral projects
At the end of 2013 the European Commission launched a project of a total budget of €6,5 million under the name "Capacity building for CO2 mitigation from international aviation". The 42-month project, implemented by the ICAO, boosts less developed countries’ ability to track, manage and reduce their aviation emissions. In line with the call from the 2013 ICAO Assembly, beneficiary countries will submit meaningful State action plans for reducing aviation emissions, and also receive assistance for establishing emissions inventories and piloting new ways of reducing fuel consumption. Through the wide range of activities in these countries, the project contributes to international, regional and national efforts to address growing emissions from international aviation. The beneficiary countries are the following:
Africa: Burkina Faso, Kenya and Economic Community of Central African States (ECCAS) Member States: Angola, Burundi, Cameroon, Central African Republic, Chad, Republic of Congo, Democratic Republic of Congo, Equatorial Guinea, Gabon, Sao Tome and Principe.
Caribbean: Dominican Republic and Trinidad and Tobago.
5. EU INITIATIVES IN THIRD COUNTRIES

53
6. SUPPORT TO VOLUNTARY ACTIONS
6.1. ACI Airport Carbon Accreditation
Airport Carbon Accreditation is a certification programme for carbon
management at airports, based on carbon mapping and management
standard specifically designed for the airport industry. It was launched in
2009 by ACI EUROPE, the trade association for European airports.
The underlying aim of the programme is to encourage and enable airports
to implement best practice carbon and energy management processes and
to gain public recognition of their achievements. It requires airports to
measure their CO2 emissions in accordance with the World Resources
Institute and World Business Council for Sustainable Development GHG
Protocol and to get their emissions inventory assured by an independent
third party.
This industry-driven initiative was officially endorsed by EUROCONTROL
and the European Civil Aviation Conference (ECAC). It is also officially
supported by the United Nations Environmental Programme (UNEP). The
programme is overseen by an independent Advisory Board.
In 2014 the programme reached global status with the extension of the
programme to the ACI North American and Latin American & Caribbean

54
regions, participation has increased to 125 airports, in over 40 countries
across the world – an increase of 23% from the previous year, growing
from 17 airports in Year 1 (2009-2010). These airports welcome 1,7 billion
passengers a year, or 27,5% of the global air passenger traffic.
Airport Carbon Accreditation is a four-step programme, from carbon
mapping to carbon neutrality. The four steps of certification are: Level 1
“Mapping”, Level 2 “Reduction”, Level 3 “Optimisation”, and Level 3+
“Carbon Neutrality”.
Levels of certification (ACA Annual Report 2014-2015)
One of its essential requirements is the verification by external and
independent auditors of the data provided by airports. Aggregated data
are included in the Airport Carbon Accreditation Annual Report thus
ensuring transparent and accurate carbon reporting. At level 2 of the
programme and above (Reduction, Optimisation and Carbon Neutrality),
airport operators are required to demonstrate CO2 reduction associated
with the activities they control.
In Europe, participation in the programme has increased from 17 airports
to 92 in 2015, an increase of 75 airports or 441% since May 2010. 92
airports mapped their carbon footprints, 71 of them actively reduced their
CO2 emissions, 36 reduced their CO2 emissions and engaged others to do
so, and 20 became carbon neutral. European airports participating in the
programme now represent 63,9% of European air passenger traffic.
Anticipated benefits:
The Administrator of the programme has been collecting CO2 data from
participating airports over the past five years. This has allowed the

55
absolute CO2 reduction from the participation in the programme to be
quantified.
Emissions reduction highlights
2009-
2010
2010-
2011
2011-
2012
2012-
2013
2013-
2014
2014-
2015
Total aggregate
scope 1 & 2
reduction (tCO2)
51 657 54 565 48 676 140 009 129 937 168 779
Total aggregate
scope 3
reduction (tCO2)
359 733 675 124 365 528 30 155 223 905 550 884
Emissions performance summary
Variable 2013 -2014 2014-2015
Emissions Number
of
airports
Emissions Number
of
airports
Aggregate carbon
footprint for ‘year 0’18
for
emissions under airports’
direct control (all airports)
2
2 044 683
tonnes CO2
85
2 089 358
tonnes CO2
92
Carbon footprint per
passenger
2,01
kg CO2
1,89
kg CO2
Aggregate reduction in
emissions from sources
under airports’ direct
control (Level 2 and
above)19
87 449
tonnes CO2
56 139 022
tonnes CO2
71
18
‘Year 0’ refers to the 12 month period for which an individual airport’s carbon footprint refers to, which
according to the Airport Carbon Accreditation requirements must have been within 12 months of the
application date.
19 This figure includes increases in emissions at airports that have used a relative emissions benchmark in order
to demonstrate a reduction.

56
Carbon footprint reduction
per passenger
0,11
kg CO2
0,15
kg CO2
Total carbon footprint for
‘year 0’ for emissions
sources which an airport
may guide or influence
(level 3 and above)20
12 777 994
tonnes CO2
31 14 037 537
tonnes CO2
36
Aggregate reductions
from emissions sources
which an airport may
guide or influence
223 905
tonnes CO2
550 884
tonnes CO2
Total emissions offset
(Level 3+)
181 496
tonnes CO2
16 294 385
tonnes CO2
20
Its main immediate environmental co-benefit is the improvement of local
air quality.
Costs for design, development and implementation of Airport Carbon
Accreditation have been borne by ACI EUROPE. Airport Carbon
Accreditation is a non-for-profit initiative, with participation fees set at a
level aimed at allowing for the recovery of the aforementioned costs.
The scope of Airport Carbon Accreditation, i.e. emissions that an airport
operator can control, guide and influence, implies that aircraft emissions
in the LTO cycle are also covered. Thus, airlines can benefit from the gains
made by more efficient airport operations to see a decrease in their
emissions during the LTO cycle. This is coherent with the objectives
pursued with the inclusion of aviation in the EU ETS as of 1 January 2012
(Directive 2008/101/EC) and can support the efforts of airlines to reduce
these emissions.
20
These emissions sources are those detailed in the guidance document, plus any other sources that an
airport may wish to include.

57
The International Civil Aviation Organization (ICAO) recognizes the critical importance of providing continuous leadership to international civil
aviation in limiting or reducing its CO2 emissions that contribute to global
climate changes. ICAO is taking decisive action in the assessment of international
aviation sector’s CO2 emissions. Resolution A37-19: „Consolidated statement of continuing ICAO policies and practices related to
environmental protection – Climate change was adopted on 11-13.07.2011.
To pursue the Resolution, ICAO is requesting that each of its member States develop and submit an Action Plan in order to track,
consolidate and report on the efforts of all aviation stakeholders in reducing their carbon footprint. The ICAO Resolution is focused on the
reduction of aircraft fuel-burn. However, it is recommended that each State may involve a range of
aviation players, including airports. According to forecasts, transport of passengers by air will exceed the 2008
level as early as 2011, while the rest of the transport modes will be able
to catch up not earlier than 2013. The higher growth rates of air transport will be preserved and by 2020 (measured by pass-km) it will increase by
about 35 – 36%, compared to 2008. As a result of this increase, the relative share of air transport in overall passenger transport volumes will
increase from 21% in 2008 to 30% in 2020. The expectations, as discussed herein, of a higher growth rate or air
transport are relevant not only for Bulgarian air carriers but also for all European airline companies. These forecasts, combined with the already
V. NATIONAL ACTIONS IN BULGARIA

58
mentioned expectations of world financial institutions for a higher
economic growth rate after 2015, which will have a positive impact on tourism, provide a sufficient ground for forecasts that the passenger flows
through Bulgaria’s international airports will substantially increase.
1. ICAO ACTION PLAN BUDDY PROGRAMME
Since April 2016 Bulgaria is participating in the ICAO Action Plan Buddy Programme. ICAO Action Plan Buddy Programme is the ICAO
programme, aligned with ICAO Resolution A38-18 Para 13, inviting States that have already submitted their action plan to ICAO to share information
contained in their plans and build partnerships with other Member States in order to support those States that have not prepared their action plans.
ICAO has developed a draft agreement of cooperation aiming to establish a model framework by which ICAO Member States can help
other Member State(s) to prepare and submit their States’ Action Plan. It
aims to facilitate the development of international cooperation among ICAO Member States, in which one State – the Buddy (Bulgaria) that has
already submitted its States’ Action Plan, assists another State (The former Yugoslav Republic of Macedonia).
List of Action Plan Buddies:
Partner State
providing support
Partner State
Status of Action Plan
Under development
Submitted to ICAO
Posted on the ICAO website
Bulgaria The former Yugoslav
Republic of Macedonia
X
Spain Ukraine X
Basket of Measures Reducing Aviation Emissions of Air carriers
The measures implemented in the following areas of operator`s activity are considered to be substantial for ensuring the reduction or limitation of
CO2 emission:
Participation in emission trading scheme.
Improvement of equipment of the airplane.
Increasing of capabilities of the aircraft for the carriage of passengers and cargo.

59
Maintenance planning – in order to limit ferry flights (non –
commercial flights) due to technical reasons Implication of components directly related to fuel consumption (such
as fuel pumps, fuel filters, etc.
Strict observance of manufacturers’ specifications. Thorough input inspection.
Quality audits of external component suppliers. Quality audits of fuel suppliers
Aircraft regular external washing – in order to decrease air resistance during flight.
Flight planning and performance Strict and accurate observance Fuel policy
Flight Performance using optimum altitude and speed when possible, and optimum flight path, for ensuring economical fuel consumption.
Fuel inspection prior refueling: Supporting documentation:
Visual check for fuel purity Use of airport infrastructure.
Basket of Measures Reducing Aviation Emissions at Airports The ICAO Resolution is focused on the reduction of aircraft fuel-burn.
However, it is recommended that each State may involve a range of aviation players, including airports. The objective of this program is to
encourage as many European airports as possible to engage in comprehensive CO2 management and achieve carbon-neutral operation
as: operation of aircraft on the ground (engine runups and test runs,
operation of Auxiliary Power Units), operation of buildings and ground handling vehicles,
supply of aircrafts with ground power supply, travel to and from the airport by passengers and employees, and
business trips. To help airport members “Airports Council International Europe” (ACI
Europe) has compiled a briefing document with information and suggested
areas that States might chose to include in their AIRPORTS ACTION.
Plans on aviation CO2 emissions. We support the expansion of our Airports with the aspiration to maintain
environmental standards.
We invest in environmental impact reduction measures.
Varna and Burgas Airports traffic forecast was prepared in 2011 by Lufthansa Consulting for the period 2011-2035. The average growth rates
of passenger traffic are presently forecasted with approximately 3.7-4.0% per annum.

60
Comparing the forecasted Air Traffic Movements (ATM) will show the same
tendency as the passenger volumes. In the long term view the ATM’s will increase with an average growth rate of 3.5 % between 2011 and 2035.
ACI EUROPE has made a commitment through its resolution on climate change agreed on 18th June 2008 to assist member airports to assess and
reduce their carbon footprint.
Reducing Aviation Emissions at Airports
1. Improving Air Trafic Management: On our two airports there is a tradition to hold working meetings
with the airlines and Air Traffic Control to discuss ways to optimize traffic in nearby space, without safety compromising. Working with
stakeholders to improve Landing and Take-off (LTO) efficiencies with applicable procedures. Improve the efficiency of air navigation lead
to fuel efficient and to reduce aviation emissions over regions of our airports. More efficient ATM planing in airfield operations at airport.
More efficient ATM planing in airpron operations (departure,
approach to stands and arrivals). More efficient use and planing of airport capacities.
Use of best practices in Air Trafic Mamagement from other airports. We are also working continuously on reducing taxiing and waiting
times for aircraft. The procedure involves better coordination of the ground-based processes.
Infrastructure efficiency:
Decision for improving of the aircraft taxiways, terminal and runway configuration to optimize the taxiing distance and capacity, and to
reduce ground and terminal area congestion. Projects for that is a part of “AIRPORTS MASTER PLAN 2012-2031” of Varna and Burgas
Airports. Arrival management that provides stands for aircraft, as far as
possible, immediately after landing.
Departure management including holding aircraft at the stand (with APU switched off) until departure slot is ready. Such practices can
also encompass slot management, virtual queuing, delayed pushback and Collaborative Making.
2. Operational efficiency:
Infrastructure efficiency: Decision for improving of the aircraft taxiways, terminal and runway
configuration to optimize the taxiing distance and capacity, and to reduce ground and terminal area congestion. Projects for that is
parts of “AIRPORTS MASTER PLAN 2012-2031” of Varna and Burgas Airports.
Arrival management that provides stands for aircraft, as far as possible, immediately after landing.

61
Departure management including holding aircraft at the stand (with
APU switched off) until departure slot is ready. Such practices can also encompass slot management, virtual queuing, delayed
pushback and Collaborative Making.
APU during the stay of the aircraft on the apron. Future implementation of fixed electrical ground power (FEGP)
supply to aircraft near terminal gates, allowing auxiliary power unit (APU) switch-off. This measure shall be discussed in the next update
of the Master plans of both airports in 2016. Switching off the APUs could significantly reduce emissions of CO2 and other air pollutants.
The Ground Support Equipment (GSE) fleet is gradually being converted to run on energy-efficient power units. Already 8 % of the
GSE vehicles operating at both airports run on electricity and this includes a large number of energy-intensive special vehicles. This
process will continue. Modernization of fleet vehicles and use of alternative fuels for buses,
cars and other air and land side vehicles, including compressed natural gas (CNG), hydrogen, electric, compressed air and hybrid
vehicles.
Providing the infrastructure for alternative fuels for airport and tenant vehicles.
Implementation of a no-idling policy. Driver education on fuel conserving driving techniques.
The apron transport flows will analyze with a view to potential optimization.
New methods for runway deicing are being introduced at both airports in 2012 as part of the environmental program and waste
management program. New measures and systems are being developed for the roll-out of a future-oriented waste strategy geared
to conserving resources. This system will avoid large amounts of waste over the long term and improve the recycling of valuable
materials. We are also implementing measures for separating and treating
deicing agents at our airports in Varna and Burgas, Bulgaria. In
addition to setting up special deicing areas and development of technical systems, building modifications are also being
implemented, such as the construction of a runway drainage system in Varna.
Enhancing weather forecasting services
Airport Collaborative Decision Making (A-CDM) is the foundation stone of
the Single European Sky ATM Research (SESAR) project and a key enabler to the realisation of the ATM Master plan bringing cost, capacity, safety
and environmental benefits to airline customers both during normal operations and especially through times of adverse meteorological
conditions. It all depends upon partnership –the partnership involves airport operators, aircraft operators, ground handlers, air traffic control

62
and meteorological services working together more efficiently and
transparently and sharing information in real time. Information sharing is the first and most essential element of A-CDM as it
creates the foundation by creating a common situational awareness. This
dramatically reduces the controller workload, thereby allowing for greater operational efficiency. Furthermore, the reduction of taxi and flight times
based on sharing of meteorological information will lead to a significant decrease in emissions and noise. This environmental benefit comes
alongside the operational efficiency gains, bringing added-value even for the airport’s surrounding communities.
In view of A-CDM identifying and developing of national A-CDM platform based on a good forecasting of weather conditions for the main airports in
Bulgaria will bring benefits in enhanced predictability, reduced delay, more flexibility, better use of resources and significant environmental benefits.
Finally the improved information sharing and flight predictability in connection with enhancing weather forecasting services will be beneficial
for the whole air transport network.
Introducing Collaborative Environmental Management (CEM) in
Bulgaria.
This is one of the key SESAR enablers and although primarily focused on the airport (local) environmental partnership, will also have the climate
change (CO2) measures within its scope. This commonly agreed on European level strategic management process will allow us to prioritise
and meet environmental challenges caused by the environmental impacts of aircraft operations, involving the key stakeholders.
Year Fuel Burn (billions of
litres)
RTK (in thousands)
Fuel (in litres) per RTK (efficiency)
2010 0,46 110 259.60 4,1267
Future year
Projected Fuel (in litres) per RTK (efficiency) Identical to Efficiency in the Base Year
2011 4,13
2012 4,13
2013 4,13
2014 4,13
2015 4,13
2016 4,13
2017 4,13
2018 4,13
2019 4,13
2020 4,13
63
Forecasted traffic growth rate (RTK)
3,5%
Future
year
Projected RTK (‘000)
2011 114 118.69
2012 118 112.79
2013 122 246.79
2014 126 525.43
2015 130 953.82
2016 135 537.20
2017 140 281.00
2018 145 190.84
2019 150 272.52
2020 155 532.06
CONCLUSION
According to the strategic vision for the development of the country, as
defined in the National Strategic Reference Framework, Bulgaria is facing the challenge to achieve a sustainable genuine convergence through high
economic growth rates based on investments, a substantial increase of productivity and improvement of competitiveness. In order to negotiate
the risks, which may compromise the efforts to maintain a high and stable economic growth, the economic policy must be focused on improving the
quality of the physical infrastructure (by enhancing connectivity and accessibility), on investing in human capital and raising the standards of
Future
Year
Projected Fuel Burn (in billions of litres)
Calculated Automatically
2011 470 937.58
2012 487 420.39
2013 504 480.10
2014 522 136.91
2015 540 411.70
2016 559 326.11
2017 578 902.52
2018 599 164.11
2019 620 134.86
2020 641 839.58
64
education and healthcare in order to maintain the quality of the work
force, and remove the inefficiency in the performance of the administration and the market in order to provide incentives for
entrepreneurship and investments and support a balanced territorial
development.Achieving this vision implies that Bulgaria must achieve two strategic objectives in the mediumterm:
To achieve and maintain a high economic growth rate by a dynamic economy in compliance with the principles of sustainable
development To improve the quality of the human factor and reach employment,
income and social integration levels, which would assure a high living standard.
Modernising the transport system is a prerequisite for its successful integration within the European transport system.
Bulgaria’s transport sector must support the economic and social
development of the country by:
Providing efficient (with maximum benefits), effective and sustainable (with
minimum external influences) transport Supporting a balanced regional development
Assisting in Bulgaria’s integration in the European structures, taking into account its crossroad location and its transit
potential.
The following vision for the development of the transport sector has been derived on the basis of the principles mentioned above:
By 2020, Bulgaria should have a modern, safe and reliable
transport system in order to satisfy the demand for high-quality transport services and to provide better opportunities for its
citizens and business.
65
ACARE – Advisory Council for Research and Innovation in Europe
ACARS – Aircraft Communications Addressing and Reporting System
ACA – Airport Carbon Accreditation
ACC – Area Control Centres
ACCAPEG – Aviation and Climate Change Action Plan Expert Group
ACI – Airports Council International
EAER – European Aviation Environmental Report
AEM – Advanced Emission Model
AIRE – The Atlantic Interoperability Initiative to Reduce Emissions
ANS – Air Navigation Service
ATC – Air Traffic Control
ATM – Air Traffic Management
BAU – Business as Usual
CAEP – Committee on Aviation Environmental Protection
CCD – Continuous Climb Departures
CDA – Continuous Descent Approach
CDM - Collaborative Decision Making
CDA – Continuous Descent Approach
CDO - Continuous Descent Operations
CPDLC – Controller-Pilot Data Link Communications
EASA – European Aviation Safety Agency
EC – European Commission
ECAC – European Civil Aviation Conference
EEA – European Economic Area
EFTA – European Free Trade Association
EU – European Union
EU ETS – the EU Emissions Trading System
FAB – Functional Airspace Block
FANS – Future Air Navigation System
FP7 - 7th Framework Programme
GHG – Greenhouse Gas
GMBM – Global Market-based Measure
Green STAR – Standard Arrival
Green IA – Initial Approach
LIST OF ABBREVIATIONS

66
HVO – Hydro-treated Vegetable Oil
ICAO – International Civil Aviation Organization
IFR – Instrumental Flight Rules
IPCC – Intergovernmental Panel on Climate Change
IPR – Intellectual Property Right
JTI – Joint Technology Initiative
LTO cycle – Landing/Take-off Cycle
MBM – Market-based Measure
OFA - Operational Focus Area
RED – Renewable Energy Directive
RNAV – Area Navigation
RNP AR – Required Navigation Performance Authorization Required
RNP STAR – Required Navigation Performance Standard Arrival
RPAS – Remotely Piloted Aircraft
RPK – Revenue Passenger Kilometre
RTD – Research and Innovation
SES – Single European Sky
SESAR – Single European Sky ATM Research
SESAR JU – Single European Sky ATM Research Joint Undertaking
SESAR R&D – SESAR Research and Development
SWAFEA – Sustainable Ways for Alternative Fuels and Energy for Aviation
SWIM – System Wide Information Management
TMA - Terminal Manoeuvring Area
ToD – Top of Descent
UNEP – United Nations Environmental Programme
— END —