Embed Size (px)
Citation preview

ActionFOR AIRThe NSW
Government’s
25-Year
Air Quality
Management Plan

ActionFOR AIRThe NSW
Government’s
25-Year
Air Quality
Management Plan

For technical information about this plan, contact:
Air Policy SectionEnvironmental PolicyEnvironment Protection AuthorityCivic TowerCorner of Rickard Road and Jacobs Street (Locked Bag 1502)Bankstown NSW 2200
Phone: (02) 9795 5200Fax: (02) 9793 8913
Published for the NSW Government by:
Environment Protection Authority799 Pacific HighwayPO Box 1135Chatswood NSW 2057
Phone: 131 555 (Publications and information requests)(02) 9795 5000 (main switchboard)
Fax: (02) 9325 5678
http://www.epa.nsw.gov.au
ISBN 0 7313 0160 9EPA 98/16February 1998Printed on recycled paper
Action for Air
2

Foreword
The New South Wales Government has made a significant commitment to develop and implement acomprehensive long-term plan to protect and improve air quality across NSW. We have also recognised thechallenge of putting in place Action for Air —a 25 year plan which tackles the widest range of emissionsspecifically affecting the Greater Metropolitan Region of Sydney, the Illawarra and the Lower Hunter.
The Government undertook extensive public consultation through a series of Green Papers ondeveloping the Air Quality Management Plan (AQMP) and the Smog Action Plan (SAP) during 1996-97.We received valuable information and input from all sectors of the community: business and industry,community groups, and local and State Government. This has led us to a more integrated approach bybringing forward Action for Air to tackle both photochemical smog and brown haze in one plan. It is a planthat commits all of government and also requires that we each contribute individually.
Everyone in NSW has a right to breathe clean air and to be protected from the adverse effects of airpollution. However, protecting air quality is a complex matter for which there is no one simple solution.Action for Air tackles our most significant and growing air quality issue: the increasing use of motor vehiclesin the urban area. Our plan, for the first time, sets targets for reducing the use of vehicles and supportsthese targets with requirements for long-term transport and freight movement plans, which will give usmore and better alternatives to increasing the use of vehicles.
The Government has also made a significant contribution to better public transport, which will improveboth air quality and the growing congestion on our roads. At the same time, Action for Air continues to pushfor cleaner cars, trucks and buses. The plan also promotes a continued emphasis on cleaner business andimproved management of pollution sources within our homes and from outdoor activities such as openburning.
Most importantly, we have set tough air quality goals within a framework that is publicly accountableand provides improved access to information. With regular reporting on the status of air quality, and on theeffectiveness of our long-term strategies, we will be able to adapt our programs as we gain new informationand new technologies over the next 25 years.
Our plan, Action for Air, will make a difference as long as we all contribute to it. We all need to do ourfair share to ensure that we have clean air in NSW well into the future.
3
BOB CARR
Premier of NSW

Introduction
The air we breathe 5
Getting the priorities right 5
Achieving air quality goals 5
How will the community be involved? 7
1. The issues in brief 9
What’s the problem? 9
What are our air quality goals? 13
2. What is the Action Plan? 17
Overview 17
Summary of objectives 17
3. The Action Plan in detail 20
Objective 1. Integrate air quality 20goals and urban transport planning
Objective 2. Provide more 24and better transport choices
Objective 3. Make cars, trucks 29and buses cleaner
Objective 4. Promote cleaner business 32
Objective 5. Promote cleaner homes 36
Objective 6. Manage the impact 38of open burning
Objective 7. Monitor, report on 39and review air quality
4. How were the strategies 41
selected?Modelling 41
AQMP package 41
Economic impact analysis 41
5. From global to local – 43
achievements to dateGlobal issues 43
Regional issues 43
Local issues 44
Integrated programs 46
Appendixes1. Community feedback on air quality 46
2. Local councils committed to a 47local air quality management plan
3. Cost effectiveness analysis 48
Contents
Action for Air
4
The air we breathe
We have reached a critical point for air quality inNSW. The good news is that the air we breathe issubstantially cleaner than it was 15 years ago,mostly through controls on industry, on motorvehicles and the fuels they use, and on backyardburning. But there is another side to the story.
Unless we shift air quality management into ahigher gear, we are in danger of losing the gains wehave already made; or, worse still, experiencinghigher pollution levels than in the past.
As the population of Sydney grows, the numberof cars and trucks on the road also increases. Thenumber of trips we take and the length of thosetrips are rising too, as we use our vehicles moreintensively than ever before. This seeminglyunstoppable growth of vehicle use not only congestsour roads: it is the most significant source of manyof the pollutants that damage our air quality.
In the past, air quality management in NSW hasfocused mostly on the technological side of theequation—making vehicles and industrialtechnology cleaner. We will certainly need tocontinue to make gains through cleaner technologyand cleaner production. But to protect our airquality well into the future, we must also approachthe problem from another side of the equation: howwe use our motor vehicles.
Changing behaviours can often be harder thanchanging technology. The whole community willneed to make positive choices about improving airquality to protect both our health and our economy.
Getting the priorities right
Recognising the need for a comprehensive plan tomake sure the air we breathe is clean, the NSWGovernment has combined scientific, health, urbanplanning and economic expertise with feedbackfrom the community, industry and government toproduce this plan. It is an ambitious initiative,seeking for the first time to develop a plan for airquality for the long-term, over a 25-year period.Everybody is being asked to take responsibility—
government, the community and industry—becauseintegrated solutions are the ones that will work inthe long-term.
Setting an air quality plan with goals, objectivesand actions over 25 years is very ambitious but it isnecessary. It is not a coincidence that NSW is nowrealising air quality gains from air pollutionprograms that were put in place in the mid 1980s.Action for Air will provide us with the next set ofgains; and be adapted as new information comes tolight and the technological landscape shifts. Itsrelease marks a crucial phase of the Government’stotal air quality management strategy, concentratingon the Greater Metropolitan Area—Sydney,Newcastle and Wollongong—which contains about70% of the State’s population.
The plan supports the Government’s overall airquality agenda, which includes local, regional andglobal issues. Action for Air focuses on regional airpollution—a comprehensive attack onphotochemical smog and fine particle pollution.The regional approach taken here draws stronglinks to local and global issues, especially theGovernment’s high priority campaigns to reducegreenhouse gas emissions and promote sustainableenergy sources.
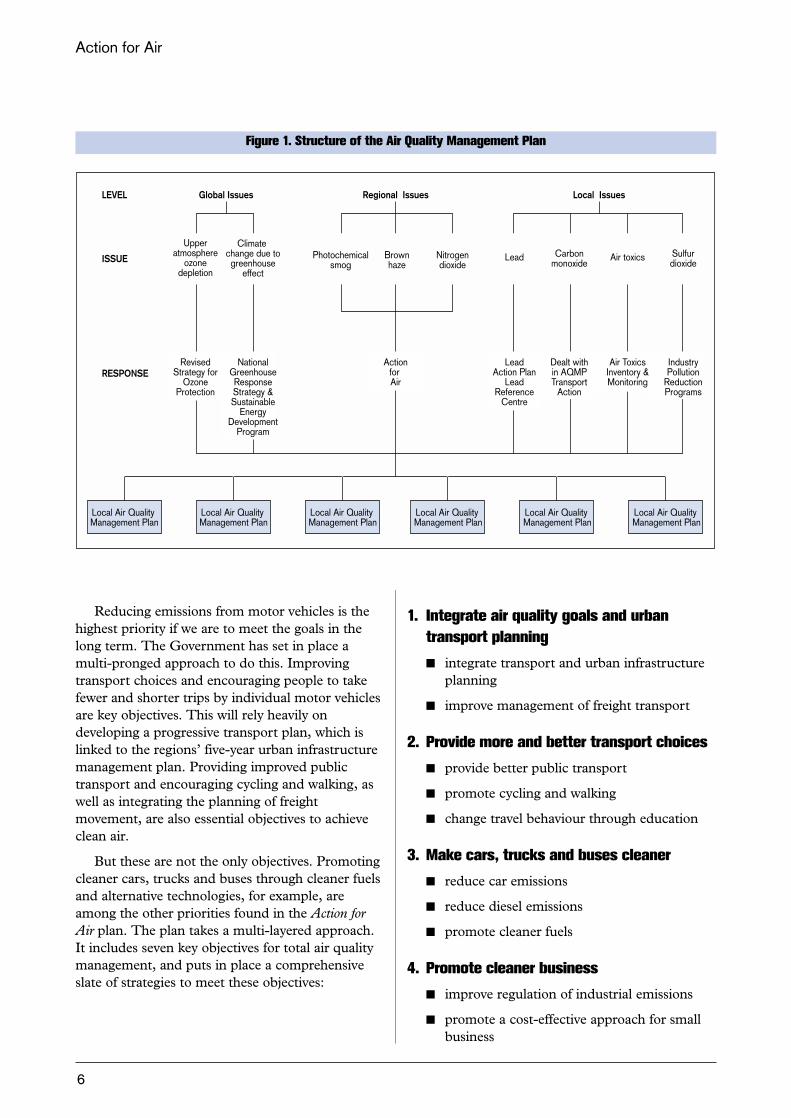
The plan is broad. It recognises that every actioncounts in tackling air pollution. It puts in placeactions that will reduce emissions from motorvehicles as well as industrial and commercialsources and from everyday household activities.Figure 1 highlights the overall air qualityframework.
Achieving air quality goals
Crucial to the plan are the ambient air quality goalsbeing adopted by NSW, pending the final decisionson air quality standards at a national level. Theseare for ozone, nitrogen dioxide and particles, whichrelate to photochemical smog and brown haze.Additional standards for carbon monoxide, sulfurdioxide and lead will be included following theconclusion of the national process.
5
Introduction
Reducing emissions from motor vehicles is thehighest priority if we are to meet the goals in thelong term. The Government has set in place amulti-pronged approach to do this. Improvingtransport choices and encouraging people to takefewer and shorter trips by individual motor vehiclesare key objectives. This will rely heavily ondeveloping a progressive transport plan, which islinked to the regions’ five-year urban infrastructuremanagement plan. Providing improved publictransport and encouraging cycling and walking, aswell as integrating the planning of freightmovement, are also essential objectives to achieveclean air.
But these are not the only objectives. Promotingcleaner cars, trucks and buses through cleaner fuelsand alternative technologies, for example, areamong the other priorities found in the Action forAir plan. The plan takes a multi-layered approach.It includes seven key objectives for total air qualitymanagement, and puts in place a comprehensiveslate of strategies to meet these objectives:
1. Integrate air quality goals and urbantransport planning
� integrate transport and urban infrastructureplanning
� improve management of freight transport
2. Provide more and better transport choices
� provide better public transport
� promote cycling and walking
� change travel behaviour through education
3. Make cars, trucks and buses cleaner
� reduce car emissions
� reduce diesel emissions
� promote cleaner fuels
4. Promote cleaner business
� improve regulation of industrial emissions
� promote a cost-effective approach for smallbusiness
Action for Air
6
Sulfurdioxide
Air toxicsCarbonmonoxideISSUE
LEVEL
Climate change due togreenhouse
effect
Photochemicalsmog
Global Issues
Brownhaze
Nitrogendioxide
LeadUpper
atmosphereozone
depletion
RESPONSE
Local Air Quality Management Plan
Local Air Quality Management Plan
Local Air Quality Management Plan
Local Air Quality Management Plan
Local Air Quality Management Plan
Local Air Quality Management Plan
Regional Issues Local Issues
RevisedStrategy for
OzoneProtection
IndustryPollution
ReductionPrograms
Air ToxicsInventory &Monitoring
Dealt within AQMPTransport
Action
NationalGreenhouseResponseStrategy &Sustainable
EnergyDevelopment
Program
LeadAction Plan
LeadReference
Centre
Actionfor Air
Figure 1. Structure of the Air Quality Management Plan

5. Promote cleaner homes
� improve operation of wood heaters
� promote energy efficiency in the home
6. Manage the impact of open burning
� develop smoke management guidelines
� inform people of open burning restrictions
7 Monitor, report on and review air quality
� improve access to air quality data
� ensure an effective public review process
� report regularly on the state of air quality inNSW.
Some actions to support these strategies are alreadyunder way, some will be started in the near future,others are still to be devised during the 25-yeartimeframe.
How will the community be involved?
Consultation with the community on air qualityissues is a high priority for the Government. RecentNSW-wide studies indicate an ongoing publicconcern about air quality and show that manypeople rank it as the highest environmental priorityfor the State.
Action for Air has numerous mechanisms toencourage further community input in the future,including:
� enhanced access to daily and quarterly airquality reporting data through the Internet
� a public Air Quality Forum to monitor airquality trends and strategies, and report back toGovernment
� an Air Quality Modelling Advisory Group as aforum for external input into priorities for futuremodelling
� the Public Transport Advisory Council,ensuring community input into public transportplanning.
Whether you are an individual or a communityorganisation, the Government is calling for yourinvolvement in its air quality improvement programand will work to keep you well informed about thequality of the air in NSW.
7
Introduction

Action for Air
8
Figure 2. Framework of Action for Air
9
What’s the problem?
Action for Air focuses primarily on regional airpollution in the Greater Metropolitan Region(GMR) of NSW, which is home to about 70% ofthe State’s population and encompasses the majormetropolitan centres of Sydney, Newcastle andWollongong. Sydney, in particular, can experiencepoor air quality under certain weather conditionsbecause of its size and topography.
Research shows that air quality problems in anyof these three metropolitan centres can affect airquality in the others, so we need to consider themtogether rather than separately. At the same time,many of the actions implemented in Action for Airwill also improve air quality in rural areas—e.g.improved standards applying to motor vehicles andwood heaters.
The two regional pollution problems of prime
concern within the GMR are photochemical smogand particle pollution. This section deals with themajor pollutants that cause smog and particlepollution—ground level ozone, nitrogen dioxideand total particulate matter. It explains wherethey come from and their effects on human health,drawing on the available body of health relatedresearch from Australia and overseas. (The sourcesof pollutants and their air quality impact areoutlined in more detail in EPA publications such asthe Metropolitan Air Quality Study—Outcomes andImplications for Managing Air Quality).
Photochemical smog
Photochemical smog is a complex mixture ofchemicals, which is sometimes visible as whitehaze. In Sydney, the Lower Hunter and Illawarra,its most significant components are the pollutantsground-level ozone and nitrogen dioxide. Ozone isthe main concern in the warmer summer months,
1 The issues in brief
������
Domestic/Commercial41%
Mobile49%
Industry10%
23%39%
25%
13%
�������
�����
Other
Natural Gas Leakage
Surface Coating/Thinner
Solvents
74%
7%
9%2%
8%
����
�
���
Passenger Vehicles
Light Commercial
Heavy Duty
Motorcycles
Other
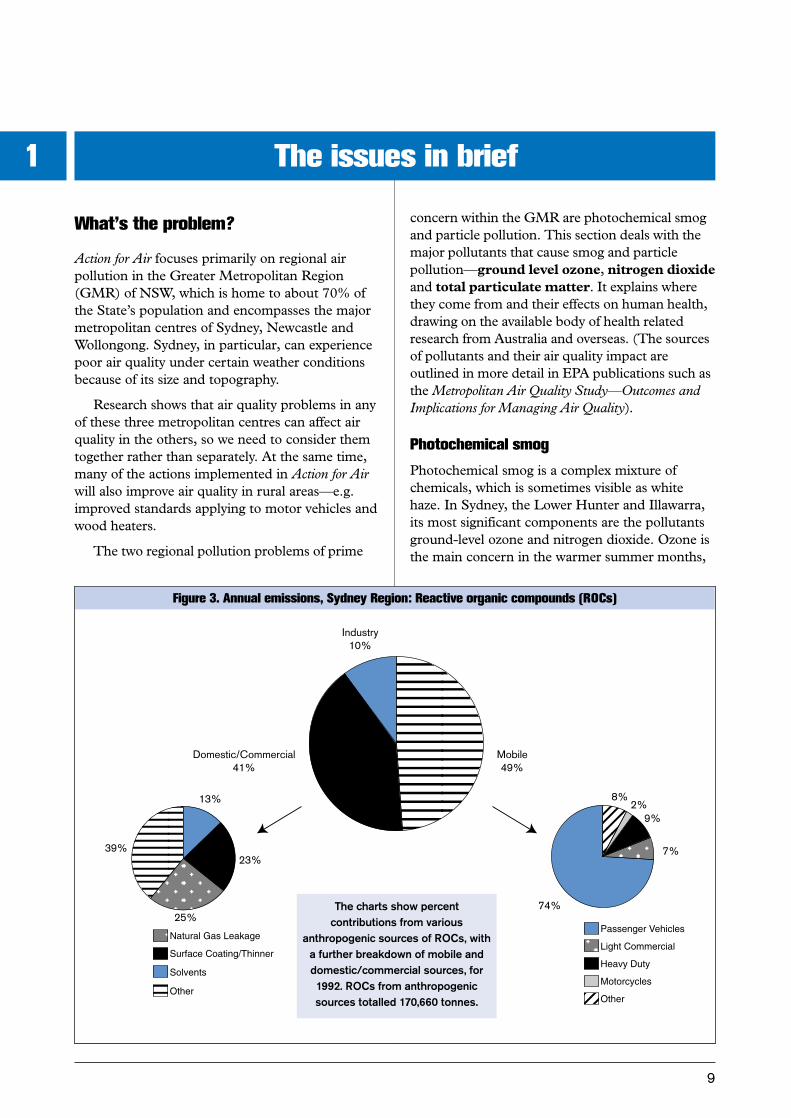
Figure 3. Annual emissions, Sydney Region: Reactive organic compounds (ROCs)
The charts show percentcontributions from various
anthropogenic sources of ROCs, witha further breakdown of mobile anddomestic/commercial sources, for1992. ROCs from anthropogenicsources totalled 170,660 tonnes.

and nitrogen dioxide in winter. These pollutants areformed in the atmosphere when two classes ofcompounds—reactive organic compounds (ROCs)and oxides of nitrogen (NOx)—react under theinfluence of sunlight.
ROCs and NOx are emitted by various humanactivities as well as from natural sources, includingvegetation, soil and the ocean. Some nitrogendioxide is also emitted directly from combustionprocesses.
Sources
The major sources of ROCs include:
� unburnt petrol and diesel from motor vehicletailpipes
� evaporative losses from motor vehicles andpetrochemical industries
� loss of solvents used in commercial anddomestic activities
� natural emissions from vegetation
The major sources of NOx are combustionprocesses including:
� motor vehicles (passenger and heavy dutyvehicles)
� industry—e.g. the power industry
Effects on human health
Ground level ozone
The health effects of ground level ozone, the majorcomponent of smog, have been widely studied.Even at very low levels, this ozone can:
� cause acute respiratory problems
� aggravate asthma
� cause temporary decreases in lung function inhealthy adults
� lead to hospital admissions and emergency roomvisits
� impair the body’s immune system
The effects of ozone vary with concentration,
10
Action for Air
����
Domestic/Commercial5%
Mobile82%
Major Industry13%
49%
8%
39%
4%
�����
Passenger Vehicles
Light Commercial
Heavy Duty
Other
Figure 4. Annual emissions, Sydney Region: Oxides of nitrogen (NOx)
The charts show percent contributions fromvarious anthropogenic sources of NOx, with a
further breakdown of mobile sources, for1992. NOx from anthropogenic sources
totalled101,730 tonnes.
length of exposure and level of activity duringexposure. Short-term acute effects, includingreduced airflow to the lungs and inflammatorychanges in the small airways and respiratory systems,have been detected in the laboratory when adults areexposed for 6.6 hours to an ozone concentration of0.08 parts per million (ppm). There is clear evidencethat substantial acute effects occur with one hour’sexposure if the concentration is 0.25 ppm or higher.
Nitrogen dioxide
Nitrogen dioxide is a major precursor to ozone aswell as being a pollutant in its own right. Healthstudies of nitrogen dioxide show that it:
� can damage the respiratory system
� is associated with increased respiratoryinfections in children, especially asthmatics
� may increase the effects of allergens
� is associated with hospital admissions for asthma
� is associated with hospital admissions for heartdisease
� may possibly be linked to mortality.
Negative respiratory health effects fromexposure to nitrogen dioxide can occur at levels aslow as 0.20 ppm. A Sydney-based health study,Health and Air Research Program (HARP),indicated that small increases in one-hourmaximum levels of nitrogen dioxide produced an11% increase in daily asthma admissions; and asimilar study in Paris showed an 8% increase.
Particle pollution
Particle pollution can sometimes be seen in themetropolitan area as brown haze, usually during thecooler months of the year. This occurs mostcommonly in the late afternoon or the earlymorning—under cold, still conditions when surfacetemperature inversions are developing or breakingdown.
Airborne particles (sometimes called particulatematter) are formed by the accumulation ofsubstances into small, discrete entities in theatmosphere. They are typically less than 50
11
The issues in brief
����
���
Domestic/Commercial36%
Mobile31%
Major industry33%
60%
13%
23%
4%
�����������
Heavy Duty
Passenger Vehicles
Light Commercial
Other
47%
13%
13%
27%
�����
���
Processing
Petroleum Refining
Manufacturing
Other
35%
63%
2%
���
Fuel Combustion
Other
Lawn Mowing
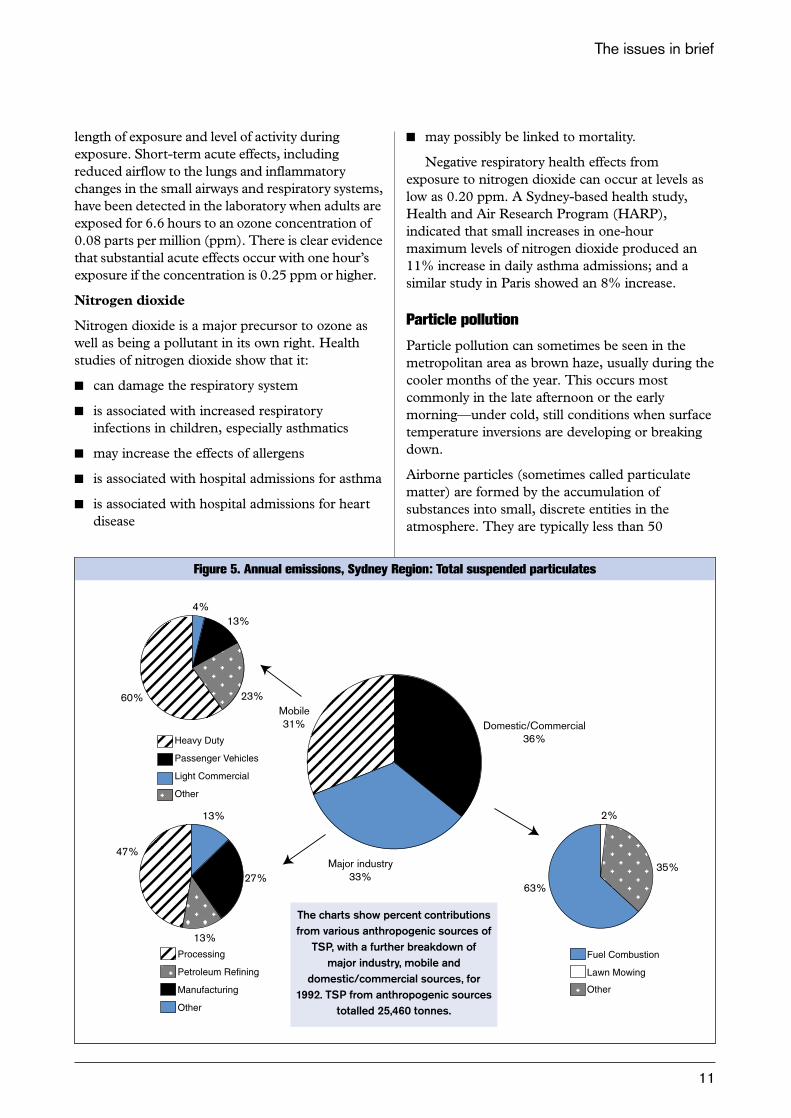
Figure 5. Annual emissions, Sydney Region: Total suspended particulates
The charts show percent contributionsfrom various anthropogenic sources of
TSP, with a further breakdown ofmajor industry, mobile and
domestic/commercial sources, for1992. TSP from anthropogenic sources
totalled 25,460 tonnes.

micrometers (µm) in size and can be as small as0.1µm.
Fine particles—less than 10µm—can betransported some distance from their source,affecting air quality on a regional scale. Becausethey are small enough to be inhaled into the lungs,they can affect human health. Coarser particlesremain in the air for relatively short periods beforebeing deposited, sometimes soiling or damagingmaterials.
Total suspended particulates (TSP) refers toboth fine and coarse particles together.
Sources
Particles originate from a wide range of humanactivities and natural sources, including motorvehicles, industrial processes, bushfires, hazardreduction burning, pollens, fungi and sea spray.The relative importance of sources varies accordingto time, season and locality.
The major sources of fine particles include:
� motor vehicles (particularly diesels)
� domestic solid fuel heaters, particularly woodburners (major source of particles during winter:34% of TSP in Sydney on a winter weekday,50% on a winter weekend)
� industry (also a major source of coarse particlesin the GMR)
� open burning associated with agriculture,forestry management and hazard reduction(significant source of particles across NSW)
Effects on human health
Fine particles are measured in two categories:
� PM10—particles 10µm or less in diameter, smallenough to be inhaled into the respiratorysystem.
� PM2.5—particles 2.5µm or less in diameter,small enough to be inhaled deep into the lungs.
Our living environment is filled with particles ofall shapes and sizes. Under normal conditions,
12
Action for Air
Table 1. Regional Ambient Air Quality
Pollutant Averaging Previous Action for Air Long-term time NSW goal interim goal reporting goal
Ozone (O3) 1 hour 0.10 ppm 0.10 ppm 0.08 ppm*4 hour 0.08 ppm 0.08 ppm 0.06 ppm*
Nitrogen dioxide (NO2) 1 hour 0.16 ppm 0.125 ppm 0.105*Annual 0.05 ppm 0.03 ppm** —
Particulate matter 24 Hours 150 µg/m3 50 µg/m3 —< 10 µm (PM10) Annual 50 µg/m3 30 µg/m3
Particulate matter 24 Hours — Standard being Standard being< 2.5 µm (PM2.5) developed. developed.
— Insufficient data Insufficient dataat this stage at this stage
Annual — Standard being Standard beingdeveloped. developed. Insufficient data Insufficient dataat this stage at this stage
Total suspended Annual 90 µg/m3 90 µg/m3
particulates (TSP)
* WHO goal ** Consistent with WHO goal of 0.021-0.026ppm

people in good health are able to deal with mostparticles without adverse effect. However, particlesof the size of PM10 can be inhaled into the lowerairways and are closely associated with healtheffects. Recent research has focused on PM2.5which can penetrate deep into the lungs and which,some studies suggest, are most closely associatedwith health effects. An important emerging issuefrom the most recent health studies is that there isno obvious threshold level of fine particles belowwhich there are no effects on health.
Health studies of fine particles have shown thatthey can:
� increase mortality from cardiovascular andrespiratory diseases
� increase hospital admissions for chronicobstructive pulmonary disease and heart disease
� reduce lung function in children with asthma
� increase respiratory symptoms in schoolchildren.
What are our air quality goals?
The starting point for any air quality managementplan is to adopt air quality goals or acceptablestandards for pollutants of concern. The NSWGovernment is committed to health based ambientair quality goals. State and Federal Governmentshave also made the important collaborative decisionto develop national air quality standards as National
Environment Protection Measures (NEPMs) andexpect to finalise these in 1998.
NSW is playing an active role in developingthese national standards and is committed toadopting them when they are finalised. Pendingthat decision, NSW has established its own interimgoals to guide the development of control strategiesand for reporting purposes.
In setting these levels, NSW has examined thelocal and overseas health research relating to theadverse health effects from high levels ofphotochemical smog, nitrogen dioxide and fineparticles. We have also been involved in the nationaldiscussions to set appropriate national standardsthrough the air NEPM.
Table 1 outlines the air quality goals that formthe basis of this action plan.
Over the 25 years of the Action for Air plan, therewill undoubtedly be further health researchundertaken and a better understanding of healtheffects established. In order to build acomprehensive picture of air quality in the region,the Government intends to report against a range ofhealth-related goals. The plan therefore commitsthe EPA to provide information on air quality atdifferent levels to ensure comparative data isavailable for the long-term.
This approach will ensure that public health inNSW is protected over the long term.
13
The issues in brief
0.00
0.05
0.10
0.15
0.20
0.25
1997**1996199519941993199219911990198919881987198619851984198319821981*1980
NHMRC goal: 0.10ppm
WHO goal: 0.08ppm
* data for 1981 incomplete ** at time of writing 1997 data had undergone first level validation only
1 ho
ur a
vera
ge o
zone
con
cent
ratio
n (p
pm)
Figure 6. Annual maxima of 1-hour average ozone concentrations, greater metropolitan area

Photochemical smog
Ground-level ozone
� Ambient goals
The NSW goal for ground-level ozone is basedon the national ozone goals set by the NHMRC in1995. These are 0.10 part per million (ppm)(averaged over one hour) and 0.08 ppm (averagedover four hours).
The World Health Organization (WHO) ozonegoals of 0.08 ppm (averaged over one hour) and0.06 ppm (averaged over 4 hours) will be set as along-term goal for reporting on air quality in NSW.The EPA will be required to report against theWHO standard as well as the interim goal forozone.
The long-term objective is ambitious. It is,however, important to set a goal for progressivelong-term reductions in ozone.
� Trends in ground-level ozone
It can be difficult to establish trends in ozonelevels because ozone formation depends on
meteorological conditions. In a cloudy summersuch as in 1996, ozone goals may not be exceeded.On the other hand, unusually hot sunny weather inNovember 1997 caused unexpected high peaklevels of ozone.
There has been little change in peak levels ofozone over the last decade, according to annualone-hour average maxima (see Figure 6).
Concentrations of ozone at EPA sites in theSydney region over the last decade have exceededthe NHMRC goal (0.10 ppm) on up to 15 days in agiven year. They have exceeded the long-term WHOgoal (0.08 ppm) on up to 31 days in a given year.
Nitrogen dioxide
� Ambient goals
Until 1998 NSW has used a goal for nitrogendioxide of 0.16 ppm (one-hour average) and 0.05ppm (annual average).
To ensure an adequate safety margin to protectthe very young and those with respiratory disease,NSW will use 0.125 ppm (one-hour average) and0.03 ppm (annual average) as its interim goals for
14
Action for Air
0
5
10
15
20
25
30
������������������������
num
ber
of d
ays
exce
edin
g go
al
IllawarraSydney
�Lower Hunter***
1997**1996199519941993199219911990198919881987198619851984198319821981*1980
* data for 1981 incomplete ** at time of writing 1997 data had undergone first level validation only
*** monitoring in the lower Hunter commenced in 1983
Figure 7. Days exceeding the NHMRC 1-hour ozone goal at EPA sites in the Sydney, Illawarra and lower Hunter regions

nitrogen dioxide. It will also adopt the WHO one-hour standard as a long-term reporting goal.
� Trends in nitrogen dioxide levels
The frequency of nitrogen dioxide events in theSydney region is highly variable (Figure 9). Duringthe past six years, the NHMRC goal (0.16 ppm)has been exceeded on only one day. Over the lastdecade, it has been exceeded on up to 16 days peryear. The more stringent WHO goal (0.11 ppm)has been exceeded more frequently.
Fine particles
Ambient goals
Current health advice is that there is no establishedthreshold for fine particles below which there are nohealth effects. Setting a standard for fine particlestherefore presents a dilemma. WHO does not havespecific goals for fine particles because of this.Instead it issues a summary table of health effectsto guide authorities.
15
The issues in brief
NHMRC goal: 0.16ppm
WHO goal: 0.11ppm
* at time of writing 1997 data had undergone first level validation only
hour
ly a
vera
ge N
O2 co
ncen
trat
ion
(ppm
)
0
0.05
0.1
0.15
0.2
0.25
0.3
0.35
1997*19961995199419931992199119901989198819871986198519841983198219811980
*** at time of writing 1997 data had undergone first level validation only
* data for 1985 not available ** data for 1990 incomplete
WHO goal equivalent: 0.11ppm
num
ber
of d
ays
1997
***
1996
1995
1994
1993
1992
1991
1990
**
1989
1988
1987
1986
1985
*
1984
1983
1982
1981
1980
0
5
10
15
20
25
30
35
40
45
50
��� ���������������� ���� �
NHMRC goal: 0.16ppm
�
Figure 8. Annual maxima of 1-hour average nitrogen dioxide concentrations, greater metropolitan area
Figure 9. Days exceeding NHMRC and WHO nitrogen dioxide goals at EPA sites in the Sydney region

Historically, NSW has applied the US EPAPM10 goal of 150 µg/m3 24-hour average in theabsence of available Australian information.
Because of rising health concerns from particles,NSW will adopt a 24-hour average goal of 50µg/m3
for PM10 (24 hour average) as the interim goal. Anew annual average standard of 30 µg/m3 will alsobe referenced as a long-term reporting goal.
Fine particles as small as of PM2.5, which arecapable of being absorbed deep into the lung, are ofprimary concern in terms of health effects. TheNSW Government is committed to thedevelopment of a PM2.5 standard but furtherresearch is necessary to achieve this. NSW will set aPM2.5 goal as soon as sufficient information isavailable.
The NSW EPA currently uses an hourlyvisibility goal which equates to approximately 9 kmunder normal conditions. It will be maintained asan interim goal.
NSW will also maintain its current goal forreporting total suspended particulates (TSP) of90µg/m3 annual average.
Trends in fine particle levels
Over the last seven years, annual average
concentrations of PM10 in the Sydney region havegenerally remained below the proposed interimNSW goal of 30 µg/m3; however, annual averagesfor individual sites can exceed this goal (figure 11).Levels in the lower Hunter and Illawarra regionsare very similar to those measured in Sydney.
16
Action for Air
0
50
100
150
200
oct
jul
1988
apr
jan
oct
jul
1989
apr
jan
oct
jul
1990
apr
jan
oct
jul
1991
apr
jan
oct
jul
1992
apr
jan
oct
jul
1993
apr
jan
oct
jul
1994
apr
jan
oct
jul
1995
apr
jan
oct
jul
1996
apr
jan
24 h
our
PM
10 (
mg/
m3 )
US EPA 24 hour goal: 150 mg/m3
AQMP interim 24 hour goal: 50 mg/m3
0
5
10
15
20
25
30
35
199619951994199319921991199019891988
Ann
ual a
vera
ge P
M10
(m
g/m
3 )
Figure 11. Annual average PM10 at EPA monitoring sites in the Sydney region, 1988-96
Figure 10. Monthly maxima of 24-hour PM10 concentrations at EPA sites in the Sydney region

Overview
Isolated pockets of action will not achieve our airquality goals over the next 25 years; the key toprotecting air quality is to launch a concerted andsustained effort across all spheres of government,industry and the community.
Action for Air aims for a fundamental change inair quality management in NSW by sketching thebig picture and identifying everyone’s place withinit, so that government, the community and thebusiness sector understand how they must worktogether to protect human health and the quality ofthe environment. The responsibility for keeping theair clean is shared by everyone.
The Action Plan focuses primarily on the greatermetropolitan region and contains diverse strategiesand actions, approaching the problem on manyfronts and linking State and local government,industry and individual actions for an integratedattack on air pollution. Transport initiatives sitalongside actions to reduce industrial andhousehold emissions. Technology initiatives sitalongside education and regulatory initiatives.
The Action Plan’s key objectives are describedin a brief overview and the strategies and actionsthat will support these objectives are detailed underseven separate headings. An overview of these isshown in Figure 12.
Summary of objectives
Objective 1. Integrate air quality goals andurban transport planning
Although big air quality gains have been madethrough new vehicle technologies and fuels, motorvehicles remain a major, and increasing, source ofair pollution in the GMR. As well as contributing tosmog and particle pollution, they are a source of airtoxics and a major contributor to greenhouse gases.
Growth in car use is increasing faster than thegrowth in population. We are taking more andlonger trips both to get to work and for domesticpurposes. Emissions from diesel vehicles, both
heavy and light commercial vehicles, are becomingan increasing source of air pollutants as they movefreight throughout the GMR.
To respond to this, the Action Plan has set anambitious objective of containing the per capitagrowth in vehicle kilometres travelled (VKT) andthen stopping the growth in total VKT byeffectively integrating planning decisions and byimproving transport choices.
The Government’s objectives include achieving:
� a shift from private cars to public transport,cycling or walking
� smoother flows of traffic and reducedcongestion, including for road-based publictransport
� reduced need for travel
� reduced length of trips travelled by vehicles
� increased occupancy of cars and publictransport carriers
� better planning and managing freight movementacross all transport modes.
The Action Plan sets specific targets forreducing per capita VKT. To achieve these targets,the Government has required the development oftwo new overarching transport initiatives:
� an integrated transport plan
� an integrated freight management strategyacross road, rail and other transport modes.
The VKT target will also be incorporated intothe Government’s metropolitan and regionalplanning processes and the five-year rolling UrbanInfrastructure Management Plan—which helps tointegrate land use and transport planning, and setsthe priorities for infrastructure funding approvals.
Objective 2. Provide more and better transportchoices
In addition to long-term planning, there is aclear need to provide more and better transportchoices, which will encourage reduction in vehicletrips and kilometres travelled by both passenger andcommercial vehicles.
17
2 What is the Action Plan?

The Action Plan outlines key commitments forimproving provision of both fixed rail and road-based public transport. The plan balancesconstruction of new public transport facilities withestablishing priority for road-based public transport
services and management improvements such asintegrated ticketing. Improved opportunities forwalking and cycling are integral to the plan, to helpreduce harmful emissions and improve people’shealth.
18
Action for Air
Integrate airquality goals & urban transport
planning
Provide more and better transport choices
Publictransport
Cyclingand
walkingEducation
Reducecar
emissions
Reducediesel
emissions
Promotecleaner
fuels
Reduceindustrialemissions
Small business
best management
practice
Make cars, trucks
& busescleaner
Promotecleaner
business
Promotecleanerhomes
Manage theimpact of
openburning
Open burninguser guide
Smokemanagement
guide
Educationpackage
Homeheaters
regulation
Code of practice
for printers
Clean air
regulation
TransportPlan
CyclewayProgram
Ongoingschool &
communityprograms
Influencenational
standards
Influencenational
standards
WesternSydney
natural gasproject
Greater WesternSydney public
transport strategy
'Don't light tonight'campaign
Auto repair/surfacecoating
housekeeping
Load-based
licensing
Clean fuelsand
technologystrategy
Nationaldiesel NEPM
Augmentsmokyvehicle
enforcement
Cleanerproductionunit in EPA
Petrol vapourrecovery from
rail gantries
Homeheaterscode ofpractice
Energyefficiency –
energy smart homes
POEOAct
Design diesel
inspection & maintenance
Reducepetrol
volatility
Bicycleuser
support
Extend heavy
rail network
Localplanning
Residentialaccessibility
criteria
Integratelightrail
RTA pedestrian
policy
Cleanergovernment
buses
NOxpolicy
Leakdetection
& repair forpetrochemical
plants
Planningfor
pedestrians
Improvedpublic
transporton roads
ParramattaREP
journey toworktarget
Freightstrategy
Research
Improvedtransport
management
Pollutionreductionprogram
for ROCs
Metro strategy annual reporting
PTAC reporting
Internet access to air quality data
MONITORING AND REPORTING
Air Quality Public Forum
Joint EPA/Oil industry technical workshop group
Air Quality Modelling Advisory Group
Bicycle& publictransportstrategy
Metropolitanstrategicplanning
Regionaltransportplanning
Bicyclefacilitiesprogram
Public transport5-year funding
plan
VKTreductionplanningpriority
Inspection & maintenance
phased program
Smokyvehicle
enforcement
Figure 12. Action fo Air: key objectives, strategies and actions

What is the Action Plan?
Objective 3. Make cars, trucks and busescleaner
We have achieved significant gains in air quality inthe GMR by adopting standards and putting inplace programs to make motor vehicles cleaner.However, there is still more work to be done. Thiswill be done at a national level for new vehiclestandards and at a state level for in-service vehicles.
The Action Plan aims to reduce exhaust andevaporative emissions from both new and in-servicecars, trucks and buses by continuing to improve thetechnology of vehicles and their fuels—includingdiesel vehicles, which contribute adisproportionately high level of emissions; andencouraging the use of alternative fuel sources(such as natural gas) and their application to privateand public fleets. Specifically, the Government hasbrought forward a comprehensive program to havecars and trucks tested and properly maintained,beginning in 1998 in the Sydney region andexpanding to the Illawarra and Hunter by 2004.
Objective 4. Promote cleaner business
Through Action for Air, the Government iscontinuing to put in place a revamped environmentprotection framework for industry, which combinesstrong legislation and regulation with economicincentives for change.
Successful measures to reduce industrialemissions of ROCs in the 1980s are being followedwith new actions that concentrate on the control ofNOx. For smaller commercial sources, the goal ofthe Action Plan is to reduce emissions of ROCs inthe most cost-effective way and, in the process, helpreduce air toxics and workplace exposure tochemicals.
Objective 5. Promote cleaner homes
The domestic sector is a significant contributor toROCs and fine particle emissions. While there are anumber of household sources, including petrol lawnmowers and garden tools, the major domesticsource of emissions is the solid-fuel (mainly wood)heater. The first phase of the 25-year plan willreinforce existing regulations to reduce emissionsfrom solid fuel heaters with a new slate of educationand management programs.
The home is also a significant consumer ofpower and a major contributor to regional
production of greenhouse gases. The second focuson the domestic front is to improve domesticenergy efficiency and encourage the use ofalternative, cleaner and sustainable energy sources.
6. Manage the impact of open burning
The effect of the Clean Air (Control of Burning)Regulation introduced in 1995 has been to prohibitbackyard burning in the Sydney and Wollongongmetropolitan regions. The major smokemanagement issue for Sydney air quality nowrelates to bushfire hazard reduction and forestrymanagement burning. There is also some impactfrom ecological and bush regeneration burns and,in regional centres, the issue extends to agriculturalopen burning.
Hazard reduction burning practices arenecessary to control bushfires, but the impact ofprescribed burning on air quality can be greatlyreduced if best practice in smoke minimisation isunderstood and implemented. Also, the publicmust have ready access to information aboutrestrictions on open burning in their particularlocality.
Objective 7. Monitor, report on and review airquality
Because of its 25-year time frame, Action for Air isan adaptive plan that will be monitored andevaluated against its own goals and objectives. Toensure greater input from the community, businessand government in this monitoring anddevelopment process, the plan includes a numberof actions to improve access to information on airquality and provide forums for input from thepublic and from industry on air quality strategies.
These include the provision of Internet access toair quality data, setting up an air quality modellinginterest/advisory group, and convening a publicforum to report to the Government. The forum islinked to the legislatively based 3-yearly State of theEnvironment report.
19

Objective 1. Integrate air qualitygoals and urban transport planning
Objective: To reduce the growth in vehicle kilometrestravelled by effectively integrating urban andtransport planning and improving transport choices.
It is now well known that the structure of our urbancentres influences travel demand and choice oftransport. Historically, urban development inAustralian cities has been characterised by lowdensity and separation of land uses. The result is areliance on the private motor vehicle as theprincipal means of transport.
Related to that, motor vehicles, both cars andtrucks, are a significant source of air-pollutingemissions.
Population is projected to be 22% higher in 2021than in 1991 for the Sydney region. Total VKT isprojected to grow approximately 35% over the sameperiod, reflecting increasing per capita VKT as aresult of increasing trip lengths, people makingmore trips, and a higher reliance on cars. If the rise
in vehicle use continues at the same rate over thenext 25 years, many air quality gains already madeacross the industrial, commercial and domesticsectors may be neutralised (see Figure 13).
For the health of the community, there is clearlya need to break this trend. There are also economicimperatives for change, as air pollution and trafficcongestion undermine the attractiveness of Sydneyas a tourist and commercial centre. The AustralianTransport Council estimates that the cost ofSydney’s traffic congestion is already in the vicinityof $2 billion a year.
To reduce vehicle kilometres travelled (VKT),we need to create more compact cities, where:
� fringe expansion is reduced
� housing development near public transportroutes is encouraged
� retail, entertainment, community service andother suitable high-use facilities are located incentres that are able to be well served by publictransport.
We also need to create long-term transport andfreight movement plans that provide the overall
20
Action for Air
ROCs
Almost half—49%—of the ROCs in Sydney and theGMR are produced by transport activity; of this, 70%are emitted by light duty vehicles
In summer, 60% of light duty vehicle emissions comesfrom evaporation and 40% from the tail-pipe.
NOx
82% of the NOx in Sydney are produced by transportactivity. Of this, light duty vehicles contribute 48%,heavy duty vehicles 38%. That 38% isdisproportionately high given the number of dieselvehicles in the fleet.
Industry is the major source of NOx in the GMR butmotor vehicles still contribute substantially in theHunter and Illawarra regions.
Particles
24% of total suspended particles (TSP) emissions fromhuman activity in Sydney are produced by motorvehicles. Of this, up to 80% comes from dieselemissions, even though diesel vehicles account for only15% of vehicle kilometres travelled.
Industry is the major source of TSP outside Sydney.
Greenhouse gases
Transport activity contributes 12% of NSWgreenhouse gases.
Not only is the number of vehicles on NSW roadsincreasing as the population increases, we are alsobecoming much more dependent on our cars. Between1981 and 1991, the growth in car use in Sydney greatlyexceeded the growth in population.
A Snapshot of Motor Vehicle Emissions
3 The Action Plan in detail

blueprint for investment in infrastructure andpublic transport management improvements.
Integrating land use and transport plans, anddelivering coordinated services, help to reduce thelength of vehicle trips and provide alternatives toprivate vehicle use. Action for Air aims to improveair quality by better and more integrated urbantransport and relevant land-use planning.
Strategy A. Integrate urbaninfrastructure and transport planningBecause it is so wide-ranging, the progress ofAction for Air will rely on unprecedentedintegration of State programs across differentagendas. This can only happen by setting outthe linkages, the steps and the goals clearly forall planning agencies to see and work with.
The creation of the Ministry of UrbanInfrastructure Management (1996) and theUrban Management Committee of Cabinetwere necessary steps to coordinate acrossplanning, environment and infrastructureproviders. The Ministry’s role is to developUrban Infrastructure Management Plans with afive-year outlook.
Equally important has been the recentdecision to bring the roads, traffic and transportagencies together in a single portfolio under thesame Minister.
Other important steps have been the creationof the Department of Urban Affairs andPlanning (DUAP), by combining theDepartment of Planning, the Office of HousingPolicy, Landcom and the City West andHoneysuckle Development Corporation; andthe creation of an independently chaired PublicTransport Authority, which is advised by aPublic Transport Advisory Council made up ofusers and public interest groups.
The focal point for future action will be along-term transport plan for the GMR.
Action 1.1. Develop a transport plan to reduce VKTgrowth
At the request of the Premier, the Minister forTransport and Roads has directed transportagencies to develop an integrated Transport Plan in
conjunction with planning agencies. This plan will:
� set directions for public transport and roaddevelopments in conjunction with related land-use issues
� include the Government’s goal of stopping theper capita growth of VKT by 2011 and stoppingthe growth in total VKT by 2021
� include regional and staged sub-targets for theachievement of the VKT target
� build on existing policies, plans and projectsacross the transport and planning agencies
� involve all relevant government agenciesincluding the RTA, the Department ofTransport, the DUAP and the EPA
� involve consultation with key communitystakeholders in its framing and development
� be provided to the Government by November1998.
21
The Action Plan in detail
100
105
110
115
120
125
Car use(120)
Cars(114)
Trips(113)
Population(109)
*Sydney Statistical Division
Figure 13. The mobility expansion, Sydney, 1981-91
The graph shows that, while Sydney’s population increasedby 9% in the 10 years 1981-91, the number of car trips
increased by 13%, car ownership by 14% and car use by20%. That is, people are using more cars, more often. (Datacourtesy Department of Transport home interview surveys.)

Action 1.2. Make the reduction of VKT a planningpriority across government
The Government has committed to a two-phasedVKT target:
� to achieve zero growth in per capita VKT by2011
� to achieve zero growth in total VKT by the year2021.
This target will be refined through thedevelopment of the Transport Plan, as a realistictimeframe can only be set when detailed planning iscomplete. It is a very challenging goal, which willrequire determined effort.
The VKT target will require a reduction ofaround 9% in per capita VKT in the decade2011–2021—a reversal of the current increasingtrend.
It will deliver a major reduction in the overallgrowth of VKT for the 1991–2021 period.Projected VKT growth will be reduced by around43%. To achieve this target there will have to be amajor shift to public transport. The projectedpublic transport share of trips to work of around21% will have to increase to a figure approaching a30% share by 2021. Again this requires a reversal ofthe current trend—which is away from publictransport.
The targets will also be incorporated into the 5-
year rolling Urban Infrastructure ManagementPlan, which sets priorities for infrastructure fundingapprovals. They will also be reference criteria inmajor policies, strategies and projects across alltransport and planning agencies.
Action 1.3. Integrate transport issues in regionaland local planning
The Department of Transport (DOT), the Roadsand Traffic authority (RTA) and the Department ofUrban Affairs and Planning (DUAP) are workingwith local councils to improve their decision-making on transport issues through the statutoryplanning process. Issues being addressed includeproposed changes to the development approvalprocess; a review of planning instruments andguidelines to broaden their transport focus; anddevelopment of best-practice notes on publictransport planning.
The DOT is convening a multi-agency taskforceto promote best practice in planning, design andmanagement of streets and roads to support moreeffective public transport. The taskforce hasdeveloped a framework of transport issues forconsideration when preparing development controlplans.
The DUAP is pursuing a number of key land-use policies that will contribute to achievement ofthe VKT targets. In particular:
� urban consolidation policies which provide for arange of housing choices and for higher-densitydevelopment close to rail and other transportcorridors
� ‘centres’ policies which facilitate multi-purposetrips and reduce demand for car travel byencouraging the concentration of retail,commercial, entertainment and community-service activities into centres that can be wellserved by public transport.
Action 1.4. Implement accessibility criteria for newresidential development
It is important that the location, design anddevelopment of new residential areas maximiseaccess to public transport. The DOT inconjunction with the DUAP have developedaccessibility criteria for new residentialdevelopment. This will provide a framework forassessing areas for inclusion in the Metropolitan
22
Action for Air
1.0
1.1
1.2
1.3
1.4
1.5
1.6
1.7
�����
���
����
2021201120011991
Inde
x (B
ase
= 1
981)
Population ProjectedTotal VKT
�Target VKT
Figure 14. Projected growth in population and total VKTbased on present trends, compared with target VKT

Urban Development Program (UDP) or for settingpriorities for areas already in the UDP. The criteriawill also be used by local government in the designand staging of new residential development areas.
Action 1.5. Set targets for journey to work bypublic transport at key centres
Parramatta provides a major opportunity toincrease the use of public transport for journey towork trips. Through the Parramatta RegionalEnvironmental Plan (REP), the Government hasset a target of increasing public transport patronagefor journeys to work—from its current 25% to 40-60% as the workforce doubles.
The Government is working with ParramattaCity Council to ensure coordinated development ofthe Parramatta City Centre as a major employmentlocation and service centre for the residents ofwestern Sydney, with greatly improved publictransport access. The REP for Parramatta has arange of specific access strategies:
� actively pursuing a high modal split towardspublic transport
� developing regional public transport corridors to
provide efficient access from all catchment areas,with particular priority for the North West,South West, North Shore/Chatswood/HillsDistricts and Homebush Bay
� managing road-traffic demand
� developing an integrated access system,including public transport, pedestrian and cycleaccess within Parramatta Primary Centre,linking all areas important for its growth
� ensuring the city is accessible through theprovision of services, information, technology,and built structures.
This integrated approach to the ParramattaREP, including a growth target for public transportin line with growth in the workforce, will be used asa model for planning development of other centres.
Strategy B. Improve management offreight transportationClear planning to improve the efficiency ofurban freight movements is an urgent priority.We need smarter and more integrated planningfor the management of freight transportation byroad, rail and other modes to reduce the impactof heavy diesel vehicles in built-up areas.
Action 1.6. Develop and implement an integratedfreight strategy
The Government has recognised the need for awider integrated freight strategy that combines acomprehensive road freight strategy with strategiesfor other transport modes, including ports and rail.The Minister for Transport and Roads isresponsible for developing the integrated strategy bythe end of 1998.
23
The Action Plan in detail
The City West (Ultimo-Pyrmont) area is beingredeveloped for high density residential and mixeduse, with strong emphasis on providing good accessto jobs through public transport, pedestrian andcycling networks. A projected 7,500 new dwellingsand jobs for 40,000 people will be provided over thenext 20 to 30 years.
Development is based on the assumption of thefollowing proportions of the local workforce travellingto/from work by public transport:
1990 15%2001 45%2011 55%2020 65%
Public transport to Ultimo and Pyrmont will beprovided by light rail as well as extensions to bus andferry services; and a comprehensive pedestrian andcycle network has been developed to complement thepublic transport system. Unrestricted on-streetparking is gradually being removed and replaced bymore restrictive parking zones intended to reducemotor vehicle use in the area.
Case Study: City West Project

Objective 2. Provide more andbetter transport choices
Objective: To improve transport choices andencourage reduction in vehicle trips and kilometrestravelled by both passenger and commercial vehicles.
Contemporary households now have complex travelpatterns that extend beyond the conventional trip towork, presenting a major challenge for transportplanners and networks. This section deals with thestrategies and actions chosen to create more andbetter alternatives to private car use.
The Government clearly has a majorresponsibility for action on this issue; however, inthe long run the community will determine whetherNSW will reverse the current trend in growth of percapita VKT.
The community must decide whether it willchange travel behaviour and use alternatives to thesingle occupant private car wherever suitablechoices are available. It will have to consider whatdisincentives to growing private-car use it is willingto accept: for example, strong pricing policies forparking.
The aim of Action for Air is by no means todiscourage car use altogether; cars and trucks willcontinue to have a central and valued role intransporting people and goods in NSW. Thechallenge for the community is to reduce thenegative impact of motor vehicles by reducing thenumber and length of trips.
The major strategies selected to achieve this goalare:
A. Provide better public transport
B. Promote cycling and walking
C. Change travel behaviour through education.
Strategy A. Provide better publictransportExisting patterns of car use can only be changedif viable public transport options are available.Improvements in public transport—both fixed-rail and road-based—across the distinct regionsin the GMR, are a high priority for theGovernment.
The key elements of Action for Air publictransport strategy are:
� implementing the Greater Western SydneyPublic Transport Strategy
� extending the heavy rail infrastructure
� integrating light rail
� improving public transport on roads
� improving transport management
� upgrading regional transport strategies.
A.1. Greater Western Sydney PublicTransport Strategy
The job of reversing the long neglect of publictransport in the fast growing region of westernSydney is being coordinated through the GreaterWestern Sydney Public Transport Strategy,which will dramatically improve public transportservices in the area. Key actions from thisstrategy include:
Action 2.1. Consider funding for public transport
The NSW Government has increased its publictransport allocation by over $200 million in theperiod 1995-97. In the 1998-99 budget, theGovernment will provide funds for projects forpublic transport in line with its identified publictransport priorities and directions in the Air QualityManagement Plan, Action for Air.
As part of the 1999-2000 budget process, theGovernment will consider a five-year fundingprogram for public transport, arising from theintegrated transport plan. The focus of the plan willbe on areas of greatest need, such as westernSydney.
The development of an integrated publictransport plan and consideration of a five-yearfunding program represent the Government’scommitment to promoting growth in publictransport usage, and allowing proper medium andlonger-term public transport infrastructureplanning.
Action 2.2. Enhance the Parramatta rail link
The Government is committed to commencing theenhancement of the Parramatta rail link.
24
Action for Air

The Government is considering options that willgreatly improve rail access to Parramatta and forwestern Sydney residents. By improving fast andefficient public links from western, south-westernand north-western Sydney, such options will greatlyreduce dependence on private vehicles in this region.
Options being considered will:
� free up train paths on the main western rail line
� enable more frequent and more punctualservices, including express services
� be consistent with reducing travel times andwith the objectives of the proposed ParramattaREP.
Action 2.3. Consider fast-tracked public transportfor the Hoxton Park to Parramattacorridor
The Government is identifying the mostappropriate services for a rapid public transportroute on a reserved corridor from Hoxton Park toParramatta—intended to strengthen Parramatta’sdevelopment as Sydney’s second CBD.
Action 2.4. Plan for public transport in north-westSydney
The Department of Transport is developing atransport strategy for north-west Sydney, which willprovide a comprehensive framework for thisgrowing region.
A dedicated bus land has now been completedon part of the Sunnyholt Road transit corridor,giving priority to road-based transport in the firststage of development of the Rouse Hill release area.The corridor is part of the strategic plan to linkRouse Hill with the proposed Mungerie Park sub-regional centre, Blacktown, Parramatta and otherkey employment areas. The feasibility of running alight rail service along the corridor to connect withthe Blacktown/Riverstone railway line is beingconsidered.
Within two years, work will commence on a newcentre at Mungerie Park at Rouse Hill, which willbecome the anchor for a comprehensive publictransport network in the Rouse Hill development.
The Richmond rail line is also being upgradedin 1998, to provide for track amplification. This willenable CityRail to meet the expected increase indemand from population growth in the north-west.
Action 2.5. Improve bus services in westernSydney
Improvements already made to bus services includeminibuses, a 24-hour information service andletter-boxing of timetables, but there is strongcommunity demand for further improvements. TheGovernment amended the Passenger Transport Actin 1996 to enhance the quality of services deliveredby private bus operators, so that a contract will onlybe renewed for another five years if a series of best-practice benchmarks are achieved.
The GWS Public Transport Strategy includesmany other bus service improvement strategies suchas establishing a TransitWay Policy and upgradingthe provision of public transport information.
Improvements to the road network to providefor bus priority, interchange upgrades and thedevelopment of future cross-regional services willalso improve bus services.
Action 2.6. Provide public transport to new suburbs
Public transport will be introduced at the outset ofnew developments (greenfield areas), to encouragethe use of public transport before consumersbecome car-dependent or house-bound. Criteria forawarding bus contracts in greenfield areas will setmandatory requirements for links to the overalltransport network, minimum levels for services,fares and vehicle and driver standards, and theaccreditation of operators.
A.2 Extend the heavy rail network
Major heavy rail initiatives under way or inplanning (in addition to the Parramatta rail link)include:
Action 2.7. Complete construction on the NewSouthern Railway
The $600 million New Southern Railway iscurrently under construction and expected to openby May 2000. It provides a new rail link betweenCentral and the East Hills line, with new stations atGreen Square, Mascot, Kingsford Smith Airport’sdomestic and international terminals, and NorthArncliffe (North Arncliffe station has been added toprovide for cross-regional transport betweenIllawarra/south-western Sydney and the developing
25
The Action Plan in detail

Sydney South area. It is expected that about 4600passengers will use this station daily); and that13,000 new dwellings will be developed as a result,providing housing for 30,000 residents.
Action 2.8. Extend the Eastern Suburbs rail line
The Government is considering a private sectorproposal to extend the rail line from Bondi Junctionto Bondi Beach. It will link a high-densityresidential area directly into the CityRail networkand provide a seamless public transport connectionto a premier tourism precinct.
Action 2.9. Construct the Homebush Bay rail loop
As part of a comprehensive strategy to make publictransport the predominant form of travel to majorevents at Homebush, a new rail link has beencompleted. This will be complemented by extensivecross-regional bus services, limited car parking andintegrated ticketing for events.
A.3. Integrate light rail
Action 2.10. Integrate light rail
The Government is committed to integrating lightrail into the transport network where it isappropriate. A new light rail service betweenCentral Railway and the Fishmarkets at Pyrmonthas already opened to the public to service urbanrenewal in this region. An EIS for extending theroute has been completed and a preliminaryfeasibility study of light rail in the eastern suburbs isunder way.
A.4. Improve public transport on roads
Road-based public transport services provide acrucial service and require ongoingimprovement to meet demand. Initiatives toreduce car use by improving road-based publictransport include:
Action 2.11. Fund road-based public transport
The Public Transport Infrastructure ImprovementProgram (PTIIP) has allocated $170 million fromthe RTA budget for the period 1995-96 to 1998-99,
to support a greater modal share of road trips bypublic transport.
Action 2.12. Implement the M2 public transportmanagement plan
The newly-opened M2 includes an exclusivebusway from the Epping bus-rail interchange westto Windsor Road. A management plan for thebusway will ensure its potential is maximised andcommit all relevant agencies to implementingrecommendations. The plan provides an effectivemodel for developing buses as a viable form of masstransit on road-based corridors.
Action 2.13. Implement the M5-East sub-regional airquality plan
The M5 East will ease traffic flow between the cityand the south-west, removing an estimated 70% ofheavy vehicles from residential roads and localsuburbs by 2011.
Planning approval for the M5 East has imposedstringent environmental conditions on thedevelopment. The RTA will be required to meetrigorous local ambient air quality standards for thetunnel. Also, the Government has required theRTA, DUAP, the Department of Health and theEPA to work together to identify key contributorsto local air pollution and develop appropriatecontrol strategies. This will include consideration ofa Transport Plan for the M5 East and surroundingstreets.
The RTA will contribute $500,000 a year forfive years to fund the implementation of thesestrategies. The objective of this integrated approachis an overall reduction in air pollution emissions inthe locality.
Action 2.14. Implement an extensive bus priorityscheme
Under the PTIIP, the Government is progressivelydeveloping the Sydney CBD Bus Priority Scheme,the most extensive of its kind in Australia. Inaddition, bus and transit lanes have been set up onEpping Road, Windsor Road and the GreatWestern Highway.
26
Action for Air

Action 2.15. Improve services to the Eastern Suburbs
Approval of the Eastern Distributor was contingenton the implementation of a comprehensive EasternDistributor bus priority plan for the EasternSuburbs of Sydney. The benefits will includeimproved travel times and reliability for the 44million passenger trips made each year on buses inthe east. Faster, more reliable services willencourage more people in this area to travel by busrather than car.
Action 2.16. Upgrade the Warringah peninsula bussystem
A five-year strategy to upgrade the existing bussystem on the Warringah peninsula is beingdeveloped by the RTA and other agencies. Buspriority on Military Road has been improved and aBus Rapid Transit System is being developed.
A.5. Improve transport management
To make public transport more attractive toconsumers, the following management initiativeswill be undertaken:
Action 2.17. Better integrate ticketing, especially inGreater Western Sydney (GWS)
Integrated ticketing is operating to a large extent inthe areas serviced by CityRail trains and StateTransit buses and ferries. The main challenge nowis to integrate the rail ticketing system with privatebus operations in western Sydney. The Governmenthas directed transport agencies to provide advice onhow to extend integrated ticketing to GWS.
The Premier has also directed DOT toinvestigate the possibility of making integratedticketing available to those using public transporton a regular casual basis—for example, to thosewho leave their car at home one day a week.
DOT has a number of integrated ticketingprograms under way, including the ‘Bus Plus’ trial,which combines into one ticket a point-to-point railweekly and an equivalent bus weekly. Trials arecurrently operating in Blacktown, Rooty Hill,Mount Druitt, Campbelltown, Minto, Wyong,Gosford and Woy Woy.
Action 2.18. Improve transport information services
The Public Transport Authority will investigate andadvise on the coordination of information relatingto all modes of public transport. The goal is to havea fully comprehensive centralised phoneinformation system that covers all public transportmodes, all providers and all Sydney regions. As partof the new best practice requirements for therenewal of commercial bus contracts, informationbenchmarks will be developed to ensure improvedtimetable and route information.
Action 2.19. Develop a metropolitan parking policy
The availability of parking is a key factorinfluencing people’s transport choices: easilyavailable and relatively cheap parking encouragescar use. For a consistent approach to the issue,transport and planning agencies and localgovernment will produce a comprehensive policy toguide the provision, management, licensing andenforcement of parking and parking regulations.
27
The Action Plan in detail
Planning for the Olympics provides a uniqueopportunity to maximise public transport facilitiesfor the future and launch innovative transportmanagement practices. It is intended to be ablueprint for sustainable urban transport networkswell beyond 2000.
Car access will be limited mainly to emergencyvehicles. Expected mode splits for spectators are:
� rail 60%
� regional bus services 20%
� park and ride 15%
� cycling and walking 5%
To facilitate public transport access to theOlympic Park, a new railway station and ferry wharfhave been constructed. A comprehensive system ofbicycle and pedestrian pathways will facilitate travelaround the area. Bicycle parking will be provided atall major venues. Four major park and ride facilities,providing up to 16,000 cars with feeder bus servicesto the venues will be located north, south, east andwest of the Park (e.g. Eastern Creek, MacquarieUniversity).
Case Study: The Olympics
Action 2.20. Promote teleworking in government andthe business sector
Teleworking is emerging as a significant andrealistic work mode with the potential to reducetravel demand, especially in peak hours. An RTAsurvey revealed that 5% of the sample teleworkedon a regular basis, 10% on an occasional basis anda further 65 % would if given the opportunity.
The Government will investigate options for itsown workforce as well as working with the NRMAClean Air 2000 Taskforce to support effectiveimplementation of teleworking in government andbusiness sectors.
Integrated ticketing will be a key to thesuccessful integration of transport systems.Ticketing for Olympic and other events (e.g. theRoyal Easter Show), combining entry and publictransport fares, will be actively marketed toencourage bus and train use.
A.6 Implement regional transport planning
Action 2.21. Develop a settlement strategy for theCentral Coast
The Central Coast and Illawarra are both majorand growing urban areas. A settlement strategy isbeing developed for the Central Coast by theDUAP and local councils. Integration of land useand transport planning will be a central element.
Action 2.22. Develop a long-term strategy forimproving transport in the Illawarra
The Illawarra sub-committee of the MetropolitanStrategy Committee has formed a task force toevaluate options for improving transport in theregion. A preliminary analysis of the region’stransport infrastructure, planning and coordinationneeds has been prepared. A draft long-term strategyfor improved public transport, reduced reliance onprivate cars and better integration with residentialdevelopment will be provided to the Illawarra sub-committee of the Metropolitan Strategy Committee.
Action 2.23. Prepare a Newcastle-Sydney corridorstudy
The Sydney-Newcastle corridor links the State’smajor economies and urban areas. Road links in the
corridor are under increasing pressure as a result ofthe growth in commuter traffic between the CentralCoast and Sydney. DOT, RTA, State and RegionalDevelopment and DUAP are working together anda corridor study is being carried out to develop anintegrated package of land use, transport and localemployment measures.
Action 2.24. Prepare a Penrith to Orange Corridorintegrated road and rail strategy
The Government has established the Penrith toOrange Transport Corridor Task Force to developan integrated road and rail strategy for the area.The Task Force will report to the Premier.
Strategy B. Provide for cycling andwalkingWalking and cycling have important parts toplay in reducing car dependency. They performthe vital function of feeding into the publictransport network and are key transport modesfor people without cars or access to publictransport. The significance of walking andcycling is likely to increase as integrated land-useand transport planning policies take effect andmore journeys are brought within their scope.
Action 2.25. Improve government support for saferand more convenient bicycle use
Improvements will be on a number of fronts,including increasing the size of the bicycle networkavailable to cyclists; encouraging dual-mode publictransport/cycling; providing bicycle access along raileasements; providing better facilities such asparking and lockers; and improving motorists’attitudes towards cyclists. Key programs include:
� the Cycleways Program and Bicycle FacilitiesProgram, run by the RTA and local councils toprovide on- and off-road cycleways, State,regional and local bicycle networks, bicycleparking, and local improvements to cycleways.The Government has allocated $5.5 millionannually to cycleway programs in NSW of whichalmost $3 million is in the Sydney region
� the Bicycles and Public Transport Strategy,managed by the DOT in collaboration with theSRA and other transport agencies. The strategy
28
Action for Air
encourages the use of cycling and publictransport as a dual mode.
� the Bicycle User Support Program, run by theRTA in collaboration with NSW Police,education agencies and local government. Itfocuses on increasing bicycle use and reducingaccidents involving bicyclists through trainingand promotion. Its goals are a threefold increasein bicycle use statewide, and a 5% reduction inaccidents, by 2001.
In support of these programs the Government hasallocated over $8m of funding through the RTA. Inaddition, the RTA provides for cyclists in the designof new roadworks and in the maintenance ofexisting roads, with the additional cost being about$12m per year over and above the specificprograms.
Action 2.26. Facilitate walking as a mode oftransport
The Government has a number of initiatives underway to facilitate walking. The Shaping Up Streetsand Roads Taskforce, comprising government andnon-government representatives, has been workingwith councils to ensure that the needs ofpedestrians, public transport users and cyclists areconsidered in the design of new developments andsuburbs.
The RTA is developing a comprehensivepedestrian policy. The initial stage of the projectinvolves a broad community consultation, withworkshops currently being held around NSW. Thepolicy will recognise walking as a legitimate form oftransport, thereby reinforcing the need to providesafe, convenient and direct routes and facilities forpedestrians.
Strategy C. Change travel behaviourthrough educationEducation and public information strategies playa vital role in achieving change in travelbehaviours. Major efforts by governmentagencies, local councils and community bodiesare under way, or in planning, to bring about ashift in community understanding of the healthand environmental consequences of individualtravel choices. To help people translate thisunderstanding into action, the quality, range and
scope of information available on transportalternatives will be substantially upgraded. Thepotential for teleworking and trip-linking willillustrate travel demand-managementphilosophies.
Action 2.27. Continue to promote school andcommunity education programs
Several initiatives involving government agencies,local councils and community groups—such as theNRMA Clean Air 2000 Task Force and the NatureConservation Council—are under way or inplanning. They include Airwatch for schools, theCity Savers resource kit, Smogbusters, and theannual ‘Travel Smart Day’ public transportcampaign.
Objective 3. Make cars, trucks and buses cleaner
OBJECTIVE: To reduce exhaust and evaporativeemissions from new and in-service cars, trucks andbuses.
Another key objective of Action for Air is toaugment the gains already made in air qualitythrough standards and programs to make cars,trucks and buses cleaner. Standards for newvehicles are set by the Commonwealth Governmentthrough the Motor Vehicle Standards Act, while in-service vehicles in NSW are currently regulated bythe State Government.
The major strategies that will achieve thisobjective are:
A. Reduce car emissions.
B. Reduce diesel vehicle emissions.
C. Promote cleaner fuels.
Strategy A. Reduce car emissions
Action 3.1. Advocate tighter national emissionstandards for new cars
A new national vehicle emissions standard wasintroduced in January 1997 but further action isneeded. NSW is chairing the national working
29
The Action Plan in detail

group reviewing Australian Design Rule 37/01 andis supporting new standards equivalent to thoseadopted in the USA in 1994 or Europe in 1996. Ifagreed to nationally, these will come into effectfrom 2003.
The new standards would achieve for each carfurther major reductions in emissions of carbonmonoxide (20%), ROCs (30%) and NOx (68%),and the resulting improvement in fuel economywould reduce greenhouse gases. It would be a verycost-effective approach for each tonne of pollutantsreduced (less than $1000/tonne). The StateGovernment’s long-term goal is nationalimplementation of the very stringent CaliforniaLow Emission Vehicle Standards or theirequivalent. The EPA will monitor all quality trendsand provide advice over time on the appropriatetiming for achieving these standards.
Action 3.2. Augment the Smoky VehicleEnforcement Program
NSW has had a Smoky Vehicle EnforcementProgram since 1974. Under the NSW Clean AirAct it is an offence for a vehicle to emit visiblesmoke continuously for a period of more than tenseconds. The EPA and RTA have strengthened thisprogram, which is enforced by issuing penaltynotices to offending vehicles. Smoky vehicles havebeen identified as the priority target for the newmandatory testing and repair program outlinedbelow.
Action 3.3. Implement an inspection andmaintenance program for in-servicevehicles
Although new cars meet stringent emissionstandards, in-service vehicle emissions are oftenexcessive owing to lack of proper maintenance orthe removal, modification or deterioration ofemission controls.
An Inspection and Maintenance (I/M) programfor passenger and in-service light commercial petrolvehicles will reduce emissions from in-servicevehicles by identifying and requiring the repair ofhigh polluting vehicles. It will be supported by amajor public information campaign on I/M. NSWwill introduce the I/M program beginning in June1998. It will be extended throughout Sydney,Illawarra and the Hunter in a phased program to2004.
A fully implemented I/M program will achievesignificant reductions in air pollution emissionswithin the GMR. Estimates are: NOx—13 tonnesper day; ROCs—16 tonnes per day and CO—342tonnes per day. Fuel economy will be improved by2.5% on average, resulting in a correspondingreduction in carbon dioxide emissions; air toxicswill also be reduced. Vehicle performance willgenerally be enhanced through more consistent,regular car maintenance.
The program will be implemented in threephases:
� Phase 1 will target high-polluting vehicles suchas modified and smoky vehicles within theSydney Region and will be operational in mid-1998, by expanding two RTA emissions-testingfacilities. There will also be random inspectionsof high-usage vehicles to assess their overallimpact.
� Phase 2 will require testing of passenger andlight commercial vehicles in the Sydney region—through a network of 20 privately-operatedtesting facilities across the region—and will beimplemented in 2000. Repairs would berequired after the first 12 months of phase 2.
� Phase 3 will extend the testing program forpassenger and light commercial vehicles to thelower Hunter and Wollongong in 2004.
Action 3.4. Reduce petrol volatility in summer
Reducing petrol volatility will reduce fuelevaporation and the formation of photochemicalsmog. Reducing Reid Vapour Pressure (RVP)—themeasure for volatility—will lower emissions fromvehicles, lawn mowers, fuel storage facilities andservice stations.
Because fuel evaporates more readily when it ishot, RVP reductions are only necessary duringsummer. NSW has negotiated a phased reductionin RVP during the peak ozone period of 15November to 15 March, to be phased in from1997-98 to 2003. There is an annual reviewprogram to assess the effectiveness of this phasedreduction. The new requirements are included in aformal memorandum of understanding withindustry. When fully implemented they will reduceemissions of ROCs by about 7000 tonnes eachsummer and will also reduce air toxics.
30
Action for Air

Action 3.5. Investigate merits of reducing sulfurcontent in petrol
Lowering the sulfur content in petrol can increasecatalyst efficiency, thereby reducing tailpipeemissions of SO2, ROCs, NOx and CO. It may beappropriate to use this strategy at some stage in thefuture; however, further evaluation of the estimatedenvironmental benefits compared with theeconomic impacts and feasibility for Australian oilrefineries is needed. The feasibility, cost andeffectiveness of the strategy will be evaluated by theEPA/Oil Industry Technical Committee for furtherconsideration by Government at a later date.
Strategy B. Reduce diesel vehicleemissionsEmissions from diesel vehicles, especially smallcommercial vehicles and vans, are a growingsource of urban air pollution. Diesel vehiclescreate a disproportionate share of emissionscompared to cars—for example, they produceup to 80% of TSP emissions from motorvehicles in Sydney, even though they account foronly 15% of VKT.
Action 3.6. Advocate tighter national emissionstandards for heavy-duty dieselvehicles
Australia is lagging behind internationaldevelopments in regulating heavy-duty dieselvehicles. Our current standards are equivalent to1991 standards in the USA, 1992 standards inEurope and 1993 standards in Japan. NSW issupporting national review, through AustralianDesign Rule 70/00 (ADR 70), of the more rigorousEuro II standards. If agreed to nationally, these willbe phased in from 2000.
Vehicles and fuels operate as a system and mustbe compatible to achieve improvements inemissions and performance. If Australian dieselemission standards become as stringent as those inthe USA and Europe, changes to the compositionof diesel fuel will be necessary for controltechnology to be effective. There is a need tounderstand the links between diesel fuel productionand passenger vehicle fuel. These issues will beconsidered in the future review of national dieselemission standards (ADR 70) and will be referred
to the National Environment Protection Councilfor consideration.
In the interim, the EPA/Oil Industry TechnicalCommittee will be asked to investigate thefeasibility, cost and effectiveness of low-sulfur dieselfuel as an emission control strategy.
Action 3.7. Develop a national diesel environmentprotection measure
NSW will continue to champion a comprehensivenational diesel measure through the NationalEnvironment Protection Council. The measurewould allow governments to tackle diesel exhaustemissions and fuel quality collectively. It would alsoprovide an opportunity to work with industry togather a better information profile on the nationaldiesel fleet so that an environmentally sound andcost-effective program can be brought forward.
Action 3.8. Design an inspection and maintenanceprogram for diesels.
Inspection and maintenance programs for dieseltrucks and buses are not as advanced as those forcars. There is no readily available short emissionstest for diesel vehicles that is both economical andaccurate. Further research into diesel vehicleinspection and maintenance programs is under wayat a state level to develop the appropriate test.
The Government is committed to implementinga comparable inspection and maintenance programfor diesel vehicles. In the meantime diesel vehicleswill be subject to the visual Smoky VehicleEnforcement Program.
Action 3.9. Ensure cutting-edge emissiontechnology for the State bus fleet
The Government gives high priority to ensuringthat its own fleets are as clean as is possible. This isbeing achieved in a number of ways:
� from 1997, specifying that new diesel buses forthe State bus fleet meet the very stringent EuroII emission control standards, although these arenot required nationally
� purchasing an additional 300 natural-gas-fuelledbuses over the next five years to add to the 107already operating from the Kingsgrove Depot.The State Transit Authority will call for tendersto supply compressed natural gas and theassociated infrastructure to bus depots.
31
The Action Plan in detail

Action 3.10. Support research to identify effectiveemission control strategies
Through a joint research program the EPA,RTA and Sydney Buses are working to identify themost effective ways of reducing emissions fromexisting buses and other heavy-duty diesel vehicles.Because these vehicles will remain on our roads formany years (the diesel fleet turnover rate inAustralia is a slow 30-35 years), the project is verysignificant. Three key options being evaluated arecatalytic converter retrofits, regular maintenanceprograms and the use of compressed natural gasfuel.
There is plenty of scope for improved emissionsfrom these vehicles. Research results available in1998 will assist the Government, local councils andother fleet owners to make sound environmentaland economic decisions.
Strategy C. Promote cleaner fuels
Action 3.11. Participate in Western Sydney GasNatural Vehicle Project
This project was initiated by Liverpool CityCouncil with a focus on the Liverpool area, butthere is opportunity to expand the scope to thewider Western Sydney Region.
In partnership with Liverpool Council, NRMAClean Air 2000, Planet Ark and the AustralianNatural Gas Vehicles Council, the NSWGovernment will promote the benefits of a regionalcompressed natural gas infrastructure. A prioritywill be to encourage fleet operators to use naturalgas, especially for diesel vehicles and possibly taxis.The Government will work closely with the project,providing seed funding, technical assistance andadvice.
Action 3.12. Develop a cleaner transport fuels andtechnology strategy
The Premier’s Department will work withgovernment agencies, private sector interests suchas AGL, the Australasian Natural Gas VehiclesCouncil and the NRMA, universities and theCSIRO to draw together many existing andemerging initiatives into a strategic framework onadoption of cleaner fuels and technologies. This
will include integration of options for the use ofalternative fuels in government and private-sectorfleets. There is much evidence to suggest thatsignificant opportunities exist for environmental,social and economic gains in this area. This strategywill be developed by July 1998.
The Government has already supportedWaverley Council in its conversion of two of itstrucks to compressed natural gas. This a pilotproject which emerged from the Southern SydneyRegional Organisation of Councils GreenhouseStrategy and is supported by the private sector andall levels of Government.
Objective 4. Promote cleaner business
Objective: To improve the regulation of industrialemissions that contribute to air pollution.
The Government is committed to finding new andmore effective ways of reducing industrial emissionswithout imposing unnecessary economic costs onindustry. It has begun to put in place a revampedenvironment protection framework for theindustrial sector, combining strong legislation andregulation with economic incentives for change.
Because reduction strategies introduced in the1980s have been successful in controlling ROCsemissions from large industrial sources, newprograms will concentrate more heavily on thecontrol of NOx. Both traditional and innovativeregulatory tools will be used to achieve maximumemissions reduction.
For smaller commercial sources, the broad goalis to reduce emissions of ROCs in the most cost-effective way. The actions supporting this goal willalso reduce air toxics and workplace exposure totoxic chemicals.
Strategy A. Reduce industrialemissionsIndustrial emissions are a relatively smallproportion of total emissions of ROCs, NOx andparticles in the Sydney region. In 1992, largeindustry contributed 11% of ROCs, 14% ofNOx and 33% of particles .
32
Action for Air

Industry accounts for a much largerproportion of NOx emissions in the GMR,however—mainly through the contribution ofpower stations on the fringe of the region.
There is potential for significant growth ofNOx emissions from new industry over the next25 years, which could substantially increaseformation of smog or cause exceedences of thenitrogen dioxide goal. New industrial sources inwestern Sydney are of particular concern:although small in terms of total NOx, they arerelatively concentrated and could feed into thephotochemical smog reaction at a stage wherethey cause rapid production of ozone. Theconcentration of ozone formed in the emissionplume from a large industrial source could besignificantly higher than in the surrounding areafor up to 15 kilometres downwind of the source.
Consequently, the strategy to reduceemissions from heavy industry makes the controlof NOx a top priority.
Action 4.1. Implement revised Clean Air Regulation1997
As an immediate action, the Government hasimplemented the revised Clean Air (Plant andEquipment) Regulation 1997, setting never-to-be-exceeded emission concentration limits for airpollutants. Limits for new premises are, in mostcases, based on NHMRC limits. In order to createfurther improvements, the EPA will implement anew performance-based licensing system (loadbased licensing) beginning in 1998.
Action 4.2. Implement load-based licensing
The introduction of load-based licensing (LBL) willsee a shift from uniform emission concentrationstandards as the main pollution control tool (as inthe current Clear Air (Plant and Equipment)Regulation) to a focus on the total mass ofpollutants discharged into the environment.Licence-specific limits will be retained to ensure airquality in local areas is protected. Licence fees willbe used to provide powerful financial incentives forlicensees to achieve discharges below the requiredminimum performance. LBL will also form theplatform for trading schemes to cap and reducetotal emissions.
The Government brought forward necessary
legislative amendments to implement LBL, whichwere passed by Parliament in December 1997. Thedraft Regulation and Regulatory Impact Statementare scheduled to be released for public consultationin February 1998, with phased implementation tobegin in mid 1998.
Action 4.3. Establish a Cleaner Industry Unit in the EPA
A new unit within the EPA will developpartnerships with industry to promote cleanerproduction. It will encourage industry to put inplace environmental management systems tocontrol its own environmental performance and willbring forward a State Cleaner Production Strategy,developed in consultation with industry.
Action 4.4. Implement the Protection of theEnvironment Operations legislation
The Clean Air Act passed more than 30 years agohas been revised and incorporated into theProtection of the Environment Operations Act 1997.The new legislation will provide stronger tools forthe EPA and local councils in dealing withcumulative industrial emissions. It will commencein July 1998.
Action 4.5. Develop a framework to control NOxemissions in the GMR
Future industrial growth, such as an expansion ofcogeneration (a positive greenhouse initiative), hasthe potential to increase NOx emissions in theSydney region—thus generating a conflict withregional air quality goals for ozone.
Action to control industrial emissions is bestapproached through a framework that allowsindustry and the EPA to work together to find themost appropriate and cost-effective controls foreach situation. An innovative framework to controlNOx emissions in the Sydney region will allow setparameters for licence negotiations with powergeneration (including cogeneration) plants,petroleum refineries, metal processing plants,chemical manufacturers and other scheduledpremises with NOx emissions.
The new policy will take into account:
� benefits to the National Greenhouse Strategyand the NSW economy of new technology andfuels, especially cogeneration
33
The Action Plan in detail
� a commitment to achieve NOx reductions withthe least cost to industry and maximumflexibility
� a commitment to transparent and predictableregulatory processes
� the complexity of the air chemistry involved inthe production of ozone and nitrogen dioxide,which makes it extremely difficult to specifyappropriate levels of NOx for any airshed.
The EPA will implement its NOx policy for theGMR by capping total emissions and setting up ascheme for trading within the cap. The scheme willbe scoped and developed during 1998 forimplementation, commencing in the 1999-2000financial year. Its aim will be to limit andprogressively reduce emissions to achieve a long-term cap on emissions at 1998 licensed levels.
Until LBL and the full trading scheme areoperational, the EPA has put in place an interimapproach for both replacement and greenfieldproposals. In all cases, this will include: the CleanAir Regulation and the safety-net requirement thatnew plant (replacement or greenfield) should notbe allowed to cause extra exceedences of theinterim air quality goals for nitrogen dioxide andozone in local or adjacent areas.
For replacement proposals, a minimumrequirement of no net increase in NOx emissionsfrom the individual site, and an economic impactanalysis of the cost of available control technologiesfor new plant, will apply. With a view toencouraging emission reductions, the EPA willrecord any reduction in annual NOx emissions forpossible future credit when the trading scheme isfinalised.
For greenfield sites, the EPA will seek emissionlimits consistent with best available controltechnology, dependent on an economic impactanalysis of the cost of achieving these limits.
Action 4.6. Enhance leak-detection and repairprograms at petrochemical facilities
Fugitive emissions, caused by equipment leaks frompump and compressor seals, valves, flanges andother equipment connections, are a significantsource of ROCs emissions from petrochemicalfacilities (such as petroleum refineries and chemicalplants). Emissions can be reduced by an activeinspection and maintenance program.
A program to reduce emissions frompetrochemical facilities will apply to plants run byICI, Ampol, Shell and Montell. In some cases,existing pollution-control licence conditions alreadyrequire fugitive emissions control; the program willensure a comprehensive coverage of all plants. Itwill be implemented as part of the licensingprocess, with appropriate conditions negotiated foreach plant prior to review of its licence.
The environmental benefits include anestimated reduction in ROCs of up to 2,600 tonnesper year in the GMR. There will also be reductionsin fugitive emissions of air toxics such as benzene,toluene and xylene. Workplace exposure to suchchemicals will be reduced and odour may also bereduced.
Industry is progressively installing low-emissionvalves and seals. It may be feasible to move to zero-emission leakless valves and seals over time, but thecost is currently prohibitive. However, futuredevelopment will be monitored.
Action 4.7. Negotiate reductions in ROCs emissionsfrom major industry sources throughlicence conditions
There are feasible ways to further reduce ROCsemissions from industrial sources and these willbecome a focus for licensing review processes withplants in relevant industrial areas. Appropriatereduction strategies will be negotiated on a plant-by-plant basis.
The range of actions to be explored includes:
� improved storage tank operations for fuel andchemical storage and distribution
� improved wastewater treatment in petroleumrefineries
� technical process modifications, add-on controlsand improvements to existing control equipmentfor chemical manufacturing plants
� improved transfer efficiency and use ofwaterborne coatings to reduce ROCs emissionsfrom can and coil-coating industries and otherfabricated metals manufacturers.
34
Action for Air

Strategy B. Develop cost-effectiveapproaches for small businessThe broad goal for small commercial premisesthat produce regional pollutants is to reduceemissions of ROCs compounds in the mostcost-effective way. The supporting actions willalso reduce air toxics and workplace exposure totoxic chemicals.
Action 4.8. Implement staged code of practice forcommercial printing premises
The EPA, the Printing Association of Australia, theAustralia Flexographic Technical Association andlocal government are working together to develop acode of practice and a complementary industryeducation campaign to reduce ROCs emissionsfrom printing activities.
They will focus on the adoption of low ROCs orROCs-free coatings in the flexographic and gravureprinting industry, for premises emitting 35 tonnesor more of ROCs a year. The code of practice willbe implemented in three stages:
� Phase 1 (2000): Improved housekeepingmeasures. Flexographic printing presses willhave chambered doctor blades, anilox rollersand ink trays fitted; there will be someconversion of gravure presses to run water-basedinks; some laminating machines will beconverted to allow use of high-solids adhesives;and the drier components on presses will beupgraded.
� Phase 2 (2003): Installation of incinerationdevices for laminating/coating operations andflexographic presses and some conversion towater-based adhesives.
� Phase 3 (2006): Installation of controlequipment on rotogravure presses, solventrecovery for laminating/coating machines andchangeover to an extrusion laminator.
When fully implemented, the code has thecapacity to produce a reduction of over 2,800tonnes of ROCs per year, to reduce air toxics andodours, and possibly reduce workplace exposure tochemicals. The costs for the program are mediumand the cost-effectiveness rating is good.
Printing industry associations have agreed toinform and educate the industry on the code of
practice. Ink manufacturers will be responsible fordeveloping low-ROCs ink alternatives. Localgovernment will monitor implementation of thecode.
The education program will be an extension ofthe successful Small Business Solutions to PollutionProgram and the EPA will work with other partnersto develop and implement it.
Action 4.9. Improve housekeeping practices in autorepair shops and surface-coatingpremises
The Small Business Solutions to Pollution programhas been effective in supporting a cooperativeapproach to environmental protection. The EPA isworking with local government and industry toextend the program to cover air quality in autorepair shops and surface coating premises.Guidelines and an information campaign toimprove practices are being developed for localimplementation in 1998.
There are various points in the work process inauto repair shops and surface-coating premiseswhere improved practices can reduce emissions ofROCs. Measures will include the use of high-volume, low-pressure spray guns; avoiding spillage;recycling and reuse of materials; and generallyimproved housekeeping practices.
This cost-effective program has the capacity toreduce ROCs emissions in the GMR by over 4,000tonnes a year. There will also be reductions in airtoxics, odours, and in workplace exposure to toxiccompounds.
Action 4.10. Install petrol-vapour recovery units atrail-loading gantries
Vapour controls can minimise the evaporation ofpetrol that frequently occurs during its distribution.Installing petrol-vapour recovery units at rail-loadinggantries extends the vapour controls currentlyrequired by the Clean Air Regulations during thetransfer of petrol at service stations in Sydney.
At present, the only operational rail-loadingfacility is at Parramatta, where fuel is loaded forrail-tanker distribution from both Sydney refineries.Negotiations with industry are under way and it isexpected that an activated carbon vapour-recoveryunit will be installed on the Parramatta Rail Gantryin 1998.
35
The Action Plan in detail

The reduction in ROCs emissions from thisaction is expected to be about 310 tonnes per year,with associated benefits possibly including reducedair toxics and odour. Product savings are anadditional benefit, as fuel vapour is returned to thesystem rather than lost to the atmosphere. Thecost-effectiveness of the strategy is rated as good.
The EPA will consult further with industry inrelation to the extension of vapour recovery units tobulk loading terminals and service stations inWollongong and Newcastle. Until now, theenvironmental benefit of this strategy has only beenconsidered in the context of its impact onphotochemical pollution. The EPA’s currentmonitoring and inventory work on air toxics willprovide additional information to assist in theenvironmental and economic assessment of theproposal.
Objective 5. Promote cleaner homes
Objective: To maximise home energy efficiency andreduce emissions of fine particles and ROCs fromdomestic fuel consumption.
In the domestic arena, individuals and householdscan initiate direct action to improve air quality.
Our homes are a significant contributor to fineparticle emissions and ROCs, mainly through solidfuel heaters but also through petrol lawn mowersand garden tools. As a significant consumer ofpower, the home is also a big contributor toregional production of greenhouse gases and animportant site for innovations in energy efficiency.
Action for Air is responding with a package ofstrategies to reduce fine particles and otheremissions from wood heaters, improve energyefficiency and encourage the use of alternative,cleaner and sustainable energy sources in the home.
Strategy A. Reduce Emissions fromsolid-fuel heatersDomestic solid fuel heaters (mainly woodheaters) are a significant source of fine-particlepollution in both Sydney and a number of ruralregional centres in winter.
They also can produce:
� carbon monoxide (CO) through incompletecombustion of fuel
� ROCs (including benzene, aldehydes,phenols and organic acids), which areresponsible for most of the odours produced
� semi-volatile organic compounds such as thepolycyclic aromatic hydrocarbons, whichneed higher temperatures to evaporate. Someof these are known to be toxic orcarcinogenic at particular levels and othersmay be so.
The EPA has examined strategies developedin other countries and used consultative tools tocanvass appropriate action for NSW. Anindependent social research organisation wascommissioned to survey community knowledge,attitudes and behaviour relating to wood heatersin 1995. In 1996, the EPA distributed adiscussion paper, Air Pollution from Solid FuelHeaters, to all NSW local councils seekingfeedback on preferred strategies.
Since 1995, the Government, incollaboration with industry, has put into place anumber of strategies to reduce the negativeimpact of wood heaters, including regulatoryaction, education programs and requests forvoluntary avoidance of wood fires on high-pollution days.
A continuing program of action includes thefollowing:
Action 5.1. Ensure compliance with the Clean AirRegulations 1997
The Government enacted regulations in 1995 tocontrol emissions from new wood heaters and thesewere renewed in 1997.
Under the Clean Air (Domestic Solid FuelHeaters) Regulations 1997, all new wood heaterssold in NSW must be certified and labelled toconfirm that they comply with emissions standardsset by Standards Australia. The EPA estimates thatproperly certified heaters will reduce emissions byup to 80% over time (the full effect of implement-ation will not be felt for a number of years).
36
Action for Air
Action 5.2. Develop a code of practice forinstallation of heaters
Heaters must be installed properly, as inappropriateinstallation can greatly increase the negative impactof smoke emissions.
The EPA is working with the key players,including industry and councils, to facilitate thedevelopment of a comprehensive industry code ofpractice—covering all aspects of the installation ofdomestic solid fuel heaters—scheduled to beavailable in early 1998.
The industry code will be made available tolocal councils, domestic solid fuel heater retailers,consumer bodies and relevant licensing and trainingauthorities. It will provide useful information andeducation material.
Action 5.3. Conduct a community educationprogram on using wood heaters
Armidale City Council and the EPA began a piloteducation campaign in 1996, focusing on thecorrect operation of wood heaters and the use ofseasoned wood to reduce emissions. The pilotprovided a successful model and the EPA extendedthe program as part of the 1997 winter campaign toreduce brown haze pollution in Sydney andregional centres (including Wollongong, Newcastle,Dubbo, Orange, Lithgow, Oberon andQueanbeyan).
The EPA will continue to work with localcouncils, the industry association, retailers and themedia on a regular community education programaddressing these issues in Sydney and otherrelevant regional centres.
Action 5.4. Continue voluntary ‘Don’t Light Tonight’campaign
The environmental and health impacts of woodheaters, especially those that do not meet the newemissions standards, are most severe on cold andstill nights when smoke emissions are poorlydispersed. Reducing wood smoke emissions onsuch nights is a clear priority and there is strongcommunity support for direct, voluntary action ofthis kind.
The EPA began the voluntary pilot ‘Don’t LightTonight’ public information campaign in 1997 inSydney, targeting open fires and old, uncertified
solid fuel heaters – conveying the informationthrough radio and television weather forecasts.Preliminary indications are that Sydney residentsresponded positively. The program is now to becontinued beyond its pilot phase.
The EPA will continue to work with the industryassociation and local government to assess thebenefits of taking further action including:
� guidelines for wood suppliers to ensure wood forsale is properly seasoned, hard wood
� possible regulatory action by local councils to fixsmoky house chimneys
� incentives for owners of old wood heaters toupgrade to certified wood heaters, or to gas orelectricity, as an alternative fuel source.Armidale Council is investigating interest-freehome loans for this purpose.
Strategy B. Improve energy-efficiency of homesEnergy efficiency in homes is an importantelement in the overall push for energy efficiency.Our broad environmental objectives are toreduce the emission of pollutants, minimise theburning of fossil fuels, encourage the use ofenergy from renewable sources and reducegreenhouse gas emissions.
Local government has a major role inpromoting energy efficiency through its planningand development responsibilities, and somecouncils have been very active on this front. It isalso a high priority for the NSW Government,involving a number of agencies but largelydriven by the Sustainable Energy DevelopmentAuthority (SEDA). The Department of Energyis responsible for programs with a regulatoryfocus, including appliance energy labelling andMinimum Energy Performance Standards(MEPS) for refrigerators and electric storagewater heaters (from 1999). A nationalframework for dealing with energy labelling andMEPS has been developed.
Action 5.5. Implement the ‘Energy Smart Homes’program
SEDA is working through partnerships with localgovernment and the building industry on
37
The Action Plan in detail

implementing its Energy Smart Homes program—designed to reduce the imported energyrequirements of new and existing homes forheating, cooling and ventilation. The program willmake use of education and public informationinitiatives, demonstration projects and land-useplanning. The overall strategy will be supported bya $6 million allocation from SEDA over the nextthree years as well as by contributions from localgovernment.
The targeted outcomes of the Energy SmartHomes program are:
� 60% of new homes granted buildingapplications between mid-1997 and 2002 willhave a ‘minimum energy performance’ rating;
� 90% of new homes and 70% of major retrofitsrequiring a building application will have at leastan ‘improved energy performance’ rating.
The program is being developed in stages andhas a number of elements:
� Energy Smart councilsSEDA aims to work with local councils to assistthem to reduce their own energy consumptionand promote energy-efficient practices in thebuilding sector and broader community. Thisincludes adopting an energy-efficient housingpolicy: promoting energy conservation to theirresidents, making their own premises moreenergy-efficient and considering the purchase ofsome portion of their electricity through aSEDA-accredited Green Power Scheme.
� Energy Smart homes policy for councilsThis initiative aims to introduce an ‘energyefficiency’ housing policy into 50 localgovernments covering 80% of new homes andhome alterations in NSW. It requires councils todo everything that is cost-effective for savinggreenhouse gases. These may includeimprovements to the building envelope, andsavings from hot water through more energy-efficient systems and showerheads (saving up to30% of greenhouse gases from the domesticsector).
� Energy Smart home buildersLand developers, home designers and homebuilders taking part in this scheme must designand build houses to comply with SEDA’sminimum requirements for energy efficiency.This includes the supply of energy-efficient
fittings and appliances with a packaged home.Partners in the scheme include:
� land developers who divide up land so as tooptimise solar access for future houses
� home designers using passive solar principlesthat reduce the need for mechanical heating,cooling and lighting
� home builders including specifications of theEnergy Smart Designers program, such as walland ceiling insulation.
Other SEDA residential programs will includeEnergy Smart Homes Make-Over—a retrofitprogram promoting insulation, efficient windows,daylighting systems and other energy savers.
Objective 6. Manage the impact of open burning
Objective: To implement effective smoke managementprograms, recognising the importance of hazardreduction burning in controlling bushfires.
Major reductions in pollution from open burningactivities have been achieved during the last decade,particularly in the metropolitan area. The effect ofthe Clean Air (Control of Burning) Regulationintroduced in 1995 has been to prohibit backyardburning in the Sydney and Wollongongmetropolitan regions.
The major open burning issue for Sydney airquality now relates to bushfire hazard reduction andforestry management burning. There is also someimpact from ecological and bush regenerationburns; and, in regional centres, the problemextends to agricultural open burning. Smoke fromthese activities can create both nuisance and healtheffects and, in certain weather conditions,contribute to brown haze. However, they are vitalactivities in preventing uncontrolled bushfires.
Strategy A. Manage the impact ofopen burningThe Rural Fires Act 1997 put in placerecommendations responding to the NSWBushfire Inquiry of 1994. The Act creates amore cohesive and integrated fire-fighting
38
Action for Air
structure in rural areas and incorporates anenhanced environmental focus. Ecologicalsustainability is identified as a guiding principlefor key bodies, including the NSW Rural FireService. The Act also provides for bushfire risk-management plans and operational plans beingable to restrict the use of fire in environmentallysensitive areas.
Future actions to minimise the impact of openburning include:
Action 6.1. Release a users’ guide to open burningrestrictions (March 1998)
A users’ guide to open burning restrictions willensure those responsible for hazard reduction andother open burning fully understand the relevantstatutory requirements relating to clean air as wellas open burning management.
The EPA and the Department of Rural FireServices (RFS) are developing clear guidelines toprovide a plain-English description of all relevantprovisions and implications of the Clean Air andRural Fires acts. The guidelines will be finalised inearly 1988 and made available to all relevant firecontrol officers in local councils, the RFS, theNSW Fire Brigade, State Forests and the NationalParks and Wildlife Service (NPWS), and will alsobe integrated into future training courses.
Action 6.2. Develop smoke management guidelinesfor open burning (June 1998)
Smoke management guidelines will help toimplement best practice in the management of fires.
Hazard reduction burning must be undertakento allow maximum control of bushfires. Good forestmanagement, native plant regeneration oragricultural work can also require open burning.But the impact of prescribed burning on air qualitycan be greatly reduced if best practice in smokeminimisation is understood and implemented.Factors such as fuel moisture content, wind speedand direction, and overall weather conditions canaffect the amount of smoke emitted. Smoke-sensitive areas such as schools, retirement villagesand hospitals need to be identified and strategiesmust be put into place to reduce the impact ofsmoke on these areas. Where appropriate,alternative management options, such as theremoval and disposal of hazardous materials by
other means, should be considered.
Smoke management guidelines, setting out bestpractice, are being developed by the NPWS inconsultation with the Department of Rural FireServices, State Forests and the EPA for release inearly 1998. They will be submitted to the Bush FireCoordination Committee for approval and will beintegrated into bushfire risk management andprescribed burning training programs over thefollowing two years.
Action 6.3. Educate the community on openburning restrictions
It is important that the community is aware of thewide-ranging restrictions on open burning and theuse of incinerators, and has ready access to clearinformation on how these restrictions apply inparticular locations. Because the controls varyacross the State, it is often quite difficult formembers of the public to sort out the requirementsfor their particular locality. The EPA Pollution Linereceives regular requests for advice on this issue asdo local councils and the fire services.
The EPA will work with local councils, theDepartment of Bush Fire Services, the FireBrigades and NPWS to produce a clear communityinformation package for distribution through localcouncils, Bush Fire Brigade depots, fire stationsand Pollution Line. These will be available in early1998.
Objective 7. Monitor, report on and review air quality
Objective: To provide for the ongoing monitoring andfuture development of the NSW Air QualityManagement Plan, based on new scientific, economicand social information, wide collaboration and openconsultation.
Action for Air is a long-term plan based on the bestinformation and resources available in 1997.Because of its 25-year time frame, it is an adaptiveplan that will be monitored and evaluated againstits own goals. Each new stage of research andplanning will take into account the cumulativeimpact of the strategies of the previous phase.
The final key objective of Action for Air is toprovide for ongoing monitoring and development of
39
The Action Plan in detail

the Regional Action Plan based on scientific,economic and social information, widecollaboration, and open and full consultation.
The major strategies for achieving this are:
� improving access to air quality monitoring dataand modelling results
� ensuring an effective and regular review processfor the plan is in place
� reporting regularly on the state of air quality inNSW.
Monitor, report, reviewIt is the cumulative effect of actions over manyareas by government, industry and thecommunity that will maintain and improve ourair quality in the future. As a community, weneed open and accessible ways of monitoringthis cumulative process.
The NSW Government already monitors andreports on air quality in the GMR and assistslocal government in some regional areas toestablish local monitoring programs. Thecommunity has daily access to this informationthrough television and newspaper weatherreports. In addition, the EPA publishes quarterlyreports on air quality. There is considerablecommunity, local government and academicinterest in this information.
Action 7.1. Provide Internet access to air qualitydata by mid-1998
The EPA will upgrade community access to data onair quality by providing Internet access to daily andquarterly reports by mid-1998.
Action 7.2. Set up an air quality modellinginterest/advisory group
The Metropolitan Air Quality Study (MAQS) hasdeveloped the capacity for sophisticated modellingof long-term air quality trends, including thepredicted impact of policy interventions. TheGovernment will open this process to greaterindustry, community and scientific participation.
The EPA will set up an air quality modellinginterest/advisory group with representatives fromcommunity interest groups, universities, CSIRO,
industry and government. The group will provide aforum to identify priorities for future modelling work.
Action 7.3. Report on results of the air toxics study
The Government has provided the EPA with$500,000 to investigate the levels of air toxics in theGMR. This will build on the pilot air toxics study ofthe Sydney airshed in 1996, and provide a sound basisfor assessing the need for specific actions to protectthe community from unsafe levels of these toxics.
The EPA will report on the results of its pilotstudy in early 1998 and on its more comprehensivemonitoring data when completed.
Action 7.4. Reconvene key technical committeeswith industry groups
The joint EPA/Industry Technical Committees willbe reconvened to undertake further work. This willinclude investigating innovative responses tounresolved issues, especially pollution from heavyvehicles, and fuel quality issues.
Action 7.5. Metropolitan Strategy Committee toreview environmental matters
The Metropolitan Strategy Committee, a whole-of-government body that coordinates integrated landuse, transport and environment planning, willannually review environmental considerationsincluding the achievement of air quality goals. Thiswill provide an important link between urbanplanning and environmental planning.
Action 7.6. Convene a public forum to reportregularly to Government
The NSW State of the Environment Reports mustbe produced and tabled in parliament every 3 years.
State of the Environment reporting provides anideal opportunity for public review of the status ofour air quality and the effectiveness of air qualitystrategies. It is an ideal context for identifyingemerging issues, new technologies and possiblesolutions. The EPA will convene a broadly basedforum within six months of the publication of eachNSW State of the Environment report to encouragepublic input on air quality trends and strategies. Theforum’s report to the Government will help guidefuture development of the Action Plan.
40
Action for Air

The strategies in the Regional Action Plan wereselected on the basis of feasibility, communityacceptance, and both environmental and economiceffectiveness.
Modelling
The photochemical smog strategies were modelledfor environmental and economic impact over the25-year timeframe set for Action for Air.
The Metropolitan Air Quality Study (MAQS)provided the tools for the environmental impactmodelling, with scenarios ranging from ‘No NewInitiatives’ to the ultimate ‘Beyond State of the Art’in control and management. Modelling allows forthe projection of the peak levels of ozone that mightoccur under worst-case conditions but does notallow for projection of the number of possibleexceedences in any one year.
No new initiatives
This scenario provides for no new strategies butassumes existing control programs will continueuntil 2021. It reveals that gains in air quality willcontinue using this approach and peak ozone levelswill continue to be reduced—although they will notachieve NSW interim or long-term goals. Ongoingreduction of peak ozone levels in this scenariocomes through the phasing-in of strategies alreadyagreed upon, particularly relating to new motorvehicle standards such as ADR 37/01.
Beyond state-of-the-art
This scenario incorporates an exhaustive array ofstate-of-the-art initiatives and an 18% reduction inthe total projected VKT in 2021. Many of thesestrategies are not available for currentimplementation in NSW—e.g. the development ofultra-low emission vehicles (foreshadowed inCalifornia) or extensively reformulated motor fuel.The modelling reveals this level of control may benecessary to ensure the current NHMRC ozonegoal is not exceeded by 2021. Even this extensivesuite of strategies may not ensure that there are noexceedences of the Government’s long-term ozonegoal by 2021. Progressive monitoring of the
effectiveness of strategies will be needed ifcompliance with the long-term goal is to beachieved.
AQMP package
This scenario estimates the impact of all the smog-management strategies outlined in Action for Air.The strategies will ensure substantial improvementin air quality by 2021, but the model indicates theGovernment’s short-term and long-term ozonegoals may still be exceeded on occasion underworst-case conditions. Therefore, ongoing review ofthe effectiveness of the strategies will be essential.
The strategies will be re-evaluated regularly inthe light of new air quality data, trends andtechnological advances, allowing the Governmentto augment strategies as needed.
Economic impact analysis
The EPA has undertaken cost-effectiveness analysisof the various strategies, focusing on the cost ofreducing the smog precursors NOx, ROCs and CO.Many of the strategies will also bring aboutreductions in fine particle emissions, air toxics andgreenhouse gases.
Information was gathered from a range ofsources. First, the EPA commissioned PeterRamsey and Associates to collect data on industrialcontrol costs and effectiveness. The resultingreport, Air Pollution Prevention and Control OptionCosts (June 1996) identified a number of cost-effective options for smog-reduction strategies.Some of these were identified as likely to achievecost savings for industry through cleanerproduction.
To gain direct local information, jointEPA/Industry Technical Committees were set upacross a number of areas: petroleum, natural gas,power generation, surface coatings and adhesives,chemical manufacturing, dry cleaning, printing,bitumen and aerosols. The committees developedlocal cost data and cost-effectiveness analyses ofproposed strategies. Industry, particularly thepetroleum industry, made considerable helpful dataavailable; other cost data were gathered from State
41
4 How were the strategies selected?

and national industry associations. Overseas costdata were collected for comparative purposes andused in some contexts where local data were notavailable.
The results of this costing analysis for keystrategies are summarised in Appendix 3.
42
Action for Air

Although Action for Air focuses on air quality at theregional level, the Government recognises thatlocal, regional and global air-quality issues areinterconnected, and is committed to action at theglobal and local levels as well.
Air quality in NSW is improving as a result ofexisting strategies to control emissions. This sectionexplores the range of initiatives that have alreadybeen put in place to alleviate global, regional andlocal air quality problems.
Global issues
Background
Ozone is present in both the lower and upperatmospheres. In the upper atmosphere (more than10km above the Earth) ozone plays an essential rolein protecting plant and animal life from the harmfuleffects of ultraviolet radiation.
The NSW State of the Environment Reportspresent information on the depletion of ozone overAustralia, and its potential health implications.Scientists have calculated that ozone depletionwould result in a 5-10% increase in UV-B radiationin Sydney between 1990 and 2000.
Climate change is the other major problem atthe global level. The presence of greenhouse gasesin the atmosphere has an insulating effect whichleads to warming of the Earth’s surface: greenhousegases such as carbon dioxide, methane and nitrousoxides trap part of the heat being radiated from theEarth back into space. While the ‘greenhouseeffect’ occurs naturally and is essential forsustaining life on Earth, scientists now generallybelieve that the accumulation in the atmosphere ofincreased amounts of greenhouse gases producedby human activities—particularly by burning fossilfuels—is intensifying global warming.
Response
Climatic change and greenhouse gases are beingtackled through a broad NSW State strategy—set inthe context of the National Greenhouse Strategy—which is the key institutional driver for the
development of renewable energy sources, researchand development policy, and improved energyefficiency in the community.
The effort is spearheaded by the NSWSustainable Energy Development Authority(SEDA), established in 1996 to reduce the level ofgreenhouse gas emissions in NSW by investing inthe commercialisation and use of sustainable energytechnologies. The NSW strategy also includesproactive legislative reform of the electricityindustry, as well as programs to control clearing ofnative vegetation. Because the transport sector is amajor generator of greenhouse gas emissions inNSW, further benefits will flow from implementingAction for Air.
The relationship between greenhouse gasabatement and air quality strategies is complex.Although reducing fossil fuel emissions will improveoverall air quality, some strategies may put pressureon local and regional air quality. For example,cogeneration results in lower overall greenhouse-gasemissions by improving the efficiency of energyuse—but it inevitably creates NOx. The need forreducing greenhouse gas emissions will have to bebalanced with the need to improve regional andlocal air quality.
Implementation of the NSW Ozone ProtectionRegulation 1997 has brought NSW in line withnational policies on ozone protection and control ofhydrochlorofluorocarbons.
Regional issues
Background
The major regional air pollutants in the GMR andtheir effects on human health have already beendiscussed (see ‘What’s The Problem?’ p. 9).
Response
An important achievement in regional air qualitymanagement is the Metropolitan Air Quality Study(MAQS), which set up a crucial airshed modellingand air quality monitoring system for Sydney, theIllawarra and the Lower Hunter, and generates
43
5 From global to local – achievements to date

important scientific information on smog formationand transportation.
The Health and Air Research Program 1995examined the health effects of major pollutants inparts of the GMR and provided a key rationale forthe development of further strategies to addressphotochemical and fine-particle air pollution.
Two NSW Government green papers on airquality management were released for publicconsultation in May 1996. Responses to thesesignificantly shaped the strategies contained inAction for Air. Appendix 1 provides details on theresponses to the documents.
New, never-to-be-exceeded air quality emissionstandards for industry and controls on motorvehicles were implemented in revamped Clean AirRegulations in August 1997.
Regulatory and education strategies to reducefine-particle/brown haze pollution were initiated in1996 and 1997, including regulations to requirenew wood heaters to be certified to the AustralianStandard and beginning a voluntary ‘Don’t LightTonight’ alert on high pollution days.
Innovative education programs on air qualityhave included:
� the successful Small Business andEnvironmental Solutions to Pollution Programrun cooperatively by the EPA, local councils andsmall business
� the innovative ‘Air Watch Breathe Easy’ AirQuality Monitoring Program for schools andcommunity groups
� State participation in the National SmogbustersProgram.
NSW has actively participated in the followingnational initiatives on air quality:
� development of the National EnvironmentProtection Measure (NEPM) for air quality,covering ozone, sulfur dioxide, nitrogen dioxide,lead, carbon monoxide and fine particles
� development of the NEPM for a NationalPollution Inventory
� the National Inquiry into Urban Air Quality
� national forums to set standards to reduceemissions from motor vehicles.
Local issues
Background
The major air pollutants at the local level are lead,air toxics, carbon monoxide and sulfur dioxide.
Lead is a toxic metal than can damage humanhealth when inhaled or ingested. Recent overseasresearch indicates a strong correlation betweenblood lead concentrations in children under four,and lead concentrations in the air. Lead is known tocause learning disabilities and to retard mentaldevelopment in children.
The main sources of lead in air are cars usingleaded petrol, and base-metal works.Concentrations are now well below NHMRCguidelines, even in the Sydney CBD. Occasionalexceedences occur in Port Kembla and northernLake Macquarie.
The Government has signalled lead as a priorityissue.
Air toxics are airborne pollutants that cancause cancer or otherwise harm health and theenvironment. They can be naturally-occurring or ofhuman origin. Nearly 200 hazardous air pollutantshave been identified by the US EPA, includingbenzene, dioxins, cadmium, organochlorides,halogenated ethylenes and PCBs.
Although overseas goals do exist for a few airtoxics, there is generally neither good informationnor any standard process in Australia for settinggoals.
Air toxics have been identified as a priority issueby the NSW Government and nationally.
Carbon monoxide is an asphyxiant thatreduces the oxygen-carrying capacity of the blood,placing additional strain on the heart as it increasesits output to compensate.
Monitoring of results from the regional networkshow that the NHMRC goal has not been exceededexcept at the monitoring station in the centre of theSydney CBD. This station is purposely set up tomonitor peak concentrations rather than the generalexposure of the population. Concentrations at thissite are declining.
Sulfur dioxide can irritate the respiratorysystem, contributing to diseases such as chronicbronchitis. Ambient sulfur dioxide in NSW results
44
Action for Air

largely from combustion of fossil fuels and smeltingof mineral ores containing sulfur. Major sources arepower stations, oil refineries and base-metalprocessing plants.
Exceedence of sulfur dioxide goals is associatedwith relatively few industrial premises and withpower generation from coal. Regional concentrationmeasures by the MAQS network show fewinstances of any established health goals beingexceeded. NSW is fortunate that its fossil fuels arerelatively low in sulfur.
Response
In 1996, a Lead Reference Centre was establishedto coordinate a whole-of-government response tomanaging all lead hazards, including lead-related airquality programs. There has been a dramaticimprovement in the level of lead in our air, and thisneeds to continue.
Following a pilot study of selected air toxics inSydney in 1996, the Government has allocated$500,000 to establish an ongoing air toxicsmonitoring program to quantify the toxic organiccompounds present in the ambient air and developan inventory of emissions from stationary anddiffuse air-pollutant sources.
Integrated programs
The development by local councils in NSW ofLocal Air Quality Management Plans (LAQMPs)contributes positively to global, regional and localair quality. In 1994, the Sydney RegionalOrganisation of Councils published a manual onlocal air quality management (Innovative Ways ofWorking Together), to guide local councils ondeveloping their own LAQMPs. A significantnumber of councils have begun to develop anLAQMP and others are committed to developingone.
Partnerships with industry and communitygroups are growing—e.g. the NRMA Clean Air2000 Task Force. In June 1995, the NRMAlaunched a Clean Air 2000 campaign designed toreduce air pollution and traffic congestion in theGMR by the year 2000. The campaign’s coreactivities are community education and efforts tomobilise key players. Clean Air 2000 is animportant complement to Action for Air.
45
From global to local – achievements to date

Appendix 1. Community feedback on airquality
Summary of main issues covered byresponses to the green papers
The 70 submissions canvassed a wide range ofissues with the following issues or recommendedactions being mentioned most often:
Issue No. of mentions
� Carry out more extensive cost/benefit analysis 17
� Introduce financial incentives to encourageenvironmental improvements 16
� Coordinate all levels of government, industry,community 15
� Increase public education 15
� Establish performance measures forimplemented strategies 12
� Increase the provision of public transport 11
� Employ more extensive long-term urbanplanning 11
� Clearly define proposed action 10
� Ensure whole-of-government approach 9
� Green papers contain inadequate publictransport options 9
� Ensure enforcement of legislation 9
� Promote national approach 9
� AQMP uncertain until verification ofMetropolitan Air Quality Study results 8
� Green papers adequately cover air qualitycauses, effects, responses 8
� Ensure strategies foster economic/social equity 8
� Reduce motor vehicle emissions 8
� Employ more extensive transport planning 8
� Ensure strategies avoid financial impost onindustry, agriculture 7
� Increase use of rail freight 7
� Set ecologically sustainable development, nothealth, goals 7
� Increase traffic management 7
� Encourage decentralisation 6
� Promote energy efficient building design 6
� Introduce fuel levy to subsidise environmentalimprovements 6
� Introduce vehicle inspection/maintenanceprogram 6
� Foster motor vehicle/VKT reduction 6
� Utilise new technology 6
� Green papers do not assign ownership ofproposed actions 6
� Support local air quality managemnt planprocess 6
List of respondents to the AQMP and SAPgreen papers
Government agencies
� Department of State and Regional Development
� Department of Urban Affairs and Planning
� Environment Protection Agency (nowEnvironment Australia)
� NSW Treasury
� State Rail Authority
Local government
� Botany Bay City Council
� Camden Council
� Dungog Shire Council
� Fairfield City Council
� Ku-ring-gai Municipal Council
� Newcastle City Council
� Penrith City Council
� South Sydney City
� Southern Sydney Regional Organisation ofCouncils
� Sutherland Shire Council
� Sydney Regional Organisations of Councils
� Western Sydney Regional Organisation ofCouncils
� Wollongong City Council
46
Action for Air
Appendixes

Industry
� AGL Gas Co (NSW)
� Ampol
� Australian Chemical Specialties ManufacturersAssociation
� Australian Institute of Company Directors
� Australian Institute of Petroleum Ltd
� BHP
� BP Aust Ltd
� Catco Australia Pty Ltd
� Exhaust Systems Professional Association
� Macquarie Generation
� NSW Farmers Association
� NSW Minerals Council
� Pacific Power
� PPM Pty Ltd
� Shell Company of Australia Ltd
� State Chamber of Commerce (NSW)
� Telecommuting Australia Pty Ltd
� Waste Contractors and Recyclers Association ofNSW
� Environment/community groups
� Bicycle New South Wales
� Clean Air Society of Australia and New Zealand
� NRMA Clean Air 2000
� Total Environment Centre
� Willoughby Environmental ProtectionAssociation
Individuals
� Mr A Batton, Moss Vale
� Mr G Borell, Petersham
� Mr R Burgess, Cronulla
� Mr S Clough, Hunters Hill
� Ms B Delaney, Greystanes
� Mr G Duff, Connells Point
� Mr J Fulford, Mittagong
� Ms H Gillett, Mt Warrigal
� Ms J Haim, Greystanes
� Mr W Hawtin, Rozelle
� Mr E Jefferay, Point Clare
� Mr I Jeisman, Yandina, Qld
� Mr M Kachka, Baulkham Hills
� Assoc Prof P Laird, University of Wollongong
� Mr P Lawson, Marsfield
� Ms K McDonnell, Hornsby Heights
� Mr P McKee, Northbridge
� Mr T Mohr, West Ryde
� Mr C Morgan, Chiswick
� Mr P Morison, Double Bay
� Mr P Motbey, Granville
� Mr M Oliver, Collaroy
� Mr D Owers, Dudley
� Mr R Pevely, Alfords Point
� Mr J Platt, Figtree
� Ms M Sinclair, St Marys
� Mr G Walker, Ingleburn
� Anonymous (2)
Appendix 2. Local councils committedto a local air quality management plan
The following councils have indicated that they arecommitted to a local air quality management plan:
� Bankstown
� Baulkham Hills
� Blacktown
� Botany Bay
� Camden/Campbelltown/Wollondilly
� Canterbury
� Fairfield
� Holroyd
� Kogarah
� Liverpool
� Marrickville
� Mosman
� North Sydney
� Parramatta
� Randwick
� Rockdale
� South Sydney
� Sutherland Shire
� Waverley
� Wollongong
47
Appendixes

Strategy(possibleimplementation date)
National strategies
New passenger vehicleemission standards(2003)
New heavy duty truckemission standards(2003)
State strategies
Inspection &maintenance program(1998-2000)
Lower fuel volatility(1998-2001)
Major industry ROCcontrols (1998-2003)
Commercial premisesROC controls
Printing (1998-2006)
Auto repair (1997-2002)
Install petrol vapourrecovery units at railloading gantries (1999)
Financial impacts
$250-$650 per vehicle
$1,300-$10,000 pertruck
$20-$25 per inspection(excluding repairs andfuel savings)
Less than $0.002 perlitre (excluding fuelsavings)
$50-$100,000 perrefinery/petrochemicalfacility (less productsavings)
N/A
Net savings
$1.5m per gantry
Average annualemission reductions(tonnes per year)
75,200 tonnes (ROC,NOx & 1/7CO)
1,800 tonnes (ROC,NOx & 1/7CO)
18,800-26,500 tonnes(ROC, NOx & 1/7CO)
5,800-8,300 tonnes(ROC, NOx & 1/7CO)
2,600 tonnes ROC
1,200-2,800 tonnes ROC
315 tonnes ROC
310 tonnes ROC
Cost-effectiveness($ per tonne reduced)
$460-$1,600
$440-$3,500
$1,800-$5,100
$190-$320
$85-$160
$1,100-$2,300
Net savings
$820
48
Action for Air
Appendix 3. Estimated cost, effectiveness and cost-effectiveness of Action for Airsmog action strategies
Notes: ROC = reactive organic compounds. NOx = oxides of nitrogen CO = Carbon monoxide. The abovestrategies would be implemented at different times. For example an inspection and maintenance programin Sydney may be operational by 1998 whereas further new passenger vehicle emission standards may notbe in effect until 2003.