Embed Size (px)
Citation preview
1 | P a g e
Action Area 5 Questionnaire
Summary of information received from 43 non-Annex I Parties1
Table of contents
1. Extreme weather events & slow onset events ....................................................................... 2
2. Addressing climate change aspects ........................................................................................ 2
3. Key development sectors ....................................................................................................... 3
4. Climate risk analysis ............................................................................................................... 4
5. Challenges in integrating long-term changes ......................................................................... 5
6. Vulnerable groups .................................................................................................................. 5
7. Comprehensive national disaster risk management process /plan/strategy ........................ 5
8. Information gaps .................................................................................................................... 6
9. Key public authorities/institutions ......................................................................................... 7
10. Key intergovernmental and non-governmental organizations ............................................ 7
11. Mechanisms for coordination .............................................................................................. 8
12. National legislation ............................................................................................................... 8
Annexes ...................................................................................................................................... 9
1 UNFCCC secretariat, Loss and Damage team, 27 June 2017.
In implementing Action Area 5 of its initial two-year workplan, the Executive Committee of the Warsaw International Mechanism (Executive Committee) invited relevant national entities, through a questionnaire, to describe the systems and/or processes currently in place for conducting and coordinating analyses of climate risk and loss and damage associated with the adverse effects of climate change, taking into account extreme and slow onset events. The questionnaire was sent to the UNFCCC focal points of all the non-Annex I Parties on two occasions: 2 August 2016 and 4 April 2017. This paper summarizes the 43 responses received as at 16 June 2017 (see Annex 1 for the list of respondents). Where possible qualitative information is illustrated with the help of graphs. The information provided will serve as an input into the work of the Executive Committee, in particular the preparation of a paper, mandated under activity (c), Action Area 5 of its initial two-year workplan, with a view to consolidating experiences and lessons learned and identifying priority areas for increasing capacity and investment.
2 | P a g e
0% 20% 40% 60% 80% 100%
Land & forest degradation
Rising temperatures
Loss of biodiversity
Sea level rise
Salinisation
Desertification
Ocean acidification
Glacial retreat & related impacts
Slow onset events
Relevant Integrated into DRM
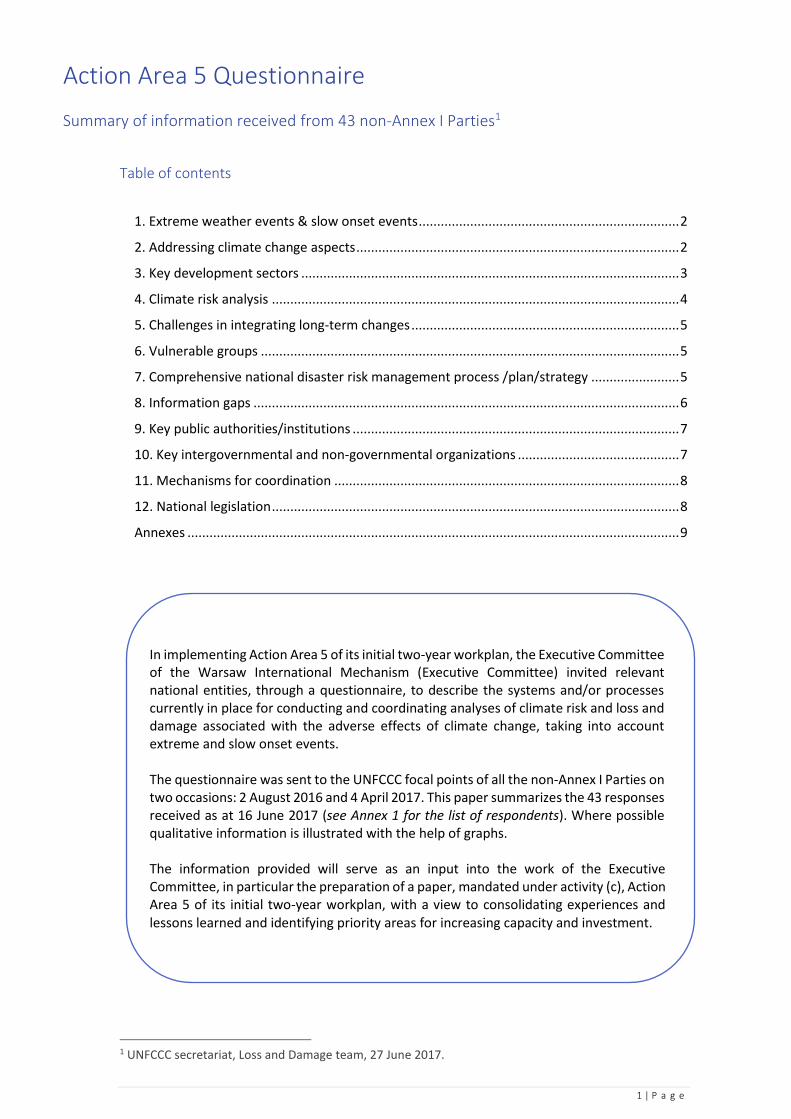
1. Extreme weather events & slow onset events The graphs below illustrate the relevance of extreme weather events and slow onset events to countries and the degree to which each of these is integrated into countries’ disaster risk management.
2. Addressing climate change aspects The graph shows the extent to which countries are not able to adequately address or implement those aspects.
0% 20% 40% 60% 80% 100%
Drought
Flood
Extreme precipitation
Extreme high temperatures
Extreme wind
Forest fires
Storm surge
Landslides
Tropical cyclone / Hurricane / Typhoon
Extreme low temperatures
Extreme weather events
Relevant Integrated into DRM
86%
77%
74%
74%
72%
65%
65%
60%
53%
0% 10% 20% 30% 40% 50% 60% 70% 80% 90% 100%
Data and knowledge of non-economic losses associated with the adverse effects ofclimate change
Data and knowledge of economic losses associated with the adverse effects ofclimate change
Data/projections of climate impact on natural hazards at sub-national level
Data/ projections of climate impact on natural hazards at sectoral level
Well-functioning national coordination mechanism to assess the adverse effects ofclimate change
Data/projections of climate impact on natural hazards at national level
Data/knowledge of vulnerability at sub-national level
Relevance of the adverse effects of climate change for your national disaster riskmanagement
Data/knowledge of vulnerability at national level
3 | P a g e
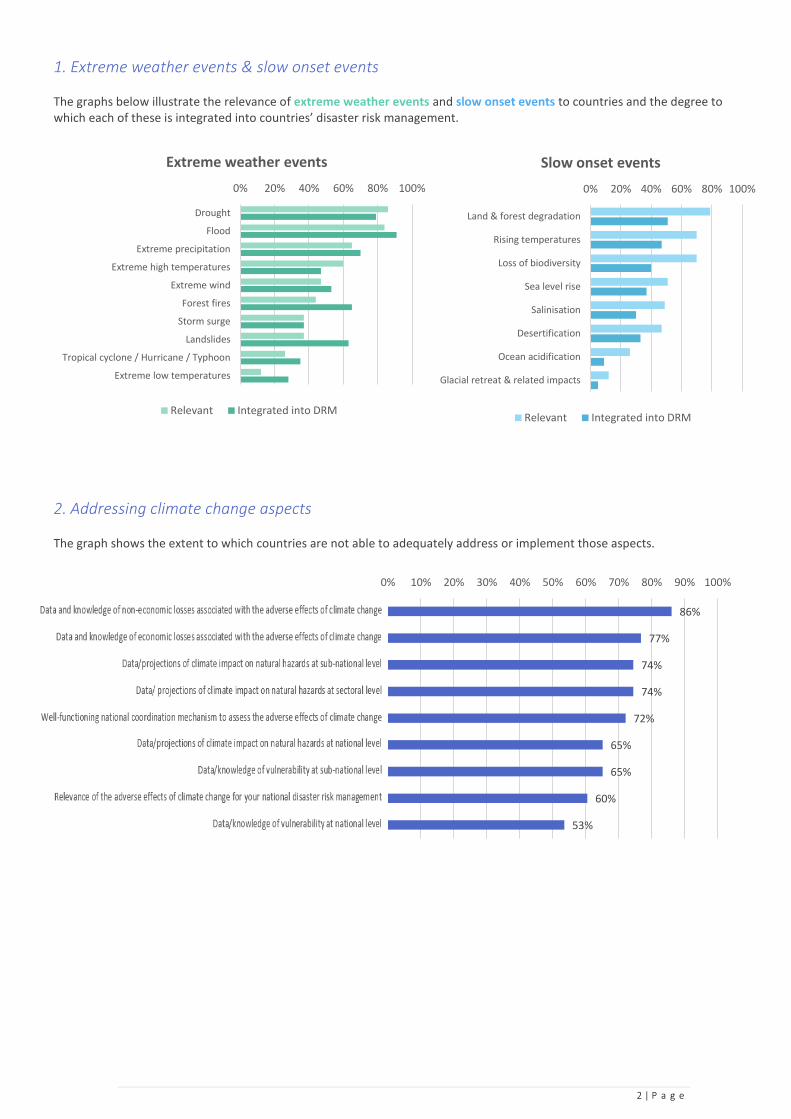
3. Key development sectors The graph below illustrates the key development resources or sectors indicated by countries to be at higher risk or have been
most impacted or adversely affected by extreme and/or slow onset events.
The most important elements from the following four key development sectors that countries consider might have been or have been damaged or lost in relation to extreme and slow onset events are as follows:
Forests & ecosystems – Water resources – Infrastructure – Agriculture & food security
Annex 2 contains details pertaining to each sector and the most important elements from each sector that may have been
damaged or have been lost in relation to extreme and/or slow onset events.
100% 95%91%
86% 84%
70%
0%
20%
40%
60%
80%
100%
Water resources Agriculture & foodsecurity
Health Infrastructure Forests & ecosystems landloss
4 | P a g e
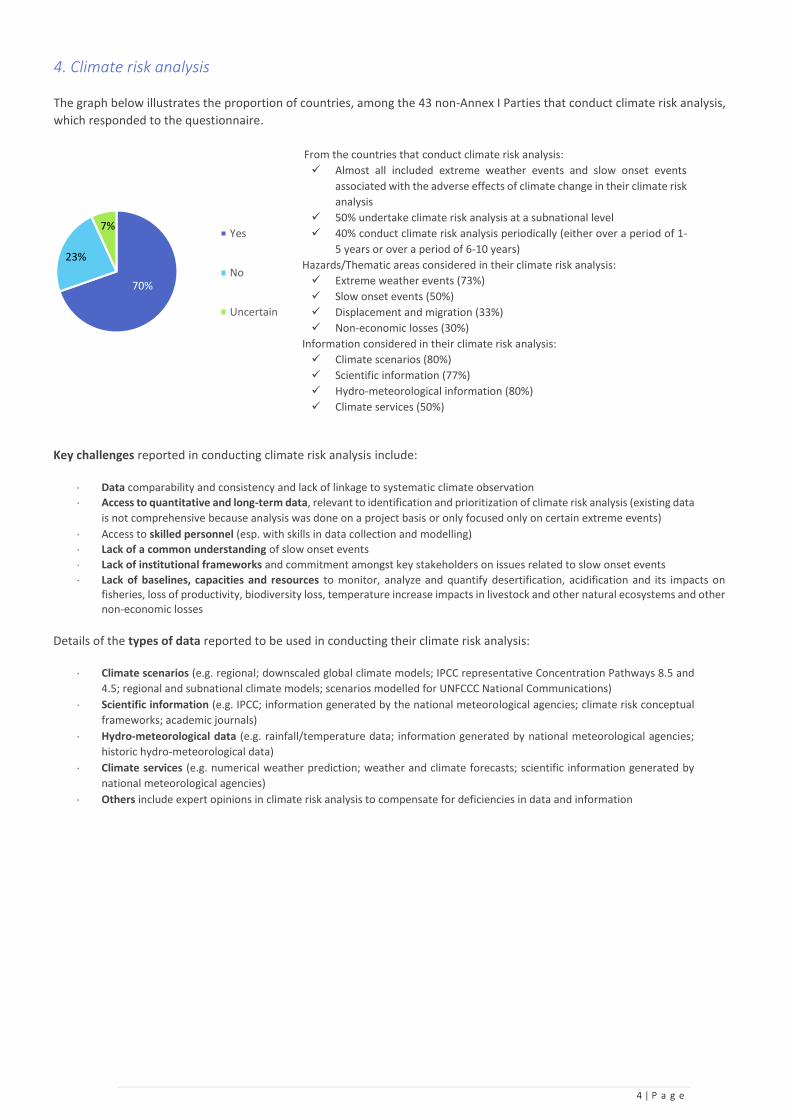
4. Climate risk analysis
The graph below illustrates the proportion of countries, among the 43 non-Annex I Parties that conduct climate risk analysis,
which responded to the questionnaire.
From the countries that conduct climate risk analysis:
Almost all included extreme weather events and slow onset events
associated with the adverse effects of climate change in their climate risk
analysis
50% undertake climate risk analysis at a subnational level
40% conduct climate risk analysis periodically (either over a period of 1-
5 years or over a period of 6-10 years)
Hazards/Thematic areas considered in their climate risk analysis:
Extreme weather events (73%)
Slow onset events (50%)
Displacement and migration (33%)
Non-economic losses (30%)
Information considered in their climate risk analysis:
Climate scenarios (80%)
Scientific information (77%)
Hydro-meteorological information (80%)
Climate services (50%)
Key challenges reported in conducting climate risk analysis include:
Data comparability and consistency and lack of linkage to systematic climate observation
Access to quantitative and long-term data, relevant to identification and prioritization of climate risk analysis (existing data
is not comprehensive because analysis was done on a project basis or only focused only on certain extreme events)
Access to skilled personnel (esp. with skills in data collection and modelling)
Lack of a common understanding of slow onset events
Lack of institutional frameworks and commitment amongst key stakeholders on issues related to slow onset events
Lack of baselines, capacities and resources to monitor, analyze and quantify desertification, acidification and its impacts on fisheries, loss of productivity, biodiversity loss, temperature increase impacts in livestock and other natural ecosystems and other non-economic losses
Details of the types of data reported to be used in conducting their climate risk analysis:
Climate scenarios (e.g. regional; downscaled global climate models; IPCC representative Concentration Pathways 8.5 and
4.5; regional and subnational climate models; scenarios modelled for UNFCCC National Communications)
Scientific information (e.g. IPCC; information generated by the national meteorological agencies; climate risk conceptual
frameworks; academic journals)
Hydro-meteorological data (e.g. rainfall/temperature data; information generated by national meteorological agencies;
historic hydro-meteorological data)
Climate services (e.g. numerical weather prediction; weather and climate forecasts; scientific information generated by
national meteorological agencies)
Others include expert opinions in climate risk analysis to compensate for deficiencies in data and information
70%
23%
7%Yes
No
Uncertain
5 | P a g e
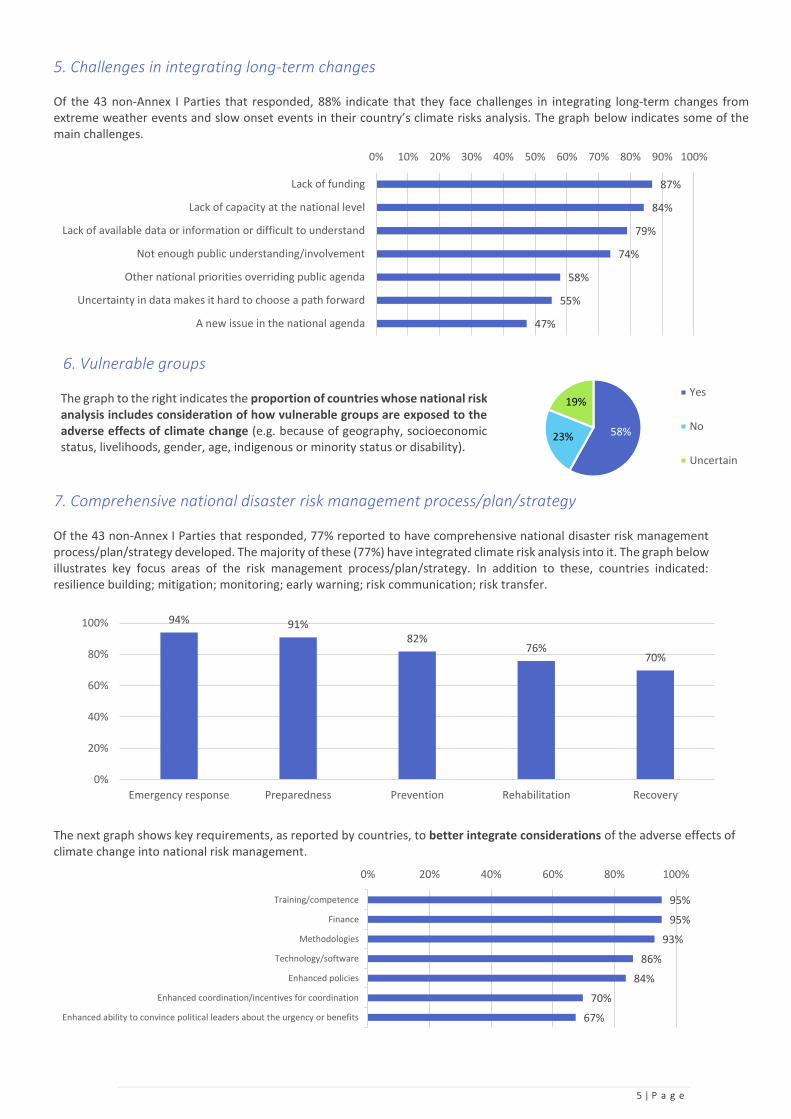
58%23%
19%Yes
No
Uncertain
5. Challenges in integrating long-term changes Of the 43 non-Annex I Parties that responded, 88% indicate that they face challenges in integrating long-term changes from extreme weather events and slow onset events in their country’s climate risks analysis. The graph below indicates some of the main challenges.
6. Vulnerable groups
The graph to the right indicates the proportion of countries whose national risk analysis includes consideration of how vulnerable groups are exposed to the adverse effects of climate change (e.g. because of geography, socioeconomic status, livelihoods, gender, age, indigenous or minority status or disability).
7. Comprehensive national disaster risk management process/plan/strategy Of the 43 non-Annex I Parties that responded, 77% reported to have comprehensive national disaster risk management process/plan/strategy developed. The majority of these (77%) have integrated climate risk analysis into it. The graph below illustrates key focus areas of the risk management process/plan/strategy. In addition to these, countries indicated: resilience building; mitigation; monitoring; early warning; risk communication; risk transfer.
The next graph shows key requirements, as reported by countries, to better integrate considerations of the adverse effects of climate change into national risk management.
87%
84%
79%
74%
58%
55%
47%
0% 10% 20% 30% 40% 50% 60% 70% 80% 90% 100%
Lack of funding
Lack of capacity at the national level
Lack of available data or information or difficult to understand
Not enough public understanding/involvement
Other national priorities overriding public agenda
Uncertainty in data makes it hard to choose a path forward
A new issue in the national agenda
94% 91%82%
76%70%
0%
20%
40%
60%
80%
100%
Emergency response Preparedness Prevention Rehabilitation Recovery
95%
95%
93%
86%
84%
70%
67%
0% 20% 40% 60% 80% 100%
Training/competence
Finance
Methodologies
Technology/software
Enhanced policies
Enhanced coordination/incentives for coordination
Enhanced ability to convince political leaders about the urgency or benefits
6 | P a g e
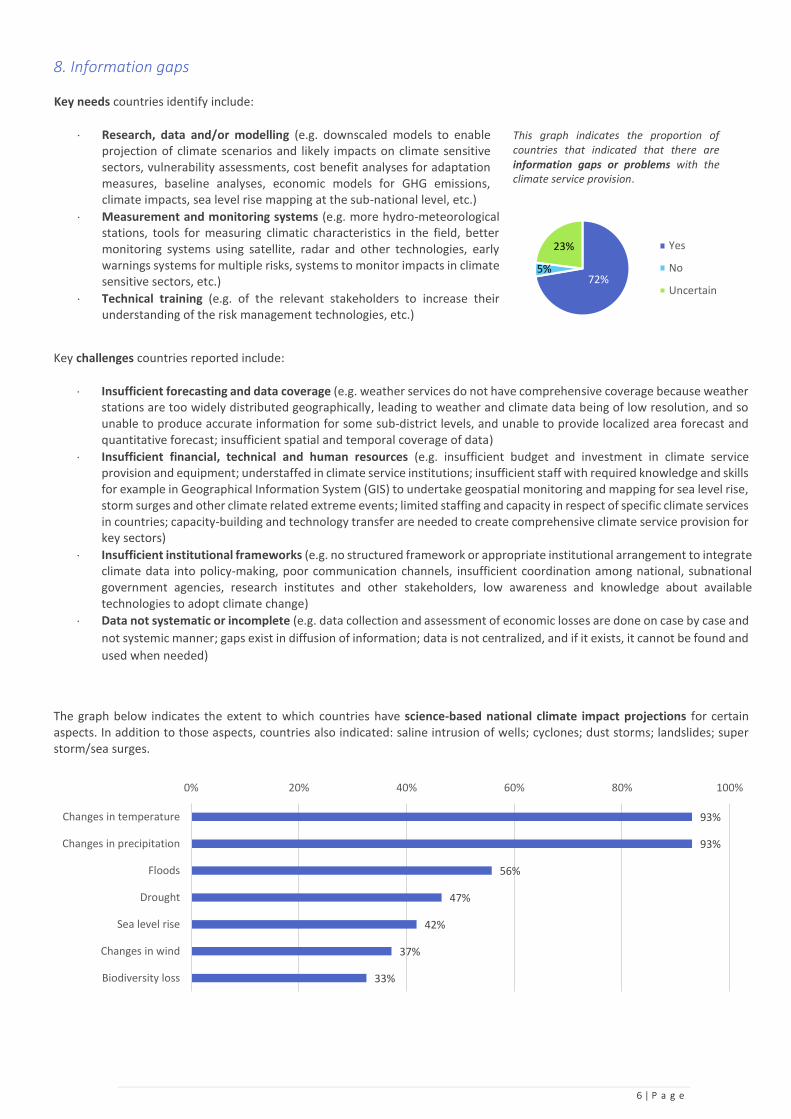
8. Information gaps Key needs countries identify include:
Research, data and/or modelling (e.g. downscaled models to enable projection of climate scenarios and likely impacts on climate sensitive sectors, vulnerability assessments, cost benefit analyses for adaptation measures, baseline analyses, economic models for GHG emissions, climate impacts, sea level rise mapping at the sub-national level, etc.)
Measurement and monitoring systems (e.g. more hydro-meteorological stations, tools for measuring climatic characteristics in the field, better monitoring systems using satellite, radar and other technologies, early warnings systems for multiple risks, systems to monitor impacts in climate sensitive sectors, etc.)
Technical training (e.g. of the relevant stakeholders to increase their understanding of the risk management technologies, etc.)
Key challenges countries reported include:
Insufficient forecasting and data coverage (e.g. weather services do not have comprehensive coverage because weather stations are too widely distributed geographically, leading to weather and climate data being of low resolution, and so unable to produce accurate information for some sub-district levels, and unable to provide localized area forecast and quantitative forecast; insufficient spatial and temporal coverage of data)
Insufficient financial, technical and human resources (e.g. insufficient budget and investment in climate service provision and equipment; understaffed in climate service institutions; insufficient staff with required knowledge and skills for example in Geographical Information System (GIS) to undertake geospatial monitoring and mapping for sea level rise, storm surges and other climate related extreme events; limited staffing and capacity in respect of specific climate services in countries; capacity-building and technology transfer are needed to create comprehensive climate service provision for key sectors)
Insufficient institutional frameworks (e.g. no structured framework or appropriate institutional arrangement to integrate climate data into policy-making, poor communication channels, insufficient coordination among national, subnational government agencies, research institutes and other stakeholders, low awareness and knowledge about available technologies to adopt climate change)
Data not systematic or incomplete (e.g. data collection and assessment of economic losses are done on case by case and
not systemic manner; gaps exist in diffusion of information; data is not centralized, and if it exists, it cannot be found and
used when needed)
The graph below indicates the extent to which countries have science-based national climate impact projections for certain aspects. In addition to those aspects, countries also indicated: saline intrusion of wells; cyclones; dust storms; landslides; super storm/sea surges.
93%
93%
56%
47%
42%
37%
33%
0% 20% 40% 60% 80% 100%
Changes in temperature
Changes in precipitation
Floods
Drought
Sea level rise
Changes in wind
Biodiversity loss
This graph indicates the proportion of countries that indicated that there are information gaps or problems with the climate service provision.
72%5%
23% Yes
No
Uncertain
7 | P a g e
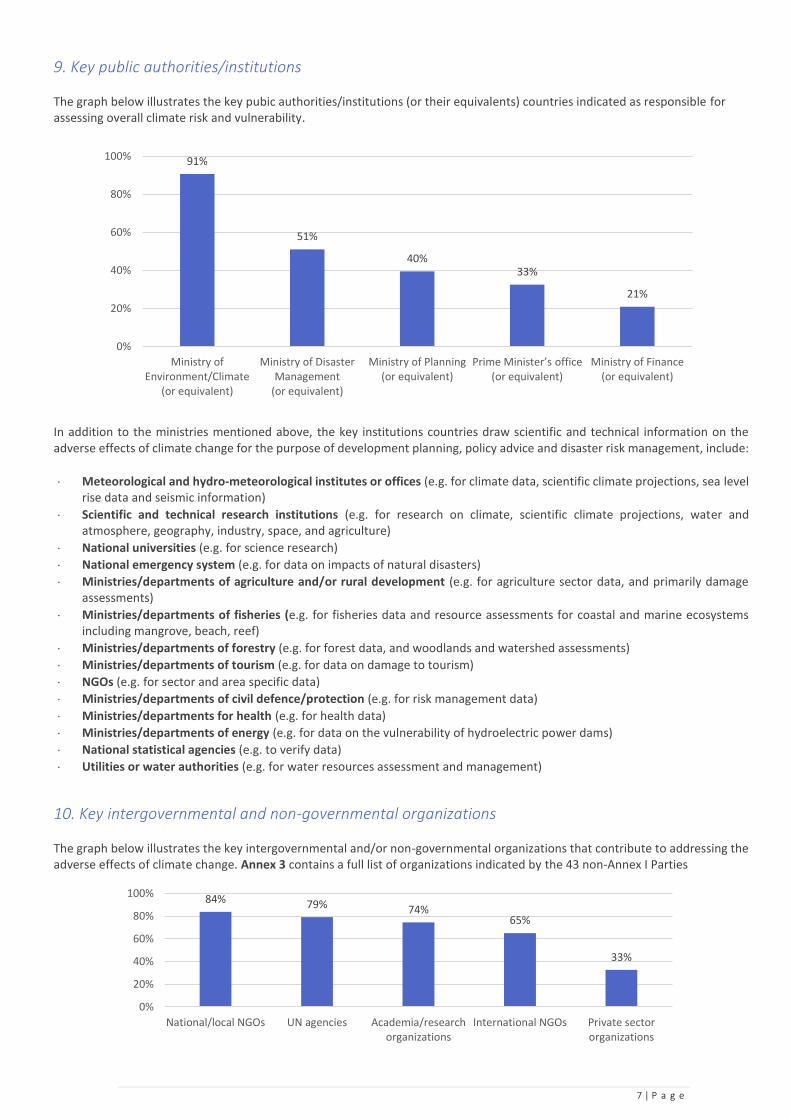
9. Key public authorities/institutions The graph below illustrates the key pubic authorities/institutions (or their equivalents) countries indicated as responsible for assessing overall climate risk and vulnerability.
In addition to the ministries mentioned above, the key institutions countries draw scientific and technical information on the adverse effects of climate change for the purpose of development planning, policy advice and disaster risk management, include:
Meteorological and hydro-meteorological institutes or offices (e.g. for climate data, scientific climate projections, sea level rise data and seismic information)
Scientific and technical research institutions (e.g. for research on climate, scientific climate projections, water and atmosphere, geography, industry, space, and agriculture)
National universities (e.g. for science research)
National emergency system (e.g. for data on impacts of natural disasters)
Ministries/departments of agriculture and/or rural development (e.g. for agriculture sector data, and primarily damage assessments)
Ministries/departments of fisheries (e.g. for fisheries data and resource assessments for coastal and marine ecosystems including mangrove, beach, reef)
Ministries/departments of forestry (e.g. for forest data, and woodlands and watershed assessments)
Ministries/departments of tourism (e.g. for data on damage to tourism)
NGOs (e.g. for sector and area specific data)
Ministries/departments of civil defence/protection (e.g. for risk management data)
Ministries/departments for health (e.g. for health data)
Ministries/departments of energy (e.g. for data on the vulnerability of hydroelectric power dams)
National statistical agencies (e.g. to verify data)
Utilities or water authorities (e.g. for water resources assessment and management)
10. Key intergovernmental and non-governmental organizations The graph below illustrates the key intergovernmental and/or non-governmental organizations that contribute to addressing the adverse effects of climate change. Annex 3 contains a full list of organizations indicated by the 43 non-Annex I Parties
91%
51%
40%33%
21%
0%
20%
40%
60%
80%
100%
Ministry ofEnvironment/Climate
(or equivalent)
Ministry of DisasterManagement
(or equivalent)
Ministry of Planning(or equivalent)
Prime Minister’s office (or equivalent)
Ministry of Finance(or equivalent)
84% 79% 74%65%
33%
0%
20%
40%
60%
80%
100%
National/local NGOs UN agencies Academia/researchorganizations
International NGOs Private sectororganizations
8 | P a g e
37%
51%
12%Yes
No
Uncertain
11. Mechanisms for coordination Countries reported that the following institutional coordination mechanisms are in place to bring together relevant stakeholders to assess and address climate risks:
Multi-sectoral bodies (e.g. comprising members of government, NGOs, private sector, etc.)
Climate change commissions/committees/councils /advisory boards (e.g. steering/ technical; led by a prime minister or environmental ministers, or members from all relevant ministries, etc.)
Interagency coordination mechanism (e.g. task force, working group, etc. to facilitate coordination of actions on climate change between ministries and agencies)
Regular meetings coordinated by a relevant ministry (e.g. to bring together stakeholders from hydrometeorology and monitoring services, and science institutions, etc.)
National platforms coordinated by a high state authority (e.g. by president, to bring together stakeholders from NGOs, science institutions, etc.)
Agreement between key ministries (e.g. ministries for climate and disaster prevention)
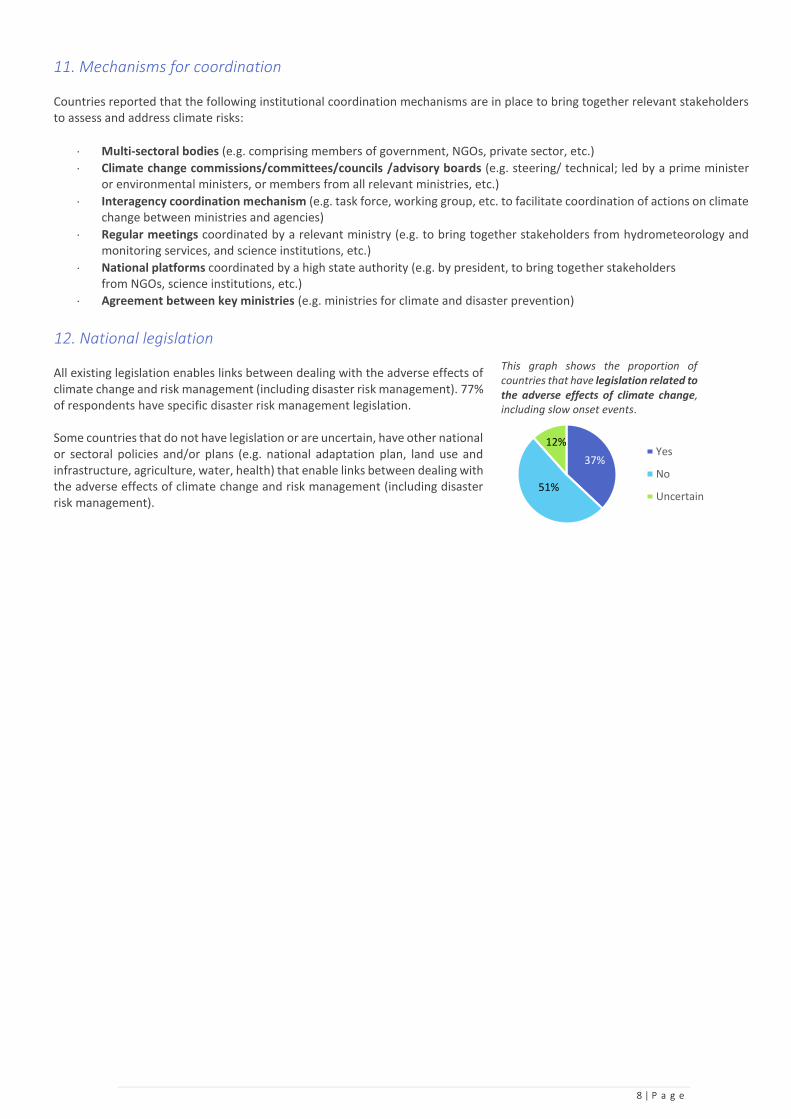
12. National legislation
All existing legislation enables links between dealing with the adverse effects of climate change and risk management (including disaster risk management). 77% of respondents have specific disaster risk management legislation. Some countries that do not have legislation or are uncertain, have other national or sectoral policies and/or plans (e.g. national adaptation plan, land use and infrastructure, agriculture, water, health) that enable links between dealing with the adverse effects of climate change and risk management (including disaster risk management).
This graph shows the proportion of countries that have legislation related to the adverse effects of climate change, including slow onset events.

9 | P a g e
Annexes
Annex 1: Respondents to the questionnaire
1. Andorra 2. Antigua and Barbuda 3. Armenia 4. Azerbaijan 5. Benin 6. Bolivia 7. Bosnia and Herzegovina 8. Brazil 9. Burundi 10. Colombia 11. Comoros 12. Cook Islands 13. Costa Rica 14. Egypt 15. El Salvador
16. Ethiopia 17. Georgia 18. Guinea-Bissau 19. Guyana 20. Indonesia 21. Jamaica 22. Kazakhstan 23. Kuwait 24. Malawi 25. Mali 26. Mauritius 27. Mexico 28. Mongolia 29. Montenegro 30. Myanmar
31. Niger 32. Nigeria 33. State of Palestine 34. Paraguay 35. Senegal 36. Serbia 37. St. Lucia 38. Singapore 39. Suriname 40. Thailand 41. The former Yugoslav Republic
of Macedonia 42. Uruguay 43. Viet Nam
10 | P a g e
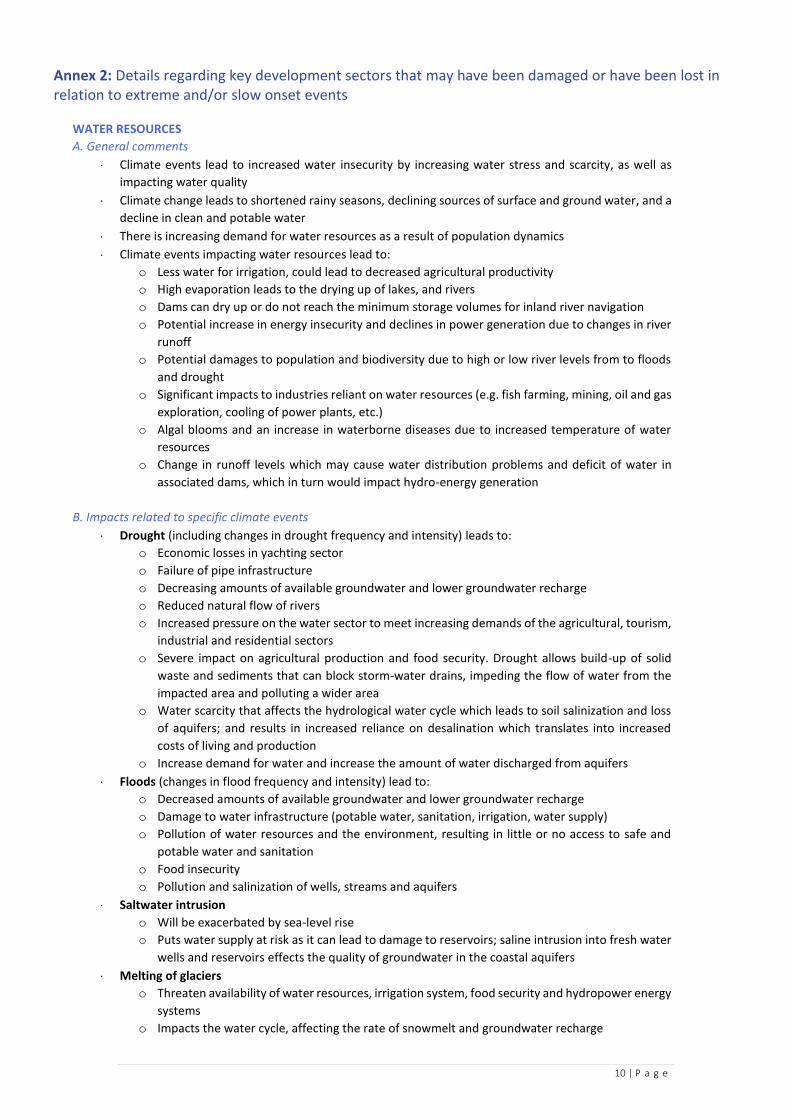
Annex 2: Details regarding key development sectors that may have been damaged or have been lost in relation to extreme and/or slow onset events
WATER RESOURCES
A. General comments
Climate events lead to increased water insecurity by increasing water stress and scarcity, as well as
impacting water quality
Climate change leads to shortened rainy seasons, declining sources of surface and ground water, and a
decline in clean and potable water
There is increasing demand for water resources as a result of population dynamics
Climate events impacting water resources lead to:
o Less water for irrigation, could lead to decreased agricultural productivity
o High evaporation leads to the drying up of lakes, and rivers
o Dams can dry up or do not reach the minimum storage volumes for inland river navigation
o Potential increase in energy insecurity and declines in power generation due to changes in river
runoff
o Potential damages to population and biodiversity due to high or low river levels from to floods
and drought
o Significant impacts to industries reliant on water resources (e.g. fish farming, mining, oil and gas
exploration, cooling of power plants, etc.)
o Algal blooms and an increase in waterborne diseases due to increased temperature of water
resources
o Change in runoff levels which may cause water distribution problems and deficit of water in
associated dams, which in turn would impact hydro-energy generation
B. Impacts related to specific climate events
Drought (including changes in drought frequency and intensity) leads to:
o Economic losses in yachting sector
o Failure of pipe infrastructure
o Decreasing amounts of available groundwater and lower groundwater recharge
o Reduced natural flow of rivers
o Increased pressure on the water sector to meet increasing demands of the agricultural, tourism,
industrial and residential sectors
o Severe impact on agricultural production and food security. Drought allows build-up of solid
waste and sediments that can block storm-water drains, impeding the flow of water from the
impacted area and polluting a wider area
o Water scarcity that affects the hydrological water cycle which leads to soil salinization and loss
of aquifers; and results in increased reliance on desalination which translates into increased
costs of living and production
o Increase demand for water and increase the amount of water discharged from aquifers
Floods (changes in flood frequency and intensity) lead to:
o Decreased amounts of available groundwater and lower groundwater recharge
o Damage to water infrastructure (potable water, sanitation, irrigation, water supply)
o Pollution of water resources and the environment, resulting in little or no access to safe and
potable water and sanitation
o Food insecurity
o Pollution and salinization of wells, streams and aquifers
Saltwater intrusion
o Will be exacerbated by sea-level rise
o Puts water supply at risk as it can lead to damage to reservoirs; saline intrusion into fresh water
wells and reservoirs effects the quality of groundwater in the coastal aquifers
Melting of glaciers
o Threaten availability of water resources, irrigation system, food security and hydropower energy
systems
o Impacts the water cycle, affecting the rate of snowmelt and groundwater recharge
11 | P a g e
Sea level rise
o Population is at risk of exposure to flooding in coastal zones, including industrial settlements,
tourism-related infrastructure and facilities, and crops
o Water sources will be vulnerable to sea water intrusion
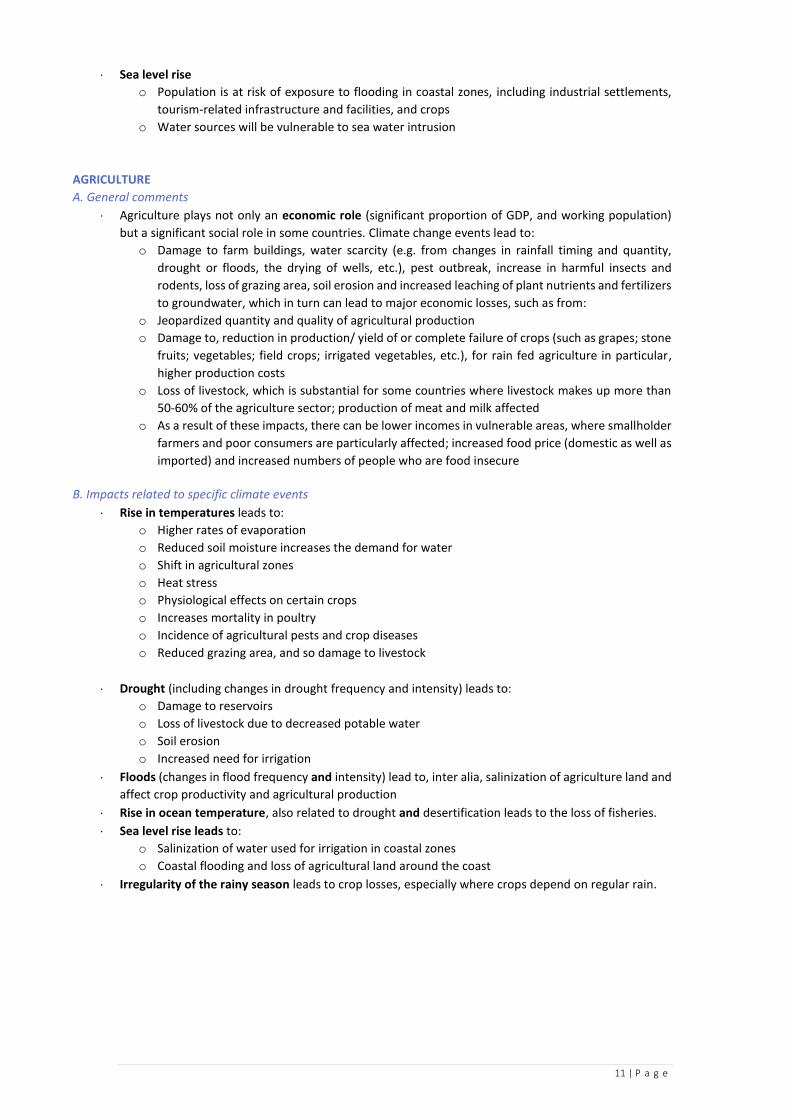
AGRICULTURE
A. General comments
Agriculture plays not only an economic role (significant proportion of GDP, and working population)
but a significant social role in some countries. Climate change events lead to:
o Damage to farm buildings, water scarcity (e.g. from changes in rainfall timing and quantity,
drought or floods, the drying of wells, etc.), pest outbreak, increase in harmful insects and
rodents, loss of grazing area, soil erosion and increased leaching of plant nutrients and fertilizers
to groundwater, which in turn can lead to major economic losses, such as from:
o Jeopardized quantity and quality of agricultural production
o Damage to, reduction in production/ yield of or complete failure of crops (such as grapes; stone
fruits; vegetables; field crops; irrigated vegetables, etc.), for rain fed agriculture in particular,
higher production costs
o Loss of livestock, which is substantial for some countries where livestock makes up more than
50-60% of the agriculture sector; production of meat and milk affected
o As a result of these impacts, there can be lower incomes in vulnerable areas, where smallholder
farmers and poor consumers are particularly affected; increased food price (domestic as well as
imported) and increased numbers of people who are food insecure
B. Impacts related to specific climate events
Rise in temperatures leads to:
o Higher rates of evaporation
o Reduced soil moisture increases the demand for water
o Shift in agricultural zones
o Heat stress
o Physiological effects on certain crops
o Increases mortality in poultry
o Incidence of agricultural pests and crop diseases
o Reduced grazing area, and so damage to livestock
Drought (including changes in drought frequency and intensity) leads to:
o Damage to reservoirs
o Loss of livestock due to decreased potable water
o Soil erosion
o Increased need for irrigation
Floods (changes in flood frequency and intensity) lead to, inter alia, salinization of agriculture land and
affect crop productivity and agricultural production
Rise in ocean temperature, also related to drought and desertification leads to the loss of fisheries.
Sea level rise leads to:
o Salinization of water used for irrigation in coastal zones
o Coastal flooding and loss of agricultural land around the coast
Irregularity of the rainy season leads to crop losses, especially where crops depend on regular rain.
12 | P a g e
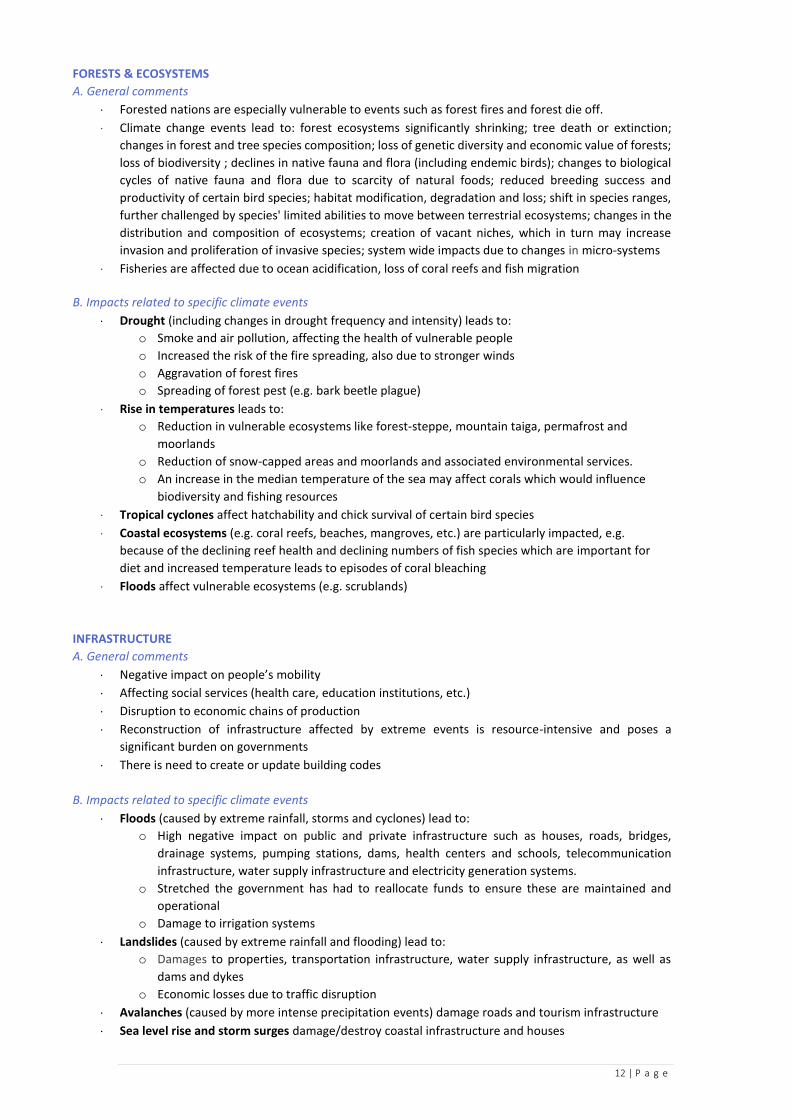
FORESTS & ECOSYSTEMS
A. General comments
Forested nations are especially vulnerable to events such as forest fires and forest die off.
Climate change events lead to: forest ecosystems significantly shrinking; tree death or extinction;
changes in forest and tree species composition; loss of genetic diversity and economic value of forests;
loss of biodiversity ; declines in native fauna and flora (including endemic birds); changes to biological
cycles of native fauna and flora due to scarcity of natural foods; reduced breeding success and
productivity of certain bird species; habitat modification, degradation and loss; shift in species ranges,
further challenged by species' limited abilities to move between terrestrial ecosystems; changes in the
distribution and composition of ecosystems; creation of vacant niches, which in turn may increase
invasion and proliferation of invasive species; system wide impacts due to changes in micro-systems
Fisheries are affected due to ocean acidification, loss of coral reefs and fish migration
B. Impacts related to specific climate events
Drought (including changes in drought frequency and intensity) leads to:
o Smoke and air pollution, affecting the health of vulnerable people
o Increased the risk of the fire spreading, also due to stronger winds
o Aggravation of forest fires
o Spreading of forest pest (e.g. bark beetle plague)
Rise in temperatures leads to:
o Reduction in vulnerable ecosystems like forest-steppe, mountain taiga, permafrost and
moorlands
o Reduction of snow-capped areas and moorlands and associated environmental services.
o An increase in the median temperature of the sea may affect corals which would influence
biodiversity and fishing resources
Tropical cyclones affect hatchability and chick survival of certain bird species
Coastal ecosystems (e.g. coral reefs, beaches, mangroves, etc.) are particularly impacted, e.g.
because of the declining reef health and declining numbers of fish species which are important for
diet and increased temperature leads to episodes of coral bleaching
Floods affect vulnerable ecosystems (e.g. scrublands)
INFRASTRUCTURE
A. General comments
Negative impact on people’s mobility
Affecting social services (health care, education institutions, etc.)
Disruption to economic chains of production
Reconstruction of infrastructure affected by extreme events is resource-intensive and poses a
significant burden on governments
There is need to create or update building codes
B. Impacts related to specific climate events
Floods (caused by extreme rainfall, storms and cyclones) lead to:
o High negative impact on public and private infrastructure such as houses, roads, bridges,
drainage systems, pumping stations, dams, health centers and schools, telecommunication
infrastructure, water supply infrastructure and electricity generation systems.
o Stretched the government has had to reallocate funds to ensure these are maintained and
operational
o Damage to irrigation systems
Landslides (caused by extreme rainfall and flooding) lead to:
o Damages to properties, transportation infrastructure, water supply infrastructure, as well as
dams and dykes
o Economic losses due to traffic disruption
Avalanches (caused by more intense precipitation events) damage roads and tourism infrastructure
Sea level rise and storm surges damage/destroy coastal infrastructure and houses
13 | P a g e
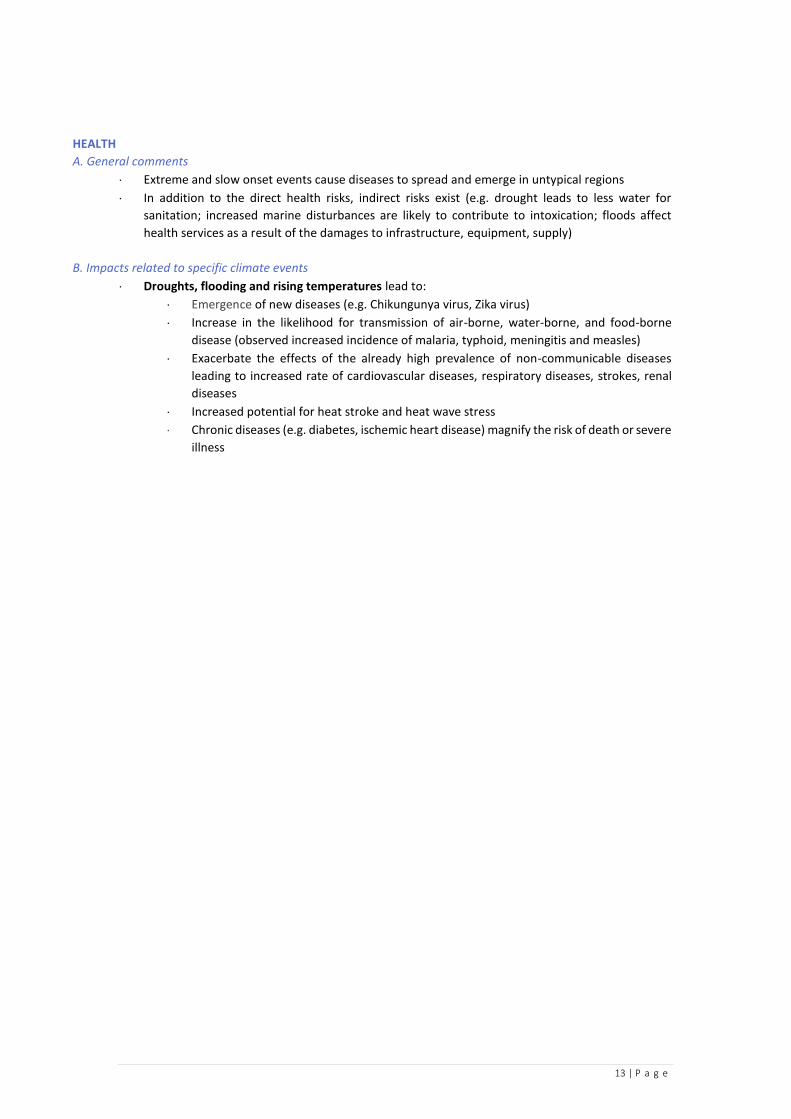
HEALTH
A. General comments
Extreme and slow onset events cause diseases to spread and emerge in untypical regions
In addition to the direct health risks, indirect risks exist (e.g. drought leads to less water for
sanitation; increased marine disturbances are likely to contribute to intoxication; floods affect
health services as a result of the damages to infrastructure, equipment, supply)
B. Impacts related to specific climate events
Droughts, flooding and rising temperatures lead to:
Emergence of new diseases (e.g. Chikungunya virus, Zika virus)
Increase in the likelihood for transmission of air-borne, water-borne, and food-borne
disease (observed increased incidence of malaria, typhoid, meningitis and measles)
Exacerbate the effects of the already high prevalence of non-communicable diseases
leading to increased rate of cardiovascular diseases, respiratory diseases, strokes, renal
diseases
Increased potential for heat stroke and heat wave stress
Chronic diseases (e.g. diabetes, ischemic heart disease) magnify the risk of death or severe
illness

14 | P a g e
Annex 3: Key intergovernmental and non-governmental organizations2 that contribute to addressing the adverse effects of climate change, as indicated in the 43 responses to the questionnaire, UN agencies FAO (Food and Agriculture Organization); IFAD (International Fund for Agricultural Development); IOM (International Organization for Migration); IPCC (Intergovernmental Panel on Climate Change); OCHA (Office for the Coordination of Humanitarian Affairs); UN Women; UNDP (UN Development Programme); UNEA (UN Environment Assembly); UNECA (UN Economic Commission for Africa); UNECLAC (UN Economic Commission for Latin America and the Caribbean); UNEP (UN Environment Programme); UNESCO (UN Educational, Scientific and Cultural Organization); UNFCCC (UN Framework Convention on Climate Change); UNHABITAT; UNICEF (UN Children's Fund); UNIDO (UN Industrial Development Organization); UNISDR (UN Office for Disaster Risk Reduction); UNITAR (UN Institute for Training and Research); UNOOSA (UN Office for Outer Space Affairs); UNPF (UN Population Fund); UN-REDD Programme; WB (World Bank); WFP (World Food Programme); WHO (World Health Organization); WMO (World Meteorological Organization). International NGOs CARE International; Cooperazione Internazionale; COSUDE (Agencia Suiza para el Desarrollo y la Cooperación); German Cooperation; GVC (Gruppo di Volontariato Civile); Handicap International; Help Age International; Helvetas Swiss Intercooperation; ICCO (International Cocoa Organization); International Union for Conservation of Nature; Italian Cooperation; KOICA (Korea International Cooperation Agency); Oxfam; Plan International; Practical Action; Protos; Red Cross; Save the Children; SNV (Netherlands Development Organisation); Spanish Cooperation; The Asia Foundation; Tree Project; Welt Hunger Life; Wetlands International; World Vision; WWF (World Wide Fund). National/local NGOs Action for Development; Amerindian Peoples Association; Arab Network for Environment & Development; Association Burundaise pour la protection de la Nature; Association pou le Developpement Durable; Bolivian Red Cross; Brazilian Forum for Sustainable Development; Caucasus Environmental NGO Network; Centro de Promoción de Tecnologías Sostenibles; Civil society platform on climate change Niger; CREDEL Benin; ENDA Senegal; Environmental Awareness Group; Environmental Foundation of Jamaica; Environmental Protection and Conservation Organisation; Fundación Moisés Bertoni; Fundación para el Desarrollo Participativo Comunitario; Gaia Pacha Foundation; Gilber Agriculture Rural Development Centre; Global Environment Facility Small Grants Programme National Council; Guyana Organisation of Indigenous Peoples; Guyra Paraguay; HuMa (Association for Community and Ecology-Based Law Reform); HUNDEE Oromo Grassroots Development Initiative; IDID Benin; Imazon; Indonesian Forum for the Environment; Instituto de Estudios Avanzados en Desarrollo; Inter-Governmental Ministry of Environment and Water; Kuwait Environment Protection Society; Liga de Defensa del Medio Ambiente; MaliFolk Center; Mauritius Council of Social Service; Mauritius Marine Conservation Society; Mauritius National Women Council; Mauritius National Youth Council; Mauritius Wildlife Foundation; Milieukontakt Macedonia; Myanmar Red Cross Society; National Amerindian Development Fund; National Service of Meteorology and Hydrology; PIKUL; Plan Paraguay; Plurinational Authority of the Mother Earth; Raks Thai Foundation; Reef Conservation Mauritius; Regional Pastoral Livelihood Resilience Project; Remisia; Saint Lucia National Trust; Secrétariat de Concertation des ONG nationales du Mali; SIDS Youth AIMS Hub; Social Pastoral Caritas Boliviana; Sumaj Huasi Foundation; Sustainable Water; Thailand Environment Institute Foundation; Te Ipukarae Society; The Amerindian Action Movement of Guyana; The Indonesian Biodiversity Foundation; The Nature Conservancy; Wetland; Women Support Association; WWF Indonesia; Yayasan Terumbu Karang Indonesia.
Academia/research organizations Anton de Kom University of Suriname; Belgrade University; Bolivian San Pablo Catholic University; Caribbean Agricultural Research and Development Institute; Caribbean Institute for Meteorology and Hydrology; Chulalongkorn University; Climate and Development Knowledge Network; Chancellor College; Commonwealth Scientific and Industrial Research Organisation; Comoros University; l'Ecole Nationale d'Ingénieurs Abderhame Baba Touré; Faculties for civil engineering; Faculties of sciences; Federal University of Sao Paulo; Federal University Rio de Janeiro; Federal University Santa Catarina; Food, Agricultural Research and Extension Institute; Gabriel Rene Moreno University; Gaston Berger University; Global Research Alliance on Agricultural Greenhouse Gases; Higher University of San Andres,; Institutes für Energiewirtschaft und Rationelle Energieanwendung; Institute for Agriculture; Institute Geology; Institute of Botany; Institute of Geography of the Republic of Kazakhstan; Institute of Zoology; International Research Institute for Climate and Society; Joint Research Centre; Kasetsart University; Kuwait Foundation for the Advancement of Science; Kuwait Institute for Scientific Research; Kuwait University; Lilongwe University of Agriculture and Natural Resources; Lembaga Ilmu Pengetahuan Indonesia; Macedonian Academy of Sciences and Arts; Malawi University of Science and Technology; Malawi University of Science and Technology; Mauritius Cane Industry Authority; Mauritius Oceanography Institute; Mauritius Research Council; Mechanical Engineering and agricultural faculties; Mongolia National Agency for Meteorology and Environmental Monitoring; Myanmar Information Management Unit; Mzuzu University; National Amazon Research Institute; National Space Research Agency; National Institute of Water and
2 Names of organizations are listed in an alphabetical order.
15 | P a g e
Atmospheric Research; Northern Caribbean University; Novi Sad University; Open University; PROCISUR cooperative research programme; NOAA/NWS Storm Prediction Center; Secretariat of the Pacific Regional Environment Programme; Thammasat University; The Polytechnic Malawi; Universite des Mascareignes; University of Abomey Calavi; University of Dakar; University of Mauritius; University of Parakou; University of San Simón; University of Technology Jamaica; University of Technology Mauritius; University of the Republic Uruguay; University of the South Pacific; University of the West Indies. Private sector organizations Aerowatt; ASTRA; Entrepreneurial Salvadoran Council for Sustainable Development (CEDES); Environmental Solutions ltd; Ethiopian Chamber of Commerce; Joint Economic Council; Mauritius Chamber of Agriculture; Mauritius Chamber of Commerce and Industry; Niger Chamber of Commerce and Industry; Omnicane Management and Consultancy Limited; PERTAMINA; Press Corporation Limited; Saint Lucia Electricity Services Company (LUCELEC); SARACO; Suzlon Padgreen Co Ltd; The Private Sector Organization of Jamaica; Tobacco Control Commission. Other (bilateral agencies, funds, IGOs, etc.) AECID; AHA Center; Asian Development Bank; Caribbean Catastrophe Risk Insurance Facility; Caribbean Community Climate Change Centre; Caribbean Disaster Emergency Management Agency; CARICOM (Caribbean Community); Catholic Development Commission; Central American Integration System; Center for Environmental Policy and Advocacy; Center for Relief and Civil Protection; Civil Society Network on Climate Danish International Development Agency; Convenio Marco del Cuenca del Plata; Department for International Development; Deutsche Gesellschaft für Internationale Zusammenarbeit; Development Bank of Latin America; Euroclima; Evangelical Association of Malawi; FONTAGRO (Regional Fund for Agricultural Technologies); French Development Agency; Green Climate Fund; Global Environment Facility; Inter-American Development Bank; Inter-American Institute for Global Change Research; Irish AID; Japan International Cooperation Agency; Kreditanstalt für Wiederaufbau (KfW); Lem Ethiopia; Organization of American States; Organization of Easter Caribbean States; Population Health and Environment; The Regional Environmental Center for Central and Eastern Europe; Regional Organization for the Protection of the Marine Environment; Saint Lucia Chapter of Caribbean Youth Environment Network (CYEN); Swedish International Development Cooperation Agency; the Global Green Growth Institute; United States Agency for International Development; Inter-American Institute for Agriculture; DIPECHO (Disaster Preparedness European Civil Protection and Humanitarian Aid Operations).
-----


![INDEX [] · n.r.i questionnaire 3 keyman questionnaire with annexures 5 employer-employee scheme questionnaire 11 personal financial questionnaire 12 general occupation questionnaire](https://img.pdfslide.us/doc/110x75/5e7f0927f331ad3020486c35/index-nri-questionnaire-3-keyman-questionnaire-with-annexures-5-employer-employee.jpg)