Embed Size (px)
Citation preview
Action and intention recognition of pedestrians in urban traffic
Dimitrios Varytimidis1, Fernando Alonso-Fernandez1, Boris Duran2 and Cristofer Englund1,2∗
Abstract— Action and intention recognition of pedestrians inurban settings are challenging problems for Advanced DriverAssistance Systems as well as future autonomous vehicles tomaintain smooth and safe traffic. This work investigates anumber of feature extraction methods in combination withseveral machine learning algorithms to build knowledge on howto automatically detect the action and intention of pedestriansin urban traffic. We focus on the motion and head orientationto predict whether the pedestrian is about to cross the street ornot. The work is based on the Joint Attention for AutonomousDriving (JAAD) dataset, which contains 346 videoclips ofvarious traffic scenarios captured with cameras mounted in thewindshield of a car. An accuracy of 72% for head orientationestimation and 85% for motion detection is obtained in ourexperiments.
I. INTRODUCTION
Traffic accidents is worldwide one of the most commoncauses of death and annually 1.25 million people are killed intraffic whereof 270.000 are pedestrians1. Hence, pedestriansafety is an important aspect in urban traffic. Therefore,automated assistance systems that further improve safetyfor these road users should be developed. A fundamentalfeature of such systems, is to first identify possible haz-ardous situations and secondly safely maneuver to avoid anycollision [1]. Today, pedestrian detection systems are dearfeatures of Advanced Driver Assistance Systems (ADAS).However, to improve functionality and extend the scope toalso include fully autonomous driving systems, in this workwe study camera-based methods for predicting future actionsand intentions of pedestrians in an urban traffic environment.
Cues that may indicate that a pedestrian will cross a streetmay for example be that he/she has looked at the approachingvehicle and tries to negotiate a free safe passage. A pedestrianthat is seeking eye contact with the approaching vehicleis less likely to cross the street than one that is walkingtowards the street without observing the traffic [2]. Moreover,the motion of a pedestrian is another cue about the futureaction of the pedestrian. A pedestrian that is moving towardsthe street is more likely to cross than one that is standingstill at the curb. In previous experiments, head orientationand motion were the most dominant features concerningpedestrians crossing or waiting intention [3].
Previous work concerning detection of pedestrians actionsuse a variety of computer vision methods. In [4], Histogramof Oriented Gradients (HOG) has been successfully used to
1D. Varytimidis, F. Alonso-Fernandez and C. Englund are with School ofInformation Technology, Halmstad University, SE 301 18 Halmstad, Sweden
2B. Duran and C. Englund are with RISE Viktoria SE417 56 Gothenburg, Sweden ∗corresponding author:[email protected]
1WHO, Global status report on road safety 2015
identify people and objects in a scene. In [5], HOG featureswere extracted from Motion History Images and were used asdescriptors to predict the crossing intention of a pedestrian.Another approach to estimate the head orientation is to usefeatures from Convolutional Neural Networks (CNN). In [6]for example, gaze is estimated using image analysis basedon CNN. Local Binary Patterns (LBP) is another methodused in combination with regression analysis to estimate eyegaze [7], [8]. In [7] LBP is applied to cropped images of theeyes.
In computer vision, features are typically high dimensionalvectors that describe distinguishing features of images. Tointerpret these vectors and use them for pattern recogni-tion tasks, machine learning algorithms are typically used.Examples of such methods are Support Vector Machines(SVM) [9], [10], [11], Decision Trees (DT) [12], [13], k-Nearest Neighbour (k-NN) [14], Artificial Neural Networks(ANN) [11] and Convolutional Neural Networks (CNN) [15].
In this work we elaborate on using a combination offeature extraction in combination with machine learningalgorithms to make predictions on the action and intentionof a pedestrian. The feature extraction methods are appliedto cropped images of pedestrians i.e. images of only thehead for head orientation estimation, and images of onlythe legs for estimation of pedestrian movement. In the nextstep, the features are used as input for the machine learningalgorithms to predict if the pedestrian will cross the street.The images are extracted from video frames of the JointAttention for Autonomous Driving (JAAD) dataset [16],depicting pedestrians walking next to the road or crossingthe road. In addition to the pedestrians estimated behavior,
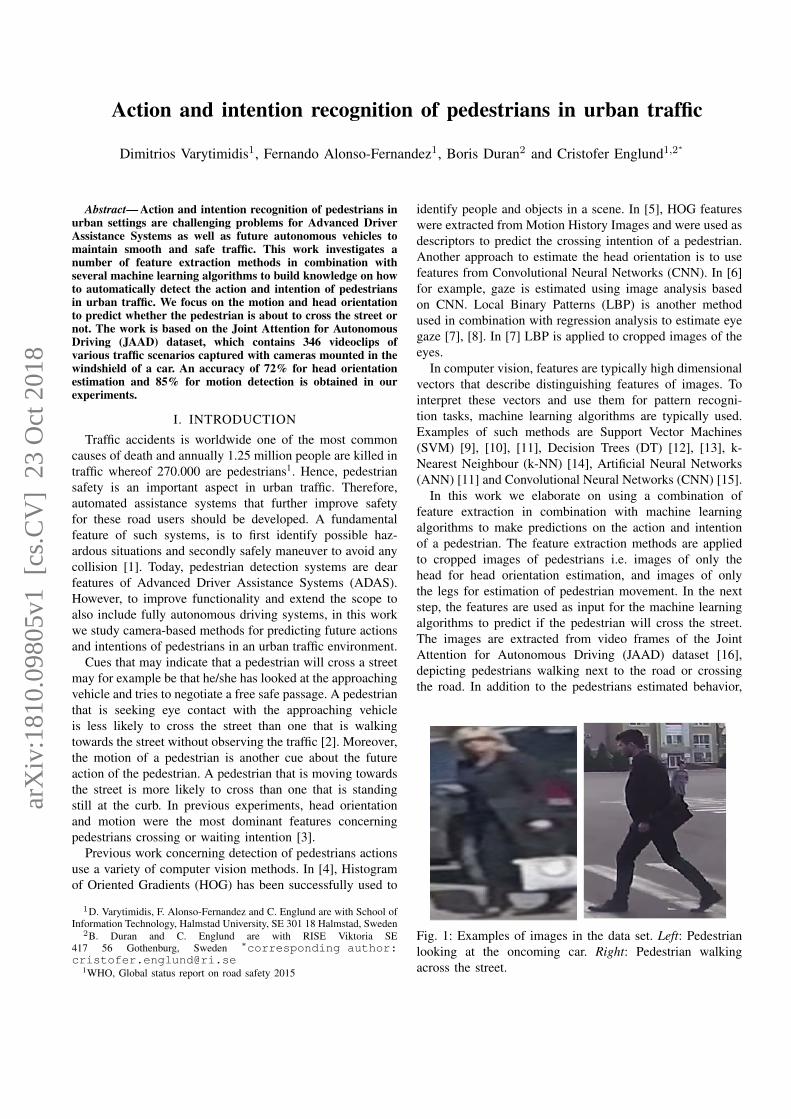
Fig. 1: Examples of images in the data set. Left: Pedestrianlooking at the oncoming car. Right: Pedestrian walkingacross the street.
arX
iv:1
810.
0980
5v1
[cs
.CV
] 2
3 O
ct 2
018
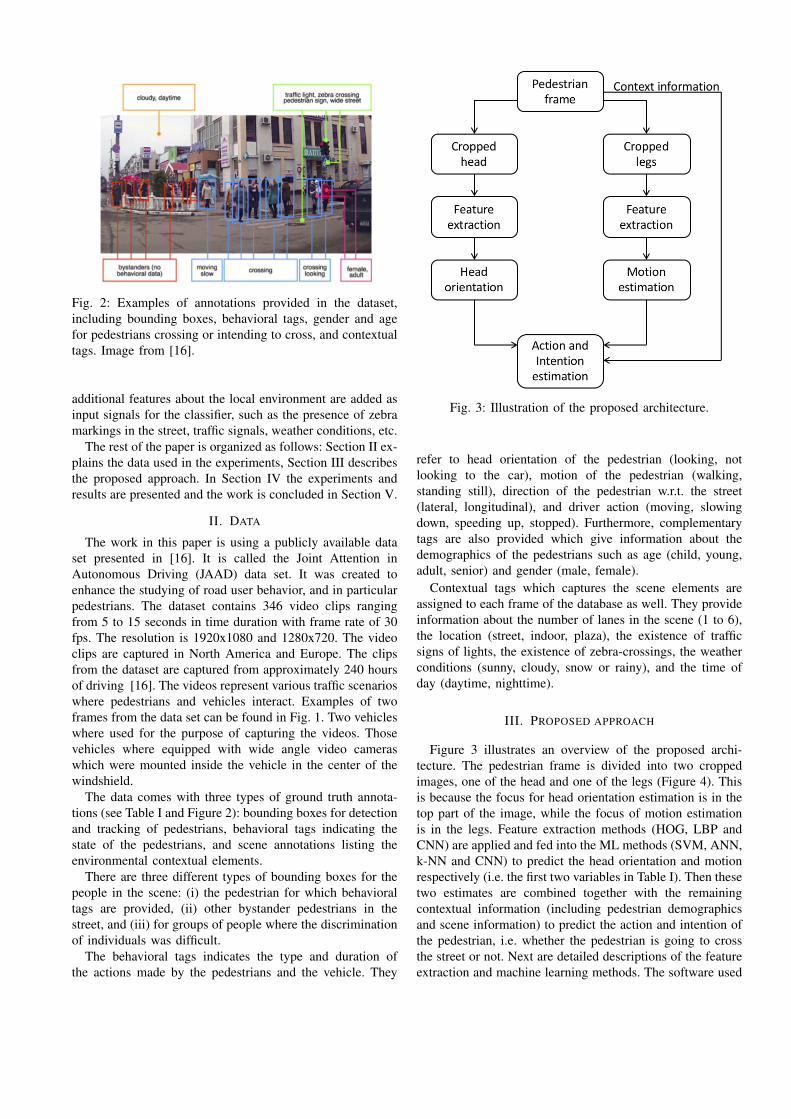
Fig. 2: Examples of annotations provided in the dataset,including bounding boxes, behavioral tags, gender and agefor pedestrians crossing or intending to cross, and contextualtags. Image from [16].
additional features about the local environment are added asinput signals for the classifier, such as the presence of zebramarkings in the street, traffic signals, weather conditions, etc.
The rest of the paper is organized as follows: Section II ex-plains the data used in the experiments, Section III describesthe proposed approach. In Section IV the experiments andresults are presented and the work is concluded in Section V.
II. DATA
The work in this paper is using a publicly available dataset presented in [16]. It is called the Joint Attention inAutonomous Driving (JAAD) data set. It was created toenhance the studying of road user behavior, and in particularpedestrians. The dataset contains 346 video clips rangingfrom 5 to 15 seconds in time duration with frame rate of 30fps. The resolution is 1920x1080 and 1280x720. The videoclips are captured in North America and Europe. The clipsfrom the dataset are captured from approximately 240 hoursof driving [16]. The videos represent various traffic scenarioswhere pedestrians and vehicles interact. Examples of twoframes from the data set can be found in Fig. 1. Two vehicleswhere used for the purpose of capturing the videos. Thosevehicles where equipped with wide angle video cameraswhich were mounted inside the vehicle in the center of thewindshield.
The data comes with three types of ground truth annota-tions (see Table I and Figure 2): bounding boxes for detectionand tracking of pedestrians, behavioral tags indicating thestate of the pedestrians, and scene annotations listing theenvironmental contextual elements.
There are three different types of bounding boxes for thepeople in the scene: (i) the pedestrian for which behavioraltags are provided, (ii) other bystander pedestrians in thestreet, and (iii) for groups of people where the discriminationof individuals was difficult.
The behavioral tags indicates the type and duration ofthe actions made by the pedestrians and the vehicle. They
Fig. 3: Illustration of the proposed architecture.
refer to head orientation of the pedestrian (looking, notlooking to the car), motion of the pedestrian (walking,standing still), direction of the pedestrian w.r.t. the street(lateral, longitudinal), and driver action (moving, slowingdown, speeding up, stopped). Furthermore, complementarytags are also provided which give information about thedemographics of the pedestrians such as age (child, young,adult, senior) and gender (male, female).
Contextual tags which captures the scene elements areassigned to each frame of the database as well. They provideinformation about the number of lanes in the scene (1 to 6),the location (street, indoor, plaza), the existence of trafficsigns of lights, the existence of zebra-crossings, the weatherconditions (sunny, cloudy, snow or rainy), and the time ofday (daytime, nighttime).
III. PROPOSED APPROACH
Figure 3 illustrates an overview of the proposed archi-tecture. The pedestrian frame is divided into two croppedimages, one of the head and one of the legs (Figure 4). Thisis because the focus for head orientation estimation is in thetop part of the image, while the focus of motion estimationis in the legs. Feature extraction methods (HOG, LBP andCNN) are applied and fed into the ML methods (SVM, ANN,k-NN and CNN) to predict the head orientation and motionrespectively (i.e. the first two variables in Table I). Then thesetwo estimates are combined together with the remainingcontextual information (including pedestrian demographicsand scene information) to predict the action and intention ofthe pedestrian, i.e. whether the pedestrian is going to crossthe street or not. Next are detailed descriptions of the featureextraction and machine learning methods. The software used
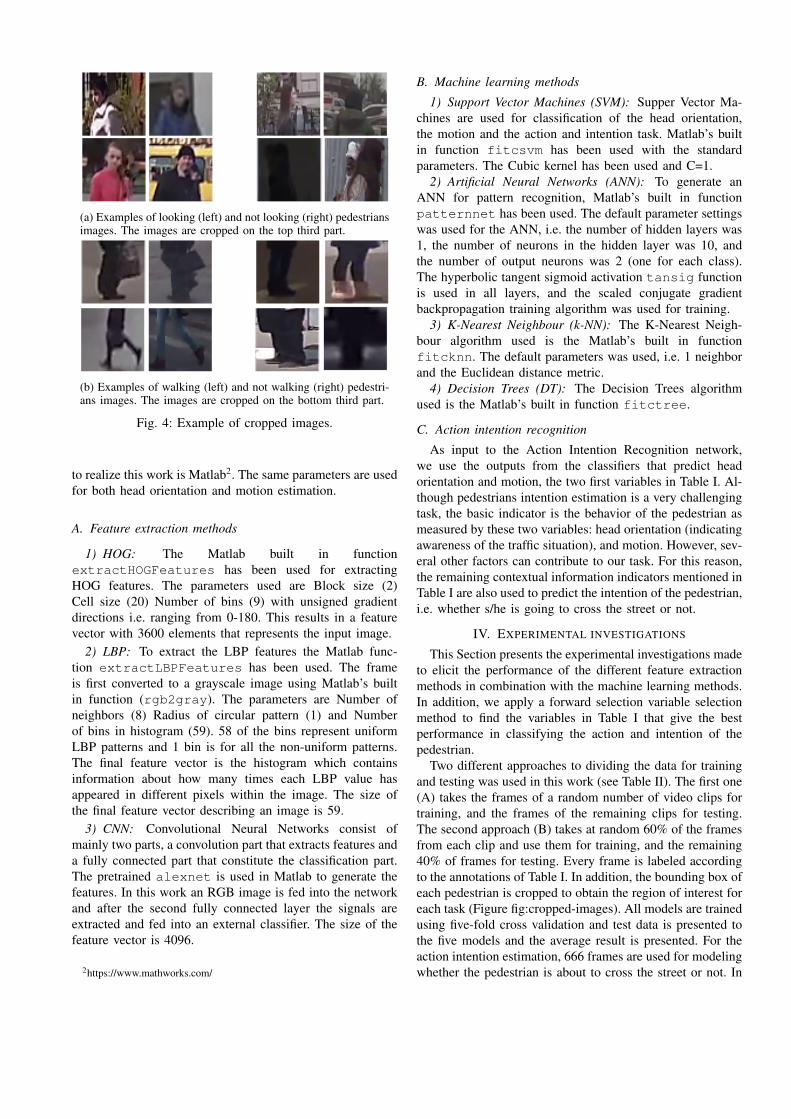
(a) Examples of looking (left) and not looking (right) pedestriansimages. The images are cropped on the top third part.
(b) Examples of walking (left) and not walking (right) pedestri-ans images. The images are cropped on the bottom third part.
Fig. 4: Example of cropped images.
to realize this work is Matlab2. The same parameters are usedfor both head orientation and motion estimation.
A. Feature extraction methods
1) HOG: The Matlab built in functionextractHOGFeatures has been used for extractingHOG features. The parameters used are Block size (2)Cell size (20) Number of bins (9) with unsigned gradientdirections i.e. ranging from 0-180. This results in a featurevector with 3600 elements that represents the input image.
2) LBP: To extract the LBP features the Matlab func-tion extractLBPFeatures has been used. The frameis first converted to a grayscale image using Matlab’s builtin function (rgb2gray). The parameters are Number ofneighbors (8) Radius of circular pattern (1) and Numberof bins in histogram (59). 58 of the bins represent uniformLBP patterns and 1 bin is for all the non-uniform patterns.The final feature vector is the histogram which containsinformation about how many times each LBP value hasappeared in different pixels within the image. The size ofthe final feature vector describing an image is 59.
3) CNN: Convolutional Neural Networks consist ofmainly two parts, a convolution part that extracts features anda fully connected part that constitute the classification part.The pretrained alexnet is used in Matlab to generate thefeatures. In this work an RGB image is fed into the networkand after the second fully connected layer the signals areextracted and fed into an external classifier. The size of thefeature vector is 4096.
2https://www.mathworks.com/
B. Machine learning methods
1) Support Vector Machines (SVM): Supper Vector Ma-chines are used for classification of the head orientation,the motion and the action and intention task. Matlab’s builtin function fitcsvm has been used with the standardparameters. The Cubic kernel has been used and C=1.
2) Artificial Neural Networks (ANN): To generate anANN for pattern recognition, Matlab’s built in functionpatternnet has been used. The default parameter settingswas used for the ANN, i.e. the number of hidden layers was1, the number of neurons in the hidden layer was 10, andthe number of output neurons was 2 (one for each class).The hyperbolic tangent sigmoid activation tansig functionis used in all layers, and the scaled conjugate gradientbackpropagation training algorithm was used for training.
3) K-Nearest Neighbour (k-NN): The K-Nearest Neigh-bour algorithm used is the Matlab’s built in functionfitcknn. The default parameters was used, i.e. 1 neighborand the Euclidean distance metric.
4) Decision Trees (DT): The Decision Trees algorithmused is the Matlab’s built in function fitctree.
C. Action intention recognition
As input to the Action Intention Recognition network,we use the outputs from the classifiers that predict headorientation and motion, the two first variables in Table I. Al-though pedestrians intention estimation is a very challengingtask, the basic indicator is the behavior of the pedestrian asmeasured by these two variables: head orientation (indicatingawareness of the traffic situation), and motion. However, sev-eral other factors can contribute to our task. For this reason,the remaining contextual information indicators mentioned inTable I are also used to predict the intention of the pedestrian,i.e. whether s/he is going to cross the street or not.
IV. EXPERIMENTAL INVESTIGATIONS
This Section presents the experimental investigations madeto elicit the performance of the different feature extractionmethods in combination with the machine learning methods.In addition, we apply a forward selection variable selectionmethod to find the variables in Table I that give the bestperformance in classifying the action and intention of thepedestrian.
Two different approaches to dividing the data for trainingand testing was used in this work (see Table II). The first one(A) takes the frames of a random number of video clips fortraining, and the frames of the remaining clips for testing.The second approach (B) takes at random 60% of the framesfrom each clip and use them for training, and the remaining40% of frames for testing. Every frame is labeled accordingto the annotations of Table I. In addition, the bounding box ofeach pedestrian is cropped to obtain the region of interest foreach task (Figure fig:cropped-images). All models are trainedusing five-fold cross validation and test data is presented tothe five models and the average result is presented. For theaction intention estimation, 666 frames are used for modelingwhether the pedestrian is about to cross the street or not. In
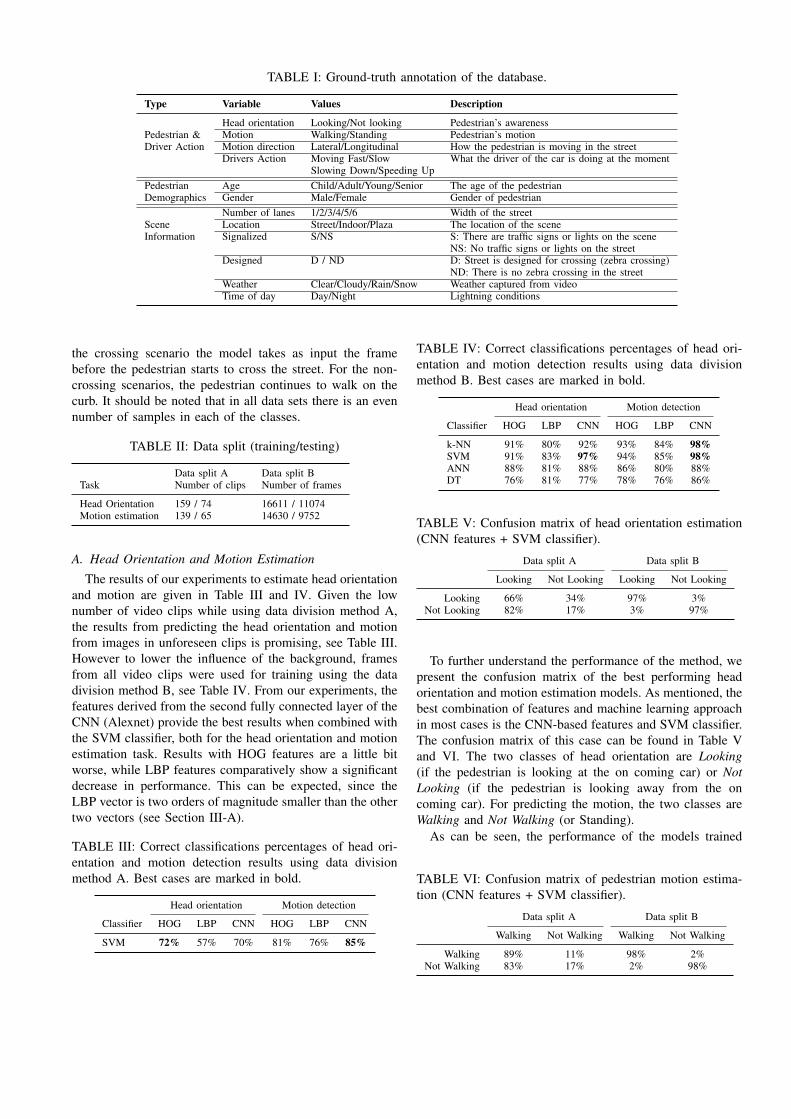
TABLE I: Ground-truth annotation of the database.
Type Variable Values Description
Head orientation Looking/Not looking Pedestrian’s awarenessPedestrian & Motion Walking/Standing Pedestrian’s motionDriver Action Motion direction Lateral/Longitudinal How the pedestrian is moving in the street
Drivers Action Moving Fast/Slow What the driver of the car is doing at the momentSlowing Down/Speeding Up
Pedestrian Age Child/Adult/Young/Senior The age of the pedestrianDemographics Gender Male/Female Gender of pedestrian
Number of lanes 1/2/3/4/5/6 Width of the streetScene Location Street/Indoor/Plaza The location of the sceneInformation Signalized S/NS S: There are traffic signs or lights on the scene
NS: No traffic signs or lights on the streetDesigned D / ND D: Street is designed for crossing (zebra crossing)
ND: There is no zebra crossing in the streetWeather Clear/Cloudy/Rain/Snow Weather captured from videoTime of day Day/Night Lightning conditions
the crossing scenario the model takes as input the framebefore the pedestrian starts to cross the street. For the non-crossing scenarios, the pedestrian continues to walk on thecurb. It should be noted that in all data sets there is an evennumber of samples in each of the classes.
TABLE II: Data split (training/testing)
Data split A Data split BTask Number of clips Number of frames
Head Orientation 159 / 74 16611 / 11074Motion estimation 139 / 65 14630 / 9752
A. Head Orientation and Motion Estimation
The results of our experiments to estimate head orientationand motion are given in Table III and IV. Given the lownumber of video clips while using data division method A,the results from predicting the head orientation and motionfrom images in unforeseen clips is promising, see Table III.However to lower the influence of the background, framesfrom all video clips were used for training using the datadivision method B, see Table IV. From our experiments, thefeatures derived from the second fully connected layer of theCNN (Alexnet) provide the best results when combined withthe SVM classifier, both for the head orientation and motionestimation task. Results with HOG features are a little bitworse, while LBP features comparatively show a significantdecrease in performance. This can be expected, since theLBP vector is two orders of magnitude smaller than the othertwo vectors (see Section III-A).
TABLE III: Correct classifications percentages of head ori-entation and motion detection results using data divisionmethod A. Best cases are marked in bold.
Head orientation Motion detection
Classifier HOG LBP CNN HOG LBP CNN
SVM 72% 57% 70% 81% 76% 85%
TABLE IV: Correct classifications percentages of head ori-entation and motion detection results using data divisionmethod B. Best cases are marked in bold.
Head orientation Motion detection
Classifier HOG LBP CNN HOG LBP CNN
k-NN 91% 80% 92% 93% 84% 98%SVM 91% 83% 97% 94% 85% 98%ANN 88% 81% 88% 86% 80% 88%DT 76% 81% 77% 78% 76% 86%
TABLE V: Confusion matrix of head orientation estimation(CNN features + SVM classifier).
Data split A Data split B
Looking Not Looking Looking Not Looking
Looking 66% 34% 97% 3%Not Looking 82% 17% 3% 97%
To further understand the performance of the method, wepresent the confusion matrix of the best performing headorientation and motion estimation models. As mentioned, thebest combination of features and machine learning approachin most cases is the CNN-based features and SVM classifier.The confusion matrix of this case can be found in Table Vand VI. The two classes of head orientation are Looking(if the pedestrian is looking at the on coming car) or NotLooking (if the pedestrian is looking away from the oncoming car). For predicting the motion, the two classes areWalking and Not Walking (or Standing).
As can be seen, the performance of the models trained
TABLE VI: Confusion matrix of pedestrian motion estima-tion (CNN features + SVM classifier).
Data split A Data split B
Walking Not Walking Walking Not Walking
Walking 89% 11% 98% 2%Not Walking 83% 17% 2% 98%
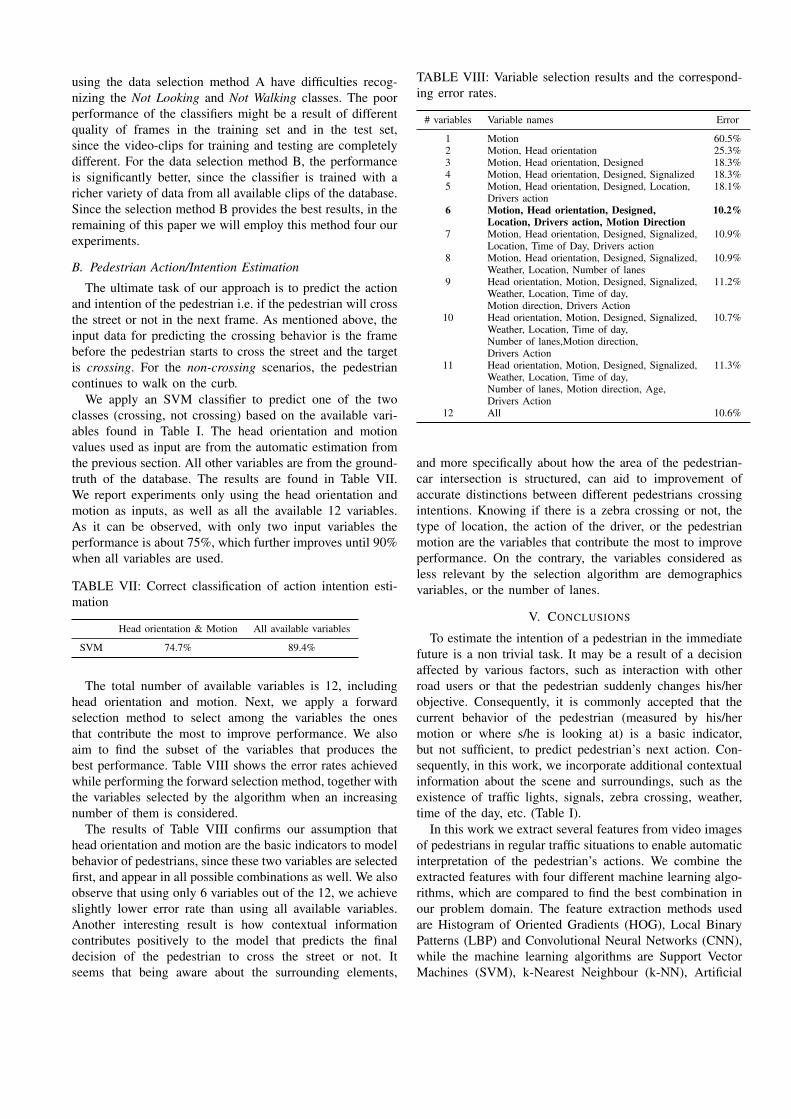
using the data selection method A have difficulties recog-nizing the Not Looking and Not Walking classes. The poorperformance of the classifiers might be a result of differentquality of frames in the training set and in the test set,since the video-clips for training and testing are completelydifferent. For the data selection method B, the performanceis significantly better, since the classifier is trained with aricher variety of data from all available clips of the database.Since the selection method B provides the best results, in theremaining of this paper we will employ this method four ourexperiments.
B. Pedestrian Action/Intention Estimation
The ultimate task of our approach is to predict the actionand intention of the pedestrian i.e. if the pedestrian will crossthe street or not in the next frame. As mentioned above, theinput data for predicting the crossing behavior is the framebefore the pedestrian starts to cross the street and the targetis crossing. For the non-crossing scenarios, the pedestriancontinues to walk on the curb.
We apply an SVM classifier to predict one of the twoclasses (crossing, not crossing) based on the available vari-ables found in Table I. The head orientation and motionvalues used as input are from the automatic estimation fromthe previous section. All other variables are from the ground-truth of the database. The results are found in Table VII.We report experiments only using the head orientation andmotion as inputs, as well as all the available 12 variables.As it can be observed, with only two input variables theperformance is about 75%, which further improves until 90%when all variables are used.
TABLE VII: Correct classification of action intention esti-mation
Head orientation & Motion All available variables
SVM 74.7% 89.4%
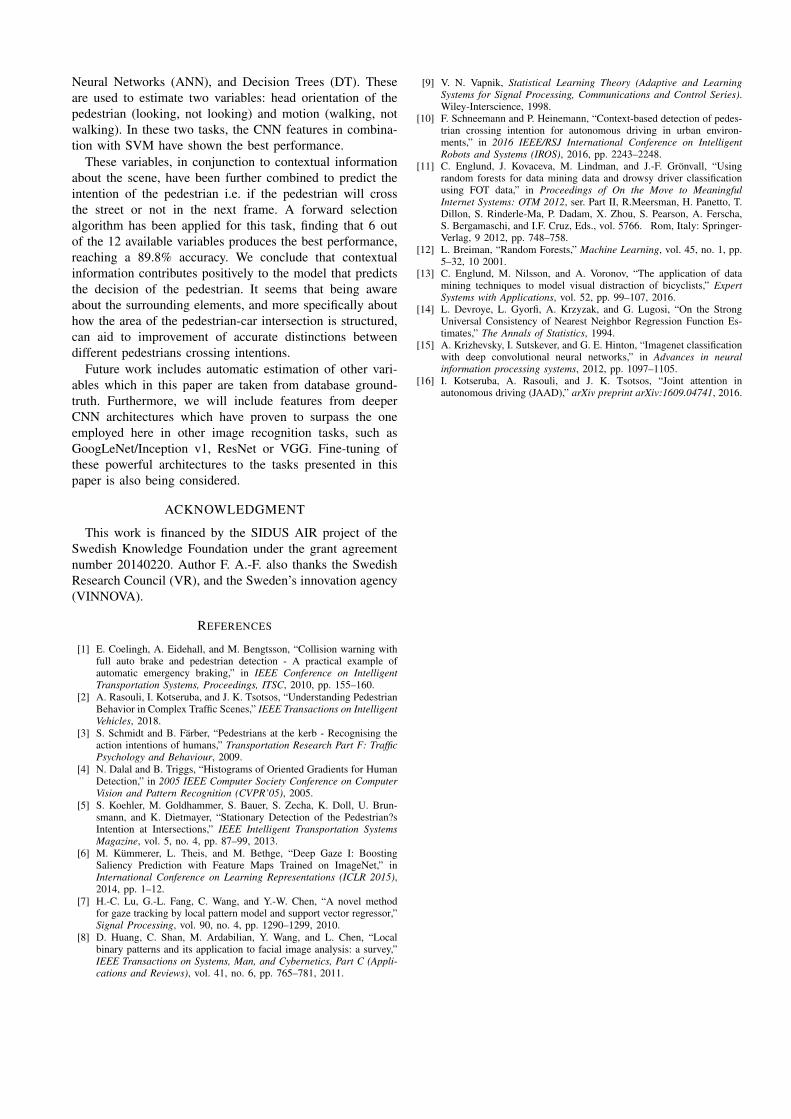
The total number of available variables is 12, includinghead orientation and motion. Next, we apply a forwardselection method to select among the variables the onesthat contribute the most to improve performance. We alsoaim to find the subset of the variables that produces thebest performance. Table VIII shows the error rates achievedwhile performing the forward selection method, together withthe variables selected by the algorithm when an increasingnumber of them is considered.
The results of Table VIII confirms our assumption thathead orientation and motion are the basic indicators to modelbehavior of pedestrians, since these two variables are selectedfirst, and appear in all possible combinations as well. We alsoobserve that using only 6 variables out of the 12, we achieveslightly lower error rate than using all available variables.Another interesting result is how contextual informationcontributes positively to the model that predicts the finaldecision of the pedestrian to cross the street or not. Itseems that being aware about the surrounding elements,
TABLE VIII: Variable selection results and the correspond-ing error rates.
# variables Variable names Error
1 Motion 60.5%2 Motion, Head orientation 25.3%3 Motion, Head orientation, Designed 18.3%4 Motion, Head orientation, Designed, Signalized 18.3%5 Motion, Head orientation, Designed, Location, 18.1%
Drivers action6 Motion, Head orientation, Designed, 10.2%
Location, Drivers action, Motion Direction7 Motion, Head orientation, Designed, Signalized, 10.9%
Location, Time of Day, Drivers action8 Motion, Head orientation, Designed, Signalized, 10.9%
Weather, Location, Number of lanes9 Head orientation, Motion, Designed, Signalized, 11.2%
Weather, Location, Time of day,Motion direction, Drivers Action
10 Head orientation, Motion, Designed, Signalized, 10.7%Weather, Location, Time of day,Number of lanes,Motion direction,Drivers Action
11 Head orientation, Motion, Designed, Signalized, 11.3%Weather, Location, Time of day,Number of lanes, Motion direction, Age,Drivers Action
12 All 10.6%
and more specifically about how the area of the pedestrian-car intersection is structured, can aid to improvement ofaccurate distinctions between different pedestrians crossingintentions. Knowing if there is a zebra crossing or not, thetype of location, the action of the driver, or the pedestrianmotion are the variables that contribute the most to improveperformance. On the contrary, the variables considered asless relevant by the selection algorithm are demographicsvariables, or the number of lanes.
V. CONCLUSIONS
To estimate the intention of a pedestrian in the immediatefuture is a non trivial task. It may be a result of a decisionaffected by various factors, such as interaction with otherroad users or that the pedestrian suddenly changes his/herobjective. Consequently, it is commonly accepted that thecurrent behavior of the pedestrian (measured by his/hermotion or where s/he is looking at) is a basic indicator,but not sufficient, to predict pedestrian’s next action. Con-sequently, in this work, we incorporate additional contextualinformation about the scene and surroundings, such as theexistence of traffic lights, signals, zebra crossing, weather,time of the day, etc. (Table I).
In this work we extract several features from video imagesof pedestrians in regular traffic situations to enable automaticinterpretation of the pedestrian’s actions. We combine theextracted features with four different machine learning algo-rithms, which are compared to find the best combination inour problem domain. The feature extraction methods usedare Histogram of Oriented Gradients (HOG), Local BinaryPatterns (LBP) and Convolutional Neural Networks (CNN),while the machine learning algorithms are Support VectorMachines (SVM), k-Nearest Neighbour (k-NN), Artificial
Neural Networks (ANN), and Decision Trees (DT). Theseare used to estimate two variables: head orientation of thepedestrian (looking, not looking) and motion (walking, notwalking). In these two tasks, the CNN features in combina-tion with SVM have shown the best performance.
These variables, in conjunction to contextual informationabout the scene, have been further combined to predict theintention of the pedestrian i.e. if the pedestrian will crossthe street or not in the next frame. A forward selectionalgorithm has been applied for this task, finding that 6 outof the 12 available variables produces the best performance,reaching a 89.8% accuracy. We conclude that contextualinformation contributes positively to the model that predictsthe decision of the pedestrian. It seems that being awareabout the surrounding elements, and more specifically abouthow the area of the pedestrian-car intersection is structured,can aid to improvement of accurate distinctions betweendifferent pedestrians crossing intentions.
Future work includes automatic estimation of other vari-ables which in this paper are taken from database ground-truth. Furthermore, we will include features from deeperCNN architectures which have proven to surpass the oneemployed here in other image recognition tasks, such asGoogLeNet/Inception v1, ResNet or VGG. Fine-tuning ofthese powerful architectures to the tasks presented in thispaper is also being considered.
ACKNOWLEDGMENT
This work is financed by the SIDUS AIR project of theSwedish Knowledge Foundation under the grant agreementnumber 20140220. Author F. A.-F. also thanks the SwedishResearch Council (VR), and the Sweden’s innovation agency(VINNOVA).
REFERENCES
[1] E. Coelingh, A. Eidehall, and M. Bengtsson, “Collision warning withfull auto brake and pedestrian detection - A practical example ofautomatic emergency braking,” in IEEE Conference on IntelligentTransportation Systems, Proceedings, ITSC, 2010, pp. 155–160.
[2] A. Rasouli, I. Kotseruba, and J. K. Tsotsos, “Understanding PedestrianBehavior in Complex Traffic Scenes,” IEEE Transactions on IntelligentVehicles, 2018.
[3] S. Schmidt and B. Farber, “Pedestrians at the kerb - Recognising theaction intentions of humans,” Transportation Research Part F: TrafficPsychology and Behaviour, 2009.
[4] N. Dalal and B. Triggs, “Histograms of Oriented Gradients for HumanDetection,” in 2005 IEEE Computer Society Conference on ComputerVision and Pattern Recognition (CVPR’05), 2005.
[5] S. Koehler, M. Goldhammer, S. Bauer, S. Zecha, K. Doll, U. Brun-smann, and K. Dietmayer, “Stationary Detection of the Pedestrian?sIntention at Intersections,” IEEE Intelligent Transportation SystemsMagazine, vol. 5, no. 4, pp. 87–99, 2013.
[6] M. Kummerer, L. Theis, and M. Bethge, “Deep Gaze I: BoostingSaliency Prediction with Feature Maps Trained on ImageNet,” inInternational Conference on Learning Representations (ICLR 2015),2014, pp. 1–12.
[7] H.-C. Lu, G.-L. Fang, C. Wang, and Y.-W. Chen, “A novel methodfor gaze tracking by local pattern model and support vector regressor,”Signal Processing, vol. 90, no. 4, pp. 1290–1299, 2010.
[8] D. Huang, C. Shan, M. Ardabilian, Y. Wang, and L. Chen, “Localbinary patterns and its application to facial image analysis: a survey,”IEEE Transactions on Systems, Man, and Cybernetics, Part C (Appli-cations and Reviews), vol. 41, no. 6, pp. 765–781, 2011.
[9] V. N. Vapnik, Statistical Learning Theory (Adaptive and LearningSystems for Signal Processing, Communications and Control Series).Wiley-Interscience, 1998.
[10] F. Schneemann and P. Heinemann, “Context-based detection of pedes-trian crossing intention for autonomous driving in urban environ-ments,” in 2016 IEEE/RSJ International Conference on IntelligentRobots and Systems (IROS), 2016, pp. 2243–2248.
[11] C. Englund, J. Kovaceva, M. Lindman, and J.-F. Gronvall, “Usingrandom forests for data mining data and drowsy driver classificationusing FOT data,” in Proceedings of On the Move to MeaningfulInternet Systems: OTM 2012, ser. Part II, R.Meersman, H. Panetto, T.Dillon, S. Rinderle-Ma, P. Dadam, X. Zhou, S. Pearson, A. Ferscha,S. Bergamaschi, and I.F. Cruz, Eds., vol. 5766. Rom, Italy: Springer-Verlag, 9 2012, pp. 748–758.
[12] L. Breiman, “Random Forests,” Machine Learning, vol. 45, no. 1, pp.5–32, 10 2001.
[13] C. Englund, M. Nilsson, and A. Voronov, “The application of datamining techniques to model visual distraction of bicyclists,” ExpertSystems with Applications, vol. 52, pp. 99–107, 2016.
[14] L. Devroye, L. Gyorfi, A. Krzyzak, and G. Lugosi, “On the StrongUniversal Consistency of Nearest Neighbor Regression Function Es-timates,” The Annals of Statistics, 1994.
[15] A. Krizhevsky, I. Sutskever, and G. E. Hinton, “Imagenet classificationwith deep convolutional neural networks,” in Advances in neuralinformation processing systems, 2012, pp. 1097–1105.
[16] I. Kotseruba, A. Rasouli, and J. K. Tsotsos, “Joint attention inautonomous driving (JAAD),” arXiv preprint arXiv:1609.04741, 2016.