Embed Size (px)
Citation preview
Actin Cytoskeleton-Dependent Dynamics of the Human Serotonin1A
Receptor Correlates with Receptor Signaling
Sourav Ganguly, Thomas J. Pucadyil, and Amitabha ChattopadhyayCentre for Cellular and Molecular Biology, Hyderabad 500 007, India
ABSTRACT Analyzing the dynamics of membrane proteins in the context of cellular signaling represents a challenging problemin contemporary cell biology. Lateral diffusion of lipids and proteins in the cell membrane is known to be influenced by thecytoskeleton. In this work, we explored the role of the actin cytoskeleton on the mobility of the serotonin1A (5-HT1A) receptor, stablyexpressed in CHO cells, and its implications in signaling. FRAP analysis of 5-HT1AR-EYFP shows that destabilization of the actincytoskeleton induced by either CD or elevation of cAMP levels mediated by forskolin results in an increase in the mobile fraction ofthe receptor. The increase in the mobile fraction is accompanied by a corresponding increase in the signaling efficiency of thereceptor. Interestingly, with increasing concentrations of CD used, the increase in the mobile fraction exhibited a correlation of;0.95 with the efficiency in ligand-mediated signaling of the receptor. Radioligand binding and G-protein coupling of the receptorwere found to be unaffected upon treatment with CD. Our results suggest that signaling by the serotonin1A receptor is correlatedwith receptor mobility, implying thereby that the actin cytoskeleton could play a regulatory role in receptor signaling. These resultsmay have potential significance in the context of signaling by GPCRs in general and in the understanding of GPCR-cytoskeletoninteractions with respect to receptor signaling in particular.
INTRODUCTION
Biological membranes are complex two-dimensional non-
covalent assemblies of a diverse variety of lipids and pro-
teins. Current understanding of the organization of biological
membranes involves the concept of lateral heterogeneities in
the membrane, collectively termed ‘‘membrane domains’’.
These specialized regions are believed to be enriched in
specific lipids and proteins and facilitate processes such as
trafficking, sorting, and signal transduction over a range of
spatiotemporal scale (1–4). The eukaryotic plasma mem-
brane, therefore, displays a rather complex architecture in
terms of the organization of membrane components.
Seven transmembrane domain GPCRs constitute one of
the largest families of proteins in mammals and account for
;2% of the total proteins coded by the human genome (5).
Signal transduction events mediated by GPCRs are the pri-
mary means by which cells communicate with and respond to
their external environment (6). As a consequence, GPCRs
represent major targets for the development of novel drug
candidates in all clinical areas (7). The major paradigm in
GPCR signaling is that their stimulation leads to the recruit-
ment and activation of heterotrimeric G-proteins (8). The key
steps involved in this process are agonist-induced guanine
nucleotide exchange of GDP by GTP on the G-protein a
subunit. This is followed by conformational changes in the
GPCR and dissociation or rearrangement of the Ga from Gbg
subunits. The activated G-protein subunits subsequently elicit
separate downstream signaling events by interacting with
specific effectors like AC, phospholipases, or ion channels.
The G-protein-coupled serotonin1A (5-HT1A) receptor is the
most extensively studied among the serotonin receptors (9).
Serotonin1A receptors appear to play a key role in the gener-
ation and modulation of various cognitive, behavioral, and
developmental functions, such as sleep, mood, addiction, de-
pression, and anxiety (10). Mutant (knockout) mice lacking
the serotonin1A receptor exhibit enhanced anxiety-related be-
havior and provide an important animal model for the analysis
of complex traits such as anxiety disorders and aggression in
higher organisms (11). Interestingly, serotonin1A receptor-
mediated signaling has been implicated in various neuro-
developmental processes such as neurite growth and neuronal
survival (12). Upon binding serotonin, the serotonin1A re-
ceptor signals via Gai-mediated inhibition of AC, leading to
the lowering of cAMP levels and consequent downstream
signaling (9). We have previously characterized the heterolo-
doi: 10.1529/biophysj.107.125732
Submitted November 13, 2007, and accepted for publication February 21,
2008.
Address reprint requests to Amitabha Chattopadhyay, Centre for Cellular
and Molecular Biology, Uppal Road, Hyderabad 500 007, India. Tel.:
191-40-2719-2578; Fax: 191-40-2716-0311; E-mail: [email protected].
Thomas J. Pucadyil’s present address is Department of Cell Biology, The
Scripps Research Institute, La Jolla, CA 92037.
Abbreviations used: CHO, Chinese hamster ovary; EYFP, enhanced yellow
fluorescent protein; G-protein, guanine nucleotide binding protein; IC50, 50%
inhibitory concentration; RhoA, ras homolog gene family, member A; ROI,
region of interest; 5-HT, 5-hydroxytryptamine; 5-HT1AR-EYFP, 5-hydroxy-
tryptamine1A receptor tagged to enhanced yellow fluorescent protein;
8-OH-DPAT, 8-hydroxy-2-(di-N-propylamino)tetralin; AC, adenylyl cy-
clase; BCA, bicinchoninic acid; cAMP, adenosine 39,59-cyclic monopho-
sphate; CD, cytochalasin D; Dapp, apparent diffusion coefficient; DMSO,
dimethyl sulphoxide; GPCR, G-protein coupled receptor; GTP-g-S, guanosine
59-O-(3-thiotriphosphate); FRAP, fluorescence recovery after photobleaching;
IBMX, 3-isobutyl-1-methylxanthine; p-MPPI, 4-(29-methoxy)-phenyl-1-
[29-(N-2$-pyridinyl)-p-iodobenzamido]ethyl-piperazine; p-MPPF, 4-(29-methoxy)-
phenyl-1-[29-(N-2$-pyridinyl)-p-fluorobenzamido]ethyl-piperazine; PBS,
phosphate-buffered saline; PDZ, PSD95/DlgA/ZO-1; PKA, protein kinase A;
PMSF, phenylmethanesulfonyl fluoride.
Editor: G. Barisas.
� 2008 by the Biophysical Society
0006-3495/08/07/451/13 $2.00
Biophysical Journal Volume 95 July 2008 451–463 451
gously expressed serotonin1A receptor tagged to EYFP in
CHO cells pharmacologically and shown that the tagged re-
ceptors are essentially similar to the native receptor in hippo-
campal membranes (13).
The plasma membrane is the first platform where a cell
initiates its reaction to an extracellular stimulus. Since
membrane-bound molecules are dynamic, functional asso-
ciation between them depends on the probability of their
interaction with signaling partners. Cellular signaling medi-
ated by proteins has therefore been hypothesized to be a con-
sequence of differential mobility parameters of the various
interacting components (14–16). This forms the basis of the
‘‘mobile receptor’’ hypothesis, which proposes that receptor-
effector interactions at the plasma membrane are controlled
by lateral mobility of the interacting components. Lateral
diffusion of membrane lipids and proteins is known to be
influenced by cytoskeletal proteins. Early results from studies
performed on myoblast and erythrocyte membranes have
suggested that the cytoskeleton imposes constraints on the
lateral dynamics of membrane proteins (17,18). Recent ob-
servations using sophisticated microscopic techniques have
further supported the notion of an actin cytoskeleton-de-
pendent dynamics of molecules in cell membranes (19) and
have led to the ‘‘anchored protein picket fence model’’ of
membranes (20). An interesting corollary of this model is that
even proteins which do not interact specifically with the actin
cytoskeleton are expected to exhibit actin cytoskeleton-
dependent dynamics. The destabilization of the actin cyto-
skeleton may thus provide a handle to manipulate the lateral
dynamics of membrane proteins. In this work, we used this
strategy to address the mechanism of signaling of the sero-
tonin1A receptor expressed in CHO cells. We report here the
effect of actin cytoskeleton destabilization on the diffusion
properties of the functional serotonin1A receptor analyzed by
FRAP. In addition, we monitored the ability of the receptor to
signal under conditions of actin destabilization by estimating
its ability to lower cAMP levels upon activation by serotonin
in live cells. We interpret our results based on the current
understanding of actin-dependent lateral dynamics of mem-
brane proteins and receptor-effector interactions.
MATERIALS AND METHODS
Materials
MgCl2, p-MPPI, CaCl2, penicillin, streptomycin, gentamycin sulfate, sero-
tonin, polyethylenimine, and CD were obtained from Sigma (St. Louis, MO).
Rhodamine-conjugated phalloidin was from Molecular Probes (Eugene,
OR). D-MEM/F-12 (Dulbecco’s modified Eagle medium: nutrient mixture
F-12 (Ham) (1:1)), fetal calf serum, and geneticin (G 418) were from In-
vitrogen Life Technologies (Carlsbad, CA). GTP-g-S was from Roche Ap-
plied Science (Mannheim, Germany). BCA reagent was from Pierce
(Rockford, IL). Forskolin and IBMX were obtained from Calbiochem (San
Diego, CA). [3H]8-OH-DPAT (specific activity ¼ 135.0 Ci/mmol) and
[3H]p-MPPF (specific activity ¼ 70.5 Ci/mmol) were purchased from
DuPont New England Nuclear (Boston, MA). The cyclic [3H]AMP assay kit
was purchased from Amersham Biosciences (Buckinghamshire, UK). GF/B
glass microfiber filters were from Whatman International (Kent, UK). All
other chemicals used were of the highest available purity. Water was purified
through a Millipore (Bedford, MA) Milli-Q system and used throughout.
Cells and cell culture
CHO-K1 cells stably expressing the 5-HT1AR-EYFP (referred to as CHO-
5-HT1AR-EYFP) were used (;105 receptors/cell). Cells were grown in D-MEM/
F-12 (1:1) supplemented with 2.4 g/l of sodium bicarbonate, 10% fetal calf
serum, 60 mg/ml penicillin, 50 mg/ml streptomycin, 50 mg/ml gentamycin sulfate
in a humidified atmosphere with 5% CO2 at 37�C. CHO-5-HT1AR-EYFP cells
were maintained in the above-mentioned conditions with 300 mg/ml geneticin.
CD treatment of cells
A stock solution of 2 mM CD was made in DMSO, and further concentra-
tions were prepared upon dilution of the stock in buffer A (PBS containing
1 mM CaCl2 and 0.5 mM MgCl2). The amount of DMSO was always ,0.5%
(v/v). Treatment of control cells with similar amounts of DMSO did not show
any change in cellular morphology or receptor dynamics.
Cell membrane preparation
Cell membranes were prepared as described earlier (13) with a few modifi-
cations. Cells grown to confluence in 175 cm2 flasks were harvested with ice
cold buffer B (10 mM Tris, 5 mM EDTA, 0.1 mM PMSF, pH 7.4) at room
temperature. The harvest was homogenized with a Polytron (Duluth, GA)
homogenizer for 20 s at 4�C at maximum speed. The cell lysate was then
centrifuged at 500 g for 10 min at 4�C, and the resulting supernatant was
centrifuged at 40,000 g for 30 min at 4�C. The pellet thus obtained was
suspended in 50 mM Tris, pH 7.4, buffer and used for radioligand binding
assays. The total protein concentration of cell membranes was determined
using BCA assay (21).
Radioligand binding assay
Receptor binding assays were carried out as described earlier (13) with some
modifications. Briefly, tubes in duplicate with 40 mg of total protein in a
volume of 1 ml buffer C (50 mM Tris, 1 mM EDTA, 10 mM MgCl2, 5 mM
MnCl2, pH 7.4) for agonist binding or in 1 ml buffer D (50 mM Tris, 1 mM
EDTA, pH 7.4) for antagonist binding assays were used. Tubes were incu-
bated with the radiolabeled agonist [3H]8-OH-DPAT (final concentration in
the assay tube was 0.29 nM) or antagonist [3H]p-MPPF (final concentration
in the assay tube was 0.5 nM) for 1 h at 25�C. Nonspecific binding was
determined by performing the assay either in the presence of 10 mM sero-
tonin (for agonist binding) or in the presence of 10 mM p-MPPI (for an-
tagonist binding). The binding reaction was terminated by rapid filtration
under vacuum in a Brandel cell harvester (Gaithersburg, MD) through
Whatman GF/B 2.5 cm diameter glass microfiber filters (1.0 mm pore size),
which were presoaked in 0.15% (w/v) polyethylenimine for 1 h. The filters
were then washed three times with 3 ml of cold water (4�C) and dried, and the
retained radioactivity was measured in a Packard (Meriden, CT) Tri-Carb
1500 liquid scintillation counter using 5 ml of scintillation fluid.
GTP-g-S sensitivity assay
For experiments in which GTP-g-S was used, agonist binding assays were
performed on membranes prepared from cells treated with CD, in the pres-
ence of varying concentrations of GTP-g-S in buffer C containing 0.29 nM
[3H]8-OH-DPAT. Membranes prepared from cells without CD treatment
served as control. The concentration of GTP-g-S leading to 50% inhibition of
specific agonist binding (IC50) was calculated by nonlinear regression fitting
of the data to a four-parameter logistic function as described earlier (13):
B ¼ a=ð1 1 ðx=IÞsÞ1 b; (1a)
452 Ganguly et al.
Biophysical Journal 95(1) 451–463
where B is specific binding of the agonist normalized to binding in the
presence of very low concentration (10�12 M) of GTP-g-S, x denotes the
concentration of GTP-g-S, a is the range (ymax–ymin) of the fitted curve on the
ordinate (y axis), I is the IC50 concentration, b is the background of the fitted
curve (ymin), and s is the slope factor.
Estimation of cAMP levels in cells
The ability of the agonist to downregulate the forskolin-stimulated increase
in cAMP levels in cells was assessed as described previously (13), with a few
modifications. CHO cells stably expressing 5-HT1AR-EYFP were plated at a
density of 105 cells in 24-well plates and grown in D-MEM/F-12 medium for
48 h. After treatment with specified concentrations of CD for 30 min in buffer
A, cells were rinsed with PBS and incubated with 10 mM forskolin in the
presence of 5 nM serotonin (5-HT) (see Fig. 8 B) or a range of concentrations
of 5-HT (see Fig. 9 B) at 37�C for 30 min in serum-free medium. The
phosphodiesterase inhibitor IBMX (50 mM) was present during this treat-
ment. After this incubation, cells were lysed in 10 mM Tris and 5 mM EDTA,
pH 7.4 buffer. Cell lysates were boiled for 7–8 min and spun for 15 min in a
Sorvall (Newtown, CT) RC-5B centrifuge using a SS-34 rotor to remove
precipitated proteins. cAMP amounts in an aliquot of the supernatant were
estimated using the [3H]cAMP assay, which is based on the protein-binding
method described previously (22). The efficiency of the ligand-mediated
reduction in cAMP levels was calculated after normalization of the data to the
cAMP content in cells stimulated with forskolin. To determine the IC50 of
ligand-induced reduction in cAMP, data with a range of concentrations of
5-HT were fitted to the four-parameter logistic equation (Eq. 1), as mentioned
earlier, with a few parameters redefined as below:
C ¼ a=ð1 1 ðx=IÞsÞ1 b; (1b)
where C is the cAMP level normalized to the level of cAMP in cells
stimulated with 10 mM forskolin, x denotes the concentration of 5-HT, a is
the range (ymax–ymin) of the fitted curve on the ordinate (y axis), I is the IC50
concentration of 5-HT for half-maximal reduction of cAMP, b is the
background of the fitted curve (ymin), and s is the slope factor.
Phalloidin labeling of F-actin andconfocal microscopy
CHO cells stably expressing 5-HT1AR-EYFP were plated at a density of 104
cells on glass coverslips and were grown in D-MEM/F-12 medium for 48 h.
The coverslips were washed with buffer A, and cells were treated with
specified amounts of CD for 30 min at room temperature. In other cases,
treatment of cells with CD was followed by a 30-min treatment with 10 mM
forskolin. After treatment, cells were washed with buffer A and fixed with
3.5% (v/v) formaldehyde for 10 min. Subsequent permeabilization of cells
was carried out in the presence of 0.5% (v/v) Triton X-100 and 0.05% (v/v)
Tween-20 for 6 min. Cells were washed and stained with rhodamine-
phalloidin for 1 h before mounting. Images were acquired on an inverted
Zeiss LSM 510 Meta confocal microscope (Jena, Germany) with a 633, 1.4
numerical aperture oil immersion objective, 108 mm pinhole using the 543
nm line of an argon laser for excitation, and 560 nm long pass filter for the
collection of rhodamine fluorescence, giving a fixed z slice of 0.3 mm. The
images shown in Fig. 1 represent individual sections from the base (attached
to the coverslip) and about ;1 mm (three sections) away from the base into
the cell, and the projection of five sections from the base are shown in Fig. 7.
FRAP measurements and analysis
FRAP experiments were carried out on cells that were grown in D-MEM/
F-12 medium for 48 h on Lab-Tek chambered coverglass (Nunc, Denmark).
Cells were treated with different concentrations of CD in buffer A. In other
cases, treatment of cells with CD for 30 min was followed by a 30 min
treatment with 10 mM forskolin in buffer A. Experiments were carried out
within 20–30 min after addition of CD (and forskolin, wherever needed).
Images were acquired at room temperature (;23�C), on an inverted Zeiss
LSM 510 Meta confocal microscope, with a 633, 1.2 numerical aperture
water immersion objective using the 514 nm line of an argon laser and 535–
590 nm filter for the collection of EYFP fluorescence. Images were recorded
with a pinhole of 225 mm, giving a z slice of 1.7 mm. The distinct membrane
fluorescence of the cell periphery was targeted for bleaching and monitoring
of fluorescence recovery (23,24). Analysis with a control ROI drawn at a
certain distance away from the bleach ROI indicated no significant bleach
while fluorescence recovery was monitored. Data representing the mean
fluorescence intensity of the bleached ROI (;1.4 mm) were background
subtracted using a ROI placed outside the cell. Fluorescence recovery plots
with fluorescence intensities normalized to prebleach intensities were ana-
lyzed on the basis of a modified one-dimensional diffusion equation (25):
Ft ¼ ðFi � FoÞ3 ½1� erffd=ð2 3 ð2 3 ðD 3 tÞ0:5ÞÞg�1 Fo;
(2)
where Ft is the fluorescence at time t, Fi is the final intensity upon recovery
over the period of the experiment, Fo is the intensity immediately after
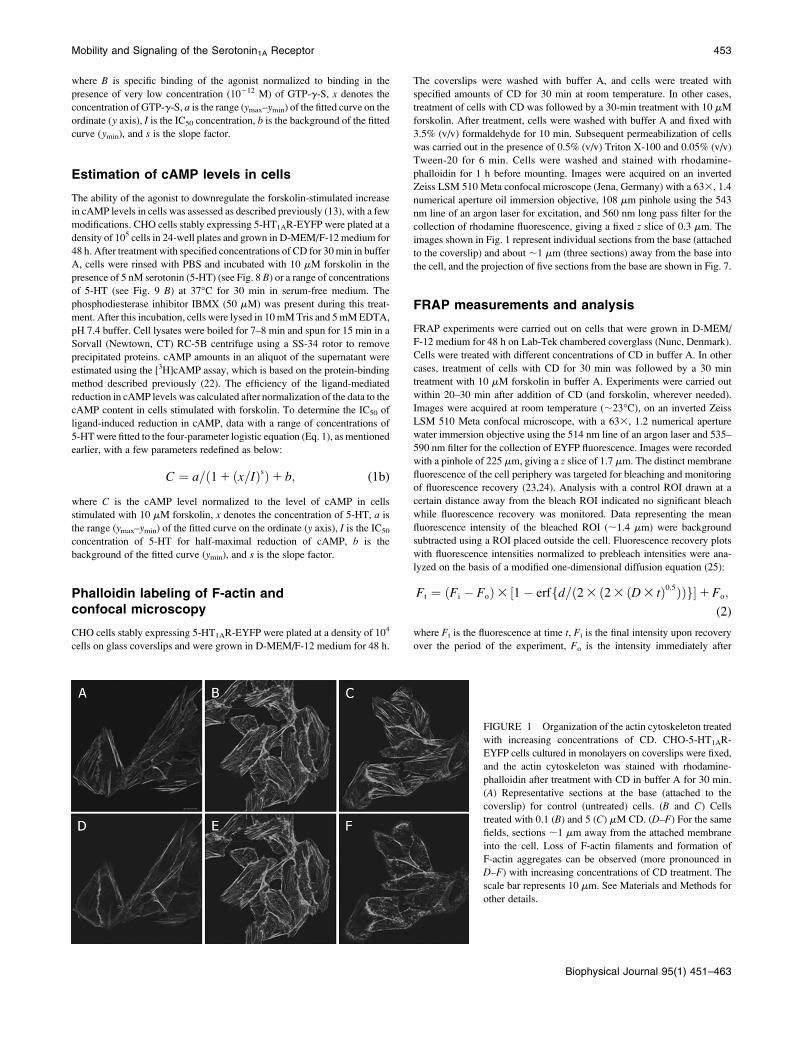
FIGURE 1 Organization of the actin cytoskeleton treated
with increasing concentrations of CD. CHO-5-HT1AR-
EYFP cells cultured in monolayers on coverslips were fixed,
and the actin cytoskeleton was stained with rhodamine-
phalloidin after treatment with CD in buffer A for 30 min.
(A) Representative sections at the base (attached to the
coverslip) for control (untreated) cells. (B and C) Cells
treated with 0.1 (B) and 5 (C) mM CD. (D–F) For the same
fields, sections ;1 mm away from the attached membrane
into the cell. Loss of F-actin filaments and formation of
F-actin aggregates can be observed (more pronounced in
D–F) with increasing concentrations of CD treatment. The
scale bar represents 10 mm. See Materials and Methods for
other details.
Mobility and Signaling of the Serotonin1A Receptor 453
Biophysical Journal 95(1) 451–463
bleach, erf is the error function, d is the length of the ROI selected for the
bleach, and D is the Dapp. The mobile fraction was estimated as
R ¼ ðFi � FoÞ=ð1� FoÞ: (3)
Normalized intensities of each data set were fitted individually to Eq. 2, and
parameters derived were used in Eq. 3. Statistical analysis was performed on
the entire set of derived parameters for all given conditions. Importantly,
analysis of fluorescence recovery kinetics based on a two-dimensional
diffusion model (26) exhibited a similar trend as that reported here using a
one-dimensional diffusion model.
Nonlinear curve fitting and statistical analysis
Nonlinear curve fitting of the fluorescence recovery data to Eq. 2 was carried
out using the Graphpad Prism software version 4.00 (San Diego, CA). The
correlation between reduction of cAMP levels and the mobile fraction of
receptors was plotted with the same software with traces for the 95% con-
fidence band of the regression line (see Fig. 10). Frequency distribution plot
and analysis was performed using Microcal Origin software, version 5.0
(OriginLab, Northampton, MA). Plots of data obtained for radioligand
binding and fits to Eqs. 1 and 19 were done with the GRAFIT program,
version 3.09b (Erithacus Software, Surrey, UK).
RESULTS
Increasing concentrations of CD lead to gradualloss of F-actin in CHO-5-HT1AR-EYFP cells
Cytochalasins are potent inhibitors of actin polymerization in
cells. In vitro studies have suggested that CD severs poly-
merized actin by predominantly binding to the barbed (fast
growing) end of the actin filament, thereby shifting the
equilibrium toward depolymerization (27). The mechanism
of action in vivo, however, appears to be a combination of the
above effect of the drug and a secondary cellular response,
leading to intensive disruption of the actin cytoskeletal net-
work (28). To monitor the effect of increasing concentrations
of CD on the actin cytoskeleton organization in CHO-
5-HT1AR-EYFP cells, fluorescence images of the actin cyto-
skeleton stained with rhodamine-phalloidin were obtained by
confocal microscopy (Fig. 1). Since FRAP measurements
require a clear identification of the plasma membrane, we
chose to use an optimal concentration range of CD where the
cellular morphology would remain more or less intact. We
also optimized the period of treatment such that for the
maximal concentration of CD used (5 mM CD), the cellular
morphology is retained over the time of measurement.
With increasing CD concentration, a progressive disinte-
gration of actin filaments was observed along with the ap-
pearance of small F-actin aggregates. The changes observed
at the base (attached to the coverslip) are relatively less al-
though small F-actin aggregates begin to appear (Fig. 1, A–C).
Individual sections of the same field ;1 mm into the cells
exhibit more pronounced effects of CD treatment and are
shown in Fig. 1, D–F. As can be seen in Fig. 1, although
untreated cells do not show any F-actin disintegration,
treatment with 5 mM CD led to a drastic shortening of the
actin filaments accompanied by the formation of large focal
aggregates of F-actin (Fig. 1 F). Further quantitation of the
CD effect from these images is difficult due to the fact that the
images presented represent selected sections of a z stack of
the field (as mentioned in Materials and Methods). Moreover,
treatment with CD results in fragmentation of actin filaments
into smaller F-actin aggregates, which appear brighter under
a fluorescence microscope, rendering intensity-based analy-
sis unsuitable. It should be noted that the action of CD on
cells was fast, and changes in cellular morphology were
visible within minutes for higher concentrations of CD.
5-HT1AR-EYFP exhibits actincytoskeleton-dependent dynamics in theplasma membrane
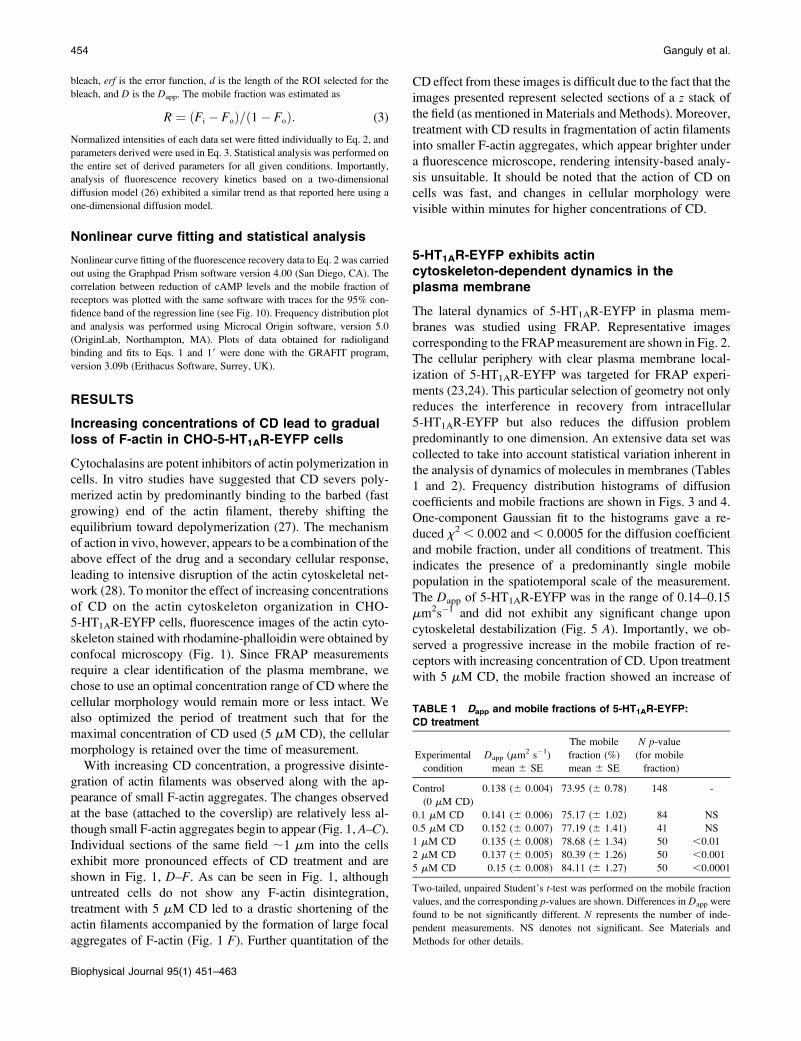
The lateral dynamics of 5-HT1AR-EYFP in plasma mem-
branes was studied using FRAP. Representative images
corresponding to the FRAP measurement are shown in Fig. 2.
The cellular periphery with clear plasma membrane local-
ization of 5-HT1AR-EYFP was targeted for FRAP experi-
ments (23,24). This particular selection of geometry not only
reduces the interference in recovery from intracellular
5-HT1AR-EYFP but also reduces the diffusion problem
predominantly to one dimension. An extensive data set was
collected to take into account statistical variation inherent in
the analysis of dynamics of molecules in membranes (Tables
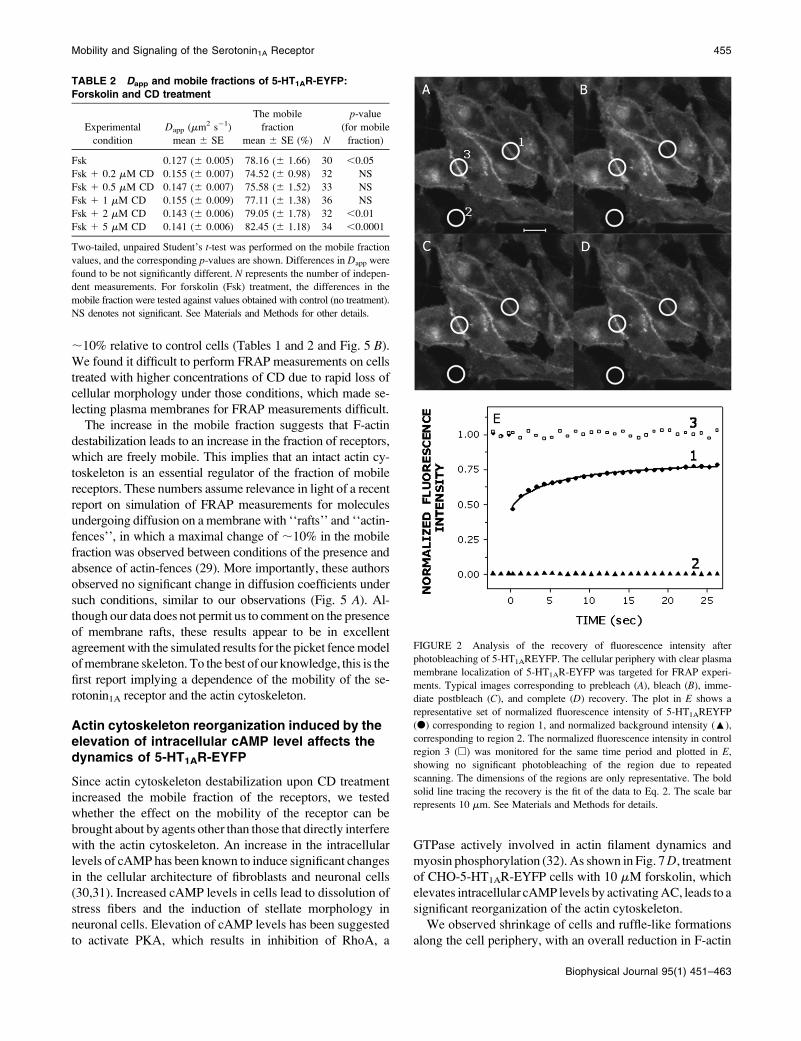
1 and 2). Frequency distribution histograms of diffusion
coefficients and mobile fractions are shown in Figs. 3 and 4.
One-component Gaussian fit to the histograms gave a re-
duced x2 , 0.002 and , 0.0005 for the diffusion coefficient
and mobile fraction, under all conditions of treatment. This
indicates the presence of a predominantly single mobile
population in the spatiotemporal scale of the measurement.
The Dapp of 5-HT1AR-EYFP was in the range of 0.14–0.15
mm2s�1 and did not exhibit any significant change upon
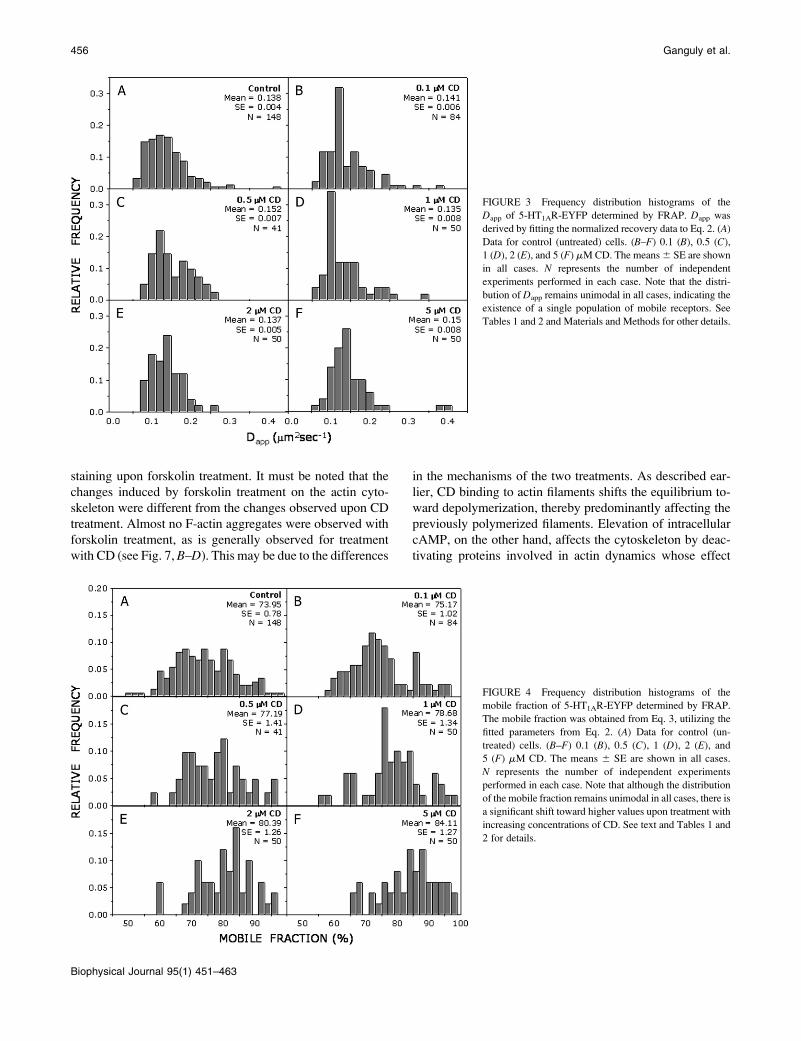
cytoskeletal destabilization (Fig. 5 A). Importantly, we ob-
served a progressive increase in the mobile fraction of re-
ceptors with increasing concentration of CD. Upon treatment
with 5 mM CD, the mobile fraction showed an increase of
TABLE 1 Dapp and mobile fractions of 5-HT1AR-EYFP:
CD treatment
Experimental
condition
Dapp (mm2 s�1)
mean 6 SE
The mobile
fraction (%)
mean 6 SE
N p-value
(for mobile
fraction)
Control
(0 mM CD)
0.138 (6 0.004) 73.95 (6 0.78) 148 -
0.1 mM CD 0.141 (6 0.006) 75.17 (6 1.02) 84 NS
0.5 mM CD 0.152 (6 0.007) 77.19 (6 1.41) 41 NS
1 mM CD 0.135 (6 0.008) 78.68 (6 1.34) 50 ,0.01
2 mM CD 0.137 (6 0.005) 80.39 (6 1.26) 50 ,0.001
5 mM CD 0.15 (6 0.008) 84.11 (6 1.27) 50 ,0.0001
Two-tailed, unpaired Student’s t-test was performed on the mobile fraction
values, and the corresponding p-values are shown. Differences in Dapp were
found to be not significantly different. N represents the number of inde-
pendent measurements. NS denotes not significant. See Materials and
Methods for other details.
454 Ganguly et al.
Biophysical Journal 95(1) 451–463
;10% relative to control cells (Tables 1 and 2 and Fig. 5 B).
We found it difficult to perform FRAP measurements on cells
treated with higher concentrations of CD due to rapid loss of
cellular morphology under those conditions, which made se-
lecting plasma membranes for FRAP measurements difficult.
The increase in the mobile fraction suggests that F-actin
destabilization leads to an increase in the fraction of receptors,
which are freely mobile. This implies that an intact actin cy-
toskeleton is an essential regulator of the fraction of mobile
receptors. These numbers assume relevance in light of a recent
report on simulation of FRAP measurements for molecules
undergoing diffusion on a membrane with ‘‘rafts’’ and ‘‘actin-
fences’’, in which a maximal change of ;10% in the mobile
fraction was observed between conditions of the presence and
absence of actin-fences (29). More importantly, these authors
observed no significant change in diffusion coefficients under
such conditions, similar to our observations (Fig. 5 A). Al-
though our data does not permit us to comment on the presence
of membrane rafts, these results appear to be in excellent
agreement with the simulated results for the picket fence model
of membrane skeleton. To the best of our knowledge, this is the
first report implying a dependence of the mobility of the se-
rotonin1A receptor and the actin cytoskeleton.
Actin cytoskeleton reorganization induced by theelevation of intracellular cAMP level affects thedynamics of 5-HT1AR-EYFP
Since actin cytoskeleton destabilization upon CD treatment
increased the mobile fraction of the receptors, we tested
whether the effect on the mobility of the receptor can be
brought about by agents other than those that directly interfere
with the actin cytoskeleton. An increase in the intracellular
levels of cAMP has been known to induce significant changes
in the cellular architecture of fibroblasts and neuronal cells
(30,31). Increased cAMP levels in cells lead to dissolution of
stress fibers and the induction of stellate morphology in
neuronal cells. Elevation of cAMP levels has been suggested
to activate PKA, which results in inhibition of RhoA, a
GTPase actively involved in actin filament dynamics and
myosin phosphorylation (32). As shown in Fig. 7 D, treatment
of CHO-5-HT1AR-EYFP cells with 10 mM forskolin, which
elevates intracellular cAMP levels by activating AC, leads to a
significant reorganization of the actin cytoskeleton.
We observed shrinkage of cells and ruffle-like formations
along the cell periphery, with an overall reduction in F-actin
TABLE 2 Dapp and mobile fractions of 5-HT1AR-EYFP:
Forskolin and CD treatment
Experimental
condition
Dapp (mm2 s�1)
mean 6 SE
The mobile
fraction
mean 6 SE (%) N
p-value
(for mobile
fraction)
Fsk 0.127 (6 0.005) 78.16 (6 1.66) 30 ,0.05
Fsk 1 0.2 mM CD 0.155 (6 0.007) 74.52 (6 0.98) 32 NS
Fsk 1 0.5 mM CD 0.147 (6 0.007) 75.58 (6 1.52) 33 NS
Fsk 1 1 mM CD 0.155 (6 0.009) 77.11 (6 1.38) 36 NS
Fsk 1 2 mM CD 0.143 (6 0.006) 79.05 (6 1.78) 32 ,0.01
Fsk 1 5 mM CD 0.141 (6 0.006) 82.45 (6 1.18) 34 ,0.0001
Two-tailed, unpaired Student’s t-test was performed on the mobile fraction
values, and the corresponding p-values are shown. Differences in Dapp were
found to be not significantly different. N represents the number of indepen-
dent measurements. For forskolin (Fsk) treatment, the differences in the
mobile fraction were tested against values obtained with control (no treatment).
NS denotes not significant. See Materials and Methods for other details.
FIGURE 2 Analysis of the recovery of fluorescence intensity after
photobleaching of 5-HT1AREYFP. The cellular periphery with clear plasma
membrane localization of 5-HT1AR-EYFP was targeted for FRAP experi-
ments. Typical images corresponding to prebleach (A), bleach (B), imme-
diate postbleach (C), and complete (D) recovery. The plot in E shows a
representative set of normalized fluorescence intensity of 5-HT1AREYFP
(d) corresponding to region 1, and normalized background intensity (:),
corresponding to region 2. The normalized fluorescence intensity in control
region 3 (h) was monitored for the same time period and plotted in E,
showing no significant photobleaching of the region due to repeated
scanning. The dimensions of the regions are only representative. The bold
solid line tracing the recovery is the fit of the data to Eq. 2. The scale bar
represents 10 mm. See Materials and Methods for details.
Mobility and Signaling of the Serotonin1A Receptor 455
Biophysical Journal 95(1) 451–463
staining upon forskolin treatment. It must be noted that the
changes induced by forskolin treatment on the actin cyto-
skeleton were different from the changes observed upon CD
treatment. Almost no F-actin aggregates were observed with
forskolin treatment, as is generally observed for treatment
with CD (see Fig. 7, B–D). This may be due to the differences
in the mechanisms of the two treatments. As described ear-
lier, CD binding to actin filaments shifts the equilibrium to-
ward depolymerization, thereby predominantly affecting the
previously polymerized filaments. Elevation of intracellular
cAMP, on the other hand, affects the cytoskeleton by deac-
tivating proteins involved in actin dynamics whose effect
FIGURE 3 Frequency distribution histograms of the
Dapp of 5-HT1AR-EYFP determined by FRAP. Dapp was
derived by fitting the normalized recovery data to Eq. 2. (A)
Data for control (untreated) cells. (B–F) 0.1 (B), 0.5 (C),
1 (D), 2 (E), and 5 (F) mM CD. The means 6 SE are shown
in all cases. N represents the number of independent
experiments performed in each case. Note that the distri-
bution of Dapp remains unimodal in all cases, indicating the
existence of a single population of mobile receptors. See
Tables 1 and 2 and Materials and Methods for other details.
FIGURE 4 Frequency distribution histograms of the
mobile fraction of 5-HT1AR-EYFP determined by FRAP.
The mobile fraction was obtained from Eq. 3, utilizing the
fitted parameters from Eq. 2. (A) Data for control (un-
treated) cells. (B–F) 0.1 (B), 0.5 (C), 1 (D), 2 (E), and
5 (F) mM CD. The means 6 SE are shown in all cases.
N represents the number of independent experiments
performed in each case. Note that although the distribution
of the mobile fraction remains unimodal in all cases, there is
a significant shift toward higher values upon treatment with
increasing concentrations of CD. See text and Tables 1 and
2 for details.
456 Ganguly et al.
Biophysical Journal 95(1) 451–463
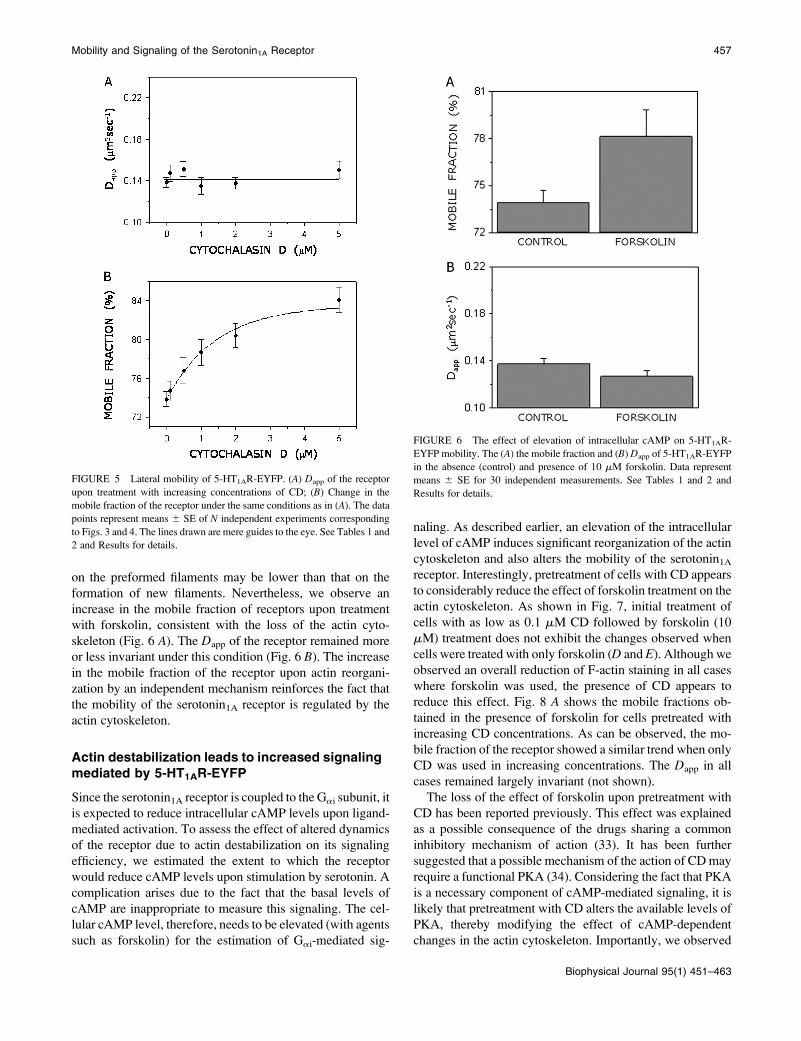
on the preformed filaments may be lower than that on the
formation of new filaments. Nevertheless, we observe an
increase in the mobile fraction of receptors upon treatment
with forskolin, consistent with the loss of the actin cyto-
skeleton (Fig. 6 A). The Dapp of the receptor remained more
or less invariant under this condition (Fig. 6 B). The increase
in the mobile fraction of the receptor upon actin reorgani-
zation by an independent mechanism reinforces the fact that
the mobility of the serotonin1A receptor is regulated by the
actin cytoskeleton.
Actin destabilization leads to increased signalingmediated by 5-HT1AR-EYFP
Since the serotonin1A receptor is coupled to the Gai subunit, it
is expected to reduce intracellular cAMP levels upon ligand-
mediated activation. To assess the effect of altered dynamics
of the receptor due to actin destabilization on its signaling
efficiency, we estimated the extent to which the receptor
would reduce cAMP levels upon stimulation by serotonin. A
complication arises due to the fact that the basal levels of
cAMP are inappropriate to measure this signaling. The cel-
lular cAMP level, therefore, needs to be elevated (with agents
such as forskolin) for the estimation of Gai-mediated sig-
naling. As described earlier, an elevation of the intracellular
level of cAMP induces significant reorganization of the actin
cytoskeleton and also alters the mobility of the serotonin1A
receptor. Interestingly, pretreatment of cells with CD appears
to considerably reduce the effect of forskolin treatment on the
actin cytoskeleton. As shown in Fig. 7, initial treatment of
cells with as low as 0.1 mM CD followed by forskolin (10
mM) treatment does not exhibit the changes observed when
cells were treated with only forskolin (D and E). Although we
observed an overall reduction of F-actin staining in all cases
where forskolin was used, the presence of CD appears to
reduce this effect. Fig. 8 A shows the mobile fractions ob-
tained in the presence of forskolin for cells pretreated with
increasing CD concentrations. As can be observed, the mo-
bile fraction of the receptor showed a similar trend when only
CD was used in increasing concentrations. The Dapp in all
cases remained largely invariant (not shown).
The loss of the effect of forskolin upon pretreatment with
CD has been reported previously. This effect was explained
as a possible consequence of the drugs sharing a common
inhibitory mechanism of action (33). It has been further
suggested that a possible mechanism of the action of CD may
require a functional PKA (34). Considering the fact that PKA
is a necessary component of cAMP-mediated signaling, it is
likely that pretreatment with CD alters the available levels of
PKA, thereby modifying the effect of cAMP-dependent
changes in the actin cytoskeleton. Importantly, we observed
FIGURE 5 Lateral mobility of 5-HT1AR-EYFP. (A) Dapp of the receptor
upon treatment with increasing concentrations of CD; (B) Change in the
mobile fraction of the receptor under the same conditions as in (A). The data
points represent means 6 SE of N independent experiments corresponding
to Figs. 3 and 4. The lines drawn are mere guides to the eye. See Tables 1 and
2 and Results for details.
FIGURE 6 The effect of elevation of intracellular cAMP on 5-HT1AR-
EYFP mobility. The (A) the mobile fraction and (B) Dapp of 5-HT1AR-EYFP
in the absence (control) and presence of 10 mM forskolin. Data represent
means 6 SE for 30 independent measurements. See Tables 1 and 2 and
Results for details.
Mobility and Signaling of the Serotonin1A Receptor 457
Biophysical Journal 95(1) 451–463
that pretreatment with even a relatively small concentration
of CD (0.1 mM) is sufficient to reduce the effect of 10 mM
forskolin. For the estimation of signaling of the receptor,
forskolin was hence used in all cases as an agent that can
elevate the basal cellular cAMP levels. Subsequent reduction
in cAMP levels, upon stimulation with serotonin, was es-
timated as a measure of the efficiency of signaling by the
receptor. It is important to note here that the control for
signaling measurements were cells which were not treated
with CD, and so in these cases we observe the effect of
forskolin itself. The concentration of serotonin (5 nM) chosen
for the measurement of signaling efficiency was IC50 in
control cells (not treated with CD). For these experiments,
cells pretreated with different concentrations of CD were
incubated in the presence of forskolin (10 mM) and serotonin
(5 nM). The relative reduction in cAMP level, normalized to
that found upon forskolin stimulation alone (without addition
of serotonin), is shown in Fig. 8 B. As can be seen, the re-
duction in cAMP levels, mediated by the receptor, shows an
increase upon treatment with increasing concentrations of
CD. Significantly, the mobile fractions and the reduction
in cAMP level, exhibited very similar trends with increasing
CD treatment (evident upon comparison of Fig. 8, A and B;
see also Tables 1 and 2). To rule out the possibility that
CD treatment itself could lead to the regulation of AC, we
estimated the level of basal cAMP present in cells pretreated
with CD.
The amount of cAMP estimated under different conditions
is shown in Fig. 9 A. No significant difference was observed
in the basal cAMP levels between control and CD-treated
cells, indicating that CD treatment does not lead to the
stimulation or inhibition of AC. If the levels of cAMP are
brought down to different extents due to treatment with
varying CD concentrations (Fig. 8 B), IC50 of reduction by
serotonin, in principle, should also shift. To assess the change
in IC50 of signaling for a given concentration of CD, we
estimated the effective reduction in cAMP levels over a range
of serotonin concentrations. As shown in Fig. 9 B, the IC50 of
signaling for 0.2 mM CD-treated cells (42.8 nM) was about
an order of magnitude higher compared to the corresponding
value (5.8 nM) for control cells (not treated with CD but in
the presence of forskolin) and for cells treated with 5 mM CD
(6.2 nM). This implies that signaling is more efficient under
conditions of actin destabilization.
Increased mobility of 5-HT1AR-EYFP correlatesstrongly to its efficiency in signaling
A plot of the mobile fractions of the receptor versus the ef-
ficiency in reduction of cAMP levels, generated by using data
from Fig. 8, A and B, is shown in Fig. 10. A linear regression
analysis between the mobile fraction and signaling produced
a positive correlation of ;0.95. The 95% confidence inter-
vals contained all the data points, implying a significant re-
lationship between the two parameters observed. Such a
correlation between the mobile fraction of the receptor and its
signaling implies a fundamental physical basis of signaling.
The fact that a strong correlation is observed despite the
natural variation of the system, both in terms of mobility and
signaling, reinforces the point.
Ligand binding of 5-HT1AR-EYFP remainsunaltered upon CD treatment
Since receptor stimulation in the case of GPCRs involves
multiple steps, the increased efficiency of signaling may be
due to the fact that the binding of the receptor toward its
agonist is altered upon cytoskeletal destabilization. To
monitor this, we performed radioligand binding assay of the
receptor in membranes prepared from CD-treated cells. Pre-
vious work from our laboratory has established that the ag-
onist preferentially binds to receptors which are coupled to
G-proteins, whereas the antagonist binds to both G-protein
coupled and uncoupled receptors (35). Fig. 11 shows
that both the agonist ([3H]8-OH-DPAT) and antagonist
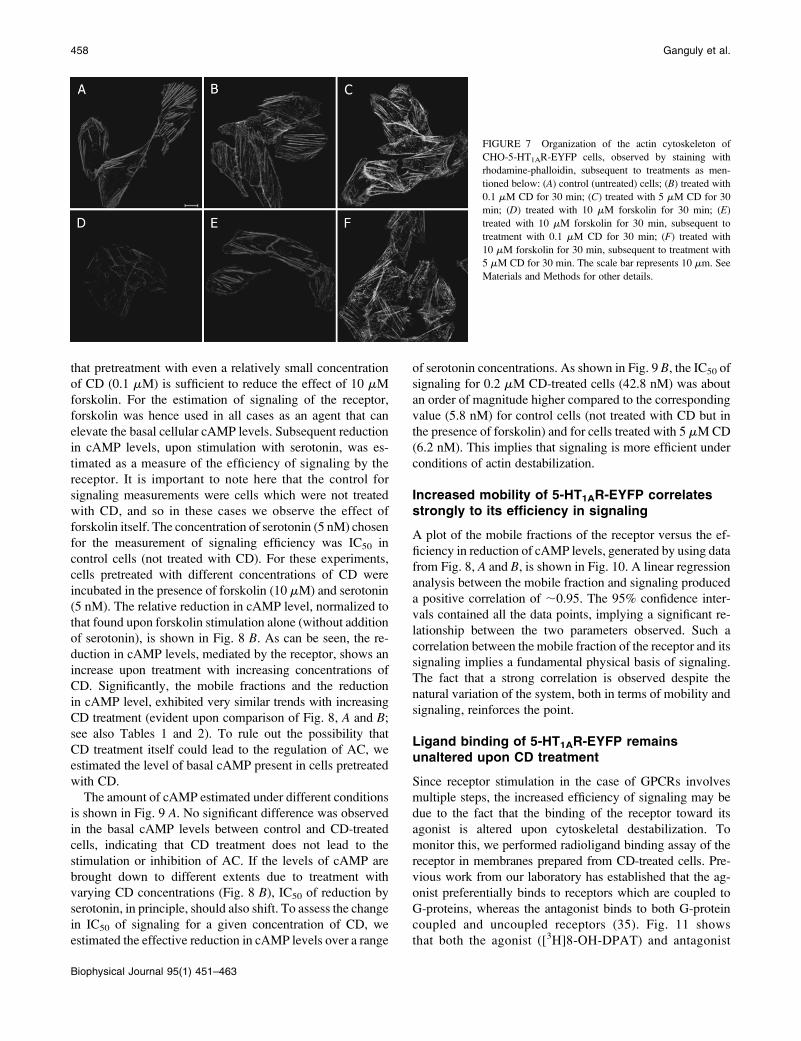
FIGURE 7 Organization of the actin cytoskeleton of
CHO-5-HT1AR-EYFP cells, observed by staining with
rhodamine-phalloidin, subsequent to treatments as men-
tioned below: (A) control (untreated) cells; (B) treated with
0.1 mM CD for 30 min; (C) treated with 5 mM CD for 30
min; (D) treated with 10 mM forskolin for 30 min; (E)
treated with 10 mM forskolin for 30 min, subsequent to
treatment with 0.1 mM CD for 30 min; (F) treated with
10 mM forskolin for 30 min, subsequent to treatment with
5 mM CD for 30 min. The scale bar represents 10 mm. See
Materials and Methods for other details.
458 Ganguly et al.
Biophysical Journal 95(1) 451–463
([3H]p-MPPF) binding remained essentially invariant upon
CD treatment, irrespective of the concentration of CD used.
G-protein coupling of 5-HT1AR-EYFP remainsunaffected upon actincytoskeleton destabilization
The coupling of the receptor to G-proteins represents an
important aspect in signaling mediated GPCRs. Signaling
mediated by the receptor is dependent on its coupling to the
respective G-protein. To check whether the increased effi-
ciency in signaling upon cytoskeletal destabilization is due to
an increased coupling of the receptor to the G-protein, we
examined the sensitivity of agonist binding in the presence of
various concentrations of GTP-g-S, a nonhydrolyzable ana-
log of GTP. We have previously shown that agonist binding
to serotonin1A receptors displays sensitivity to agents such as
GTP-g-S that uncouple the normal cycle of guanine nucle-
otide exchange at the Ga subunit caused by receptor activa-
tion (35). The specific binding of the agonist to serotonin1A
receptors is thus sensitive to guanine nucleotides and is in-
hibited with increasing concentrations of GTP-g-S. In the
presence of GTP-g-S, serotonin1A receptors undergo an af-
finity transition, from a high affinity G-protein coupled to a
low affinity G-protein uncoupled state (35). In agreement
with these results, Fig. 12 shows a characteristic reduction in
binding of the agonist [3H]8-OH-DPAT in the presence of
increasing concentrations of GTP-g-S with an estimated IC50
of 0.97 nM (control). The corresponding value in the case of
CD-treated membranes is ;1.08 nM, irrespective of the CD
concentration used. This shows that there is no significant
change in G-protein coupling upon cytoskeletal destabilization.
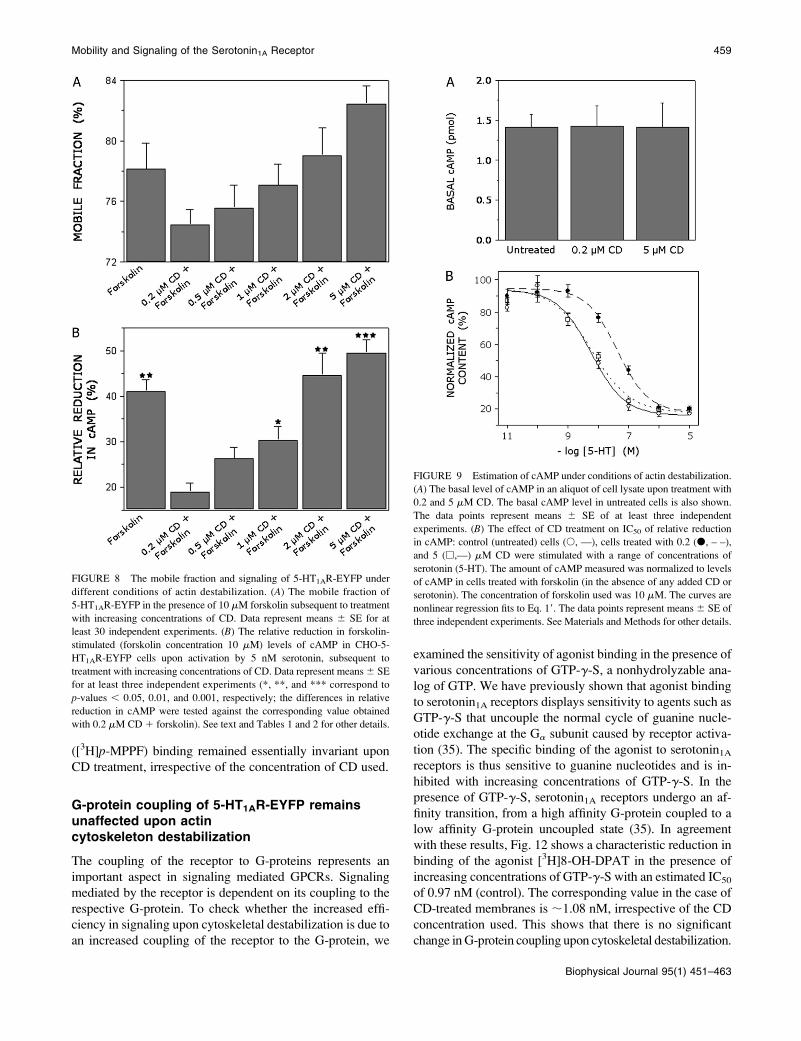
FIGURE 8 The mobile fraction and signaling of 5-HT1AR-EYFP under
different conditions of actin destabilization. (A) The mobile fraction of
5-HT1AR-EYFP in the presence of 10 mM forskolin subsequent to treatment
with increasing concentrations of CD. Data represent means 6 SE for at
least 30 independent experiments. (B) The relative reduction in forskolin-
stimulated (forskolin concentration 10 mM) levels of cAMP in CHO-5-
HT1AR-EYFP cells upon activation by 5 nM serotonin, subsequent to
treatment with increasing concentrations of CD. Data represent means 6 SE
for at least three independent experiments (*, **, and *** correspond to
p-values , 0.05, 0.01, and 0.001, respectively; the differences in relative
reduction in cAMP were tested against the corresponding value obtained
with 0.2 mM CD 1 forskolin). See text and Tables 1 and 2 for other details.
FIGURE 9 Estimation of cAMP under conditions of actin destabilization.
(A) The basal level of cAMP in an aliquot of cell lysate upon treatment with
0.2 and 5 mM CD. The basal cAMP level in untreated cells is also shown.
The data points represent means 6 SE of at least three independent
experiments. (B) The effect of CD treatment on IC50 of relative reduction
in cAMP: control (untreated) cells (s, —), cells treated with 0.2 (d, – –),
and 5 (h,—) mM CD were stimulated with a range of concentrations of
serotonin (5-HT). The amount of cAMP measured was normalized to levels
of cAMP in cells treated with forskolin (in the absence of any added CD or
serotonin). The concentration of forskolin used was 10 mM. The curves are
nonlinear regression fits to Eq. 19. The data points represent means 6 SE of
three independent experiments. See Materials and Methods for other details.
Mobility and Signaling of the Serotonin1A Receptor 459
Biophysical Journal 95(1) 451–463
DISCUSSION
Understanding cellular signaling by membrane receptors in
terms of their lateral dynamics represents a challenging area
in biology. Considering the fact that about one half of all
genetically encoded proteins in the eukaryotic genome are
membrane-associated proteins, it is likely that ;50% of all
reactions occurring in a cell occur on membranes (36). Since
a majority of all membrane proteins are targeted to the plasma
membrane, a significant fraction of cellular reactions occur
on or close to the plasma membrane. The plasma membrane
accordingly not only acts as a selective barrier for the cell but
also serves as a platform for the initiation and regulation of
signaling pathways. It is therefore relevant to understand the
mechanism of processes involved in signaling on the mem-
brane for a proper understanding of cellular function. In this
work, we explored the relationship between the actin cyto-
skeleton-dependent lateral mobility of the G-protein-coupled
serotonin1A receptor and its signaling.
Although the theoretical framework for lateral diffusion in
membranes was described a number of years back (37),
models for lateral diffusion of membrane-bound molecules
continue to emerge (38). In normal Brownian diffusion, the
mean-square displacement of the molecule is linearly pro-
portional to time. However, the mean-square displacement of
molecules on membranes has been reported to be non-
Brownian in many cases, particularly when monitored at
varying timescales (39). Such diffusion behavior has been
termed ‘‘anomalous diffusion’’. Diffusion of molecules on
cellular membranes is likely to be hindered due to cytoskel-
eton and other interacting components, leading to anomalous
diffusion. Interestingly, it appears that the nature of diffusion
observed is related to the timescale of measurement (39). It
should be mentioned here that for FRAP measurements per-
formed on the characteristic timescale of the order of seconds
to minutes, it is difficult to resolve anomalous from normal
diffusion (40). Our results show that with increasing desta-
bilization of the actin cytoskeleton, there is a gradual increase
in the mobile fraction of the serotonin1A receptor, whereas the
Dapp does not exhibit any significant change. The values ob-
tained for the Dapp are in the range of 0.14–0.15 mm2 s�1,
similar to values reported for GPCRs from FRAP measure-
ments in CHO cells (24,41,42). The increase in the mobile
fraction with increasing cytoskeletal destabilization can, then,
be due to the gradual release of receptors, previously confined
by the actin network. An alternative explanation of the effect
of actin destabilization could be the alteration of membrane
lipid organization in membrane domains (‘‘rafts’’), leading to
the release of the receptors, as reported recently (43–45).
Cellular signaling by GPCRs involves their activation
upon binding to ligands present in the extracellular envi-
ronment and the subsequent transduction of signals to the
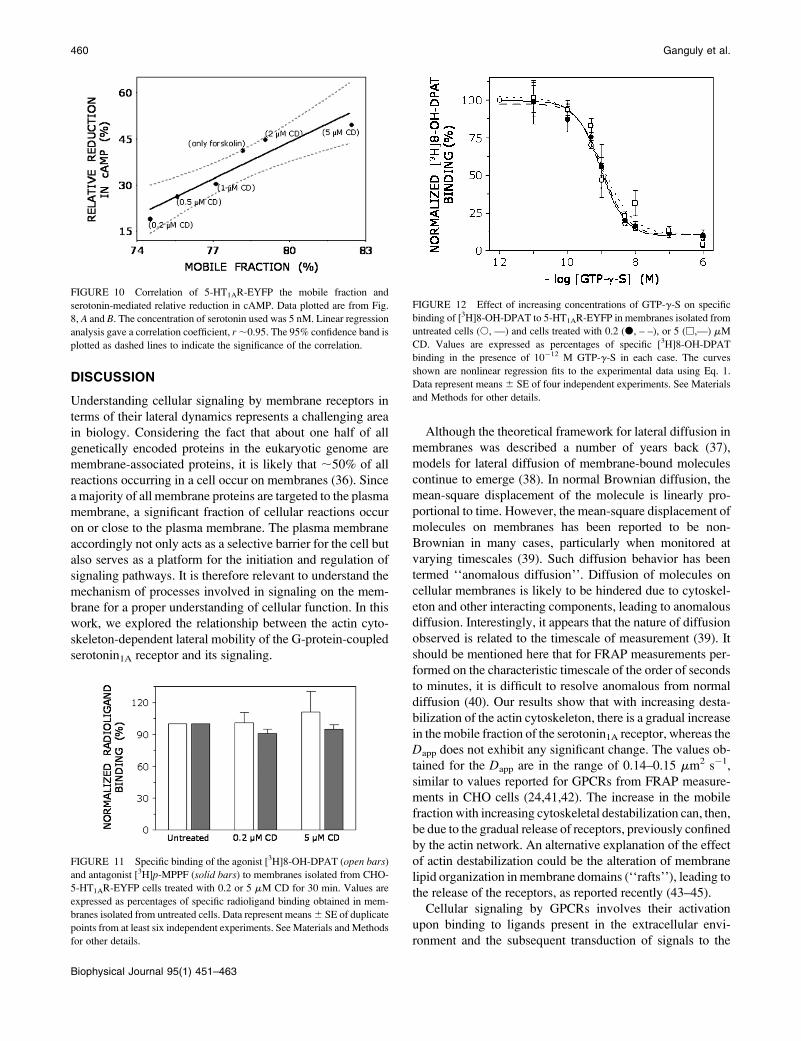
FIGURE 11 Specific binding of the agonist [3H]8-OH-DPAT (open bars)
and antagonist [3H]p-MPPF (solid bars) to membranes isolated from CHO-
5-HT1AR-EYFP cells treated with 0.2 or 5 mM CD for 30 min. Values are
expressed as percentages of specific radioligand binding obtained in mem-
branes isolated from untreated cells. Data represent means 6 SE of duplicate
points from at least six independent experiments. See Materials and Methods
for other details.
FIGURE 10 Correlation of 5-HT1AR-EYFP the mobile fraction and
serotonin-mediated relative reduction in cAMP. Data plotted are from Fig.
8, A and B. The concentration of serotonin used was 5 nM. Linear regression
analysis gave a correlation coefficient, r ;0.95. The 95% confidence band is
plotted as dashed lines to indicate the significance of the correlation.
FIGURE 12 Effect of increasing concentrations of GTP-g-S on specific
binding of [3H]8-OH-DPAT to 5-HT1AR-EYFP in membranes isolated from
untreated cells (s, —) and cells treated with 0.2 (d, – –), or 5 (h,—) mM
CD. Values are expressed as percentages of specific [3H]8-OH-DPAT
binding in the presence of 10�12 M GTP-g-S in each case. The curves
shown are nonlinear regression fits to the experimental data using Eq. 1.
Data represent means 6 SE of four independent experiments. See Materials
and Methods for other details.
460 Ganguly et al.
Biophysical Journal 95(1) 451–463
interior of the cell through concerted changes in their trans-
membrane domain structure (46). The major paradigm in this
signal transduction process is that stimulation of GPCRs
leads to the recruitment and activation of heterotrimeric
G-proteins (47). These initial events, fundamental to all types of
GPCR signaling, occur at the plasma membrane via protein-
protein interactions. An important consequence of this is that
the dynamics of the activated receptor on the cell sur-
face represents an important determinant in its encounter with
G-proteins and has significant impact on the overall effi-
ciency of the signal transduction process (16). Evidence for
this comes from a previous report in which the activation of
G-proteins by light-activated rhodopsin was determined by
diffusion rates of the receptor in the membrane (48).
In this context, the membrane organization and dynamics
of GPCRs and G-proteins participating in this signal trans-
duction process assume relevance. The classical view of re-
ceptor/G-protein function in cells proposes free diffusion of
molecules on the cell surface such that the probability of such
interaction would depend on random collisions (reviewed in
Neubig (49)). However, the specific and rapid signaling re-
sponses, characteristic of GPCR activation, cannot be ex-
plained solely based on a uniform distribution of receptors,
G-proteins, and effectors, one or more of which could even be
in low abundance, on the cell membrane (50,51). This leads to
the possibility that receptor/G-protein interactions may be de-
pendent on their organization in membranes. G-proteins have
earlier been shown as largely immobile, and it has been re-
ported that their mobility remains low even after cytoskeleton
destabilization (52). Various other studies have suggested a
highly organized and consequently restricted distribution of
G-proteins in the plasma membrane (49). Interestingly, ex-
perimental evidence on the distribution of AC suggests a
heterogeneous distribution, where GPCRs, G-proteins, and
AC were found in similar membrane fractions (50,53). Spa-
tiotemporal regulation of interactions between receptor,
G-proteins, and effectors on the cell membrane by the re-
striction imposed on their mobility (e.g., by the cytoskeleton)
is now believed to be an important determinant in GPCR sig-
naling (51,54,55).
An increase in the mobile fraction of the receptor can be
interpreted as an increase in the sampling space of the re-
ceptor. Actin destabilization may thus lead to increased
probability of interactions of the receptor with its signaling
partners in the context of the heterogeneous distribution of
the effectors (G-proteins and AC). This is supported by
the observation that the change in signaling mediated by the
receptor increases in a correlated manner with increase in the
mobile fraction (Fig. 10). Interestingly, a similar correlation
has previously been observed for the vasopressin V2-receptor
(56). These authors reported that the ability of the vasopressin
V2-receptor to activate AC via G-proteins was directly de-
pendent on the mobile fraction of these receptors on the cell
membrane. Jans et al. measured the mobile fraction of the
vasopressin V2-receptor as a function of temperature, and
attributed changes in the mobile fraction to temperature-
induced actin reorganization. In the case here, we depoly-
merized the actin cytoskeleton with CD or by elevating
intracellular cAMP level and observed a positive correlation
of ;0.95 between the mobile fraction and signaling effi-
ciency monitored by reduction in cAMP levels. Our results
are therefore in general agreement with the observations of
Jans et al. The vasopressin V2-receptor is a Gas-coupled GPCR
and activates AC, leading to elevation of cAMP levels in
cells. As mentioned earlier, the serotonin1A receptor is cou-
pled to Gai and downregulates AC, thereby lowering cAMP
levels. These two subtypes (Gai and Gas) of heterotrimeric G-
protein are believed to act differently upon activation, e.g.,
the Gai family of proteins has been reported to undergo
subunit rearrangement rather than dissociation upon activa-
tion, which is characteristic of the Gas subtype (57). More-
over, whereas Jans et al. monitored the mobility of
fluorescent ligand-bound vasopressin V2-receptors, our re-
sults were obtained using receptors with an EYFP tag. De-
spite these differences in their mode of activation, it is
interesting to note that the effect of increased mobility of the
receptor resulting in increased efficiency of signaling is ob-
served for both the receptors and appears to be independent
of the nature of the G-protein involved. Importantly, we
observe that the change in signaling efficiency (as measured
by IC50 values, Fig. 9 B) is different by about an order of
magnitude corresponding to a 10% change in mobile frac-
tion. Notably, the change in signaling is more pronounced
than the change in mobile fraction. This may be due to the
fact that signaling from a single receptor gets amplified
manyfold at the cAMP level. We further report that the
binding of the receptor to its agonist and its extent of
G-protein coupling remain unaltered upon actin destabilization.
The lack of significant alteration in ligand binding and
G-protein coupling upon CD treatment may be due to the fact
that these assays were performed on cell membranes upon
pretreatment of cells with CD. It is possible that the process
of membrane preparation eliminates any effect of actin cy-
toskeleton on the receptor. Interestingly, a recent report
suggests that membrane fractions isolated from cells are in-
terconnected with the actin cytoskeleton (58).
The possible reason for the observed increase in the mobile
fraction upon actin destabilization merits comment. It has
been recently reported that the actin-dependent mobility of
the cystic fibrosis transmembrane conductance regulator pro-
tein is regulated by its C-termini PDZ motif (59). These do-
mains are believed to help anchor transmembrane proteins to
the cytoskeleton and hold together signaling complexes. The
existence of such a binding motif has recently been reported
for a serotonin2-like receptor in Caenorhabditis elegans(60). A possible region of the receptor that may interact with
PDZ proteins and/or actin is the long third intracellular loop
of the receptor, although this needs to be confirmed. This
region has previously been shown to bind calmodulin (61),
which is known to interact with PDZ proteins (60). However,
Mobility and Signaling of the Serotonin1A Receptor 461
Biophysical Journal 95(1) 451–463
to the best of our knowledge, there are no reports in the
literature implying the existence of PDZ domains in sero-
tonin1A receptors.
Our results are important in the overall context of the role
of actin cytoskeleton in signaling mediated by the serotonin1A
receptor in particular and GPCRs in general. In addition,
processes involved in neurite growth require extensive re-
structuring of the actin cytoskeleton. Interestingly, activation
of the serotonin1A receptor has been implicated in neurite
outgrowth and neuronal survival (12). These results assume
significance in light of a recent report that the protein mo-
bilities are different between navigating and nonnavigating
growth cones in neurons, possibly due to differences in the
organization of the actin cytoskeleton (62). Moreover, with
growing evidence in favor of cAMP transducing specific
responses by localized signaling (63), our results raise an
interesting possibility of a dynamic system involving the
actin cytoskeleton, cAMP, and the serotonin1A receptor. We
note that the above system, in the presence of extracellular
serotonin, could be driven by a local negative feedback loop
wherein an increase in local intracellular cAMP level can
reorganize the actin cytoskeleton, leading to increased mo-
bility and hence signaling by the serotonin1A receptor, which
in effect would reduce the cAMP levels. It is notable that
cAMP-dependent neurite outgrowth has been observed ear-
lier (64,65). In light of our results, it may be possible to link
serotonin-mediated responses with neurite outgrowth. In sum-
mary, our results show that destabilization of the actin cyto-
skeleton can lead to increased receptor signaling. Whether the
effect of increased mobility by serotonin1A receptors during
neural growth constitutes a signaling cue represents a fasci-
nating question.
We thank Nandini Rangaraj for help with the confocal microscope,
Kaushlendra Tripathi for useful discussion, and members of our laboratory
for critically reading the manuscript and for helpful discussion and suggestions.
This work was supported by the Council of Scientific and Industrial Research
(CSIR), Government of India. S.G. thanks CSIR for the award of a research
fellowship. T.J.P. thanks the National Brain Research Center for the award of
a postdoctoral fellowship. A.C. is an Honorary Professor of the Jawaharlal
Nehru Centre for Advanced Scientific Research, Bangalore (India).
REFERENCES
1. Mukherjee, S., and F. R. Maxfield. 2004. Membrane domains. Annu.Rev. Cell Dev. Biol. 20:839–866.
2. Kusumi, A., and K. Suzuki. 2005. Toward understanding the dynamicsof membrane-raft-based molecular interactions. Biochim. Biophys.Acta. 1746:234–251.
3. Marguet, D., P.-F. Lenne, H. Rigneault, and H.-T. He. 2006. Dynamicsin the plasma membrane: how to combine fluidity and order. EMBO J.25:3446–3457.
4. Jacobson, K., O. G. Mouritsen, and R. G. W. Anderson. 2007. Lipidrafts: at a crossroad between cell biology and physics. Nat. Cell Biol.9:7–14.
5. Fredriksson, R., M. C. Lagerstrom, L.-G. Lundin, and H. B. Schioth.2003. The G-protein-coupled receptors in the human genome form fivemain families. Phylogenetic analysis, paralogon groups, and finger-prints. Mol. Pharmacol. 63:1256–1272.
6. Pierce, K. L., R. T. Premont, and R. J. Lefkowitz. 2002. Seven-transmembrane receptors. Nat. Rev. Mol. Cell Biol. 3:639–650.
7. Hopkins, A. L., and C. R. Groom. 2002. The druggable genome. Nat.Rev. Drug Discov. 1:727–730.
8. Oldham, W. M., and H. E. Hamm. 2006. Structural basis of function inheterotrimeric G proteins. Q. Rev. Biophys. 39:117–166.
9. Pucadyil, T. J., S. Kalipatnapu, and A. Chattopadhyay. 2005. Theserotonin1A receptor: a representative member of the serotonin receptorfamily. Cell. Mol. Neurobiol. 25:553–580.
10. Muller, C. P., R. J. Carey, J. P. Huston, and M. A. D. S. Silva. 2007.Serotonin and psychostimulant addiction: focus on 5-HT1A-receptors.Prog. Neurobiol. 81:133–178.
11. Gingrich, J. A., and R. Hen. 2001. Dissecting the role of the serotoninsystem in neuropsychiatric disorders using knockout mice. Psycho-pharmacology (Berl.). 155:1–10.
12. Fricker, A. D., C. Rios, L. A. Devi, and I. Gomes. 2005. Serotoninreceptor activation leads to neurite outgrowth and neuronal survival.Brain Res. Mol. Brain Res. 138:228–235.
13. Pucadyil, T., S. Kalipatnapu, K. Harikumar, N. Rangaraj, S. Karnik,and A. Chattopadhyay. 2004. G-protein-dependent cell surface dynam-ics of the human serotonin1A receptor tagged to yellow fluorescentprotein. Biochemistry. 43:15852–15862.
14. Cuatrecasas, P. 1974. Membrane receptors. Annu. Rev. Biochem. 43:169–214.
15. Kahn, C. R. 1976. Membrane receptors for hormones and neurotrans-mitters. J. Cell Biol. 70:261–286.
16. Peters, R. 1988. Lateral mobility of proteins and lipids in the red cellmembrane and the activation of adenylate cyclase by b-adrenergicreceptors. FEBS Lett. 234:1–7.
17. Tank, D. W., E. S. Wu, and W. W. Webb. 1982. Enhanced moleculardiffusibility in muscle membrane blebs: release of lateral constraints.J. Cell Biol. 92:207–212.
18. Berk, D. A., and R. M. Hochmuth. 1992. Lateral mobility of integralproteins in red blood cell tethers. Biophys. J. 61:9–18.
19. Fujiwara, T., K. Ritchie, H. Murakoshi, K. Jacobson, and A. Kusumi.2002. Phospholipids undergo hop diffusion in compartmentalized cellmembrane. J. Cell Biol. 157:1071–1081.
20. Kusumi, A., H. Murakoshi, K. Murase, and T. Fujiwara. 2005. Single-molecule imaging of diffusion, recruitment, and activation of signalingmolecules in living cells. In Biophysical Aspects of TransmembraneSignaling. S. Damjanovich, editor. Springer Series in Biophysics.Springer-Verlag, Berlin. 123–152.
21. Smith, P. K., R. I. Krohn, G. T. Hermanson, A. K. Mallia, F. H.Gartner, M. D. Provenzano, E. K. Fujimoto, N. M. Goeke, B. J. Olson,and D. C. Klenk. 1985. Measurement of protein using bicinchoninicacid. Anal. Biochem. 150:76–85.
22. Nordstedt, C., and B. B. Fredholm. 1990. A modification of a protein-binding method for rapid quantification of cAMP in cell-culturesupernatants and body fluid. Anal. Biochem. 189:231–234.
23. Umenishi, F., J.-M. Verbavatz, and A. S. Verkman. 2000. cAMPregulated membrane diffusion of a green fluorescent protein-aquaporin2 chimera. Biophys. J. 78:1024–1035.
24. Pucadyil, T. J., and A. Chattopadhyay. 2007. Cholesterol depletioninduces dynamic confinement of the G-protein coupled serotonin1A
receptor in the plasma membrane of living cells. Biochim. Biophys.Acta. 1768:655–668.
25. Crank, J. 1956. The Mathematics of Diffusion. Oxford University Press,London.
26. Soumpasis, D. M. 1983. Theoretical analysis of fluorescence photo-bleaching recovery experiments. Biophys. J. 41:95–97.
27. Sampath, P., and T. D. Pollard. 1991. Effects of cytochalasin, phalloidin,and pH on the elongation of actin filaments. Biochemistry. 30:1973–1980.
28. Schliwa, M. 1982. Action of cytochalasin D on cytoskeletal networks.J. Cell Biol. 92:79–91.
462 Ganguly et al.
Biophysical Journal 95(1) 451–463
29. Nicolau, D. V., K. Burrage, R. G. Parton, and J. F. Hancock. 2006.Identifying optimal lipid raft characteristics required to promote nano-scale protein-protein interactions on the plasma membrane. Mol. Cell.Biol. 26:313–323.
30. Lamb, N. J., A. Fernandez, M. A. Conti, R. Adelstein, D. B. Glass, W. J.Welch, and J. R. Feramisco. 1988. Regulation of actin microfilamentintegrity in living nonmuscle cells by the cAMP-dependent proteinkinase and the myosin light chain kinase. J. Cell Biol. 106:1955–1971.
31. Dong, J. M., T. Leung, E. Manser, and L. Lim. 1998. cAMP-inducedmorphological changes are counteracted by the activated RhoA smallGTPase and the Rho kinase ROKa. J. Biol. Chem. 273:22554–22562.
32. Howe, A. K. 2004. Regulation of actin-based cell migration by cAMP/PKA. Biochim. Biophys. Acta. 1692:159–174.
33. Szaszi, K., K. Kurashima, K. Kaibuchi, S. Grinstein, and J. Orlowski.2001. Role of the cytoskeleton in mediating cAMP-dependent proteinkinase inhibition of the epithelial Na1/H1 exchanger NHE3. J. Biol.Chem. 276:40761–40768.
34. Fischer, H., B. Illek, and T. E. Machen. 1995. The actin filamentdisrupter cytochalasin D activates the recombinant cystic fibrosistransmembrane conductance regulator Cl-channel in mouse 3T3 fibro-blasts. J. Physiol. 489:745–754.
35. Harikumar, K. G., and A. Chattopadhyay. 1999. Differential discrim-ination of G-protein coupling of serotonin1A receptors from bovinehippocampus by an agonist and an antagonist. FEBS Lett. 457:389–392.
36. Zimmerberg, J. 2006. Membrane biophysics. Curr. Biol. 16:R272–R276.
37. Saffman, P. G., and M. Delbruck. 1975. Brownian motion in biologicalmembranes. Proc. Natl. Acad. Sci. USA. 72:3111–3113.
38. Gambin, Y., R. Lopez-Esparza, M. Reffay, E. Sierecki, N. S. Gov, M.Genest, R. S. Hodges, and W. Urbach. 2006. Lateral mobility ofproteins in liquid membranes revisited. Proc. Natl. Acad. Sci. USA.103:2098–2102.
39. Suzuki, K., K. Ritchie, E. Kajikawa, T. Fujiwara, and A. Kusumi.2005. Rapid hop diffusion of a G-protein-coupled receptor in theplasma membrane as revealed by single-molecule techniques. Biophys.J. 88:3659–3680.
40. Saxton, M. J. 2001. Anomalous subdiffusion in fluorescence photo-bleaching recovery: a Monte Carlo study. Biophys. J. 81:2226–2240.
41. Horvat, R. D., S. Nelson, C. M. Clay, B. G. Barisas, and D. A. Roess.1999. Intrinsically fluorescent luteinizing hormone receptor demon-strates hormone-driven aggregation. Biochem. Biophys. Res. Commun.255:382–385.
42. Nelson, S., R. D. Horvat, J. Malvey, D. A. Roess, B. G. Barisas,and C. M. Clay. 1999. Characterization of an intrinsically fluorescentgonadotropin-releasing hormone receptor and effects of ligand bindingon receptor lateral diffusion. Endocrinology. 140:950–957.
43. Kwik, J., S. Boyle, D. Fooksman, L. Margolis, M. P. Sheetz, and M.Edidin. 2003. Membrane cholesterol, lateral mobility, and the phos-phatidylinositol 4,5-bisphosphate-dependent organization of cell actin.Proc. Natl. Acad. Sci. USA. 100:13964–13969.
44. Liu, A. P., and D. A. Fletcher. 2006. Actin polymerization serves as amembrane domain switch in model lipid bilayers. Biophys. J. 91:4064–4070.
45. Sun, M., N. Northup, F. Marga, T. Huber, F. J. Byfield, I. Levitan, andG. Forgacs. 2007. The effect of cellular cholesterol on membrane-cytoskeleton adhesion. J. Cell Sci. 120:2223–2231.
46. Gether, U. 2000. Uncovering molecular mechanisms involved inactivation of G protein-coupled receptors. Endocr. Rev. 21:90–113.
47. Hamm, H. E. 2001. How activated receptors couple to G proteins.Proc. Natl. Acad. Sci. USA. 98:4819–4821.
48. Calvert, P. D., V. I. Govardovskii, N. Krasnoperova, R. E. Anderson, J.Lem, and C. L. Makino. 2001. Membrane protein diffusion sets thespeed of rod phototransduction. Nature. 411:90–94.
49. Neubig, R. R. 1994. Membrane organization in G-protein mechanisms.FASEB J. 8:939–946.
50. Huang, C., J. R. Hepler, L. T. Chen, A. G. Gilman, R. G. Anderson,and S. M. Mumby. 1997. Organization of G proteins and adenylylcyclase at the plasma membrane. Mol. Biol. Cell. 8:2365–2378.
51. Hein, P., M. Frank, C. Hoffmann, M. J. Lohse, and M. Bunemann.2005. Dynamics of receptor/G protein coupling in living cells. EMBOJ. 24:4106–4114.
52. Kwon, G., D. Axelrod, and R. R. Neubig. 1994. Lateral mobility oftetramethylrhodamine (TMR) labelled G protein a and bg subunits inNG 108–15 cells. Cell. Signal. 6:663–679.
53. Rebois, R. V., M. Robitaille, C. Gales, D. J. Dupre, A. Baragli, P.Trieu, N. Ethier, M. Bouvier, and T. E. Hebert. 2006. Heterotrimeric Gproteins form stable complexes with adenylyl cyclase and Kir3.1channels in living cells. J. Cell Sci. 119:2807–2818.
54. Hur, E.-M., and K.-T. Kim. 2002. G protein-coupled receptor signal-ling and cross-talk: achieving rapidity and specificity. Cell. Signal.14:397–405.
55. Head, B. P., H. H. Patel, D. M. Roth, F. Murray, J. S. Swaney, I. R.Niesman, M. G. Farquhar, and P. A. Insel. 2006. Microtubules and actinmicrofilaments regulate lipid raft/caveolae localization of adenylylcyclase signaling components. J. Biol. Chem. 281:26391–26399.
56. Jans, D. A., R. Peters, P. Jans, and F. Fahrenholz. 1991. VasopressinV2 receptor mobile fraction and ligand-dependent adenylate cyclaseactivity are directly correlated in LLC-PK1 renal epithelial cells. J. CellBiol. 114:53–60.
57. Bunemann, M., M. Frank, and M. J. Lohse. 2003. Gi protein activationin intact cells involves subunit rearrangement rather than dissociation.Proc. Natl. Acad. Sci. USA. 100:16077–16082.
58. Mellgren, R. L. 2008. Detergent-resistant membrane subfractionscontaining proteins of plasma membrane, mitochondrial, and internalmembrane origins. J. Biochem. Biophys. Methods. 70:1029–1036.
59. Haggie, P. M., B. A. Stanton, and A. S. Verkman. 2004. Increaseddiffusional mobility of CFTR at the plasma membrane after deletion ofits C-terminal PDZ binding motif. J. Biol. Chem. 279:5494–5500.
60. Xiao, H., V. M. Hapiak, K. A. Smith, L. Lin, R. J. Hobson, J. Plenefisch,and R. Komuniecki. 2006. SER-1, a Caenorhabditis elegans 5-HT2-likereceptor, and a multi-PDZ domain containing protein (MPZ-1) interactin vulval muscle to facilitate serotonin-stimulated egg-laying. Dev. Biol.298:379–391.
61. Turner, J. H., A. K. Gelasco, and J. R. Raymond. 2004. Calmodulininteracts with the third intracellular loop of the serotonin 5-hydroxy-tryptamine1A receptor at two distinct sites: putative role in receptorphosphorylation by protein kinase C. J. Biol. Chem. 279:17027–17037.
62. Kulkarni, R. P., M. Bak-Maier, and S. E. Fraser. 2007. Differences inprotein mobility between pioneer versus follower growth cones. Proc.Natl. Acad. Sci. USA. 104:1207–1212.
63. Zaccolo, M., G. D. Benedetto, V. Lissandron, L. Mancuso, A. Terrin,and I. Zamparo. 2006. Restricted diffusion of a freely diffusible secondmessenger: mechanisms underlying compartmentalized cAMP signal-ling. Biochem. Soc. Trans. 34:495–497.
64. Song, H. J., G. L. Ming, and M. M. Poo. 1997. cAMP-induced switch-ing in turning direction of nerve growth cones. Nature. 388:275–279.
65. Ming, G. L., H. J. Song, B. Berninger, C. E. Holt, M. Tessier-Lavigne,and M. M. Poo. 1997. cAMP-dependent growth cone guidance bynetrin-1. Neuron. 19:1225–1235.
Mobility and Signaling of the Serotonin1A Receptor 463
Biophysical Journal 95(1) 451–463


![CYTOSKELETON NEWS - fnkprddata.blob.core.windows.net · Dynamic remodeling of the actin cytoskeleton [i.e., rapid cycling between filamentous actin (F-actin) and monomer actin (G-actin)]](https://img.pdfslide.us/doc/110x75/609edd2b88630103265d18ee/cytoskeleton-news-dynamic-remodeling-of-the-actin-cytoskeleton-ie-rapid-cycling.jpg)

![Actin cytoskeleton and cell motility - Indico [Home]indico.ictp.it/event/a10138/session/33/contribution/22/material/0/... · Actin cytoskeleton and cell motility Julie Plastino, UMR](https://img.pdfslide.us/doc/110x75/5bcc339f09d3f232618dcbfd/actin-cytoskeleton-and-cell-motility-indico-home-actin-cytoskeleton-and.jpg)