Embed Size (px)
Citation preview

Acta Cryst. D (2014). 70, doi:10.1107/S1399004714005239 Supporting information
Acta Crystallographica Section D Volume 70 (2014)
Supporting information for article:
Structure and mechanism of a nonhaem-iron SAM-dependent C-methyltransferase and its engineering to a hydratase and O-methyltransferase
Xiao-Wei Zou, Yu-Chen Liu, Ning-Shian Hsu, Chuen-Jiuan Huang, Syue-Yi Lyu, Hsiu-Chien Chan, Chin-Yuan Chang, Hsien-Wei Yeh, Kuan-Hung Lin, Chang-Jer Wu, Ming-Daw Tsai and Tsung-Lin Li

Acta Cryst. D (2014). 70, doi:10.1107/S1399004714005239 Supporting information, sup-1
S1. Supporting methods
S1.1. Enzymatic reaction
A typical enzymatic assay for methyltransferase activity was conducted in a buffer solution of 150 μl
for 4.5 hr at 25°C, wherein it contained enzyme (2.5 ng), PBS (50 mM, pH 7.4), Ppy (3 mM), and
SAM (1.5 mM). After incubation, the reaction mixture was centrifuged at 16000 g for 5 min and then
filtered with an ultracentrifugal membrane with 5 kDa cut-off (Millipore). The resulting filtrate was
subjected to HPLC-ESI/MS analysis in a gradient solvent system: acetonitrile linearly increased from
0 to 60% against water (0.1% TFA) in 30 min. On-line LC-ESI/MS spectra were recorded by an
Agilent HPLC 1200 series instrument coupled with a Thermo-Finnigan LTQ-XL ESI-ion trap mass
spectrometer in a positive mode. For non-heme oxygenase activity assay, MppJ was purified in a
reducing environment, which contained pre-degased buffer 50 mM HEPES pH 8.0 and 5 mM DTT.
Then Enzyme (10 ng) was incubated with 10 mM Ppy or 4HPpy in the presence of 1 mM ascorbic
acid (a reducing agent). Reactions were performed at 25°C for overnight incubation. After incubation,
enzyme was quenched by adding 6N HCl. The protein was removed by centrifugation and the
resultant was subjected to LC/MS analysis.
S1.2. Site-directed mutagenesis
Site-directed mutagenesis was carried out using QuickChange (Stratagene). The wild-type MppJ was
used as the template for single mutation. For multiple mutations, the single or double mutant was used
as the template. All mutations were confirmed by DNA sequencing. The pET/His plasmid was used
for protein expression. Mutant enzymes were purified with the same protocol for the wild-type MppJ.
S1.3. Analytical ultracentrifugation analysis
The sedimentation velocity experiments were performed with a Beckman-Coulter XL-I analytical
ultracentrifuge. Samples and buffers were loaded into 12 mm standard double-sector Epon charcoal-
filled centerpieces and mounted in an An-60 Ti rotor. 400 l of 1 mg ml-1
protein sample were loaded
into the cell. Sedimentation velocity experiments were performed at a rotor speed of 42,000 r.p.m. at
20°C. The signals of samples were monitored at 280 nm and collected every 3 min for 6 hr. The raw
data of experiments were calculated using SedFit (Schuck, 2000) software. The density and viscosity
of buffer were calculated using Sednterp software (http:// www.jphilo.mailway.com/default.htm). All
samples were visually checked for clarity after ultracentrifugation.

Acta Cryst. D (2014). 70, doi:10.1107/S1399004714005239 Supporting information, sup-2
S1.4. Isothermal titration calorimetry analysis
ITC experiments were performed at 25°C using an iTC200 microcalorimeter (MicroCal Inc.;
Northampton, MA). All the samples were dissolved in 50 mM HEPES buffer solutions (pH 8.0). The
titration consisted of 15 injections of 2 l in 150 s intervals. Each titration contained 0.1 mM MppJ in
the sample cell (250 l). Forty microliter of SAM, Ppy, or SAH (1 mM) were loaded in the injection
syringe. The reference cell was filled with water for all experiments. The heat of dilution was
determined by titrating the substrates into the buffer without enzyme and subtracted prior to curve
fitting. Data analysis was performed by using the Origin 7.0 software provided by MicroCal.
S1.5. X-ray absorption spectroscopy
X-ray absorption spectra were recorded at beamline 17C1 at the National Synchrotron Radiation
Research Center (Taiwan). Two millimolar of MppJ in a buffer solution (50 mM HEPES, pH 8.0)
were used in data collection. A cold-air device was set at 10°C for avoiding photodamage. The
absorption spectra were collected in fluorescence mode with solid-state detector or Lytle detector. The
first inflection point at 7112 eV of Fe foil spectrum was used for energy calibration. Raw X-ray
absorption data were analyzed following the standard procedure, including background subtractions
and normalization. Data were processed by using ATHENA (Ravel & Newville, 2005) software.
S1.6. Electron paramagnetic resonance spectroscopy
EPR spectra were recorded at the X band (9.5 GHz) by using a Bruker X-band E500CW spectrometer
(Bruker Biospin). Two millimolar samples were loaded into an EPR sample tube and immersed into a
liquid nitrogen Cold Finger Dewar to maintain the temperature at 77K for data collection.
S1.7. Chiral HPLC analysis
A Phenomenex Chirex (D)-penicillamine phase 3126 (4.6 mm 250 mm) ligand exchange column
(Torrence, CA, USA) was used in resolving the four diastereomers of -methylphenylalanine
standards and the enzymatic products. The -methylphenylalanine ( MePhe) standards (Sigma-
Aldrich) and enzymatic products were prepared in 1:1 H2O/CH3CN, and their chiral HPLC analyses
were eluted isocratically with a CuSO4 (2 mM) solution in 85:15 H2O/CH3CN.

Acta Cryst. D (2014). 70, doi:10.1107/S1399004714005239 Supporting information, sup-3
Table S1 Relative enzymatic activities (MT), enzyme colors and proposed functions of selected
residues.
Mutants
Relative
activitya
Color Function
M240L 0.88 turquoise SAM/SAH binding
M241L 0.91 turquoise SAM/SAH binding
M240L/M241L 0.70 turquoise SAM/SAH binding
W99F 0.46 colorless active site base
S104A 0.36 colorless active site base
C136A 0.75 turquoise SAM/SAH stabilization
C136H 0.01 turquoise SAM/SAH stabilization
C319A 0.61 turquoise allosteric regulation
R127L 0.94 yellow Ppy binding
R127L/D244E 0.70 lime Ppy binding/water interaction
R127L/D244L 0.00 lime Ppy binding/water interaction
R127L/V300E 0.00 lime hydrotase and methyltransferase
R127L/D244A/V300E 0.00 lime hydrotase and methyltransferase
H243F 0.00 colorless metal coordination
H295F 0.01 colorless metal coordination
D244L 0.02 olive green metal coordination
D244E 1.20 turquoise metal coordination
V300E 1.37 lime metal coordination
D244A/V300E 0.26 lime metal coordination
H243D/D244H 0.00 colorless metal coordination
H243E/D244H 0.01 colorless metal coordination
D244H/H295D 0.00 colorless metal coordination
D244H/H295E 0.02 turquoise metal coordination
a. The reactions of mutants were analyzed by HPLC; peak areas in triplicate were integrated and averaged; the
reaction rates were calculated using the linear regression equation; relative activities were determined by
dividing individual reaction rates with that of WT; the relative activity of WT is 1.0.

Acta Cryst. D (2014). 70, doi:10.1107/S1399004714005239 Supporting information, sup-4
Figure S1 Protein colors of purified MppJ and mutants thereof. The purified WT, D244E and
D244L display turquoise, dark green, and olive green, respectively.
a
D244E WT D244L
Acta Cryst. D (2014). 70, doi:10.1107/S1399004714005239 Supporting information, sup-5
b
Figure S2 Gel filtration analysis. (a) The size exclusive chromatograph of MppJ resolved by using a
Superdex 75 10/300 column. (b) The size exclusive chromatograph of molecular weight standards
resolved under the same condition.
0
100
200
300
400
500
0 5 10 15 20 25 30
0
400
800
1200
1600
2000
0 5 10 15 20 25 30
1.3
5 k
Da
17
kD
a
44
kD
a
158
kD
a
670
kD
a
(mAu)
(mAu)
(ml)
(ml)
~70 kDa

Acta Cryst. D (2014). 70, doi:10.1107/S1399004714005239 Supporting information, sup-6
Figure S3 Multiple sequence alignment for MppJ and homologues. The sequence alignment was
performed by ClustalW (http://www.ebi.ac.uk/Tools/msa/clustalw2/). The plot was generated by
ESPript (http://espript.ibcp.fr/ESPript/ESPript). The secondary structure of MppJ is shown on the top
of the sequence. Accession codes for MppJ (Q643C8), MmcR (Q9X5T6), LpOMT1 (Q9ZTU2),
NcsB1 (Q84HC8), DnrK (Q06528), CalO1 (Q8KNE5), and RdmB (Q54527) are designated by the
UniProtKB databank (http://www.uniprot.org/).

Acta Cryst. D (2014). 70, doi:10.1107/S1399004714005239 Supporting information, sup-7
a
b
Figure S4 Analytical ultracentrifugation analysis of MppJ. The AUC data were analyzed by SedFit
(http://www.analyticalultracentrifugation.com/default.htm). The calculated c(M) and c(S) distributions
are shown in the upper (a) and lower (b) panels, respectively. The insert grayscale bars indicate the
residuals bitmap in each fit.
0.00E+00
3.00E-05
6.00E-05
9.00E-05
1.20E-04
10000 30000 50000 70000 90000 110000 130000 150000 170000 190000 210000
c(M
)
Molecular weight (Da)
0.00E+00
1.00E+00
2.00E+00
3.00E+00
1 4 7 10 13
c(S
)
Sedimentation coefficient (S)
70203.8 Da
4.41

Acta Cryst. D (2014). 70, doi:10.1107/S1399004714005239 Supporting information, sup-8
Figure S5 Schematic topology of MppJ. The topology diagram was generated by TopDraw. The
secondary structures of -helix and -sheet are shown in red and yellow, respectively. MppJ is
composed of two domains, an N-terminal DD domain (residues 1-160) and a C-terminal MT catalytic
domain (residues 161-337).
DD
MT

Acta Cryst. D (2014). 70, doi:10.1107/S1399004714005239 Supporting information, sup-9
Figure S6 Interfaces analysis of MppJ. PISA (Krissinel & Henrick, 2007) analysis showed that the
interfaced area of an MppJ dimer is 3135 Å2, mainly dominated by hydrophobic interactions, 23
hydrogen bonds and 8 salt bridges. The analysis statistics is demonstrated on the bottom panel.

Acta Cryst. D (2014). 70, doi:10.1107/S1399004714005239 Supporting information, sup-10
a
b
Figure S7 Metal ion determination by inductively coupled plasma mass spectrometry (ICP-MS) and
X-ray absorption spectroscopy (XAS). (a) The ICP-MS spectrum (the molecular weight of Fe is 56
a.m.u.) (b) The XAS spectra, wherein MppJ, Fe3+
and Fe2+
are colored in green, blue and red,
respectively.

Acta Cryst. D (2014). 70, doi:10.1107/S1399004714005239 Supporting information, sup-11
MppJ-SAM (Kd=22.4±1.6 M) MppJ-Ppy (Kd=14.6±0.9 M) MppJ-SAH (Kd=2.5±0.4 M)
Figure S8 Isothermal titration calorimetry (ITC) analysis of MppJ. The ITC thermograms of MppJ
versus SAM, Ppy, or SAH. Each exothermic heat pulse corresponds to an injection of 2 l of ligands
(1 mM) into the protein solution (0.1 mM); integrated heat areas constitute a differential binding
curve that was fitted with a standard single-site binding model (Origin 7.0, MicroCal iTC200).
a b
0.0 0.5 1.0 1.5 2.0 2.5 3.0 3.5 4.0 4.5 5.0 5.5 6.0 6.5 7.0
-4.00
-2.00
0.00
-0.50
-0.40
-0.30
-0.20
-0.10
0.00
0 10 20 30 40 50
Time (min)
µcal/sec
Data: Data1_NDH
Model: OneSites
Chi^2/DoF = 1857
N 0.860 ±0.0605 Sites
K 4.51E4 ±3.31E3 M-1
H -9324 ±768.4 cal/mol
S -9.98 cal/mol/deg
Molar Ratio
KC
al/M
ole
ofIn
jecta
nt
0.0 0.5 1.0 1.5 2.0
-8.00
-6.00
-4.00
-2.00
0.00
-1.60
-1.40
-1.20
-1.00
-0.80
-0.60
-0.40
-0.20
0.00
0.200 10 20 30 40 50
Time (min)
µcal/sec
Data: Data1_NDH
Model: OneSites
Chi^2/DoF = 8908N 0.707 ±0.0108 Sites
K 6.87E4±4.41E3 M-1
H -9169 ±195.8 cal/mol
S -8.62 cal/mol/deg
Molar Ratio
KC
al/M
ole
ofIn
jecta
nt
0.0 0.5 1.0 1.5 2.0 2.5 3.0 3.5
-10.00
-8.00
-6.00
-4.00
-2.00
0.00
-0.80
-0.70
-0.60
-0.50
-0.40
-0.30
-0.20
-0.10
0.00
0.100 10 20 30 40 50
Time (min)
µca
l/se
c
Data: Data1_NDH
Model: OneSites
Chi^2/DoF = 1.049E5N 1.08 ±0.0309 Sites
K 4.13E5 ±7.61E4 M-1
H -1.062E4 ±402.7 cal/mol
S -9.92 cal/mol/deg
Molar Ratio
KC
al/M
ole
of
Inje
cta
nt

Acta Cryst. D (2014). 70, doi:10.1107/S1399004714005239 Supporting information, sup-12
Figure S9 Structure and electron density map of SAH in WT and D244L mutant. (a) The 2Fo-Fc
electron density map of SAH in WT. (b) The 2Fo-Fc electron density map of SAH in D244L mutant,
where the bond between the sulfur atom and 2-aminobutanoic acid is partially discontinued.
WT D244L
Acta Cryst. D (2014). 70, doi:10.1107/S1399004714005239 Supporting information, sup-13
a b
c d
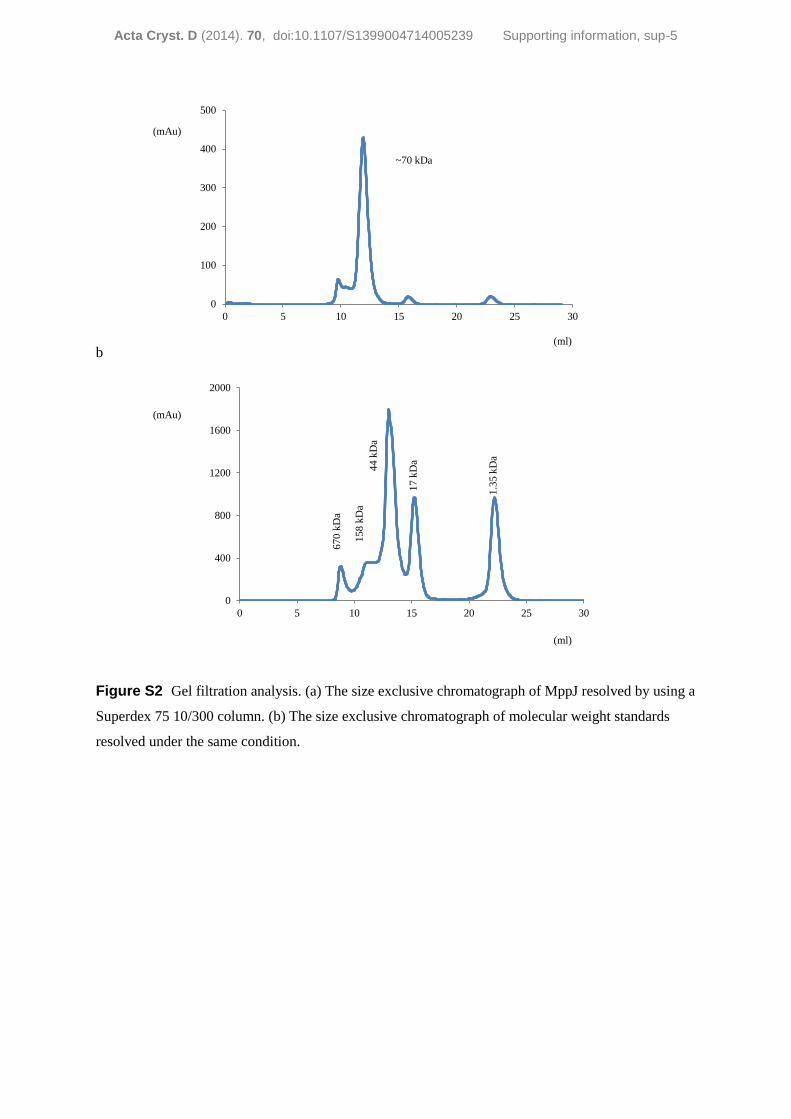
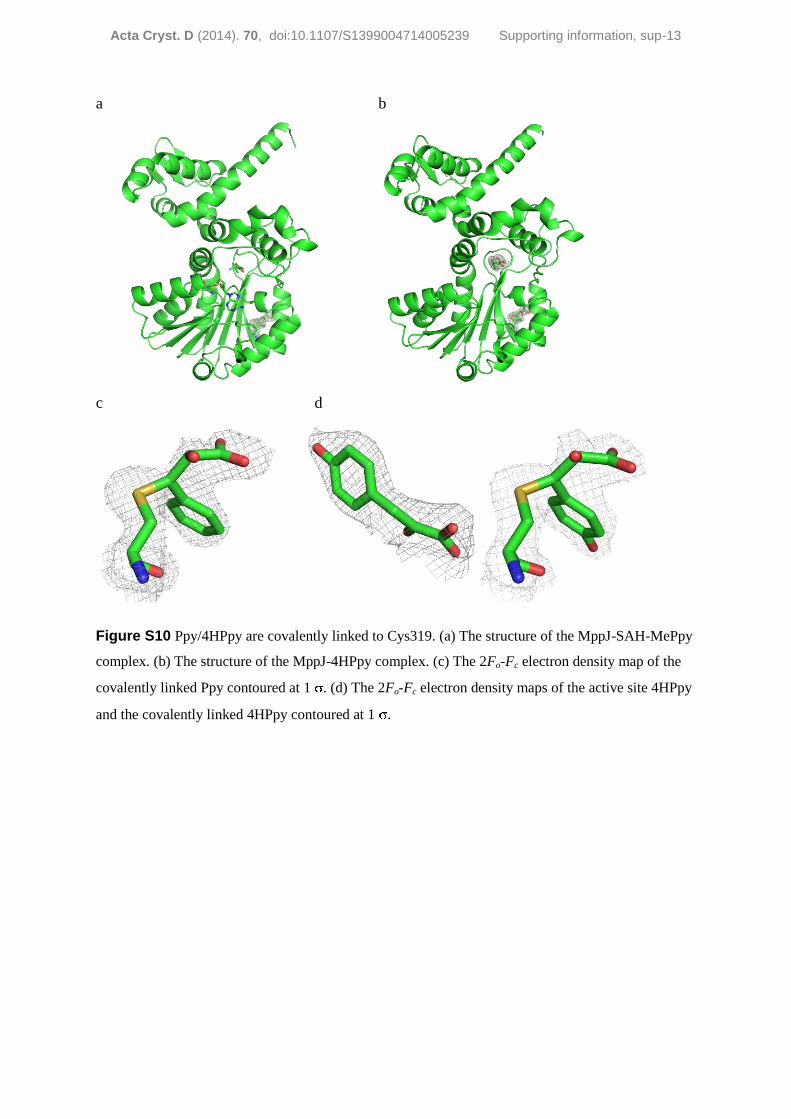
Figure S10 Ppy/4HPpy are covalently linked to Cys319. (a) The structure of the MppJ-SAH-MePpy
complex. (b) The structure of the MppJ-4HPpy complex. (c) The 2Fo-Fc electron density map of the
covalently linked Ppy contoured at 1 . (d) The 2Fo-Fc electron density maps of the active site 4HPpy
and the covalently linked 4HPpy contoured at 1 .

Acta Cryst. D (2014). 70, doi:10.1107/S1399004714005239 Supporting information, sup-14
a.
b.
c.
Figure S11 Mass spectrometric analysis of MppJ and mutant thereof. (a) The mass spectrum of WT
(left panel) and the corresponding de-convoluted mass (right panel) in the absence of Ppy. (b) The
mass spectrum of C319A (left panel) and the corresponding de-convoluted mass (right panel) in the
presence of Ppy. (c) The mass spectrum of WT (left panel) and the corresponding de-convoluted mass

Acta Cryst. D (2014). 70, doi:10.1107/S1399004714005239 Supporting information, sup-15
(right panel) in the presence of Ppy. The protein mass of WT in the presence of Ppy gains additional
mass units ( 168 amu ~ Ppy) relative to that of WT in the absence of Ppy, as opposed to that of
C319A which losses 30 amu (equivalent to a sulfur atom), confirming that Ppy is covalently linked to
the residue C319 of MppJ.
Supporting references
Krissinel, E. & Henrick, K. (2007). J. Mol. Biol. 372, 774-797.
Ravel, B. & Newville, M. (2005). Journal of Synchrotron Radiation 12, 537-541.
Schuck, P. (2000). Biophys. J. 78, 1606-1619.