Embed Size (px)
Citation preview

*050207130* Rev 1
A Comparison of Three Methods for Computing Scale Score Conditional
Standard Errors of Measurement
David Woodruff
Anne Traynor
Zhongmin Cui
Yu Fang
October 2013
ACT Research Report Series2013 (7)

For additional copies: ACT Research Report Series PO Box 168 Iowa City, IA 52243-0168
© 2013 by ACT, Inc. All rights reserved.

A Comparison of Three Methods for Computing Scale Score Conditional Standard Errors of Measurement
David Woodruff Anne Traynor Zhongmin Cui
Yu Fang


ii
Abstract
Professional standards for educational testing recommend that both the overall standard
error of measurement and the conditional standard error of measurement (CSEM) be computed
on the score scale used to report scores to examinees. Several methods have been developed to
compute scale score CSEMs. This paper compares three methods, based on classical test theory,
item response theory, and the four-parameter beta compound binomial model. The three
methods are compared using data from a single form of the ACT® College Readiness
Assessment. The results indicate that all three methods produce comparable results.

iii

A Comparison of Three Methods for Computing Scale Score Conditional Standard Errors of Measurement
Introduction
Interpreting scores from educational tests requires considering the scores’ precision (the
extent to which scores would be replicable on repeated testing of the same examinees with a
parallel instrument on the same measurement occasion). Professional testing standards have
long directed that reported scores (henceforth, “scale scores”) should be accompanied by
estimates of their precision, such as the standard error of measurement, at various points along
the score scale (American Educational Research Association, American Psychological
Association, & National Council on Measurement in Education, 1999). The conditional standard
error of measurement (CSEM) is the standard deviation of an examinee’s observed score that
would be expected over repeated parallel measurements of an examinee with a fixed, unchanging
true score. Although procedures for computing the CSEM on the raw number-correct score scale
have existed since at least the 1940s, the development of appropriate estimators for the CSEM on
reported score scales obtained by nonlinear transformations of raw scores is more recent, and
few studies have compared the performance of these estimators. The purpose of this paper is to
illustrate two procedures for computing scale score CSEM using the delta method (Feldt &
Qualls, 1998; Lord, 1980), and to compare the CSEMs computed by these procedures with
CSEM estimates from a strong true score theory-based method (Kolen, Hanson, & Brennan
1992; Lord, 1965) that is used by the ACT® College Readiness Assessment (ACT, 2007). Real
data from a single form of the ACT test, comprised of multiple-choice tests in English,
Mathematics, Reading, and Science, are used for the illustration and comparison.
Several methods for estimating the exact or approximate number-correct true score
CSEM, based on different models for observed test score data, have been proposed: analysis of

2
variance (Brennan, 1998; Jarjoura, 1986), four-parameter beta compound binomial (Lord, 1965),
item response theory (IRT) (Lord, 1980), binomial error (Lord, 1957), compound binomial error
(Feldt, 1984), and classically-parallel tests (Thorndike, 1951; Woodruff, 1991). All of these
methods can be directly extended to computation of CSEMs for linear transformations of
number-correct raw scores. In practice though, scale scores are often nonlinear transformations
of raw scores. In addition, particularly when scale scores on several forms must be equated, the
final raw-to-scale score conversion for a certain form is often expressed as a table of
corresponding values instead of as a function.
To approximate the squared scale score CSEM when the raw-to-scale score
transformation is a known, possibly nonlinear, continuous function, application of the delta
method for computing the sampling variance of a function of a statistic can be used (Lord, 1980).
The delta method (Kendall & Stuart, 1977) can be simply stated. Let X denote a random variable
with population mean X and population variance 2X , and let Y = g(X) be a function of X. Then
an approximate value for the variance of g(X) may be computed as follows:
2
2 2( )
X
Y X
X
dg X
dX
.
The subscript XX on the derivative of g(X) denotes that the derivative should be evaluated at
the value X . For illustration, consider a sample of N observations on the random variable X and
let Xm and 2Xs denote the sample mean and variance of X. Note that Xm is a random variable
with mean xm x and variance 2 2 /
xm x N . Consider the function of the sample mean,
43 XY m , the derivative of which is 312 Xm . An approximate formula for the variance of this
function is

3
2 3 2 2 6 2(12 ) 144 /X XY m m x x N .
Because Xm is an estimate of its own mean, an estimate for the approximate variance of Y can be
computed by replacing the parameters in the preceding equation by their sample estimates which
yields
2 6 2144 /Y x xs m s N .
In practical measurement situations, especially if integer-valued scale scores are required
for reporting, the transformation of raw to scale scores is seldom a continuous function, but
instead, a score conversion table specifying a many-to-one conversion. Using the delta method
in this situation requires approximating the tabled values by a known function, then
differentiating that function to obtain its slope at particular raw score values. A rough
approximation for the slope at a certain raw score value could be found by substitution of
distinct, adjacent integer scale score values into the definitional equation for finding a slope
between two points (e.g., Kolen & Brennan, 1995). Seeking a more precise and stable solution,
Feldt and Qualls (1998) suggested fitting a high-degree polynomial function to the conversion
table points. Cubic spline functions, also relatively easy to differentiate, have been proposed as
an alternative to fit the conversion table values (Feldt & Qualls, 1998). In this study, polynomial
functions will be used to approximate the raw-to-scale score conversion because they use data
from the entire scale score distribution and are readily computed by many software packages.
They also produce smoother estimated measurement error variance distributions than cubic
spline approximation, desirable because population error variance functions are presumed to be
smooth (Lee, Brennan, & Kolen, 1998).
In principle, any method for estimating the raw score CSEM could be combined with the
delta method to estimate the scale score CSEM. Lord (1980) described how to use the delta
4
method in conjunction with an IRT model to calculate the scale score CSEM when scale scores
are a known continuous function of an observed score. Feldt and Qualls (1998) suggested
application of the delta method employing Feldt’s (1984) raw score CSEM estimate for tests
consisting of distinct content strata. This paper will focus on deriving CSEMs appropriate for
scale scores that are a transformation of number-correct raw scores, as did Feldt and Qualls.
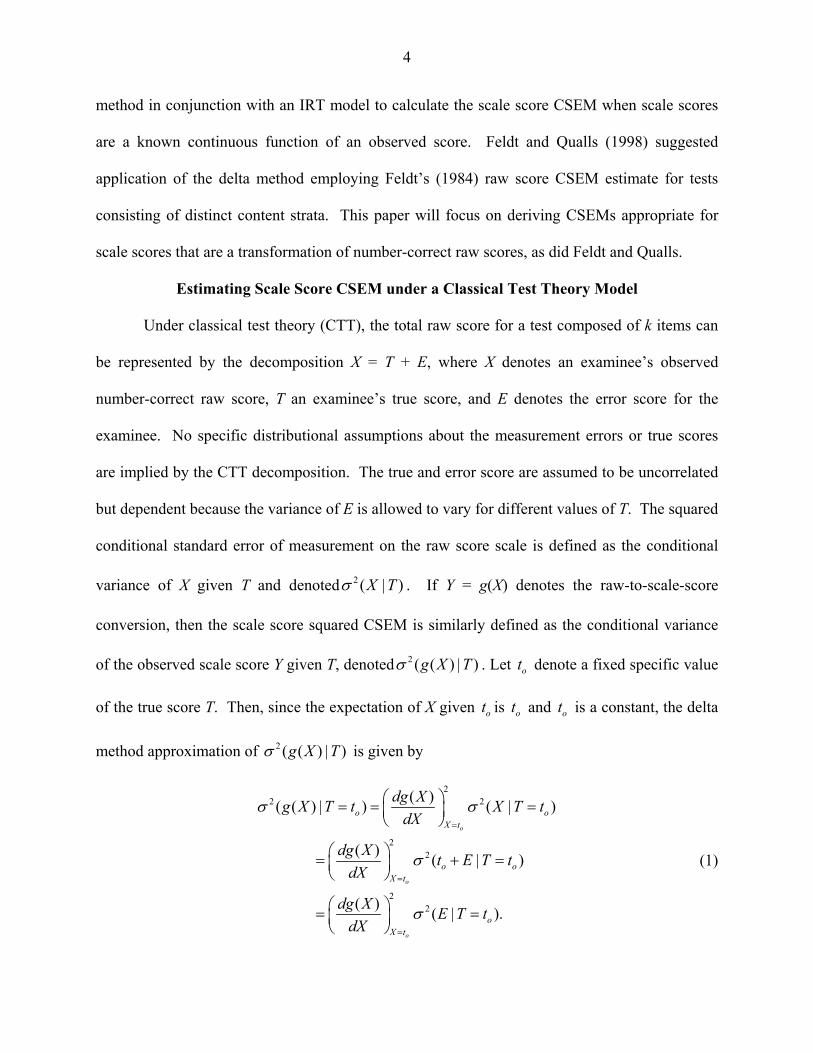
Estimating Scale Score CSEM under a Classical Test Theory Model
Under classical test theory (CTT), the total raw score for a test composed of k items can
be represented by the decomposition X = T + E, where X denotes an examinee’s observed
number-correct raw score, T an examinee’s true score, and E denotes the error score for the
examinee. No specific distributional assumptions about the measurement errors or true scores
are implied by the CTT decomposition. The true and error score are assumed to be uncorrelated
but dependent because the variance of E is allowed to vary for different values of T. The squared
conditional standard error of measurement on the raw score scale is defined as the conditional
variance of X given T and denoted 2 ( | )X T . If Y = g(X) denotes the raw-to-scale-score
conversion, then the scale score squared CSEM is similarly defined as the conditional variance
of the observed scale score Y given T, denoted 2 ( ( ) | )g X T . Let ot denote a fixed specific value
of the true score T. Then, since the expectation of X given ot is ot and ot is a constant, the delta
method approximation of 2 ( ( ) | )g X T is given by
2
2 2
2
2
2
2
( )( ( ) | ) ( | )
( )( | )
( )( | ).
o
o
o
o o
X t
o o
X t
o
X t
dg Xg X T t X T t
dX
dg Xt E T t
dX
dg XE T t
dX
(1)

5
Practical application of the method requires a sample estimate for 2 ( | )oX T t . Feldt,
Steffen, and Gupta (1985) discuss several methods for estimating 2 ( | )oX T t . The simplest
way, based on a CTT model, is Thorndike’s (1951) difference method, which depends on
splitting the test into two classically-parallel half-tests, 1X and 2X , with identical score
distributions. Then, using the difference method, 2 ( | )X T is estimated by
2 20 1 2 0( | ) ( | ).s X T t s X X X t (2)
Note that this equation is an approximation because the left side conditions on T whereas the
right side conditions on X. (See Woodruff (1990) for a discussion of this issue.) Combining
Equations (1) and (2) yields
2
2 21 2
( )( ( ) | ) ( | ).
o
o o
X t
dg Xs g X T t s X X X t
dX
(3)
Equation (3) defines a CTT estimate for the scale score measurement error variance, the squared
CSEM, by letting ot take the value of each of possible number correct raw score 0, 1, 2, … , k
for a test with k items.
Use of the Thorndike difference method to estimate conditional raw score error variance
requires the assumption that the parallel tests, used in the theoretical repeated measurements of
an examinee that defines the CSEM, be divisible into parallel half-tests. No assumptions are
made about the distribution of measurement errors in the examinee population. The delta
method requires the assumptions that the polynomial selected is a suitable approximation to the
raw-to-scale score transformation function and a first-order Taylor series expansion accurately
approximates the polynomial function at all raw score values.

6
Estimating Scale Score CSEM under an Item Response Theory Model
Alternatively, an IRT model can be fit to the item response data and the error variance
conditional on the IRT θ scale score can be estimated from the IRT item parameter estimates.
IRT models assume that conditional on θ, measurement error follows a compound or generalized
binomial distribution (Lord, 1980, p 85). Because it is often the case in practice that the scale
scores reported to examinees are a function of number-correct raw scores even when IRT is used
for some aspects of a testing program such as scaling, linking, or equating, this study considers
the situation in which the reporting scale score is a function of the number-correct raw score
rather than the estimated IRT theta scale score. Following Lord (1980), let 0
1
( ) ( )k
ii
P
denote number-correct true score as a function of θ and let ( )P denote the item characteristic
curve for a particular IRT model applied to a test with k items. Then the conditional expected
value of an observed raw score given a true raw score is an increasing function of θ given by
0 0 0 0
1
( | ) ( | )) ( | ) ( )k
ii
X X X P
E E E , (4)
where 0 and 0 denote specified corresponding values. It also follows from the assumption of
local independence that the conditional variance of observed raw score given true raw score is
2 2 20 0 0 0 0
1
( | ) ( | ( )) ( | ) ( )(1 ( ))k
i ii
X X X P P
. (5)
Equations (4) and (5) are taken from Lord (1980, p 85). They assert that the values of the total
raw score conditional mean and variance do not change when you condition them on a different
true score metric. This is in contrast to the information function which does change. Of course,
if you transform the total raw score then their values do change. For raw score transformation
g(X), inserting equations (4) and (5) into the general equation for the delta method approximation

7
and employing estimated item parameter values yields the following estimate for the scale score
squared CSEM:
0
2
20 0 0 0
1
( ) ˆ ˆ( ( ) | ( )) ( )(1 ( ))k
i iiX
dg Xs g X P P
dX
, (6)
where the derivative is evaluated at the true raw score value 0 = ξ(θ0). Equations (6) is
essentially an application of Lord’s (1980, p 79) equation (5-22). One way to apply the method
in practice is to solve numerically the equation ( ) for all 0 0( , ) pairs where 0 takes on
the integer values 0, 1, 2, …, k. A Newton Raphson method was used to accomplish this in the
IRT examples given later in this paper. Alternatively, one could just compute ( ) for a grid of
closely spaced points and then use Equation 6 to compute the scale score CSEM at all of the
points. An appropriately modified version of this alternative procedure is used in the third
method presented in this paper.
Between the two scale score CSEM estimation methods discussed so far, the IRT variant
of the delta method requires the strongest assumptions. In addition to requiring the assumptions
for a delta method approximation, use of the estimator in Equation 6 requires the common IRT
assumptions of unidimensionality of item response data and conditional independence of item
error scores. In addition, if a three parameter IRT model is used with a guessing parameter,
denoted by C, then
0 0
1 1
) ( )k k
i ii i
P C
(7)
for all values of . Consequently, this method cannot be used to compute the CSEM for true
scores values less than the sum of the Cs, or what could be called the estimated true guessing
score on the test.

8
Estimating Scale Score CSEM under a Beta Compound Binomial Model
The third method considered for estimating scale score CSEM is one presented by Lord
(1965) and further developed by Kolen et al. (1992). It is based on a strong true score theory
model, the four-parameter beta compound binomial model (BCBM). Strong true score theory
models, including both the beta compound binomial model and IRT models, adopt assumptions
regarding the form of the conditional distributional of error and, in some instances, the marginal
distribution of true scores, rendering the CTT decomposition of observed scores empirically
testable. Let τ denote an examinee’s true proportion correct score. A general expression for a
strong true score theory model for some infinite population of examinees can be given as
1
0Pr( ) Pr( ) ( ) ,X i X i h d (8)
where Pr(X = i) is the marginal probability of a raw score i, Pr( | )X i is the conditional
probability of raw score i given true score τ, and h(τ) is the marginal density of true scores.
Equation 8 describes a general class of strong true score theory models that posit particular
distributions for both true and error scores including, but not limited to, the four-parameter
BCBM.
In applying a BCBM to equation (8), Kolen et al. (1992) assume that a total test is
divided into several subtests they call strata. Within each stratum the conditional probability for
that stratum’s raw score is assumed to be binomial given a within stratum proportion correct true
score. Hence, the integral in equation (8) becomes a multiple integral over a product of binomial
distributions groups of which depend on different proportion correct true scores, 1 2, ,..., .k
However, Kolen et al. then fit Lord’s (1965) two-term approximation of the compound binomial
distribution to the conditional probability distribution of the total test raw score so that this
conditional probability distribution depends only on a single proportion correct true score rather

9
than on all the proportion correct true scores for all the strata. They thereby reduce their model
to equation (8) with just a single integral. This single proportion correct true score is assumed to
follow a four-parameter beta distribution, with two parameters specifying the shape of the score
distribution, which is quite flexible, and two limiting parameters between 0 and 1 bounding the
distribution. Because Lord’s approximation to the compound binomial distribution requires an
estimate of the average error variance for the total test score, consistent with the assumptions of a
binomial distribution within each stratum, Feldt’s (1984) stratified binomial error variance
coefficient is used to compute the average total test score error variance. Estimation of the four-
parameter BCBM by the method of moments is discussed in Lord (1965) and Hanson (1991).
Under the Kolen et al. (1992) stratified compound binomial model, measurement error is
held to occur due to sampling of items for a given test form from a stratified domain of items, a
process characterizing test development from a table of specifications, where stratification is
based on item content. Different forms of the test are taken to be randomly parallel across
corresponding strata in repeated sampling; that is, items assembled to create a particular form’s
strata are held to represent a random sample from the domain for each stratum, although no
specific criterion for form equity is invoked. Measurement errors for examinees with a particular
set of stratum true scores are assumed to be independent and follow a binomial distribution
within each stratum, and to be independent across strata. Within each stratum, the assumption of
a binomial distribution given a particular true score value usually requires that all items be
equally difficult for all examinees with the same true score value. However, various assumptions
about the administration of randomly sampled items to randomly sampled examinees are
sometimes used to justify a binomial model even when items have unequal difficulties, but such
assumptions tend to complicate the definition of error variance (Lord & Novick, 1968). This

10
paper is only interested in comparing the CSEM results from the three models and not justifying
any one model.
Given a particular strong true score theory model for observed number-correct scores
conforming to the general expression in Equation 8, and a certain transformation of number-
correct raw scores, g(i), permitted to be nonlinear, Kolen et. al. (1992) define the conditional
measurement error variance for scale scores as
2 2
2
0 0
( ( ) | ) {[ ( ) ( ( | ))] | }
( ) ( ) Pr( | ) Pr( | )|k k
i i
g X g X g X
g i g i X i X i
E E
(9)
where, as before, E denotes the expectation operator and all other notation is as given
previously. For different values of true scores, estimates of conditional probabilities for the four-
parameter BCBM are substituted into Equation 8 to yield the estimated squared scale score
CSEM, 2 ( ( ) | ).s g X Unlike the CTT and IRT variants of the delta method outlined previously,
which approximate the raw score transformation function by a polynomial, this BCBM method
for CSEM estimation uses the exact transformation to compute the scale score CSEM.
Synopsis of Results from Previous Studies
In addition to the scale score CSEM estimation methods outlined above: the two delta
methods (CTT and IRT) with polynomial approximation to the raw-to-scale score conversion
table and the four-parameter beta compound binomial method, at least four other distinct
methods have been proposed. Because calculation of a polynomial regression was believed to be
beyond the capabilities of some test developers, Feldt and Qualls (1998) suggested a method,
typically referenced as the “Feldt-Qualls procedure,” that uses a simpler approximation to the
derivative of the polynomial conversion in the delta method scale score CSEM estimation
equation. Details are provided in Feldt and Qualls (1998). Although the Feldt-Qualls procedure

11
has been rendered to some degree obsolete by the relative ease of computing polynomial
functions in many statistical software packages, it has been tested repeatedly in comparison
studies. Kolen, Zeng, and Hanson (1996) demonstrated that the general formula for the scale
score CSEM under a strong true score theory model (Kolen et al., 1992) is also applicable when
an IRT model, rather than a beta compound binomial model, is assumed for conditional number-
correct score frequencies, provided a particular form for the population theta score distribution is
given. Additionally, methods for raw score CSEM estimation assuming a binomial or compound
binomial model for measurement error have been directly extended to treat scale scores (Brennan
& Lee, 1999).
Demonstrations of the proposed CSEM estimation techniques have warranted several
general conclusions regarding the pattern and magnitude of scale score CSEMs. When scale
score type is varied, e.g., grade-equivalent scores versus percentile ranks, etc., the shape of the
estimated CSEM function also varies with each different transformation of raw scores from a
given test potentially yielding a unique pattern of CSEM estimates (Kolen et al., 1992; Brennan
& Lee, 1999). Although test developers typically select the number of reporting scale score
points to be slightly fewer than the number of raw score points to prevent test users from over-
interpreting minor differences in scores, the choice of a reporting scale affects score reliability.
Measurement error tends to increase as the number of scale score points for a particular test is
reduced; scores converted to a relatively coarse reporting scale tend to have a larger standard
error of measurement than scores reported on a more precise scale (Kolen et al., 1992). For scale
scores obtained by nonlinear transformation, the CSEM estimated by any reasonable method
should be amplified by the slope of the transformation function, showing variability that mirrors
the variability in the slope of the transformation function across the score range. In a simulation

12
study comparing three CSEM estimation methods, Lee, Brennan, and Kolen (1998, p. 19) found
that, for all estimation methods tested, CSEM estimates exhibited only marginal bias around
scale score values corresponding to inflection points in the transformation function, but tended to
be underestimated where the slope of the transformation function was greatest and overestimated
where the slope was least, although the average magnitude of this bias varied considerably
depending on the estimation method used.
Although the literature comparing scale score CSEM estimation methods is fairly limited,
previous studies have clarified the strengths and limitations of some methods, illuminating
measurement conditions under which particular methods might be preferred. In simulation,
CSEMs calculated using the Feldt-Qualls procedure exhibited larger sampling error variance
than those estimated by any of the three direct methods, as well as higher average bias, except
when assumptions of one of the other methods was clearly violated by the simulation conditions
(Lee, Brennan, & Kolen, 1998, 2000). Because CSEM functions produced by the Feldt-Qualls
procedure also tend to be relatively jagged (Brennan & Lee, 1999), use of this procedure is
typically not recommended.
The most detailed comparison of scale score CSEM estimation methods is the Lee,
Brennan, and Kolen (1998) simulation study. The study compared performance of the Feldt-
Qualls, binomial error model, compound binomial error model, and IRT scale score CSEM
estimation methods, computing the standard error of measurement for individual examinees
under two types of conditions: unidimensional and multidimensional, and three different scale
transformations. When examinee true scores were drawn from a two-dimensional distribution,
with various correlations between the two ability dimensions, CSEMs estimated by the
compound binomial error model method, which assumes test items are categorized into distinct

13
content strata, showed less average bias than those estimated by the binomial error model
method, which assumes test items are drawn from a single undifferentiated domain. However,
when item response data was generated to be unidimensional, there was little difference in
CSEMs from the binomial or compound binomial error model methods. One result of this study
was that CSEMs estimated by the IRT direct method exhibited the least bias and lowest sampling
error variance in not only all the unidimensional, but also all the multidimensional, item response
conditions. The IRT method allows items to differ in difficulties and discriminations, but the
binomial and compound binomial methods require either equal item difficulties (binomial
method) or equal within strata item difficulties (compound binomial method) along with
correspondingly equal item variances.
Delta method CSEM approximation using a polynomial to approximate the function g,
two variants of which are used in this study, has been included in only two prior comparison
studies, in both cases incorporating Feldt’s (1984) estimate of raw score error variance for
stratified tests. The polynomial version of the delta method has been shown to produce scale
score CSEMs similar in magnitude to those generated by the Feldt-Qualls procedure (Feldt &
Qualls, 1998) and the binomial error model method (Brennan & Lee, 1999), although slightly
less smooth than those from the latter two methods. Similar findings have been obtained for
comparison of CSEM estimates from the delta method, Feldt-Qualls procedure, and compound
binomial error model method when all three methods relied on compound binomial error
assumptions (Brennan & Lee, 1999). Review of the literature indicates that the four-parameter
BCBM method, the third CSEM estimation procedure to be compared in this study, has not
appeared in any previous published comparison studies of the delta method.

14
The few groupwise comparisons of scale score CSEM estimation or approximation
methods that have been conducted for different tests and score scale types indicate the methods
tend to yield relatively similar CSEM functions, with only the Feldt-Qualls approximation
procedure consistently producing larger, more variable CSEM estimates. Given the similarity of
performance among the scale score CSEM estimation and approximation methods, the preferred
method in a particular measurement situation will depend on available computer resources and
sample size, as well as the assumptions an investigator is willing to make about the process that
generated the observed test score data. Because the computational burden for procedures
estimating the CSEM directly from individual scale scores is relatively high, as are sample size
requirements for the IRT-based direct procedure (Kolen, Zeng, & Hanson, 1996), approximate
methods of scale score CSEM estimation may be necessary, particularly for applications
involving small sample sizes, for example, analysis of field test data in the early phases of
instrument development. Using a polynomial to approximate the raw-to-scale score conversion
table values for the four ACT tests, this study compares scale score CSEMs obtained by the delta
method approximation under the CTT and IRT models to CSEMs estimated under a four
parameter BCBM method using the exact score transformation.
The Current Comparison of Three Methods
Three methods for computing CSEMs, the CTT delta method, the IRT delta method, and
the four-parameter BCBM method are compared using real test data from approximately 445,000
examinees who took the four ACT subject-area tests: English (75 items), mathematics (60
items), reading (40 items), and science (40 items).
The previous scaling (Kolen et al., 1992) of each one of these four multiple choice tests
was conducted separately by sequential application of a series of transformations, including

15
variance stabilization, equipercentile equating, rounding, and truncation. Each scaling produced
a raw score to scale score conversion where the scale scores range from 1 to 36 (ACT, 2007).
This sequence of nonlinear transformations was represented as a single discrete transformation
function in the form of a unique raw-score-to-scale-score conversion table for each test. In
addition, each unique form of each subject area test had its own conversion table. The data in
this study consists of a single distinct form for each one of the four subject-area tests.
Producing delta-method CSEM estimates under any set of assumptions requires first
finding the slope of the transformation function at each raw score scale point. Regressions of the
scale score values from each test’s conversion table on a polynomial function of the
corresponding raw score values, computed using the software JMP, produced continuous
approximations to the transformation function for each of the four tests. Choosing the degree of
the polynomial approximation for each conversion table involves subjective judgment.
However, the magnitude of CSEM estimates across the score range does not depend greatly on
the degree of the polynomial selected (Brennan & Lee, 1999, p. 14). To select a polynomial of
the lowest possible degree that produced a smooth but adequate approximation to the score
conversion table points, plots of the fitted polynomials and residuals, as well as R2 and root mean
square error fit index values, were inspected. Figures A-1 through A-4 in the Appendix plot the
score conversion table values, as well as the polynomial used to approximate the conversion
table, for each test. Sixth-degree polynomials were selected to fit the English, Math, and Science
test conversion table values, but a fourth-degree polynomial was judged to provide a satisfactory
approximation to the tabled conversion values for the Reading test, which showed the least
departure from linearity. Because the conversion tables specified many-to-one transformations
of multiple raw score values to single scale score points, for simplicity, the polynomials used for

16
computation were fit to the means of the set of raw score values corresponding to each scale
score point. The forms of the polynomials fit to the averaged raw score points differed little
from those of the polynomials fit to all raw score points.
After selecting a polynomial to approximate each test’s conversion table, the polynomial
was differentiated, and its slope at each (average) raw score point obtained as the derivative.
Since the same conversion table was used for both the CTT- and IRT-based delta method
procedures, the same slope values appeared in both Equations 3 and 6, for each raw score point.
It should be noted, however, that although the “raw scores” in each conversion table took the
same values for both delta method procedures, in fact, they represented true score estimates
obtained under different assumptions: for CTT, the observed number-correct scores in Equation
3, and for IRT, the model-estimated number-correct scores in Equation 6.
To generate raw score conditional measurement error variance estimates for the ACT
tests under CTT assumptions, Thorndike’s (1951) difference method was applied. For each
subject-area test, item subsets for the difference method were obtained by an odd-even split of
the items, and number-correct scores from each generated half-test were taken as estimates of the
population quantities X1 and X2 in Equation 2. (The 75 item English test had a 38-37 odd-even
item split.) Near-equivalence of the mean and variance for each half-test pair over the sample
was verified, such that the assumption of classically-parallel half-tests in the population seemed
reasonable. Obtaining the raw score error variance estimates by Equation 2, squared slope
values from the polynomial approximation were then used to scale the raw score error variance,
as shown in Equation 3, and the square root of the resulting quantity was taken as a CTT-based
estimate of the scale score CSEM.

17
Implementing Lord’s (1980) IRT method, item parameters were estimated under a three-
parameter logistic IRT model from the item response data using BILOG-MG 3 (Zimowski,
Muraki,, Mislevy, & Bock, 2002). A Newton-Raphson method was used to locate pairs of
corresponding estimated number-correct and theta scores, 0 0ˆ ˆ( , ), for which the estimated
number-correct score took on integer values. Substituting 0̂ values corresponding to the
average raw score values in the conversion tables into the first term of Equation 5, and matching
0̂ values as well as item parameter estimates into the second term, provided estimates of the raw
score conditional error variance. IRT-based scale score CSEM estimates were computed using
Equation 6 as the square root of the resultant scale score error variance.
The four-parameter BCBM method was estimated using data from each subject-area test
following the procedure detailed by Hanson (1991). The model requires a fixed value for raw
score reliability, so stratified alpha coefficients estimated from each test’s sample data, given
stratum indicators drawn from the tests’ tables of specifications, were used as reliability values.
Estimates for conditional probabilities and true scores from the four-parameter beta compound
binomial model were substituted into Equation 8, with the subject-area-specific score conversion
table used for the other two methods again treated as the transformation. For each raw score
point,0
ˆ , the square root of the equation’s solution provided a BCBM-based scale score CSEM
estimate, a third estimated CSEM to be compared to the two delta-method-based estimates
obtained previously. Since CSEMs are typically represented as smooth functions (e.g., Kolen,
Zeng, & Hanson, 1996, p. 137), cubic spline functions were fit to the discrete CSEM estimates
generated at specific estimated true scale score values by the three methods. To allow
comparison among methods, a .10 smoothing parameter value, selected by generalized cross-

18
validation to fit the BCBM English CSEM estimates, which appeared to be among the most
regular sets of estimates, was used to smooth all plots.
Results
Graphs of the scale score CSEMs computed by the three methods for each ACT subject-
area test are displayed in Figures A-5 through A-8 in the Appendix . Prior to spline smoothing,
the discrete CSEM values for all procedures appeared to follow relatively smooth curves,
although the patterns for the CTT-based delta method CSEM estimates were somewhat less
smooth than those for the other two methods. CSEM estimates for scale scores at the low end of
the scale score scale are not included in the figures because their estimates were very unstable
due to the small number of examinees with such scores. The CSEM estimates for the ACT
English test are very similar for all three methods except for a bump around 18 for the BCBM.
The estimates tend to vary closely around 1.5 in the middle of the scale score scale, but decrease
more sharply to 1 or below at the bottom and top of the scale score scale. The CSEM estimates
for the ACT Mathematics test are also very similar for all three methods, although the BCBM
method’s curve is bumpier. Similar to English, but with more variability, the Mathematics
CSEM estimates also tend to vary closely around 1.5 in the middle of the score scale, but then
diverge away from 1.5 at the lower and upper extremes of the scale score scale.
The three different methods’ Reading CSEM estimates are all very similar across the
entire score scale, although, again, the BCBM method’s curve is bumpier. In the bottom and
middle of the score scale the estimates are very close to but a little above 2.0, whereas at the top
of the score scale they decrease dramatically. The CSEM estimates from the three methods are
also very similar for Science although they do differ somewhat in the middle of the score scale
where they reach a local minimum. At the low end of the score scale the Science CSEM

19
estimates are about 2.25. They decrease in the middle of the score scale then increase to a local
maximum before dramatically decreasing at the top of the score scale.
Discussion
Comparison of the results from the three CSEM estimation techniques indicates that the
delta method approximation may be a useful procedure for obtaining scale score CSEM
estimates under a variety of test score models. For the ACT test data used in this study, the
approximate CSEM values produced by the two delta method procedures varied little from the
estimates obtained from the four-parameter BCBM method which used the exact score
transformation function. This result seems likely to hold for commonly-used score scale types
because previous work suggests the relative magnitude of CSEM estimates from a particular set
of estimation procedures tends to be fairly similar for typical score transformations (e.g.,
percentile ranks, grade-equivalent scores) (Brennan & Lee, 1999; Lee, Brennan, & Kolen, 1998),
but may not generalize to all conceivable score scale types. However, the result that the three
methods produced highly similar CSEM estimates can be loosely extended to data from other
test instruments or examinee populations because it is consistent with the conclusions of other
studies contrasting other sets of CSEM estimation methods (Brennan & Lee, 1999; Feldt &
Qualls, 1998). The CSEMs obtained from the compared methods were highly similar,
considering only empirical criteria, it would be difficult to justify recommending any one
particular estimation method over another.
The CTT-based delta method allows CSEM estimation even when conditional raw score
frequencies are very low, which may be perceived as advantageous for obtaining CSEMs of
scores in the tails of a scale score distribution. However, previous authors (e.g., Feldt, Steffen, &
Gupta, 1985), demonstrate that raw score error variance estimates obtained from Thorndike’s

20
(1951) difference method can be unstable for small sample sizes, and they recommend
smoothing the raw score CSEM estimates. This could be done before applying the delta method
to obtain the scale score CSEM estimates.
Previous studies producing CSEMs by the delta method with a polynomial approximation
(albeit using different raw score error variance estimators than either of those used in the present
study) reported that these methods produced relatively jagged CSEMs (Brennan & Lee, 1999;
Feldt & Qualls, 1998). Feldt and Qualls asserted that the jagged pattern reflected real
irregularities in the scale score transformation function, but Brennan and Lee argued that
irregularities in the estimated CSEMs were perhaps due to the over fit of the approximating
polynomials, because population transformation functions should be smooth. The results of this
study demonstrate that a jagged pattern is not always a feature of CSEM estimates produced by
the delta method with a polynomial conversion approximation at least when sample sizes are
large. Although the CSEM estimates from the CTT-based delta method were slightly more
jagged than the estimates from the IRT-based delta method, the approximating polynomial was
the same for both methods, thus the jaggedness of the CTT-based delta method CSEM estimates
can be attributable to irregularities in the set of difference-method raw score error variance
estimates. If the assumptions of all three estimation procedures were equally plausible, then
adopting Brennan and Lee’s position (see also Lee, Brennan, & Kolen, 1998), the IRT-based
delta method or BCBM method might be favored over the CTT-based delta method although
smoothing of the raw score error variances could be used to remove any jaggedness.
Although the estimation methods compared in this study yielded similar CSEM estimates
for scale scores from the four ACT tests, as emphasized in other authors’ conclusions (e.g., Lee,
Brennan, & Kolen, 2000), choice of a scale score CSEM estimation method should depend on its

21
assumptions and the types of measurement error expected to predominate in a particular
measurement situation. Given test design information, and response data from an examinee
population of interest, particular assumptions underlying each of the three methods might be
judged unreasonable based on theory or statistical test results.
The CTT-based delta method appears to have the least stringent assumptions:
uncorrelated true and error scores and the division of the test into parallel half-tests, but this
simplicity is offset by the conditioning on observed raw score instead of true raw score, as made
clear in Equation 2, and this conditioning leads to a negative correlation between the error scores
on the two half-tests (Woodruff, 1990). However, as the results in this paper demonstrate, the
method produces results similar to the other two methods used in this paper, and intuition
suggests that the negative correlation between the two half-test error scores may be less of a
problem as test length increases especially in the middle of the raw score scale.
The IRT-based delta method requires the usual unidimensional IRT model assumptions
and the delta method assumptions, as well as an adequate sample size to estimate IRT item
parameters. Unidimensional IRT models allow for only one “true” score in contrast to the
BCBM that allows for several, albeit, a priori true scores. However, if content category scores
for a certain test are highly correlated in the population, so that the item domains behave as
undifferentiated, the CTT-based delta method could be an appropriate, simple mechanism to
produce CSEM estimates. If, furthermore, the item response data is unidimensional, in a factorial
sense, then the IRT-based delta method procedure could be used. See Lee, Brennan, and Kolen
(1998, pp. 25-30) for a discussion that emphasizes the relationships between the assumptions of
the various estimation procedures and the meanings of their estimated CSEMs. Another

22
consideration for picking one method over another is theoretical and computational complexity
as regards explaining the method to test score users.
The four parameter BCBM assumes that items are randomly sampled from a population
of items that are divided into different strata, and each stratum has its own true score. The
crucial assumption is that given a particular stratum true score value, the observed raw score for
that stratum has a binomial distribution. This is true when, conditional on true score, the
observed stratum score is a sum of the independent Bernoulli distributed item score random
variables all of which have equal probabilities of success. Various assumptions about the
random sampling of items and examinees can be used to justify a binomial model even when
items are not all equally difficult for an examinee with a given true score. The model also may
be robust to violations of equal conditional item difficulties because the other models do not
make this assumption and all three models yield very similar results. That the three methods
produce similar results even though they are based on different assumptions and approximations
suggests that although their underlying assumptions may not be completely realistic in practice,
their application to real data can produce consistent and useful results.

23
References
ACT, Inc. (2007). The ACT technical manual. Iowa City, IA: Author. Retrieved from
http://www.act.org/research/researchers/techmanuals.html American Educational Research Association, American Psychological Association, & National
Council on Measurement in Education. (1999). Standards for educational and psychological testing. Washington, DC: Author.
Brennan, R. L. (1998). Raw-score conditional standard errors of measurement in generalizability
theory. Applied Psychological Measurement, 22(4), 307-331. Brennan, R. L., & Lee, W.-C. (1999). Conditional scale-score standard errors of measurement
under binomial and compound binomial assumptions. Educational and Psychological Measurement, 59(1), 5-24.
Feldt, L. S. (1984). Some relationships between the binomial error model and classical test
theory. Educational and Psychological Measurement, 44(4), 883-891. Feldt, L. S., & Qualls, A. L. (1998). Approximating scale score standard error of measurement
from the raw score standard error. Applied Measurement in Education, 11(2), 159-177. Feldt, L. S., Steffen, M., & Gupta, N. C. (1985). A comparison of five methods of estimating the
conditional standard error of measurement at specific score levels. Journal of Educational Measurement, 9(4), 351-361.
Hanson, B. A. (1991). Method of moments estimates for the four-parameter beta compound
binomial model and the calculation of classification consistency indexes (ACT Research Report No. 91-5). Iowa City, IA: American College Testing Program.
Jarjoura, D. (1986). An estimator of examinee-level measurement error variance that considers
test form difficulty adjustments. Applied Psychological Measurement, 10(2), 175-186. Kendall, M. G., & Stuart, A. (1977). The advanced theory of statistics (4th ed., Vol. 1). New
York: Macmillan. Kolen, M. J., & Brennan, R. L. (1995). Test equating, scaling and linking: Methods and
practices. New York: Springer. Kolen, M. J., Hanson, B. A., & Brennan, R. L. (1992). Conditional standard errors of
measurement for scale scores. Journal of Educational Measurement, 29(4), 285-307. Kolen, M. J., Zeng, L., & Hanson, B. A. (1996). Conditional standard errors of measurement for
scale scores using IRT. Journal of Educational Measurement, 33(2), 129-140.

24
Lee, W., Brennan, R. L., & Kolen, M. J. (1998). A comparison of some procedures for estimating conditional scale-score standard errors of measurement. (Iowa Testing Programs Occasional Paper No. 43). Iowa City, IA: University of Iowa.
Lee, W., Brennan, R. L., & Kolen, M. J. (2000). Estimators of conditional scale-score
standard errors of measurement: A simulation study. Journal of Educational Measurement, 37(1), 1-20.
Lord, F. M. (1980). Applications of item response theory to practical testing problems. Hillsdale,
NJ: Erlbaum. Lord, F. M. (1984). Standard errors of measurement at different ability levels. Journal of
Educational Measurement, 21(3), 239-243.
Lord, F. M. & Novick, M. R. (1968). Statistical theory of mental tests. Reading, MA: Addison Wesley.
Lord, F. M. (1957). Do tests of the same length have the same standard errors of measurement?
Educational and Psychological Measurement, 17(4), 510-521. Lord, F. M. (1965). A strong true score theory, with applications. Psychometrika, 30(3), 239-
270. Thorndike, R. L. (1951). Reliability. In E. F. Lindquist (Ed.), Educational measurement (1st ed.,
pp. 560-620). Washington, DC: American Council on Education. Woodruff, D. (1990). Conditional standard error of measurement in prediction. Journal of
Educational Measurement, 27(3), 191-208. Woodruff, D. (1991). Stepping up test score conditional variances. Journal of
Educational Measurement, 28(3), 191-196.
Zimowski,M. F., Muraki, E., Mislevy, R. J., & Bock, R. D. (2002). BILOG-MG3 [Computer software]. St. Paul, MN: Assessment Systems Corporation.

25
Appendix
Figures A-1 -- A-8

26

27
Figure A-1. Sixth-degree polynomial function fit of raw to scale score conversion table values
for the selected form of the ACT English Test

28
Figure A-2. Sixth-degree polynomial function fit of raw to scale score conversion table values
for the selected form of the ACT Mathematics Test

29
Figure A-3. Fourth-degree polynomial function fit of raw to scale score conversion table values
for the selected form of the ACT Reading Test

30
Figure A-4. Sixth-degree polynomial function fit of raw to scale score conversion table values
for the selected form of the ACT Science Test

31
Figure A-5. Estimated conditional standard error of measurement for observed scale score given
true scale score for the ACT English Test form

32
Figure A-6. Estimated conditional standard error of measurement for observed scale score given
true scale score for the ACT Mathematics Test form

33
Figure A-7. Estimated conditional standard error of measurement for observed scale score given
true scale score for the ACT Reading Test form

34
Figure A-8. Estimated conditional standard error of measurement for observed scale score given
true scale score for the ACT Science Test form


*050207130* Rev 1
A Comparison of Three Methods for Computing Scale Score Conditional
Standard Errors of Measurement
David Woodruff
Anne Traynor
Zhongmin Cui
Yu Fang
October 2013
ACT Research Report Series2013 (7)