Embed Size (px)
Citation preview

ACT RESEARCH REPORT
DECLINING ADM ISSIONSTEST SCORES
No. 71
71February 1976
L. A. Munday
THE AMERICAN COLLEGE TESTING PROGRAM
P. 0. BOX 168, IOWA CITY, IOWA 52240


Declining Admissions Test Scores
ABSTRACT
Questions surrounding declining admissions test scores are being asked by teachers, school administrators, and state agencies. The general public as well as the measurement profession is involved in consideration of the issues. To better inform these discussions we explore in this report the dimensions of the decline in ACT scores. Some generalizations are possible about the nature, of the decline. Over the last 10 years the decline in test score averages has been experienced by both ACT and SAT, and the extent of the decline—about 2% to 3% of a standard deviation per year— has been similar for both programs. There is variation by subject matter field; the decline in ACT scores has been most marked in social studies, there has been no decline in natural sciences, and there has been some decline in English and mathematics. The decline in test score averages has been accompanied by an increased variability in the academic achievement of students tested. Declining admissions test scores are a national phenomenon, occurring in all regions and in nearly all states. The percentage of ACT-tested high scoring students has remained about the same over the last five years, while the percentage of low scoring students has increased. There are marked sex differences. Overall the scores of men have not declined appreciably over the last five years, but the scores of women have declined considerably. This trend has been accompanied by an increase in the percentage of women among ACT-tested students.
Two possible explanations for declining admissions test scores were examined. The first concerned who takes the test and the second, how well-prepared they are. To deal with these questions it was necessary to use data from state testing programs and the National Assessment since ACT data describe college-bound students and not high school students generally. Our results for one and two states showed that in recent years, different people have probably been taking the test, and that starting in the late 1960’s and continuing to the present, high school students have likely been less well-prepared than previously. In different years one factor likely has more influence than the other, and in other years they combine in their influence. If the limited data studied here have applicability to the national scene, we would conclude that in recent years the ACT score decline has been largely due to the changed pool of test-takers. For their part colleges and universities would seem to have adapted to the declining admissions scores of their incoming students.

Prepared by the Research and Development DivisionThe American College Testing Program
ACT, a nonprofit organization, is an Equal Opportunity Employer.
© 1976 by The American College Testing Program
All rights reserved. Printed in the United States of America.
For additional copies write:ACT PublicationsThe American College Testing Program P.O. Box 168, Iowa City, Iowa 52240
(Check or money order must accompany request.) Price: $1.00O rder No. 4-7-71

Declining Admissions Test Scores
Leo A. Munday1
Few educational issues in recent years have gripped the imagination of the popular press like the finding that admissions test scores have declined. It is true that little factual information is available to the public or anyone else about the operation of schools and colleges, and even less is available about changing educational results or outcomes of our educational institutions. In this situation the phenomenon of declining admissions test scores was viewed by many as a sign that something was or might be wrong with our educational system.
But it is premature to consider how we should view the declining scores. First we should marshall the most pertinent facts we have about the phenomenon, analyze the information and look for patterns, and finally develop interpretations that are most consistent with the facts. To accomplish these tasks is the purpose of this report. We begin by exploring the nature of the problem.
Dimensions of the Admissions Test Score Decline
Most of the discussions of declining test scores have focused on experience with admissions tests. The two major national testing programs for college admissions, ACT and SAT, have both reported year- by-year declining test score averages. Table 1 taken from a nationally syndicated newspaper column by Suzanne De Lesseps, reports the averages for ACT and SAT over a 10-year period. We have verified the accuracy of the ACT data from ACT records, and we assume that the SAT data are reported with comparable accuracy.
How much decline has occurred on a national basis? For the last 10 years (1964-65 through 1973-74) for which data were available, ACT Composite average scores declined 1.2 standard scores, or about one-fifth of a standard deviation of the overall distribution of scores. On a per-year basis this would mean the average ACT decline is about 2% of a standard deviation. For the same 10 years SAT Verbal average scores declined 33 standard scores, or about 33% of a standard deviation. SAT Math average scores declined only 18 standard scores in this same period of time, however, or about 18% of a standard deviation. Combining the Verbal and Math scores, this would mean the average SAT decline is about 25% of a standard deviation over 10 years, or about 2% or 3% of a standard deviation on a per- year basis. We conclude the size of the decline, has
Table 1
DECLINING NATIONAL ADMISSIONS TEST SCORES*
SAT ACTScore Averages Score Averages
Year Verbal Math. Composite
1962-63 478 502 NA1963-64 475 498 NA1964-65 473 496 19.91965-66 471 496 20.01966-67 467 495 19.41967-68 466 494 19.01968-69 462 491 19.41969-70 460 488 19.51970-71 454 487 18.91971-72 450 482 18.81972-73 443 481 18.91973-74 440 478 18.71974-75 434 472 NA
SAT--Scholastic Aptitude Test. Scale rangesfrom 200 Ito 800.
ACT-—American College Testing Program.Scale ranges from 1 to 36.
r
NA—Not Available. In the early years it was felt the number of student records on which the ACT figures were based were changing too rapidly for reliable year to year comparisons.
* Reprinted by permission of Editorial Research Reports, Washington, D.C.
been comparable for the two programs, ACT and SAT. Further, the magnitude of the decline in any given year, at least for the years reported, is small and would likely warrant little concern if it were not for the year to year downward trend. As with inflation figures people wonder, when will it stop and what is behind the overall trend?
'The author is indebted to Leonard S. Feldt, University of Iowa, and Dallis Perry, University of Minnesota, for their comments on an earlier draft of this manuscript, to Jean Tucker of ACT for her editorial suggestions, and to James Maxey, Lee Wimpey, Charles Yang and Gary Hanson of ACT for their help in the retrieval and analysis of ACT data.
1

While we cannot answer these questions at this point in our analysis, it is possible to deal with two matters that relate to the meaning of the above observations. First, is the decline a real one? The decline is real or significant, in that it is based for both testing programs on too many student records for it to be due to random yearly fluctuations.
Second, are the tests getting harder? There have been no changes over the last 15 years in methods used for scaling and equating of the ACT tests. Scaling and equating are two technical procedures used to insure that the difficulty of one test form is equal to that of others. The methods used by ACT are explicit and straightforward, and are unlikely to bias test scores one direction or the other. There is every reason to assume that the SAT experience is similar. Each year three new forms of the ACT tests are developed and equated to a form used the previous year. This form is called the anchor form, and because a new anchor form is used yearly it is possible some downward drift may have occurred. It is unlikely, however, that this would have occurred year after year.
Has the content of the ACT tests changed? Is it possible that the items and hence the tests may have changed in subtle ways over the last 10 years in the content they measure? If something like this has occurred, the test scores today could less faithfully reflect school achievement and consequently would show lower correlations with college grades than was the case in the past. The content outlines of the four ACT tests are reported in Charts 1-4, but the question of predictive validity remains. To consider this possibility Table 2 was constructed from ACT Standard Research Service files, showing the validities of the ACT tests in predicting college grades for 3 time periods falling within the last 10 years. The data show that, by and large, the ACT tests scores are as highly correlated in recent years as in the past with college grade point average. Later in this paper we shall have something more to say about changing correlations between ACT scores and other variables, but at this point the evidence would seem to support the contention that the tests have not changed in what they measure.
CHART 1
Content of the ACT English Usage Test*
Grammar and punctuation. This includes punctuation and graphic conventions, usage in agreement,
verb forms, adjectives and adverbs, pronouns and their antecedents, and nouns.
Sentence structure. This includes relation between clauses, parallelism, placement of modifiers, and predication and shifted constructions.
Diction. Under this rubric are items concerned with word choice and idioms, figurative language, and economical writing.
Logic and organization. Included here are logical organization of ideas, the elimination of inappropriate ideas and statements, proper wording of transitions, paragraphing, and appropriate conclusions.
English Usage Proportion No. ofContent Area of Test Items
Grammar and Punctuation .35 26Sentence Structure .25 19Diction .35 26Logic and Organization .05 4
Total 1.00 75
*Taken from Technical Report for the ACT Assessment Program, Iowa City, Iowa: American College Testing Program, 1973.
CHART 2
Content of the ACT Mathematics Usage Test*
Arithmetic and algebraic reasoning. These problems are word problems about practical situations in which algebraic and/or arithmetical reasoning is required. The problems require the student to interpret the question and find an approach to its solution. Some of the problems may require only advanced arithmetic for solution while others call for algebraic approaches.
Arithmetic and algebraic operations. In these problems, operations to be performed are explicitly described in the problem and the student must complete the designated operation. These problems include manipulation of fractions and decimals, operations with signed numbers, addition, subtraction, multiplication, and division of polynomials, solution of linear equations in one unknown, and manipulation of algebraic fractions.
Advanced algebra. These problems include depen-
2

dence and variation of quantities related by given formulas, arithmetic and geometric series, solution of simultaneous equations, graphs of equations, inequalities, logarithmic principles, exponents, radicals, roots of equations, factoring and dividing polynomials, solution of quadratic equations.
Geometry. Topics include mensuration of lines and plane surface, properties of polygons, angular relationships involving parallel lines and polygons, relationships involving circles and properties of circles, loci, solid geometry, trigonometric principles, and the Pythagorean theorem. Both formal and applied problems are included nnder this category with most being formal.
Miscellaneous. This category includes problems in
set theory, probability, logic, properties of numbers (prime, rational), and bases of number systems.
Proportion No. of Mathematics Content Area of Test Items
Arithmetic and Algebraic Reasoning .35 14Arithmetic and Algebraic Operations .15 6Advanced Algebra .20 8Geometry .20 8Miscellaneous .10 4
Total 1.00 40
*Same as Chart 1.
CHART 3
Content of the ACT Social Studies Reading Test*
Social Studies AreaInference Items Information Items Total
{Proportion of Test)
{No. of Items) {Proportion ol Test)
{No. of Items) (Proportion of Test)
(No. of Items)
European and Ancient History
Government and American History
Current Social Issues, Sociology, Economics, etc.
Total
.14
.28
.28
.70
7
15
15
37
.06
,12
.12
.30
6
15
.20
.40
.40
1.00
10
21
21
52
*Same as Chart 1.
CHART 4
Content of the ACT Natural Sciences Reading Test*
Inference Items Information Items TotalScience Area (Proportion
of Test){No. of Items) (Proportion
of Test){No. of Items) (Proportion
of Test)(No. of Items)
Biology .36 19 .12 6 .48 25Chemistry .17 9 .06 3 .23 12Physics, Geology,
Astronomy, and General Science .17 9 .12 6 .29 15
Total ~J0 ~37 ~30 15 1.00 52
*Same as Chart 1.
3

TRENDS IN THE VALIDITY OF THE ACT ASSESSMENT IN PREDICTING OVERALL
COLLEGE GRADE POINT AVERAGE
Multiple Correlation Mean ACT CoefficientsComposite 25th 50th 75th
Period* Score Pctle Pctle Pclle
TABLE 2
1964-67 Period 1 20.3 .54 .60 .66
1967-70 Period 2 20.0 .50 .58 .64
1971-74 Period 3 20.1 .50 .58 .64
•Period 1 represents data from 440 colleges that participated in the 1964-65, 1965-66, or 1966-67 Standard Research Service.
Period 2 represents data from 425 colleges that participated in the 1967-68, 1968-69, or 1969-70 Standard Research Service.
Period 3 represents data from 395 colleges that participated in the 1971-72, 1972-73, or 1973-74 Standard Research Service.
Source: ACT Standard Research Services files.
Is the decline in scores a common phenomenon affecting all subject matter areas, or is it more marked in some subjects? Data from the ACT tests are designed to assess academic achievement in the subject matter fields of English, mathematics, social studies, and natural sciences. Table 3 reveals there has been no decline in natural sciences, some decline in English and mathematics, and a substantial decline in social studies. This is in contrast to the experience of the National Assessment of Educational Progress, where a decline in Science scores was obtained for 9, 13, and 17 year olds from 1969-70 to1973-74 (NAEP Newsletter, October, 1975). The different results can likely be explained by differences between the tests. The Science test of the National Assessment emphasizes working with apparatus and pieces of equipment, while the natural sciences test of the ACT covers reading comprehension of scientific and technical material.
Data are reported in Table 3 not only by ACT test but by sex. The latter data suggest the decline in test scores has been more marked for women than for men. Since 1965-66 the ACT Composite has dropped about one standard score for men and 1.6 standard scores for women. In every area except mathematics scores for women have declined more than scores for men, with the greatest difference being social studies where men declined 1.9 standard scores since 1965-66 while women declined 3.5 standard scores. This suggests that sex differences should be carefully examined; we will do so later in this paper.
Given the general decline in test scores, what has
happened to the spread or variability of student achievement, overall and by subject matter area? Data in Table 3 speak to this issue also. The standard deviation for the ACT Composite has increased from 5.2 to 5.8 over the 10 year span, indicating that the variability of overall student achievement has increased. Students have become more heterogeneous in their talents. While the variability has increased in all subject matter areas, it is most marked in social studies and least marked in English and natural sciences.
Could the decline in test scores be associated with the fact that more juniors are writing the ACT tests? ACT records show that the number of juniors tested has increased from 14 to 26 percent over the last 5 years.2 The juniors, however, make higher test scores. Last year the average ACT Composite score for juniors was 22.6 while for seniors it was 19.5. We conclude'that the decline in scores is likely not associated with juniors taking the tests.
Is the decline in admissions test scores taking place in all states and all geographic regions or is it localized in certain regions? The ACT Assessment Program is used primarily in the Western, Southern, and North Central States, and data summarizing experience in these states and regions are reported in Table 4. All regions show a decline in ACT Composite score averages, though the decline is less marked in the Western states than in the Southern and North Central states. Except for two states in the North Central region, all states show a decline. One of the two showed an increase and the other showed no change. In view of the SAT experience reported in Table 1, it appears that declining test scores have occurred as well in the East, a region in which use of SAT is widespread. Overall, we conclude the declining admissions test scores are a national phenomenon, not restricted to certain states or regions.
Has there been a decrease in the number of high scoring students, accompanying the decline in test score averages? Apparently this has been the SAT experience (Scully, 1975). Data on the ACT tests are reported in Table 5, where each of the five ACT scales is divided into four score intervals and results reported for the last five years. Data are reported separately for men, women, and total. For the total group the percentage of high scoring students, those in the 26-36 standard score interval, has remained virtually unchanged on the ACT Composite at 14% over the last five years. On the other hand, the percentage of low scoring students on the ACT Com-
2ACT adjusts scores of students tested as juniors to approximate what they would have been had they been tested as seniors. However, because the adjustment may operate imperfectly, it is appropriate to look at juniors in conjunction with declining scores.
4

Table 3
ACT TEST SCORE AVERAGES (MEANS) AND VARIABILITY (SD’S)______________ FOR SUCCESSIVE YEARS OF TESTED COLLEGE-BOUND STUDENTS_______________School ACT English ACT Math ACT Soc. Std. ACT N. Sci. ACT Comp.Year Mean (SD) Mean (SD) Mean (SD) Mean (SD) Mean (SD)
TOTAL (Men and Women Combined)
1964-65 18.7 (5.1) 19.6 (6.6) 20.6 (6.4) 20.4 (6.1) 19.9 (5.2)1965-66 19.1 (5.1) 19.5 (6.7) 20.5 • (6.4) 20.5 (6.1) 20.0 (5.2)1966-67 18.5 (5-3) 18.7 (7.0) 19.6 (6.6) 20.1 (6.3) 19.4 (5.4)1967-68 18.1 (5.3) 18.3 (7.3) 19.4 (6.7) 19.8 (6.5) 19.0 (5.5)1968-69 18.4 (5.2) 19.2 (6.9) 19.4 (6.7) 20.0 (6.4) 19.4 (5.3)1969-70 18.1 (5.3) 19.5 (6.7) 19.3 (6.8) 20.5 (6.1) 19.5 (5.3)1970-71 17.7 (5.6) 18.7 (7.2) 18.3 (7.2) 20.2 (6.4) 18.9 (5.6)1971-72 17.6 (5.6) 18.6 (7.3) 18.4 (7.3) 20.3 (6.5) 18.8 (5.7)1972-73 17.8 (5.4) 18.8 (7.2) 18.1 (7.5) 20.5 (6.5) 18.9 (5.8)1973-74 17.6 (5.4) 18.1 (7.5) 17.9 (7.6) 20.6 (6.5) 18.7 (5.8)
MEN
1964-65 17.7 (5.1) 20.9 (6.5) 20.6 (6.4) 21.0 (6.2) 20.2 (5.3)1965-66 18.1 (5.2) 20.7 (6.6) 20.7 (6.5) 21.3 (6.1) 20.3 (5.3)1966-67 17.5 (5.3) 19.7 (6.9) 19.7 (6.7) 20.9 (6.5) 19.6 (5.5)1967-68 17.0 (5.3) 19.3 (7.3) 19.6 (6-7) 20.6 (6.7) 19.2 (5.6)1968-69 17.4 (5.3) 19.9 (7-0) 19.9 (6-7) 20.9 (6.5) 19.7 (5.5)1969-70 17.2 (5.4) 20.4 (6.8) 19.9 (6.8) 21.1 (6.3) 19.8 (5.4)1970-71 16.7 (5.7) 19.7 (7.3) 18.5 (7.3) 20.9 (6.5) 19.1 (5.8)1971-72 16.6 (5.7) 19.6 (7.3) 18.8 (7.3) 21.2 (6.7) 19.2 (5.8)1972-73 17.0 (5.5) 19.9 (7.3) 18.7 (7.5) 21.5 (6.7) 19.4 (5.9)1973-74 16.8 (5.4) 19.4 (7.5) 18.7 (7.7) 21.9 (6.6) 19.3 (5.9)
WOMEN
1964-65 19.9 (4.8) 18.0 (6.4) 20.6 (6.3) 19.7 (5.9) 19.7 (5.1)1965-66 20.3 (4.8) 18.1 (6.6) 20.3 (6.4) 19.6 (5.9) 19.7 (5-1)1966-67 19.7 (4.9) 17.5 (6.8) 19.5 (6.5) 19.1 (6.0) 19.1 (5.2)1967-68 19.5 (5.0) 17.2 (7.1) 19.1 (6.6) 18.8 (6.1) 18.8 (5.3)1968-69 19.5 (4.9) 18.3 (6.7) 18.9 (6.6) 19.0 (6.1) 19.0 (5.2)1969-70 19.2 (5.1) 18.5 (6.5) 18.6 (6.7) 19.7 (5-8) 19.1 (5.1)1970-71 18.8 (5.4) 17.7 ■ (6.9) 18.1 (7.1) 19.5 (6.1) 18.7 (5.5)1971-72 18.5 (5.4) 17.6 (7.1) 18.0 (7.3) 19.4 (6.3) 18.5 (5.6)1972-73 18.6 (5.3) 17.8 (7.0) 17.5 (7.5) 19.7 (6.2) 18.5 (5.6)1973-74 18.4 (5.3) 16.9 (7.3) 17.1 (7.5) 19.4 (6.1) 18.1 (5.6)
TEST YEAR. 1964-65
1965-661966-671967-681968-691969-701970-711971-721972-731973-74
PERCENTWOMEN
4546 4646474849505152
5

Table 4
AVERAGE (MEAN) ACT COMPOSITE SCORES BY REGION 1970-71 through 1974-75
1970-71 1971-72 1972-73 1973-74 1974-7
Western States
State 1 19.3 19.3 19.5 19.1 18.82 19.7 19.9 19.9 19.7 19.33 19.7 19.9 19.9 19.6 19.34 20.7 21.1 21.0 20.6 20.15 19.2 19.3 19.4 19.1 18.96 18.5 18.4 18.3 17.9 17.47 20.5 20.6 20.6 20.7 19.88 19.4 19.7 19.4 19.2 18.7
Median 19.6 19.8 19.7 19.4 19.1
Southern States
State 1 18.3 18.0 18.0 17.8 17.22 18.4 18.6 18.6 18.6 18.33 18.6 18.4 18.5 18.3 17.94 18.1 18.0 17.8 17.6 17.15 16.3 16.3 16.4 16.4 15.86 18.4 18.3 18.3 18.1 17.57 17.9 17.9 17.9 17.7 17.38 18.8 18.7 18.8 18.5 18.2
Median 18.4 18.2 18.2 18.0 17.4
North Central States
State 1 20.0 19.8 19.9 19.3 18.92 21.8 22.0 22.0 21.5 21.13 20.2 20.0 19.9 19.7 19.04 19.1 19.4 20.0 19.6 19.25 21.2 21.4 21.4 21.3 20.76 20.2 20.1 20.2 20.0 19.47 20.5 20.6 20.5 20.7 20.58 20.2 20.0 20.0 19.7 19.29 20.6 20.6 20.6 20.5 20.0
10 19.7 19.6 19.4 19.3 18.7
Median 20.2 20.1 20.1 19.9 19.3
NOTE: N-counts for the various states are not reported in order to assure the anonymity of the states. A state was included only if the number of students tested was sizable and had remained fairly stable over the 5-year period. For state figures by sex, See Appendix A.
6
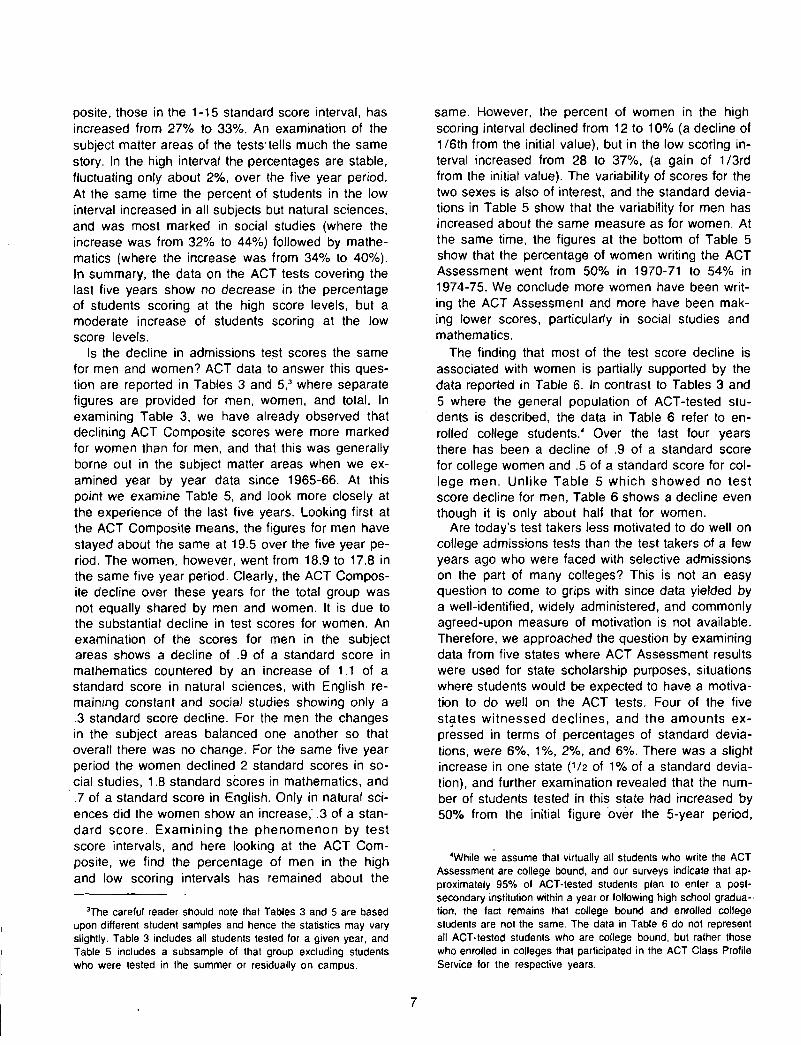
posite, those in the 1-15 standard score interval, has increased from 27% to 33%. An examination of the subject matter areas of the tests'tells much the same story. In the high interval the percentages are stable, fluctuating only about 2%, over the five year period. At the same time the percent of students in the low interval increased in all subjects but natural sciences, and was most marked in social studies (where the increase was from 32% to 44%) followed by mathematics (where the increase was from 34% to 40%). In summary, the data on the ACT tests covering the last five years show no decrease in the percentage of students scoring at the high score levels, but a moderate increase of students scoring at the low score levels.
Is the decline in admissions test scores the same for men and women? ACT data to answer this question are reported in Tables 3 and 5,3 where separate figures are provided for men, women, and total. In examining Table 3, we have already observed that declining ACT Composite scores were more marked for women than for men, and that this was generally borne out in the subject matter areas when we examined year by year data since 1965-66. At this point we examine Table 5, and look more closely at the experience of the last five years. Looking first at the ACT Composite means, the figures for men have stayed about the same at 19.5 over the five year period. The women, however, went from 18.9 to 17.8 in the same five year period. Clearly, the ACT Composite decline over these years for the total group was not equally shared by men and women. It is due to the substantial decline in test scores for women. An examination of the scores for men in the subject areas shows a decline of .9 of a standard score in mathematics countered by an increase of 1.1 of a standard score in natural sciences, with English remaining constant and social studies showing only a .3 standard score decline. For the men the changes in the subject areas balanced one another so that overall there was no change. For the same five year period the women declined 2 standard scores in social studies, 1.8 standard scores in mathematics, and .7 of a standard score in English. Only in natural sciences did the women show an increase,' .3 of a standard score. Examining the phenomenon by test score intervals, and here looking at the ACT Composite, we find the percentage of men in the high and low scoring intervals has remained about the
3The careful reader should note that Tables 3 and 5 are based upon different student samples and hence the statistics may vary slightly. Table 3 includes all students tested for a given year, and Table 5 includes a subsample of that group excluding students who were tested in the summer or residually on campus.
same. However, the percent of women in the high scoring interval declined from 12 to 10% (a decline of 1 /6th from the initial value), but in the low scoring interval increased from 28 to 37%, (a gain of 1 /3rd from the initial value). The variability of scores for the two sexes is also of interest, and the standard deviations in Table 5 show that the variability for men has increased about the same measure as for women. At the same time, the figures at the bottom of Table 5 show that the percentage of women writing the ACT Assessment went from 50% in 1970-71 to 54% in 1974-75. We conclude more women have been writing the ACT Assessment and more have been making lower scores, particularly in social studies and mathematics.
The finding that most of the test score decline is associated with women is partially supported by the data reported in Table 6. In contrast to Tables 3 and5 where the general population of ACT-tested students is described, the data in Table 6 refer to enrolled college students/ Over the last four years there has been a decline of .9 of a standard score for college women and .5 of a standard score for college men. Unlike Table 5 which showed no test score decline for men, Table 6 shows a decline even though it is only about half that for women.
Are today’s test takers less motivated to do well on college admissions tests than the test takers of a few years ago who were faced with selective admissions on the part of many colleges? This is not an easy question to come to grips with since data yielded by a well-identified, widely administered, and commonly agreed-upon measure of motivation is not available. Therefore, we approached the question by examining data from five states where ACT Assessment results were used for state scholarship purposes, situations where students would be expected to have a motivation to do well on the ACT tests. Four of the five states witnessed declines, and the amounts expressed in terms of percentages of standard deviations, were 6%, 1 %, 2%, and 6%. There was a slight increase in one state (1 /2 of 1% of a standard deviation), and further examination revealed that the number of students tested in this state had increased by 50% from the initial figure over the 5-year period,
*While we assume that virtually all students who write the ACT Assessment are college bound, and our surveys indicate that approximately 95% of ACT-tested students plan to enter a postsecondary institution within a year or following high school graduation, the fact remains that college bound and enrolled college students are not the same. The data in Table 6 do not represent all ACT-tested students who are college bound, but rather those who enrolled in colleges that participated in the ACT Class Profile Service for the respective years.
7

Table 5
DISTRIBUTION OF ACT ASSESSMENT SCORES FOR A NATIONAL SAMPLE OF STUDENTS TESTED FROM 1970-71 TO 1974-75 (IN PERCENTAGES)
1970-71 1971-72 1972-73 1973-74 - 1974-75
TEST SCORE INTERVAL M w T M w T M w T M W T M W T
English 26-36 4 7 6 4 7 6 4 7 6 4 7 5 4 6 521-25 25 36 31 24 33 29 26 34 30 24 32 28 24 31 2816-20 37 35 36 38 37 38 37 35 36 37 36 37 37 35 36
1-15 35 22 28 34 22 28 33 23 28 35 25 30 35 27 31
Mean 17.1 19.0 18.0 17.0 18.7 17.9 17.3 18.9 18.1 17.1 18.6 17.9 17.1 18.3 17.7S.D. 5.5 5.3 5.5 5.5 5.3 5.5 5.3 5.1 5.3 5.2 5.1 5.2 5.2 5.2 5.3
Mathematics j 26-36 28 18 23 28 18 23 28 18 23 27 15 21 27 15 2121-25 19 17 18 18 15 16 19 17 18 20 16 18 19 15 1716-20 24 26 25 28 31 29 27 30 29 27 29 28 22 23 22
1-15 28 39 34 26 37 32 25 35 30 27 40 34 32 47 40
Mean 20.2 18.0 19.1 20.1 17.7 18.8 20.2 18.0 19.1 19.7 17.1 18.3 19.3 16.2 17.6S.D. 7.1 6.9 7.1 7.2 6.9 7.2 7.2 7.0 7.2 7.4 7.2 7.4 7.9 7.6 7.9
Social 26-36 19 16 17 21 16 18 22 16 19 22 15 18 21 12 16Studies 21-25 30 30 30 29 29 30 28 27 28 30 27 29 28 24 26
16-20 21 22 21 17 18 17 14 16 15 14 15 14 13 14 131-15 31 33 32 33 37 35 35 41 39 34 43 39 37 50 44
Mean 19.0 18.4 18.7 19.1 18.2 18.6 19.0 17.7 18.3 19.1 17.3 18,1 18.7 16.4 17.4S.D. 7.1 7.0 7.0 7.2 7.1 7,2 7.5 7.4 7.4 7.6 7.5 7.6 7.5 7.3 7.5
Natural 26-36 32 22 27 33 21 27 34 23 28 35 18 26 36 21 28Science 21-25 19 19 19 22 22 22 19 19 19 24 23 24 24 23 23
16-20 29 33 31 26 31 28 26 32 30 24 31 28 23 29 261-15 21 27 24 19 27 23 20 26 23 18 28 23 17 27 22
Mean 21.3 19.7 20.5 21.6 19.6 20.6 21.7 19.9 20.8 22.2 19.6 20.8 22.4 20.0 21.1S.D. 6.4 6.0 6.3 6.5 6.1 6.4 6.5 6.0 6.3 6.5 5.9 6.4 6.4 6.0 6.3
Composite 26-36 16 12 14 17 12 14 18 13 15 18 11 14 17 10 1421-25 29 28 28 29 26 28 29 26 27 29 25 27 28 23 2616-20 29 33 31 28 32 30 27 30 29 27 31 29 27 29 281-15 26 28 27 26 30 28 26 30 28 26 33 30 27 37 33
Mean 19.5 18.9 19.2 19.6 18.7 19.1 19.7 18.8 19.2 19.7 18.2 18.9 19.5 17.8 18.6S.D. 5.6 5.4 5.5 5.7 5.4 5.6 5.8 5.5 5.7 5.8 5.5 5.7 5.9 5.6 5.8
TOTAL SAMPLE 20082 20059 40141 16501 17364 33865 35350 38394 73744 35068 38927 73995 32932 38511 71443
Note: Taken from “Trends on Selected Items of the ACT Assessment: 1970-71 to 1974-75: by E. James Maxey, Lee M. Wimpey, Richard L. Ferguson, and Gary R. Hanson. Unpublished manuscript. ACT Research and Development Division, 1974. This table was reproduced by permission. The samples on which this table was constructed were developed as follows: For the first two years, the sample is a five percent sample of all students tested on the first four national test dates for the respective years. For the remaining three years, it is a ten percent sample, again of all students tested on the first four national test dates. In insuring the samples, student records were placed in student name order within high schools, which were in number order within states, and the states were in alphabetical order. Then every twentieth or every tenth name was drawn. -
due to additional colleges and universities participating in the ACT Assessment Programs. The state scholarship agencies in these five states used the ACT Assessment results exclusively for their purposes, and did not allow test results from other agencies to be used. We conclude that since states that use the ACT Assessment for state scholarship purposes are witnessing declining ACT scores, dampened student motivation in recent years to do well on the tests is likely not a significant factor overall in declining admissions test scores.
The dimensions of the admissions test score de
cline may be summarized as follows:1. Over the last 10 years the decline in test score
averages has been experienced by both ACT and SAT. The extent of the decline has been similar for both programs, and in any given year is small. The downward year to year trend in admissions test score averages is fully documented.
2. There is variation by subject matter field. The decline in ACT scores has been most marked in social studies: there has been no decline over the last 10 years in natural sciences. English and mathematics have shown some decline.
3. The declining test score averages have been ac-
8

companied by an increased variability in the academic achievement of students tested. College- bound students are becoming more heterogeneous in the achievement they bring to their college coursework.
4. Declining admissions test scores are a national phenomenon, occurring in all regions and in nearly all states.
5. The percentage of ACT-tested high scoring students has remained about the same over the last five years, while the percentage of low scoring students has increased.
6. There are marked sex differences. Over the last 10 years there has been about a 1.0 drop by men and a 1.6 decline by women in the ACT Composite standard score. For men, almost all of this decline occurred between 1964 and 1970, with little change since 1970. For women, the decline has continued more or less steadily from 1964 to date. At the same time there has been an almost steady increase in the percentage of women among ACT-tested students over the last 10 years.
TABLE 6
AVERAGE (MEANS) AND VARIABILITY (STANDARD DEVIATIONS) OF ACT TEST SCORES FOR STUDENTS ENROLLING IN ACT PARTICIPATING COLLEGES IN 1970-71, 1972-73, 1973-74, AND
1974-75’
Year NMen
EnglishWomen Total Men
MathematicsWomen Total Men
Social Studies Women Total
Natural Sciences Men Women Total Men
CompositeWomen Total
1970-71 50,122 17.8 19.7 18.7 21.1 19.1 20.2 20.5 19.3 19.9 21.7 20.2 21.0 20.4 19.7 20.1(5.2) (4.9) (5.1) (6.6) (6.4) (6.6) (6.5) (6.5) (6.6) (6.2) (5.8) (6.1) (5.3) (5.0) (5.2)
1972-73 49,297 17.1 19.2 18.1 20.2 18.3 19.3 19.5 18.8 19.2 21.7 20.0 20.9 19.8 19.2 19.5(5.6) (5.2) (5.5) (7.2) (7.0) (7.2) (7.1) (7.1) (7.1) (6.6) (6.3) (6.5) (5.7) (5.5) (5.6)
1973-74 44,942 17.4 19.0 18.2 20.4 18,4 19,4 19.4 ■18.3 18.8 21.9 20.1 21.0 19.9 19.1 19.5(5.4) (5.2) (5.3) (7.2) (7.0) (7.1) (7.3) (7.3) (7.3) (6.5) (6.2) (6.4) (5.7) (5.5) (5.6)
1974-75 45,272 17.3 19.0 18.2 20.2 17.8 18.9 19.5 17.9 18.7 22.3 20.0 21.1 19.9 18.8 19.4(5.4) • (5.2) (5.4) (7.4) (7.3) (7.5) (7.5) (7.5) (7.5) (6.6) (6.2) (6.5) (5.8) (5.7) (5.8)
’ Main entries are means. Entries in parentheses are standard deviations. Taken from Trends in the Academic Performance of High School and College Students, by Richard L. Ferguson and E. James Maxey, ACT Research Report No. 70, 1975, in press.
Nole: Data in this table are based on a 10 percent sample of students enrolled in colleges which participated in the ACT Class Profile Service for the respective year. Student records were pul in alphabetic or optionally Social Security number order within institutions, and institutions were placed in code number order. Then every tenth student record was selected for this analysis.
There are a number of unanswered questions that intrigue us and may motivate people to do further research. Why has there been no decline in natural sciences but substantial decline in social studies scores? Many high schools have strengthened the courses they offer in both the natural sciences and social studies, but at the same time have offered more specialized courses as electives with the consequence that the bulk of students may no longer be taking the broad survey courses in the fields. The interesting question is whether this applies more to social studies than to natural sciences. Why is the shape of the score distributions, as they have changed over time, apparently different for ACT and SAT? Given that the two programs serve different portions of the national pool of college-bound students, it is nonetheless puzzling that ACT would find no change in the percent of high scoring students and increases in the percent of low scoring students,
while SAT would apparently find a decrease in the percent of high scoring students and no change in the percent of low scoring students. What is behind the marked sex differences over time in scores of college-bound students? This question concerns the changing ratio of the sexes in the college-bound population, why this is occurring, and how this is related to lower scores for women.
Examination of Two Explanations for Declining Admissions Test Scores
Two general theories have been offered to explain the decline in admissions test scores. The first has to do with who takes the test and the second with how well-prepared the test-takers are. Somewhat overstated for purposes of contrast, they are as follows:1. We have a “changed pool” of students in college
today. Many more students from the lower half of
9

u
their high school classes are attending college, and these new students have weaker academic preparation than traditional college students. The pool of college-bound students has changed as colleges, particularly the 2-year college, have recently renewed efforts to serve all students interested in education after high school.
2. High school students are academically weaker today than they were five or ten years ago. For various reasons including greater use of electives, lowering of teacher demands and expectations, and schooling directed relatively more by students than by teachers, today's population of students leave high school and enter college or work with less academic preparation than previous years’ students.
It is our purpose here to examine these two explanations. We will draw on information available about ACT-tested students, including data previously reported in this paper and other available relevant information. We first consider data that might be expected to confirm or discredit the “ changed pool” theory.
Who Takes the Test?
Information reported in the previous section of this paper addresses the "changed pool” thesis. The greater variability of college-bound students suggests such a change. Likewise the finding that the percentage of low scoring students had increased while the percentage of high scoring students remained about the same, further points to a "changed pool" of college-bound students.
Table 5 gives some indication of the nature of the new students in the "changed pool.” They may be women. Much of the decline in test scores may be due to a larger percentage of low ability women planning to attend college. One possible explanation is that in the past, men from a broad spectrum of ability levels attended college, but in many cases only the brightest women attended.5 Society seemed to be saying that it was appropriate to educate men, but only the brightest or most exceptional women could profit from college. As social attitudes toward women changed, and as women’s attitudes toward them-1 selves changed, perhaps a wider cross section of women began to consider college and subsequent careers.
Where are the students in this “changed pool” at
sThe author is indebted to Gary R. Hanson, ACT Research andDevelopment Division, for this interpretation, which appears plausible, for the decline in test scores for women.
tending college? Average ACT Composite Scores are reported for enrolled students by college level and sex in Table 7. The decline in test scores is observed for students enrolled in Level I colleges, primarily the open door community colleges. Here, too, there has been a big increase in the percentage of women in the student body. At the other college levels there has been an increase in average ACT Composite Scores, but the amount of the increase has been less for women than for men.6 The data in this table seem to confirm that declining scores are occurring more with women than with men, and if women have changed their pattern of college preference over the last few years, it is to attend the 2-year college in considerably greater numbers than before.
If we are witnessing a changed student pool interested in college, what information do we have about the backgrounds of these students, other than that many are women? The information is inconclusive. There has been little change over the last five years in the family incomes of ACT-tested students, as Table 8 documents. This table is particularly difficult to interpret because the severe inflation of the last five years has essentially changed the income intervals. The 14% in 1974-75 with family incomes below $7,500 are at a lower poverty level than the 18% in 1970-71 with family incomes below $7,500. At the same time the income levels are so gross that extrapolation or estimation is difficult. But in a time of severe inflation no change in family incomes for incoming students means more students from low-in- come backgrounds. When many people think of new students they think of minorities. What information do we have about these students? Table 9 indicates that the percentage of minority students has remained approximately the same over the last five years. Though many of these students come from
6This does not completely agree with a finding recently reported by Rever and Kojaku (1975), or with Table 2 in this report. Rever and Kojaku used ACT data and compared enrolled means by college level for the years 1965-72, and found a decline for all 4 levels of colleges but a much bigger decline for Level I (2-year) colleges. Rever and Kojaku did not weigh their means by college N-counts as we did in Table 7 and 2, and Tables 7 and 2 differ in that Table 7 is based on all colleges for the respective year for which data were available whereas Table 2 was based on the same colleges over the time span of interest. All 3 tables show decline among enrolled students at the 2-year colleges, and Rever and Kojaku and Table 2 show some decline among enrolled students at all college levels. Similarly both Tables 7 and 2, the two that made a sex breakdown, show declining scores to be more marked with women. Because ACT data could apply to different kinds of colleges in different years, our view is that using the same colleges or units of study over time, as we do in Table 2, has merit for many analytic purposes.
10

Table 7
AVERAGE (MEAN) ACT COMPOSITE SCORES FOR ENROLLED COLLEGE FRESHMEN BY COLLEGE LEVEL—1965-66 AND 1970-71 ACADEMIC YEARS
Level IMean ACT Composite
Men Women Total N-Colleges N-StudentsPercentWomen
1965-661970-71
18.318.0
18.017.5
18.217.8
118496
55,12218,500*
3946
Level II
1965-661970-71
19.520.4
19.119.5
19.319.9
108323
30,2268,041
4548
Level III
1965-661970-71
19.720.5
19.420.1
19.620.2
70176
51,71212,858
4851
Level IV
1965-661970-71
22.623.1
21.521.6
22.122.4
3897
80,82614,615
4645
All Levels4
1965-661970-71
20.320.3
19.819.7
20.120.0
3981,169
238,14555,702
4446
*The sample of students shown is a 10% sample drawn from ACT Class Profile files.
**lncludes institutions and students other than those in Levels I through IV, particularly nursing schools and voc-tech institutions.
Note—The data for this table were drawn from College Student Profiles (American College Testing Program, 1966) and Assessing Students on the Way to College, College Student Profiles (American College Testing Program, 1972). In each case the figures are based on institutions that participated in the Class Profile Service, and, consequently, possess the regional bias in favor of the South, West, and Midwest commonly associated with data from the ACT Assessment. Please note also that the figures for the three years for a given level do not include the same colleges, i.e., the number of colleges varies by year.
backgrounds that include inadequate schooling, there has been no change over the last few years in the percentage of these students in the ACT-tested population. Similarly, Table 10 shows little change in the
degree aspirations of college-bound students, and Table 11 reveals little change in the percentage of men and women who have participated in honors courses over the last five years.

TABLE 8
DISTRIBUTION OF SELF-REPORTED FAMILY INCOME REPORTED BY A NATIONAL SAMPLE OF STUDENTS TESTED FROM 1970-71 to 1974-75 (IN PERCENTAGES)
FAMILY INCOME LEVEL 1970-71 1971-72 1972-73 1973-74 1974-75
Less than $3,000 3 3 4 4 3$ 3,000 - $ 7,499 16 14 13 13 11$ 7,500 - $14,999 32 31 33 35 34$15,000 - $19,999 9 7 8 9 14$20,000 and Over 7 8 9 11 17I consider this infor 5 5 5 27 20
mation confidentialDo Not Know* 28 31 29 — —
100 99 101 99 99
Subtotal 39,474 33,411 72,821 70,425 66,161No Response 667 454 923 2,260 2,852
TOTAL 40,141 33,865 73,744 72,685 69,013
*This response option was dropped starting with the 1973-74 testing year, which may account for the increasedpercentages in the “ I consider this information confidential ” response and in the number not responding.
Table 9
DISTRIBUTION OF RACIAL-ETHNIC BACKGROUND FOR A NATIONAL SAMPLE OF STUDENTS TESTED FROM 1970-71 to 1974-75 (IN PERCENTAGES)
BACKGROUND 1970-71 1971-72 1972-73 1973-74 1974-75
Afro-American 6 7 7 7 7American Indian/Eskimo 1 1 1 3 1Caucasian American 79 81 79 73 77Mexican/Spanish Speaking American 2 2 2 2 2Oriental American 2 1 1 1 . 1Other or I prefer not to respond 10 8 10 14 11
TOTAL SAMPLE 38,405 32,812 71,315 69,454 65,960
*Note: Same as Table 5.
12

Table 10
DISTRIBUTION OF EDUCATIONAL DEGREE ASPIRATIONS FOR A NATIONAL SAMPLE OF STUDENTS TESTED FROM 1970-71 to 1974-75 (IN PERCENTAGES)
YEAR
1970-71 1971-72 1972-73 1973-74 1974-75
EDUCATIONAL DEGREE M W T M W T M W T M W T M W T
Vocational or Technical 3 5 4 3 6 4 3 5 4 3 5 4 3 5 4Program
(Less Than 2 years)
Two-year College Degree 12 19 15 12 21 16 12 20 16 12 21 17 9 18 14
Bachelor's Degree 41 43 42 39 41 40 40 41 41 39 39 39 42 44 43
One or Two Years of 20 18 19 19 18 19 17 16 16 17 15 16 17 14 16Graduate Study
Professional Level 18 8 13 21 8 14 22 10 16 23 13 18 24 14 19Degree
Other 6 7 7 6 7 7 5 6 5 6 7 6 5 5 5
TOTAL SAMPLE
*Note: Same as Table 5.
19910 19884 39794 16369 17224 33593 35100 38135 73235 34838 38634 73472 31512 37008 68520
Table 11
DISTRIBUTION OF PARTICIPATION IN HIGH SCHOOL HONORS COURSES FOR A NATIONAL SAMPLE OF STUDENTS TESTED FROM 1970-71 to 1974-75 (IN PERCENTAGES)
1970-71 1971-72 1972-73 1973-74 1974-75
PARTICIPATION M W T M W T M W T M W T M W T
YES 34 39 36 35 38 36 35 37 36 44 43 43 39 38 39
NO 66 62 64 66 63 64 65 63 64 56 57 57 61 62 62
TOTAL SAMPLE 19,766 19.844 39.610 15,627 16,693 32,320 33,422 36,837 70,259 35,068 38,927 73,995 32,932 38,511 71,443
•Note: Same as Table 5.
In summary, there are several facts that support the thesis that there has been at least a slight shift in the pool of ACT-tested college-bound students. Perhaps the most persuasive ones are these. There has been an increase over the last few years in the percentage of low scoring students who are college bound. They have enrolled in the colleges that have the greatest commitment to open admissions—the 2-year college. The new low scoring students are women, who perhaps are more aware of the need for self development and a career than was the case a few years ago, and at any rate are going to college in increasing numbers.
Are Students as Well-Prepared Today?
We turn now to the thesis that the decline in test scores is due to a decline in the academic preparation of students leaving high school. It is not possible to deal effectively with this issue using only ACT data. It has been noted that almost all students write the ACT Assessment because they are college bound. For this reason the population of ACT-tested students closely approximates the population of college-bound students, at least in the states well served by ACT. Because those students who are not college bound are excluded, ACT data does not de-
13

scribe high school graduates generally. The test scores for all high school graduates could be drastically fluctuating up or down independent of shifts in the pool of college-bound students.
High school students. In order to investigate changes in test scores for high school graduates generally, data from two state testing programs were investigated. In both of these programs almost all students at the given grade level were tested, and consequently for these states the data are descriptive of the high school population.
Minnesota has a statewide testing program that over a period of years has tested virtually all high school juniors. Called the Minnesota Scholastic Aptitude Test or MSAT, the test is a 50-minute version of the Ohio State Psychological Examination and has been used in Minnesota since 1959. The test yields a single score and primarily measures verbal ability. The experience in Minnesota for a 14-year period is shown in Table 12. The Minnesota data show an increase in the means from 1959-60 through 1965-66, peaking in that year. Since that time there has been a general decline in the means. The amount of decline has been 3.66 scores over a 7-year period, from 1965-66 through 1972-73. This averages about 4% of a standard deviation per year.
Table 12
MSAT Means, Medians, and Standard Deviations for Minnesota High School Juniors:
1960-1973*
Junior YearMSATForm N Median Mean SD
1959-60**
A 47,890 NA 30.71 13.91
1961-62**
A 45,353 NA 32.38 14.69
1963-64 A 62,434 32.0 34.41 14.731964-65 A 61,094 31.8 34.58 14.701965-66 A 62,648 32.4 34.71 14.411966-67 c 62,783 31.1 32.88 13.611967-68 c 67,018 31.1 32.87 13.461968-69 c 66,727 31.4 32.96 13.341969-70 c 65,830 30.8 32.47 13.191970-71 c 66,314 30.3 31.97 12.861971-72 c 64,805 30.0 31.53 12.651972-73 c 64,628 29.4 31.05 12.39
‘ This tabJe was taken from the paper “Decline in Minnesota College Aptitude Test Scores" by Dali is K.. Perry and Edward O. Swanson, 1974 (unpublished manuscript) and is reproduced here by permission ol the senior author.
** Information not available for 1960-61 and 1962*63.
Perry and Swanson (1974) interpret the increase in MSAT scores from 1959-60 through 1965-66 as the
result of increased emphasis by our society on a high school education. It was the post-Sputnik era, students were going to college in great number, and colleges were becoming more selective so that students had to compete for admission. The quality of a high school education was very important. On the other hand, the subsequent decline in test scores is not easily interpreted. Perry and Swanson feel that the decline may be greater than that shown in Table 12, because while the percentage of juniors tested was never below 90, in the recent years there were more not tested and typically these were low scoring students. In another article, Swanson (1973) found, unlike the experience to date with the ACT Assessment, that there was a decline in the proportion of high scoring students tested from 1967 to 1972. These two facts suggest something about the size of the decline (it may be larger than appears) and where it is occurring (among high scoring students), but add little to our understanding of why the decline is occurring. Perry and Swanson offer three possible reasons. First, testing is de-emphasized today. Extending this thought would imply that students are not motivated to do well on the tests, even though they may “know as much” as students in previous years. The second possible reason is that they do not "know as much." The high. school curriculum may be producing students less able than those of a few years ago. The third possible reason is that the MSAT instrument is too global and factorially pure (in a psychometric sense) to be sensitive to subject matter and curricular content. The MSAT scores may not adequately reflect schooling, in contrast to an achievement test that is subject matter bound.
To consider this likelihood we turned to a state that has a statewide program involving an achievement test. Through Iowa Testing Programs, the Iowa Tests of Educational Development or ITED have been administered in most high schools in the state over a period of years. The ITED includes achievement tests directly related to high school subjects for 9th, 10th, 11th, and 12th grade students. In recent years there has been some but not a substantial decline in the number of Iowa students tested in the 12th grade, but volume of use in the other grades has remained stable.
The experience in Iowa with the ITED at four high school grade levels is shown in Table 13. The rise and decline of the test score means is present at all grade levels. As in Minnesota, 1965 was the year the means were highest, and since that time a decline has been in evidence on the composite scores.
14

ITED MEAN COMPOSITE SCORES— 1962-74 FOR IOWA GRADES 9, 10, 11, AND 12
1962 1963 1964 1965 1966 1967 1968 1969 1970 1971 1972 1973 1974
TABLE 13*
♦This table is reproduced by permission of Leonard S. Feldl and the Iowa Testing Program.
15

Trends in the subtests, those most related to subject matter as taught in the schools, are reported in Table 14. All of the subtest scores have shown a decline since 1965. From 1965 to 1974 the decline on the composite has been 1.3 standard scores, or about 2% of a standard deviation per year. To make the Minnesota and Iowa experience comparable, it is
helpful to examine their data for the same years, 1965 through 1971, and the same grade levels (juniors.) The per-year decline was 4% of a standard deviation for Minnesota, and 3% for Iowa. (Using statistics on a national level for comparison, during the same years the average ACT Composite declined 4% of a standard deviation per year, and the SAT about 3%.)
Table 14
MEAN ITED SCORES BY SUBTEST FOR THE STATE OF IOWA, 1962-1974*
1962 1963 1964 1965
Grade 11
1966 1967 1968 1969 1970 1971 *1973 1974
Test E 16.8 17.3 17.1 17.2 17.2 17.2 16.9 16.6 16.4 16.4 16.5 16.3Test Q 16.9 17.2 17.1 17.2 17.0 16.9 16.7 16.5 16.4 16.4 16.3 16.3Test SS 16.9 17.4 17.3 17.4 17.5 17.4 17.2 16.8 16.5 16.3 16.2 16.3Test NS 17.9 18.6 18.6 18.7 18.6 18.6 18.4 18.1 17.6 17.6 17.5 17.5Test L 16.7 17.4 17.4 17.6 17.5 17.5 17.2 16.9 16.5 16.5 16.1 16.0Test V 17.3 17.9 17.9 18.1 18.0 18.1 17.9 17.7 17.5 17.4 17.3 17.4Test SI 18.2 18.8 18.8 19.2 19.1 19.1 18.9 18.6 18.2 18.1 17.9 18.1Composite 18.1 18.6 18.7 18.9 18.8 18.8 18.5 18.2 17.8 17.7 17.6 17.6
*This table is reproduced by permission of Leonard S. Feldt and the Iowa Testing Program.Note: The tests lettered E, Q, SS, NS, L, V, and SI refer, respectively, to (English) Correctness and Appropri
ateness of Expression, Quantitative Thinking, Social Studies, Natural Sciences, Interpretation of Literature, General Vocabulary, and Sources of Information.
Feldt (personal communication, 1975), the author of the ITED, attributes the increase in test scores from 1962 to 1965 to much the same factors as cited by Perry and Swanson. Among these are Sputnik and the increased emphasis on education during the early 1960s. To this he adds the movement in Iowa during these years toward consolidation of high schools, a factor that could have resulted in better schooling. Feldt finds no ready explanation, other than those offered by his Minnesota colleagues, for declining scores since 1965.
Before we consider possible educational explanations for declining scores on the part of high school students in Iowa and Minnesota, we should consider whether or not the population of high school students has changed. It is possible that more teenagers are in school today than previously, due to better counselors, social workers, and school retention policies, and that these “new” students have weaker academic backgrounds. To explore this possibility, we examined school enrollment figures for grades 9-12 against population figures for youth ages 14-17 for
selected years from 1961 through 1973. The data are reported in Table 15, and show that in Iowa and Minnesota the percentage of school age youth in school has remained relatively constant, fluctuating within a range of 3% over the 12-year period. Consequently, we conclude that the decline in recent years on the ITED and the MSAT is likely not due to a different pool of students in high school.
Are women leaving high school with lower test scores than men? Data on score declines by sex were available for Iowa but not Minnesota, and the Iowa ITED data by sex for grades 9-12 are reported in Table 16. The ITED data for Iowa agree in the overall downward trend of test scores. However, the ITED data for Iowa do not agree with the ACT data in two respects. ITED data show a bigger decline for the boys than for the girls, and they show a decline in Natural Sciences of about the same magnitude as the other subjects. Most puzzling is the sex difference. It is possible that this factor is interacting with several others, to produce the ITED-ACT difference. Among other possible factors are the following: (1) A
16
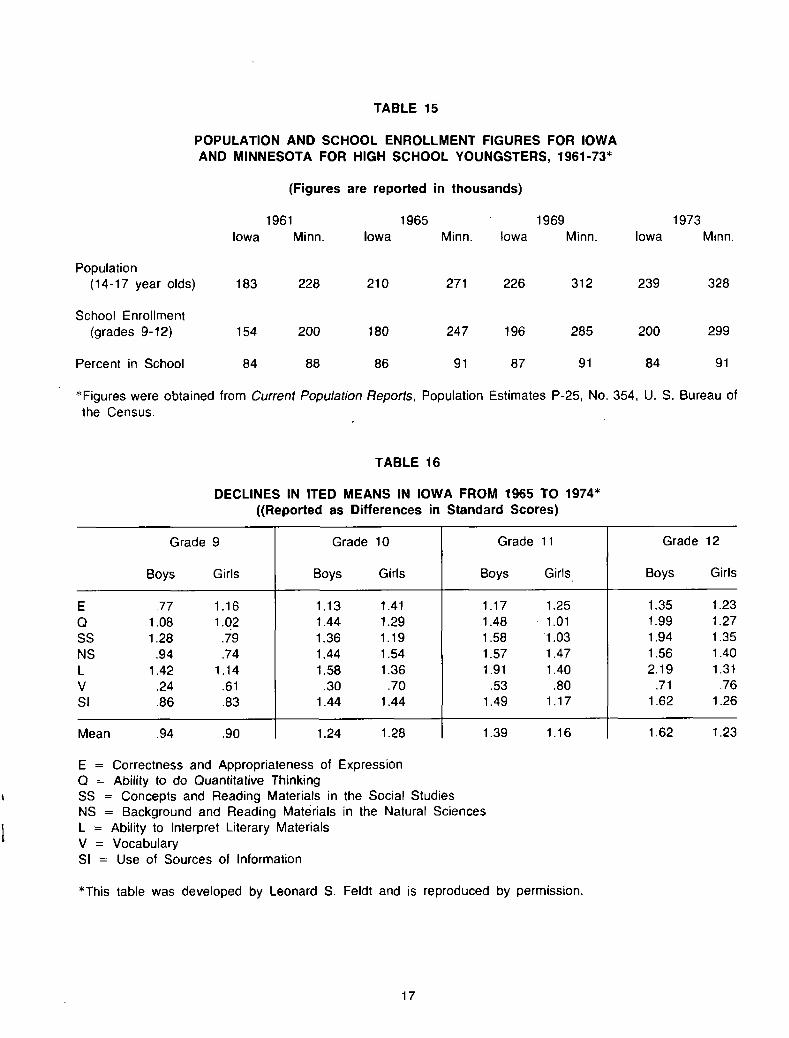
TABLE 15
POPULATION AND SCHOOL ENROLLMENT FIGURES FOR IOWA AND MINNESOTA FOR HIGH SCHOOL YOUNGSTERS, 1961-73*
(Figures are reported in thousands)
1961 1965 1969 1973Iowa Minn. Iowa Minn. Iowa Minn. Iowa Minn.
Population(14-17 year olds) 183 228 210 271 226 312 239 328
School Enrollment(grades 9-12) 154 200 180 247 196 285 200 299
Percent in School 84 88 86 91 87 91 84 91
* Figures were obtained from Current Population Reports, Population Estimates P-25, No. 354, U. S. Bureau of the Census.
TABLE 16
DECLINES IN ITED MEANS IN IOWA FROM 1965 TO 1974* ((Reported as Differences in Standard Scores)
Grade
Boys
9
Girls
Grade
Boys
10
Girls
Grade
Boys
11
Girls
Grade
Boys
12
Girls
E .77 1.16 1.13 1.41 1.17 1.25 1.35 1.23Q 1.08 1.02 1.44 1.29 1.48 1.01 1.99 1.27SS 1.28 .79 1.36 1.19 1.58 1.03 1.94 1.35NS .94 .74 1.44 1.54 1.57 1.47 1.56 1.40L 1.42 1.14 1.58 1.36 1.91 1.40 2.19 1.31V .24 .61 .30 .70 .53 .80 .71 .76SI .86 .83 1.44 1.44 1.49 1.17 1.62 1.26
Mean .94 .90 1.24 1.28 1.39 1.16 1.62 1.23
E = Correctness and Appropriateness of Expression Q - Ability to do Quantitative Thinking
t SS = Concepts and Reading Materials in the Social StudiesNS = Background and Reading Materials in the Natural Sciences
] L = Ability to Interpret Literary MaterialsV = VocabularySI = Use of Sources of Information
*This table was developed by Leonard S. Feldt and is reproduced by permission.
17

different group of students may be going to college now and this includes more low-scoring women, (2) different things may be happening in the top half of the high school population in contrast to the bottom half, and (3) Iowa may be atypical in its high school students and the patterning of the score declines.
To investigate the latter possibility, we turned to data from the National Assessment of Educational Progress. These data have two advantages. They are based on a national sample rather than one or two states,7 and they are available for different age levels. The results from eight tests of the National Assessment are reported in Table 17, and show that males generally do considerably better than females in mathematics and science, and somewhat better in social studies and citizenship. The differences favor the males at all age levels, and become greater as people get older. In the four other learning areas— writing, reading, literature, and music—females generally outperform males, but only in writing do they do so consistently and to any appreciable degree. We conclude that on the national level there is a disparity between male and female achievement, and that male high school graduates likely outperform female high school graduates.
Another important question has to do with sex differences over time for high school graduates. For example, is the trend line for one sex pointing upward and that for the other sex downward? To attempt to answer this question we turned to three tests of the National Assessment, writing, functional literacy, and science, for which data were available over a several year period. The data are reported in Table 18, and do not deal with enough tests to be conclusive. They do indicate, however, that year-to-year trends in scores appear to be similar for males and females. Though one sex may be stronger than the other in any given area for any year, declines or increases over time affect both sexes to about the same degree. We conclude on the basis of this preliminary evidence that while males generally outperform females, there likely are not marked sex differences in the amount and direction of change over time. Scores for both sexes have probably declined slightly over the last few years.
If this is an accurate description of the nation’s high school graduates in the early 1970s, and if we also consider the fact that increasing percentages of females are going to college, it would suggest that today we are getting a somewhat more selective group of men in college, and a considerably less selective group of women. It is possible that men leav
ing high school today have local options for vocational education that are interesting and promise their graduates higher salaries than college graduates. Consequently, only the better students among the men are going to college. Another factor is that the draft of a few years ago associated with the Vietnam War no longer operates to induce men leaving high school to attend college. In other words a more select group of men could be going to college now, since the pressures of the draft are off, making it ap-
TABLE 17
MEDIAN DIFFERENCE IN PERFORMANCE BETWEEN MALES AND NATION AND FEMALES AND NATION ON SELECTED TESTS FROM THE
NATIONAL ASSESSMENT OF EDUCATIONAL PROGRESS*
B*<Ow NjTion - 6 - 5 -4 -3 - ? -1
in P«rc»nuge Poinu
Abovt Nation
- 6 - 5 - 4 - 3 - ? -1
BtlO* Nation
No. of Exercit«i
1 .1 1 1 i 1
Y_-J
✓ \\
^ "S\
V// \
//
s ///
{L-
\
\ n_i/
/I . . . . .
\ \
L— r _._iy r \ x... . f
Iii
( ...... \v_ )
/ \\ / ■ . .
.. /
y //
/
. \i__ i
r -i \
__ i
•T “ 1 T---- 1----1---- 1---- 1
Mathem atics1972-73
Scicnc*1972-73
Socut S tudm 1971-72
Citix«n«hip 1969 70
Writing 1969 70
RtJdirq1970*71
L it« r« tun 1970 71
M uiic1971*72
in P«rcentig» PdirUtMales: 9!*Ck Femalei: Sh*c«3
7A national probability sample was drawn of the nation’s population at the age levels of interest, for administration of the tests.
-Taken Irom ihc NAEP Newsletter, October 1975 and reproduced by permission.
18
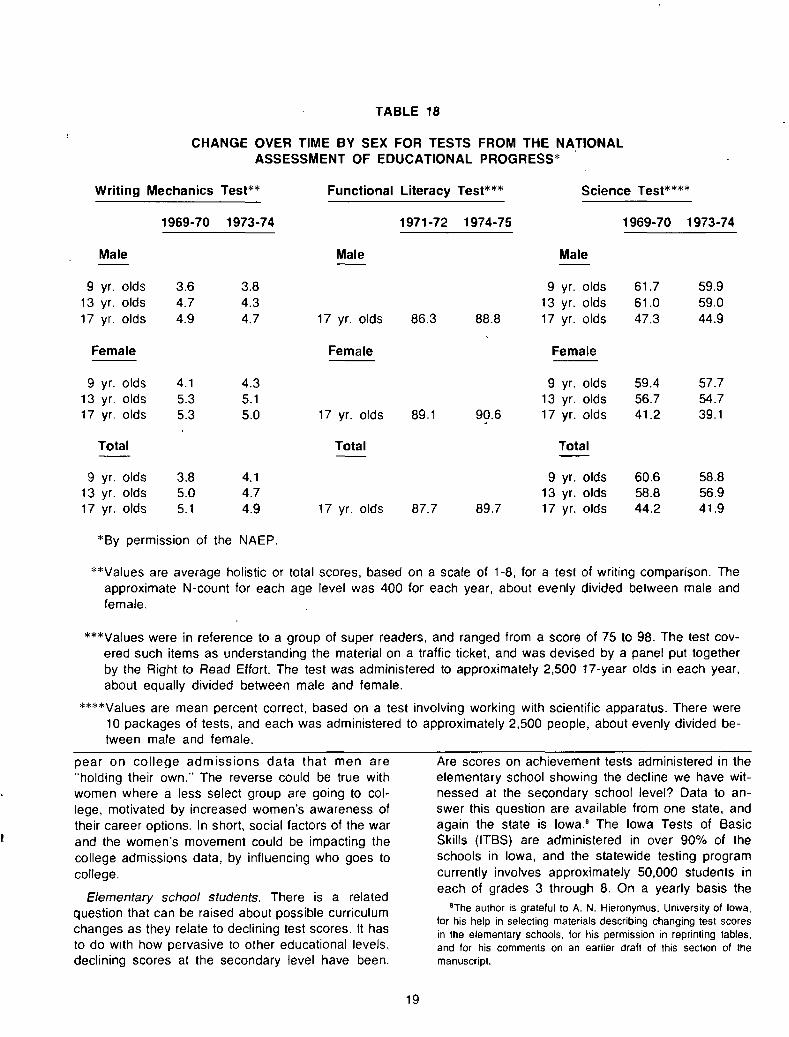
TABLE 18
CHANGE OVER TIME BY SEX FOR TESTS FROM THE NATIONAL ASSESSMENT OF EDUCATIONAL PROGRESS*
Writing Mechanics Test* Functional Literacy Test*’ Science Test****
1969-70 1973-74 1971-72 1974-75 1969-70 1973-74
Male Male Male
9 yr. olds 3.6 3.8 9 yr. olds 61.7 59.913 yr. olds 4.7 4.3 13 yr. olds 61.0 59.017 yr. olds 4.9 4.7 17 yr. olds 86.3 88.8 17 yr. olds 47.3 44.9
Female Female Female
9 yr. olds 4.1 4.3 9 yr. olds 59.4 57.713 yr. olds 5.3 5.1 13 yr. olds 56.7 54.717 yr. olds 5.3 5.0 17 yr. olds 89.1 90.6 17 yr. olds 41.2 39.1
Total Total Total
9 yr. olds 3.8 4.1 9 yr. olds 60.6 58.813 yr. olds 5.0 4.7 13 yr. olds 58.8 56.917 yr. olds 5.1 4.9 17 yr. olds 87.7 89.7 17 yr. olds 44.2 41.9
*By permission of the NAEP.
**Values are average holistic or total scores, based on a scale of 1-8, for a test of writing comparison. The approximate N-count for each age level was 400 for each year, about evenly divided between male and female.
***Values were in reference to a group of super readers, and ranged from a score of 75 to 98. The test covered such items as understanding the material on a traffic ticket, and was devised by a panel put together by the Right to Read Effort. The test was administered to approximately 2,500 17-year olds in each year, about equally divided between male and female.
****Values are mean percent correct, based on a test involving working with scientific apparatus. There were 10 packages of tests, and each was administered to approximately 2,500 people, about evenly divided between male and female.
pear on college admissions data that men are “ holding their own.” The reverse could be true with women where a less select group are going to college, motivated by increased women’s awareness of their career options. In short, social factors of the war and the women’s movement could be impacting the college admissions data, by influencing who goes to college.
Elementary school students. There is a related question that can be raised about possible curriculum changes as they relate to declining test scores. It has to do with how pervasive to other educational levels, declining scores at the secondary level have been.
Are scores on achievement tests administered in the elementary school showing the decline we have witnessed at the secondary school level? Data to answer this question are available from one state, and again the state is Iowa.8 The Iowa Tests of Basic Skills (ITBS) are administered in over 90% of the schools in Iowa, and the statewide testing program currently involves approximately 50,000 students in each of grades 3 through 8. On a yearly basis the
8The author is grateful to A. N. Hieronymus, University of Iowa, for his help in selecting materials describing changing test scores in the elementary schools, for his permission in reprinting tables, and for his comments on an earlier draft of this section of the manuscript.
19

TABLE 19
Trends in the School Achievement of Iowa Pupils as Measured by the ITBS, 1955-75:Differences in Grade Medians*
Differences are expressed in terms of grade-equivalent units ("months” ). For example, 2.7 represents a gain of 2.7 months; - .5 represents a loss of .5 month, etc.
Grade 3
TEST V: VOCABULARY
V
TEST R: READ
ING
RTEST L; LANGUAGE SKILLS TEST W: WORK-STUDY SKILLS TEST M; MATHEMATICS SKILLS COM
POSITE
cSPELLING
1-1CAPITALIZATION
L-2
PUNCTUATION
L-3
USAGEL-4
TOTAL
LMAPSW-1
GRAPHSW-2
REFERENCES
W-3
TOTAL
wCONCEPTS
M-1PROBLEMS
M-2TOTAL
M1955-60 2.7 2.6 3.7 5.0 4.0 4.4 4.3 1.7 2.9 4.3 3.0 3.8 1.5 2.6 3.01960-65 1.4 1.9 2.0 .5 .7 2.4 1.4 1.5 1.3 .5 1.1 .8 .2 .5 1.31965-70 .3 .2 - .5 -1.1 - .9 - .7 - .8 .8 .6 .3 .6 .1 .7 .4 .11970-75 .4 .5 - .4 - .6 .6 .5 .0 ,6 .1 .7 .5 - .1 .3 .1 .3
Grade 4TEST V: VOCABULARY
V
TEST R: READ
ING
RTEST L: LANGUAGE SKILLS TEST W: WORK-STUDY SKILLS TEST M: MATHEMATICS SKILLS COM
POSITE
cSPELLING
L-1CAPITALIZATION
L-2
PUNCTUATION
L-3
USAGEL-4
TOTAL
LMAPSW-1
GRAPHSW-2
REFERENCES
W-3
TOTAL
wCONCEPTS
M-1PROBLEMS
M-2TOTAL
M1955-60 3.2 2.8 5.0 7.8 3.9 5.7 5.6 2.9 3.8 6.2 4.3 2.5 2.0 2.2 5.01960-65 1.7 1.3 .4 1.8 1.3 1.6 1.3 .2 .0 .5 .2 2.3 .7 1.5 1.21965-70 - .7 - .2 - .7 -1.1 -1.1 - .7 - .9 .9 1.9 .5 1.1 - .1 -1 .1 - .6 - .31970-75 .3 - .2 - .2 -2 .4 -1 .5 - .6 - 1 .2 .0 .1 - ,1 .0 - .2 - .4 - .3 - .2
Grade 5TEST V: VOCABULARY
V
TEST R: READ
ING
RTEST L: LANGUAGE SKILLS TEST W: WORK-STUDY SKILLS TEST M: MATHEMATICS SKILLS COM
POSITE
cSPELLING
L-1CAPITALIZATION
L-2
PUNCTUATION
L-3
USAGEL-4
TOTAL
LMAPSW-1
GRAPHSW-2
REFERENCES
W-3
TOTAL
wCONCEPTS
M-1PROBLEMS
M-2TOTAL
M1955-60 3.3 3.3 4.1 6.1 2.0 6.6 4.7 4.3 4.1 4.5 4.3 3.9 1.7 2.8 3.71960-65 .9 .2 .8 2.6 3.1 .6 1.8 1.0 1.6 1.0 1.2 4.1 3.5 3.8 1.61965-70 - .2 - .1 - .9 -1 .7 - .9 -1 .3 -1 .2 .5 1.2 .6 .8 -1 .4 -2 .5 -1 .9 - .51970-75 - .6 -1 .8 -1 .2 -3.1 -2 .6 -1 .7 -2.1 - .9 - .7 -1 .0 - .9 -1 .7 - .8 -1 .3 -1 .4
Grade 6TEST V: VOCABULARY
V
TEST R: READ
ING
RTEST L: LANGUAGE SKILLS TEST W: WORK-STUDY SKILLS TEST M: MATHEMATICS SKILLS COM
POSITE
cSPELLING
L-1CAPITALIZATION
L-2
PUNCTUATION
L-3
USAGEL-4
TOTAL
LMAPSW-1
GRAPHSW-2
REFERENCES
W-3
TOTAL
wCONCEPTS
M-1PROBLEMS
M-2
TOTAL
M1955-60 3.7 3.5 3.8 8.4 4.0 7.3 5.9 5.7 6.1 3.3 5.0 3.3 2.8 3.0 4.21960-65 .5 1.0 1.5 3.2 2.8 1.3 2.2 .7 1.4 2.2 1.4 2.9 .3 1.6 1.31965-70 - .3 - .9 - .5 - .7 - .5 -2 .2 -1 .0 .7 .8 .7 .7 -2.1 -3 .3 -2 .7 - .81970-75 -1.1 -1 .6 -1 .3 -3 .4 -3 .4 -3 .6 -3 .3 -2 .2 -1 .4 -1 .5 -1 .7 -2 .7 -1 .7 -2 .2 -1 .9
Grade 7TEST V: VOCABULARY
V
TEST R: READ
ING
RTEST L: LANGUAGE SKILLS TEST W: WORK-STUDY SKILLS TEST M: MATHEMATICS SKILLS COM
POSITE
cSPELLING
L-1CAPITALIZATION
L-2
PUNCTUATION
L-3
USAGEL-4
TOTAL
LMAPSW-1
GRAPHSW-2
REFERENCES
W-3
TOTAL
wCONCEPTS
M-1PROBLEMS
M-2TOTAL
M1955-60 3.9 5.8 6.6 10.6 4.8 7.9 7.5 7.6 6.9 3.3 5.9 4.9 6.0 5.4 5.71960-65 1.1 .9 1.7 5.1 2.6 .6 2.5 2.6 .0 2.2 1.6 1.8 .2 1.0 1.41965-70 -1 .4 -3.1 -1 .3 -3 .4 -3 .4 -3 .8 -3 .0 - .5 - .9 - .1 - .5 -2 .9 -4.1 -3 .5 -2 .31970-75 -2 .5 -2 .1 -3 .0 -5 .7 -5 .4 -4 .3 -4 .6 -2 .7 -1 .4 -3 .0 -2 .4 -3 .6 -3 .0 -3 .3 -3 .0
20

Grade 8
1955-601960-651965-701970-75
TEST V: VOCABULARY
V
TEST R: READ
ING
RTEST L: LANGUAGE SKILLS TEST W: WORK-STUDY SKILLS TEST M: MATHEMATICS SKILLS COM
POSITE
cSPELLING
L-1CAPITALIZATION
L-2
PUNCTUATION
L-3
USAGEt-4
TOTAL
LMAPSW-1
GRAPHSW-2
REFERENCES
W-3
TOTAL
wCONCEPTS
M-1PROBLEMS
M-2TOTAL
M4.3 5.5 2.2 12.0 1.0 2.0 4.3 3.0 4.0 3.0 3.3 8.5 4.1 6.3 4.7
.0 - .5 2.8 5.5 1.0 3.5 3.2 2.6 .0 2.6 1.7 2.2 1.4 1.8 1.2-1 .9 -2 .5 - .3 -1 .4 - .8 -4 .5 -1.7 .2 -1 .7 .3 - .4 -3 .5 -5.1 -4 .3 -2 .2-2 .4 -3 .0 -4 .0 -6 .4 -5 .4 -5 .2 -5.3 -2 .5 - .1 -2 .3 -1 .7 -3 .5 -2 .2 -2 .9 -3 .0
Averages for Grades 3-8
1955-601960-651965-701970-75
TEST V: VOCABULARY
V
TEST R: READ
ING
RTEST L: LANGUAGE SKILLS TEST W: WORK-STUDY SKILLS TEST M: MATHEMATICS SKILLS COM
POSITE
cSPELLING
L-1CAPITALIZATION
L-2
PUNCTUATION
L-3
USAGEL-4
TOTAL
LMAPSW-1
GRAPHSW-2
REFERENCES
W-3
TOTAL
wCONCEPTS
M-1PROBLEMS
M-2TOTAL
M3.5 3.9 4,2 8.3 3.3 5.6 5.4 4.2 4.6 4.1 4.3 4.5 3.0 3.8 4.2
.9 .9 1.5 3.1 1.9 1.7 2.0 1.4 .7 1.5 1.2 2.4 1.1 1.8 1.3- .7 -1 .1 - .7 -1 .6 -1 .3 -2 .2 -1 .4 .4 .3 .4 .4 -1 .6 -2 .6 -2.1 -1 .0-1 .0 -1 .4 -1 .7 -3 .6 -3 .0 -2 .5 -2 .7 -1 .3 - .6 -1 .2 -1 .0 -2 .0 -1 .3 -1 .6 -1 .5
*Ttiis table is reproduced by permission of A. N. Hieronymus and the Iowa Testing Program.
number and percentage of Iowa pupils to whom the ITBS has been administered have remained fairly stable over the last 20 years. The ITBS are achievement tests in the areas of vocabulary, reading, language skills, work study skills, and mathematics skills. Changes for each 5-year period from 1955 through 1975 for each of the elementary grade levels for each of the tests are reported in Table 19.
Results are reported as differences expressed in terms of grade equivalent months, using 1965 as a
1 base.Achievement in the basic skills in Iowa improved
markedly during the period between 1955 and 1960. Achievement continued to improve but at a slower rate between 1960 and 1965. Between 1965 and 1970 there was a general decline in all areas except work-study, with losses being most pronounced in language usage and mathematics. Between 1970 and 1975 there have been substantial losses, partic
ularly in the language skills, and particularly in the upper grades. Achievement in the lower grades has remained fairly stable, and generally the decline has become greater as one goes up the grades. At the elementary school level we conclude that in at least one state there are declining achievement test scores in recent years.
But how well does this generalize to the national scene? Hieronymus and Lindquist (1974) provide a comparison of ITBS national norms for 1955, 1963, and 1970, and a summary of differences is reported in Table 19. The authors have reviewed the sampling design used for the national normings that took place in 1955, 1963, and 1970, to insure that population and not sampling differences are being reported in Table 20. To the best of their knowledge this is the case. The data portray national statistics similar to those obtained in the State of Iowa, although the national decline is less marked and consistent.
21

TABLE 20
Comparison of 1955, 1963, and 1970 ITBS National Norms: Summary of Differences*
TEST V: VOCABULARY
V
TEST R: READ
ING
RTEST L: LANGUAGE SKILLS TEST W: WORK-STUDY SKILLS TEST M: MATHEMATICS SKILLS COM
POSITE
cSPELLING
L-1CAPITALIZATION
L-2
PUNCTUATION
L-3
USAGEL-4
TOTAL
LMAPSW-1
GRAPHSW-2
REFERENCES
W-3
TOTAL
wCONCEPTS
M-1PROBLEMS
M-2
TOTAL
M50thPercentile
o '71-64 0.4 -2.1 1.0 0.6 -1 .6 -3.1 0.0 0.8 0.9 1.4 0.9 -1 .7 -3 .1 -2 .4 -1.1o '64-56 -0 .8 2.5 2.1 3.3 -2 .0 1.6 1.3 2.0 3.2 1.8 2.3 3.4 1.6 2.5 1.67 '71-64 1.0 -1 .4 1.1 -0 .9 0.0 -1 .6 0.0 1.2 2.3 2.0 1.7 -2 .2 -4 .1 -2 .8 -0 .4f '64-56 1.8 1.5 4.8 6.6 -2 .4 1.4 2.6 3.8 3.7 2.8 3.4 3.5 4.6 4.1 2.7c '71-64 0.9 -2 .6 -1 .4 -2 .8 -1 .4 -1 .6 -1 .4 0.7 2.2 0.3 1.1 -2 .7 -3 .0 -3 .0 -1 .1D '64-56 0.8 2.2 1.5 4.5 -0 .2 2.4 2.1 2.0 1.2 3.8 2.3 4.4 2.5 3.4 2.2
'71-64 1.4 -0 .7 0.4 -2 .3 0.0 -0 .8 -0 .5 1.4 3.4 0.7 1.5 0.8 0.6 0.6 0.6D '64-56 0.8 2.6 4.0 4.4 1.8 2.0 3.1 1.4 1.6 1.8 1.6 3.6 2.6 3.1 2.2A '71-64 0.6 -0 .6 -1 .0 -1 .6 -0 .6 -2 .2 -1 .4 1.2 3.5 1.0 1.9 0.6 0.3 0.7 0.3H '64-56 3.6 2.5 3.4 6.6 3.4 3.2 4.2 1.5 0.5 2.8 1.6 1.9 0.6 1.3 2.6Q ’71-64 1.3 0.5 0.0 -0 .6 1.0 0.0 -0 .6 0.9 0.3 1.0 0.9 0.7 1.9 1.6 0.4
'64-56 2.4 4.3 3.0 4.6 1.8 0.5 2.5 1.6. 2.5 2.2 2.1 2.8 0.6 1.7 2.6
Mean ’71-64 0.9 -1 .2 0.0 -1 .3 -0 .4 -1 .6 -0 .6 1.0 2.1 1.1 1.3 -0 .8 -1 .2 -0 .9 -0 .2Diff. '64-56 1.4 2.6 3.1 5.0 0.4 1,8 2.6 2.0 2.1 2.5 2.2 3.3 2.1 2.7 2.3
‘ Taken from the Manual for Administrators, Supervisors, and Counselors, Iowa Tests of Basic Skills Forms 5 and 6. authored by A. N. Hieronymus and E. F. Lindquist, and published by Houghton-Miffiin Company (1974). This table is reproduced by permission of the publisher.
The authors describe the national situation as follows.
Between 1955 and 1963 achievement improved rather consistently for most achievement test areas, grade levels, and achievement levels. The average change was 3.0 months at the 90th percentile, 2.3 months at the 50th percentile, and 1.1 months at the 10th percentile. (Only data for the 50th percentile is portrayed in Table 19.)Overall between 1963 and 1970, differences in median composite scores were negligible. However, there were some small but fairly consistent qualitative differences among achievement areas, grades, and achievement levels. In general the changes were positive in the lower grades and tended to balance out in the upper grades.Gains were fairly consistent in vocabulary and work-study skills, but fairly consistent losses occurred in reading and in some of the language skills. Mathematics achievement appears to have improved in the lower grades, but in the upper grades losses in both concepts and problem solving are consistent and sizable. (Hieronymus and Lindquist, 1974, p. 66.)It is of interest to look as well at experience in an
other country. The Canadian Tests of Basic Skills (CTBS) were developed along a rationale similar to that employed by the ITBS, and are widely used in Canada to measure the educational achievement of elementary school children. The CTBS were normed
in both 1966 and 1973, and changes in the achievement of elementary school children within the country are reflected in changes in grade-equivalent norms over the 7-year period. The investigators summarized the Canadian findings as follows:
In general, performance on the basic skills was lower in 1973 than in 1966. Differences on the Composite range from 1.5 grade equivalent months in Grade 3 to 6.1 grade equivalent (months) in Grade 8. Differences were greatest in the four tests of language skills, capitalization in particular. This may reflect de-emphasis in instruction in mechanics of language. The smallest differences were in the work-study skills. (King and Hieronymus, 1974, p. 56)Before we leave the subject of declining achieve
ment scores at the elementary level, we should inquire a bit more deeply into the meaning of the phenomenon. Year-to-year change in test scores is not new. For several years until about 1965, achievement test scores at both the elementary and secondary levels were rising. No one got concerned about this, because the American public was ready to accept the idea that every year things were getting better. Yet no factual information was collected that showed what kind of schools, teachers, or instruction were most potent in bringing about the academic gains. Today we are witnessing declining scores although the decline, at least at the elementary level where we have data, is not so great that it has wiped
22

out all of the gains of the 1950's and 1960’s. Today's youngsters in the elementary school have a higher level of achievement than their counter-parts of 20-25 years ago—today’s parents. Because scores are declining, educators are being asked to give explanations as to why this is occurring, explanations that were never required while the scores were rising. Yet the fact of the matter is that we have precious little factual information about what kind of schools, teachers, and instruction make for change in pupil learning. Since the purpose of schools is student learning, it is important at any time that we focus our attention on how learning gains can be maximized within the practical limits offered by the schools, and conversely how achievement losses as they may occur can be controlled and minimized. To provide such an analysis would go beyond data that is readily available, and hence is beyond the scope of this paper. It represents, however, the central issue in declining achievement scores at the elementary and secondary level.
We conclude that declining school achievement test scores is a pervasive phenomenon in Iowa, and even the United States may not be alone in witnessing declining achievement test scores at the elementary level. Further, declining achievement scores of college-bound students would seem to be analogous to declining achievement scores at the secondary and elementary school levels in that there were steady gains to the mid 1960’s, score averages peaked, and then there were declines.
Relationship between tests and the curriculum. A related question has to do with whether the academic outcomes of instruction have changed over the years so that achievement tests today may not adequately reflect school achievement. No one has ever argued that achievement tests measure all of the significant academic outcomes of schooling, but rather that they measure some of the important ones. Teacher grades are other measures of academic learning, and in many cases these are available for comparison with test scores. We sought to determine the extent to which the high school and college curriculum may have become more dissimilar from one another over the last 10 years, and at the same time the extent to which ACT test scores may have changed in their overlap of either.
To accomplish this Table 21 was prepared, showing over the recent 10-year period correlations between ACT scores and respective college grades, high school grades and respective college grades, ACT scores and respective high school grades, and finally the multiple R of the four ACT test scores versus respective college grades. This table was based on the complete institutional participation in the ACT
MEDIAN WITHIN COLLEGE CORRELATIONS OF ACT SCORES, HIGH SCHOOL GRADES, AND
COLLEGE GRADES, 1965-75
TABLE 21
ACT Scores Vs.Respective
College Grades*
High School Grades Vs. Respective College
Grades**
Correlations 1965 1968 1971 1975 1965 1968 1971 1975
English .45 .42 .39 .41 .44 .40 .38 .36
Mathematics .37 .38 .37 ,42 .35 .34 .36 .34
Social Studies .44 .41 .38 .41 .40 .39 .38 .36
NaturalSciences
,36 .35 .34 .38 .37 .35 .35 .34
Overall .48 .45 .42 .49 .53 .51 .50 .50
ACT Scores Vs. Respective High School Grades
Multiple R—4 ACT Tests Vs. Respective Coliege
Grades
Corre la tions 1965 1968 1971 1975 1965 1968 197t 1975
English .40 .39 .39 .41 .48 .44 .42 .44
Mathematics ,38 .37 .38 .44 .42 .42 41 .46
Social Studies .33 .33 .33 .35 .49 .46 .45 .50
NaturalSciences
.25 .24 .26 .30 ,48 .46 .45 .51
Overall .45 .43 .45 .50
N C ounts1
1965 1968 1971 1975
CollegesStudents (Median)
257530
214592
229586
162508
CollegesStudents (Median)
177313
161362
169379
114304
CollegesStudents (Median)
232425
191489
201472
129420
CollegesStudents (Median)
221387
173452
192406
124365
CollegesStudents (Median)
271494
227463
262446
190518
•Read as follows, The median correlation between ACT English scores and College
English grades was .45 in 1965, .42 in 1968, .39 in 1971, and so on.
**Read as follows. The median correlation between high school English grades and
college grades was .40 in 1965, .40 in 1968. .38 in 1971. and so on.
***N Counts are those on which ihe Multiple R's are based. There may be some
slight variation for the other correlations.
Source: ACT Standard Research Service Files, 1965-75
23

Standard Research Service for the appropriate years. The results show little change over the last 10 years in the pattern of relationships. ACT scores, high school grades, and college grades have about the same correlations with one another now as they did several years ago. There may be a slight tendency over the years for high school grades to be less correlated with college grades and for ACT scores to be more correlated with high school grades, but observed changes are small and likely of little consequence.
How do the results in Table 21 interact with the known increase in the variability of ACT scores and the inflation in high school and college grades? The standard deviations for ACT scores, high school grades, and college grades are reported in Table 22 for the same institutions as were examined in Table 21. The data show an increase over time in the size of the standard deviations for the ACT scores, and stability in the standard deviations for high school and college grades. At the same time high school and college average grades have been rising, See Table 23. With the rising means for high school and college grades, both grade distributions have become less normally distributed. Related to this, there are more students getting A’s and fewer D’s and F’s
than before. Changes of this kind—that is, a dilution in the level of quality represented by the highest letter grade and hesitancy to assign grades of D and F according to former achievement standards—tend to reduce the magnitude of correlations.
By itself the increased variability of the ACT scores would tend to inflate somewhat the obtained correlations of the ACT scores with college grades. And by itself the rising average of high school and college grades, particularly since they are on a 4- or 5-point scale, would decrease the correlations between which these variables could enter with respect to others. The obtained correlations between ACT scores and college grades presented in Table 21 probably represent as accurate figures as can be determined, representing as they do a balance between influences to both inflate and deflate the r's. At the same time the correlations between high school and college grades may be underestimated. There was another reason why we felt it would be inappropriate to adjust the correlations for variability on ACT scores. Such formulas assume the population changes which are reflected in the standard deviation have not affected the standard error of estimate or the errors of prediction. Such an assumption is questionable when college grading standards are undergoing changes in
TABLE 22
MEDIAN WITHIN COLLEGE STANDARD DEVIATIONS, 1965-1975
1965 1968 1971 1975------- ------- ---- -------
nglish
ACT Scores 4.43 4.38 4.54 4,80High School Grades .83 .79 .79 .77College Grades ,92 .92 .91 .90
Mathematics
ACT Scores 5.51 5.97 5.80 6.59High School Grades .94 .91 .92 .94College Grades 1.13 1.14 1.14 1.12
Social Studies
ACT Scores 5.46 5.69 5.99 6.87High School Grades .86 ,81 .81 .79College Grades .97 .98 1.00 .99
Natural Sciences
ACT Scores 5.51 5.57 5.12 5.84High School Grades .89 .84 .83 .84College Grades 1.03 1.03 1.03 1.04
Overall
ACT Scores 4.22 4.36 4.39 4.96High School Grades .58 .62 .62 .63College Grades .77 .79 .77 .78
Source: ACT Standard Research Service Files, 1965-75,
24

TABLE 23
DISTRIBUTIONS OF HIGH SCHOOL AND COLLEGE GRADES, 1962-65 AND 1974-75, FOR ENROLLED COLLEGE STUDENTS
High School Grades
1962-65Distributions(Percents)
1974-75Distributions
1962-65 Means N Colleges = N Students =
1974-75 Means N Colleges = N Students =
ABCDFNA
ABCDFNA
English184134
701
304422
301
2.69398
225,402
Mathematics1329381622
193233
9 1 6
2.37
2.623.03 1,218
43,926 (10% Sample)
SocialStudies
233930602
343920
204
2.79
3.08
NaturalSciences
14343811
1
3
22362740
10
2.51
2.83
College Grades
1962-65Distributions(Percents)
1974-75Distributions
1962-65 Means N Colleges N Students
1974-75 Means N Colleges N Students
153934
74
2.02379
176,779
2.50335
142,297
Mathematics1124331913
232829128
1.98249
76,039
2.43280
58,443
SocialStudies
72341209
173234115
1.97337
128,201
2.41309
97,344
NaturalSciences
822392011
16293513
7
1.93315
112,638
2.31291
73,295
Source: ACT Standard Research Service Files, 1962-75.
25

one direction (up) and the average level of the population appears to be changing in the opposite direction (down). Thus, it was felt that application of the formulas which ostensibly “correct” for changes in variability could not be safely applied to the correlations in this setting.
Where does this leave us in attempting to understand whether the tests are less related to the high school and college curricula than previously? Because of the complex of influences and the inadequacy of our statistics to sort them out, we are left with a fuzzy picture and an uncertain answer. Forced to articulate a conclusion, the most prudent one would probably be that the tests are likely overlapping or measuring the curricular content of high school and college courses to about the degree they always have. This suggests that there has not been a major curricular redirection at either the high school or college level over the last 10 years. We would not, however, want to rule out the possibility that some curricular change at either or both has occurred. At the same time the data supply preliminary evidence that the relationship between the tests and the high school and college curricula is approximately the same today as it was 10 years ago.
If we do leave room in our thinking for at least some curricular redirection in high school and college over the last 10 years, what form might this have taken? We do not have facts with which to answer this question, but we do have impressions of experienced teachers, professors, school administrators, and others who have been close to instruction. Among the comments that they might give are the following.
It is possible that our schools, and high schools in particular, are now teaching more abstract than concrete knowledge. For example, through the new math students may have increased understanding of numbers and mathematics, but have less experience and skill in arithmetic and algebraic operations. Similarly many English teachers today may emphasize written and oral expression in contrast to punctuation, sentence structure, or vocabulary. If this line of speculation has some validity, there has been a slight curricular redirection in the schools with the consequence that schools are teaching somewhat different material than that measured by the various tests. Whether schools ought to be teaching this or something else is a matter for curriculum specialists, and ultimately perhaps the general public, to resolve.
Impact of the high school decline on the decline of admissions scores. Assuming that average test scores for high school graduates are in decline, how does this interact with the decline for college-bound students? It is instructive to look at the State of Iowa
where we have quality data about both high school and college-bound students, and can compare ITED and ACT figures for Iowa for the same years. In the 4-year period from 1970-1974, the ITED Composite for 11th graders declined approximately 1% of a standard deviation per year. During the same 4-year period, Iowa college-bound students declined on the ACT Composite an average of 4% of a standard deviation per year. It is possible that the population of high school students is changing but the pool of college-bound students is changing more. At least, this would appear to be the case in one state for these years.
It is desirable to look as well at the years before 1970, since the years just preceding were marked by a relatively sharp decline followed after 1970 by a plateauing of the score means. For the 4-year period from 1966-1970, the ITED composite for Iowa 11th graders declined approximately 4% of a standard deviation per year. During the same 4-year period, Iowa college-bound students declined on the ACT Composite an average of 2% of a standard deviation per year. A somewhat different finding was obtained for Minnesota where for the same years data on both the MSAT and ACT were available. The MSAT declined an average of 2% of a standard deviation per year, while the college-bound students declined on the ACT Composite the same amount. We conclude that during the late 1960’s, at least in two states, test scores for high school students generally declined as much or more than the test scores of college-bound students.
It would appear that the fundamental factor or factors responsible for the decline in admissions test scores were different for the 1966-1970 period than for the 1970-1974 period. For example, from 1966-1970 much of the decline in admissions test scores could have been due to a decline in the popu la tion of high schoo l s tuden ts , w h ile from 1970-1974 much of the decline could have been due to a changed pool of college-bound students. In some years one factor may play a more important role and in yet other years the factors may combine in their effects.
We can summarize our examination of the thesis that “students are academically weaker today" by noting several observations.1. Recent years have seen declining aptitude and
achievement test scores for high school students generally in Iowa and Minnesota. Both state testing programs saw a gradual increase in test scores up to 1965. In the years immediately following 1965, a sharp decline occurred, followed by a plateauing and gradual decline. From 1965 through 1971, the per-year average decline was
26

about 3% to 4% of a standard deviation for high school juniors in the two states. During these years approximately the same percentage of the age cohorts were in school in these states, so the decline cannot be attributed to the schools retaining more low-scoring would-be dropouts.
2. Data from the National Assessment of Educational Progress show that high school age males generally outperform females in most areas of academic work. Both sexes, however, show declining averages over time.
3. There have been declining achievement scores at the elementary school level, both in Iowa and nationally. Achievement in the lower grades has remained fairly stable and generally the decline has become greater as one goes up the grades.
4. There is at least preliminary evidence that the ACT tests are likely measuring the curricular content of high school and college courses about as well as they ever did. Assuming that the content of the ACT tests have stayed more or less the same, this suggests that there has not been a major curricular redirection over the last 10 years at either the high school or college level, but we would not rule out some curricular redirection at either or both.
5. The decline in admissions test scores would seem to be attributable to different factors at different
points in time. From 1970 to 1974 in Iowa, ACT average scores declined about four times as much as scores of high school students generally. We conclude that for these years the declining ACT scores in Iowa were likely due to a changed pool of college-bound students. On the other hand, from 1966 to 1970 in Iowa and Minnesota the average scores of high school students generally declined about twice as much or as much as the average scores of ACT-tested students. We conclude that for these earlier years the declining ACT scores in these states were likely due to the decline in test scores of high school students generally.
We conclude our analysis of the explanations often given for declining test scores—the “changed pool of college-bound students” thesis and the “students are academically weaker today” thesis—by observing that there is factual evidence to support both. Not only is there a measure of truth in each explanation, but they likely interact with one another. We have insufficient data on a national basis to determine which explanation has more relevance to declining admissions test scores. Whether experience in one or two states is similar to that of other states is at present unknown, though there is evidence even here that one explanation may explain the situation in some years but not in others.
Response of Colleges and Universities to Declining Admissions Test Scores
Some college observers would expect colleges and universities to respond to declining admissions scores by one or both of two approaches: refuse admission to an increasing percentage of applicants, or admit as many students as ever but encourage those with little academic promise to leave within the first term. Those who would expect a senario such as this would likely feel that collegiate standards of academic merit are more or less fixed and would preclude institutional adaptation to low scoring students. In contrast, other observers would expect colleges and universities to respond to declining admissions scores by accepting and retaining as many students as before. They would see the colleges adapting to the student applicant pool before them, and motivated perhaps by institutional financial incentives to maintain enrollments, would adjust their academic standards for admission and retention. Still others might be of the opinion that college admissions standards are more implied than real to most stu
dents, and consequently whatever the facts may be about what colleges are prepared to do, many of the low scoring students on admissions tests would simply not enroll in college.
To investigate the plausibility of these and other speculations about the response of colleges to declining admissions scores, we obtained data from the files of ACT Research Services. The Class Profile Service provides a description to participating colleges of their ACT-tested students who enroll, and a like description of ACT-tested students who were interested in the college but who went elsewhere. This permits a comparison for each college or type of college between enrolled students and others in the applicant pool who for various reasons did not enroll. In addition for institutions that participate in ACT’s Basic or Standard Research Service, data descriptive of students who persist through the first term of college are available. Consequently, information from the three reports can be combined to describe students
27

who were interested, enrolled, and persisted. These data are reported in Table 24 for the 1969-70 and the 1974-75 college freshman years, and are available by college level. College level refers to the highest academic degree offered, with Level I being the associate, and Level IV the doctorate.
For each level a college was included only if data were available for interested, enrolled, and persisted students for each of the two academic years,
1969-70 and 1974-75. As a preliminary check on whether or not these colleges and their students were typical of the ACT population because of some reason associated with complete data being available, we compared means for men, women, and total for enrolled students at colleges in the Class Profile Service in 1974-75 with the enrolled students in the subset of colleges presented in Table 24.9 We conclude that the population statistics for Levels I and III
TABLE 24
Flow of Students to Different Levels of Colleges and Institutions, 1969-70 and 1974-75: ACT Composite
Means & Standard Deviations by Sex, College Level, and Student Status
1969-70 1974-75
Interested but went
elsewhereEnrolled
Persisted through
first term
Interested but went
elsewhereEnrolled
Persisted through
first term
Level I CollegesMales "x 18.2 17.9 NA* 17.6 17.3 NAS. D.** 4.9 4.6 NA 5.3 5.1 NAFemales x 17.8 17.6 NA 16.8 16.6 NAS. D ._ 4.6 4.4 NA 5.0 4.9 NATotal 7 18.0 17.8 18.3 17.1 16.9 17.6S. D. 4.7 4.6 4.5 5.1 5.1 5.0N Students 65,129 58.724 48.738 74,268 46,970 39,228P.C.*** Male 53 59 NA 43 47 NAN Colleges 154 154
Level II CollegesMales Y 19.4 19.6 NA 19.0 19.0 NAS. D. 4.8 4.4 NA 5.3 5.1 NAFemales x 19.0 19.2 NA 18.1 18.5 NAS. D. 4.6 4.3 NA 5.2 5.0 NATotal x 19.2 19.4 19.6 18.5 18.7 19.2S. D. 4.7 4.4 4.3 5.3 5.1 5.0N Students 73,892 39,019 38,193 85,310 34,033 32,018P.C. Male 52 53 NA 46 47 NAN Colleges 123 123
Level III CollegesMales x 19.8 20.2 NA 18.9 19.3 NAS. D. 4.8 4.5 NA 5.3 5.1 NAFemales x 19.3 19.9 NA 18.1 18.7 NAS. D. 4.6 4.3 NA 5.1 5.0 NATotal x 19.5 20.0 20.2 18.5 19.0 19.3S. D. 4.8 4.4 4.3 5.2 5.1 5.1N Students 187,589 80,993 71,771 193,565 59,365 51,873P.C. Male 51 50 NA 47 46 NAN Colleges 80 80
Level IV Colleges tMales x 20.9 22.6 NA 20.0 21.6 NAS. D. 4.9 4.2 NA 5.4 4.9 NAFemales x 20.1 21.5 NA 18.8 20.3 NAS. 0. 4.7 4.3 NA 5.2 5.0 NATotal x 20.6 22.1 22.3 19.4 20.9 21.2S. D. 4.8 4.4 4.2 5.3 5.0 4.9 .N Students 186,640 67,346 59.614 207,984 65,591 55.309P.C. Male 54 52 NA 50 49 NAN Colleges 34 34
* Not available
** Median S.D. for the group of colleges
** Percent
28

Conclusions
colleges are similar to those reported in Table 24, and that the population means for Levels II and IV are somewhat higher than reported.
If the data in Table 24 are reasonably satisfactory estimates of ACT statistics for the years, college levels, and student groups indicated, the following generalizations can be drawn.1. The decline in test scores has affected interested,
enrolled, and persisted students at all college levels.
2. The decline has been greater for women than for men at all college levels and for all student groups.
3. At all levels except Level I (the 2-year colleges), enrolled students have higher scores than interested students. The difference between enrolled and interested students is greatest and holding its own over time at Level IV colleges {doctoral- granting universities).
4. At all levels, persisted students have higher scores than enrolled students. The greatest difference between persisted and enrolled students is at Levels I (2-year) and II (baccalaureate-grant- ing) colleges. A sizable difference is continuing at Level I colleges, but is recent at Level II colleges.
5. The variability of test scores is increasing for all student groups in all levels.
6. The percentage of women has increased over the years in all student groups, but the increase is most marked in Level I (2-year) colleges.
To give a specific answer to the question posed at the beginning of this section, we conclude that colleges have responded to declining test scores by adapting. Colleges at all levels are today enrolling and retaining students with lower admissions test scores than previously, although there are differences in the magnitude in which this is occurring among college levels and undoubtedly among colleges within a level. That the colleges are adapting is clear, but how and how successfully the colleges are adapting to today’s students are interesting questions which unfortunately go beyond the data available to us.
Altogether, the number of enrolled college students for which we had data for 1974-75 for Levels I, II, III, and IV colleges was, respectively, 109,835, 64,954, 96,917 and 134,320, and the number of colleges, again by level, was 431, 337, 189, and 112. Except for Levels I and III where both samples yielded about the same statistics, the ACT Composite means for colleges in the% 1974-75 Class Profile Service were up to .5 higher than those reported in Table 20.
We have reviewed a considerable amount of information in this report. Perhaps we can briefly restate the most salient points.1. There is evidence that today we have a different
group, of people writing college admissions tests. As contrasted with several years ago, today there are more low scoring ACT-tested students and about the same number of high scoring students. Many of these low scoring students are women. In fact there has been considerable decline in ACT score averages for women, with less decline for men. At the same time more women are writing the ACT tests. These women, in turn, are attending 2-year colleges. This suggests that at least some of the ACT test score decline could be due to different people taking the test today in comparison with several years ago.
2. There is also evidence that our current test takers are less well prepared. Students in the elementary and secondary school today are showing lower scores on achievement tests than their counterparts of five and ten years ago. At the same time there is preliminary evidence that in recent years the ACT tests, and presumably, other achievement tests, are assessing school and college curricula about as adequately as before.
3. The decline in ACT scores would seem to be attributable at some times to different people taking the tests, and at other times to the test takers being less well prepared.
4. Colleges and universities have adapted to declining admissions test scores. At all levels, colleges today are enrolling and retaining students with lower ACT test scores than previously.
At the conclusion of a preliminary study on a popular topic— and this study is certainly that—some final remarks are in order. We are at the point where declining test scores for a state or school district is a news-worthy item. So interested is the public that frequently the story makes the front page of newspapers. The articles, however, are usually short on facts and long on opinions.
The greatest barriers to intelligent fact-finding and discussion are undoubtedly ideology and vested interests. Anti-education and pro-education ideologies come into play. Education critics who see current education practice as basically wrong use declining scores to blame educators and the schools. At the other extreme some educators react defensively, wishing to protect the schools. At the worst they conceal data descriptive of the facts, at the best they indiscrim inantly blame parents, TV, and other factors external to the schools. Some testing agencies them
29

selves are protective of their tests, and assert before any investigation has occurred that whatever should be blamed for declining scores they are certain it is not the tests. It did not help interests of fact-finding or open discussion that when stories of declining admissions scores first appeared in newspapers, it was generally with the implication that something was wrong with the schools. A major question is whether or not anti-education feeling today is so crystallized and become so adamant that the general environment does not permit open discussion of the facts. This does not seem to be the case, in the writer’s opinion.
To raise the level of discussion at this point, it would be helpful if commentators first gathered facts about the subject before they assessed blame and paraded their opinions about what is wrong with the
world. Not only should facts form educated opinion, but the opinion itself should be amenable to further fact-gathering and eventual confirmation, rejection, or revision. It likewise is not constructive to start blaming teachers, parents, or what have you. No matter where achievement scores are, we would like them higher. It is in the public interest at any time for schools to be more effective in helping youngsters learn.
We know enough about declining admissions test scores to realize that it is a complicated question. It is not, however, so complicated that we can never hope to understand it better than we do today. Our current understanding of the phenomenon is certainly incomplete, but on the basis of incomplete information knowledge develops. To make a beginning was the purpose of this report.
REFERENCES
The American College Testing Program. College student profiles: Norms for the ACT Assessment. Iowa City, Iowa: Author, 1972.
The American College Testing Program. Technical report for the ACT Assessment Program. Iowa City, Iowa: Author, 1973.
De Lesseps, S. ‘Back to Basics’ movement gains. Iowa City Press Citizen, September 17, 1975. Iowa City, Iowa.
Feldt, L. S. Personal communication, 1975.
Ferguson, R. L., & Maxey, E. J. Trends in the academic performance of high school and college students. ACT Research Report No. 70. Iowa City, Iowa: The American College Testing Program, in press.
Hieronymus, A. N., & Lindquist, E. F. Manual for Administrators, Supervisors, and Counselors, Iowa Tests of Basic Skills Forms 5 and 6. Boston: Houghton Mifflin, 1974.
King, E. M., & Hieronymus, A. N. Canadian Tests of Basic Skills Manual for Administrators, Supervisors, and Counselors Forms 3 and 4. Ontario, Canada: Thomas Nelson & Sons Limited, 1974.
Maxey, E. J., Wimpey, L. M., Ferguson, R. L., & Hanson, G. R. Trends on selected items of the
ACT Assessment: 1970-71 to 1974-75. Unpublished Manuscript. Iowa City, Iowa: The American College Testing Program, Research and Development Division, 1975.
NAEP Newsletter, October 1975, Vol. VIII, No. 5.
Perry, D. K.t & Swanson, E. O. Decline in Minnesota college aptitude test scores. Decline in standardized test scores: A widespread phenomenon, by J. Fasold, M. Hall, and J. Impara, Oregon Department of Education, 1974.
Rever, P. R., & Kojaku, L. K. Access, attrition, test scores and grades of college entrants and persisted: 1965-1973. Paper read at the national meeting of the American Association of Collegiate Registrars and Admissions Officers, Minneapolis, 1975.
Scully, M. G. Drop in aptitude test scores is largest on record. Chronicle of Higher Education, September 15. 1975.
Swanson, E. O. Fashions in test scores. Minneapolis, MN: University of Minnesota, Student Counseling Bureau Review, September 1973, 23, p. 1.
U.S. Bureau of the Census. Current Population Reports, Population estimates. Washington, D.C.: United States Office of Education, 1973, 354, p. 25.
30

APPENDIX A

Appendix A
Mean ACT Composite Scores by Region & Sex1970-71 through 1974-75
MALES FEMALESOverall* Overall
W estern States 1970-71 1971-72 1972-73 1973-74 1974-75 Change 1970-71 1971-72 1972-73 1973-74 1974-75 Change
1. Means 19.8 20.0 20.3 20.0 19.8 0 18.7 18.6 18.9 18.2 17.9 - .8Percents** 48 48 48 46 46 52 52 52 54 54
2. Means 19.9 20.4 20.5 20.4 20.2 + .3 19.4 19.5 19.4 19.0 18.4 -1 .0Percents 49 48 47 47 48 51 52 53 53 52
3. Means 20.3 20.7 20.6 20.6 20.4 + .1 19.1 19.2 19.3 18.8 18.4 - .7Percents 49 47 47 44 45 51 53 53 56 55
4. Means 21.2 21.6 21.6 21.3 20.9 - .3 20.2 20.7 20.4 20.0 19,4 - .8Percents 49 48 48 46 45 51 52 52 54 55
5. Means 19.6 20.0 20.3 20.0 20.1 + .5 18.8 18.5 18,6 18.3 17.9 - .9Percents 52 50 48 47 47 48 50 52 53 53
6. Means 18.9 18.9 19.1 18.8 18.4 - .5 18.1 17,9 17.5 17.1 16.5 -1 .6Percents 49 49 48 47 45 51 51 52 53 55
7. Means 20.7 21.2 21.3 21.6 20.8 + .1 20.2 20.1 19.9 19.8 19.0 -1 .2Percents 50 49 48 47 45 50 51 52 53 55
8. Means 20.1 20.5 20.4 20.3 19.8 - .3 18.6 18,9 18.6 18.2 17.7 - .9Percents 48 48 45 46 46 52 52 55 54 54
Median Change +.1 - .9
Southern States
i Means 18.6 18.5 18.7 18.7 18.1 - ,5 18.0 17.5 17.4 17.1 164 -1 .6Percents 49 49 48 46 45 51 51 52 54 55
Means 188 19.0 19.2 19.5 19.4 +.6 18.0 18.2 17.9 17.8 17.5 - .5Percents 49 48 47 46 45 51 52 53 54 55
Means 18.8 18.8 19.0 19.0 18.8 0 18.3 18.0 18.0 17.7 17.2 - .9Percents 50 48 49 47 46 50 52 51 53 54
Means 18.5 18.4 18.3 18.3 18.0 - .5 17.8 17.5 17.4 16.9 16.4 -1 .4Percents 50 48 48 46 46 50 52 52 54 54
Means 16.8 16.8 17.0 17.1 16.6 - .2 15.9 15.0 15.9 15.8 15.2 - .7Percents 47 47 46 45 44 53 53 54 55 56
Means 18.7 18.7 188 18.9 18.4 - .3 18.1 17,8 17.9 17.4 16.7 -1 .4Percents 50 49 48 46 46 50 51 52 54 54
Means 18.1 18.2 18.3 18.3 18.0 - .1 17.8 17.6 17.6 17.3 16.7 -1 .1Percents 48 47 45 44 43 52 53 55 56 57
Means 19.0 19.1 19.3 19.2 19,0 0 18,5 18.2 18.3 17.8 17.5 -1 .0Percents 51 50 49 48 47 49 50 51 52 53
Median Change - .2
North Central States
1. Means 20.3 20.3 20.5 20.1 19.8 - .5 19.8 19.4 19.3 18.6 18.1 -1 .7Percents 50 49 49 48 47 50 51 51 52 53
2. Means 21.9 22 .3 22.5 22.1 21.9 0 21.6 21.7 21.6 20.9 20.4 -1 .2Percents 49 49 46 46 45 51 51 54 54 5S
3. Means 20.5 20.6 20.5 20.4 20.0 - .5 19.6 19.5 19.4 19.0 182 -1 .6Percents 49 49 49 47 46 51 51 51 53 54
4. Means 19.4 19.9 20.6 20.4 20.2 + .8 18.9 18.9 19.5 18.8 18,3 - .6Percents 49 47 46 46 46 51 53 54 54 54
5. Means 21.6 21.B 21.9 22.1 21.5 - .1 20.9 20.9 20.9 20.6 20.0 - .9Percents 48 47 47 46 47 52 53 53 54 53
6. Means 20.6 20.5 20.7 20.8 20.3 - .3 19.9 19.7 19.7 19.3 18.7 -1 .2Percents 51 50 48 46 45 49 50 52 54 55
7. Means 21.0 20.9 20.9 21.4 21.3 + .3 20.1 20.3 20.2 20.2 19.7 - .4Percents 46 47 46 45 46 54 53 54 55 54
8. Means 20.5 20.5 20.5 20.4 20.1 - .4 19.9 19.6 19.5 19.0 18,5 -1 .4Percents 52 51 50 49 47 48 49 50 51 53
9. Means 21.0 21.0 21.2 21.3 20.9 - .1 20.1 20.1 20.0 19.8 19.2 - .9Percents 48 47 47 46 45 52 53 53 54 55
10. Means 19.9 19.7 19.9 19.7 19.5 - .4 19.6 19.4 19.1 18.9 18.0 -1 .6Percents 49 48 47 47 46 51 52 53 53 54
Median Change - .2 -1 .2
* Change from 1970-71 to 1974-75.
** The percent o( males or females for ACT-tested students lor a particular state and year.
NOTE: N-coun(s lor the various slates are not reported in order to assure the anonymity of the slates. A state was included only if the number of students tested were sizable and had remained fairly stable over the 5-year period.
32

ACT Research Reports
This report is N um ber 71 in a series published by the Research and Development D ivision of The American College Testing Program. The firs t 26 Research Reports have been deposited w ith the American D ocum entation Institute, ADI Auxilia ry Publications Project, Photodup lica tion Service, L ib rary o f Congress, W ashington, D.C. 20540. Photocopies and 35 mm. m icrofilm s are available at cost from ADI; o rder by ADI D ocum ent num ber. Advance payment is required. Make checks or money orders payable to : Chief, Photodup lica tion Service, L ib rary o f Congress. Research Reports No. 27 through No. 59 have been deposited w ith the N ational A ux ilia ry Publications Service of the American Society fo r In form ation Science (NAPS), c /o M icro fiche P ublications, 440 Park Avenue South, New York, New York 10016. Photocopies and 35 mm. m icrofilm s are available at cost from NAPS. O rder by NAPS Docum ent number. Advance payment is required. Beginning w ith No. 60, the ACT Research Reports have been abstracted by the Educational Resources Inform ation Center (ERIC) C learinghouse System. Printed copies o f m ost o f the reports may be obta ined from ACT Publications, P.O. Box 168, Iowa City, Iowa 52240, at a cost o f $1.00 per copy. Check o r m oney order m ust accom pany request.
The reports in this series published since O ctober 1970 are listed below. A com plete list can be obtained from ACT Publications.
No. 37. Practices and O utcom es o f V ocationa l-Technica l Education in Technical and C om m unity Colleges, by T. G. Gartland, & J. F. C arm ody (NAPS No. 01441; photo, $6.80; m icro film , $2.00)
No. 38 Bayesian C onsiderations in Educational In fo rm ation Systems, by M. R. Novick (NAPS No. 01442; photo, $5.00; m icro film , $2.00)
No. 39 In teractive Effects o f Achievem ent O rien ta tion and Teaching Style on Academ ic Achievem ent, by G. Domino (NAPS No. 01443; photo, $5.00; m icro film , $2.00)
No. 40 An Analysis o f the S tructure o f Vocational Interests, by N. S. Cole, & G. R. Hanson (NAPS No. 01444; photo, $5.00; m icro film , $2.00)
No. 41 How Do C om m unity College Transfer and O ccupationa l Students D iffe r? by E. J. Brue, H. B. Engen, & E. J. Maxey (NAPS No. 01445; photo, $5.50; m icro film , $2.00)
No. 42 App lica tions o f Bayesian Methods to the Pred iction o f Educationa l Performance, by M. R. Novick, P. H. Jackson, D. T. Thayer, & N. S. Cole (NAPS No. 01544; photo, $5.00; m icro film , $2.00)
No. 43 Toward More Equitable D is tribu tion o f College S tudent A id Funds: Problems in Assessing S tudent Financial Need, by M. D. O rw ig (NAPS No. 01543; photo, $5.00; m icro film , $2.00)
No. 44 Converting Test Data to C ounseling In fo rm a tion , by D. J. P rediger (NAPS No. 01776; photo, $5.00; m icrofiche, $2 .00)
No. 45 The A ccuracy o f Se lf-R eport In fo rm ation C o llected on the A C T Test Battery: H igh School Grades and Items of N onacadem ic Achievem ent, by E. J. Maxey, & V. J. Orm sby (NAPS No. 01777; photo, $5.00; m icrofiche, $2.00)
No. 46 Correlates o f S tudent Interest in Socia l Issues, by R. H. Fenske, & J. F. C arm ody (NAPS No. 01778; photo, $5.00; m icrofiche, $2.00)
No. 47 The Im pact o f College on S tudents ' Com petence to Function in a Learning Society, by M. H. Walizer, & R. E. H errio tt (NAPS No. 01779; photo, $5.00; m icrofiche, $2.00)
No. 48 E nro llm ent P ro jection Models fo r Ins titu tiona l P lanning, by M. D. O rw ig, P. K. Jones, & O. T. Lenning (NAPS No. 01780; photo, $5.00; m icro fiche, $2.00)
No. 49 On M easuring the Vocational Interests o f Women, by N. S. Cole (NAPS No. 02071; photo, $5.00; m icrofiche, $1.50)
No. 50 Stages in the D evelopm ent o f a B lack Identity, by W. S. Hall, R. Freedle, & W. E. Cross, Jr. (NAPS No. 02072; photo, $5.00; m icro fiche, $1.50)
No. 51 Bias in Selection, by N. S. Cole (NAPS No. 02073; photo, $5.00; m icrofiche, $1.50)
No. 52 Changes in Goals, Plans, and Background Characteristics o f C ollege-Bound H igh Schoo l Students, by J. F. Carm ody, R. H. Fenske, & C. S. Scott (NAPS No. 02074; photo, $5.75; m icro fiche, $1.50)
No: 53 Toward an In tegration o f Theory and M ethod fo r C riterion-Referenced Tests, by R. K. Hambleton, & M. R. Novick (NAPS No. 02075; photo, $5.00; m icrofiche, $1.50)
No. 54 College S tudent M igration, by R. H. Fenske, C. S. Scott, & J. F. Carm ody (NAPS No. 02215; photo, $5.00; m icrofiche, $1.50)
No. 55 Predictions o f Perform ance in Career Education, by M. R. Novick, P. K. Jones, & N. S. Cole (NAPS No. 02216; photo, $5.00; m icro fiche, $1.50)
33

No. 56 Predictors o f G raduation from College, by E. N icholson (NAPS No. 02217; photo, $5.00; m icrofiche, $1.50)
No. 57 S chooling and Subsequent Success: In fluence o f A b ility , Background, and Form al Education, by L. C. Solmon (NAPS No. 02218; photo, $5.00; m icro fiche, $1.50)
No. 58 Common Fallacies abou t Heredity, Environm ent, and Human Behavior, by A. Anastasi (NAPS No. 02220; photo, $5.00; m icro fiche, $1.50)
No. 59 A S tudy o f the College Investm ent Decision, by W. W. M cM ahon, & A. P. W agner (NAPS No. 02219; photo, $5.00; m icro fiche, $1.50)
No. 60 Im plem entation o f a Bayesian System fo r D ecision Analysis in a Program o f Ind iv idua lly Prescribed Instruction, by R. L. Ferguson, & M. R. Novick
No. 61 Nationw ide S tudy o f S tudent Career Developm ent: Sum m ary o f Results, by D. J. Prediger, J. D. Roth, & R. J. Noeth
No. 62 Varieties o f A ccom plishm ent a fter College: Perspectives on the Meaning o f Academ ic Talent, by L. A. Munday, & J. C. Davis
No. 63 Patterns o f C oncentration in Large Foundations ' Grants to U.S. Colleges and Universities, by R. Colvard, & A. M. Bennett
No. 64 Vocational Choice Change Patterns o f a N ationa l Sample o f C om m un ity-Jun io r College Students, by C. S. Scott, R. H. Fenske, & E. J. Maxey
No. 65 Considerations and Procedures in N a tiona l N orm ing: An Illus tra tion Using the A C T Assessment o f Career Developm ent and A C T Career P lanning Program, Grades 8-11, by D. L. Bayless, J. W. Bergsten, L. H. Lewis, & R. J. Noeth
No. 66 The Measurement o f E conom ic W ell-Being in Need Analysis Models, by W. J. Goggin
No. 67 Assessing the Career Interests o f College Youth: Sum m ary o f Research and Applications, by G. R. Hanson
No. 68 Sex-Role Socia lization and Em ploym ent Realities: Im p lications fo r Vocational Interest Measures, by D. J. Prediger,& N. S. Cole
No. 69 Predictive Valid ity o f the A C T Tests at Selective Colleges, by O. T. Lenning
No. 70 Trends in the Academ ic Performance o f H igh Schoo l and College Students, by R. L. Ferguson, & E. J. Maxey
34


![The Drugs Act, 1976 - Federal Investigation Agency 1 of 32 THE DRUGS ACT, 1976 (XXXI OF 1976) [11th May, 1976] An Act to regulate the import, export, manufacture, storage, distribution](https://img.pdfslide.us/doc/110x75/5aba2cf47f8b9a684c8eb828/the-drugs-act-1976-federal-investigation-1-of-32-the-drugs-act-1976-xxxi-of.jpg)
![THE REGIONAL RURAL BANKS ACT, 1976 ACT NO. …mahagramin.in/Downloads/rrb_act_1976.pdfTHE REGIONAL RURAL BANKS ACT, 1976 ACT NO. 21 OF 1976 [9th February, 1976.] An Act to provide](https://img.pdfslide.us/doc/110x75/5b1f48587f8b9ab2148b45fa/the-regional-rural-banks-act-1976-act-no-regional-rural-banks-act-1976-act-no.jpg)

![CHAPTER 71 ENVIRONMENT PROTECTION ACT Act 9 of 1994€¦ · 1994 ed] environment protection act [cap 71 chapter 71 environment protection act act 9 of 1994 arrangement of sections](https://img.pdfslide.us/doc/110x75/5f79512c18be526dd12a071d/chapter-71-environment-protection-act-act-9-of-1994-ed-environment-protection-act.jpg)
![THE REGIONAL RURAL BANKS ACT, 1976 ARRANGEMENT OF … · 3 THE REGIONAL RURAL BANKS ACT, 1976 ACT NO. 21 OF 1976 [9th February, 1976.] An Act to provide for the incorporation, regulation](https://img.pdfslide.us/doc/110x75/5e9a1fd73460944d7818ffd8/the-regional-rural-banks-act-1976-arrangement-of-3-the-regional-rural-banks-act.jpg)