Embed Size (px)
Citation preview

7/27/2019 ACT Minnesota 2013
http://slidepdf.com/reader/full/act-minnesota-2013 1/20
TheCondition
of College& CareerReadiness2013Minnesta
7/27/2019 ACT Minnesota 2013
http://slidepdf.com/reader/full/act-minnesota-2013 2/20
19878
© 2013 by ACT, Inc. A rihts reserved. The ACT® coee readiness assessment and ACT WorkKeys® are reistered trademarkso ACT, Inc., in the U.S.A . and other countries. The ACT Nationa Curricuum Survey ®, ACT Enae®, ACT Expore®, ACT Pan®, and ACT QuaityCore®
are reistered trademarks o ACT, Inc. ACT Aspire™, Core Practice™ and the ACT Nationa Career Readiness Certicate™ are trademarks o ACT, Inc.
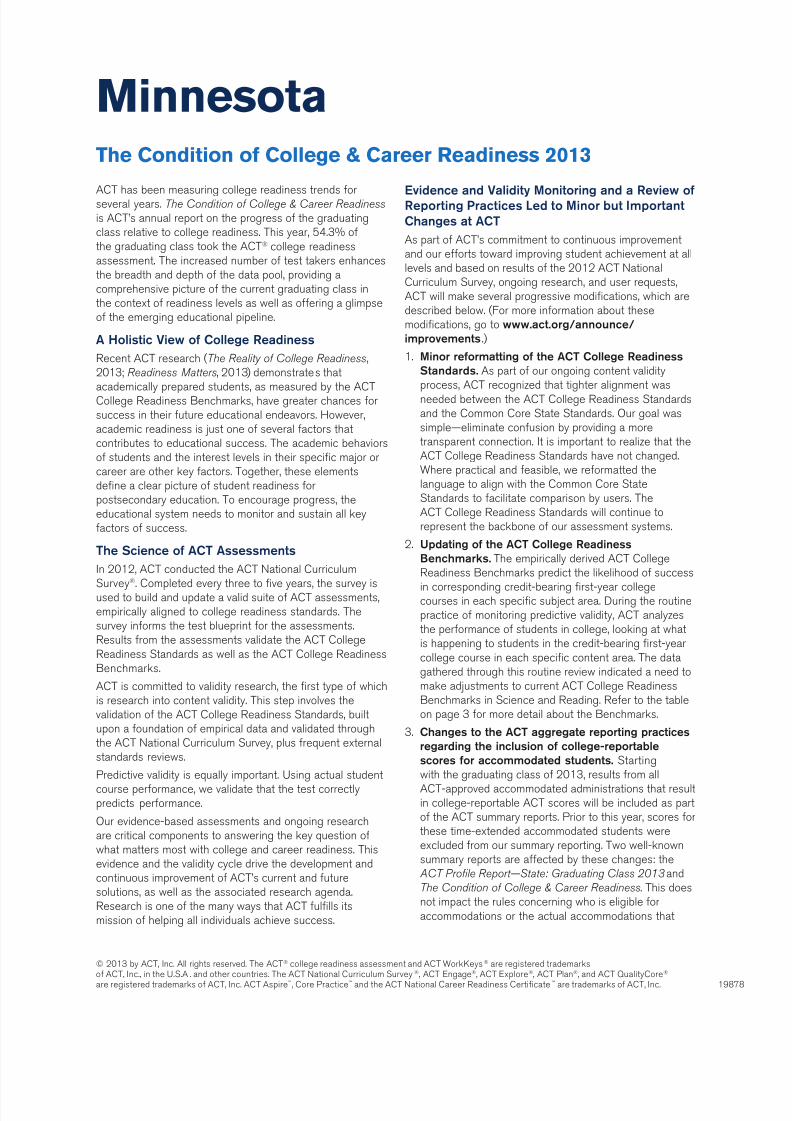
The Condition of College & Career Readiness 2013
ACT has been measurin coee readiness trends orsevera years. The Condition o College & Career Readiness
is ACT’s annua report on the proress o the raduatincass reative to coee readiness. This year, 54.3% othe raduatin cass took the ACT® coee readinessassessment. The increased number o test takers enhancesthe breadth and depth o the data poo, providin acomprehensive picture o the current raduatin cass inthe context o readiness eves as we as oerin a impseo the emerin educationa pipeine.
A Hlistic View Cllege Readiness
Recent ACT research (The Reality o College Readiness ,2013; Readiness Matters, 2013) demonstrates that
academicay prepared students, as measured by the ACTCoee Readiness Benchmarks, have reater chances orsuccess in their uture educationa endeavors. However,academic readiness is just one o severa actors thatcontributes to educationa success. The academic behaviorso students and the interest eves in their specic major orcareer are other key actors. Toether, these eementsdene a cear picture o student readiness orpostsecondary education. To encourae proress, theeducationa system needs to monitor and sustain a keyactors o success.
The Science ACT Assessments
In 2012, ACT conducted the ACT Nationa Curricuum
Survey®
. Competed every three to ve years, the survey isused to buid and update a vaid suite o ACT assessments,empiricay ained to coee readiness standards. Thesurvey inorms the test bueprint or the assessments.Resuts rom the assessments vaidate the ACT CoeeReadiness Standards as we as the ACT Coee ReadinessBenchmarks.
ACT is committed to vaidity research, the rst type o whichis research into content vaidity. This step invoves thevaidation o the ACT Coee Readiness Standards, buitupon a oundation o empirica data and vaidated throuhthe ACT Nationa Curricuum Survey, pus requent externastandards reviews.
Predictive vaidity is equay important. Usin actua student
course perormance, we vaidate that the test correctypredicts perormance.
Our evidence-based assessments and onoin researchare critica components to answerin the key question owhat matters most with coee and career readiness. Thisevidence and the vaidity cyce drive the deveopment andcontinuous improvement o ACT’s current and uturesoutions, as we as the associated research aenda.Research is one o the many ways that ACT us itsmission o hepin a individuas achieve success.
Evidence and Validity Mnitring and a Review Reprting Practices Led t Minr but ImprtantChanges at ACT
As part o ACT’s commitment to continuous improvementand our eorts toward improvin student achievement at aeves and based on resuts o the 2012 ACT NationaCurricuum Survey, onoin research, and user requests,ACT wi make severa proressive modications, which aredescribed beow. (For more inormation about thesemodications, o to www.act.rg/annunce/imprvements .)
1. Minr rermatting the ACT Cllege ReadinessStandards. As part o our onoin content vaidityprocess, ACT reconized that tihter ainment wasneeded between the ACT Coee Readiness Standardsand the Common Core State Standards. Our oa wassimpe—eiminate conusion by providin a moretransparent connection. It is important to reaize that theACT Coee Readiness Standards have not chaned.Where practica and easibe, we reormatted theanuae to ain with the Common Core StateStandards to aciitate comparison by users. TheACT Coee Readiness Standards wi continue torepresent the backbone o our assessment systems.
2. Updating the ACT Cllege ReadinessBenchmarks. The empiricay derived ACT CoeeReadiness Benchmarks predict the ikeihood o success
in correspondin credit-bearin rst-year coeecourses in each specic subject area. Durin the routinepractice o monitorin predictive vaidity, ACT anayzesthe perormance o students in coee, ookin at whatis happenin to students in the credit-bearin rst-yearcoee course in each specic content area. The dataathered throuh this routine review indicated a need tomake adjustments to current ACT Coee ReadinessBenchmarks in Science and Readin. Reer to the tabeon pae 3 or more detai about the Benchmarks.
3. Changes t the ACT aggregate reprting practicesregarding the inclusin cllege-reprtablescres r accmmdated students. Startinwith the raduatin cass o 2013, resuts rom a
ACT-approved accommodated administrations that resutin coee-reportabe ACT scores wi be incuded as parto the ACT summary reports. Prior to this year, scores orthese time-extended accommodated students wereexcuded rom our summary reportin. Two we-knownsummary reports are aected by these chanes: the ACT Profle Report—State: Graduating Class 2013 andThe Condition o College & Career Readiness. This doesnot impact the rues concernin who is eiibe oraccommodations or the actua accommodations that
Minnesota

7/27/2019 ACT Minnesota 2013
http://slidepdf.com/reader/full/act-minnesota-2013 3/20
3MINNESoTA
How Does ACT Determine if Students Are College Ready?
The ACT Coee Readiness Benchmarks are scores on the ACT subject area tests that represent the eve o achievementrequired or students to have a 50% chance o obtainin a B or hiher or about a 75% chance o obtainin a C or hiher incorrespondin credit-bearin rst-year coee courses. Based on a nationay stratied sampe, the Benchmarks are mediancourse pacement vaues or these institutions and represent a typica set o expectations. The ACT Coee ReadinessBenchmarks are:
Cllege Curse Subject Area Testoriginal ACT Cllege
Readiness Benchmark Revised ACT Cllege
Readiness Benchmark
Enish Composition Enish 18 18
Socia Sciences Readin 21 22
Coee Aebra Mathematics 22 22
Biooy Science 24 23
are made. It simpy means that we are incudin theresuts or these students in our summary reports.
4. Future mdifcatins t the ACT. We are committedto a research-based sustainabiity mode that:
ensures vaidity
reviews test bueprints reuary
empoys a robust research and support aenda
eatures vaidated coee readiness benchmarkscores
ACT makes chanes ony ater a thorouh anaysis o userneed, couped with our commitment to the hihest-quaitytest deveopment. It is with this in mind that ACT is peasedto announce the deveopment o an onine administration othe ACT as we as optiona constructed-response questionsor the ACT. We have aready started deveopment, incudinitem testin, in preparation or a sprin 2015 aunch oin-schoo testin at the state, district, and schoo eves. Weare peased to ead with the cuttin-ede chanes that wiserve to redene the assessment industry.
Early Student Mnitring and Interventin
ACT research shows the importance o eary monitorino student achievement and appropriate interventions.Staying on Target (ACT, 2012) ound that students who aremonitored eary beore takin the ACT are more ikey to becoee and career ready than those not monitored eary(i.e., students who take the ACT ony), reardess o thehih schoo they attend and their eve o prior achievement.In act, students who are monitored eary are more ikey tomeet three or a our o the ACT Coee ReadinessBenchmarks than students who are not monitored eary,reardess o ender, race, or annua amiy income.The research ceary shows that these probems can beovercome by creatin an interated, onitudina, data-drivensystem to inorm and encourae coherence in schoo,district, and state eorts to prepare a hih schooraduates or coee and career. A students must asohave systematic uidance and eedback about theirproress and et that eedback eary and oten.
An Aligned, Cherent System
Startin in sprin 2014 with the aunch o ACT Aspire™,ACT wi provide an ained, coherent system that wi spanrades 3–12, ivin states, districts, and schoos a suite oopportunities. This new system ains to the ACT CoeeReadiness Standards, which aows monitorin andintervenin to take pace much earier and heps preparestudents to succeed at coee-eve work. Utimatey, this
system wi provide educators with assessment toos tointervene and et more students on the riht track tocoee and career success.
A Cmmitment t STEM
ACT is uniquey positioned to report on STEM (Science,Technooy, Enineerin, and Math) proress in the UnitedStates in severa vauabe ways. The rst is by assessinand reportin both Mathematics and Science abiity. Thesecond is our abiity throuh the ACT Interest Inventory onACT Expore®, ACT Pan®, and the ACT to determine thosestudents who have either an expressed or measuredinterest in STEM-reated majors or occupations. The charton pae 8 is ACT’s rst attempt to show academic abiity
reated to interest in STEM eds. We are currenty panninto reease nationa- and state-eve reports on STEM aterthis year.
Using This Reprt1
This report is desined to hep inorm the oowinquestions drivin nationa eorts to strenthen P–16education.
Are your students prepared or coee and career?
Are enouh o your students takin core courses?
Are your core courses riorous enouh?
Are your youner students on taret or coee andcareer?
What other dimensions o coee and career readiness,ike academic behaviors, shoud educators track?
How are educators trackin proress on STEMinitiatives?

7/27/2019 ACT Minnesota 2013
http://slidepdf.com/reader/full/act-minnesota-2013 4/20
4 THE CONDITION OF COllEgE & CAREER READINESS 2013
Attainment of College and Career Readiness
44,676 o your raduates,which is an estimated 74%
o your raduatin cass,
took the ACT.*
From 2009–2013, the
number o ACT test-takin
raduates has increased by
2.4%, whie the number o
raduates in your state has
decreased by 5.8%.
78 79 78 78 78
65 65 64 64
57
5761 62 62
62
3942 43 42 52
3235 36 36
39
0
20
40
60
80
100
2009 2010 2011 2012 2013
P e r c e n t
English Reading Mathematics Science All Four Subjects
Percent 2009–2013 ACT-Tested High Schl Graduates
Meeting ACT Cllege Readiness Benchmarks
Percent 2013 ACT-Tested High Schl Graduates MeetingCllege Readiness Benchmarks by Subject
78
57
62
52
39
64
44 44
36
26
0
20
40
60
80
100
English Reading Mathematics Science All FourSubjects
P e r c e n t
Minnesota Nation
Minnesota
* Totas or raduatin seniors wereobtained rom Knocking at the
College Door: Projections o High
School Graduates, 8th edition.© December 2012 by the WesternInterstate Commission or HiherEducation.
Note: Percents in this report may notsum to 100% due to roundin.

7/27/2019 ACT Minnesota 2013
http://slidepdf.com/reader/full/act-minnesota-2013 5/20
5
Met 1
Benchmark
13%
Met 2
Benchmarks
15%
Met 3
Benchmarks
17%
Met All 4
Benchmarks
39%
Met No
Benchmarks
16%
Percent 2013 ACT-Tested High Schl Graduates by
Number ACT Cllege Readiness Benchmarks Attained
Percent 2013 ACT-Tested High Schl Graduates byBenchmark Attainment and Subject
78
57 6252
8
149
19
14
28 28 29
0
20
40
60
80
100
English Reading Mathematics Science
P e r c e n t
Below Benchmarkby 3+ Points
Within 2 Pointsof Benchmark
Met Benchmark
MINNESoTA
Near Attainment of College and Career Readiness

7/27/2019 ACT Minnesota 2013
http://slidepdf.com/reader/full/act-minnesota-2013 6/20
6 THE CONDITION OF COllEgE & CAREER READINESS 2013
5 3 3 4 4
22 2
3 3
8182 80 78 77
2 23 4 4
5 5 6 6 6
1 1 14 5 5 5 5
0
20
40
60
80
100
2009 2010 2011 2012 2013
P e r c e n t
African American
American Indian
Asian
Hispanic
Pacific Islander
White
Two or More RacesNo Response
Participation and Opportunity
Over the past decade, ACT hasexperienced unprecedented
rowth in the number o
students tested, as we as
statewide partnerships in
13 dierent states and in many
districts across the country. As
a resut, the 2013 Condition o
College & Career Readiness
report provides a much deeper
and more representative
sampe in comparison to apurey se-seected
coee-oin popuation.
Percent 2009–2013 ACT-Tested High Schl Graduates
Meeting Three r Mre Benchmarks by Race/Ethnicity*
14 1517 16 16
30
36
3130
29
3336
3436 36
33
29
3234
32
45
22
34
5559 60 59
61
0
20
40
60
80
100
2009 2010 2011 2012 2013
P e r c e n t
AfricanAmerican
AmericanIndian
Asian Hispanic PacificIslander
White
Percent 2009–2013 ACT-Tested High Schl Graduatesby Race/Ethnicity*
Minnesota
Note: less than 0.5% wi not appear.
* Race/ethnicity cateorieschaned in 2011 to refect updatedUS Department o Educationreportin requirements.2

7/27/2019 ACT Minnesota 2013
http://slidepdf.com/reader/full/act-minnesota-2013 7/20
7
Percent 2013 ACT-Tested High Schl Graduates Meeting CllegeReadiness Benchmarks by Race/Ethnicity and Subject*
78
84
66
55
53
56
39
AllStudents
White
PacificIslander
Hispanic
Asian
AmericanIndian
AfricanAmerican
English
57
62
40
39
35
36
23
AllStudents
White
PacificIslander
Hispanic
Asian
AmericanIndian
AfricanAmerican
62
68
46
40
51
36
22
AllStudents
White
PacificIslander
Hispanic
Asian
AmericanIndian
AfricanAmerican
Mathematics
Reading
52
57
40
30
34
28
15
AllStudents
White
PacificIslander
Hispanic
Asian
AmericanIndian
AfricanAmerican
Science
MINNESoTA
Participation and Opportunity by Subject
* Race/ethnicity cateorieschaned in 2011 to refect updatedUS Department o Educationreportin requirements.2

7/27/2019 ACT Minnesota 2013
http://slidepdf.com/reader/full/act-minnesota-2013 8/20
8 THE CONDITION OF COllEgE & CAREER READINESS 2013
78
58
63
54
62
49
18
25
0
20
40
60
80
100
English Reading Mathematics Science
P e r c e n t
Core or More Less Than Core
Course-Taking Patterns and Benchmark Performance
Within subjects, ACT hasconsistenty ound that
students who take the
recommended core curricuum
are more ikey to be ready or
coee or career than those
who do not. A core curricuum
is dened as our years o
Enish and three years each o
mathematics, socia studies,
and science.3
Percent 2013 ACT-Tested High Schl Graduates inCre r Mre vs. Less Than Cre Curses MeetingACT Cllege Readiness Benchmarks by Subject
Minnesota
70
57 57
41
59
44
33
21
0
20
40
60
80
100
English Reading Mathematics Science
P
e r c e n t
STEM (11.6%) Non-STEM (88.4%)
Percent Meeting ACT Cllege Readiness Benchmarks byNatinal Science Fundatin STEM Status
A First look at STEM
This chart depicts ACT Coee
Readiness Benchmark
attainment by student interest
in STEM majors/occupations,
as dened by the Nationa
Science Foundation, rom
the 2010–2012 nationa
ACT-tested raduatin casses(N = 1,167,221). ACT pans
to reease a report on the
condition o the STEM pipeine
in 2013.

7/27/2019 ACT Minnesota 2013
http://slidepdf.com/reader/full/act-minnesota-2013 9/20
9
Early Preparation
ACT research shows that youner students who take riorous curricua are moreprepared to raduate rom hih schoo ready or coee or career. Moreover, our research
(The Forgotten Middle, 2008) ound that “the eve o academic achievement that students
attain by 8th rade has a arer impact on their coee and career readiness by the time
they raduate rom hih schoo than anythin that happens academicay in hih schoo.”
75
54
46
33
14
23
24
20
11
2431
47
0
20
40
60
80
100
English Reading Mathematics Science
P e r c e n t
Below Benchmarkby 3+ Points
Within 2 Pointsof Benchmark
Met Benchmark
Percent 2012–2013 ACT Plan®–Tested 10th Graders Meeting ACT Cllege Readiness Benchmarks(N = 55,138)
70
53 52
26
16
24 23
18
14
23 24
56
0
20
40
60
80
100
English Reading Mathematics Science
P e r c e n t
Below Benchmarkby 3+ Points
Within 2 Pointsof Benchmark
Met Benchmark
Percent 2012–2013 ACT Explre®–Tested 8th Graders Meeting ACT Cllege Readiness Benchmarks(N = 43,186)
MINNESoTA
Met 1
Benchmark 18%
Met 2
Benchmarks
19%
Met 3
Benchmarks
16%
Met All 4
Benchmarks
25%
Met No
Benchmarks
21%
Met 1
Benchmark
16%
Met 2
Benchmarks
18%
Met 3
Benchmarks
20%
Met All 4
Benchmarks
22%
Met No
Benchmarks
24%

7/27/2019 ACT Minnesota 2013
http://slidepdf.com/reader/full/act-minnesota-2013 10/20
10 THE CONDITION OF COllEgE & CAREER READINESS 2013
Minnesota
12
10 10 109
7 7
2
5
2
0
5
10
15
20
25
Education CommunityServices
Computer/InformationSpecialties
Management Marketing/Sales
P e r c e n t
Job Openings
Career Interests
Other College and Career Readiness Factors
ACT has ound severa othersubstantia actors that impact
coee and career readiness
or students. They incude
career and educationa
pannin and the academic
behaviors o students.
75 7478
63
74
5254
60
42
525248
73
5053
42 42
63
38
43
0
20
40
60
80
100
Education CommunityServices
Computer/InformationSpecialties
Management Marketing/Sales
P e r c e n t
English Reading Mathematics Science
Percent 2013 ACT-Tested High Schl Graduates with CareerInterests in Jbs Calling r a Tw-Year Degree r Mre in theState’s Five Fastest-Grwing Career Fields4
Percent 2013 ACT-Tested High Schl Graduates Interested
in High-Grwth Careers Meeting ACT Cllege ReadinessBenchmarks by Subject
Preparation for Careersin High-Growth Fields
Many students who are
interested in these career
areas a short o meetin
ACT Coee Readiness
Benchmarks, suestin that
they are not on the riht path
to take advantae o career
opportunities in these
hih-rowth eds.

7/27/2019 ACT Minnesota 2013
http://slidepdf.com/reader/full/act-minnesota-2013 11/20
11
Academic Achievement and Academic Behaviors: Both Matter
32
56
3
8
0
20
40
60
80
100
Graduate/Professional
Degree
Bachelor’sDegree
Associate’s/Voc-tech Degree
Other/NoResponse
P e r c e n t
Aligning Student Behaviors, Planning,and Aspirations
Most students aspire to a
post–hih schoo credentia.
To hep them meet those
aspirations, educationa
pannin, monitorin, and
interventions must be ained
to their aspirations, bein eary,
and continue throuhout their
educationa careers.
Percent 2013 ACT-Tested High Schl Graduates byEducatinal Aspiratins
13
20
3127
46
69
49
64
83
0
20
40
60
80
100
0 Benchmarks 1 or 2 Benchmarks 3 or 4 Benchmarks
P e r c e n t E n r o l l e d
Low Graduation Index Moderate Graduation Index High Graduation Index
MINNESoTA
First-Year Cllege Enrllment Rates by 8th GradeACT Explre Benchmarks and ACT Engage®
Graduatin Index Level*
ACT research iustrates the importanceo combinin measures o academic
achievement and behavior to obtain a morehoistic picture o students, incudin theirikeihood o enroin in coee oowinhih schoo raduation. Since thisinormation can be avaiabe in middeschoo, it aows or eary identication ostudents who may be ess ikey tocompete hih schoo and o to coee.These students can be enaed ininterventions that can assist them toprepare or the transition to postsecondaryeducation or work ater hih schoo.
Across a ACT Expore Benchmark
attainment eves, students with hiherACT Enae graduation Index scores(which are based on a combination oACT Enae scae scores and otherse-reported student inormation) enroedin a postsecondary institution ater hihschoo at substantiay hiher rates thanstudents with ower ACT Enaegraduation Index scores.
Other College and Career Readiness Factors
* Based on N = 3,356 8th raders in 24 midde schoos across thecountry who took ACT Expore and ACT Enae grades 6–9. Thesedata do not refect the 2013 ACT-tested hih schoo raduate cohortrom your state.

7/27/2019 ACT Minnesota 2013
http://slidepdf.com/reader/full/act-minnesota-2013 12/20
12 THE CONDITION OF COllEgE & CAREER READINESS 2013
Minnesota Academic Achievement and Academic Behaviors: Both Matter
Academic achievement is essentia but not theony actor in determinin coee and career
readiness. Students aso need to have the
behaviora skis (e.., oa settin, workin
with others, oowin rues) to succeed
beyond hih schoo or postsecondary
education. Over the past 10 years, ACT
research has ocused on the behavior domains
that are essentia or success across a variety
o settins, incudin schoo and work. These
domains incude motivation, socia
enaement, and se-reuation.Mtivatin: Persona characteristics that hep
students to succeed academicay by ocusin
and maintainin eneries on oa-directed
activities. Behaviors in this domain are
important or maintainin the eve o eort
required to achieve ood rades.
Scial Engagement: Interpersona actors
that infuence students’ successu interation
into their environment. Behaviors in this
domain are reated to participation andenaement in socia and community
activities, such as extracurricuar activities.
Sel-Regulatin:The thinkin processes and
emotiona responses o students that overn
how we they monitor, reuate, and contro
their behavior reated to schoo and earnin.
Behaviors in this domain are important or
oowin rues and maintainin ood conduct.
ACT Engage Grades 6–9 is a se-report
assessment used to measure the academicbehaviors noted above and determine
students’ persona strenths and weaknesses.
For more inormation about ACT Enae, see
www.act.rg/engage.
3944 43
4651
58
65 6771
80
0
20
40
60
80
100
1–9 10–19 20–29 30–39 40–49 50–59 60–69 70–79 80–89 90–99
P e r c e
n t R e p o r t i n g T w o o r M o r e A c t i v i t i e s
Social Engagement Score
Mean High Schl GPA by Mtivatin Scre*
Students Reprting Tw r Mre ExtracurricularActivities in High Schl by Scial Engagement Scre**
Average Number Disciplinary Events bySel-Regulatin Scre***
1.8 1.8
2.12.2
2.42.5
2.7 2.7
2.9
3.2
0.0
0.5
1.0
1.5
2.0
2.5
3.0
3.5
1–9 10–19 20–29 30–39 40–49 50–59 60–69 70–79 80–89 90–99
M e a n H i g h S c h o o l G P A
Motivation Score
2.9
2.3
2.0
1.6
1.2
0.9
0.7
0.50.4
0.3
0.0
0.5
1.0
1.5
2.0
2.5
3.0
3.5
1–9 10–19 20–29 30–39 40–49 50–59 60–69 70–79 80–89 90–99
M e a n D i s c i p l i n a r y E v e n t s
Self-Regulation Score
* Based on N = 3,949 students who took ACT Enae grades 6–9.** Based on N = 1,635 students who took ACT Enae grades 6–9.
*** Based on N = 16,234 students who took ACT Enae grades 6–9.
These data do not refect the 2013 ACT-tested hih schooraduate cohort rom your state.

7/27/2019 ACT Minnesota 2013
http://slidepdf.com/reader/full/act-minnesota-2013 13/20
Looking Back at the Class of 2012
Minnesota
Percent 2012 ACT-Tested High Schl Graduates byNumber ACT Cllege Readiness Benchmarks Attained
Percent 2012 ACT-Tested High Schl Graduates by
Number ACT Cllege Readiness Benchmarks Attainedand Fall 2012 Cllege Enrllment Status
Met 1
Benchmark
13%
Met 2
Benchmarks
17%
Met 3
Benchmarks
18%
Met All 4
Benchmarks
36%
Met No
Benchmarks
15%
35
13
7
42
5
52
26
26
0
20
40
60
80
100
Zero One Two Three Four
P e r c e n t
2-Year Public 4-Year Private 4-Year Other/Unknown
ACT College Readiness Benchmarks and Fall 2012 College Enrollment
Academic achievement, as
measured by ACT College
Readiness Benchmark
attainment, has a clear and
distinctive relationship with the
path taken by high school
graduates. Those who were
more academically ready were
more likely to enroll in 4-year
institutions. Graduates who
enrolled in 2-year colleges or
pursued other options after
high school were more likely to
have met fewer Benchmarks.
For the sizeable number of
2012 graduates who did not
meet any Benchmarks, their
post–high school opportunities
appear to have been limited
compared to their college-
ready peers.
13MINNESoTA

7/27/2019 ACT Minnesota 2013
http://slidepdf.com/reader/full/act-minnesota-2013 14/20
14 THE CONDITION OF COllEgE & CAREER READINESS 2013
State
Percent Graduates
Tested*
AverageCmpsite
Scre
PercentMeetingEnglish
Benchmark
PercentMeetingReading
Benchmark
PercentMeeting
MathBenchmark
PercentMeetingScience
Benchmark
Alabama 78 20.4 66 41 31 30
Alaska 37 21.1 65 48 48 38
Arizna 50 19.6 53 37 38 28
Arkansas 90 20.2 63 39 35 29
Calirnia 26 22.2 72 51 58 41
Clrad 100 20.4 62 42 39 36
Cnnecticut 27 24.0 86 66 68 56
Delaware 15 22.9 77 59 59 49
District Clumbia 38 20.4 54 43 39 33
Flrida 74 19.6 54 38 35 26
Gergia 51 20.7 64 43 38 33
Hawaii 40 20.1 56 37 43 30
Idah 49 22.1 74 54 52 43
Illinis 100 20.6 63 41 42 35
Indiana 38 21.7 70 51 53 41
Iwa 66 22.1 76 54 50 46Kansas 75 21.8 72 51 51 42
Kentucky 100 19.6 57 36 30 28
Luisiana 100 19.5 60 33 29 25
Maine 8 23.5 83 62 64 53
Maryland 21 22.3 73 54 54 45
Massachusetts 22 24.1 84 66 72 55
Michigan 100 19.9 57 37 35 33
Minnesta 74 23.0 78 57 62 52
Mississippi 95 18.9 54 29 21 20
Missuri 74 21.6 72 49 45 41Mntana 72 21.3 66 50 49 39
Nebraska 84 21.5 71 48 46 41
Nevada 32 21.3 66 48 47 37
New Hampshire 19 23.8 84 64 66 54
New Jersey 23 23.0 77 58 64 48
New Mexic 70 19.9 56 38 33 29
New Yrk 26 23.4 80 61 68 54
Minnesota2013 State Percent of High School GraduatesTested, Average Composite Score, and Percent
Meeting Benchmarks by Subject

7/27/2019 ACT Minnesota 2013
http://slidepdf.com/reader/full/act-minnesota-2013 15/20
15
State
Percent Graduates
Tested*
AverageCmpsite
Scre
PercentMeetingEnglish
Benchmark
PercentMeetingReading
Benchmark
PercentMeeting
MathBenchmark
PercentMeetingScience
Benchmark
Nrth Carlina 100 18.7 43 31 33 25
Nrth Dakta 98 20.5 61 41 43 35
ohi 72 21.8 71 51 49 44
oklahma 75 20.8 66 45 37 35
oregn 34 21.5 66 50 50 42
Pennsylvania 18 22.7 77 57 61 47Rhde Island 14 22.7 78 60 58 48
Suth Carlina 51 20.4 62 41 39 32
Suth Dakta 78 21.9 72 52 53 46
Tennessee 100 19.5 58 36 29 27
Texas 37 20.9 61 43 48 36
Utah 100 20.7 63 45 38 36
Vermnt 26 23.0 79 59 61 50
Virginia 26 22.6 76 57 57 47
Washingtn 21 22.8 75 58 60 49
West Virginia 63 20.6 69 45 33 34Wiscnsin 71 22.1 75 53 54 47
Wyming 100 19.8 55 39 33 30
Natinal 54 20.9 64 44 44 36
* Totas or raduatin seniors were obtained rom Knocking at the College Door: Projections o High School Graduates ,8th edition. © December 2012 by the Western Interstate Commission or Hiher Education.
MINNESoTA
2013 State Percent of High School GraduatesTested, Average Composite Score, and Percent
Meeting Benchmarks by Subject

7/27/2019 ACT Minnesota 2013
http://slidepdf.com/reader/full/act-minnesota-2013 16/20
16 THE CONDITION OF COllEgE & CAREER READINESS 2013
How to Increase College Readiness
Approximatey 31% o a 2013 ACT-tested hih schooraduates did not meet any o the ACT Coee ReadinessBenchmarks, meanin they were not preparedacademicay or rst-year coee courses in EnishComposition, Coee Aebra, Biooy, and socia sciences.There are steps that states, districts, schoos, andcassrooms can take to increase student readiness orcoee-eve work.
Essential Standards. Since ACT rst reeased Making the
Dream a Reality in 2008, we have caed or states to adopteducation standards that prepare a students or the riorso coee or career trainin prorams. With the adoption othe Common Core State Standards by 45 states and theDistrict o Coumbia, most states have taken that rst step
on the road to ensurin a students are ready or coee orcareer. It is imperative now that poicymakers andpractitioners continue this process by ainin a aspectso their systems to coee and career readiness.
Cmmn Expectatins. A states—especiay those thathave adopted the Common Core State Standards—shoudbe ainin coee and career readiness standards to ariorous core curricuum or a hih schoo studentswhether they are bound or coee or work. The eves oexpectation or coee readiness and workorce traininreadiness shoud be comparabe. To ensure studentsmaster the knowede and skis to succeed aterhih schoo, ACT supports the core curricuumrecommendations o A Nation at Risk: The Imperative or
Educational Reorm—specicay that students take a corecurricuum consistin o at east our years o Enish andthree years each o mathematics, science, and sociastudies.
Clear Perrmance Standards. States must dene“how ood is ood enouh” or coee and careerreadiness. In addition to a consistent, riorous set oessentia K–12 content standards, states must deneperormance standards so that students, parents, andteachers know how we students must perormacademicay to have a reasonabe chance o success atcoee or on the job. Based on decades o studentperormance data, ACT denes “coee readiness” as
students havin a 50% chance o earnin a rade o B orhiher or about a 75% chance o earnin a rade o C orhiher in rst-year coee Enish Composition; CoeeAebra; Biooy; or History, Psychooy, Sociooy,Poitica Science, or Economics.
Rigrus High Schl Curses.Havin appropriate andained standards, couped with a core curricuum, wi
adequatey prepare hih schoo students ony i thecourses are truy chaenin. That is, takin the riht kindso courses matters more than takin the riht number ocourses. Students who take a riorous core curricuumshoud be ready or credit-bearin rst-year coeecourses without remediation.
Early Mnitring and Interventin. We know rom ourempirica data that students who take chaenin curricuaare much better prepared to raduate hih schoo ready orcoee or career trainin opportunities. I students are tobe ready or coee or career when they raduate, theirproress must be monitored cosey so that deciencies in
oundationa skis can be identied and remediated eary,in upper eementary and midde schoo. In addition,ae-appropriate career assessment, exporation, andpannin activities that encourae students to consider andocus on personay reevant career options shoud be apart o this process so that students can pan theirhih schoo coursework accordiny.
Data-Driven Decisins. States have been hard at workdeveopin onitudina P–16 data systems—this work mustcontinue and acceerate. I states are serious aboutensurin more o their students are prepared or coeeand work in the 21st century, they must deveop systemsthat aow schoos and districts to cosey monitor studentperormance at every stae o the earnin pipeine, rom
preschoo throuh the eementary, midde, and hih schoorades, a the way throuh coee. Use o a onitudinadata system enabes educators to identiy students whoare in need o academic interventions at an eary stae,thus ivin teachers and students more time to strenthenthese skis beore raduation. lonitudina data systemsprovide a too to schoos to ensure a their students takeand compete the riht number and kinds o courses beoreraduation. Usin a onitudina assessment system asopermits schoos to determine the vaue added by each corecourse in hepin students to become ready or coee andcareer. Such systems aow coees to oer eedbackreports to hih schoos that examine how we preparedeach hih schoo’s raduates are or coee. These reportscan be used to strenthen hih schoo curricua.
Policies and Practices

7/27/2019 ACT Minnesota 2013
http://slidepdf.com/reader/full/act-minnesota-2013 17/20
17
District, School, and Classroom Practices
The Path t Readiness: It Takes a SystemResearch by the Nationa Center or EducationaAchievement (NCEA)—a department o ACT—shows thatno sine proram or isoated reorm can be a substitute ora coherent, on-term, systemwide approach to improvinteachin and earnin. We a want our students to raduateprepared to take on uture opportunities with success. So,what are consistenty hiher perormin schoos doin topace more students on the path to coee and careerreadiness?
The Cre Practice™ Framewrk , buit upon the study omore than 550 schoos across 20 states, identies the corepractices that distinuish a hiher perormin schoo romits averae perormin counterparts. NCEA studies the
practices o those schoos and schoo systems that havemore success in preparin their students or coee andcareers than their peers who serve simiar studentpopuations. Our onoin research supports the rameworkand adds content and inormation to each o the corepractices beow.
The 15 Practices Higher PerrmingSchl Systems
The Core Practice Framework outines the evidence-basededucator practices at each eve o a schoo system—district, schoo, and cassroom—that wi hep a studentsmaster hih standards. The ramework ocuses on vethemes:
Theme 1: Curriculum and Academic Gals
District Practice: Provide cear, prioritized earninobjectives by rade and subject that a students areexpected to master.
Schl Practice: Set expectations and oas or teachinand earnin based on the district’s written curricuum.
Classrm Practice: Study and use the district’s writtencurricuum to pan a instruction.
Theme 2: Sta Selectin, Leadership, andCapacity Building
District Practice: Provide stron principas, a taentedteacher poo, and ayered proessiona deveopment.
Schl Practice: Seect and deveop teachers to ensurehih-quaity instruction.
Classrm Practice: Coaborate as a primary means orimprovin instruction.
Theme 3: Instructinal Tls—Prgrams andStrategies
District Practice: Provide evidence- and standards-basedinstructiona toos that support academic rior or astudents.
Schl Practice:Promote strateies and buid structuresand schedues to support academic rior.
Classrm Practice: Use proven instructiona toos tosupport riorous earnin or students.
Theme 4: Mnitring Perrmance and Prgress
District Practice: Deveop and use student assessmentand data manaement systems to monitor student earnin.
Schl Practice: Monitor teacher perormance andstudent earnin.
Classrm Practice: Anayze and discuss studentperormance data.
Theme 5: Interventin and Adjustment
District Practice: Respond to data throuh tareted
interventions or curricuar/instructiona adjustments.Schl Practice: Use tareted interventions to addressearnin needs o teachers and students.
Classrm Practice: Use tareted interventions oradjustments to address earnin needs o students.
Another ayer behind the ramework, the Critica Actions,provides additiona support or educators by outinin howto successuy impement the key components o each corepractice.
The Cre Practice Framewrk
Readin rom bottom to top, the path to readiness beinswith the ACT Coee Readiness Standards, Common Core
State Standards, and district earnin objectives. Appyinthe 15 core practices o teachin and earnin eads tohih-quaity instruction, which in turn creates theopportunity or a students to reach the ACT CoeeReadiness Benchmarks.
To earn more, visit www.nc4ea.rg.
Policies and Practices
MINNESoTA

7/27/2019 ACT Minnesota 2013
http://slidepdf.com/reader/full/act-minnesota-2013 18/20
18 THE CONDITION OF COllEgE & CAREER READINESS 2013
Statewide Partnerships in College and Career Readiness
Resources
3rd-thrugh
8th-gradestudents
8th- and9th-grade
students
10th-gradestudents
11th- and12th-grade
students
8th- thrugh12th-grade
students
11th- and12th-grade
students
ACT NatinalCareer
ReadinessCertifcate™
ACTWrkKeys®-
basedcertifcates
Aabama Aabama
Arkansas
Hawaii
Iinois
Kentucky
louisiana
Michian
Minnesota
NorthCaroina
Okahoma
SouthCaroina
Tennessee
Utah
WestVirinia
Wyomin
Aabama
Arkansas
Forida
Hawaii
Iinois
Kentucky
louisiana
Michian
Minnesota
NewMexico
NorthCaroina
Okahoma
Tennessee
Utah
WestVirinia
Wyomin
Arkansas
Coorado
Hawaii
Iinois
Kentucky
louisiana
Michian
Montana
NorthCaroina
NorthDakotaTennessee
Utah
Wyomin
Aabama
Kentucky
Aaska
Iinois
Hawaii
Michian
NorthCaroina
NorthDakota
Wyomin
Aaska
Connecticut
Indiana
Iowa
Kentucky
louisiana
Michian
Minnesota
Missouri
Montana
NewHampshire
New Mexico
North Dakota
Ohio
Oreon
Pennsyvania
South Dakota
Tennessee
Vermont
Wisconsin
Aabama
Arkansas
Coorado
Forida
georia
Indiana
Kansas
Mississippi
NorthCaroina
Okahoma
SouthCaroina
Virinia
WestVirinia
Wyomin
Statewide Partnership
States that incorporate ACT’scoee and career readinesssoutions as part o their statewideassessments provide reater accessto hiher education and increasethe ikeihood o student success inpostsecondary education.Educators aso have the abiity toestabish a onitudina pan usinACT’s assessments, which providehih schoos, districts, and stateswith unique student-eve data thatcan be used or eective studentintervention pans.
State administration o ACT’sprorams and services:
Increases opportunities or minority and midde- toow-income students.
Promotes student educationa and career pannin.
Reduces the need or remediation.
Correates with increases in coee enroment,persistence, and student success.
Ains with state standards.

7/27/2019 ACT Minnesota 2013
http://slidepdf.com/reader/full/act-minnesota-2013 19/20
19
Endnotes
1. The data presented herein are based on the ACT Profle Report—State: Graduating Class 2013 or each respective state, and accessibe at www.act.rg/readiness/2013 . With the exception
o the top raph on pae 6, data reated to students who did not provide inormation or who
responded “Other” to questions about ender, race/ethnicity, hih schoo curricuum, etc., are not
presented expicity.
2. The race/ethnicity cateories chaned in 2011 to refect updated US Department o Education
reportin requirements; trends to previous reports may not be avaiabe or a race/ethnicity
cateories.
3. Data refect subject-specic curricuum. For exampe, Enish “Core or More” resuts pertain to
students who took at east our years o Enish, reardess o courses taken in other subject
areas.
4. State on-term occupationa projections or 2009–2019 (based on job rowth and job
repacement data provided by Minnesota Department o Empoyment and Economic
Deveopment). The occupations that are used to cacuate the projected hih-rowth career eds
are based on a combination o the oowin: the occupationa criteria used by the US Bureau o
labor Statistics to obtain state-eve occupation data, occupationa shits that refect a state’s
economic situation, and the ACT Career Cassication System that oranizes occupations into
career eds. Career interests and achievement resuts based on 2013 ACT-tested Minnesota
students (N = 27,794) with vaid career inormation and subject scores. Sampe occupations
within state hih-rowth career eds are Education (secondary teachers, administrators, etc.);
Community Services (socia workers, schoo counseors, etc.); Computer/Inormation Speciaties
(computer prorammers, database administrators, etc.); Manaement (convention panners, hote/
restaurant manaers, etc.); Marketin/Saes (insurance aents, buyers, etc.).
MINNESoTA

7/27/2019 ACT Minnesota 2013
http://slidepdf.com/reader/full/act-minnesota-2013 20/20
ACT is an independent, nonprot oranization that provides assessment,research, inormation, and proram manaement services in the broadareas o education and workorce deveopment. Each year, we servemiions o peope in hih schoos, coees, proessiona associations,businesses, and overnment aencies, nationay and internationay.
Thouh desined to meet a wide array o needs, a ACT prorams andservices have one uidin purpose—hepin peope achieve educationand workpace success.
A copy o this report can be ound atwww.act.org/readiness/2013
*070162130*