Embed Size (px)
Citation preview

1
ABB industrial drivesACS800
DriveWindow basics
© ABB Group April 4, 2011 | Slide 1
Welcome to the DriveWindow basics training module.
2
Objectives
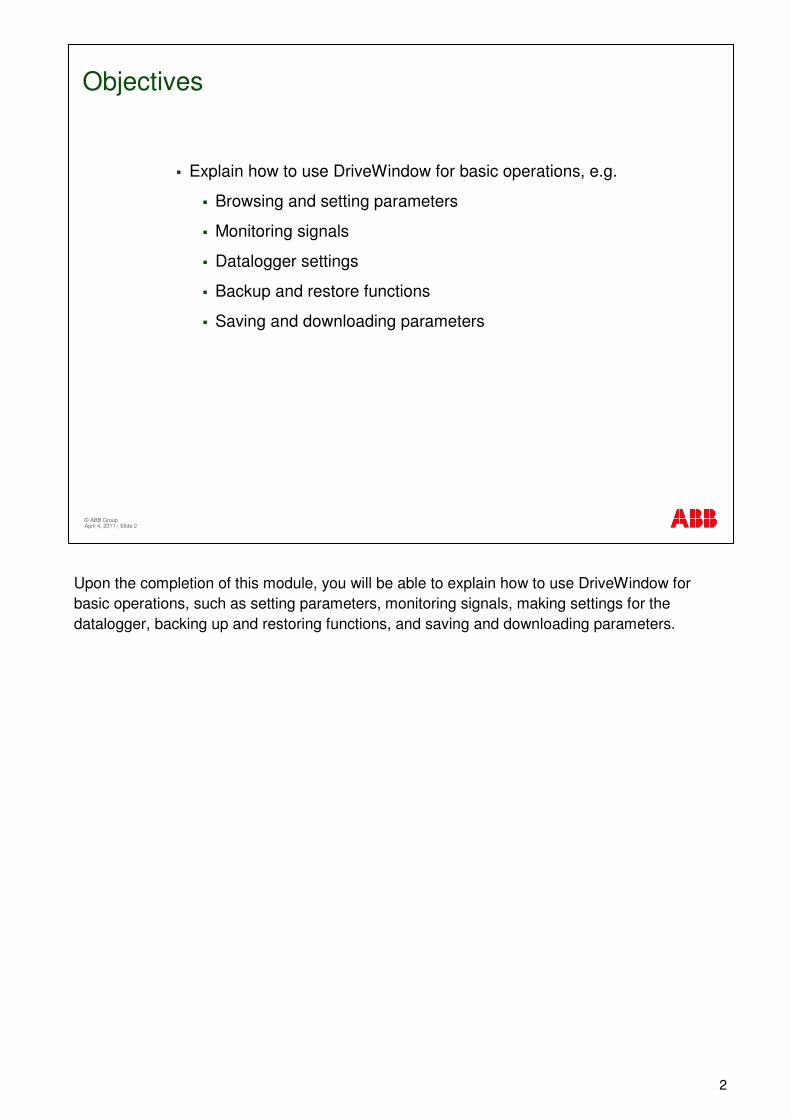
� Explain how to use DriveWindow for basic operations, e.g.
� Browsing and setting parameters
� Monitoring signals
� Datalogger settings
� Backup and restore functions
� Saving and downloading parameters
© ABB Group April 4, 2011 | Slide 2
Upon the completion of this module, you will be able to explain how to use DriveWindow for basic operations, such as setting parameters, monitoring signals, making settings for the datalogger, backing up and restoring functions, and saving and downloading parameters.

3
DriveWindow operations
� A powerful PC tool for commissioning and maintenance of ABB drives
� Control operations (start, stop, references, etc.)
� Monitoring (signals and parameters)
� Handle parameters
� Data Logger (controls, display)
� Fault Logger (display faults, controls)
� All functions over network (control, monitoring, etc.)
© ABB Group April 4, 2011 | Slide 3
DriveWindow is a powerful PC tool for commissioning and maintenance of ABB drives.
It lets you start and stop the drive, change the motor’s rotating direction, monitor signals, and handle parameters, as well as use several logger functions.
You can also use DriveWindow to connect to drives via a local network.
4
Hardware and software requirements
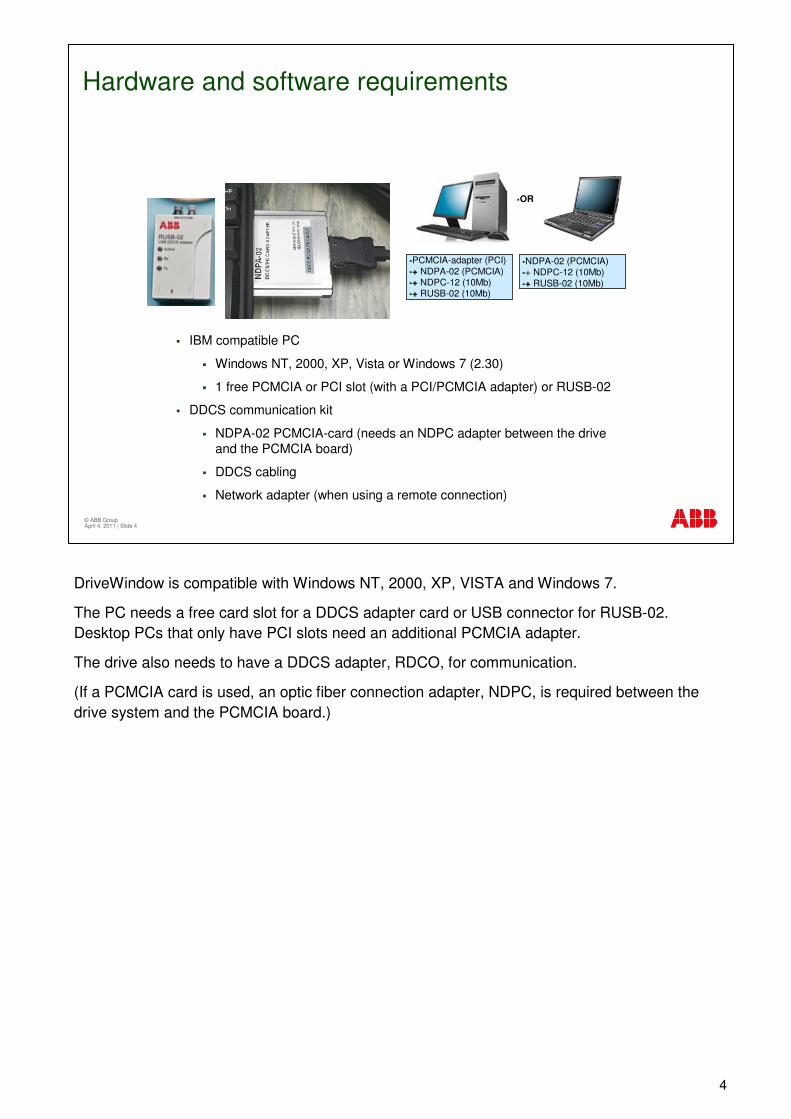
� IBM compatible PC
� Windows NT, 2000, XP, Vista or Windows 7 (2.30)
� 1 free PCMCIA or PCI slot (with a PCI/PCMCIA adapter) or RUSB-02
� DDCS communication kit
� NDPA-02 PCMCIA-card (needs an NDPC adapter between the drive and the PCMCIA board)
� DDCS cabling
� Network adapter (when using a remote connection)
�NDPA-02 (PCMCIA)�+ NDPC-12 (10Mb)�+ RUSB-02 (10Mb)
�PCMCIA-adapter (PCI)�+ NDPA-02 (PCMCIA)�+ NDPC-12 (10Mb)�+ RUSB-02 (10Mb)
�OR
© ABB Group April 4, 2011 | Slide 4
DriveWindow is compatible with Windows NT, 2000, XP, VISTA and Windows 7.
The PC needs a free card slot for a DDCS adapter card or USB connector for RUSB-02. Desktop PCs that only have PCI slots need an additional PCMCIA adapter.
The drive also needs to have a DDCS adapter, RDCO, for communication.
(If a PCMCIA card is used, an optic fiber connection adapter, NDPC, is required between the drive system and the PCMCIA board.)

5
Connections
Local
� Direct connection
� Through an optical distributor
� Ring
Remote
� Network server
Ringconnection
�Network
�PC �Remote PC
�Drive communication links
�Drive communication links
© ABB Group April 4, 2011 | Slide 5
There are four possible ways to connect drives to DriveWindow.
A direct connection means that one drive is connected to the PC (as described in the previous slide). On the other hand, multiple drives can be connected via an optical branching unit (NDBU) or by linking the drives into a ring network.
There is also the possibility to connect drives and DriveWindow in a remote network. In that case, a remote PC acts as the server through which DriveWindow has full access to the drives.

6
Local connections
GOF =Glass Optic Fibre,
HCS =Hard Clad Silica Fibre
POF =Plastic Optical Fibre
1CH 3
DDCS
GOF, HCS or POF
HCS or POF
�...�8 7 6 0
NDBU-95/85�MSTR
�...
CH 3 or 4
2
�8 7 6 0NDBU-95/85
�MSTRCH 3 or 4
CH 33
CH 3CH 3
© ABB Group April 4, 2011 | Slide 6
A direct connection, or a point-to-point connection, is used between the PC and the drive if there is only one drive in the system. Several drives can be connected through optical distributors or by connecting them in a ring.
The drive and the PC, or the PC and the distributor can be connected using glass optical fiber, hard clad silica fiber or plastic optical fiber. When the drives are connected through optical distributors, a DDCS protocol is used.
Grid-side converter has DW connection to CH3 at RDCO-xx option board and generator-side converter to CH4 on AMC-33.

7
GOF =Glass Optic Fibre, Max 1000m (NOCR-01 required)
HCS = Hard Clad Silica Fibre, Max 200m
POF =Plastic Optical Fibre, Max 30m
� Set up unique drive addresses in group 70
1CH 3
�...
DDCS
GOF, HCS or POF
Optical distributor �8 7 6 0
NDBU-95/85�MSTR
�...
CH 3 or 4
2
�8 7 6 0NDBU-95/85
�MSTRHCS or POF CH 3
or 4
CH 33
CH 3CH 3
Constant power supply
Ring
� 1 = reserved for spare part use
� 76…127 = reserved for optical distributors
© ABB Group April 4, 2011 | Slide 7
Local connections
An optical distributor has 9 channels for chaining and connecting the drives. An NDBU-95 distributor has nine 10 Mb optical channels and an NDBU-85 one 10 Mb channel for chaining and eight 5 Mb channels for connecting drives. Plastic optical fibers or hard clad silica fibers are used in connections. The distributors can be connected using different connection methods, for example in series, enabling connection for tens of inverters.
A unique address has to be set in parameter group 70 for every drive in the link for communication. Note that address number 1 cannot be used if several drives are in a network as it is reserved for spare part use. The addresses from 76…127 are reserved for optical distributors. NDBU boards have a hardware switch for address setting.
When the drives are connected in a ring, all the drives in the ring should have constant power supply, otherwise the ring will break.
With plastic cables the maximum distance is 20 meters for 5 Mb optical components, and 30 meters for 10 Mb optical components. For longer distances a hard clad silica fiber must be used and then the maximum distance is 200 meters.

8
Getting started
� Select a server and click OK.
© ABB Group April 4, 2011 | Slide 8
In the remainder of this module, we give an overview of Drive Window's user interface and basic functions.
When DriveWindow is started, it first prompts to select which server to use. The ABB SMP server is the usual selection for working with a local drive. Other options include not connecting to any drive or connecting to a remote server.
9
�Browse Tree�Item Sets
�Trend Settings�Trend Display
Getting started
© ABB Group April 4, 2011 | Slide 9
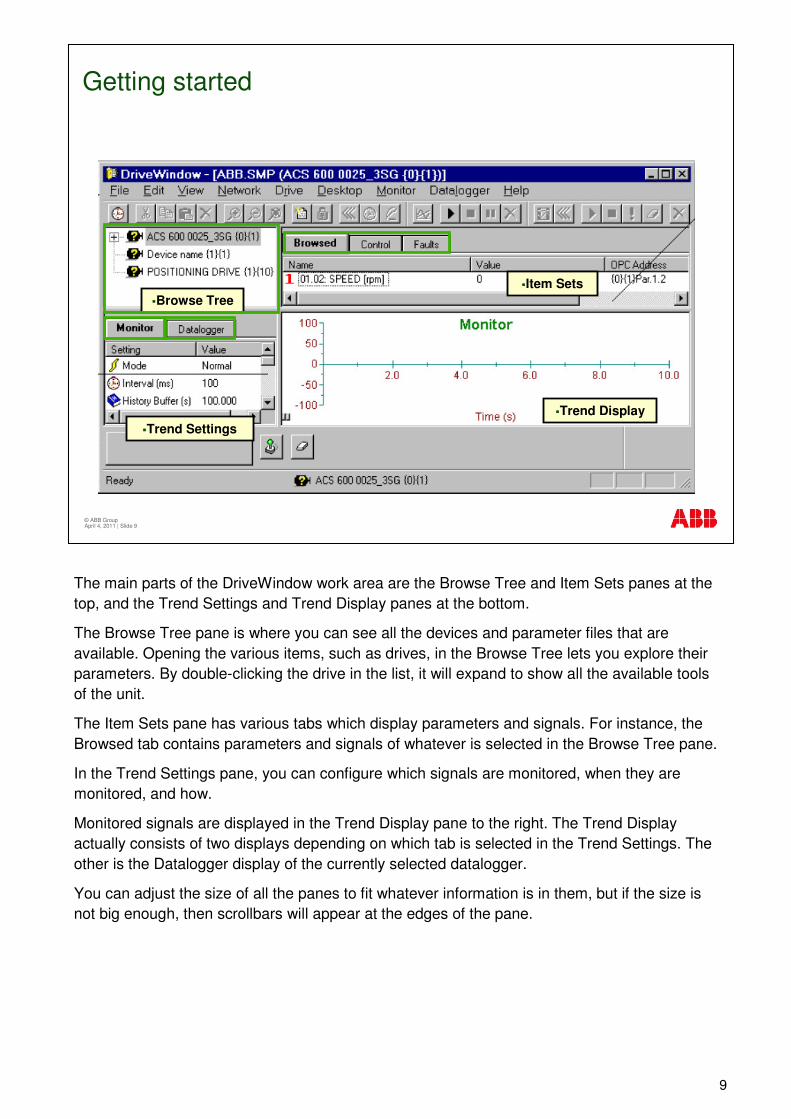
The main parts of the DriveWindow work area are the Browse Tree and Item Sets panes at the top, and the Trend Settings and Trend Display panes at the bottom.
The Browse Tree pane is where you can see all the devices and parameter files that are available. Opening the various items, such as drives, in the Browse Tree lets you explore their parameters. By double-clicking the drive in the list, it will expand to show all the available tools of the unit.
The Item Sets pane has various tabs which display parameters and signals. For instance, the Browsed tab contains parameters and signals of whatever is selected in the Browse Tree pane.
In the Trend Settings pane, you can configure which signals are monitored, when they are monitored, and how.
Monitored signals are displayed in the Trend Display pane to the right. The Trend Display actually consists of two displays depending on which tab is selected in the Trend Settings. The other is the Datalogger display of the currently selected datalogger.
You can adjust the size of all the panes to fit whatever information is in them, but if the size is not big enough, then scrollbars will appear at the edges of the pane.

10
The toolbars and status bar
Status bar
Drive Panel toolbar
Title bar
Standard toolbar
Monitor toolbar Logger toolbar
DriveWindow User’s manual (large pdf-file)
© ABB Group April 4, 2011 | Slide 10
The other parts of the work area include the title bar, the various toolbars and the status bar.
The title bar displays the names of the current server and the item selected in the Browse Tree.
The status bar displays information on the state of the currently selected drive.
You can access the most common commands for browsing, monitoring and logging from the three toolbars shown at the top.
The Drive Panel toolbar, which is used to take control of the drive, is normally right above the status bar.
The toolbars and status bar can individually be hidden or moved to different locations, but the appearance shown here is commonly used.
You can find more detailed information on the buttons and menus in the DriveWindow User’s manual.

11
Item sets
• Parameters in a drive
• Parameters in a file
• Fault logs
• Event logs
• Monitored items
• Datalogger items
• Copy to clipboard
• Monitored drive
© ABB Group April 4, 2011 | Slide 11
The item sets pane is the upper right pane within the window area. It consists of several item sets, one of which is visible at a time.
You can use the pane for several purposes, such as
• To view and change item values in a drive or in an open parameter file.
• To view the contents of fault and event loggers in a user friendly way.
• To add items to and remove items from the monitor or datalogger.
• To change the drive of monitored items, and
• To copy items to the clipboard.
Although there are several types of item sets, they can be divided into two main categories:
• Those that list items, and
• Those that list faults or events.

12
Adding item sets
Context menu
© ABB Group April 4, 2011 | Slide 12
Instead of having fixed item sets, DriveWindow allows you to add, remove, and arrange item sets as well as change their properties.
Adding an item set is done by selecting the Add New command from the Item Set submenu of the Desktop menu.
The same submenu is included in the context menu, which you can access by right-clicking on the item sets pane outside the name of an item.
You can add the following types of item sets:
All parameters, which contains all un-protected parameters of the source drive.
User items, which contains user-defined parameters and signals.
Faults, which is used to view the contents of the source drive fault logger. By default, there is a predefined item set of this kind.
Events, which is used to view the contents of the source drive event logger.
All faults, which is used to view the combined contents of the fault loggers for all connected drives.
All events, which is used to view the combined contents of the event loggers for all connected drives.
The added item set is on the far right in the item sets pane and its tab is selected. You can rearrange the item sets, and you can also remove any item sets you’ve added.

13
Item set properties
© ABB Group April 4, 2011 | Slide 13
Item set properties are shown and changed in dialog boxes. Each type of item set has properties of its own. So, contents of the dialog boxes depend on the type of the item set.
To view and change properties of the currently shown item set, select the Properties command from the Item Set submenu of the Desktop menu or from the context menu.

14
Item set properties
© ABB Group April 4, 2011 | Slide 14
Item set types of browsed, user defined, and all parameters have a Format tab in their Item Set Properties dialog box. This tab defines the format to be used in displaying the values of items in the item set.
All types of item sets have the same General tab in their Item Set Properties dialog box. This tab contains general properties common to all types of item sets.
Only user item sets have the Items tab in their Item Set Properties dialog box. This tab defines how the names of items are formed and what is displayed in case an item is not available.

15
Item set properties
© ABB Group April 4, 2011 | Slide 15
The User defined item set, the All parameters item set, and the Faults, and Events sets all have the same Source tab in their Item Set Properties dialog box. This tab defines the drive whose values are displayed.
The Faults, Events, All faults, and All events item sets have the Show tab in their Item Set Properties dialog box. In the show tab, you can filter which values are shown in these item sets.

16
Warning: Selecting Local control stops normal operation immediately, without any warnings. Automation system can’t effect in Local control.
The full drive panel toolbar (local control) is available only when the drive is in remote control mode (Local control is not selected from control panel or other computer).
In the toolbar you can see the name and address of the selected drive.
With the drive panel toolbar you can, for example, take and release control of the drive, clear faultlogger, edit and set the reference value, start and stop the drive, and change the direction of rotation.
Drive panel toolbar
1. Name and address of the selected drive2. Take/release control (Local/Remote)
3. Clear faultlogger4. Reference edit field and reference value (DW 2.1)5. Set reference
6. Step button (DW 2.1)7. Reset
8. Start9. Stop10. Direction of rotation
11. Coast stop
1 2 3 4 5 6 7 8 9 10 11
© ABB Group April 4, 2011 | Slide 16
1 2 3
Panel toolbar in remote mode,
take control action stops normal operation

17
Desktop preferences
� Specifyingdefault settings(for all ItemSets):
� Specifyingcustom settings(for individualItem Sets): � Right-click
© ABB Group April 4, 2011 | Slide 17
The default behavior of how DriveWindow displays item sets is controlled by the Desktop Preferences. They are accessed from Preferences in the Desktop menu.
First, it is good to check the Item Update setting, which specifies the default for how DriveWindow refreshes the values shown in the Item Sets pane.
There are three options: from device, from cache and put on-line.
From Device means that the item values are always fetched from the drives.
From Cache means that the item values are fetched from a cache.
The Put On-Line command means that item values are updated at regular intervals.
Note, that the Desktop Preferences are default selections that an item set may or may not use. You can choose whether an item set really uses these defaults, or if it simply overrides them with its own settings. The defaults provide a quick way to make changes that apply to many places at once.
To change the preferences for a specific item set, right click its tab in the item sets pane and select properties.

18
Editing parameters
�(double-click) �(double-click) �(double-click)
�Write-protection
© ABB Group April 4, 2011 | Slide 18
Parameter values are edited in the Items Sets pane.
For example, to change the constant speed selection, open parameter group 12 in the Browse Tree, and double-click parameter 12.01 in the Browsed set.
Some items, such as signals, are write-protected. You can tell if the item is write-protected if the Change Value button in the toolbar is grayed out, or the computer beeps when you double-click it.
(If the drive is running when you double-click a parameter group, editing some parameters is not possible. This so called READ ONLY-status remains even after the drive has been stopped. In that case, to make parameter editing possible:
First, choose the option “Disconnect the Server” from the Network menu.
Then, select the option “Network Servers” from the Network menu.
An item list is displayed, that also includes a list of all parameters.)

19
Reading actual signals
� Open group1
� Activate signals
� Online signals are shown in yellow
� Lock signals
�Activate/Deactivate
�Lock
© ABB Group April 4, 2011 | Slide 19
To read the actual signal values of the drive, open one of the Actual signal parameter groups, such as group 1, in the Browse Tree.
Now you can see the signal values in that group in the Browsed set. However, signal values usually change continuously, so you may want to put some signals online by clicking the Activate button in the toolbar. For example, you could select the first signal in the list and put it online to make DriveWindow periodically refresh the value. Online signals are shown in yellow.
Furthermore, you might also want to browse other parameters while still keeping the online signal visible in the Browsed set. You can lock the signal by clicking the Lock button in the toolbar.
Note that many of the operations you do in DriveWindow apply to all currently selected items. So, you could, for instance, select all the signals that you want to observe by holding down the Control (or Shift) key while selecting them in the Item Sets pane, and then activate and lock them all with just a few mouse clicks.
20
Monitoring signals
� Monitor settings
� Graph preferences
© ABB Group April 4, 2011 | Slide 20
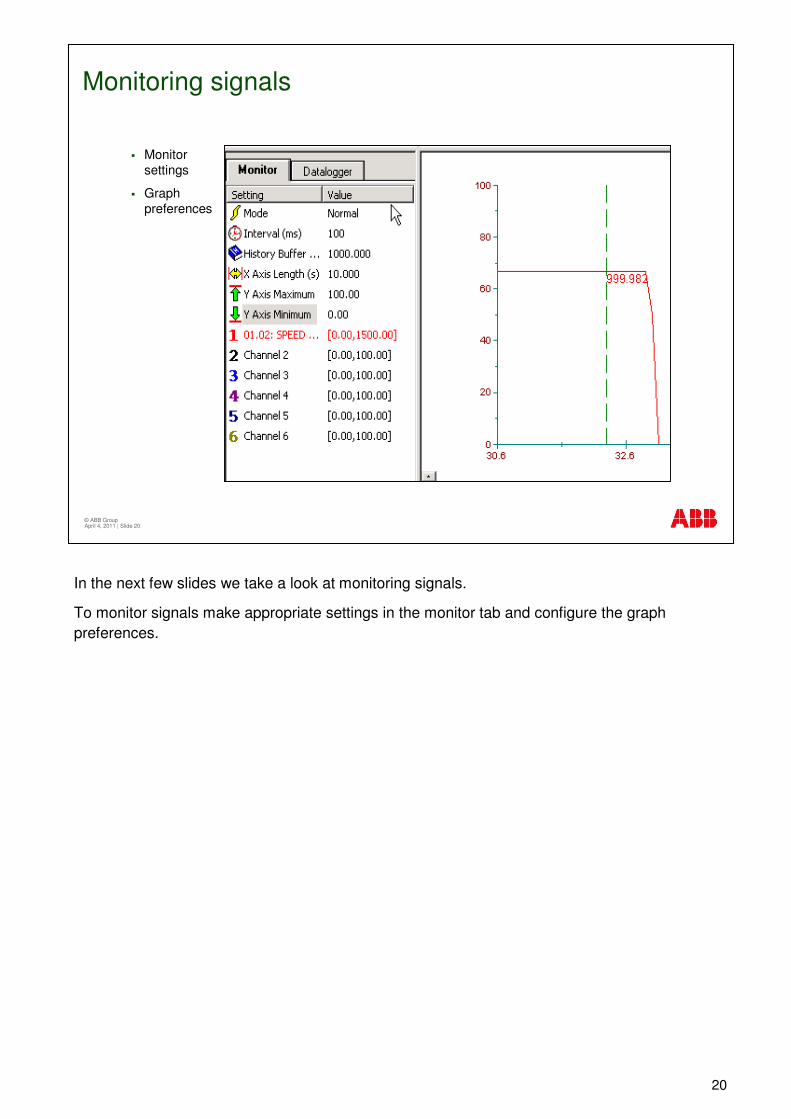
In the next few slides we take a look at monitoring signals.
To monitor signals make appropriate settings in the monitor tab and configure the graph preferences.
21
Selecting monitored items
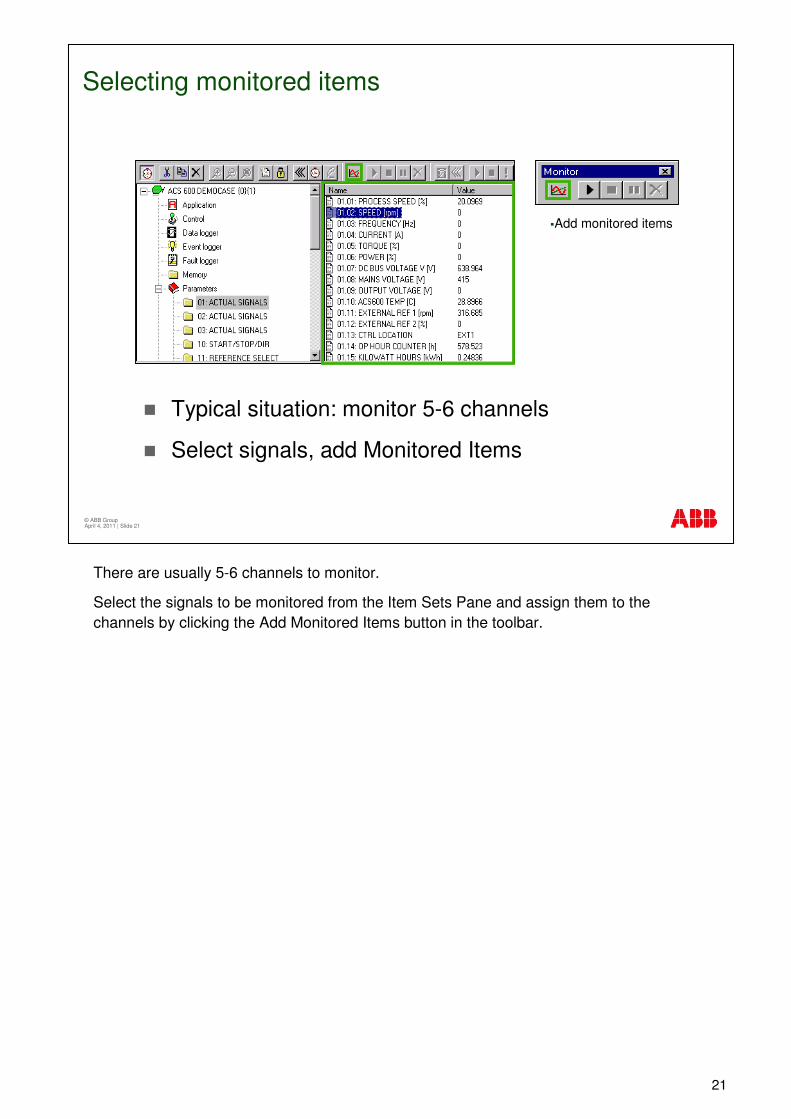
� Typical situation: monitor 5-6 channels
� Select signals, add Monitored Items
�Add monitored items
© ABB Group April 4, 2011 | Slide 21
There are usually 5-6 channels to monitor.
Select the signals to be monitored from the Item Sets Pane and assign them to the channels by clicking the Add Monitored Items button in the toolbar.

22
� Monitor modes– Normal (min. sampling interval
10ms)
– Fast (min. 1ms)
� Monitoring interval (ms)
� History buffer (in seconds)
� Coordinate lengths (s)
� Scaling of each channel� �= Can be set at any time
� = Can be set when monitoring is cleared�
� = Can be set when monitoring is stopped or paused�
Settings and scaling
© ABB Group April 4, 2011 | Slide 22
There are two modes of monitoring: normal and fast.
Normal is the mode you will almost always use.
Fast mode is for monitoring real or integer type signals.
The monitoring interval is the x-axis resolution.
The data the monitor collects goes into a history buffer. The history buffer makes it possible to collect more data than fits on the screen.
When the monitor is paused or stopped, you can browse the data in the history buffer. You can set the size of the buffer in seconds.
The next three settings define the coordinate lengths.

23
Graph preferences
� Graph appearance and settings
� How points are connected
� Graph scaling
� Are values shown with the graph cursor
� Show scaled/unscaled cursor values
© ABB Group April 4, 2011 | Slide 23
Graph preferences controls the trend display graph appearance and settings. It is accessed from the file menu. It has settings for printing, line colors and so on.
The miscellaneous tab allows you to change how points in a graph are connected to each other, graph scaling and whether or not to show scaled or unscaled values with the graph cursor.
The scaling method defines how the coordinate axes are scaled. The options are coefficient and offset and values at 100 and 0.

24
Operating the monitor
� Use the monitor toolbar to
1. Add/remove item
2. Start/continue monitoring
3. Stop monitoring
4. Pause monitoring
5. Clear monitoring
� From the file menu
� Open or save the graph
� Comment or print the graph
� Export data
� Copy graph into the clipboard
� Set graph preferences
© ABB Group April 4, 2011 | Slide 24
The monitor toolbar is where you also start and stop monitoring the signals you have selected. You can also pause the monitor temporarily to take a closer look at a signal.
From the File menu, you can save a graph to a file, or export the data to Excel, for instance.

25
Workspace
© ABB Group April 4, 2011 | Slide 25
Workspaces allow you to save your preferences and pane arrangements such as the items shown in the browsed item set and their status.
By doing this you can quickly setup DriveWindow to show the signals and parameters you desire.
You can interrupt your work and then easily continue from the point you left off by restoring your saved workspace settings.
You can create different personalized workspace sets.

26
Fault logger
� Browsing the fault history
� Opening the Fault logger
� Log 00 = most recent log
� Updating values
� Clearing the fault logger
�OFF-LINE or COMM. BREAK�NOT RUNNING�RUNNING (forward)�FAULT�WARNING
�DRIVE STATUS
© ABB Group April 4, 2011 | Slide 26
DriveWindow allows you to browse the fault history of the drive.
The icon at the top of the browse tree shows the status of the drive, if the feature has not been turned off. If the drive has tripped on a fault the drive icon has an exclamation mark on it.
You can view the contents of the fault logger in the drive by opening the fault logger item in the browse tree or by selecting the fault tab in the item sets pane.
The fault set contains the description, time, status, etc.
Log 00 is the most recent fault log.
If the fault items are offline the values may be very old so you have to update them manually by clicking the UPDATE ITEMS button in the toolbar.
You can clear the fault logger by clicking the Clear Faultlogger button in the Drive panel toolbar.

27
Saving a parameter file
1.Saving parameter files (with comments)
2.Download into a drive
3.Compare to other files
4.Export to other applications
© ABB Group April 4, 2011 | Slide 27
With DriveWindow it is possible to save user and ID run result parameters into a file.
You can use the saved parameters to download them into a drive or to compare them with current parameters of a drive and other parameter files. And you can export the parameter files for use in other applications.

28
Restoring parameters
� Open the fileand select thedrive
� SelectDownloadcommand andthen theRestore type
© ABB Group April 4, 2011 | Slide 28
To download a parameter file to the drive, open the file and select Download from the File menu. DriveWindow checks the software version differences between the file and the drive. If differences are found, a warning is presented.
Then you select whether to download the user data or ID run result, or both.
Restore ID run results is usually selected if the file includes specifications of the motor connected to the drive. The parameters are downloaded to the drive’s RAM. If the drive is restarted, they will disappear, unless you force them into the Flash memory.
The parameters are downloaded to the drive’s RAM and into the Flash memory.
After the download is complete, DriveWindow prompts you to restart the drive.
You should check using the Compare-function that there are no differences between the drive and the file.

29
Creating a backup of the motor control board
� System Software > New > Backup Package
� System Software > Backup
� System Software > Save As…
© ABB Group April 4, 2011 | Slide 29
To create a backup of the motor control board, create a new backup folder by selecting New > Backup package.
Next, select Backup under System software which opens the Select drives dialog box.
Select the drives you want to back up and click Backup to confirm.
Once the backup is completed you will need to save the Backup package.
Note that when this function is used, DriveWindow has to be updated with the service pack which can be found from the internet.
30
Restoring the motor control board
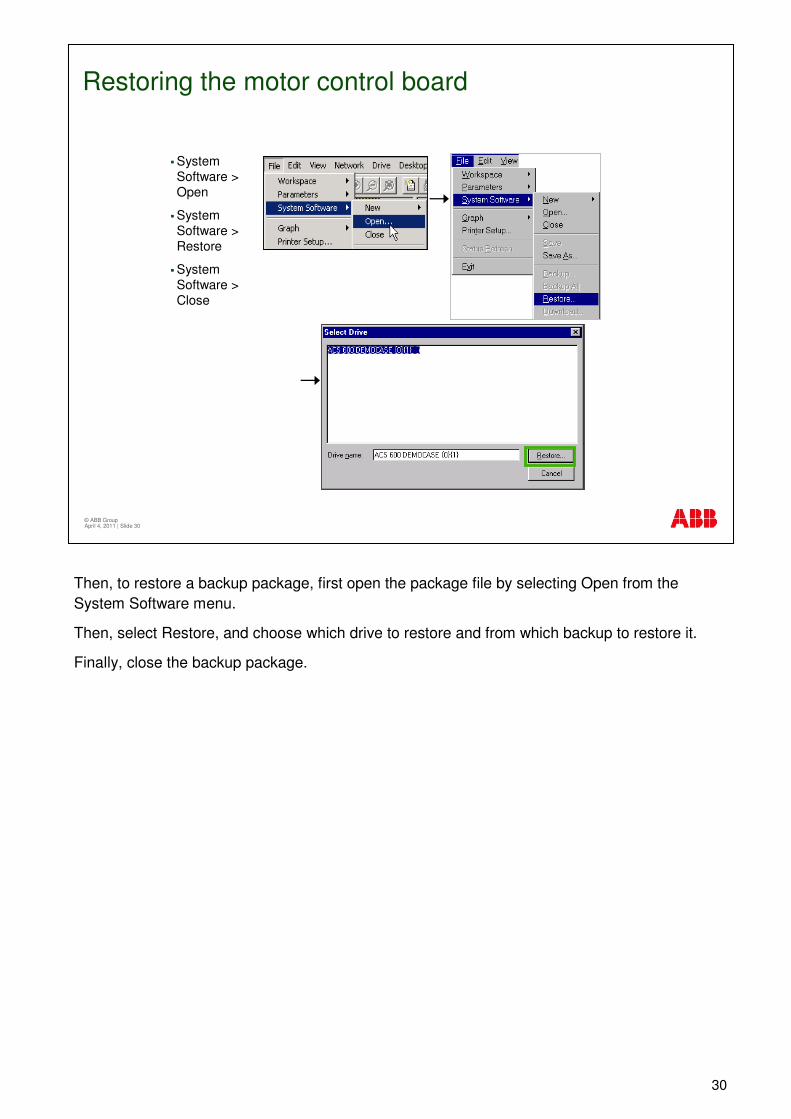
� SystemSoftware >Open
� SystemSoftware >Restore
� SystemSoftware >Close
© ABB Group April 4, 2011 | Slide 30
Then, to restore a backup package, first open the package file by selecting Open from the System Software menu.
Then, select Restore, and choose which drive to restore and from which backup to restore it.
Finally, close the backup package.
31
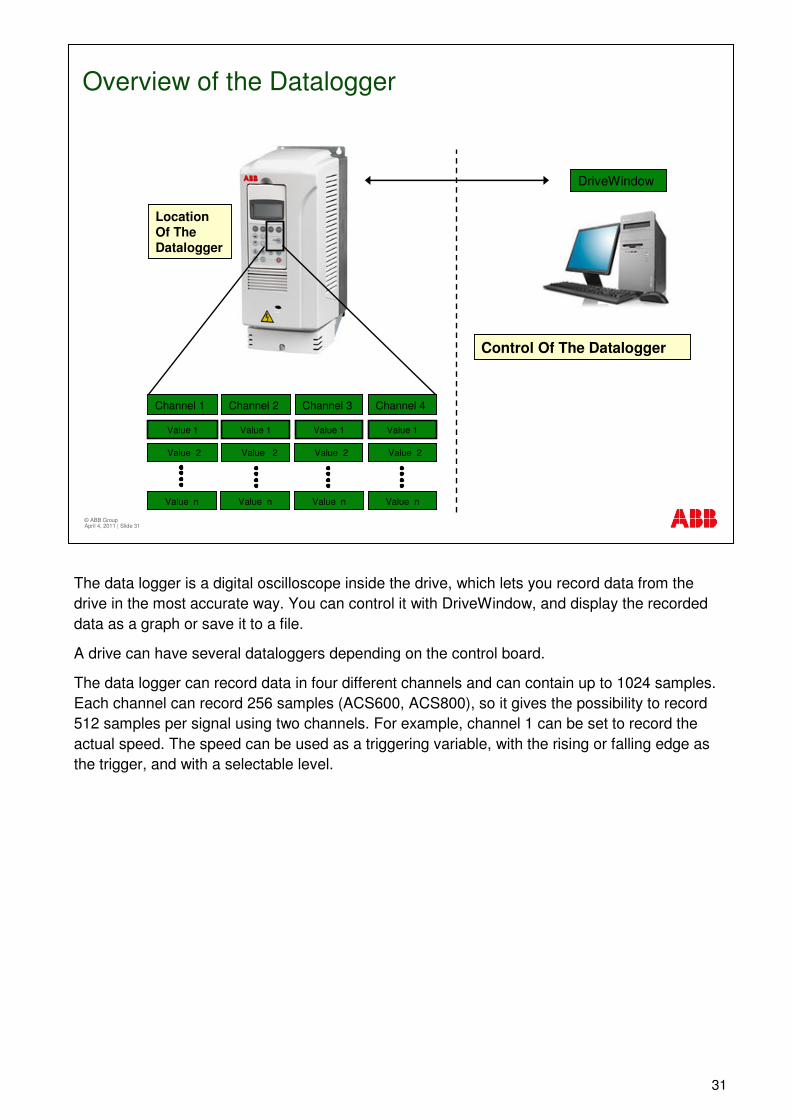
Overview of the Datalogger
Location Of The Datalogger
Control Of The Datalogger
DriveWindow
Channel 1 Channel 3 Channel 4Channel 2
Value 1
Value 2
Value 1
Value 2
Value 1
Value 2
Value 1
Value 2
Value nValue nValue nValue n
© ABB Group April 4, 2011 | Slide 31
The data logger is a digital oscilloscope inside the drive, which lets you record data from the drive in the most accurate way. You can control it with DriveWindow, and display the recorded data as a graph or save it to a file.
A drive can have several dataloggers depending on the control board.
The data logger can record data in four different channels and can contain up to 1024 samples. Each channel can record 256 samples (ACS600, ACS800), so it gives the possibility to record 512 samples per signal using two channels. For example, channel 1 can be set to record the actual speed. The speed can be used as a triggering variable, with the rising or falling edge as the trigger, and with a selectable level.

32
Datalogger settings
� Status of the drive and the reason why the datalogger was triggered are shown
� Interval and pre-trigger time (ms)
� Trigger conditions, variable, level and hysteresis
© ABB Group April 4, 2011 | Slide 32
The Datalogger settings pane shows the status of the logger, and the reason why the logger was triggered.
Here you can change the dataloggers sample interval, pre-trigger time, trigger conditions and so on.
The pre-trigger time sets how many samples the logger keeps before the triggering point.
The condition sets the event that triggers the logging, for instance a fault or a rising edge of a signal.
The trigger variable tells the datalogger, which of the drive signals or parameters to use as the trigger when using level triggering.
The Level tells the datalogger at what signal level to trigger.

33
Datalogger example
1. Delete signals
2. Select the new signal
3. Add the signal to the datalogger
4. Make your datalogger settings
5. Start the datalogger
6. Upload the data from the datalogger
7. View the recorded data 3
2
5
6
4
7
© ABB Group April 4, 2011 | Slide 33
1
Here is an example of how the Datalogger is used.
Data read into DriveWindow must be cleared before new data can be downloaded.
Delete the existing signal from the Datalogger and select the new signal as shown.
By clicking the add symbol in the toolbar, add the signal to the datalogger.
Next, make your datalogger settings. Scaling, such as the x-axis length can be done after the upload.
Then start the datalogger.
Once the Status value shows that the datalogger has been filled, you can upload the data from the datalogger.
The recorded data can be viewed in the trend display.
When you are finished viewing uploaded data, you can clear the datalogger graph. Clearing the graph enables you to change datalogger settings, if the datalogger is not running.

34