Embed Size (px)
Citation preview
Acreage Shifts in Southern Commodities: Why and Is It Temporary?
National Farm Business Management ConferenceJune 9-13, 2013
Dr. Nathan B. Smith, Amanda Smith, and Dr. Don Shurley
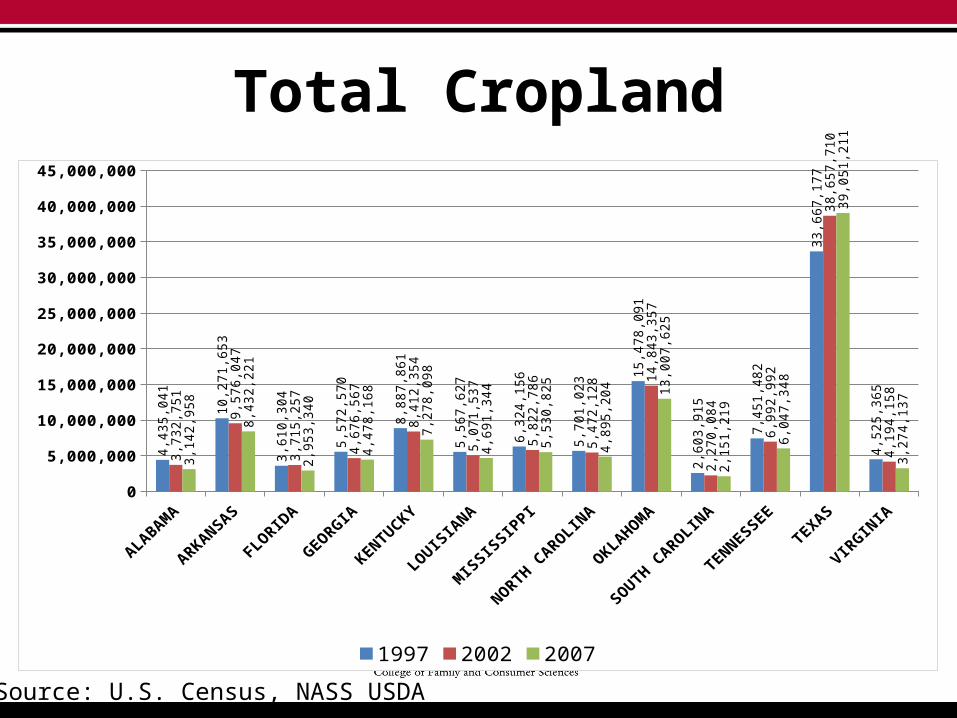
Total Cropland
ALABAM
A
ARKANSAS
FLORID
A
GEORGIA
KENTUCKY
LOUISIA
NA
MISSISSIPPI
NORTH CAROLINA
OKLAHOM
A
SOUTH CAROLINA
TENNESSEE
TEXAS
VIRGINIA
0
5,000,000
10,000,000
15,000,000
20,000,000
25,000,000
30,000,000
35,000,000
40,000,000
45,000,0004,
435,
041 10
,271
,653
3,61
0,30
4
5,57
2,57
0
8,88
7,86
1
5,56
7,62
7
6,32
4,15
6
5,70
1,02
3
15,4
78,0
91
2,60
3,91
5
7,45
1,48
2
33,6
67,1
77
4,52
5,36
5
3,73
2,75
1 9,57
6,04
7
3,71
5,25
7
4,67
6,56
7
8,41
2,35
4
5,07
1,53
7
5,82
2,78
6
5,47
2,12
8
14,8
43,3
57
2,27
0,08
4
6,99
2,99
2
38,6
57,7
10
4,19
4,15
8
3,14
2,95
8 8,43
2,22
1
2,95
3,34
0
4,47
8,16
8
7,27
8,09
8
4,69
1,34
4
5,53
0,82
5
4,89
5,20
4
13,0
07,6
25
2,15
1,21
9
6,04
7,34
8
39,0
51,2
11
3,27
4,13
7
1997 2002 2007
Source: U.S. Census, NASS USDA
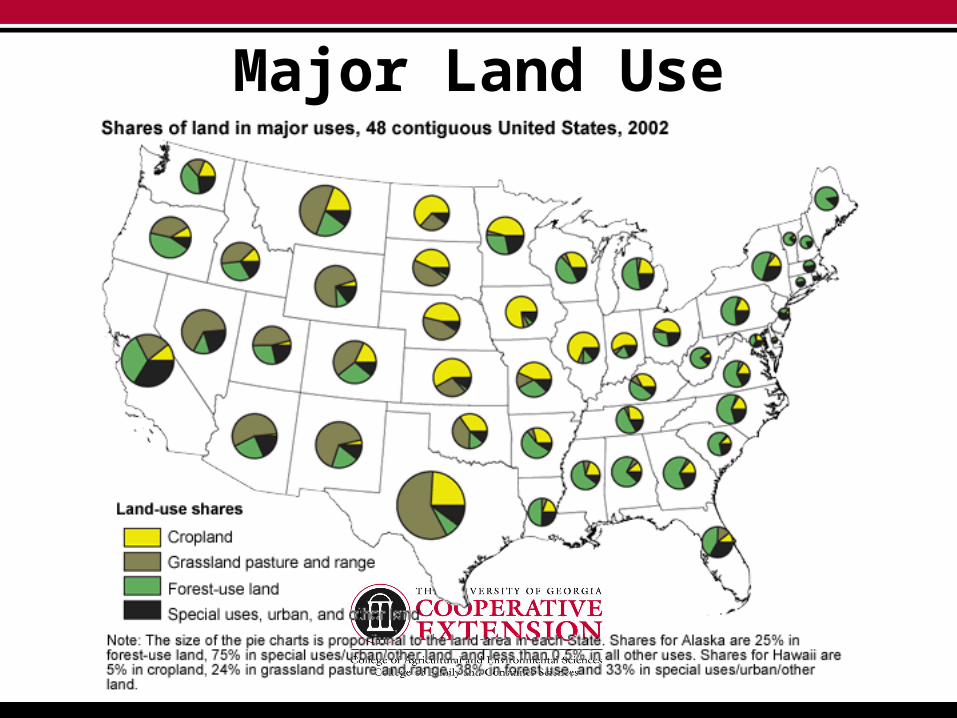
Major Land Use
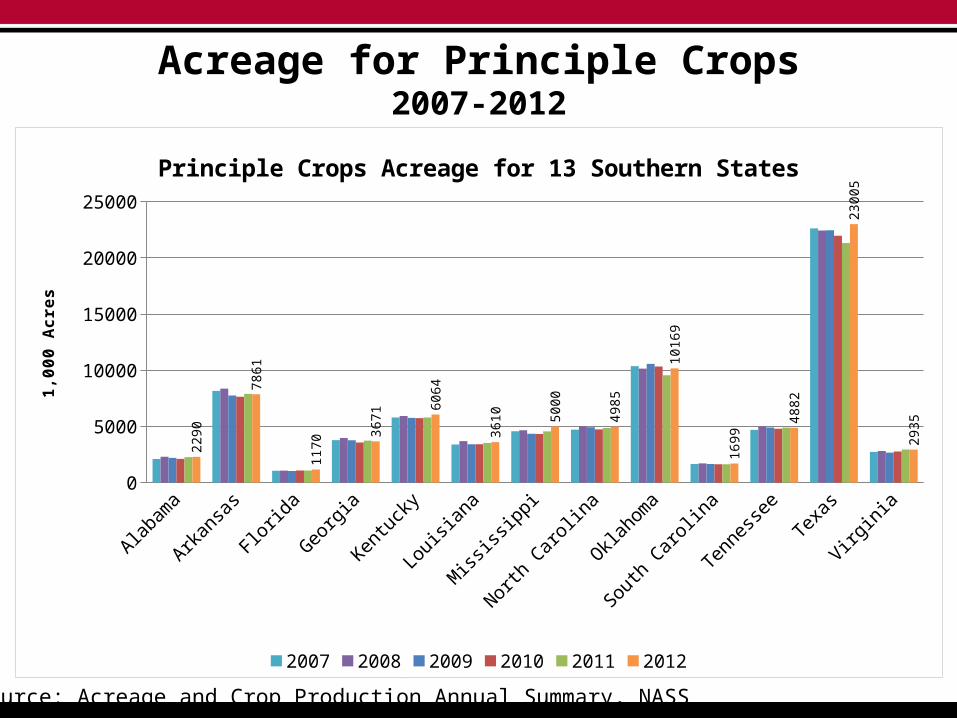
Acreage for Principle Crops2007-2012
Alabama
Arkansas
Florida
Georgia
Kentucky
Louisia
na
Mississ
ippi
North Caro
lina
Oklahoma
South Carolin
a
Tennessee
Texas
Virginia
0
5000
10000
15000
20000
2500022
90
7861
1170
3671
6064
3610 50
00
4985
1016
9
1699
4882
2300
5
2935
Principle Crops Acreage for 13 Southern States
2007 2008 2009 2010 2011 2012
1,00
0 A
cres
Source: Acreage and Crop Production Annual Summary, NASS
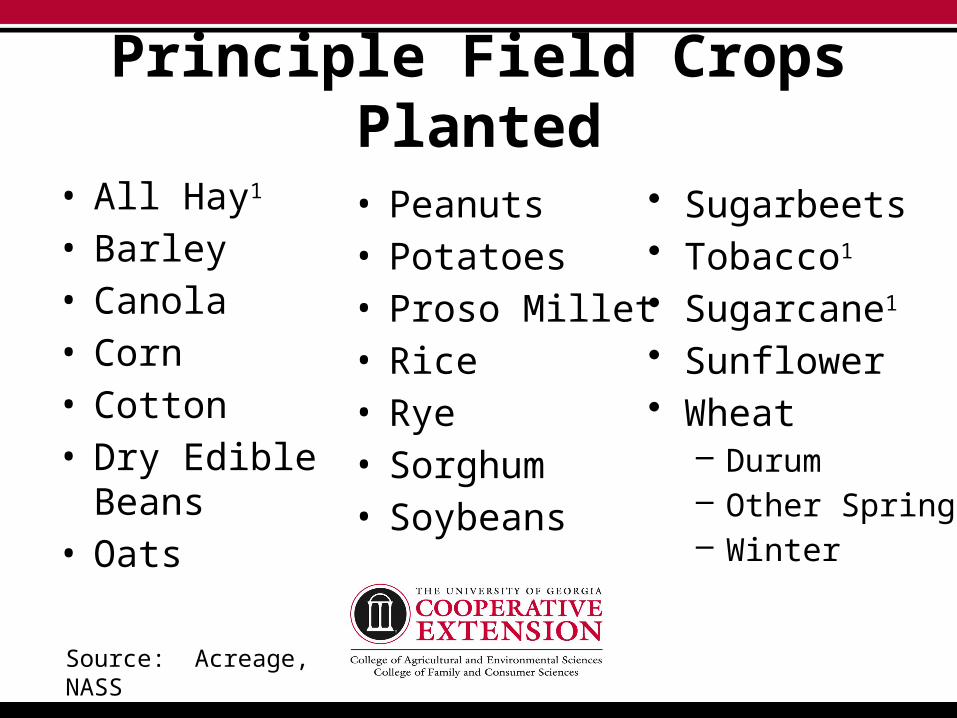
Principle Field Crops Planted
• All Hay1
• Barley• Canola• Corn• Cotton• Dry Edible Beans• Oats
• Peanuts• Potatoes• Proso Millet• Rice• Rye• Sorghum• Soybeans
• Sugarbeets• Tobacco1
• Sugarcane1
• Sunflower• Wheat
– Durum – Other Spring – Winter
Source: Acreage, NASS1Harvested Acres used
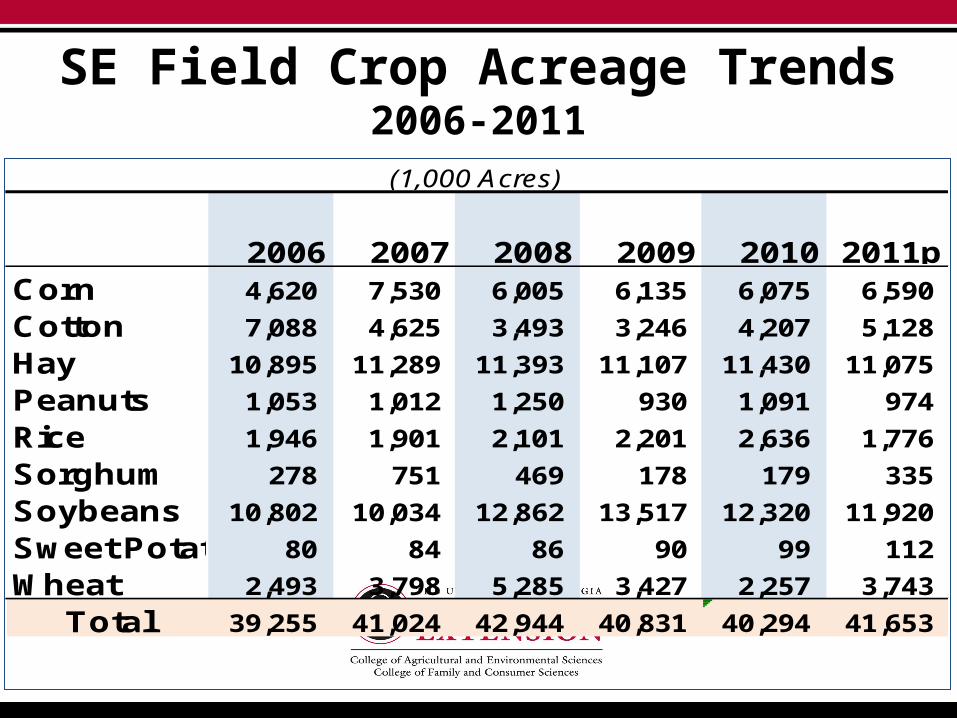
2006 2007 2008 2009 2010 2011pCorn 4,620 7,530 6,005 6,135 6,075 6,590
Cotton 7,088 4,625 3,493 3,246 4,207 5,128
Hay 10,895 11,289 11,393 11,107 11,430 11,075
Peanuts 1,053 1,012 1,250 930 1,091 974
Rice 1,946 1,901 2,101 2,201 2,636 1,776
Sorghum 278 751 469 178 179 335
Soybeans 10,802 10,034 12,862 13,517 12,320 11,920
Sweet Potato 80 84 86 90 99 112
Wheat 2,493 3,798 5,285 3,427 2,257 3,743
Total 39,255 41,024 42,944 40,831 40,294 41,653
(1,000 Acres)
SE Field Crop Acreage Trends2006-2011
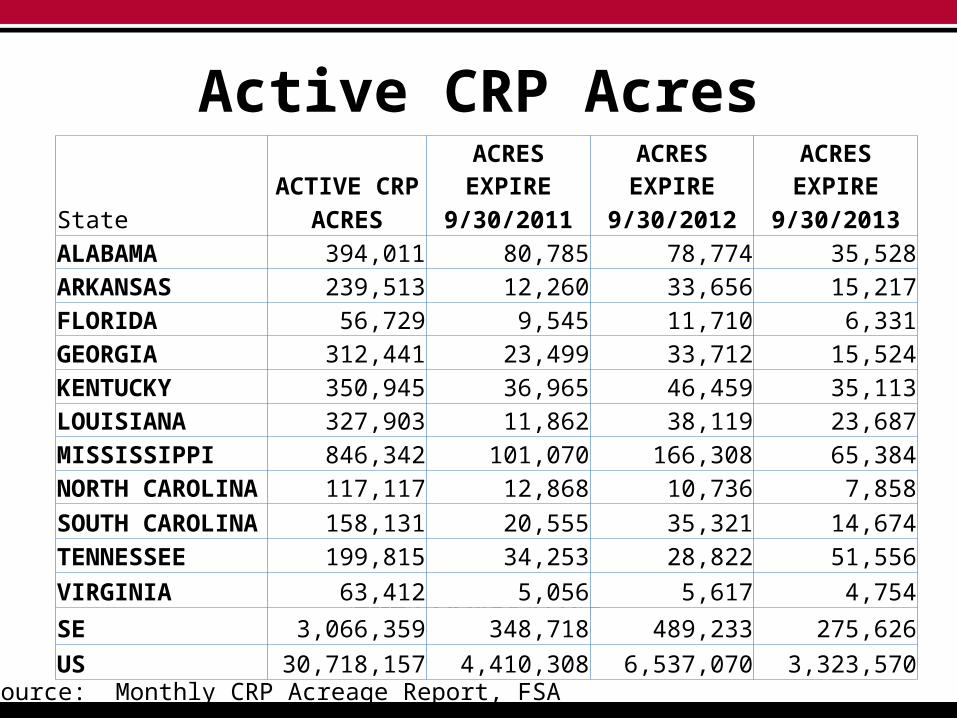
Active CRP Acres ACTIVE CRP ACRES EXPIRE ACRES EXPIRE ACRES EXPIREState ACRES 9/30/2011 9/30/2012 9/30/2013ALABAMA 394,011 80,785 78,774 35,528ARKANSAS 239,513 12,260 33,656 15,217FLORIDA 56,729 9,545 11,710 6,331GEORGIA 312,441 23,499 33,712 15,524KENTUCKY 350,945 36,965 46,459 35,113LOUISIANA 327,903 11,862 38,119 23,687MISSISSIPPI 846,342 101,070 166,308 65,384NORTH CAROLINA 117,117 12,868 10,736 7,858SOUTH CAROLINA 158,131 20,555 35,321 14,674TENNESSEE 199,815 34,253 28,822 51,556VIRGINIA 63,412 5,056 5,617 4,754
SE 3,066,359 348,718 489,233 275,626US 30,718,157 4,410,308 6,537,070 3,323,570
Source: Monthly CRP Acreage Report, FSA
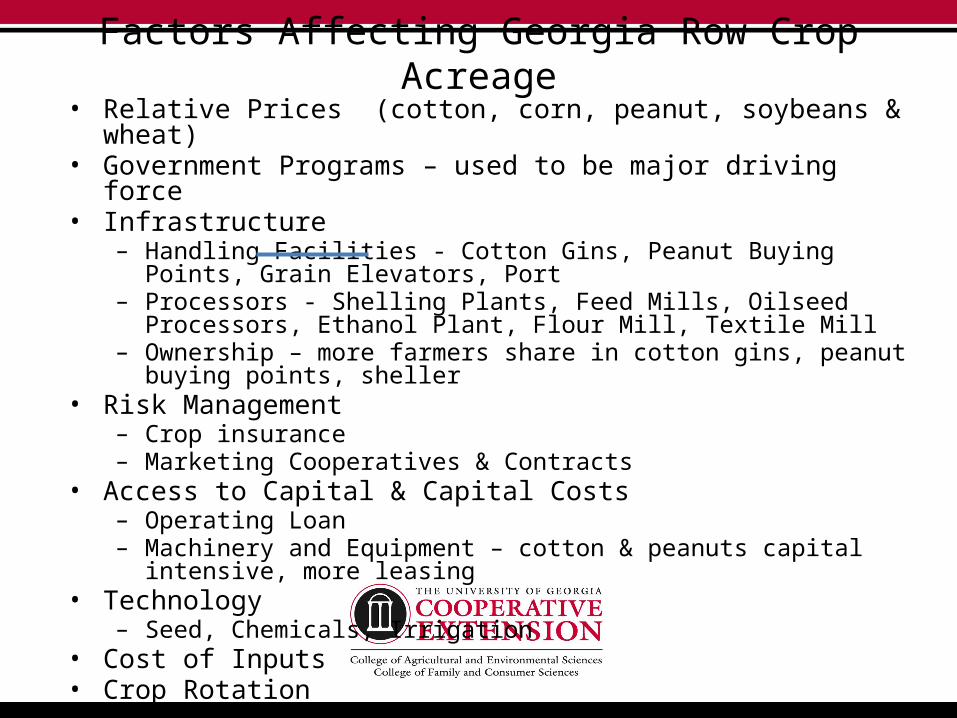
Factors Affecting Georgia Row Crop Acreage• Relative Prices (cotton, corn, peanut, soybeans & wheat) • Government Programs – used to be major driving force• Infrastructure
– Handling Facilities - Cotton Gins, Peanut Buying Points, Grain Elevators, Port– Processors - Shelling Plants, Feed Mills, Oilseed Processors, Ethanol Plant,
Flour Mill, Textile Mill– Ownership – more farmers share in cotton gins, peanut buying points, sheller
• Risk Management– Crop insurance – Marketing Cooperatives & Contracts
• Access to Capital & Capital Costs – Operating Loan– Machinery and Equipment – cotton & peanuts capital intensive, more leasing
• Technology– Seed, Chemicals, Irrigation
• Cost of Inputs• Crop Rotation • Weather • Water
Georgia Trends in Row Crops
• Increased acres• More interest in corn and soybeans • Growth in grain infrastructure• Increase in irrigation units• Clearing of edges of fields and pine plantations
brought back into production• More corn in cotton, peanut rotation.
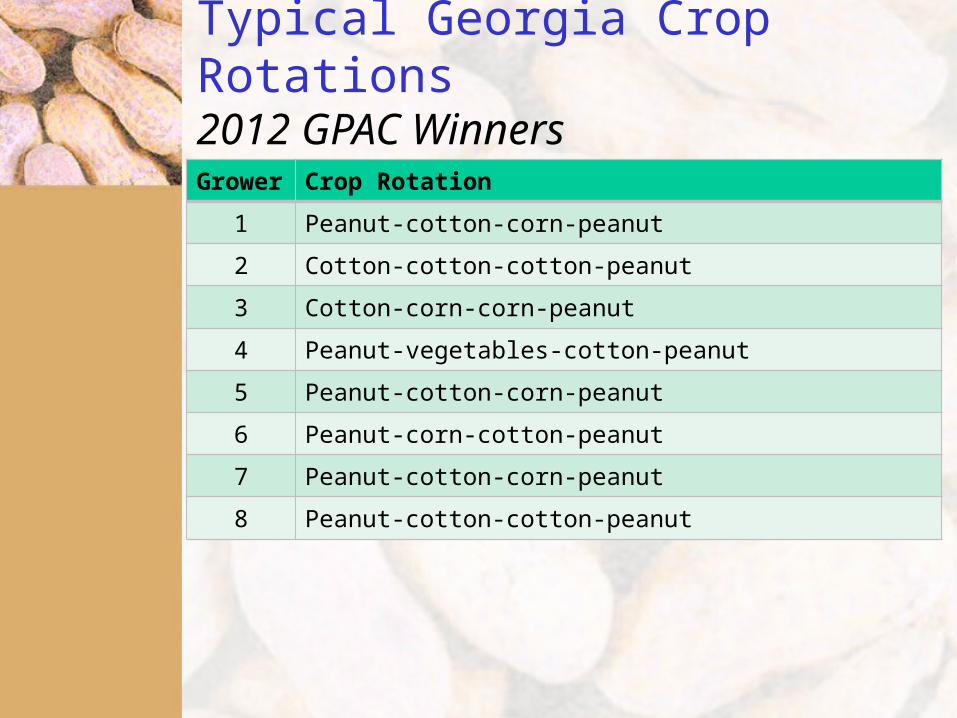
Typical Georgia Crop Rotations2012 GPAC Winners
Grower Crop Rotation
1 Peanut-cotton-corn-peanut
2 Cotton-cotton-cotton-peanut
3 Cotton-corn-corn-peanut
4 Peanut-vegetables-cotton-peanut
5 Peanut-cotton-corn-peanut
6 Peanut-corn-cotton-peanut
7 Peanut-cotton-corn-peanut
8 Peanut-cotton-cotton-peanut
12
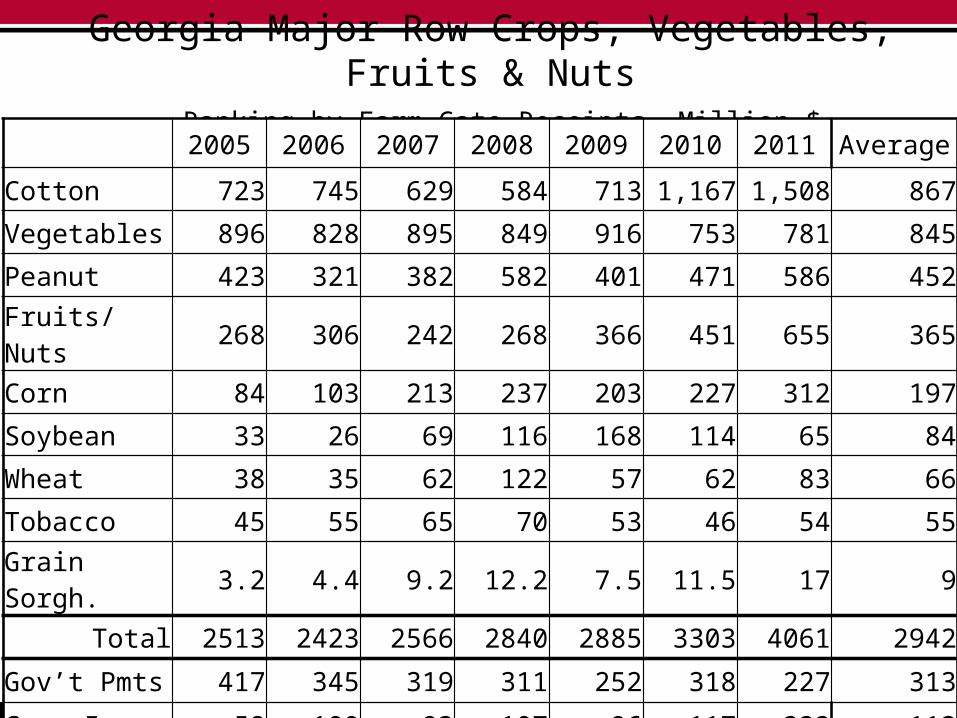
Georgia Major Row Crops, Vegetables, Fruits & Nuts Ranking by Farm Gate Receipts, Million $
2005 2006 2007 2008 2009 2010 2011 Average
Cotton 723 745 629 584 713 1,167 1,508 867
Vegetables 896 828 895 849 916 753 781 845
Peanut 423 321 382 582 401 471 586 452
Fruits/Nuts 268 306 242 268 366 451 655 365
Corn 84 103 213 237 203 227 312 197
Soybean 33 26 69 116 168 114 65 84
Wheat 38 35 62 122 57 62 83 66
Tobacco 45 55 65 70 53 46 54 55
Grain Sorgh. 3.2 4.4 9.2 12.2 7.5 11.5 17 9
Total 2513 2423 2566 2840 2885 3303 4061 2942
Gov’t Pmts 417 345 319 311 252 318 227 313
Crop Ins. 58 100 93 107 96 117 222 113
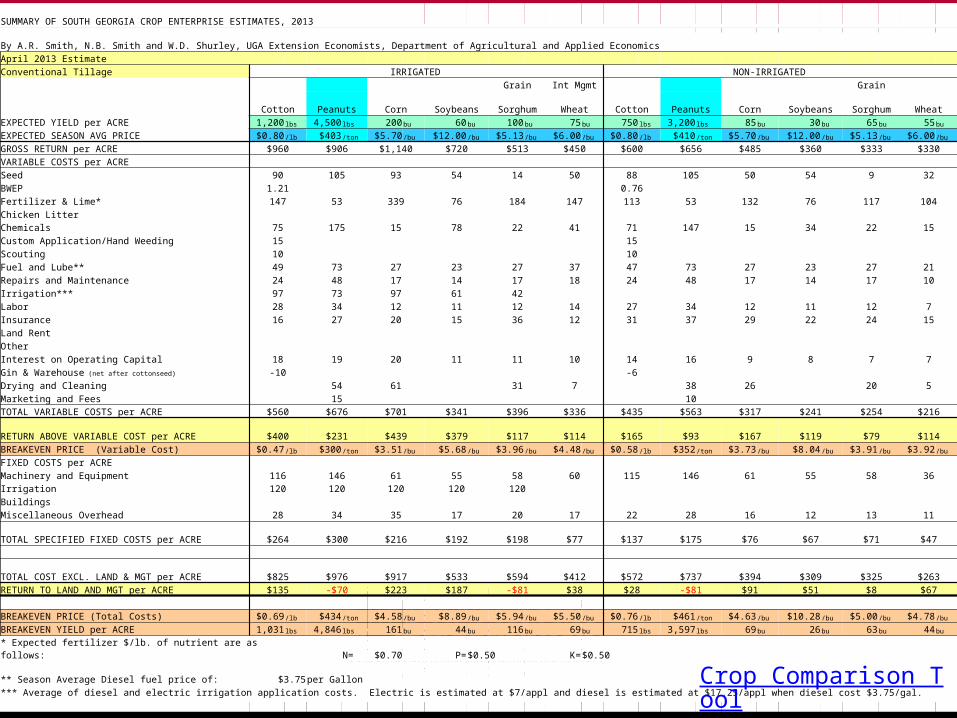
SUMMARY OF SOUTH GEORGIA CROP ENTERPRISE ESTIMATES, 2013
By A.R. Smith, N.B. Smith and W.D. Shurley, UGA Extension Economists, Department of Agricultural and Applied Economics April 2013 Estimate Conventional Tillage IRRIGATED NON-IRRIGATED
Grain Int Mgmt Grain
Cotton Peanuts Corn Soybeans Sorghum Wheat Cotton Peanuts Corn Soybeans Sorghum WheatEXPECTED YIELD per ACRE 1,200 lbs 4,500 lbs 200bu 60bu 100bu 75bu 750 lbs 3,200 lbs 85bu 30bu 65bu 55bu
EXPECTED SEASON AVG PRICE $0.80 /lb $403 /ton $5.70 /bu $12.00 /bu $5.13 /bu $6.00 /bu $0.80 /lb $410 /ton $5.70 /bu $12.00 /bu $5.13 /bu $6.00 /bu
GROSS RETURN per ACRE $960 $906 $1,140 $720 $513 $450 $600 $656 $485 $360 $333 $330VARIABLE COSTS per ACRE Seed 90 105 93 54 14 50 88 105 50 54 9 32BWEP 1.21 0.76 Fertilizer & Lime* 147 53 339 76 184 147 113 53 132 76 117 104Chicken Litter Chemicals 75 175 15 78 22 41 71 147 15 34 22 15Custom Application/Hand Weeding 15 15 Scouting 10 10 Fuel and Lube** 49 73 27 23 27 37 47 73 27 23 27 21Repairs and Maintenance 24 48 17 14 17 18 24 48 17 14 17 10Irrigation*** 97 73 97 61 42 Labor 28 34 12 11 12 14 27 34 12 11 12 7Insurance 16 27 20 15 36 12 31 37 29 22 24 15Land Rent Other Interest on Operating Capital 18 19 20 11 11 10 14 16 9 8 7 7Gin & Warehouse (net after cottonseed) -10 -6 Drying and Cleaning 54 61 31 7 38 26 20 5Marketing and Fees 15 10 TOTAL VARIABLE COSTS per ACRE $560 $676 $701 $341 $396 $336 $435 $563 $317 $241 $254 $216
RETURN ABOVE VARIABLE COST per ACRE $400 $231 $439 $379 $117 $114 $165 $93 $167 $119 $79 $114BREAKEVEN PRICE (Variable Cost) $0.47 /lb $300 /ton $3.51 /bu $5.68 /bu $3.96 /bu $4.48 /bu $0.58 /lb $352 /ton $3.73 /bu $8.04 /bu $3.91 /bu $3.92 /bu
FIXED COSTS per ACRE Machinery and Equipment 116 146 61 55 58 60 115 146 61 55 58 36Irrigation 120 120 120 120 120 Buildings Miscellaneous Overhead 28 34 35 17 20 17 22 28 16 12 13 11
TOTAL SPECIFIED FIXED COSTS per ACRE $264 $300 $216 $192 $198 $77 $137 $175 $76 $67 $71 $47
TOTAL COST EXCL. LAND & MGT per ACRE $825 $976 $917 $533 $594 $412 $572 $737 $394 $309 $325 $263RETURN TO LAND AND MGT per ACRE $135 -$70 $223 $187 -$81 $38 $28 -$81 $91 $51 $8 $67 BREAKEVEN PRICE (Total Costs) $0.69 /lb $434 /ton $4.58 /bu $8.89 /bu $5.94 /bu $5.50 /bu $0.76 /lb $461 /ton $4.63 /bu $10.28 /bu $5.00 /bu $4.78 /bu
BREAKEVEN YIELD per ACRE 1,031 lbs 4,846 lbs 161bu 44bu 116bu 69bu 715 lbs 3,597 lbs 69bu 26bu 63bu 44bu
* Expected fertilizer $/lb. of nutrient are as follows: N= $0.70 P=$0.50 K=$0.50
** Season Average Diesel fuel price of: $3.75per Gallon *** Average of diesel and electric irrigation application costs. Electric is estimated at $7/appl and diesel is estimated at $17.25/appl when diesel cost $3.75/gal. Crop Comparison Tool
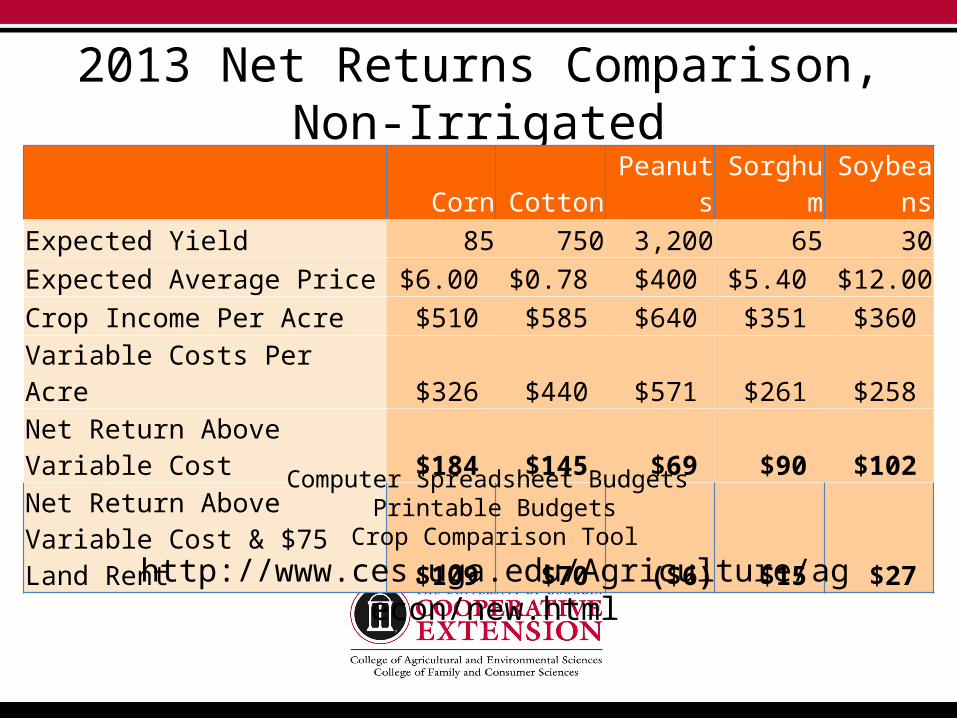
2013 Net Returns Comparison, Non-IrrigatedCorn Cotton Peanuts Sorghum Soybeans
Expected Yield 85 750 3,200 65 30Expected Average Price $6.00 $0.78 $400 $5.40 $12.00 Crop Income Per Acre $510 $585 $640 $351 $360 Variable Costs Per Acre $326 $440 $571 $261 $258 Net Return Above Variable Cost $184 $145 $69 $90 $102
Net Return Above Variable Cost & $75 Land Rent $109 $70 ($6) $15 $27
Computer Spreadsheet Budgets Printable Budgets
Crop Comparison Tool
http://www.ces.uga.edu/Agriculture/agecon/new.html
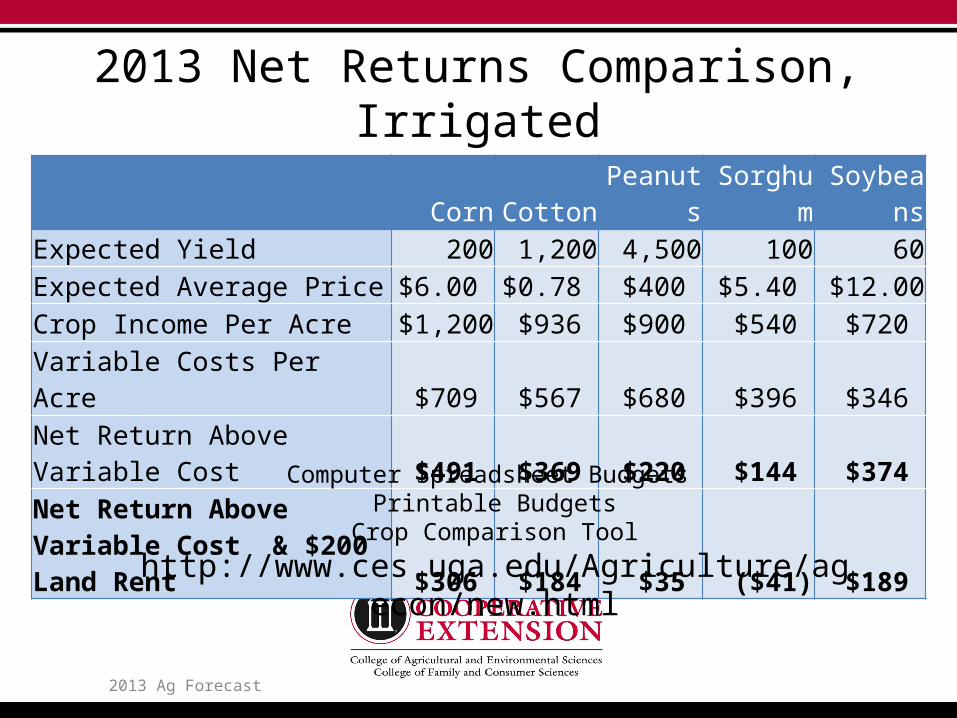
2013 Net Returns Comparison, Irrigated
2013 Ag Forecast
Corn Cotton Peanuts Sorghum SoybeansExpected Yield 200 1,200 4,500 100 60Expected Average Price $6.00 $0.78 $400 $5.40 $12.00 Crop Income Per Acre $1,200 $936 $900 $540 $720 Variable Costs Per Acre $709 $567 $680 $396 $346 Net Return Above Variable Cost $491 $369 $220 $144 $374
Net Return Above Variable Cost & $200 Land Rent $306 $184 $35 ($41) $189
Computer Spreadsheet Budgets Printable Budgets
Crop Comparison Tool
http://www.ces.uga.edu/Agriculture/agecon/new.html
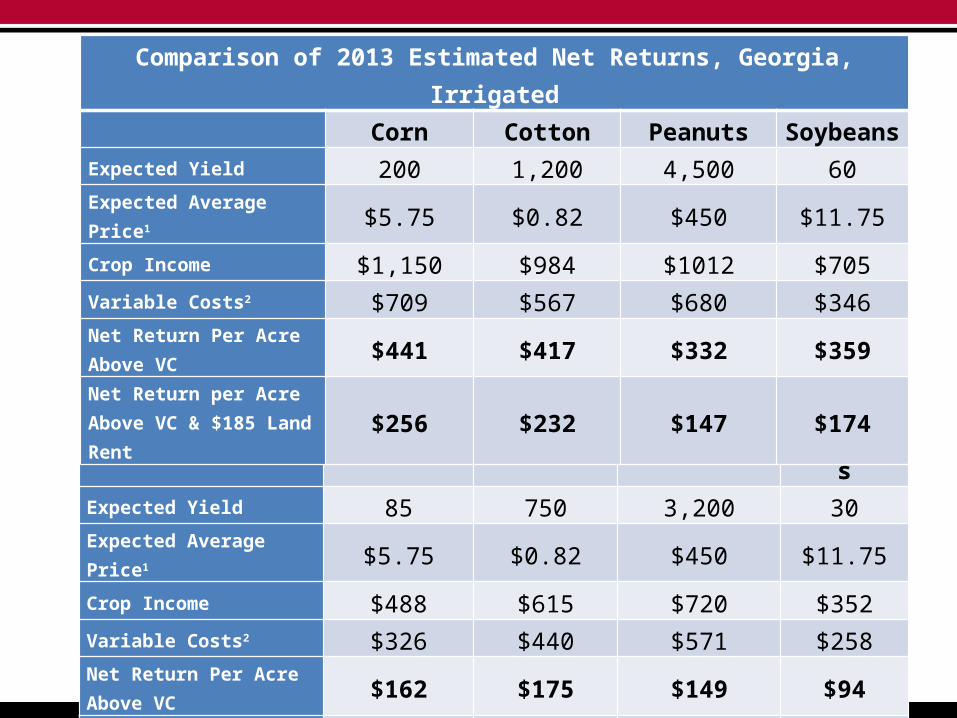
Comparison of 2013 Estimated Net Returns, Georgia, Non-Irrigated Corn Cotton Peanuts SoybeansExpected Yield 85 750 3,200 30Expected Average Price1 $5.75 $0.82 $450 $11.75Crop Income $488 $615 $720 $352Variable Costs2 $326 $440 $571 $258Net Return Per Acre Above VC $162 $175 $149 $94Net Return Per Acre Above VC + $75 Land Rent $87 $100 $74 $191/ Basis the futures prices as of1/15/2013. Peanut price is expected average price.
2/ Assumes Jan 2013 costs, Crop Comparison Tool, Department of Agricultural and Applied Economics, University of Georgia
Comparison of 2013 Estimated Net Returns, Georgia, Irrigated Corn Cotton Peanuts SoybeansExpected Yield 200 1,200 4,500 60Expected Average Price1 $5.75 $0.82 $450 $11.75Crop Income $1,150 $984 $1012 $705Variable Costs2 $709 $567 $680 $346Net Return Per Acre Above VC $441 $417 $332 $359Net Return per Acre Above VC & $185 Land Rent $256 $232 $147 $174
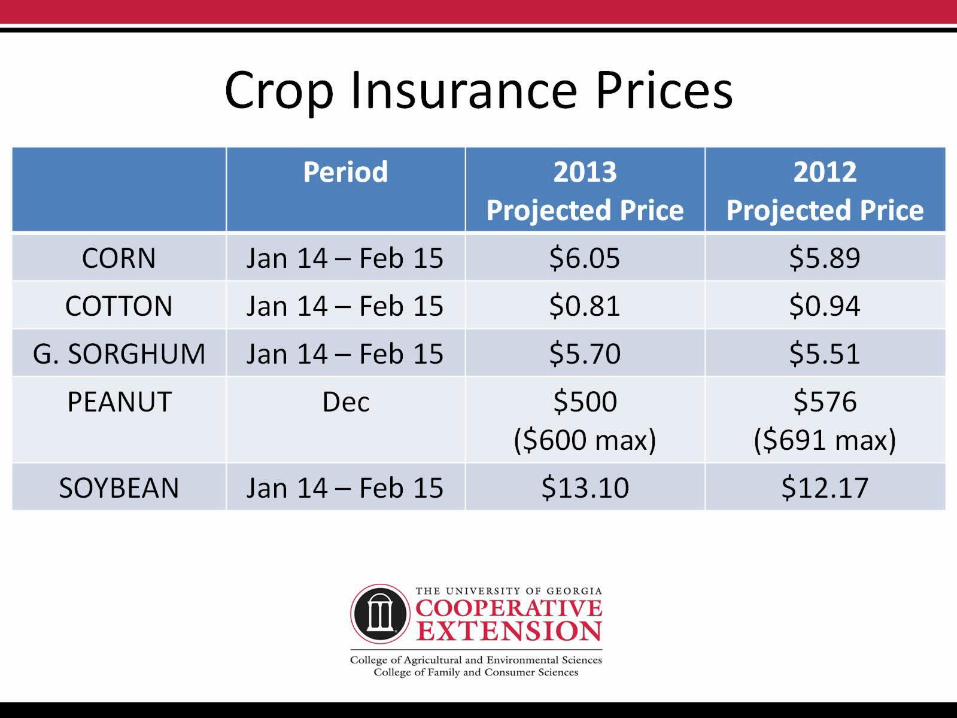
Crop Insurance Prices
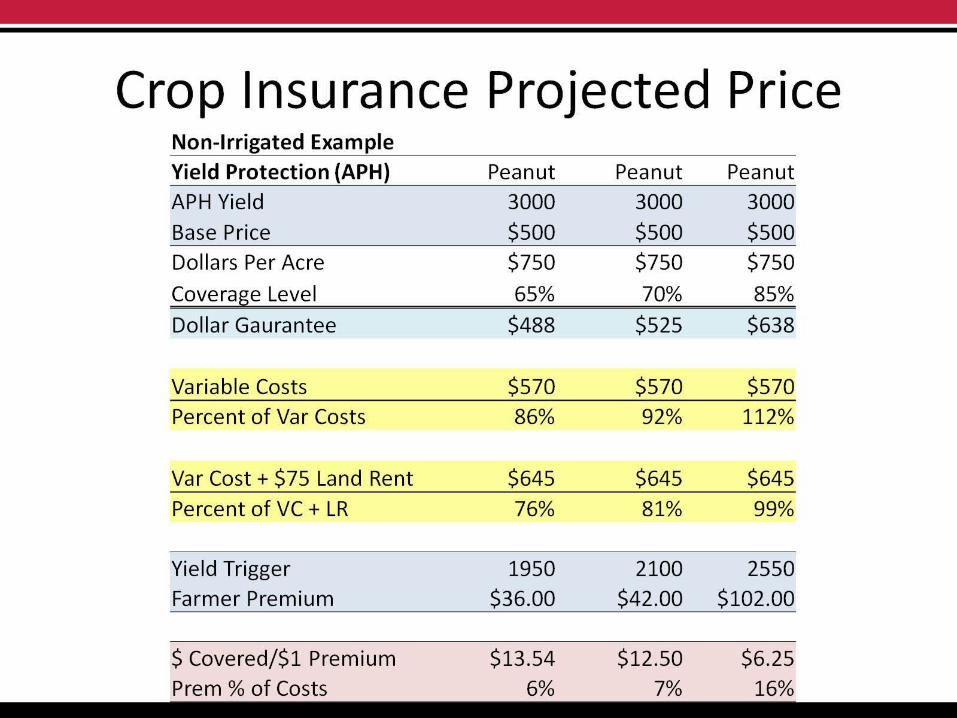
Crop Insurance Projected Price
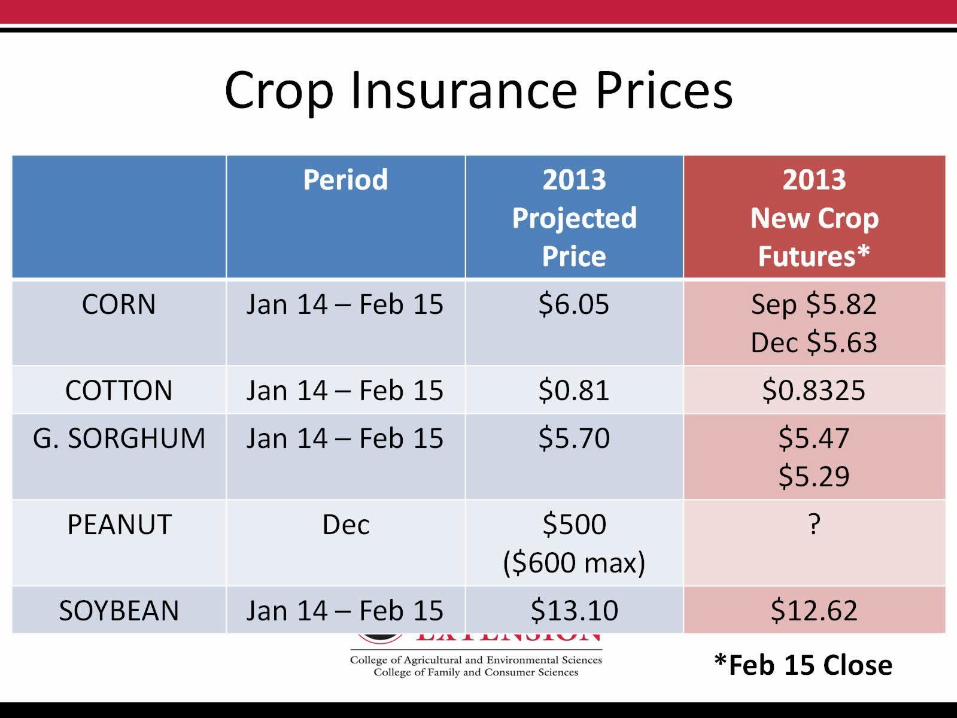
Crop Insurance Prices
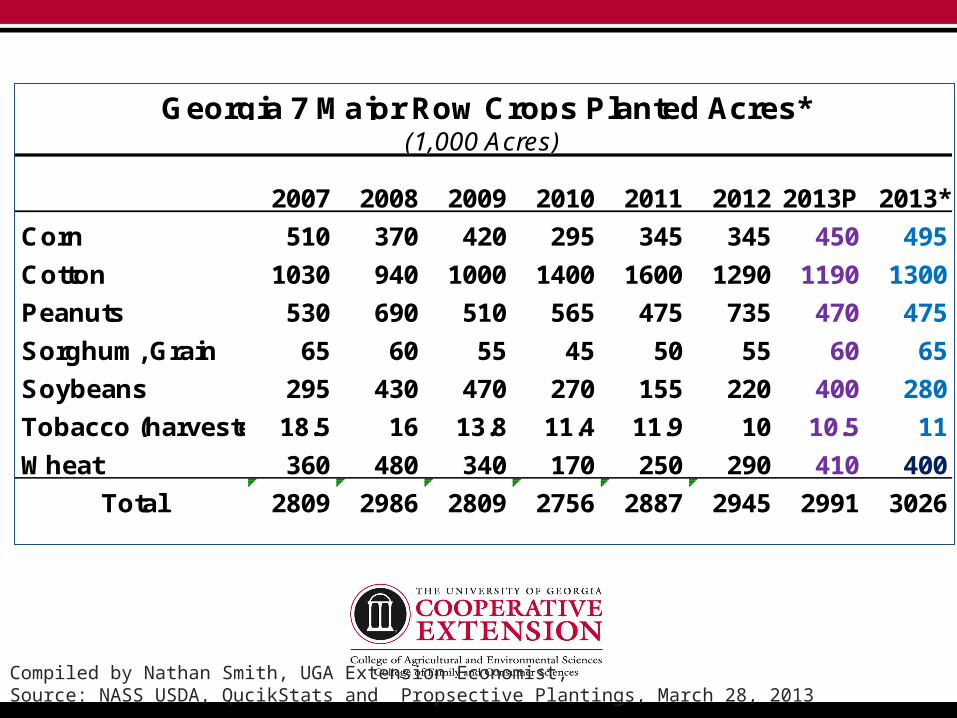
Compiled by Nathan Smith, UGA Extension Economist, Source: NASS USDA, QucikStats and Propsective Plantings, March 28, 2013
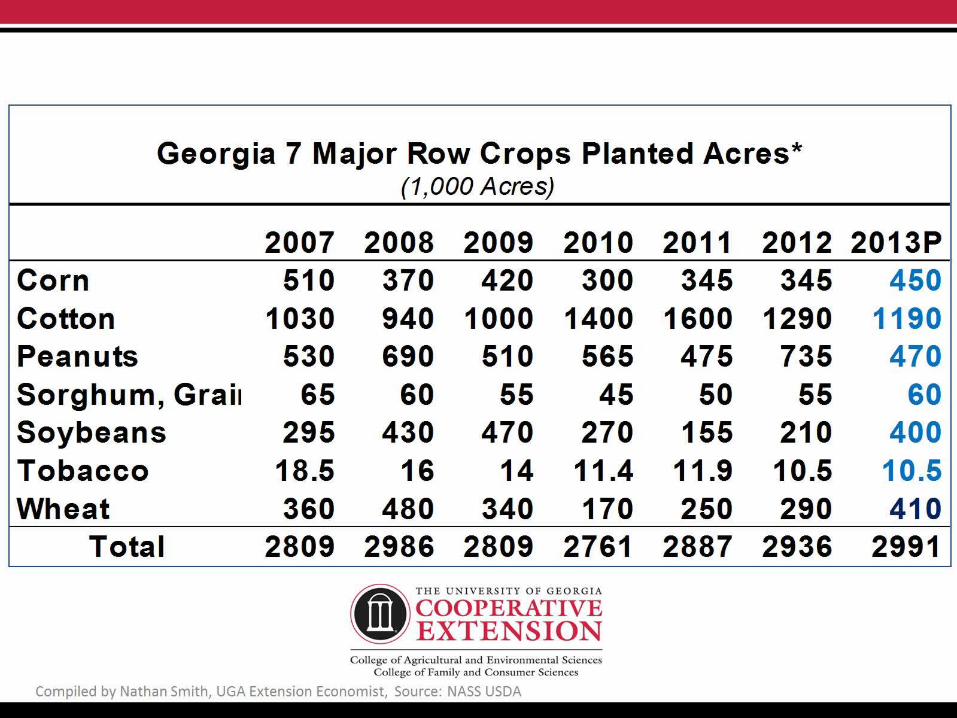
2007 2008 2009 2010 2011 2012 2013P 2013*
Corn 510 370 420 295 345 345 450 495
Cotton 1030 940 1000 1400 1600 1290 1190 1300
Peanuts 530 690 510 565 475 735 470 475
Sorghum, Grain 65 60 55 45 50 55 60 65
Soybeans 295 430 470 270 155 220 400 280
Tobacco (harvested)18.5 16 13.8 11.4 11.9 10 10.5 11
Wheat 360 480 340 170 250 290 410 400
Total 2809 2986 2809 2756 2887 2945 2991 3026
Georgia 7 Major Row Crops Planted Acres*(1,000 Acres)
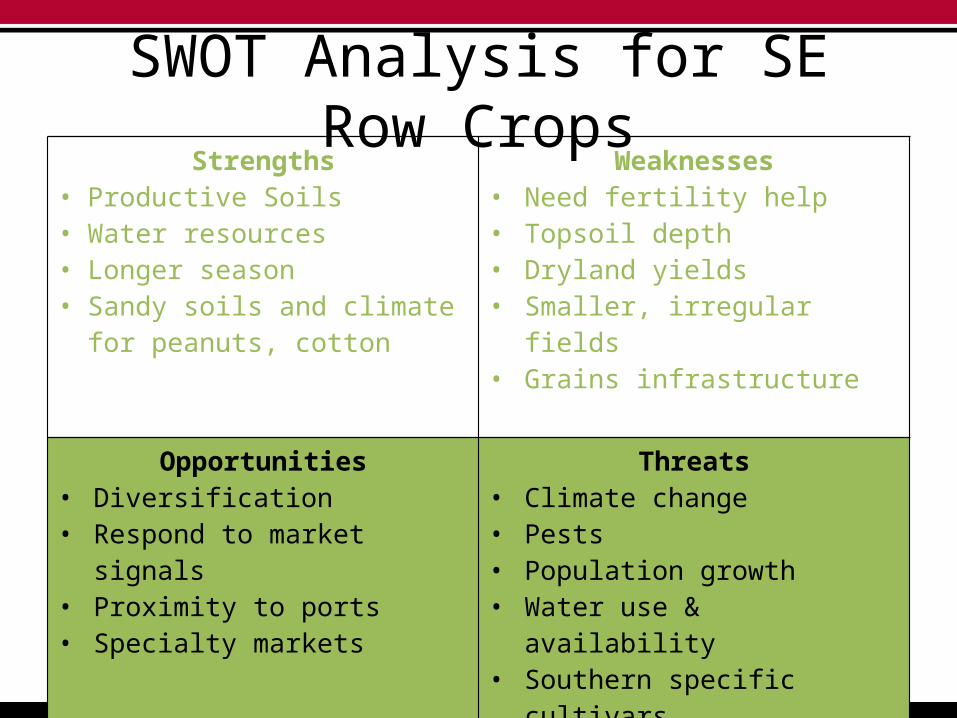
SWOT Analysis for SE Row CropsStrengths
• Productive Soils• Water resources• Longer season• Sandy soils and climate for
peanuts, cotton
Weaknesses• Need fertility help• Topsoil depth• Dryland yields • Smaller, irregular fields• Grains infrastructure
Opportunities• Diversification• Respond to market signals• Proximity to ports• Specialty markets
Threats• Climate change• Pests• Population growth• Water use & availability• Southern specific cultivars