Embed Size (px)
Citation preview
ACRE UPDATEEstimates as of
February 9, 2010
Ron Haugen/Dwight Aakre
Farm Management Specialists
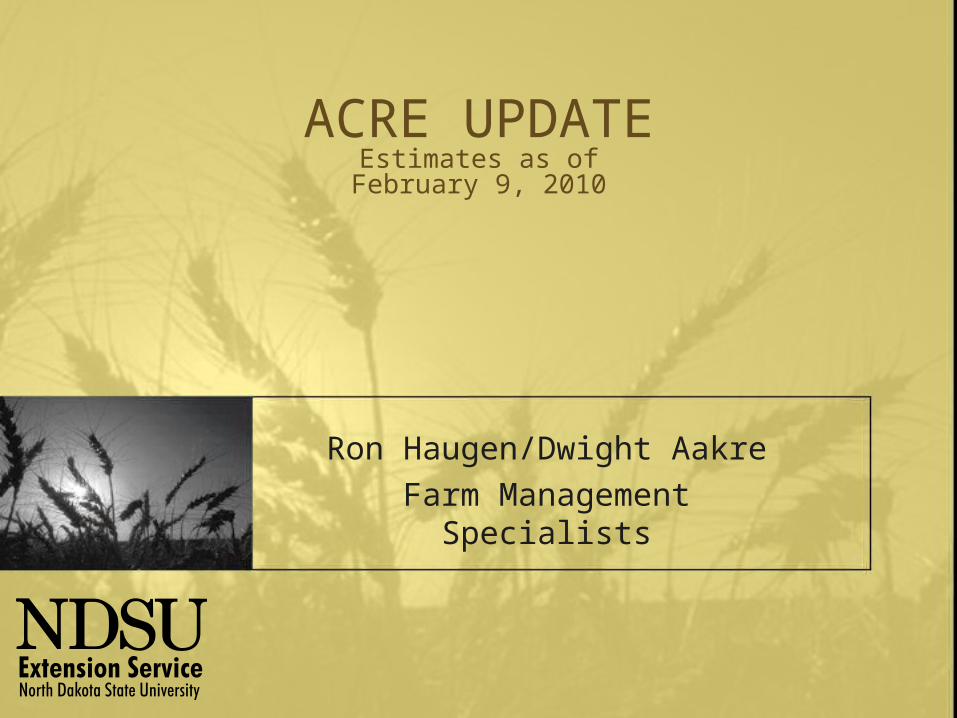
Percent of FSA Farms and Base Acres Enrolled in ACRE, 2009
ACRE Enrollment MN MT ND SD
Percent of Farms 6 4 10 18
Percent of Base Acres 10 10 15 26
Illinois, Iowa, Nebraska, Oklahoma had 55.9% of total enrolled farms
2
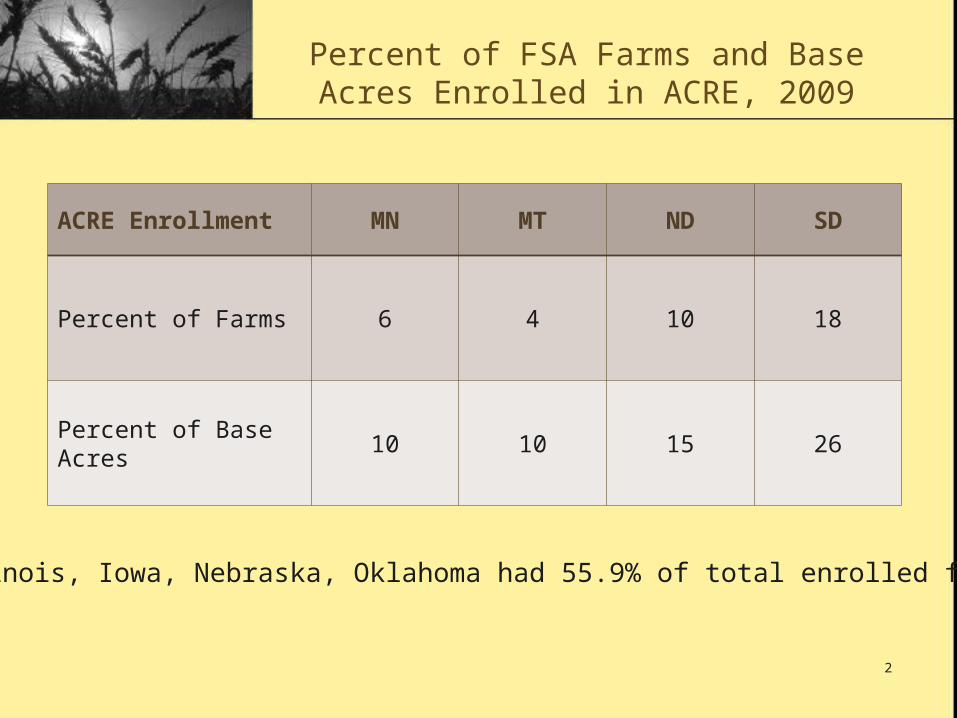
Ranking of Base Acres Enrolled in ACRE and Percent of Base, 2009
Crop Rank MN % MT % ND % SD %
1 Corn - 11 Wheat - 9 Wheat - 13 Corn - 26
2 Soybeans - 12 Barley - 11 Soybeans - 38 Wheat - 28
3 Wheat - 7 Corn - 32 Soybeans - 26
3
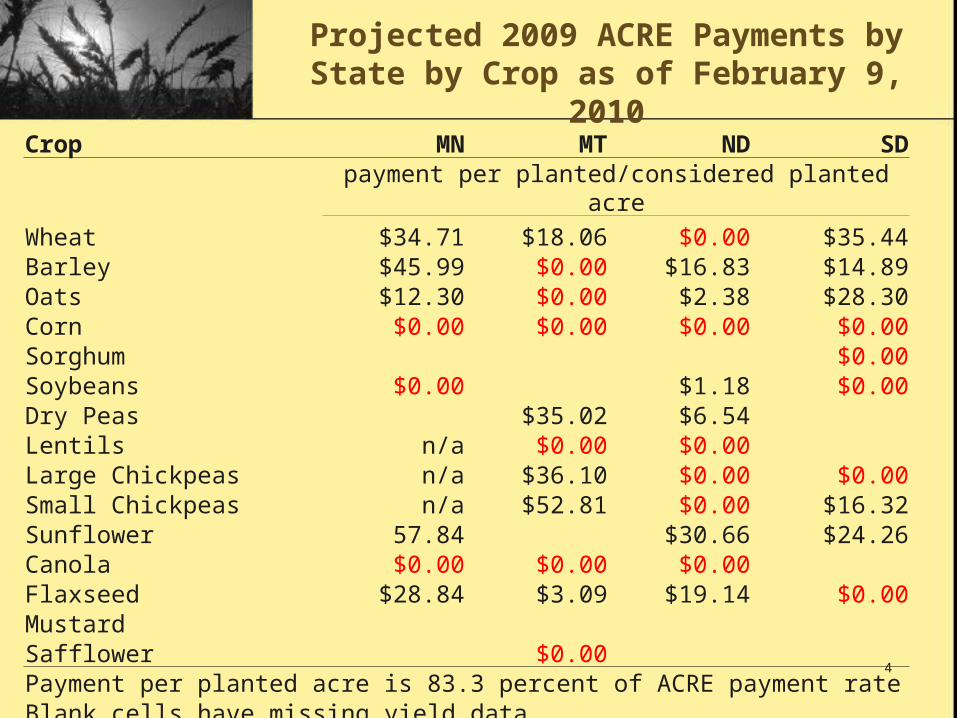
Crop MN MT ND SD
payment per planted/considered planted acre
Wheat $34.71 $18.06 $0.00 $35.44Barley $45.99 $0.00 $16.83 $14.89Oats $12.30 $0.00 $2.38 $28.30Corn $0.00 $0.00 $0.00 $0.00Sorghum $0.00Soybeans $0.00 $1.18 $0.00Dry Peas $35.02 $6.54Lentils n/a $0.00 $0.00Large Chickpeas n/a $36.10 $0.00 $0.00Small Chickpeas n/a $52.81 $0.00 $16.32Sunflower 57.84 $30.66 $24.26Canola $0.00 $0.00 $0.00Flaxseed $28.84 $3.09 $19.14 $0.00MustardSafflower $0.00 Payment per planted acre is 83.3 percent of ACRE payment rateBlank cells have missing yield data
Projected 2009 ACRE Payments by State by Crop as of February 9,
2010
4
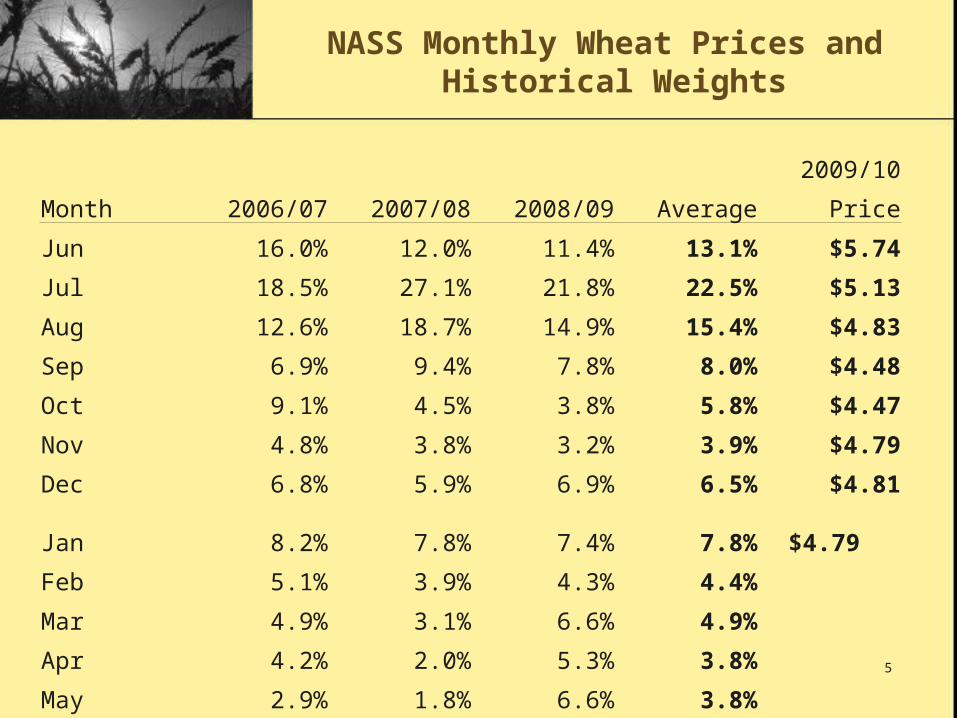
NASS Monthly Wheat Prices and Historical Weights
2009/10
Month 2006/07 2007/08 2008/09 Average Price
Jun 16.0% 12.0% 11.4% 13.1% $5.74
Jul 18.5% 27.1% 21.8% 22.5% $5.13
Aug 12.6% 18.7% 14.9% 15.4% $4.83
Sep 6.9% 9.4% 7.8% 8.0% $4.48
Oct 9.1% 4.5% 3.8% 5.8% $4.47
Nov 4.8% 3.8% 3.2% 3.9% $4.79
Dec 6.8% 5.9% 6.9% 6.5% $4.81
Jan 8.2% 7.8% 7.4% 7.8% $4.79
Feb 5.1% 3.9% 4.3% 4.4%
Mar 4.9% 3.1% 6.6% 4.9%
Apr 4.2% 2.0% 5.3% 3.8%
May 2.9% 1.8% 6.6% 3.8%5
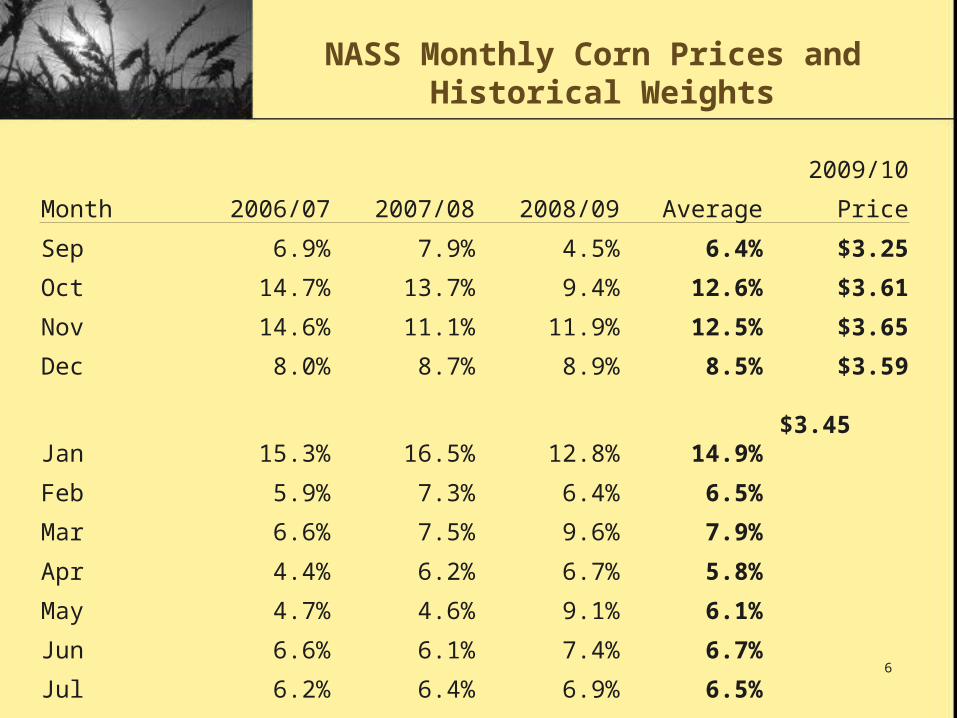
NASS Monthly Corn Prices and Historical Weights
2009/10
Month 2006/07 2007/08 2008/09 Average Price
Sep 6.9% 7.9% 4.5% 6.4% $3.25
Oct 14.7% 13.7% 9.4% 12.6% $3.61
Nov 14.6% 11.1% 11.9% 12.5% $3.65
Dec 8.0% 8.7% 8.9% 8.5% $3.59
Jan 15.3% 16.5% 12.8% 14.9% $3.45
Feb 5.9% 7.3% 6.4% 6.5%
Mar 6.6% 7.5% 9.6% 7.9%
Apr 4.4% 6.2% 6.7% 5.8%
May 4.7% 4.6% 9.1% 6.1%
Jun 6.6% 6.1% 7.4% 6.7%
Jul 6.2% 6.4% 6.9% 6.5%
Aug 6.1% 4.0% 6.4% 5.5%6
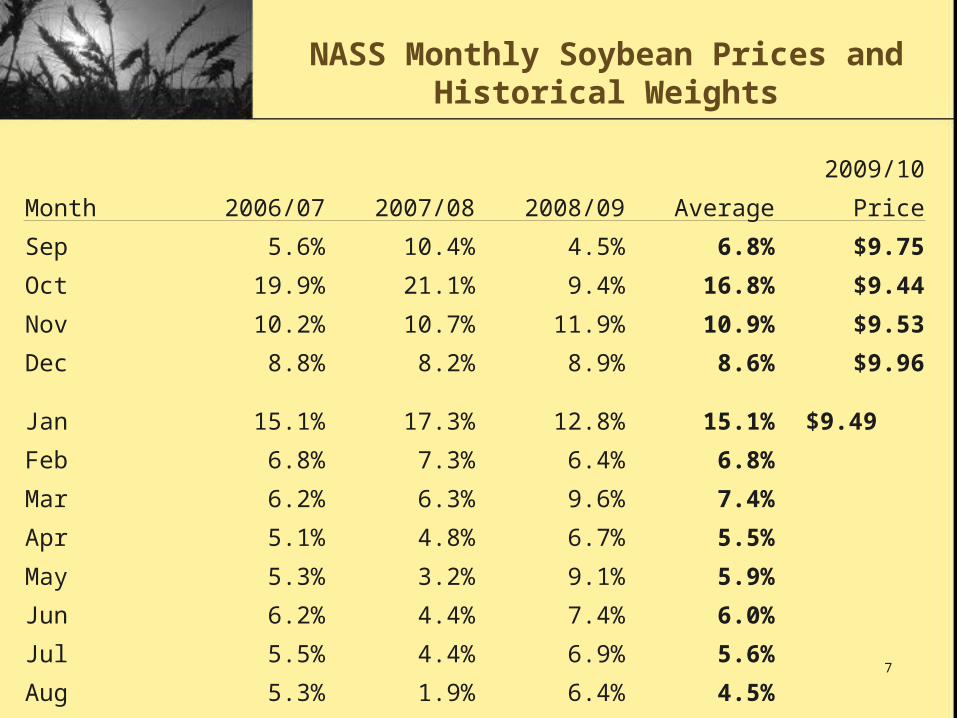
NASS Monthly Soybean Prices and Historical Weights
2009/10
Month 2006/07 2007/08 2008/09 Average Price
Sep 5.6% 10.4% 4.5% 6.8% $9.75
Oct 19.9% 21.1% 9.4% 16.8% $9.44
Nov 10.2% 10.7% 11.9% 10.9% $9.53
Dec 8.8% 8.2% 8.9% 8.6% $9.96
Jan 15.1% 17.3% 12.8% 15.1% $9.49
Feb 6.8% 7.3% 6.4% 6.8%
Mar 6.2% 6.3% 9.6% 7.4%
Apr 5.1% 4.8% 6.7% 5.5%
May 5.3% 3.2% 9.1% 5.9%
Jun 6.2% 4.4% 7.4% 6.0%
Jul 5.5% 4.4% 6.9% 5.6%
Aug 5.3% 1.9% 6.4% 4.5% 7
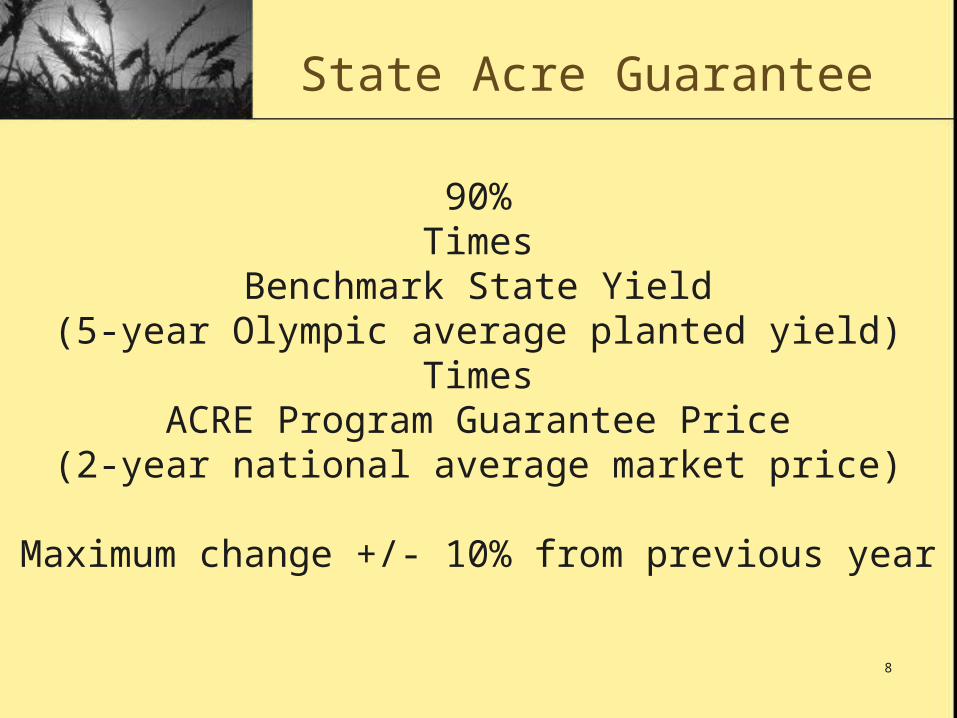
State Acre Guarantee
90%Times
Benchmark State Yield(5-year Olympic average planted yield)
TimesACRE Program Guarantee Price
(2-year national average market price)
Maximum change +/- 10% from previous year
8
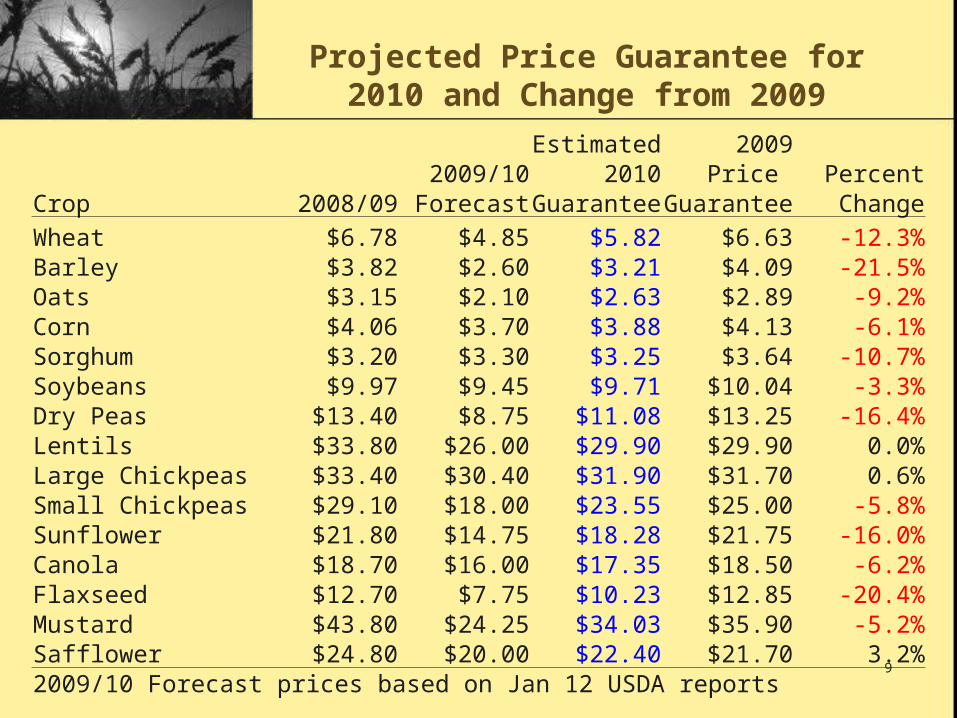
Projected Price Guarantee for 2010 and Change from 2009
Estimated 20092009/10 2010 Price Percent
Crop 2008/09 Forecast Guarantee Guarantee ChangeWheat $6.78 $4.85 $5.82 $6.63 -12.3%Barley $3.82 $2.60 $3.21 $4.09 -21.5%Oats $3.15 $2.10 $2.63 $2.89 -9.2%Corn $4.06 $3.70 $3.88 $4.13 -6.1%Sorghum $3.20 $3.30 $3.25 $3.64 -10.7%Soybeans $9.97 $9.45 $9.71 $10.04 -3.3%Dry Peas $13.40 $8.75 $11.08 $13.25 -16.4%Lentils $33.80 $26.00 $29.90 $29.90 0.0%Large Chickpeas $33.40 $30.40 $31.90 $31.70 0.6%Small Chickpeas $29.10 $18.00 $23.55 $25.00 -5.8%Sunflower $21.80 $14.75 $18.28 $21.75 -16.0%Canola $18.70 $16.00 $17.35 $18.50 -6.2%Flaxseed $12.70 $7.75 $10.23 $12.85 -20.4%Mustard $43.80 $24.25 $34.03 $35.90 -5.2%Safflower $24.80 $20.00 $22.40 $21.70 3.2%2009/10 Forecast prices based on Jan 12 USDA reports
9
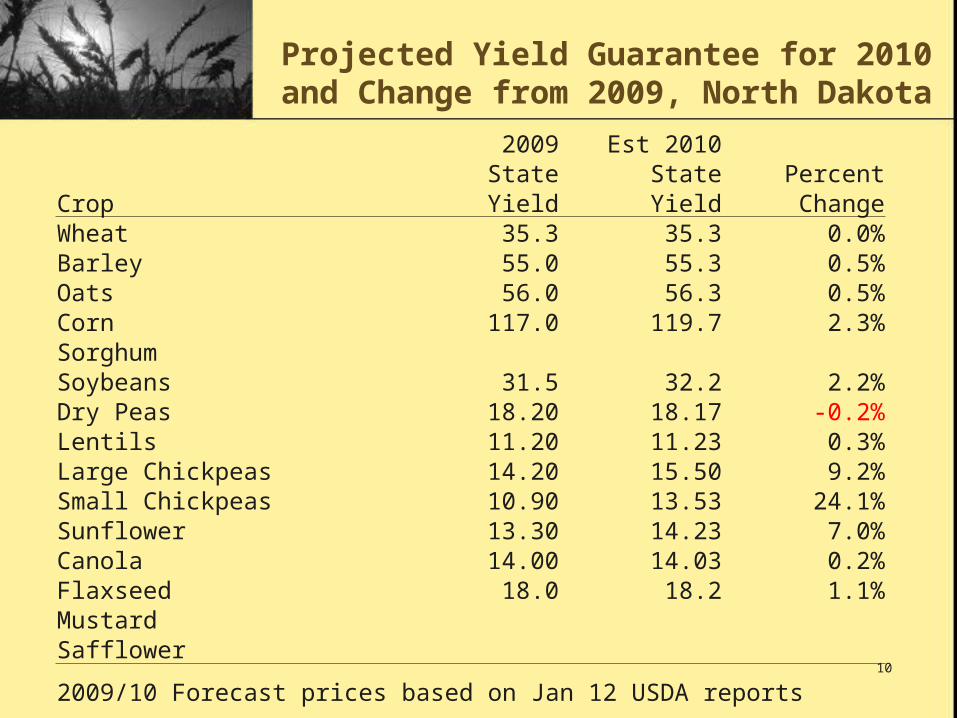
Projected Yield Guarantee for 2010 and Change from 2009, North
Dakota2009 Est 2010State State Percent
Crop Yield Yield ChangeWheat 35.3 35.3 0.0%Barley 55.0 55.3 0.5%Oats 56.0 56.3 0.5%Corn 117.0 119.7 2.3%SorghumSoybeans 31.5 32.2 2.2%Dry Peas 18.20 18.17 -0.2%Lentils 11.20 11.23 0.3%Large Chickpeas 14.20 15.50 9.2%Small Chickpeas 10.90 13.53 24.1%Sunflower 13.30 14.23 7.0%Canola 14.00 14.03 0.2%Flaxseed 18.0 18.2 1.1%MustardSafflower
2009/10 Forecast prices based on Jan 12 USDA reports10
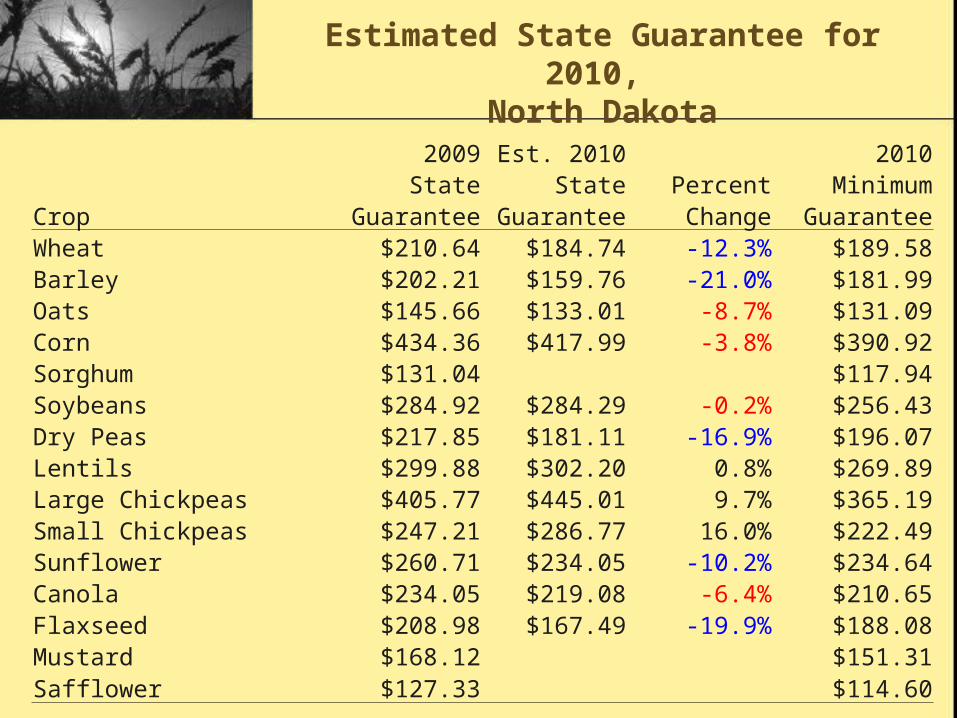
Estimated State Guarantee for 2010, North Dakota
2009 Est. 2010 2010State State Percent Minimum
Crop Guarantee Guarantee Change GuaranteeWheat $210.64 $184.74 -12.3% $189.58Barley $202.21 $159.76 -21.0% $181.99Oats $145.66 $133.01 -8.7% $131.09Corn $434.36 $417.99 -3.8% $390.92Sorghum $131.04 $117.94Soybeans $284.92 $284.29 -0.2% $256.43Dry Peas $217.85 $181.11 -16.9% $196.07Lentils $299.88 $302.20 0.8% $269.89Large Chickpeas $405.77 $445.01 9.7% $365.19Small Chickpeas $247.21 $286.77 16.0% $222.49Sunflower $260.71 $234.05 -10.2% $234.64Canola $234.05 $219.08 -6.4% $210.65Flaxseed $208.98 $167.49 -19.9% $188.08Mustard $168.12 $151.31Safflower $127.33 $114.60
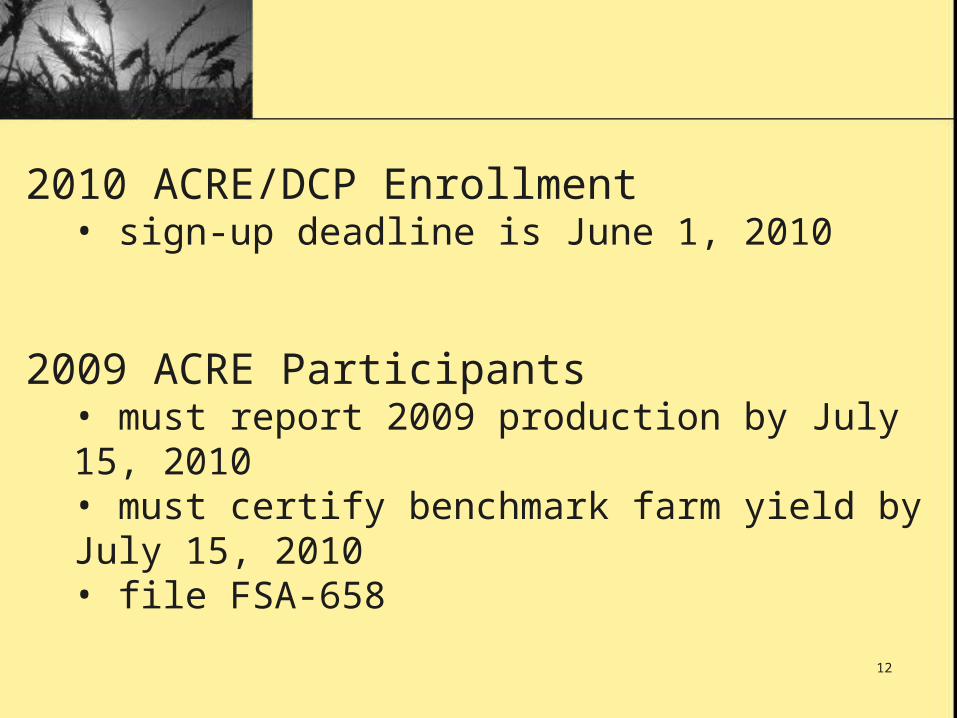
2010 ACRE/DCP Enrollment• sign-up deadline is June 1, 2010
2009 ACRE Participants• must report 2009 production by July 15, 2010• must certify benchmark farm yield by July 15, 2010• file FSA-658
12
NDSU Extension ServiceFarm Management Website
http://www.ag.ndsu.nodak.edu/aginfo/farmmgmt/farmmgmt.htm
Farm Service Agency ACRE Website
http://www.fsa.usda.gov/dcp
13

Thank you,Any Questions?
14