Embed Size (px)
Citation preview
Acquisition Reform: Integrate
Technical Performance with
Earned Value Management
Paul Solomon, PMP Performance-Based Earned Value®
www.PB-EV.com
Abstract 14622 1
NDIA Systems Engineering Conference San Diego October 25, 2012
Agenda
• Link EV to Technical Performance/Quality
• Government Needs and Acquisition Reform
• Standards, Models and DoD Guides
• Practical Application
• Proposed EVM Acquisition Reform
2
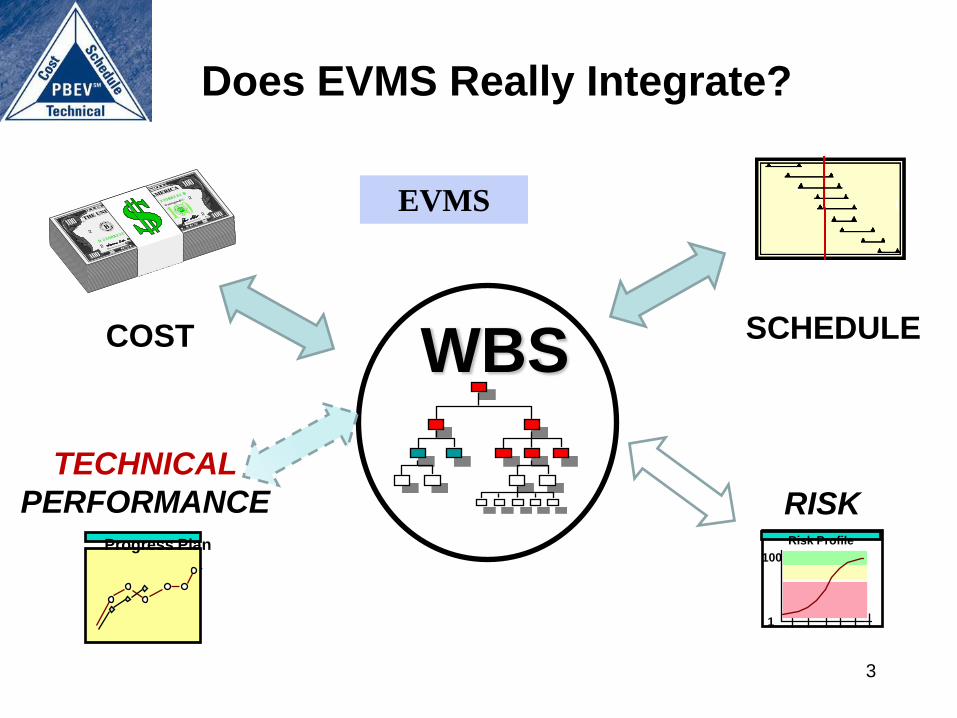
Does EVMS Really Integrate?
WBS
COST SCHEDULE
Progress Plan
TECHNICAL
PERFORMANCE
100
1
Risk Profile
RISK
EVMS
3
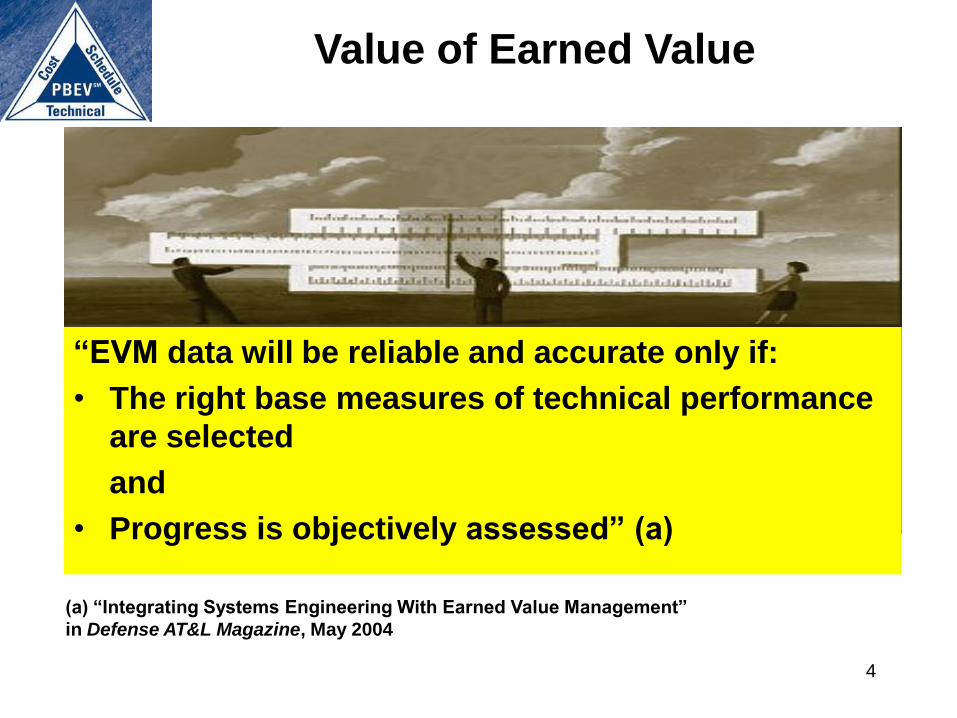
Value of Earned Value
“EVM data will be reliable and accurate only if:
• The right base measures of technical performance
are selected
and
• Progress is objectively assessed” (a)
4
(a) “Integrating Systems Engineering With Earned Value Management”
in Defense AT&L Magazine, May 2004

Government Needs
and
Acquisition Reform
5
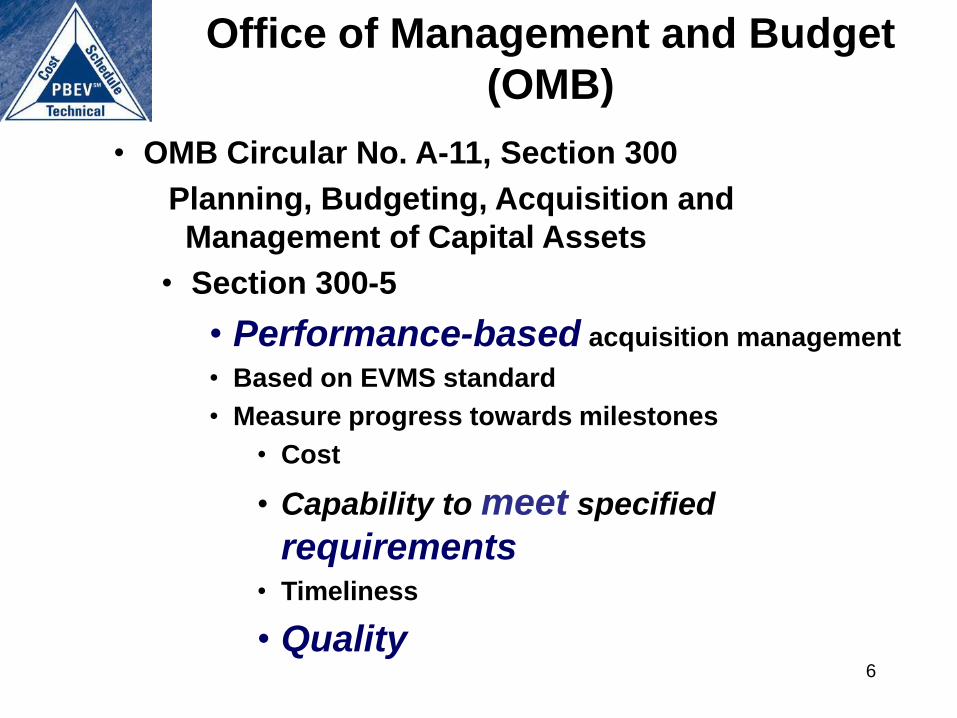
Office of Management and Budget
(OMB)
• OMB Circular No. A-11, Section 300
Planning, Budgeting, Acquisition and
Management of Capital Assets
• Section 300-5
• Performance-based acquisition management
• Based on EVMS standard
• Measure progress towards milestones
• Cost
• Capability to meet specified
requirements • Timeliness
• Quality 6
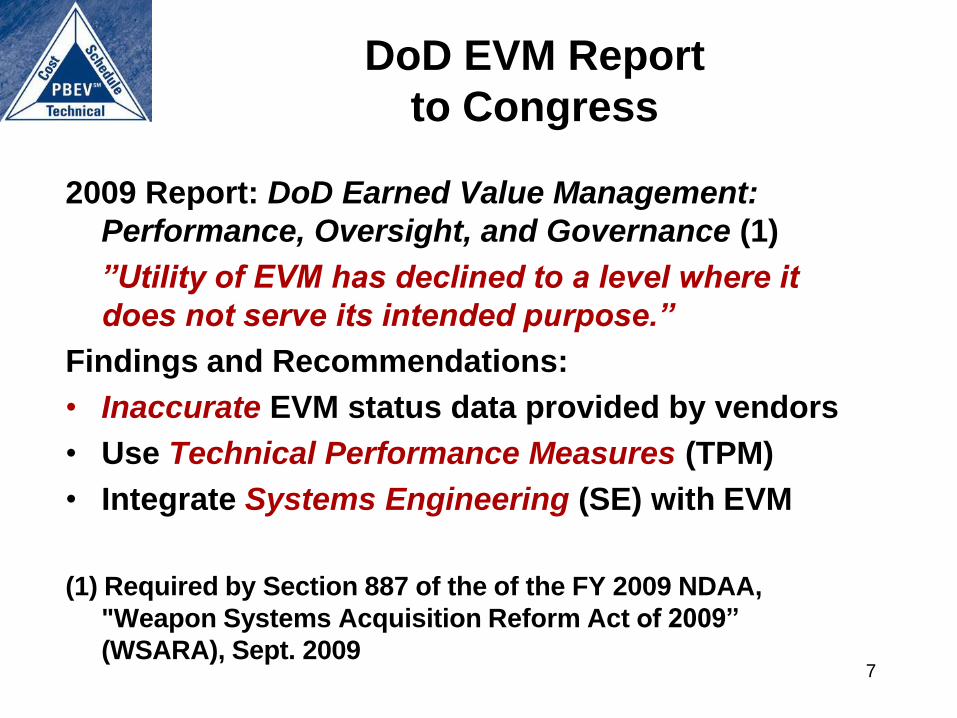
DoD EVM Report
to Congress
2009 Report: DoD Earned Value Management:
Performance, Oversight, and Governance (1)
”Utility of EVM has declined to a level where it
does not serve its intended purpose.”
Findings and Recommendations:
• Inaccurate EVM status data provided by vendors
• Use Technical Performance Measures (TPM)
• Integrate Systems Engineering (SE) with EVM
(1) Required by Section 887 of the of the FY 2009 NDAA,
"Weapon Systems Acquisition Reform Act of 2009”
(WSARA), Sept. 2009
7
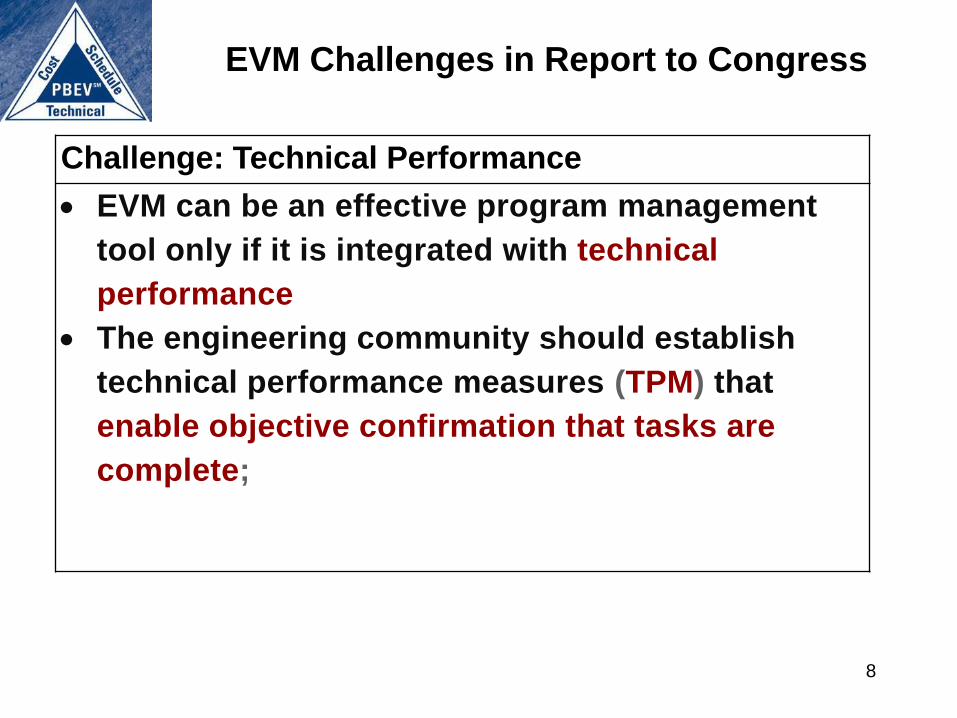
EVM Challenges in Report to Congress
Challenge: Technical Performance
EVM can be an effective program management
tool only if it is integrated with technical
performance
The engineering community should establish
technical performance measures (TPM) that
enable objective confirmation that tasks are
complete;
8
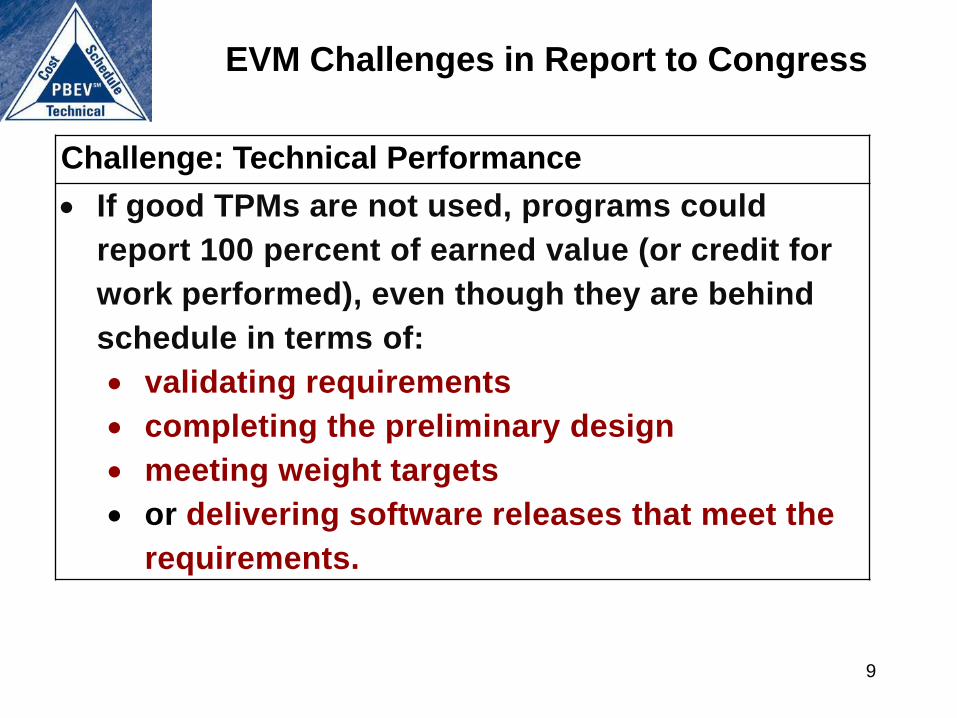
EVM Challenges in Report to Congress
Challenge: Technical Performance
If good TPMs are not used, programs could
report 100 percent of earned value (or credit for
work performed), even though they are behind
schedule in terms of:
validating requirements
completing the preliminary design
meeting weight targets
or delivering software releases that meet the
requirements.
9
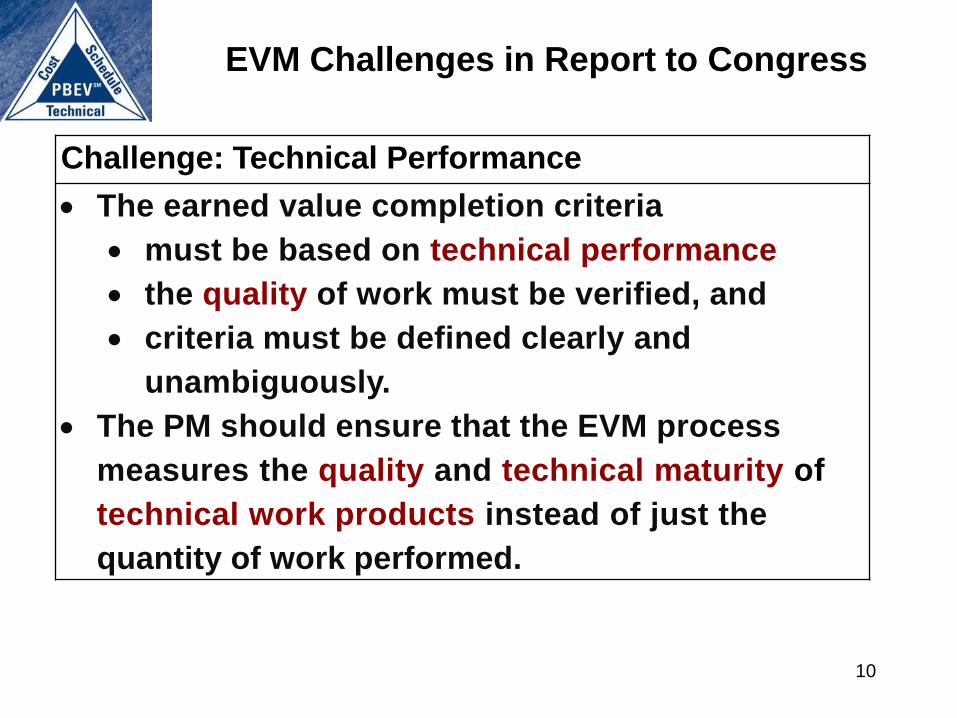
EVM Challenges in Report to Congress
Challenge: Technical Performance
The earned value completion criteria
must be based on technical performance
the quality of work must be verified, and
criteria must be defined clearly and
unambiguously.
The PM should ensure that the EVM process
measures the quality and technical maturity of
technical work products instead of just the
quantity of work performed.
10
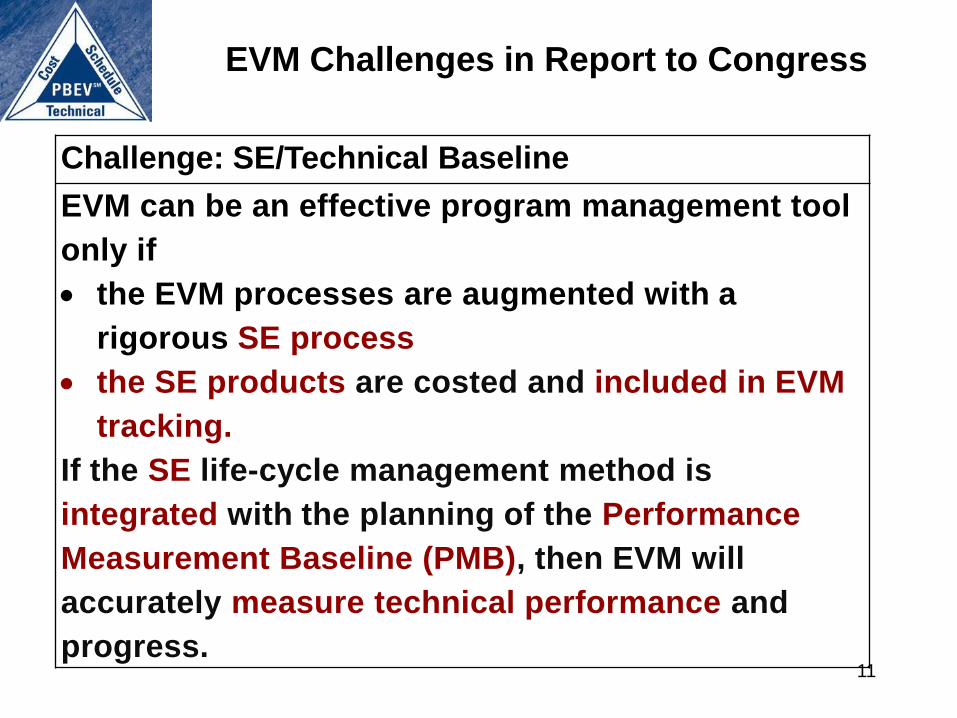
EVM Challenges in Report to Congress
Challenge: SE/Technical Baseline
EVM can be an effective program management tool
only if
the EVM processes are augmented with a
rigorous SE process
the SE products are costed and included in EVM
tracking.
If the SE life-cycle management method is
integrated with the planning of the Performance
Measurement Baseline (PMB), then EVM will
accurately measure technical performance and
progress. 11
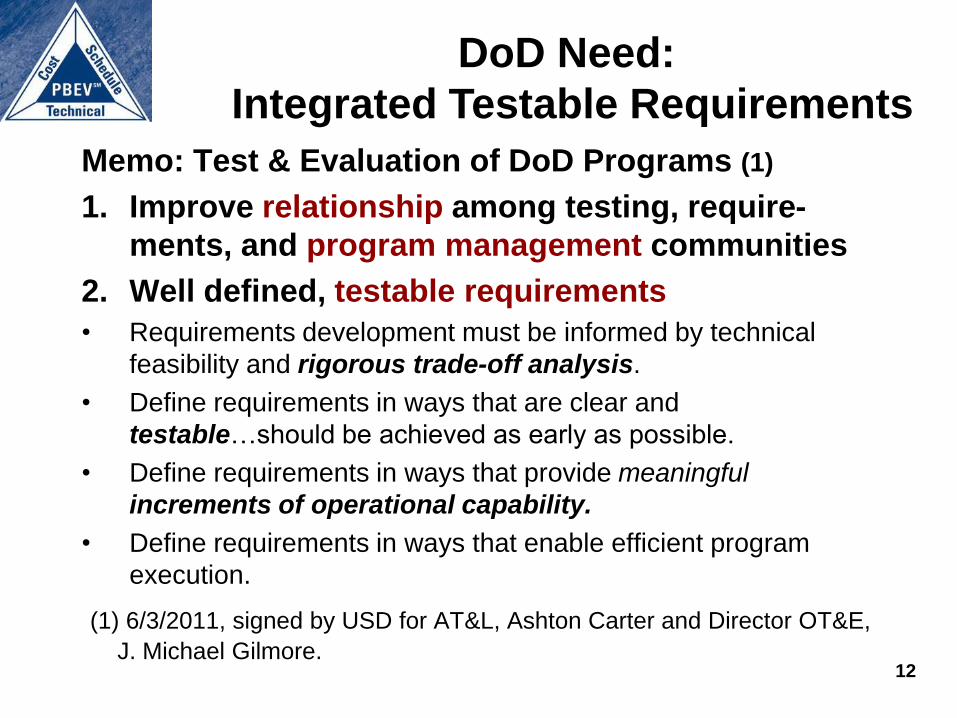
DoD Need:
Integrated Testable Requirements
Memo: Test & Evaluation of DoD Programs (1)
1. Improve relationship among testing, require-
ments, and program management communities
2. Well defined, testable requirements
• Requirements development must be informed by technical
feasibility and rigorous trade-off analysis.
• Define requirements in ways that are clear and
testable…should be achieved as early as possible.
• Define requirements in ways that provide meaningful
increments of operational capability.
• Define requirements in ways that enable efficient program
execution.
(1) 6/3/2011, signed by USD for AT&L, Ashton Carter and Director OT&E,
J. Michael Gilmore.
12
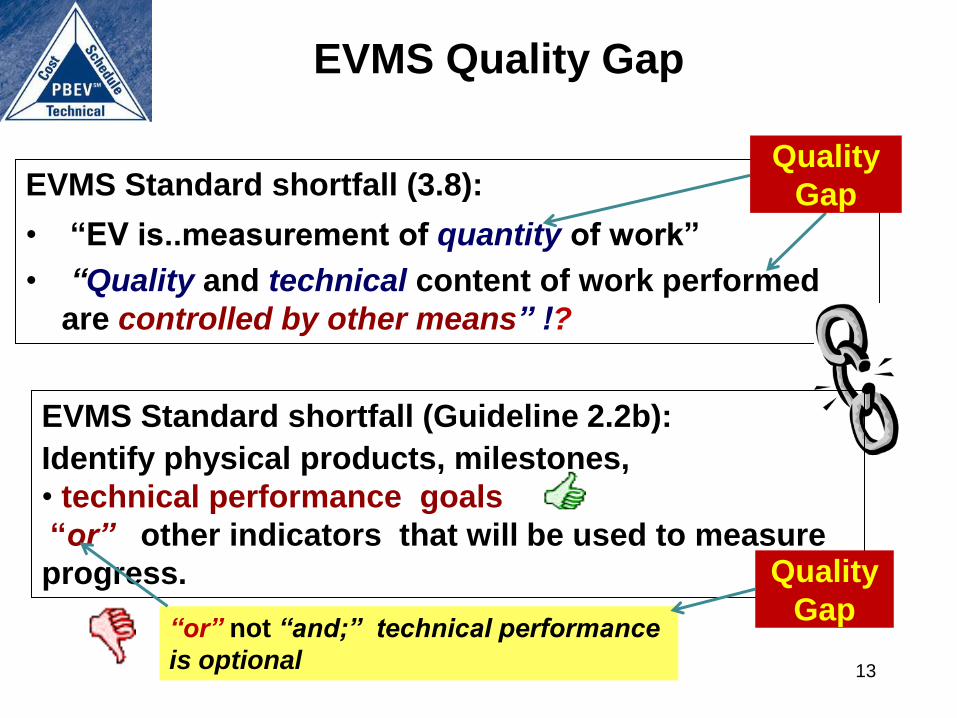
EVMS Quality Gap
EVMS Standard shortfall (3.8):
• “EV is..measurement of quantity of work”
• “Quality and technical content of work performed
are controlled by other means” !?
Quality
Gap
13
EVMS Standard shortfall (Guideline 2.2b):
Identify physical products, milestones,
• technical performance goals
“or” other indicators that will be used to measure
progress. Quality
Gap “or” not “and;” technical performance
is optional
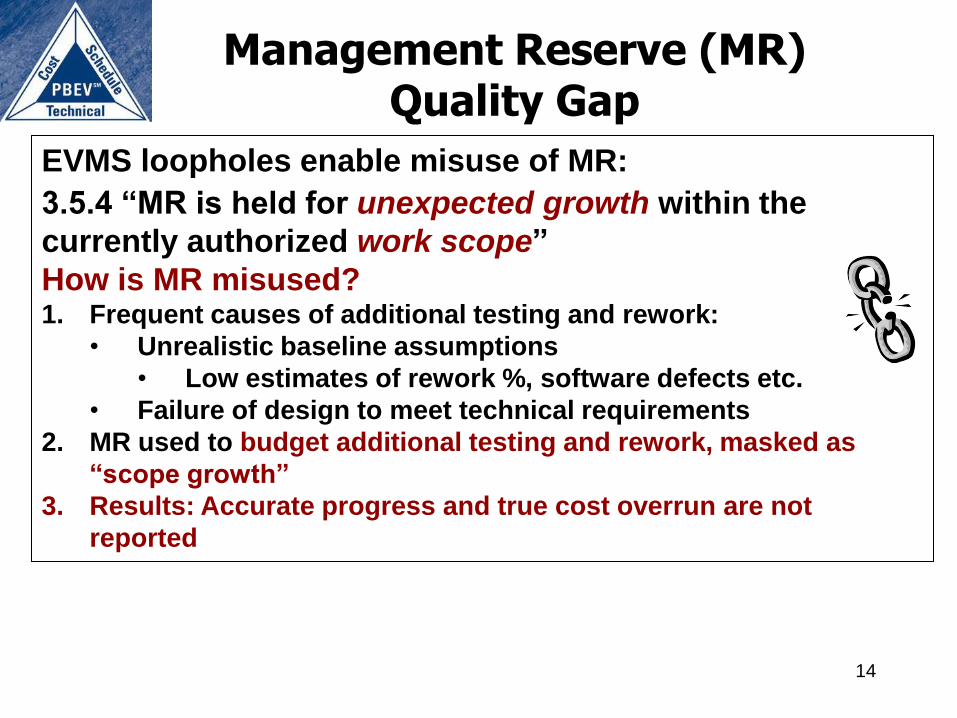
Management Reserve (MR) Quality Gap
EVMS loopholes enable misuse of MR:
3.5.4 “MR is held for unexpected growth within the
currently authorized work scope”
How is MR misused? 1. Frequent causes of additional testing and rework:
• Unrealistic baseline assumptions
• Low estimates of rework %, software defects etc.
• Failure of design to meet technical requirements
2. MR used to budget additional testing and rework, masked as
“scope growth”
3. Results: Accurate progress and true cost overrun are not
reported
14
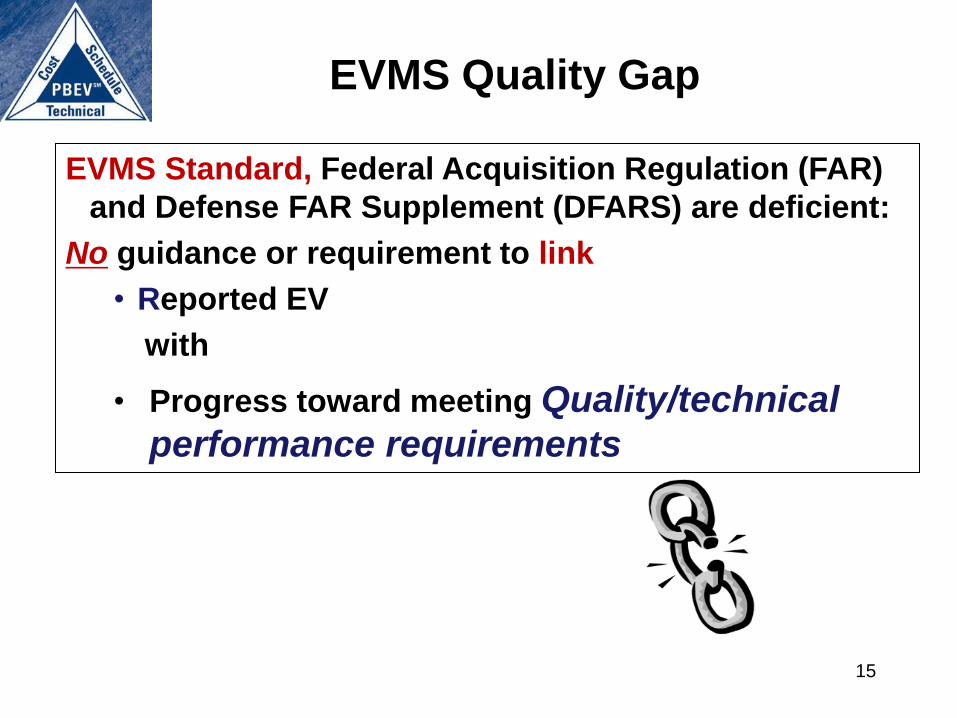
EVMS Quality Gap
EVMS Standard, Federal Acquisition Regulation (FAR)
and Defense FAR Supplement (DFARS) are deficient:
No guidance or requirement to link
• Reported EV
with
• Progress toward meeting Quality/technical
performance requirements
15
Guidance in
Standards, Models,
and DoD Guides
16
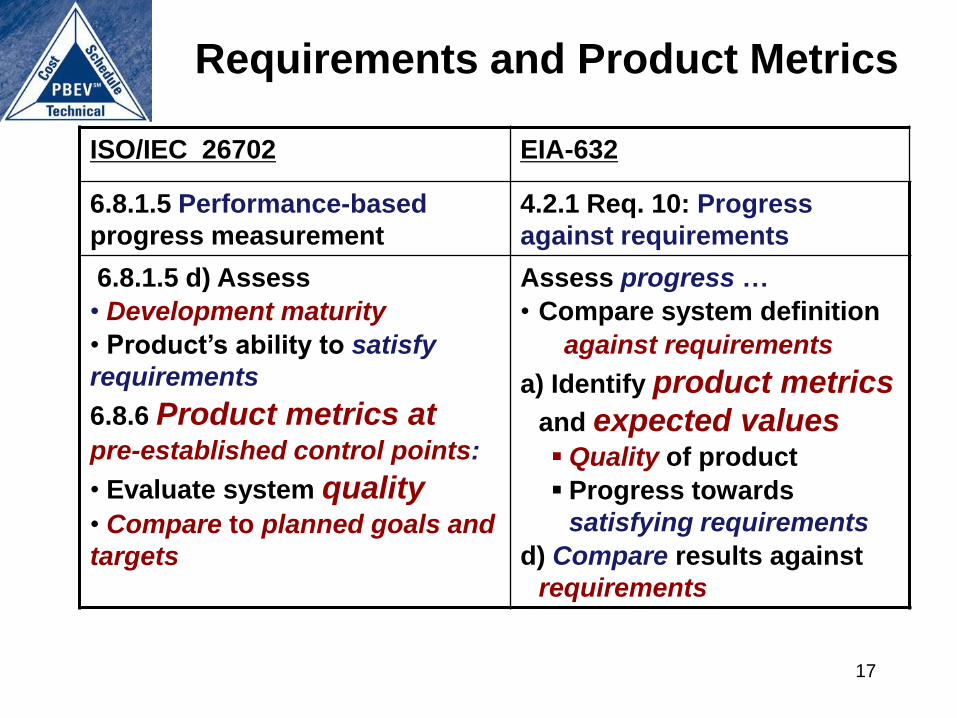
Requirements and Product Metrics
ISO/IEC 26702 EIA-632
6.8.1.5 Performance-based
progress measurement
4.2.1 Req. 10: Progress
against requirements
6.8.1.5 d) Assess
• Development maturity
• Product’s ability to satisfy
requirements
6.8.6 Product metrics at pre-established control points:
• Evaluate system quality • Compare to planned goals and
targets
Assess progress …
• Compare system definition
against requirements
a) Identify product metrics
and expected values Quality of product
Progress towards
satisfying requirements
d) Compare results against
requirements
17
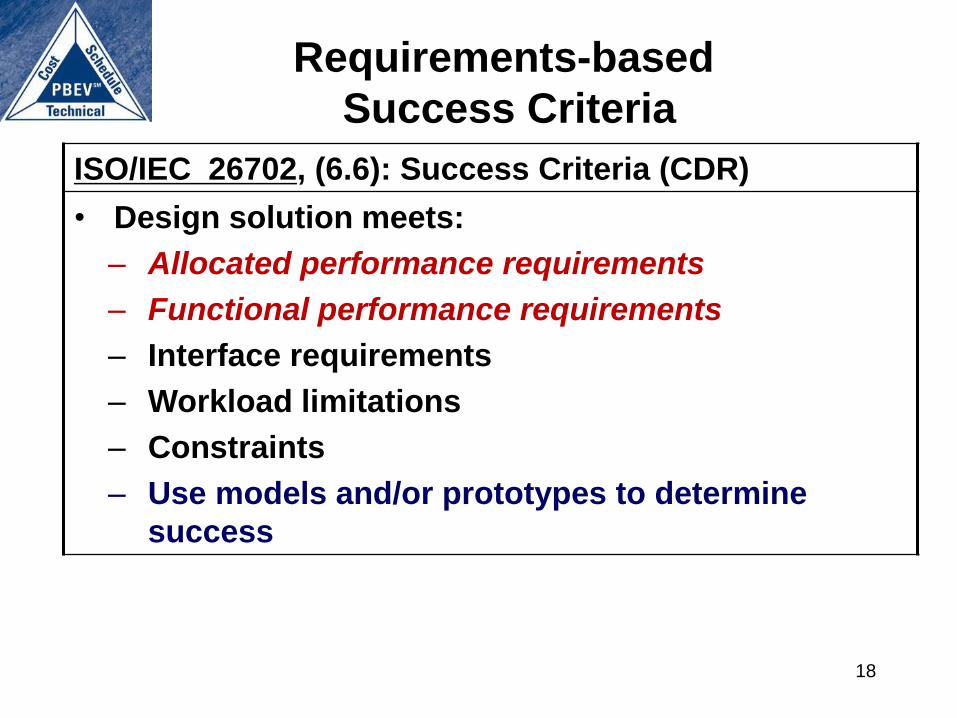
Requirements-based
Success Criteria
ISO/IEC 26702, (6.6): Success Criteria (CDR)
• Design solution meets:
– Allocated performance requirements
– Functional performance requirements
– Interface requirements
– Workload limitations
– Constraints
– Use models and/or prototypes to determine
success
18
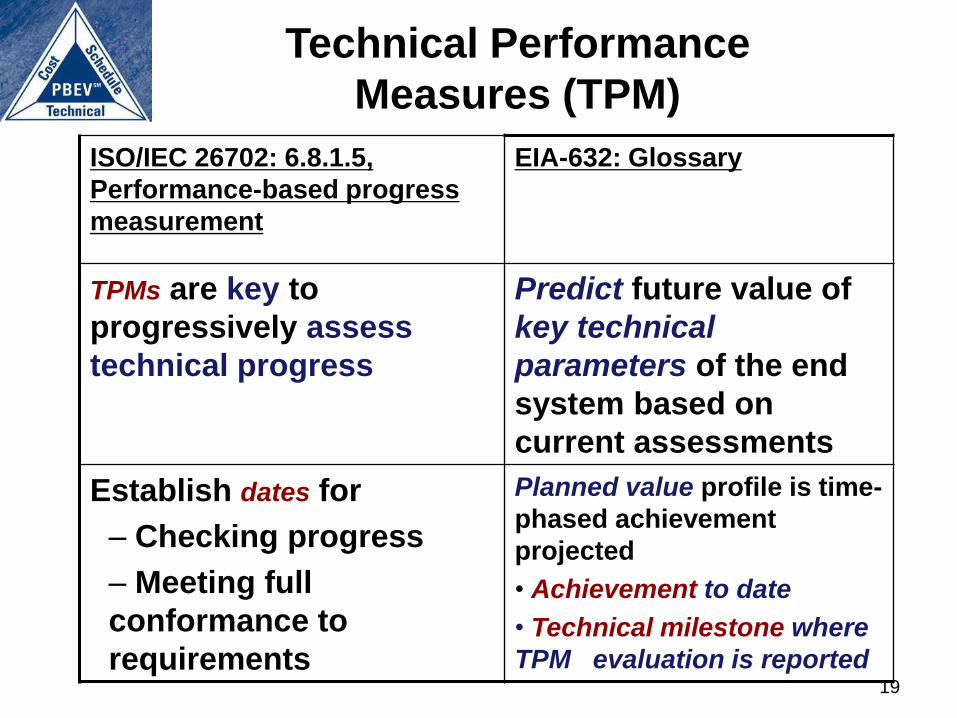
Technical Performance
Measures (TPM)
ISO/IEC 26702: 6.8.1.5,
Performance-based progress
measurement
EIA-632: Glossary
TPMs are key to
progressively assess
technical progress
Predict future value of
key technical
parameters of the end
system based on
current assessments
Establish dates for
– Checking progress
– Meeting full
conformance to
requirements
Planned value profile is time-
phased achievement
projected
• Achievement to date
• Technical milestone where
TPM evaluation is reported 19
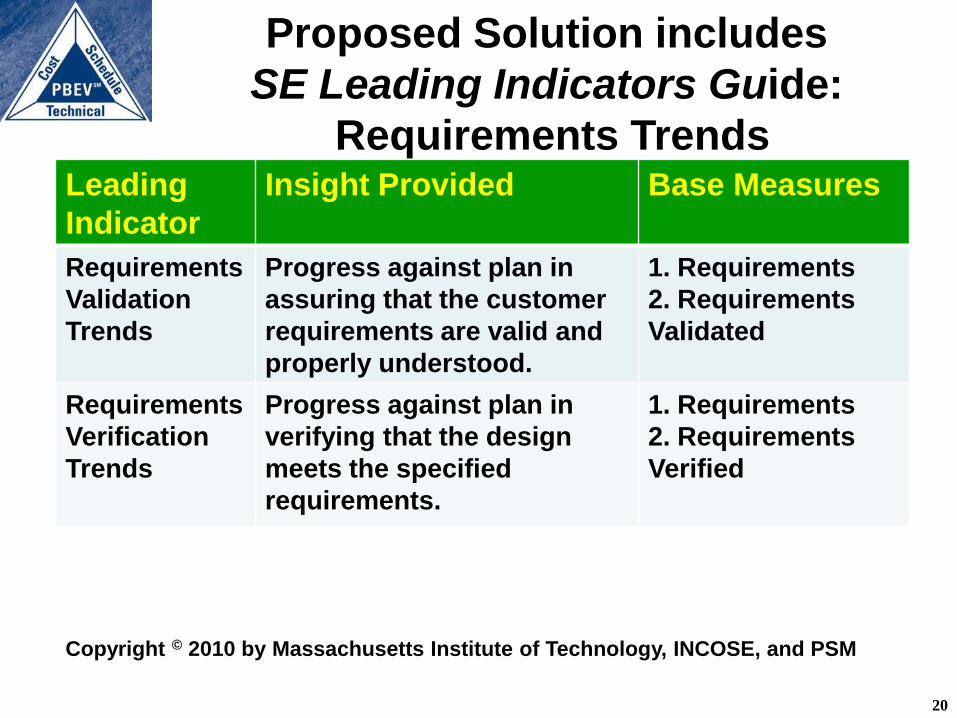
Proposed Solution includes
SE Leading Indicators Guide:
Requirements Trends
20
Leading
Indicator
Insight Provided Base Measures
Requirements
Validation
Trends
Progress against plan in
assuring that the customer
requirements are valid and
properly understood.
1. Requirements
2. Requirements
Validated
Requirements
Verification
Trends
Progress against plan in
verifying that the design
meets the specified
requirements.
1. Requirements
2. Requirements
Verified
Copyright © 2010 by Massachusetts Institute of Technology, INCOSE, and PSM
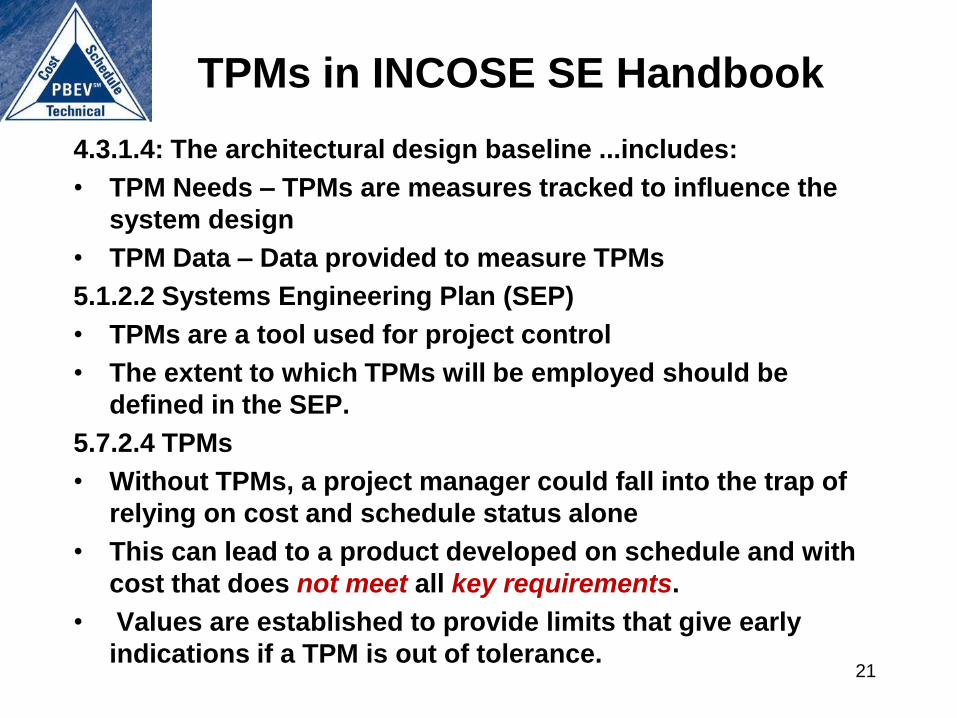
TPMs in INCOSE SE Handbook
4.3.1.4: The architectural design baseline ...includes:
• TPM Needs – TPMs are measures tracked to influence the
system design
• TPM Data – Data provided to measure TPMs
5.1.2.2 Systems Engineering Plan (SEP)
• TPMs are a tool used for project control
• The extent to which TPMs will be employed should be
defined in the SEP.
5.7.2.4 TPMs
• Without TPMs, a project manager could fall into the trap of
relying on cost and schedule status alone
• This can lead to a product developed on schedule and with
cost that does not meet all key requirements.
• Values are established to provide limits that give early
indications if a TPM is out of tolerance.
21
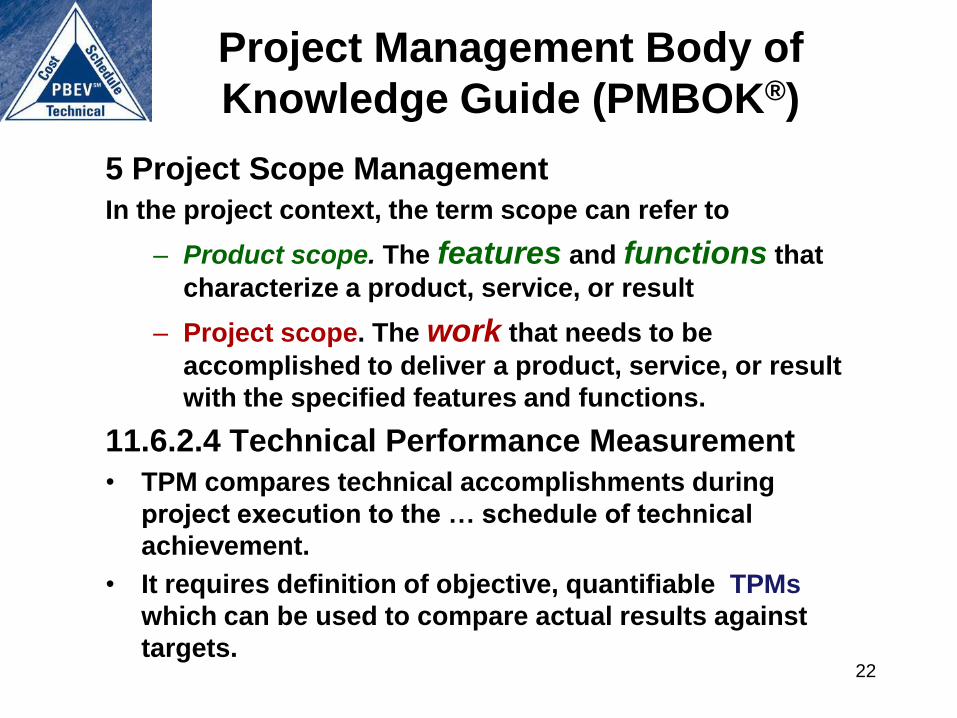
Project Management Body of
Knowledge Guide (PMBOK®)
5 Project Scope Management
In the project context, the term scope can refer to
– Product scope. The features and functions that
characterize a product, service, or result
– Project scope. The work that needs to be
accomplished to deliver a product, service, or result
with the specified features and functions.
11.6.2.4 Technical Performance Measurement
• TPM compares technical accomplishments during
project execution to the … schedule of technical
achievement.
• It requires definition of objective, quantifiable TPMs
which can be used to compare actual results against
targets.
22
23
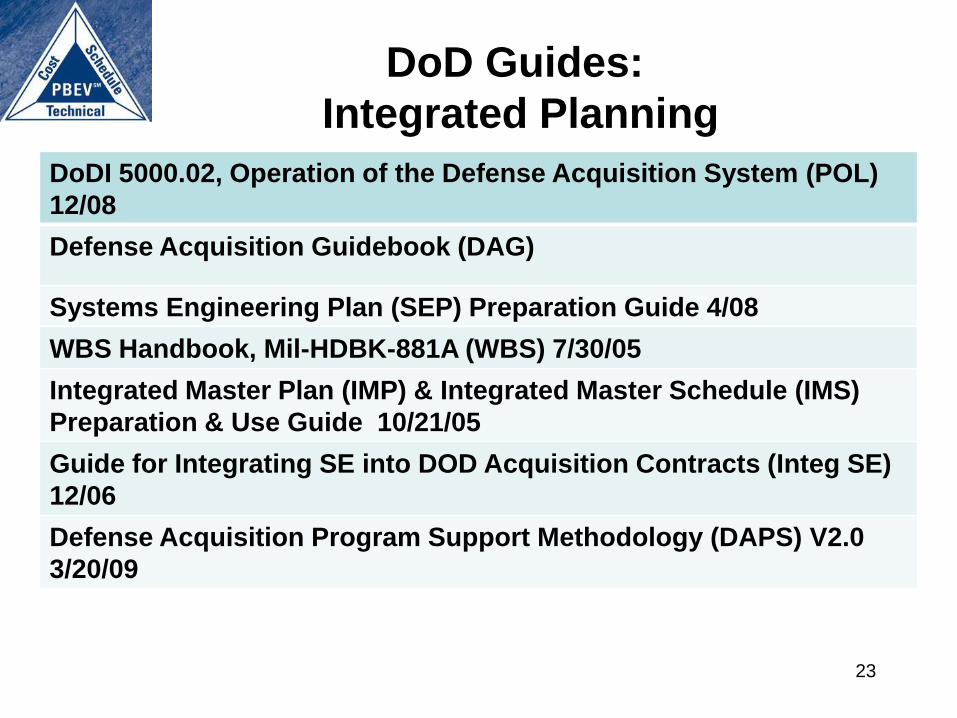
DoD Guides:
Integrated Planning
DoDI 5000.02, Operation of the Defense Acquisition System (POL)
12/08
Defense Acquisition Guidebook (DAG)
Systems Engineering Plan (SEP) Preparation Guide 4/08
WBS Handbook, Mil-HDBK-881A (WBS) 7/30/05
Integrated Master Plan (IMP) & Integrated Master Schedule (IMS)
Preparation & Use Guide 10/21/05
Guide for Integrating SE into DOD Acquisition Contracts (Integ SE)
12/06
Defense Acquisition Program Support Methodology (DAPS) V2.0
3/20/09
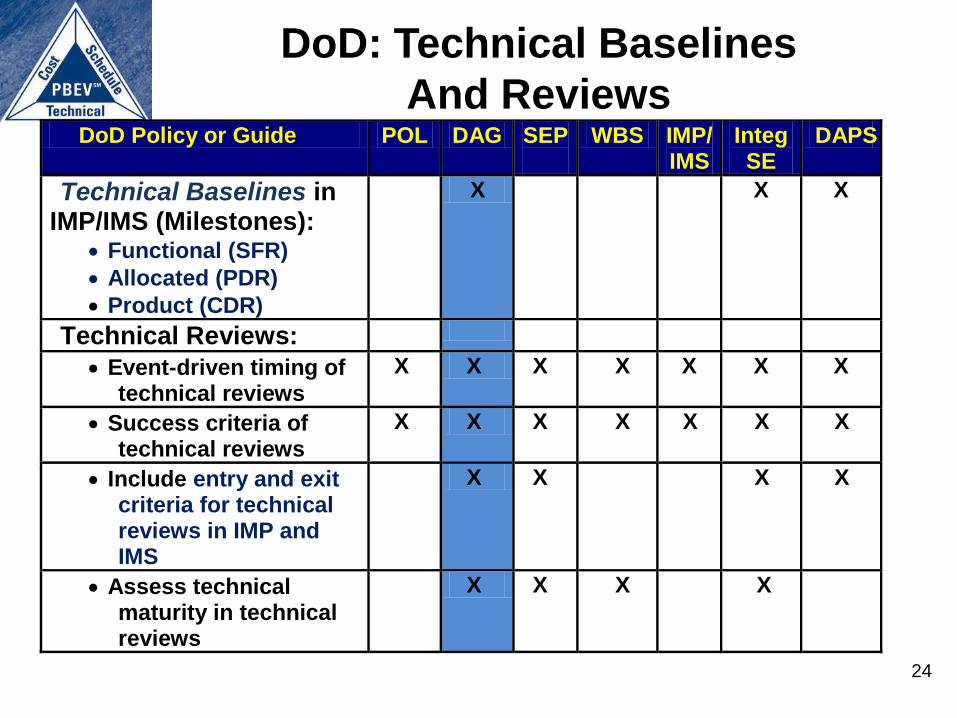
DoD: Technical Baselines
And Reviews DoD Policy or Guide POL DAG SEP
WBS IMP/
IMS Integ SE
DAPS
Technical Baselines in IMP/IMS (Milestones):
Functional (SFR)
Allocated (PDR)
Product (CDR)
X X X
Technical Reviews:
Event-driven timing of technical reviews
X X X X X X X
Success criteria of technical reviews
X X X X X X X
Include entry and exit criteria for technical reviews in IMP and IMS
X X X X
Assess technical maturity in technical reviews
X X X X
24
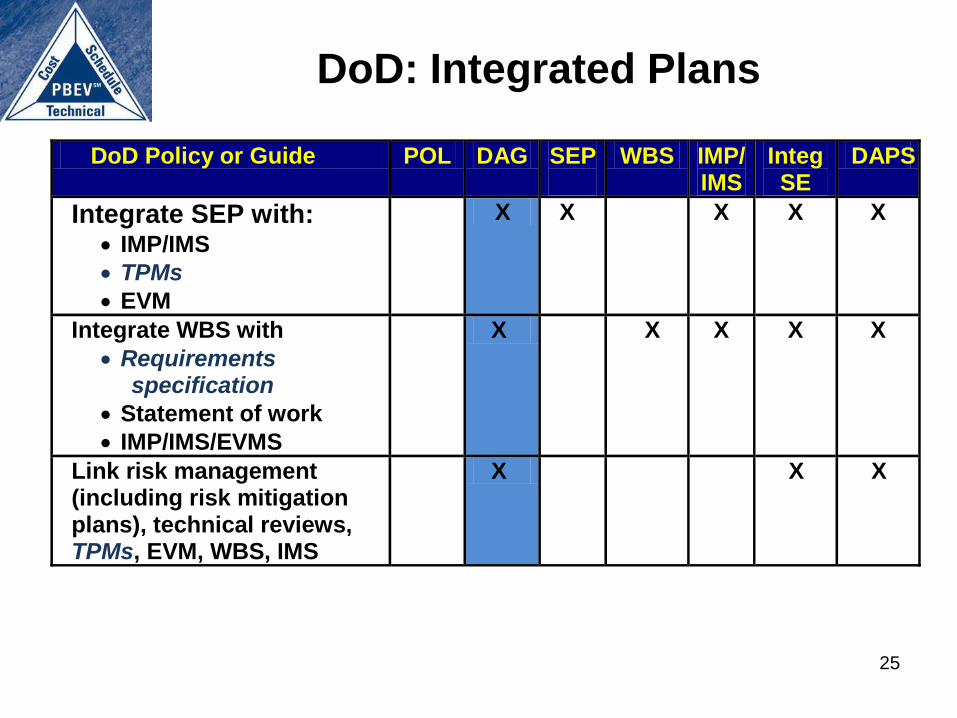
DoD: Integrated Plans
DoD Policy or Guide POL DAG SEP
WBS IMP/ IMS
Integ SE
DAPS
Integrate SEP with: IMP/IMS
TPMs
EVM
X X X X X
Integrate WBS with
Requirements specification
Statement of work
IMP/IMS/EVMS
X X X X X
Link risk management (including risk mitigation plans), technical reviews, TPMs, EVM, WBS, IMS
X X X
25
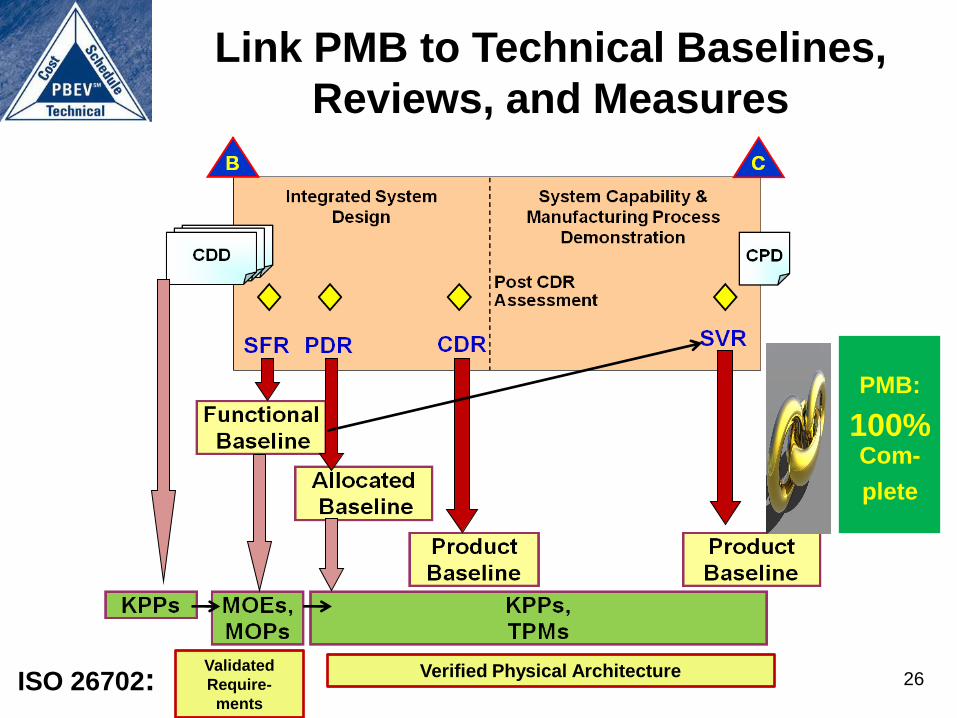
26
Link PMB to Technical Baselines,
Reviews, and Measures
ISO 26702: Verified Physical Architecture Validated
Require-
ments
PMB:
100% Com-
plete
Practical Application
27
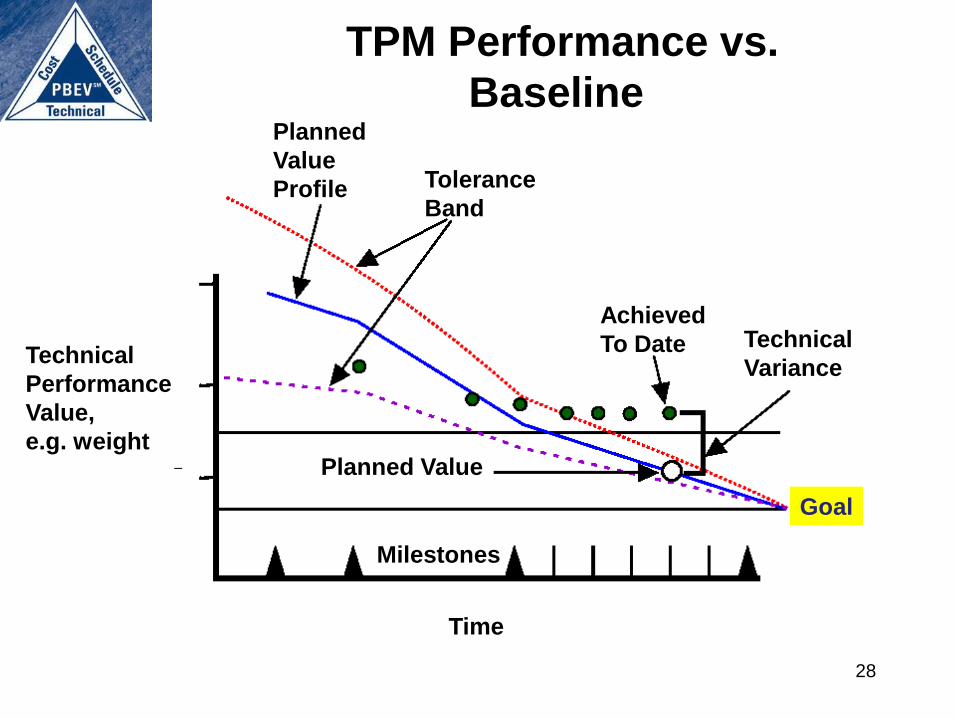
28
Planned
Value
Profile Tolerance
Band
Achieved
To Date Technical
Variance
Planned Value
Goal
Time
Milestones
Technical
Performance
Value,
e.g. weight
TPM Performance vs.
Baseline
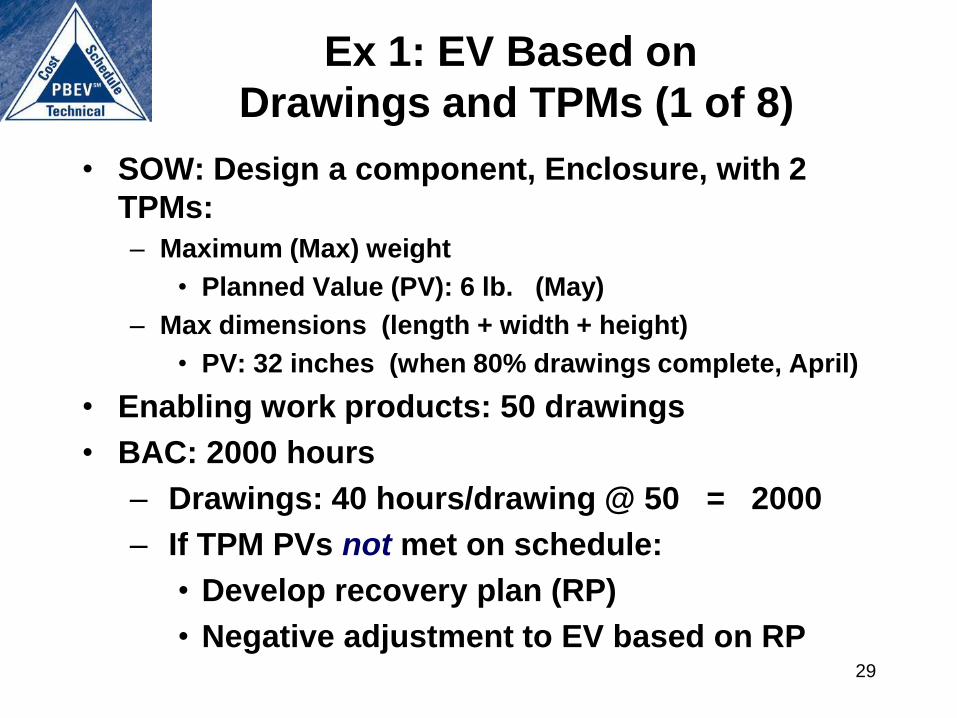
Ex 1: EV Based on
Drawings and TPMs (1 of 8)
• SOW: Design a component, Enclosure, with 2
TPMs:
– Maximum (Max) weight
• Planned Value (PV): 6 lb. (May)
– Max dimensions (length + width + height)
• PV: 32 inches (when 80% drawings complete, April)
• Enabling work products: 50 drawings
• BAC: 2000 hours
– Drawings: 40 hours/drawing @ 50 = 2000
– If TPM PVs not met on schedule:
• Develop recovery plan (RP)
• Negative adjustment to EV based on RP 29
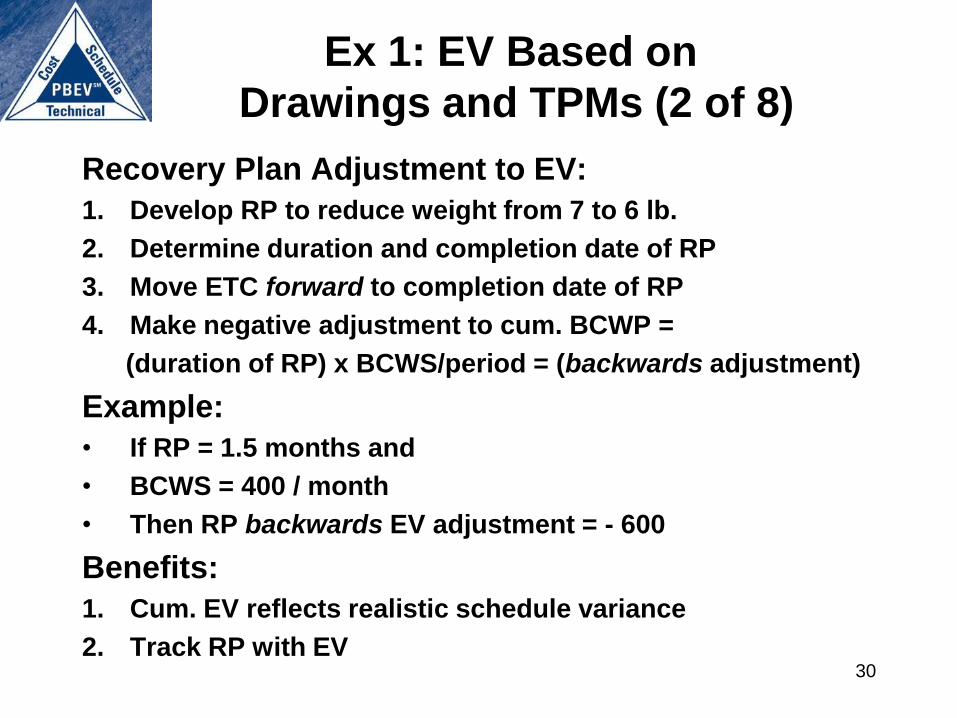
Ex 1: EV Based on
Drawings and TPMs (2 of 8)
Recovery Plan Adjustment to EV:
1. Develop RP to reduce weight from 7 to 6 lb.
2. Determine duration and completion date of RP
3. Move ETC forward to completion date of RP
4. Make negative adjustment to cum. BCWP =
(duration of RP) x BCWS/period = (backwards adjustment)
Example:
• If RP = 1.5 months and
• BCWS = 400 / month
• Then RP backwards EV adjustment = - 600
Benefits:
1. Cum. EV reflects realistic schedule variance
2. Track RP with EV 30
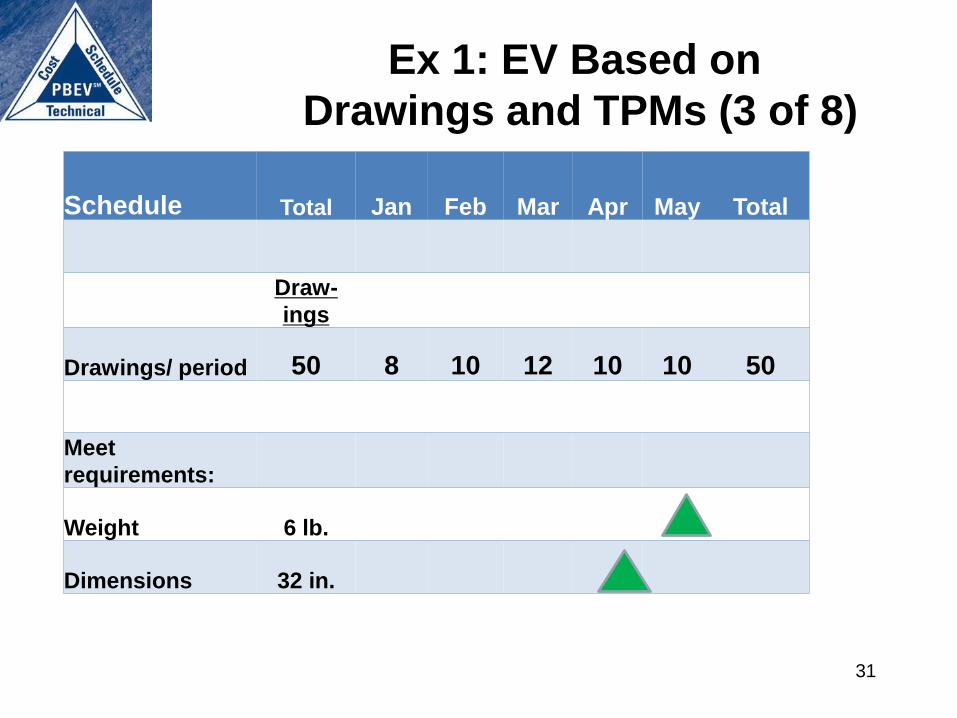
Ex 1: EV Based on
Drawings and TPMs (3 of 8)
31
Schedule Total Jan Feb Mar Apr May Total
Draw-
ings
Drawings/ period 50 8 10 12 10 10 50
Meet
requirements:
Weight 6 lb.
Dimensions 32 in.
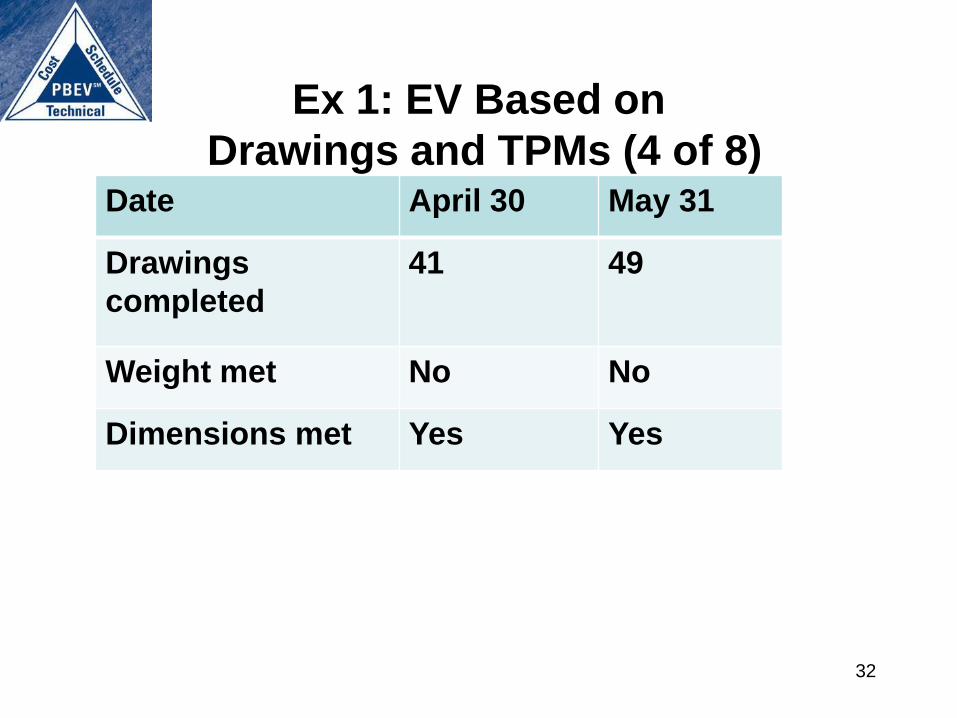
Ex 1: EV Based on
Drawings and TPMs (4 of 8)
32
Date April 30 May 31
Drawings
completed
41 49
Weight met No No
Dimensions met Yes Yes
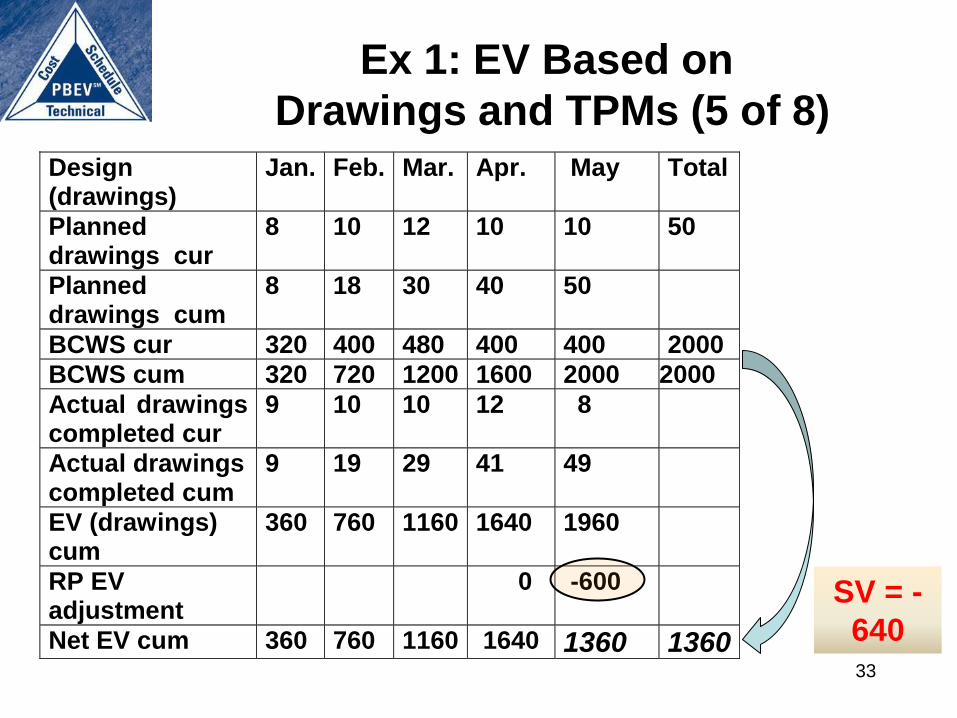
Ex 1: EV Based on
Drawings and TPMs (5 of 8)
33
Design (drawings)
Jan. Feb. Mar. Apr. May
Total
Planned drawings cur
8 10 12 10 10 50
Planned drawings cum
8 18 30 40 50
BCWS cur 320 400 480 400 400 2000
BCWS cum 320 720 1200 1600 2000 2000
Actual drawings completed cur
9 10 10 12 8
Actual drawings completed cum
9 19 29 41 49
EV (drawings) cum
360 760 1160 1640 1960
RP EV adjustment
0 -600
Net EV cum 360 760 1160 1640 1360 1360
SV = -
640
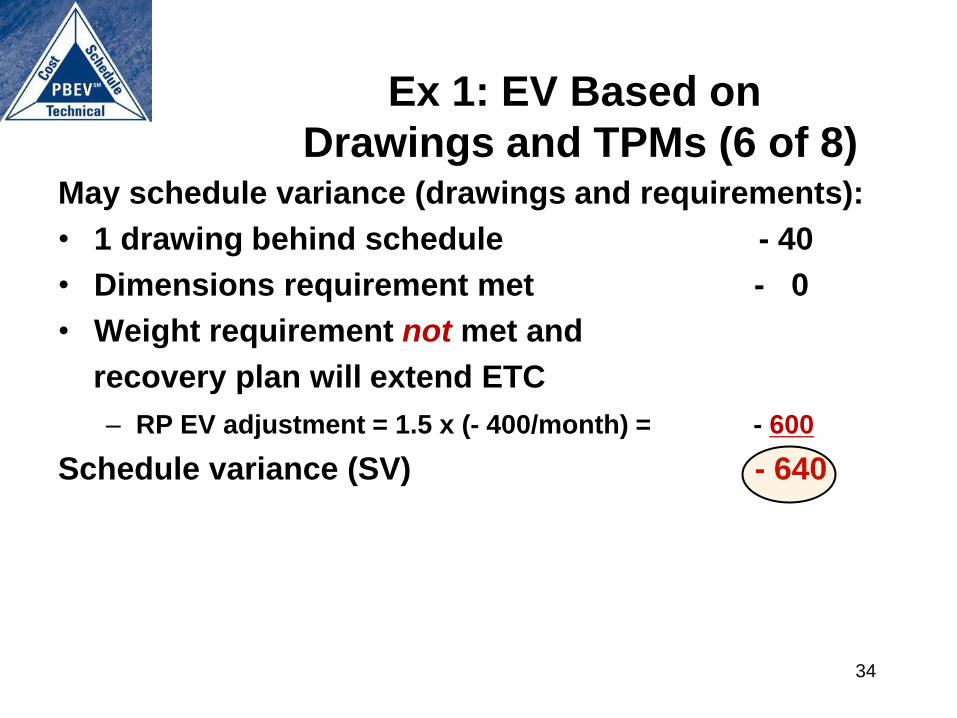
Ex 1: EV Based on
Drawings and TPMs (6 of 8) May schedule variance (drawings and requirements):
• 1 drawing behind schedule - 40
• Dimensions requirement met - 0
• Weight requirement not met and
recovery plan will extend ETC
– RP EV adjustment = 1.5 x (- 400/month) = - 600
Schedule variance (SV) - 640
34
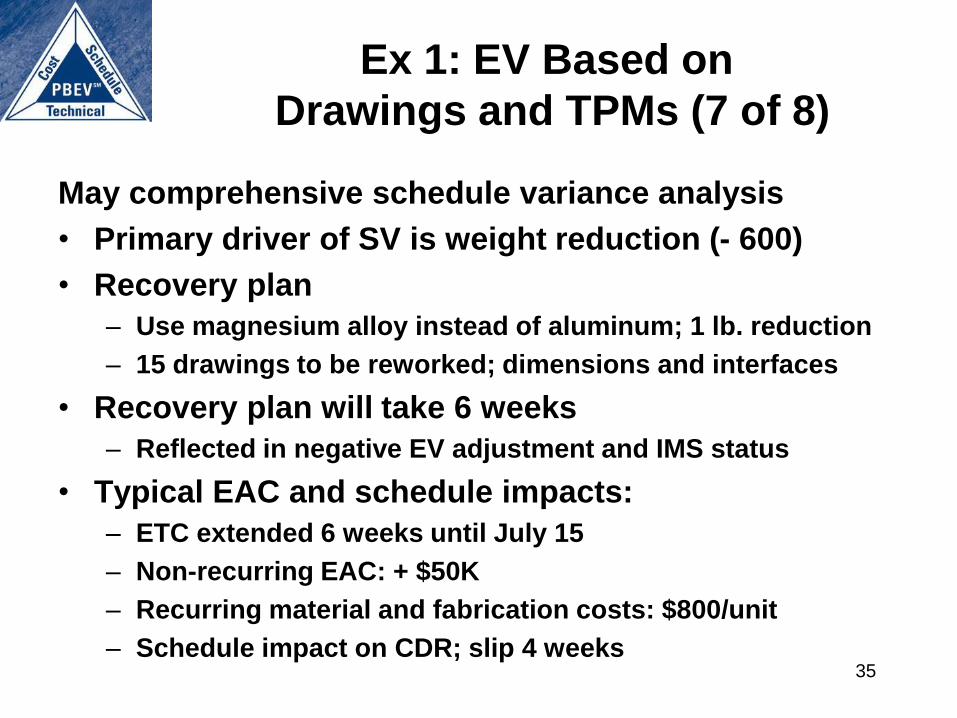
Ex 1: EV Based on
Drawings and TPMs (7 of 8)
May comprehensive schedule variance analysis
• Primary driver of SV is weight reduction (- 600)
• Recovery plan
– Use magnesium alloy instead of aluminum; 1 lb. reduction
– 15 drawings to be reworked; dimensions and interfaces
• Recovery plan will take 6 weeks
– Reflected in negative EV adjustment and IMS status
• Typical EAC and schedule impacts:
– ETC extended 6 weeks until July 15
– Non-recurring EAC: + $50K
– Recurring material and fabrication costs: $800/unit
– Schedule impact on CDR; slip 4 weeks 35
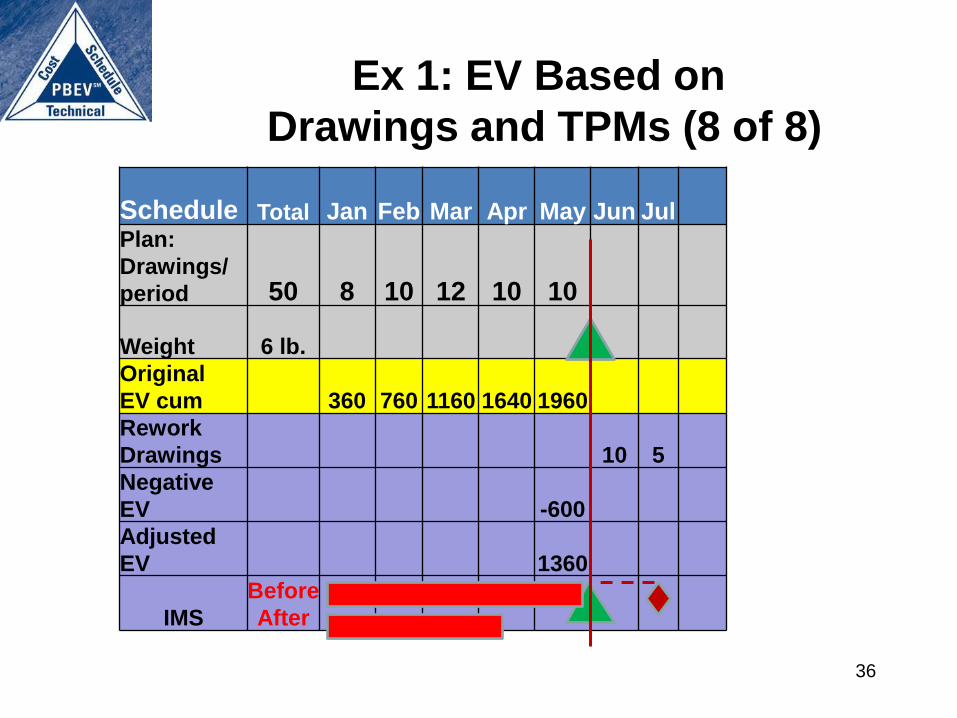
Ex 1: EV Based on
Drawings and TPMs (8 of 8)
36
Schedule Total Jan Feb Mar Apr May Jun Jul Plan:
Drawings/
period 50 8 10 12 10 10
Weight 6 lb.
Original
EV cum 360 760 1160 1640 1960
Rework
Drawings 10 5
Negative
EV -600
Adjusted
EV 1360
IMS
Before
After
Proposed EVM
Acquisition Reform
37
Revise Acquisition
Policy, Regulations, SOW
• Federal
– OMB policy and FAR
• DoD
– DFARS
– DoDI 5000.02
– DoD acquisition and SE guides
• Interim solution: Impose contract requirements
per CrossTalk article, Jan. 2013:
“Basing EV on Technical
Performance”
http://www.pb-ev.com/Pages/AdvancedEV.aspx
38
Program Management Tips
• Make IMP a contractual requirement
• Require SE best practices and tailored EVMS
clause in RFP and SOW
• Verify compliance in Integrated Baseline Review
(IBR)
• Confirm achievement of success criteria in
technical reviews
• Monitor consistency and validity of status
reports, variance analyses, EAC
• Close the Quality Gap
39
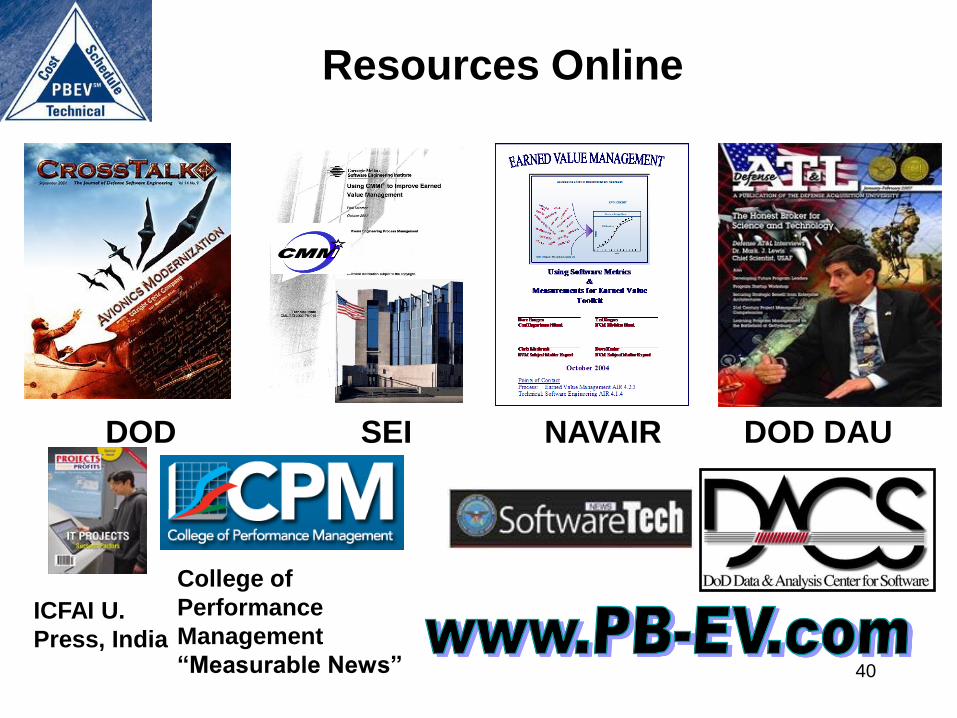
Resources Online
DOD DAU DOD SEI NAVAIR
ICFAI U.
Press, India
College of
Performance
Management
“Measurable News” 40
Acronyms/Contact
PMBOK Guide ® is registered by the Project Management Institute in the U.S. Patent and Trademark Office
CDR: Critical Design Review
EAC: Estimate at Completion
EVM: Earned Value Management
IBR: Integrated Baseline Review
IMP: Integrated Master Plan
IMS: Integrated Master Schedule
KPP: Key Performance Parameter
MOE: Measure of Effectiveness
MOP: Measure of Performance
OMB: Office of Management and Budget
PDR: Preliminary Design Review
PMB: Performance Measurement Baseline
SE: Systems Engineering
SFR: System Functional Review
TPM: Technical Performance Measure
Contact:
Paul Solomon, Performance-Based Earned Value®
818-212-8462 [email protected] 41