Embed Size (px)
Citation preview
Brigham Young University Brigham Young University
BYU ScholarsArchive BYU ScholarsArchive
Theses and Dissertations
2011-12-14
Acquisition of Spanish Voiceless Stops in Extended Stays Abroad Acquisition of Spanish Voiceless Stops in Extended Stays Abroad
Mary Williams Crane Brigham Young University - Provo
Follow this and additional works at: https://scholarsarchive.byu.edu/etd
Part of the Spanish and Portuguese Language and Literature Commons
BYU ScholarsArchive Citation BYU ScholarsArchive Citation Crane, Mary Williams, "Acquisition of Spanish Voiceless Stops in Extended Stays Abroad" (2011). Theses and Dissertations. 2707. https://scholarsarchive.byu.edu/etd/2707
This Thesis is brought to you for free and open access by BYU ScholarsArchive. It has been accepted for inclusion in Theses and Dissertations by an authorized administrator of BYU ScholarsArchive. For more information, please contact [email protected], [email protected].
Acquisition of Spanish Voiceless Stops in Extended Stays Abroad
Mary Williams Crane
A thesis submitted to the faculty of Brigham Young University
in partial fulfillment of the requirements for the degree of
Master of Arts
Scott M. Alvord, Chair Willis Fails
Lynn Williams
Department of Spanish and Portuguese
Brigham Young University
December 2011
Copyright © 2011 Mary Williams Crane
All Rights Reserved
ABSTRACT
Acquisition of Spanish Voiceless Stops in Extended Stays Abroad
Mary Williams Crane Department of Spanish and Portuguese, BYU
Master of Arts
Although English and Spanish both have the voiceless stops /ptk/, they differ in VOT; English has long-lag voiceless stops and Spanish has short-lag. This difference means that native English-speaking learners of Spanish are likely to transfer the long voice lag typical of their first language (L1) to Spanish voiceless stops. This study measured the VOT of 20 native English-speaking learners of Spanish, each with a length of residence (LOR) in a Spanish-speaking country of almost 2 years. The study participants were found to produce voiceless stops intermediate to the averages of their L1 (American English) and L2 (Spanish), with some speakers producing voiceless stops with the range observed for Spanish. A significant main effect on VOT was found for all the variables of linguistic context tested: place of articulation, word-initial vs. -internal position, stress, preceding segment and following segment. A significant main effect was also found for speech style, percentage of communication done in Spanish with native Spanish speakers while abroad, years of formal L2 instruction prior to stay abroad, and time spent each week speaking Spanish with native speakers since their return home. While the extra-linguistic variables are correlated with more target-like VOT, the amount of communication done in the L2 with other native English L2 learners of Spanish was correlated with longer VOTs, i.e. less target-like VOTs, possibly due to reinforcement of L1 transfer habits. Keywords: [Second language acquisition, Spanish language – acquisition, Spanish language – Consonants, Spanish language – Study and teaching – English speakers, voiceless occlusives, VOT]

ACKNOWLEDGEMENTS
I would like to acknowledge my thesis advisor, Dr. Scott M. Alvord, for his
guidance and encouragement in this research over the last few years. I would also like to
acknowledge my husband, William Crane, for his support and patience and Kristy Crane
for watching my son so that this thesis could finally finish being written and defended.
iv
Table of Contents
Chapter 1 – Introduction
Statement of the problem ...............................................................................................1
Justification of the problem ...........................................................................................2
Delimitation of the problem ...........................................................................................3
Research questions .........................................................................................................3
Chapter 2 – Review of the Literature
Definition of VOT ..........................................................................................................4
Equivalence Classification of L1 and L2 Sounds ..........................................................6
The Role of Transfer in VOT Production .......................................................................7
The Effect of Phonetic Context on VOT ........................................................................9
Place of articulation ..............................................................................................10
Vowel height .........................................................................................................10
Surrounding segments (consonants) .....................................................................11
Effect of length of residence (LOR) on accent ............................................................12
Positive effect........................................................................................................12
No effect................................................................................................................14
Reconciling disparity in research study conclusions ............................................16
Other factors affecting L2 pronunciation ......................................................................17
Age of learning (AOL)..........................................................................................18
Gender ...................................................................................................................19
Formal instruction .................................................................................................20
Speech style ..........................................................................................................21
v
Motivation .............................................................................................................21
Cultural Sensitivity ...............................................................................................23
L1 use/L2 use ........................................................................................................23
Chapter 3 – Methodology
Speakers ........................................................................................................................26
Variables .......................................................................................................................27
Instruments ....................................................................................................................29
Method ..........................................................................................................................30
Statistical Analysis ........................................................................................................32
Chapter 4 – Results
Results for the first research question ...........................................................................33
Results for the second research question ......................................................................40
Segment.................................................................................................................40
Word initial ...........................................................................................................41
Stress .....................................................................................................................41
Preceding Segment................................................................................................42
Following Segment ...............................................................................................45
Vowels ............................................................................................................45
Glides ..............................................................................................................46
Liquids ............................................................................................................47
Style ......................................................................................................................48
Months with a native Spanish-speaking companion .............................................49
Percentage of Spanish spoken with native Spanish-speaking companions ..........50
vi
Months with a native English-speaking companion .............................................50
Percentage of English spoken with native English-speaking companions ...........50
Formal instruction (in years) .................................................................................51
Spanish spoken with native speakers at time of study (hours per week) ..............52
Total amount of Spanish spoken at time of study (hours per week) .....................52
Summary .......................................................................................................................53
Chapter 5 – Conclusion
Research questions ........................................................................................................54
Research implications ...................................................................................................56
Appendix A – Questionnaire .............................................................................................58
Appendix B – Inventory of Cross-Cultural Sensitivity .....................................................59
Appendix C – Motivational Survey ...................................................................................63
Appendix D – Reading Passage .........................................................................................65
Appendix E – Wordlist ......................................................................................................66
Appendix F – Tables of post hoc comparisons of preceding segments .............................67
Appendix G – Tables of post hoc comparisons of following segments ............................74
Bibliography ......................................................................................................................78
vii
List of Tables
Table 4.1 – Average VOT in ms for Spanish, English, and the current study ...................33
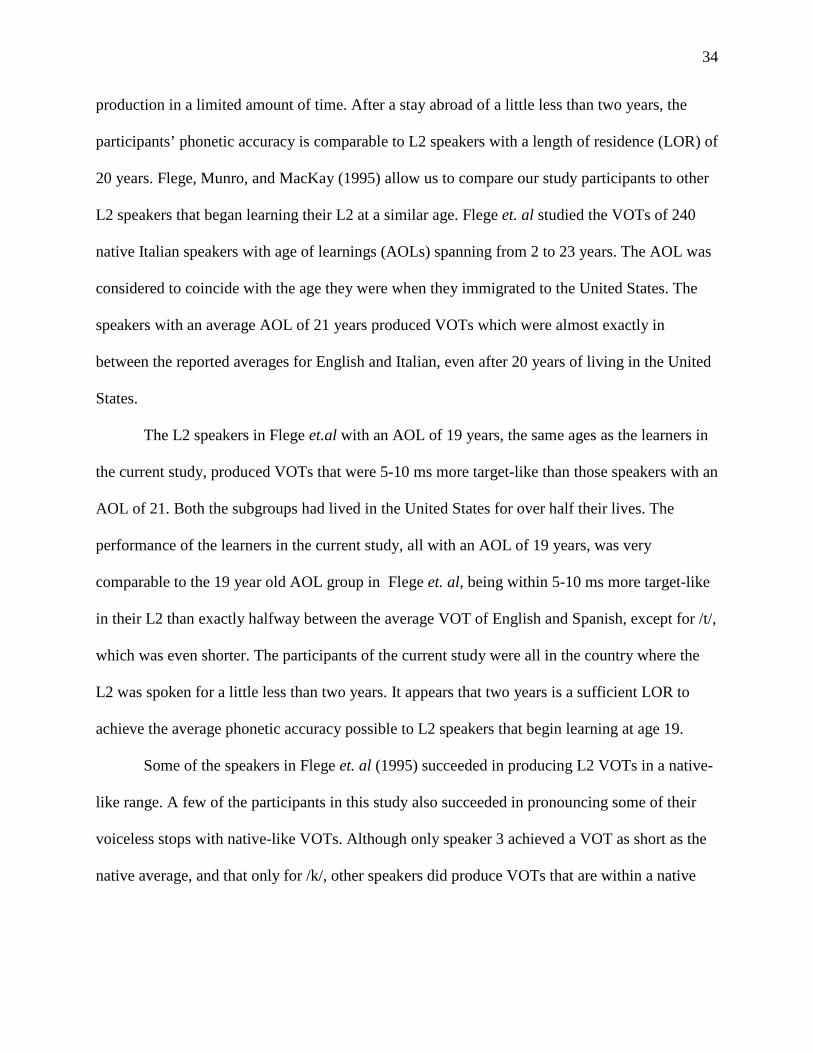
Table 4.2 – Range of VOT in ms for native speakers of Spanish ......................................35
Table 4.3 – The average VOT for each study participant for /p/, /t/, and /k/ .....................36
Table 4.4 – The average VOT for /p/, /t/, and /k/ of the current study ..............................41
Table 4.5 – The average VOT for word initial vs. word internal voiceless stops
in the current study.......................................................................................................41
Table 4.6 – The average VOT for voiceless stops in stressed and unstressed syllables
in the current study.......................................................................................................42
Table 4.7 – The average VOT for voiceless stops differing by preceding segment in
the current study ...........................................................................................................44
Table 4.8 – The average VOT for voiceless stops differing by following segment in
the current study ...........................................................................................................48
Table 4.9 – The average VOT for three speech styles in the current study ......................48
viii
List of Figures
Figure 2.1 – Waveform of a voiceless stop..........................................................................5
Figure 3.1 – Example of how VOT was measured ............................................................31
Figure 4.1 – Example of native Spanish /p/ .......................................................................38
Figure 4.2 – Example of English-like /p/ ...........................................................................38
Figure 4.3 – Example of unaspirated /p/ with longer VOT ...............................................39
1
Chapter 1 – Introduction
Statement of the problem
One of the facets of second language acquisition is that of phonetic accuracy. A foreign
accent impedes complete mastery of the L2. Researchers have examined many possible factors in
an attempt to find the cause and, indeed, the remedy for foreign accent. One of the many factors
that have been considered is length of residence (LOR) in a country where the target language is
spoken. BYU students recently returned from foreign missionary service provide a unique source
of people that have stayed abroad for an extended period of time. They have little formal
instruction and much daily contact with native speakers of the L2. They provide a unique
opportunity to determine what an extended stay abroad alone can do for an accent. Previous
studies that have examined the effect of LOR on accent have chiefly been of two different
concentrations: how accent improves in students after a short study abroad and the degree of
accent in immigrants after several years of residence in a country where the second language
(L2) is spoken.
When studying the second language acquisition of phonology, one of the phenomena
often examined is the voice-onset time (VOT) of stop consonants. Their nature makes them
easily measured objectively by means of VOT, which is the length of time between the release of
oral occlusion and the beginning of the vibration of the vocal folds (Hualde 2005). The VOT of
the voiceless stops /p t k/ differs in English and Spanish by the length of time that lapses before
the vocal chords begin vibrating. Spanish voiceless stops are considered short-lag stops with a
range of 6 to 30 milliseconds, while English stops are much longer with a range of 50 to 80
milliseconds. Measures of VOT are one way to determine the acquisition of Spanish phonology
in BYU students that have had an extended stay abroad.
2
Justification of the problem
While the numbers of students that return to BYU after an extended experience abroad
with recently gained language skills are many, their phonetic ability to speak their new language
is largely unresearched. As Arteaga (2000) points out in her article, though pronunciation often
takes a backseat in the classroom, the “social penalty” of speaking with an accent is great. She
references research indicating that “listeners often assume that a speaker with a marked accent
has inferior language ability and even mental ability” (Arteaga 2000). The pronunciation of
voiceless stops is an important phonetic category for native English learners of Spanish, because
they have a tendency to transfer English voice lag to Spanish and González-Bueno (1997) claims
that it marks the speaker as having a foreign accent to native listeners.
The effect that length of residence in the target culture has on the acquisition of L2
phonology is not completely understood at this time. While some studies find LOR to be an
important factor, others do not. This discrepancy may be due to the very different lengths of time
that L2 speakers have spent in the target culture in the various studies. My research may help
foreign language teachers and researchers understand the effect that a length of residence of
almost two years has on pronunciation. A semester of phonetic training alone was found to
improve realization of Spanish voiceless stops in Lord (2005), but in Díaz-Campos’s 2004 study,
a semester abroad did no more to improve students’ voiceless stops than did a semester of
regular Spanish class at home. A look at the L2 voiceless stops after a much longer period of
time will be very useful to understanding whether a longer stay abroad can accomplish what a
short stay abroad cannot.
3
Delimitation of the problem
The purpose of this study is to be a descriptive analysis of how fully the research
participants acquired the VOT of Spanish voiceless stops and to determine which linguistic and
extra-linguistic factors affected the participants’ ability to do so. This study is not an experiment.
Data was elicited by means of a questionnaire and a speech elicitation activity. This study looks
at VOT only in contexts where transfer from English is likely, hence all tokens of /p t k/ are
either word-initial or in the onset of the stressed syllable. Although I may refer to studies
involving other languages, this study will only involve native speakers of English that have
learned Spanish as a second language.
Research questions
The questions to be answered by this study are the following:
1. Have the research participants attained a target-like pronunciation of /p t k/?
2. What is the effect on the VOT of adult learners of Spanish of factors including
phonetic context, speech style, language use (during time abroad and at time of
study), formal instruction, motivational intensity, and cultural sensitivity?
It is expected that the research participants will evidence VOT values that are
intermediate between the target language, Spanish, and the L1, English. This hypothesis is based
on Major’s Ontogeny Phylogeny Model, that similar phenomena are acquired more slowly than
dissimilar phenomena. The researcher proposes that the participants’ VOT values will
approximate those of the target language, but that L2 mastery is not yet complete.
In regards to the second research question, phonetic context, speech style, language use,
formal instruction, motivational intensity, and cultural sensitivity are all factors that researchers
have considered in the past and it is hypothesized that they will affect degree of foreign accent.
4
Chapter 2 – Review of the Literature
Definition of VOT
When degree of accent is measured in acquirers of an L2, stop consonants are one of the
indicators of accent that is most often measured. Their nature makes them easy to measure
objectively by means of voice-onset time (VOT), which is the length of time between the release
of oral occlusion and the beginning of the vibration of the vocal folds (Hualde 2005). The release
of oral occlusion is marked as 0 ms, so any prevoicing that begins before the release of the
articulators is assigned a negative VOT and is called voice lead. On the other hand, voicing that
begins after the release of oral occlusion is called voice lag and given a positive VOT.
Voiceless stops can be placed into two different categories: short voice lag and long voice
lag. Short lag stops are defined as ones in which voicing begins within 30 ms after the release of
the articulators. Stops in which voicing begins sometime after 30 ms are long lag stops (Yavas &
Wildermuth 2006). In standard Spanish, voiceless stops are short lag stops, meaning that the
vocal folds start vibrating shortly after oral release. The average VOT values for Castilian
Spanish found by Castañeda (1986) are the following: /p/ = 6.5 ms, /t/ = 10.4 ms, /k/ = 25.7 ms.
These values are similar to those found by Rosner et al. (2000) for Castilian Spanish, although
Rosner et al. found slightly greater values for /p/ and /t/. However, the VOT values of various
dialects of Latin American Spanish are longer than those of Castilian, according to Williams
(1977), excepting those VOT values found for Guatemalan Spanish, which are very similar to the
findings of studies of Castilian Spanish. All of the VOT values found by these researchers are
typical short voice lag stops.
5
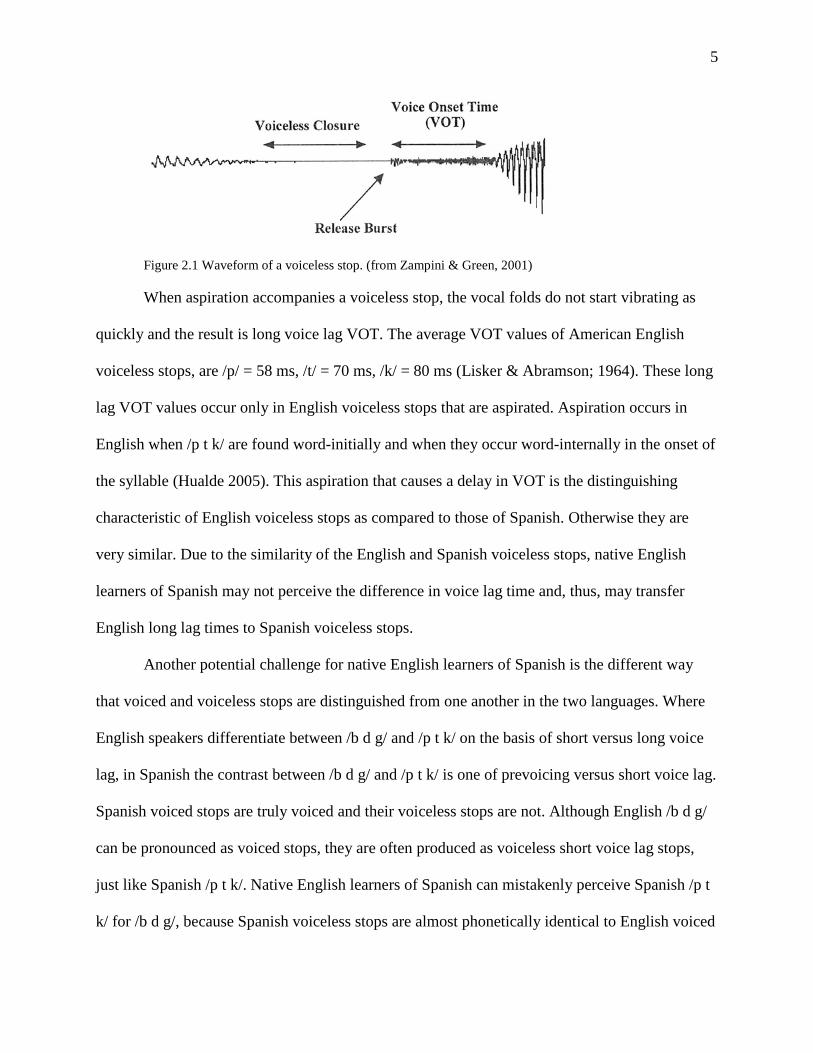
Figure 2.1 Waveform of a voiceless stop. (from Zampini & Green, 2001)
When aspiration accompanies a voiceless stop, the vocal folds do not start vibrating as
quickly and the result is long voice lag VOT. The average VOT values of American English
voiceless stops, are /p/ = 58 ms, /t/ = 70 ms, /k/ = 80 ms (Lisker & Abramson; 1964). These long
lag VOT values occur only in English voiceless stops that are aspirated. Aspiration occurs in
English when /p t k/ are found word-initially and when they occur word-internally in the onset of
the syllable (Hualde 2005). This aspiration that causes a delay in VOT is the distinguishing
characteristic of English voiceless stops as compared to those of Spanish. Otherwise they are
very similar. Due to the similarity of the English and Spanish voiceless stops, native English
learners of Spanish may not perceive the difference in voice lag time and, thus, may transfer
English long lag times to Spanish voiceless stops.
Another potential challenge for native English learners of Spanish is the different way
that voiced and voiceless stops are distinguished from one another in the two languages. Where
English speakers differentiate between /b d g/ and /p t k/ on the basis of short versus long voice
lag, in Spanish the contrast between /b d g/ and /p t k/ is one of prevoicing versus short voice lag.
Spanish voiced stops are truly voiced and their voiceless stops are not. Although English /b d g/
can be pronounced as voiced stops, they are often produced as voiceless short voice lag stops,
just like Spanish /p t k/. Native English learners of Spanish can mistakenly perceive Spanish /p t
k/ for /b d g/, because Spanish voiceless stops are almost phonetically identical to English voiced
6
stops. However, the current study will concentrate of the production of /p t k/ by native English-
speaking learners of Spanish.
Equivalence Classification of L1 and L2 sounds
According to Major (2001), several studies have indicated that phenomena that are
similar across L1 and L2 are less easily acquired than phenomena that are very different. The
reason is that phenomena that are very different are more easily perceived as different by the L2
learner, while in the case of similar phenomena, transfer takes place. Flege (1992, 1995) explains
that the L2 learner mentally establishes a new phonetic category for sounds that he perceives as
new or different. On the other hand, sounds that are similar to L1 sounds for which the learner
already has established L1 phonetic categories get classified as “equivalent.” Flege (1992)
defines a “similar” sound as one that is represented by the same IPA symbol in the L1 and L2,
although the two have been shown to have some acoustical difference. VOT has been a useful
tool to support the equivalence classification because, although otherwise very similar, the
voiceless stops /p t k/ differ across Germanic and Romance languages in lag time. Flege and
Hillenbrand (1984) hypothesized that native French (late) learners of English would classify
English /p t k/ as equivalent to French /p t k/ and thus be prevented in accurately pronouncing the
aspirated English versions. They found that they were correct in their hypothesis. The French
learners of English produced English /p t k/ with short lag or intermediate VOT. Since the
learner has already established a phonetic category for that sound in the L1, he groups the new
sound in that same category, which results in his pronouncing the two phonemes the same way.
Further evidence for the equivalence classification is that speakers have been shown to produce
L1 and L2 voiceless stops similarly not only in the L2 but also in the L1. Flege (1987) found that
Americans with a great deal of experience speaking French produce English /p t k/ with shorter
7
VOT values than those produced by English monolinguals. Although speakers do perceive a
difference between the similar sounds of L1 and L2, it seems they expand the phonetic category
rather than making a new one, because their voiceless stops of L1 and L2 actually get more
similar over time. Flege (1995) solidified his theory of language learning, titling it the Speech
Learning Model (SLM). Hypothesis 5 of the SLM states: “Category formation for an L2 sounds
may be blocked by the mechanism of equivalence classification. When this happens, a single
phonetic category will be used to process perceptually linked L1 and L2 sounds (diaphones).
Eventually, the diaphones will resemble one another in production.” (p. 239)
The similarity between the English and Spanish phonemes /p t k/ is likely to result in
their classification as equivalent by adult native English-speaking learners of Spanish. Such a
classification would result in transfer of English aspiration to the voiceless stops of Spanish.
However, not all studies conclude that different sounds are easier to distinguish and
therefore pronounce accurately in the L2. Major (1987) found in advanced Korean learners of
English that the similar sounds were realized more accurately than dissimilar sounds.
Nevertheless, he did find that the dissimilar sounds were acquired more quickly than their similar
counterparts, which actually worsened with time. (Such worsening would support Flege’s
hypothesis that sounds classified in the same phonetic category will approximate each other over
time). Because dissimilar sounds are acquired before similar sounds, finding the Spanish VOTs
of those who have learned Spanish as a foreign language might indicate the level of acquisition
the learners have achieved.
The Role of Transfer in VOT Production
Voice-onset time is measured on a continuum, which has encouraged research on the
perception of varying lengths of VOTs. Lisker and Abramson's (1970) study involved
8
monolingual speakers of different languages, including English and Spanish, listening to
computer manipulated VOT values with a computer program. Abramson and Lisker increased
VOT by small increments for participants to listen to and determine what phoneme they heard.
The participants' perception of the stimuli with gradual VOT increases as /d/ or /t/ coincided with
the phoneme boundary of the participants' native language. For example, English speakers
perceived 100% of the apical stimuli as /d/ from -150 ms to 15 ms and as /t/ from 50 ms on.
When the stimuli had a VOT of about 35 seconds, they were perceived as /t/ or /d/ about 50% of
the time, which Lisker and Abramson considered the phoneme boundary. On the other hand,
Spanish speakers perceived 100% of the apical stimuli as /d/ from -150 ms to -5 ms. After 35 ms,
100% of the stimuli were perceived as /t/, with the crossover point where 50% were identified
each way occurring at 22 ms (Abramson & Lisker 1973). Stop phoneme boundaries occur at
specific VOTs for monolingual speakers.
However, the VOT values produced by bilinguals usually fall between the monolingual
native values of either language. This discrepancy between monolingual and bilingual VOT
values can be ascribed to transfer or a change in the production of one language due to the
influence of another. Because VOT is measured on a continuum, it is a good source of viewing
how the bilingual speaker uses forms in the L2 that are not characteristic of either the L1 or the
L2, like using a VOT that is somewhere in between the VOT lengths for the phonemes of each
language. Transfer can be bi-directional; the L2 can also affect the L1. Major's (1992) study of
American immigrants to Brazil found that L1 casual speech suffered more L2 transfer than L1
formal speech and that the more proficient the speaker was in the L2, the more the Portuguese
short-lag VOT values influenced speech in English, the L1. However, VOT values in neither
language were of typical native length. This kind of interference was found in immigrants and
9
may be less applicable to those people, like the participants of this study, who stay abroad for an
extended period of time and then return to their native country.
Another language-learning model that describes the role of transfer of similar phenomena
is Major’s Ontogeny Phylogeny Model. Speakers that are in the process of acquiring an L2
develop an interlanguage (IL) that is influenced by the L1, the L2, and Universal Language (U).
The Ontogeny Phylogeny Model’s similarity corollary states that similar phenomena are
acquired more slowly than dissimilar phenomena. For similar phenomena, L1 transfer is very
high at first and decreases slowly. It is possible, with the Ontogeny Phylogeny Model, to
describe the learning process in stages. Stage 1 of the Model is mastery of L1. As the speaker
begins learning the L2, L1 transfer is very strong for similar phenomena because the L2 forms
are still difficult to grasp. As a result, in stage 2, U has a larger effect on the IL than even L2, as
the speaker fails to quite grasp the phenomena of L2. In stage 3, the role that universal language
plays is greater, only to decrease, along with L1, in stage 4, as the L2 is mastered more and more
and has a greater effect on the IL. The final stage of the OPM for similar phenomena is complete
mastery of L2.
It is unlikely that the participants of my study have achieved complete mastery of the L2.
Instead, I hypothesize that they will be in stage 4 of Major’s OPM. The IL will be greatly
influenced by the L2, but their average VOT values will reflect an IL that is in between the
average VOTs of the L1 and L2, although definitely showing a heavy influence from the L2.
The Effect of Phonetic Context on VOT
One of the many factors that affect average VOT is phonetic context. VOT is influenced
by place of articulation, the vowel height of the following vowel, other surrounding segments,
10
and the rate and type of speech. Therefore, VOT can be expected to vary not only across
speakers, but within the enunciation of one speaker as well.
Place of articulation
The first and most important linguistic variable is place of articulation of the voiceless
stop. These consonants are shortest when their place of articulation is toward the front of the
mouth and they have longer and longer VOT as the place is toward the back of the vocal tract,
i.e. phoneme boundaries of /p t k/ have increasingly longer VOT values as the place of
articulation moves from bilabial to dental/alveolar to velar. Lisker and Abramson (1964) found
this pattern to be true across a variety of languages. It has been confirmed by every study since.
The increase in VOT from bilabial to velar position seems to be related to how abrupt the
pressure drop is in the oral cavity upon release of occlusion (Klatt 1973). The quicker the
occlusion is released, the more sudden the pressure drop and the sooner the vocal folds start
vibrating to produce the following segment. The pressure drop is the most abrupt for /p/ and the
least abrupt for /k/, due to the agility of the articulators (Yavas & Wildermuth 2006).
Vowel height
Although Lisker and Abramson's 1967 original study did not find VOT to be significantly
influenced by the following vowel, subsequent studies have found that tense high vowels
generally have a longer preceding VOT than lax low vowels (Klatt 1973 & 1975; Weismer 1979;
Cooper 1974). In addition, Summerfield (1975) found that place of articulation also plays a part.
Although, as expected, he found that /ki/ had longer VOT than /ka/, he found /p/ to be an
exception with /pi/ having a shorter VOT value than /pa/. However, in contrast with Summerfield
(1975), Port and Rotunno (1979) did not find place of articulation to interact with the height or
tensity of the following vowel at all. With Summerfield’s findings in mind, Port and Rotunno
11
had five students produce phonological combinations of the three voiceless stops with six
different vowels. They found VOTs were consistently shorter before lax vowels than tense
vowels, regardless of place of articulation. Thornburgh (1998) had similar findings with native
Spanish speaking late and early learners of English. All subjects had longer VOT values for stops
preceding /u/ and /i/ than /a/, place of articulation notwithstanding.
Yavas and Wildermuth (2006) explain that VOT is longer when voiceless stops are
followed by high vowels due to the less abrupt pressure drop in the oral cavity. When the
voiceless stop is followed by a high vowel, the tongue is already in a higher position upon
release of oral occlusion in preparation for the following vowel. Being in a higher position
causes the tongue to be more of an obstruction, causing the release and subsequent pressure drop
to happen more slowly than it does when the voiceless stop is followed by a low vowel, when the
tongue is not an obstruction.
Surrounding segments (consonants)
The appearance of /p t k/ in consonant clusters also has an effect on the VOT. For
example, in English, when the segment that immediately precedes the stop is /s-/, /p t k/ are not
aspirated. They are articulated as short-lag stops with values almost identical to, only very
slightly longer than average values for /b d g/ (Klatt 1975). For this reason all tokens of /p t k/
that are immediately preceded by an [s] are not being considered as part of the data. For
example, in the Spanish words los peces [lospeses], I hypothesize that the word-initial /p/ would
not be aspirated because the context for transfer does not occur after [s].
Klatt (1975) found VOT values to be an average of 20 ms longer when followed by a
sonorant consonant in English. The “sonorant consonants” included in his study are /l/, /r/, /w/.
The semi-consonant /w/ increased the length of the VOT of the preceding voiceless stop more
12
than the liquids, especially in the case of /tw/ which increased by 57%, whereas the /kw/ only
increased by 34%. /pw/ was not represented.
Effect of length of residence (LOR) on accent
Positive effect
Two articles that found LOR to have a significant effect on foreign accent will be
discussed in this section. The first article, by Purcell and Suter (1980), is actually a second look
and a reanalysis of a study published by Suter in 1976. In the reanalysis, Purcell and Suter found
LOR to be the third most important predictor of foreign accent., The second article, Flege and
Fletcher (1992), found LOR to be significantly correlated with degree of foreign accent.
Suter (1976) examined 20 variables in a study in which 14 judges rated the pronunciation
of 61 nonnative speakers of English. He found twelve factors to be significantly correlated with
degree of foreign accent in his analysis. However, his analysis did not determine the relative
importance of the twelve, nor which were true predictors of accent and which were predictors
only because of their correlations with other factors. After Purcell took the data and reanalyzed
it, four factors were found to be significant predictors of “pronunciation accuracy.” The first, and
the strongest predictor by far, was L1 background. In fact, Suter’s study is unique in that it
examined the effect of L1 background. Suter found that native speakers of Arabic and Persian
had better English pronunciation than native speakers of Japanese and Thai. Purcell and Suter
(1980) found that L1 accounted for most of the variation in L2 pronunciation and that it was the
most important factor influencing L2 accent. However, as Piske et al. (2001) observe, the study
participants were not matched for age of learning (AOL) or LOR, so the relative importance of
those factors remains undetermined. Nevertheless, according to Purcell and Suter’s article, length
of residence is the third most important predictor of foreign accent, whereas they found aptitude
13
for oral mimicry to be the second most important factor. The length of residence predictor was
actually a composite of two of Suter’s variables: years in an English speaking country and
months residing with a native speaker of English. The fourth most important predictor found was
motivation, or “strength of concern for pronunciation accuracy” (p. 283). After these four
predictors were taken into account, all other factors were insignificant. Interestingly, AOL was
one of those factors that were deemed to be insignificant after the above-mentioned predictors
were taken into account.
Flege and Fletcher (1992) found that there is a strong correlation between length of
residence and level of accent in L2 speech. The purpose of the first experiment of the study was
twofold: firstly, to find if native Spanish L2 learners that began learning at or under the age of 6
could speak English without a perceptible foreign accent and, secondly, to see if LOR made a
difference in the accent of adults, that is late learners of English. The study included three groups
that consisted of native Spanish speakers. One group consisted of persons with a mean age of 23
that all began learning English at or under the age of 6. They are referred to as early learners.
The two other groups consisted of “late learners”: adults that had immigrated to the United States
and had begun learning English at a late age. However, the two adult groups differed in LOR.
One group, referred to as the experienced group, had a mean LOR of 14.3 years, and the other,
the inexperienced group, had a mean LOR of only 0.7 years.
Although length of residence is easy to determine, it is difficult to know how much a
native Spanish learner interacts with native English speakers and how much the learner uses L2
on a daily basis. LOR itself may not be a good descriptor in light of the possible disparity of
daily language use among a group matched for LOR. Flege and Fletcher recognized this problem
and attempted to account for it in a questionnaire in which the experienced late learners reported
14
that English constituted an average of 75% of their daily language use. The inexperienced late
learners reported using English slightly less – 68% of their day.
A group of native English listeners rated the accent level of all the learners. On a scale of
1 to 256, 1 being “strong foreign accent” and 256 being “no foreign accent,” the experienced late
learners received an average score of 91 and the inexperienced late learners received an average
score of 44. As may be expected, the learners that had lived in the United States for much a
much longer period had a better accent than those that had lived in the United States for less than
a year. On the other hand, the early learners of English, who began learning English at or before
age 6, received a score of 242. Thus, the experiment showed that even though a late learner
retains a strong accent where an early learner is able to speak very native-like, LOR does
positively affect foreign accent. Also, the amount of formal education a late learner had was
found to correlate with accent. Interestingly, although the simple correlation between LOR and
degree of accent was significant, LOR was not a significant predictor of accent. Only AOL was
found to be a significant predictor of level of foreign accent. Flege and Fletcher concluded that
late learners do experience fossilization, in that they are unable to achieve native-like
pronunciation, but that their accent does indeed improve as a function of LOR.
Although neither of these two studies found LOR to be the most significant predictor of
degree of foreign accent, both found the correlation between accent and LOR to be significant.
Purcell and Suter even found LOR to be a significant predictor of accent, although not the most
important factor.
No effect
The following three articles all found that LOR was not a significant factor in foreign
accent. The first two articles have students as the research subjects. The first, Elliott (1995),
15
studies students who had very brief stays abroad of unspecified amounts of time. The second,
Moyer (1999), studied graduate students who had stayed abroad for an average of 2.7 years. The
third study was done by Tahta, Wood, and Loewenthal (1981) and researched a diverse subject
group who had all immigrated to the target country.
Elliott (1995) considered a very brief LOR and found that it had no significant benefit to
pronunciation. Elliott’s research participants were 66 students of Spanish at Indiana University:
32 males and 34 females. Under the label “foreign travel,” LOR was among the many variables
considered. In the subject group, foreign travel consisted of short stays, such as vacations or
school sponsored trips to a foreign country where the target language is spoken. Elliott did not
find that these brief stays in a target country had any effect on pronunciation, as the foreign
travel variable was only found to be significant if it was entered in as the first step in the multiple
regression analysis. Elliott’s explanation is that the students that go abroad are the motivated
ones with a positive attitude. He found attitude to be the number one predictor of foreign accent.
According to his explanation, the students with the best accents also happen to be the ones with
the most experience abroad because of their attitude. The multiple regression analysis found that
their stays abroad were not actually a factor in their accents.
Moyer (1999) looked at 24 native English graduate students of German. All had
immersion experience in Germany, ranging from several months to several years, with a mean of
2.7 years. Moyer did not find that those with a longer LOR had a better accent than their
counterparts: “A longer exposure in the target country did not lead to any greater phonological
accuracy.” However, it would be well to note that the standard deviation of the participants’
length of stay was 2.3. Moyer’s finding that an LOR of four years yields no greater accent ability
than a stay of two years or less is surprising. To give a possible explanation, Moyer points to the
16
discrepancy of exposure versus intake; length of residence does not necessarily coincide with
focus on form. Explaining from a different angle, he points to other studies in which LOR was
not found to be a good predictor of accent and suggests that length of residence is irrelevant in
the face of fossilization at the intermediate levels of language acquisition.
Tahta, Wood, and Loewenthal (1981) also found that length of residence, or length of
stay as they refer to it, was not a strong predictor of accent transfer. They studied 109 subjects,
males and females, with a wide variety of native languages. All the participants had lived in the
United Kingdom and had learned English there. The study included 10 participants with an AOL
of 6 and 10 at every age thereafter until 15. Nineteen participants had an AOL at 15 or above.
Although they did not find LOR to be a predictor of foreign accent, they mention in their article
that during their preliminary investigations of possible study participants that they noted that
people who had less than two years of residency spoke with an accent even if they had begun
learning at an early age. These people were excluded, however, from their study. All participants
had an LOR within the range of 2-55 years.
These three studies all examined LOR as a variable, with each study having an LOR of a
different length. None of these three studies found LOR to be a significant factor influencing
degree of foreign accent.
Reconciling disparity in research study conclusions
The studies that have taken LOR into account as a variable have come up with such
different results that many of the authors give their opinion of the possible source of such
disparity within their discussion of the results. The most logical attempts to explain the disparity
propose that LOR’s influence on accent is a function of time, but that one’s own particular study
did not examine sufficient data to determine what that is.
17
The authors of two studies suggested that LOR is a significant factor in the early stages of
L2 acquisition. Tahta, Wood, and Loewenthal (1981) noticed a significant difference in the
accents of participation candidates with an LOR of less than two years compared with those that
had an LOR of two years or more. They referenced the study that was done by Oyama in 1976.
Oyama similarly found no effect of LOR, but Tahta, Wood, and Loewenthal suggested that those
results were due to his only studying persons with five or more years of residence and that LOR
may be an important factor, “but only up to a point of a few years, whose exact number has yet
to be determined” (271). Flege made a similar proposal in a study he did in 1988 in which he
compared the speech of two groups of native Taiwanese learners of English. He found that LOR
was not a significant factor, although the first group had an LOR of only 1.1 years and the
second had an LOR of 5.1 years. He owed the lack of correlation between accent and LOR to
both groups’ having already passed a supposed stage of rapid improvement that would correlate
with LOR.
The previously mentioned study of Flege and Fletcher (1992), however, drew the
conclusions that LOR is correlated with less foreign accent, though not a significant predicator.
The range between the LORs of the two study groups in their study was much greater (0.7 vs.
14.3 years), and Flege and Fletcher proposed that LOR was not found to have a significant effect
in previous studies because the range of LOR was too small.
Other Factors Affecting L2 Pronunciation
The most important factor affecting acquisition of L2 phonology is most likely the L1.
The speaker may be better prepared by their first language to acquire some languages than
others. Purcell and Suter (1980) found the L1 to be the single most significant factor affecting
degree of foreign accent in a study of 61 nonnative speakers of English from several L1
18
backgrounds. As other researchers have not attempted a cross-language study like Purcell and
Suter (1980), their data stands undisputed.
Age of learning
The second most important factor to predict foreign accent seems to be the age of
learning (AOL). AOL is most often defined as the age at which the subject came as an immigrant
to the country that speaks the target language. The general rule is the earlier a person begins to
learn the L2, the better that person will pronounce it. Piske et al. (2001) explains that some
researchers contribute the age-related loss of ability to have native-like L2 pronunciation to loss
of neural plasticity. Others, rather than owing loss of phonetic ability to age-related mental
phenomena, attribute age-related inability to acquire native-like pronunciation to transfer from a
more fully developed L1. According to such a view, the L1 system becomes more fully
developed over time; a 12 year old’s L1 system is more developed than a 6 year old’s, and a 15
year old’s L1 system is more developed than a 12 year old’s, etc. This hypothesis of L1
development explains why the relationship between AOL and foreign accent is linear, as has
been found in some studies. On the other hand, a study by Snow & Hoefnagel-Höhle (1977)
found that adolescents and adults have an initial advantage over children in phonetic acquisition
of L2. However, after 10-11 months in the target country, the children surpassed adults in
pronunciation.
Another possible reason for the ability of children to surpass adults in achieving native-
like pronunciation is the hypothesis of a critical period. It has been suggested that there is a
critical period after which the likelihood of developing a native-like accent is slim. Studies have
shown that if the AOL is 6 years old or younger, then a person is much more likely to develop a
native-like accent than a person with an AOL of 12 years or older (Tahta et al., 1981; Flege &
19
Fletcher, 1992). However, other studies have also shown that many people who begin learning
the L2 under the age of 6 are found to have a detectable foreign accent by native speakers, even
if it is slight (Thompson, 1991; Flege et al., 1997). Conversely, other studies have shown that
some L2 learners that began as adults were able to speak without a detectable foreign accent
(Moyer, 1999; Bongaerts et al., 1997). Such exceptions to the hypothesis of a critical period
suggest that other factors besides age are at work in the development of native-like speech
ability. My study examines 20 individuals who are matched for AOL. Although many have had
some degree of formal instruction, all were 19 years old when they arrived in the Spanish-
speaking country and began to learn the language in earnest.
Gender
Another factor that has been studied in attempts to determine its effect on foreign accent
in L2 is gender. Unlike the significant findings for age, the findings for gender have been less
conclusive. The studies are divided in their findings, some with results that being female
correlated with less of an accent (Tahta et al., 1981; Thompson, 1991; Díaz-Campos 2004), but
most finding no such correlation (Snow & Hoefnagel-Höhle, 1977; Purcell & Suter, 1980; Flege
& Fletcher, 1992; Elliott, 1995). Asher and García (1969) found that female children and
adolescents performed better than males, but that the differences depended in part on AOL as
well. Gender made a biggest difference in the group of children and adolescents with an AOL of
1-6 years. Gender may have different effects at different ages. It may be that gender differences
are not due to ability, but rather to sociolinguistic variables. At any rate, it is generally agreed
that sex has less of an effect on foreign accent than other factors, such as AOL and LOR. Gender
will not figure as a variable in the current study.
20
Formal instruction
Unfortunately, there are not many studies on the degree of influence that formal
instruction has on accent. The fact that formal instruction normally neglects pronunciation may
be the reason that studies have generally not found formal instruction to be a significant factor
affecting foreign accent (Purcell & Suter 1980; Thompson 1991; Elliott 1995; Flege, Munro,
MacKay 1995; Flege et al 1999). Perhaps the subjects did not have a long enough span of formal
instruction to make a difference. Díaz-Campos et al. (2002) and Díaz-Campos and Lazar (2003)
did find formal instruction to be correlated with more accurate pronunciation, but that was in
those students with 7 or more years of formal instruction.
The studies that have been done show that formal instruction has little effect on
pronunciation unless the learner has pointedly been given instruction on L2 pronunciation.
Moyer (1999) found that the native American L2 speakers of German that had phonological
(segmental and suprasegmental) instruction consistently were rated as speaking with a more
native like accent than fellow graduate students that had not had phonological training. Lord
(2005) also found pointed phonetic instruction to improve pronunciation accuracy. In an
experiment of American English-speaking undergraduate students enrolled in a Spanish
phonetics class, she found that VOT production to be significantly more native-like in a post-test
than in the pretest taken at the beginning of the class.
Bongaerts (1999) discusses the results of two other studies, another with Dutch learners
of English and a third with Dutch learners of French. In these studies, the learners that
demonstrated native-like accent all had extensive phonetic training. It may be that explicit
phonetic training is required for adult L2 learners that are certainly beyond any critical age/time
before L1 system is fully formed, where pre-pubescent children, especially those younger than 6,
21
may still be able to discern and replicate L2 sounds accurately. The participants of my study, all
adult learners with an LOR of 2 years in the target country, have not had extensive, explicit
phonetic instruction in Spanish. So it may be that any Spanish instruction in high school will
have no significant effect.
Speech style
It is expected that the phonetic accuracy in VOT production of the participants of theis
study will vary with speech style. Tarone (1979) asserts that there is a range of speech styles. As
the style becomes more forma, the speaker pays more attention to form. Furhtmore, this
continuum of formality and attention to form is true in second language productions as well. As
formality increases, so do the instances of target-like L2 forms (Tarone 1982). This relationship
between accuracy and formality of style is predicted by Major’s (2001) stylistic corollary of the
Ontogeny Phylogeny model (OPM). L1 transfer is most prominent when the style is extremely
causal and becomes less and less prominent as the style becomes more formal. According to
Major, one can expect L2 learners to have “more accuracy pronouncing isolated words than in
conversation because in running speech learners often revert to their L1 patterns, making their
foreign accent more prevalent” (Major 2001; p.95). In the current study, participants will be
given three task varying form least to most formal: to tell a narrative, to read a paragraph aloud
for comprehension, and to read aloud a wordlist. I hypothesize that VOT will be shortest, and
most target-like, in the wordlist and longest in the narrative, with VOTs for the passage reading
falling somewhere in between.
Motivation
Another factor, one that has been examined in several studies, is motivation. It seems
intuitive that a person who is highly motivated to pronounce an L2 well will be more successful
22
in acquiring native-like pronunciation than someone who is unmotivated. Purcell and Suter
(1980) found Strength of Concern for Pronunciation Accuracy to be a significant predictor of
foreign accent, after First Language, Aptitude for Oral Mimicry, and LOR. However,
motivational intensity is hard to quantify, and, so, it is difficult to say to what extent a person is
motivated and determine how that affects pronunciation. Motivation has been defined as “the
extent to which the individual works or strives to learn the language because of a desire to do so
and the satisfaction experienced in this activity” (Gardner 1985). According to Gardner, there are
two kinds of motivation. The first, integrative motivation, is what impels a speaker to form
connections with native speakers of the target language, becoming part of their lives. The second
type of motivation, instrumental motivation, describes the desire to successfully acquire a
language for practical purposes, such as professional considerations.
Masgoret and Gardner (2003) found motivation to be the most important predictor in
language acquisition. Motivation has also been found to be an important factor in the context of
the stay abroad. In a study of students that spent an academic year abroad, Isabelli (2001) found
that the most highly motivated students were also the students that showed the most
improvement linguistically. Additionally, Alvord and Christiansen (in press) found motivational
intensity to be a significant factor in target-like pronunciation of Spanish /bdg/ in a study very
similar to mine. I am going to attempt to determine the effect of motivational intensity on the
VOT production of Spanish voiceless stops by the participants of the current study. Motivational
intensity will be measured by means of a survey that will be further detailed in Chapter 3. It is
proposed that research participants with higher motivational intensity will have more target-like
VOTs.
23
Cultural Sensitivity
One of the factors that may influence gains in linguistic ability is cultural sensitivity.
Wilkinson (1998) found that a lack of cultural sensitivity prevents language learners from
interacting with native speakers of the target language while abroad. Students with a great
degree of cultural sensitivity were better able to adapt to the target culture and thus have
prolonged interactions with native speakers that may have resulted in linguistic gains. Twombly
(1995) drew very similar conclusions from a group of students who participated in a study
abroad to Costa Rica. Cultural differences were a major reason that students refrained from
interaction with native speakers of Spanish, which consequently limited their linguistic progress.
Additionally, in a study of American study abroad students in Mexico, Yager (1998) found
improvement in attitude towards Mexicans to be correlated with linguistic improvement in
beginning level students. He used native Spanish speakers as judges of the nativeness of the
students’ speech. Nativeness of speech was related to the amount of informal interactive contact
between the study abroad students and members of the target culture.
L1 use/ L2 use
There are two angles from with language use can be examined. One is frequency of L2
use. In studies that take L2 use into account, participants are asked to estimate how much they
use L2 in general, or in specific places (e.g. at work, at home, etc.). Díaz-Campos (2004), in his
study of study abroad students, found L2 use during the semester to be a significant factor
affecting phonological acquisition during the semester abroad. “Students reporting use of
Spanish outside the classroom for 4 hours or more per week highly favored the production of
faithful variants, whereas students using Spanish for 0-3 hours per week did not favor native-like
pronunciation.”
24
Some studies have found a correlation between L2 use and accent in immigrants (Purcell
& Suter, 1980; Tahta et al, 1981), although others have not (Flege & Fletcher, 1992; Elliot,
1995). Tahta et al. (1981) found L2 use in the home to be the only significant factor besides
AOL to effect accent in 7-11 year olds. They did not run the multiple regression analysis for any
other age group because they found that none of their L2 speakers with an AOL of 6 or less had a
detectable foreign accent, while all of their L2 speakers with an AOL of 12 or greater did have a
foreign accent. L2 use in the home was the only factor besides AOL that was shown to be
significant.
The variable LOR may really be an attempt to quantify L2 use. Perhaps the reason that
studies are divided as to the effects of LOR is due to varied second language use among the
participants. In my research study, all of the learners have the same LOR, and they are asked to
estimate what percentage of their speech was in English and in Spanish during their stay abroad
and at the time of the interviews.
The other angle from which to examine language use is by examining continued L1 use.
Studies that take into account continued L1 use ask immigrants estimate how much they use their
native language. The amount of L1 use has been significantly correlated to degree of foreign
accent in the L2 (Flege et al., 1997; Guion et al., 2000). Flege et al. (1997) had native speakers
of English listen to sentences spoken by 60 speakers, which included rate the level of foreign
accent of a group of native English speakers and two different groups of native Italian speakers.
The listeners rated the accent of the speakers as being “definitely Italian, probably Italian,
probably English, or definitely English.” Both groups of native Italian speakers were early
learners of English, having immigrated to Canada at an average age of 5.9 years for one group
and 5.6 years for another. However, the two groups of immigrants differed in reported amount of
25
L1 use (36% versus 3%). Although both groups were found to have a detectable foreign accent,
the group that reported doing 36% of their communication in Italian had significantly stronger
accents when speaking English.
A similar effect of L1 use on the L2 was found by Guion et al. (2000) in Quichua-
Spanish bilinguals. Native speakers of Quichua that were matched for Spanish AOL differed in
amount of self-reported L1 use. The speakers repeated sentences aloud in both languages. The
sentences were then listened to and rated for accent by monolingual speakers of both languages.
L1 use was found to significantly affect accent in the L2, but no effect was found in the L1.
26
Chapter 3 – Research Methodology
Speakers
The participants include 20 male university students that all recently returned from a 22 –
23 ½ month stay abroad in various Spanish speaking countries. Including: Chile (6 participants),
Costa Rica (1), El Salvador (1), Spain (1), Paraguay (2), Argentina (1), Bolivia/Peru (2), Peru
(1), Nicaragua (1), Mexico (2), Honduras (1), Uruguay, (1). All participants were 19 years old
when they began their stay abroad and 21 years old at the time that the data were collected. All
had been back in the United States for 6 months or less at the time that the data were collected.
Some of the participants had some Spanish in high school, but generally the extent of their
formal language training is what they received in a 9 week preparation course before they began
their experience abroad. While abroad, the participants were considered religious missionaries
and spent every day conversing with native Spanish-speakers of the country. Missionaries speak
with whomever is willing to talk with them, in the streets and in private homes. While abroad,
the participants are constantly paired up with one of their peers, called a companion. The
companion lives with them and accompanies them throughout the day. Companions are
randomly assigned and switch every six weeks. As missionaries in Spanish-speaking countries
are both native English and native Spanish speakers, the participants were able to be paired with
both native English and native Spanish speaker.
The participants are now students at Brigham Young University in their first semester of
study after their return home. They were all members of a Spanish grammar course designed for
those students who learned Spanish as missionaries. Students from two classes participated in a
speech elicitation activity. Of the two classes, 20 students were selected for the study based on
27
sex, whether they had stayed the requisite 22 - 23 1/2 months in a Spanish-speaking country, and
whether they had been back in the United States for 6 months or less.
Variables
The controlled variables include age, sex, and length of stay abroad. The research
participants were restricted to adult males who were 19 years old when they began their stay
abroad. As female missionaries spend less time in the foreign country, sex cannot be analyzed as
an independent factor, as the researcher could not be certain that differences in pronunciation
were not due to a shorter stay abroad. In addition to sex and age, this research will include only
participants who stayed the full 22 months abroad.
The independent variables to be examined are speech style, previous Spanish formal
instruction, time spent with native and nonnative Spanish-speaking companions, time spent
speaking English and Spanish with native and nonnative companions, use of Spanish since their
return, amount of time back in the United States, motivation (as determined by Gardner’s survey
of motivational intensity), and cross-cultural sensitivity (as determined by Cushner’s inventory
of cross-cultural sensitivity).
The first variable, type of speech, will include three variants, listed from most to least
formal: wordlists, passage reading, and spontaneous speech. Formality of task is known to affect
target-like accuracy in form. I hypothesize that VOT will be shortest, and most target-like, in the
wordlist and longest in the narrative, with VOTs for the passage reading falling somewhere in
between.
Because L2 use is beneficial to language acquisition, I hypothesize that time spent with
native Spanish companions will have a stronger positive effect on pronunciation than time spent
with native English companions. Likewise, it is expected that time spent speaking Spanish while
28
abroad and since returning home will positively affect pronunciation. The longer the learners
have been back in the United States, away from the immersion experience, the less target-like
their pronunciation is expected to be.
Formal instruction, motivational intensity, and cultural sensitivity are additional factors
that have been shown by other researchers to have an impact on L2 pronunciation. I hypothesize
that formal instruction will have a significant main effect on the Spanish VOTs of the
participants, making them shorter and more target-like. Likewise, I hypothesize that higher
scores on the motivational intensity survey and the inventory of cross-cultural sensitivity will be
significantly related to more target-like VOTs.
The other independent variables to be examined relate to phonetic environment. The
tokens of /p t k/ will all be at the syllable onset, because it is there that voiceless stops are
aspirated in English (Hualde; 2005). I assume that aspiration in speaking Spanish will only occur
in contexts where transfer is possible. For that reason, any voiceless stop that is preceded by /s-/,
either word-internally or in the flow of continuous speech will not be considered. Klatt (1975)
found that, in English, the VOT of /p t k/ preceded by /s-/ is almost identical to the VOT of /b d
g/, making them short-lag, rather than long-lag occlusions.
The aspects of linguistic context that will be considered include the segments preceding
and following the voiceless stop. Following previous research, I expect VOT to be longer when
the stop immediately precedes a liquid (Klatt, 1975). Also, research suggests that VOT will be
longer before high vowels than lax vowels (Yavas, 2009). Other linguistic aspects included as
independent variables are place of articulation, stress, and word-initial versus word-internal
position.
29
It is expected that place of articulation will be found to have a significant effect on VOT.
Previous studies have found /p/ to have the shortest average VOT and /k/ to have the longest in
the native speech of both English and Spanish. A different finding by the current study would be
surprising and may indicate the presence of some unforeseen interaction in the interlanguage.
Stress and word-initial versus word-internal position are another two factors that may
have an effect on VOT. Beginning a stressed syllable is associated with longer VOTs in English
and I hypothesize that the learners’ VOTs will be longer in stressed than in unstressed syllables.
The difference in the VOT of voiceless stops that begin a word versus the VOT of those that
begin a syllable internally is less researched, but I hypothesize that word position will make a
significant difference, with the VOT of word-initial voiceless stops being longer than their
syllable initial but word-internal counterparts.
Instruments
The Inventory of Cross-Cultural Sensitivity
The instrument that I will use to measure cultural sensitivity is Cushner’s (1986)
Inventory of Cross-Cultural Sensitivity (ICCS). The ICCS consists of 32 statements with which
the respondent chooses where he ranks on a scale of 1 to 7, with 1 representing “Strongly
Disagree” and 7 being “Strongly Agree.” The ICCS comprises five subscales that measure
different aspects of cultural sensitivity: Cultural Integration, Behavioral Response, Intellectual
Interaction, Attitudes Toward Others, and Empathy. The scores for the five subscales add
together to give a total ICCS score. The ICCS has been shown to be a valid measure of cross-
cultural sensitivity, successfully distinguishing between people that have been cross-culturally
trained and those that have not (Broaddus 1986; Cushner 1989). A copy of the ICCS can found
in Appendix B.
30
Motivational Intensity survey
Participants were also given a survey to assess motivational intensity (see Appendix C).
The survey consists of 9 statements (e.g. I intend to improve my Spanish as much as I can) to
which the participants responded using a Likert scale of 1 to 4, with 1 signifying "strongly
disagree" and 4 signifying "strong agree." This version of the survey was taken from Martinsen
(2007) who adapted it from Gardner (1985).
Method
Each student was given a background questionnaire as well as the motivational intensity
and the cross-cultural sensitivity surveys in class, which they filled out before arriving to the
interview. Students were interviewed individually, with each interview lasting approximately 15
minutes. The participants were asked to produce three types of speech, beginning with the least
formal: spontaneous speech, passage reading, and wordlist. The spontaneous speech was
procured in the form of a narrative. Participants were asked to tell the researcher a story based on
the illustrations of the wordless children’s book Good Dog, Carl, by Alexandra Day. The
illustrations tell the story of the adventures that a dog and a baby have together around the house
while the mother is away. The only additional instruction they received was that the dog's name
was Carlos and that the baby's name was Tito (or Tomás). When the student had finished, he was
asked to read aloud a passage and told that the researcher would ask him content-based questions
for understanding afterward. The final task was to read aloud a wordlist. The words on the
wordlist, as well as those within in the passage, were selected to include all linguistic variables
being considered. A copy of the passage and the wordlist can be found in the Appendix.
All recording was done on the Brigham Young University campus in a sound proof
recording studio located in the Humanities Learning Resource Center using a Sennheiser
31
MKH40 P48 microphone and Peak Pro 5.2 recording software. The recordings were saved as
.wav files and analyzed in PRAAT (Boersma 2001). PRAAT, a computer program specifically
designed for phonetic studies, produced waveforms and spectrograms for all of the sound files
and allowed for all measurements to be made to the nearest thousandth of a millisecond. All
measurements were done by the researcher, who used the waveform to measure from the release
of articulatory occlusion to the onset of periodic vibration. The beginning of the VOT was
marked at the release of occlusion and was generally indisputable, except in the case of /p/. I
found that the more Spanish-like the production, the harder it was to find the release of
occlusion, because there was no burst of air with it. In cases like this, the spectrogram revealed
an approximate start, which, upon taking a closer look in the area, I could often find the moment
of aperture/release on the waveform. Those tokens for which a beginning could not be
determined with certainty, or which underwent prevoicing, were excluded from the analysis.
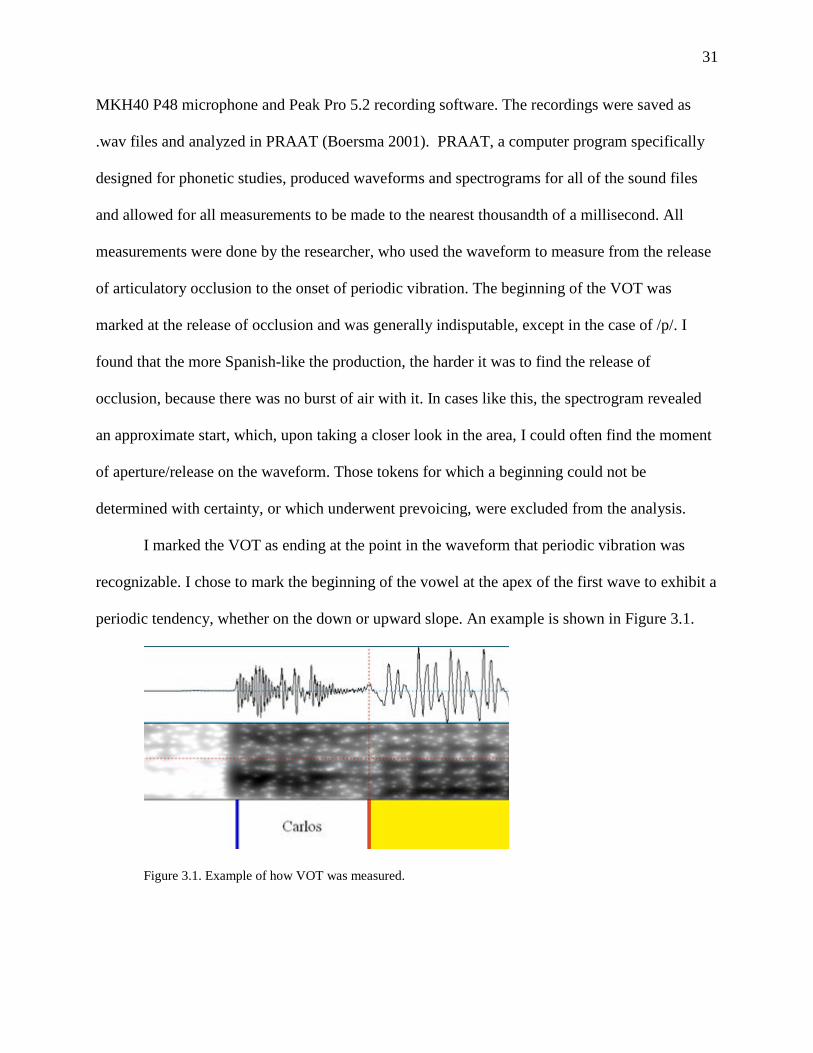
I marked the VOT as ending at the point in the waveform that periodic vibration was
recognizable. I chose to mark the beginning of the vowel at the apex of the first wave to exhibit a
periodic tendency, whether on the down or upward slope. An example is shown in Figure 3.1.
Figure 3.1. Example of how VOT was measured.
32
Statistical Analysis
All of the variables were analyzed statistically in order to determine whether they had a
significant effect on foreign accent. The statistical analysis was done in SPSS with the help Dr.
Dennis Eggett of the Brigham Young University Department of Statistics and Dr. Scott Alvord
of the Brigham Young University Department of Spanish and Portuguese. The type of statistical
analysis done was a random effects model, specifically a mixed model analysis of co-variance.
The mixed model includes both a multiple regression analysis and a repeated measures analysis
of variance (ANOVA). A random effects model is a good fit for studies that take repeated
measures over time, because it takes into account that the some of the variation in the subjects
answers will be random and not due to any particular variable. Although these models are
generally thought of for longitudinal data, in this study the repeated measurements of VOT from
each speaker acted in much the same way as longitudinal data. “The essential feature of a
random effects model for longitudinal data is that there is natural heterogeneity across
individuals in their responses over time and that this heterogeneity can be represented by an
appropriate probability distribution” (Landau & Everitt, 2004).
33
Chapter 4 – Results
Results for the First Research Question
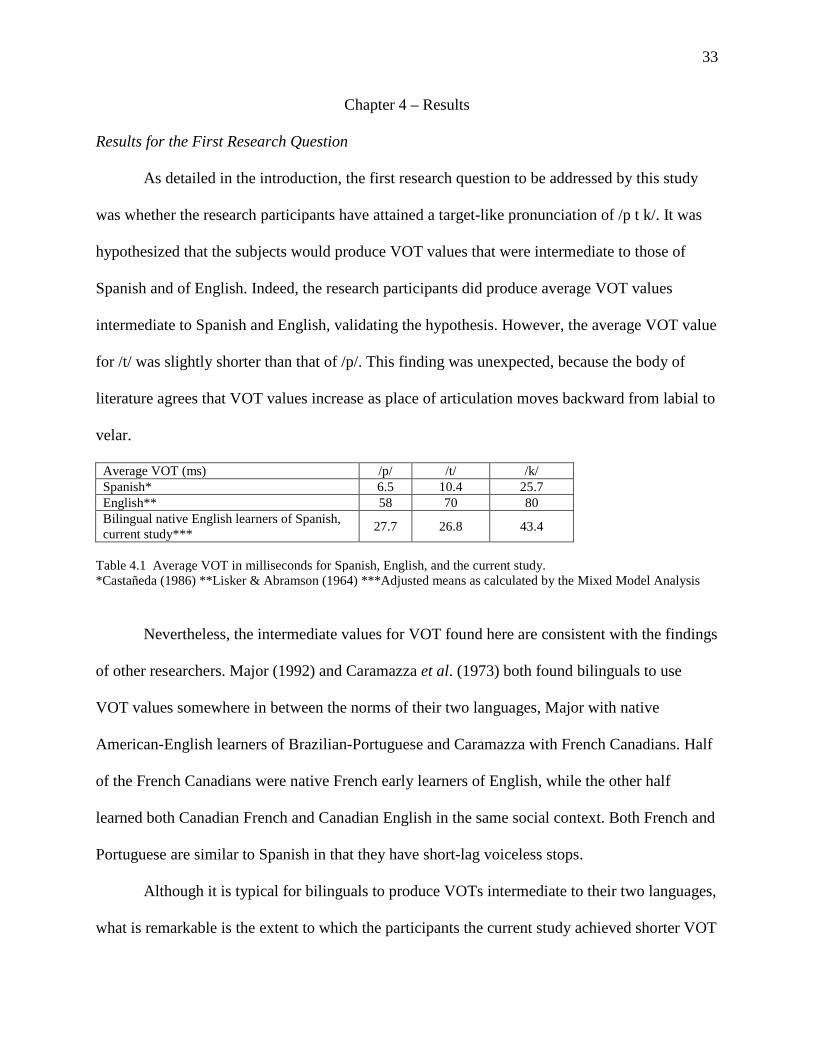
As detailed in the introduction, the first research question to be addressed by this study
was whether the research participants have attained a target-like pronunciation of /p t k/. It was
hypothesized that the subjects would produce VOT values that were intermediate to those of
Spanish and of English. Indeed, the research participants did produce average VOT values
intermediate to Spanish and English, validating the hypothesis. However, the average VOT value
for /t/ was slightly shorter than that of /p/. This finding was unexpected, because the body of
literature agrees that VOT values increase as place of articulation moves backward from labial to
velar.
Average VOT (ms) /p/ /t/ /k/ Spanish* 6.5 10.4 25.7 English** 58 70 80 Bilingual native English learners of Spanish, current study*** 27.7 26.8 43.4
Table 4.1 Average VOT in milliseconds for Spanish, English, and the current study. *Castañeda (1986) **Lisker & Abramson (1964) ***Adjusted means as calculated by the Mixed Model Analysis
Nevertheless, the intermediate values for VOT found here are consistent with the findings
of other researchers. Major (1992) and Caramazza et al. (1973) both found bilinguals to use
VOT values somewhere in between the norms of their two languages, Major with native
American-English learners of Brazilian-Portuguese and Caramazza with French Canadians. Half
of the French Canadians were native French early learners of English, while the other half
learned both Canadian French and Canadian English in the same social context. Both French and
Portuguese are similar to Spanish in that they have short-lag voiceless stops.
Although it is typical for bilinguals to produce VOTs intermediate to their two languages,
what is remarkable is the extent to which the participants the current study achieved shorter VOT
34
production in a limited amount of time. After a stay abroad of a little less than two years, the
participants’ phonetic accuracy is comparable to L2 speakers with a length of residence (LOR) of
20 years. Flege, Munro, and MacKay (1995) allow us to compare our study participants to other
L2 speakers that began learning their L2 at a similar age. Flege et. al studied the VOTs of 240
native Italian speakers with age of learnings (AOLs) spanning from 2 to 23 years. The AOL was
considered to coincide with the age they were when they immigrated to the United States. The
speakers with an average AOL of 21 years produced VOTs which were almost exactly in
between the reported averages for English and Italian, even after 20 years of living in the United
States.
The L2 speakers in Flege et.al with an AOL of 19 years, the same ages as the learners in
the current study, produced VOTs that were 5-10 ms more target-like than those speakers with an
AOL of 21. Both the subgroups had lived in the United States for over half their lives. The
performance of the learners in the current study, all with an AOL of 19 years, was very
comparable to the 19 year old AOL group in Flege et. al, being within 5-10 ms more target-like
in their L2 than exactly halfway between the average VOT of English and Spanish, except for /t/,
which was even shorter. The participants of the current study were all in the country where the
L2 was spoken for a little less than two years. It appears that two years is a sufficient LOR to
achieve the average phonetic accuracy possible to L2 speakers that begin learning at age 19.
Some of the speakers in Flege et. al (1995) succeeded in producing L2 VOTs in a native-
like range. A few of the participants in this study also succeeded in pronouncing some of their
voiceless stops with native-like VOTs. Although only speaker 3 achieved a VOT as short as the
native average, and that only for /k/, other speakers did produce VOTs that are within a native
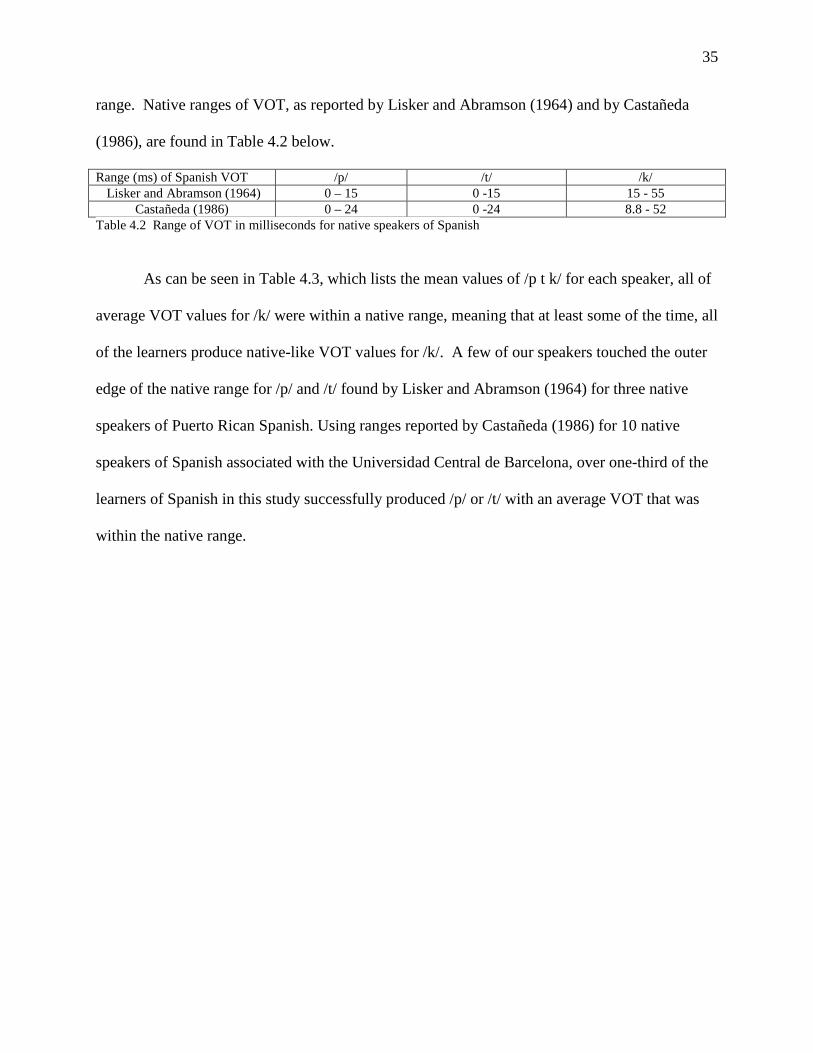
35
range. Native ranges of VOT, as reported by Lisker and Abramson (1964) and by Castañeda
(1986), are found in Table 4.2 below.
Range (ms) of Spanish VOT /p/ /t/ /k/ Lisker and Abramson (1964) 0 – 15 0 -15 15 - 55
Castañeda (1986) 0 – 24 0 -24 8.8 - 52 Table 4.2 Range of VOT in milliseconds for native speakers of Spanish
As can be seen in Table 4.3, which lists the mean values of /p t k/ for each speaker, all of
average VOT values for /k/ were within a native range, meaning that at least some of the time, all
of the learners produce native-like VOT values for /k/. A few of our speakers touched the outer
edge of the native range for /p/ and /t/ found by Lisker and Abramson (1964) for three native
speakers of Puerto Rican Spanish. Using ranges reported by Castañeda (1986) for 10 native
speakers of Spanish associated with the Universidad Central de Barcelona, over one-third of the
learners of Spanish in this study successfully produced /p/ or /t/ with an average VOT that was
within the native range.
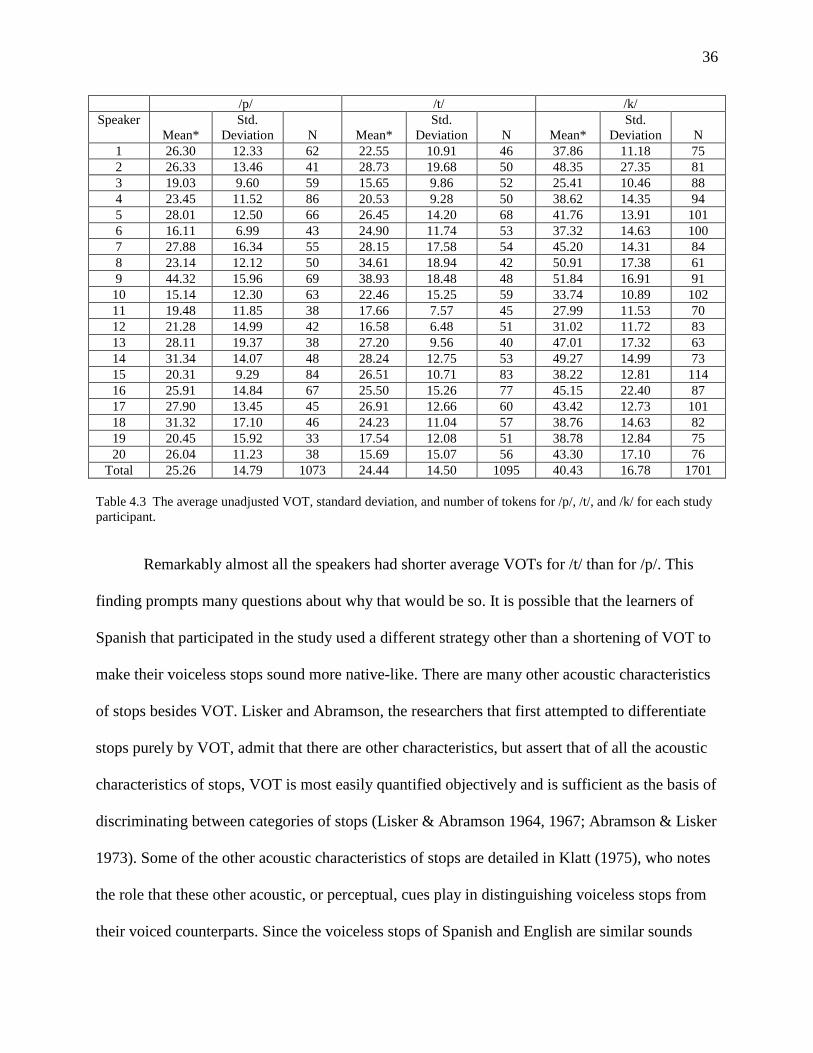
36
/p/ /t/ /k/ Speaker
Mean* Std.
Deviation N Mean* Std.
Deviation N Mean* Std.
Deviation N 1 26.30 12.33 62 22.55 10.91 46 37.86 11.18 75 2 26.33 13.46 41 28.73 19.68 50 48.35 27.35 81 3 19.03 9.60 59 15.65 9.86 52 25.41 10.46 88 4 23.45 11.52 86 20.53 9.28 50 38.62 14.35 94 5 28.01 12.50 66 26.45 14.20 68 41.76 13.91 101 6 16.11 6.99 43 24.90 11.74 53 37.32 14.63 100 7 27.88 16.34 55 28.15 17.58 54 45.20 14.31 84 8 23.14 12.12 50 34.61 18.94 42 50.91 17.38 61 9 44.32 15.96 69 38.93 18.48 48 51.84 16.91 91 10 15.14 12.30 63 22.46 15.25 59 33.74 10.89 102 11 19.48 11.85 38 17.66 7.57 45 27.99 11.53 70 12 21.28 14.99 42 16.58 6.48 51 31.02 11.72 83 13 28.11 19.37 38 27.20 9.56 40 47.01 17.32 63 14 31.34 14.07 48 28.24 12.75 53 49.27 14.99 73 15 20.31 9.29 84 26.51 10.71 83 38.22 12.81 114 16 25.91 14.84 67 25.50 15.26 77 45.15 22.40 87 17 27.90 13.45 45 26.91 12.66 60 43.42 12.73 101 18 31.32 17.10 46 24.23 11.04 57 38.76 14.63 82 19 20.45 15.92 33 17.54 12.08 51 38.78 12.84 75 20 26.04 11.23 38 15.69 15.07 56 43.30 17.10 76
Total 25.26 14.79 1073 24.44 14.50 1095 40.43 16.78 1701 Table 4.3 The average unadjusted VOT, standard deviation, and number of tokens for /p/, /t/, and /k/ for each study participant.
Remarkably almost all the speakers had shorter average VOTs for /t/ than for /p/. This
finding prompts many questions about why that would be so. It is possible that the learners of
Spanish that participated in the study used a different strategy other than a shortening of VOT to
make their voiceless stops sound more native-like. There are many other acoustic characteristics
of stops besides VOT. Lisker and Abramson, the researchers that first attempted to differentiate
stops purely by VOT, admit that there are other characteristics, but assert that of all the acoustic
characteristics of stops, VOT is most easily quantified objectively and is sufficient as the basis of
discriminating between categories of stops (Lisker & Abramson 1964, 1967; Abramson & Lisker
1973). Some of the other acoustic characteristics of stops are detailed in Klatt (1975), who notes
the role that these other acoustic, or perceptual, cues play in distinguishing voiceless stops from
their voiced counterparts. Since the voiceless stops of Spanish and English are similar sounds
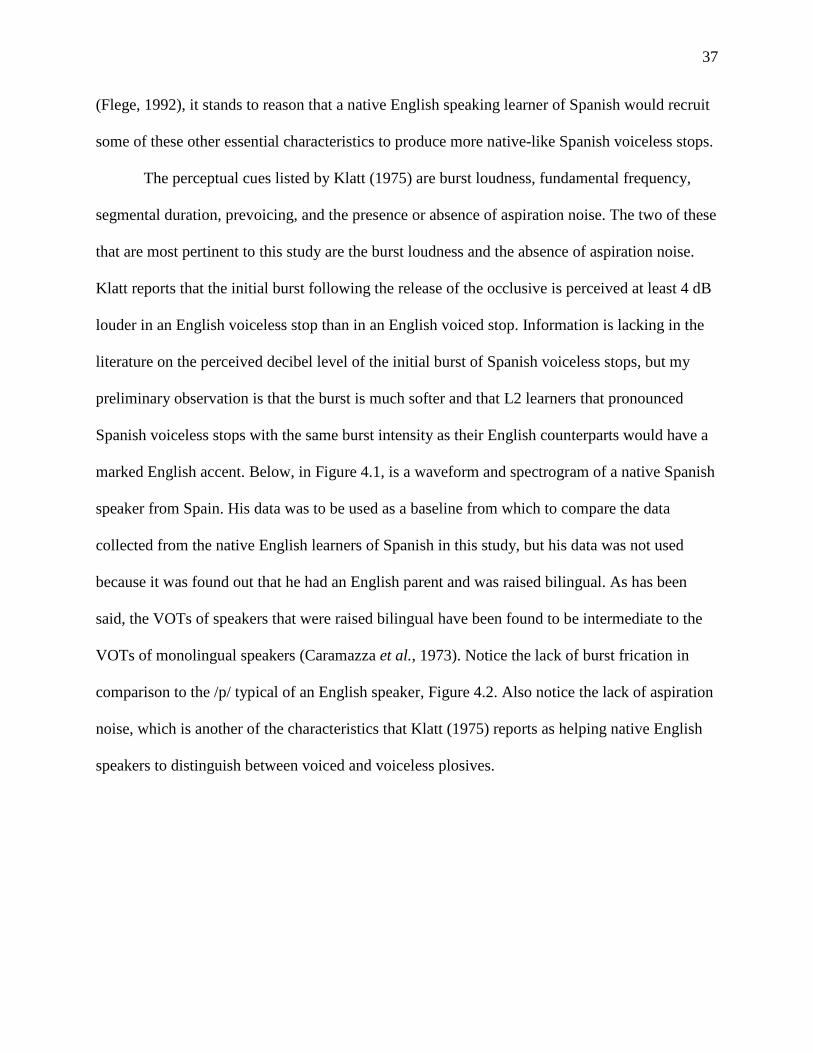
37
(Flege, 1992), it stands to reason that a native English speaking learner of Spanish would recruit
some of these other essential characteristics to produce more native-like Spanish voiceless stops.
The perceptual cues listed by Klatt (1975) are burst loudness, fundamental frequency,
segmental duration, prevoicing, and the presence or absence of aspiration noise. The two of these
that are most pertinent to this study are the burst loudness and the absence of aspiration noise.
Klatt reports that the initial burst following the release of the occlusive is perceived at least 4 dB
louder in an English voiceless stop than in an English voiced stop. Information is lacking in the
literature on the perceived decibel level of the initial burst of Spanish voiceless stops, but my
preliminary observation is that the burst is much softer and that L2 learners that pronounced
Spanish voiceless stops with the same burst intensity as their English counterparts would have a
marked English accent. Below, in Figure 4.1, is a waveform and spectrogram of a native Spanish
speaker from Spain. His data was to be used as a baseline from which to compare the data
collected from the native English learners of Spanish in this study, but his data was not used
because it was found out that he had an English parent and was raised bilingual. As has been
said, the VOTs of speakers that were raised bilingual have been found to be intermediate to the
VOTs of monolingual speakers (Caramazza et al., 1973). Notice the lack of burst frication in
comparison to the /p/ typical of an English speaker, Figure 4.2. Also notice the lack of aspiration
noise, which is another of the characteristics that Klatt (1975) reports as helping native English
speakers to distinguish between voiced and voiceless plosives.
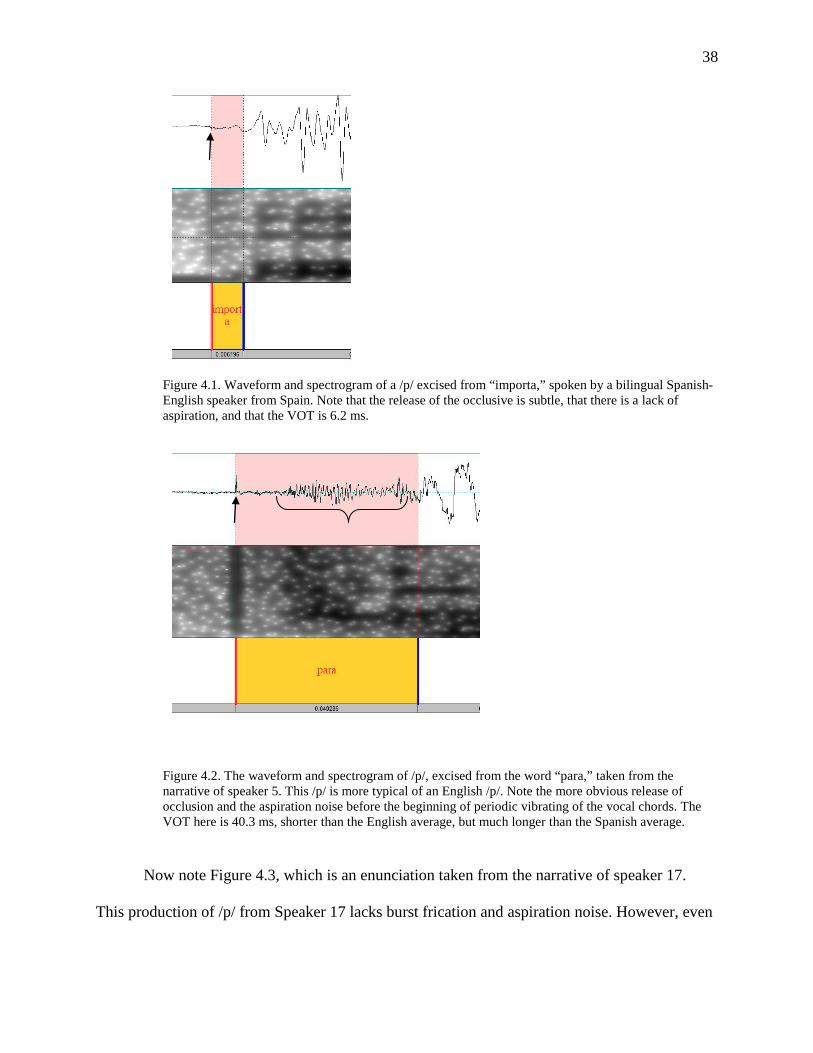
38
Figure 4.1. Waveform and spectrogram of a /p/ excised from “importa,” spoken by a bilingual Spanish-English speaker from Spain. Note that the release of the occlusive is subtle, that there is a lack of aspiration, and that the VOT is 6.2 ms.
Figure 4.2. The waveform and spectrogram of /p/, excised from the word “para,” taken from the narrative of speaker 5. This /p/ is more typical of an English /p/. Note the more obvious release of occlusion and the aspiration noise before the beginning of periodic vibrating of the vocal chords. The VOT here is 40.3 ms, shorter than the English average, but much longer than the Spanish average.
Now note Figure 4.3, which is an enunciation taken from the narrative of speaker 17.
This production of /p/ from Speaker 17 lacks burst frication and aspiration noise. However, even
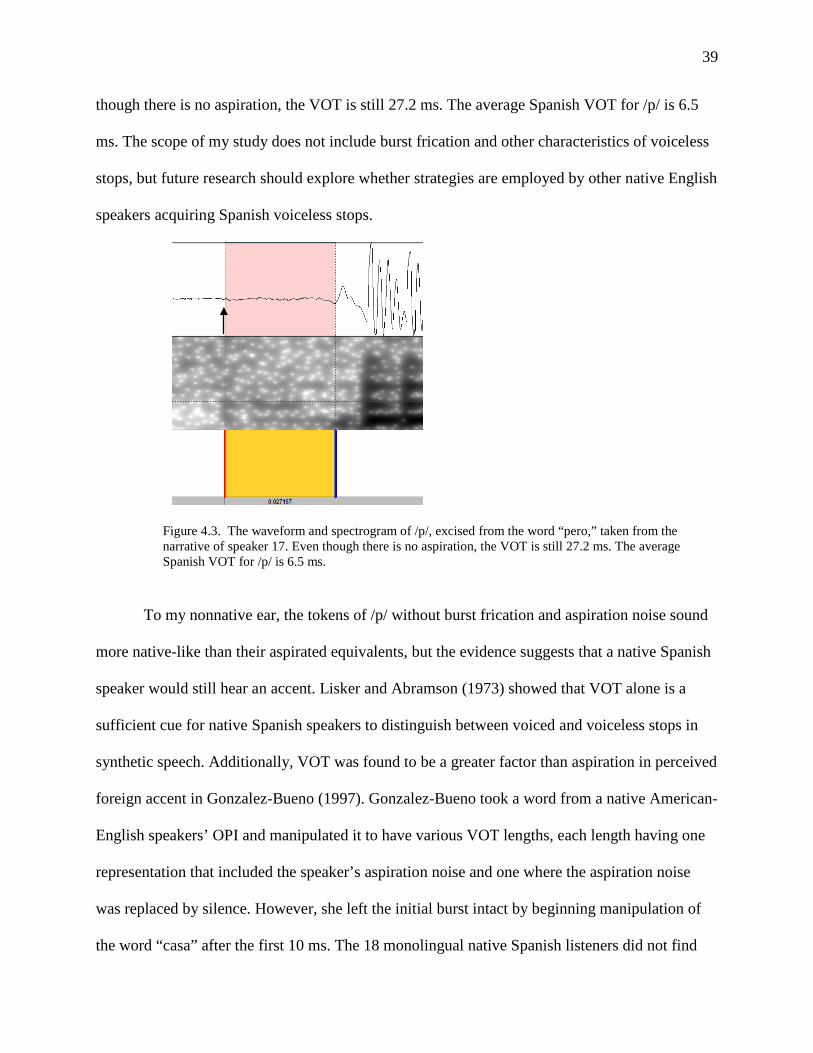
39
though there is no aspiration, the VOT is still 27.2 ms. The average Spanish VOT for /p/ is 6.5
ms. The scope of my study does not include burst frication and other characteristics of voiceless
stops, but future research should explore whether strategies are employed by other native English
speakers acquiring Spanish voiceless stops.
Figure 4.3. The waveform and spectrogram of /p/, excised from the word “pero,” taken from the narrative of speaker 17. Even though there is no aspiration, the VOT is still 27.2 ms. The average Spanish VOT for /p/ is 6.5 ms.
To my nonnative ear, the tokens of /p/ without burst frication and aspiration noise sound
more native-like than their aspirated equivalents, but the evidence suggests that a native Spanish
speaker would still hear an accent. Lisker and Abramson (1973) showed that VOT alone is a
sufficient cue for native Spanish speakers to distinguish between voiced and voiceless stops in
synthetic speech. Additionally, VOT was found to be a greater factor than aspiration in perceived
foreign accent in Gonzalez-Bueno (1997). Gonzalez-Bueno took a word from a native American-
English speakers’ OPI and manipulated it to have various VOT lengths, each length having one
representation that included the speaker’s aspiration noise and one where the aspiration noise
was replaced by silence. However, she left the initial burst intact by beginning manipulation of
the word “casa” after the first 10 ms. The 18 monolingual native Spanish listeners did not find
40
the aspirated versions to be any more heavily accented than their aspirationless counterparts. The
variable that was correlated with accent was VOT. Listeners may therefore have been influenced
by burst loudness.
Results for the Second Research Question
The second research question seeks to know what the effects of phonetic context, speech
style, language use (during time abroad and at time of study), formal instruction, motivation, and
cultural sensitivity are on the production of /p t k/ by this learner population. A Mixed Model
Analysis of Co-variance found a significant main effect for all of the variables of phonetic
context, namely, place of articulation (segment), syllable stress, word initial position, preceding
segment, and following segment. In regards to the other factors, a significant main effect was
found for the following variables: speech style; number of months with native Spanish speakers
as companions; percent of communication in Spanish with native Spanish-speaking companions
abroad; number of months with native English speakers as companions; formal instruction; time
spent weekly speaking in Spanish at the time of the study; and, time spent weekly speaking in
Spanish with native speakers at the time of the study. Factors that did not show a significant
main effect include: percentage of communication in English with native English-speaking
companions; motivation; cultural sensitivity; and the amount of time past since their return to the
United States. p values were considered to be significant when p ≤ .05.
Segment
The linear mixed model analysis found segment to have a main effect, F(2, 3833) =
490.28, p < .001. The segment /k/ was found to have a significantly longer VOT (μ = 43.37, SD
= 4.91), than either /p/ (μ = 27.66, SD = 4.90) or /t/ (μ = 26.80, SD = 4.92). The segments /p/ and
/t/ had statistically equal VOTs, with shorter averages found for /t/ than for /p/. The finding of
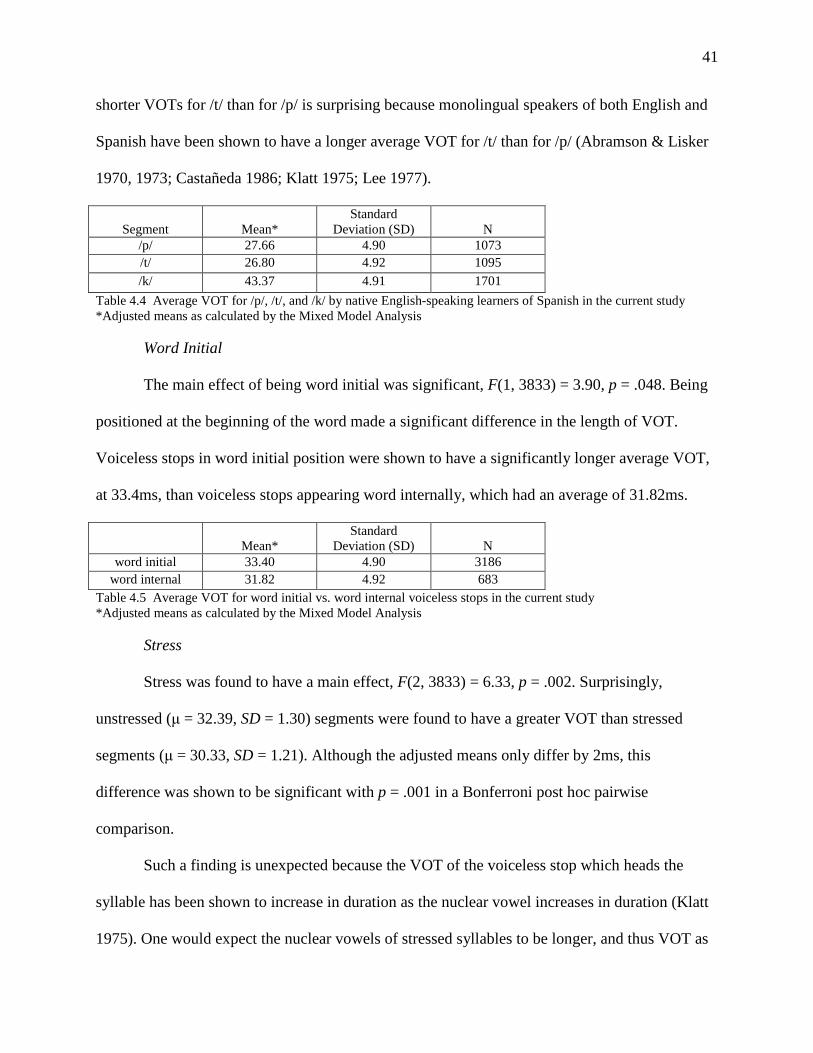
41
shorter VOTs for /t/ than for /p/ is surprising because monolingual speakers of both English and
Spanish have been shown to have a longer average VOT for /t/ than for /p/ (Abramson & Lisker
1970, 1973; Castañeda 1986; Klatt 1975; Lee 1977).
Segment
Mean*
Standard Deviation (SD)
N
/p/ 27.66 4.90 1073 /t/ 26.80 4.92 1095 /k/ 43.37 4.91 1701
Table 4.4 Average VOT for /p/, /t/, and /k/ by native English-speaking learners of Spanish in the current study *Adjusted means as calculated by the Mixed Model Analysis
Word Initial
The main effect of being word initial was significant, F(1, 3833) = 3.90, p = .048. Being
positioned at the beginning of the word made a significant difference in the length of VOT.
Voiceless stops in word initial position were shown to have a significantly longer average VOT,
at 33.4ms, than voiceless stops appearing word internally, which had an average of 31.82ms.
Mean*
Standard Deviation (SD)
N
word initial 33.40 4.90 3186 word internal 31.82 4.92 683
Table 4.5 Average VOT for word initial vs. word internal voiceless stops in the current study *Adjusted means as calculated by the Mixed Model Analysis
Stress
Stress was found to have a main effect, F(2, 3833) = 6.33, p = .002. Surprisingly,
unstressed (μ = 32.39, SD = 1.30) segments were found to have a greater VOT than stressed
segments (μ = 30.33, SD = 1.21). Although the adjusted means only differ by 2ms, this
difference was shown to be significant with p = .001 in a Bonferroni post hoc pairwise
comparison.
Such a finding is unexpected because the VOT of the voiceless stop which heads the
syllable has been shown to increase in duration as the nuclear vowel increases in duration (Klatt
1975). One would expect the nuclear vowels of stressed syllables to be longer, and thus VOT as
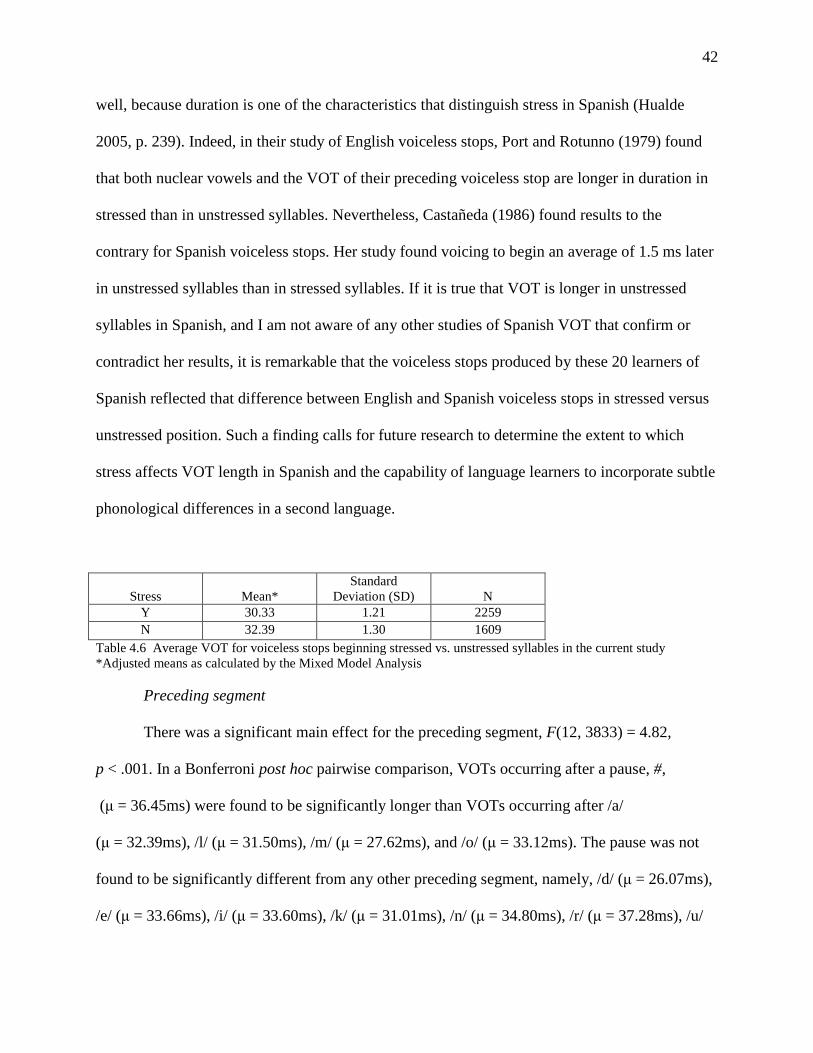
42
well, because duration is one of the characteristics that distinguish stress in Spanish (Hualde
2005, p. 239). Indeed, in their study of English voiceless stops, Port and Rotunno (1979) found
that both nuclear vowels and the VOT of their preceding voiceless stop are longer in duration in
stressed than in unstressed syllables. Nevertheless, Castañeda (1986) found results to the
contrary for Spanish voiceless stops. Her study found voicing to begin an average of 1.5 ms later
in unstressed syllables than in stressed syllables. If it is true that VOT is longer in unstressed
syllables in Spanish, and I am not aware of any other studies of Spanish VOT that confirm or
contradict her results, it is remarkable that the voiceless stops produced by these 20 learners of
Spanish reflected that difference between English and Spanish voiceless stops in stressed versus
unstressed position. Such a finding calls for future research to determine the extent to which
stress affects VOT length in Spanish and the capability of language learners to incorporate subtle
phonological differences in a second language.
Stress
Mean*
Standard Deviation (SD)
N
Y 30.33 1.21 2259 N 32.39 1.30 1609
Table 4.6 Average VOT for voiceless stops beginning stressed vs. unstressed syllables in the current study *Adjusted means as calculated by the Mixed Model Analysis
Preceding segment
There was a significant main effect for the preceding segment, F(12, 3833) = 4.82,
p < .001. In a Bonferroni post hoc pairwise comparison, VOTs occurring after a pause, #,
(μ = 36.45ms) were found to be significantly longer than VOTs occurring after /a/
(μ = 32.39ms), /l/ (μ = 31.50ms), /m/ (μ = 27.62ms), and /o/ (μ = 33.12ms). The pause was not
found to be significantly different from any other preceding segment, namely, /d/ (μ = 26.07ms),
/e/ (μ = 33.66ms), /i/ (μ = 33.60ms), /k/ (μ = 31.01ms), /n/ (μ = 34.80ms), /r/ (μ = 37.28ms), /u/
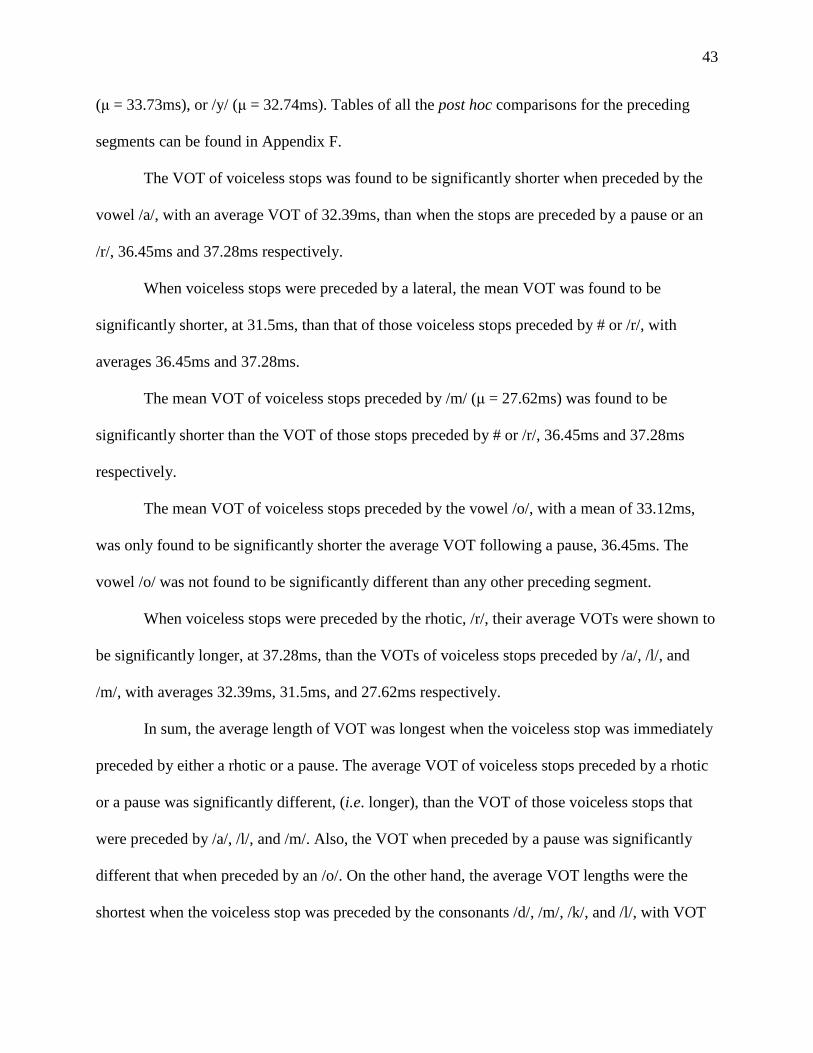
43
(μ = 33.73ms), or /y/ (μ = 32.74ms). Tables of all the post hoc comparisons for the preceding
segments can be found in Appendix F.
The VOT of voiceless stops was found to be significantly shorter when preceded by the
vowel /a/, with an average VOT of 32.39ms, than when the stops are preceded by a pause or an
/r/, 36.45ms and 37.28ms respectively.
When voiceless stops were preceded by a lateral, the mean VOT was found to be
significantly shorter, at 31.5ms, than that of those voiceless stops preceded by # or /r/, with
averages 36.45ms and 37.28ms.
The mean VOT of voiceless stops preceded by /m/ (μ = 27.62ms) was found to be
significantly shorter than the VOT of those stops preceded by # or /r/, 36.45ms and 37.28ms
respectively.
The mean VOT of voiceless stops preceded by the vowel /o/, with a mean of 33.12ms,
was only found to be significantly shorter the average VOT following a pause, 36.45ms. The
vowel /o/ was not found to be significantly different than any other preceding segment.
When voiceless stops were preceded by the rhotic, /r/, their average VOTs were shown to
be significantly longer, at 37.28ms, than the VOTs of voiceless stops preceded by /a/, /l/, and
/m/, with averages 32.39ms, 31.5ms, and 27.62ms respectively.
In sum, the average length of VOT was longest when the voiceless stop was immediately
preceded by either a rhotic or a pause. The average VOT of voiceless stops preceded by a rhotic
or a pause was significantly different, (i.e. longer), than the VOT of those voiceless stops that
were preceded by /a/, /l/, and /m/. Also, the VOT when preceded by a pause was significantly
different that when preceded by an /o/. On the other hand, the average VOT lengths were the
shortest when the voiceless stop was preceded by the consonants /d/, /m/, /k/, and /l/, with VOT
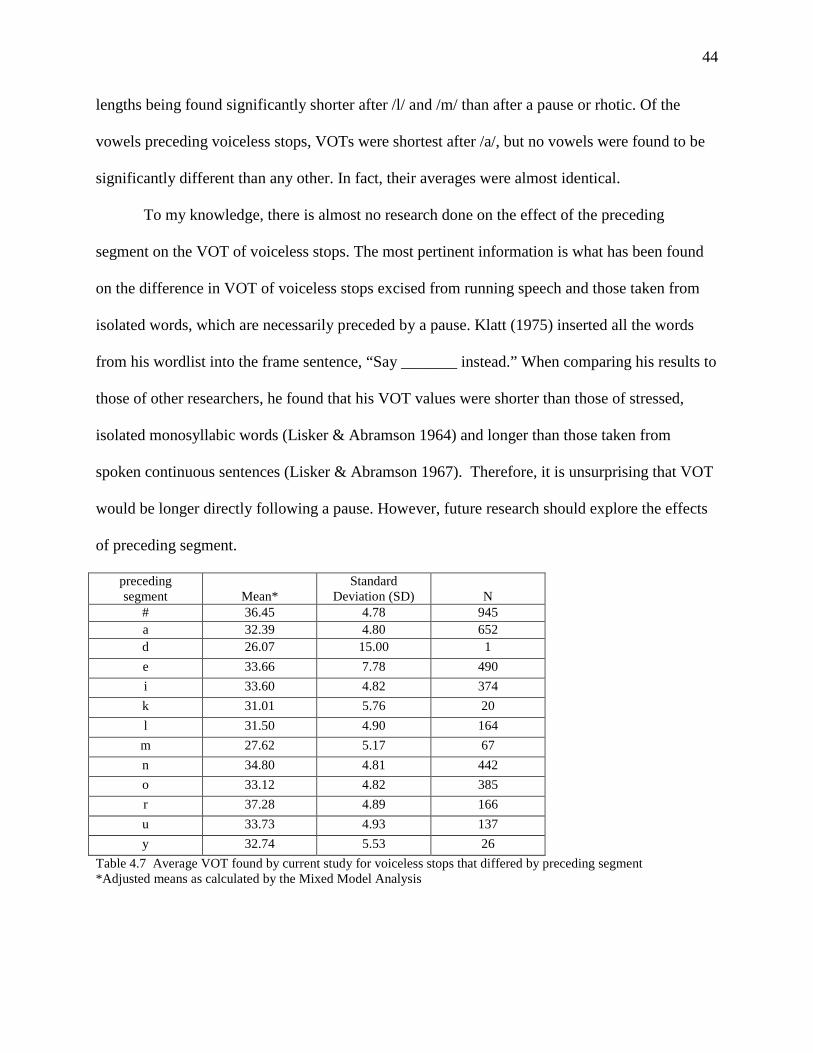
44
lengths being found significantly shorter after /l/ and /m/ than after a pause or rhotic. Of the
vowels preceding voiceless stops, VOTs were shortest after /a/, but no vowels were found to be
significantly different than any other. In fact, their averages were almost identical.
To my knowledge, there is almost no research done on the effect of the preceding
segment on the VOT of voiceless stops. The most pertinent information is what has been found
on the difference in VOT of voiceless stops excised from running speech and those taken from
isolated words, which are necessarily preceded by a pause. Klatt (1975) inserted all the words
from his wordlist into the frame sentence, “Say _______ instead.” When comparing his results to
those of other researchers, he found that his VOT values were shorter than those of stressed,
isolated monosyllabic words (Lisker & Abramson 1964) and longer than those taken from
spoken continuous sentences (Lisker & Abramson 1967). Therefore, it is unsurprising that VOT
would be longer directly following a pause. However, future research should explore the effects
of preceding segment.
preceding segment
Mean*
Standard Deviation (SD)
N
# 36.45 4.78 945 a 32.39 4.80 652 d 26.07 15.00 1 e 33.66 7.78 490 i 33.60 4.82 374 k 31.01 5.76 20 l 31.50 4.90 164
m 27.62 5.17 67 n 34.80 4.81 442 o 33.12 4.82 385 r 37.28 4.89 166 u 33.73 4.93 137 y 32.74 5.53 26
Table 4.7 Average VOT found by current study for voiceless stops that differed by preceding segment *Adjusted means as calculated by the Mixed Model Analysis
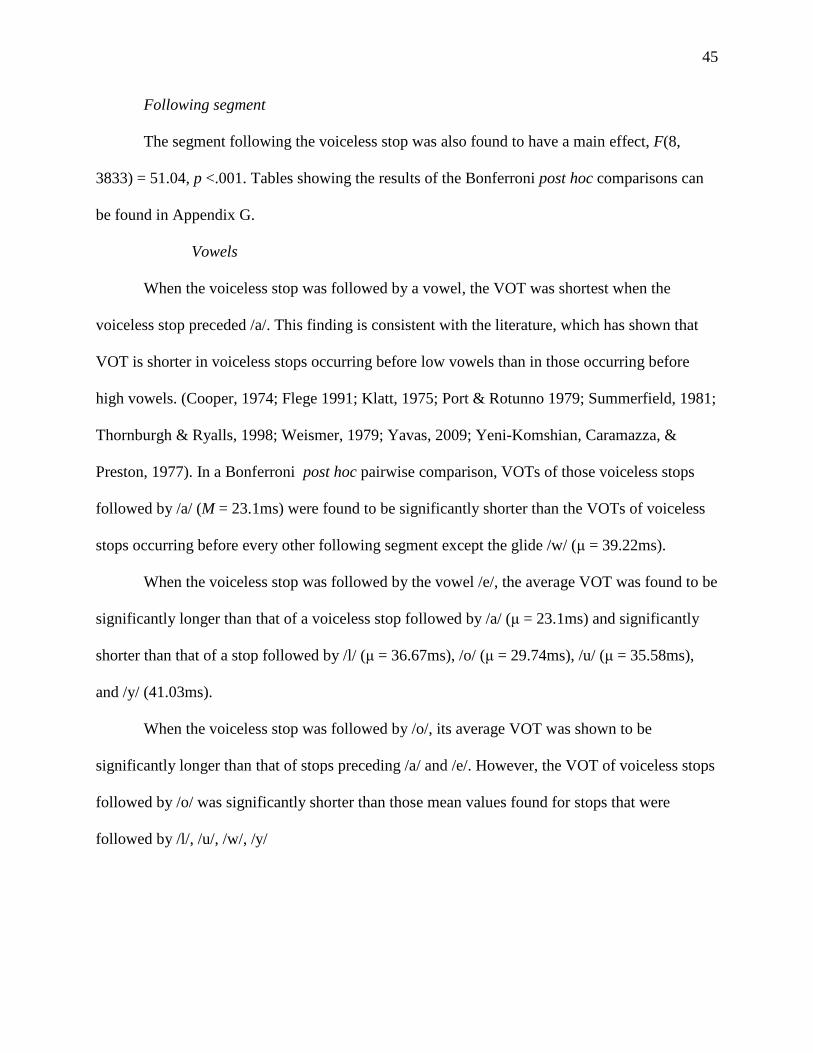
45
Following segment
The segment following the voiceless stop was also found to have a main effect, F(8,
3833) = 51.04, p <.001. Tables showing the results of the Bonferroni post hoc comparisons can
be found in Appendix G.
Vowels
When the voiceless stop was followed by a vowel, the VOT was shortest when the
voiceless stop preceded /a/. This finding is consistent with the literature, which has shown that
VOT is shorter in voiceless stops occurring before low vowels than in those occurring before
high vowels. (Cooper, 1974; Flege 1991; Klatt, 1975; Port & Rotunno 1979; Summerfield, 1981;
Thornburgh & Ryalls, 1998; Weismer, 1979; Yavas, 2009; Yeni-Komshian, Caramazza, &
Preston, 1977). In a Bonferroni post hoc pairwise comparison, VOTs of those voiceless stops
followed by /a/ (M = 23.1ms) were found to be significantly shorter than the VOTs of voiceless
stops occurring before every other following segment except the glide /w/ (μ = 39.22ms).
When the voiceless stop was followed by the vowel /e/, the average VOT was found to be
significantly longer than that of a voiceless stop followed by /a/ (μ = 23.1ms) and significantly
shorter than that of a stop followed by /l/ (μ = 36.67ms), /o/ (μ = 29.74ms), /u/ (μ = 35.58ms),
and /y/ (41.03ms).
When the voiceless stop was followed by /o/, its average VOT was shown to be
significantly longer than that of stops preceding /a/ and /e/. However, the VOT of voiceless stops
followed by /o/ was significantly shorter than those mean values found for stops that were
followed by /l/, /u/, /w/, /y/
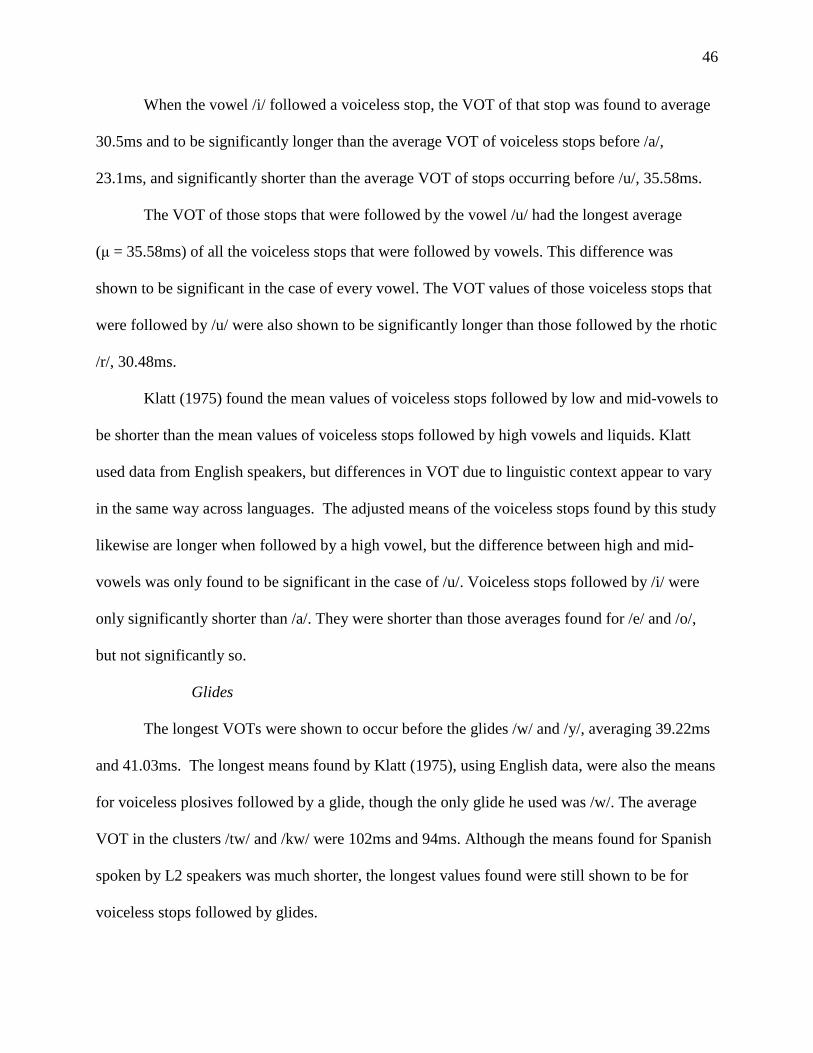
46
When the vowel /i/ followed a voiceless stop, the VOT of that stop was found to average
30.5ms and to be significantly longer than the average VOT of voiceless stops before /a/,
23.1ms, and significantly shorter than the average VOT of stops occurring before /u/, 35.58ms.
The VOT of those stops that were followed by the vowel /u/ had the longest average
(μ = 35.58ms) of all the voiceless stops that were followed by vowels. This difference was
shown to be significant in the case of every vowel. The VOT values of those voiceless stops that
were followed by /u/ were also shown to be significantly longer than those followed by the rhotic
/r/, 30.48ms.
Klatt (1975) found the mean values of voiceless stops followed by low and mid-vowels to
be shorter than the mean values of voiceless stops followed by high vowels and liquids. Klatt
used data from English speakers, but differences in VOT due to linguistic context appear to vary
in the same way across languages. The adjusted means of the voiceless stops found by this study
likewise are longer when followed by a high vowel, but the difference between high and mid-
vowels was only found to be significant in the case of /u/. Voiceless stops followed by /i/ were
only significantly shorter than /a/. They were shorter than those averages found for /e/ and /o/,
but not significantly so.
Glides
The longest VOTs were shown to occur before the glides /w/ and /y/, averaging 39.22ms
and 41.03ms. The longest means found by Klatt (1975), using English data, were also the means
for voiceless plosives followed by a glide, though the only glide he used was /w/. The average
VOT in the clusters /tw/ and /kw/ were 102ms and 94ms. Although the means found for Spanish
spoken by L2 speakers was much shorter, the longest values found were still shown to be for
voiceless stops followed by glides.
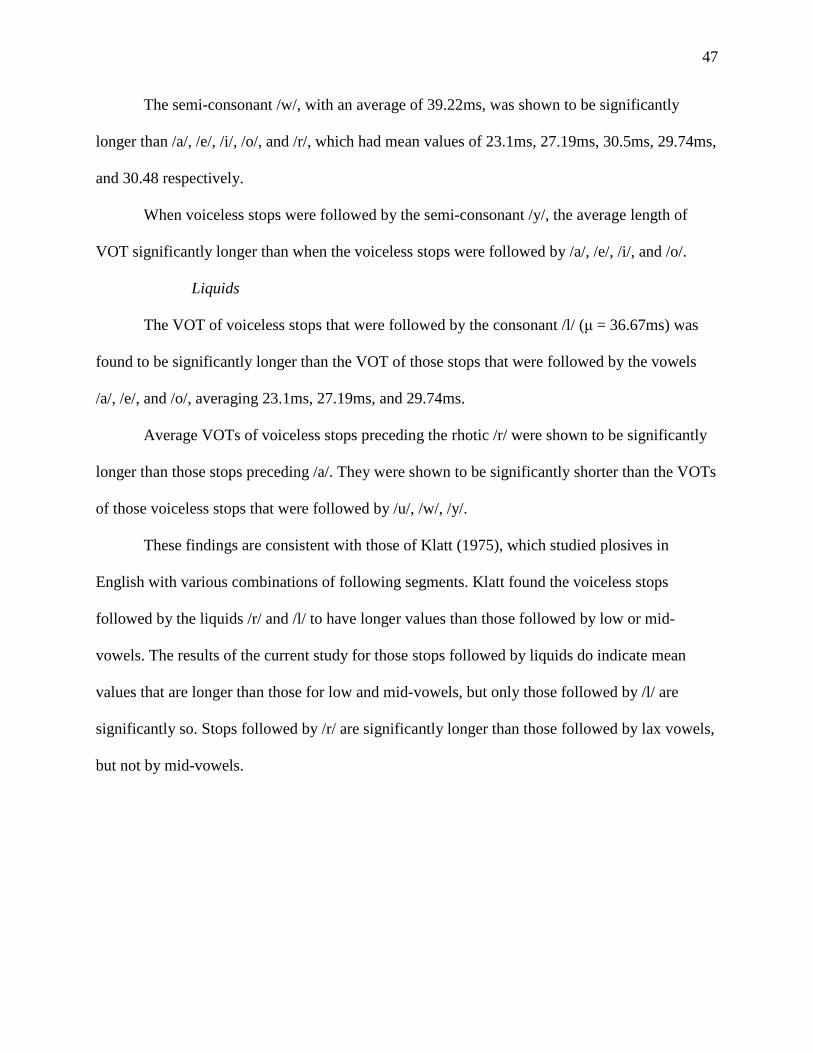
47
The semi-consonant /w/, with an average of 39.22ms, was shown to be significantly
longer than /a/, /e/, /i/, /o/, and /r/, which had mean values of 23.1ms, 27.19ms, 30.5ms, 29.74ms,
and 30.48 respectively.
When voiceless stops were followed by the semi-consonant /y/, the average length of
VOT significantly longer than when the voiceless stops were followed by /a/, /e/, /i/, and /o/.
Liquids
The VOT of voiceless stops that were followed by the consonant /l/ (μ = 36.67ms) was
found to be significantly longer than the VOT of those stops that were followed by the vowels
/a/, /e/, and /o/, averaging 23.1ms, 27.19ms, and 29.74ms.
Average VOTs of voiceless stops preceding the rhotic /r/ were shown to be significantly
longer than those stops preceding /a/. They were shown to be significantly shorter than the VOTs
of those voiceless stops that were followed by /u/, /w/, /y/.
These findings are consistent with those of Klatt (1975), which studied plosives in
English with various combinations of following segments. Klatt found the voiceless stops
followed by the liquids /r/ and /l/ to have longer values than those followed by low or mid-
vowels. The results of the current study for those stops followed by liquids do indicate mean
values that are longer than those for low and mid-vowels, but only those followed by /l/ are
significantly so. Stops followed by /r/ are significantly longer than those followed by lax vowels,
but not by mid-vowels.
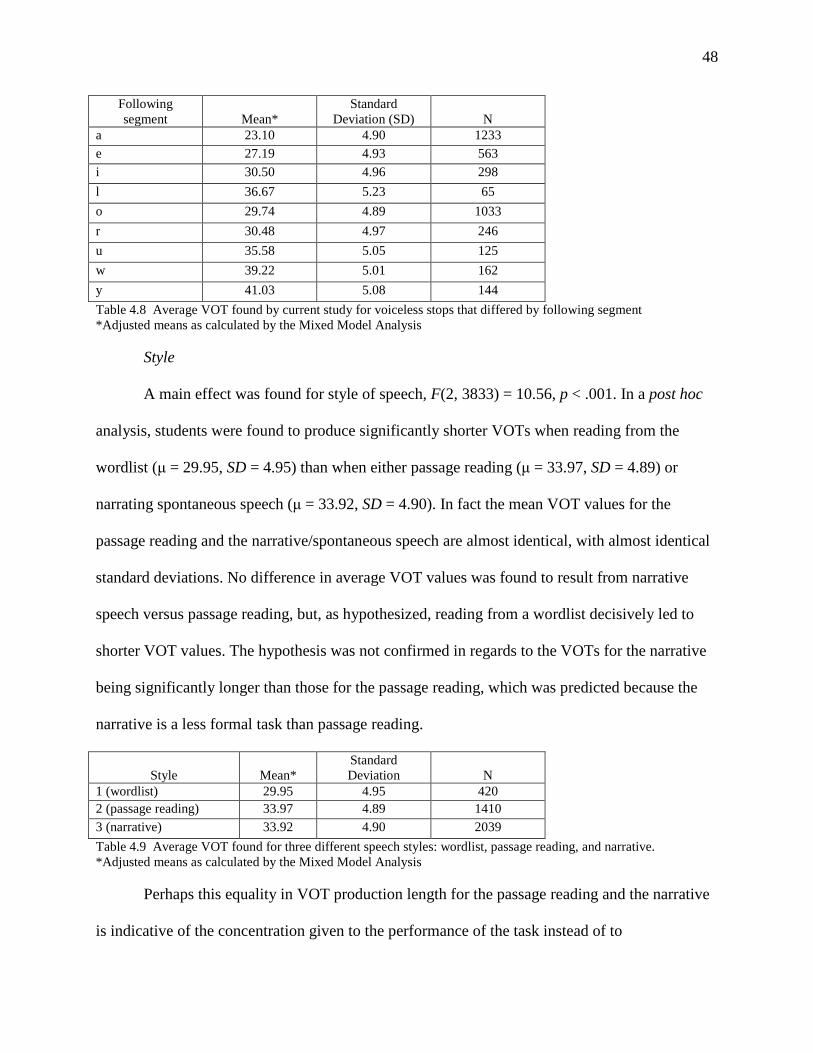
48
Following segment
Mean*
Standard Deviation (SD)
N
a 23.10 4.90 1233 e 27.19 4.93 563 i 30.50 4.96 298 l 36.67 5.23 65 o 29.74 4.89 1033 r 30.48 4.97 246 u 35.58 5.05 125 w 39.22 5.01 162 y 41.03 5.08 144 Table 4.8 Average VOT found by current study for voiceless stops that differed by following segment *Adjusted means as calculated by the Mixed Model Analysis
Style
A main effect was found for style of speech, F(2, 3833) = 10.56, p < .001. In a post hoc
analysis, students were found to produce significantly shorter VOTs when reading from the
wordlist (μ = 29.95, SD = 4.95) than when either passage reading (μ = 33.97, SD = 4.89) or
narrating spontaneous speech (μ = 33.92, SD = 4.90). In fact the mean VOT values for the
passage reading and the narrative/spontaneous speech are almost identical, with almost identical
standard deviations. No difference in average VOT values was found to result from narrative
speech versus passage reading, but, as hypothesized, reading from a wordlist decisively led to
shorter VOT values. The hypothesis was not confirmed in regards to the VOTs for the narrative
being significantly longer than those for the passage reading, which was predicted because the
narrative is a less formal task than passage reading.
Style
Mean*
Standard Deviation
N
1 (wordlist) 29.95 4.95 420 2 (passage reading) 33.97 4.89 1410 3 (narrative) 33.92 4.90 2039 Table 4.9 Average VOT found for three different speech styles: wordlist, passage reading, and narrative. *Adjusted means as calculated by the Mixed Model Analysis
Perhaps this equality in VOT production length for the passage reading and the narrative
is indicative of the concentration given to the performance of the task instead of to
49
pronunciation. The study participants were cautioned that they would be asked questions for
understanding after they had finished reading aloud the passage. The effort they expended in
understanding the passage may have slowed their reading down. Speaking rate itself as been
shown to be correlated with VOT (Summerfield, 1975, 1981) and that in CV syllables, as the
vowel decreases in duration, so does the VOT of the preceding voiceless stop (Klatt, 1975). It
has been shown, at least in English, that the faster the rate of speech, the shorter the VOT of the
stop consonants.
This effect is so predictable that one study found that speaking rate helps listeners
identify an occlusive. In Summerfield (1981) 16 subjects listened to randomly selected tokens
along a continuum of voiced to voiceless for each place of articulation. For each place of
articulation, there were 36 combinations, occurring 10 times each, of rate of articulation of the
precursor phrase and of vowels following the stop consonant. Listeners rated the stop consonant
by how well it approximated either the voiced or voiceless phoneme. In regards to the effect of
rate of articulation, Summerfield found that as rate of articulation increased, the phoneme
boundaries fell at shorter VOT values, demonstrating a shift in phoneme boundaries
accompanies a shift in rate of articulation. It may be that the research participants’ rate of
continuous speech as they told a story from the wordless picture book shortened their VOTs to
make them comparable to their VOTs during the more formal passage reading task.
Months with a native Spanish-speaking companion
Months spent with a native Spanish-speaking companion during the participants’ time
abroad was also shown to have a main effect, F(1, 3833) = 106.83, p < .001. As expected, the
number of months spent with a native Spanish-speaking companion was inversely correlated
50
with VOT, β = -2.07, t(3833) = -10.34, p <.001. The more time that the subjects were paired up
with native speakers, the shorter their average VOT.
Percentage of Spanish spoken with native Spanish-speaking companions
A main effect was found for the percentage of time spent speaking Spanish with native
companions, F(1, 3833) = 115.17, p < .001. This variable had the steepest standardized slope of
any of the variables examined, β = -40.84, t(3833) = -10.73, p <.001. The self-reported
percentage of the participants’ communication that was done in Spanish with native Spanish
speakers was highly significant and highly correlated with shorter VOTs. The more Spanish the
participants spoke with native Spanish-speakers while abroad, the more native-like their
pronunciation of voiceless stops.
Lapkin, Hart, and Swain (1995) also found linguistic gains to depend heavily on the
amount of communication done with native speakers while on a study abroad. English-speaking
high school students went on three-month exchange to French Quebec. Lapkin et. al (1995; p.
83) found “frequent and sustained interactions” with native French speakers to be very important
to the linguistic gain of the students.
Months with a native English-speaking companion
The number of months that the participant was paired with a native English-speaking
companion during his time abroad also proved to have a main effect, F(1, 3833) = 127.08,
p < .001. An inverse relationship also existed between months with a nonnative companion and
length of VOT, β = -2.14, t(3833) = -11.27, p <.001. It seems that just being in the native
Spanish-speaking country and interacting with native speakers frequently throughout the day
made VOT shorter and more target-like. Number of months of being paired with a native
English-speaking companion improved accent to about the same extent as months spent with
51
native companions, judging by the steepness of their respective correlation slopes. Nevertheless,
the effect of these variables on reducing accent is far outshone by the percentage of
communication done in Spanish with native Spanish-speaking companions while abroad.
Speaking Spanish with native Spanish-speaking companions had a much steeper slope, -40.84
(see above), as opposed to the much smaller slopes of -2.07 and -2.14 for months with native
Spanish-speaking companions and native English-speaking companions. Although the months
spent with native and nonnative companions have a significant main effect, the main effect of
speaking Spanish with native Spanish-speaking companions is much more strongly correlated
with more native-like pronunciation of /p t k/.
Formal instruction (in years)
A main effect of formal instruction was found to be highly significant,
F(1, 3833) = 37.15, p < .001. The more years of formal instruction that the participants reported,
the shorter their average VOT was, β = -1.48, t(3833) = -6.1, p <.001. In this case, a background
of formal instruction in Spanish gave L2 learners an advantage in production of voiceless stops.
Formal instruction has not been found to be significantly correlated with degree of
foreign accent in most studies, unless specific phonetic training takes place (Piske, MacKay, &
Flege 2001; Lord, 2005). However, there is evidence that having a background of formal
instruction is correlated with more significant phonological gains in a study-abroad context.
Díaz-Campos et. al (2002) found that students with 7 years of Spanish study or more showed the
most phonetic improvement on a study abroad to Spain. Another study of a semester-long study
abroad found that students with 6 or more semesters of Spanish study evinced more
improvement on the OPI scale than students with 5 semesters or less, even though they all began
the study abroad at the same speaking level (Magnan & Back, 2007). However, Alvord and
52
Christensen (in press) found formal instruction to be significantly correlated with less native-like
/b d g/ spirantization among a population very similar to that of the current study.
Spanish spoken with native Spanish speakers at time of study (hours per week)
The extent that the participants continued to speak Spanish after their return home was
also of interest. As part of their survey, participants were asked to estimate the number of hours
per week that currently speak Spanish. The hours per week spent speaking Spanish with native
speakers was found to have a main effect, F(1, 3833) = 5.89, p = .015. Hours per week spent
speaking Spanish with native speakers was inversely correlated with VOT, β = -.64,
t(3833) = -2.42, p = .015. The more time the participants reported speaking with native speakers
per week on average, the shorter their average VOT values.
Other studies are conflicted as to whether L2 use has a significant effect on foreign
accent. Purcell & Suter (1980) and Tahta et al. (1981) found L2 use to be a significant factor
affecting foreign accent, but Flege and Fletcher (1992) and Thompson (1991) did not. However
the results of these studies may be less applicable to the results of this research because they
involve L2 speakers that are living in the country that speaks the target language. The current
research indicates that once an L2 speaker has traveled abroad and returned home, seeking out
native speakers of their second language helps maintain or improve accent in the L2.
Total amount of Spanish spoken at time of study (hours per week)
The number of hours per week spent speaking Spanish was found to have a main effect,
F(1, 3833) = 11.15, p = .001. Interestingly, hours per week spent speaking Spanish was
positively correlated with VOT, β = .39, t(3833) = 3.34, p = .001 The more hours reported, the
longer the participants’ average VOT. Unlike the previous variable, which was Spanish spoken
exclusively with native speakers, this variable was an estimation of total hours spent
53
communicating in Spanish and would include class time and any other communication in the L2
with nonnative Spanish speakers. It appears that communicating in an L2 with speakers that
share one’s own native language has a negative effect on phonetic accuracy. It may reinforce
language transfer from the L1 to the L2. This is not the first time such a finding has been
reported in the literature. Magnan & Back’s (2007) study of American students on a study abroad
to France found an inverse relationship between speaking French with American classmates and
level of improvement. Students that spent more time speaking in French with their American
classmates saw significantly less improvement on the OPI scale over the course of the study
abroad that those who spent less time speaking in French with American classmates. Alvord and
Christensen (in press) had similar findings.
Summary
In summary, all of the linguistic variables tested (i.e., segment, word position, stress,
preceding segment, following segment, and style) were found to have a significant main effect.
Of the extra-linguistic variables that had significant main effect, the following were correlated
with shorter VOTs and thus more native-like phonetic production: the time abroad paired with a
native speaker of Spanish, the percentage of communication done in Spanish with the native
Spanish-speaking companions, the time abroad paired with a native speaker of English, years of
formal instruction prior to the stay abroad, and the time spent each week speaking Spanish with
native speakers since their return to the United States. The total amount of time spent each week
speaking Spanish since their return home, which included speaking Spanish with native English
speakers who had also learned Spanish as an L2, was shown to have a main effect, but was
positively correlated with VOT, meaning that more speaking the L2 with other L2 speakers of
Spanish was associated with longer VOTs, possibly due to reinforcement of L1 transfer habits.
54
Chapter 5 – Conclusion
Research questions
The purpose of this research study was twofold. First, to determine the extent to which
the study group had obtained target-like pronunciation of L2 voiceless stops using VOT as the
measure. The study group consisted of 20 male students of Brigham Young University that had
all gone abroad to Spanish speaking countries at age 19 and lived there for 22 – 23 ½ months.
They were all native American-English speaking learners of Spanish. As was hypothesized, the
study participants all produced Spanish voiceless stops with VOTs intermediate to the averages
of their L1 and L2. Production of intermediate VOT values by bilinguals is well attested in the
literature. In this case, a little less than two years was a sufficient amount of time for the L2
Spanish learners to acquire VOT values typical of bilinguals that began learning the L2 at a
similar age.
Of the language learning models presented in Chapter 2, the results of the first research
question better support the Speech Learning Model (SLM) than the Ontogeny Phylogeny Model
(OPM). It is possible that two years is not enough time for the L2 learners that participated in
this study to get beyond stage 4 of the OPM to obtain stage 5, which is complete mastery of the
L2. However, a look at other studies of adult second language learners casts into doubt whether
complete mastery of similar sounds is even attainable. On the other hand, the SLM predicts that
similar L1 and L2 sounds which learners have classified in the same phonologic category will
end up sounding the same over time. This prediction is better supported in the literature.
Complete mastery of L2 pronunciation by adult learners has not been found to be the norm. The
participants of studies that do suggest that target-like pronunciation is attainable by adult L2
learners have both had phonetic training and have been abroad in the target country for an
55
extended period of time. Perhaps phonetic training enables language learners to form new
phonologic categories for similar L2 sounds, allowing for complete mastery of L2 pronunciation.
Secondly, this study also proposed to find the effect on the VOT of adult learners of
Spanish of factors including phonetic context, speech style, language use (during time abroad
and at time of study), formal instruction, motivational intensity, and cultural sensitivity. In
regards to phonetic context, variables included place of articulation, position (word-initial vs.
word-internal), stress, and both the segment preceding and the segment following the voiceless
stop. All of the variables pertaining to linguistic context were found to be significant.
A number of the other variables were also found to be significant. Speech style was found
to have a significant main effect, with the average VOT for the wordlist task significantly shorter
and more target-like than the average VOT of the less formal tasks, the passage reading and
narrative. Also, years of formal instruction prior to the stay abroad was also found to be
significantly correlated with shorter VOTs. The formal instruction reported by the participants
was limited to high school Spanish class.
Due to the nature of their stay abroad, the participants’ time was randomly divided
between living with another native English speaker and living with a native Spanish speaker.
This peer that a participant lives with and does everything with is called a companion. I looked at
the number of months that each participant had stayed with native Spanish-speaking companions
and the number of months that each had stayed with native English-speaking companions while
abroad. Both factors proved to be significant, neither more than the other. However, a key
difference was noted in the percentage of time that the participants reported having spoken
Spanish with their native Spanish-speaking companions (as opposed to English). Percentage of
communication done in Spanish with native Spanish-speaking companions was shown to be
56
highly significantly correlated with shorter, more native-like VOTs, while percentage of
communication in Spanish with native English-speaking companions had no significant main
effect. Communication in the target language with native speakers of that language while abroad
is a highly significant factor in degree of foreign accent.
The amount of time spent weekly communicating in Spanish since returning home did
have a significant main effect. Though speaking Spanish with native Spanish speakers had the
expected significant effect of reducing VOT to more native-like values, speaking Spanish with
other nonnatives had the significant effect of lengthening VOTs and making them less target-
like. Speaking the L2 with other native speakers of one’s own language appears to reinforce
transfer habits and thicken foreign accent.
Lastly, motivational intensity and cross-cultural sensitivity were not shown to have a
significant main effect in this study. It may be that the informants, all selected from a university
Spanish course, were too similarly motivated for any significant difference to be found by the
mixed model statistical analysis.
Research Implications
The results of the current study indicate that adult learners can mostly acquire L2
pronunciation of voiceless stops in two years without formal instruction. While these learners’
production of VOT did not demonstrate complete mastery of Spanish voiceless stops, their
pronunciation had a similar degree of accuracy as the pronunciation of other adult learners with
their age of learning. None of these participants had taken a Spanish phonetics course, so it may
be supposed that they are unaware that Spanish /ptk/ are aspirationless and have short-lag VOTs.
Yet the L2 learners in this study were approximating native Spanish VOTs. The results of my
research indicate that in the absence of explicit phonetic instruction, the most effective way to

57
improve pronunciation of voiceless stops is to communicate in the L2 with native speakers.
Future research should investigate the relative importance of phonetic instruction and interaction
in the L2 and how second language acquisition is facilitated when the two are combined.
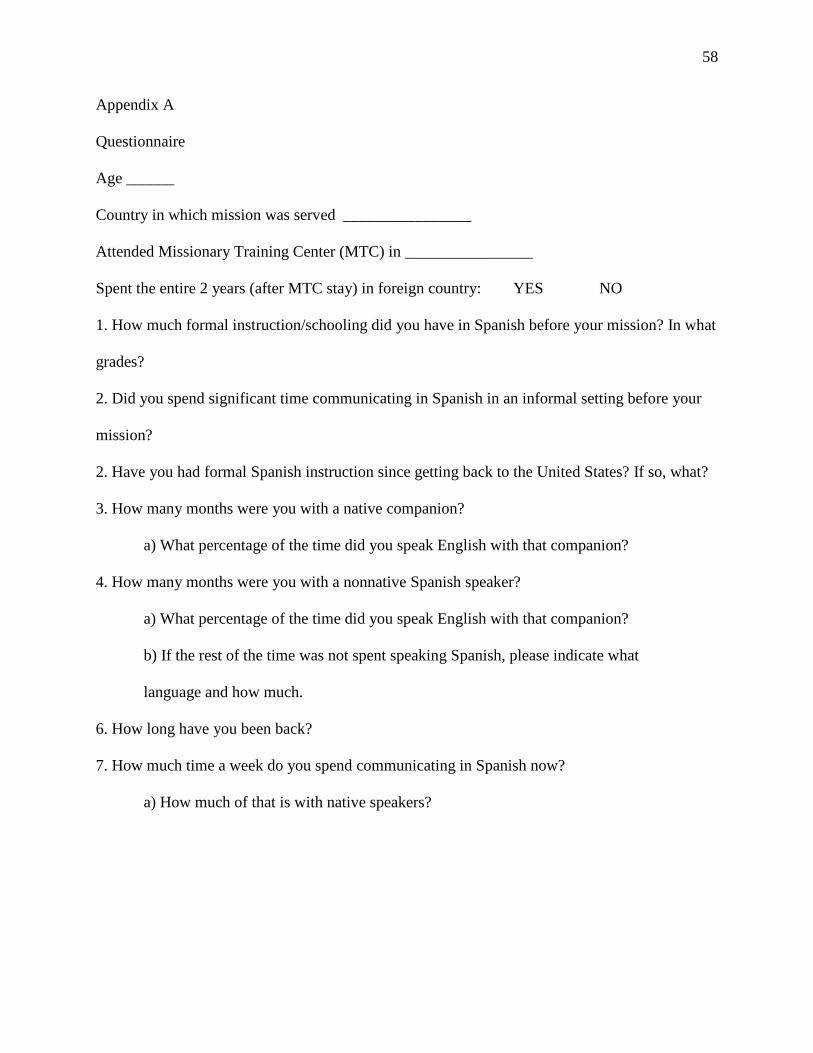
58
Appendix A
Questionnaire
Age ______
Country in which mission was served ________________
Attended Missionary Training Center (MTC) in ________________
Spent the entire 2 years (after MTC stay) in foreign country: YES NO
1. How much formal instruction/schooling did you have in Spanish before your mission? In what
grades?
2. Did you spend significant time communicating in Spanish in an informal setting before your
mission?
2. Have you had formal Spanish instruction since getting back to the United States? If so, what?
3. How many months were you with a native companion?
a) What percentage of the time did you speak English with that companion?
4. How many months were you with a nonnative Spanish speaker?
a) What percentage of the time did you speak English with that companion?
b) If the rest of the time was not spent speaking Spanish, please indicate what
language and how much.
6. How long have you been back?
7. How much time a week do you spend communicating in Spanish now?
a) How much of that is with native speakers?

59
Appendix B Inventory of Cross-Cultural Sensitivity Name:_________________________________ (Last) (First)
THIS SECTION PROVIDES INFORMATION ABOUT YOUR CULTURAL ATTITUDES. PLEASE BE AS SINCERE AND ACCURATE AS
POSSIBLE. IT IS VITAL THAT YOU ANSWER ALL OF THE QUESTIONS IN ORDER FOR THE TEST TO BE A USEFUL
MEASUREMENT. THANK YOU FOR YOUR TIME AND ATTENTION.
1. I speak only one language.
Strongly Disagree 1 2 3 4 5 6 7 Strongly Agree
2. The way other people express themselves is very interesting to me.
Strongly Disagree 1 2 3 4 5 6 7 Strongly Agree
3. I enjoy being with people from other cultures.
Strongly Disagree 1 2 3 4 5 6 7 Strongly Agree
4. Foreign influence in our country threatens our national identity.
Strongly Disagree 1 2 3 4 5 6 7 Strongly Agree
5. Others’ feelings rarely influence decisions I make.
Strongly Disagree 1 2 3 4 5 6 7 Strongly Agree
6. I cannot eat with chopsticks.
Strongly Disagree 1 2 3 4 5 6 7 Strongly Agree
7. I avoid people who are different from me.
Strongly Disagree 1 2 3 4 5 6 7 Strongly Agree
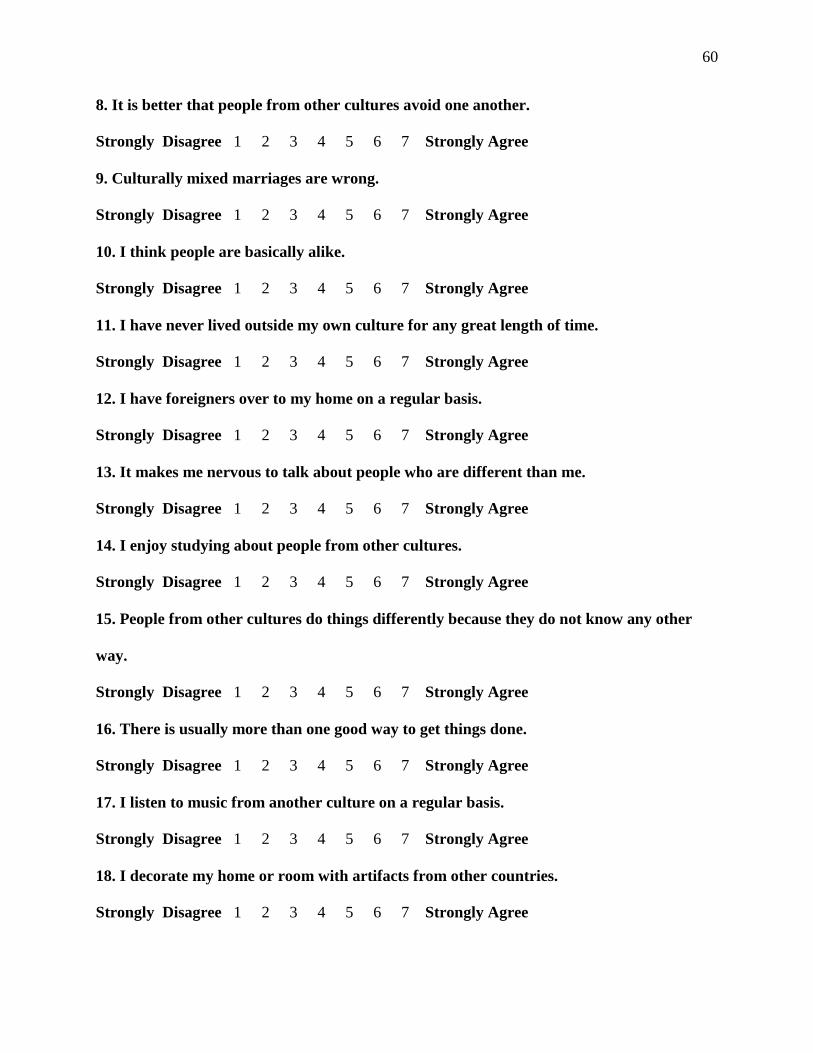
60
8. It is better that people from other cultures avoid one another.
Strongly Disagree 1 2 3 4 5 6 7 Strongly Agree
9. Culturally mixed marriages are wrong.
Strongly Disagree 1 2 3 4 5 6 7 Strongly Agree
10. I think people are basically alike.
Strongly Disagree 1 2 3 4 5 6 7 Strongly Agree
11. I have never lived outside my own culture for any great length of time.
Strongly Disagree 1 2 3 4 5 6 7 Strongly Agree
12. I have foreigners over to my home on a regular basis.
Strongly Disagree 1 2 3 4 5 6 7 Strongly Agree
13. It makes me nervous to talk about people who are different than me.
Strongly Disagree 1 2 3 4 5 6 7 Strongly Agree
14. I enjoy studying about people from other cultures.
Strongly Disagree 1 2 3 4 5 6 7 Strongly Agree
15. People from other cultures do things differently because they do not know any other
way.
Strongly Disagree 1 2 3 4 5 6 7 Strongly Agree
16. There is usually more than one good way to get things done.
Strongly Disagree 1 2 3 4 5 6 7 Strongly Agree
17. I listen to music from another culture on a regular basis.
Strongly Disagree 1 2 3 4 5 6 7 Strongly Agree
18. I decorate my home or room with artifacts from other countries.
Strongly Disagree 1 2 3 4 5 6 7 Strongly Agree
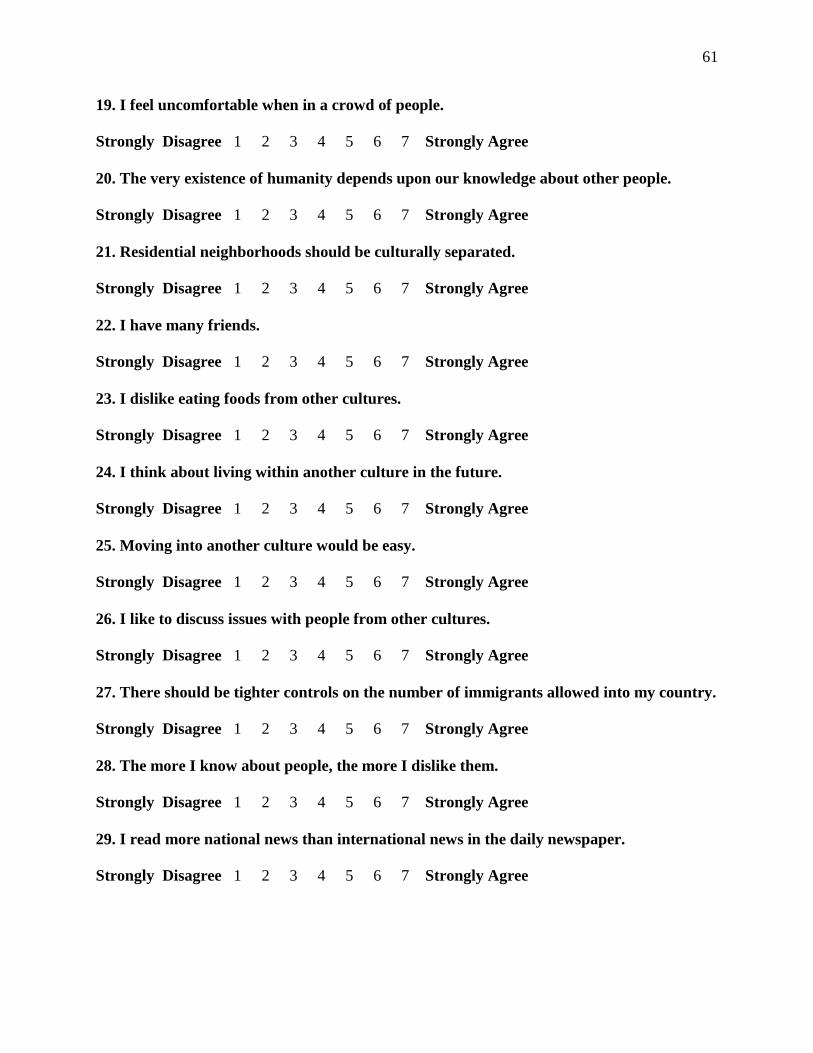
61
19. I feel uncomfortable when in a crowd of people.
Strongly Disagree 1 2 3 4 5 6 7 Strongly Agree
20. The very existence of humanity depends upon our knowledge about other people.
Strongly Disagree 1 2 3 4 5 6 7 Strongly Agree
21. Residential neighborhoods should be culturally separated.
Strongly Disagree 1 2 3 4 5 6 7 Strongly Agree
22. I have many friends.
Strongly Disagree 1 2 3 4 5 6 7 Strongly Agree
23. I dislike eating foods from other cultures.
Strongly Disagree 1 2 3 4 5 6 7 Strongly Agree
24. I think about living within another culture in the future.
Strongly Disagree 1 2 3 4 5 6 7 Strongly Agree
25. Moving into another culture would be easy.
Strongly Disagree 1 2 3 4 5 6 7 Strongly Agree
26. I like to discuss issues with people from other cultures.
Strongly Disagree 1 2 3 4 5 6 7 Strongly Agree
27. There should be tighter controls on the number of immigrants allowed into my country.
Strongly Disagree 1 2 3 4 5 6 7 Strongly Agree
28. The more I know about people, the more I dislike them.
Strongly Disagree 1 2 3 4 5 6 7 Strongly Agree
29. I read more national news than international news in the daily newspaper.
Strongly Disagree 1 2 3 4 5 6 7 Strongly Agree
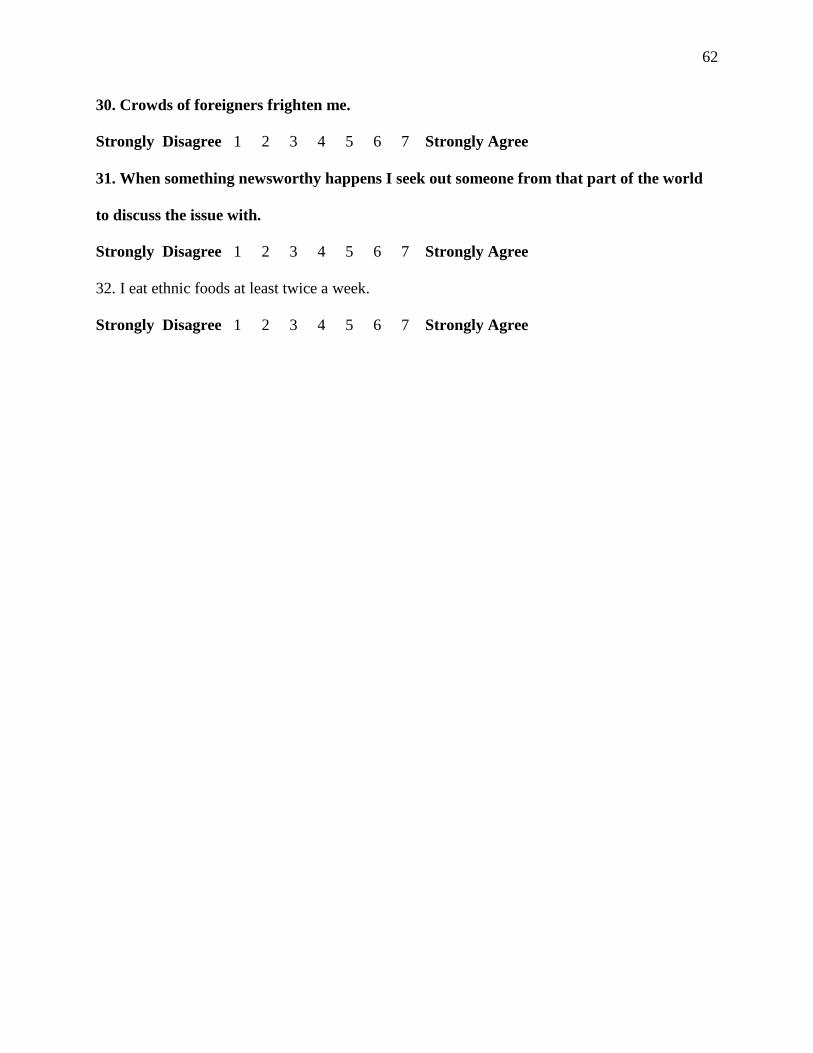
62
30. Crowds of foreigners frighten me.
Strongly Disagree 1 2 3 4 5 6 7 Strongly Agree
31. When something newsworthy happens I seek out someone from that part of the world
to discuss the issue with.
Strongly Disagree 1 2 3 4 5 6 7 Strongly Agree
32. I eat ethnic foods at least twice a week.
Strongly Disagree 1 2 3 4 5 6 7 Strongly Agree
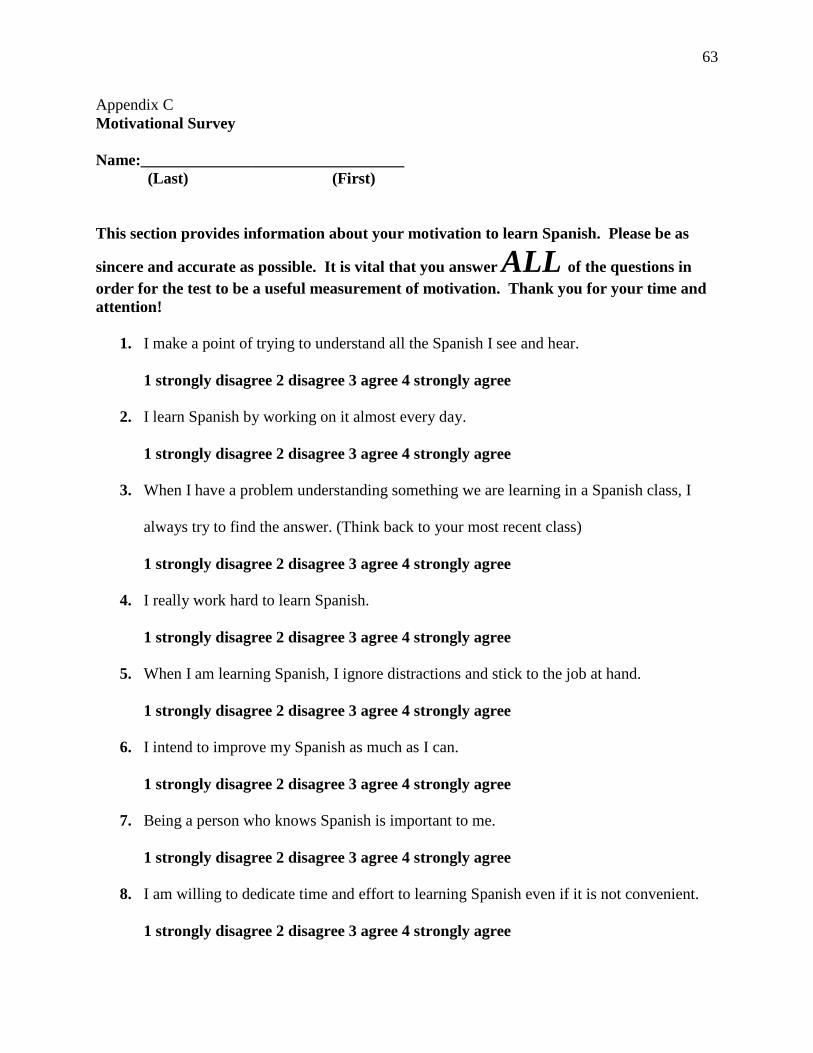
63
Appendix C Motivational Survey Name:_________________________________ (Last) (First) This section provides information about your motivation to learn Spanish. Please be as
sincere and accurate as possible. It is vital that you answer ALL of the questions in order for the test to be a useful measurement of motivation. Thank you for your time and attention!
1. I make a point of trying to understand all the Spanish I see and hear.
1 strongly disagree 2 disagree 3 agree 4 strongly agree
2. I learn Spanish by working on it almost every day.
1 strongly disagree 2 disagree 3 agree 4 strongly agree
3. When I have a problem understanding something we are learning in a Spanish class, I
always try to find the answer. (Think back to your most recent class)
1 strongly disagree 2 disagree 3 agree 4 strongly agree
4. I really work hard to learn Spanish.
1 strongly disagree 2 disagree 3 agree 4 strongly agree
5. When I am learning Spanish, I ignore distractions and stick to the job at hand.
1 strongly disagree 2 disagree 3 agree 4 strongly agree
6. I intend to improve my Spanish as much as I can.
1 strongly disagree 2 disagree 3 agree 4 strongly agree
7. Being a person who knows Spanish is important to me.
1 strongly disagree 2 disagree 3 agree 4 strongly agree
8. I am willing to dedicate time and effort to learning Spanish even if it is not convenient.
1 strongly disagree 2 disagree 3 agree 4 strongly agree

64
9. I will not stop trying to learn until I have reached I reach the skill level in Spanish that I
seek.
1 strongly disagree 2 disagree 3 agree 4 strongly agree
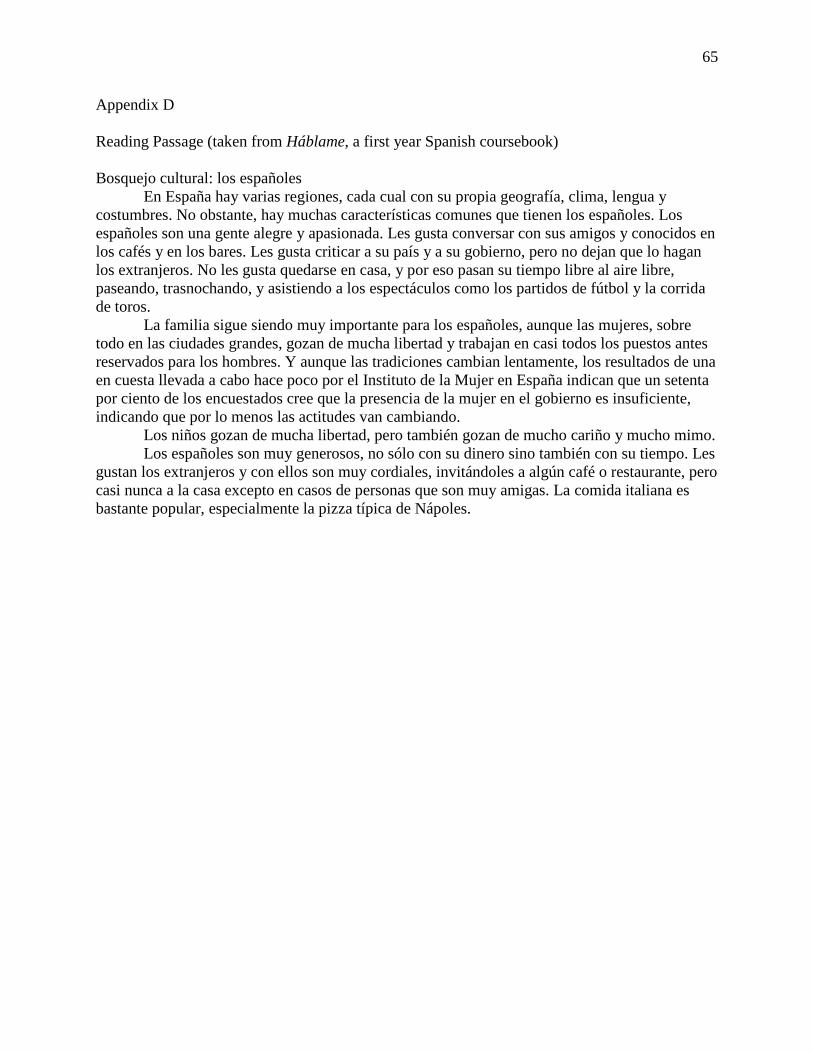
65
Appendix D
Reading Passage (taken from Háblame, a first year Spanish coursebook)
Bosquejo cultural: los españoles En España hay varias regiones, cada cual con su propia geografía, clima, lengua y costumbres. No obstante, hay muchas características comunes que tienen los españoles. Los españoles son una gente alegre y apasionada. Les gusta conversar con sus amigos y conocidos en los cafés y en los bares. Les gusta criticar a su país y a su gobierno, pero no dejan que lo hagan los extranjeros. No les gusta quedarse en casa, y por eso pasan su tiempo libre al aire libre, paseando, trasnochando, y asistiendo a los espectáculos como los partidos de fútbol y la corrida de toros. La familia sigue siendo muy importante para los españoles, aunque las mujeres, sobre todo en las ciudades grandes, gozan de mucha libertad y trabajan en casi todos los puestos antes reservados para los hombres. Y aunque las tradiciones cambian lentamente, los resultados de una en cuesta llevada a cabo hace poco por el Instituto de la Mujer en España indican que un setenta por ciento de los encuestados cree que la presencia de la mujer en el gobierno es insuficiente, indicando que por lo menos las actitudes van cambiando. Los niños gozan de mucha libertad, pero también gozan de mucho cariño y mucho mimo. Los españoles son muy generosos, no sólo con su dinero sino también con su tiempo. Les gustan los extranjeros y con ellos son muy cordiales, invitándoles a algún café o restaurante, pero casi nunca a la casa excepto en casos de personas que son muy amigas. La comida italiana es bastante popular, especialmente la pizza típica de Nápoles.

66
Appendix E
Wordlist
química cometa importa veleta plena carretera enseña nombre clima tren luna piña gitano cristales punitiva toqué momento papá tubo leyes próximo pena amigo cuenta
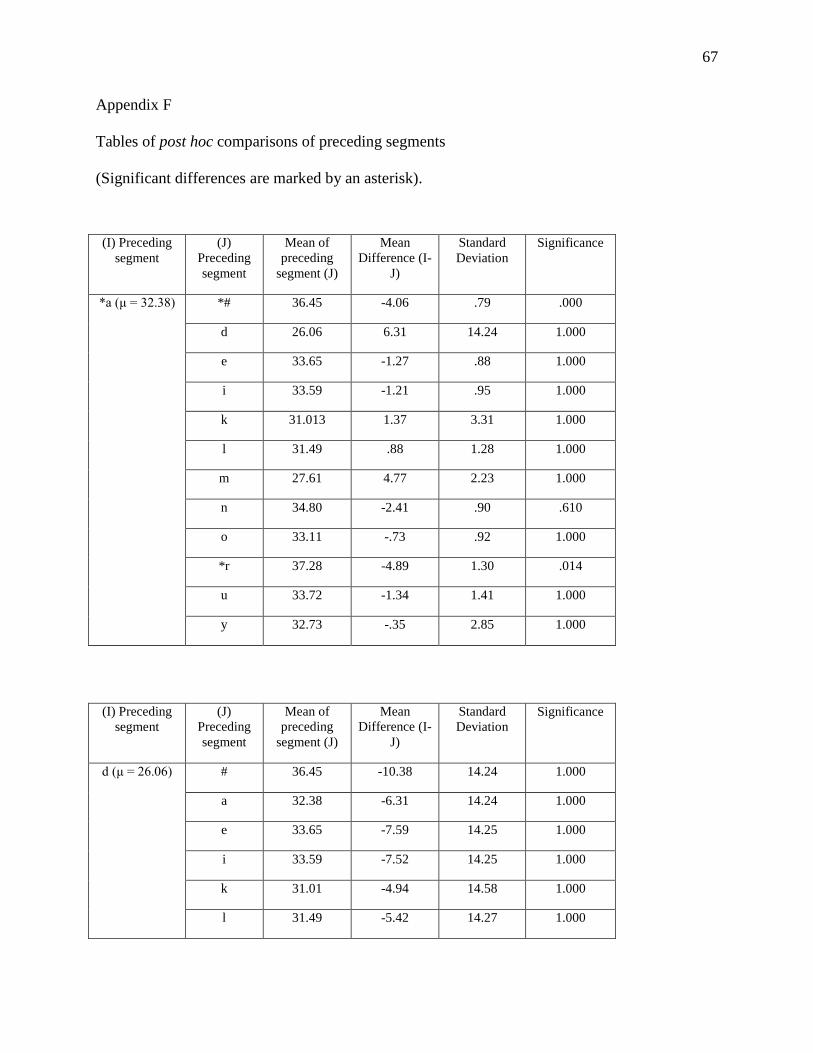
67
Appendix F
Tables of post hoc comparisons of preceding segments
(Significant differences are marked by an asterisk).
(I) Preceding segment
(J) Preceding segment
Mean of preceding
segment (J)
Mean Difference (I-
J)
Standard Deviation
Significance
*a (μ = 32.38) *# 36.45 -4.06 .79 .000
d 26.06 6.31 14.24 1.000
e 33.65 -1.27 .88 1.000
i 33.59 -1.21 .95 1.000
k 31.013 1.37 3.31 1.000
l 31.49 .88 1.28 1.000
m 27.61 4.77 2.23 1.000
n 34.80 -2.41 .90 .610
o 33.11 -.73 .92 1.000
*r 37.28 -4.89 1.30 .014
u 33.72 -1.34 1.41 1.000
y 32.73 -.35 2.85 1.000
(I) Preceding segment
(J) Preceding segment
Mean of preceding
segment (J)
Mean Difference (I-
J)
Standard Deviation
Significance
d (μ = 26.06) # 36.45 -10.38 14.24 1.000
a 32.38 -6.31 14.24 1.000
e 33.65 -7.59 14.25 1.000
i 33.59 -7.52 14.25 1.000
k 31.01 -4.94 14.58 1.000
l 31.49 -5.42 14.27 1.000
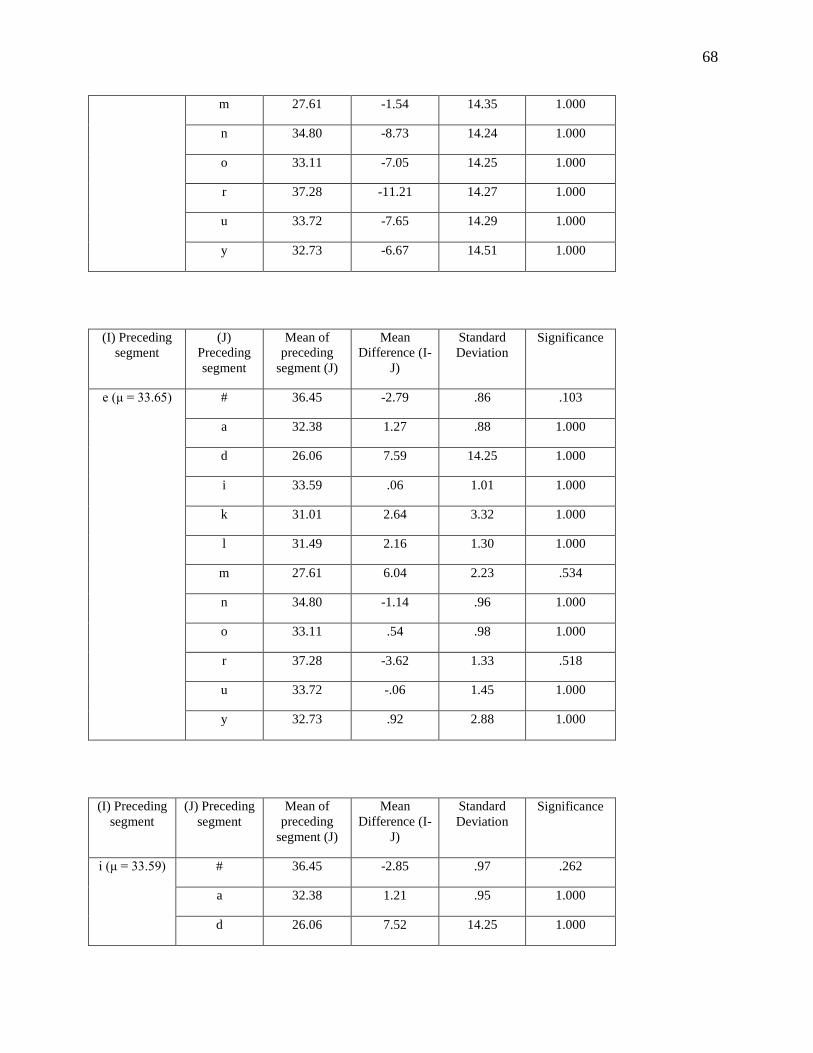
68
m 27.61 -1.54 14.35 1.000
n 34.80 -8.73 14.24 1.000
o 33.11 -7.05 14.25 1.000
r 37.28 -11.21 14.27 1.000
u 33.72 -7.65 14.29 1.000
y 32.73 -6.67 14.51 1.000
(I) Preceding segment
(J) Preceding segment
Mean of preceding
segment (J)
Mean Difference (I-
J)
Standard Deviation
Significance
e (μ = 33.65) # 36.45 -2.79 .86 .103
a 32.38 1.27 .88 1.000
d 26.06 7.59 14.25 1.000
i 33.59 .06 1.01 1.000
k 31.01 2.64 3.32 1.000
l 31.49 2.16 1.30 1.000
m 27.61 6.04 2.23 .534
n 34.80 -1.14 .96 1.000
o 33.11 .54 .98 1.000
r 37.28 -3.62 1.33 .518
u 33.72 -.06 1.45 1.000
y 32.73 .92 2.88 1.000
(I) Preceding segment
(J) Preceding segment
Mean of preceding
segment (J)
Mean Difference (I-
J)
Standard Deviation
Significance
i (μ = 33.59) # 36.45 -2.85 .97 .262
a 32.38 1.21 .95 1.000
d 26.06 7.52 14.25 1.000
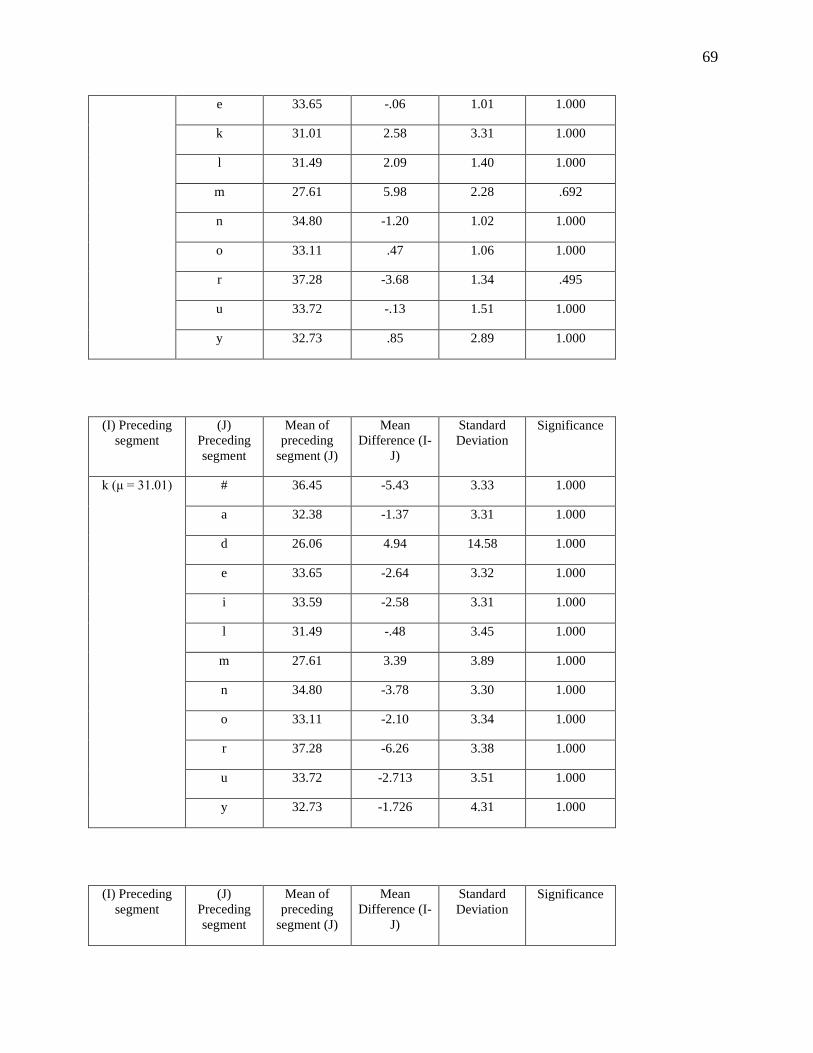
69
e 33.65 -.06 1.01 1.000
k 31.01 2.58 3.31 1.000
l 31.49 2.09 1.40 1.000
m 27.61 5.98 2.28 .692
n 34.80 -1.20 1.02 1.000
o 33.11 .47 1.06 1.000
r 37.28 -3.68 1.34 .495
u 33.72 -.13 1.51 1.000
y 32.73 .85 2.89 1.000
(I) Preceding segment
(J) Preceding segment
Mean of preceding
segment (J)
Mean Difference (I-
J)
Standard Deviation
Significance
k (μ = 31.01) # 36.45 -5.43 3.33 1.000
a 32.38 -1.37 3.31 1.000
d 26.06 4.94 14.58 1.000
e 33.65 -2.64 3.32 1.000
i 33.59 -2.58 3.31 1.000
l 31.49 -.48 3.45 1.000
m 27.61 3.39 3.89 1.000
n 34.80 -3.78 3.30 1.000
o 33.11 -2.10 3.34 1.000
r 37.28 -6.26 3.38 1.000
u 33.72 -2.713 3.51 1.000
y 32.73 -1.726 4.31 1.000
(I) Preceding segment
(J) Preceding segment
Mean of preceding
segment (J)
Mean Difference (I-
J)
Standard Deviation
Significance
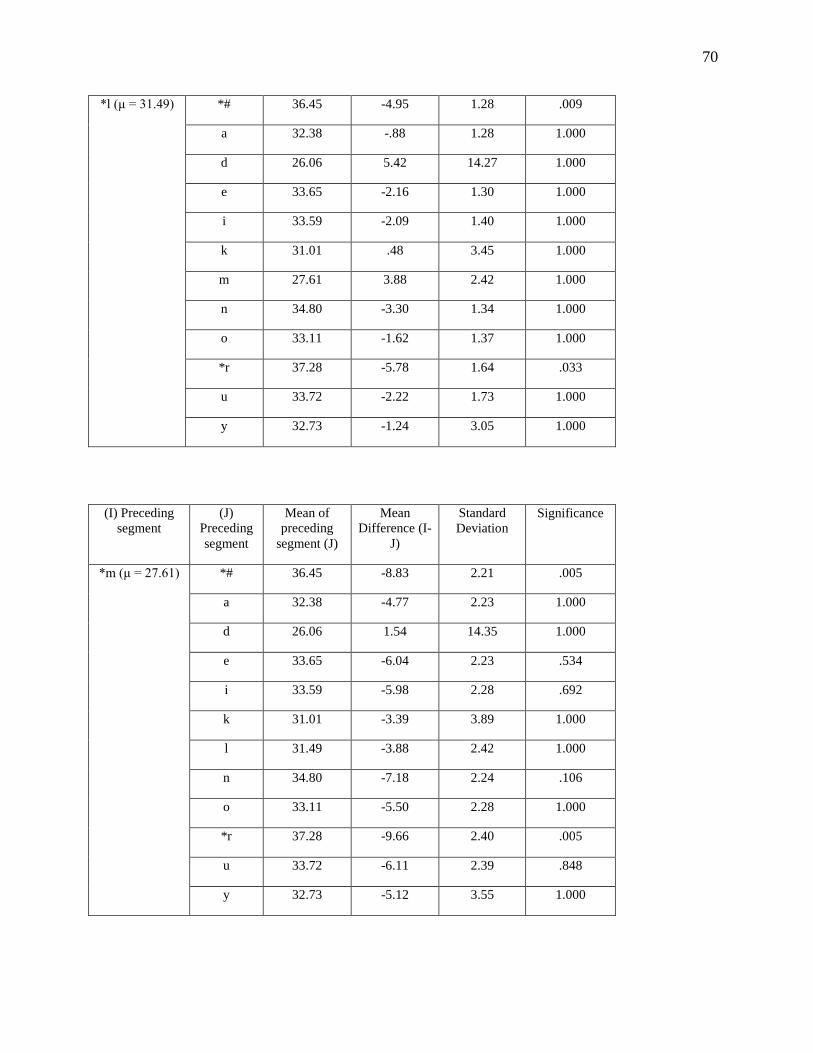
70
*l (μ = 31.49) *# 36.45 -4.95 1.28 .009
a 32.38 -.88 1.28 1.000
d 26.06 5.42 14.27 1.000
e 33.65 -2.16 1.30 1.000
i 33.59 -2.09 1.40 1.000
k 31.01 .48 3.45 1.000
m 27.61 3.88 2.42 1.000
n 34.80 -3.30 1.34 1.000
o 33.11 -1.62 1.37 1.000
*r 37.28 -5.78 1.64 .033
u 33.72 -2.22 1.73 1.000
y 32.73 -1.24 3.05 1.000
(I) Preceding segment
(J) Preceding segment
Mean of preceding
segment (J)
Mean Difference (I-
J)
Standard Deviation
Significance
*m (μ = 27.61) *# 36.45 -8.83 2.21 .005
a 32.38 -4.77 2.23 1.000
d 26.06 1.54 14.35 1.000
e 33.65 -6.04 2.23 .534
i 33.59 -5.98 2.28 .692
k 31.01 -3.39 3.89 1.000
l 31.49 -3.88 2.42 1.000
n 34.80 -7.18 2.24 .106
o 33.11 -5.50 2.28 1.000
*r 37.28 -9.66 2.40 .005
u 33.72 -6.11 2.39 .848
y 32.73 -5.12 3.55 1.000
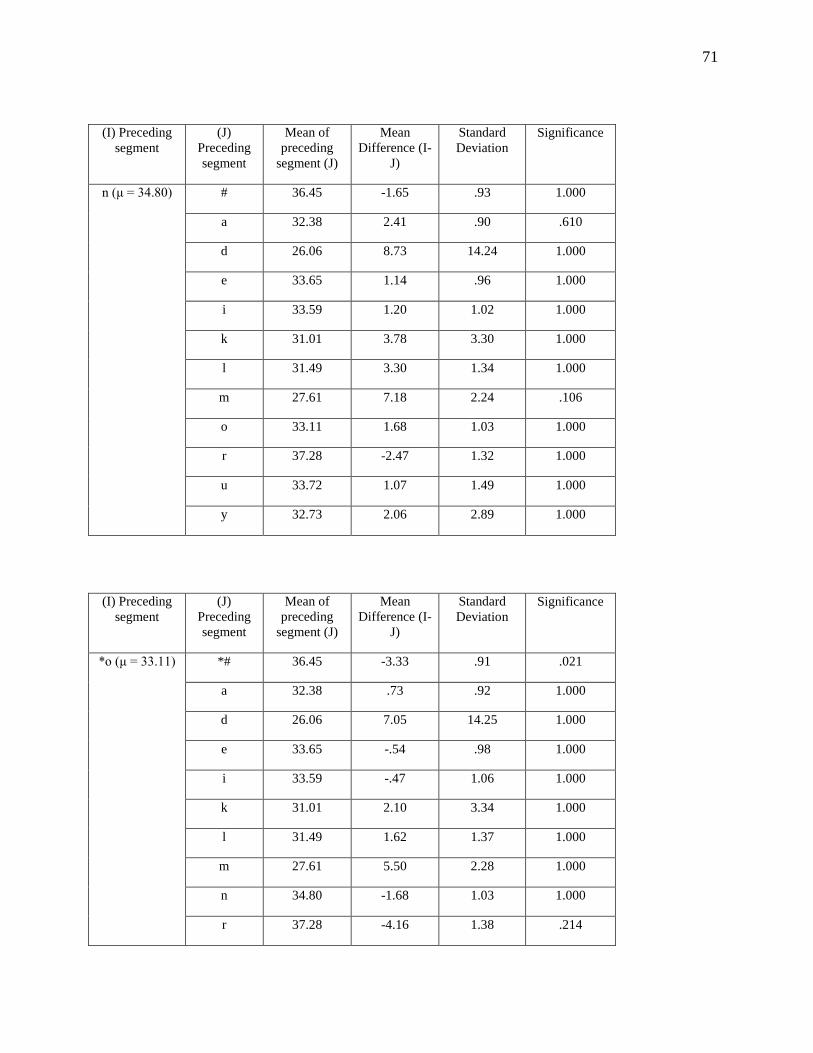
71
(I) Preceding segment
(J) Preceding segment
Mean of preceding
segment (J)
Mean Difference (I-
J)
Standard Deviation
Significance
n (μ = 34.80) # 36.45 -1.65 .93 1.000
a 32.38 2.41 .90 .610
d 26.06 8.73 14.24 1.000
e 33.65 1.14 .96 1.000
i 33.59 1.20 1.02 1.000
k 31.01 3.78 3.30 1.000
l 31.49 3.30 1.34 1.000
m 27.61 7.18 2.24 .106
o 33.11 1.68 1.03 1.000
r 37.28 -2.47 1.32 1.000
u 33.72 1.07 1.49 1.000
y 32.73 2.06 2.89 1.000
(I) Preceding segment
(J) Preceding segment
Mean of preceding
segment (J)
Mean Difference (I-
J)
Standard Deviation
Significance
*o (μ = 33.11) *# 36.45 -3.33 .91 .021
a 32.38 .73 .92 1.000
d 26.06 7.05 14.25 1.000
e 33.65 -.54 .98 1.000
i 33.59 -.47 1.06 1.000
k 31.01 2.10 3.34 1.000
l 31.49 1.62 1.37 1.000
m 27.61 5.50 2.28 1.000
n 34.80 -1.68 1.03 1.000
r 37.28 -4.16 1.38 .214
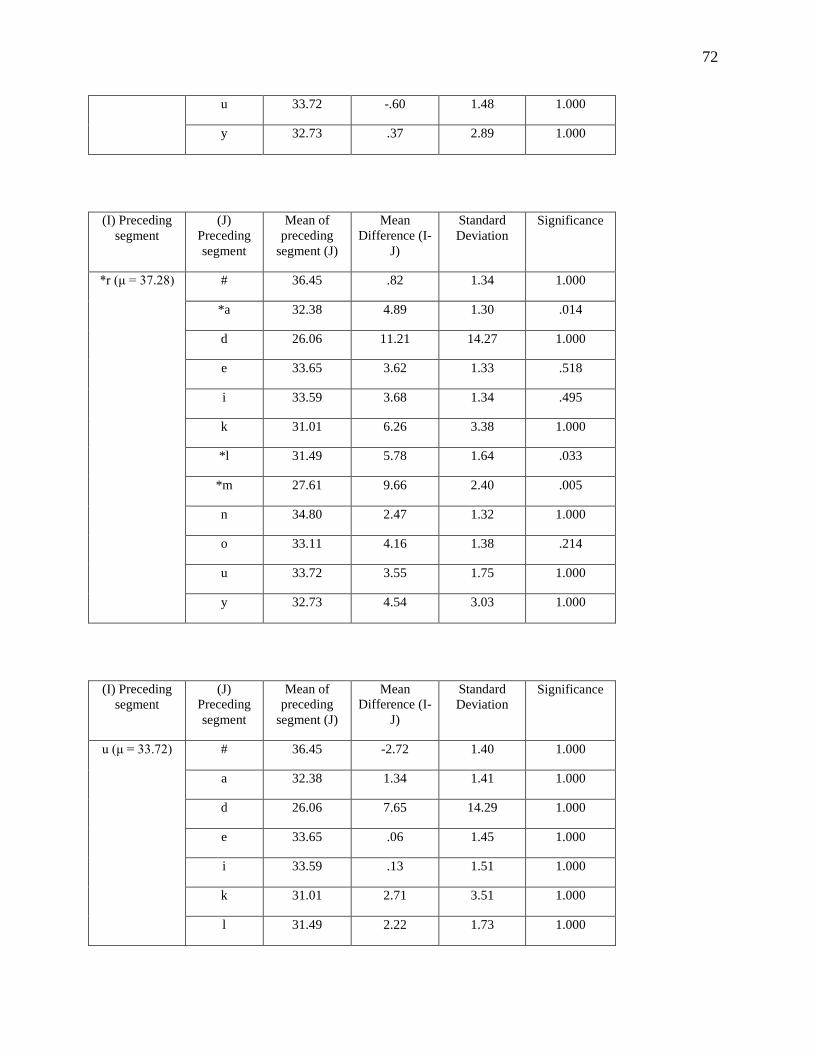
72
u 33.72 -.60 1.48 1.000
y 32.73 .37 2.89 1.000
(I) Preceding segment
(J) Preceding segment
Mean of preceding
segment (J)
Mean Difference (I-
J)
Standard Deviation
Significance
*r (μ = 37.28) # 36.45 .82 1.34 1.000
*a 32.38 4.89 1.30 .014
d 26.06 11.21 14.27 1.000
e 33.65 3.62 1.33 .518
i 33.59 3.68 1.34 .495
k 31.01 6.26 3.38 1.000
*l 31.49 5.78 1.64 .033
*m 27.61 9.66 2.40 .005
n 34.80 2.47 1.32 1.000
o 33.11 4.16 1.38 .214
u 33.72 3.55 1.75 1.000
y 32.73 4.54 3.03 1.000
(I) Preceding segment
(J) Preceding segment
Mean of preceding
segment (J)
Mean Difference (I-
J)
Standard Deviation
Significance
u (μ = 33.72) # 36.45 -2.72 1.40 1.000
a 32.38 1.34 1.41 1.000
d 26.06 7.65 14.29 1.000
e 33.65 .06 1.45 1.000
i 33.59 .13 1.51 1.000
k 31.01 2.71 3.51 1.000
l 31.49 2.22 1.73 1.000
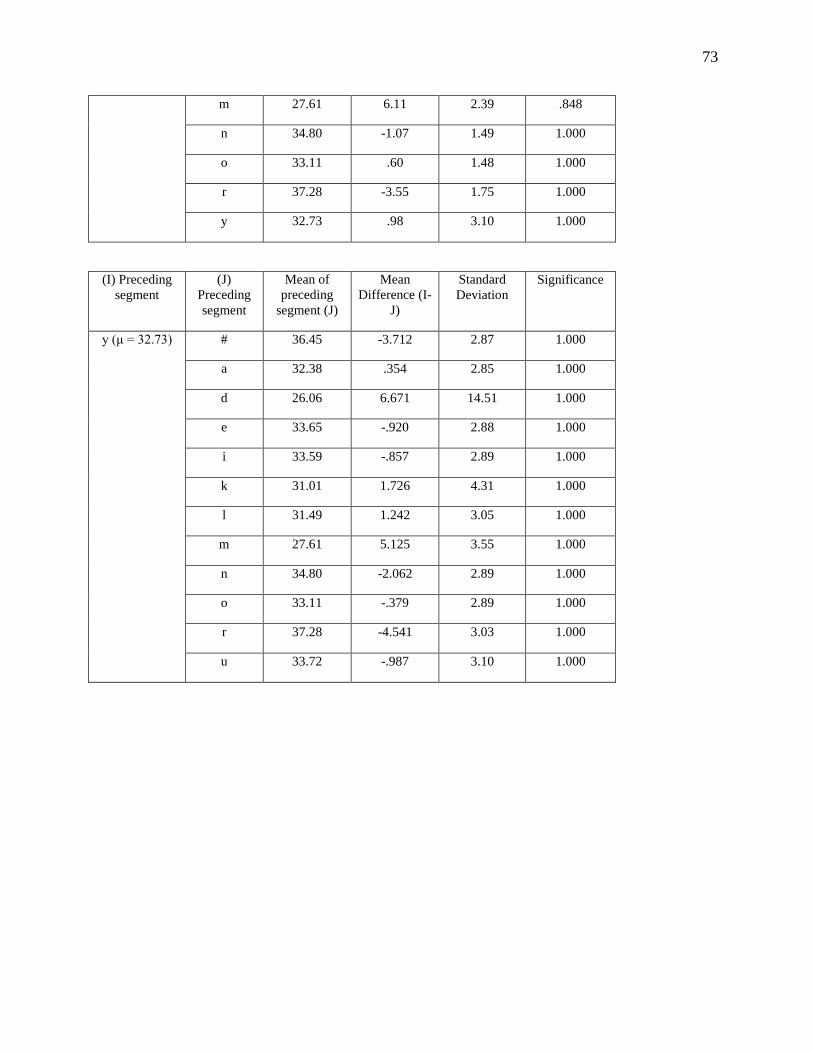
73
m 27.61 6.11 2.39 .848
n 34.80 -1.07 1.49 1.000
o 33.11 .60 1.48 1.000
r 37.28 -3.55 1.75 1.000
y 32.73 .98 3.10 1.000
(I) Preceding segment
(J) Preceding segment
Mean of preceding
segment (J)
Mean Difference (I-
J)
Standard Deviation
Significance
y (μ = 32.73) # 36.45 -3.712 2.87 1.000
a 32.38 .354 2.85 1.000
d 26.06 6.671 14.51 1.000
e 33.65 -.920 2.88 1.000
i 33.59 -.857 2.89 1.000
k 31.01 1.726 4.31 1.000
l 31.49 1.242 3.05 1.000
m 27.61 5.125 3.55 1.000
n 34.80 -2.062 2.89 1.000
o 33.11 -.379 2.89 1.000
r 37.28 -4.541 3.03 1.000
u 33.72 -.987 3.10 1.000
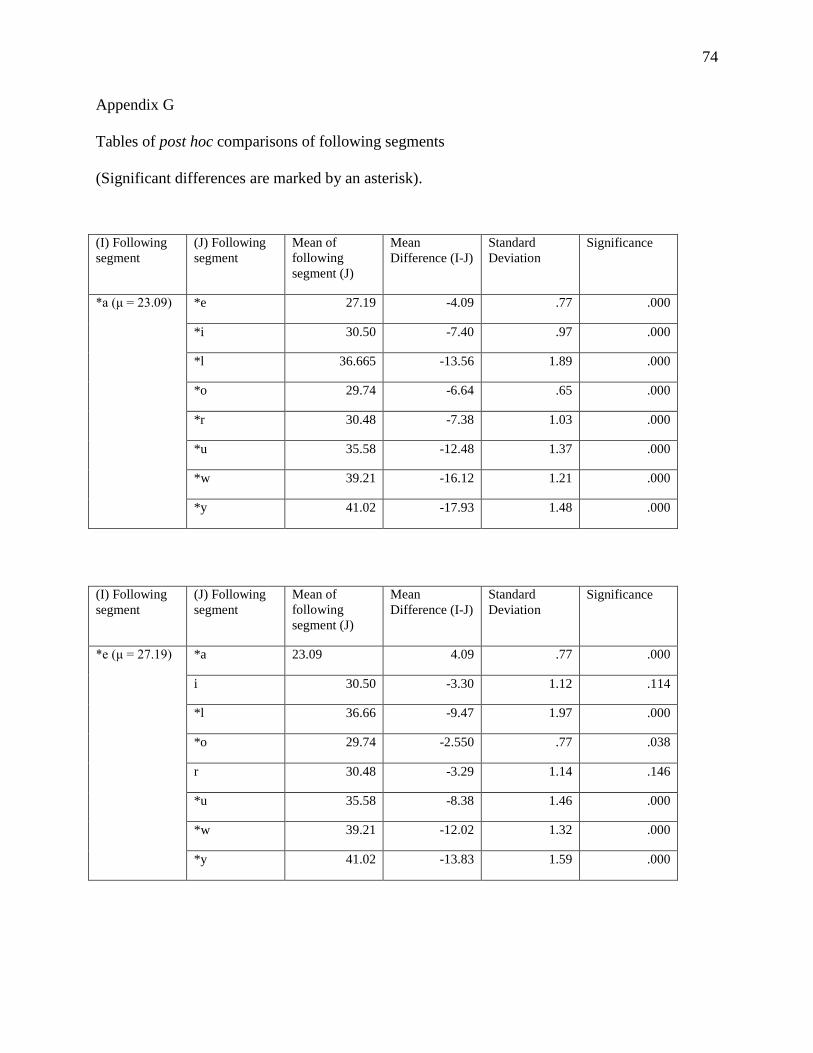
74
Appendix G
Tables of post hoc comparisons of following segments
(Significant differences are marked by an asterisk).
(I) Following segment
(J) Following segment
Mean of following segment (J)
Mean Difference (I-J)
Standard Deviation
Significance
*a (μ = 23.09) *e 27.19 -4.09 .77 .000
*i 30.50 -7.40 .97 .000
*l 36.665 -13.56 1.89 .000
*o 29.74 -6.64 .65 .000
*r 30.48 -7.38 1.03 .000
*u 35.58 -12.48 1.37 .000
*w 39.21 -16.12 1.21 .000
*y 41.02 -17.93 1.48 .000
(I) Following segment
(J) Following segment
Mean of following segment (J)
Mean Difference (I-J)
Standard Deviation
Significance
*e (μ = 27.19) *a 23.09 4.09 .77 .000
i 30.50 -3.30 1.12 .114
*l 36.66 -9.47 1.97 .000
*o 29.74 -2.550 .77 .038
r 30.48 -3.29 1.14 .146
*u 35.58 -8.38 1.46 .000
*w 39.21 -12.02 1.32 .000
*y 41.02 -13.83 1.59 .000
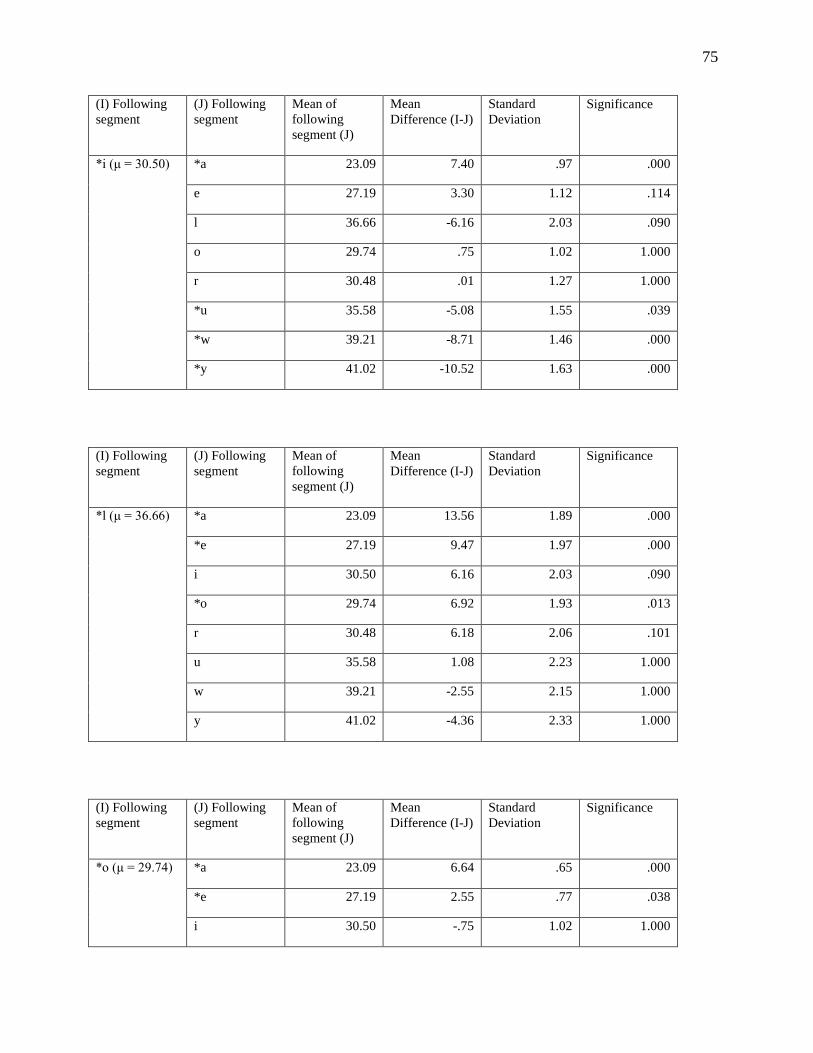
75
(I) Following segment
(J) Following segment
Mean of following segment (J)
Mean Difference (I-J)
Standard Deviation
Significance
*i (μ = 30.50) *a 23.09 7.40 .97 .000
e 27.19 3.30 1.12 .114
l 36.66 -6.16 2.03 .090
o 29.74 .75 1.02 1.000
r 30.48 .01 1.27 1.000
*u 35.58 -5.08 1.55 .039
*w 39.21 -8.71 1.46 .000
*y 41.02 -10.52 1.63 .000
(I) Following segment
(J) Following segment
Mean of following segment (J)
Mean Difference (I-J)
Standard Deviation
Significance
*l (μ = 36.66) *a 23.09 13.56 1.89 .000
*e 27.19 9.47 1.97 .000
i 30.50 6.16 2.03 .090
*o 29.74 6.92 1.93 .013
r 30.48 6.18 2.06 .101
u 35.58 1.08 2.23 1.000
w 39.21 -2.55 2.15 1.000
y 41.02 -4.36 2.33 1.000
(I) Following segment
(J) Following segment
Mean of following segment (J)
Mean Difference (I-J)
Standard Deviation
Significance
*o (μ = 29.74) *a 23.09 6.64 .65 .000
*e 27.19 2.55 .77 .038
i 30.50 -.75 1.02 1.000
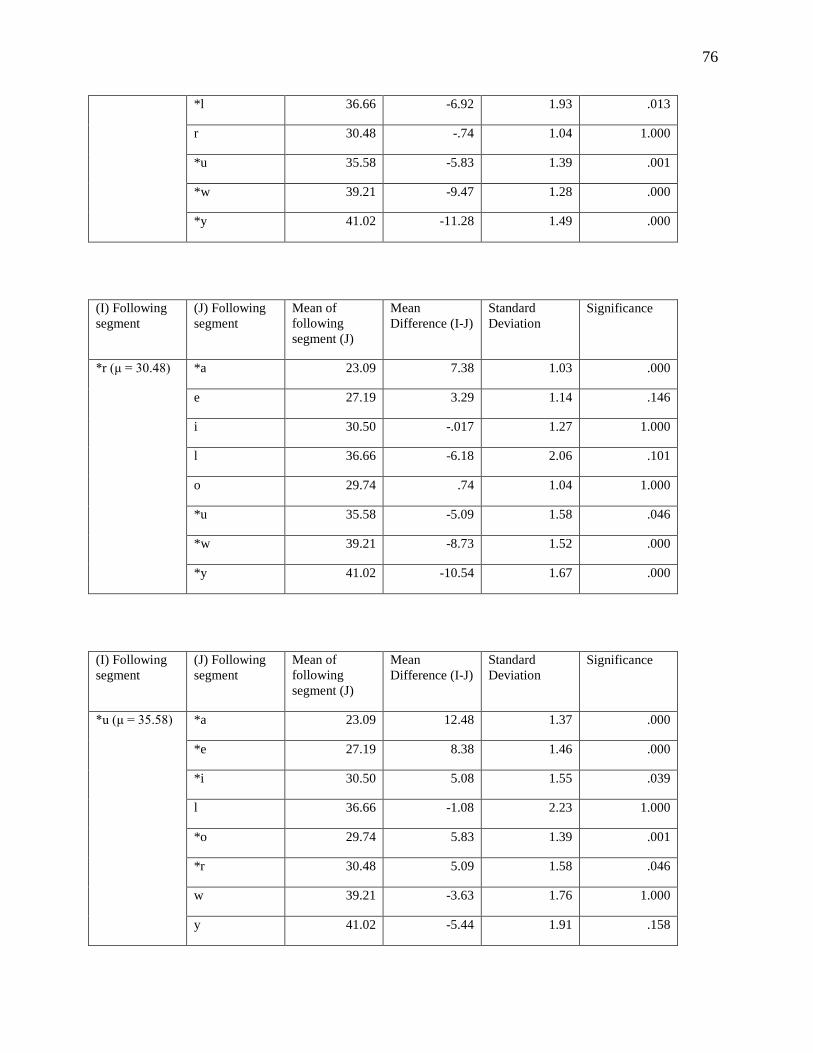
76
*l 36.66 -6.92 1.93 .013
r 30.48 -.74 1.04 1.000
*u 35.58 -5.83 1.39 .001
*w 39.21 -9.47 1.28 .000
*y 41.02 -11.28 1.49 .000
(I) Following segment
(J) Following segment
Mean of following segment (J)
Mean Difference (I-J)
Standard Deviation
Significance
*r (μ = 30.48) *a 23.09 7.38 1.03 .000
e 27.19 3.29 1.14 .146
i 30.50 -.017 1.27 1.000
l 36.66 -6.18 2.06 .101
o 29.74 .74 1.04 1.000
*u 35.58 -5.09 1.58 .046
*w 39.21 -8.73 1.52 .000
*y 41.02 -10.54 1.67 .000
(I) Following segment
(J) Following segment
Mean of following segment (J)
Mean Difference (I-J)
Standard Deviation
Significance
*u (μ = 35.58) *a 23.09 12.48 1.37 .000
*e 27.19 8.38 1.46 .000
*i 30.50 5.08 1.55 .039
l 36.66 -1.08 2.23 1.000
*o 29.74 5.83 1.39 .001
*r 30.48 5.09 1.58 .046
w 39.21 -3.63 1.76 1.000
y 41.02 -5.44 1.91 .158
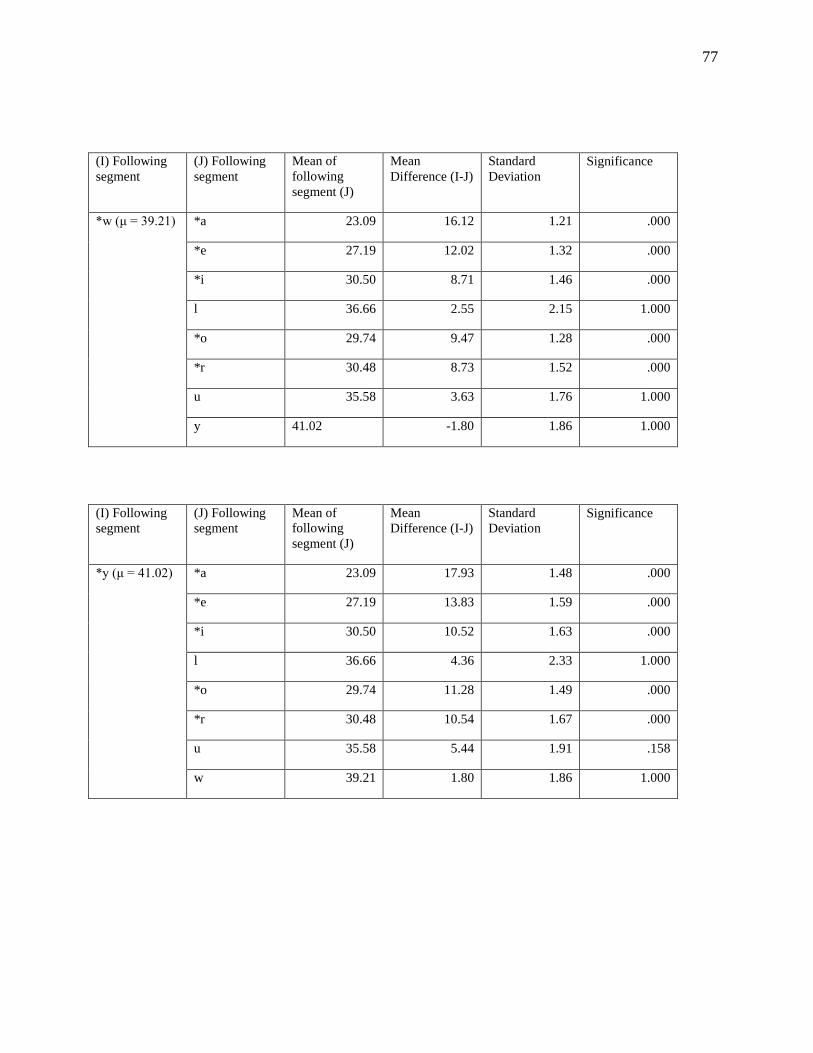
77
(I) Following segment
(J) Following segment
Mean of following segment (J)
Mean Difference (I-J)
Standard Deviation
Significance
*w (μ = 39.21) *a 23.09 16.12 1.21 .000
*e 27.19 12.02 1.32 .000
*i 30.50 8.71 1.46 .000
l 36.66 2.55 2.15 1.000
*o 29.74 9.47 1.28 .000
*r 30.48 8.73 1.52 .000
u 35.58 3.63 1.76 1.000
y 41.02 -1.80 1.86 1.000
(I) Following segment
(J) Following segment
Mean of following segment (J)
Mean Difference (I-J)
Standard Deviation
Significance
*y (μ = 41.02) *a 23.09 17.93 1.48 .000
*e 27.19 13.83 1.59 .000
*i 30.50 10.52 1.63 .000
l 36.66 4.36 2.33 1.000
*o 29.74 11.28 1.49 .000
*r 30.48 10.54 1.67 .000
u 35.58 5.44 1.91 .158
w 39.21 1.80 1.86 1.000
78
Bibliography
Abramson, A., & Lisker, L. (1970). Discriminability along the voicing continuum: Cross-
language tests. In B. Hála, M. Pomportal, & P. Janota (Eds.), Proceedings of the 6th
International Congress of Phonetic Sciences (pp. 569-573). Prague: Academia.
Abramson, A., & Lisker, L. (1973). Voice-timing perception in Spanish word-initial stops.
Journal of Phonetics, 1, 1-8.
Alvord, Scott M. and Diane E. Christiansen. In press. Studies of Spanish and Lusophone
Linguistics.
Arteaga, D. L. (2000). Articulatory Phonetics in the First-Year Spanish Classroom. The Modern
Language Journal. 84(3), pp. 339-354.
Asher, J. J., & García, R. (1969). The optimal age to learn a foreign language. Modern Language
Journal, 53, 334-341.
Boersma, Paul (2001). Praat, a system for doing phonetics by computer. Glot
International 5:9/10, 341-345.
Bongaerts, T., Planken, B., & Schils, E. (1995). Can late learners attain a native accent in a
foreign language? A test of the critical period hypothesis. In The age factor in second
language acquisition (D. Singleton & Z. Lengyel, editors), pp. 30-50. Clevedon, U.K.:
Multilingual Matters.
Bongaerts, T., Planken, B., & Schils, E. (1997). Age and ultimate attainment in the pronunciation
of a foreign language. Studies in Second Language Acquisition, 19, 447-465.
Bongaerts, T. (1999). Ultimate attainment in L2 Phonology: The case of very advanced late
learners. In D. Birdsong (Ed.) Second Language Acquisition and the Critical Theory
Hypothesis (pp. 133-159). Mahwah, N.J.: Lawrence Erlbaum.
79
Borzone, A. M. (1980). Manual de Fonética Acústica, Buenos Aires, L. Hachette.
Broaddus, D. L. (1986). Use of the culture-general assimilator in intercultural training.
Unpublished doctoral disseration, The School of Graduate Studies, Indiana State
University.
Caramazza, A., Yeni-Komshian, G. H., Zurif, E. B., & Carbone, E. (1973). The acquisition of a
new phonological contrast: The case of stop consonants in French-English bilinguals.
Journal of the Acoustical Society of America, 54, 421-428.
Castañeda, M. L. (1986). El VOT de las oclusiva sordas y sonoras españolas. Estudios de
fonética experimental, 2, 91-110.
Coleman, J. (1998, Fall). Language learning and study abroad: The European perspective.
Frontiers, 167-203.
Cooper, W. E. (1974). Contingent feature analysis in speech perception. Perception &
Psychophysics, 16, 201-204.
Cushner, K. (1986). The Inventory of Cross-Cultural Sensitivity. Kent State University: School
of Education.
Cushner, K. (1989). Assessing the impact of a culture-general assimilator. International Journal
of Intercultural Relations, 13, 125-126.
Day, A. (1985). Good dog, Carl. New York, New York: Aladdin Paperbacks. Díaz-Campos, M.
(2004). Context of learning in the Acquisition of Spanish Second Language Phonology.
Studies in Second Language Acquisition, 26(2), pp. 249-273.
Díaz-Campos, M. (2006). The effect of style in second language phonology: An analysis of
segmental acquisition in study abroad and regular-classroom students. In Carol A. Klee
and Timothy L. Face (Eds.), Selected Proceedings of the 7th Conference on the
80
Acquisition of Spanish and Portuguese as First and Second Languages (pp. 26-39).
Somerville, MA: Cascadilla Proceedings Project.
Díaz-Campos, M., & Lazar N. (2003). Acoustic analysis of voiceless initial stops in the speech
of study abroad and regular class students: context of learning as a variable in Spanish
second language acquisition. In P. Kempchinksy & C. E. Piñeros, (Eds.), Theory,
Practice, and Acquisition: Papers from the 6th Hispanic Linguistics Symposium and the
5th Conference on the Acquisition of Spanish and Portuguese. (pp. 352-370) Somerville:
Cascadilla Press.
Díaz-Campos, M., Lazar N., Freed, B. F., Segalowitz, N., Lafford, B., & Collentine, J. (2002
October). Acoustic analysis of voiceless initial stops in the speech of study abroad and
regular class students. Paper presented at the 5th Conference on the Acquisition of
Spanish, Iowa City.
Elliott, R. (1995) Field independence/dependence, hemispheric specialization, and attitude in
relation to pronunciation accuracy in Spanish as a foreign language. The Modern
Language Journal, 79, 356-371.
Flege, J. E. (1987). The production of “new” and “similar” phones in a foreign language:
evidence for the equivalence classification, Journal of Phonetics, 15, 47-65.
Flege, J. E. (1988). Factors affecting degree of perceived foreign accent in English sentences.
Journal of the Acoustical Society of America, 84, 70-79.
Flege, J. E. (1991). Age of learning affects the authenticity of VOT in stop consonants produced
in a second language. Journal of the Acoustical Society of America, 89(1), 395-411.
81
Flege, J. E. (1992). The intelligibility of English vowels spoken by British and Dutch talkers. In
R. D. Kent (Ed.), Intelligibility in speech disorders: Theory, measurement, and
management (Vol. 1, pp. 157-232). Philadelphia: John Benjamins.
Flege, J. E. (1995). Second Language speech learning: Theory, findings, and problems. In W.
Stange (Ed.), Speech perception and linguistic experience: Issues in cross-linguistic
research (pp. 233-277). Timonium, MD: York Press.
Flege, James E., & Fletcher, Kathryn L. (1992) Talker and listener effects on degree of perceived
foreign accent. Journal of the Acoustical Society of America, 91, 370-389.
Flege, J. E., Frieda, E. M., & Nozawa, T. (1997) Amount of native-language (L1) use affects the
pronunciation of an L2. Journal of Phonetics, 25, 169-186.
Flege, J. E., & Hillenbrand, J. (1984). Limits on pronunciation accuracy in adult foreign
language speech production. Journal of the Acoustical Society of America, 76, 708-721.
Flege, J. E., Munro, M. J., & MacKay, I. R. A. (1995). Effects of age of second-language
learning on the production of English consonants. Speech Communication, 16, 1-26.
Flege, J. E., Yeni-Komshian, G., & Liu, H. (1999). Age constraints on second language
acquisition, Journal of Memory & Language, 41, 78-104.
Freed, Barbara. (1995). What makes us think that student who study abroad become fluent? In B.
Freed (Ed.), Second language acquisition in a study abroad context. (pp. 123-148).
Amsterdam: John Benjamins.
Gardner, R. C. (1985). Second language attrition: The role of motivation and use. London: Dept.
of Psychology, University of Western Ontario.
González-Bueno, M. (1997). Voice onset time in the perception of foreign accent by native
listeners. Spanish International Review of Applied Linguistics, 35, 251 -267.
82
Guion, S. G., Flege, J. E. & Loftin, J. D. (2000). The effect of L1 use on pronunciation in
Quichua-Spanish bilinguals, Journal of Phonetics, 28, 27-42.
Hualde, J. I. (2005). The Sounds of Spanish. Cambridge: Cambridge University Press, pp. 138-
151.
Isabelli, C.L. (2001). Motivation and Extended Interaction in the Study Abroad
Context: Factors in the Development of Spanish Language Accuracy and
Communication Skills. Dissertation Abstracts International, Section A: The
Humanities and Social Sciences, 61 (11): 4362. (UMI No. 9992827
Klatt, D. H. (1973). Interaction between two factors that influence vowel duration. Journal of the
Acoustical Society of America, 54, 1102-1104.
Klatt, D. H. (1975). Voice onset time, frication, and aspiration in word-initial consonant clusters.
Journal of Speech and Hearing Research, 18, 686-706.
Lapkin, S., Hart, D., & Swain, M. (1995). A Canadian interprovincial exchange: Evaluating the
linguistic impact of a three-month stay in Quebec. In B. Freed (Ed.), Second language
acquisition in a study abroad context. (pp. 67-94). Amsterdam: John Benjamins.
Landau, S., & Everitt, B. S. (2004). A handbook of statistical analyses using SPSS. Boca Raton,
Florida: Chapman & Hall/CRC Press LLC. (electronic copy)
Lisker, L., & Abramson, A. S. (1964). A cross-language study of voicing in initial stops:
acoustical measurements. Word, 20¸ 384-422.
Lisker, L., & Abramson, A. S. (1967). Some effects of context on voice onset time in English
stops. Language and Speech, 10, 1-28.
83
Lisker, L., & Abramson, A. S. (1970). The voicing dimension: Some experiments in comparative
phonetics. In B. Hála, M. Pomportal, & P. Janota (Eds.), Proceedings of the 6th
International Congress of Phonetic Sciences. (pp. 569-573). Prague: Academia.
Lord, G. (2005). (How) can we teach foreign language pronunciation? On the effects of a
Spanish phonetics course. Hispania, 88(3), 557-67.
MacDonald, M. G. 1987. The influence of Spanish phonology on the English spoken by United
States hispanics. In Hammond, R., & Bjarkman, P. (Eds.), American Spanish
pronunciation: Theoretical and applied perspectives (pp. 215-236). Washington, D. C.:
Georgetown University Press.
Magnan, S. S. & Back, M. (2007). Social interaction and linguistic gain during study abroad.
Foreign Language Annals, 40(1), 43-61.
Major, R. C. (1987). Phonological simialarity, markedness, and rate of L2 acquisistion. Studies
in Second Language Acquisition, 9, 63-82.
Major, R. C. (1992). Losing English as a first language. The Modern Language Journal, 76, 190-
208.
Major, R. C. (2001). Foreign accent: the ontogeny and phylogeny of second language
phonology. Mahwah, New Jersey: Lawrence Erlbaum Associates, Publishers.
Masgoret, A., Gardner, R. (2003). Attitudes, motivation and second language
learning: meta-analysis of studies conducted by Gardner and associates.
Language Learning, 53, 167-210.
Moyer, A. (1999). Ultimate attainment in L2 phonology. Studies in Second Language
Acquisition, 21, 81-108.
84
Piske, T., MacKay, I. R. A., & Flege, J. E. (2001). Factors affecting degree of foreign accent in
an L2: a review. Journal of Phonetics, 29, 191-215.
Port, R. F. & Rotunno, R. (1979). Relation between voice-onset time and vowel duration.
Journal of the Acoustical Society of America, 66(3), 654-662.
Purcell, E. T. & Suter, R. W. (1980). Predictors of pronunciation accuracy: a reexamination.
Language Learning, 30, 271-287.
Rosner, B., López-Bascuas, L. E., García-Albea, J. E., & Fahey, R. P. (2000). Voice-onset times
for Castilian Spanish initial stops. Journal of Phonetics, 28, 217-224.
Sancier, M. L. & Fowler, C. A. (1997). Gestural drift in a bilingual speaker of Brazilian
Portuguese and English. Journal of Phonetics, 25, 421-436.
Summerfield, Q. (1975). How a detailed account of segmental perception depends on prosody
and vice versa. In A. Cohen and S. G. Nooteboom (eds.), Structure and Process in
Speech Perception. (pp. 51-68). New York: Springer.
Summerfield, Q. (1981). “Articulatory Rate and Perceptual Constancy in Phonetic Perception.”
Journal of Experimental Psychology: Human Perception and Performance, 7(5), 1074-
1095.
Suter, R. W. (1976). Predictors of pronunciation accuracy in second language learning.
Language Learning, 26, 233-253.
Tahta, S., Wood, M., & Lowenthal, K. (1981). Foreign accents: Factors relating to transfer of
accent from the first language to the second language. Lang. Speech, 24, 363-372.
Thornburgh, D. F., & Ryalls, J. (1998). Voice onset time in Spanish-English bilinguals: early
versus late learners of English. Journal of Communication Disorders, 31, 215-229.
85
Thompson, I. (1991). Foreign accents revisited: the English pronunciation of Russian
immigrants, Language Learning, 4, 177-204.
Twombly, S.B. (1995). Piropos and friendships: gender and culture clash in study
abroad. Frontiers: Interdisciplinary Journal of Study Abroad, 1.
http://www.frontiersjournal.com/issues/vol1/index.htm
Weismer, G. (1979). Sensitivity of VOT measures to certain segmental features in speech
production. Journal of Phonetics, 7(2), 197-204.
Wilkinson, S. (1998). On the nature of immersion during study abroad: some
participant perspectives. Frontiers: The Interdisciplinary Journal of Study
Abroad, 4. http://www.frontiersjournal.com/issues/vol4/index.htm
Williams, Lee. (1977) The voicing contrast in Spanish. Journal of Phonetics, 5, 169-184.
Yager, K. (1998). Learning Spanish in Mexico: the effect of informal contact and
student attitudes on language gain. Hispania, 81, 898-913.
Yavas, M. (2009). Factors influencing the VOT of English long lag stops and interlanguage
phonology. In, M. Watkins, A. Reuber & B. Baptista (Eds.) Recent Research in Second
Language Phonetics/Phonology: perception and production. (pp. 244-255). Cambridge
Scholars Publishing.
Yavas, M., & Wildermuth, R. (2006). The effects of place of articulation and vowel height in the
acquisition of English aspirated stops by Spanish speakers. International Review of
Applied Linguistics in Language Teaching, 44, 251-263.
Yeni-Komshian, G., Caramazza, A., & Preston, M. S. (1977). A study of voicing in Lebanese
Arabic. Journal of Phonetics, 5, 35-48.

86
Zampini, M. L. & Green, K. P. (2001). The voicing contrast in English and Spanish: the
relationship between perception and production. In J. Nicol (ed.). One mind, two
languages (pp. 23-48). Oxford: Blackwell.