Embed Size (px)
Citation preview
indiastat.com July - August, 2011 1 socio - economic voices
Acquisition of Agricultural Land, Compensation, Livelihood and Environmental issues in Urbanizing Fringe of Lucknow Metroplis (Prof. (Dr.) S.S.A. Jafri, Giri Institute of Development Studies Sector O, Aliganj Housing Scheme, Lucknow)
Introduction
India’s 1.5 per cent or more than 21 lakh hectares net sown area between 1990 and 2003 have
gone to non-farm activity. The actual figures could be much higher. If we accept 21 lakh hectares
of crop land which is diverted to non-agricultural uses and if this area was brought under wheat
then it would amount to a mind-boggling 57 lakh tones of produce, which could have fed more
than 43 million hungry people every year. In Uttar Pradesh 68.6 per cent land is cultivated and
31.4 pr cent land is under non farm uses. Only 7.0 per cent land is under forest, when according
to forest policy there should be one-third forest cover for healthy environment. Adverse
environmental impact is now reflected in falling yield and increasing other fallow and current
fallow land as it is becoming uneconomical to cultivate. For example in Sultanpur, Pratapgarh,
Lucknow and Unnao districts other and current fallow lands have increased up to 15.0 per cent.
In U.P. cereal production was 41.8 million metric tones in 2001-02 which has fallen to 37.6 million
metric tones in 2004-05 due to land degradation.
In Central region of U.P. the growth of land put to non-agricultural use in rural areas has risen to
19.1 per cent during 2001-08. Similarly growth rate of land put to non agricultural uses in
Bundelkhand has gone up to 17.6 per cent in rural areas. In Lucknow division we find that during
2004-05 from an area of 2420134 hectare the production was 4958114 metric tones, while during
2005-06 the area decreased to 2314603 hectare and with it the production also decreased to
4721101 metric tones.
Therefore, it is most essential to identify the non-agricultural infertile land through satellite
imageries and on the basis of data the area available should be compulsorily utilized for
urbanization. Million plus cities should not be allowed to further grow by putting ban on expansion
of industries or any kind of activities which are not directly required for the cities. In this way
urbanization would grow in un-urbanized areas and thus barren waste lands would be easily
available for urban use. Agricultural land should not be allowed at any cost to be used for non
farm activities. There should be strict check and control on the basis of clear cut formulated
policies at the state and local level so that an all round sustainable development should be
achieved and that too within a short period of time. If at all it is so essential to acquire the
agricultural land then on the basis of average
indiastat.com July - August, 2011 2 socio - economic voices
indiastat.com July - August, 2011 3 socio - economic voices
cost of the produce at present and future prices, it should be calculated for 30 years and paid to
farmers every year. During 30 years farmers would be able to adopt non-farm livelihood as it is
already in practice in Haryana State.
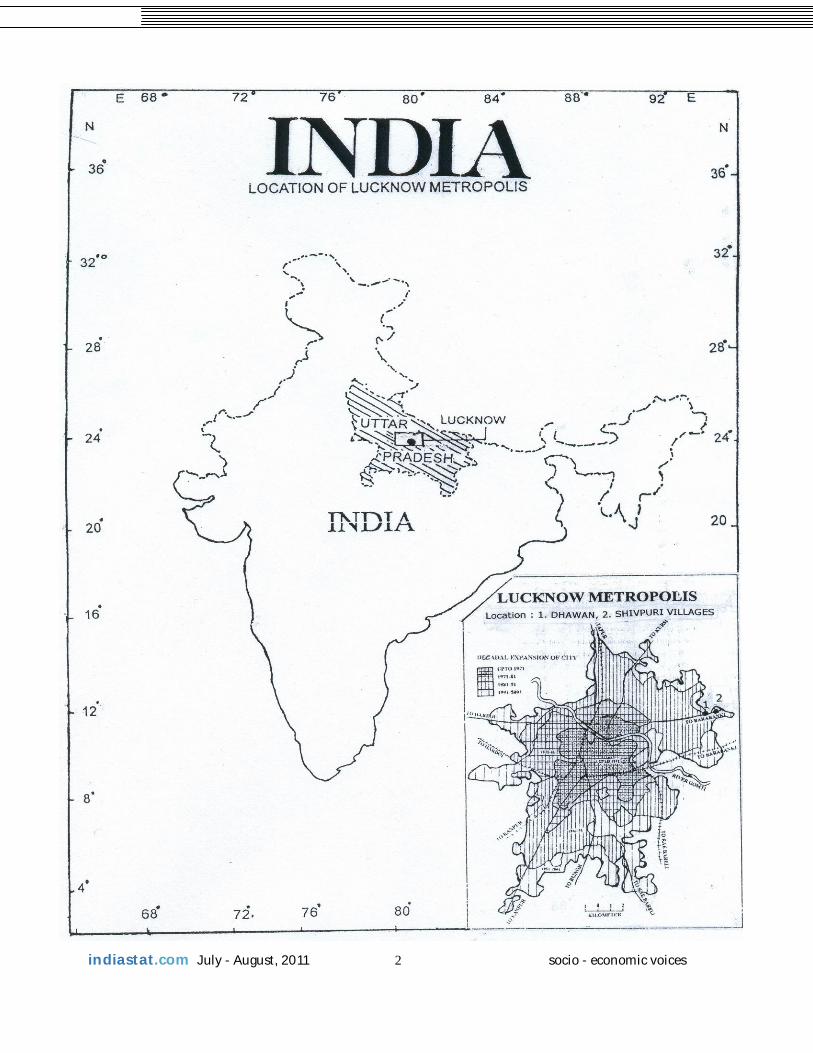
Lucknow district occupies about 2519 sq. km. area in Central region of Uttar Pradesh and it is
privileged with having the capital city of the most populated state of India. Lucknow district is
having 8 blocks, namely, Malihabad, Mal, Bakshi-ka-Talab, Kakori, Chinhat, Sarojininagar,
Gosaiganj and Mohanlalganj. Lucknow the capital city which is now a metropolis with 2.25 million
population (2001) is spreading quite fast on its peripheral areas and encroaching on adjoining
fertile agricultural land of rural blocks mainly Sarojininagar, Chinhat, Mohanlalganj, Mal and
Bakshi-ka-Talab. Lucknow city along with Cantonment was occupying only 50 sq. km. in 1950,
which spread on 110 sq.km. in 1971, 146 sq.km. in 1981, 338 sq.km. in 1991 and about 450
sq.km. in 2001. In 1981 its population was 1.08 million which doubled in 20 years to 2.25 million
in 2001 and in next 20 years, i.e. 2021 it is expected to be 4.50 million.
Till 1991 in U.P. land put to non-agricultural uses was around 8.0 per cent and by the beginning
of 2000 the land put to non-agricultural uses increased to around 9.0 per cent. In 2008 the land
put to non-agricultural uses occupies around 11.0 per cent of the geographical area of Uttar
Pradesh. The increasing size of land put to non-agricultural uses and recently decline in net area
sown in rural areas is an indication that the prime agricultural land is fast being encroached by
fringes of towns and cities and in due course of time they would become the part of urban land.
Earlier land put to non-agricultural uses was generally meant that the land is being used as a
common land for thrashing the harvested crops, exhibition grounds, playgrounds and other
amenities and it was well within 8.0 per cent of the geographical area. Now with the beginning of
the 21st century it is especially found that around some of the fast growing cities and towns a
large chunk of fertile land is being purchased and left by the industrialists, colonizers and
individual entrepreneurs for future use as urban land. It is generally found that the expansion of
cities is taking place on commercially viable areas ignoring the importance of environment and
land meant for cultivation purposes. Around every city and town and in every district there are
plenty of wastelands, which could have been brought under urbanization if there was any such
law to restrict and spare the agricultural land and also to protect environment.
The farmers on urban fringes are compelled and lured to sell their land to urban people and they
loose their centuries old traditional livelihood from farming forever. Farmers are left only with their
indiastat.com July - August, 2011 4 socio - economic voices
dwellings and it is found that once they become landless, for generations they do not become
capable to earn their proper livelihood from non-farm occupations. Mostly they work as a casual
labourers in their neighbourhood of city and their socio-economic condition remain deplorable for
decades together.
Lucknow being the capital city has a continuously fast process of occupying the neighbouring
fertile land of the villages. The result is during last 13 years, i.e. between 1994-95 and 2007-08,
the growth rate of land put to non-agricultural uses in neighbouring rural areas of Lucknow
metropolis was recorded 45.1 per cent. For example, in Sarojininagar block the land put to non-
agricultural uses grew to 109.8 per cent, Chinhat block 83.3 per cent, Mohanlalganj block 43.7
per cent, Gosaiganj block 34.0 per cent, Mal block 30.0 per cent and in Bakshi-ka-Talab block
21.5 per cent. If we see the proportion of geographical area of Chinhat block brought under land
put to non-agricultural uses was maximum in Lucknow district, i.e. 31.3 per cent in 2008.
It is an interesting study to survey few villages and their households, enquiring about the value of
land received and its utilization, their changing occupation and income and their overall socio-
economic and living conditions. This would guide us how to control the agricultural land brought
to non-agricultural uses and how to plan the rehabilitation of agricultural farmers and their families
before the city encroaches in an unplanned manner. In Lucknow metropolitan city, after
independence the settlements of villages which had lost their valuable agricultural land are still
existing and the plight of their dwellers is quite obvious.
Sample Villages:
Among two, one slow and another fast urbanizing villages i.e. Dhawan and Shivpuri respectively
are located adjacent to eastern side of Lucknow metropolis in Chinhat Block were identified for
sample survey. The geographical area of Dhawan Village was 200 hectare and Shivpuri 300
hectare. Among these villages Dhawan is left with only about 50 hectare of agricultural land when
in Shivpuri most of the land is occupied in urban process. There are 250 households in Dhawan
village with 3500 population when in Shivpuri 5000 households are there with 15,9000 population.
Most of the houses in both the villages are pucca. Religion wise only less than 10 per cent
population belong to minority. Caste wise majority population belong to OBC (Other Backward
Caste). In records 84 households (64 Hindu, 20 Muslim) in Dhawan Village and 341 (326 Hindu
and 15 Muslims) in Shivpuri village belongs to BPL (Below Poverty Level) category who are
entitled for various benefits under Government schemes.
indiastat.com July - August, 2011 5 socio - economic voices
In Dhawan village about 6 ponds were there which were perennial but today only 3 ponds are left
perennial and 1 pond non perennial. In Shivpuri only 1 pond was perennial earlier, which is now
non perennial. In both the villages the ground water is about 20 to 25 feet below the ground
surface, but for perennial boring farmers go up to 120 feet deep. In remaining agricultural land
mainly wheat and paddy is grown and the productivity is lowered to 5 to 10 quintal per bigha and
food grain is retained for only household consumption, except vegetable is sold in the market.
Most of the households have almost shifted their dependence on non farm activities, as the
remaining agricultural land has become non productive and it is in the process of selling with the
hope of better prices for urbanization which is imposed. Lands purchased by Government by
force are paid only less than Rs.50,000/- per bigha when private parties are paying in millions of
rupees (present rate is between Rs.3 to 6 million). It is highly objectionable that farmers are
deprived by Government by force and their livelihood is snatched through spurious laws. It is high
time that Government must adopt the Haryana pattern where the productivity of land is calculated
and the value is paid to the farmers for 30 years with consideration of cost escalation of
agricultural produce during the years. It is the proper method through which farmers would slowly
adopt to adjust with the non-farm livelihood, otherwise it is injustice to impose least value of land.
During rainy season both villages suffer from the effects of bad drainage system. Household of
both the villages mostly depend upon private hand pumps, except few households depends on
public hand pumps mark IV. Households suffer mainly by stomach diseases, fewer, cough, blood
pressure, small pox and sugar but none of these villages have proper health centre. About 15.0
per cent natives of these villages have their own toilets. When 60.0 per cent newly settled
households have their own toilets. There is a lot to do to improve the hygienic condition in these
villages. There is co-ed primary-middle school in Dhawan village when in Shivpuri 3 primary-
middle schools are there, however children of affluent class go out for convent education i.e.
English medium education.
Under Indra Awas Yojana 11 houses are constructed in Dhawan village when in Shivpuri village
42 houses are constructed. In both the villages 50 to 80 per cent households have got T.V.,
Mobile phone and scooter/motor bike, when VCD, fridge, and 4 wheelers are rare in their
household assets. No community or caste tension is reported in both the villages, but few police
cases are recorded under crimes. There are also few court cases due to property and land
compensation claims. Over all it is a big question before the uneducated native youth and
working age population in both the villages that how to adjust with the changing scenario from
centuries old agricultural dependence to non agricultural non-acquainted alien means of
livelihood.
indiastat.com July - August, 2011 6 socio - economic voices
Population Dynamics:
Over all 120 households were surveyed for this study. Total 60 households from each Dhawan
and Shivpuri villages were identified belonging to their dominant occupations. Cultivators, animal
husbandry, business, agricultural labourers non agricultural labourer and services. Thus
information of 354 people of Dhawan and 365 of Shivpuri village were recorded. In Shivpuri sex
ratio was recorded 1006 females per thousand males because here SC households are
comparatively more in household sample and higher castes households are less in comparison to
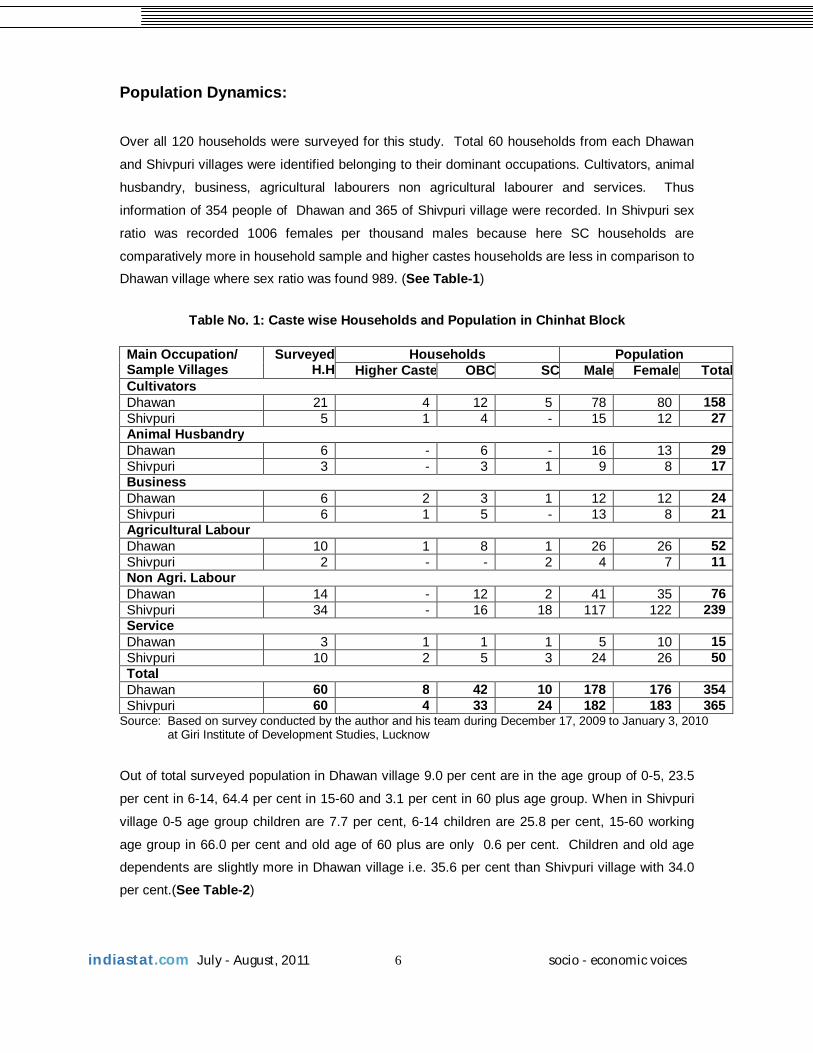
Dhawan village where sex ratio was found 989. (See Table-1)
Table No. 1: Caste wise Households and Population in Chinhat Block
Main Occupation/ Sample Villages
SurveyedH.H
Households Population Higher Caste OBC SC Male Female Total
Cultivators Dhawan 21 4 12 5 78 80 158 Shivpuri 5 1 4 - 15 12 27 Animal Husbandry Dhawan 6 - 6 - 16 13 29 Shivpuri 3 - 3 1 9 8 17 Business Dhawan 6 2 3 1 12 12 24 Shivpuri 6 1 5 - 13 8 21 Agricultural Labour Dhawan 10 1 8 1 26 26 52 Shivpuri 2 - - 2 4 7 11 Non Agri. Labour Dhawan 14 - 12 2 41 35 76 Shivpuri 34 - 16 18 117 122 239 Service Dhawan 3 1 1 1 5 10 15 Shivpuri 10 2 5 3 24 26 50 Total Dhawan 60 8 42 10 178 176 354 Shivpuri 60 4 33 24 182 183 365
Source: Based on survey conducted by the author and his team during December 17, 2009 to January 3, 2010 at Giri Institute of Development Studies, Lucknow
Out of total surveyed population in Dhawan village 9.0 per cent are in the age group of 0-5, 23.5
per cent in 6-14, 64.4 per cent in 15-60 and 3.1 per cent in 60 plus age group. When in Shivpuri
village 0-5 age group children are 7.7 per cent, 6-14 children are 25.8 per cent, 15-60 working
age group in 66.0 per cent and old age of 60 plus are only 0.6 per cent. Children and old age
dependents are slightly more in Dhawan village i.e. 35.6 per cent than Shivpuri village with 34.0
per cent.(See Table-2)
indiastat.com July - August, 2011 7 socio - economic voices
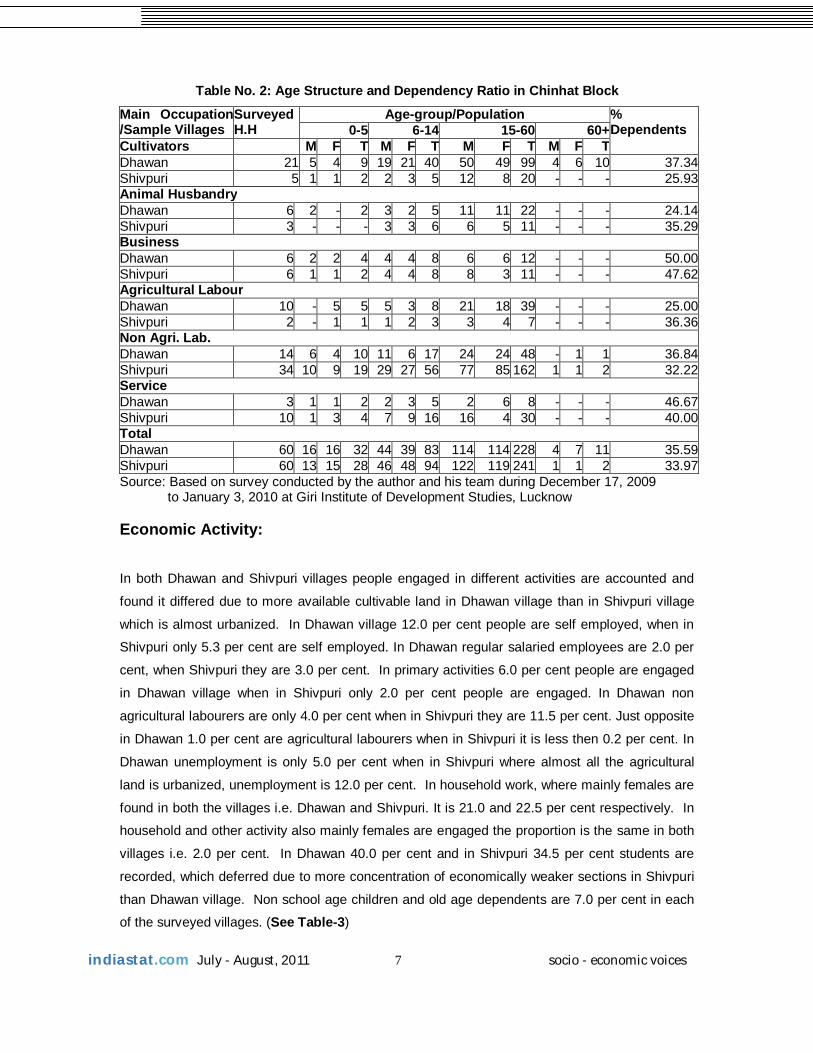
Table No. 2: Age Structure and Dependency Ratio in Chinhat Block
Main Occupation /Sample Villages
Surveyed H.H
Age-group/Population % Dependents 0-5 6-14 15-60 60+
Cultivators M F T M F T M F T M F TDhawan 21 5 4 9 19 21 40 50 49 99 4 6 10 37.34Shivpuri 5 1 1 2 2 3 5 12 8 20 - - - 25.93Animal Husbandry Dhawan 6 2 - 2 3 2 5 11 11 22 - - - 24.14Shivpuri 3 - - - 3 3 6 6 5 11 - - - 35.29Business Dhawan 6 2 2 4 4 4 8 6 6 12 - - - 50.00Shivpuri 6 1 1 2 4 4 8 8 3 11 - - - 47.62Agricultural Labour Dhawan 10 - 5 5 5 3 8 21 18 39 - - - 25.00Shivpuri 2 - 1 1 1 2 3 3 4 7 - - - 36.36Non Agri. Lab. Dhawan 14 6 4 10 11 6 17 24 24 48 - 1 1 36.84Shivpuri 34 10 9 19 29 27 56 77 85 162 1 1 2 32.22Service Dhawan 3 1 1 2 2 3 5 2 6 8 - - - 46.67Shivpuri 10 1 3 4 7 9 16 16 4 30 - - - 40.00Total Dhawan 60 16 16 32 44 39 83 114 114 228 4 7 11 35.59Shivpuri 60 13 15 28 46 48 94 122 119 241 1 1 2 33.97Source: Based on survey conducted by the author and his team during December 17, 2009
to January 3, 2010 at Giri Institute of Development Studies, Lucknow
Economic Activity:
In both Dhawan and Shivpuri villages people engaged in different activities are accounted and
found it differed due to more available cultivable land in Dhawan village than in Shivpuri village
which is almost urbanized. In Dhawan village 12.0 per cent people are self employed, when in
Shivpuri only 5.3 per cent are self employed. In Dhawan regular salaried employees are 2.0 per
cent, when Shivpuri they are 3.0 per cent. In primary activities 6.0 per cent people are engaged
in Dhawan village when in Shivpuri only 2.0 per cent people are engaged. In Dhawan non
agricultural labourers are only 4.0 per cent when in Shivpuri they are 11.5 per cent. Just opposite
in Dhawan 1.0 per cent are agricultural labourers when in Shivpuri it is less then 0.2 per cent. In
Dhawan unemployment is only 5.0 per cent when in Shivpuri where almost all the agricultural
land is urbanized, unemployment is 12.0 per cent. In household work, where mainly females are
found in both the villages i.e. Dhawan and Shivpuri. It is 21.0 and 22.5 per cent respectively. In
household and other activity also mainly females are engaged the proportion is the same in both
villages i.e. 2.0 per cent. In Dhawan 40.0 per cent and in Shivpuri 34.5 per cent students are
recorded, which deferred due to more concentration of economically weaker sections in Shivpuri
than Dhawan village. Non school age children and old age dependents are 7.0 per cent in each
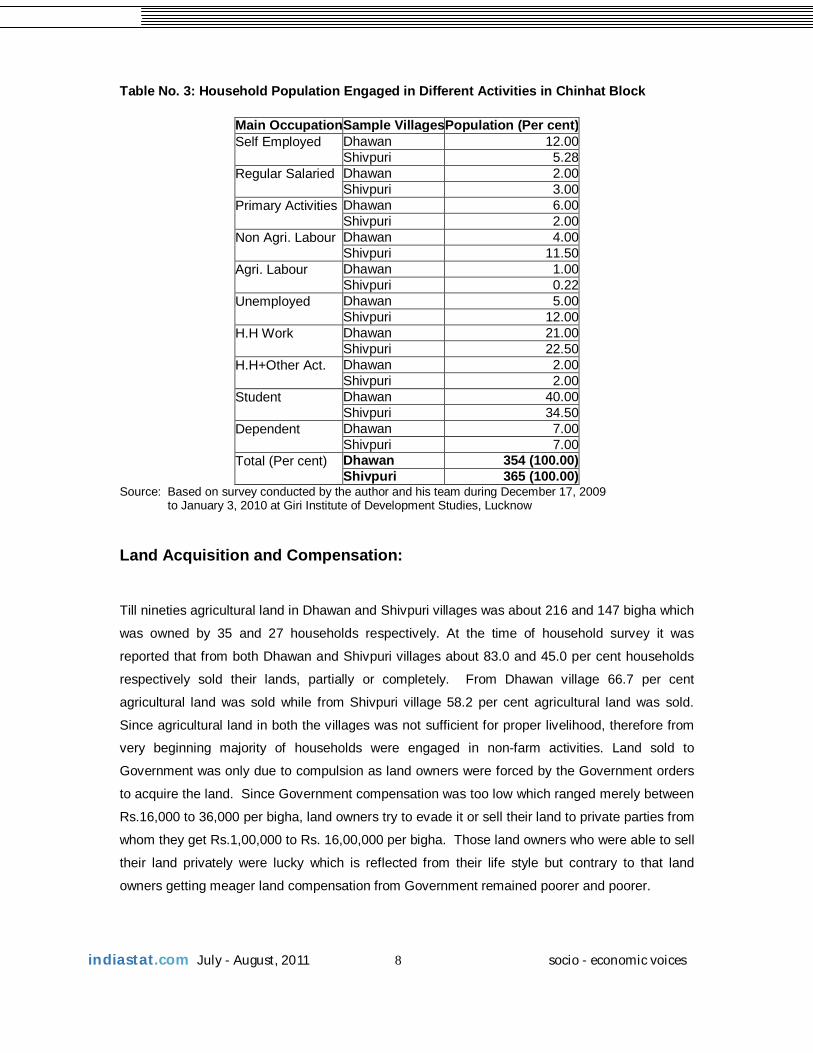
of the surveyed villages. (See Table-3)
indiastat.com July - August, 2011 8 socio - economic voices
Table No. 3: Household Population Engaged in Different Activities in Chinhat Block
Main OccupationSample VillagesPopulation (Per cent)Self Employed
Dhawan 12.00Shivpuri 5.28
Regular Salaried
Dhawan 2.00Shivpuri 3.00
Primary Activities
Dhawan 6.00Shivpuri 2.00
Non Agri. Labour
Dhawan 4.00Shivpuri 11.50
Agri. Labour
Dhawan 1.00Shivpuri 0.22
Unemployed
Dhawan 5.00Shivpuri 12.00
H.H Work
Dhawan 21.00Shivpuri 22.50
H.H+Other Act.
Dhawan 2.00Shivpuri 2.00
Student
Dhawan 40.00Shivpuri 34.50
Dependent
Dhawan 7.00Shivpuri 7.00
Total (Per cent)
Dhawan 354 (100.00)Shivpuri 365 (100.00)
Source: Based on survey conducted by the author and his team during December 17, 2009 to January 3, 2010 at Giri Institute of Development Studies, Lucknow
Land Acquisition and Compensation:
Till nineties agricultural land in Dhawan and Shivpuri villages was about 216 and 147 bigha which
was owned by 35 and 27 households respectively. At the time of household survey it was
reported that from both Dhawan and Shivpuri villages about 83.0 and 45.0 per cent households
respectively sold their lands, partially or completely. From Dhawan village 66.7 per cent
agricultural land was sold while from Shivpuri village 58.2 per cent agricultural land was sold.
Since agricultural land in both the villages was not sufficient for proper livelihood, therefore from
very beginning majority of households were engaged in non-farm activities. Land sold to
Government was only due to compulsion as land owners were forced by the Government orders
to acquire the land. Since Government compensation was too low which ranged merely between
Rs.16,000 to 36,000 per bigha, land owners try to evade it or sell their land to private parties from
whom they get Rs.1,00,000 to Rs. 16,00,000 per bigha. Those land owners who were able to sell
their land privately were lucky which is reflected from their life style but contrary to that land
owners getting meager land compensation from Government remained poorer and poorer.
indiastat.com July - August, 2011 9 socio - economic voices
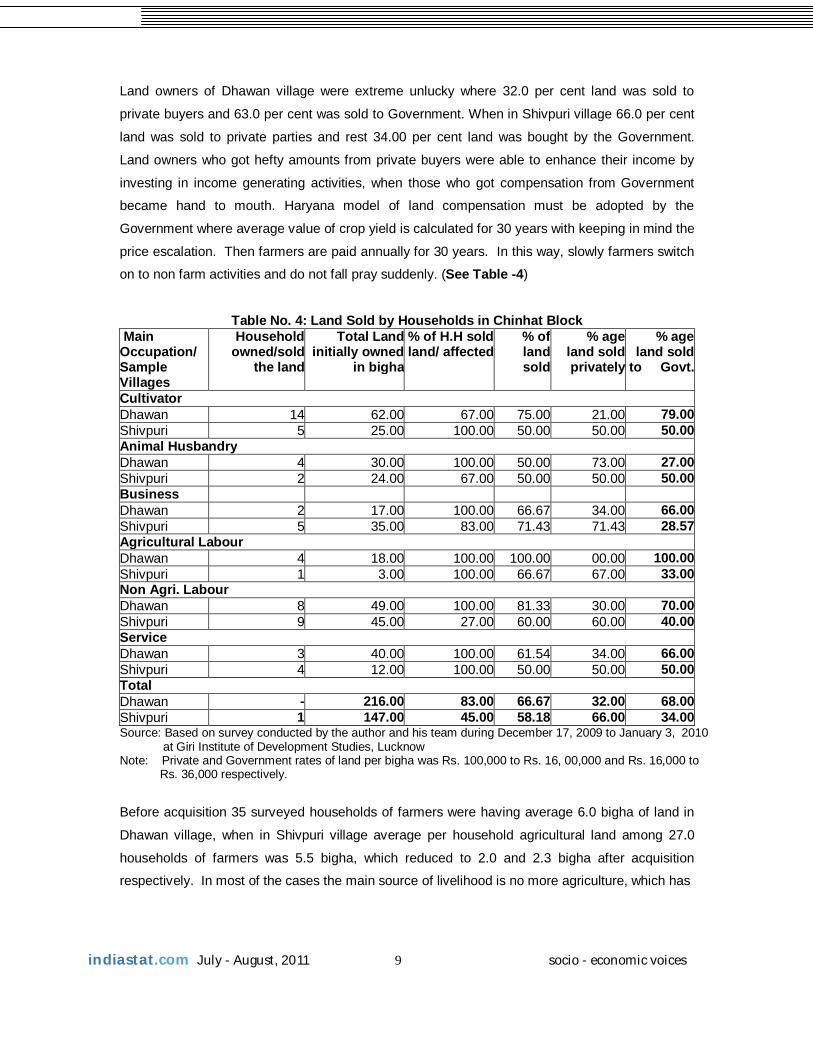
Land owners of Dhawan village were extreme unlucky where 32.0 per cent land was sold to
private buyers and 63.0 per cent was sold to Government. When in Shivpuri village 66.0 per cent
land was sold to private parties and rest 34.00 per cent land was bought by the Government.
Land owners who got hefty amounts from private buyers were able to enhance their income by
investing in income generating activities, when those who got compensation from Government
became hand to mouth. Haryana model of land compensation must be adopted by the
Government where average value of crop yield is calculated for 30 years with keeping in mind the
price escalation. Then farmers are paid annually for 30 years. In this way, slowly farmers switch
on to non farm activities and do not fall pray suddenly. (See Table -4)
Table No. 4: Land Sold by Households in Chinhat Block Main Occupation/ Sample Villages
Household owned/sold
the land
Total Land initially owned
in bigha
% of H.H sold land/ affected
% of land sold
% ageland sold privately
% age land sold to Govt.
Cultivator Dhawan 14 62.00 67.00 75.00 21.00 79.00Shivpuri 5 25.00 100.00 50.00 50.00 50.00Animal Husbandry Dhawan 4 30.00 100.00 50.00 73.00 27.00Shivpuri 2 24.00 67.00 50.00 50.00 50.00Business Dhawan 2 17.00 100.00 66.67 34.00 66.00Shivpuri 5 35.00 83.00 71.43 71.43 28.57Agricultural Labour Dhawan 4 18.00 100.00 100.00 00.00 100.00Shivpuri 1 3.00 100.00 66.67 67.00 33.00Non Agri. Labour Dhawan 8 49.00 100.00 81.33 30.00 70.00Shivpuri 9 45.00 27.00 60.00 60.00 40.00Service Dhawan 3 40.00 100.00 61.54 34.00 66.00Shivpuri 4 12.00 100.00 50.00 50.00 50.00Total Dhawan - 216.00 83.00 66.67 32.00 68.00Shivpuri 1 147.00 45.00 58.18 66.00 34.00Source: Based on survey conducted by the author and his team during December 17, 2009 to January 3, 2010 at Giri Institute of Development Studies, Lucknow Note: Private and Government rates of land per bigha was Rs. 100,000 to Rs. 16, 00,000 and Rs. 16,000 to Rs. 36,000 respectively.
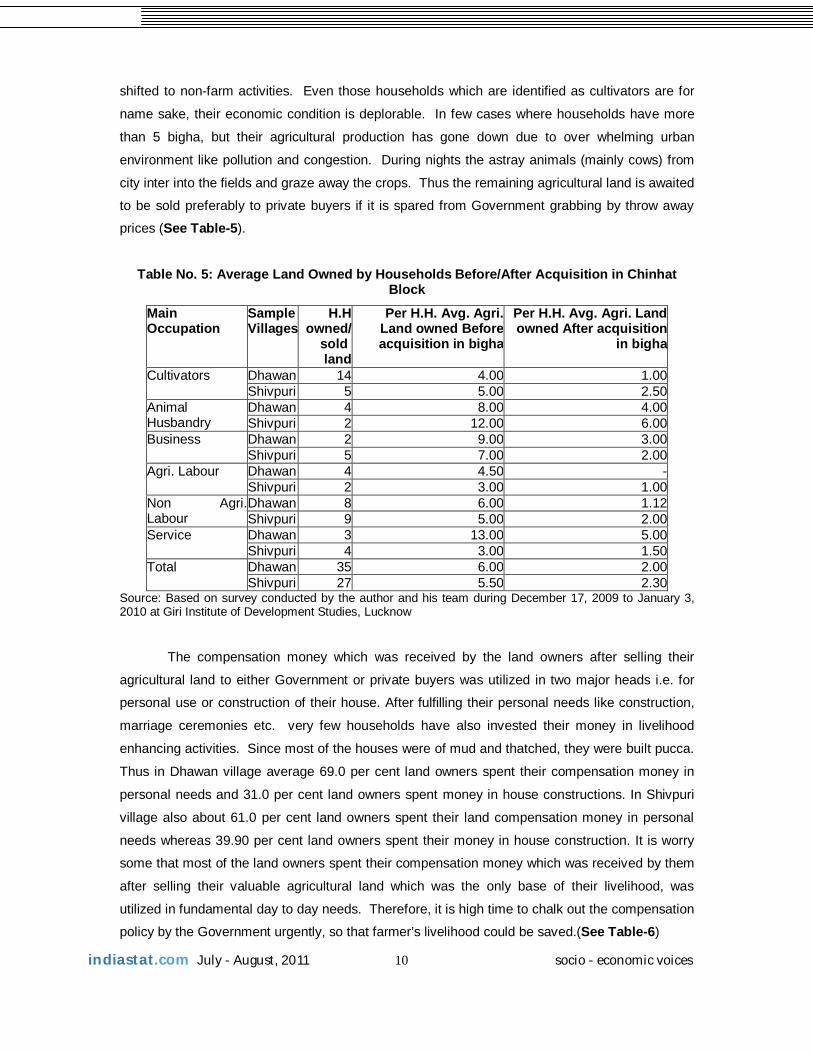
Before acquisition 35 surveyed households of farmers were having average 6.0 bigha of land in
Dhawan village, when in Shivpuri village average per household agricultural land among 27.0
households of farmers was 5.5 bigha, which reduced to 2.0 and 2.3 bigha after acquisition
respectively. In most of the cases the main source of livelihood is no more agriculture, which has
indiastat.com July - August, 2011 10 socio - economic voices
shifted to non-farm activities. Even those households which are identified as cultivators are for
name sake, their economic condition is deplorable. In few cases where households have more
than 5 bigha, but their agricultural production has gone down due to over whelming urban
environment like pollution and congestion. During nights the astray animals (mainly cows) from
city inter into the fields and graze away the crops. Thus the remaining agricultural land is awaited
to be sold preferably to private buyers if it is spared from Government grabbing by throw away
prices (See Table-5).
Table No. 5: Average Land Owned by Households Before/After Acquisition in Chinhat Block
Main Occupation
Sample Villages
H.H owned/
sold land
Per H.H. Avg. Agri. Land owned Before acquisition in bigha
Per H.H. Avg. Agri. Land owned After acquisition
in bigha
Cultivators Dhawan 14 4.00 1.00Shivpuri 5 5.00 2.50
Animal Husbandry
Dhawan 4 8.00 4.00Shivpuri 2 12.00 6.00
Business Dhawan 2 9.00 3.00Shivpuri 5 7.00 2.00
Agri. Labour
Dhawan 4 4.50 -Shivpuri 2 3.00 1.00
Non Agri. Labour
Dhawan 8 6.00 1.12Shivpuri 9 5.00 2.00
Service Dhawan 3 13.00 5.00Shivpuri 4 3.00 1.50
Total Dhawan 35 6.00 2.00Shivpuri 27 5.50 2.30
Source: Based on survey conducted by the author and his team during December 17, 2009 to January 3, 2010 at Giri Institute of Development Studies, Lucknow The compensation money which was received by the land owners after selling their
agricultural land to either Government or private buyers was utilized in two major heads i.e. for
personal use or construction of their house. After fulfilling their personal needs like construction,
marriage ceremonies etc. very few households have also invested their money in livelihood
enhancing activities. Since most of the houses were of mud and thatched, they were built pucca.
Thus in Dhawan village average 69.0 per cent land owners spent their compensation money in
personal needs and 31.0 per cent land owners spent money in house constructions. In Shivpuri
village also about 61.0 per cent land owners spent their land compensation money in personal
needs whereas 39.90 per cent land owners spent their money in house construction. It is worry
some that most of the land owners spent their compensation money which was received by them
after selling their valuable agricultural land which was the only base of their livelihood, was
utilized in fundamental day to day needs. Therefore, it is high time to chalk out the compensation
policy by the Government urgently, so that farmer’s livelihood could be saved.(See Table-6)
indiastat.com July - August, 2011 11 socio - economic voices
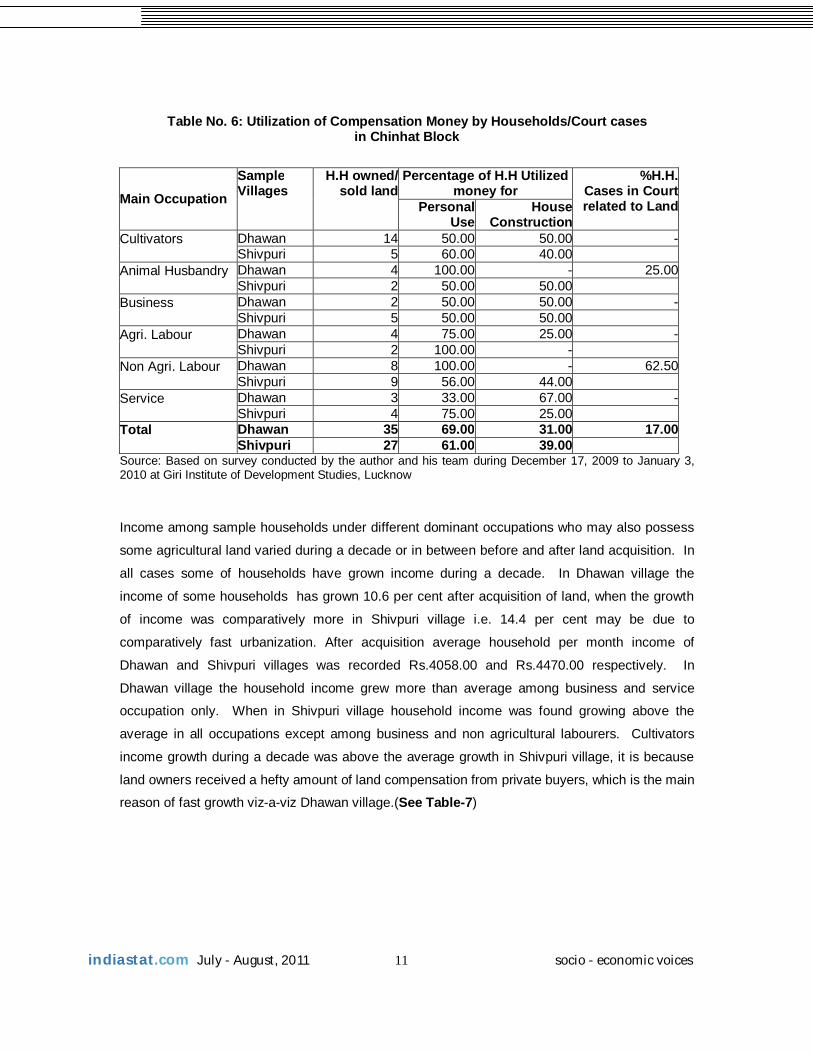
Table No. 6: Utilization of Compensation Money by Households/Court cases in Chinhat Block
Main Occupation
Sample Villages
H.H owned/ sold land
Percentage of H.H Utilized money for
%H.H.Cases in Court related to LandPersonal
Use House
ConstructionCultivators
Dhawan 14 50.00 50.00 -Shivpuri 5 60.00 40.00
Animal Husbandry
Dhawan 4 100.00 - 25.00Shivpuri 2 50.00 50.00
Business
Dhawan 2 50.00 50.00 -Shivpuri 5 50.00 50.00
Agri. Labour
Dhawan 4 75.00 25.00 -Shivpuri 2 100.00 -
Non Agri. Labour
Dhawan 8 100.00 - 62.50Shivpuri 9 56.00 44.00
Service
Dhawan 3 33.00 67.00 -Shivpuri 4 75.00 25.00
Total
Dhawan 35 69.00 31.00 17.00Shivpuri 27 61.00 39.00
Source: Based on survey conducted by the author and his team during December 17, 2009 to January 3, 2010 at Giri Institute of Development Studies, Lucknow
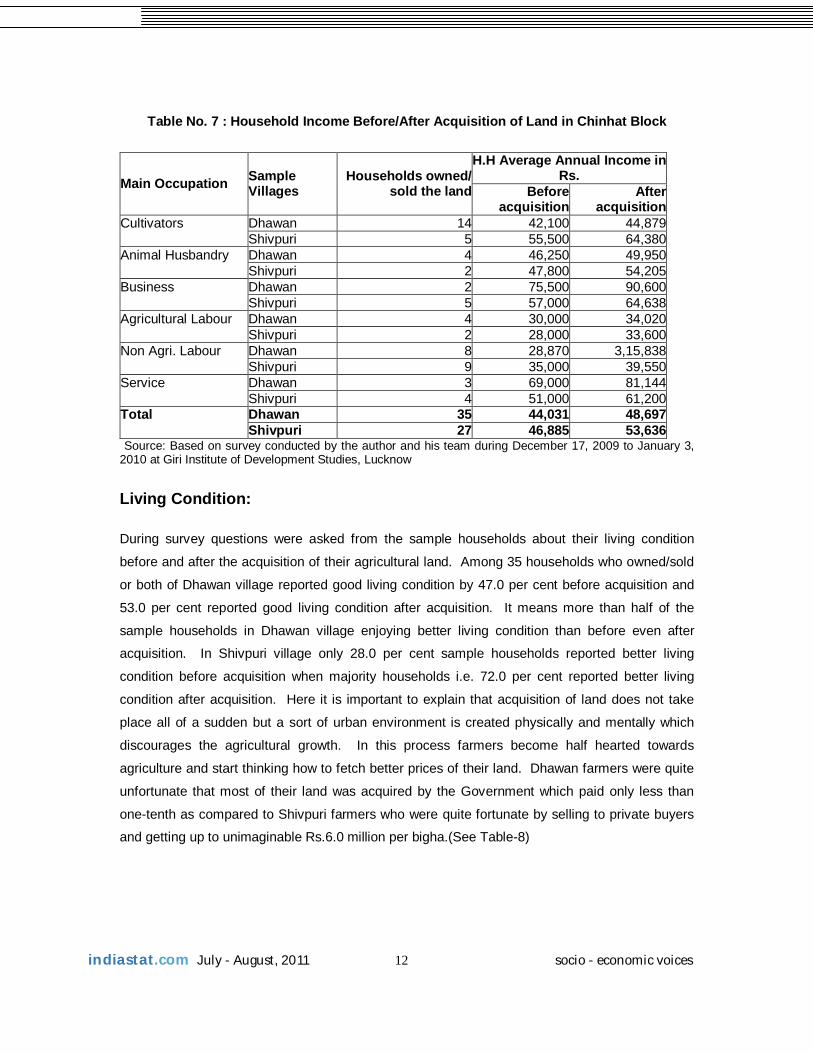
Income among sample households under different dominant occupations who may also possess
some agricultural land varied during a decade or in between before and after land acquisition. In
all cases some of households have grown income during a decade. In Dhawan village the
income of some households has grown 10.6 per cent after acquisition of land, when the growth
of income was comparatively more in Shivpuri village i.e. 14.4 per cent may be due to
comparatively fast urbanization. After acquisition average household per month income of
Dhawan and Shivpuri villages was recorded Rs.4058.00 and Rs.4470.00 respectively. In
Dhawan village the household income grew more than average among business and service
occupation only. When in Shivpuri village household income was found growing above the
average in all occupations except among business and non agricultural labourers. Cultivators
income growth during a decade was above the average growth in Shivpuri village, it is because
land owners received a hefty amount of land compensation from private buyers, which is the main
reason of fast growth viz-a-viz Dhawan village.(See Table-7)
indiastat.com July - August, 2011 12 socio - economic voices
Table No. 7 : Household Income Before/After Acquisition of Land in Chinhat Block
Main Occupation Sample Villages
Households owned/ sold the land
H.H Average Annual Income in Rs.
Before acquisition
After acquisition
Cultivators Dhawan 14 42,100 44,879Shivpuri 5 55,500 64,380
Animal Husbandry Dhawan 4 46,250 49,950Shivpuri 2 47,800 54,205
Business Dhawan 2 75,500 90,600Shivpuri 5 57,000 64,638
Agricultural Labour Dhawan 4 30,000 34,020Shivpuri 2 28,000 33,600
Non Agri. Labour Dhawan 8 28,870 3,15,838Shivpuri 9 35,000 39,550
Service Dhawan 3 69,000 81,144Shivpuri 4 51,000 61,200
Total Dhawan 35 44,031 48,697Shivpuri 27 46,885 53,636
Source: Based on survey conducted by the author and his team during December 17, 2009 to January 3, 2010 at Giri Institute of Development Studies, Lucknow
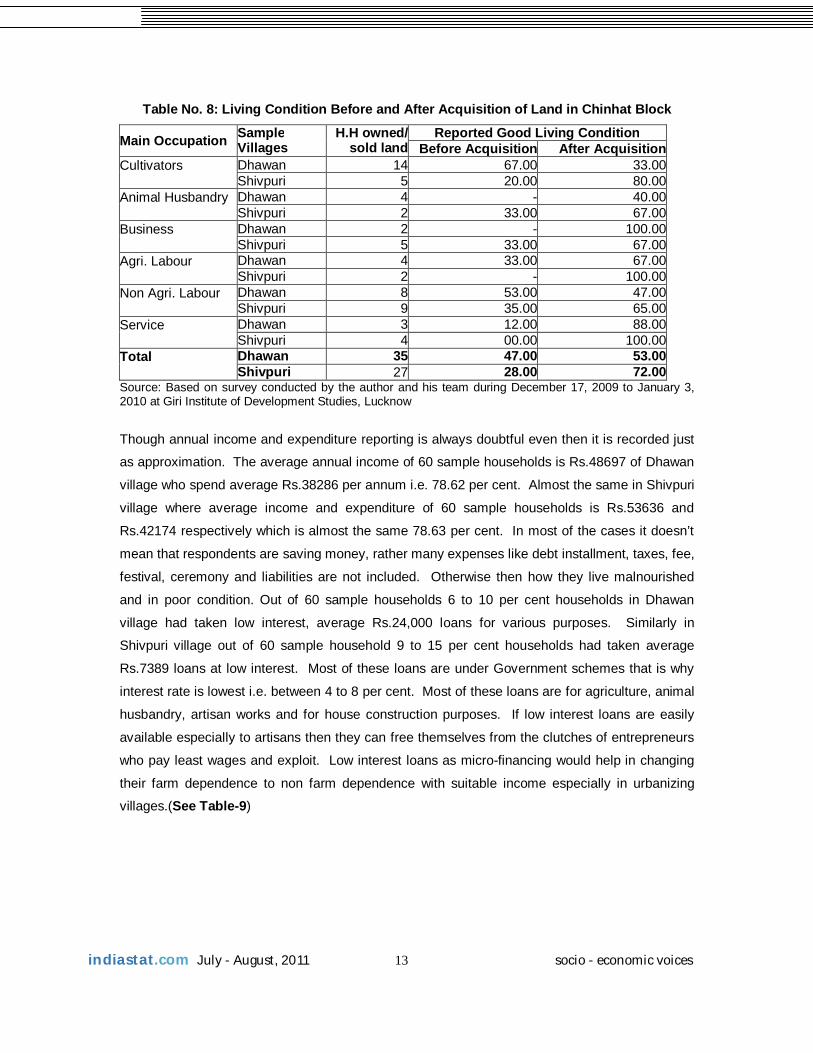
Living Condition: During survey questions were asked from the sample households about their living condition
before and after the acquisition of their agricultural land. Among 35 households who owned/sold
or both of Dhawan village reported good living condition by 47.0 per cent before acquisition and
53.0 per cent reported good living condition after acquisition. It means more than half of the
sample households in Dhawan village enjoying better living condition than before even after
acquisition. In Shivpuri village only 28.0 per cent sample households reported better living
condition before acquisition when majority households i.e. 72.0 per cent reported better living
condition after acquisition. Here it is important to explain that acquisition of land does not take
place all of a sudden but a sort of urban environment is created physically and mentally which
discourages the agricultural growth. In this process farmers become half hearted towards
agriculture and start thinking how to fetch better prices of their land. Dhawan farmers were quite
unfortunate that most of their land was acquired by the Government which paid only less than
one-tenth as compared to Shivpuri farmers who were quite fortunate by selling to private buyers
and getting up to unimaginable Rs.6.0 million per bigha.(See Table-8)
indiastat.com July - August, 2011 13 socio - economic voices
Table No. 8: Living Condition Before and After Acquisition of Land in Chinhat Block
Main Occupation Sample Villages
H.H owned/ sold land
Reported Good Living Condition Before Acquisition After Acquisition
Cultivators
Dhawan 14 67.00 33.00Shivpuri 5 20.00 80.00
Animal Husbandry
Dhawan 4 - 40.00Shivpuri 2 33.00 67.00
Business
Dhawan 2 - 100.00Shivpuri 5 33.00 67.00
Agri. Labour
Dhawan 4 33.00 67.00Shivpuri 2 - 100.00
Non Agri. Labour
Dhawan 8 53.00 47.00Shivpuri 9 35.00 65.00
Service
Dhawan 3 12.00 88.00Shivpuri 4 00.00 100.00
Total
Dhawan 35 47.00 53.00Shivpuri 27 28.00 72.00
Source: Based on survey conducted by the author and his team during December 17, 2009 to January 3, 2010 at Giri Institute of Development Studies, Lucknow
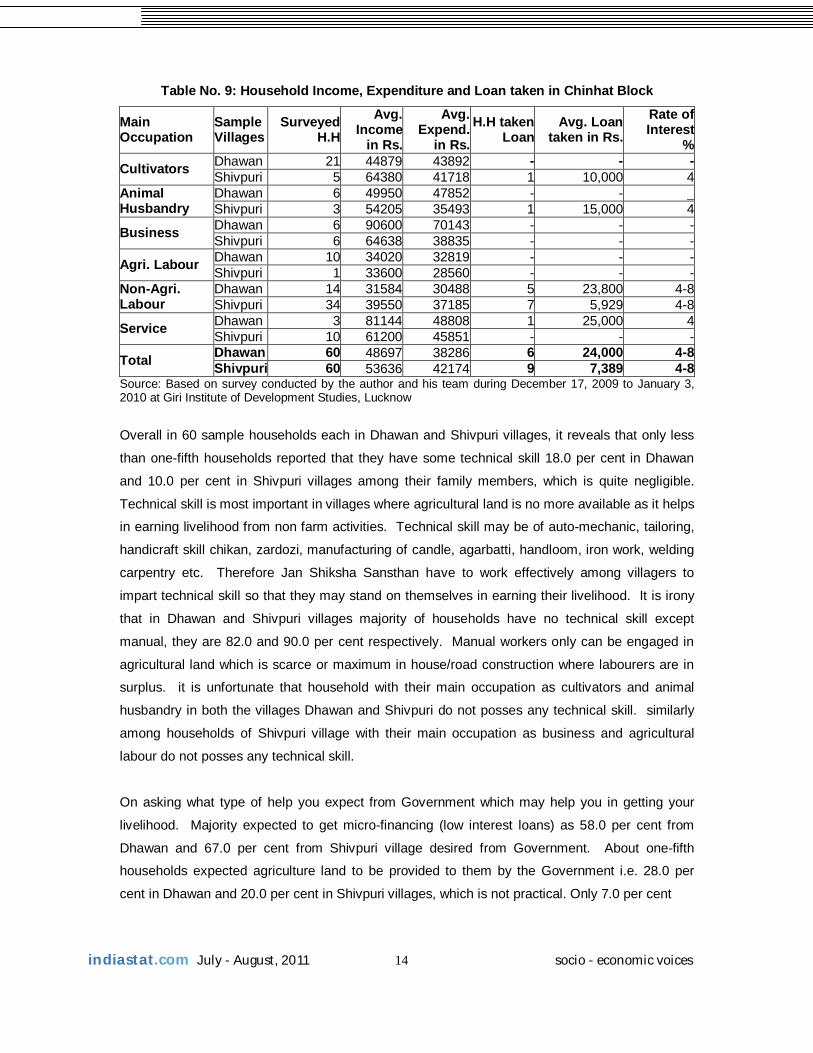
Though annual income and expenditure reporting is always doubtful even then it is recorded just
as approximation. The average annual income of 60 sample households is Rs.48697 of Dhawan
village who spend average Rs.38286 per annum i.e. 78.62 per cent. Almost the same in Shivpuri
village where average income and expenditure of 60 sample households is Rs.53636 and
Rs.42174 respectively which is almost the same 78.63 per cent. In most of the cases it doesn’t
mean that respondents are saving money, rather many expenses like debt installment, taxes, fee,
festival, ceremony and liabilities are not included. Otherwise then how they live malnourished
and in poor condition. Out of 60 sample households 6 to 10 per cent households in Dhawan
village had taken low interest, average Rs.24,000 loans for various purposes. Similarly in
Shivpuri village out of 60 sample household 9 to 15 per cent households had taken average
Rs.7389 loans at low interest. Most of these loans are under Government schemes that is why
interest rate is lowest i.e. between 4 to 8 per cent. Most of these loans are for agriculture, animal
husbandry, artisan works and for house construction purposes. If low interest loans are easily
available especially to artisans then they can free themselves from the clutches of entrepreneurs
who pay least wages and exploit. Low interest loans as micro-financing would help in changing
their farm dependence to non farm dependence with suitable income especially in urbanizing
villages.(See Table-9)
indiastat.com July - August, 2011 14 socio - economic voices
Table No. 9: Household Income, Expenditure and Loan taken in Chinhat Block
Main Occupation
Sample Villages
Surveyed H.H
Avg. Income
in Rs.
Avg. Expend.
in Rs. H.H taken
LoanAvg. Loan
taken in Rs.Rate of Interest
%
Cultivators Dhawan 21 44879 43892 - - -Shivpuri 5 64380 41718 1 10,000 4
Animal Husbandry
Dhawan 6 49950 47852 - - _Shivpuri 3 54205 35493 1 15,000 4
Business Dhawan 6 90600 70143 - - -Shivpuri 6 64638 38835 - - -
Agri. Labour Dhawan 10 34020 32819 - - -Shivpuri 1 33600 28560 - - -
Non-Agri. Labour
Dhawan 14 31584 30488 5 23,800 4-8Shivpuri 34 39550 37185 7 5,929 4-8
Service Dhawan 3 81144 48808 1 25,000 4Shivpuri 10 61200 45851 - - -
Total Dhawan 60 48697 38286 6 24,000 4-8Shivpuri 60 53636 42174 9 7,389 4-8
Source: Based on survey conducted by the author and his team during December 17, 2009 to January 3, 2010 at Giri Institute of Development Studies, Lucknow
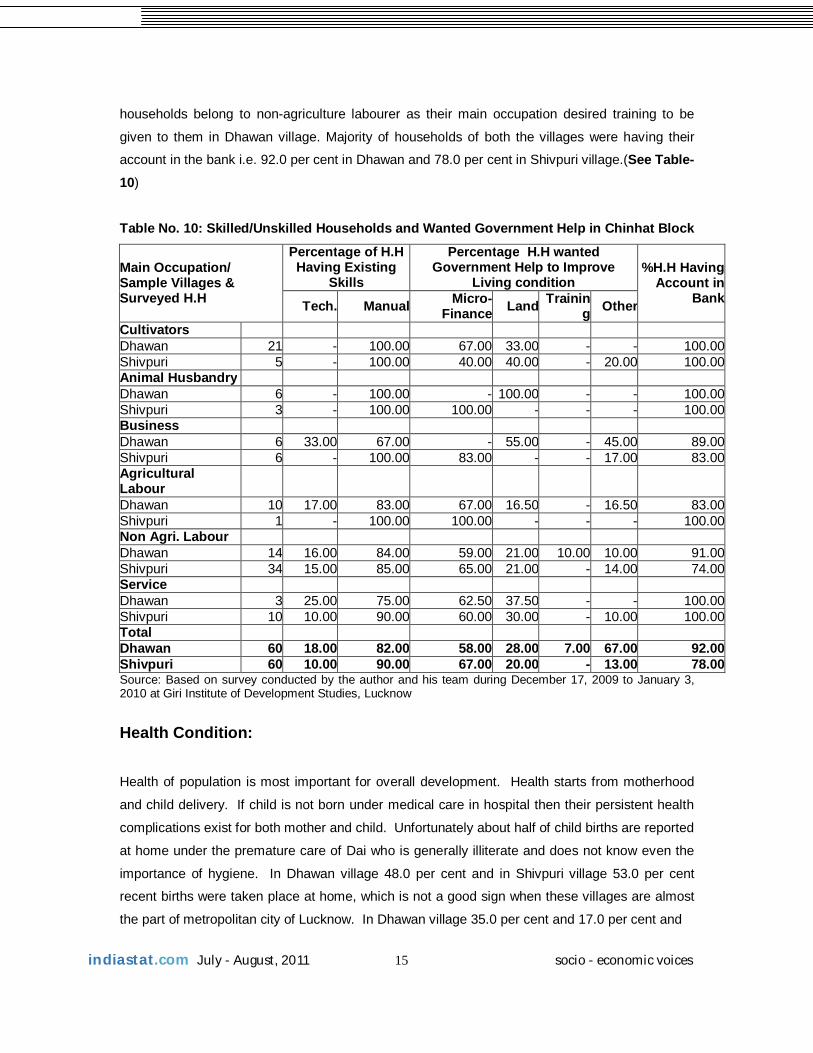
Overall in 60 sample households each in Dhawan and Shivpuri villages, it reveals that only less
than one-fifth households reported that they have some technical skill 18.0 per cent in Dhawan
and 10.0 per cent in Shivpuri villages among their family members, which is quite negligible.
Technical skill is most important in villages where agricultural land is no more available as it helps
in earning livelihood from non farm activities. Technical skill may be of auto-mechanic, tailoring,
handicraft skill chikan, zardozi, manufacturing of candle, agarbatti, handloom, iron work, welding
carpentry etc. Therefore Jan Shiksha Sansthan have to work effectively among villagers to
impart technical skill so that they may stand on themselves in earning their livelihood. It is irony
that in Dhawan and Shivpuri villages majority of households have no technical skill except
manual, they are 82.0 and 90.0 per cent respectively. Manual workers only can be engaged in
agricultural land which is scarce or maximum in house/road construction where labourers are in
surplus. it is unfortunate that household with their main occupation as cultivators and animal
husbandry in both the villages Dhawan and Shivpuri do not posses any technical skill. similarly
among households of Shivpuri village with their main occupation as business and agricultural
labour do not posses any technical skill.
On asking what type of help you expect from Government which may help you in getting your
livelihood. Majority expected to get micro-financing (low interest loans) as 58.0 per cent from
Dhawan and 67.0 per cent from Shivpuri village desired from Government. About one-fifth
households expected agriculture land to be provided to them by the Government i.e. 28.0 per
cent in Dhawan and 20.0 per cent in Shivpuri villages, which is not practical. Only 7.0 per cent
indiastat.com July - August, 2011 15 socio - economic voices
households belong to non-agriculture labourer as their main occupation desired training to be
given to them in Dhawan village. Majority of households of both the villages were having their
account in the bank i.e. 92.0 per cent in Dhawan and 78.0 per cent in Shivpuri village.(See Table-10)
Table No. 10: Skilled/Unskilled Households and Wanted Government Help in Chinhat Block
Main Occupation/ Sample Villages & Surveyed H.H
Percentage of H.H Having Existing
Skills
Percentage H.H wanted Government Help to Improve
Living condition %H.H Having
Account in BankTech. Manual Micro-
Finance Land Training Other
Cultivators Dhawan 21 - 100.00 67.00 33.00 - - 100.00Shivpuri 5 - 100.00 40.00 40.00 - 20.00 100.00Animal Husbandry Dhawan 6 - 100.00 - 100.00 - - 100.00Shivpuri 3 - 100.00 100.00 - - - 100.00Business Dhawan 6 33.00 67.00 - 55.00 - 45.00 89.00Shivpuri 6 - 100.00 83.00 - - 17.00 83.00Agricultural Labour
Dhawan 10 17.00 83.00 67.00 16.50 - 16.50 83.00Shivpuri 1 - 100.00 100.00 - - - 100.00Non Agri. Labour Dhawan 14 16.00 84.00 59.00 21.00 10.00 10.00 91.00Shivpuri 34 15.00 85.00 65.00 21.00 - 14.00 74.00Service Dhawan 3 25.00 75.00 62.50 37.50 - - 100.00Shivpuri 10 10.00 90.00 60.00 30.00 - 10.00 100.00Total Dhawan 60 18.00 82.00 58.00 28.00 7.00 67.00 92.00Shivpuri 60 10.00 90.00 67.00 20.00 - 13.00 78.00Source: Based on survey conducted by the author and his team during December 17, 2009 to January 3, 2010 at Giri Institute of Development Studies, Lucknow
Health Condition:
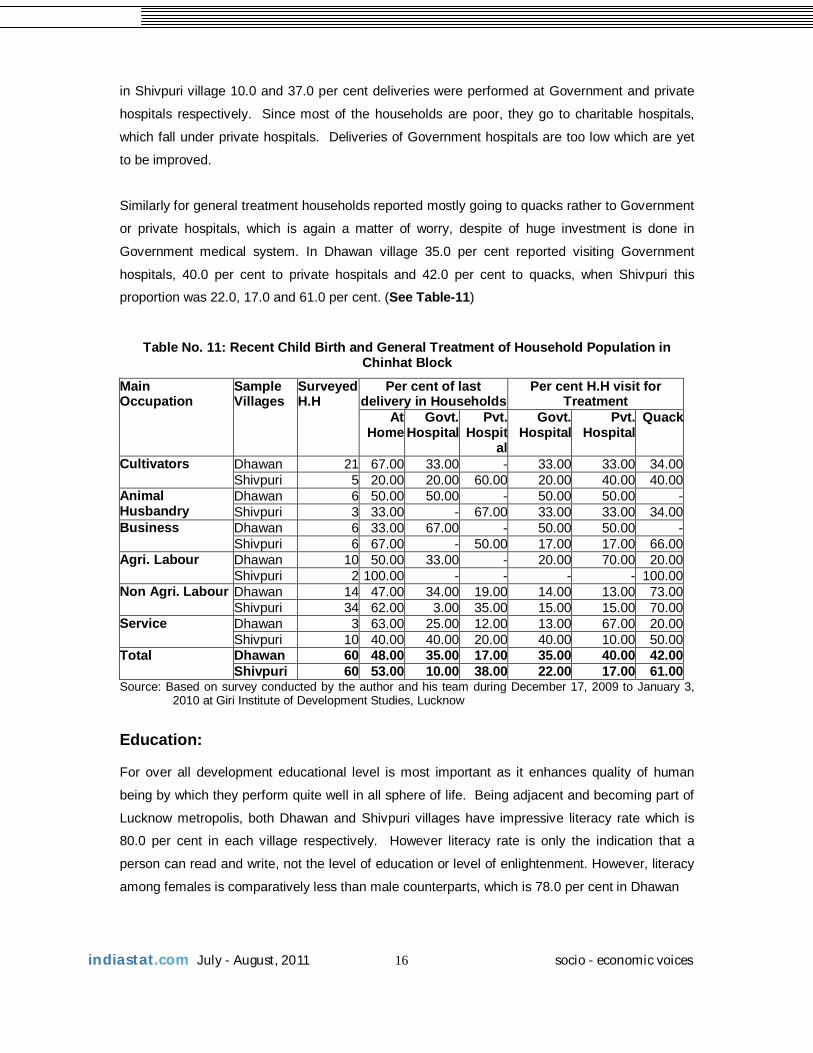
Health of population is most important for overall development. Health starts from motherhood
and child delivery. If child is not born under medical care in hospital then their persistent health
complications exist for both mother and child. Unfortunately about half of child births are reported
at home under the premature care of Dai who is generally illiterate and does not know even the
importance of hygiene. In Dhawan village 48.0 per cent and in Shivpuri village 53.0 per cent
recent births were taken place at home, which is not a good sign when these villages are almost
the part of metropolitan city of Lucknow. In Dhawan village 35.0 per cent and 17.0 per cent and
indiastat.com July - August, 2011 16 socio - economic voices
in Shivpuri village 10.0 and 37.0 per cent deliveries were performed at Government and private
hospitals respectively. Since most of the households are poor, they go to charitable hospitals,
which fall under private hospitals. Deliveries of Government hospitals are too low which are yet
to be improved.
Similarly for general treatment households reported mostly going to quacks rather to Government
or private hospitals, which is again a matter of worry, despite of huge investment is done in
Government medical system. In Dhawan village 35.0 per cent reported visiting Government
hospitals, 40.0 per cent to private hospitals and 42.0 per cent to quacks, when Shivpuri this
proportion was 22.0, 17.0 and 61.0 per cent. (See Table-11)
Table No. 11: Recent Child Birth and General Treatment of Household Population in
Chinhat Block
Main Occupation
Sample Villages
Surveyed H.H
Per cent of last delivery in Households
Per cent H.H visit for Treatment
AtHome
Govt. Hospital
Pvt.Hospit
al
Govt. Hospital
Pvt.Hospital
Quack
Cultivators
Dhawan 21 67.00 33.00 - 33.00 33.00 34.00Shivpuri 5 20.00 20.00 60.00 20.00 40.00 40.00
Animal Husbandry
Dhawan 6 50.00 50.00 - 50.00 50.00 -Shivpuri 3 33.00 - 67.00 33.00 33.00 34.00
Business
Dhawan 6 33.00 67.00 - 50.00 50.00 -Shivpuri 6 67.00 - 50.00 17.00 17.00 66.00
Agri. Labour
Dhawan 10 50.00 33.00 - 20.00 70.00 20.00Shivpuri 2 100.00 - - - - 100.00
Non Agri. Labour
Dhawan 14 47.00 34.00 19.00 14.00 13.00 73.00Shivpuri 34 62.00 3.00 35.00 15.00 15.00 70.00
Service
Dhawan 3 63.00 25.00 12.00 13.00 67.00 20.00Shivpuri 10 40.00 40.00 20.00 40.00 10.00 50.00
Total Dhawan 60 48.00 35.00 17.00 35.00 40.00 42.00Shivpuri 60 53.00 10.00 38.00 22.00 17.00 61.00
Source: Based on survey conducted by the author and his team during December 17, 2009 to January 3, 2010 at Giri Institute of Development Studies, Lucknow
Education: For over all development educational level is most important as it enhances quality of human
being by which they perform quite well in all sphere of life. Being adjacent and becoming part of
Lucknow metropolis, both Dhawan and Shivpuri villages have impressive literacy rate which is
80.0 per cent in each village respectively. However literacy rate is only the indication that a
person can read and write, not the level of education or level of enlightenment. However, literacy
among females is comparatively less than male counterparts, which is 78.0 per cent in Dhawan
indiastat.com July - August, 2011 17 socio - economic voices
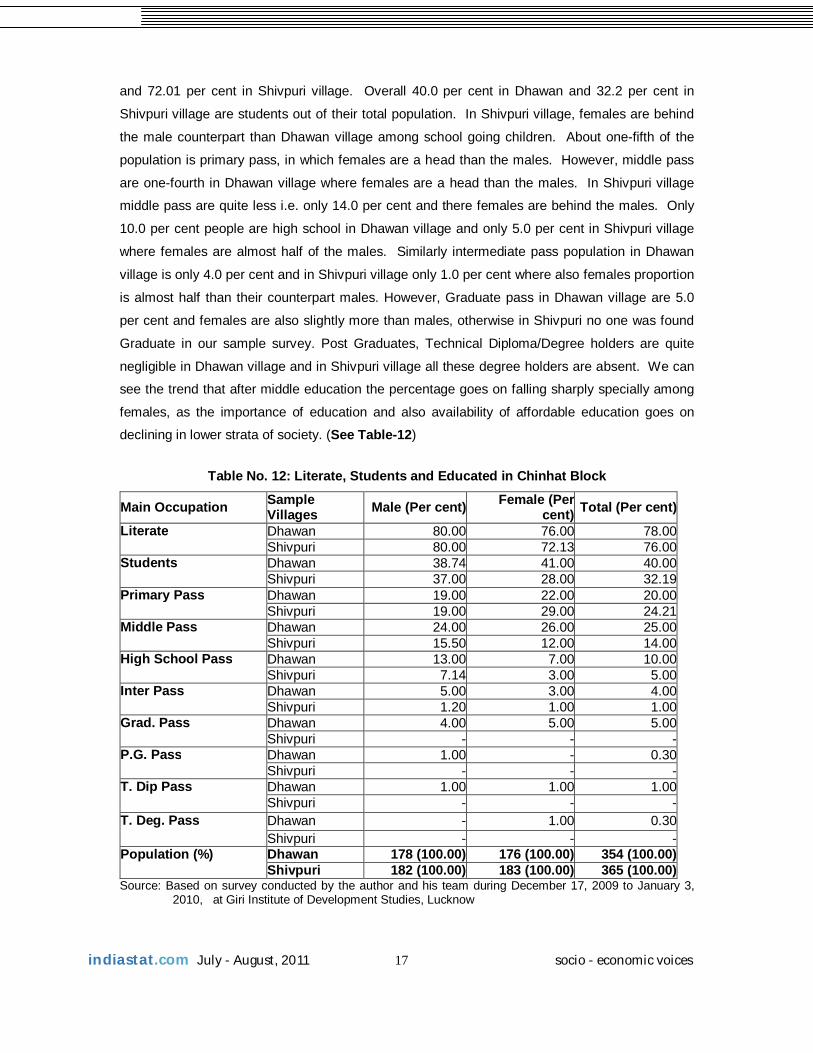
and 72.01 per cent in Shivpuri village. Overall 40.0 per cent in Dhawan and 32.2 per cent in
Shivpuri village are students out of their total population. In Shivpuri village, females are behind
the male counterpart than Dhawan village among school going children. About one-fifth of the
population is primary pass, in which females are a head than the males. However, middle pass
are one-fourth in Dhawan village where females are a head than the males. In Shivpuri village
middle pass are quite less i.e. only 14.0 per cent and there females are behind the males. Only
10.0 per cent people are high school in Dhawan village and only 5.0 per cent in Shivpuri village
where females are almost half of the males. Similarly intermediate pass population in Dhawan
village is only 4.0 per cent and in Shivpuri village only 1.0 per cent where also females proportion
is almost half than their counterpart males. However, Graduate pass in Dhawan village are 5.0
per cent and females are also slightly more than males, otherwise in Shivpuri no one was found
Graduate in our sample survey. Post Graduates, Technical Diploma/Degree holders are quite
negligible in Dhawan village and in Shivpuri village all these degree holders are absent. We can
see the trend that after middle education the percentage goes on falling sharply specially among
females, as the importance of education and also availability of affordable education goes on
declining in lower strata of society. (See Table-12)
Table No. 12: Literate, Students and Educated in Chinhat Block
Main Occupation Sample Villages Male (Per cent) Female (Per
cent) Total (Per cent)
Literate
Dhawan 80.00 76.00 78.00Shivpuri 80.00 72.13 76.00
Students
Dhawan 38.74 41.00 40.00Shivpuri 37.00 28.00 32.19
Primary Pass
Dhawan 19.00 22.00 20.00Shivpuri 19.00 29.00 24.21
Middle Pass
Dhawan 24.00 26.00 25.00Shivpuri 15.50 12.00 14.00
High School Pass
Dhawan 13.00 7.00 10.00Shivpuri 7.14 3.00 5.00
Inter Pass
Dhawan 5.00 3.00 4.00Shivpuri 1.20 1.00 1.00
Grad. Pass
Dhawan 4.00 5.00 5.00Shivpuri - - -
P.G. Pass
Dhawan 1.00 - 0.30Shivpuri - - -
T. Dip Pass
Dhawan 1.00 1.00 1.00Shivpuri - - -
T. Deg. Pass
Dhawan - 1.00 0.30Shivpuri - - -
Population (%)
Dhawan 178 (100.00) 176 (100.00) 354 (100.00)Shivpuri 182 (100.00) 183 (100.00) 365 (100.00)
Source: Based on survey conducted by the author and his team during December 17, 2009 to January 3, 2010, at Giri Institute of Development Studies, Lucknow
indiastat.com July - August, 2011 18 socio - economic voices
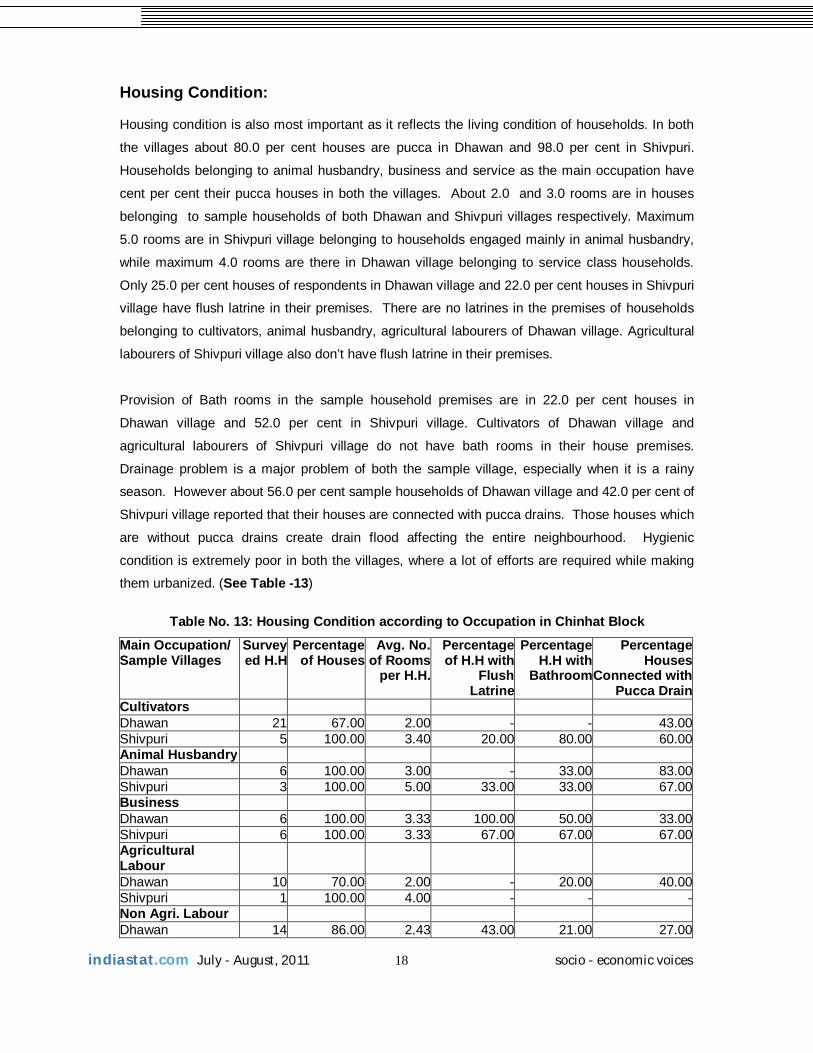
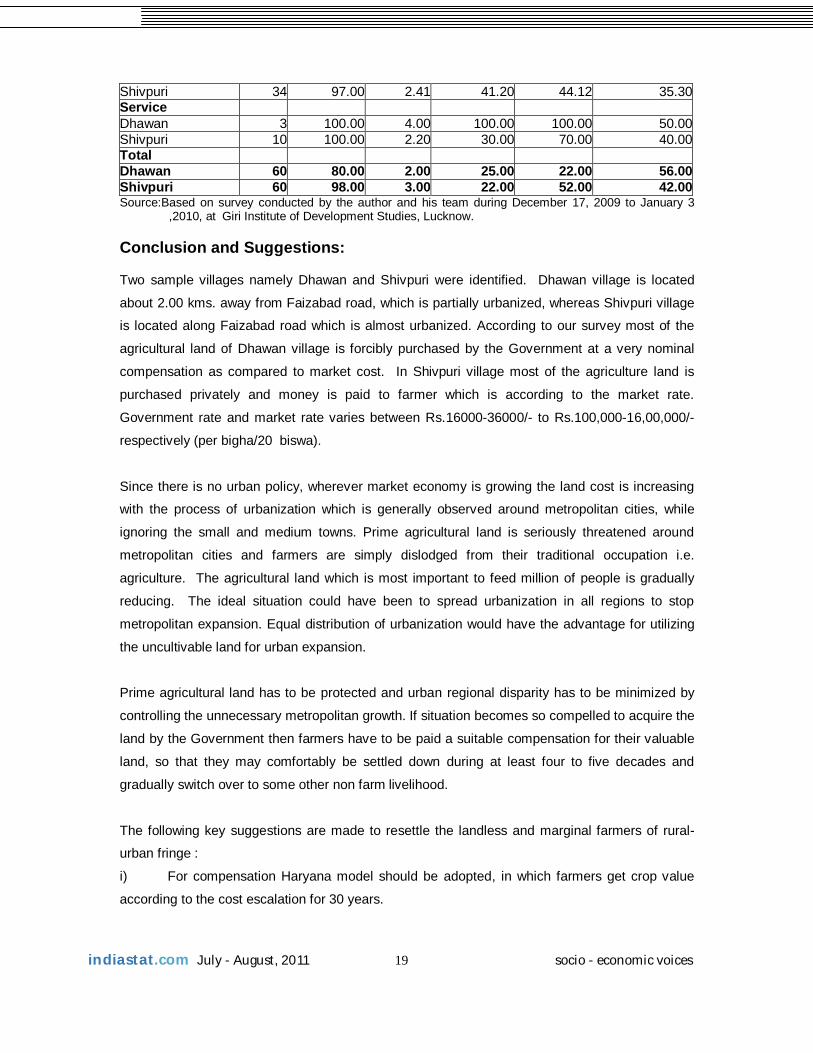
Housing Condition: Housing condition is also most important as it reflects the living condition of households. In both
the villages about 80.0 per cent houses are pucca in Dhawan and 98.0 per cent in Shivpuri.
Households belonging to animal husbandry, business and service as the main occupation have
cent per cent their pucca houses in both the villages. About 2.0 and 3.0 rooms are in houses
belonging to sample households of both Dhawan and Shivpuri villages respectively. Maximum
5.0 rooms are in Shivpuri village belonging to households engaged mainly in animal husbandry,
while maximum 4.0 rooms are there in Dhawan village belonging to service class households.
Only 25.0 per cent houses of respondents in Dhawan village and 22.0 per cent houses in Shivpuri
village have flush latrine in their premises. There are no latrines in the premises of households
belonging to cultivators, animal husbandry, agricultural labourers of Dhawan village. Agricultural
labourers of Shivpuri village also don’t have flush latrine in their premises.
Provision of Bath rooms in the sample household premises are in 22.0 per cent houses in
Dhawan village and 52.0 per cent in Shivpuri village. Cultivators of Dhawan village and
agricultural labourers of Shivpuri village do not have bath rooms in their house premises.
Drainage problem is a major problem of both the sample village, especially when it is a rainy
season. However about 56.0 per cent sample households of Dhawan village and 42.0 per cent of
Shivpuri village reported that their houses are connected with pucca drains. Those houses which
are without pucca drains create drain flood affecting the entire neighbourhood. Hygienic
condition is extremely poor in both the villages, where a lot of efforts are required while making
them urbanized. (See Table -13)
Table No. 13: Housing Condition according to Occupation in Chinhat Block
Main Occupation/ Sample Villages
Surveyed H.H
Percentage of Houses
Avg. No. of Rooms
per H.H.
Percentage of H.H with
Flush Latrine
Percentage H.H with
Bathroom
Percentage Houses
Connected with Pucca Drain
Cultivators Dhawan 21 67.00 2.00 - - 43.00Shivpuri 5 100.00 3.40 20.00 80.00 60.00Animal Husbandry Dhawan 6 100.00 3.00 - 33.00 83.00Shivpuri 3 100.00 5.00 33.00 33.00 67.00Business Dhawan 6 100.00 3.33 100.00 50.00 33.00Shivpuri 6 100.00 3.33 67.00 67.00 67.00Agricultural Labour
Dhawan 10 70.00 2.00 - 20.00 40.00Shivpuri 1 100.00 4.00 - - -Non Agri. Labour Dhawan 14 86.00 2.43 43.00 21.00 27.00
indiastat.com July - August, 2011 19 socio - economic voices
Shivpuri 34 97.00 2.41 41.20 44.12 35.30Service Dhawan 3 100.00 4.00 100.00 100.00 50.00Shivpuri 10 100.00 2.20 30.00 70.00 40.00Total Dhawan 60 80.00 2.00 25.00 22.00 56.00Shivpuri 60 98.00 3.00 22.00 52.00 42.00Source:Based on survey conducted by the author and his team during December 17, 2009 to January 3
,2010, at Giri Institute of Development Studies, Lucknow. Conclusion and Suggestions: Two sample villages namely Dhawan and Shivpuri were identified. Dhawan village is located
about 2.00 kms. away from Faizabad road, which is partially urbanized, whereas Shivpuri village
is located along Faizabad road which is almost urbanized. According to our survey most of the
agricultural land of Dhawan village is forcibly purchased by the Government at a very nominal
compensation as compared to market cost. In Shivpuri village most of the agriculture land is
purchased privately and money is paid to farmer which is according to the market rate.
Government rate and market rate varies between Rs.16000-36000/- to Rs.100,000-16,00,000/-
respectively (per bigha/20 biswa).
Since there is no urban policy, wherever market economy is growing the land cost is increasing
with the process of urbanization which is generally observed around metropolitan cities, while
ignoring the small and medium towns. Prime agricultural land is seriously threatened around
metropolitan cities and farmers are simply dislodged from their traditional occupation i.e.
agriculture. The agricultural land which is most important to feed million of people is gradually
reducing. The ideal situation could have been to spread urbanization in all regions to stop
metropolitan expansion. Equal distribution of urbanization would have the advantage for utilizing
the uncultivable land for urban expansion.
Prime agricultural land has to be protected and urban regional disparity has to be minimized by
controlling the unnecessary metropolitan growth. If situation becomes so compelled to acquire the
land by the Government then farmers have to be paid a suitable compensation for their valuable
land, so that they may comfortably be settled down during at least four to five decades and
gradually switch over to some other non farm livelihood.
The following key suggestions are made to resettle the landless and marginal farmers of rural-
urban fringe :
i) For compensation Haryana model should be adopted, in which farmers get crop value
according to the cost escalation for 30 years.
indiastat.com July - August, 2011 20 socio - economic voices
ii) Working age population should be identified and they should be trained in non-farm
activities so that they may change their source of livelihood. Jan Shikshan Sansthan (JSS) can
serve the purpose.
iii) Similar to Kisan Credit Card (KCC) Shilpkar Credit Card (SCC) must be introduced to
avoid procedural complication like in SHG formation etc.
iv) School age children should be given scholarship up to High School to compulsorily go to
school and desist of becoming the child labour.
References
Bansal, S.C. (1975), Town Country Relationship in Saharanpur City- Region- a Study in Rural
Urban Interdependence Problems, Sanjeev Prakashan, Saharanpur
Bryant, C.R., I.R. Russwurm & A.G. Mclellan (1982), The City’s Countryside: Land and its
Management in the Rural-urban Fringe, Longman, London
Das Gupta, K. (2000), Is the Joyride Over? Down to Earth, Centre for Science and
Environment, Vol. 9(6), New Delhi
Fazal, S (1998), Agricultural Production and Price Mechanism, Chugh Publications, Allahabad
Fazal, S. (2001) The Need For Preserving Our Farm Lands. A Case Study from a Predominantly
Agrarian Economy. Landscape and Urban Planning, Vol. 55, No.1, Elsevier Science Publication,
United Kingdom.
Jafri, S.S.A.(2003), India’s Rural Habitat in Need of Rejuvenation, Geographical Review of India,
Vol.65, No.2, Calcutta
Jafri, S.S.A.(2006), Levels of Civic amenities in Urban Settlements of Avadh Region of Uttar
Pradesh, Urban Panorama, Vol.V, No.2, Lucknow
Jafri,S.S.A. (2008), Urbanization in Uttar Pradesh, Urban Panorama, Vol.VII, No.2, Lucknow
Master Plan 2021, Lucknow, Town and Country Planning Department, LDA, Lucknow
indiastat.com July - August, 2011 21 socio - economic voices
Nangia, S. (1976), Delhi Metropolitan Region, a study in settlement geography, K.B. Publishing
House, New Delhi.
Ranade, A. and Dev, M.S. (1998) Agriculture and Rural Development, India development Report,
Oxford University Press, New Delhi
Shafi, M. (1969) Land Use Planning land Classification and Land Capability: Methods and
Techniques, The Geographer, Aligarh
Schenk, H. (1997), The Rurban Fringe: a Central area Between Region and City: the Case of
Bangalore, India. in: M. Chatterji & Y. Kaizhang, Regional Science in Developing Countries, New,
MacMillan, New York
Thakur, B. (1991), Land Utilization and Urbanization, The Rural-Urban Fringe, Deep & Deep,
New Delhi.
Yadav, C.S. (1987), Rural-urban Fringe. Concept Publication, New Delhi