Embed Size (px)
Citation preview

2008 vf
Acquiring Luminescence Spectra using
the ARC –NCL Spectral Measurement
System + Boxcar Integrator

2008 vf
Disclaimer
Safety –the first !!! This presentation is not manual. It is just brief
set of rule to remind procedure for simple measurements. You should read manual first.
Notwithstanding any language to the contrary, nothing contained herein constitutes, nor is intended to
constitute, an offer, inducement, promise, or contract of any kind. The data contained herein are for informational purposes only and are not represented to be error free. Any links to non-UAB information are provided as a courtesy. They are not intended to constitute, nor do they constitute, an endorsement of the linked materials by the University of Alabama at Birmingham.

2008 vf
Luminescence
Chemoluminescence, is the emission of light as the
result of a chemical reaction
For example, the following types of luminescence caused by different
excitation processes could be classified as :
Light production in fireflies is due to a type of chemical reaction
called bioluminescence
is a process in which an excited material emits light (electromagnetic radiation)
Photoluminescence ( PL) is a process in which a
material absorbs photons (electromagnetic radiation)
and then re-radiates photons Banknote photoluminescence after excitation by UV
light from flash lamp
Electroluminescence (EL) is an process in which a material
emits light in response to an electric current passed through it,
or to a strong electric field.
Infrared electroluminescence of photodiode in the
remote is stimulated by electrical current

2008 vf
Parameters of the Luminescence
The luminescence quantum yield gives the efficiency of the
luminescence. It is defined as the ratio of the number of photons
emitted to the number of photons absorbed.
Luminescence lifetime refers to the average time the molecule/ion
stays in its excited state before emitting a photon (or how long
luminescence could be observed)
Luminescence spectra shows how intensity of the luminescence
depends on wavelength
Goal of the Lab: Measuring of the Luminescence spectra using
ARC –NCL Spectral System

2008 vf
Experiment Background
1. First of all, we need excitation source to transfer our sample into
excited (high energy ) state. Here we will consider only optical
excitation. It means that we will use optical radiation to excite
the sample.
2. Second, we need an optical system to collect the luminescence
and direct it to the detector. Also we need to select
luminescence from the excitation radiation. For these purposes
we can use optical filter or monochromator which can help
select radiation only at required wavelength.
3. We need to detect optical signal ( convert intensity of the optical
radiation into electrical signals) and then convert signal into
digital format

2008 vf
sample
Spectra Pro 300i
Registration
system
Detector
Experimental setup (Principal Scheme )
Triggering signal
To
An
alog
-Dig
ital Co
nv
erter
grating turret
DC signal
SpectraPro-300i
Control Unit (NCL)
Pulse signal

2008 vf
Requirements to optical excitation
A wavelength of the optical excitation pulses should be within absorption band
of the studied samples !!!
30ps 7ns
Available commercial tunable solid-state lasers
OPO Ekspla OPO Spectra Physics
60-100ns
Typical curve of the
Alexandrite laser

2008 vf
Optical Setup
sample
Optical
Excitation
pulses
Spectra Pro 300i
1 ) Avoid reflection of the excitation radiation to the measurement system!!!
L2 L1
2 ) Acceptance angle of Spectra Pro300i is =1/4. Therefore lens
diameter should be D>L (for L2=L1=2F configuration D>F/2)
=1/4
Input slits
Optical
Detector
Output slits

2008 vf
Operating Ranges for Judson Technologies detectors
How to Choose a Detector ? A optical detector should convert luminescence of the sample into a
electrical signal.
Therefore the major requirement to the optical
detector : to be sensitive at the wavelength of the to
the luminescence photons
Attention, these detectors should cooled by liquid Nitrogen !!!

2008 vf
Operating Ranges for ARC detectors

2008 vf
Boxcar Integrator
Lock-in Amplifier Input Signal
Optical Detector
V
t
Ts
Tr
V
t
Ts
Tr
Ts<< Tr
Ts Tr
depends on the ratio of the signal duration (Ts) and period
between pulses (Tr ); duty cycle
Two type of the electronic registration system
Lock-in Amplifier for signals when Ts Tr
Boxcar Integrator for signals when Ts<< Tr
DC
signal

2008 vf
Experiments with
Boxcar Integrator
A gated integrator (also called a boxcar integrator or averager) integrates an
analytical signal over a fixed time window. In pulsed experiments the
integrator gate is synchronized with the analytical signal by a trigger. This
method increases the signal-to-noise ratio by recording the voltage only
when the signal is present, and ignoring time periods when there is no signal
and only noise.

2008 vf
Spectra Pro 300i
Focal length: 300 mm
Aperture ratio: f / 4
Optical design: Czerny – Turner
Grating size: 68 x 68 mm
Grating mount: triple-grating turre
Grating #1 300gr/mm (blaze=) (max=5.6)
Grating #2 600 gr/mm (blaze=) (max=2.8)
Grating #3 150 gr/mm (blaze=) (max=11.2)
Standard slits: adjustable
from 10 μm to 3 mm wide;
Output slits
Input slits
Linear dispersion (nm/mm)@500 nm :
11- Grating #1 300gr/mm
5- Grating #2 600 gr/mm
21- Grating #3 150 gr/mm

2008 vf
To Spectrometer
Ch1
Mono 1 RS-232
From Lock-in- Amplifier
To Computer
Power
Spectra Pro 300i
Connections
To Power
Supply unit
To Power
Supply unit
To Control Unit
(NCL)

2008 vf
Experimental Setup and Wiring Spectra Pro 300i
sample Detector
Averaged
Signal
Pulsed Laser
Ch1
Thorlabs Si Photo Detector can be used.
Detector should be set to “see” scattered
light, NOT under direct beam.
Sample Luminescence
signal
Triggering signal gate Power switch
2008 vf
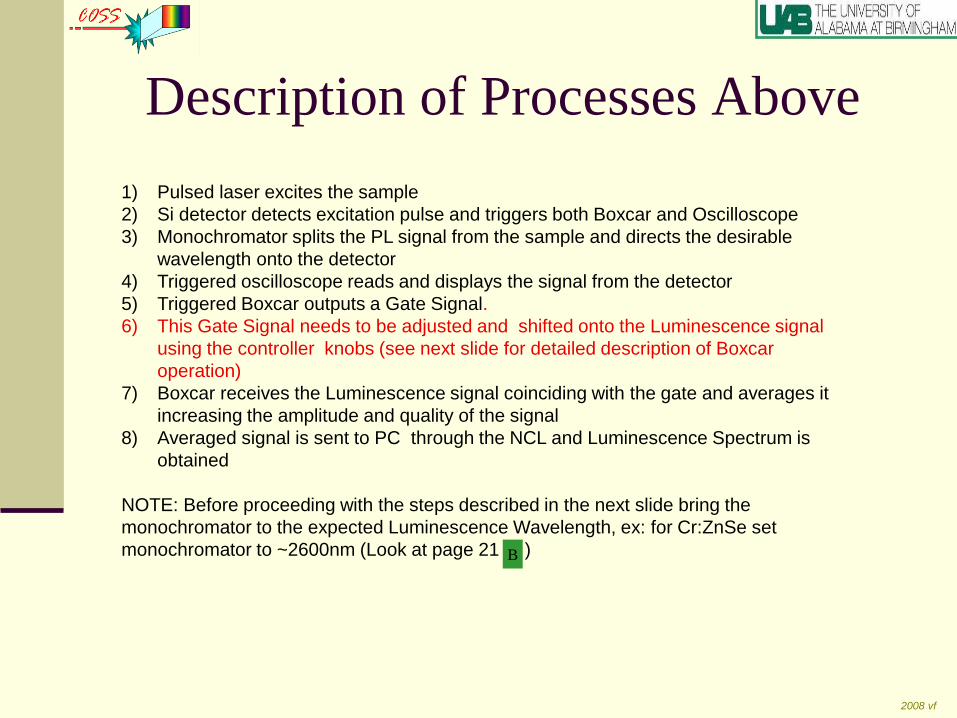
Description of Processes Above
1) Pulsed laser excites the sample
2) Si detector detects excitation pulse and triggers both Boxcar and Oscilloscope
3) Monochromator splits the PL signal from the sample and directs the desirable
wavelength onto the detector
4) Triggered oscilloscope reads and displays the signal from the detector
5) Triggered Boxcar outputs a Gate Signal.
6) This Gate Signal needs to be adjusted and shifted onto the Luminescence signal
using the controller knobs (see next slide for detailed description of Boxcar
operation)
7) Boxcar receives the Luminescence signal coinciding with the gate and averages it
increasing the amplitude and quality of the signal
8) Averaged signal is sent to PC through the NCL and Luminescence Spectrum is
obtained
NOTE: Before proceeding with the steps described in the next slide bring the
monochromator to the expected Luminescence Wavelength, ex: for Cr:ZnSe set
monochromator to ~2600nm (Look at page 21 ) B

2008 vf
Operation of Boxcar
2008 vf
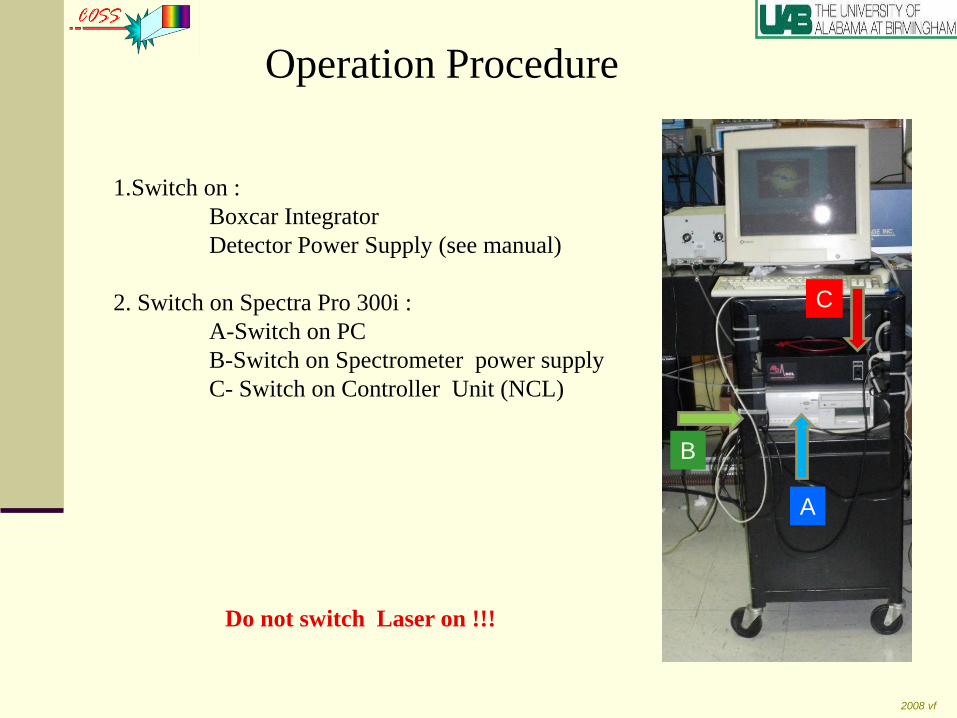
Operation Procedure
1.Switch on :
Boxcar Integrator
Detector Power Supply (see manual)
2. Switch on Spectra Pro 300i :
A-Switch on PC
B-Switch on Spectrometer power supply
C- Switch on Controller Unit (NCL)
Do not switch Laser on !!!
A
B
C

2008 vf
Operation Procedure
3. Run “SepctraSense” Program

2008 vf
Operation Procedure 4. Select Hardware Status Menu
Here
Or Here
2008 vf
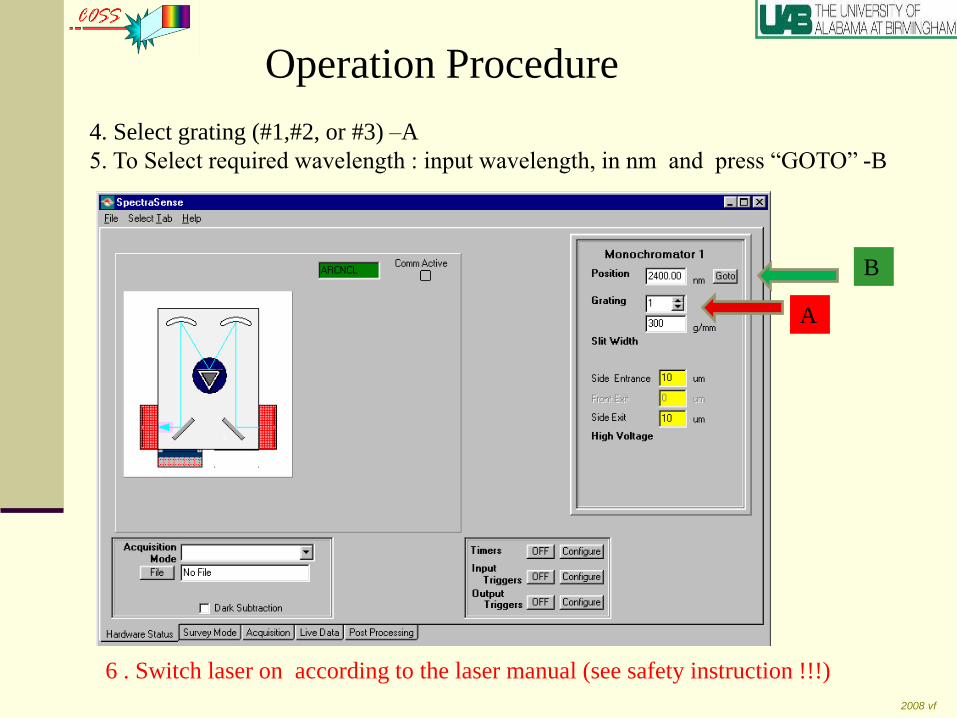
Operation Procedure
4. Select grating (#1,#2, or #3) –A
5. To Select required wavelength : input wavelength, in nm and press “GOTO” -B
A
B
6 . Switch laser on according to the laser manual (see safety instruction !!!)

2008 vf
Operation Procedure
6. For Spectra Measuring:
6.A- Select Accusation mode
Here
Or Here

2008 vf
Operation Procedure
6. For Spectra Measuring:
6.B- Select Scan of the Monochromator #1
2008 vf
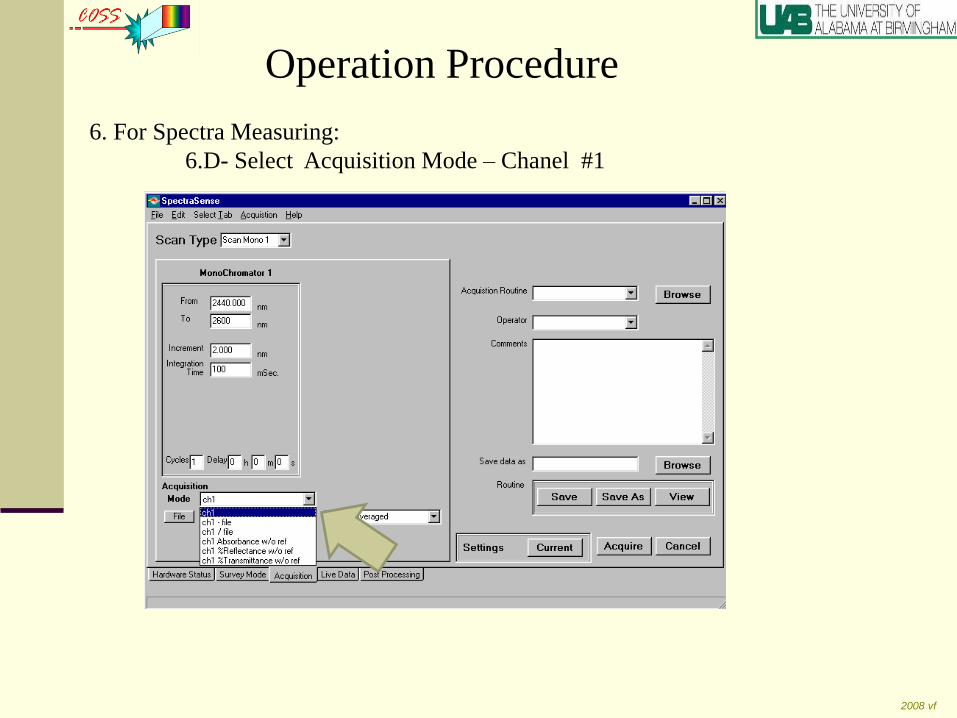
Operation Procedure
6. For Spectra Measuring:
6.D- Select Acquisition Mode – Chanel #1

2008 vf
Operation Procedure
7. For Spectra Measuring:
7.E- Select Scan Parameters
•E1-Initinal Wavelength
•E2- Final Wavelength
•E3 –Increment
•E4- Integration Time at each
wavelength
•E5- Number of scanning
cycles
8. Press Acquire to start measurements

2008 vf
Results will be shown in the “Live Data’ window

2008 vf
9. To save Spectra in the ASCII code (Text File)
9.1 Select File>Save
9.2 Select “Experiment Data”
9.3 Press “OK”
9.4 Select Directory and File Name

2008 vf
Operation Procedure
10. After work done, shutdown :
Laser (according manual)
Detector Power Supply Unit
Boxcar Integrator
NCL controller
Monochromator power supply unite