Embed Size (px)
Citation preview

AcqDemo Interim Evaluation Report i

AcqDemo Interim Evaluation Report ii
TABLE OF CONTENTS
Volume ll: Technical Report
Section A—Summary Descriptive Statistics......................................................................................II-2
1. Workforce Summary Data..................................................................................................... II-2 2. Attitude Survey Summary Data ............................................................................................ II-5
Section B—Specific Data for Primary Interventions .....................................................................II-24
1. Simplified Accelerated Hiring................................................................................................ II-24 2. CCAS...................................................................................................................................... II-30 3. Appointment Authority........................................................................................................... II-47 4. Simplified Classification System............................................................................................ II-49 5. Academic Degree and Certificate Training ............................................................................ II-50
Section C—Specific Data for Secondary Interventions..................................................................II-52
6. Expanded Candidate Selection Process .................................................................................. II-52 7. Extended Probationary Period ................................................................................................ II-52 8. Broadbanding.......................................................................................................................... II-53 9. Simplified, Modified RIF ....................................................................................................... II-55 10. Sabbaticals .............................................................................................................................. II-56 11. Voluntary Emeritus Program.................................................................................................. II-58

AcqDemo Interim Evaluation Report iii
LIST OF TABLES
Table 1 - AcqDemo Population Baseline.................................................................................................. II-2 Table 2 - Transaction History for AcqDemo ............................................................................................ II-2 Table 3 - Separations by Type for AcqDemo ........................................................................................... II-3 Table 4 - Workforce Profile I.................................................................................................................... II-3 Table 5 - Workforce Profile II .................................................................................................................. II-4 Table 6 - Education Level for AcqDemo.................................................................................................. II-4 Table 7 - Education Level for Comparison Group.................................................................................... II-5 Table 8 - Occupational Baseline ............................................................................................................... II-5 Table 9 - Response Totals......................................................................................................................... II-6 Table 10 - Respondent Demographics ...................................................................................................... II-9 Table 11 - Education and Service ........................................................................................................... II-10 Table 12 - 2003 Survey Responses ......................................................................................................... II-11 Table 13 - 1998, 2001, and 2003 Survey Responses .............................................................................. II-20 Table 14 - 2001 and 2003 Survey Responses ......................................................................................... II-21 Table 15 - 1998, 2000, 2001, and 2003 Survey Responses .................................................................... II-23 Table 16 - New Hires Composite............................................................................................................ II-25 Table 17 - Ability to Attract High-Quality Candidates........................................................................... II-26 Table 18 - Hiring Flexibility ................................................................................................................... II-26 Table 19 - Hiring Timeliness .................................................................................................................. II-27 Table 20 - Education Level for AcqDemo.............................................................................................. II-27 Table 21 - Education Level for Comparison Group................................................................................ II-28 Table 22 - Separations by Type for AcqDemo ....................................................................................... II-28 Table 23 - Separations by Type for Comparison Group ......................................................................... II-29 Table 24 - Hiring Timeliness, CY 1999-2002: Days to Referral List..................................................... II-29 Table 25 - Hiring Timeliness, CY 1999-2002: Days to Selection Made ................................................ II-29 Table 26 - Hiring Timeliness, CY 1999-2002: Days to Entry on Duty (EOD) ...................................... II-30 Table 27 - AcqDemo Broadbands and Career Paths .............................................................................. II-31 Table 28 - Contribution Reward Composite ........................................................................................... II-40 Table 29 - Retention of High Contributors ............................................................................................. II-41 Table 30 - Losses of Low Contributors .................................................................................................. II-41 Table 31 - Perceptions of Pay Fairness................................................................................................... II-42 Table 32 – Financial Reward-Contribution Link.................................................................................... II-42 Table 33 – External Equity ..................................................................................................................... II-43 Table 34 – Awards-Contribution Link.................................................................................................... II-43 Table 35 – Monetary Reward-Contribution Link ................................................................................... II-44 Table 36 – Non-monetary Reward Link ................................................................................................. II-44 Table 37 – Supervisors’ Recognition of Individual Contributions ......................................................... II-45 Table 38 – Supervisors’ Recognition of Team Contributions ................................................................ II-45 Table 39 - Pay Differentials .................................................................................................................... II-46 Table 41 - Pay Raise-Contribution Link ................................................................................................. II-46 Table 41 - Personnel System Composite ................................................................................................ II-47 Table 42 - Transaction History .............................................................................................................. II-48 Table 43 - Profile of Non-permanent Employees ................................................................................... II-48 Table 44 - Classification Composite ....................................................................................................... II-49 Table 45 - Simplified Classification Results........................................................................................... II-50 Table 46 - Training Composite ............................................................................................................... II-50 Table 47 - Reported Uses of Academic Degree and Certificate Training—All AcqDemo .................... II-51 Table 48 - Separations by Type for AcqDemo ....................................................................................... II-52 Table 49 - Separations by Type for Comparison Group ......................................................................... II-53

AcqDemo Interim Evaluation Report iv
Table 50 – Satisfaction Composite ......................................................................................................... II-54 Table 51 - Reduction-in-Force (RIF) Fairness........................................................................................ II-56 Table 52 - Sabbatical Opportunities........................................................................................................ II-57 Table 53 - Sabbaticals and Skills ............................................................................................................ II-57 Table 54 - Number of Sabbaticals by Component .................................................................................. II-58 Table 55 - Voluntary Emeritus Appointments by Component ............................................................... II-58
LIST OF CHARTS Chart 1 – The Normal Pay Range ........................................................................................................... II-31 Chart 2 - 1999 – 2002 Total Zone Distribution ...................................................................................... II-32 Chart 3 - 1999 AcqDemo Scatter Plot .................................................................................................... II-32 Chart 4 - 2000 AcqDemo Scatter Plot .................................................................................................... II-33 Chart 5 - 2001 AcqDemo Scatter Plot .................................................................................................... II-33 Chart 6 - 2002 AcqDemo Scatter Plot .................................................................................................... II-34 Chart 7- Withheld GPI ............................................................................................................................ II-34 Chart 8 - Required MFR’s and CIP’s...................................................................................................... II-35 Chart 9 - Average CRI $ by Career Path ................................................................................................ II-35 Chart 10 - Average CRI % by Career Path ............................................................................................. II-36 Chart 11 - Average Raise (CRI + GPI) $ by Career Path ....................................................................... II-36 Chart 12 - Average Raise (CRI + GPI) % by Career Path ...................................................................... II-37 Chart 13 - Average $ CA by Career Path................................................................................................ II-37 Chart 14 - Average % CA by Career Path .............................................................................................. II-38 Chart 15 - Category Movement By Ratings FY 1999 to FY 2002 ......................................................... II-38 Chart 16 - Loss Rates by Zone................................................................................................................ II-39 Chart 17 - Loss Rates by Zone, (One Year Rate Excludes Paypools 201 and 202) ............................... II-39 Chart 18 - Average 2002 Basic Pay - NH & Total ................................................................................. II-54 Chart 19 - Average 2002 Basic Pay - NK & NJ ..................................................................................... II-55

Volume II Technical Report
AcqDemo Interim Evaluation Report II-1
VOLUME II—TECHNICAL REPORT
This report provides the interim evaluation of the effectiveness of the Department of Defense (DoD) Civilian Acquisition Personnel Demonstration Project (AcqDemo) and recommendations on its future direction. The report covers the period February 2000 through December 2002. The period that includes planning and preparation for AcqDemo through the initial implementation and the first year of operation was previously covered in the Baseline/Implementation Report, submitted by the AcqDemo Program Office (PO) in August 2000 and approved by the Office of Personnel Management (OPM) on August 7, 2001. The report is organized into three Volumes: • Volume I—Management Report
• Volume II—Technical Report • Volume III—Appendices (complete databases, for reference) This Technical Report provides more detailed statistics, both descriptive and inferential, that support the conclusions reached and recommendations made in the Management Report. The technical information is organized into three sections: • Summary Descriptive Statistics, which apply to AcqDemo as a whole, and include both workforce
data and attitude survey data; • Specific Data for Primary Interventions; and • Specific Data for Secondary Interventions. Primary interventions are those that will have the most significant impact on the acquisition workforce and are not piloted in this configuration in any other demo. Secondary interventions are those that have been tried and evaluated in other demonstration projects.

Volume II Technical Report
AcqDemo Interim Evaluation Report II-2
A. Summary Descriptive Statistics
1. Workforce Summary Data The following tables provide a general, descriptive picture of the AcqDemo workforce for calendar years 2000 through 2002. Data from 1998 (before AcqDemo started) and 1999 are included in the Baseline/Implementation Report. These data were provided by the Defense Manpower Data Center (DMDC)—from its civilian personnel data file—for AcqDemo participants and the comparison group (Air Armaments Center at Eglin, AFB, Florida). Workforce data that are especially applicable to a given AcqDemo intervention are provided in Sections B and C below.
Table 1:
AcqDemo Population Baseline 12/1998 12/1999 12/2000 12/2001 12/2002
Air Force 2026 (40.4%) 2008 (40.3%) 1978 (39.0%) 2062 (37.3%) 2218 (36.9%) Army 1489 (29.8%) 1492 (29.9%) 1559 (30.8%) 1741 (31.5%) 2052 (34.1%) Marine Corps 568 (11.4%) 566 (11.4%) 567 (11.2%) 730 (13.2%) 723 (12.0%) Navy 650 (13.0%) 646 (13.0%) 671 (13.2%) 713 (12.9%) 614 (10.3%) USD (AT&L) 271 (5.4%) 271 (5.4%) 293 (5.8%) 281 (5.1%) 404 (6.7%)
Total: 5,004 4,983 5,068 5,527 6,011
Comparison Group 1,328 1,316 1,312 1,338 1,389
Table 2:
Transaction History for AcqDemo AcqDemo Comparison Group 2000 2001 2002 2000 2001 2002 Total (as of 12/2000; 12/2001; 12/2002) 5,068 5,527 6,011 1,312 1,338 1,389
Number of employees promoted 413 (8.1 %)
235 (4.3%)
309 (5.1%)
212 (16.2%)
128 (9.6%)
363 (26.1%)
Number of accessions during the year
265 (5.2%)
242 (4.4%)
365 (6.1%)
59 (4.5%)
148 (11.1%)
376 (27.1%)
Number of employees denied a WGI
0 (0.0%)
0 (0.0%)
0 (0.0%)
1 (0.08%)
0 (0.0%)
0 (0.0%)
Number of employees converted from non-permanent to permanent appointments
40 (0.8%)
29 (0.5%)
50 (0.8%)
25 (1.9%)
19 (1.4%)
66 (4.8%)
Number of employees on temporary appointment
15 (0.3%)
8 (0.1%)
8 (0.1%)
15 (1.1%)
6 (0.4%)
56 (4.0%)
Number of employees on term/modified term appointment
44 (0.9%)
38 (0.7%)
40 (0.7%)
17 (1.3%)
34 (2.5%)
38 (2.7%)

Volume II Technical Report
AcqDemo Interim Evaluation Report II-3
Table 3:
Separations by Type for AcqDemo AcqDemo Comparison Group
2000 (% of
population)
2001 (% of
population)
2002 (% of
population)
2000 (% of
population)
2001 (% of
population)
2002 (% of
population)During probationary period 2 (0.04%) 1 (0.01%) 0 (0.0%) 0 (0.0%) 1 (0.07%) 0 (0.0%)
Resignation 113 (2.2%) 56 (1.0%) 71 (1.2%) 21 (1.6%) 34 (2.5%) 69 (5.0%) Retirement 82 (1.6%) 69 (1.2%) 182 (3.0%) 31 (2.4%) 64 (4.8%) 100 (7.2%) Removal 5 (0.1%) 1 (0.01%) 1 (0.01%) 2 (0.2%) 1 (0.07%) 2 (0.1%) Death 12 (0.2%) 5 (0.09%) 9 (0.2%) 2 (0.2%) 2 (0.1%) 3 (0.2%) RIF 0 (0.0%) 0 (0.0%) 0 (0.0%) 0 (0.0%) 0 (0.0%) 3 (0.2%) Termination 56 (1.1%) 44 (0.8%) 74 (1.2%) 20 (1.5%) 19 (1.4%) 59 (4.3%)
Total # of employees separated 270 176 337 76 121 236
Table 4: Workforce Profile I
AcqDemo Comparison Group
12/2000 12/2001 12/2002 12/2000 12/2001 12/2002
Total Population 5068 5527 6011 1312 1338 1389 Percent Supervisors/Managers 11.3% 10.9% 9.8% 14.7% 13.7% 12.2% Average Length of Civilian Service 19 years 19 years 18 years 19 years 19 years 18 years
Average Age 47 years 48 years 48 years 49 years 49 years 48 years Percent Eligible for Retirement 8.4% 8.9% 10.0% 12.8% 13.3% 13.5% Percent on Permanent Appointment 97.0% 97.0% 96.9% 93.0% 91.9% 91.9%
Percent in Bargaining Unit 10.2% 14.1% 16.3% 81.1% 80.9% 81.6% Average GS Grade 10.7 10.2 9.7 10.4 10.2 10.2 DAWIA-Covered 56.2% 58.4% NA 55.9% 55.1% NA

Volume II Technical Report
AcqDemo Interim Evaluation Report II-4
Table 5:
Workforce Profile II AcqDemo Comparison Group
12/2000 12/2001 12/2002 12/2000 12/2001 12/2002
Female 45.7% 45.2% 44.8% 41.3% 41.4% 39.2% Male 54.3% 54.8% 55.1% 58.7% 58.6% 60.8% White 75.5% 75.2% 75.0% 83.8% 83.2% 82.8% Black 14.1% 14.0% 14.3% 8.5% 9.0% 8.7% Hispanic 3.9% 4.2% 4.3% 3.5% 3.7% 4.4% American Indian/Alaska Native 0.7% 0.9% 0.8% 1.7% 1.5% 1.4% Asian/Pacific Islander 5.6% 5.4% 5.2% 2.5% 2.7% 2.7% Other Race or National Origin 0.2% 0.4% 0.4% 0.0% 0.0% 0.0% Veteran 25.9% 27.8% 27.9% 35.9% 35.9% 38.3%
Table 6: Education Level for AcqDemo
Total AcqDemo New Hires
12/2000 12/2001 12/2002 12/2000 12/2001 12/2002
High School Graduate or Less 21.7% 22.9% 23.7% 46.6% 46.8% 33.8% Terminal Occupation Program 1.5% 1.6% 1.5% 0.0% 0.3% 0.0% Some College/Associate’s Degree 24.5% 24.0% 23.0% 12.1% 9.4% 12.3%
Bachelor’s Degree 26.0% 25.3% 25.9% 21.4% 20.4% 30.8% Some Graduate School 6.6% 6.2% 5.9% 3.1% 2.7% 2.5% Master’s Degree 17.1% 17.1% 17.5% 16.8% 18.2% 19.4% Some Graduate School Beyond Master’s Degree 1.6% 1.7% 1.5% 0.0% 0.9% 0.8%
Doctorate or Higher 1.0% 1.1% 1.0% 0.0% 0.6% 0.4% Number of New Hires:* 131 329 238 *New hires are employees with a service computation date of 1 year or less.

Volume II Technical Report
AcqDemo Interim Evaluation Report II-5
Table 7:
Education Level for Comparison Group Total Comparison Group New Hires
12/2000 12/2001 12/2002 12/2000 12/2001 12/2002
High School Graduate or Less 10.7% 13.7% 15.2% 39.1% 58.6% 35.6% Terminal Occupation Program 2.6% 2.4% 2.1% 0.0% 0.0% 2.2% Some College/Associate’s Degree 24.1% 23.2% 24.0% 30.5% 11.4% 11.1%
Bachelor’s Degree 23.6% 23.7% 23.5% 17.4% 20.0% 22.2% Some Graduate School 10.7% 10.0% 8.6% 4.3% 1.4% 0.0% Master’s Degree 26.0% 24.7% 24.6% 8.7% 7.1% 28.9% Some Graduate School Beyond Master’s Degree 1.3% 1.3% 1.1% 0.0% 0.0% 0.0%
Doctorate or Higher 1.0% 1.0% 0.9% 0.0% 1.4% 0.0% Number of New Hires: 23 70 45 *New hires are employees with a service computation date of 1 year or less.
Table 8:
Occupational Baseline AcqDemo Comparison Group* 12/2000 12/2001 12/2002 12/2000 12/2001 12/2002
Business Management and Technical Management Professional (NH)
79.4% 81.2% 82.1% 73.9% 73.6% 74.8%
Technical Management Support (NJ) 5.3% 5.2% 5.2% 8.8% 8.8% 9.0%
Administrative Support (NK) 15.3% 13.6% 12.7% 17.3% 17.6% 16.2% *Note: The Comparison Group’s GS occupation series were converted to AcqDemo career path equivalents.
2. Attitude Survey Summary Data
The following analysis provides a general overview of attitude survey results based on surveys of the AcqDemo population and the comparison group conducted in 1998, 2001, and 2003. Specific survey analyses related to individual AcqDemo interventions are located in Sections B and C below. Survey instruments and complete results may be found in Volume III, Appendix C.
a. RESPONSE RATE
Cubic Applications, Inc. conducted a survey of AcqDemo participants and comparison group participants in order to assess changes in employee attitudes for the DoD Civilian Acquisition Workforce Personnel Demonstration Project. An employee attitude survey was made available to project participants on the AcqDemo website (www.acqdemo.com) from February 5th until February

Volume II Technical Report
AcqDemo Interim Evaluation Report II-6
27, 2003. A modified version of the survey was also made available to comparison group participants from February 21 until March 2, 2003. Individuals from the acquisition personnel of the Office of the Secretary of Defense and its Agencies, Air Force, Army, Navy, and the Marine Corps had access to the survey at their workplace during work hours. Of the 6,011 potential respondents for AcqDemo, 2,027 completed the survey for a response rate of 33.7%. Of the 1,389 potential respondents for the comparison group, 275 completed the survey for a response rate of 19.8%. The table below gives the number of responses for the demonstration group and the comparison group for the 1998 baseline, 2001 and 2003 surveys by agency.
Table 9: Response Totals
Demonstration Group Comparison Group Baseline 2001 2003 Baseline 2001 2003
Air Force 1025 683 898 Air Force 470 130 275
Army 954 640 743 Navy 402 226 71
Marine Corps 367 254 161
OSD 148 154
390, or 19.2%, of the demonstration group sample, and 88, or 32%, of the comparison group sample also completed the separate section at the end of the survey for supervisors.
b. ANALYSIS METHODOLOGY
Initial Summary Analyses Frequency distributions were developed for the 2003 and 2001 demonstration group survey, the 2003 and 2001 comparison group survey, and the 1998 Baseline Group Survey in order to assess respondents’ attitudes and opinions about AcqDemo. To facilitate this analysis, the frequency counts were converted into percentages. As part of this conversion, response categories were grouped in order to reflect overall favorable responses or unfavorable responses to a particular statement (e.g., the percent of respondents who answered "strongly agree" and the percent who answered "agree" were combined in order to calculate "% favorable"). In order to reflect how representative each group is of its population, a 95 percent confidence interval was calculated for each group. Since the results are reported as percentages, the standard error of a percentage was used in the calculation of the confidence interval. The standard errors, assuming a worst-case split of 50/50 (i.e., the maximum variation in a two-category response), are 1.11 for the 2003 demonstration group, 3.01 for the 2003 comparison group, 1.13 for the 2001 demonstration group, 4.39 for the 2001 comparison group, and .95 for the 1998 Baseline demonstration group. Consequently, the 95 percent confidence interval is plus or minus 2.22 percentage points for the 2003 demonstration group, 6.02 percentage points for the 2003 comparison group, 2.26 percentage points for the 2001 demonstration group, plus or minus 8.78 percentage points for the 2001 comparison group, and plus or minus 1.85 percentage points for the 1998 Baseline Demonstration

Volume II Technical Report
AcqDemo Interim Evaluation Report II-7
group. In other words, we can be 95 percent confident that the true population response values would fall within about plus or minus: • 3 percentage points of the reported 2003 demonstration group’s response values • 6 percentage points of the reported 2003 comparison group’s response values • 3 percentage points of the reported 2001 demonstration group’s response values • 9 percentage points of the reported 2001 comparison group’s response values • 2 percentage points of the reported 1998 Baseline group’s response values The initial analyses of the 2003 survey data consisted of developing response frequency
distributions for the following survey questions: • Demographics (Questions 2, 3, 4) • Education (Question 15) • Length of Service (Question 5) • Career Path/Occupation (Question 6) • Perceived Fairness (Questions 16, 17, 19, 25, 26, 27, 30, 31, 38, 39, 40, 64, 84, 101, 102) • Perceived Flexibility (Question 41, 42, 43, 44, 45, 46, 47) • Satisfaction with Pay (Question 18) • Perceived Pay-Contribution Link (Questions 20, 35, 36, 48, 49) • Perceived Organizational Effectiveness (Questions 75, 76, 77, 79, 80, 85) • Satisfaction with Supervisor (Questions 88, 90, 91, 92, 100, 101, 102) • Satisfaction with Personnel Services (Questions 87a, 87b, 87c, 119) • Satisfaction with AcqDemo (Questions 33, 106) • Understanding of AcqDemo (Questions 32, 72)
Analyses of Primary and Secondary Interventions Frequency distributions were then developed for the survey questions that assessed employee attitudes about the project's primary and secondary interventions.
Primary Interventions
1. Simplified Accelerated Hiring
• Perceived Hiring Flexibility – Supervisors (Questions 56, 57, 121, 130, 137) • Perceived Quality of New Hires – (Questions 53, 58, 109a-109o, 120, 134)
2. Contribution-Based Compensation and Appraisal System
• Pay-contribution correlation (Question 16, 18, 27, 36, 37, 38, 39) • Perceived Pay-Contribution Link (Questions 20, 35, 36, 48, 49) • Perceived Fairness of Ratings (Questions 17, 25, 26, 27) • Perceived Fairness of Awards (Questions 35, 36, 37, 38, 39) • Employees’ Trust in Supervisors (Questions 38, 39, 90, 92, 97, 101, 102) • Adequacy of Contribution and Performance Feedback (Questions 88, 97, 91, 92, 100) • Employee Satisfaction with Pay (Questions 16, 18, 19, 21)

Volume II Technical Report
AcqDemo Interim Evaluation Report II-8
3. Modified Appointment Authority • Perceived Flexibility of Appointing Authorities (Question 46)
4. Simplified Classification System • Perceived Classification Flexibility-General (Question 43, 50, 51) • Perceived Classification Flexibility-Supervisors (Question 124, 126, 128, 129, 130) • Perceived Classification Timeliness (Question 52, 57)
5. Academic Degree and Certificate Training • Satisfaction with Training Opportunities (Questions 68, 69, 70) • Perceived Flexibility (Questions 41, 43, 44, 45)
Secondary Interventions
6. Expanded Candidate Selection Process
• Same as Intervention 1
7. Flexible Probationary Period • Supervisors’ perceptions of probationary period (Questions 135, 136)
8. Broadbanding • Employees Perception of Pay Satisfaction and Pay Equity (Questions 16, 18, 19, 21,
28, 40, 48, 49)
9. Simplified, Modified RIF • Perceived Fairness of RIF Process (Questions 112a, 112b, 112c)
10. Sabbaticals • Employees perception of sabbatical opportunities available (Question 67)
11. Voluntary Emeritus Program • Not assessed by 2003 Survey
Analyses of 2003 Demonstration and Comparison Groups Frequency distributions were developed for the demonstration group and the comparison group on common items. These distributions were then compared to determine if significant differences exist in the response patterns between the groups. Analyses of the 2003, 2001 and the 1998 Baseline Results for the Demonstration Group Frequency distributions were developed for the demonstration group on those items found on the 1998 Baseline, 2001 and 2003 surveys. These distributions were compared to determine if significant differences existed in the participants’ response patterns over time.

Volume II Technical Report
AcqDemo Interim Evaluation Report II-9
c. RESULTS
Respondent Demographics Table 10 shows the gender, race and origin of the survey respondents. These data are based on participant responses to the survey; however, actual workforce data will be used to evaluate the demographic impact of AcqDemo interventions.
Table 10:
Respondent Demographics Demonstration Group Comparison Group
Baseline 2001 2003 Baseline 2001 2003
Gender:
• Male 56% 54% 54% 60% 57% 77% Female 44% 45% 46% 40% 43% 23%
Race: • American Indian-Alaskan 1% 2% 1% 2% 2% 2% • Asian-Pacific Islander 5% 6.7% 5% 1% 1% 2% • Black 12% 11.5% 14% 7% 3% 6% • White 77% 77.5% 80% 87% 94% 89% • Other1 5% 4.5% NA 3% NA 1% Origin: • Hispanic 5% 4% 6% 3% 5% 4% • Non-Hispanic 95% 96% 94% 97% 95% 96%
Workforce Characteristics
Table 11 shows the educational level and the length of service in the Federal Government. All respondents were well educated with the majority of respondents having at least some college level education or a Bachelor’s degree. The majority of respondents had 16 or more years of service in the Federal Government.
1 This includes Spanish/Hispanic/Latino (2001 AcqDemo Survey)

Volume II Technical Report
AcqDemo Interim Evaluation Report II-10
Table 11:
Education and Service Demonstration Group Comparison Group
Baseline 2001 2003 Baseline 2001 2003
Educational Level:
• High School or less 6% 5% 4% 5% 5% 2% • Technical, Vocational or
Business School 2% 2% 2% 2% 2% .5%
• Some college/2-year Associate degree 33% 32% 33% 29% 18% 4.5%
• Bachelor's degree (B.A., B.S. or other)/Some graduate school
33% 32% 32% 33% 30% 37%
• Master's degree 25% 28% 28% 29% 41% 52% • Doctorate degree (Ph.D.,
M.D., Ed.D., J.D.) or higher 1% 1% 1% 2% 5% 4%
Length Of Service:
• Less than 1 year 1% 2% 2% 2% 0% 5%
• 1-2 2% 2% 6% 2% 0% 4%
• 3-5 3% 4% 5% 4% 1.5% 4% • 6-8 6% 6% 4% 6% 4% 2%
• 9-10 90% 12% 2% 12% 3% 4%
• 11-15 20% 19% 17% 19% 25% 14%
• 16 or more years 59% 55% 64% 55% 66.5% 67%

Volume II Technical Report
AcqDemo Interim Evaluation Report II-11
Survey Responses: 2003
The following table summarizes the 2003 survey data for both AcqDemo participants and the Comparison Group.
Table 12: 2003 Survey Responses
% Favorable % Unfavorable Item # Question Demo Comp Demo Comp
16 Pay progression, the way I move up within my broadband, is fair. 54% 52% 30% 34%
17 My overall contribution score (OCS) represents a fair and accurate picture of my actual contribution to the mission.
54% 66% 33% 20%
18 All in all, I am satisfied with my pay. 57% 52% 32% 35%
19 Pay is administered fairly in this organization. 39% 48% 37% 29%
20 In this organization, my pay raises depend on my contribution to the organization’s mission. 59% 18% 28% 60%
21 I am satisfied with my chances for advancement. 45% 33% 38% 53%
22 High contributors tend to stay with this organization. 37% 27% 27% 45%
23 Low contributors tend to leave this organization. 18% 15% 36% 54%
24 In general, I am satisfied with my job. 74% 78% 14% 12%
25 There are adequate procedures to get my contribution rating reconsidered, if necessary. 37% 47% 26% 15%
26 I will be demoted or removed from my position if I perform my job poorly. 39% 34% 24% 40%
27 Under the present system, financial rewards are seldom related to employee contribution. 32% 47% 44% 34%
28 Other employers in this area pay more than the Government does for the kind of work I am doing.
54% 53% 11% 21%
29 My contribution appraisal takes into account the most important parts of my job. 60% 65% 23% 18%
30
Contribution-based compensation and assessment system (CCAS) self-assessment provided me a good opportunity to influence my contribution assessment.
55% NA 27% NA
31 CCAS is administered without regard to gender, ethnic origin, or age in this organization. 62% 74% 16% 12%
32 I understand the contribution-based compensation and assessment system (CCAS) being used in this organization.
79% 84% 12%
8%
33 Overall, the demonstration project is an improvement over the previous performance rating and compensation system.
46% NA 33% NA

Volume II Technical Report
AcqDemo Interim Evaluation Report II-12
% Favorable % Unfavorable Item # Question Demo Comp Demo Comp
34 In this organization, my pay raises depend on my contribution to the organization's mission. 58% 19% 26% 60%
35 In this organization, my cash awards depend on my contribution to the organization's mission. 56% 50% 28% 29%
36 High-contributing employees receive monetary rewards (e.g. cash rewards, bonuses, quality step increases).
56% 46% 21% 27%
37 High-contributing employees receive non-monetary rewards (e.g. plaques, letters of appreciation, public recognition).
41% 60% 28% 19%
38 Supervisors are fair in recognizing individual contributions. 50% 60% 30% 20%
39 Supervisors are fair in recognizing team contributions. 51% 64% 25% 18%
40 Pay pool panels are fair in recognizing individual contributions. 37% NA 35% NA
41 Management is flexible enough to make changes when necessary. 40% 48% 31% 28%
42 Under the current personnel system, it is easy to reassign employees to permanent positions within this organization.
32% 32% 23% 39%
43 Supervisors here feel that their ability to manage is restricted by unnecessary personnel rules and regulations.
27% 47% 19% 16%
44 The personnel management system is flexible enough to allow changes when necessary. 30% 25% 28% 48%
45 New practices and ways of doing business are encouraged in this organization. 54% 59% 25% 21%
46 Current personnel rules provide the flexibility needed to make workforce adjustments in response to workload and mission changes.
37% 32% 29% 44%
47 I have enough flexibility in my job to initiate tasks that will enhance my contribution to the mission.
68% 73% 19% 13%
48 Pay differentials here fairly represent real differences in levels of responsibility and job difficulty.
28% 23% 43% 55%
49 In this organization, I don't have to become a supervisor to receive more pay. 54% 28% 26% 56%
50 The current job classification system makes it easy for employees to move in and out of supervisory jobs.
17% 9% 37% 62%
51 Our job classification system is flexible enough to respond to changing requirements. 30% 18% 30% 52%
52 It takes too long to get classification decisions approved in this organization. 38% 61% 11% 6%

Volume II Technical Report
AcqDemo Interim Evaluation Report II-13
% Favorable % Unfavorable Item # Question Demo Comp Demo Comp
53 This organization is able to attract high-quality candidates. 47% 46% 26% 30%
54 In this organization, when there is a promotion opportunity, the best-qualified applicant is chosen 35% 39% 34% 34%
55 Competition for jobs here is fair and open. 41% 42% 32% 32%
56 I am satisfied with the process used to fill vacancies here. 34% 31% 37% 42%
57 It takes too long to process the paperwork to fill vacancies here. 55% 67% 10% 7%
58 I am satisfied with the quality of new supervisors. 36% 50% 24% 21%
59 During the next year, I will probably look for a new job outside this organization. 39% 36% 34% 41%
60 In this organization: Employees are kept well informed on all issues affecting their job.
43% 56% 38% 28%
61 In this organization: Supervisors encourage subordinates to participate in important decisions.
47% 61% 34% 23%
62 In this organization: Employees share their knowledge with each other.
60% 75% 25% 13%
63
In this organization: Managers promote effective communication among different work groups (e.g. about projects, goals, needed resources).
47% 62% 31% 21%
64 In general, disciplinary actions are fair and justified. 33% 47% 15% 12%
65 This organization passes off marginal and unsatisfactory workers to others or moves them to positions where they can be ignored.
34% 36% 23% 27%
66 Disciplinary actions in this organization are avoided because of the paperwork that is required.
25% 29% 23% 23%
67 I have the opportunity to take advantage of sabbatical leave. 15% 13% 26% 32%
68 I have all the skills I need in order to do my job. 76% 79% 14% 11%
69 I am given adequate opportunity to participate in training programs. 69% 80% 19% 12%
70 Employees are provided with training when new technologies and tools are introduced. 60% 72% 22% 17%
71 The use of sabbaticals has increased employee skills. 6% 11% 16% 16%
72 I have received sufficient training to prepare me for participation in the demonstration project. 64% NA 17% NA

Volume II Technical Report
AcqDemo Interim Evaluation Report II-14
% Favorable % Unfavorable Item # Question Demo Comp Demo Comp
73 This organization offers employees the opportunity for academic degree and certificate training.
61% 80% 17% 10%
74 I have the opportunity for academic degree and certificate training. 57% 76% 19% 11%
75 In my organization, products and services are designed to meet customer needs and expectations.
70% 82% 13% 6%
76 Employees in my organization have a good understanding of who their customers are. 78% 86% 12% 8%
77 Overall, my organization is effective in accomplishing its objectives. 74% 86% 11% 5%
78 Different work groups cooperate to get the job done. 69% 84% 15% 6%
79 I understand the mission of this organization. 91% 92% 4% 3%
80 Employees in my organization use suggestions from their customers to improve the quality of products and services.
58% 72% 12% 9%
81 My organization establishes strategic plans (goals and objectives) that help guide program decisions. 57% 66% 17% 14%
82 My group works well together. 78% 90% 12% 5%
83 Coordination among employees in different organizational functions is good in this organization.
57% 72% 23% 13%
84 When changes are made in this organization, the employees usually lose out in the end. 30% 24% 33% 35%
85 Overall, our customers are satisfied with the support and services provided by my organization.
69% 81% 12% 6%
86 I understand how my job relates to the mission of the organization. 92% 92% 4% 3%
87a The staff who provide personnel services: a. have a good understanding of my work group's operations and mission.
47% 50% 25% 22%
87b The staff who provide personnel services: b. provide timely service. 52% 48% 23% 30%
87c The staff who provide personnel services: c. help me achieve my organization's mission. 47% 46% 22% 21%
88 My supervisor sets clear contribution goals for me. 53% 72% 28% 11%
89 My supervisor and I worked together to set clear contribution goals for me. 54% 67% 28% 15%
90 I have trust and confidence in my supervisor. 66% 77% 18% 9%
91 My supervisor gives me adequate feedback on how I am contributing. 61% 80% 25% 7%

Volume II Technical Report
AcqDemo Interim Evaluation Report II-15
% Favorable % Unfavorable Item # Question Demo Comp Demo Comp
92 My supervisor and I agree on what contribution on my job means. 60% 74% 20% 6%
93 My supervisor knows the technical parts of his/her job well. 76% 80% 11% 8%
94 My supervisor works well with people. 71% 81% 14% 10%
95 My supervisor handles the administrative parts of his/her job well. 66% 75% 15% 8%
96 My supervisor takes corrective action when problems arise. 62% 70% 16% 10%
97 My supervisor recognizes my personal accomplishments. 68% 66% 17% 11%
98 My supervisor determines program or project priorities to allocate resources. 64% 72% 15% 11%
99 My supervisor sets deadlines for project completion. 70% 74% 12% 12%
100 My supervisor assigns me tasks that allow me to contribute to the mission in a meaningful way. 67% 80% 16% 8%
101 My supervisor tends to inflate the contribution ratings of the employees he/she supervises. 9% 15% 56% 43%
102 My supervisor tends to deflate the contribution ratings of the employees he/she supervises. 14% 7% 47% 50%
103
In this organization, differences among individuals (gender, race, national origin, religion, age, cultural background, disability) are respected.
74% 84% 9% 3%
104
Gender, race, national origin, religion, age, cultural background, or disability do not affect advancement opportunities for highly-qualified individuals.
67% 66% 15% 18%
105 Senior leaders in my organization support the demonstration project. 70% NA 6% NA
106 I am in favor of the demonstration project for my organization. 52% NA 30% NA
107 To what extent have you participated in the development of your contribution plans and the standards on which you are rated?
41% NA 36% NA
108 I utilize the skills taught in the AcqDemo training programs. 31% NA 42% NA
109a How satisfied are you with the competence of new hires who are in the following positions? a. Program Manager
25% 30% 11% 11%
109b b. Contracting 26% 38% 9% 4% 109c c. Industrial Property Management 9% 12% 4% 1% 109d d. Purchasing 17% 21% 6% 2% 109e e. Manufacturing and Production 10% 18% 2% 3%

Volume II Technical Report
AcqDemo Interim Evaluation Report II-16
% Favorable % Unfavorable Item # Question Demo Comp Demo Comp 109f f. Quality Assurance 15% 18% 5% 4%
109g g. Business, Cost Estimating and Financial Management 25% 33% 8% 7%
109h h. Acquisition Logistics 19% 28% 6% 4% 109i i. Communications and Computer Systems 33% 45% 11% 9%
109j j. Systems Planning, Research Development and Engineering 23% 43% 4% 6%
109k k. Test Evaluation 28% 46% 5% 5% 109l l. Auditing 10% 15% 3% 4% 109m m. Technical 31% 51% 5% 6% 109n n. Administrative 38% 45% 13% 9% 109o o. Support Staff 39% 47% 13% 7% 112a a. The RIF process is fair. 18% 30% 18% 7%
112b b. I was provided with adequate information about the RIF. 22% 23% 19% 8%
112c c. I was provided with adequate information about job placement. 20% 25% 18% 8%
116 Assigning the right people to the job? 73% 85% 27% 16% 117 Coordinating the efforts of different work groups? 47% 61% 21% 17%
118 Providing supplies, equipment, training, and other resources to get the job done? 52% 67% 21% 14%
119 Overall, the quality of personnel services provided to me is… 48% 52% 19% 16%
120 The skills and abilities of the most recent candidate I hired were a good match for the job. 76% 78% 6% 8%
121 I have enough authority to hire people with the right skills when I need them. 25% 43% 29% 35%
122 I have enough authority to promote people. 37% 30% 41% 62%
123 I have enough authority to determine my employees' pay. 44% 8% 37% 82%
124 I am satisfied with the classification procedures used in this organization. 0% 23% 49% 48%
125 I have enough authority to remove people from their jobs if they perform poorly. 100% 26% 0% 61%
126 I have enough authority to influence classification decisions. 64% 30% 30% 51%
127 In this organization, management has the flexibility to reduce the workforce, when necessary.
44% 45% 22% 33%
128 Discussion over job classification has delayed the staffing process in my organization. 31% 32% 28% 25%
129 I have been adequately trained to exercise the classification authorities delegated to me. 33% 40% 32% 28%

Volume II Technical Report
AcqDemo Interim Evaluation Report II-17
% Favorable % Unfavorable Item # Question Demo Comp Demo Comp
130 Job classification is easier and faster under the demonstration project than under the previous system.
35% 19% 18% 9%
131 In the last CCAS cycle, the pay pool panel generally agreed with the contribution ratings I gave to my immediate employees.
66% NA 16% NA
132 I have received sufficient training to prepare me for supervisory responsibilities in the demonstration project.
68% NA 15% NA
133 The demonstration project provides supervisors with effective tools to improve employee contributions.
55% NA 19% NA
Question % of respondents Demo
% of respondents Comp
(110) Do you feel the current length of the probation period for employees is: (Choose one)
Too Long About Right
Too Short Don’t Know
7% 57% 7%
29%
8% 63% 10% 19%
(111) Within the last year, has there been a formal RIF (reduction in force) in your organization or at your installation? Note: Buyouts and offers of early retirement do not constitute a RIF. (Choose one)
Yes (if yes, answer item 112) No, but my organization is planning a RIF (skip to item
113) No (skip to item 113)
Don’t know (skip to item 113)
12% 4%
73% 11%
23% 18% 50% 9%
(112) If yes, were you personally affected by the RIF (for example, your position or workload changed or you felt jeopardized)? (Choose one)
Yes (answer 112a. b. and c) No (skip to item 113)
Don’t know (skip to item 113)
18% 68% 14%
9% 84% 7%

Volume II Technical Report
AcqDemo Interim Evaluation Report II-18
Question % of respondents Demo
% of respondents Comp
(113) I would like to see additional training provided in the following areas: (Choose one)
The use of all AcqDemo interventions Hiring and Pay Setting
The pay pool panel process The Contribution-based compensation & appraisal Scoring
The Contribution-based compensation & appraisal Pay Adjustment
Other
13% 11% 19% 25% 14% 18%
NA NA NA NA NA NA
(114) The place where I primarily receive personnel services is located: (Choose one)
In my building or within walking distance Too far to walk but in the same area-within
driving/commuting Outside of this immediate geographic area
Don’t know
45% 33% 15% 7%
66% 20% 9% 5%
(115) The factor that most influenced the frequency of communication between my supervisor and me was: (Choose one)
Mission changes within my Personnel changes within my organization
Information gained in training programs Other environmental factors
40% 17% 5%
38%
42% 19% 6%
33% (134) If you have hired someone in the past year, what was your assessment of the overall capabilities of the person hired compared to the rest of your workforce?
Top 1% Top 10% outstanding
Top 25% very good Average
Below average Poor
6% 33% 37% 20% 4% 0%
7% 18% 27% 20% 3%
25% (135) Have you ever officially terminated an employee during the probationary period?
Yes No
6% 94%
7% 93%
(136) Have you ever encouraged an employee to leave voluntarily during the probationary period?
Yes No
9% 91%
6% 94%

Volume II Technical Report
AcqDemo Interim Evaluation Report II-19
Question % of respondents Demo
% of respondents Comp
(137) For the most recent hire, how much time (in weeks) elapsed from submission of the request for personnel action (SF-52) to the extension of the firm job offer?
4 or fewer weeks
5-8 weeks 9-16 weeks
17-25 weeks more than 25 weeks
12% 25% 34% 17% 13%
2% 12% 24% 28% 34%
(138) For the most recent hire, how many offers were made before a candidate accepted the job?
One (the top candidate accepted the job) Two
Three Four
Five or more No offer was made
73% 12% 3% 3% 1% 8%
73% 8% 7% 1% 1%
10%

Volume II Technical Report
AcqDemo Interim Evaluation Report II-20
Survey Responses: 1998, 2001, and 2003
Table 13 shows response data for those questions common to the 1998. 2001, and 2003 surveys.
Table 13: 1998, 2001, and 2003 Survey Responses
% Favorable % Unfavorable Question (2003/2001/1998) 2003 2001 Base 2003 2001 Base
(16/14/19) Pay progression, the way I move up within my grade or band is fair. 54% 41% 45% 30% 40% 30%
(17/15/24) My (OCS / performance rating) represents a fair and accurate picture of my actual (contribution to the mission / performance).
54% 42% 75% 33% 42% 14%
(18/16/28) All in all, I am satisfied with my pay. 57% 47% 49% 32% 39% 32% (20/17/38) Pay raises depend on my contribution to the organization's mission. 59% 51% 20% 28% 33% 54%
(35/18/40) My cash awards depend upon (my contribution to the organization’s mission/how well I perform). 56% 50% 58% 28% 34% 24%
(19/19/20) Pay is administered fairly. 39% 29% 40% 37% 46% 29% (48/20/54) Pay differentials here fairly represent real differences in levels of responsibility and job difficulty. 28% 22% 22% 43% 51% 51%
(21/22/21) I am satisfied with my chances for advancement. 45% 33% 31% 38% 47% 52%
(49/24/55) In this organization, I don’t have to become a supervisor to receive more pay. 54% 52% 40% 26% 27% 40%
(88/27/111) My supervisor sets clear (contribution) goals for me. 53% 38% 57% 28% 40% 23%
(90/30/116) I have trust and confidence in my supervisor. 66% 60% 63% 18% 23% 18% (91/31/118) My supervisor gives me adequate (feedback/information) on how well I am (contributing/performing).
61% 48% 55% 25% 33% 23%
(92/32/122) My supervisor and I agree on what (contribution/good performance) on my job means. 60% 47% 63% 20% 25% 14%
(75/37/98) In my organization, products and services are designed to meet customer needs and expectations. 70% 72% 71% 13% 9% 9%
(76/39/93) Employees in my organization have a good understanding of who their customers are. 78% 79% 79% 12% 9% 10%
(77/40/96) Overall, my organization is effective in accomplishing its objectives. 74% 76% 74% 11% 10% 9%
(79/41/95) I understand the mission of this organization. 91% 92% 89% 4% 3% 4% (106/44/126a) I am in favor of the demonstration project for my organization. 52% 36% 25% 30% 47% 48%
(53/47/64) This organization is able to attract high-quality candidates. 47% 30% 28% 26% 36% 35%
(59/48/75) During the next year, I will probably look for a new job outside this organization. 39% 41% 38% 34% 33% 38%
(67/49/83) I have the opportunity to take advantage of sabbatical leave. 15% 12% 7% 26% 38% 55%

Volume II Technical Report
AcqDemo Interim Evaluation Report II-21
% Favorable % Unfavorable Question (2003/2001/1998) 2003 2001 Base 2003 2001 Base
(57/51/63) It takes too long to process the paperwork needed to fill vacancies here. 55% 76% 57% 10% 11% 10%
(120/52/136) The skills and abilities of the most recent candidate I hired were a good match for the job. 76% 62% 56% 6% 13% 11%
(121/57/127) I have the authority to hire people with the right skills when I need them. 25% 40% 33% 29% 39% 55%
Question (2003/2001/1998) 2003 2001 Baseline
(134/58/139) If you have hired someone in the past year, what was your assessment of the overall capabilities of the person hired compared to the rest of your workforce?
Top 1% Top 10% outstanding
Top 25% very good Average
Below average Poor
6% 33% 37% 20% 4% 0%
3% 16.5% 24% 16% 2.5% 1%
4% 18% 17% 16% 3% 3%
Survey Responses: 2001 and 2003
The questions in Table 14 were not included on the Baseline (1998) survey.
Table 14: 2001 and 2003 Survey Responses
% Favorable % Unfavorable Question (2003/2001) 2003 2001 2003 2001
(30/21) Contribution-based compensation and assessment system (CCAS) self-assessment provided me a good opportunity to influence my contribution assessment.
55% 39.5% 27% 40%
(31/25) CCAS is administered without regard to gender, ethnic origin, or age in this organization. 62% 52% 16% 20%
(33/42) Overall, the demonstration project is an improvement over the previous performance rating and compensation system.
46% 34% 33% 46%
(40/23) Pay pool panels are fair in recognizing individual contributions. 37% 25% 35% 47%
(47/29) I have enough flexibility in my job to initiate tasks that will enhance my contribution to the mission. 68% 65.5% 19% 21%
(72/43) I have received sufficient training to prepare me for participation in the demonstration project. 64% 55.5% 17% 23.5%
(73/50) This organization offers employees the opportunity for academic degree and certificate training. 61% 60.5% 17% 18%
(84/36) When changes are made in this organization, the employees usually lose out in the end. 30% 38% 33% 28%

Volume II Technical Report
AcqDemo Interim Evaluation Report II-22
% Favorable % Unfavorable Question (2003/2001) 2003 2001 2003 2001
(85/38) Overall, our customers are satisfied with the support and services provided by my organization. 69% 70% 12% 9.5%
(100/28) My supervisor assigns me tasks that allow me to contribute to the mission in a meaningful way. 67% 53% 16% 27.5%
(101/33) My supervisor tends to inflate the contribution ratings of the employees he/she supervises. 9% 9% 56% 52.5%
(102/35) My supervisor tends to deflate the contribution ratings of the employees he/she supervises. 14% 13% 47% 43%
(105/34) Senior leaders in my organization support the demonstration project. 70% 61% 6% 9%
(130/53) Job classification is easier and faster under the demonstration project than under the previous system. 35% 33.5% 18% 32%
(131/54) In the last CCAS cycle, the pay pool panel generally agreed with the contribution ratings I gave to my immediate employees.
66% 63% 16% 9%
(132/55) I have received sufficient training to prepare me for supervisory responsibilities in the demonstration project.
68% 68% 15% 16%
(133/56) The demonstration project provides supervisors with effective tools to improve employee contributions. 55% 49% 19% 25%
Question (2003/2001) % of respondents 2003
% of respondents 2001
(137/59) For the most recent hire, how much time (in weeks) elapsed from submission of the request for personnel action (SF-52) to the extension of the firm job offer?
4 or fewer weeks
5-8 weeks 9-16 weeks
17-25 weeks more than 25 weeks
12% 25% 34% 17% 13%
7% 24% 35%
22.5% 11.5%
(138/60) For the most recent hire, how many offers were made before a candidate accepted the job?
One (the top candidate accepted the job) Two
Three Four
Five or more No offer was made
73% 12% 3% 3% 1% 8%
64.5% 17% 7% 1% 0%
10.5%

Volume II Technical Report
AcqDemo Interim Evaluation Report II-23
Survey Responses: 1998, 2000, 2001, and 2003
The questions in Table 15 were included in the three AcqDemo surveys as well as in a survey of the acquisition workforce conducted by the DoD Acquisition Reform Office in 2000.
Table 15: 1998, 2000, 2001, and 2003 Survey Responses
% Favorable % Unfavorable Question (1998/2001/2003) 1998 2000 2001 2003 1998 2000 2001 2003
(93/39/76) Employees in my organization have a good understanding of who their customers are.
79% 77% 79% 78% 10% 11% 9% 12%
(116/30/90) I have trust and confidence in my supervisor. 63% 64% 60% 66% 18% 16% 23% 18%
(98/37/75) In my organization, products and services are designed to meet customer needs and expectations.
71% 74% 72% 70% 9% 9% 9% 13%
(95/41/79) I understand the mission of this organization. 89% 88% 92% 91% 4% 4% 3% 4%
(40/96/77) Overall, my organization is effective in accomplishing its objectives. 74% 74% 76% 74% 9% 8% 10% 11%

Volume II Technical Report
AcqDemo Interim Evaluation Report II-24
B. Specific Data for Primary Interventions In accordance with the evaluation plan, analyses were identified for each of the 11 AcqDemo interventions that would address over time, and in relation to the comparison group, changes in variables that are the indicators of expected effects for each intervention. In the following sections, each intervention is briefly described, and this description is followed by data from one ore more of the following sources: survey data, workforce data, CCAS data, and/or Personnel Office data. Where applicable, inferential statistical analyses were performed, and the results (showing when statistical significance was obtained) are indicated in the appropriate tables. In the case of survey data, composite variables were identified in some cases. To reduce redundancy and increase the interpretability of the attitude survey data, variables that seemed logically related were grouped together. Then the internal consistency of the variable groupings was tested using alpha.2 Composites with alpha levels of 6 or higher were retained. For significance tests, mean differences in attitude survey variables were tested using t-tests.3 T-tests were performed to test for significant differences between the acqdemo and comparison group in a single year. The t-test assumes that knowing the value of one survey answer does not give you information about the value of another survey answer (this is called the assumption of independence). Because the same people may have completed the survey in multiple years, the survey answers are probably not independent. Therefore, to avoid violating the assumption of independence, t- tests were not performed to test for mean differences across years. Because of the large number of t-tests conducted, the potential for erroneously finding a statistically significant result is inflated. Therefore, a more conservative critical value than the standard value (.01 and .05 respectively) was used to determine statistical significance. A determination of statistical significance was made if the p value was less than .01.
1. Simplified Accelerated Hiring Three changes were made to the Title 5 recruitment and selection procedures to enhance the AT&L workforce’s ability to compete with the private sector in attracting highly qualified new hires:
- Competitive examining authority for the hiring and appointment of candidates into permanent and non-permanent positions was delegated to the Components. The Components could, in turn, re-delegate to lower levels.
- Eligible candidates are placed into three quality groups (basically qualified, highly qualified,
or superior) instead of consideration according to the “rule of three.” After assignment to a quality group, any applicable veterans’ preference points are added, preserving veterans’ preference eligibility. (Note that this feature was originally labeled as “Expanded Candidate Selection Process” and listed as a Secondary Intervention in the AcqDemo Evaluation Plan
2 Alpha (called Cronbach’s alpha) is a model of internal consistency, based on the average inter-item correlation. Alpha gives a measure of how well a set of items vary consistently across people, providing evidence that the items are measuring a single construct. 3 The t-test assesses whether the means of two groups are statistically different from each other. This analysis is appropriate whenever you want to compare the means of two groups. The t-test gives the probability that the difference between the two means is caused by chance. It is customary to say that if this probability is less than 0.05, the difference is 'significant'; i.e., the difference is not caused by chance.

Volume II Technical Report
AcqDemo Interim Evaluation Report II-25
because it has been tried out in several other demonstration projects. However, this categorical ranking process is an integral part of AcqDemo’s hiring flexibilities, and is therefore treated as such in this evaluation report.)
- Scholastic Achievement Appointment Authority was added to facilitate the rapid appointment
of degreed candidates to positions in broadband level II with positive education requirements. Degree of Implementation: Hiring flexibilities were implemented at some level across all participating components. The Air Force, with nearly 2000 AcqDemo participants, most systematically and forcefully managed this intervention. The survey results show a statistically significant, more positive perception of the quality of new hires in AcqDemo versus the comparison group. In addition, on a composite of survey questions related to satisfaction with new hire competence, favorable responses from AcqDemo employees and managers grew from 62% to 73% over the period 1998 to 2003. In the comparison group, the favorable response rate remained at 66% throughout the period.
Survey Data The following table shows the response results for a composite of questions regarding relative competence of new hires in several occupational groups:
Table 16
New Hires Composite Satisfaction with new
hire competence Acq200 (includes 109a-109o) Not
Favorable Favorable
Male 34.3% 65.7% What is your gender?
Female* 38.4% 61.6% White 34.4% 65.6%
What is your race? Non-white 40.7% 59.3% Non-Supervisor 39.1% 60.9% What is your current
level of supervisory responsibility? Supervisor 31.4% 68.6%
1998 AcqDemo Baseline 38.5% 61.5% 1998 Comparison 34.3% 65.7% 2001 AcqDemo .0% .0% 2001 Comparison .0% .0% 2003 AcqDemo 33.9% 66.1%
Overall Survey Responses
2003 Comparison 26.8% 73.2%
*Indicates a significant mean difference, p<.01

Volume II Technical Report
AcqDemo Interim Evaluation Report II-26
• Perceived Quality of New Hires:
Table 17: Ability to Attract High-Quality Candidates
This organization is able to attract high-quality candidates. Question 53
Strongly disagree Disagree
Neither agree nor disagree Agree
Strongly agree
Male 11.7% 22.5% 31.0% 29.0% 5.8% What is your gender? Female 9.6% 19.3% 35.7% 29.0% 6.3%
White 10.1% 21.9% 31.6% 30.1% 6.2% What is your race? Non-white 12.9% 18.8% 38.1% 25.1% 5.1%
Non-Supervisor 10.8% 19.7% 35.7% 27.9% 5.8% What is your current level of supervisory responsibility?
Supervisor 10.7% 23.4% 29.0% 30.7% 6.2%
1998 Acq Demo Baseline 12.2% 22.8% 37.2% 23.1% 4.8% 1998 Comparison 8.6% 21.4% 34.3% 28.3% 7.5% 2001 Acq Demo 14.8% 21.6% 33.9% 24.6% 5.1% 2001 Comparison 3.1% 14.7% 24.0% 51.2% 7.0% 2003 Acq Demo 6.7% 18.5% 27.9% 38.8% 8.0%
Overall Survey Responses
2003 Comparison 5.6% 24.6% 24.3% 39.9% 5.6%
• Perceived Hiring Flexibility and Timelines:
Table 18: Hiring Flexibility
I am satisfied with the process used to fill vacancies here. Question 56
Strongly disagree Disagree
Neither agree nor disagree Agree
Strongly agree
Male 18.6% 26.3% 28.4% 22.5% 4.2% What is your gender?
Female 18.7% 29.6% 28.6% 20.3% 3.0% White 17.4% 28.0% 27.7% 23.1% 3.8%
What is your race? Non-white 23.3% 26.9% 31.2% 15.2% 3.3% Non-Supervisor 19.6% 27.8% 31.1% 18.7% 2.8% What is your current
level of supervisory responsibility? Supervisor 17.2% 27.4% 24.5% 25.9% 4.9%
1998 Acq Demo Baseline 20.7% 30.9% 28.7% 16.6% 3.0%
1998 Comparison 27.7% 30.9% 22.5% 16.1% 2.8% 2001 Acq Demo .0% .0% .0% .0% .0% 2001 Comparison .0% .0% .0% .0% .0% 2003 Acq Demo 13.9% 22.7% 29.7% 28.9% 4.8%
Overall Survey Responses
2003 Comparison 15.7% 26.1% 27.6% 27.6% 3.0%

Volume II Technical Report
AcqDemo Interim Evaluation Report II-27
Table 19:
Hiring Timeliness
It takes too long to process the paperwork to fill vacancies here. Question 57
Strongly disagree Disagree
Neither agree nor disagree Agree
Strongly agree
Male 2.8% 7.2% 31.4% 32.0% 26.6% What is your gender?
Female 3.0% 7.0% 30.3% 33.9% 25.9% White 2.3% 7.0% 28.8% 33.9% 27.9%
What is your race? Non-white 4.9% 7.6% 39.5% 28.9% 19.1% Non-Supervisor 3.0% 6.9% 38.2% 31.8% 20.2% What is your current
level of supervisory responsibility? Supervisor 2.6% 7.4% 22.0% 34.1% 33.8%
1998 Acq Demo Baseline 3.8% 6.6% 32.7% 30.3% 26.7%
1998 Comparison 1.9% 4.9% 26.9% 36.1% 30.1% 2001 Acq Demo 1.0% 10.3% 12.5% 35.1% 41.0% 2001 Comparison .0% 4.5% 13.6% 36.4% 45.5% 2003 Acq Demo* 2.0% 8.2% 34.5% 34.2% 21.1%
Overall Survey Responses
2003 Comparison* 3.8% 3.4% 25.4% 39.4% 28.0%
*Indicates a significant mean difference, p<.01
Workforce Data
Following are the specific workforce data tables relevant to this intervention:
• Distribution of Education Level for All Employees and for New Hires Within Past Year
Table 20:
Education Level for AcqDemo Total Comparison Group New Hires 12/2000 12/2001 12/2002 12/2000 12/2001 12/2002
High School Graduate or Less 21.7% 22.9% 23.7% 46.6% 46.8% 33.8% Terminal Occupation Program 1.5% 1.6% 1.5% 0.0% 0.3% 0.0% Some College/Associate’s Degree 24.5% 24.0% 23.0% 12.1% 9.4% 12.3%
Bachelor’s Degree 26.0% 25.3% 25.9% 21.4% 20.4% 30.8% Some Graduate School 6.6% 6.2% 5.9% 3.1% 2.7% 2.5% Master’s Degree 17.1% 17.1% 17.5% 16.8% 18.2% 19.4% Some Graduate School Beyond Master’s Degree 1.6% 1.7% 1.5% 0.0% 0.9% 0.8%
Doctorate or Higher 1.0% 1.1% 1.0% 0.0% 0.6% 0.4% Number of New Hires:* 131 329 238 *New hires are employees with a service computation date of 1 year or less.

Volume II Technical Report
AcqDemo Interim Evaluation Report II-28
Table 21:
Education Level for Comparison Group Total Comparison Group New Hires 12/2000 12/2001 12/2002 12/2000 12/2001 12/2002
High School Graduate or Less 10.7% 13.7% 15.2% 39.1% 58.6% 35.6% Terminal Occupation Program 2.6% 2.4% 2.1% 0.0% 0.0% 2.2% Some College/Associate’s Degree 24.1% 23.2% 24.0% 30.5% 11.4% 11.1%
Bachelor’s Degree 23.6% 23.7% 23.5% 17.4% 20.0% 22.2% Some Graduate School 10.7% 10.0% 8.6% 4.3% 1.4% 0.0% Master’s Degree 26.0% 24.7% 24.6% 8.7% 7.1% 28.9% Some Graduate School Beyond Master’s Degree 1.3% 1.3% 1.1% 0.0% 0.0% 0.0%
Doctorate or Higher 1.0% 1.0% 0.9% 0.0% 1.4% 0.0% Number of New Hires: 23 70 45 *New hires are employees with a service computation date of 1 year or less.
• Number/rate of Separations During Probation Period
Table 22: Separations by Type for AcqDemo
2000 (% of
population)
2001 (% of
population)
2002 (% of
population) During probationary period 2 (0.04%) 1 (0.01%) 0 (0.0%) Resignation 113 (2.2%) 56 (1.0%) 71 (1.2%) Retirement 82 (1.6%) 69 (1.2%) 182 (3.0%) Removal 5 (0.1%) 1 (0.01%) 1 (0.01%) Death 12 (0.2%) 5 (0.09%) 9 (0.2%) RIF 0 (0.0%) 0 (0.0%) 0 (0.0%) Termination 56 (1.1%) 44 (0.8%) 74 (1.2%)
Total # of employees separated 270 176 337

Volume II Technical Report
AcqDemo Interim Evaluation Report II-29
Table 23: Separations by Type for Comparison Group
2000 (% of
population)
2001 (% of
population)
2002 (% of
population) During probationary period 0 (0.0%) 1 (0.07%) 0 (0.0%) Resignation 21 (1.6%) 34 (2.5%) 69 (5.0%) Retirement 31 (2.4%) 64 (4.8%) 100 (7.2%) Removal 2 (0.2%) 1 (0.07%) 2 (0.1%) Death 2 (0.2%) 2 (0.1%) 3 (0.2%) RIF 0 (0.0%) 0 (0.0%) 3 (0.2%) Termination 20 (1.5%) 19 (1.4%) 59 (4.3%)
Total # of employees separated 76 121 236
Personnel Office Data • Offer/acceptance ratios—data were collected initially, but did not show any meaningful trend,
i.e., the ratio was uniformly in excess of 99%; therefore, it was not used in this analysis. • Hiring timeliness—see tables below derived from Personnel Office data through annual data
calls.
Table 24
Hiring Timeliness, CY 1999-2002: Days to Referral List Air Force Army AT&L Navy USMC
Demo Non Demo Non Demo Non Demo Non Demo Non 1999 56.2 63.1 N/A N/A 89.9 N/A N/A N/A N/A N/A 2000 69.0 69.0 90.0 N/A 103.9 78.1 60.0 N/A 63.5 N/A 2001 32.0 81.0 63.3 60.0 66.0 65.0 39.0 37.0 69.0 40.0 2002 32.3 120.6 54.4 60.0 44.8 40.5 28.0 24.0 67.4 40.0
Table 25 Hiring Timeliness, CY 1999-2002: Days to Selection Made
Air Force Army AT&L Navy USMC Demo Non Demo Non Demo Non Demo Non Demo Non
1999 119.9 93.1 N/A N/A 119.1 N/A N/A N/A N/A N/A 2000 81.0 106.0 133.0 N/A 133.8 94.0 74.0 N/A 101.1 N/A 2001 47.0 112.8 122.4 90.0 98.0 88.0 79.0 70.0 91.0 75.0 2002 50.8 154.4 99.1 90.0 75.2 65.5 47.5 48.0 95.8 75.0

Volume II Technical Report
AcqDemo Interim Evaluation Report II-30
Table 26
Hiring Timeliness, CY 1999-2002: Days to Entry on Duty (EOD) Air Force Army AT&L Navy USMC Demo Non Demo Non Demo Non Demo Non Demo Non
1999 150.1 130.0 N/A N/A 123.6 N/A N/A N/A N/A N/A 2000 106.0 126.0 168.0 N/A 140.3 139.7 90.0 N/A 122.5 N/A 2001 67.0 151.5 163.2 120.0 109.0 109.7 113.0 117.0 114.0 90.0 2002 71.0 187.7 154.3 120.0 110.4 91.0 61.0 88.0 140.1 90.0
2. CCAS CCAS measures employee contribution to the mission and goals of the organization, rather than job performance as defined by a job description and performance standards. The purpose of CCAS is to provide an equitable and flexible method for appraising and compensating the AT&L workforce. Contribution is measured by using a set of factors, discriminators, and descriptors, each of which is relevant to the success of a DoD acquisition organization. Each factor has multiple levels of increasing contribution and contains descriptors for each respective level within the relevant career path. Annual Objectives are jointly developed by the employee and supervisor. These Objectives are tied directly to the mission of the organization. Employees are assessed on accomplishment of these objectives and their contributions in each of the six factors. An overall contribution score (OCS) is derived and is used by a panel of managers and a pay pool manager to determine pay increases and contribution awards. Under CCAS, the annual general pay increase is not automatic, and the funds for this increase as well as those for step increases and awards are distributed among all participants according to their contribution. More detailed descriptions of CCAS, as well as the results of four annual payouts, are included in Volume III—Appendix E. Degree of Implementation: CCAS was fully implemented across all participating components, and received the majority of the time and resources devoted to AcqDemo implementation.
CCAS Data
Under CCAS, each employee’s contribution to the organization’s mission is measured on the following six factors: • Problem Solving • Teamwork and Cooperation • Customer Relations • Leadership and Supervision • Communication • Resource Management Each employee’s Overall Contribution Score (OCS) is the weighted average of the six factor scores. For the first four cycles, all factor weights were set to 1.0; in the future the weights may vary by Occupational Series.

Volume II Technical Report
AcqDemo Interim Evaluation Report II-31
As shown in Table 27, the AcqDemo workforce is divided into three career paths and four broadbands with different OCS and pay ranges.
Table 27:
AcqDemo Broadbands and Career Paths Broadband Business and Technical
Management Professional (NH)Technical Management
Support (NJ)Administrative Support
(NK)I OCS = 0-29
Pay = GS-1 to 4OCS = 0-29
Pay = GS-1 to 4OCS = 0-29
Pay = GS-1 to 4II OCS = 22-66
Pay = GS-5 to 11OCS = 22-51
Pay = GS-5 to 8OCS = 22-46
Pay = GS-5 to 7III OCS = 61-83
Pay = GS-12 to 13OCS = 43-66
Pay = GS-9 to 11OCS = 38-61 (70)Pay = GS-8 to 10
IV OCS = 79-100 (115)Pay = GS-14 to 15
OCS = 61-83 (95)Pay = GS-12 to 13
N/A
As shown in the figure below, pay is linked to contribution through a series of curves that define a Normal Pay Range (NPR). The middle of the NPR is an exponential curve called the Standard Pay Line (SPL). The SPL is constructed such that an OCS of zero equates to the annual basic pay of a GS-1/step 1, while an OCS of 100 equates to the annual basic pay of a GS-15/step 10. The base represents the percent change in pay associated with a contribution change of one OCS point. It changes slightly from one year to next. The upper boundary of the NPR is 8% above the SPL, while the lower boundary is 8% below the SPL. Employees whose basic pay falls within the NPR for their OCS are considered appropriately compensated for their level of contribution. For a given level of basic pay, the SPL can be used to determine an employee’s expected OCS; conversely, for a given OCS, the SPL can be used to determine an employee’s target pay. The target can also be the upper or lower boundary of the NPR.
Chart 1: The Normal Pay Range
Zone C = NormalPay Range
$0
$20,000
$40,000
$60,000
$80,000
$100,000
$120,000
$140,000
$160,000
0 10 20 30 40 50 60 70 80 90 100 110
OCS
Basi
c Pa
y
Standard Pay Line (SPL) = (GS-1/step 1 pay) * (Base)OCS
Upper Rail = 1.08 * SPLLower Rail = .92 * SPL
OCS∆
∆ Y
TargetPay
Expected OCS
Zone C =Normal
Pay Range
Zone A = InappropriatelyCompensated - Above the Rails
Zone B = InappropriatelyCompensated - Below the Rails

Volume II Technical Report
AcqDemo Interim Evaluation Report II-32
Chart 2:
1999 – 2002 Total Zone Distribution
C
B
A
C
B
A
C
B
A
N = 4,700A = 6.7%B = 30.3%C = 62.9%
1999 2000 2001 2002
N = 5,083A = 2.3%B = 31.3%C = 66.6%
N = 5,335A = 2.2%B = 28.4%C = 69.4%
N = 5,568A = 1.6%B = 26.7%C = 71.7%
C
B
A
C
B
A
C
B
A
C
B
A
N = 4,700A = 6.7%B = 30.3%C = 62.9%
1999 2000 2001 2002
N = 5,083A = 2.3%B = 31.3%C = 66.6%
N = 5,335A = 2.2%B = 28.4%C = 69.4%
N = 5,568A = 1.6%B = 26.7%C = 71.7%
C
B
A
Chart 3: 1999 AcqDemo Scatter Plot
$10,000
$25,000
$40,000
$55,000
$70,000
$85,000
$100,000
$115,000
0 10 20 30 40 50 60 70 80 90 100 110
OCS
Zone A = 6.7%Zone C = 63.0%Zone B = 30.3%
$10,000
$25,000
$40,000
$55,000
$70,000
$85,000
$100,000
$115,000
0 10 20 30 40 50 60 70 80 90 100 110
OCS
Zone A = 6.7%Zone C = 63.0%Zone B = 30.3%

Volume II Technical Report
AcqDemo Interim Evaluation Report II-33
Chart 4: 2000 AcqDemo Scatter Plot
$10,000
$25,000
$40,000
$55,000
$70,000
$85,000
$100,000
$115,000
0 10 20 30 40 50 60 70 80 90 100 110
OCS
Zone A = 2.3%Zone C = 66.6%Zone B = 31.3%
$10,000
$25,000
$40,000
$55,000
$70,000
$85,000
$100,000
$115,000
0 10 20 30 40 50 60 70 80 90 100 110
OCS
Zone A = 2.3%Zone C = 66.6%Zone B = 31.3%
Chart 5: 2001 AcqDemo Scatter Plot
$10,000
$25,000
$40,000
$55,000
$70,000
$85,000
$100,000
$115,000
0 10 20 30 40 50 60 70 80 90 100 110OCS
Zone A = 2.2%Zone C = 69.4%Zone B = 28.4%
$10,000
$25,000
$40,000
$55,000
$70,000
$85,000
$100,000
$115,000
0 10 20 30 40 50 60 70 80 90 100 110OCS
Zone A = 2.2%Zone C = 69.4%Zone B = 28.4%

Volume II Technical Report
AcqDemo Interim Evaluation Report II-34
Chart 6:
2002 AcqDemo Scatter Plot
$10,000
$25,000
$40,000
$55,000
$70,000
$85,000
$100,000
$115,000
0 10 20 30 40 50 60 70 80 90 100 110OCS
Zone A = 1.6%Zone C = 71.7%Zone B = 26.7%
$10,000
$25,000
$40,000
$55,000
$70,000
$85,000
$100,000
$115,000
0 10 20 30 40 50 60 70 80 90 100 110OCS
Zone A = 1.6%Zone C = 71.7%Zone B = 26.7%
Chart 7: Withheld GPI
Component GPI GPI Withheld GPI GPI Withheld GPI GPI Withheld GPI GPI WithheldArmy 31 15 $84,183 21 4 $29,757 12 4 $24,080 10 0 $17,816 Navy 31 28 $111,981 8 0 $15,287 3 0 $8,354 . 0 .
USMC 17 21 $66,475 10 0 $16,260 10 0 $20,944 12 0 $19,495 USAF 128 0 $243,467 43 0 $56,037 63 0 $104,139 43 0 $63,606 OSD 3 0 $6,743 4 0 $7,125 4 0 $8,366 Total 207 64 $489,096 85 4 $124,084 92 4 $164,642 69 0 $109,283
Part. Total2002
NO Part. TotalNO Part. Total NO No Part. Total1999 2000 2001
1999 2000 2001 2002Employees in Zone A 316 116 117 93
On Retained Pay 25 13 18 18
Not on Retained Pay 291 103 99 75 Received No GPI 207 85 92 69
Received Partial GPI 64 4 4 0 Received Full GPI 20 14 3 6

Volume II Technical Report
AcqDemo Interim Evaluation Report II-35
Chart 8:
Required MFRs and CIPs4
MFR CIP MFR CIP MFR CIP MFR CIPArmy 14 3 0 0 3 0 17 3Navy 0 0 0 0 0 0 0 0USMC 9 0 0 0 2 1 11 1USAF 22 6 4 1 22 1 48 8OSD 3 0 0 0 2 0 5 02002 Total 48 9 4 1 29 2 81 122001 Total 64 6 7 3 36 1 107 102000 Total 73 6 14 2 20 1 107 91999 Total 217 13 34 1 48 3 299 17
Component NH NJ NK All
Chart 9: Average CRI $ by Career Path
Average CRI $
$0
$500
$1,000
$1,500
$2,000
1999 $1,549 $910 $810 $1,402
2000 $1,569 $892 $872 $1,432
2001 $1,718 $941 $971 $1,578
2002 $1,614 $1,018 $897 $1,496
NH NJ NK Total
Average CRI $
$0
$500
$1,000
$1,500
$2,000
1999 $1,549 $910 $810 $1,402
2000 $1,569 $892 $872 $1,432
2001 $1,718 $941 $971 $1,578
2002 $1,614 $1,018 $897 $1,496
NH NJ NK Total
4 AcqDemo policy requires that all employees in Zone A receive a Memorandum for the Record (MFR) notifying them of their status and the need to improve their contribution. Further, any employee with at least one factor score at or below the midpoint of the next lower broadband must be placed on a Contribution Improvement Plan (CIP).

Volume II Technical Report
AcqDemo Interim Evaluation Report II-36
Chart 10: Average CRI % by Career Path
Average CRI %
0.0
0.5
1.0
1.5
2.0
2.5
3.0
3.5
1999 2.72 2.41 3.03 2.752000 2.58 2.22 3.07 2.632001 2.74 2.28 3.25 2.782002 2.50 2.31 2.93 2.55
NH NJ NK Total
Chart 11: Average Raise (CRI + GPI) $ by Career Path
Average Raise $
$0$500
$1,000$1,500$2,000$2,500$3,000$3,500$4,000$4,500
1999 $3,752 $2,245 $1,847 $3,3822000 $3,318 $1,970 $1,681 $3,0082001 $4,143 $2,458 $2,070 $3,7802002 $3,758 $2,408 $1,893 $3,461
NH NJ NK Total

Volume II Technical Report
AcqDemo Interim Evaluation Report II-37
Chart 12: Average Raise (CRI + GPI) % by Career Path
Average Raise %
01
234
56
78
1999 6.32 5.77 6.66 6.342000 5.23 4.77 5.73 5.282001 6.23 6.46 6.71 6.312002 5.57 5.37 5.94 5.61
NH NJ NK Total
Chart 13: Average $ CA by Career Path
Average CA $
$0
$500
$1,000
$1,500
$2,000
1999 $1,123 $500 $560 $1,0002000 $1,413 $639 $647 $1,2572001 $1,583 $674 $761 $1,4242002 $1,581 $810 $799 $1,442
NH NJ NK Total

Volume II Technical Report
AcqDemo Interim Evaluation Report II-38
Chart 14:
Average % CA by Career Path
Average CA %
0.0
0.5
1.0
1.5
2.0
2.5
1999 1.80 1.28 1.99 1.802000 2.09 1.48 2.11 2.062001 2.26 1.56 2.36 2.242002 2.19 1.74 2.37 2.20
NH NJ NK Total
Chart 15: Category Movement By Ratings
FY 1999 to FY 2002
Inappropriately Compensated (A)
Appropriately Compensated (C)
Inappropriately Compensated (B)
1999
316
2002
18
Losses
170
2002
1182002
10
1999
1,426
2002
5
2002
6222002
434
Losses
365
Losses
9522002
322002
1,656
2002
3181999
2,958
New Hires38
New Hires723
New Hires1,594
Inappropriately Compensated (A)
Appropriately Compensated (C)
Inappropriately Compensated (B)
1999
316
2002
18
Losses
170
2002
1182002
10
2002
18
Losses
170
2002
1182002
10
1999
1,426
2002
5
2002
6222002
434
Losses
3652002
5
2002
6222002
434
Losses
365
Losses
9522002
322002
1,656
2002
318
Losses
9522002
322002
1,656
2002
3181999
2,958
New Hires38
New Hires723
New Hires1,594

Volume II Technical Report
AcqDemo Interim Evaluation Report II-39
Survey respondents increasingly agreed that high contributors tend to stay with the organization, while low contributors tend to leave. This perception is borne out by objective data (loss rates by zone) from the CCAS system displayed in the charts below.
Chart 16: Loss Rates by Zone
31.6%
53.8%
14.1%
32.2%
10.2%
25.6%
13.4%
31.6%
0%
10%
20%
30%
40%
50%
60%
2001 to 2002 1999 to 2002
Zone AZone CZone BTotal
Chart 17:
Loss Rates by Zone (One Year Rate Excludes Paypools 201 and 202)
29.8%
53.8%
10.7%
32.2%
9.5%
25.6%
10.8%
31.6%
0%
10%
20%
30%
40%
50%
60%
2001 to 2002 1999 to 2002
Zone AZone CZone BTotal

Volume II Technical Report
AcqDemo Interim Evaluation Report II-40
Survey Data The following composite of 10 related survey questions measures respondents’ perceptions of the linkage between contribution and rewards including pay raises, awards, and promotions.
Table 28
Contribution Reward Composite Contribution reward
linkage Composite 203 (includes Acq19, 20, 27, 28, 35, 36, 37, 38, 39, 48)
Not Favorable Favorable
Male 41.9% 58.1% What is your gender?
Female 48.1% 51.9% White 43.9% 56.1%
What is your race? Non-white 46.9% 53.1% Non-Supervisor 49.0% 51.0% What is your current
level of supervisory responsibility? Supervisor 38.3% 61.7%
1998 AcqDemo Baseline 39.2% 60.8%
1998 Comparison 53.0% 47.0% 2001 AcqDemo 55.7% 44.3% 2001 Comparison 66.7% 33.3% 2003 AcqDemo 39.4% 60.6%
Overall Survey Responses
2003 Comparison 37.5% 62.5%

Volume II Technical Report
AcqDemo Interim Evaluation Report II-41
One of the expected effects of CCAS is increased retention of high contributors and increased turnover of low contributors. The next two tables provide perceptual data related to this effect.
Table 29: Retention of High Contributors
High contributors tend to stay with this organization. Question 22
Strongly disagree Disagree
Neither agree nor disagree Agree
Strongly agree
Male 10.8% 21.1% 34.8% 25.5% 7.8% What is your gender? Female 10.2% 20.3% 36.4% 25.1% 8.0%
White 9.8% 21.2% 34.9% 25.7% 8.4% What is your race? Non-white 12.7% 18.9% 38.1% 23.9% 6.4%
Non-Supervisor 11.4% 20.9% 38.3% 22.5% 7.0% What is your current level of supervisory responsibility?
Supervisor 9.3% 20.7% 31.5% 29.2% 9.3%
1998 Acq Demo Baseline 10.4% 23.2% 34.2% 25.8% 6.4% 1998 Comparison 9.0% 26.7% 29.5% 26.5% 8.3% 2001 Acq Demo 12.7% 17.5% 39.7% 22.3% 7.7% 2001 Comparison 5.6% 17.5% 31.7% 40.5% 4.8% 2003 Acq Demo* 9.1% 17.7% 36.2% 26.3% 10.7%
Overall Survey Responses
2003 Comparison* 12.5% 33.0% 27.8% 22.3% 4.4%
*Indicates a significant mean difference, p<.01
Table 30: Losses of Low Contributors
Low contributors tend to leave this organization. Question 23
Strongly disagree Disagree
Neither agree nor disagree Agree
Strongly agree
Male 12.8% 27.7% 43.0% 13.5% 3.0% What is your gender?
Female 13.0% 28.7% 42.1% 12.2% 3.9% White 13.1% 29.3% 41.4% 12.9% 3.3%
What is your race? Non-white 12.1% 23.5% 47.3% 13.0% 4.1% Non-Supervisor 12.7% 26.5% 45.7% 11.8% 3.3% What is your current
level of supervisory responsibility? Supervisor 13.2% 30.6% 38.2% 14.4% 3.6%
1998 Acq Demo Baseline 15.7% 31.1% 37.9% 11.9% 3.5% 1998 Comparison 13.5% 34.4% 39.5% 9.2% 3.4% 2001 Acq Demo 11.0% 23.6% 48.8% 13.9% 2.7% 2001 Comparison 7.8% 27.9% 48.1% 11.6% 4.7% 2003 Acq Demo* 11.1% 25.4% 45.3% 14.3% 4.0%
Overall Survey Responses
2003 Comparison* 13.6% 40.1% 31.6% 12.1% 2.6%
*Indicates a significant mean difference, p<.01

Volume II Technical Report
AcqDemo Interim Evaluation Report II-42
CCAS is expected to increase employees’ perceptions of the link between contribution and rewards, while not compromising perceptions of fairness. The following 10 tables show survey results on items ranging from perceptions of fairness, recognition, and the linkage of both non-monetary and monetary rewards to employee contribution.
Table 31: Perceptions of Pay Fairness
Pay is administered fairly in this organization. Question 19
Strongly disagree Disagree
Neither agree nor disagree Agree
Strongly agree
Male 13.7% 18.6% 26.2% 32.5% 8.9% What is your gender?
Female 17.3% 22.5% 28.3% 25.4% 6.4% White 13.9% 20.1% 26.4% 31.0% 8.6%
What is your race? Non-white 20.3% 20.8% 29.3% 24.3% 5.4% Non-Supervisor 18.1% 20.5% 29.6% 25.6% 6.2% What is your current
level of supervisory responsibility? Supervisor 11.2% 20.1% 23.5% 35.0% 10.2%
1998 Acq Demo Baseline 9.5% 19.0% 31.1% 33.8% 6.7% 1998 Comparison 13.3% 19.4% 26.9% 33.5% 6.9% 2001 Acq Demo* 23.4% 22.7% 24.9% 22.3% 6.8% 2001 Comparison* 9.4% 17.2% 39.1% 31.3% 3.1% 2003 Acq Demo 17.4% 20.2% 23.6% 27.6% 11.1%
Overall Survey Responses
2003 Comparison 6.9% 21.5% 23.4% 42.0% 6.2%
*Indicates a significant mean difference, p<.01
Table 32: Financial Reward-Contribution Link
Under the present system, financial rewards are seldom related to employee contribution.
Question 27 Strongly disagree Disagree
Neither agree nor disagree Agree
Strongly agree
Male 6.9% 31.5% 21.8% 25.0% 14.8% What is your gender?
Female 6.0% 30.1% 23.1% 26.0% 14.7% White 6.6% 31.7% 21.7% 25.7% 14.2%
What is your race? Non-white 6.5% 28.0% 24.5% 24.3% 16.7% Non-Supervisor 5.6% 29.1% 24.3% 25.5% 15.5% What is your current
level of supervisory responsibility? Supervisor 8.0% 33.6% 19.4% 25.4% 13.6%
1998 Acq Demo Baseline 6.1% 29.4% 21.8% 27.4% 15.4%
1998 Comparison 3.9% 20.2% 18.9% 34.1% 23.0% 2001 Acq Demo .0% .0% .0% .0% .0% 2001 Comparison .0% .0% .0% .0% .0% 2003 Acq Demo* 7.9% 35.9% 24.4% 19.7% 12.1%
Overall Survey Responses
2003 Comparison* 6.6% 27.5% 18.7% 33.3% 13.9%
*Indicates a significant mean difference, p<.01

Volume II Technical Report
AcqDemo Interim Evaluation Report II-43
Table 33: External Equity
Other employers in this area pay more than the Government does for the kind of work I am doing.
Question 28 Strongly disagree Disagree
Neither agree nor disagree Agree
Strongly agree
Male 1.9% 7.2% 26.5% 33.8% 30.4% What is your gender?
Female 3.8% 11.4% 36.0% 28.5% 20.4% White 2.4% 9.6% 30.9% 31.9% 25.2%
What is your race? Non-white 4.0% 7.2% 30.6% 30.0% 28.3% Non-Supervisor 3.1% 9.5% 33.8% 30.5% 23.2% What is your current
level of supervisory responsibility? Supervisor 2.1% 8.2% 26.2% 33.2% 30.3%
1998 Acq Demo Baseline 1.8% 5.7% 29.3% 32.9% 30.4%
1998 Comparison 9.6% 22.5% 25.7% 22.5% 19.7% 2001 Acq Demo .0% .0% .0% .0% .0% 2001 Comparison .0% .0% .0% .0% .0% 2003 Acq Demo 2.2% 9.2% 34.6% 32.0% 22.0%
Overall Survey Responses
2003 Comparison 3.6% 17.5% 25.5% 31.0% 22.3%
Table 34: Awards-Contribution Link
In this organization, my cash awards depend on my contribution to the organization's mission.
Question 35 Strongly disagree Disagree
Neither agree nor disagree Agree
Strongly agree
Male 12.3% 15.5% 17.9% 41.1% 13.2% What is your gender?
Female 13.0% 17.0% 16.3% 39.3% 14.5% White 12.1% 16.5% 17.1% 40.5% 13.8%
What is your race? Non-white 13.8% 14.8% 17.3% 39.8% 14.4% Non-Supervisor 13.9% 16.9% 17.5% 39.1% 12.5% What is your current
level of supervisory responsibility? Supervisor 10.7% 15.0% 16.7% 41.9% 15.7%
1998 Acq Demo Baseline 9.2% 15.1% 18.1% 42.0% 15.6%
1998 Comparison 19.7% 16.7% 18.0% 36.7% 8.8% 2001 Acq Demo 16.9% 16.7% 16.6% 37.1% 12.6% 2001 Comparison 12.4% 20.2% 15.5% 38.8% 13.2% 2003 Acq Demo 11.8% 16.2% 15.9% 42.1% 14.0%
Overall Survey Responses
2003 Comparison 9.9% 19.0% 21.6% 38.8% 10.6%

Volume II Technical Report
AcqDemo Interim Evaluation Report II-44
Table 35: Monetary Reward-Contribution Link
High-contributing employees receive monetary rewards (e.g. cash rewards, bonuses, quality step increases).
Question 36 Strongly disagree Disagree
Neither agree nor disagree Agree
Strongly agree
Male 7.5% 14.0% 21.8% 42.8% 13.8% What is your gender?
Female 8.7% 16.0% 18.9% 42.0% 14.5% White 7.7% 15.5% 20.3% 42.5% 14.0%
What is your race? Non-white 9.0% 12.4% 21.3% 42.6% 14.8% Non-Supervisor 9.3% 15.4% 23.3% 40.2% 11.8% What is your current
level of supervisory responsibility? Supervisor 6.2% 14.2% 16.4% 45.7% 17.6%
1998 Acq Demo Baseline 6.1% 14.0% 18.3% 45.5% 16.1%
1998 Comparison 17.9% 26.3% 20.5% 27.6% 7.7% 2001 Acq Demo .0% .0% .0% .0% .0% 2001 Comparison .0% .0% .0% .0% .0% 2003 Acq Demo* 8.0% 13.1% 22.8% 42.2% 13.9%
Overall Survey Responses
2003 Comparison* 9.9% 17.5% 26.3% 40.1% 6.2%
*Indicates a significant mean difference, p<.01
Table 36:
Non-monetary Reward Link
High-contributing employees receive non-monetary rewards (e.g. plaques, letters of appreciation, public recognition).
Question 37 Strongly disagree Disagree
Neither agree nor disagree Agree
Strongly agree
Male 7.4% 17.1% 28.4% 39.6% 7.5% What is your gender?
Female 10.1% 21.4% 27.3% 33.7% 7.5% White 8.1% 19.3% 27.7% 37.7% 7.2%
What is your race? Non-white 10.0% 17.6% 29.6% 33.9% 9.0% Non-Supervisor 9.8% 20.3% 30.3% 33.3% 6.3% What is your current
level of supervisory responsibility? Supervisor 6.7% 16.8% 24.8% 42.5% 9.3%
1998 Acq Demo Baseline 8.1% 19.8% 27.4% 36.5% 8.2%
1998 Comparison 10.0% 18.4% 23.7% 41.2% 6.6% 2001 Acq Demo .0% .0% .0% .0% .0% 2001 Comparison .0% .0% .0% .0% .0% 2003 Acq Demo* 9.2% 18.7% 31.0% 34.8% 6.4%
Overall Survey Responses
2003 Comparison* 5.5% 13.2% 21.0% 50.7% 9.6%
*Indicates a significant mean difference, p<.01

Volume II Technical Report
AcqDemo Interim Evaluation Report II-45
Table 37: Supervisors’ Recognition of Individual Contributions
Supervisors are fair in recognizing individual contributions. Question 38
Strongly disagree Disagree
Neither agree nor disagree Agree
Strongly agree
Male 9.7% 15.1% 23.9% 41.9% 9.3% What is your gender?
Female 13.6% 21.4% 23.0% 33.8% 8.1% White 10.1% 17.4% 23.5% 40.1% 8.9%
What is your race? Non-white 15.9% 19.5% 24.0% 31.6% 9.0% Non-Supervisor 13.2% 19.6% 25.6% 33.8% 7.7% What is your current
level of supervisory responsibility? Supervisor 8.6% 15.1% 20.4% 45.4% 10.5%
1998 Acq Demo Baseline 11.2% 18.2% 25.0% 37.0% 8.6%
1998 Comparison 15.0% 19.2% 27.8% 32.3% 5.8% 2001 Acq Demo .0% .0% .0% .0% .0% 2001 Comparison .0% .0% .0% .0% .0% 2003 Acq Demo* 11.6% 17.5% 21.0% 39.8% 10.1%
Overall Survey Responses
2003 Comparison* 5.1% 14.6% 20.4% 53.3% 6.6%
*Indicates a significant mean difference, p<.01
Table 38: Supervisors’ Recognition of Team Contributions
Supervisors are fair in recognizing team contributions.
Question 39 Strongly disagree Disagree
Neither agree nor disagree Agree
Strongly agree
Male 8.2% 14.3% 28.2% 41.2% 8.1% What is your gender?
Female 10.5% 19.6% 27.9% 34.5% 7.4% White 8.0% 16.4% 28.2% 39.6% 7.7%
What is your race? Non-white 13.5% 17.1% 27.6% 33.2% 8.6% Non-Supervisor 10.3% 18.1% 29.7% 35.3% 6.6% What is your current
level of supervisory responsibility? Supervisor 7.5% 14.4% 25.3% 43.2% 9.7%
1998 Acq Demo Baseline 8.7% 18.1% 31.8% 34.3% 7.2%
1998 Comparison 10.8% 15.7% 29.1% 38.8% 5.6% 2001 Acq Demo .0% .0% .0% .0% .0% 2001 Comparison .0% .0% .0% .0% .0% 2003 Acq Demo* 10.2% 15.1% 24.0% 41.6% 9.1%
Overall Survey Responses
2003 Comparison* 3.7% 14.7% 17.9% 55.3% 8.4%
*Indicates a significant mean difference, p<.01
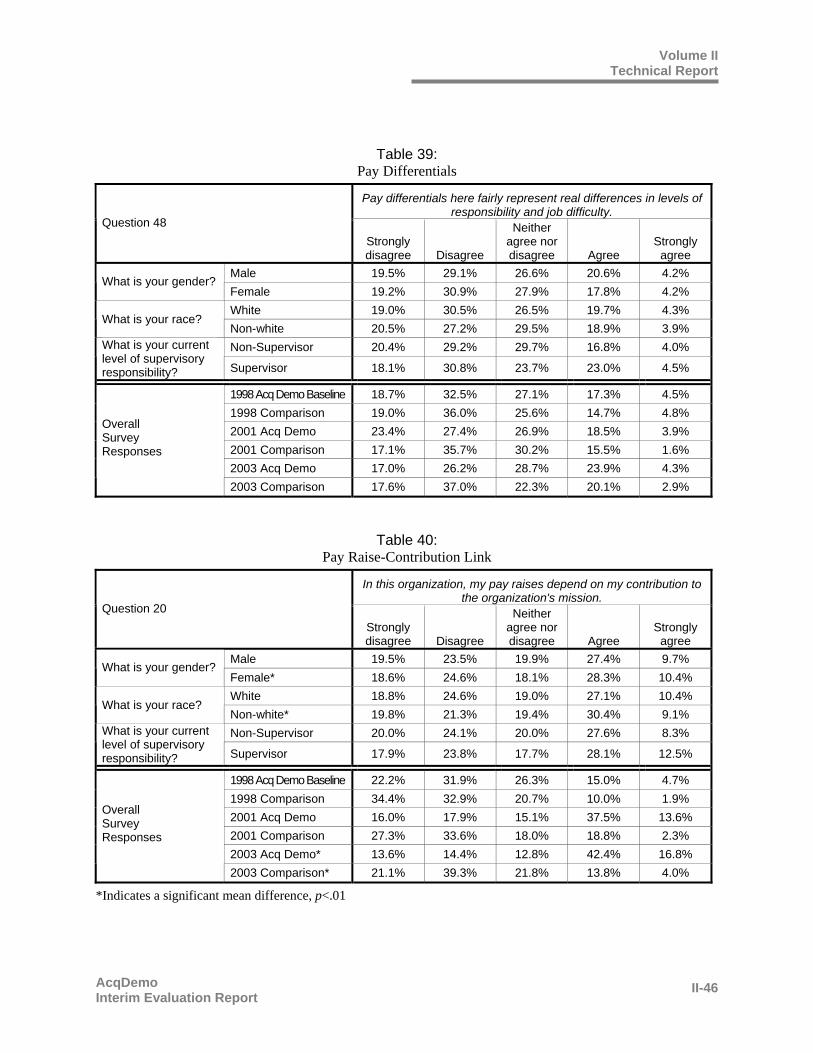
Volume II Technical Report
AcqDemo Interim Evaluation Report II-46
Table 39: Pay Differentials
Pay differentials here fairly represent real differences in levels of responsibility and job difficulty.
Question 48 Strongly disagree Disagree
Neither agree nor disagree Agree
Strongly agree
Male 19.5% 29.1% 26.6% 20.6% 4.2% What is your gender?
Female 19.2% 30.9% 27.9% 17.8% 4.2% White 19.0% 30.5% 26.5% 19.7% 4.3%
What is your race? Non-white 20.5% 27.2% 29.5% 18.9% 3.9% Non-Supervisor 20.4% 29.2% 29.7% 16.8% 4.0% What is your current
level of supervisory responsibility? Supervisor 18.1% 30.8% 23.7% 23.0% 4.5%
1998 Acq Demo Baseline 18.7% 32.5% 27.1% 17.3% 4.5% 1998 Comparison 19.0% 36.0% 25.6% 14.7% 4.8% 2001 Acq Demo 23.4% 27.4% 26.9% 18.5% 3.9% 2001 Comparison 17.1% 35.7% 30.2% 15.5% 1.6% 2003 Acq Demo 17.0% 26.2% 28.7% 23.9% 4.3%
Overall Survey Responses
2003 Comparison 17.6% 37.0% 22.3% 20.1% 2.9%
Table 40: Pay Raise-Contribution Link
In this organization, my pay raises depend on my contribution to the organization's mission.
Question 20 Strongly disagree Disagree
Neither agree nor disagree Agree
Strongly agree
Male 19.5% 23.5% 19.9% 27.4% 9.7% What is your gender?
Female* 18.6% 24.6% 18.1% 28.3% 10.4% White 18.8% 24.6% 19.0% 27.1% 10.4%
What is your race? Non-white* 19.8% 21.3% 19.4% 30.4% 9.1% Non-Supervisor 20.0% 24.1% 20.0% 27.6% 8.3% What is your current
level of supervisory responsibility? Supervisor 17.9% 23.8% 17.7% 28.1% 12.5%
1998 Acq Demo Baseline 22.2% 31.9% 26.3% 15.0% 4.7% 1998 Comparison 34.4% 32.9% 20.7% 10.0% 1.9% 2001 Acq Demo 16.0% 17.9% 15.1% 37.5% 13.6% 2001 Comparison 27.3% 33.6% 18.0% 18.8% 2.3% 2003 Acq Demo* 13.6% 14.4% 12.8% 42.4% 16.8%
Overall Survey Responses
2003 Comparison* 21.1% 39.3% 21.8% 13.8% 4.0%
*Indicates a significant mean difference, p<.01

Volume II Technical Report
AcqDemo Interim Evaluation Report II-47
3. Appointment Authority Appointment Authority: Under AcqDemo, there are three appointment options: permanent, temporary-limited, and modified term. The permanent and temporary-limited are the existing title 5 authorities. The new, modified term appointment authority provides the ability to expand and contract the workforce and adapt to variable workloads and mission changes. Under the modified term option, appointments may be made for a period that is expected to last longer than one year, but not to exceed five years, with an option for one additional year when the need for an employee’s service is not permanent. After two years under this appointment, an employee may be converted to permanent status through internal merit promotion procedures without further competition. Degree of Implementation: This intervention was implemented on a relatively limited basis, with approximately 40 modified term appointments being made each year. Survey results show that perceptions of the flexibility in personnel management systems have improved, with favorable responses increasing from 24.9% in 1998 to 38.9% in 2003.
Survey Data • The following table shows respondents’ perceptions on a composite of three questions relating
to flexibility of the personnel management system.
Table 41
Personnel System Composite
Personnel management system flexibility Composite 202 (includes Acq43, 44, 46) Not
Favorable Favorable Male 69.1% 30.9%
What is your gender? Female* 71.2% 28.8% White 70.8% 29.2%
What is your race? Non-white 67.3% 32.7% Non-Supervisor 69.1% 30.9% What is your current
level of supervisory responsibility? Supervisor 71.5% 28.5%
1998 AcqDemo Baseline 75.1% 24.9%
1998 Comparison 79.2% 20.8% 2001 AcqDemo .0% .0% 2001 Comparison .0% .0% 2003 AcqDemo* 61.1% 38.9%
Overall Survey Responses
2003 Comparison* 68.9% 31.1%
*Indicates a significant mean difference, p<.01

Volume II Technical Report
AcqDemo Interim Evaluation Report II-48
Workforce Data The following tables provide a general picture of the usage of non-permanent employment, to include both temporary and term/modified term appointments. These flexibilities have been used only to a limited extent, and there does not appear to be a significant pattern with regard to demographics.
Table 42: Transaction History
AcqDemo Comparison Group
2000 2001 2002 2000 2001 2002 Total (as of 12/2000; 12/2001; 12/2002) 5,068 5,527 6,011 1,312 1,338 1,389
Number of employees promoted 413 (8.1 %)
235 (4.3%)
309 (5.1%)
212 (16.2%)
128 (9.6%)
363 (26.1%)
Number of accessions during the year
265 (5.2%)
242 (4.4%)
365 (6.1%)
59 (4.5%)
148 (11.1%)
376 (27.1%)
Number of employees denied a WGI 0 (0.0%) 0 (0.0%) 0 (0.0%) 1 (0.08%) 0 (0.0%) 0 (0.0%)
Number of employees given a WGI 1 (0.02%) 2 (0.03%) 10 (0.2%) 542 (41.3%) 33 (2.5%) 235 (16.9%)Number of employees converted from non-permanent to permanent appointments
40 (0.8%)
29 (0.5%)
50 (0.8%)
25 (1.9%)
19 (1.4%)
66 (4.8%)
Number of employees on temporary appointment
15 (0.3%)
8 (0.1%)
8 (0.1%)
15 (1.1%)
6 (0.4%)
56 (4.0%)
Number of employees on term/modified term appointment
44 (0.9%)
38 (0.7%)
40 (0.7%)
17 (1.3%)
34 (2.5%)
38 (2.7%)
Table 43:
Profile of Non-permanent Employees AcqDemo Comparison Group 2000 2001 2002 2000 2001 2002
Female 66 (43.4%)
76 (44.4%)
44 (28.6%)
30 (32.3%)
41 (31.8%)
69 (32.4%)
Male 86 (56.6%)
95 (55.6%)
110 (71.4%)
62 (66.7%)
88 (68.2%)
144 (67.6%)
White 114 (75.0%)
133 (77.8%)
122 (79.2%)
74 (79.6%)
99 (76.7%)
169 (79.3%)
Black 21 (13.8%)
22 (12.9%)
15 (9.7%)
14 (15.1%)
20 (15.5%)
23 (10.8%)
Hispanic 12 (7.9%) 10 (5.8%) 10 (6.5%)
2 (2.2%)
4 (3.1%)
13 (6.1%)
Asian/Pacific Islander 5 (3.3%) 6 (3.5%) 7 (4.5%) 3 (3.2%) 5 (3.9%) 8 (3.8%) Other Race or National Origin 0 (0.0%) 0 (0.0%) 0 (0.0%) 0 (0.0%) 1 (0.8%) 0 (0.0%)
Veteran 70 (46.1%)
79 (46.2%)
83 (53.9%)
61 (65.5%)
91 (70.5%)
121 (56.8%)
# of non-permanent employees: 152 171 154 93 129 213

Volume II Technical Report
AcqDemo Interim Evaluation Report II-49
4. Simplified Classification System Simplified Classification System: Under AcqDemo, commanders (or equivalent) may re-delegate classification authority to subordinate management levels, at least one level above the first-line supervisor (except commander’s direct reports). CCAS descriptors are used for broadband level determination, instead of OPM standards. A new, simple Position Requirements Document (PRD) replaces the normal position description form. The PRD combines position information, staffing requirements, and contribution expectations into a single document. It includes job specific information and reference to the CCAS level descriptors. Degree of Implementation: This intervention was implemented by all components, with widespread use of the delegation of classification authority. With regard to classification, survey results show that participants increasingly believe the AcqDemo classification intervention has greater flexibility than the Title 5 system. On a composite of related questions, only 23.2% of AcqDemo respondents gave favorable responses in 1998, while 28% were favorable in 2003. Furthermore, favorable responses from the comparison group actually declined during the period, from 20.7% in 1998 to 14.4% in 2003.
Survey Data The following table shows responses on a composite of three survey questions related to classification system flexibility.
Table 44 Classification Composite
Classification system flexibility Composite 201 (includes Acq50-52)
Not Favorable Favorable
Male 76.0% 24.0% What is your gender?
Female* 75.3% 24.7% White 75.5% 24.5%
What is your race? Non-white* 75.6% 24.4% Non-Supervisor 75.8% 24.2% What is your current
level of supervisory responsibility? Supervisor 75.4% 24.6%
1998 AcqDemo Baseline 76.8% 23.2%
1998 Comparison 79.3% 20.7% 2001 AcqDemo .0% .0% 2001 Comparison .0% .0% 2003 AcqDemo* 72.0% 28.0%
Overall Survey Responses
2003 Comparison* 85.6% 14.4%
*Indicates a significant mean difference, p<.01

Volume II Technical Report
AcqDemo Interim Evaluation Report II-50
Personnel Office Data
Table 45: Simplified Classification Results
Measure 1998 (Pre-demo)
2000 2001 2002
Pages per PD/PRD 7.0 4.2 4.2 3.7 Average Staff Hours per PD/PRD 9.2 2.6 2.6 2.7
5. Academic Degree and Certificate Training Academic degree and certificate training: The Defense Acquisition Workforce Improvement Act (DAWIA) authorized degree and certificate training for DAWIA coded positions through the year 2001. AcqDemo extended this authority for the duration of the project to all employees in acquisition support positions identified in the project. Funding for academic degree and certificate training, while potentially available from numerous sources, is the responsibility of the participating organization. This intervention was implemented by all components, but with relatively limited intensity, due primarily to funding constraints. With regard to manager/employee satisfaction with academic degree and certificate training opportunities, there was not a significant difference between 2003 survey responses from the AcqDemo population and those of the comparison group. Focus group results and personnel office data both indicate that Academic Degree and Certificate training was not widely implemented, and DAWIA training was already available to many AcqDemo participants—two factors that help explain why there was no change in this indicator.
Survey Data The following table shows responses on a composite of three questions related to employees’ satisfaction with opportunities for training and development.
Table 46 Training Composite
Satisfaction with training and development Composite 208 (includes Acq68, 69, 70) Not
Favorable Favorable Male 27.1% 72.9%
What is your gender? Female 30.1% 69.9% White 27.3% 72.7%
What is your race? Non-white 32.4% 67.6% Non-Supervisor 31.6% 68.4% What is your current
level of supervisory responsibility? Supervisor 23.8% 76.2%
1998 AcqDemo Baseline 30.6% 69.4% Overall
Survey Responses 1998 Comparison 34.5% 65.5%

Volume II Technical Report
AcqDemo Interim Evaluation Report II-51
2001 AcqDemo .0% .0% 2001 Comparison .0% .0% 2003 AcqDemo* 25.6% 74.4%
2003 Comparison* 17.6% 82.4%
*Indicates a significant mean difference, p<.01
Personnel Office Data The table below is extracted from annual data calls, and shows reported uses of the Academic Degree and Certificate Training intervention over the course of the project.
Table 47: Reported Uses of Academic Degree and Certificate Training—All AcqDemo
Year Number of Participants Reported 1999 259 2000 60 2001 15 2002 21
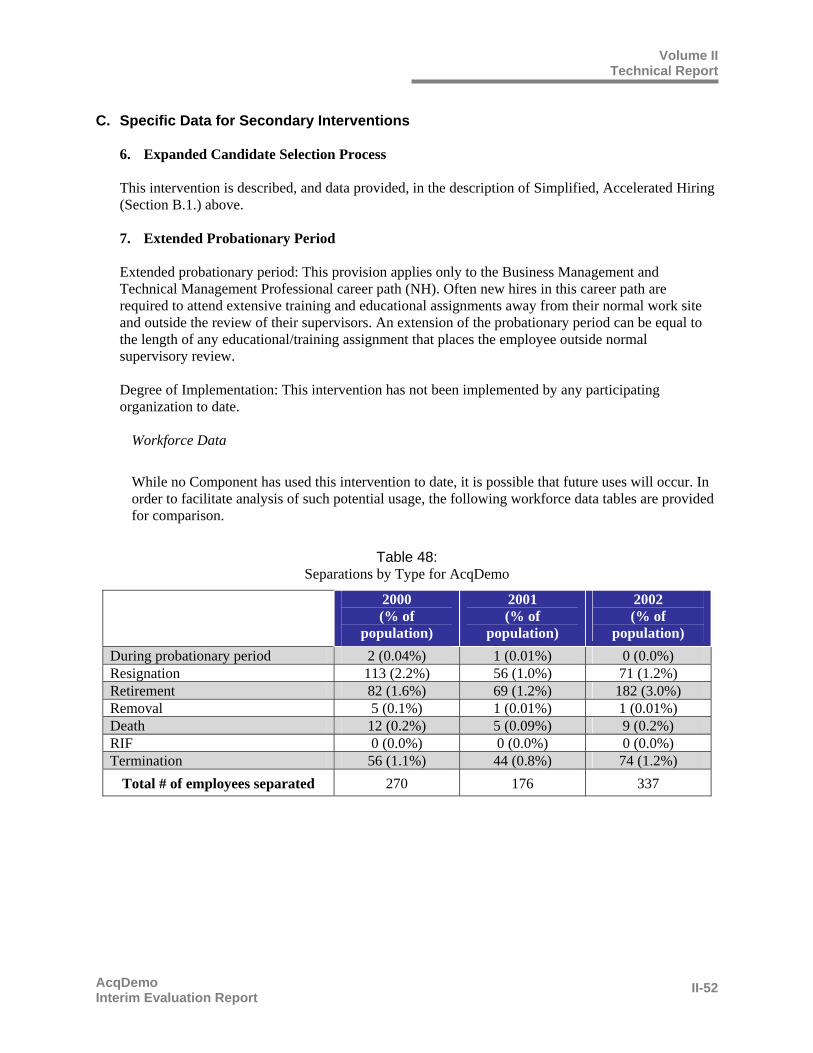
Volume II Technical Report
AcqDemo Interim Evaluation Report II-52
C. Specific Data for Secondary Interventions
6. Expanded Candidate Selection Process This intervention is described, and data provided, in the description of Simplified, Accelerated Hiring (Section B.1.) above. 7. Extended Probationary Period Extended probationary period: This provision applies only to the Business Management and Technical Management Professional career path (NH). Often new hires in this career path are required to attend extensive training and educational assignments away from their normal work site and outside the review of their supervisors. An extension of the probationary period can be equal to the length of any educational/training assignment that places the employee outside normal supervisory review. Degree of Implementation: This intervention has not been implemented by any participating organization to date.
Workforce Data
While no Component has used this intervention to date, it is possible that future uses will occur. In order to facilitate analysis of such potential usage, the following workforce data tables are provided for comparison.
Table 48: Separations by Type for AcqDemo
2000 (% of
population)
2001 (% of
population)
2002 (% of
population) During probationary period 2 (0.04%) 1 (0.01%) 0 (0.0%) Resignation 113 (2.2%) 56 (1.0%) 71 (1.2%) Retirement 82 (1.6%) 69 (1.2%) 182 (3.0%) Removal 5 (0.1%) 1 (0.01%) 1 (0.01%) Death 12 (0.2%) 5 (0.09%) 9 (0.2%) RIF 0 (0.0%) 0 (0.0%) 0 (0.0%) Termination 56 (1.1%) 44 (0.8%) 74 (1.2%)
Total # of employees separated 270 176 337

Volume II Technical Report
AcqDemo Interim Evaluation Report II-53
Table 49: Separations by Type for Comparison Group
2000 (% of
population)
2001 (% of
population)
2002 (% of
population) During probationary period 0 (0.0%) 1 (0.07%) 0 (0.0%) Resignation 21 (1.6%) 34 (2.5%) 69 (5.0%) Retirement 31 (2.4%) 64 (4.8%) 100 (7.2%) Removal 2 (0.2%) 1 (0.07%) 2 (0.1%) Death 2 (0.2%) 2 (0.1%) 3 (0.2%) RIF 0 (0.0%) 0 (0.0%) 3 (0.2%) Termination 20 (1.5%) 19 (1.4%) 59 (4.3%)
Total # of employees separated 76 121 236
8. Broadbanding Broadbanding: The broadbanding system replaces the GS grade structure. Acquisition occupations with similar characteristics are grouped together into three career paths with broadband levels designed to facilitate pay progression and internal assignment of duties, and to allow for more competitive recruitment of quality candidates at differing pay rates. The three career paths are Business Management and Technical Management Professional (NH); Technical Management Support (NJ); and Administrative Support (NK). There are four broadband levels covering GS grades 1 through 15. Degree of Implementation: This intervention was fully implemented by all components, and is an integral part of the CCAS system. Another expected benefit of simplified classification and broadbanding is the ability to assign an employee to new duties without creating a new position description and/or processing a formal personnel action. Focus group and survey results indicate that both employees and supervisors understand this flexibility is available and observe that it has been used frequently in some organizations.
Survey Data
• The following table presents results on a composite of three survey questions on pay satisfaction, internal and external equity, and advancement opportunity.

Volume II Technical Report
AcqDemo Interim Evaluation Report II-54
Table 50: Satisfaction Composite
Satisfaction with opportunities Composite 207 (includes Acq18, 19, 21)
Not Favorable Favorable
Male 53.7% 46.3% What is your gender?
Female 57.3% 42.7% White 52.8% 47.2%
What is your race? Non-white 64.2% 35.8% Non-Supervisor 59.9% 40.1% What is your current
level of supervisory responsibility? Supervisor 48.7% 51.3%
1998 AcqDemo Baseline 56.8% 43.2%
1998 Comparison 59.8% 40.2% 2001 AcqDemo 59.8% 40.2% 2001 Comparison 55.8% 44.2% 2003 AcqDemo 48.2% 51.8%
Overall Survey Responses
2003 Comparison 54.5% 45.5%
CCAS Data Broadbanding, together with the contribution-based compensation and appraisal system was expected to produce faster career progression and higher starting salaries as indicated by compensation data. The charts below show average basic pay for each career path during 2002. Detailed CCAS statistics are located in Volume III, Appendix E.
Chart 18: Average 2002 Basic Pay - NH & Total
NH
$78,336 $83,970
$69,326$63,629
$98,530
$73,323
$0$10,000$20,000$30,000$40,000$50,000$60,000$70,000$80,000$90,000
$100,000
Army Navy MarineCorps
AirForce
OSD Total
Total
$73,728$80,969
$65,754$55,975
$90,411
$66,842
$0$10,000$20,000$30,000$40,000$50,000$60,000$70,000$80,000$90,000
$100,000
Army Navy MarineCorps
Air Force OSD Total

Volume II Technical Report
AcqDemo Interim Evaluation Report II-55
Chart 19: Average 2002 Basic Pay - NJ & NK
NK
$38,285 $37,348 $33,752 $31,917
$43,120$34,552
$0$10,000$20,000$30,000$40,000$50,000$60,000$70,000$80,000
Army Navy MarineCorps
Air Force OSD Total
NJ
$35,717
$73,763
$44,332 $47,489 $47,367
$0$10,000$20,000$30,000$40,000$50,000$60,000$70,000$80,000
Army Navy MarineCorps
Air Force OSD Total
NK
$38,285 $37,348 $33,752 $31,917
$43,120$34,552
$0$10,000$20,000$30,000$40,000$50,000$60,000$70,000$80,000
Army Navy MarineCorps
Air Force OSD Total
NJ
$35,717
$73,763
$44,332 $47,489 $47,367
$0$10,000$20,000$30,000$40,000$50,000$60,000$70,000$80,000
Army Navy MarineCorps
Air Force OSD Total
9. Simplified, Modified RIF A simplified, modified RIF process was established, under which employees in AcqDemo within a given Component and located in the same commuting area are placed in a different competitive area from employees not covered by AcqDemo. Employees are entitled to additional years of retention service credit based on appraisal results. Degree of Implementation: The simplified modified RIF process has been implemented only by the Air Force, for a small unit at Edwards AFB.
Survey Data While AcqDemo usage of its Simplified, Modified RIF implementation has been extremely limited, future potential usage may require data for comparison. The following table contains survey data regarding perceptions of RIF fairness.

Volume II Technical Report
AcqDemo Interim Evaluation Report II-56
Table 51: Reduction-in-Force (RIF) Fairness
112a. The RIF process is fair. Acq112a
Strongly disagree Disagree
Neither agree nor disagree Agree
Strongly agree
No basis to judge
Male 13.0% 12.7% 19.8% 19.8% 5.6% 29.1% What is your gender?
Female 13.3% 14.6% 17.7% 16.7% 3.4% 34.4% White 13.6% 13.9% 17.7% 19.5% 4.3% 31.1%
What is your race? Non-white 13.0% 12.3% 20.4% 15.4% 4.9% 34.0% Non-Supervisor 15.0% 13.5% 18.5% 16.5% 4.5% 32.0% What is your current
level of supervisory responsibility? Supervisor 10.3% 13.8% 19.2% 21.0% 4.5% 31.3%
1998 Acq Demo Baseline 17.6% 19.0% 20.3% 20.7% 6.2% 16.2%
1998 Comparison 12.0% 20.0% 36.0% 16.0% 4.0% 12.0% 2001 Acq Demo .0% .0% .0% .0% .0% .0% 2001 Comparison .0% .0% .0% .0% .0% .0% 2003 Acq Demo 9.9% 8.5% 16.0% 14.9% 2.8% 47.9%
Overall Survey Responses
2003 Comparison 3.7% 3.7% 14.8% 25.9% 3.7% 48.1%
Personnel Office Data No RIF appeals were reported.
10. Sabbaticals Sabbaticals: Sabbaticals are designed to help employees participate in study or work experience that benefits the organization and acquisition community and contributes to their development and effectiveness. The sabbatical provides opportunities to acquire knowledge and expertise that employees could not get in the standard work environment. As a program requirement, a sabbatical must result in a product, service, report, or study that will benefit the acquisition community as well as increase the employee’s individual effectiveness. Approval by the activity’s Executive Director or equivalent is required. Degree of Implementation: This intervention was implemented on a limited basis, with only seven instances of use during from 1999 through 2002, again due primarily to resource constraints (based on managers and supervisors focus groups). Sabbaticals were not widely implemented, and survey results show no noticeable change in perception of opportunities to take sabbaticals, or the value of sabbaticals to the organization, between 1998 and 2003.
Survey Data Data used to measure the effects of this intervention include employee and supervisor perceptions of (1) the opportunity to take advantage of sabbaticals, and (2) the value of sabbaticals in increasing
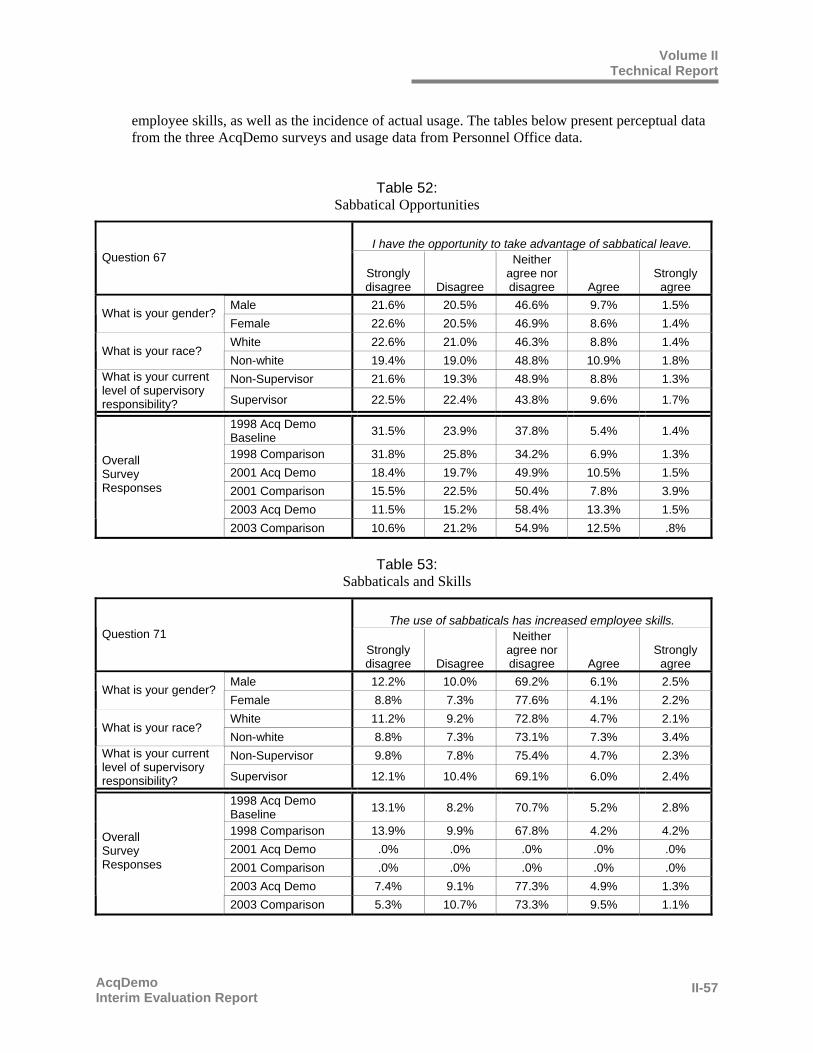
Volume II Technical Report
AcqDemo Interim Evaluation Report II-57
employee skills, as well as the incidence of actual usage. The tables below present perceptual data from the three AcqDemo surveys and usage data from Personnel Office data.
Table 52:
Sabbatical Opportunities
I have the opportunity to take advantage of sabbatical leave. Question 67
Strongly disagree Disagree
Neither agree nor disagree Agree
Strongly agree
Male 21.6% 20.5% 46.6% 9.7% 1.5% What is your gender?
Female 22.6% 20.5% 46.9% 8.6% 1.4% White 22.6% 21.0% 46.3% 8.8% 1.4%
What is your race? Non-white 19.4% 19.0% 48.8% 10.9% 1.8% Non-Supervisor 21.6% 19.3% 48.9% 8.8% 1.3% What is your current
level of supervisory responsibility? Supervisor 22.5% 22.4% 43.8% 9.6% 1.7%
1998 Acq Demo Baseline 31.5% 23.9% 37.8% 5.4% 1.4%
1998 Comparison 31.8% 25.8% 34.2% 6.9% 1.3% 2001 Acq Demo 18.4% 19.7% 49.9% 10.5% 1.5% 2001 Comparison 15.5% 22.5% 50.4% 7.8% 3.9% 2003 Acq Demo 11.5% 15.2% 58.4% 13.3% 1.5%
Overall Survey Responses
2003 Comparison 10.6% 21.2% 54.9% 12.5% .8%
Table 53:
Sabbaticals and Skills
The use of sabbaticals has increased employee skills. Question 71
Strongly disagree Disagree
Neither agree nor disagree Agree
Strongly agree
Male 12.2% 10.0% 69.2% 6.1% 2.5% What is your gender?
Female 8.8% 7.3% 77.6% 4.1% 2.2% White 11.2% 9.2% 72.8% 4.7% 2.1%
What is your race? Non-white 8.8% 7.3% 73.1% 7.3% 3.4% Non-Supervisor 9.8% 7.8% 75.4% 4.7% 2.3% What is your current
level of supervisory responsibility? Supervisor 12.1% 10.4% 69.1% 6.0% 2.4%
1998 Acq Demo Baseline 13.1% 8.2% 70.7% 5.2% 2.8%
1998 Comparison 13.9% 9.9% 67.8% 4.2% 4.2% 2001 Acq Demo .0% .0% .0% .0% .0% 2001 Comparison .0% .0% .0% .0% .0% 2003 Acq Demo 7.4% 9.1% 77.3% 4.9% 1.3%
Overall Survey Responses
2003 Comparison 5.3% 10.7% 73.3% 9.5% 1.1%

Volume II Technical Report
AcqDemo Interim Evaluation Report II-58
Personnel Office Data
Table 54: Number of Sabbaticals by Component
Year Army Air Force AT&L Navy USMC 1999 1 0 0 0 1 2000 1 0 0 0 1 2001 1 0 0 0 0 2002 0 0 2 0 0
11. Voluntary Emeritus Program Voluntary emeritus program: This program allows AcqDemo organizations to accept the gratuitous services of retired or separated employees. It will be beneficial during personnel reductions as skilled acquisition professionals accept retirement and return to provide corporate knowledge and mentoring to less experienced employees. Voluntary emeritus assignments are not considered federal employment, and therefore do not affect an employee’s entitlement to buy-outs, severance pay, or retirement payments based on earlier separation from federal service. This program may not be used to replace civilian employees occupying regular positions required to perform the mission of the command. Degree of Implementation: This intervention was implemented on a limited basis, with only six instances of use from 1999 through 2002.
Because of the limited usage of this intervention, there is insufficient evidence to judge the degree to which it has achieved its expected outcomes.
Personnel Office Data This intervention’s expected effect is to encourage retirees to mentor junior professionals, as measured by the frequency of use. The table below shows usage by Component over the life of the project.
Table 55: Voluntary Emeritus Appointments by Component
Year Army Air Force AT&L Navy USMC 1999 2 0 0 0 1 2000 0 1 0 0 0 2001 0 0 0 1 0 2002 0 1 0 0 0