Embed Size (px)
Citation preview

Acoustical Application Tests of Perforated Metals To validate data developed by Theodore I. Schultz, Ph.D.* as presented in his book, ACOUSTICAL USES FOR PERFORATED METALS: Principles and Applications the IPA contracted the Riverbank Acoustical Laboratories to test his findings. The following is a summary report on the tests conducted by the Riverbank Acoustical Laboratories in demonstrating the two acoustical capabilities of perforated metals- allowing a maximum amount of sound to pass through it in order for it to be absorbed by a material behind it and their capability in a tuned resonant sound absorber to attenuate specific, narrow frequency range.
The objectives of the tests were:
a. Determine which perforated metal specifications would provide a high degree of sound transparency.
b. Demonstrate the theories regarding Tuned Resonant Absorbers set forth by Dr. Schultz.
*Dr. Schultz's many friends, clients and acoustical engineering colleagues were deeply saddened by his untimely death in August, 1989. His important contributions to the science of acoustics will be long remembered and appreciated.

The first test compares the sound absorption performance of a bare, unprotected 4" blanket of fiberglass with the same material protected by sheets of perforated metal that required the sound to pass through the perforated sheet. The three perforated sheets were of the following specifications:
IPA #107 with 48% Open Area IPA #112 with 37% Open Area IPA #115 with 23% Open Area
IPA #107 with 46% Open Area: .080” dia. holes on
.109”, 60° staggered centers.
IPA #112 with 37% Open Area: .100” dia. holes on
.156”, 60° staggered centers
IPA #115 with 23% Open Area: .125” dia. holes on
.250”, 60° staggered centers
CHART 1: ABSORPTION OF 4” FIBERGLASS BLANKET WITH OR WITHOUT PERFORATED
Chart 1 disclosed that there was virtually no diminishment of the fiberglass blanket's sound absorption performance by the presence of any of the perforated metal sheets; they were equally transparent with only minor and insignificant variations. Each of the perforated-protected tests followed very closely the performance of the bare blanket at all frequency levels.
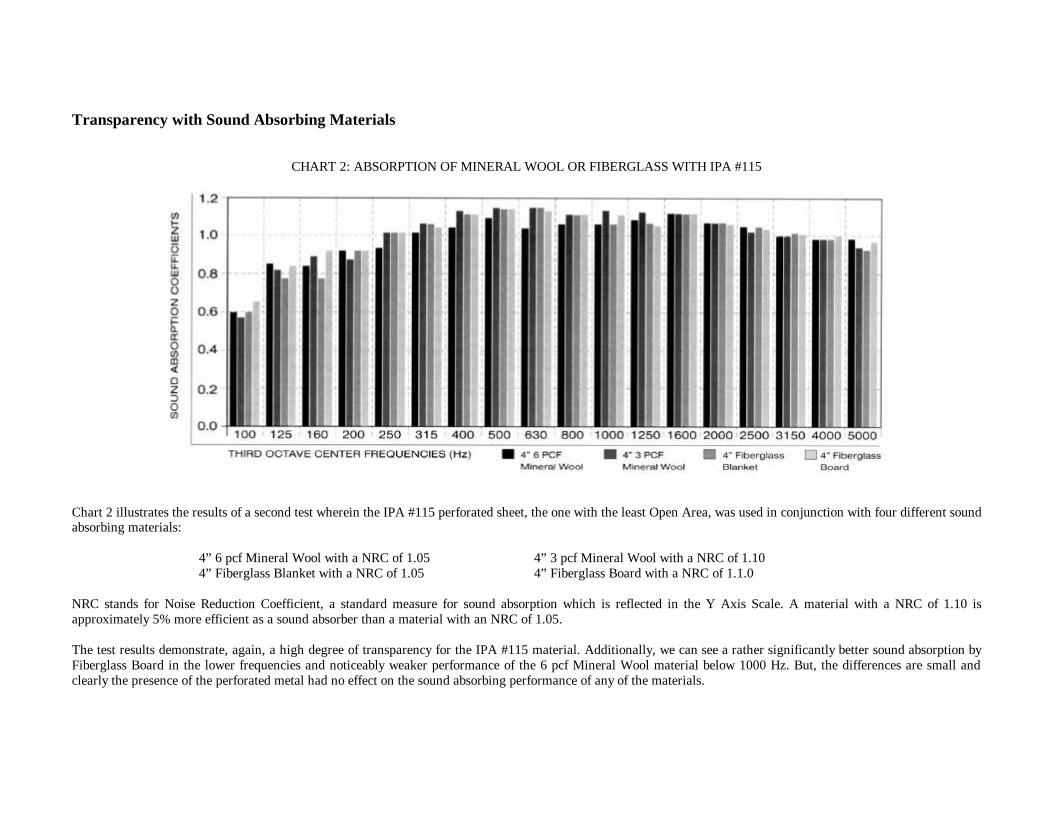
Transparency with Sound Absorbing Materials
CHART 2: ABSORPTION OF MINERAL WOOL OR FIBERGLASS WITH IPA #115
Chart 2 illustrates the results of a second test wherein the IPA #115 perforated sheet, the one with the least Open Area, was used in conjunction with four different sound absorbing materials:
4” 6 pcf Mineral Wool with a NRC of 1.05 4” 3 pcf Mineral Wool with a NRC of 1.10 4” Fiberglass Blanket with a NRC of 1.05 4” Fiberglass Board with a NRC of 1.1.0
NRC stands for Noise Reduction Coefficient, a standard measure for sound absorption which is reflected in the Y Axis Scale. A material with a NRC of 1.10 is approximately 5% more efficient as a sound absorber than a material with an NRC of 1.05. The test results demonstrate, again, a high degree of transparency for the IPA #115 material. Additionally, we can see a rather significantly better sound absorption by Fiberglass Board in the lower frequencies and noticeably weaker performance of the 6 pcf Mineral Wool material below 1000 Hz. But, the differences are small and clearly the presence of the perforated metal had no effect on the sound absorbing performance of any of the materials.

Transparency with Sound Absorbing Materials In the tests depicted by Charts 3, 4, and 5, as the diagrams show, the perforated sheet, IPA #115, was mounted over a frame having a rigid back into which fiberglass blankets of varying thicknesses were placed either against the perforated sheet with or without airspace behind it or against the back leaving an airspace between the face of the sound absorbing blanket and the perforated sheet. In addition to the sound transparency of the #115 material shown in Charts 1 and 2, these tests clearly demonstrated these conclusions:
1. As a general rule, the thicker the absorbent blanket the greater the sound absorbency. But, the thickness of the fiberglass blanket has its most noticeable effect below 500 Hz with the effect increasing towards the lower frequencies.
2. Placement of the absorbent blanket against the perforated metal with an airspace behind does not diminish sound absorbency. On the other hand, the airspace behind does not contribute to sound absorbency.
3. Placement of the sound absorbent blanket away from the perforated metal-leaving an air space between- will noticeably reduce sound absorbency. To achieve maximum transparency of the perforated metal requires that the absorbent material be placed against it leaving no airspace.
CHART 3: ABSORPTION OF FIBERGLASS AGAINST IPA #115 IN FRAME

Transparency with Sound Absorbing Materials
CHART 4: ABSORPTION OF FIBERGLASS WITH AIRSPACE & IPA #115 IN FRAME

Transparency with Sound Absorbing Materials
CHART 5: ABSORPTION OF 2” FIBERGLASS WITH AIRSPACES & IPA #115 IN FRAME

Transparency with Sound Absorbing Materials
CHART 6: ABSORPTION OF 4” FIBERGLASS WITH IPA #115 WITH OR WITHOUT POLY FILM
The tests in Chart 6 were conducted to determine the sound absorbency loss when a sheet of polyethylene film was placed as a protective cover between the absorbent blanket and the sheet of perforated metal. The chart shows that there is a substantial loss at frequencies above 500 Hz and that the loss increases as frequencies go up. Loss also, as you might expect, increases with the thickness of the poly film. At thicknesses greater than .075 mil the loss does not appear to be acceptable. In the lower frequency ranges below 500 Hz the loss of sound absorbency caused by the presence of the poly film seems to be negligible.
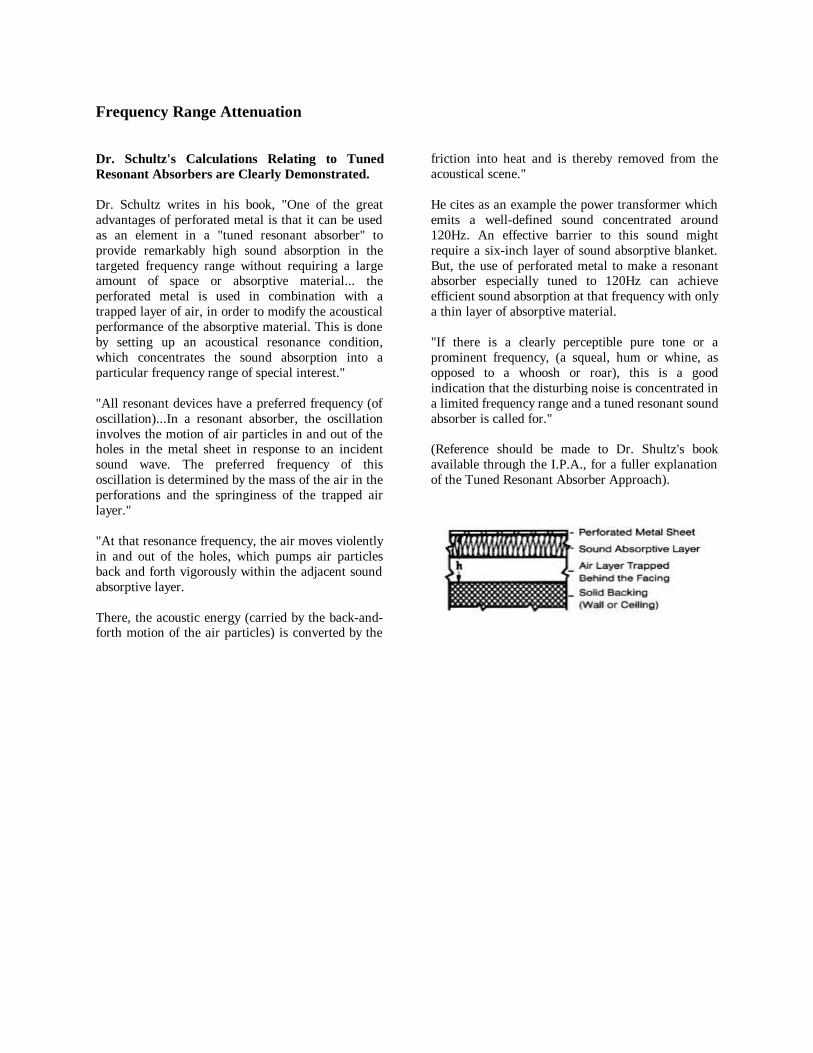
Frequency Range Attenuation Dr. Schultz's Calculations Relating to Tuned Resonant Absorbers are Clearly Demonstrated. Dr. Schultz writes in his book, "One of the great advantages of perforated metal is that it can be used as an element in a "tuned resonant absorber" to provide remarkably high sound absorption in the targeted frequency range without requiring a large amount of space or absorptive material... the perforated metal is used in combination with a trapped layer of air, in order to modify the acoustical performance of the absorptive material. This is done by setting up an acoustical resonance condition, which concentrates the sound absorption into a particular frequency range of special interest." "All resonant devices have a preferred frequency (of oscillation)...In a resonant absorber, the oscillation involves the motion of air particles in and out of the holes in the metal sheet in response to an incident sound wave. The preferred frequency of this oscillation is determined by the mass of the air in the perforations and the springiness of the trapped air layer." "At that resonance frequency, the air moves violently in and out of the holes, which pumps air particles back and forth vigorously within the adjacent sound absorptive layer. There, the acoustic energy (carried by the back-and-forth motion of the air particles) is converted by the
friction into heat and is thereby removed from the acoustical scene." He cites as an example the power transformer which emits a well-defined sound concentrated around 120Hz. An effective barrier to this sound might require a six-inch layer of sound absorptive blanket. But, the use of perforated metal to make a resonant absorber especially tuned to 120Hz can achieve efficient sound absorption at that frequency with only a thin layer of absorptive material. "If there is a clearly perceptible pure tone or a prominent frequency, (a squeal, hum or whine, as opposed to a whoosh or roar), this is a good indication that the disturbing noise is concentrated in a limited frequency range and a tuned resonant sound absorber is called for." (Reference should be made to Dr. Shultz's book available through the I.P.A., for a fuller explanation of the Tuned Resonant Absorber Approach).

Frequency Range Attenuation CALCULATING THE DESIGN PARAMETERS OF THE TUNED ABSORBER Having determined the desired frequency for maximum absorption, the Nomogram shown below can be used to calculate the specifications for a tuned absorber to attenuate that frequency. Use of the Nomogram is described in detail, below, in the discussion of the Riverbank tests. The Nomogram works equally well whether you are starting with a desired target frequency range or with a set of constraints relating to available spacer or perforated metal. THE RIVERBANK TESTS The Riverbank tests used a test specimen that comprised the basic elements of a Tuned Resonant Absorber which is illustrated below. The test specimen was two-chambered to provide for comparative experiments. The elements included a sheet of perforated metal backed by a layer of aluminum honeycomb with 1" cells into which fiberglass had been pressed; the thickness of this layer varied in the tests from 1" to 4". This assembly was placed at the top of a box which was 4" deep from the underside of the perforated sheet to the bottom of the box. Important note: Dr. Schultz points out, "It makes a very important difference whether the airspace behind the (perforated) sheet is continuous or divided into small cells by means of partitions."
"When the airspace is continuous, the behavior of the absorber changes greatly at different angles of incidence of the sound. As the sound direction changes from perpendicular to the surface of the absorber (angle of incidence = 0) to grazing incidence (90), the resonance frequency changes drastically, rising away from the intended frequency to as much as three octaves higher. In addition, the bandwidth of frequencies within which the higher values of sound absorption occur gets smaller and smaller as the angle of incidence tends toward grazing." "By contrast, with the partitioned backstructure, not only does the resonance frequency remain the same as the angle of incidence increases, but the bandwidth of high sound absorption actually becomes broader". Appreciation of these phenomena dictated the use of aluminum honeycomb or similar material in the design of the absorbing layer in the test specimens.

Frequency Range Attenuation Using the Nomogram (Example 1) Nomogram 1 and Charts 7 and 8 illustrate a test which used an aluminum sheet .080" thick perforated with 1/8" (.125) holes on 2 1/4" straight row centers providing an open area of .2437%. The Nomogram elements for this test, therefore were:
t The thickness of the sheet = .080" e The effective throat-length of the holes in the perforated sheet, (t + .89d) = .080 + (.125X.8) = .18 h The distance from the perforated sheet to the backing = 4" P The percentage of Open Area, (O.A.) = .2437%

Frequency Range Attenuation Using the Nomogram (Example 1) To determine the target frequency which this Tuned Resonant Absorber will attenuate using the Nomograph, first calculate the "e" dimension, which is .18. Using a ruler, connect the point .18 on the "e" scale with the point .2437 on the p scale, (it will be necessary to estimate the position of this point on the Nomograph). Now place your ruler on the point where this line crosses the M line and draw a line to the 4" position on the "h" scale. Where this line crosses the "f' scale you'll find the target frequency that should be most highly attenuated by this Tuned Resonant Absorber. The target frequency in this test was determined to be 125Hz. Charts 7 and 8 reporting on the results of two tests conducted by Riverbank Labs, the first with a 1"
thick absorbing layer and second with a 4" thick absorbing layer, demonstrate clearly the effectiveness of the Tuned Resonant Absorber principle and the accuracy of Dr. Schultz's methods and Nomograph for determining the components of an efficient system. Chart 7 illustrates the test results for the TRA using a 1" thick absorbing layer. The target frequency is clearly 125Hz; a "Sound Absorption Coefficient" of 1.0 is very close to 100% efficiency. Chart 8 illustrating the test using a 4" sound absorbing layer, shows a slight shift to 100 Hz as the frequency most efficiently attenuated though 125Hz is also efficiently removed, as well. It also illustrates an overall increase in sound absorbed. Both of these results can be attributed to the thicker sound absorbing layer.

Frequency Range Attenuation Using the Nomogram (Example 1) Nomogram 1 for Use with Charts 7 and 8
Nomogram for calculating the resonance frequency of a tuned resonant sound absorber

Frequency Range Attenuation Using the Nomogram (Example 1) Reporting on the results of two tests conducted by Riverbank Labs
CHART 7: ABSORPTION THROUGH .080” ALUMINUM WITH 1/8” HLS, .243% O.A. ON 1” FG

Frequency Range Attenuation Using the Nomogram (Example 1) Reporting on the results of two tests conducted by Riverbank Labs
CHART 8: ABSORPTION THROUGH .080” ALUMINUM WITH 1/8” HLS, .243% O.A. ON 4” FG

Frequency Range Attenuation Using the Nomogram (Example 2) Use Chart 9 with Nomogram 2 Chart 9 with Nomogram 2 depict a test with different elements: A sheet of 26 gauge galvanized steel perforated with .046" diameter holes on .266" staggered centers providing a 2.7% open area mounted on a 2" thick layer of fiberglass/honeycomb. The 4 " dimension for "h " remained the same. Thus, the Nomogram elements were:
t 26 gauge = .0179 e .0179 + (.046 X .8) = .0547 P 2.7% h 4"
Referring to Nomogram 2, the target frequency works out to be approximately 750Hz. Chart 9 shows that in this test the frequencies between 400Hz and 800Hz were absorbed above the 1.0 coefficient and the frequency bands for 315Hz and 1,000 Hz on either side of that range nearly reached that level. The pattern of absorption was broader not as narrowly focused, but, the Tuned Resonant Absorber effect is plainly evident.

Frequency Range Attenuation Using the Nomogram (Example 2) Nomogram 2 for Use with Charts 9

Frequency Range Attenuation Using the Nomogram (Example 2) Use Chart 9 with Nomogram 2
CHART 9: ABSORPTION THROUGH 26GA WITH .046” HLS, 2.7% O.A. ON 2” FG
In his book, Dr. Schultz explains in detail how a narrowing of the frequency range around the targeted frequency will result from having a shallower air space between the perforated sheet and the solid backing, (scale h on the nomogram). With a perforated sheet that provided a higher value on the "e" scale and the same Open Area on the "P" scale in combination with a 2" air space, (h scale), the same target frequency would have been maintained but a more focused range of frequencies would be attenuated. (See dotted lines on Nomogram 2).