Embed Size (px)
Citation preview
i
ACOUSTIC POWERED MICRO SWIMMER AND ITS BIDIRECTIONAL
PROPULSION
by
Ye Zhan
Bachelor of Engineering, Harbin Univ. of Sci. & Tech., 2014
Submitted to the Graduate Faculty of
Swanson School of Engineering in partial fulfillment
of the requirements for the degree of
Master of Science
University of Pittsburgh
2016

ii
UNIVERSITY OF PITTSBURGH
SWANSON SCHOOL OF ENGINEERING
This thesis was presented
by
Ye Zhan
It was defended on
May 12, 2016
and approved by
Sung Kwon Cho, PhD., Associate Professor, Department of Mechanical Engineering and
Materials Science
Sangyeop Lee, PhD., Assistant Professor, Department of Mechanical Engineering and
Materials Science
Young Jae Chun, PhD., Assistant Professor, Department of Industrial Engineering
Thesis Advisor: Sung Kwon Cho, PhD., Associate Professor, Department of Mechanical
Engineering and Materials Science

iii
Copyright © by Ye Zhan 2016

iv
Micro-robots have great potential in biomedical aspects. However, there are no detailed
experiments results for micro-swimmer (a micro-channel contains an air bubble inside it)
propelling into the human body environment. This thesis describes the micro-swimmer propelling
in blood environments, and testing in real blood. Demonstrated through bubble vibration, micro-
swimmer can push forward in the blood environment. Meanwhile, I found the phenomenon of the
micro-swimmer moving backward in the blood environment. The velocity of stream speed and
position of the bubble interface have effect on the micro-swimmer propulsion direction. One the
other hand, I find out the micro-swimmer is harder to propel in the blood environment. In order to
improve the efficiency of acoustic transmission, I also made the liquid lens to focus sound, which
can improve the transfer efficiency of acoustic wave.
ACOUSTIC POWERED MICRO SWIMMER AND ITS BIDIRECTIONAL
PROPULSION
Ye Zhan, M.S
University of Pittsburgh, 2016

v
TABLE OF CONTENTS
1.0 INTRODUCTION............................................................................................................. 1
1.1 PROPULSION IN THE MICRON AND NANO-SCALE ........................................ 5
1.1.1 Bubble Oscillation ..................................................................................................... 5
1.1.2 Artificial Cilia/Flagella ............................................................................................. 7
1.1.3 Driven through chemical energy ............................................................................. 9
1.1.4 Brownian motion method ....................................................................................... 11
1.2 THE AFFECT OF VISCOSITY OF THE LIQUID FOR MICRO-SWIMMER
MOTION IN THE FLUID ..................................................................................................... 13
1.3 LIQUID LENS ............................................................................................................ 17
2.0 EXPERIMENTS ............................................................................................................. 21
2.1 THE RELATIONSHIP BETWEEN THE VISCOSITY OF THE LIQUID AND
THE STREAM SPEED .......................................................................................................... 21
2.1.1 Experiment of principle .......................................................................................... 21
2.1.2 Experimental equipment set up ............................................................................. 26
2.1.3 Experimental Set Up ............................................................................................... 30
2.1.4 Test Method ............................................................................................................. 31
2.1.5 Experiment results and discussion ........................................................................ 34
2.2 TUBE PROPULSION IN THE BLOOD .................................................................. 41
vi
2.2.1 Experiment Principle .............................................................................................. 41
2.2.2 Experimental result ................................................................................................ 42
2.3 EFFECT OF THE GAS-LIQUID INTERFACE POSITION TO MICRO-
SWIMMER .............................................................................................................................. 45
2.3.1 Experiment principle .............................................................................................. 45
2.3.2 Experimental equipment building up and testing method .................................. 45
2.3.3 Experiment Result and discussion ......................................................................... 46
2.4 METHOD TO IMPROVE THE SOUND TRANSMISSION ................................. 50
2.4.1 Experiment principle .............................................................................................. 50
2.4.2 Experimental design and equipment build up ..................................................... 51
3.0 FUTURE WORK ............................................................................................................ 57
REFERENCES ............................................................................................................................ 60

vii
LIST OF FIGURES
Figure 1. Medical tasks for micro-robots[2] ................................................................................... 2
Figure 2. The conception of propulsion by an oscillating bubble column ...................................... 6
Figure 3. Oscillating bubble-columns attached to a plane and carrying the load ........................... 6
Figure 4. Micro-swimmer 2-D motion............................................................................................ 7
Figure 5. Bacterial cilia bionic design (rotating forward) ............................................................... 8
Figure 6. Bacterial cilia bionic design (Traveling-Wave Propulsion) ............................................ 9
Figure 7. swimmer movement by generate energy through a chemical reaction ......................... 10
Figure 8. Using of the inertial motion to propulsion nano-motor ................................................. 11
Figure 9. Microtubules structure and testing data ......................................................................... 12
Figure 10. Trajectory of a self-propelled Janus particle by light gradient .................................... 13
Figure 11. Relationship between Reynolds and propulsion force ................................................ 16
Figure 12. Four different kinds of streaming ................................................................................ 17
Figure 13. Different types of liquid lens ....................................................................................... 20
Figure 14. Tube with one end closed and the other end open made by capillary glass tube ........ 22
Figure 15. fabrication processes ................................................................................................... 23
Figure 16. One period of the bubble oscillation ........................................................................... 24
Figure 17. Simulated micro-propulsion streamline ...................................................................... 25
Figure 18. Glycerin ....................................................................................................................... 26

viii
Figure 19. Water tank build up & Piezoelectric in different position ........................................... 28
Figure 20. Set up of the experiment .............................................................................................. 30
Figure 21. Set up of the experiment .............................................................................................. 31
Figure 22. Particles at the open end .............................................................................................. 33
Figure 23. Microstreaming measurement ..................................................................................... 34
Figure 24. The relationship between viscosity coefficient and stream speed ............................... 35
figure 25. Whole view of the tube oscillate in high viscosity ....................................................... 36
Figure 26. View of micro-particles oscillation ............................................................................. 37
Figure 27. The relationship between viscosity and amplitude ...................................................... 38
Figure 28. The relationship between amplitude and stream speed ............................................... 39
Figure 29. The relationship of input frequency and stream speed ................................................ 40
Figure 30. The relationship between stream speed and frequency (water / water-glycerin) ........ 41
Figure 31. Testing for micro-swimmer in plasma ........................................................................ 43
Figure 32. Testing micro-robot movement in blood ..................................................................... 44
Figure 33. The relationship between stream speed and bubble position ...................................... 47
Figure 34. The relationship between stream speed and viscosity ................................................. 48
Figure 35. The relationship between stream speed and input voltage .......................................... 49
Figure 36. The relationship between stream speed and input voltage (u =0.001Pas) ................... 49
Figure 37. Snell’s Law .................................................................................................................. 50
Figure 38. Structure of Lens ......................................................................................................... 52
Figure 39. Top/side view of liquid lens ........................................................................................ 54

ix
Figure 40. Experiment testing platform set up.............................................................................. 54
Figure 41. Experiment result for Amplitude on vertical plane at the focal point ......................... 55
Figure 42. Experiment result for Amplitude on horizontal plane at the focal point ..................... 55
Figure 43. Experiment result for with/without liquid lens ............................................................ 56

1
1.0 INTRODUCTION
With the development of medical technology, many patients require minimally invasive
procedures [1, 2], which can significantly reduce the pain, recovery time after treatment. It can
also lower the risk of infection and extenuate the patient during surgery [3-5]. Micro medical-
robots can be used in: treatment of cerebral thrombosis and thrombosis in other parts of the body,
treatment of cancer and delivery the drug to a specific organ or tissue. Therefore, scientists and
engineers hope to invent a kind of robot that can swim in the blood vessels, tissues and organs in
human or animal bodies[2, 6-8]. However, those kinds of micro-robots also face many problems[9-
11], which are: (1) Energy supply, because the swimming robots mainly work in the human body,
it is difficult to design micro- robots into micro size with a small micro-stepper motor and battery
propulsion system. Scientists need to design a wireless energy supply to generate kinetic energy.
In this way, it can minimize the size and reduce the difficulty of producing. (2) The micro-robots
must produce propulsion force suitable for micro-robots controller, because the micro- robots need
to adapt to different vessels, it must contend with the pulsating blood flow motion. figure 1 shows
the medical tasks for micro-robots.
Tasks of medical micro-robots are shown in figure 1: (1) Micro-robots propel in the blood
vessels, which can be used in treating retinal vein occlusion. These kinds of micro-robots can
minimize the side effects and improve targeted drug therapies efficiency[12]. (2) Micro-robots can
carry the radioactive particles to destroy cancer brachytherapy. (3) A kind of time-varying

2
magnetic field induction heating miniature robot can be used for treating hyperthermia[13, 14]. (4)
Scientists usually conduct stem cell research in vitro, micro-robots can give assistance to apply
these results in vivo. (5) Micro-robots can assay tissue samples[15]. (6) Micro-robots can be used
as engineering applications to support objects for tissue[16].
Figure 1. Medical tasks for micro-robots[2]

3
The principles of promoting micro-size device in liquid is different from in large scale (centimeters,
meters) creatures in liquid. Under normal circumstances, biological propel method like
human/animal swimming, or mechanical propulsion such as ship move forward, the principles of
promoting can mainly be divided into two types: advance by inertia propulsion & viscosity
propulsion [17]. In order to discuss this part, we need to study the Navier-Stokes equation (N-S
equation). When the Reynolds number is 𝑅𝑒, constant density is 𝜌, liquid viscosity coefficient is
𝜂, fluid velocity is 𝑉, length has been characterized as 𝐿, we can get:
(𝜌𝑉𝐿
𝜂) =
𝑑 ��
𝑑𝑡= −∇𝑝 + ∇2�� ⇒ 𝑅𝑒 =
𝜌𝑉𝐿
𝜂 (1-1)
�� is the velocity vector-field. At low Reynolds number liquid environment, it means stream speed
is very slow. For the medical-robot devices, they design in small-scale and working in low-speed
fluid environment. The duration time of the action equation (1) is negligible. Fluid flow patterns
will not change significantly, and the flow is nearly reversible. Therefore, the results of sliding
reciprocation, such as people swimming (go back and forth between the two configurations of
body motion) is negligible net movement[18].
Firstly, we should discuss the mechanical motion in the low Reynolds number environment.
For volume of micro-robots various from the size of the human body to the millimeter-scale
bacteria, propulsion force mainly relying on inertia force. But in the case of liquids having a low
Reynolds number[19-23], micro-robots can propel themselves by a way of using a quite different

4
principle, which includes controlling the direction of movement and the speed of the robots [18].
By using the Navier–Stokes equation (N-S equation) (2),
𝜌 (𝜕
𝜕𝑡+ 𝝁 ∙ ∇)𝝁 = −∇𝑝 + 𝜂∇2𝒖, ∇ ∙ 𝒖 = 0 (1-2)
With flow field u and pressure 𝑝, we can now solve the force distribution surrounding objects.
Moreover, since the incompressible Newtonian fluid density is ρ, we get the stress tensor:
𝜎 = −𝑝𝒋 + 𝜂[∇𝒖 + (∇𝒖)𝑇] (1-3)
In the Navier-Stokes equation(2), 𝜌𝒖 ∙ ∇𝒖 is inertia phase, and 𝜂∇2𝒖 is the viscous force per unit
volume. In the case of the low Reynolds number, viscous force is dominant.
High Reynolds number conditions are more common for larger creatures, such as fish and
humans [24-29]. But for the microscopic world, creatures such as biological sperm swim close to
the ovum; by swimming or predation, the paramecium naturally avoid predators. The mechanical
principles of swimming are different with biologicals which have large volumes. In the
microscopic world, the low Reynolds number is main environmental conditions. Using limbs to
swing forward, which is the method that larger creatures mostly used. However, this method is
difficult to implement in the microscopic world, because if try to move a fluid by imparting

5
momentum, after paddling completed, it will be canceled by large viscous damping. So I will
discuss how micro-swimmer work in micro & nano-size.
1.1 PROPULSION IN THE MICRON AND NANO-SCALE
1.1.1 Bubble Oscillation
One design of micro-swimmers is: micro-swimmers propel buy bubble oscillation. Propulsive
force can be generated by the vibration of air bubbles in the tube [30]. One design of the micro-
swimmer is making the tube with one end opened and the other end closed. The teflon tube length
is 3mm, the outer diameter is 750 µm and the inner diameter is 250 µm. When device enters into
the liquid, since the tube is closed at one end and is filled with a gas, there is an air bubble enclosed
within the tube. When given the external sound-field, the bubble will be compressed and vibrated
to generate impetus, the liquid will be ejected from the opened end which will generate the propel
force. By using MEMS technology, we can produce the smaller tubes[31]. The tubes will be
approximately 80×45×530 μm in size. Jian’s device is shown in figure 2, it can reach a maximum
speed of 45 mm/s. By changing the length of tubes, the resonance frequency of the device will be
changed. By fixing the tubes on a plate, the goal of steering and loading the weight can be
successful realized. By fixing the tubes with different lengths on the plate, since the different length
tube have different resonance frequency, by given different input frequency, the goal of 2-D
movement can be realized. As we can see from figure 4. When give input voltage at 370 V,
frequency at 5.07 kHz , the longer tube will push the plant move forward. But when we change
the input voltage at 210 V, and give frequency at 10.97kHz , the shorter tube will generate main

6
force to propel the plant move from the other direction, this can help the plate change the
movement direction, which will cause the plate travel through the T route.
Figure 2. The conception of propulsion by an oscillating bubble column
Figure 3. Oscillating bubble-columns attached to a plane and carrying the load

7
Figure 4. Micro-swimmer 2-D motion
1.1.2 Artificial Cilia/Flagella
Another method for micro-swimmer propel in the liquid with micro size is changing the shape of
the micro-swimmers, the limited number of degrees of freedom will result in an irreversible
movement. Such a device would need at least two degrees of freedom to make movement [18, 32,
33]. The second kind of design is a swimmer composed by three spheroids, the distance between
the spheres change with time and phase [34-38]. J E Avron’s group used two spheres with different
volumes, which can also cause micro-mechanical motion in the liquid [39].
There are some micro-swimmers propelling at low Reynolds numbers environment using
ideal come from bionic. The inspirations of these designs come from the structure of the bacterial
flagellum. Such as: synthesis of micron magnetic flagella, which using an external magnetic field
to produce torque, it has several interesting designs in papers. These kinds of bacterial cilia bionic
8
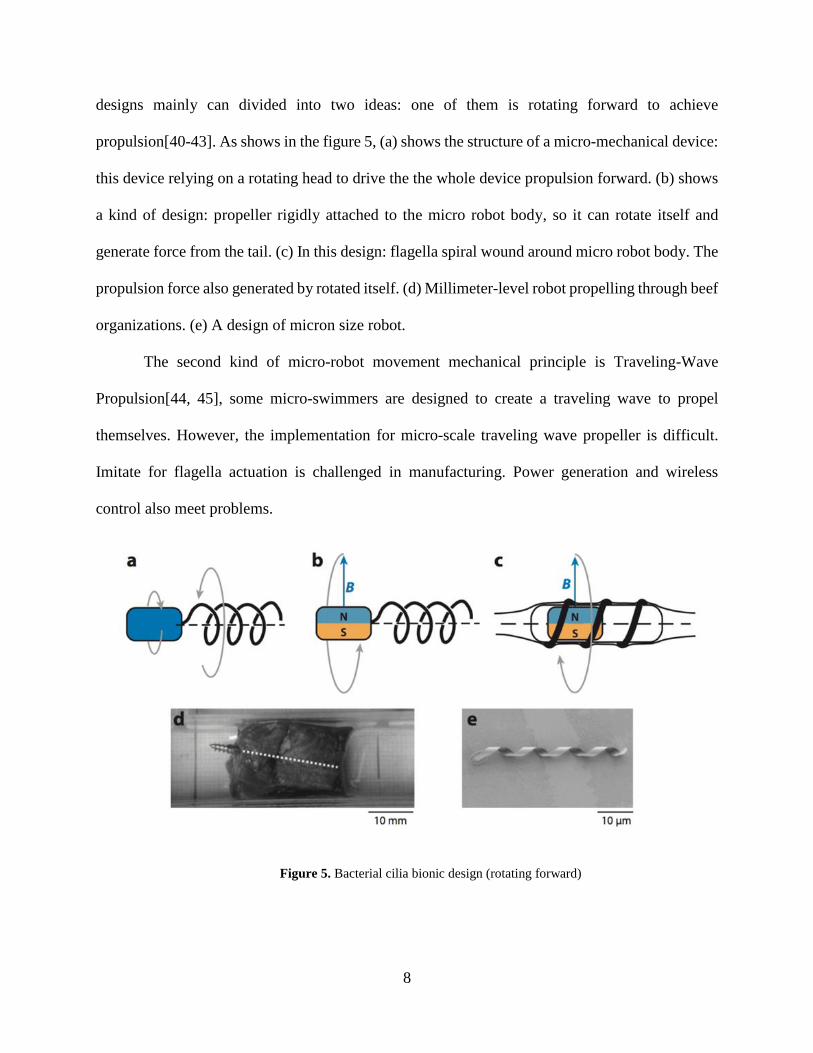
designs mainly can divided into two ideas: one of them is rotating forward to achieve
propulsion[40-43]. As shows in the figure 5, (a) shows the structure of a micro-mechanical device:
this device relying on a rotating head to drive the the whole device propulsion forward. (b) shows
a kind of design: propeller rigidly attached to the micro robot body, so it can rotate itself and
generate force from the tail. (c) In this design: flagella spiral wound around micro robot body. The
propulsion force also generated by rotated itself. (d) Millimeter-level robot propelling through beef
organizations. (e) A design of micron size robot.
The second kind of micro-robot movement mechanical principle is Traveling-Wave
Propulsion[44, 45], some micro-swimmers are designed to create a traveling wave to propel
themselves. However, the implementation for micro-scale traveling wave propeller is difficult.
Imitate for flagella actuation is challenged in manufacturing. Power generation and wireless
control also meet problems.
Figure 5. Bacterial cilia bionic design (rotating forward)

9
Figure 6. Bacterial cilia bionic design (Traveling-Wave Propulsion)
The figure 6 shows two kinds of propulsions by traveling-wave. (a) A kind of design
attached to a miniature robot inside the body vibrator. (b) The figure shows the relationship of F
vs SP, in the figure, F is force and SP is speed. The elastic tail drive sinusoidal wave. (c) Drive the
tail by oscillating magnetic field. (d) The numerical simulation is driven by the head, which is pure
sinusoidal wave driven, the relationship of dimensionless torque and speed is displayed in the
figure 6.
1.1.3 Driven through chemical energy
The micro-swimmers can also make movement through energy generated by the chemical reaction
[46]. As shown in figure 7. Put polystyrene colloid ball into hydrogen peroxide and water solution.

10
Changing the concentration of hydrogen peroxide can control the movement speed of the ball. Half
of sphere adding the platinum which is catalyst for swimming. The reduction of hydrogen peroxide
generating oxygen and water, resulting in the directional movement of the sphere.
There is also the other kind of design which is utilize bubble recoiling to make momentum
transfer by inertia force propulsion. This is a design using the inertial force motion to propel nano-
motor (as show in figure 8) [47].
Figure 7. swimmer movement by generate energy through a chemical reaction
The micro-devices can convert chemical energy into kinetic energy. They can make
themselves propel forward and rotated[48]. One efficient method is a kind of tube like device to
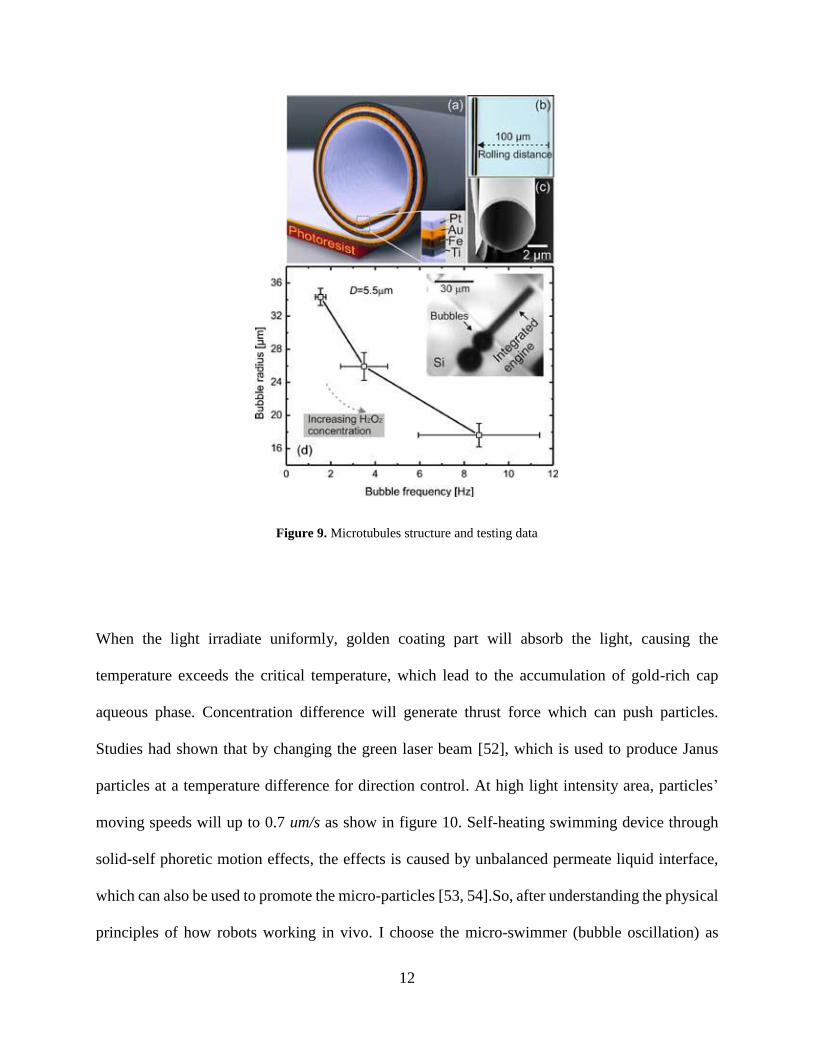
propel itself. The micro-tubules were made by metal thin film [49]. As shown in figure 9, the
film is used for the decomposition of hydrogen peroxide, this kind of micro-swimmer using
ferromagnetic to control the direction of the magnetic layer.

11
Figure 8. Using of the inertial motion to propulsion nano-motor
At larger opening end, there is a difference between the Laplace pressure, the oxygen
bubbles are driven into here. The hydroperoxides are pushed to the smaller openings, which
producing a continuous jet stream. Therefore, thrust force is obtained. The maximum speed of this
micro-tubule can reach to 2 mm/s, which is equal to about 50 body lengths per second.There are
also experiment results for tubular polyaniline (PANI) / zinc micro-rockets voluntary movements
effective in extreme acidic environment[50].
1.1.4 Brownian motion method
Brownian motion external input signal without biased, the combination of deterministic and
stochastic systems can assist in the sub-micron scale particles orienteering [51]. Silica spheres
covered by (radius of 2.13 m) half of the gold-coated layer [58].
12
Figure 9. Microtubules structure and testing data
When the light irradiate uniformly, golden coating part will absorb the light, causing the
temperature exceeds the critical temperature, which lead to the accumulation of gold-rich cap
aqueous phase. Concentration difference will generate thrust force which can push particles.
Studies had shown that by changing the green laser beam [52], which is used to produce Janus
particles at a temperature difference for direction control. At high light intensity area, particles’
moving speeds will up to 0.7 um/s as show in figure 10. Self-heating swimming device through
solid-self phoretic motion effects, the effects is caused by unbalanced permeate liquid interface,
which can also be used to promote the micro-particles [53, 54].So, after understanding the physical
principles of how robots working in vivo. I choose the micro-swimmer (bubble oscillation) as

13
subjects. I will verify the possibility of in vivo work, so I'll put micro-swimmer in vivo
environment for testing.
Figure 10. Trajectory of a self-propelled Janus particle by light gradient
1.2 THE AFFECT OF VISCOSITY OF THE LIQUID FOR MICRO-SWIMMER
MOTION IN THE FLUID
We know that at the microscopic environment, most of organisms and artificial robots are working
at the condition of a low Reynolds numbers, they are propelled using viscous force. By observing

14
the N-S equation: we can figure out that part of equation: η∇2u, which means the viscous force
per unit volume. The coefficient of viscosity η will affects propulsion force.
Next, we will discuss different kinds of liquids’ impacts on stream flow and fluid field
around micro-robots. We chose micro-swimmer made by glass tubes as the test subjects. In
previous experiments, the liquid with different viscosities were tested [55-57]. H. C. Brinkman
calculated viscous force applied to the micro-particle, which his equation can be used in different
viscosity fluids [58]. Using stokes law, the force exerted on the small spherical particles can be
calculated, and they got the equation (4):
𝐹𝑑 = 6𝜋𝜇𝑅𝑉 (1-4)
In this equation: 𝜇 is the coefficient of viscosity, R is the particle radius and V is the velocity
of the fluid. For the spherical bubbles, there is an equation to calculate resonance frequency of the
bubble fo [59]. In equation (5) a is the diameter of the bubble.
a𝑓0 ≅6𝑚
𝑠 (1-5)
In the case of glass tubes, the equation (6) also given expression in papers [60, 61]. In the equation
(6) κ is frequency-dependent parameter determined by the thermodynamic cycle, which is

15
executed by the gas in the course of the oscillations. 𝑃0 is undisturbed pressure in the bubble, ρ is
liquid density, 𝐿𝐵 is length of the bubble and 𝐿0 is length of the liquid column comprised between
the bubble interface and the exit of the tube.
𝑓0 =1
2𝜋√
𝜅𝑃0
𝜌𝐿0𝐿𝐵 (1-6)
Jian Feng given calculation formula through impetus of the bubble vibration, which can
descript propel force apply on micro-swimmer (micro-tube)[62]:
𝐹 ≅ 0.8𝜌𝐴(𝑎𝑓)2 (1-7)
Meanwhile, he also shown the corresponding diagram of relationship between Reynolds
numbers and propulsion forces, which is shown in figure 11:
Because the micro-swimmers will eventually be used in vivo as a targeted drug delivery
devices or targeted therapy instruments. So biological environment simulation tests are very
important. From these equations we can know, the viscosity coefficient of the liquid and the fluid
velocity will have large impacts on propulsion force. By review the relevant documents, the
density of blood is approximately 1040-1060kg/m3[63-67]. Compared to the density of water

16
(1000 kg/m3). The difference is negligible (4%-6%). However, the coefficient of viscosity of blood
is approximately 3.5-4 times of water [68, 69].
Figure 11. Relationship between Reynolds and propulsion force
Philippe Marmottant & Sascha Hilgenfeldt[70], their study involved in air bubbles
deformation and vibration in the liquid. Many treatment methods and biological experiments using
the cavitation microstreaming technology [71, 72]. Robin Hui Liu's research [73] mentioned the a
kind of mixing liquid flow field by using bubble vibration. However, this paper does not give
details of how flow field changed in different liquid environments. S. A. Elder [74] described more
details of the flow field of micro-streaming with different liquid viscosity coefficients. In his paper,
he gave cases of micro-streaming at a low viscosity coefficient (𝜂=0.01 cm2/s). The paper showed

17
the flow fields around the bubble with the increase in bubble vibration amplitude, which we can
see figure 12.
Figure 12. Four different kinds of streaming
However, the author only gave the vibration of circular bubble and the surrounding flow
field. But my research will focus on the case of air bubbles vibrate in the tube and find out the
details of conditions which will can cause the micro-streaming circular around the open end of the
tube.
1.3 LIQUID LENS
In the future research program, we need to apply sound field in vitro to achieve control device in
human/animal body. However, we found we mainly use two kind of sound source today, one is
point sound source, the other is excitation sound field by vibrating plate. The reasons to use these

18
two sound sources because sound source structure is simple and easily control. The disadvantage
of these two methods are both of these sound source was divergent transmission with low
transmission efficiency. Especially when used in blood and human tissue, the energy will get a lot
of losses. Such a sound field mode is not conducive to the the device that intend to propel in the
human/animal body. In order to improve the transfer efficiency of the sound field, I designed a
liquid lens and the focal length can be varied for focusing sound waves.
I was inspired by a video on YouTube upload by Indiana University Physics department
[75], In this video, they demonstrated by using of plexiglass lens can focus ultrasound in water.
We can see in from video, after using a lens, concentric ripples generated at the focal point is
significant enhanced (sound field generated by ultrasonic acoustic transducer at bottom part of the
board).
Here is the principle of sound waves through the medium refraction, the acoustic focus and
light focus using principles of Snell Law:
𝑠𝑖𝑛𝜃1
𝑠𝑖𝑛𝜃2=
𝑣1
𝑣2=
𝑛1
𝑛2 (1-8)
In equation (8) 𝜃 is the angle measured from the normal of the boundary, 𝑣 is the velocity
of acoustic in the medium and n is refractive index (unitless) of the medium. Although a solid lens
having advantages like simple structure, but it also has shortcomings, for example: a fixed focal
length that can not be changed and highly reflective. So I looked up information on a liquid lens.
The liquid lens can be used for optical enlarge, various-focal [76-80] and miniature cameras[81].
19
However, the liquid lens basically using for optical field. There no published results show the
experiments of using liquid lens to focus the sound waves. I will make the lens and to verify my
ideal: using liquid lens focusing sound waves idea.
The three kinds of liquid lens design are described at following part, we can see them in
figure 13.
From figure 13,1. We can see a kind of design to change the focal length of the liquid lens
by applying an external voltage [82, 83]. This type of lens having short response time and can
continuously change the focus. However, such a lens is typically used for small cases.
From figure 13,2. By injection / pulled out of liquid in chamber to change the curvature of
the lens surface of the elastic membrane [76, 84-86]. This type of fluid lens can have various focus
length without changing the lens aperture.
From figure 13,3. By changing the boundary of elastic membrane [87]. The liquid within
the lens assembly is brought into/out, so the curvature of the film changes, causing the light
converging or diverging. A disadvantage of such a lens is not easily kept parallel to the plane of
the substrate of the elastic film.
The figure 13 shows the lens types 1,2,3. And 4 is the use of a mechanical structure change
the focal length of the lens
Consider the purpose of the experiment is to focus sound wave on the micro-swimmer. The
size of the micro-swimmer: diameter is about 600 um, length is 1200 um. The piezoelectric which
generated acoustic pressure diameter is 30mm. So, I chose the second method, such a design can
cover a larger area, easily making and does not require application of an external electric field,
which is suitable for our experiment case,it can work in various medium, and easily change the
focus length.

20
Figure 13. Different types of liquid lens

21
2.0 EXPERIMENTS
2.1 THE RELATIONSHIP BETWEEN THE VISCOSITY OF THE LIQUID AND
THE STREAM SPEED
2.1.1 Experiment of principle
I test with a tube with one end open and the other end closed made by capillary tube, which is
based on the experiments results of Jian Feng. I test with this design because its structure is simple
and easy to fabricate. One of the important thing is it’s do not carry energy source itself. From the
experiments results of Jian’s work, we know that by arrange several tube together we can carry
the load and propel in the fluid environment. So finally it can obtain the goal of drug delivery. On
the other hand, by using two different length tube attach on a plant, 2-D movement can be realized.
In normal case, Reynold’s number can be defined as 𝑅𝑒 =𝜌𝜈𝐿
𝜇, which 𝜌 is the density of the fluid ,
𝜈 is stream speed, 𝜇 is viscosity and L is length of the tube. However, in case of generated by
oscillation flow and sound source is extend acoustic wave, which means the propulsion force
related to the input frequency, Reynold’s number can be re-defined as:
In this equation (2-1), R is the radius of the micro-channel, a is amplitude of bubble amplitude and
f is oscillation frequency. We test the tube in high frequency (1.0kHz~4.0kHz), in this case, we test

22
in high Re number. For the Navier–Stokes equation (2-2): in section of 𝜌(𝝁 ∙ 𝛻)𝝁, which is a
nonlinear term. Assume V is one of the solution of the N-S equation, -V may not be a necessarily
solution. By time-average the two solution, the result should not be zero, which will cause the
movement speed.
Re =2𝜌𝑅(2𝜋𝑓)𝑎
𝜇 (2-1)
𝜌 (𝜕
𝜕𝑡+ 𝝁 ∙ ∇)𝝁 = −∇𝑝 + 𝜂∇2𝒖 (2-2)
Figure 14. Tube with one end closed and the other end open made by capillary glass tube

23
Experiments testing glass capillary tubes are closed at one end and open at the other end,
as shown in figure 14. Then I would like to explain the production processes which is also shown
in figure 15. Firstly, using medical glass capillary tube, which inner diameter is about 300um, and
outer diameter is about 600 um, cutting it into subsections.
Figure 15. fabrication processes
Each section length is 2500 um (±50um), one end is heated to melt the glass tube, so I can
make it one end closed. Eventually we obtain glass tubes closed at one end open at the other. The
propulsion principle is based on the "acoustic scallop"[30]. Which I mentioned above, bubbles
trapped into micro-tubes, when the external sound field is applied (frequency is about 2.0kHz -
4.0kHz), the interface between the gas-liquid bubble periodically oscillate back and forth. Since
liquids in and out, the flow field is not a simple symmetry, which means speeds is calculated by
mathematical method, and they are not zero, thus micro-tube moving forward.
Navier-Stokes equations have been analyzed and described above: 𝜂∇2𝒖 is the viscous
force per unit volume. In the condition of low Reynolds number, viscous forces are dominated.

24
For experiments of micro-mechanical devices propel in liquids, the "inertial force" also affect
smaller, which means "viscous forces" are dominant. So we can get the conclusion: 𝑅e is a key
element of this micro-robot propel in liquids.
Jian Feng’s [62] article simulated micro-propulsion streamline under different Reynolds
numbers, which is shown in figure 17.
Figure 16. One period of the bubble oscillation
The same amount of fluid inflow and outflow of rate are settled. In the low Reynolds
number: Re=0.38. We can see from the figure: discharged and enter fluid presents a relatively
wide angle, they are almost the same jet flow, except for direction.

25
Therefore, in this case the fluid flow around micro-device generated momentum almost
equal to zero. In high Reynolds number, when Re = 380, the input and output liquids are distinctly
different, the output flow field showing a straight, centralized state; while in the case of suction,
the fluid get together near the opening end of microtubules. Suction at the angle of almost 0-175
degrees, such a huge contrast phenomenon, can generate significant propulsion. Because if we
time-average the speed of the fluid flow, the speed should not be zero, and Reynolds number is
calculated by the equation: 𝑅𝑒 =2𝜌𝑅(2𝜋𝑓)𝑎
𝜇 . In my experiments, I will test the movement of
microtubules in different liquids with different viscosities. And these experiments will finally try
to prove the micro-swimmer can swim in the blood environment.
Figure 17. Simulated micro-propulsion streamline

26
2.1.2 Experimental equipment set up
(1) Liquid choosing
liquids for testing should have the following characteristics: low toxicity, low causticity,
easily preserved, viscosity coefficient larger than blood, readily available, inexpensive, and easily
to configure different solution viscosity coefficient. Finally, I chose Glycerin (essentialdepot;
batch no.892647002536-14132454). The reason for chose the Glycerin are: coefficient of viscosity
is much greater than blood (After measure viscosity is [62]1.4Pas; the viscosity of blood is 0.0035-
0.004Pas; Distilled water is 0.001Pas). And there is no resistance, which means it can configure a
solution in water, and easy to store.
Figure 18. Glycerin

27
(2) Capillary glass tube selection
I chose the medical glass capillary tube as raw materials, which inner diameter is 300 um
(±25um), outer diameter is 600 um(±25um). As described above, the reason is the glass capillary
tubes are inexpensive, durable, easy to store, and not brittle breakable.
(3) Sound source selection
I select the piezoelectric disk (Piezo electric disk transducer 35mm) as sound source.
Because the vibration amplitude and frequency of the device can be controlled. The frequency and
voltage is generated by the Waveform Generator (Agilent 33220A 20 MHz). The device can
produce sine wave from 0 kHz to 20kHz. For the general case, the resonance frequency of the
micro-swimmer is 2.0 kHz to 3.5kHz, within the scope of the use of equipment. The output current
generated by the device, but then through an amplifier (Trek Model Pzd700A High-Voltage Power
Amplifier/Piezo Driver) for amplification.
(4) Water tank build up
Water tank was built up by acrylic (Optically Clear Cast Acrylic Sheet, 1/16" Thick, 12" x
12"). After cutting and paste into 50 × 100 × 50 𝑚𝑚 sink, as show in figure 22. The acrylic
pieces pasted on acrylic tank by the chloroform. In order to test piezoelectric locations effects, I
attached piezoelectric disks to the different positions of the tank, and I tested its effect to bubble
oscillation. Tank and piezoelectric disks are shown in figure 19. The same voltage is applied to the
piezoelectric disk, the sound field generated by piezoelectric. By measuring the amplitude of
bubble oscillated in the fluid, we can see the different position of the disks indeed have effect on
bubble oscillation. When the sound source located at the bottom of the tank, giving the voltage at
49.4V, frequency at 1.670 kHz, the amplitude of the bubble oscillation is 0.020 mm; When the
sound source at the top of the tank, given voltage at 50.1 V, frequency at 1.670 kHz, the amplitude
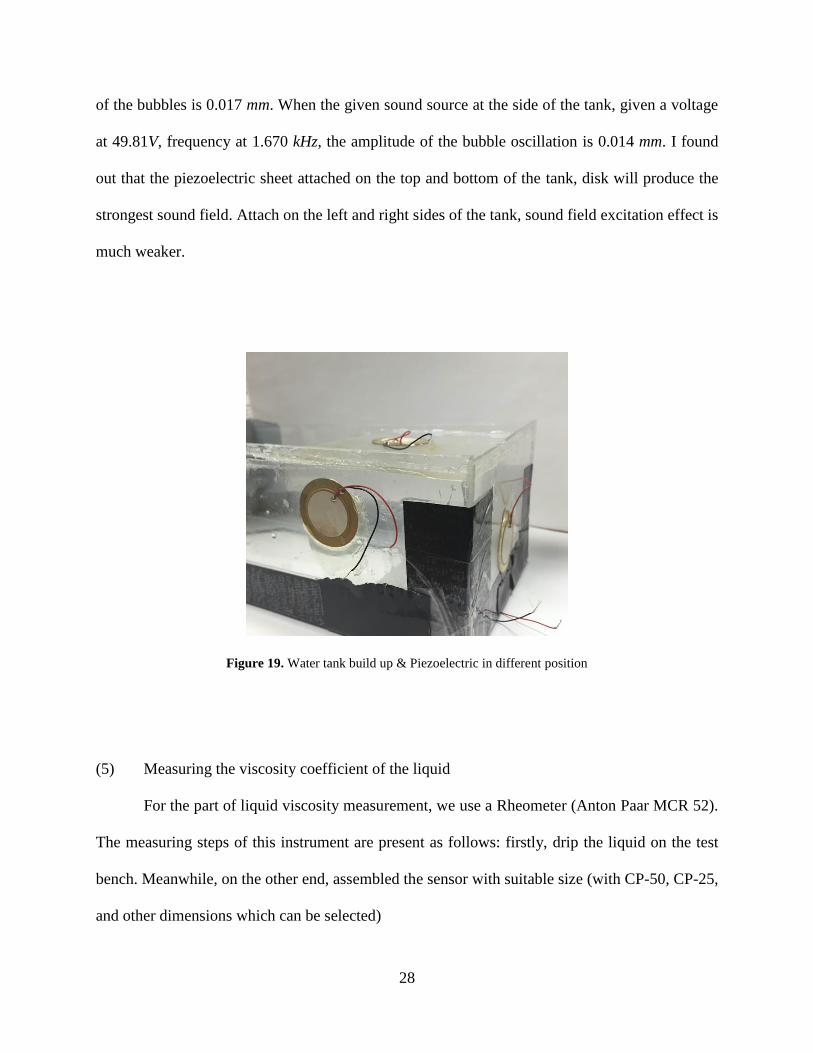
28
of the bubbles is 0.017 mm. When the given sound source at the side of the tank, given a voltage
at 49.81V, frequency at 1.670 kHz, the amplitude of the bubble oscillation is 0.014 mm. I found
out that the piezoelectric sheet attached on the top and bottom of the tank, disk will produce the
strongest sound field. Attach on the left and right sides of the tank, sound field excitation effect is
much weaker.
Figure 19. Water tank build up & Piezoelectric in different position
(5) Measuring the viscosity coefficient of the liquid
For the part of liquid viscosity measurement, we use a Rheometer (Anton Paar MCR 52).
The measuring steps of this instrument are present as follows: firstly, drip the liquid on the test
bench. Meanwhile, on the other end, assembled the sensor with suitable size (with CP-50, CP-25,
and other dimensions which can be selected)

29
The sensor will rotate at a constant speed, and the rotate speed determines the surface shear
rate of the liquid, which we dripped it on the platform previously.
Liquid form will tends to the shape of test probe under the squeezed of the sensor. The
force applied to the test bench (torque) is measured, which can be converted to shear stress.
(6) High Speed Cameras
I using a high speed camera (Phantom v7.3) to record the movement of microtubules and
vibration of the gas-liquid interface.
Generally, I selected recording mode: (1) when recording the movement of microtubules,
I choose exposure high speed camera model of: 25 ISO, 1000 fps, 800×600 pixel. (2) when
recording the gas-liquid interface vibration & fluid flow at the opening end of micro-tubule, I chose
model of: frame is 37000 fps, exposure is 25 with 256×256 pixel.
(7) Microscope selection
I chose optical microscope when I need to observation micro-tubule movement and and
gas-liquid interface oscillation: I chose microscope: Nikon (eclipse te2000-u). I choose different
lenses for different cases: (1) CFI Plan Fluor 4x (N.A 0.13;. W.D. 17.1mm; Material No.
MRH00040); I use this lens to observe the movement of microtubules. Because I can observe the
entire microtubules using lens with this enlarged scale. (2)CFI Plan Fluor 10x: (NA 0.30; WD
16.0mm; DIC Prism : 10x; Material No. MRH00100) I chose a larger magnification lens to observe
the gas-liquid interface vibration. I released particles in a fluid, by observing the movement of
particles, we obtain the situation of the fluid flow in the liquid at the open end.
(8) Observation of experimental equipment itself microscope selection:
Keyence VHX-600 Digital Optical Microscope (Keyence digital microscope system)
30
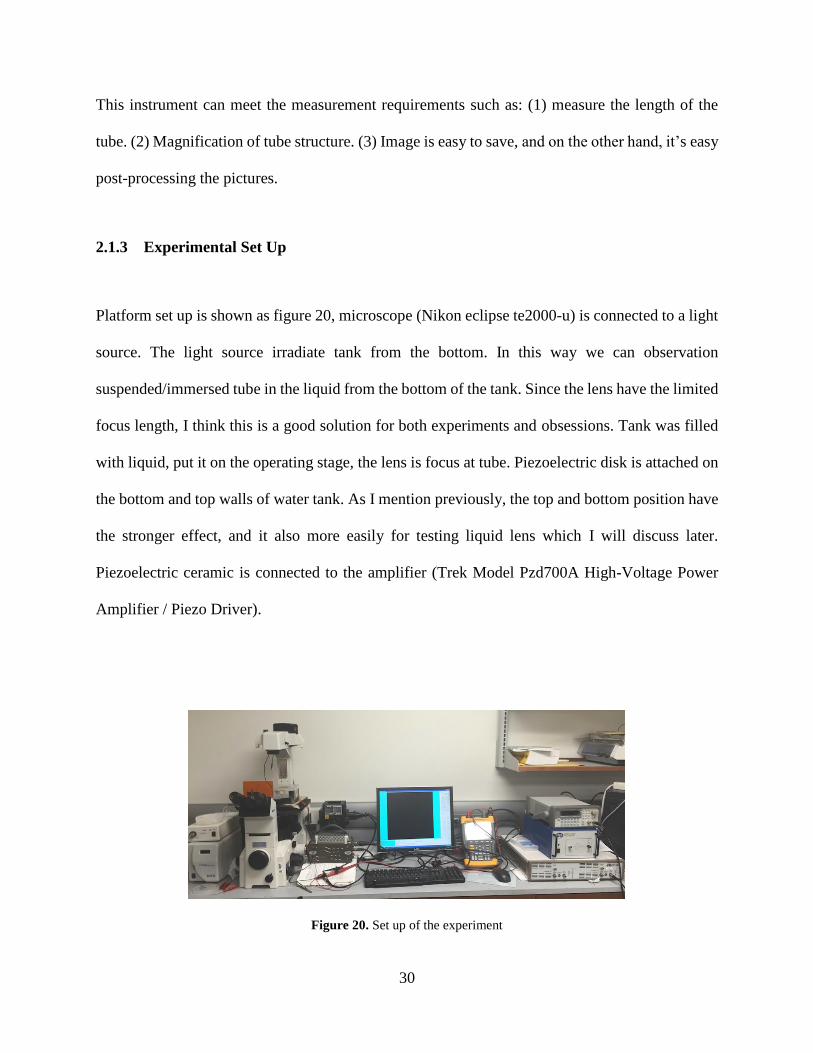
This instrument can meet the measurement requirements such as: (1) measure the length of the
tube. (2) Magnification of tube structure. (3) Image is easy to save, and on the other hand, it’s easy
post-processing the pictures.
2.1.3 Experimental Set Up
Platform set up is shown as figure 20, microscope (Nikon eclipse te2000-u) is connected to a light
source. The light source irradiate tank from the bottom. In this way we can observation
suspended/immersed tube in the liquid from the bottom of the tank. Since the lens have the limited
focus length, I think this is a good solution for both experiments and obsessions. Tank was filled
with liquid, put it on the operating stage, the lens is focus at tube. Piezoelectric disk is attached on
the bottom and top walls of water tank. As I mention previously, the top and bottom position have
the stronger effect, and it also more easily for testing liquid lens which I will discuss later.
Piezoelectric ceramic is connected to the amplifier (Trek Model Pzd700A High-Voltage Power
Amplifier / Piezo Driver).
Figure 20. Set up of the experiment

31
The amplifier is connected to the Waveform Generator (Agilent 33220A 20 MHz), By changing
the frequency and voltage inputs, we can find the resonance frequency, and a vibration amplitude
for observation. In this way, we can test the bubble oscillation in different input voltage and
frequency, which will also help me to research the relationship between the input voltage and
bubble position which I will discuss them later in details.
Figure 21. Set up of the experiment
2.1.4 Test Method
The volume of liquid needs to meet the following requirements: (1). Liquid can cover the bottom
of water tank and tube can be completely immersed in the liquid. In this case, flow field can be
observed in this volume of liquid. (2) In the same volume of blood, the thickness of the blood in
the tank can make the light irradiation, and it can be clearly captured by microscope. After testing,
I chose liquid volume of 100 ml to testing.
In order to formulate an appropriate solution, I calculate viscosity of mixed solution of
glycerol and water. These equations come from the paper [88], I also calculation the viscosity

32
through the data on reference sites and on the web to double check and compare the results[89].
By using rheometer I measured mixed solution of glycerol and water, I can compare the results
from experiments and result from equation calculation. I measured water and glycerol mixing
solution with ratio 1: 3 (temperature of 25 ° C). From the web, I got the result:0.00268 𝑃𝑎 ∙ 𝑠 .
From the rheometer, I got the result of 0.0027 𝑃𝑎 ∙ 𝑠, the error between them is 0.7%.
The experiments aim at understand the bubbles oscillation & micro-robot propulsion in
liquid with different coefficient of viscosity. And finally proof micro-robot can be propelled in
blood. The experimental conditions should be controlled: (1) the same volume of liquid within the
tank. (2) The same input voltage and input frequency, which can ensure the vibration amplitudes
of the piezoelectric are the same.
Two cases should be considered: (1) Liquids with the different viscosity, bubble vibration
oscillation differently. One of reasons might be: bubble is compressed differently, so they have
different amplitudes; Another possible reason is: the bubbles are compressed under same
conditions with the same amplitude, but effects on the flow field is different. (2) Viscosity and
density are different, so reflectivity and attenuation coefficient is also different, in conclusion,
acoustic energy transmission capacity is different. So, I will measure into two parts: (1) By
applying the same external sound field, measured the fluid flow at the open end of the tube. (2) In
the case of the same amplitude, measured tube flow field generated by bubble vibration in different
liquid.
Since I can’t measure liquid flow field directly. I tried measure it by using a very fine line,
it suspended vertically at the open end of the tube. When the bubble oscillation generates flow
field, the fluid flow will give force to the line, causing thin line tilt a certain angle. By measure the
angle I can compare details of flow field in different conditions. However, this method has the
33
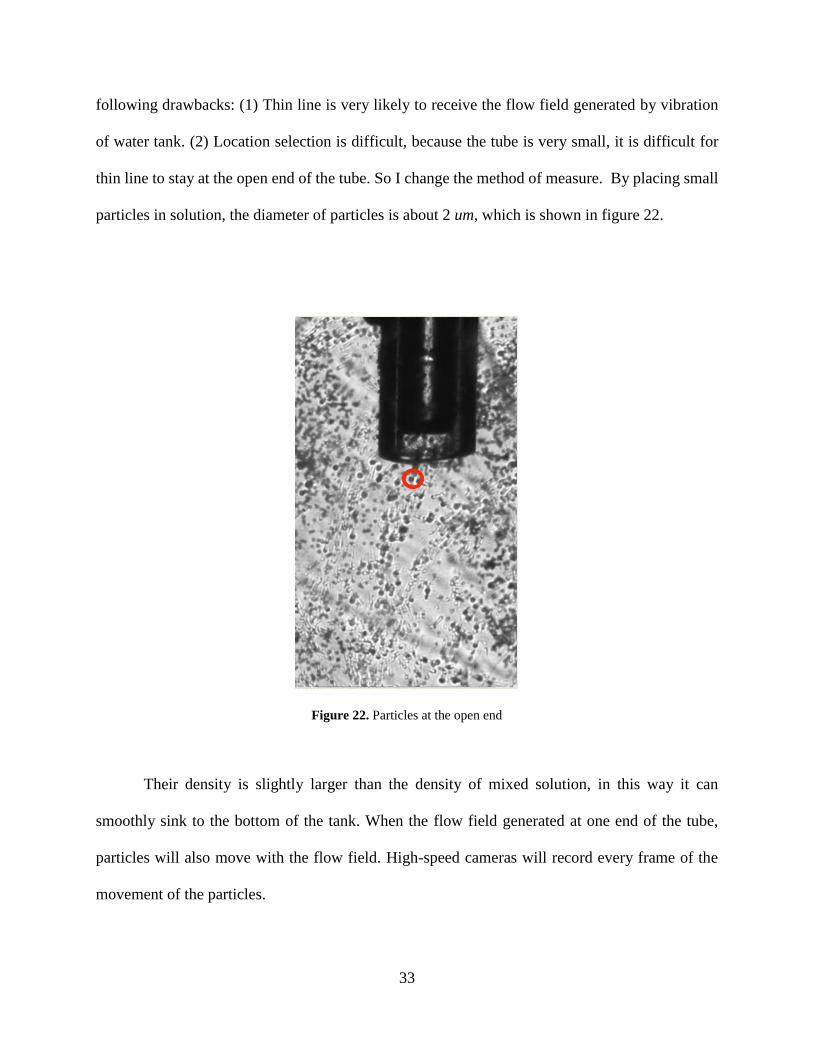
following drawbacks: (1) Thin line is very likely to receive the flow field generated by vibration
of water tank. (2) Location selection is difficult, because the tube is very small, it is difficult for
thin line to stay at the open end of the tube. So I change the method of measure. By placing small
particles in solution, the diameter of particles is about 2 um, which is shown in figure 22.
Figure 22. Particles at the open end
Their density is slightly larger than the density of mixed solution, in this way it can
smoothly sink to the bottom of the tank. When the flow field generated at one end of the tube,
particles will also move with the flow field. High-speed cameras will record every frame of the
movement of the particles.
34
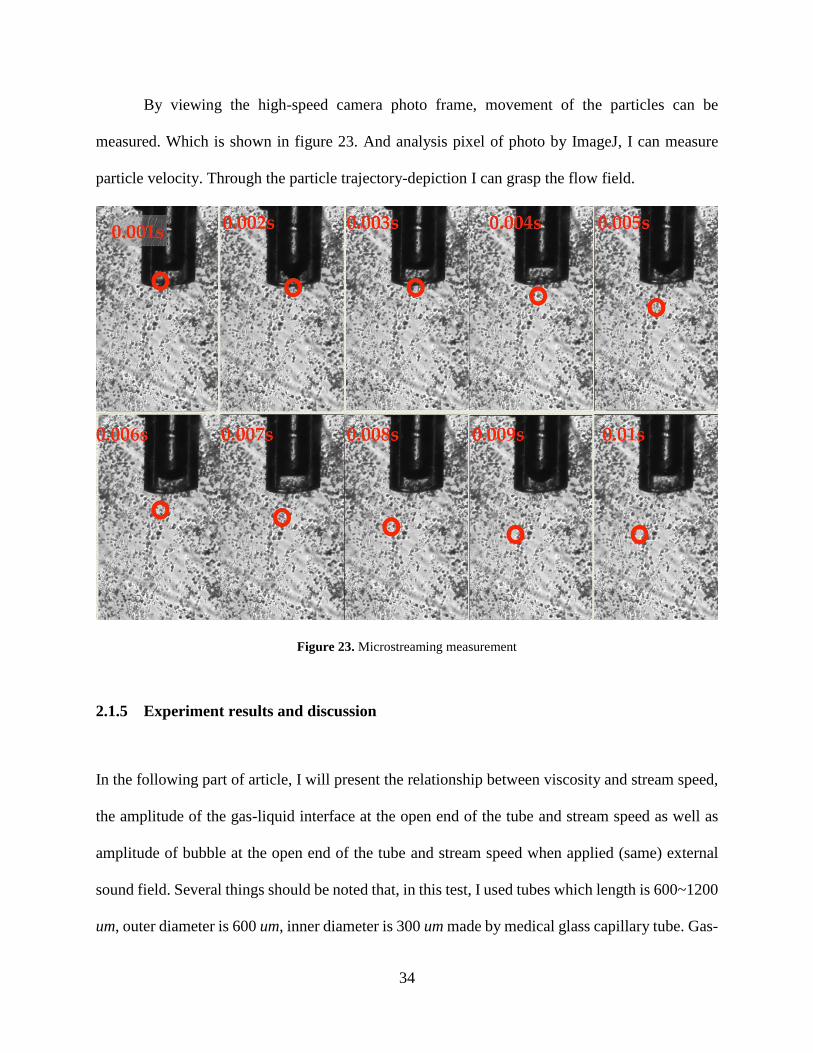
By viewing the high-speed camera photo frame, movement of the particles can be
measured. Which is shown in figure 23. And analysis pixel of photo by ImageJ, I can measure
particle velocity. Through the particle trajectory-depiction I can grasp the flow field.
Figure 23. Microstreaming measurement
2.1.5 Experiment results and discussion
In the following part of article, I will present the relationship between viscosity and stream speed,
the amplitude of the gas-liquid interface at the open end of the tube and stream speed as well as
amplitude of bubble at the open end of the tube and stream speed when applied (same) external
sound field. Several things should be noted that, in this test, I used tubes which length is 600~1200
um, outer diameter is 600 um, inner diameter is 300 um made by medical glass capillary tube. Gas-

35
liquid interface is below the open end, and depth is about 150 um (±20 um). With applied voltage
at 75V, frequency at 3.7 kHz. Experimental results of relationship between viscosity coefficient
and stream speed are shown in figure 23.
Figure 24. The relationship between viscosity coefficient and stream speed
From the chart, we can see under the same external experimental conditions, with the increasing
of viscosity, the stream speed become slower. I expound several explanations: (1) With the
increasing viscosity, the amplitude of the bubble becomes smaller, so as the stream speed. The
amplitude of the bubble oscillation has a large effect on stream speed, because oscillation
36
amplitude determines the initial velocity of the stream speed, it means with the large bubble
oscillation amplitude, the initial speed of the particle become larger. (2) In the case of high
viscosity liquid, particles oscillate back and forth, this can cause the particles move forward slowly
because when give time average of the the velocity, back and forth can lead to low average speed.
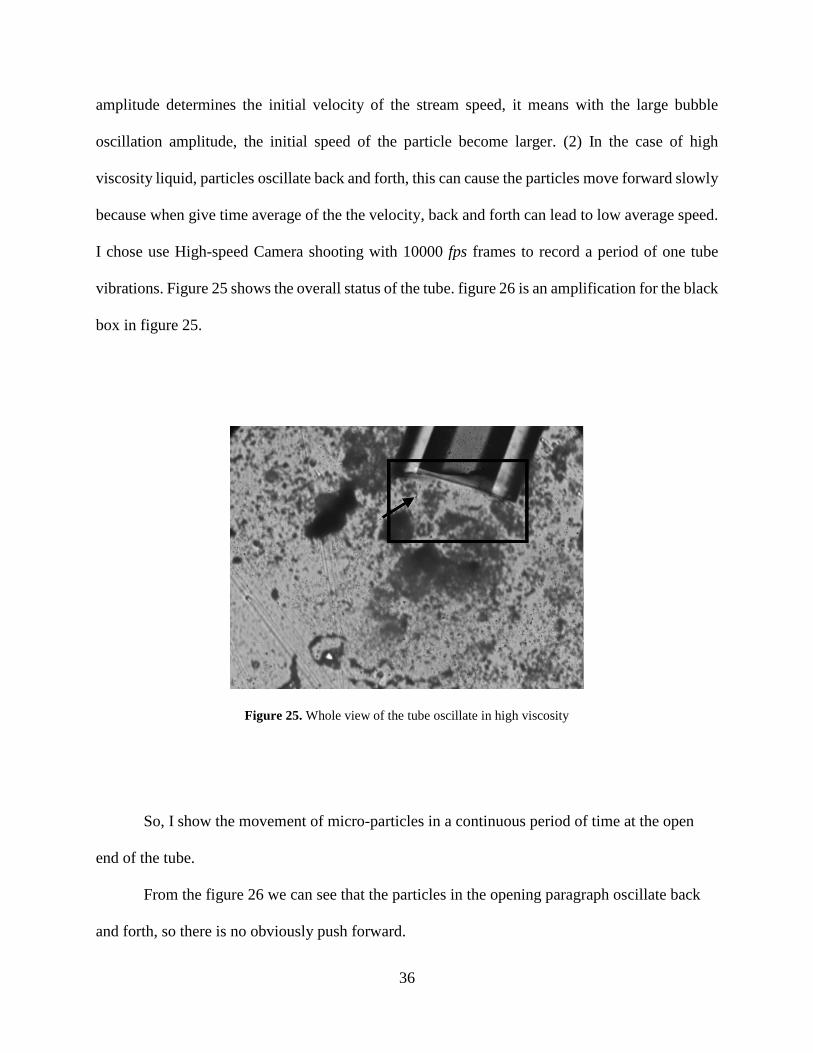
I chose use High-speed Camera shooting with 10000 fps frames to record a period of one tube
vibrations. Figure 25 shows the overall status of the tube. figure 26 is an amplification for the black
box in figure 25.
Figure 25. Whole view of the tube oscillate in high viscosity
So, I show the movement of micro-particles in a continuous period of time at the open
end of the tube.
From the figure 26 we can see that the particles in the opening paragraph oscillate back
and forth, so there is no obviously push forward.

37
Figure 26. View of micro-particles oscillation
(3) Physical properties of the liquid are different with different viscosity coefficient: such
as density and speed of sound, although the same sound field is applied to tube, with different
attenuation coefficients, stream speed might be different. From the equation of characteristic
impedance, we can see:
𝑧 = 𝜌𝑐 (2-3)
Which 𝑧 is characteristic impedance, 𝜌 is fluid density and 𝑐 is sound speed. For the first
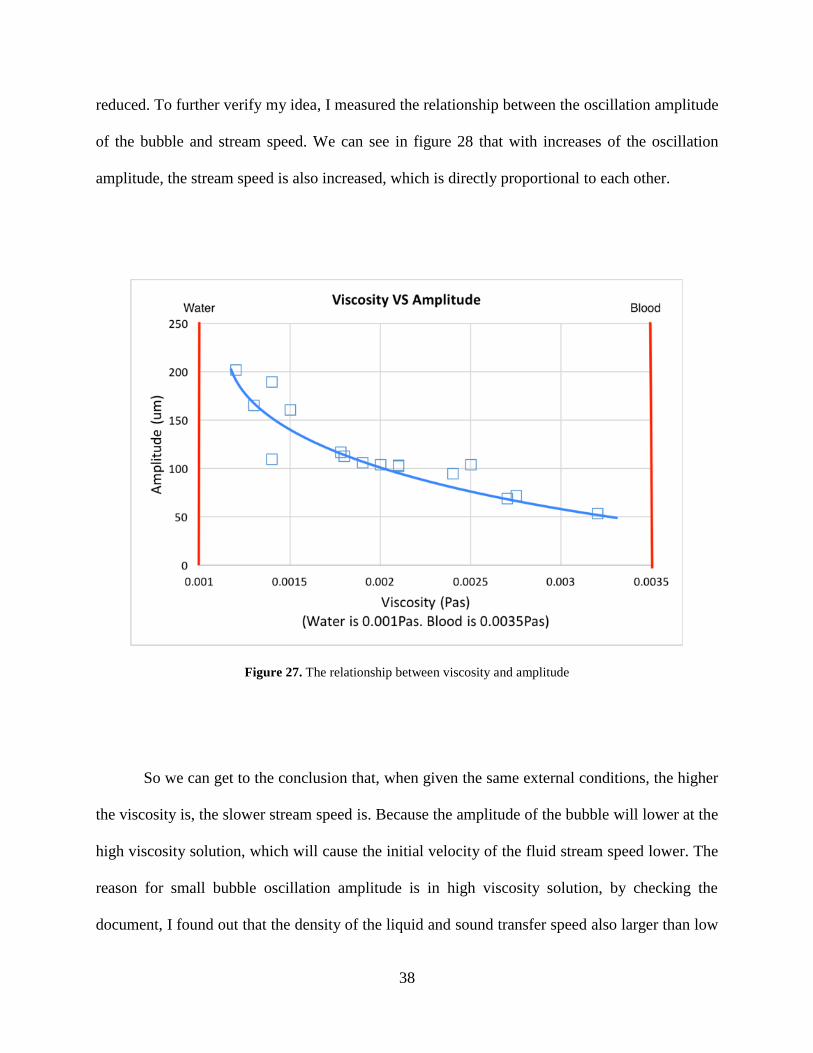
explanation, I did the following experiment to proof it. The results can be found in figure 27. The
figure 27 shows that with the increase in viscosity, the amplitude of the bubble oscillation indeed
38
reduced. To further verify my idea, I measured the relationship between the oscillation amplitude
of the bubble and stream speed. We can see in figure 28 that with increases of the oscillation
amplitude, the stream speed is also increased, which is directly proportional to each other.
Figure 27. The relationship between viscosity and amplitude
So we can get to the conclusion that, when given the same external conditions, the higher
the viscosity is, the slower stream speed is. Because the amplitude of the bubble will lower at the
high viscosity solution, which will cause the initial velocity of the fluid stream speed lower. The
reason for small bubble oscillation amplitude is in high viscosity solution, by checking the
document, I found out that the density of the liquid and sound transfer speed also larger than low

39
viscosity liquid, which leading the attenuation coefficient is larger, causing the energy transfer
efficiency is very low. On the other hand, from these data we can predict that it’s more difficult to
propel the micro-swimmer swim in the blood environment than water.
Figure 28. The relationship between amplitude and stream speed
If micro-swimmer working into the actual blood environment, due to physical properties
changes, causing the low efficiency of acoustic transmission, and will directly affect the oscillation
amplitude of the bubble. Thus the micro-swimmer propulsion in the blood may be move slowly,
causing actual application more difficult.
At the same time, I also measured the relationship between the viscosity coefficient and
the input vibration frequency, I measured the velocity of the fluid flow field at the tail of micro-

40
robot. By simulating the liquid viscosity coefficient as same as blood. By changing the input
frequency, we can observe the relationship of stream speed of fluid and input frequency variation.
Figure 28 show with the change of frequency, stream speed changes. We can see from the
figure 28, with the input frequency changes, there are several resonant frequency peaks appear.
There are peaks at the frequency of 3.2 kHz, 3.9 kHz, 4.3 kHz, 4.9 kHz…
Figure 29. The relationship of input frequency and stream speed
Then, I tested frequency various from 2.0kHz~3.5kHz with two liquids with different
viscosities. We can see from figure 29, "single resonance range" of water is significantly larger
than the " single resonating space" of solution of mix of water and glycerol. By calculating their
Q factor we know that the Q factor of water and glycerol solution is obviously a lot smaller than
Q factor of water. We can also see the bandwidth of water and glycerol solution is wider than the

41
band width of water. Except the effects of different physical properties of the two liquids, I think
one of the reasons is water is much easily to propel by oscillation of bubble than mixed solution
of glycerol. The Q factor is calculate by the equation 𝑄 =𝑓
∆𝑓, where f is resonance frequency. And
∆𝑓 is bandwidth.
Figure 30. The relationship between stream speed and frequency (water / water-glycerin)
2.2 TUBE PROPULSION IN THE BLOOD
2.2.1 Experiment Principle
The experimental principles are as same as previous experiments. I use the capillary glass tubes
which closed at one end are immersed in the blood, so there will be a bubble of blood enclosed in

42
a glass tube. When applied to externally of the sound field, bubbles will oscillation because of the
external sound field, the bubbles can be compressed elastically then oscillate back and forth. By
changing the flow field, the driving force will also be changed in the open produced by bubble at
the end of the glass capillary tube. One thing should be mentioned that the physical properties of
the water and the blood is quite different, which means the blood has different density and viscosity
with water. Moreover, since blood component red blood cells, platelets, so the blood is non-
Newtonian fluid. Before the implementation of this experiment, it is difficult to determine whether
can we push the device forward through the oscillate of bubbles. From the previously experiment
we expected that micro-swimmer is harder to propel at large viscosity environment.
2.2.2 Experimental result
Experimental platform set up is same as previous one. Experiment was divided into two parts. (1)
Micro-robot propel testing in plasma. (2) The micro-robot propelling testing in blood.
Because the blood is dark color liquid with high viscosity, and the microscope lens is
viewed from bottom to the top. I test different volume of blood to make sure the clarity of
observation. Finally, I chose 100 ml. I choose 100 ml because micro- robot can be completely
immersed in the water tanks liquid with this volume, and microscope can easily catch the
observation target in bright light.
Tests in plasma: the density of plasma is about 1025 𝑘𝑔/𝑚3 [90]. By actual tests for
viscosity at 0.00226 𝑃𝑎 ∙ 𝑠. The results are shown in figure 31 below:
Because plasma easily observed under the microscope (it’s a kind of light color liquid
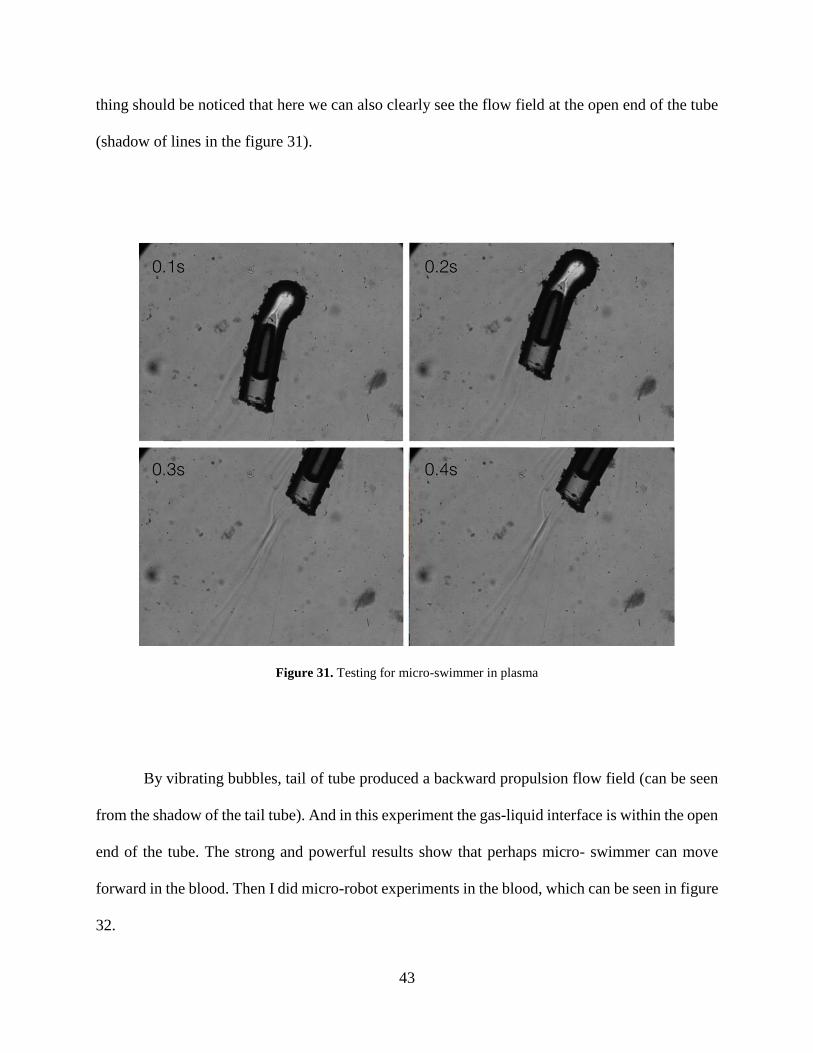
compare with whole blood), which we can see a clear micro- swimmer forward movement. One
43
thing should be noticed that here we can also clearly see the flow field at the open end of the tube
(shadow of lines in the figure 31).
Figure 31. Testing for micro-swimmer in plasma
By vibrating bubbles, tail of tube produced a backward propulsion flow field (can be seen
from the shadow of the tail tube). And in this experiment the gas-liquid interface is within the open
end of the tube. The strong and powerful results show that perhaps micro- swimmer can move
forward in the blood. Then I did micro-robot experiments in the blood, which can be seen in figure
32.

44
The average density of whole blood for a human is 1060 𝑘𝑔/𝑚3[91],By measuring the
viscosity of blood by rheometers I know the viscosity of blood is 0.0036 𝑃𝑎 ∙ 𝑠. This a slightly
different compare with document provides. This different may caused by anticoagulant in blood,
but the error is within an acceptable range.
Figure 32. Testing micro-robot movement in blood
From the comparison of the two figures, we can see that in the plasma micro-robot moving
speed is significantly faster than that in the blood, and blood viscosity coefficient is larger than
plasma. So this also to verify the correctness of the above simulation experiments.

45
2.3 EFFECT OF THE GAS-LIQUID INTERFACE POSITION TO MICRO-
SWIMMER
2.3.1 Experiment principle
During the experiment I found a “unusual” phenomenon: the position of the bubble in the tube
may exist in different positions. Typically, when given external sound field a period of time. The
bubble itself growth in the liquid and bubbles will show the trend of growing out (In different
liquids, the bubble growth with different speed. In lower viscosity liquid bubble growth is faster,
liquid with higher viscosity was growth slower according to the experimental observation). The
different position of the bubble will affect the micro-swimmers propulsion. During the experiments
I have observed the phenomenon that tube can move backwards. I find this phenomenon in blood
environment firstly, then I repeat the experiments results in in water, water-glycerine environment,
I can also observe the same phenomenon.
2.3.2 Experimental equipment building up and testing method
The experimental equipment set up is same as the equipment that measure relationship between
the viscosity coefficient and stream speed.
The method used in the experiment will be described below: short-term external sound
field is applied causing bubbles maintain in different positions. When gas-liquid interface stability,
I given different external sound field causing different stream speed, then I observe the relationship
of the different positions to micro-swimmer propulsion. I calculate the time-average speed of the
micro-swimmer and compare the data. The reason for using time-average speed is there are a lot

46
of factors that may effect the instantaneous velocity. Such as the smoothness of the bottom of the
tank. By measure the average speed can reduce the error.
2.3.3 Experiment Result and discussion
Three tube with different length (length between 600~900um) were tested under the same external
conditions. The results were shown in figure 33. When the gas-liquid interface within the open end
of the tube, only two backward movement result show in experiment 2 (I definition stream speed
negative for the reverse movement is backward movement), the other are all forward movement.
When the gas-liquid interface above the open end of the tube, there are a large number of backward
movements were observed. It can be seen from the experimental data. In case when gas-liquid
interface above the open end of the tube at the stream speed of 50 mm/s to 100 mm/s. (In the chart,
positive / negative represented direction, so here I just want to show the size of the speed so I
ignore the sign of direction). Tube will move backward. When stream speed is 100-250 mm/s tube
will move forward.
Here, there are three factors that may affect the results of the experiments. The viscosity
coefficient of the liquid; the position of the bubble interface and stream speed of flow field. First
of all, I tested the effect of the different viscosity on stream speed in different bubble position cases,
the experimental results are shown in the figure 34. I tested three different liquid viscosities. In
test results we can see, when the gas-liquid interface above the open end of the tube, liquids with
different viscosities were at different stream speeds, there are data of both the forward movement
and backward motion.
It is impossible to determine whether the viscosity is the decided the move direction of the
micro-robot. For the case of the gas-liquid interface below the open end of the tube, we can see

47
that with the increase in the viscosity the reverse movement greatly reduced. So may be a position
of the bubble and the oscillation amplitude will influence the direction of movement.
Figure 33. The relationship between stream speed and bubble position
In order to proof my idea, I prepare two liquids with different viscosities, they were tested
by applied different external voltage, I obtain different external sound field. The experiment results
are shown in figure 34 and figure 35.
We can see when the viscosity is 0.0035 𝑃𝑎 ∙ 𝑠 and the gas-liquid interface within the open
end of the tube, During the test, there is no case of backward movement appears. However, when

48
gas-liquid interface above the open end of the tube and stream speed at low speed, the device has
a backward movement phenomenon. One thing should be notice that at the large stream speed, (≥
30mm/s) the device trend forward movement.
Figure 34. The relationship between stream speed and viscosity
In water (u = 0.001 𝑃𝑎 ∙ 𝑠), equipment movement trend to be the same. But one thing different is
the backward movement phenomenon also appears, under the conditions of stream speed is large
enough and the gas-liquid interface within the open end. I think when applied the large externally
sound field the large bubble oscillation amplitude is generated. At that time, the gas-liquid
interface at the peak of period was outside in the open end. This is the similar situation when gas-
liquid interface outside the open end.

49
Figure 35. The relationship between stream speed and input voltage
Figure 36. The relationship between stream speed and input voltage (u =0.001Pas)

50
2.4 METHOD TO IMPROVE THE SOUND TRANSMISSION
2.4.1 Experiment principle
During the blood testing I find out micro-swimmer move much slower than in water, so I decided
to improve the sound transmission efficiency. The principle of the experiment is when ultrasonic
wave transfer through the two materials at an oblique angle, which the materials have different a
refractive index, there will be refracted waves generated. They follow Snell's Law:
𝑠𝑖𝑛𝜃1
𝑠𝑖𝑛𝜃2=
𝑣1
𝑣2=
𝜆1
𝜆2=
𝑛2
𝑛1 (2-4)
Figure 37. Snell’s Law

51
Which 𝜃 is regarded as a boundary from the vertical angle measured. 𝑉 is the speed of
light/sound wave in each medium (SI units are meters per second, or m/s ). 𝜆 is the wavelength of
light in the respective medium and n is refractive index of each medium (unitless).
The reasons for I choose liquid lens are: structure of lens is not complicated and can change
the focal length. The liquid lens has a wide range of application, and it have large potential for
improvement, which can be applied later for the control in vivo micro-robot.
2.4.2 Experimental design and equipment build up
Liquid lens structure designing is shown below at figure 37, the elastic film is made by a cross-
linkable polydimethyl siloxane (PDMS), which was provided by Dow Corning Corp. (Sylgard®
182). The cross-linkable PDMS was mixed as a viscous fluid and cross-linked at a w/w ratio of
10:1. By using rotating machine, I made the membrane, which thickness is 100 um. The production
process for the liquid lens will be described below: Firstly, pick up PDMS solution 20g, using Karl
Suss CT62 Spinner to produce membrane. Dripping photoresist on glass sheet and process in 1000
r/min rotation for 60s, so photoresist evenly coated on glass. Then drip the PDMS solution on a
glass substrate. Select the spinner speed at 600 r/min, rotation for 60 s. Next, put the glass sheet
into the oven in 60 ˚C, baking for about 30 min. After cooling for 4 hours, using acetone wash
foam glass sheet, removing light plastic, letting glass sheet and PDMS membrane separation.
Using alcohol rinse PDMS film, I can get a clean and complete PDMS film.
I chose metal flange as ring portion of the lens. The diameter of the upper surface is 40 mm,
inner diameter is 26.20 mm. Between deformable PDMS membrane and the flange, I using optical
glue (Dymax OP-29V, Dymanx Corp., Torrington CT) to adhesive them together. Under
ultraviolet light irradiation is about 5 min, the metal flange can paste with PDMS membrane.

52
The PDMS sandwiched between Plexiglas and metal flanges, secured with bolts for
reinforcement. Drilled two holes with 5mm in diameter in the side flanges, an input the liquid
through one of it, exhaust gas from the other. A solid biconcave lens is attached in the bottom to
maximize the use of space, so the focal length can be short enough. Then, I need to select liquid
lens inside the lens. Sound waves will transmit through the liquid medium within the lens. When
sound waves transmit through the intermediate compartment, then the reflection and refraction
will be different. We need to select suitable liquid by compare sound intensity transmission
coefficient:
Figure 38. Structure of Lens
𝑡𝑝 =𝑝𝑡𝑎
𝑝𝑖𝑎= −
1
1 +14 (𝑅12 − 𝑅21)2𝑠𝑖𝑛2𝑘2𝐷
(2-5)

53
I chose the cooking oil as an intermediate medium, because it is easy to get, and its density
is close to the density of water, which will cause less attenuation. For method for liquid input, I
used medical glass syringes direct injection liquid of liquid lens at first. Later I improved the inject
method by using Harvard PHD 2000 to get more precise control.
Experimental platform structure is shown in figure 39. The tube will be placed in the
bottom of the tank, so it is easily to be observed. The sound source is piezoelectric, which is
attached on the top. The liquid lens, tube and sound source are in three-point line, and tube is
immersed in the tank. Liquid lens us fixed by the holder (SUSS PH120 Manual ProbeHead) and a
lens holder made by myself. It can be accurately moved in three dimensions. Microscope observe
tube from the bottom. I measuring the vibration amplitude of the bubble in tube to determine the
energy transmission efficiency.
First, I tested the bubble oscillation amplitude after liquid lens focus the acoustic wave. By
changing the distance of the lens from tube in the z direction (vertical direction of paper consider
as z direction). Firstly, I find the focal length, I try to change the lens position in the x, y direction
(x direction, perpendicular out to the paper. y-axis the horizontal to paper). Observe amplitude
changes. Figure 40 shows the change in the y direction. Figure 41 shows the change in the x
direction. From the figure 40 we can see, in the central part of the liquid lens, we got the max value
of the oscillation amplitude of the air bubbles, which is caused by acoustic liquid lens focusing
sound field. At the position where bubble got maximum oscillate amplitude, the sound field is the
strongest. So, the figure 41 description the acoustic liquid lens focusing effect.
So, I tested the liquid lens at the center of the focus line. By changing the input voltage, I
test vibration of air bubbles, which can be seen from the figure 41, From the figure 42, by compare
the bubble oscillation amplitude with/without liquid lens, we can see that the amplitude of the

54
bubble has been significantly improved, so we can get the conclusion that by using the liquid lens,
we can focus the sound field, which can be used for improve the sound transmit efficiency
Figure 39. Top/side view of liquid lens
Figure 40. Experiment testing platform set up

55
Figure 41. Experiment result for Amplitude on vertical plane at the focal point
Figure 42. Experiment result for Amplitude on horizontal plane at the focal point

56
Figure 43. Experiment result for with/without liquid lens

57
3.0 FUTURE WORK
(1) Gas within the tube material selection Because this kind of micro-swimmer move forward based on bubble-vibration. Eventually we
hope that it can be applied to the human or animal body. In my experiments, I found out that the
position of the bubble will vary in different situations, even the gas can overflow tube. Such a
situation would occur in vivo biological impact. If the air inside the tube overflow within the blood
vessel or tissue, and gas in the tube will adversely affect the living body. So, I want to test different
types of gas, charged into the tube, dissolves in the blood, and test the affect to blood environment.
I can also test different properties of the gas, the impact of the tube propulsion.
Here I plan to charge CO2, oxygen in tube, these kind of gas can be taken away by blood
or absorbed into the blood, reducing the impact on the biological environment. Jian Feng has been
carried out using different materials made micro-swimmer, testing decomposition time in the blood.
My plan is: find out experimental material can be absorbed or discharged by an organism, instead
of being dissolved.
(2) Control the position of the bubble
Through the experiment in this thesis we can know. By changing the position of the bubble, I can
make changes in the flow field around the tube. Apart from by applying the external sound field
to vibrate bubble. By reading literature [92], We can guess, by changing the temperature and

58
light around the bubbles, we can control the growth of the bubble. For instance: using a laser
directly irradiated on the tube containing bubble. To control the position of the bubble in the
tube.
(3) Simulation Calculation of Flow Field around Bubble
In this thesis, I describe micro-swimmer have different movement phenomenon when bubbles in
different positions, I also give the explanations of this phenomenon which were summarized from
the experiment results. However, I did not give physical explanations on this phenomenon, I do
not know what physical reason for this phenomenon, and I also can’t give the specific physical
parameters which will effect the direction of the micro-robot propulsion. Such as: the size/shape
of the micro-robot, fluid velocity generated by bubble oscillation in micro-robots. I hope by using
ANSYS calculations, I can describe the impact of the different positions of air bubble interface to
the micro-swimmer propel direction. What’s more, by computer simulation, I can know the
streamline of the micro-fluid.
(4) Further Verification for Acoustic Lens
From the existing formula and we know that if we want to focus the light, the light wavelength is
very important. From the existing formula I mentioned above, I just verified the sound waves
transmit through different media, there will be refracted and focused. However, I did not verify
the relationship between the vibration frequency and the lens curvature. So I can not fully
determine, at acoustic frequencies of 3kHz (I use in the experiments), micro-swimmer movement
is enhanced because of sound focusing. Other reasons, such as: With the addition of the lens, the
acoustic transfer way changes, leading to the same result. In addition, the reproducibility of the
experimental results is very low, so it is necessary to do more experiments to further control the

59
experimental variables, in this way I can make sure the lens can focus on low frequency sound
waves.
60
REFERENCES
[1] J. V. Josepha, M. Aryab, and H. R. Patel, "Robotic surgery: the coming of a new era in surgical innovation," Expert Rev. Anticancer Ther, vol. 5, pp. 7-9, 2005.
[2] B. J. Nelson, I. K. Kaliakatsos, and J. J. Abbott, "Microrobots for Minimally Invasive
Medicine," Annu. Rev. Biomed. Eng, vol. 12, pp. 55-85, 2010. [3] P. Dario, M. C. Carrozza, A. Benvenuto, and A. Menciassi, "Menciassi A. 2000. Micro-
systems in biomedical applications," J. Micromech. Microeng, vol. 10(2), pp. 235–44, 2000.
[4] M. J. Mack, "Minimally invasive and robotic surgery," J. Am. Med. Assoc, vol. 285(5), pp.
568–572, 2001. [5] F. Tendick, S. S. Sastry, R. S. Fearing, and M. Cohn, "Applications of micromechatronics in
minimally invasive surgery," IEEE/ASME Trans. Mechatron, vol. 3(1), pp. 34–42, 1998. [6] G. Vince and C. Wilson, "The rise of the miniature medical robots," New Sci, vol. 204, pp.
50–53, 2009. [7] M. Sitti, "Voyage of the microbots," Nature, vol. 458, pp. 1121-1122, 2009. [8] L. Rubinstein, "A Practical Nanorobot for Treatment of Various Medical Problems," in In
Proceedings of the 8th Foresight Conference on Molecular Nanotechnology, Bethesda, MD, USA.
[9] G. Vince and C. Wilson, "The rise of the miniature medical robots," New Sci, vol. 204, pp.
50-53, 2009. [10] M. Sitti, "Voyage of the microbots," Nature, vol. 458, pp. 1121–1122, 2009.

61
[11] L. Rubinstein, "A Practical Nanorobot for Treatment of Various Medical Problems," in In Proceedings of the 8th Foresight Conference on Molecular Nanotechnology, Bethesda, MD, USA, 2000.
[12] G. Dogangil, O. Ergeneman, J. J. Abbott, S. Pane, H. Hall, S. Muntwyler, et al.,
"Towardtargetedretinaldrugdelivery with wireless magnetic microrobots," in Proc. IEEE/RSJ Int. Conf. Intell. Robots Syst, Nice, Fr, 2008, pp. 1921–1926.
[13] M. Sendoh, K. Ishiyama, K. I. Arai, M. Jojo, F. Sato, and H. Matsuki,
"Fabricationofmagneticmicromachine for local hyperthermia," IEEE Trans. Magn, vol. 38, pp. 3359–3361, 2002.
[14] F. Sato, M. Jojo, H. Matsuki, T. Sato, M. Sendoh, K. Ishiyama, et al., "The operation of a
magnetic micromachine for hyperthermia and its exothermic characteristic," IEEE Trans. Magn, vol. 38, pp. 3362-3364, 2002.
[15] S. Byun, J.-M. Lim, S.-J. Paik, A. Lee, K.-i. Koo, S. Park, et al., "Barbed micro-spikes for
micro-scale biopsy," J.Micromech. Microeng, vol. 15, pp. 1279–1284, 2005. [16] A. C. Jones, B. Milthorpe, H. Averdunk, A. Limaye, T. J. Senden, A. Sakellariou, et al.,
"Analysis of 3D bone ingrowth into polymer scaffolds via micro-computed tomography imaging," Biomaterials, vol. 25, pp. 4947–4954, 2004.
[17] J. Feng and S. K. Cho, "Mini and Micro Propulsion for Medical Swimmers,"
Micromachines, vol. 5, pp. 97-113, 2014. [18] E. M. Purcell, "Life at Low Reynolds Number," Am. J. Phys, vol. 45, pp. 3-11, 1977. [19] J. Happel and H. Brenner, Low Reynolds Number Hydrodynamics. New York: Martinus
Nijhoff Publishers, 1983. [20] S. Kim and S. J.Karrila, Microhydrodynamics: Principles and Selected Applications.
Mineola, New York: Dover Publications, 2005. [21] L. G. Leal, Advanced Transport Phenomena: Fluid Mechanics and Convective Transport
Processes, 2010. [22] J. Hinch, Hydrodynamics at Low Reynolds Numbers: A Brief and Elementary Introduction:
Springer Netherlands, 1988. [23] P. C, Theoretical and Computational Fluid Dynamics: Oxford: Oxford University Press,
2000.

62
[24] S. Vogel, Comparative Biomechanics: Life’s Physical World Princeton, NJ: Princeton University Press, 2003.
[25] R. Dudley, TheBiomechanicsofInsectFlight: Form, Function, Evolution. Princeton, NJ:
Princeton University Press, 2002. [26] D. E. Alexander, Nature’s Flyers: Birds, Insects, and the Biomechanics of Flight Baltimore,
MD: The Johns Hopkins University Press, 2002. [27] S. Vogel, Life in Moving Fluids, Second edition ed. Princeton,NJ: Princeton University
Press, 1996. [28] C. Ellington, The Aerodynamics of Hovering Insect Flight vol. 305. London: The Royal
Society, 1984. [29] S. Childress, Mechanics of Swimming and Flying. Cambridge: Cambridge University
Press, 1981. [30] R. J. Dijkink, J. P. v. d. Dennen, C. D. Ohl, and A. Prosperetti, "The ‘acoustic scallop’: a
bubble-poweredactuator," J. Micromech. Microeng, vol. 16, pp. 1653–1659, 2006. [31] J. Feng and S. K. Cho, "Micro Propulsion in Liquid by Oscillating Bubbles," in IEEE 26th
International Conference on Micro Electro Mechanical System, Taipei, Taiwan, January 2013, pp. 63–66.
[32] J. E. Avron and O. Raz, "Ageometrictheoryofswimming: Purcell’s swimmer and its
symmetrized cousin," New J. Phys, vol. 10, 2008. [33] D. Tam and A. E. Hosoi, Phys. Rev. Lett, vol. 98, 2007. [34] A. Najafi and R. Golestanian, "Simple swimmer at low Reynolds number: Three linked
spheres," Phys.Rev.E, vol. 69, 2004. [35] R. Dreyfus, J. Baudry, and H. A. Stone, "Purcell’s “rotator”: mechanical rotation at low
Reynolds number," Eur. Phys. J. B, vol. 47, pp. 161–164, 2005. [36] A. Najafi and R. Golestanian, "Propulsion at low Reynolds number," J. Phys.: Condens.
Matter, vol. 17, pp. 203-208, 2005. [37] R. Golestanian and A. Ajdari, "Analytic results for the three-sphere swimmer at low
Reynolds number," Phys. Rev. E vol. 77, 2008. [38] R. Golestanian, "Three spherelow Reynolds number swimmer with a cargo container,"
Eur. Phys. J. E, vol. 25, pp. 1-4, 2008.
63
[39] J. E. Avron and K. K. O, "Pushmepullyou: an efficient micro-swimmer " New J. Phys, vol. 7, p. 234, 2005.
[40] E. Lauga and T. R. Powers, "The hydrodynamics of swimming microorganisms," Rep.
Prog. Phys, vol. 72, 2009. [41] T. Honda, K. I. Arai, and K. Ishiyama, "Micro swimming mechanisms propelled by
external magnetic fields," IEEE Trans. Magn, vol. 9, pp. 5085–5087, 1996. [42] A. Ghosh and P. Fischer, "Controlled propulsion of artificial magnetic nanostructured
propellers," Nano Lett, vol. 9, 2009. [43] L. Zhang, J. J. Abbott, L. Dong, B. E. Kratochvil, D. Bell, and B. J. Nelson, "Artificial
bacterial flagella: fabrication and magnetic control," Appl. Phys. Lett, vol. 94, 2009. [44] B. Behkam and M. Sitti, "Design methodology for biomimetic propulsion of miniature
swimming robots," ASME J. Dyn. Syst. Meas. Control, vol. 128, pp. 36–43, 2006. [45] G. Kósa, P. Jakab, F. Jólesz, and N. Hata, "Swimming capsule endoscope using static and
RF magnetic field of MRI for propulsion," in Proc. IEEE Int. Conf. Robot. Autom., Pasadena, Calif., 2008, pp. 2922–2927.
[46] J. R. Howse, R. A. L. Jones, A. J. Ryan, T. Gough, R. Vafabakhsh, and R. Golestanian, "Self-
motile colloidal particles: From directed propulsion to random walk," Phys. Rev. Lett, vol. 99, 2007.
[47] J. G. Gibbs and Y.-P. Zhao, "Autonomously motile catalytic nanomotors by bubble
propulsion," Appl. Phys. Lett, vol. 94, 2009. [48] J. Vicario, R. Eelkema, W. R. Browne, A. Meetsma, R. M. L. Crois, and B. L. Feringa,
"Fuelling autonomous movement by a surface bound synthetic manganese catalase," Chem. Commun, pp. 3936–3938, 2005.
[49] A. A. Solovev, Y. Mei, E. B. Urena, G. Huang, and O. G. Schmidt, "Catalytic microtubular
jet engines self-propelled by accumulated gas bubbles," Small vol. 5, pp. 1688–1692, 2009.
[50] W. Gao, A. Uygun, and J. Wang, "Hydrogen-bubble-propelled zinc-based microrockets in
strongly acidic media," J. Am. Chem. Soc, vol. 134, pp. 897–900, 2012. [51] P. Hanggi and F. Marchesoni, "Artificial Brownian motors: Controlling transport on the
nanoscale," Rev. Mod. Phys, vol. 81, pp. 387-442, 2009.

64
[52] I. Buttinoni, G. Volpe, F. Kummel, G. Volpe, and C. Bechinger, "Active Brownian motion tunable by light," J. Phys. Condens. Matter, vol. 24, 2012.
[53] R. Golestanian, T. B. Liverpool, and A. Ajdari, "Designing phoretic micro- and nano-
swimmers," New J. Phys, vol. 9, p. 126, 2007. [54] H.-R. Jiang, N. Yoshinaga, and M. Sano, "Active motion of a Janus particle by self-
thermophoresis in a defocused laser beam," Phys. Rev. Lett, 2010. [55] D. D.Joseph, "Instability of the flow of two immiscible liquids with different viscosities in
pipe," J. Fluid Mech, vol. 141, pp. 309-317, 1984. [56] C.-M. Ho and Y.-C. Tai, "Micro-Eelectro-Mechanical-Systems (MEMS) and Fluid Flows,"
Annu. Rev. Fluid Mech, pp. 579–612, 1998. [57] Y. Renardy, "Instabilities in Steady Flows of Two Fluids," J. of Math, vol. 8, pp. 455-477,
1988. [58] H. C. Brinkman, "A Calculation of the Viscous Force Exerted by a Flowing Fluid on a
Dense Swaem of Particles," Appl. Sci. Res, vol. A1, pp. 27-34, 1947. [59] M. Minnaer, "On musical air bubbles and sound of running water," Philosophical
Magazine, vol. 16, pp. 235-248, 1993. [60] H. N. Oguz and A. Prosperetti, "The natural frequency of oscillation of gas bubbles in
tubes," J. Acoust. Soc. Am., vol. 103, pp. 3301-3308. [61] H. Levine and J. Schwinger, "On the Radiation of Sound from an Unfianged Circular
Pipe," Physical Review, vol. 73, pp. 383-406, 1948. [62] J. Feng, J. Yuan, and S. K. Cho, "Micropropulsion by an acoustic bubble for navigating
microfluidic spaces," Lab Chip, vol. 15, pp. 1554-1562, 2015. [63] Cutnell, John, Johnson, and Kenneth, Physics, Fourth Edition ed., 1998. [64] Benson and Katherine, MCAT Review: Emory University, 1999. [65] E. Margolis, J.Gurevitch, and E. Hasson, Blood: Funk and Wagnalls Encyclopedia., 1985. [66] Hinghofer-Szalkay, H.G., Greenleaf, and J.E., "Continuous monitoring of blood volume
changes in humans," Journal of Applied Physiology, vol. 63, pp. 1003-1007, 1987.

65
[67] N. Ageyama, "Specific Gravity of Whole Blood in Cynomolgus Monkeys, Squirrel Monkeys, and Tamarins," Contemporary Topics in Laboratory Animal Science, vol. 40, 2001.
[68] H. RE and C. YI, Advancing Medicine with Food and Nutrients, Second Edition ed.: CRC
Press, 2012. [69] G. Elert, Viscosity. The Physics Hypertextbook. [70] P. Marmottant and S. Hilgenfeldt, "Controlled vesicle deformation and lysis by single
oscillating bubbles," Nature, vol. 423, pp. 153-156, 2003. [71] C. J, M. R, L. P, T. P, O. A, P.-D. K, et al., "Cavitation microstreaming and stress fields
created by microbubbles," j.ultras, vol. 50(2), pp. 273-279, 2010. [72] J. Collis, R. Manasseh, P. Liovic, P. Tho, A. Ooi, K. Petkovic-Duran, et al., "Cavitation
microstreaming and material transport around microbubbles," J. phpro, vol. 3, pp. 427–432, 2010.
[73] R. H. Liu, R. Lenigk, R. L. Druyor-Sanchez, J. Yang, and P. Grodzinski†, "Hybridization
Enhancement Using Cavitation Microstreaming," Anal. Chem, vol. 75, pp. 1911-1917, 2003.
[74] S. A. Elder, "Cavitation Microstreaming," Acoust. Soc. Am, vol. 29, pp. 54-64, 1958. [75] mashephe1. (2011). Acoustic Lenses. Available:
https://www.youtube.com/watch?v=KnjzJkBboc4 [76] H. Ren, D. Fox, P. A. Anderson, B. Wu, and S.-T. Wu, "Tunable-focus liquid lens
controlled using a servo motor," Opt. Express, vol. 14, pp. 8031-8036, 2006. [77] H. Ren and S.-T. Wu, "Variable-focus liquid lens " Opt. Express, vol. 15, pp. 5931-5936,
2007. [78] S. W. Lee and S. S. Lee, "Focal tunable liquid lens integrated with an electromagnetic
actuator," Appl. Phys. Lett. 9, vol. 90, pp. 121129 1-3, 2007. [79] C.-C. Cheng and J. A. Yeh, "Dielectrically actuated liquid lens " Opt. Express, vol. 15, pp.
7140-7145, 2007. [80] H. Oku and M. Ishikawa, "High-speed liquid lens with 2 ms response and 80.3 nm root-
mean-square wavefront error," Appl. Phys. Lett., vol. 94, p. 221108, 2009.

66
[81] S. Kuiper and B. H. W. Hendriks, "Variable-focus liquid lens for miniature cameras," Appl. Phys. Lett., vol. 85, pp. 1128-1130, 2004.
[82] M. Vallet and B. Berge, "Electrowetting of water and aqueous solutions on poly(ethylene
terephthalate) insulating films," Polymer Vol., vol. 37, pp. 2465-2470, 1996. [83] T. Krupenkin, S. Yang, and P. Mach, "Tunable liquid microlens," Appl. Phys. Lett., vol. 82,
pp. 316-318, 2003. [84] J. Chen, W. Wang, J. Fang, and K. Varahramyan, "Variable-focusing microlens with
microfluidic chip," J. Micromech. Microeng., vol. 14, pp. 675–680, 2004. [85] K.-H. Jeong, G. L. Liu, N. Chronis, and L. P. Lee, "Tunable microdoublet lens array " Opt.
Express, vol. 12, pp. 2494-2500, 2004. [86] D.-Y. Zhang, V. Lien, Y. Berdichevsky, J. Choi, and Y.-H. Lo, "Fluidic adaptive lens with
high focal length tunability," Appl. Phys. Lett., vol. 82, pp. 3171-3172, 2003. [87] G. Beadie, M. L. Sandrock, M. J. Wiggins, R. S. Lepkowicz, J. S. Shirk, M. Ponting, et al.,
"Tunable polymer lens," Opt. Express, vol. 16, pp. 11847-11857, 2008. [88] N.-S. Cheng, "Formula for Viscosity of Glycerol-Water Mixture " Ind. Eng. Chem. Res, vol.
47, pp. 3285-3288, 2008. [89] . Viscosity. Available: http://www.met.reading.ac.uk/~sws04cdw/viscosity_calc.html [90] . Available: https://en.wikipedia.org/wiki/Blood_plasma [91] (2004). Density of Blood. Available:
http://hypertextbook.com/facts/2004/MichaelShmukler.shtml [92] D. Ahmed, M. Lu, A. Nourhani, P. E. Lammert, Z. Stratton, H. S. Muddana, et al.,
"Selectively manipulable acoustic-powered microswimmers," Sci. Rep., vol. 5, 2015.