Embed Size (px)
Citation preview
Acoustic Measurements of Pan and Concert FlutesPHYS 406 Final Report
Kira Bonk
Abstract
Measurements of the acoustical properties of an Antara pan flute and Western concert flute were
taken and compared. For each flute, notes were recorded and the sound output was run through a
wave analysis program. The program produced many plots, including information on the
amplitudes of the harmonics. It was found that in some cases the pan flute was truer to the actual
frequency of a note than the concert flute, while each flute became more out of tune as the notes
increased in frequency. In addition, further data was collected about the input impedances of the
concert flute by using pressure and particle velocity microphones, as well as a piezoelectric
transducer attached to the cork in the head joint, to find resonances. It was found that the results
of the wave analysis were closer to the actual frequencies than the resonance experiment, which
may be due to the use of two different head joints.
I. IntroductionFlutes are woodwind instruments that have been played for thousands of years. Figure 1 shows a
South American Antara pan flute. Thirteen bamboo pipes of various lengths are tied together in a
row; the length corresponds to a frequency. The pipes are closed on the bottom end and open on
the top end. To make sound, a stream of air is blown over the top of the pipe similar to how
sound is made by blowing air across bottles.
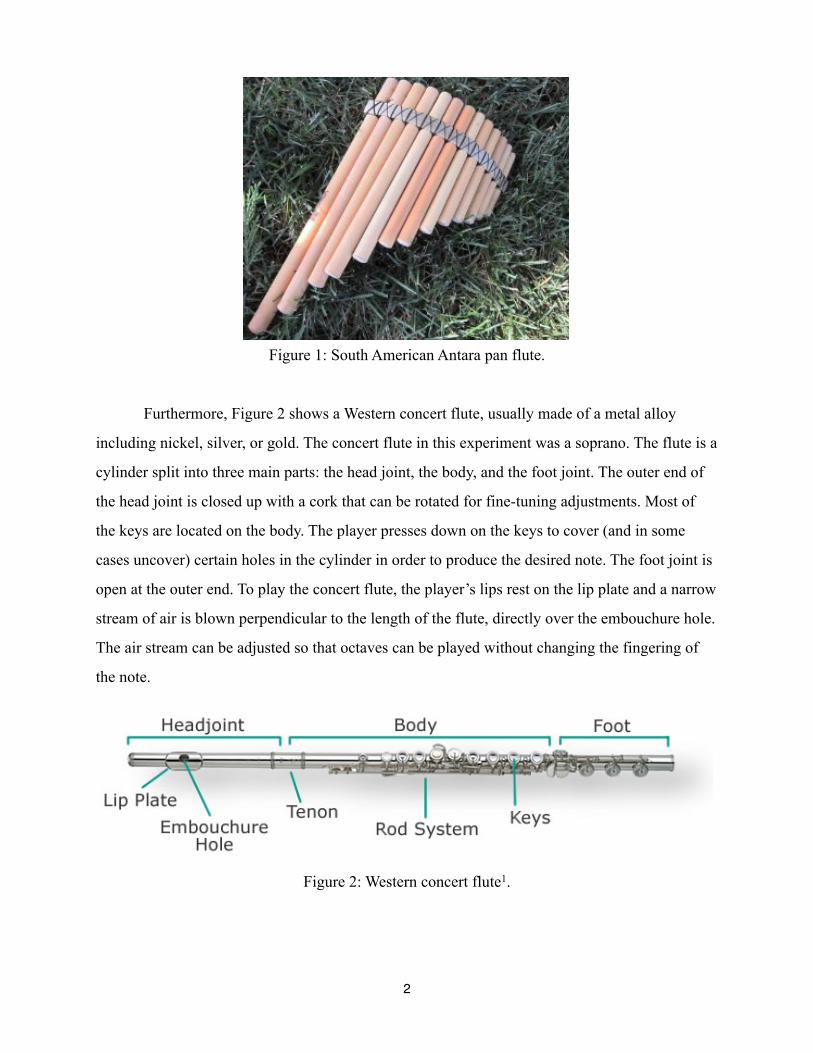
Figure 1: South American Antara pan flute.
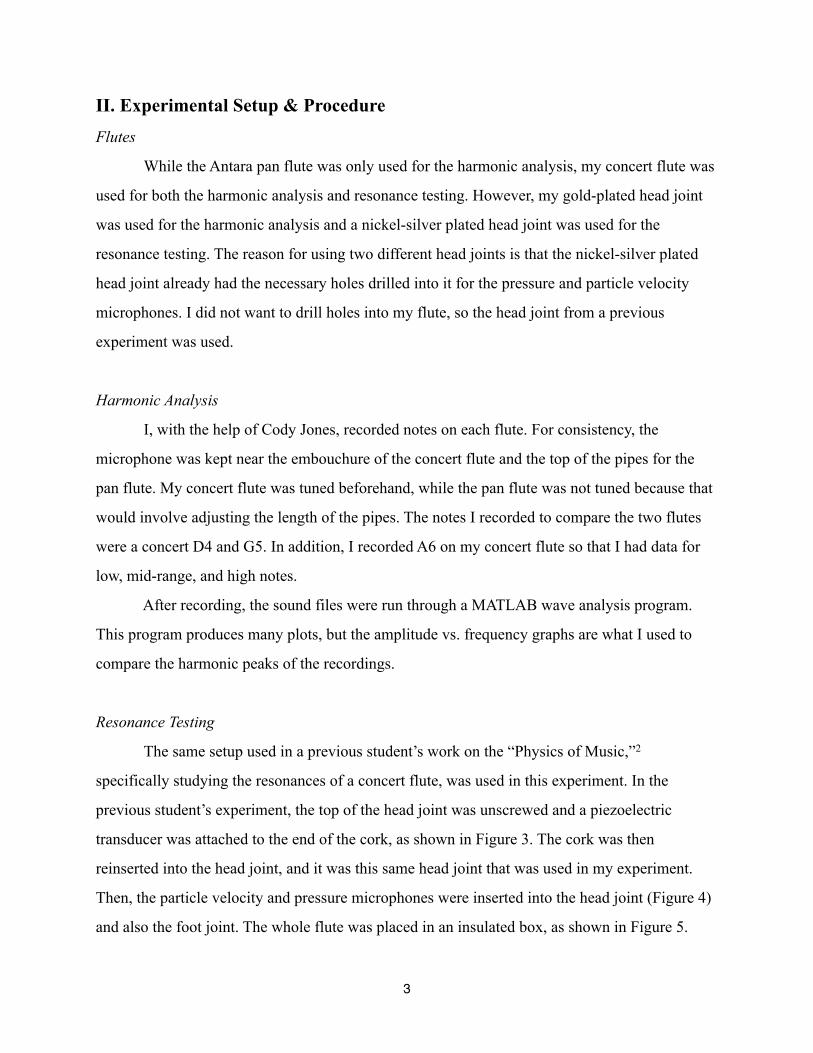
Furthermore, Figure 2 shows a Western concert flute, usually made of a metal alloy
including nickel, silver, or gold. The concert flute in this experiment was a soprano. The flute is a
cylinder split into three main parts: the head joint, the body, and the foot joint. The outer end of
the head joint is closed up with a cork that can be rotated for fine-tuning adjustments. Most of
the keys are located on the body. The player presses down on the keys to cover (and in some
cases uncover) certain holes in the cylinder in order to produce the desired note. The foot joint is
open at the outer end. To play the concert flute, the player’s lips rest on the lip plate and a narrow
stream of air is blown perpendicular to the length of the flute, directly over the embouchure hole.
The air stream can be adjusted so that octaves can be played without changing the fingering of
the note.
Figure 2: Western concert flute1.
2
II. Experimental Setup & Procedure Flutes
While the Antara pan flute was only used for the harmonic analysis, my concert flute was
used for both the harmonic analysis and resonance testing. However, my gold-plated head joint
was used for the harmonic analysis and a nickel-silver plated head joint was used for the
resonance testing. The reason for using two different head joints is that the nickel-silver plated
head joint already had the necessary holes drilled into it for the pressure and particle velocity
microphones. I did not want to drill holes into my flute, so the head joint from a previous
experiment was used.
Harmonic Analysis
I, with the help of Cody Jones, recorded notes on each flute. For consistency, the
microphone was kept near the embouchure of the concert flute and the top of the pipes for the
pan flute. My concert flute was tuned beforehand, while the pan flute was not tuned because that
would involve adjusting the length of the pipes. The notes I recorded to compare the two flutes
were a concert D4 and G5. In addition, I recorded A6 on my concert flute so that I had data for
low, mid-range, and high notes.
After recording, the sound files were run through a MATLAB wave analysis program.
This program produces many plots, but the amplitude vs. frequency graphs are what I used to
compare the harmonic peaks of the recordings.
Resonance Testing
The same setup used in a previous student’s work on the “Physics of Music,”2
specifically studying the resonances of a concert flute, was used in this experiment. In the
previous student’s experiment, the top of the head joint was unscrewed and a piezoelectric
transducer was attached to the end of the cork, as shown in Figure 3. The cork was then
reinserted into the head joint, and it was this same head joint that was used in my experiment.
Then, the particle velocity and pressure microphones were inserted into the head joint (Figure 4)
and also the foot joint. The whole flute was placed in an insulated box, as shown in Figure 5.
3
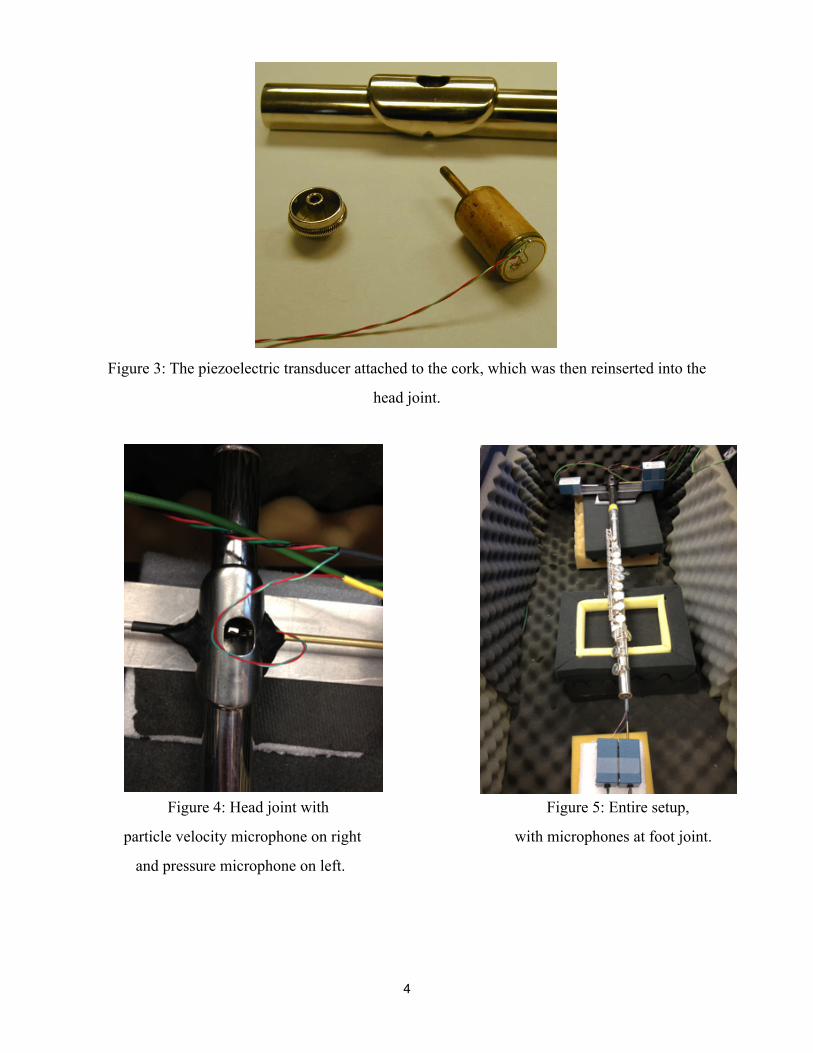
Figure 3: The piezoelectric transducer attached to the cork, which was then reinserted into the
head joint.
Figure 4: Head joint with Figure 5: Entire setup,
particle velocity microphone on right with microphones at foot joint.
and pressure microphone on left.
4
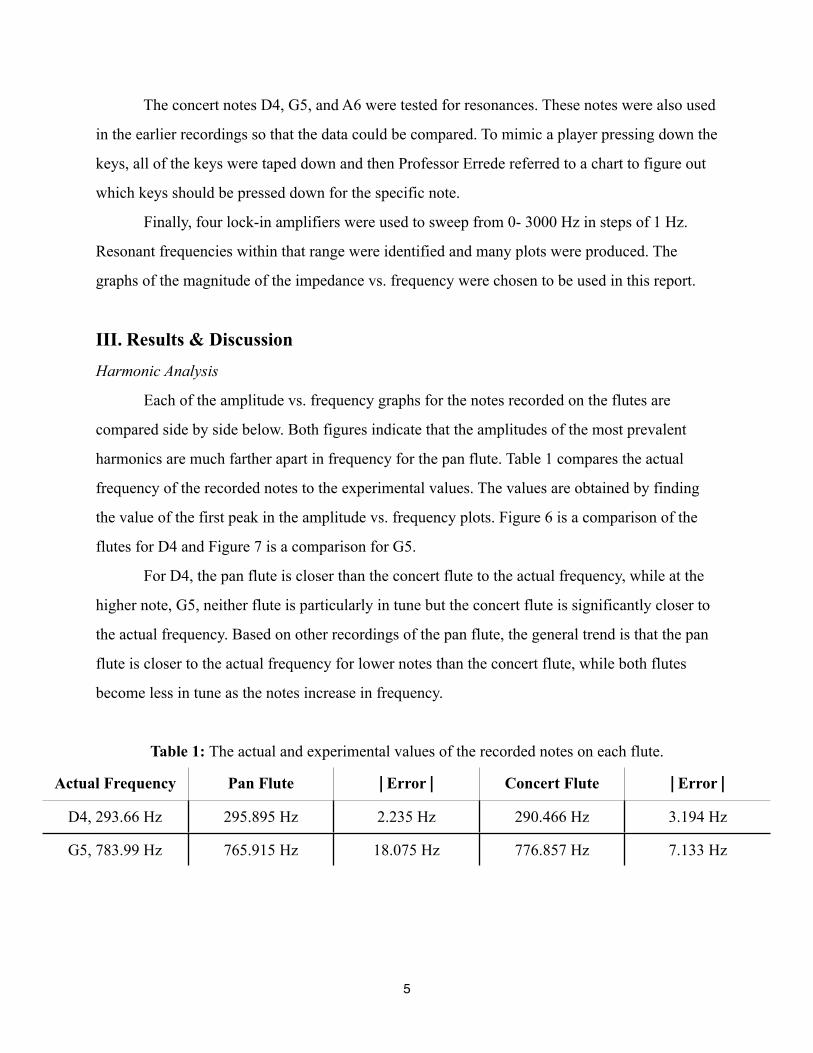
Actual Frequency Pan Flute ⎮Error⎮ Concert Flute ⎮Error⎮
D4, 293.66 Hz 295.895 Hz 2.235 Hz 290.466 Hz 3.194 Hz
G5, 783.99 Hz 765.915 Hz 18.075 Hz 776.857 Hz 7.133 Hz
The concert notes D4, G5, and A6 were tested for resonances. These notes were also used
in the earlier recordings so that the data could be compared. To mimic a player pressing down the
keys, all of the keys were taped down and then Professor Errede referred to a chart to figure out
which keys should be pressed down for the specific note.
Finally, four lock-in amplifiers were used to sweep from 0- 3000 Hz in steps of 1 Hz.
Resonant frequencies within that range were identified and many plots were produced. The
graphs of the magnitude of the impedance vs. frequency were chosen to be used in this report.
III. Results & Discussion Harmonic Analysis
Each of the amplitude vs. frequency graphs for the notes recorded on the flutes are
compared side by side below. Both figures indicate that the amplitudes of the most prevalent
harmonics are much farther apart in frequency for the pan flute. Table 1 compares the actual
frequency of the recorded notes to the experimental values. The values are obtained by finding
the value of the first peak in the amplitude vs. frequency plots. Figure 6 is a comparison of the
flutes for D4 and Figure 7 is a comparison for G5.
For D4, the pan flute is closer than the concert flute to the actual frequency, while at the
higher note, G5, neither flute is particularly in tune but the concert flute is significantly closer to
the actual frequency. Based on other recordings of the pan flute, the general trend is that the pan
flute is closer to the actual frequency for lower notes than the concert flute, while both flutes
become less in tune as the notes increase in frequency.
Table 1: The actual and experimental values of the recorded notes on each flute.
5
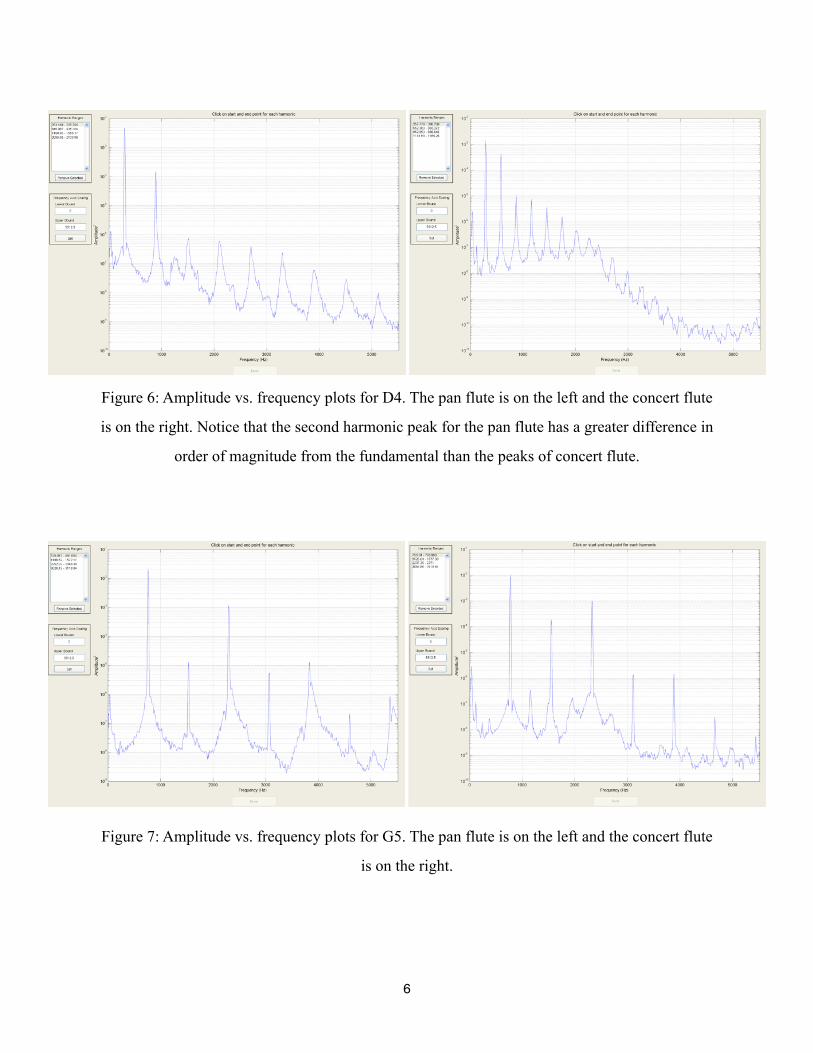
Figure 6: Amplitude vs. frequency plots for D4. The pan flute is on the left and the concert flute
is on the right. Notice that the second harmonic peak for the pan flute has a greater difference in
order of magnitude from the fundamental than the peaks of concert flute.
Figure 7: Amplitude vs. frequency plots for G5. The pan flute is on the left and the concert flute
is on the right.
6
Actual Frequency Harmonic Analysis ⎮Error⎮ Resonance Testing ⎮Error⎮
D4, 293.66 Hz 290.466 Hz 3.194 Hz 311.5 Hz 17.84 Hz
G5, 783.99 Hz 776.857 Hz 7.133 Hz 760.5 Hz 23.49 Hz
A6, 1760 Hz 1745.834 Hz 14.166 Hz 1867.5 Hz 107.5 Hz
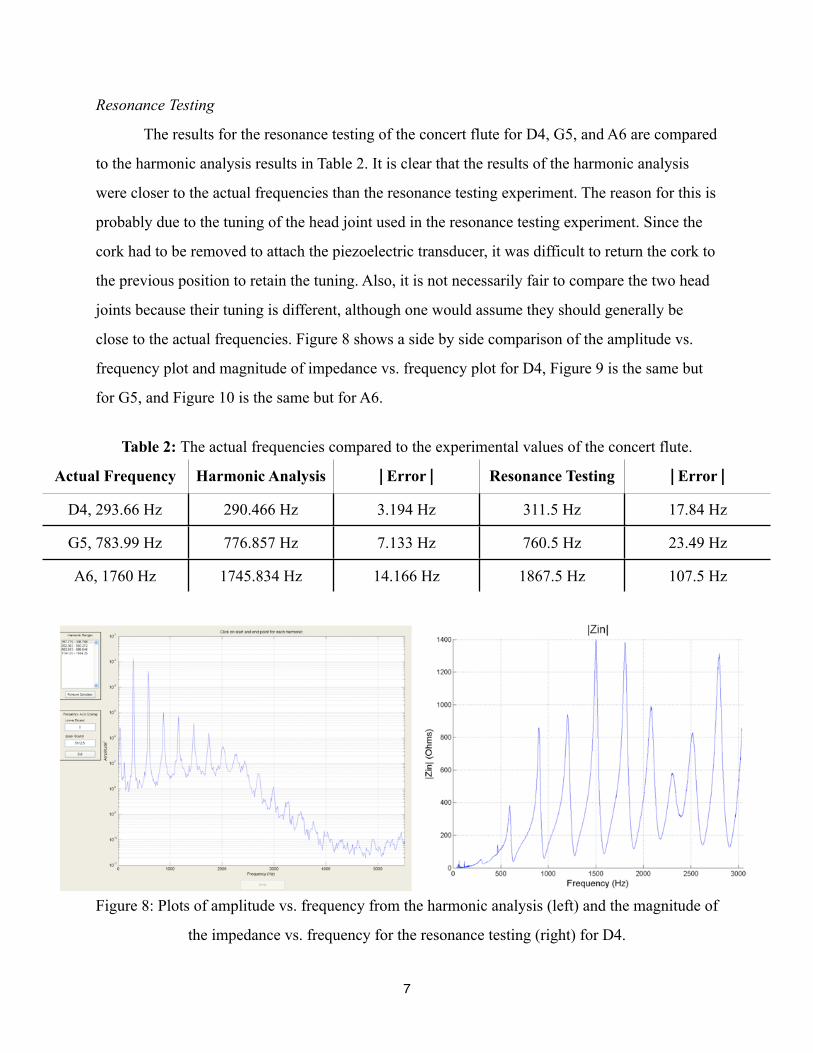
Resonance Testing
The results for the resonance testing of the concert flute for D4, G5, and A6 are compared
to the harmonic analysis results in Table 2. It is clear that the results of the harmonic analysis
were closer to the actual frequencies than the resonance testing experiment. The reason for this is
probably due to the tuning of the head joint used in the resonance testing experiment. Since the
cork had to be removed to attach the piezoelectric transducer, it was difficult to return the cork to
the previous position to retain the tuning. Also, it is not necessarily fair to compare the two head
joints because their tuning is different, although one would assume they should generally be
close to the actual frequencies. Figure 8 shows a side by side comparison of the amplitude vs.
frequency plot and magnitude of impedance vs. frequency plot for D4, Figure 9 is the same but
for G5, and Figure 10 is the same but for A6.
Table 2: The actual frequencies compared to the experimental values of the concert flute.
Figure 8: Plots of amplitude vs. frequency from the harmonic analysis (left) and the magnitude of
the impedance vs. frequency for the resonance testing (right) for D4.
7
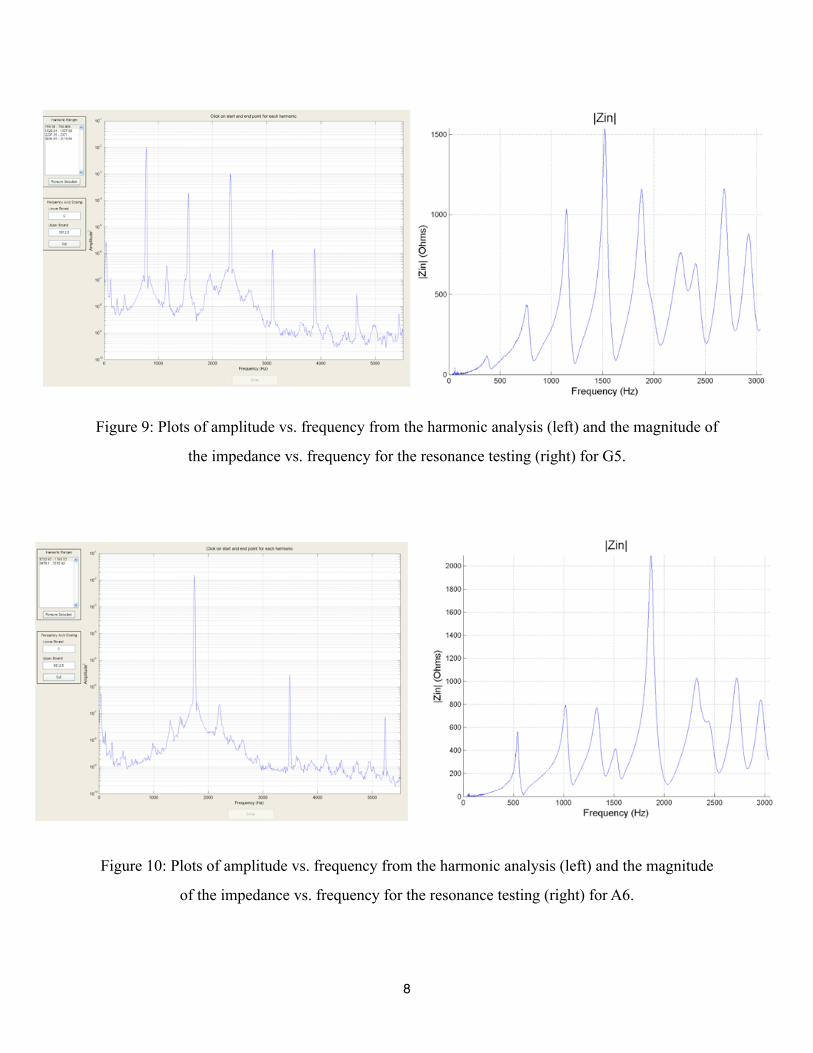
Figure 9: Plots of amplitude vs. frequency from the harmonic analysis (left) and the magnitude of
the impedance vs. frequency for the resonance testing (right) for G5.
Figure 10: Plots of amplitude vs. frequency from the harmonic analysis (left) and the magnitude
of the impedance vs. frequency for the resonance testing (right) for A6.
8
IV. ConclusionsHarmonic Analysis
Overall, the results from the harmonic analysis concluded that the Antara pan flute was
surprisingly in tune for the cheap price I purchased it for. I was not surprised that the results
indicated each flute becoming less in tune as the notes increased in frequency because, from my
decade of experience playing flute, that is a common occurrence. It was interesting to investigate
the physics behind the music I make from my flutes. The plots generated from the MATLAB
program were especially intriguing to me because having a visual of a sound I made on my flute
added depth to my understanding of music in general.
Resonance Testing
In summary, the resonance testing experiment was not as accurate as I had anticipated.
However, it was worth the effort because I gained hands-on experience setting up the experiment
and learning about piezoelectric transducers and microphones. In addition, I was reminded of the
importance of the cork in the head joint for fine-tuning. For future experiments, it might be
useful to record notes on that head joint and then running the resonance testing, being careful to
keep the cork in the same placement. That way, the harmonic analysis and the resonance testing
results could be more accurately compared.
V. Special Acknowledgment I would like to thank Professor Steve Errede for his tireless efforts to get the resonance
testing up and running. Each run of the experiment took many hours, and it was his willingness
to work on it in his own time, as well as his patience in teaching me how to use the MATLAB
program, that made this project possible.
9
VI. References 1<http://www.musicshowcaseonline.com/images/flute-diagram.jpg>2Granback, Nella. “Physics of Music” (unpublished)
<https://courses.physics.illinois.edu/phys406/Student_Projects/Spring11/
Nella_Granback/Nella_Granback_P498POM_Final_Report_Sp11.pdf>Formosa, Gregory. “Acoustic Harmonicity and Input Impedance for Various Bb Trumpet
Mutes” (unpublished)
<https://courses.physics.illinois.edu/phys406/Student_Projects/Spring10/
Greg_Formosa/G_Formosa_P498POM_Final_Report_Sp10.pdf> (referenced for format)
10