Embed Size (px)
Citation preview
Acoustic emission behaviour of dense sands
ALISTER SMITH� and NEIL DIXON†
Interpretation of acoustic emission (AE) generated by particulate materials has to date been qualitative.The objective of this study was to move the discipline towards quantitative interpretation of AE toenable early warning of serviceability and ultimate limit state failures in the field, and to enhance theinstrumentation of element and physical model tests in the laboratory. Results from a programme ofdrained triaxial tests on dense sands show that: AE generation is proportional to the imposed stresslevel, imposed strain rate, fabric coordination number and boundary work done; there are two types ofAE response at the transition from contractive to dilative behaviour, which was governed by the meanparticle size; and AE activity in particulate materials is negligible until the current stress conditions(compression and/or shear) exceed the maximum that has been experienced in the past. Relationshipshave been quantified between AE and boundary work (i.e. AE generated per Joule) for a unit volume ofsand under isotropic compression and shear, and between AE and shear strain rate. An exampleinterpretation framework demonstrates how AE measurements could be used to identify the transitionfrom contractive to dilative behaviour, mobilisation of peak shear strength and quantify acceleratingdeformation behaviour that typically accompanies shear zone development.
KEYWORDS: consolidation; deformation; geophysics; laboratory tests; monitoring; sands
INTRODUCTIONGranular soils mobilise shearing resistance through inter-particle friction and interlocking (i.e. dilation, particlerearrangement and particle damage) (Sadrekarimi &Olson, 2011). Stresses applied to the boundary of a soilbody are transmitted to the soil skeleton and cause normaland tangential forces to develop at particle contacts (Cundall& Strack, 1979; Senetakis et al., 2013). The orientation anddistribution of particle contacts is typically referred to as the‘fabric’, while the term ‘state’ is used to describe the soil’scurrent physical condition and includes void ratio, stressesand fabric (Been & Jefferies, 1985; Been et al., 1991). Thedistribution and evolution of inter-particle forces at particlecontacts strongly controls the mechanical behaviour ofparticulate systems (Wan & Guo, 2004).Mobilisation of peak shear strength in dense sands
typically causes shear strains to localise into concentratedshear zones with inclined column-like chains of particles andlarge void ratios (Hasan & Alshibli, 2010). Shear strengthreduces in this post-bifurcation regime, as the sandapproaches the critical state, and accelerating deformationbehaviour typically ensues as the soil mass is weaker underthe same imposed boundary stresses; this ultimate limit statecan have devastating consequences for people andinfrastructure.Proportions of the energy dissipated during deformation
of particulate materials are converted to heat and sound. Thehigh-frequency (.10 kHz) component of this sound energy
is called acoustic emission (AE). AE monitoring offers thepotential to sense particle-scale interactions that lead tomacro-scale responses of granular materials. AE is widelyused in many industries for non-destructive testing andevaluation of materials and systems; however, it is seldomused in geotechnical engineering, despite evidence of thebenefits, because AE generated by particulate materials ishighly complex and difficult to measure and interpret.AE is generated in particulate materials through a suite of
mechanisms: particle–particle interactions such as slidingand rolling friction; particle contact network rearrangement(e.g. release of contact stress and stress redistribution asinterlock is overcome and regained); degradation at particleasperities; and crushing (Michlmayr & Or, 2014; Smith et al.,2014).Fundamental laboratory studies on the AE behaviour of
soils carried out in the 1970s, 1980s and 1990s (e.g. Koerneret al., 1976, 1978, 1981, 1984; Tanimoto & Nakamura, 1981;Mitchell & Romeril, 1984; Tanimoto & Tanaka, 1986; Garga& Chichibu, 1990; Shiotani & Ohtsu, 1999) led to thefollowing qualitative conclusions: well-graded soils generatemore AE than uniformly graded soils; angular particlesgenerate more AE than rounded particles; AE amplitudeincreases with particle size; higher imposed stresses generategreater AE activity; AE activity increases with imposed strainrate; soils exhibit greatly increased AE activity when stresslevels exceed the pre-stress/pre-consolidation pressure due tothe Kaiser effect (Lavrov, 2003); and AE activity increaseswith strain when densely packed arrangements of grains aresheared until the transition from contractive to dilativebehaviour, whereupon the AE activity remains relativelyconstant. The research reported in this paper goes beyond thestate-of-the-art and quantifies the influence of these variablesupon AE generation for the first time.The focus of AE research in geotechnical engineering over
the past 60 years has been to quantify links betweenmeasured AE and soil strength and deformation behaviourto enable interpretation of the field performance of geotech-nical infrastructure assets. Recent advances have been madein the interpretation of soil/structure interaction behaviour
� School of Architecture, Building and Civil Engineering,Loughborough University, Leicestershire, UK(Orcid:0000-0003-3363-300X).† School of Architecture, Building and Civil Engineering,Loughborough University, Leicestershire, UK.
Manuscript received 23 August 2018; revised manuscript accepted4 January 2019. Published online ahead of print 5 February 2019.Discussion on this paper closes on 1May 2020, for further details seep. ii.Published with permission by the ICE under the CC-BY 4.0 license.(http://creativecommons.org/licenses/by/4.0/)
Smith, A. & Dixon, N. (2019). Géotechnique 69, No. 12, 1107–1122 [https://doi.org/10.1680/jgeot.18.P.209]
1107
Downloaded by [ LOUGHBOROUGH UNIVERSITY] on [04/12/19]. Published with permission by the ICE under the CC-BY license
from AE measurements using physical modelling and fieldexperiments. For slope monitoring applications, relationshipsbetween measured AE and slope deformation behaviour havebeen quantified, enabling early warning of accelerating slopemovements and failure (Smith et al., 2014, 2017; Smith &Dixon, 2015; Dixon et al., 2015a, 2015b, 2018; Michlmayret al., 2017; Berg et al., 2018). For pile monitoringapplications, relationships between measured AE and load–displacement behaviour are being developed (Mao et al.,2015, 2016, 2018a, 2018b).
Lin et al. (2018) recently observed that loose sandsgenerated more AE than dense sands in triaxial tests,which is possibly due to the greater distribution of shearstrains and hence particle dislocations within a bulging-typefailure. These results are important and interesting, but arebased on a limited number of tests and stress conditions (i.e.three tests at different relative densities and one effectiveconfining stress). Mao & Towhata (2015) found that particlecrushing has a much higher frequency content (.100 kHz)than inter-particle friction and particle rearrangement(,100 kHz). Ibraim et al. (2017) have investigated particlecrushing-generated AE in uniaxial compression tests. Inaddition, numerical simulations with fibre-bundle models arebeing used to investigate the AE behaviour of grain-scaleinteractions (Michlmayr et al., 2013; Michlmayr & Or, 2014).These studies demonstrate the benefits of AE monitoring,but do not provide methodologies to interpret and quantifysoil behaviour from AE measurements.
Interpretation of the AE generated by particulate materialshas to date been qualitative. The objective of this study was tomove the discipline towards quantitative interpretation of AEto enable early warning of serviceability and ultimate limitstate failures in the field, and to enhance the instrumentationof element and physical model tests in the laboratory. Aprogramme of drained triaxial isotropic compression andshearing tests was performed on dense sands to investigatethe influence of volume change behaviour, stress level, stresshistory, strain rate and work done by boundary stresses.
METHODOLOGYApparatusTriaxial tests enabled the systematic investigation of the
evolution of AE with the stress–strain response of densesands at a range of effective confining stresses and strain ratesunder drained conditions. The triaxial test remains the mostwidely used element test, in research and practice, forsimulating conditions on soil specimens. The authorsacknowledge that dense sands can remain dilatant at theend of a test and not reach the critical state (i.e. constantvolume) due to the limited magnitude of strain that can beimposed (Been et al., 1991; Sadrekarimi & Olson, 2011;López-Querol & Coop, 2012). However, the final dilationrate (δεvol/δεγ) measured at the end of the tests reported hereranged from 0 to 0·04 for the smallest and largest meanparticle sizes, respectively.A hydraulic GDS Instruments (Hook, UK) Bishop &
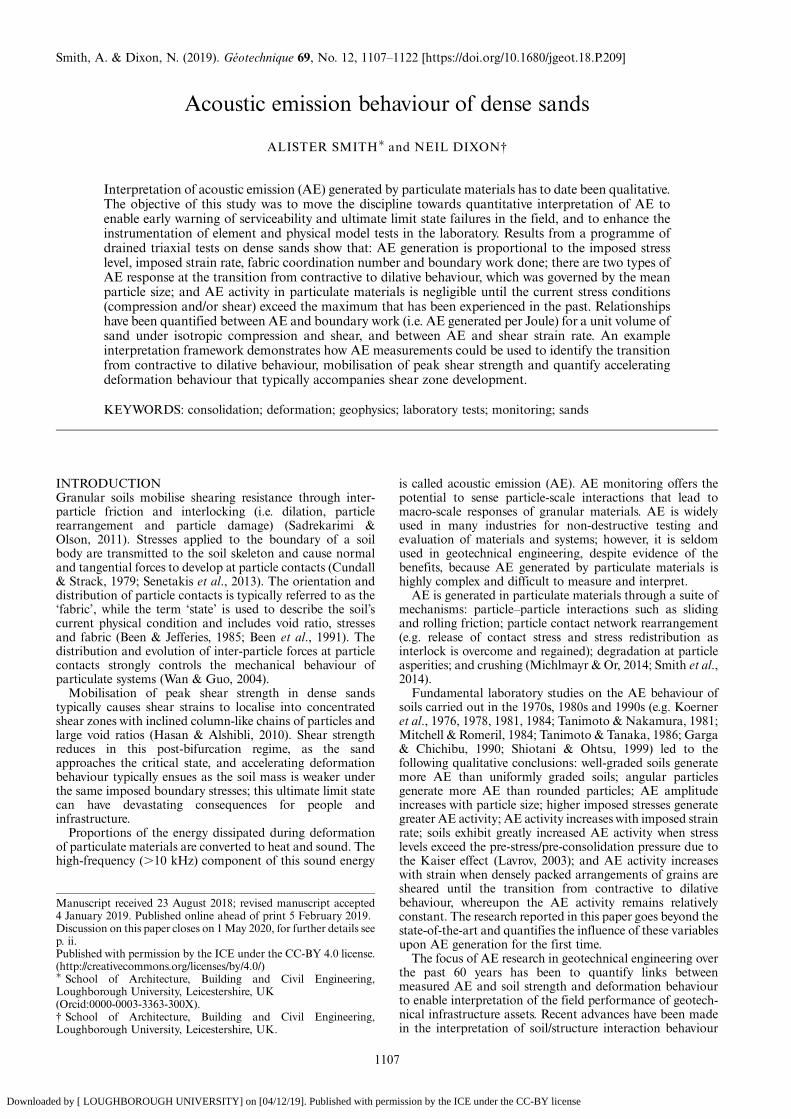
Wesley (1975) stress path triaxial apparatus was used toeliminate the noise that could be generated by motor-operated systems. A schematic diagram of the apparatus isshown in Fig. 1; the apparatus has a bespoke 50 mm dia.base pedestal incorporating both AE and pore-water pressuremeasurement.
SoilsQuartz Leighton Buzzard sand (LBS) was selected for this
investigation as its mechanical behaviour has been studiedextensively in the literature (e.g. Cavarretta et al., 2011;Senetakis et al., 2013) and batches of different size fractionscould be procured with consistent properties. Four uniformlygraded size fractions were selected to minimise the influenceof different fabrics and control, as far as is practicallypossible with a natural sand, mineralogy, shape, surfaceroughness and inter-particle friction. In addition, a fifthsand, ‘LBS combined’, was created by combining the fouruniformly graded fractions to investigate the influence of asignificant change to fabric and void ratio.
AE data acquisitionsystem
Back-pressurecontroller
Lower chamberpressure controller
Cell pressurecontroller
LVDT
Load cell
Pore-waterpressure sensor
AE sensor
Porousdiscs
Fig. 1. Schematic diagram of the GDS Instruments Bishop and Wesley stress path triaxial apparatus and modified base pedestal to incorporateboth AE and pore-water pressure measurement. LVDT, linear variable differential transformer
SMITH AND DIXON1108
Downloaded by [ LOUGHBOROUGH UNIVERSITY] on [04/12/19]. Published with permission by the ICE under the CC-BY license
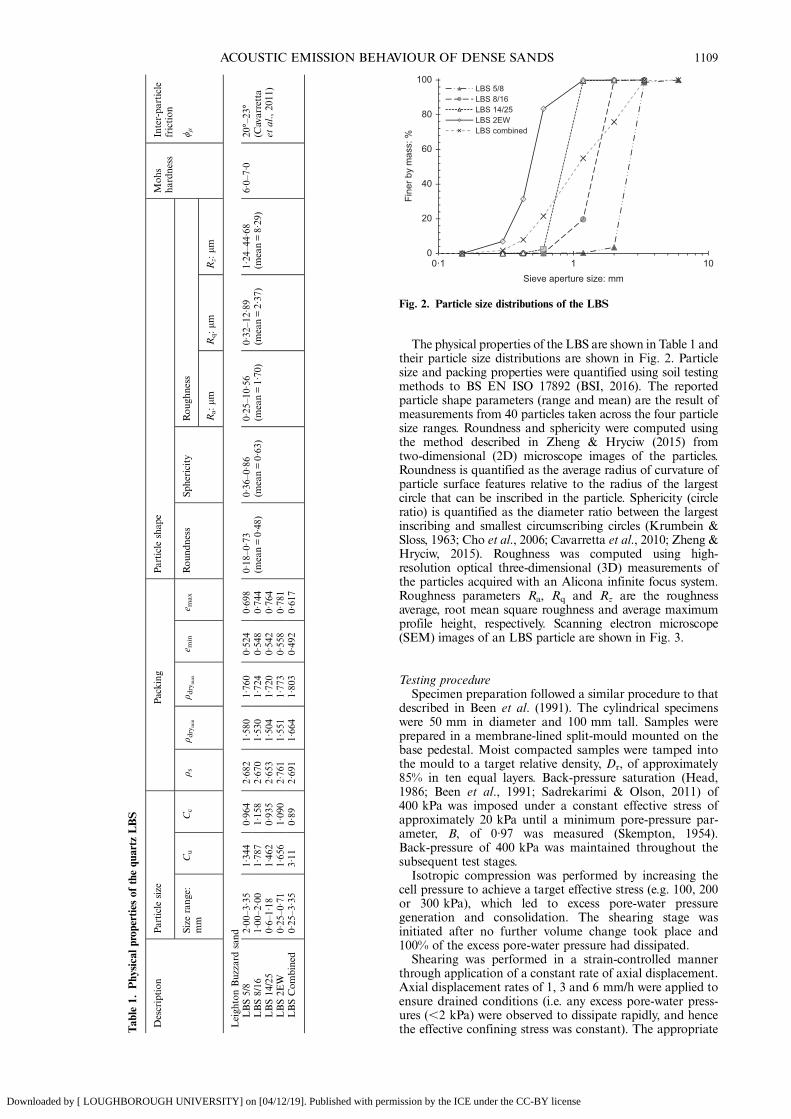
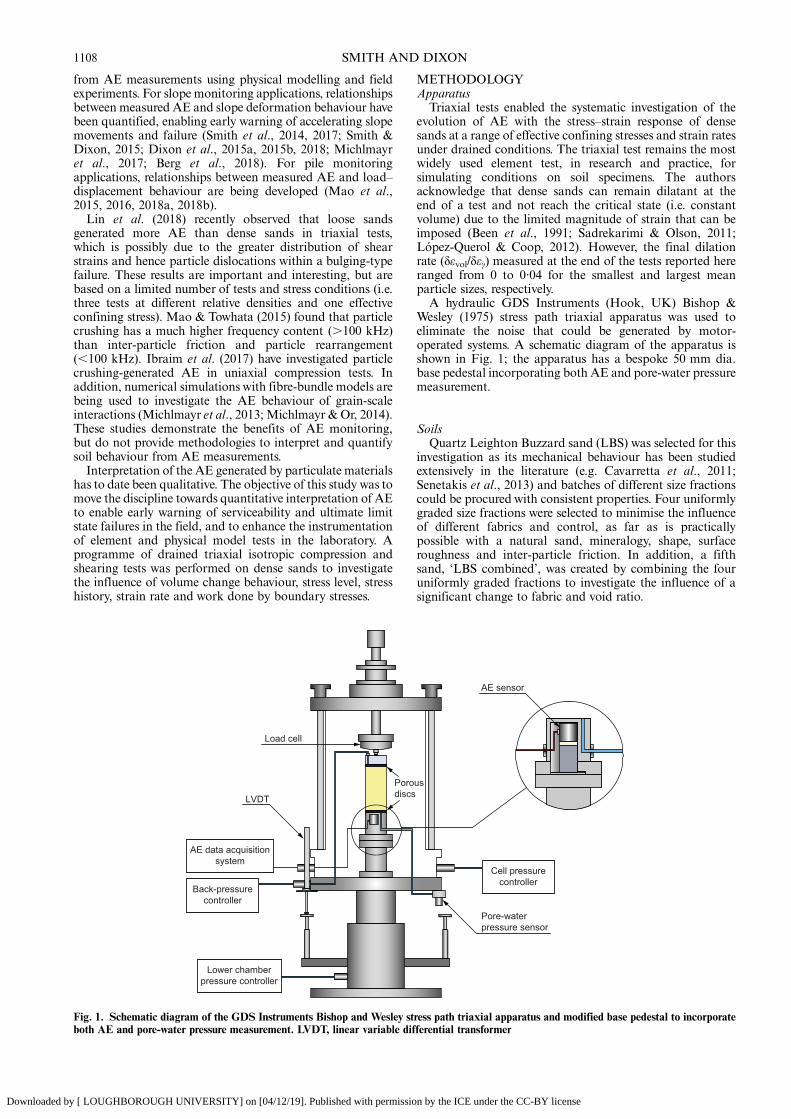
The physical properties of the LBS are shown in Table 1 andtheir particle size distributions are shown in Fig. 2. Particlesize and packing properties were quantified using soil testingmethods to BS EN ISO 17892 (BSI, 2016). The reportedparticle shape parameters (range and mean) are the result ofmeasurements from 40 particles taken across the four particlesize ranges. Roundness and sphericity were computed usingthe method described in Zheng & Hryciw (2015) fromtwo-dimensional (2D) microscope images of the particles.Roundness is quantified as the average radius of curvature ofparticle surface features relative to the radius of the largestcircle that can be inscribed in the particle. Sphericity (circleratio) is quantified as the diameter ratio between the largestinscribing and smallest circumscribing circles (Krumbein &Sloss, 1963; Cho et al., 2006; Cavarretta et al., 2010; Zheng &Hryciw, 2015). Roughness was computed using high-resolution optical three-dimensional (3D) measurements ofthe particles acquired with an Alicona infinite focus system.Roughness parameters Ra, Rq and Rz are the roughnessaverage, root mean square roughness and average maximumprofile height, respectively. Scanning electron microscope(SEM) images of an LBS particle are shown in Fig. 3.
Testing procedureSpecimen preparation followed a similar procedure to that
described in Been et al. (1991). The cylindrical specimenswere 50 mm in diameter and 100 mm tall. Samples wereprepared in a membrane-lined split-mould mounted on thebase pedestal. Moist compacted samples were tamped intothe mould to a target relative density, Dr, of approximately85% in ten equal layers. Back-pressure saturation (Head,1986; Been et al., 1991; Sadrekarimi & Olson, 2011) of400 kPa was imposed under a constant effective stress ofapproximately 20 kPa until a minimum pore-pressure par-ameter, B, of 0·97 was measured (Skempton, 1954).Back-pressure of 400 kPa was maintained throughout thesubsequent test stages.Isotropic compression was performed by increasing the
cell pressure to achieve a target effective stress (e.g. 100, 200or 300 kPa), which led to excess pore-water pressuregeneration and consolidation. The shearing stage wasinitiated after no further volume change took place and100% of the excess pore-water pressure had dissipated.Shearing was performed in a strain-controlled manner
through application of a constant rate of axial displacement.Axial displacement rates of 1, 3 and 6 mm/h were applied toensure drained conditions (i.e. any excess pore-water press-ures (,2 kPa) were observed to dissipate rapidly, and hencethe effective confining stress was constant). The appropriateT
able
1.Physicalp
ropertiesof
thequartz
LBS
Description
Particle
size
Packing
Particle
shap
eMoh
sha
rdness
Inter-pa
rticle
friction
Size
rang
e:mm
Cu
Cc
ρ sρ d
rymin
ρ dry
max
e min
e max
Rou
ndness
Sphericity
Rou
ghness
ϕμ
Ra:μm
Rq:μm
Rz:μm
Leigh
tonBuzzard
sand
LBS5/8
2·00–3·35
1·344
0·964
2·682
1·580
1·760
0·524
0·698
0·18
–0·73
(mean=0·48)
0·36–0·86
(mean=0·63)
0·25
–10·56
(mean=1·70)
0·32
–12·89
(mean=2·37)
1·24–44·68
(mean=8·29)
6·0–
7·0
20°–23°
(Cavarretta
etal.,2011)
LBS8/16
1·00–2·00
1·787
1·158
2·670
1·530
1·724
0·548
0·744
LBS14/25
0·6–1·18
1·462
0·935
2·653
1·504
1·720
0·542
0·764
LBS2E
W0·25–0·71
1·656
1·090
2·761
1·551
1·773
0·558
0·781
LBSCom
bined
0·25–3·35
3·11
0·89
2·691
1·664
1·803
0·492
0·617
0
20
40
60
80
100
0·1 1 10Sieve aperture size: mm
LBS 5/8LBS 8/16LBS 14/25LBS 2EWLBS combined
Fine
r by
mas
s: %
Fig. 2. Particle size distributions of the LBS
ACOUSTIC EMISSION BEHAVIOUROF DENSE SANDS 1109
Downloaded by [ LOUGHBOROUGH UNIVERSITY] on [04/12/19]. Published with permission by the ICE under the CC-BY license

corrections for the membrane and changes in specimen areawere applied to the measurements (Head, 1986).
A summary of the triaxial tests performed in thisinvestigation is shown in Table 2. The state parameter, ψ, isthe difference in void ratio between the current state and thaton the critical state line at the current mean effective stress(reported for the onset of shearing in Table 2). Additionalparameters describing the fabric and stress anisotropy arealso necessary to define the unique state of a sand, but theseare difficult to measure and rarely available (Been & Jefferies,1985). The peak and critical state friction angles obtainedwere comparable for each of the four uniformly graded sands(±1°). The critical state friction angles obtained are typicaland consistent with those reported by Bolton (1986) forquartz sands (i.e. 33° ± 1°).
Energy calculationsEquations (1)–(3) were used to quantify the work done
during the triaxial experiments for comparison with AEmeasurements. The increment of work done per unit volumetransmitted to the soil skeleton across its boundaries(i.e. boundary work) was computed using equation (1).Boundary work per unit volume has two components:distortional work per unit volume, which causes a change
of sample shape (equation (2)); and volumetric work perunit volume, which causes a change of sample volume(equation (3)) (Muir Wood, 1990; Bolton, 2003; Powrie,2013; Hanley et al., 2017).
ΔW ¼ ΔWd þ ΔWv ð1Þ
ΔWd ¼ qδεq ¼ 23qδεγ ð2Þ
ΔWv ¼ p′δεvol ð3Þwhere δεγ, δεq and δεvol are increments of shear strain,deviatoric strain and volumetric strain, respectively. Theincrements of work done per unit volume were multiplied bythe current sample volume in each increment (Hanley et al.,2017). This allowed direct comparison with the AE generatedby each sample, and hence the AE generated for an incrementof work done per unit volume.
Coordination numberA general estimation of how the microstructure in
particulate materials evolves during shear can be conveyedfrom the average coordination number (CN) of the system
(a) (b)
(c) (d)
Fig. 3. Scanning electron microscope (SEM) images of a LBS particle. The length of the white bar in the bottom panel of each image shows thescale: 1 mm in (a), 100 μm in (b), 10 μm in (c) and 1 μm in (d)
SMITH AND DIXON1110
Downloaded by [ LOUGHBOROUGH UNIVERSITY] on [04/12/19]. Published with permission by the ICE under the CC-BY license
(Mirghasemi et al., 2002). The CN refers to the averagenumber of contacts per particle and is a measure of the fabricof granular materials (Oda, 1977; Cui & O’Sullivan, 2006;Hasan & Alshibli, 2010). The following linear relationshipbetween e and CN has been reported in the literature basedon experimental data for granular materials (Chang et al.,1990; Hasan & Alshibli, 2010)
e ¼ 1�66� 0�125CN for 0�38 � e � 0�87 ð4ÞThe CN for each material was calculated using equation (4)in the research reported here to investigate the influence ofthe number of contacts per particle on AE generation. AEgeneration following mobilisation of peak shear strength indense sands is controlled by shear deformation within aconcentrated, dilating shear zone. The local void ratio withinthis shear band is much greater than the global void ratio (i.e.average for the specimen) (Desrues et al., 1996). Althoughmore significant fabric changes will have occurred in theshear zone than those calculated using the global void ratio,general trends and relationships between CN and AEgeneration can be obtained.The CN has been shown to vary proportionally with
volumetric strain during shearing of dense granularmaterials, that is CN initially increases as the soil contractsand reaches a maximum at the transition from contractive todilative behaviour, then reduces as the sand dilates at a rateproportional to the dilatancy, and stabilises at constantvolume (e.g. Mirghasemi et al., 2002; Cui et al., 2007).
Acoustic emission measurementsA body of research has demonstrated that deforming soils
generate significant AE within the frequency range of10–100 kHz (e.g. Koerner et al., 1981; Michlmayr et al.,2013; Naderi-Boldaji et al., 2017; Smith et al., 2017).Filtering signals below 10 kHz is essential to removeextraneous low-frequency environmental noise that could
be generated in a laboratory by machinery or in a fieldenvironment by construction activity or traffic.Soil-generated AE can have energy at frequencies below10 kHz; however, noise can significantly contaminate themeasurements at these frequencies, which requires arduousprocessing to remove. Filtering signals above 100 kHz isappropriate as the study focused on relatively low effectiveconfining stresses (from 100 to 300 kPa) and particle damagewas minimal (confirmed from post-test particle size distri-butions) (Mao & Towhata, 2015).The AE sensor was installed inside the base pedestal, as
shown in Fig. 1; a 5 mm wall of stainless steel separated thesurface of the sensor and the top surface of the pedestal.Measuring AE at this consistent position eliminated sensorlocation and coupling quality as variables from the investi-gation. Moreover, installation of AE sensors at this position
Table 2. Summary of the drained triaxial isotropic compression and shearing tests performed in this study
Test no. Material* σ′r: kPa† Axialdisplacementrate: mm/h
Initial Dr: %‡ ψ§ CN∥ AE behaviourtype in shear
ϕ′p** ϕ′cv** M**
1 LBS 0·25–0·71 100 1 83·6 �0·156 8·57 1 42° 34° 1·372 LBS 0·25–0·71 200 1 83·6 �0·132 8·62 23 LBS 0·25–0·71 300 1 83·6 �0·112 8·63 24 LBS 0·6–1·18 100 1 83·5 �0·132 8·60 2 41° 33° 1·335 LBS 0·6–1·18 200 1 83·5 �0·110 8·64 26 LBS 0·6–1·18 300 1 83·5 �0·102 8·68 27 LBS 1·0–2·0 100 1 84·1 �0·153 8·75 1 41° 34° 1·378 LBS 1·0–2·0 200 1 84·1 �0·129 8·80 19 LBS 1·0–2·0 300 1 84·1 �0·114 8·84 110 LBS 1·0–2·0 300 3 84·1 �0·114 8·84 111 LBS 1·0–2·0 300 6 84·1 �0·114 8·84 112 LBS 2·0–3·35 100 1 83·1 �0·143 8·81 1 41° 34° 1·3713 LBS 2·0–3·35 200 1 83·1 �0·116 8·82 114 LBS 2·0–3·35 300 1 83·1 �0·103 8·86 115 LBS 0·25–3·35 300 1, 3, 6 82·4 — 9·29 2 —16†† LBS 1·0–2·0 300 6 84·1 �0·114 8·84 1 —
*Material identified using the size range shown in Table 1.†Final effective confining pressure after isotropic compression and constant during shearing.‡Initial relative density prior to isotropic compression.§State parameter at onset of shearing (i.e. after isotropic compression). Note that the critical state lines in e–p′ space, and hence the stateparameters, were interpreted from the final void ratio at the end of each test, but dilation can continue in dense sands beyond 20% axial strain(Been et al., 1991).∥Average coordination number at onset of shearing (i.e. after isotropic compression).**Friction parameters obtained from drained triaxial shearing tests performed in this study at three different cell pressures.††Isotropic load–unload–reload (LUR) cycles of cell pressure followed by LUR cycles of deviator stress.Note: All specimens failed with a concentrated shear zone in shearing.
0 0·1 0·2
Am
plitu
de: V
–0·10
–0·08
–0·06
–0·04
–0·02
0
0·02
0·04
0·06
0·08
0·10
0 0·1 0·2Time: s Time: s
(a) (b)
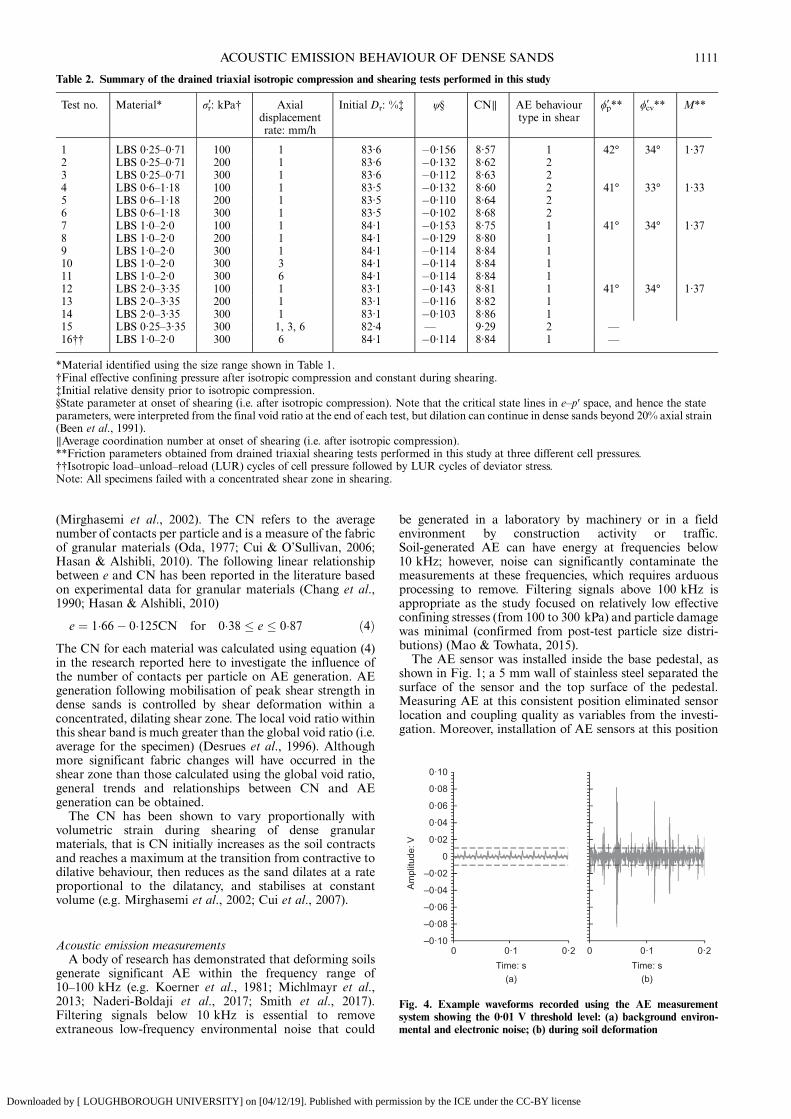
Fig. 4. Example waveforms recorded using the AE measurementsystem showing the 0·01 V threshold level: (a) background environ-mental and electronic noise; (b) during soil deformation
ACOUSTIC EMISSION BEHAVIOUROF DENSE SANDS 1111
Downloaded by [ LOUGHBOROUGH UNIVERSITY] on [04/12/19]. Published with permission by the ICE under the CC-BY license
is more practicable for routine element testing than directon-sample coupling. The sensor was a Mistras Group(Cambridge, UK) R3α piezoelectric transducer, which issensitive over the frequency range of 0–100 kHz and has aresonant frequency of 30 kHz. The sensor converts themechanical AE to a voltage waveform that can be processed.
The AE measurement system was a bespoke set-upcomprising a pre-amplifier (with a 10–1200 kHz filter and20 dB gain), a main amplifier (with a 10–100 kHz filter and3 dB gain), an analogue-to-digital converter with 2 MHzsampling frequency and a laptop with a LabView program tocondition, process and record the AE waveform. The twoamplifiers were used to improve the signal-to-noise ratio. TheLabView program was set to further attenuate signals outsidethe 10–100 kHz range and record the full AE waveformwithin this frequency range.Two key AE parameters of interest are ring-down counts
(RDC) and b-value. RDC per unit time are the number oftimes the AE waveform crosses a programmable thresholdlevel (set to 0·01 V in this study, above backgroundenvironmental and electronic noise, as shown in Fig. 4)within a predefined time interval and are a measure of thesignal energy. The b-value can be obtained from the full AEwaveform data (Pollock, 1973) and is a convenient way todescribe the amplitude distribution in a single value. Whenthe AE waveform is dominated by low-amplitude events theb-value is large. As the proportion of higher amplitude eventsincreases, indicating an increase in energy, the b-valuereduces. The b-value was computed at 1 min intervals usingequations (5) and (6).
logN ¼ c� bm ð5Þ
m ¼ logA ð6Þwhere A is the amplitude; m is a log-scale measure termedmagnitude; N is the number of AE events with magnitudegreater thanm; c is the point where the log(N ) plotted against
050
100150200250300
0 1 2 3 4 5 6 7 8 9 10
p': k
Pa
Time: min
05
1015202530354045
0 1 2 3 4 5 6 7 8 9 10
U: k
Pa
Time: min
–1·2
–1·0
–0·8
–0·6
–0·4
–0·2
0
0 1 2 3 4 5 6 7 8 9 10Time: min
0
1000
2000
3000
4000
5000
6000
0 1 2 3 4 5 6 7 8 9 10Time: min
00·050·100·150·200·250·300·35
0 1 2 3 4 5 6 7 8 9 10Time: min
(a)
(b)
(c)
(d)
(e)
Vol
ume
chan
ge: %
Cum
ulat
ive
AE
: RD
CV
olum
etric
wor
k: J
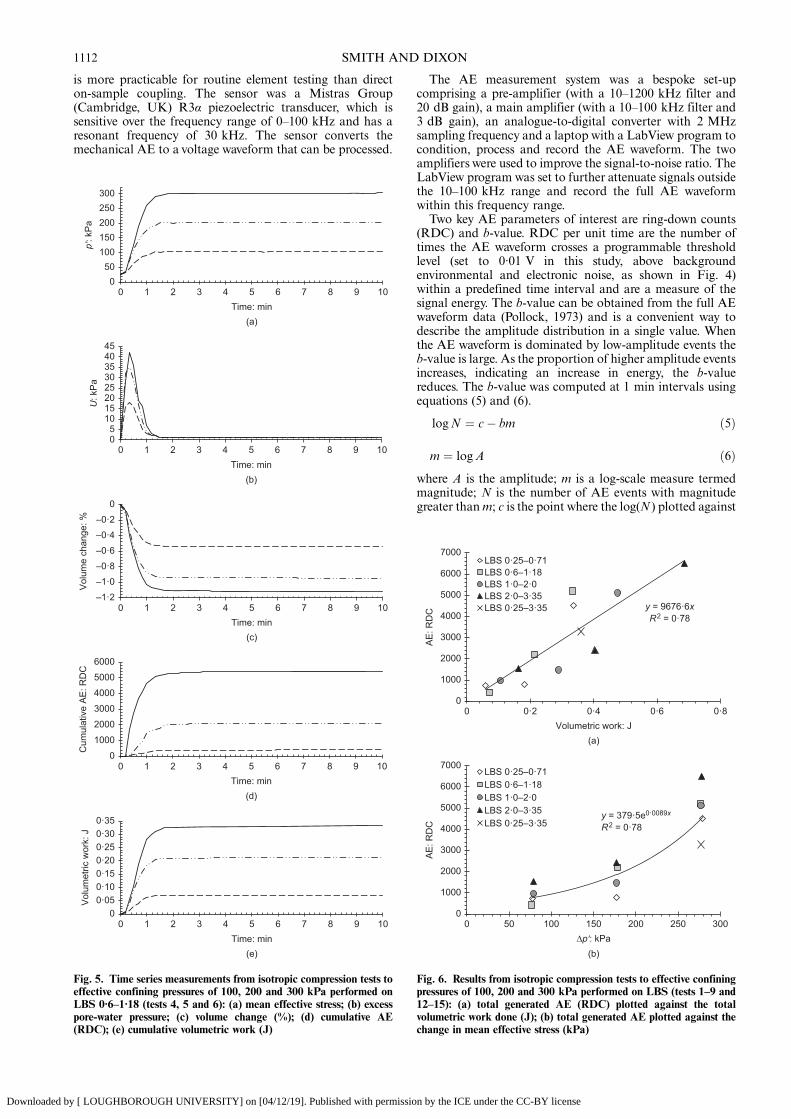
Fig. 5. Time series measurements from isotropic compression tests toeffective confining pressures of 100, 200 and 300 kPa performed onLBS 0·6–1·18 (tests 4, 5 and 6): (a) mean effective stress; (b) excesspore-water pressure; (c) volume change (%); (d) cumulative AE(RDC); (e) cumulative volumetric work (J)
y = 9676·6xR2 = 0·78
0
1000
2000
3000
4000
5000
6000
7000
0 0·2 0·4 0·6 0·8
AE
: RD
CA
E: R
DC
Volumetric work: J
LBS 0·25–0·71LBS 0·6–1·18LBS 1·0–2·0LBS 2·0–3·35LBS 0·25–3·35
y = 379·5e0·0089x
R2 = 0·78
0
1000
2000
3000
4000
5000
6000
7000
0 50 100 150 200 250 300Δp': kPa
LBS 0·25–0·71LBS 0·6–1·18LBS 1·0–2·0LBS 2·0–3·35LBS 0·25–3·35
(a)
(b)
Fig. 6. Results from isotropic compression tests to effective confiningpressures of 100, 200 and 300 kPa performed on LBS (tests 1–9 and12–15): (a) total generated AE (RDC) plotted against the totalvolumetric work done (J); (b) total generated AE plotted against thechange in mean effective stress (kPa)
SMITH AND DIXON1112
Downloaded by [ LOUGHBOROUGH UNIVERSITY] on [04/12/19]. Published with permission by the ICE under the CC-BY license
m relationship intersects the y-axis; and the coefficient b(b-value) is the negative slope of the log(N ) plotted against mrelationship.
RESULTSIsotropic compressionFigure 5 shows example time series measurements from
isotropic compression performed on LBS 0·6–1·18 (tests 4, 5and 6). Space precludes inclusion of time series measure-ments for all tests; however, the general trends in behaviourwere the same, and the results from all isotropic compressiontests (tests 1–9 and 12–15) are compared in relation to thevolumetric work done and change in mean effective stressin Fig. 6.
An increase in cell pressure caused excess pore-waterpressures to develop, which dissipated as the sampleconsolidated and the mean effective stress increased. Thecumulative RDC generated was proportional to the changein mean effective stress and magnitude of volumetricwork done, and they followed comparable trends with time(Figs 5(a), 5(d) and 5(c)).The linear regression plotted through results from all LBS
(tests 1–9 and 12–15) in Fig. 6(a) shows that, in general,approximately 10 000 RDC were generated per 1 J ofvolumetric work done. Fig. 6(b) shows the relationshipbetween generated RDC and the change in mean effectivestress, which is best described using the exponential function(highestR2 obtained from systematic curve fitting of 0·78) forthe range of data reported.
0
100
200
300
400
500
600
700
0 0·5 1·0 1·5 2·0 2·5
–0·2
0
0·2
0·4
0·6
0 0·5 1·0 1·5 2·0 2·5
0·65
0·75
0·85
0·95
1·05
1·15
1·25
0 0·5 1·0 1·5 2·0 2·5
b-va
lue
0
0·5
1·0
1·5
2·0
0 0·5 1·0 1·5 2·0 2·5
q/p'
0
100
200
300
400
500
600
700
0 0·5 1·0 1·5 2·0 2·5
AE
rate
: RD
C/m
in
AE
rate
: RD
C/m
in
–0·2
0
0·2
0·4
0·6
0 0·5 1·0 1·5 2·0 2·5
0·65
0·75
0·85
0·95
1·05
1·15
1·25
0 0·5 1·0 1·5 2·0 2·5
b-va
lue
0
0·5
1·0
1·5
2·0
0 0·5 1·0 1·5 2·0 2·5
q/p'
(e) (f)
(c) (d)
(g) (h)
(a) (b)
Contraction Dilation Contraction Dilation
LBS 1·0–2·0 LBS 0·6–1·18
εγ : % εγ : %
εγ : %
ε vol
: %
ε vol
: %
εγ : %
εγ : % εγ : %
εγ : % εγ : %
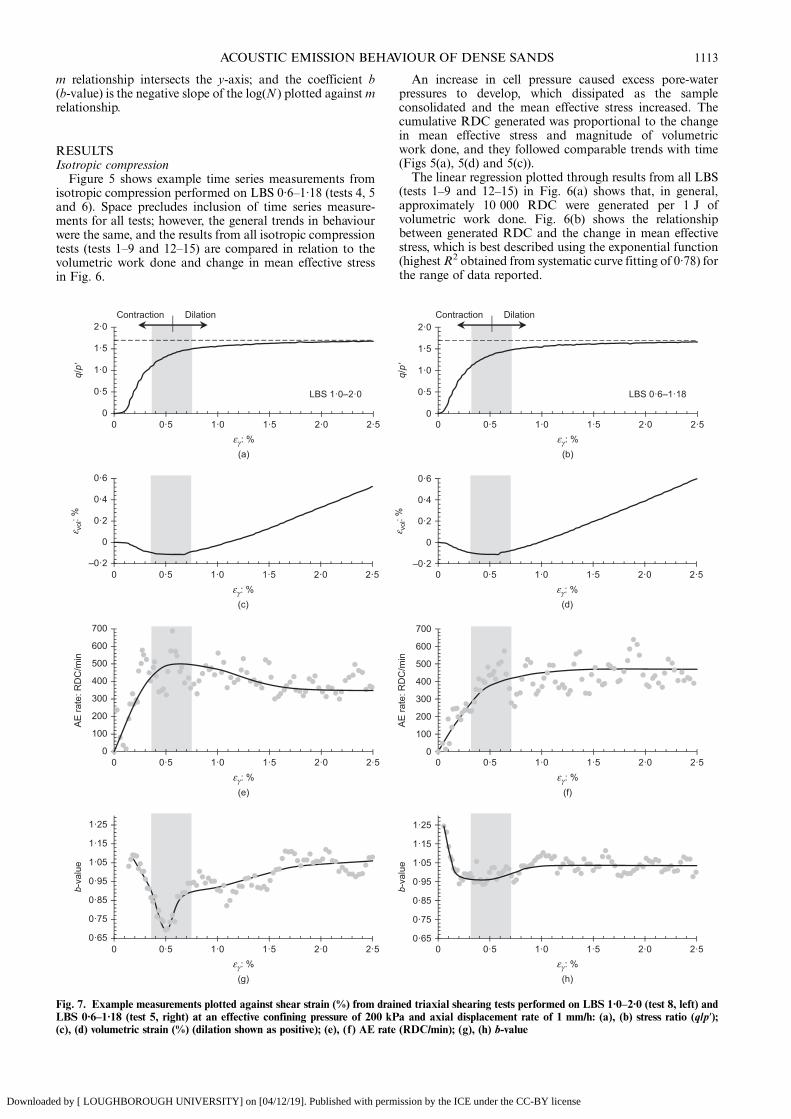
Fig. 7. Example measurements plotted against shear strain (%) from drained triaxial shearing tests performed on LBS 1·0–2·0 (test 8, left) andLBS 0·6–1·18 (test 5, right) at an effective confining pressure of 200 kPa and axial displacement rate of 1 mm/h: (a), (b) stress ratio (q/p′);(c), (d) volumetric strain (%) (dilation shown as positive); (e), (f) AE rate (RDC/min); (g), (h) b-value
ACOUSTIC EMISSION BEHAVIOUROF DENSE SANDS 1113
Downloaded by [ LOUGHBOROUGH UNIVERSITY] on [04/12/19]. Published with permission by the ICE under the CC-BY license
As the magnitude of mean effective stress increases, andhence the volume of the sample decreases, the CN increases.The combined effect of both stress change and CN change istherefore the cause of the exponential, as opposed to linear,relationship. Moreover, the change in CN is likely to be themain cause for the scatter in Fig. 6(a) (R2 of 0·78) (e.g. AEgenerated by each material increased exponentially, asopposed to linearly, with volumetric work in Fig. 6(a)).Other potential reasons for variability include: naturalvariations in the particles (e.g. shape and roughness);differences in initial fabric (e.g. the same sands with equalvoid ratio and confining stress have been observed to exhibitdifferent stress–strain behaviour due to differences ininitial fabrics derived from sample preparation (Arthur &Menzies, 1972; Oda, 1972; Been & Jefferies, 1986)); therate of consolidation (i.e. rate of volume change andhence particle–particle interactions); and differences inpropagation paths and attenuation through the soil skeletonas the AE waves travelled from the generation sources tothe sensor.
ShearingFigure 7 shows measurements plotted against shear strain
from test 8 (LBS 1·0–2·0) and test 5 (0·6–1·18) to exemplify
the two types of AE behaviour observed in this study. All testsexhibited one of these two trends in behaviour, and the AEbehaviour type experienced by each is detailed in Table 2. AEactivity increases (i.e. AE rates increase, and b-values reduce)approximately linearly with shear strain in both identifiedtypes of behaviour until the point of volume minimum (i.e.transition from contractive to dilative behaviour). Inaddition, AE activity remains relatively constant followingmobilisation of peak shear strength in both behaviour types.The difference in behaviour occurs between the point ofvolume minimum and mobilisation of peak shear strength:type-1 (illustrated by LBS 1·0–2·0) exhibits a significant peakin AE activity at the point of volume minimum, which thenreduces and stabilises at peak shear strength; type-2 (illus-trated by LBS 0·6–1·18) does not exhibit a significant peakand drop in AE rates but does exhibit a trough in b-valuemeasurements at the point of volume minimum, althoughsignificantly less in magnitude than type-1.AE is generated by particle-scale interactions and evolving
mechanisms such as inter-particle friction, slip–stick andparticle rearrangement, and hence the AE measurementshave a variable nature. Smoothed curves of moving averagevalues have been used to describe the general trends.Figure 8 shows measurements plotted against shear strain
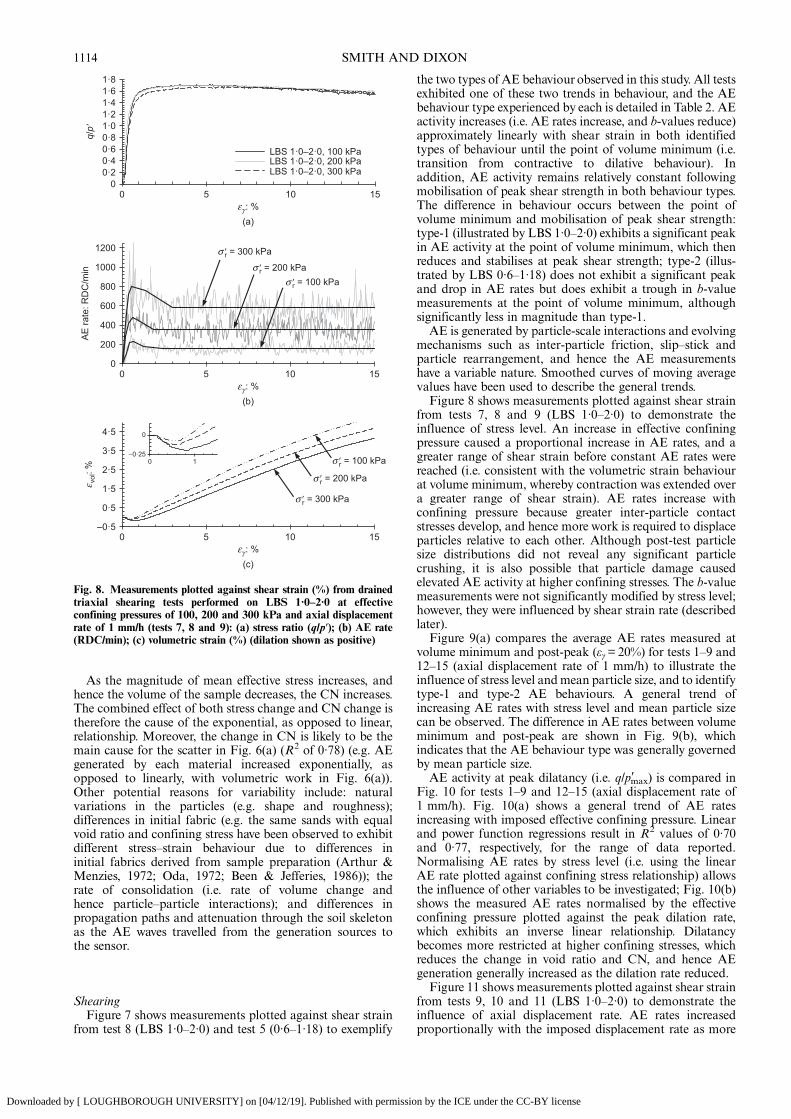
from tests 7, 8 and 9 (LBS 1·0–2·0) to demonstrate theinfluence of stress level. An increase in effective confiningpressure caused a proportional increase in AE rates, and agreater range of shear strain before constant AE rates werereached (i.e. consistent with the volumetric strain behaviourat volume minimum, whereby contraction was extended overa greater range of shear strain). AE rates increase withconfining pressure because greater inter-particle contactstresses develop, and hence more work is required to displaceparticles relative to each other. Although post-test particlesize distributions did not reveal any significant particlecrushing, it is also possible that particle damage causedelevated AE activity at higher confining stresses. The b-valuemeasurements were not significantly modified by stress level;however, they were influenced by shear strain rate (describedlater).Figure 9(a) compares the average AE rates measured at
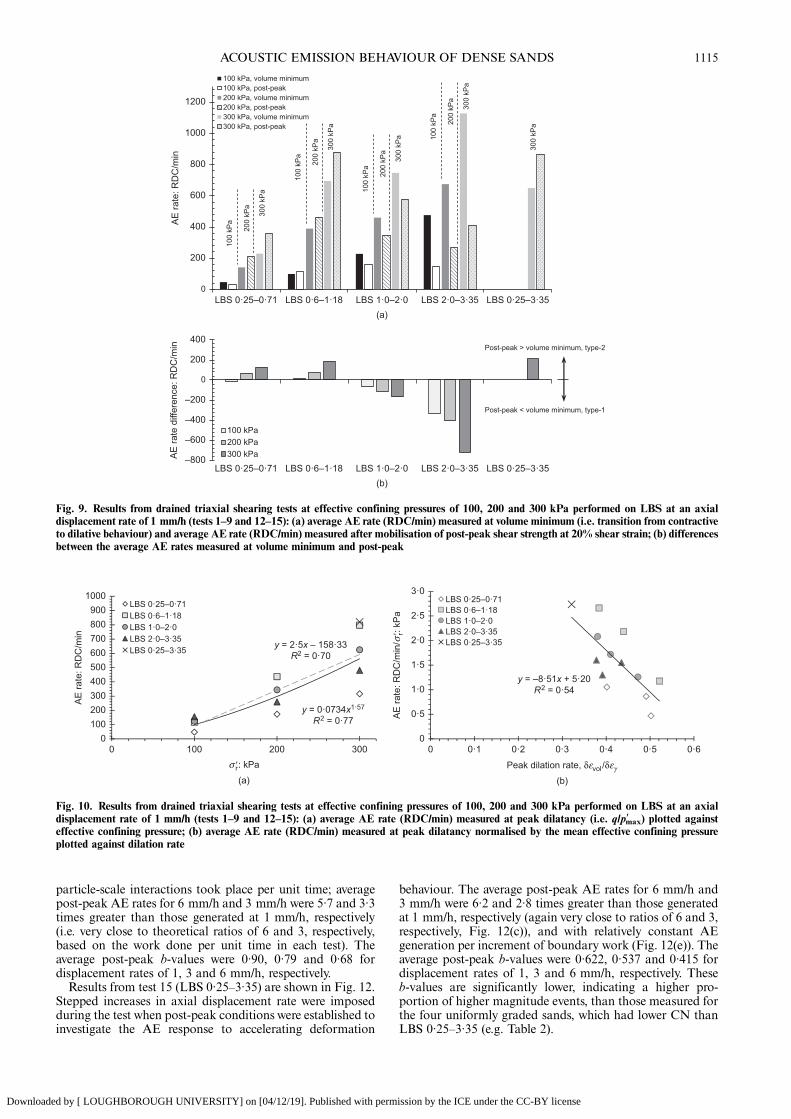
volume minimum and post-peak (εγ=20%) for tests 1–9 and12–15 (axial displacement rate of 1 mm/h) to illustrate theinfluence of stress level and mean particle size, and to identifytype-1 and type-2 AE behaviours. A general trend ofincreasing AE rates with stress level and mean particle sizecan be observed. The difference in AE rates between volumeminimum and post-peak are shown in Fig. 9(b), whichindicates that the AE behaviour type was generally governedby mean particle size.AE activity at peak dilatancy (i.e. q/p′max) is compared in
Fig. 10 for tests 1–9 and 12–15 (axial displacement rate of1 mm/h). Fig. 10(a) shows a general trend of AE ratesincreasing with imposed effective confining pressure. Linearand power function regressions result in R2 values of 0·70and 0·77, respectively, for the range of data reported.Normalising AE rates by stress level (i.e. using the linearAE rate plotted against confining stress relationship) allowsthe influence of other variables to be investigated; Fig. 10(b)shows the measured AE rates normalised by the effectiveconfining pressure plotted against the peak dilation rate,which exhibits an inverse linear relationship. Dilatancybecomes more restricted at higher confining stresses, whichreduces the change in void ratio and CN, and hence AEgeneration generally increased as the dilation rate reduced.Figure 11 shows measurements plotted against shear strain
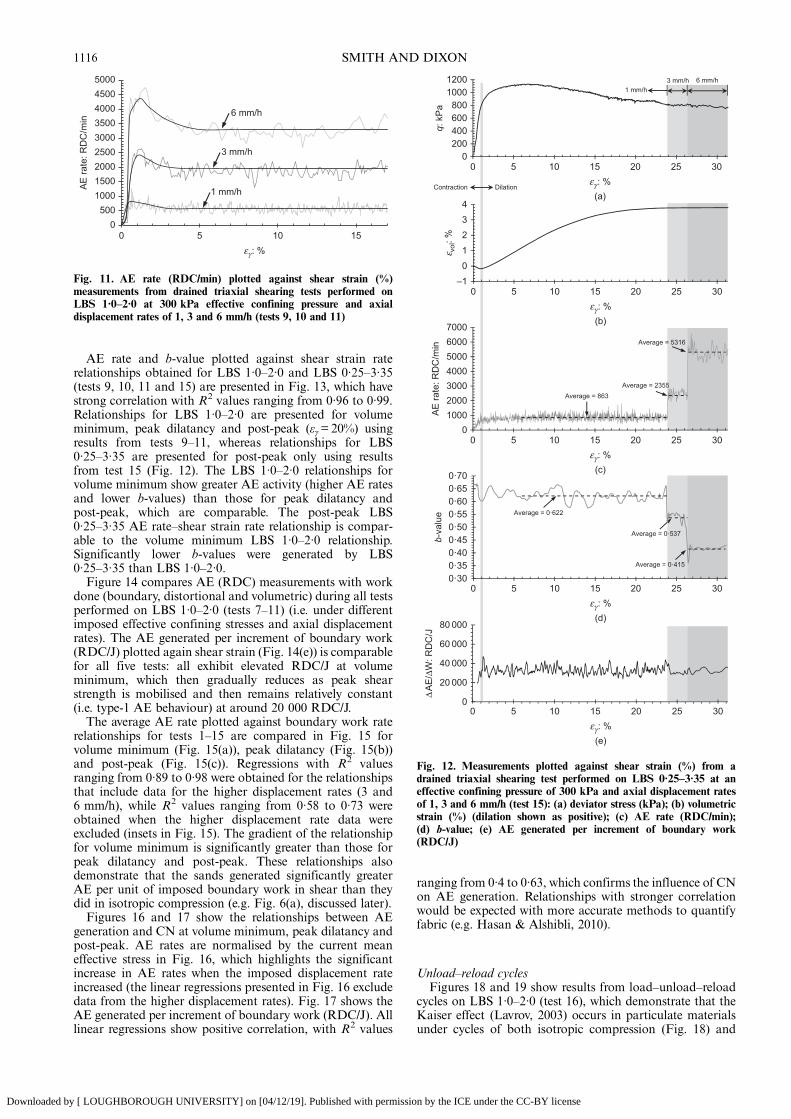
from tests 9, 10 and 11 (LBS 1·0–2·0) to demonstrate theinfluence of axial displacement rate. AE rates increasedproportionally with the imposed displacement rate as more
0
200
400
600
800
1000
1200
0 5 10 15
–0·5
0·5
1·5
2·5
3·5
4·5
0 5 10 15
00·20·40·60·81·01·21·41·61·8
0 5 10 15
σ ′r = 100 kPaσ ′r = 200 kPa
σ ′r = 300 kPa
σ ′r = 300 kPa
σ ′r = 200 kPa
σ ′r = 100 kPa–0·25
0
0 1
LBS 1·0–2·0, 100 kPaLBS 1·0–2·0, 200 kPaLBS 1·0–2·0, 300 kPa
AE
rate
: RD
C/m
inε v
ol: %
q/p'
εγ : %
εγ : %
εγ : %
(a)
(b)
(c)
Fig. 8. Measurements plotted against shear strain (%) from drainedtriaxial shearing tests performed on LBS 1·0–2·0 at effectiveconfining pressures of 100, 200 and 300 kPa and axial displacementrate of 1 mm/h (tests 7, 8 and 9): (a) stress ratio (q/p′); (b) AE rate(RDC/min); (c) volumetric strain (%) (dilation shown as positive)
SMITH AND DIXON1114
Downloaded by [ LOUGHBOROUGH UNIVERSITY] on [04/12/19]. Published with permission by the ICE under the CC-BY license
particle-scale interactions took place per unit time; averagepost-peak AE rates for 6 mm/h and 3 mm/h were 5·7 and 3·3times greater than those generated at 1 mm/h, respectively(i.e. very close to theoretical ratios of 6 and 3, respectively,based on the work done per unit time in each test). Theaverage post-peak b-values were 0·90, 0·79 and 0·68 fordisplacement rates of 1, 3 and 6 mm/h, respectively.Results from test 15 (LBS 0·25–3·35) are shown in Fig. 12.
Stepped increases in axial displacement rate were imposedduring the test when post-peak conditions were established toinvestigate the AE response to accelerating deformation
behaviour. The average post-peak AE rates for 6 mm/h and3 mm/h were 6·2 and 2·8 times greater than those generatedat 1 mm/h, respectively (again very close to ratios of 6 and 3,respectively, Fig. 12(c)), and with relatively constant AEgeneration per increment of boundary work (Fig. 12(e)). Theaverage post-peak b-values were 0·622, 0·537 and 0·415 fordisplacement rates of 1, 3 and 6 mm/h, respectively. Theseb-values are significantly lower, indicating a higher pro-portion of higher magnitude events, than those measured forthe four uniformly graded sands, which had lower CN thanLBS 0·25–3·35 (e.g. Table 2).
0
200
400
600
800
1000
1200
100 kPa, volume minimum100 kPa, post-peak200 kPa, volume minimum200 kPa, post-peak300 kPa, volume minimum300 kPa, post-peak
–800
–600
–400
–200
0
200
400
100 kPa200 kPa300 kPa
LBS 0·25–0·71 LBS 0·6–1·18 LBS 1·0–2·0 LBS 2·0–3·35 LBS 0·25–3·35
LBS 0·25–0·71 LBS 0·6–1·18 LBS 1·0–2·0 LBS 2·0–3·35 LBS 0·25–3·35
(a)
(b)
300
kPa
100
kPa
200
kPa
300
kPa
300
kPa
100
kPa
200
kPa
300
kPa
100
kPa
200
kPa
300
kPa
100
kPa
200
kPa
Post-peak > volume minimum, type-2
Post-peak < volume minimum, type-1
AE
rate
diff
eren
ce: R
DC
/min
AE
rate
: RD
C/m
in
Fig. 9. Results from drained triaxial shearing tests at effective confining pressures of 100, 200 and 300 kPa performed on LBS at an axialdisplacement rate of 1 mm/h (tests 1–9 and 12–15): (a) average AE rate (RDC/min) measured at volume minimum (i.e. transition from contractiveto dilative behaviour) and average AE rate (RDC/min) measured after mobilisation of post-peak shear strength at 20% shear strain; (b) differencesbetween the average AE rates measured at volume minimum and post-peak
y = 0·0734x1·57
R2 = 0·77
y = 2·5x – 158·33R2 = 0·70
0100200300400500600700800900
1000
0 100 200 300
LBS 0·25–0·71LBS 0·6–1·18LBS 1·0–2·0LBS 2·0–3·35LBS 0·25–3·35
(a)
σ 'r: kPa
y = –8·51x + 5·20R2 = 0·54
0
0·5
1·0
1·5
2·0
2·5
3·0
0 0·1 0·2 0·3 0·4 0·5 0·6
Peak dilation rate, δεvol/δεγ
LBS 0·25–0·71LBS 0·6–1·18LBS 1·0–2·0LBS 2·0–3·35LBS 0·25–3·35
(b)
AE
rate
: RD
C/m
in/σ' r:
kPa
AE
rate
: RD
C/m
in
Fig. 10. Results from drained triaxial shearing tests at effective confining pressures of 100, 200 and 300 kPa performed on LBS at an axialdisplacement rate of 1 mm/h (tests 1–9 and 12–15): (a) average AE rate (RDC/min) measured at peak dilatancy (i.e. q/p′max) plotted againsteffective confining pressure; (b) average AE rate (RDC/min) measured at peak dilatancy normalised by the mean effective confining pressureplotted against dilation rate
ACOUSTIC EMISSION BEHAVIOUROF DENSE SANDS 1115
Downloaded by [ LOUGHBOROUGH UNIVERSITY] on [04/12/19]. Published with permission by the ICE under the CC-BY license
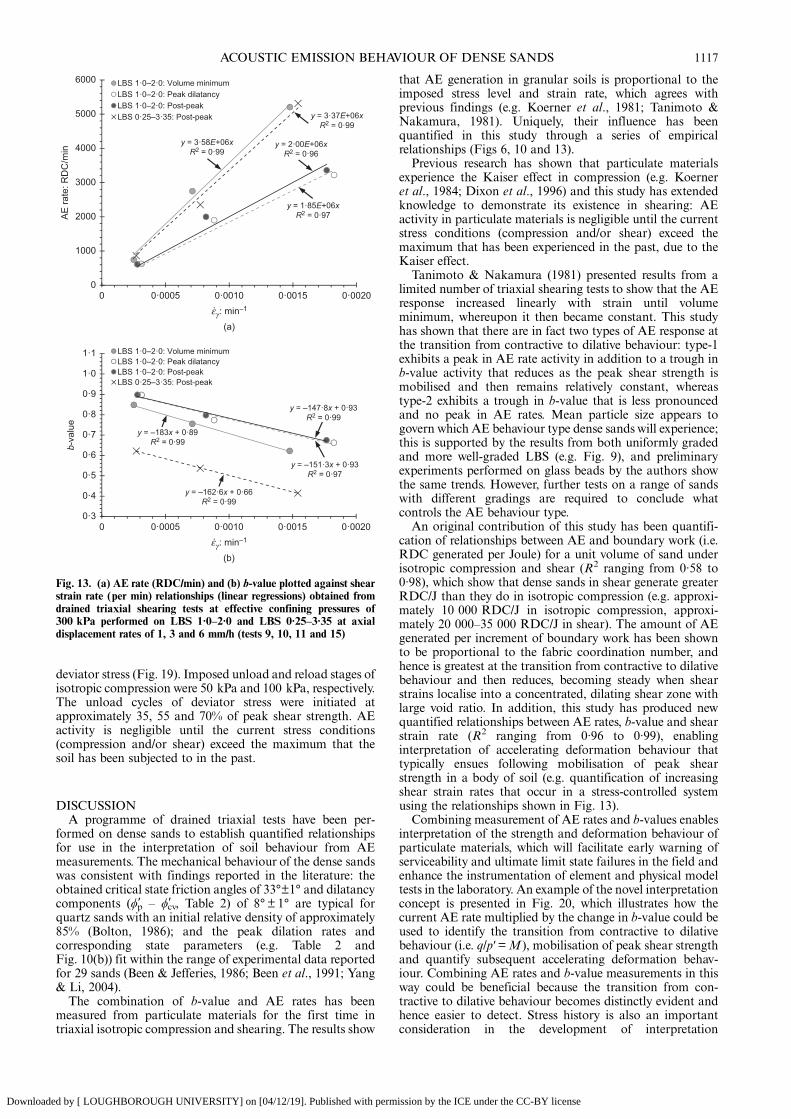
AE rate and b-value plotted against shear strain raterelationships obtained for LBS 1·0–2·0 and LBS 0·25–3·35(tests 9, 10, 11 and 15) are presented in Fig. 13, which havestrong correlation with R2 values ranging from 0·96 to 0·99.Relationships for LBS 1·0–2·0 are presented for volumeminimum, peak dilatancy and post-peak (εγ=20%) usingresults from tests 9–11, whereas relationships for LBS0·25–3·35 are presented for post-peak only using resultsfrom test 15 (Fig. 12). The LBS 1·0–2·0 relationships forvolume minimum show greater AE activity (higher AE ratesand lower b-values) than those for peak dilatancy andpost-peak, which are comparable. The post-peak LBS0·25–3·35 AE rate–shear strain rate relationship is compar-able to the volume minimum LBS 1·0–2·0 relationship.Significantly lower b-values were generated by LBS0·25–3·35 than LBS 1·0–2·0.
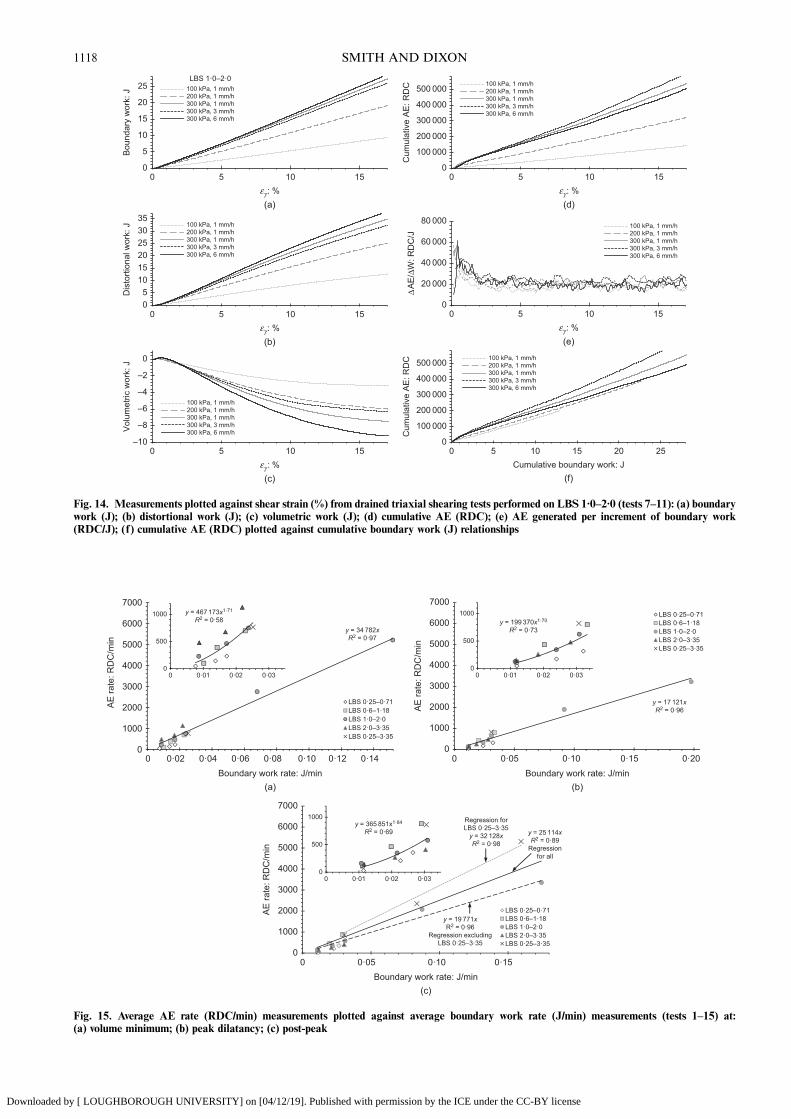
Figure 14 compares AE (RDC) measurements with workdone (boundary, distortional and volumetric) during all testsperformed on LBS 1·0–2·0 (tests 7–11) (i.e. under differentimposed effective confining stresses and axial displacementrates). The AE generated per increment of boundary work(RDC/J) plotted again shear strain (Fig. 14(e)) is comparablefor all five tests: all exhibit elevated RDC/J at volumeminimum, which then gradually reduces as peak shearstrength is mobilised and then remains relatively constant(i.e. type-1 AE behaviour) at around 20 000 RDC/J.
The average AE rate plotted against boundary work raterelationships for tests 1–15 are compared in Fig. 15 forvolume minimum (Fig. 15(a)), peak dilatancy (Fig. 15(b))and post-peak (Fig. 15(c)). Regressions with R2 valuesranging from 0·89 to 0·98 were obtained for the relationshipsthat include data for the higher displacement rates (3 and6 mm/h), while R2 values ranging from 0·58 to 0·73 wereobtained when the higher displacement rate data wereexcluded (insets in Fig. 15). The gradient of the relationshipfor volume minimum is significantly greater than those forpeak dilatancy and post-peak. These relationships alsodemonstrate that the sands generated significantly greaterAE per unit of imposed boundary work in shear than theydid in isotropic compression (e.g. Fig. 6(a), discussed later).
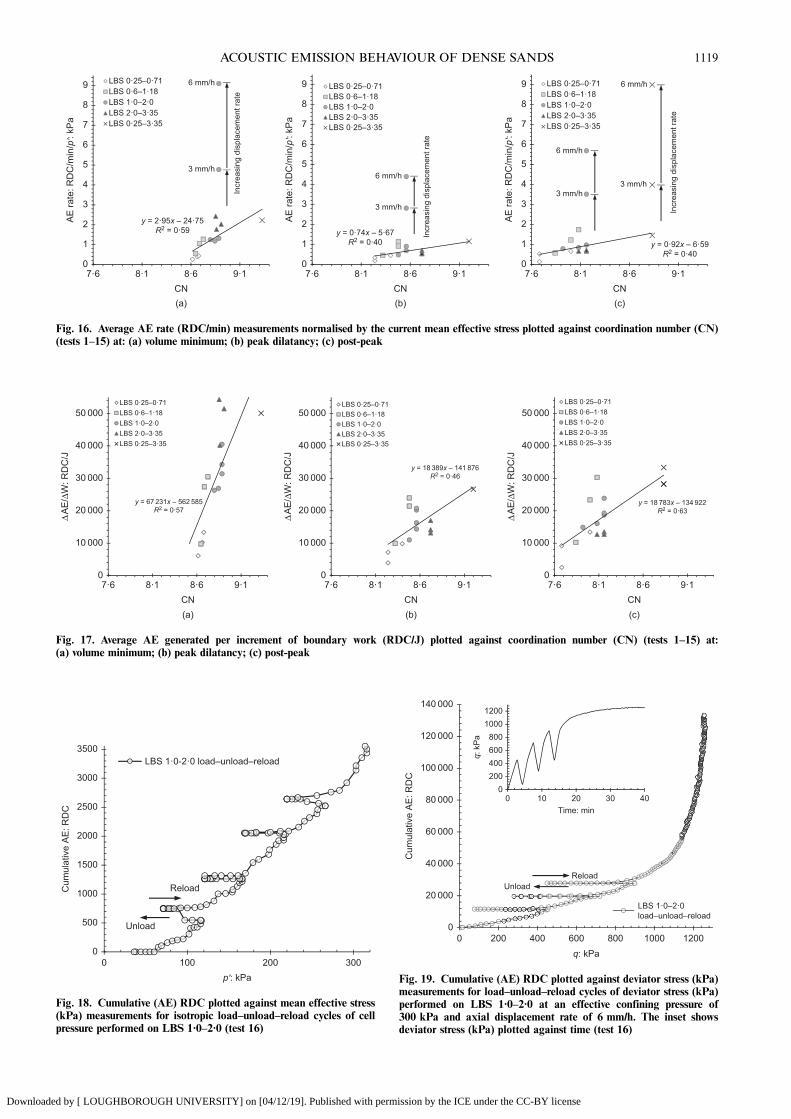
Figures 16 and 17 show the relationships between AEgeneration and CN at volume minimum, peak dilatancy andpost-peak. AE rates are normalised by the current meaneffective stress in Fig. 16, which highlights the significantincrease in AE rates when the imposed displacement rateincreased (the linear regressions presented in Fig. 16 excludedata from the higher displacement rates). Fig. 17 shows theAE generated per increment of boundary work (RDC/J). Alllinear regressions show positive correlation, with R2 values
ranging from 0·4 to 0·63, which confirms the influence of CNon AE generation. Relationships with stronger correlationwould be expected with more accurate methods to quantifyfabric (e.g. Hasan & Alshibli, 2010).
Unload–reload cyclesFigures 18 and 19 show results from load–unload–reload
cycles on LBS 1·0–2·0 (test 16), which demonstrate that theKaiser effect (Lavrov, 2003) occurs in particulate materialsunder cycles of both isotropic compression (Fig. 18) and
0500
100015002000250030003500400045005000
0 5 10 15
AE
rate
: RD
C/m
in
6 mm/h
3 mm/h
1 mm/h
εγ : %
Fig. 11. AE rate (RDC/min) plotted against shear strain (%)measurements from drained triaxial shearing tests performed onLBS 1·0–2·0 at 300 kPa effective confining pressure and axialdisplacement rates of 1, 3 and 6 mm/h (tests 9, 10 and 11)
Average = 0·622
Average = 0·537
Average = 0·415
Average = 5316
Average = 2355Average = 863
DilationContraction
1 mm/h3 mm/h 6 mm/h
(e)
0200400600800
10001200
q: k
Pa
–101234
01000200030004000500060007000
AE
rate
: RD
C/m
in
0·300·350·400·450·500·550·600·650·70
b-va
lue
0
20 000
40 000
60 000
80 000
0 5 10 15 20 25 30εγ : %
(d)
0 5 10 15 20 25 30εγ : %
(c)
0 5 10 15 20 25 30εγ : %
(b)
0 5 10 15 20 25 30εγ : %
(a)
0 5 10 15 20 25 30εγ : %
ΔA
E/Δ
W: R
DC
/J
ε vol
: %
Fig. 12. Measurements plotted against shear strain (%) from adrained triaxial shearing test performed on LBS 0·25–3·35 at aneffective confining pressure of 300 kPa and axial displacement ratesof 1, 3 and 6 mm/h (test 15): (a) deviator stress (kPa); (b) volumetricstrain (%) (dilation shown as positive); (c) AE rate (RDC/min);(d) b-value; (e) AE generated per increment of boundary work(RDC/J)
SMITH AND DIXON1116
Downloaded by [ LOUGHBOROUGH UNIVERSITY] on [04/12/19]. Published with permission by the ICE under the CC-BY license
deviator stress (Fig. 19). Imposed unload and reload stages ofisotropic compression were 50 kPa and 100 kPa, respectively.The unload cycles of deviator stress were initiated atapproximately 35, 55 and 70% of peak shear strength. AEactivity is negligible until the current stress conditions(compression and/or shear) exceed the maximum that thesoil has been subjected to in the past.
DISCUSSIONA programme of drained triaxial tests have been per-
formed on dense sands to establish quantified relationshipsfor use in the interpretation of soil behaviour from AEmeasurements. The mechanical behaviour of the dense sandswas consistent with findings reported in the literature: theobtained critical state friction angles of 33°±1° and dilatancycomponents (ϕ′p – ϕ′cv, Table 2) of 8° ± 1° are typical forquartz sands with an initial relative density of approximately85% (Bolton, 1986); and the peak dilation rates andcorresponding state parameters (e.g. Table 2 andFig. 10(b)) fit within the range of experimental data reportedfor 29 sands (Been & Jefferies, 1986; Been et al., 1991; Yang& Li, 2004).The combination of b-value and AE rates has been
measured from particulate materials for the first time intriaxial isotropic compression and shearing. The results show
that AE generation in granular soils is proportional to theimposed stress level and strain rate, which agrees withprevious findings (e.g. Koerner et al., 1981; Tanimoto &Nakamura, 1981). Uniquely, their influence has beenquantified in this study through a series of empiricalrelationships (Figs 6, 10 and 13).Previous research has shown that particulate materials
experience the Kaiser effect in compression (e.g. Koerneret al., 1984; Dixon et al., 1996) and this study has extendedknowledge to demonstrate its existence in shearing: AEactivity in particulate materials is negligible until the currentstress conditions (compression and/or shear) exceed themaximum that has been experienced in the past, due to theKaiser effect.Tanimoto & Nakamura (1981) presented results from a
limited number of triaxial shearing tests to show that the AEresponse increased linearly with strain until volumeminimum, whereupon it then became constant. This studyhas shown that there are in fact two types of AE response atthe transition from contractive to dilative behaviour: type-1exhibits a peak in AE rate activity in addition to a trough inb-value activity that reduces as the peak shear strength ismobilised and then remains relatively constant, whereastype-2 exhibits a trough in b-value that is less pronouncedand no peak in AE rates. Mean particle size appears togovern which AE behaviour type dense sands will experience;this is supported by the results from both uniformly gradedand more well-graded LBS (e.g. Fig. 9), and preliminaryexperiments performed on glass beads by the authors showthe same trends. However, further tests on a range of sandswith different gradings are required to conclude whatcontrols the AE behaviour type.An original contribution of this study has been quantifi-
cation of relationships between AE and boundary work (i.e.RDC generated per Joule) for a unit volume of sand underisotropic compression and shear (R2 ranging from 0·58 to0·98), which show that dense sands in shear generate greaterRDC/J than they do in isotropic compression (e.g. approxi-mately 10 000 RDC/J in isotropic compression, approxi-mately 20 000–35 000 RDC/J in shear). The amount of AEgenerated per increment of boundary work has been shownto be proportional to the fabric coordination number, andhence is greatest at the transition from contractive to dilativebehaviour and then reduces, becoming steady when shearstrains localise into a concentrated, dilating shear zone withlarge void ratio. In addition, this study has produced newquantified relationships between AE rates, b-value and shearstrain rate (R2 ranging from 0·96 to 0·99), enablinginterpretation of accelerating deformation behaviour thattypically ensues following mobilisation of peak shearstrength in a body of soil (e.g. quantification of increasingshear strain rates that occur in a stress-controlled systemusing the relationships shown in Fig. 13).Combining measurement of AE rates and b-values enables
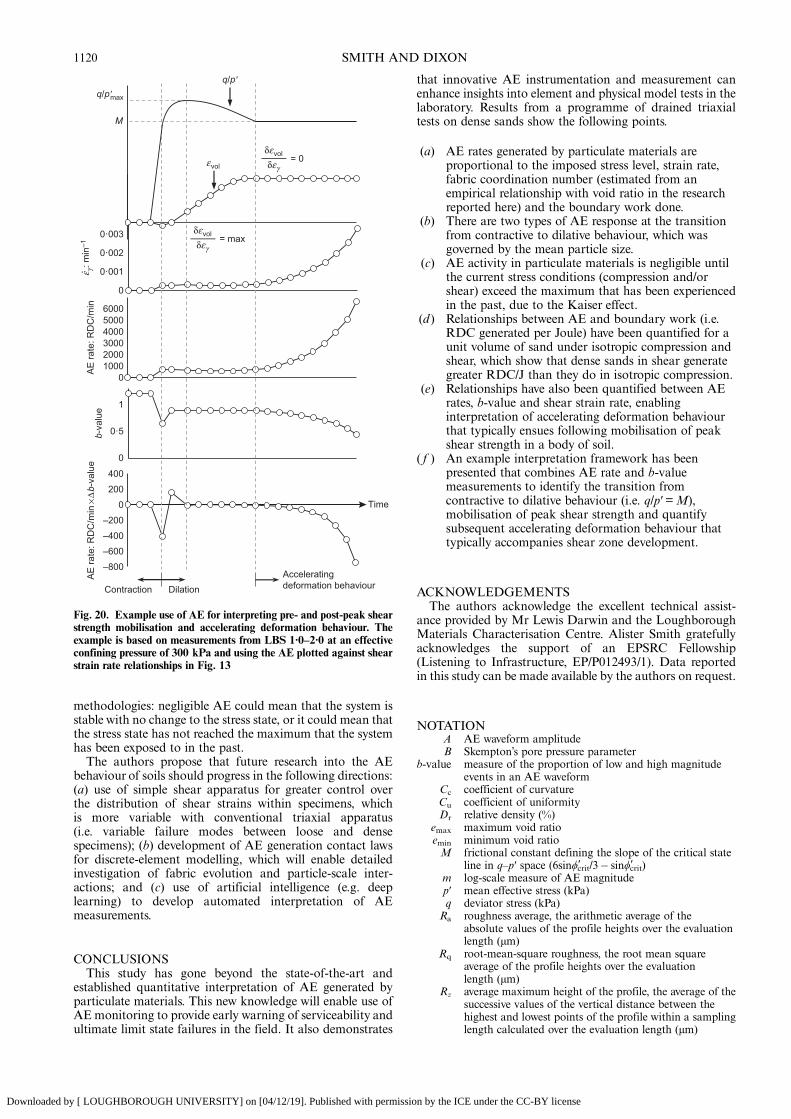
interpretation of the strength and deformation behaviour ofparticulate materials, which will facilitate early warning ofserviceability and ultimate limit state failures in the field andenhance the instrumentation of element and physical modeltests in the laboratory. An example of the novel interpretationconcept is presented in Fig. 20, which illustrates how thecurrent AE rate multiplied by the change in b-value could beused to identify the transition from contractive to dilativebehaviour (i.e. q/p′=M ), mobilisation of peak shear strengthand quantify subsequent accelerating deformation behav-iour. Combining AE rates and b-value measurements in thisway could be beneficial because the transition from con-tractive to dilative behaviour becomes distinctly evident andhence easier to detect. Stress history is also an importantconsideration in the development of interpretation
y = –183x + 0·89R2 = 0·99
y = –151·3x + 0·93R2 = 0·97
y = –147·8x + 0·93R2 = 0·99
y = –162·6x + 0·66R2 = 0·99
0·3
0·4
0·5
0·6
0·7
0·8
0·9
1·0
1·1
0 0·0005 0·0010 0·0015 0·0020
LBS 1·0–2·0: Volume minimumLBS 1·0–2·0: Peak dilatancyLBS 1·0–2·0: Post-peakLBS 0·25–3·35: Post-peak
y = 3·58E+06xR2 = 0·99
y = 1·85E+06xR2 = 0·97
y = 2·00E+06xR2 = 0·96
y = 3·37E+06xR2 = 0·99
0
1000
2000
3000
4000
5000
6000 LBS 1·0–2·0: Volume minimumLBS 1·0–2·0: Peak dilatancyLBS 1·0–2·0: Post-peakLBS 0·25–3·35: Post-peak
(b)
εγ : min–1
εγ : min–1
0 0·0005 0·0010 0·0015 0·0020
(a)
AE
rate
: RD
C/m
inb-
valu
e
Fig. 13. (a) AE rate (RDC/min) and (b) b-value plotted against shearstrain rate (per min) relationships (linear regressions) obtained fromdrained triaxial shearing tests at effective confining pressures of300 kPa performed on LBS 1·0–2·0 and LBS 0·25–3·35 at axialdisplacement rates of 1, 3 and 6 mm/h (tests 9, 10, 11 and 15)
ACOUSTIC EMISSION BEHAVIOUROF DENSE SANDS 1117
Downloaded by [ LOUGHBOROUGH UNIVERSITY] on [04/12/19]. Published with permission by the ICE under the CC-BY license
0
5
10
15
20
25
0 5 10 15
05
101520253035
–10
–8
–6
–4
–2
0
(a)
LBS 1·0–2·0100 kPa, 1 mm/h200 kPa, 1 mm/h300 kPa, 1 mm/h300 kPa, 3 mm/h300 kPa, 6 mm/h
100 kPa, 1 mm/h200 kPa, 1 mm/h300 kPa, 1 mm/h300 kPa, 3 mm/h300 kPa, 6 mm/h
100 kPa, 1 mm/h200 kPa, 1 mm/h300 kPa, 1 mm/h300 kPa, 3 mm/h300 kPa, 6 mm/h
εγ : %
0 5 10 15
(b)εγ : %
0 5 10 15
(c)εγ : %
0
100 000
200 000
300 000
400 000
500 000
0 5 10 15 20 25Cumulative boundary work: J
0
100 000
200 000
300 000
400 000
500 000
(f)
0
20 000
40 000
60 000
80 000
100 kPa, 1 mm/h200 kPa, 1 mm/h300 kPa, 1 mm/h300 kPa, 3 mm/h300 kPa, 6 mm/h
100 kPa, 1 mm/h200 kPa, 1 mm/h300 kPa, 1 mm/h300 kPa, 3 mm/h300 kPa, 6 mm/h
100 kPa, 1 mm/h200 kPa, 1 mm/h300 kPa, 1 mm/h300 kPa, 3 mm/h300 kPa, 6 mm/h
0 5 10 15
(d)εγ : %
0 5 10 15
(e)εγ : %
Cum
ulat
ive
AE
: RD
CC
umul
ativ
e A
E: R
DC
ΔA
E/Δ
W: R
DC
/J
Vol
umet
ric w
ork:
JD
isto
rtion
al w
ork:
JB
ound
ary
wor
k: J
Fig. 14. Measurements plotted against shear strain (%) from drained triaxial shearing tests performed on LBS 1·0–2·0 (tests 7–11): (a) boundarywork (J); (b) distortional work (J); (c) volumetric work (J); (d) cumulative AE (RDC); (e) AE generated per increment of boundary work(RDC/J); (f) cumulative AE (RDC) plotted against cumulative boundary work (J) relationships
y = 25 114xR2 = 0·89
Regressionfor all
y = 19 771xR2 = 0·96
Regression excludingLBS 0·25–3·35
0
1000
2000
3000
4000
5000
6000
7000
0 0·05 0·10 0·15Boundary work rate: J/min
LBS 0·25–0·71LBS 0·6–1·18LBS 1·0–2·0LBS 2·0–3·35LBS 0·25–3·35
y = 365 851x1·84
R2 = 0·69
0
500
1000
0 0·01 0·02 0·03
y = 34 782xR2 = 0·97
y = 467 173x1·71
R2 = 0·58
0
1000
2000
3000
4000
5000
6000
7000
0 0·02 0·04 0·06 0·08 0·10 0·12 0·14Boundary work rate: J/min
(c)
(a)
LBS 0·25–0·71LBS 0·6–1·18LBS 1·0–2·0LBS 2·0–3·35LBS 0·25–3·35
0
500
1000
0 0·01 0·02 0·03
Regression forLBS 0·25–3·35
y = 32 128xR2 = 0·98
AE
rate
: RD
C/m
in
y = 17 121xR2 = 0·96
0
1000
2000
3000
4000
5000
6000
7000
0 0·05 0·10 0·15 0·20Boundary work rate: J/min
LBS 0·25–0·71LBS 0·6–1·18LBS 1·0–2·0LBS 2·0–3·35LBS 0·25–3·35
y = 199 370x1·70
R2 = 0·73
0
500
1000
0 0·01 0·02 0·03
(b)
AE
rate
: RD
C/m
in
AE
rate
: RD
C/m
in
Fig. 15. Average AE rate (RDC/min) measurements plotted against average boundary work rate (J/min) measurements (tests 1–15) at:(a) volume minimum; (b) peak dilatancy; (c) post-peak
SMITH AND DIXON1118
Downloaded by [ LOUGHBOROUGH UNIVERSITY] on [04/12/19]. Published with permission by the ICE under the CC-BY license
y = 2·95x – 24·75R2 = 0·59
0
1
2
3
4
5
6
7
8
9
7·6 8·1 8·6 9·1
AE
rate
: RD
C/m
in/p':
kPa
CN
LBS 0·25–0·71LBS 0·6–1·18LBS 1·0–2·0LBS 2·0–3·35LBS 0·25–3·35
y = 0·74x – 5·67R2 = 0·40 y = 0·92x – 6·59
R2 = 0·400
1
2
3
4
5
6
7
8
9
7·6 8·1 8·6 9·1A
E ra
te: R
DC
/min
/p':
kPa
CN
LBS 0·25–0·71LBS 0·6–1·18LBS 1·0–2·0LBS 2·0–3·35LBS 0·25–3·35
0
1
2
3
4
5
6
7
8
9
7·6 8·1 8·6 9·1
AE
rate
: RD
C/m
in/p':
kPa
CN
LBS 0·25–0·71LBS 0·6–1·18LBS 1·0–2·0LBS 2·0–3·35LBS 0·25–3·35
(a) (b) (c)
Incr
easi
ng d
ispl
acem
ent r
ate
3 mm/h
6 mm/h
Incr
easi
ng d
ispl
acem
ent r
ate
3 mm/h
6 mm/h
Incr
easi
ng d
ispl
acem
ent r
ate
3 mm/h
6 mm/h
3 mm/h
6 mm/h
Fig. 16. Average AE rate (RDC/min) measurements normalised by the current mean effective stress plotted against coordination number (CN)(tests 1–15) at: (a) volume minimum; (b) peak dilatancy; (c) post-peak
y = 67 231x – 562 585R2 = 0·57
0
10 000
20 000
30 000
40 000
50 000
7·6 8·1 8·6 9·1CN
LBS 0·25–0·71LBS 0·6–1·18LBS 1·0–2·0LBS 2·0–3·35LBS 0·25–3·35
y = 18 389x – 141 876R2 = 0·46
y = 18 783x – 134 922R2 = 0·63
0
10 000
20 000
30 000
40 000
50 000
7·6 8·1 8·6 9·1CN
LBS 0·25–0·71LBS 0·6–1·18LBS 1·0–2·0LBS 2·0–3·35LBS 0·25–3·35
0
10 000
20 000
30 000
40 000
50 000
7·6 8·1 8·6 9·1CN
LBS 0·25–0·71LBS 0·6–1·18LBS 1·0–2·0LBS 2·0–3·35LBS 0·25–3·35
(a) (b) (c)
ΔA
E/Δ
W: R
DC
/J
ΔA
E/Δ
W: R
DC
/J
ΔA
E/Δ
W: R
DC
/J
Fig. 17. Average AE generated per increment of boundary work (RDC/J) plotted against coordination number (CN) (tests 1–15) at:(a) volume minimum; (b) peak dilatancy; (c) post-peak
0
500
1000
1500
2000
2500
3000
3500
0 100 200 300p': kPa
LBS 1·0-2·0 load–unload–reload
Unload
ReloadCum
ulat
ive
AE
: RD
C
Fig. 18. Cumulative (AE) RDC plotted against mean effective stress(kPa) measurements for isotropic load–unload–reload cycles of cellpressure performed on LBS 1·0–2·0 (test 16)
0
20 000
40 000
60 000
80 000
100 000
120 000
140 000
0 200 400 600 800 1000 1200q: kPa
0200400600800
10001200
0 10 20 30 40
q: k
Pa
Time: min
UnloadReload
LBS 1·0–2·0load–unload–reload
Cum
ulat
ive
AE
: RD
C
Fig. 19. Cumulative (AE) RDC plotted against deviator stress (kPa)measurements for load–unload–reload cycles of deviator stress (kPa)performed on LBS 1·0–2·0 at an effective confining pressure of300 kPa and axial displacement rate of 6 mm/h. The inset showsdeviator stress (kPa) plotted against time (test 16)
ACOUSTIC EMISSION BEHAVIOUROF DENSE SANDS 1119
Downloaded by [ LOUGHBOROUGH UNIVERSITY] on [04/12/19]. Published with permission by the ICE under the CC-BY license
methodologies: negligible AE could mean that the system isstable with no change to the stress state, or it could mean thatthe stress state has not reached the maximum that the systemhas been exposed to in the past.
The authors propose that future research into the AEbehaviour of soils should progress in the following directions:(a) use of simple shear apparatus for greater control overthe distribution of shear strains within specimens, whichis more variable with conventional triaxial apparatus(i.e. variable failure modes between loose and densespecimens); (b) development of AE generation contact lawsfor discrete-element modelling, which will enable detailedinvestigation of fabric evolution and particle-scale inter-actions; and (c) use of artificial intelligence (e.g. deeplearning) to develop automated interpretation of AEmeasurements.
CONCLUSIONSThis study has gone beyond the state-of-the-art and
established quantitative interpretation of AE generated byparticulate materials. This new knowledge will enable use ofAEmonitoring to provide early warning of serviceability andultimate limit state failures in the field. It also demonstrates
that innovative AE instrumentation and measurement canenhance insights into element and physical model tests in thelaboratory. Results from a programme of drained triaxialtests on dense sands show the following points.
(a) AE rates generated by particulate materials areproportional to the imposed stress level, strain rate,fabric coordination number (estimated from anempirical relationship with void ratio in the researchreported here) and the boundary work done.
(b) There are two types of AE response at the transitionfrom contractive to dilative behaviour, which wasgoverned by the mean particle size.
(c) AE activity in particulate materials is negligible untilthe current stress conditions (compression and/orshear) exceed the maximum that has been experiencedin the past, due to the Kaiser effect.
(d ) Relationships between AE and boundary work (i.e.RDC generated per Joule) have been quantified for aunit volume of sand under isotropic compression andshear, which show that dense sands in shear generategreater RDC/J than they do in isotropic compression.
(e) Relationships have also been quantified between AErates, b-value and shear strain rate, enablinginterpretation of accelerating deformation behaviourthat typically ensues following mobilisation of peakshear strength in a body of soil.
( f ) An example interpretation framework has beenpresented that combines AE rate and b-valuemeasurements to identify the transition fromcontractive to dilative behaviour (i.e. q/p′=M),mobilisation of peak shear strength and quantifysubsequent accelerating deformation behaviour thattypically accompanies shear zone development.
ACKNOWLEDGEMENTSThe authors acknowledge the excellent technical assist-
ance provided by Mr Lewis Darwin and the LoughboroughMaterials Characterisation Centre. Alister Smith gratefullyacknowledges the support of an EPSRC Fellowship(Listening to Infrastructure, EP/P012493/1). Data reportedin this study can be made available by the authors on request.
NOTATIONA AE waveform amplitudeB Skempton’s pore pressure parameter
b-value measure of the proportion of low and high magnitudeevents in an AE waveform
Cc coefficient of curvatureCu coefficient of uniformityDr relative density (%)
emax maximum void ratioemin minimum void ratioM frictional constant defining the slope of the critical state
line in q–p′ space (6sinϕ′crit/3� sinϕ′crit)m log-scale measure of AE magnitudep′ mean effective stress (kPa)q deviator stress (kPa)
Ra roughness average, the arithmetic average of theabsolute values of the profile heights over the evaluationlength (μm)
Rq root-mean-square roughness, the root mean squareaverage of the profile heights over the evaluationlength (μm)
Rz average maximum height of the profile, the average of thesuccessive values of the vertical distance between thehighest and lowest points of the profile within a samplinglength calculated over the evaluation length (μm)
= 0
0
0·001
0·002
0·003
0100020003000400050006000
AE
rate
: RD
C/m
in
–800
–600–400
–200
0
200
400
q/p'
Time
0
0·5
1
b-va
lue
q/p'max
M
Contraction DilationAcceleratingdeformation behaviour
AE
rate
: RD
C/m
in ×
Δb-
valu
eε γ:
min
–1
δεγ
δεvol
= maxδεγ
δεvol
εvol
Fig. 20. Example use of AE for interpreting pre- and post-peak shearstrength mobilisation and accelerating deformation behaviour. Theexample is based on measurements from LBS 1·0–2·0 at an effectiveconfining pressure of 300 kPa and using the AE plotted against shearstrain rate relationships in Fig. 13
SMITH AND DIXON1120
Downloaded by [ LOUGHBOROUGH UNIVERSITY] on [04/12/19]. Published with permission by the ICE under the CC-BY license

ΔW increment of work done per unit volume transmitted tothe soil skeleton across its boundaries (i.e. boundary work)
ΔWd increment of distortional work per unit volumeΔWv increment of volumetric work per unit volume
εa axial strainεq deviatoric strain ((2/3)εγ¼ (2/3)(εa� εr)¼ εa� (1/3)εvol)εr radial strain
εvol volumetric strainεγ shear strain (εa� εr¼ (1/2)(3εa� εvol))ε̇γ shear strain rate (min�1)
ρdrymaxmaximum dry density (Mg/m3)
ρdryminminimum dry density (Mg/m3)
ρs particle density (Mg/m3)σ′r radial effective stress (kPa)ϕμ inter-particle friction angleϕ′cv constant volume friction angleϕ′p peak effective friction angleψ state parameter
REFERENCESArthur, J. R. F. & Menzies, B. (1972). Inherent anisotropy in a sand.
Géotechnique 22, No. 1, 115–128, https://doi.org/10.1680/geot.1972.22.1.115.
Been, K. & Jefferies, M. G. (1985). A state parameter for sands.Géotechnique 35, No. 2, 99–112, https://doi.org/10.1680/geot.1985.35.2.99.
Been, K. & Jefferies, M. G. (1986). Discussion: a state parameter forsands. Géotechnique 36, No. 1, 123–132, https://doi.org/10.1680/geot.1986.36.1.123.
Been, K., Jefferies, M. G. &Hachey, J. (1991). Critical state of sands.Géotechnique 41, No. 3, 365–381, https://doi.org/10.1680/geot.1991.41.3.365.
Berg, N., Smith, A., Russell, S., Dixon, N., Proudfoot, D. &Take, W. A. (2018). Correlation of acoustic emissions withpatterns of movement in an extremely slow moving landslide atPeace River, Alberta, Canada. Can. Geotech. J. 55, No. 10,1475–1488, https://doi.org/10.1139/cgj-2016-0668.
Bishop, A. W. &Wesley, L. D. (1975). A hydraulic triaxial apparatusfor controlled stress path testing. Géotechnique 25, No. 4,657–670, https://doi.org/10.1680/geot.1975.25.4.657.
Bolton, M. D. (1986). The strength and dilatancy of sands.Géotechnique 36, No. 1, 65–78, https://doi.org/10.1680/geot.1986.36.1.65.
Bolton, M. D. (2003). A guide to soil mechanics. London, UK:Universities Press.
BSI (2016). BS EN ISO 17892: Geotechnical investigation andtesting – laboratory testing of soil. London, UK: BSI.
Cavarretta, I., Coop, M. & O’Sullivan, C. (2010). The influence ofparticle characteristics on the behaviour of coarse grained soils.Géotechnique 60, No. 6, 413–423, https://doi.org/10.1680/geot.2010.60.6.413.
Cavarretta, I., Rocchi, I. & Coop, M. R. (2011). A new interparticlefriction apparatus for granular materials. Can. Geotech. J. 48,No. 12, 1829–1840.
Chang, C. S., Misra, A. & Sundaram, S. S. (1990). Micromechanicalmodelling of cemented sands under low amplitude oscillations.Géotechnique 40, No. 2, 251–263, https://doi.org/10.1680/geot.1990.40.2.251.
Cho, G. C., Dodds, J. & Santamarina, J. C. (2006). Particle shapeeffects on packing density, stiffness, and strength: natural andcrushed sands. J.Geotech.Geoenviron. Engng 132,No. 5, 591–602.
Cui, L. & O’Sullivan, C. (2006). Exploring the macro- andmicro-scale response of an idealised granular material in thedirect shear apparatus. Géotechnique 56, No. 7, 455–468,https://doi.org/10.1680/geot.2006.56.7.455.
Cui, L., O’Sullivan, C. & O’Neill, S. (2007). An analysis of thetriaxial apparatus using a mixed boundary three-dimensionaldiscrete element model. Géotechnique 57, No. 10, 831–844,https://doi.org/10.1680/geot.2007.57.10.831.
Cundall, P. A. & Strack, O. D. (1979). A discrete numerical modelfor granular assemblies. Géotechnique 29, No. 1, 47–65,https://doi.org/10.1680/geot.1979.29.1.47.
Desrues, J., Chambon, R., Mokni, M. & Mazerolle, F. (1996). Voidratio evolution inside shear bands in triaxial sand specimens
studied by computed tomography. Géotechnique 46, No. 3,529–546, https://doi.org/10.1680/geot.1996.46.3.529.
Dixon, N., Kavanagh, J. & Hill, R. (1996). Monitoring landslideactivity and hazard by acoustic emission. J. Geol. Soc. China 39,No. 4, 437–464.
Dixon, N., Spriggs, M. P., Smith, A., Meldrum, P. & Haslam, E.(2015a). Quantification of reactivated landslide behaviour usingacoustic emission monitoring. Landslides 12, No. 3, 549–560.
Dixon, N., Smith, A., Spriggs, M., Ridley, A., Meldrum, P. &Haslam, E. (2015b). Stability monitoring of a rail slope usingacoustic emission. Proc. Instn Civ. Engrs – Geotech. Engng 168,No. 5, 373–384, https://doi.org/10.1680/jgeen.14.00152.
Dixon, N., Smith, A., Flint, J. A., Khanna, R., Clark, B. &Andjelkovic, M. (2018). An acoustic emission landslide earlywarning system for communities in low-income andmiddle-income countries. Landslides 15, No. 8, 1631–1644,https://doi.org/10.1007/s10346-018-0977-1.
Garga, V. K. & Chichibu, A. (1990). A study of AE parametersand shear strength of sand. Progress in acoustic emission V 10thacoustic emission symposium, Sendai, Japan, vol. 5, pp. 129–136.
Hanley, K. J., Huang, X. & O’Sullivan, C. (2017). Energydissipation in soil samples during drained triaxial shearing.Géotechnique 68, No. 5, 421–433, https://doi.org/10.1680/jgeot.16.P.317.
Hasan, A. & Alshibli, K. A. (2010). Experimental assessment of 3Dparticle-to-particle interaction within sheared sand using syn-chrotron microtomography. Géotechnique 60, No. 5, 369–379,https://doi.org/10.1680/geot.2010.60.5.369.
Head, K. H. (1986).Manual of laboratory testing, volume 3: effectivestress tests. London, UK: ELE International Ltd.
Ibraim, E., Luo, S. & Diambra, A. (2017). Particle soil crushing:passive detection and interpretation. In Proceedings of the 19thinternational conference on soil mechanics and geotechnicalengineering (eds W. Lee, J.-S. Lee, H.-K. Kim and D.-S. Kim),pp. 389–392. London, UK: International Society for SoilMechanics and Geotechnical Engineering.
Koerner, R. M., Lord, A. E. Jr., Mccabe, W. M. & Curran, J. W.(1976). Acoustic emission behavior of granular soils. J. Geotech.Geoenviron. Engng 102, No. 7, 761–773.
Koerner, R. M., Lord, A. E. Jr. & McCabe, W. M. (1978). Acousticemission monitoring of soil stability. J. Geotech. Geoenviron.Engng 104, No. 5, 571–582.
Koerner, R. M., McCabe, W. M. & Lord, A. E. (1981). Acousticemission behavior and monitoring of soils. In Acoustic emissionsin geotechnical engineering practice (eds V. P. Drnevich andR. E. Gray), ASTM STP 750, pp. 93–141. West Conshohocken,PA, USA: ASTM International.
Koerner, R. M., Lord, A. E. Jr & Deutsch, W. L. (1984).Determination of prestress in granular soils using AE.J. Geotech. Engng 110, No. 3, 346–358.
Krumbein, W. C. & Sloss, L. L. (1963). Stratigraphy and sedimen-tation, 2nd edn. San Francisco, CA, USA: Freeman andCompany.
Lavrov, A. (2003). The Kaiser effect in rocks: principles and stressestimation techniques. Int. J. Rock Mech. Min. Sci. 40, No. 2,151–171.
Lin,W., Mao,W., Koseki, J. & Liu, A. (2018). Frequency response ofacoustic emission to characterize particle dislocations in sandysoil. In Proceedings of GeoShanghai international conference:fundamentals of soil behaviours (eds A. Zhou, J. Tao, X. Gu andL. Hu), pp. 689–697. Singapore: Springer.
López-Querol, S. & Coop, M. R. (2012). Drained cyclic behaviourof loose Dogs Bay sand. Géotechnique 62, No. 4, 281–289,https://doi.org/10.1680/geot.8.P.105.
Mao, W. & Towhata, I. (2015). Monitoring of single-particlefragmentation process under static loading using acousticemission. Appl. Acoust. 94, 39–45.
Mao, W., Aoyama, S., Goto, S. & Towhata, I. (2015). Acousticemission characteristics of subsoil subjected to vertical pileloading in sand. J. Appl. Geophys. 119, 119–127.
Mao, W., Aoyama, S., Goto, S. & Towhata, I. (2016). Behaviour andfrequency characteristics of acoustic emissions from sandyground under model pile penetration. Near Surf. Geophys. 14,No. 6, 515–525.
Mao, W., Aoyama, S. & Towhata, I. (2018a). Feasibility study ofusing acoustic emission signals for investigation of pile
ACOUSTIC EMISSION BEHAVIOUROF DENSE SANDS 1121
Downloaded by [ LOUGHBOROUGH UNIVERSITY] on [04/12/19]. Published with permission by the ICE under the CC-BY license
spacing effect on group pile behaviour. Appl. Acoust. 139,189–202.
Mao,W., Yang, Y., Lin, W., Aoyama, S. & Towhata, I. (2018b). Highfrequency acoustic emissions observed during model pilepenetration in sand and implications for particle breakagebehavior. Int. J. Geomech. 18, No. 11, 04018143.
Michlmayr, G. & Or, D. (2014). Mechanisms for acoustic emissionsgeneration during granular shearing. Granular Matter 16, No. 5,627–640.
Michlmayr, G., Cohen, D. & Or, D. (2013). Shear-induced forcefluctuations and acoustic emissions in granular material.J. Geophys. Res.: Solid Earth 118, No. 12, 6086–6098.
Michlmayr, G., Chalari, A., Clarke, A. & Or, D. (2017). Fiber-optichigh-resolution acoustic emission (AE) monitoring of slopefailure. Landslides 14, No. 3, 1139–1146.
Mirghasemi, A. A., Rothenburg, L. & Matyas, E. L. (2002).Influence of particle shape on engineering properties ofassemblies of two-dimensional polygon-shaped particles.Géotechnique 52, No. 3, 209–217, https://doi.org/10.1680/geot.2002.52.3.209.
Mitchell, R. J. & Romeril, P. M. (1984). Acoustic emission distressmonitoring in sensitive clay.Can. Geotech. J. 21, No. 1, 176–180.
Muir Wood, D. (1990). Soil behaviour and critical state soilmechanics. Cambridge, UK: Cambridge University Press.
Naderi-Boldaji, M., Bahrami, M., Keller, T. & Or, D. (2017).Characteristics of acoustic emissions from soil subjected toconfined uniaxial compression. Vadose Zone J., https://doi.org/10.2136/vzj2017.02.0049.
Oda, M. (1972). Initial fabrics and their relations to mechanicalproperties of granular material. Soils Found. 12, No. 1, 17–36.
Oda, M. (1977). Co-ordination number and its relation to shearstrength of granular material. Soils Found. 17, No. 2, 29–42.
Pollock, A. A. (1973). Acoustic emission-2: acoustic emissionamplitudes. Non-Destructive Testing 6, No. 5, 264–269.
Powrie, W. (2013). Soil mechanics: concepts and applications.Boca Raton, FL, USA: CRC Press.
Sadrekarimi, A. & Olson, S. M. (2011). Critical state friction angleof sands. Géotechnique 61, No. 9, 771–783, https://doi.org/10.1680/geot.9.P.090.
Senetakis, K., Coop, M. R. & Todisco, M. C. (2013). Theinter-particle coefficient of friction at the contacts of LeightonBuzzard sand quartz minerals. Soils Found. 53, No. 5, 746–755.
Shiotani, T. & Ohtsu, M. (1999). Prediction of slope failure based onAE activity. In Acoustic emission: standards and technologyupdate (ed. S. J. Vahaviolos), pp. 156–172. West Conshohocken,PA, USA: ASTM International.
Skempton, A. W. (1954). The pore-pressure coefficients A and B.Géotechnique 4, No. 4, 143–147, https://doi.org/10.1680/geot.1954.4.4.143
Smith, A. & Dixon, N. (2015). Quantification of landslide velocityfrom active waveguide–generated acoustic emission. Can.Geotech. J. 52, No. 4, 413–425.
Smith, A., Dixon, N., Meldrum, P., Haslam, E. & Chambers, J.(2014). Acoustic emission monitoring of a soil slope: compari-sons with continuous deformation measurements. GéotechniqueLett. 4, No. 4, 255–261, https://doi.org/10.1680/geolett.14.00053.
Smith, A., Dixon, N. & Fowmes, G. (2017). Early detection offirst-time slope failures using acoustic emission measurements:large-scale physical modelling. Géotechnique 67, No. 2,138–152, https://doi.org/10.1680/jgeot.15.P.200.
Tanimoto, K. & Nakamura, J. (1981). Studies of acoustic emissionin soils. In Acoustic emissions in geotechnical engineeringpractice (eds V. P. Drnevich and R. E. Gray), ASTM STP 750,pp. 164–173. West Conshohocken, PA, USA: ASTMInternational.
Tanimoto, K. & Tanaka, Y. (1986). Yielding of soil as determined byacoustic emission. Soils Found. 26, No. 3, 69–80.
Wan, R. G. & Guo, P. J. (2004). Stress dilatancy and fabricdependencies on sand behavior. J. Engng Mech. 130, No. 6,635–645.
Yang, J. & Li, X. S. (2004). State-dependent strength of sands fromthe perspective of unified modeling. J. Geotech. Geoenviron.Engng 130, No. 2, 186–198.
Zheng, J. & Hryciw, R. D. (2015). Traditional soil particle sphericity,roundness and surface roughness by computational geometry.Géotechnique 65, No. 6, 494–506, https://doi.org/10.1680/geot.14.P.192.
SMITH AND DIXON1122
Downloaded by [ LOUGHBOROUGH UNIVERSITY] on [04/12/19]. Published with permission by the ICE under the CC-BY license