Embed Size (px)
Citation preview

De! Sci J, Vol 40, No 1, January 1990, pp 55-70
Acoustic Emission and Signal Analysis
A.K. Rao
Department of Aerospace Engineering, Indian Institute of Science, Bangalore-560 on
ABSTRACT
Acoustic emission (AE) is one of the most recent entries into thefield of nondestructive evaluation. Due to the uniqueness of the basicprinciple and the potential for tackling a wide range of applications,the technique has gone through rapid strides in a very short time. Thus,today, two decades after the first application of the technique, AE isused in various industries, such as petro-chemical, refinery , nuclear ,transportation and aerospace. While, some of the applications can bedealt with by current state-of-the-art, through simple methods ofmeasurement and analysis, the entire potential of the technique stillremains to be exploited as extraction of complete information containedin the signal is not possible with the adaption of only simple dataanalysis procedures. Currently several scientists in many countries areinvolved in evolving and~mplementing advanced concepts for AE signalanalysis. These along with the approach adopted by us are discussedin this paper .
I. SOME ASPECTS OF ACOUSTIC EMISSION
1.1 The Phenomenon
Acoustic emissions are pressure waves generated due to transient release of
energy when a material is subjected to mechanical, thermal or chemical changescausing irreversible deformations or changes in atomic arrangement. Cracking oftimber, tin cry , noise generated before rock and mine collapses are some of theexamples of acoustic emission (AB) which have been intuitively utilized as warningsignals. Local dynamic movements such as initiation and propagation of cracks,twinning, slip dislocation movements, phase transformation, and fusion (welding) are
Received 20 January, 1990
55
56 A K Rao
'ITransient energyl
release
Pressure waves
I Propagation
material
Distortion ani
A E wave at the
surface
Couplont ,
~ t-i Itratian and
\amplif~n
[ Data
acqui~
Transducer!Anolysis
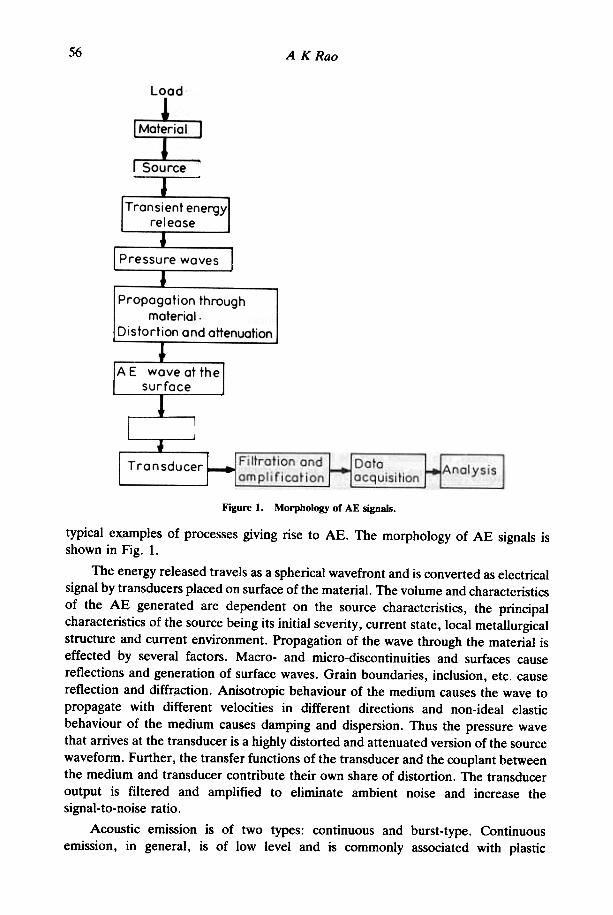
Figure I. Morphology of AE signals.
typical examples of processes giving rise to AE. The morphology of AE signals isshown in Fig. 1.
The energy released travels as a spherical wavefront and is converted as electrical
signal by transducers placed on surface of the material. The volume and characteristicsof the AE generated are dependent on the source characteristics, the principal
characteristics of the source being its initial severity, current state, local metallurgicalstructure and current environment. Propagation of the wave through the material iseffected by several factors. Macro- and micro-discontinuities and surfaces causereflections and generation of surface waves. Grain boundaries, inclusion, etc. causereflection and diffraction. Anisotropic behaviour of the medium causes the wave topropagate with different velocities in different directions and non-ideal elasticbehaviour of the medium causes damping and dispersion. Thus the pressure wavethat arrives at the transducer is a highly distorted and attenuated version of the sourcewaveform. Further, the transfer functions of the transducer and the couplant betweenthe medium and transducer contribute their own share of distortion. The transduceroutput is filtered and amplified to eliminate ambient noise and increase thesignal-to-noise ratio.
Acoustic emission is of two types: continuous and burst-type. Continuousemission, in general, is of low level and is commonly associated with plastic
through
d attenuatian
Acoustic Emission and Signal Analysis ~7
deformation, grain boundary sliding and dislocation movements in crystal lattices.Some of the common examples of burst-type emissions are crack advancement,twinning, phase transformations (for example, martensite formation in carbon steel).Emissions from a material can contain a combination of both of these two types.
The first scientific investigation of AE phenomenon was reported in 1948 byShockley et al.l. First pioneering work using electronic instrumentation was done in1950 by Joseph Kaise~ who observed that AE was an irreversible phenomenon, inthat repetitive loading does not lead to repetition of emissions.
The work by Shoefield3 and Tatro4 in the mid 1950s did much to improveinstrumentation and bette~ understanding of AE sources. However, in this decadevery little work was reported. In the early 1960s AE caught the attention of manyworkers. Significant advancements were made in this decade in AE signal processingand instrumentation which hastened its growth as a viable nondestructive evaluation(NDE) method. First commercial equipment was developed and a number of reportson AE applications appeared5,6. In the seventies AE technology enjoyed a vigorousgrowth and today AE literature spreads over thousands of papers, numerous booksand monographs. For qui<::k reference bibliographies with abstracts have been broughtout7. Special technical publications5,8 reviews by Lord6,9, Kanji OnolO and Wadleyand Scurbyl2 are valuable references.
1.2 Applications
The first practical application of AE was during the hydrotesting of Polaris missilechambers. Since then it has gained wide recognition as an active NDE tool. One ofthe first areas of applications is the study of plastic deformation, crack initiatiqn andextension in materials. Currently, AE is being increasingly used to detect and locateflaws in metallic and composite structures and has emerged as a valuable tool infracture mechanics studies.
In industry, AE technology is used for testing and monitoring a wide variety ofstructures and components ranging from simple fluid transmission pipelines to largenuclear pressure vessels. Some of the other industrial applications are loose "partkledetection, leak testing, weld and drill monitoring and corrosion detection in metals.
In the field of rock mechanics AE has emerged as a useful tool for field studieson geologic structures.
1.3 Typical AE Instrumentation
Typical AE equipment consists of signal detection, data (signal) acquisition,processing and analysis units. Most commonly used AE sensors are piezoelectrictransducers. Resonant types are used with narrow band instrumentation andnonresonant types with wide band instrumentation. Transducers based on opticalinterferometry principle using laser beams are currently under study. The transduceris followed by a preamplifier -amplifier combination giving up to 100 dB totalamplification. If filtering is desired it is generally included as an interstage in thepreamplifier unit itself. To cater fora wide frequency range of experimentation, AEpreamplifiers are generally designed for wide bandwidth.

58 A KRao
The signal can be displayed on a cathode ray oscilloscope screen to get a
preliminary idea of the activity. To characterise the source mechanism, informationcontained in the signal can be extracted and interpreted either online or off-line.Different options of AE signal analysis are shown in Fig. 2. For off-line analysis andinterpretation, the signals can be recorded on analog magnetic recorders; the advantagebeing the availability of raw signals for analysis. Alternatively, the data can also bestored on digital recorders after digitization. Currently, a number of
microcomputer-based integrated real-time AE monitoring systems are commerciallyavailable. These systems have software for signal parameter extraction and distribution
analysis.
D~<?:VAmplifier
Analoguerecording IOigitisatian
Off- I i ne
analysis Feature
extraction
Digital
recording
Onlineanalysis
Off-lineanalysis
Figure 2. Options for AE analysis systems.
1.4 Signals
Acoustic emission bursts are transient in nature and hence are broad in spectralcontent. But due to resonances of the transducer and the component, AE signal
(transducer output) becomes oscillatory. While a signal due to a burst-type emissionevent can be approximated by decaying sinusoid (Fig. 3(a», continuous emissionevents occur so rapidly that a sustained signal (Fig. 3(b» is observed. Ambient noiseslimit measurements in the audio range. On the other hand, attenuation problems areencountered in the higher frequency range. So, the usual frequency range of AEexperimentation is in the 100 kHz to 5 MHz band. Within this frequency range forsensitivity and to avoid noise, resonant transducers are utilized in association withnarrow band filters (for example, 125 to 250 kHz). However, this approach has thedisadvantage of loosing signal content at frequencies other than the considered band.There are certain mechanical and hydraulic noises which have broad spectral contentlike acoustic emission events. In such cases it is desirable to have wide band operationand determine characteristic spectral features of AE bursts which can be used todiscriminate them from noise signalsl2.

59Acoustic Emission and Signal Analysis
BURST -TYPE EM ISSION(a)
CONTINUOUS EMISSION(b)
Two types or AE signals .Figure 3.
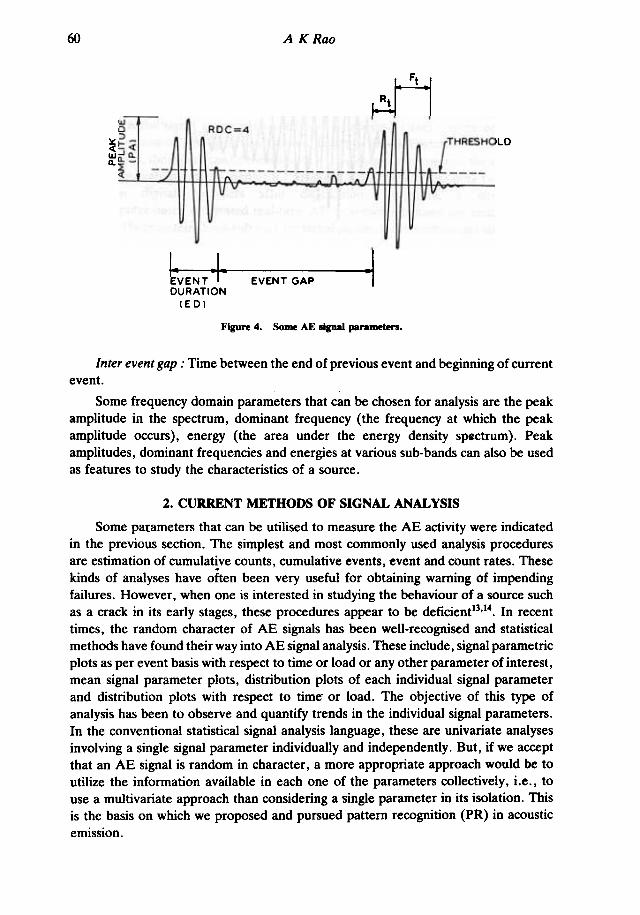
Figure 4 shows a typical AE signal due to burst-type emission and the parameterscommonly used for analysis. These are explained below:
Threshold (V J : In burst-type AE, the threshold voltage level ~ is generally setto distinguish signal from noise. An AE event is counted only if the signal crosses
the threshold level V,.Ring down count (RDC) : Number of times the signal crosses the threshold ~.
Event duration (ED) : The beginning of an event is marked when the envelopeof the signal crosses the threshold ~ and the end is marked when it falls below thethreshold. Event duration is the time difference between the beginning and ending
of an event.Peak amplitude (PA) : Highest amplitude attained by signal in an event.
Rise time (RT) : Time taken for signal to reach peak amplitude from the time it
first crosses the threshold.Energy ( Ee) : The area under time versus amplitude squared curve for an event.
Fall time (Ff) : Difference between the time when peak amplitude occurs and
end of event.
60 A KRao
~~
~ I101O:>
~I--<-<J Q.
Q.-
~
RDC=4
l:~~:OLD
~
kENT .1. EVENT GAP ~DURATION
IEDI
FIgure 4. Some AE signal parameters.
Inter event gap: Time between the end of previous event and beginning of currentevent.
Some frequency domain parameters that can be chosen for analysis are the peakamplitude in the spectrum, dominant frequency (the frequency at which the peakamplitude occurs), energy (the area under the energy density spectrum). Peakamplitudes, dominant frequencies and energies at various sub-bands can also be usedas features to study the characteristics of a source.
2. CURRENT METHODS OF SIGNAL ANAL YSIS
Some parameters that can be utilised to measure the AE activity were indicatedin the previous section. The simplest and most commonly used analysis proceduresare estimation of cumulat~ve counts, cumulative events, event and count rates. Thesekinds of analyses have often been very useful for obtaining warning of impendingfailures. However, when one is interested in studying the behaviour of a source suchas a crack in its early stages, these procedures appear to be deficienf3.14. In recenttimes, the random character of AE signals has been well-recognised and statisticalmethods have found their way into AE signal analysis. These include, signal parametricplots as per event basis with respect to time or load or any other parameter of interest,mean signal parameter plots, distribution plots of each individual signal parameterand distribution plots with respect to time- or load. The objective of this type ofanalysis has been to observe and quantify trends in the individual signal parameters.In the conventional statistical signal analysis language, these are univariate analysesinvolving a single signal parameter individually and independently. But, if we acceptthat an AE signal is random in character, a more appropriate approach would be toutilize the information avail:lble in each one of the parameters collectively, i.e. , touse a multivariate approach than considering a single parameter in its isolation. Thisis the basis on which we proposed and pursued pattern recognition (PR) in acousticemission.
a:
Acoustic Emission and Signal Analysis 61
An AB signal available for analysis is a distorted version of the source waveform.While the distorted version of the signal, v~riations in the behaviour of notionallyidentical sources and statistical aspects of the experimental conditions give a randomcharacter to an AB signal, the presence of pseudo AB sources and extraneous noisesignals further complicate the situation. Thus in some cases signal recognition itselfcan become a difficult task. Under these circumstances, the concept of PR whichlooks for meaningful regularities under otherwise confusing conditions has attractedthe attention of some investIgators in the AB community.
3. PATTERN CLASSIF1CATION OF AE SIGNALS
Pattern recognition by itself is a vast field. Often, the success of using the approachdepends upon understanding the data at hand and identifying a suitable method. In
the present context, we can start with a formulation that ABs are complaints generatedby materials in their own language and suggest the use of syntactic approach forunderstanding the phenomenon. But, this would be highly involved' and too difficultto handle as the basics of the kl:nguage itself are completely unknown. Thus, we are
left with statistical methods, either supervised or unsupervised, the underlying principlebeing extraction of implicit information from data which has statistical variations andis distorted and noisy. When we focus our attention on the general situationsencountered with AB data such as difficulties in generating a training set for analysis,the advantages of unsupervised methods outweigh the supervised methods.
Blsley and Graham15 first reported the application of PR to AB signal analysis.They used the peak amplitude in each of the seven chosen bands of the frequencyspectrum and the time of occurrence of an emission event as features to classify datafrom bending experiments on graphite epoxy composite coupons. Detection of theinherent classes (clusters) in the emission data was attempted by searching for dense
regions, well separated from one another, in the eight-dimensional feature space.
Hut ton et al.16 utilized PR to discriminate emission due to crack growth fromacoustic noise signals such as rubbing or fretting in fasteners with the objective of
automated detection of fatigue crack growth in aircraft structures. Using a combinationof time and frequency domain para~eters, they compared the performance of
commonly used classification. techniques Jike linear discriminant function, empiricalHayes estimation and K-nearest neighbour rule and obtained classification accuracy
ranging from 80 to 90 per cent.
Chan et al.17 demonstrated the utility of PR techniques by successful applicationof K-nearest neighbour rule, empirical Bayesian classification and linear discriminantfunction for identification of stress corrosion cracking in aluminium, stainless steeland alloy steel. Features were derived from time and frequency domain parameters
and statistical properties of the signals.
Michel et al.18 applied the ISODATA algorithm for analysis of acoustic signalsgenerated in sodium-cooled fast breeder reactor. Bae et al.19 also used the ISODA T Aalgorithm to classify AB signals generated during mechanical testing of two types offibre glass composite materials. They attempted to model the envelope of AB burstsby two different mathematical fu~ctions. Parameters obtained through least square
62 A K Rao
fit were used for clustering the data which do not lead to any conclusive results.However, when energies of various sub-frequency bands of 5 MHz width were usedas features, four distinct classes resulted.
Chan et aJ.20 applied linear discriminant function, minimum-distance classificationand K-nearest neighbour classification for sorting AE signals representing severalkinds of welding parameters under controlled shop conditions. Classificationexperiments were conducted with thirty waveform features, and also with the bestfeatures chosen from this set. Results revealed 95 per cent classification accuracy.
Murthy13 studied the feasibility of PR approach for AE signal classification throughseveral experiments with plain and defective tin and zircalloy specimens. Using acombination of time and frequency domain parameters, a heuristic clustering algorithmwas applied to classify signals obtained from a plain specimen and two specimens withdifferent initial crack lengths of tin and zircalloy.
Graham and Elslerl used energies in each of the seven chosen frequency bandsas detected by a single transducer and the ratios of the energies in these bands asdetected by two transducers, as features to classify signals due to fatigue crack growth,crack face rubbing and fretting. They could achieve an accuracy of more than 95 percent in discriminating fretting against crack growth or crack face rubbing using theratios of the spectral energies detected by the two transducers. An accuracy of morethan 90 per cent was achieved in separating crack growth events from crack facerubbing using spectral energies detected at either transducer separately.
The investigations discussed in the preceeding paragraphs indicate that they aremore or less feasibility studies with limited scope. The Bayesian scheme, K-nearestneighbour rule and linear discriminant functions used by Hut ton et aJ.16 and Chanet al.17.20 are supervised procedures. These procedures require a sufficiently large setof classified training samples truely representative of the various categories of signalsrepresenting different sources. In most of the AE signal classification problems,collection of such a training set is either impossible or impracticable due to thenon-availability of a priori information regarding the sources of the signals.
The unsupervised procedures (clustering) used by Elsley and Graham IS are
heuristic in nature and for practical AE signal analysis problems the computationalrequirements of these procedures may turn out to be prohibitive. Theminimum-distance classification method20 suffers from the drawback that its successdepends on the choice of characteristic prototypes or cluster centres in the given dataset. The ISODATA algorithm used by Michel et aJ.18 and Bae et al.19 requires anumber of process parameters that depend on the knowledge about the categorystructure of data to be specified. In the absence of such information, the investigatorhas to experiment with various values of the process parameters to arrive at meaningful
results.
4. APPLICATION OF AE IN AIRCRAFf COMPONENT MONITORING
Failure of structural members under the action of fluctuating loads is known as'fatigue failure'. A fatigue failure begins with a small crack. The crack usually nucleatesfrom a point of discontinuity in the material such as change in cross-section or a hole.
Acoustic Emission and Signal Analysis 63
Less obvious points at which fatigue cracks are likely to initiate are irregularitiescaused due to machining, inclusions, etc. A fatigue crack thus nucleated, can growto critical size due to fluctuating loads in service leading to catastrophe if it is notdetected and attended to at some stage before it becomes critical.
Fatigue crack growth in critical aircraft components like aero engine mountings,wing root attachments, undercarriage mountings, etc. during flight can lead tocatastrophic .failures. Cause of many fatal accidents in the past has been traced tofatigue crack growth. Even in the recent times, failure of critical aircraft structuresdue to cracks resulting in fatal accidents are not uncommon. So, there is a vital needto continuously monitor these structures to detect the existence of growing fatiguecracks. This demands a dynamic nondestructive testing (NDT) technique which cancontinuously monitor critical assemblies and give suitable early warning before apropagating crack reaches the limits of criticality.
Many of the conventional NDT techniques like radiography, eddy current andultrasonics are unsuited for detection of incipient cracks in some aircraft componentsbecause of their poor reliability and the laborious process of scanning the entirestructure. For example, a crack present in the bottom face of wing spar can ea~ily gounnoticed when the aircraft is on ground by any of the above mentioned techniques.Moreover, these techniques cannot be used in detecting cracks located in inaccessiblelocations in aircraft components such as wing root attachments, engine mountings,etc. Naturally a dynamic technique such as AB is the obvious answer. But, certainproblems prevent the direct usage of the technique in the current state-of-the-art andpreforce further investigations. Currently, some investigators in the area are involvedin investigation to address this problem.
A major problem with AB technique in the context of in-flight monitoring ofcritical aircraft components is that of detecting the true AB activity in the presenceof various spurious AB sources such as hydraulic noise, jet engine noise, aerodynamic
noise, electromagnetic interference, fretting, crack face rubbing, etc.
4.1 AE Monitoring during Fatigue Crack Growth in an Aero Engine Mount
An aero engine mount, a highly stressed structural member of an aircraft whichcan be treated for all practical purposes as a typical pin joint is considered for thepresent investigation. The complete experimental programme was planned and carriedout towards a Master of Engineering Project22.23. A study was carried out on differenttypes of aero engine mountings pertaining to Dart, Orpheus, RD-OF, RIIF, Goblin,AI-2O and Avon engines and a typical engine mount of a jet engine pertaining to afighter aircraft was chosen for the study. In the present context, though differentengine mounts differ in finer design details, most of these can be generalised intosimple pin joint type of structures. So, a simple version of the mount was designedkeeping in view the overall geometric features. Fine curvature and stepping in thefork end of engine mount were avoided. The simplified engine mount which is in twoparts, viz. , top bracket and bottom bracket secured by a centre pin is shown in Fig.5. Thus the problem when brought down to the laboratory scale should consist of twonoise sources, fretting (friction between pin and the hole periphery) and crack face

64 A K Roo
Figure 5. Aero engine mount.
rubbing (rubbing of crack surface due to crack tip plasticity effects), in addition tothe true AB activity due to crack growth.
4.2 Experimental Program
Three simulated aero engine mounts were fabricated with EN-24 (SAE 4340)material. To obtain illustrative data for understanding the basic characteristics of thematerial in relation to AE as well as to decide about the instrument settings, tensiletests were also carried out. Further, the tensile tests also included experiments designedfor obtaining fretting data separately. The.engine mounts were subjected to constantamplitude fatigue cycling using a servo-hydraulic test system (MTS) (Fig. 6). AE datawas picked up by using a 375 kHz resonant transducer, and was recorded on winchester{floppy diskettes utili sing AET -5000 system. The sensors were mounted on oppositefaces on the bottom bracket of the engine mount well close to the centre bolt, thelikely zone of fatigue crack initiation. Fretting characteristics were obtained fromfatigue tests on engine mounts by suppressing the signals due to fretting with theapplication of grease and use of teflon tape on the pin and noting down thecharacteristics of the events that were eliminated. Further different load ratios were
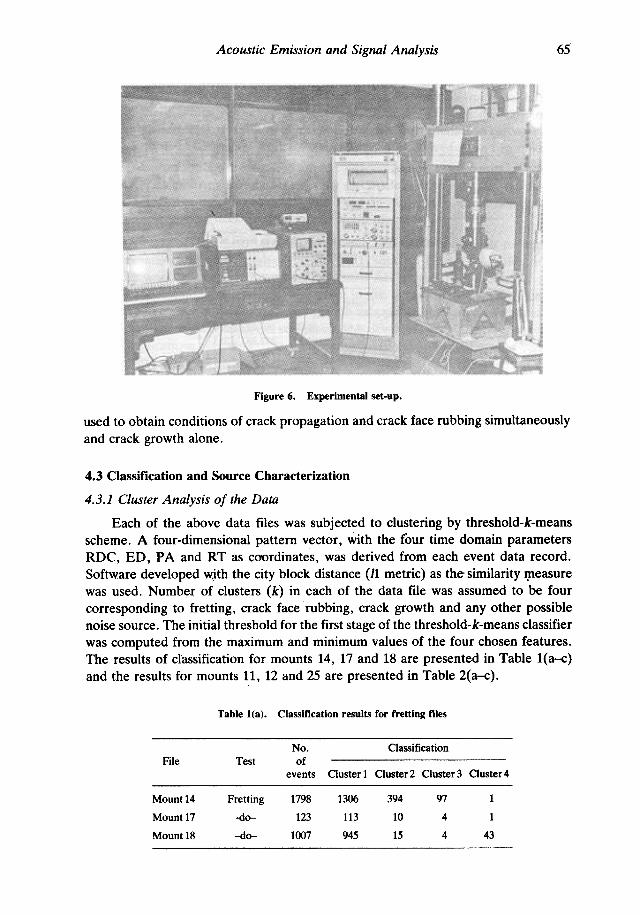
Acoustic Emission and Signal Analysis 65
Figure 6. Experimental set-up.
used to obtain conditions of crack propagation and crack face rubbing simultaneously
and crack growth alone.
4.3 Classification and Source Characterization
4.3.1 Cluster Analysis of the Data
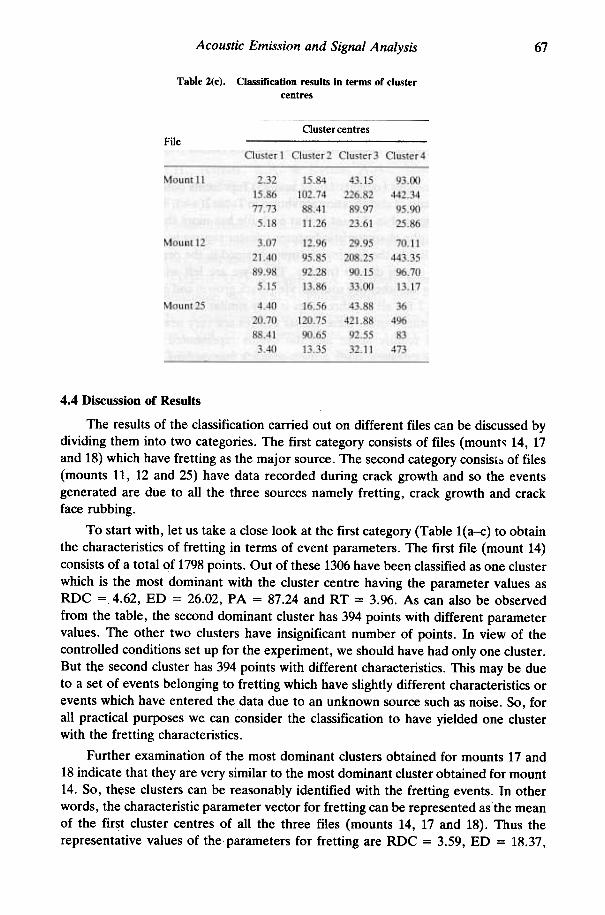
Each of the above data files was subjected to clustering by threshold-k-meansscheme. A four-dimensional pattern vector, with the four time domain parametersRDC, ED, PA and RT as coordinates, was derived from each event data record.Software developed with the city block distance (1! metric) as the similarity IJ1easurewas used. Number of clusters (k) in each of the data file was assumed to be fourcorresponding to fretting, crack face rubbing, crack growth and any other possiblenoise source. The initial threshold for the first stage of the threshold-k-means classifierwas computed from the maximum and minimum values of the four chosen features.The results of classification for mounts 14, 17 and 18 are presented in Table l(a-c)and the results for mounts 11, 12 and 25 are presented in Table 2(a-c).
Table l(a). Classification results for fretting files
File Test
394
10
15
97
4
4
Mount 14
Mount 17
Mount 18
Fretting
-do-
-do-
1798
123
1007
1306
113
945
11
43
No. Classificationof
events Ouster 1 Cluster 2 Cluster 3 Cluster 4

66 A KRao
Table 1 (b) .Classification results in tenns of percentage population of clusters
File Test
Mount 14
Mount 17
Mount 18
Fretting
-do-
-do-
1798
1~
1007
72.6
91.8
93.8
21.9
8.1
1.5
5.4
3.2
0.4
0.05
0.8
4.3
Table l(c). Classification results in terms ofcluster centres.
Cluster centresFile
Cluster 1 Cluster 2 Cluster 3 Cluster 4
4.62
26.02
87.24
3,96
2.84
12.92
92.58
1.42
2.26
8.45
96.07
1.14
20.29
166.51
92.54
11.97
10.1
65.9
92.7
3.9
13.06
104.00
92.00
7.53
63.23
347.88
94.27
18.77
9.50
117 .25
97.00
1.00
7.00
196.25
97.00
1.00
36
383
85
289
2
213
97
1
6.44
37.44
90.95
4.00
Mount 14
Mount 17
Mount 18
Table 2(a). Classification of events obtained for different tests by thethreshold-k-means method
File Test
Mount!! Crack
propagation
-do-
--do-
1212 521 408 221
Mount 12
Mount 25
1437
981
808
831
460
140
152
9
17
Table 2(b) .Classification results in terms of percentage population of clusters
TestFile
43.2 33.6 18.2 5.00Mount!! Crack
propagation
-do-
-do-
1212
1437
981
56.2
84.7
32.2
14.2
10.5
0.9
1.10
0.10
Mount 12
Mount 25

Acoustic Emission and Signal Analysis 67
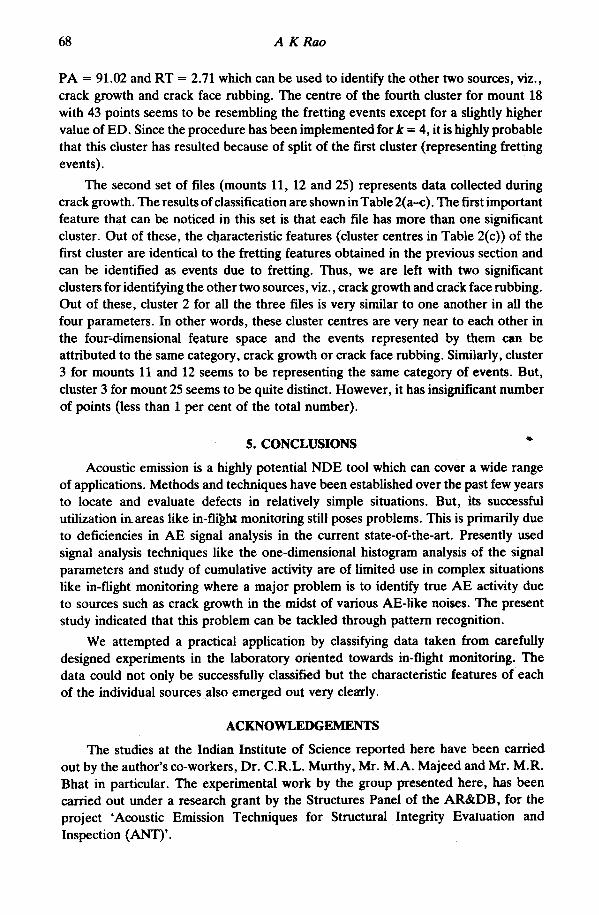
Table 2(c). Classification results in terms of clustercentres
(Cluster centres
File
Cluster 1 Cluster 2 Cluster 3 Cluster 4
Mountll 2.32
15.86
77.73
5.18
3.07
21.40
89.98
5.15
4.40
20.70
88.41
3.40
15.84
102.74
88.41
11.26
12.96
95.85
92.28
13.86
16.56
120.75
90.65
13.35
43.15
226.82
89.97
23.61
29.95
208.25
90.15
33.00
43.88
421.88
92.55
32.11
93.00
442.34
95.90
25.86
70.11
443.35
96.70
13.17
36
496
83
473
Mount 12
Mount 25
4.4 Discussion of Results
The results of the classification carried out on different files can be discussed bydividing them into two categories. The first category consists of files (mount" 14, 17and 18) which have fretting as the major source. The second category consist:. of files(mounts 11, 12 and 25) have data recorded during crack growth and so the eventsgenerated are due to all the three sources namely fretting, crack growth and crackface rubbing.
To start with, let us take a close look at the first category (Table l(a-<:) to obtainthe characteristics of fretting in terms of event parameters. The first file (mount 14)consists of a total of 1798 points. Out of these 1306 have been classified as one clusterwhich is the most dominant with the cluster centre having the parameter values asRDC = 4.62, ED = 26.02, PA= 87.24 and RT = 3.96. As can also be observed
from the table, the second dominant cluster has 394 points with different parametervalues. The other two clusters have insignificant number of points. In view of thecontrolled conditions set up for the experiment, we should have had only one cluster .But the second cluster has 394 points with different characteristics. This may be dueto a set of events belonging to fretting which have slightly different characteristics orevents which have entered the data due to an unknown source such as noise. So, forall practical purposes we can consider the classification to have yielded one clusterwith the fretting characteristics.
Further examination of the most dominant clusters obtained for mounts 17 and18 indicate that they are very similar to the most dominant cluster obtained for mount14. So, th~se clusters can be reasonably identified with the fretting events. In otherwords, the characteristic parameter vector for fretting can be represented as the meanof the first cluster centres of all the three files (mounts 14, 17 and 18). Thus therepresentative values of the parameters for fretting are RDC = 3.59, ED = 18.37,
Acoustic Emission and Signal Analysis 67
Table 2(c). Classification results in terms of clustercentres
Cluster centresFile
4.4 Discussion of Results
The results of the classification carried out on different files can be discussed bydividing them into two categories. The first category consists of files (mount" 14, 17and 18) which have fretting as the major source. The second category consist~ of files(mounts 11, 12 and 25) have data recorded during crack growth and so the eventsgenerated are due to all the three sources namely fretting, crack growth and crackface rubbing.
To start with, let us take a close look at the first category (Table l(a-c) to obtainthe characteristics of fretting in terms of event parameters. The first file (mount 14)
consists of a total of 1798 points. Out of these 1306 have been classified as one clusterwhich is the most dominant with the cluster centre having the parameter values asRDC = 4.62, ED = 26.02, PA= 87.24 and RT = 3.96. As can also be observed
from the table, the second dominant cluster has 394 points with different parametervalues. The other two clusters have insignificant number of points. In view of thecontrolled conditions set up for the experiment, we should have had only one cluster .But the second cluster has 394 points with different characteristics. This may be dueto a set of events belonging to fretting which have slightly different characteristics orevents which have entered the data due to an unknown source such as noise. So, forall practical purposes we can consider the classification to have yielded one clusterwith the fretting characteristics.
Further examination of the most dominant clusters obtained for mounts 17 and18 indicate that they are very similar to the most dominant cluster obtained for mount14. So, th~se clusters can be reasonably identified with the fretting events. In otherwords, the characteristic parameter vector for fretting can be represented as the meanof the first cluster centres of all the three files (mounts 14, 17 and 18). Thus therepresentative values of the parameters for fretting are RDC = 3.59, ED = 18.37,
68 A KRao
PA = 91.02 and RT = 2.71 which can be used to identify the other two sources, viz.,
crack growth and crack face rubbing. The centre of the fourth cluster for mount 18with 43 points seems to be resembling the fretting events except for a slightly highervalue of ED. Since the procedure has been implemented for k = 4, it is highly probablethat this cluster has resulted because of split of the first cluster (representing fretting
events).The second set of files (mounts 11, 12 and 25) represents data collected during
crack growth. The results of classification are shown in Table 2(a~). The first importantfeature that can be noticed in this set is that each file has more than one significantcluster. Out of these, the ciJaracteristic features (cluster centres in Table 2(c» of thefirst cluster are identical to the fretting features obtained in the previous section andcan be identified as events due to fretting. Thus, we are left with two significantclusters for identifying the other two sources, viz. , crack growth and crack face rubbing.Out of these, cluster 2 for all the three files is very similar to one another in all thefour parameters. In other words, these cluster centres are very near to each other inthe four"dimensional feature space and the events represented by them can beattributed to the same category , crack growth or crack face rubbing. Similarly, cluster3 for mounts 11 and 12 seems to be representing the same category of events. But,cluster 3 for mount 25 seems to be quite distinct. However, it has insignificant numberof points (less than 1 per ~ent of the total number).
s. CONCLUSIONS .
Acoustic emission is a highly potential NDE tool which can cover a wide rangeof applications. Methods and techniques have been established over the past few yearsto locate and evaluate defects in relatively simple situations. But, its successfulutilization in.areas like in-flight monitoring still poses problems. This is primarily dueto deficiencies in AE signal analysis in the current state-of-the-art. Presently usedsignal analysis techniques like the one-dimensional histogram analysis of the signalparameters and study of cumulative activity are of limited use in complex situationslike in-flight monitoring where a major problem is to identify true AE activity dueto sources such as crack growth in the midst of various AE-Iike noises. The presentstudy indicated that this problem can be tackled through pattern recognition.
We attempted a practical application by classifying data taken from carefullydesigned experiments in the laboratory oriented towards in-flight monitoring. Thedata could not only be successfully classified but the characteristic features 0( each
of the individual sources also emerged out very clearly.
ACKNOWLEDGEMENTS
The studies at the Indian Institute of Science reported here have been carriedout by the author's co-workers, Dr. C.R.L. Murthy, Mr. M.A. Majeed and Mr. M.R.Bhat in particular. The experimental work by the group presented here, has beencarried out under a research grant by the Structures Panel of the AR&DB, for theproject' Acoustic Emission Techniques for Structural Integrity Evaluation and
Inspection (ANT)'.

70 A KRao
18.
19.
20.
21
22
23
Michel, V., Bernard, D. & Max, B., Pattern recognition techniques in sodiumcooled fast breeder reactor's acoustic signal analysis, Proceedings of the IEEEConference on Pattern Recognition, 1980.
Bae, P. , Chaari, A., Gaillard, P. & Chretien, J .F ., Pattern recognition techniquesfor characterisation and classification of acoustic emission signals, Proceedingsof the IEEE Conference on Pattern Recognition, 1980.
Chan, R.W.Y., Hay Robert, D., Victor Caron, Hone, Michel & Sharp Douglas,R., Journal of Acoustic Emission, 4 (4), (1985), 115-123.
Graham, L.J. & Elsley, R.K., Journal of Acoustic Emission, 2 (2), (1983).
Pathak, S.C. & Murthy, C.R.L., Journal of Acoustic Emission, 4 (2/3), (1985),532-534.
Pathak, S.C., Acoustic Emission Studies for Detection and Monitoring IncipientCracks in Simulated Aero Engine Mount Under Fatigue, ME Project Report,(Dept. of Aerospace Engg., Indian Institute of Science, Bangalore), 1985.