Embed Size (px)
Citation preview
� � �
ACOUSTIC BEHAVIOUR OF BOTTLENOSE DOLPHINS AND
PILOT WHALES
PhD dissertation
FRANTS HAVMAND JENSEN
Zoophysiology Department of Biological Sciences
University of Aarhus, Denmark

FRANTS�H.�JENSEN,�PHD�THESIS,�2011�
� � �
CONTENTS Preface …………………………………………………………………………………………………..………… 5 Acknowledgements ……………………………………………………………………………………………… 7 Summary ………………………………………………………………………………………………………… 8 Resumé (danish summary) ……………………………………………………………………………………… 11 Chapter I: Introduction ………………………………………………………………………………………… 15 Background and objectives …………………………………………………………………………………… 17 Phylogeny and diversity of toothed whales …………………………………………………………………… 17 The bottlenose dolphin ………………………………………………………………………………………… 18 The short-finned pilot whale…………………………………………………………………………………… 20 Sensory challenges to a marine lifestyle ……………………………………………………………………… 21 Odontocete sound production ………………………………………………………………………………… 23 Odontocete sound reception …………………………………………………………………………………… 27 Auditory capabilities…………………………………………………………………………………………… 28 Sound propagation …………………………………………………………………………………………… 28 Underwater ambient noise …………………………………………………………………………………… 29 Structural categories of acoustic signals ……………………………………………………………………… 30 Echolocation …………………………………………………………………………………………………… 33 Biosonar behaviour …………………………………………………………………………………………… 35 Communication ……………………………………………………………………………………………… 38 Future research………………………………………………………………………………………………… 43 References……………………………………………………………………………………………………… 45 Chapter II: Biosonar adjustments to target range 55 Jensen F. H., Bejder L., Wahlberg M., and Madsen P.T. (2009): Biosonar adjustments to target range of echolocating bottlenose dolphins (Tursiops sp.) in the wild. J. Exp. Biol. 212: 1078-1086 Chapter III: Biosonar clicks from free-ranging dolphins 65 Wahlberg M., Jensen F. H., Beedholm K., Bejder L., Madsen P. T.: Source parameters of echolocation signals from wild bottlenose dolphins (Tursiops sp.). (In prep for JASA) Chapter IV: Demodulation and filtering technique 95 Beedholm, K., Jensen, F. H.: Novel demodulation and filtering procedure for isolating signals overlapping in time and frequency (In prep for JASA) Chapter V: Dolphins don’t whistle 103 Madsen, P. T., Jensen, F. H.: Dolphins don’t whistle: Vocal tract resonances affect formants of dolphin tonal calls, but not the fundamental contours (In prep for Biology Letters) Chapter VI: Source levels and energy content of dolphin whistles 113 Jensen F. H., Beedholm K., Bejder L., Wahlberg M., and Madsen P.T.: Short detection ranges of bottlenose dolphin whistles in a tropical habitat (In prep for JASA) Chapter VII: Pneumatic effects on pilot whale calls 143 Jensen F. H., Marrero Perez J., Johnson M. P., Aguilar Soto N., Madsen P. T.: Calling under pressure: Short-finned pilot whales make social calls during deep foraging dives. Proc. R. Soc. B. (accepted) Chapter VIII: Pilot whale contact calls 169 Jensen F. H., Marrero Perez J., Johnson M. P., Aguilar Soto N., Madsen P. T.: Short-finned pilot whale contact calling during deep dives (progress report) Chapter IX: Vessel noise effects on delphinid communication 181 Jensen F. H., Bejder L., Wahlberg M., Aguilar Soto N., Johnson M., and Madsen P.T. (2009): Vessel noise effects on delphinid communication. Mar. Ecol. Prog. Ser. 395: 161-175

FRANTS�H.�JENSEN,�PHD�THESIS,�2011�
� � �
PREFACE This dissertation represents the partial fulfilment of the requirements for the degree of
Doctor of Philosophy (PhD) at the Faculty of Science, Aarhus University. It is written in
accordance with regulations outlined by the Faculty of Science in May 2002. The work described in
this dissertation was carried out at the Department of Biological Sciences, University of Aarhus
under the supervision of Prof. Peter T. Madsen, with fieldwork conducted in Tenerife (the Canary
Islands, Spain) and Bunbury (Western Australia).
On the very first day of my PhD study, I found myself sleeping on the pavement in front of
an Australian hostel with a very locked front gate, my head on a rucksack and three good friends
and fellow bioacoustics students around me. We had arrived that very night to start a three-week
field expedition in Bunbury, collecting various data including the basis for a large part of this
dissertation. My personal goals for that expedition were to investigate the acoustic behaviour and
acoustic signals of a resident population of bottlenose dolphins. My PhD was aimed at uncovering
the acoustic behaviour of two species of toothed whales inhabiting different niches, using various
bioacoustic field techniques to investigate how environmental factors and the biophysics of sound
production shape the communication signals and flow of information between animals in these two
species. As with most other PhD projects, these goals evolved over the last four years, changed
form when efforts in some directions did not seem fruitful or when new ideas or inputs from
colleagues spurred my imagination. The present dissertation is the outcome of that process and
deals with the acoustic signals, social communication and foraging behaviour of bottlenose dolphins
and pilot whales.
The dissertation consists of a broad review-like introduction to the toothed whales and their
acoustics and behavioural ecology followed by 8 chapters in the form of papers published in
international, peer-reviewed journals, manuscripts close to submission, and a final progress report
from an ongoing study.
Aarhus, Jan 31st, 2011
_________________________________________
FRANTS HAVMAND JENSEN
Chapter I
Page 5Page 5

FRANTS�H.�JENSEN,�PHD�THESIS,�2011�
Page 6Page 6
� � �
ACKNOWLEDGEMENTS This dissertation is the result of a four-year PhD conducted at the Department of Biological Sciences, Faculty of Science, Aarhus University, and I am grateful for the support I have received from this institution. The PhD School of Aquatic Sciences, now part of the Aarhus Graduate School of Science, funded the four years of this PhD, to which I owe them many thanks. Further support has been granted to me by WWF Verdensnaturfonden and Aase og Ejner Danielsens Foundation as well as the Siemens Foundation.
Out of all the people that have been helped me along on this adventure, I owe the greatest thanks to my supervisor, Peter Teglberg Madsen. Peter is one of those people who is able to see a solution where everyone else only sees trouble. Throughout this PhD, his optimism and enthusiasm has helped me through all the hard times that you encounter through a journey such as this. Never have I experienced that Peter could not find the time for helping me out, or lost patience with my foolish questions. His continued support and encouragement has allowed me to do the most exciting studies around the globe, in the process meeting many new and amazing people. This project would not have been possible without him. I also wish to thank Magnus Wahlberg who has always been available for enlightening and inspiring discussions, who can spend several hours in the galley of a stormridden ship just to cook pancakes for a score of seasick marine biologists. Magnus truly is a morale boost whenever you need it. I am also grateful to Bertel Møhl, who introduced me to the field of bioacoustics on a memorable research cruise to Andenes in 2005. I am truly grateful to have met with Mark Johnson and Natacha Aguilar Soto, who have kindly allowed me to delve down into the abyssal domain of a deep-diving marine predator like the pilot whales while offering insightful comments and discussions whenever needed. I owe a great deal of thanks to Jacobo Marrero Perez and the rest of the marine biologists. Jacobo has attacked the data analysis of the piles of DTAG data with vigour, and has been critical for many of the studies here. Thanks also to Kristian Beedholm for exceptional analytical support, and especially for the convolution song. Lars Bejder has been a great colleague during fieldwork as well as a truly supporting friend. Finally, I wish to thank all the amazing friends I have met while working in this lab and who have all helped make the day-to-day studies and occasional fieldwork exciting and fun. These include, among others, Maria Wilson, Inge Revsbech, Henriette Schack, Michael Hansen, Danuta Wisniewska, Karin Clausen, Holly Smith, and Christian B. Christensen.
Note: Through the first chapter comprising the introduction, I will be referring to chapters of my thesis where I am the lead author in the first person singular tense, and chapters I have coauthored in the first person plural tense. However, all chapters are the product of a close collaboration with a series of good colleagues that deserve proper recognition.
Chapter I
Page 7Page 7
FRANTS�H.�JENSEN,�PHD�THESIS,�2011�
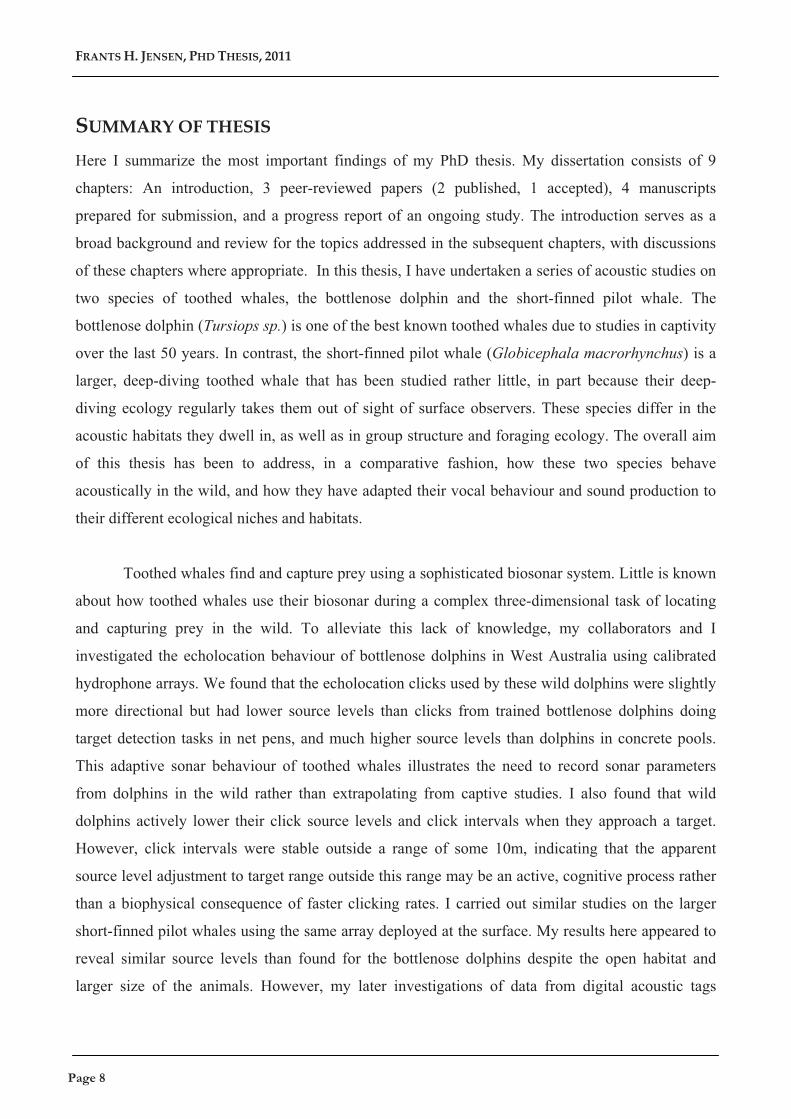
SUMMARY OF THESIS Here I summarize the most important findings of my PhD thesis. My dissertation consists of 9
chapters: An introduction, 3 peer-reviewed papers (2 published, 1 accepted), 4 manuscripts
prepared for submission, and a progress report of an ongoing study. The introduction serves as a
broad background and review for the topics addressed in the subsequent chapters, with discussions
of these chapters where appropriate. In this thesis, I have undertaken a series of acoustic studies on
two species of toothed whales, the bottlenose dolphin and the short-finned pilot whale. The
bottlenose dolphin (Tursiops sp.) is one of the best known toothed whales due to studies in captivity
over the last 50 years. In contrast, the short-finned pilot whale (Globicephala macrorhynchus) is a
larger, deep-diving toothed whale that has been studied rather little, in part because their deep-
diving ecology regularly takes them out of sight of surface observers. These species differ in the
acoustic habitats they dwell in, as well as in group structure and foraging ecology. The overall aim
of this thesis has been to address, in a comparative fashion, how these two species behave
acoustically in the wild, and how they have adapted their vocal behaviour and sound production to
their different ecological niches and habitats.
Toothed whales find and capture prey using a sophisticated biosonar system. Little is known
about how toothed whales use their biosonar during a complex three-dimensional task of locating
and capturing prey in the wild. To alleviate this lack of knowledge, my collaborators and I
investigated the echolocation behaviour of bottlenose dolphins in West Australia using calibrated
hydrophone arrays. We found that the echolocation clicks used by these wild dolphins were slightly
more directional but had lower source levels than clicks from trained bottlenose dolphins doing
target detection tasks in net pens, and much higher source levels than dolphins in concrete pools.
This adaptive sonar behaviour of toothed whales illustrates the need to record sonar parameters
from dolphins in the wild rather than extrapolating from captive studies. I also found that wild
dolphins actively lower their click source levels and click intervals when they approach a target.
However, click intervals were stable outside a range of some 10m, indicating that the apparent
source level adjustment to target range outside this range may be an active, cognitive process rather
than a biophysical consequence of faster clicking rates. I carried out similar studies on the larger
short-finned pilot whales using the same array deployed at the surface. My results here appeared to
reveal similar source levels than found for the bottlenose dolphins despite the open habitat and
larger size of the animals. However, my later investigations of data from digital acoustic tags
Page 8Page 8
� � �
(DTAGs: Woods Hole Oceanographic Institution) reveal that the source levels measured at the
surface are much lower than those used when searching for prey several hundred meters below the
surface, underscoring the need for measuring biosonar parameters in the habitat where they are
actually used for foraging.
Concurrent with investigations on biosonar properties, I investigated the acoustic
communication signals of both species. Toothed whales communicate using several types of
acoustic signals including narrow-band frequency modulated whistles and rapid series of clicks and
burst pulse calls. Using a GPS linked array of receivers, I measured source levels and energy
content of bottlenose dolphin whistles in a tropical, shallow habitat with high noise levels. I find
that the source levels of whistles are lower than previously measured, possibly restricted by the size
of the animals there. I estimated the detection range of whistles to be 5x lower than estimated for a
North-Atlantic bottlenose dolphin population in a quieter habitat. I also found that the stimated
metabolic cost of producing these whistles is insignificant compared to the high metabolic rate of
these marine mammals, indicating that communication for bottlenose dolphins – and likely all
toothed whales – is energetically cheap in terms of direct costs. Using acoustic tags (DTAGs), I find
that pilot whales, on the other hand, use signals that can be detected at longer distances, primarily
due to lower background noise levels in the more open habitat but also because they seem to be able
to produce calls at higher amplitudes. However, their deep-diving ecology appears to impose
special constraints on the communication of these animals. Toothed whales use a closed loop
system of air in the nasal passages for pneumatic sound production. By using DTAGs to quantify
the vocalizations of diving animals at a known depth, I demonstrate that when pilot whales descend
towards foraging depths, the hydrostatic pressure negatively affects the production of
communication signals. This results in lower amplitude, shorter calls at depth despite an increased
distance to their social group at the surface. I show that calling ceases during the deepest part of the
foraging dives, but resumes during the ascent phase, allowing foragers to re-establish acoustic
contact with their social group during the ascent. These biophysical limitations further suggest that
toothed whales inhaling before a dive, in sharp contrast to all pinnipeds that exhale before diving,
may do so to increase the amount of air available for sound production and extend the range of
depths they can cover while producing sounds pneumatically.
Chapter I
Page 9Page 9
FRANTS�H.�JENSEN,�PHD�THESIS,�2011�
Surprisingly, I find that the frequency content of pilot whale calls, including the
time/frequency modulation patterns that seem to convey information for some toothed whales, is
unaffected by depth despite the compression of air cavities inside the head of the animal. This led
me to participate in an investigation of the sound production of trained bottlenose dolphins
vocalizing in a mixture of oxygen and helium that alters the resonance frequency of air cavities.
Using a novel signal processing technique to isolate the energy within individual harmonics of a
frequency-modulated signal, we find that the fundamental frequency of whistles is unaffected by the
increased resonance frequency in internal air sacs, but that energy is moved into higher harmonics.
This is similar to humans speaking in a helium mixture but drastically different from a human
whistling in a helium mixture. These results show that toothed whales do not actually whistle per
se, but produce tonal signals by phonic lip vibrations set in motion by a controlled air flow, and
where internal air spaces affect the distribution of energy in harmonics. As a consequence, the
frequency contours that convey acoustic signatures in delphinids are unaffected by changes in depth
as well as changes in the size of different nasal air sacs during sound production.
Finally, both bottlenose dolphins and pilot whales are the subject of heavy whale watching
activities and other anthropogenic noise sources, but little effort has gone into modelling the sound
exposure levels that would arise from smaller vessels. I therefore measured the noise from two
small vessels and modelled the masking impacts they would have on the communication signals of
the two study species. I documented significant masking levels increasing with the speed of the
vessels due to greater cavitation noise, as well as very high-level transients generated from gear
shifts. My results show that limiting the gear shifts and keeping speeds below 5 knots would greatly
reduce the masking impact from these vessels.
Page 10Page 10
� � �
RESUMÉ AF AFHANDLINGEN Dette kapitel opsummerer de vigtigste resultater og fund i min PhD-afhandling. Min afhandling
består af 9 kapitler: En introduktion, tre peer-reviewed artikler (to udgivet, en accepteret), fire
manuskripter klargjort til publicering og en statusrapport af et igangværende studie. Introduktionen
indeholder en bred baggrundsviden samt et resumé af de emner, som berøres i de efterfølgende
kapitler. Under mit PhD-forløb har jeg udført en række akustiske studier af to arter af tandhvaler,
øresvinet (Tursiops sp.) og den kortluffede grindehval (Globicephala macrorhynchus) (herefter blot
grindehval). Øresvinet er den af alle tandhvaler vi ved mest om da den er blevet studeret i
fangenskab gennem de sidste 50 år. I modsætning er vores viden om de noget større og
dybdykkende grindehvaler meget begrænset, til dels pga deres dybdykkende adfærd, som
besværliggør adfærdsmæssige observationer fra havoverfladen. De to arter er forskellige i de
akustiske habitater de anvender, samt i deres gruppestruktur og fødesøgningsøkologi. Det
overordnede formål med min PhD-afhandling er dels at undersøge disse to arters akustiske adfærd i
naturen med en komparativ tilgangsvinkel, dels at undersøge hvordan de har tilpasset deres
akustiske adfærd og lydproduktion til de forskellige økologiske nicher og habitater de befinder sig i.
Tandhvaler lokaliserer og fanger bytte vha et sofistikeret biosonar system. Men hvordan
tandhvalerne bruger deres biosonar under en kompleks tredimensional lokalisering og fangst af
byttet i naturen ved vi meget lidt om. Af denne årsag har mine samarbejdspartnere og jeg undersøgt
øresvinets ekkolokaliseringsadfærd gennem feltarbejde udført i vest Australien ved brug af et
kaliberet array af hydrofoner. Undersøgelserne viser, at ekkolokaliserings klik fra disse fritlevende
delfiner var mere retningsbestemte, men havde lavere kildestyrke end klik udsendt af delfiner, som
udførte bytte-detektions-eksperiment i et netbur, samt at de havde en meget højere kildestyrke end
klik udsendt af delfiner i betonbassiner. Disse dynamiske tilpasninger i biosonar adfærd hos
tandhvaler viser, at der er behov for at observere, hvordan tandhvaler anvender deres biosonar i
naturen, i stedet for at ekstrapolere fra studier udført på delfiner holdt i fangeskab.
Yderligere fandt vi, at delfiner aktivt sænker kildestyrken på deres klik og øger
klikhastigheden, når de nærmer sig deres bytte. Klikraten var dog stabile, når tandhvalen var mere
end 10 meter fra byttet, hvilket indikerer, at den tilsyneladende tilpasning af kildestyrken til byttets
afstand er en aktiv og kognitiv proces frem for en biofysisk konsekvens af at klikke hurtigere. Jeg
har udført tilsvarende studier på grindehvaler, hvor samme array system er anvendt ved
havoverfladen. Her viser mine resultater, at kortluffet grindehvaler anvender samme kildestyrke
Chapter I
Page 11Page 11
FRANTS�H.�JENSEN,�PHD�THESIS,�2011�
som øresvinet på trods af det mere åbne habitat og den større fysiske størrelse af grindehvalen.
Mine seneste analyser af data fra digitale akustiske tags (DTAGs: Woods Hole Oceanographic
Institution) tyder dog på at kildestyrker for klik målt ved havoverfladen er meget lavere end
kildestyrker målt på klik der udsendes under byttedyrssøgning på flere hundrede meters dybde,
hvilket understreger behovet for at måle på biosonar parametrene i de habitater hvor de egentlige
byttefangster finder sted.
Jeg har sideløbende med undersøgelserne på biosonar egenskaberne, analyseret de akustiske
kommunikations signaler hos begge arter af tandhvaler. Tandhvaler kommunikerer ved at anvende
forskellige typer af akustiske signaler, herunder smalbåndede, frekvensmodulerede fløjt og hurtige
serier af klik samt ”burst pulse” kald, en meget hurtig serie af klik som lyder toneagtigt for det
menneskelige øre. Ved at anvende et GPS synkroniseret array af hydrofoner, har det været muligt at
måle kildestyrker og energi indhold af øresvinets kald i tropiske, lavtvands habitater med høje
støjniveauer. Jeg fandt, at kildestyrken på kald er lavere end tidligere målte kildestyrker for
nordatlantiske øresvin, hvilket muligvis kan være forklaret til dels af at de nordatlantiske øresvin er
næsten dobbelt så store. Jeg estimerede detektionsafstanden på kald til at være fem gange lavere end
estimater for populationer af de nordatlantiske øresvin målt i mere stille habitater. Yderligere
estimerede jeg at metabolske omkostning for at producere disse kald er af minimal betydning
sammenholdt med disse marine pattedyrs meget høje stofskifte, hvilket indikerer at kommunikation
hos øresvin – og sandsynligvis alle andre tandhvaler - er energimæssigt. Ved at analysere data fra
akustiske tags på grindehvaler, fandt jeg at de i modsætning til øresvin udsender signaler, der kan
detekteres på længere afstand, hovedsagligt pga det lavere baggrundsstøjniveau i de mere åbne
habitater, men også fordi de tilsyneladende er i stand til at producere kald med en større amplitude.
Den dybdykkende adfærd pålægger dog specielle restriktioner på disse dyrs kommunikation.
Tandhvaler bruger et lukket pneumatisk system hvor drivmidlet er luft i næsegangene, til at
producere lyd med. Ved at anvende DTAGs til at kvantificere vokaliseringer hos dykkende dyr på
en kendt dybde, kan jeg vise, at når grindehvaler dykker til de dybder, hvor de søger føde, så har
det hydrostatiske tryk en negativ effekt på produktionen af kommunikations signaler. Dette giver
sig udslag i en mindre amplitude og kortere varighed på kald udsendt på store dybder, hvilket er på
trods af, at afstanden til deres gruppe ved overfladen øges. Samtidig viser jeg at hyppigheden af
kald falder under den dybeste del af forageringsdykkene, men stiger, når hvalerne søger mod
overfladen, hvilket gør det muligt for hvalerne at genetablere den akustiske kontakt til deres gruppe.
Page 12Page 12
� � �
De biofysiske begrænsninger indikerer, at tandhvaler, der fylder lungerne med luft før de dykker i
skarp modsætning til sæler og søløver, gør dette for at optimere mængden af luft til rådighed for
lydproduktion og derved øger den dybde, hvor de kan søge føde og kommunikere med artsfæller.
Underligt nok så fandt jeg yderligere at frekvens indholdet af grindehvalernes kald, herunder
ændringen af grundfrekvens over tid som ellers er blevet vist at indeholde information for øresvin,
ikke er påvirket af dybde på trods af at resonansfrekvensen for luftfyldte områder i hovedet stiger på
større dybde. Dette resultat er overraskende og fik mig til at hjælpe med til at undersøge
lydproduktion hos et øresvin der var trænet til at fløjte mens den indåndede en blanding af ilt og
helium. Ved at anvende en ny signal behandlingsteknik, hvor det er muligt at isolere energien i de
enkelte harmoniske bånd af et frekvens-moduleret signal, fandt vi, at den grundtonen i delfinens
fløjt er upåvirkede af den øgede resonansfrekvens i de indre luftsække, men at energien flyttes til de
højere harmoniske bånd. Disse ændringer svarer til hvad man ville se hvis et menneske snakkede
efter at have indåndet helium, men helt anderledes end hvis mennesket fløjtede. Disse resultater
viser, at tandhvaler faktisk ikke fløjter, men i stedet producerer toner ved læbevibrationer forårsaget
af en kontrolleret luftstrøm, hvor indre luftrum påvirker fordelingen af energi mellem grundtone og
overtoner. Konsekvensen er, at frekvenskonturerne i akustiske signaturer hos delphinider, ikke er
påvirket af ændringer i dybde så vel som ændringer i størrelsen af de forskellige indre luftsække
under lydproduktion – hvilket betyder at for eksempel delfiner kan blive ved med at fløjte det
samme fløjt uanset hvilken dybde de dykker på.
Både øresvin og grindehvaler er genstand for meget heftig hvalturisme og andre
menneskeskabte støjkilder, men der er ikke gjort meget for at forstå de lydniveauer, som mindre
både udsender. Jeg har derfor målt støj fra to mindre både og efterfølgende modelleret den
maskeringspåvirkningen, som de kunne have på kommunikationssignaler fra både øresvin og
grindehvaler. Jeg fandt at støjniveauerne stiger kraftigt når bådene sejler hurtigere, samt at kraftige
gearskift faktisk også forårsager meget høje lyde under vandet. Disse resultater viser, at ved at
begrænse gearskift og mindske hastigheden til under 5 knob, så vil påvirkningen af dyrenes
kommunikation fra disse både reduceres markant og formodentlig ikke have nogen væsentlig fysisk
effekt på dyrenes kommunikation.
Chapter I
Page 13Page 13

FRANTS�H.�JENSEN,�PHD�THESIS,�2011�
Page 14Page 14

� � �
Chapter I: Introduction
Chapter I
Page 15Page 15

FRANTS�H.�JENSEN,�PHD�THESIS,�2011�
Page 16Page 16
� � �
BACKGROUND AND OBJECTIVES Bottlenose dolphins have been extensively studied in captivity and in the wild during more than 60 years, and a continued research effort is focused on the social organization and especially the social communication systems of this toothed whale species. Much less is known about another delphinid, the pilot whale, but recent biologging developments have made it feasible to study the social and foraging ecology of these animals in detail in the wild. Bottlenose dolphins and pilot whales face different challenges to their foraging and communication capacities because their lifestyles differ in various ways. Both these species may be studied in the wild using a variety of methods such as array recordings or acoustic tags placed on the animals. These techniques make it possible to investigate the acoustic adaptations to their different habitats, ecology, and group structures. In the following section, I will provide a background for my research on the sensory ecology and acoustic behaviour of these two species of toothed whales. I will start by briefly summarizing the evolution of toothed whales and the biology of the two model species. Then, I introduce the sensory challenges of an aquatic environment and the adaptations in the sound production apparatus and the auditory system of toothed whales. Subsequently, I provide an overview of the different functions of acoustic signals in toothed whales, describing the principles of communication and echolocation and the challenges that an echolocating predator faces. Finally, discuss the importance of acoustics for cetacean groups in an open, three-dimensional environment, leading into a discussion of future directions for continued research on these two species and other toothed whales in the wild.
PHYLOGENY AND DIVERSITY OF TOOTHED WHALES
Whales and dolphins diverged from even-toed ungulates approximately 53-56 million years ago (Mya) and gradually adapted from a terrestrial lifestyle to a fully pelagic lifestyle (Thewissen et al., 2007). Extant cetaceans evolved from Archeocetes around 36 Mya, separating into filter-feeding mysticetes (baleen whales) and the raptorial Odontocetes (toothed whales) (Steeman et al., 2009; Thewissen et al., 2007). This phylogenetic split seems to have been facilitated by the evolution of filter feeding in baleen whale ancestors and echolocation in the toothed whale ancestors (Steeman et al., 2009; Uhen, 2010). Modern toothed whales comprise some 71 known species, ranging from the small vaquita (adult length of 1.45 m) to the large sperm whale (male adult length exceeding 18 m) inhabiting all known marine ecotypes and even several larger river systems (Reeves et al., 2002).
Chapter I
Page 17Page 17
FRANTS�H.�JENSEN,�PHD�THESIS,�2011�
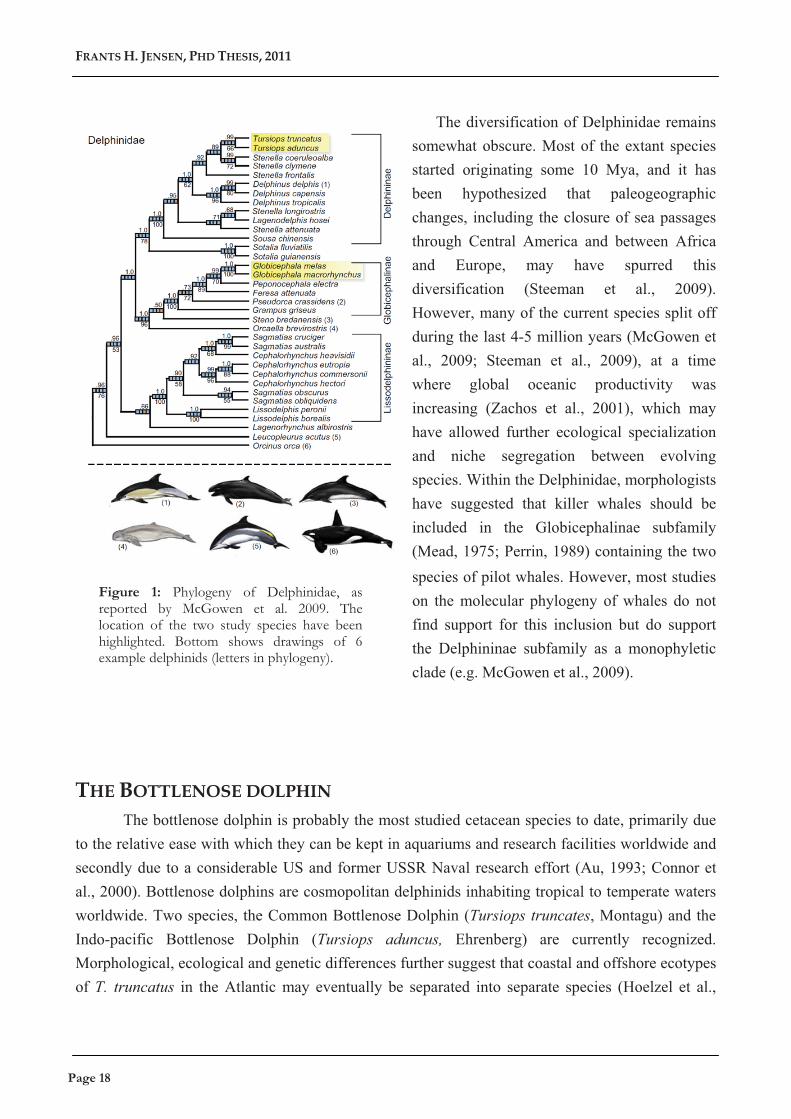
The diversification of Delphinidae remains somewhat obscure. Most of the extant species started originating some 10 Mya, and it has been hypothesized that paleogeographic changes, including the closure of sea passages through Central America and between Africa and Europe, may have spurred this diversification (Steeman et al., 2009). However, many of the current species split off during the last 4-5 million years (McGowen et al., 2009; Steeman et al., 2009), at a time where global oceanic productivity was increasing (Zachos et al., 2001), which may have allowed further ecological specialization and niche segregation between evolving species. Within the Delphinidae, morphologists have suggested that killer whales should be included in the Globicephalinae subfamily (Mead, 1975; Perrin, 1989) containing the two species of pilot whales. However, most studies on the molecular phylogeny of whales do not find support for this inclusion but do support the Delphininae subfamily as a monophyletic clade (e.g. McGowen et al., 2009).
THE BOTTLENOSE DOLPHIN
The bottlenose dolphin is probably the most studied cetacean species to date, primarily due to the relative ease with which they can be kept in aquariums and research facilities worldwide and secondly due to a considerable US and former USSR Naval research effort (Au, 1993; Connor et al., 2000). Bottlenose dolphins are cosmopolitan delphinids inhabiting tropical to temperate waters worldwide. Two species, the Common Bottlenose Dolphin (Tursiops truncates, Montagu) and the Indo-pacific Bottlenose Dolphin (Tursiops aduncus, Ehrenberg) are currently recognized. Morphological, ecological and genetic differences further suggest that coastal and offshore ecotypes of T. truncatus in the Atlantic may eventually be separated into separate species (Hoelzel et al.,
Figure 1: Phylogeny of Delphinidae, as reported by McGowen et al. 2009. The location of the two study species have been highlighted. Bottom shows drawings of 6 example delphinids (letters in phylogeny).
Page 18Page 18
� � �
1998; Natoli et al., 2005). The bottlenose dolphins studied in Bunbury Bay throughout the studies comprising this dissertation are likely T. aduncus. However, since some morphological traits resemble those of T. truncatus and a full genetic analysis has not been completed, this population is referred to as Tursiops sp. through this dissertation. They normally reach adult lengths of 220-230 cm similarly to dolphins in Sarasota Bay and Shark Bay (Cockroft & Ross, 1990; Connor et al., 2000), quite a bit smaller than populations inhabiting the cooler waters of the North Atlantic where adults may reach lengths of 350-410 cm (Fraser, 1974; Lockyer & Morris, 1985).
Bottlenose dolphins are generalist predators feeding on fish, shrimp and squid in shallow
waters (Cockroft & Ross, 1990), and presumably larger aggregations of fish in deeper, oceanic waters (Shane et al., 1986). Like other mammals, they use foraging techniques that are shaped to habitat type and prey availability, which is especially evident in Shark Bay, West Australia (Allen et al., 2010). Some coastal populations have evolved very intricate feeding specializations (Allen et al., 2010; Connor et al., 2000), including potentially dangerous behaviours such as intentionally beaching themselves (Hoese 1971, Silber and Fertl 1995, Sargeant et al. 2005). A small proportion of dolphins in Shark Bay, Western Australia, have even been reported to hunt with marine sponges on their rostra, perhaps the first indication of tool use in wild cetaceans (Smolker et al., 1997).
Bottlenose dolphin groups in Shark Bay and in Sarasota Bay, Florida, are characterized by
fluid interactions normally classified as a loose fission-fusion society with frequent movement of individuals between groups (Connor et al., 2000; Mann et al., 2000). Males may exhibit several levels of alliance formation. Most males form long-term bonds with one or two other males in first-order alliances (Connor et al., 1992). In Shark Bay, these male alliances band together in second-order alliances to compete for access to females (Connor et al., 1999; Connor et al., 1992). In contrast, most females have larger social networks and seem to associate primarily in bands of other females and juveniles, but some females appear to remain solitary (Connor et al. 2000). Calves are highly dependent on their mothers until they are weaned around the age of 3-4 years (Connor et al. 2000) and seem to associate almost exclusively with their mothers or other females during this time (Mann et al. 2000). Such a strong mother-calf bond offers a vital protection against predators (Heithaus, 2001a; Heithaus, 2001b) but also seems to be extremely important for learning important skills through play and imitation. Many foraging specializations, for example, seem to be transmitted to offspring through social learning, especially from mother to calf (Krutzen et al., 2005).
Despite the similarities in group structure between Sarasota Bay and Shark Bay, bottlenose
dolphin populations in other geographic locations may have different association patterns. One of the northernmost populations of studied bottlenose dolphins reside in the cold, temperate waters of
Chapter I
Page 19Page 19
FRANTS�H.�JENSEN,�PHD�THESIS,�2011�
the Moray Firth, Scotland. This population seems to be split into two loose communities where association patterns are dominated by short-term acquaintances rather than long-term alliances (Lusseau, 2003). Larger associations seem determined primarily by temporary food aggregations (Lusseau et al. 2004). In a way, this fluid pattern seems to resemble the populations studied in Shark Bay and Sarasota, yet without the strong male-male bonds (Wilson et al. 1993). Another studied population of bottlenose dolphins resides in Doubtful Sound, New Zealand, on the most southern extreme of the species range. The community structure here seems to be temporally stable, without immigration or emigration of animals. These animals live in large, mixed-sex groups characterized by many long-term associations both within and between sexes (Lusseau et al., 2003). However, not much is known yet about the ecological factors shaping such diverse community structures (Lusseau et al., 2003).
THE SHORT-FINNED PILOT WHALE
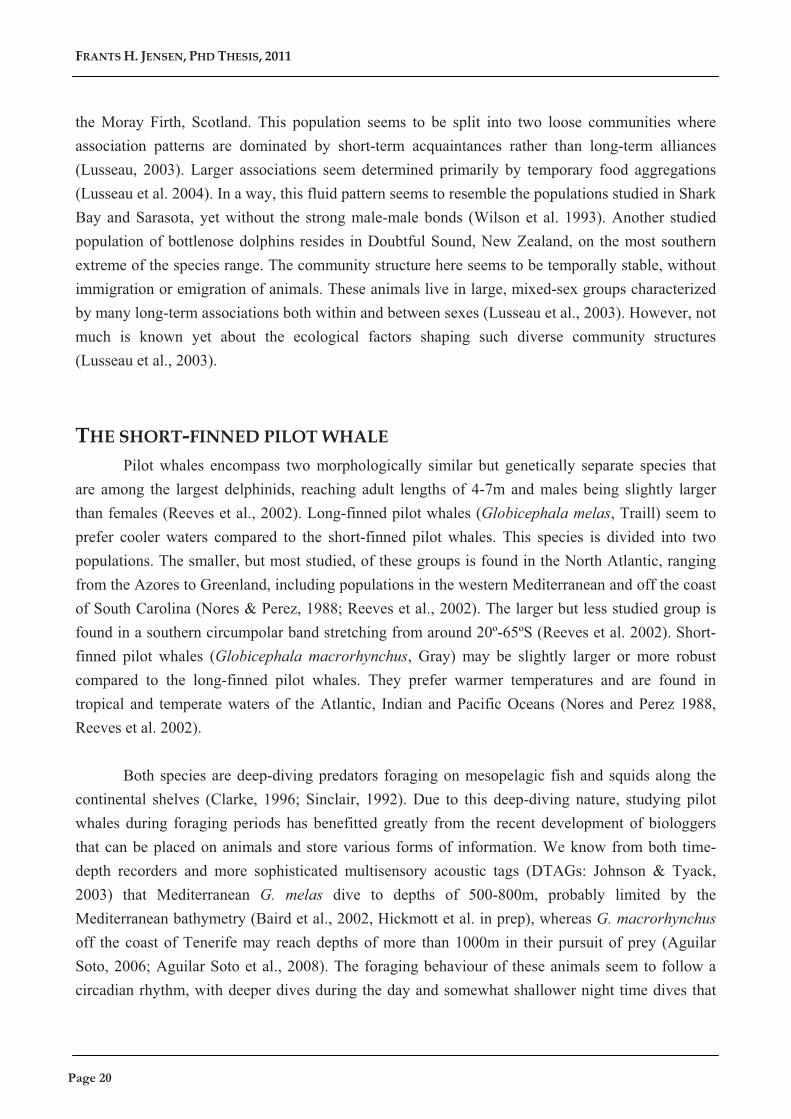
Pilot whales encompass two morphologically similar but genetically separate species that are among the largest delphinids, reaching adult lengths of 4-7m and males being slightly larger than females (Reeves et al., 2002). Long-finned pilot whales (Globicephala melas, Traill) seem to prefer cooler waters compared to the short-finned pilot whales. This species is divided into two populations. The smaller, but most studied, of these groups is found in the North Atlantic, ranging from the Azores to Greenland, including populations in the western Mediterranean and off the coast of South Carolina (Nores & Perez, 1988; Reeves et al., 2002). The larger but less studied group is found in a southern circumpolar band stretching from around 20º-65ºS (Reeves et al. 2002). Short-finned pilot whales (Globicephala macrorhynchus, Gray) may be slightly larger or more robust compared to the long-finned pilot whales. They prefer warmer temperatures and are found in tropical and temperate waters of the Atlantic, Indian and Pacific Oceans (Nores and Perez 1988, Reeves et al. 2002).
Both species are deep-diving predators foraging on mesopelagic fish and squids along the
continental shelves (Clarke, 1996; Sinclair, 1992). Due to this deep-diving nature, studying pilot whales during foraging periods has benefitted greatly from the recent development of biologgers that can be placed on animals and store various forms of information. We know from both time-depth recorders and more sophisticated multisensory acoustic tags (DTAGs: Johnson & Tyack, 2003) that Mediterranean G. melas dive to depths of 500-800m, probably limited by the Mediterranean bathymetry (Baird et al., 2002, Hickmott et al. in prep), whereas G. macrorhynchus off the coast of Tenerife may reach depths of more than 1000m in their pursuit of prey (Aguilar Soto, 2006; Aguilar Soto et al., 2008). The foraging behaviour of these animals seem to follow a circadian rhythm, with deeper dives during the day and somewhat shallower night time dives that
Page 20Page 20
� � �
presumably target the deep scattering layer (Aguilar Soto et al. 2008). Although breath-hold divers normally conserve oxygen by swimming slowly, these whales sometimes employ energetically costly sprints at the bottom of their day-time foraging dives, reaching vertical speeds of up to 9 m/s, possibly to catch large, calorific squid (Aguilar Soto et al. 2008).
The pilot whale core group is most often composed of animals of mixed age and sex, though
male groups have been observed in a few cases (Heimlich-Boran, 1993). All group members appear to be related while males within a group never appear to be the fathers of calves (Amos et al., 1993). This indicates that a high degree of natal philopatry, where individuals of both sexes remain in the same social group as their mother and mate with individuals of other social groups, seems to characterize the population structure of short-finned pilot whales (Heimlich-Boran, 1993). Such a highly constant, matrilineal group structure with reproduction restricted to temporary aggregations of several groups is also typical of killer whales (Baird, 2000). Pilot whale group cohesion is high, making these animals ideal targets of drive fisheries and susceptible to mass strandings. Groups of short-finned pilot whales (but apparently not long-finned pilot whales) often include old post-reproductive females (Kasuya & Marsh, 1984; Kasuya & Tai, 1993), a trait only seen in a few other mammals such as humans and killer whales (Foote, 2008). Such reproductive menopause may be favoured by kin selection if post-reproductive mothers are able to help related individuals to survive and reproduce, either directly (Baird, 2000) or through accumulated social knowledge as proposed for elephant matriarchs and cetaceans (McAuliffe & Whitehead, 2005). Natal philopatry combined with extra-group mating characteristic of short-finned pilot whales and killer whales may be determining factors in the evolution of reproductive senescence (Johnstone & Cant, 2010).
SENSORY CHALLENGES TO A MARINE LIFESTYLE
The two species studied here have adapted to life in an aquatic habitat. In order to acquire information about their surroundings, terrestrial mammals mainly rely on vision, hearing, chemoreception (taste and smell) and touch. However, a marine environment poses different limitations and opportunities to sensory systems than air. Most importantly, light is transmitted poorly underwater and hence the intensity of available light declines rapidly with increasing depth (Warrant & Locket, 2004). As a consequence of the decreased light availability, both the sensitivity and resolution of vision declines during night or with increasing depth (Warrant & Locket, 2004). Chemical signals are easily diffused and travel too slowly to facilitate rapid or long-distance communication. Conversely, sound waves propagate faster and attenuate less rapidly underwater than in air, and both absorption and reception of sound is largely independent of depth, weather conditions or the time of day (Urick, 1983). These acoustic properties make sound a good vehicle
Chapter I
Page 21Page 21
FRANTS�H.�JENSEN,�PHD�THESIS,�2011�
for fast, long-range transmission of information in the ocean and for acquiring information about predators or potential prey passively (by listening) or actively (by echolocating).
All cetaceans appear to rely on acoustics for many aspects of their behavioural ecology. Baleen
whales are known to produce low-frequency communication calls detectable over vast distances (Payne & Webb, 1971). Toothed whales also utilise sound for communication (Tyack, 2000), and have furthermore evolved the ability to find and track prey with echolocation (Au, 1993). The importance of this sense is best seen by the sudden radiation of all major toothed whale groups (sperm whales, beaked whales, delphinids and also Platanista) around 34 Million years ago (McGowen et al., 2009; Steeman et al., 2009), when toothed whale ancestors evolved high-frequency hearing and the ability to echolocate their prey (Liu et al., 2010).
As I will outline in the next section, toothed whales have undergone several modifications to
their sound production anatomy when they adapted to an aquatic lifestyle, facilitating the process of producing high-amplitude sounds for echolocation and communication even at depth.
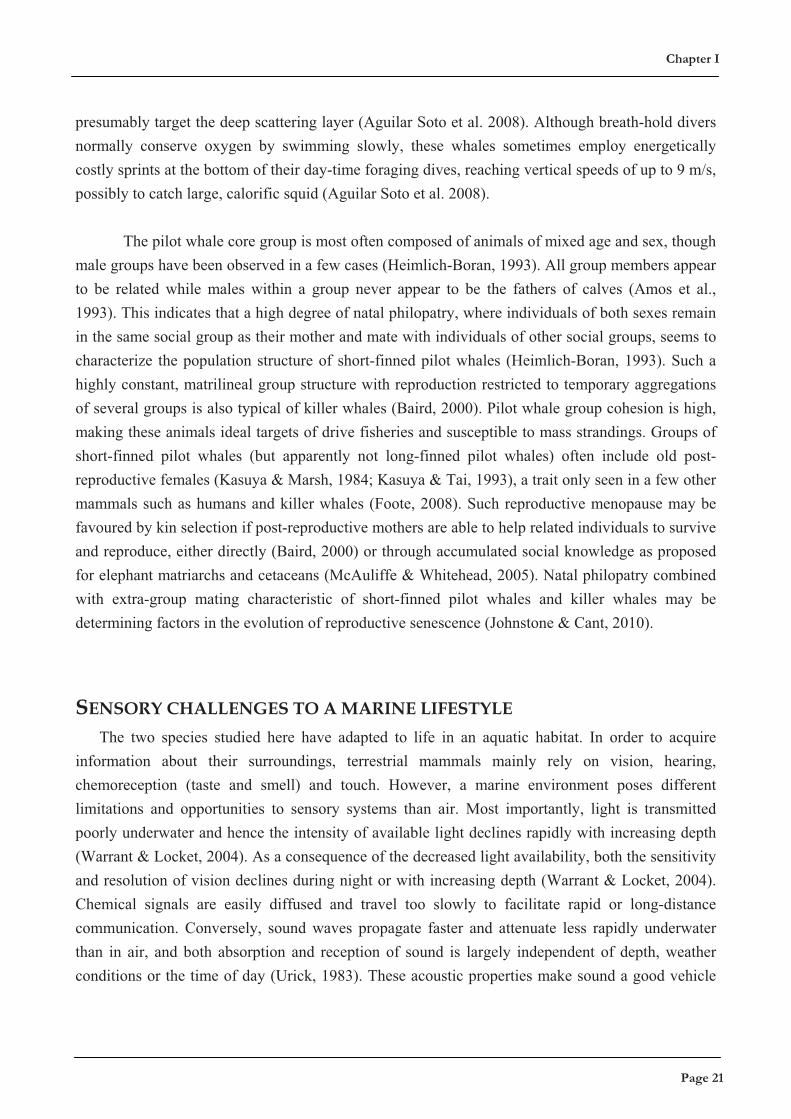
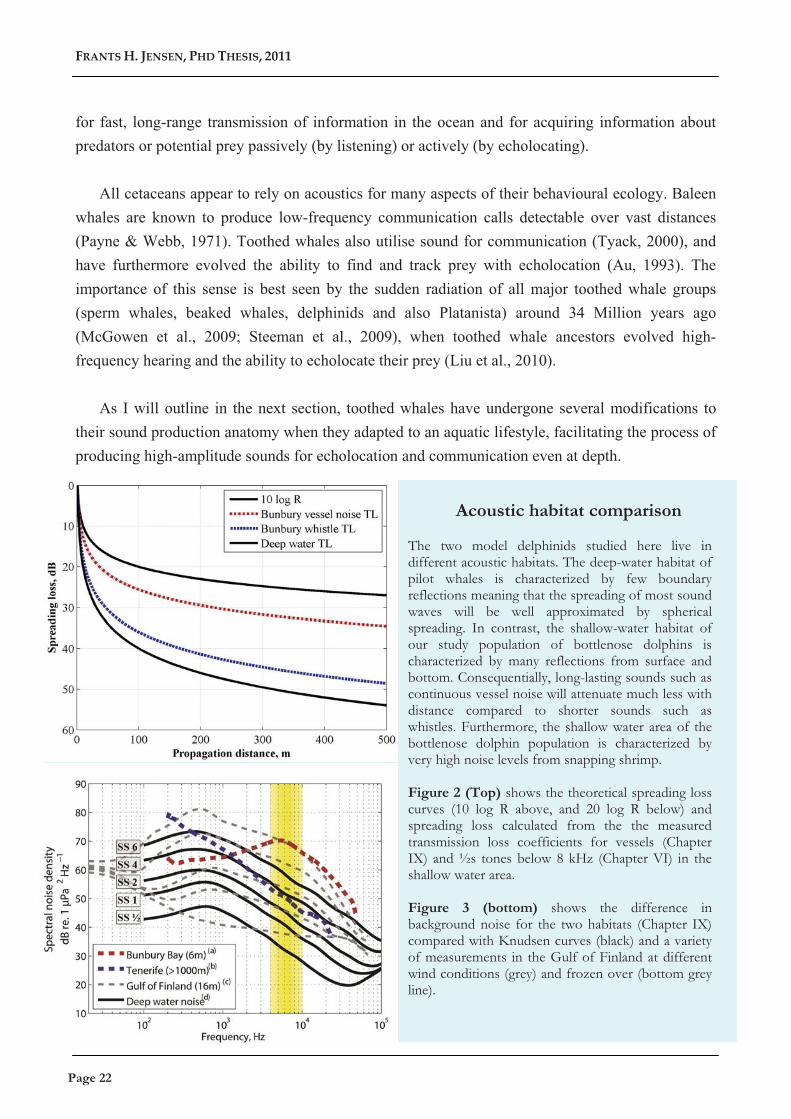
Acoustic habitat comparison The two model delphinids studied here live in different acoustic habitats. The deep-water habitat of pilot whales is characterized by few boundary reflections meaning that the spreading of most sound waves will be well approximated by spherical spreading. In contrast, the shallow-water habitat of our study population of bottlenose dolphins is characterized by many reflections from surface and bottom. Consequentially, long-lasting sounds such as continuous vessel noise will attenuate much less with distance compared to shorter sounds such as whistles. Furthermore, the shallow water area of the bottlenose dolphin population is characterized by very high noise levels from snapping shrimp. Figure 2 (Top) shows the theoretical spreading loss curves (10 log R above, and 20 log R below) and spreading loss calculated from the the measured transmission loss coefficients for vessels (Chapter IX) and ½s tones below 8 kHz (Chapter VI) in the shallow water area. Figure 3 (bottom) shows the difference in background noise for the two habitats (Chapter IX) compared with Knudsen curves (black) and a variety of measurements in the Gulf of Finland at different wind conditions (grey) and frozen over (bottom grey line).
Page 22Page 22
� � �
ODONTOCETE SOUND PRODUCTION
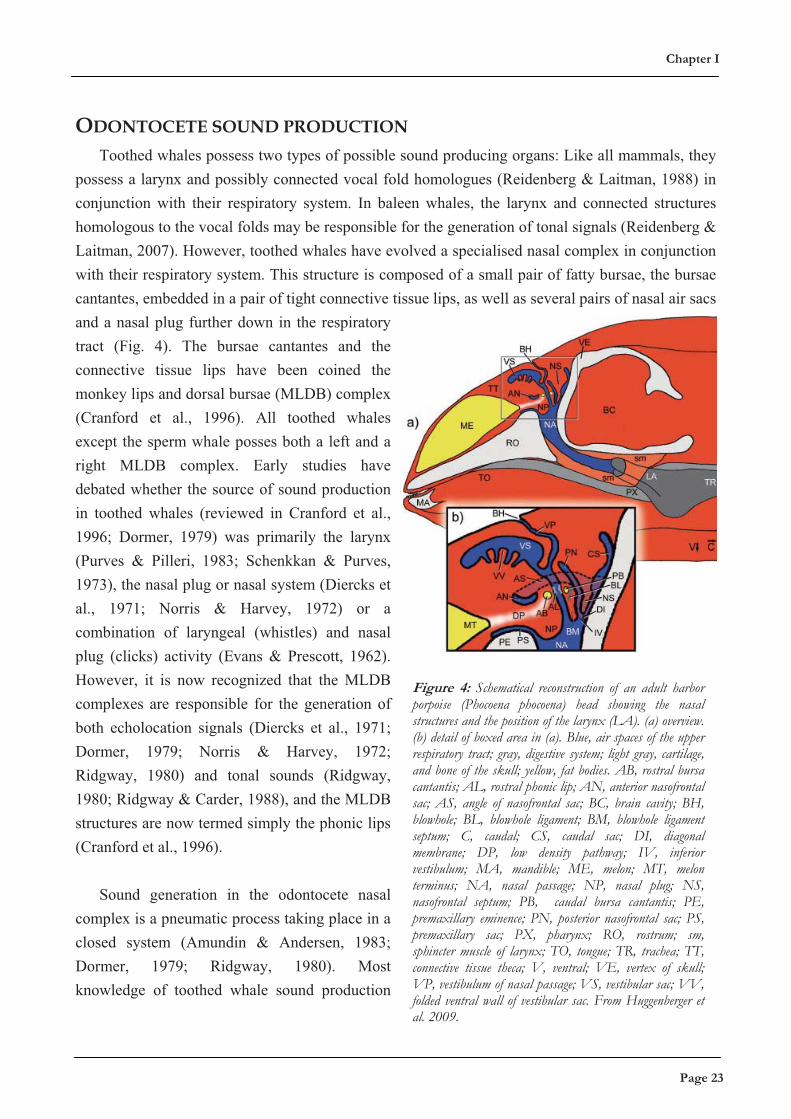
Toothed whales possess two types of possible sound producing organs: Like all mammals, they possess a larynx and possibly connected vocal fold homologues (Reidenberg & Laitman, 1988) in conjunction with their respiratory system. In baleen whales, the larynx and connected structures homologous to the vocal folds may be responsible for the generation of tonal signals (Reidenberg & Laitman, 2007). However, toothed whales have evolved a specialised nasal complex in conjunction with their respiratory system. This structure is composed of a small pair of fatty bursae, the bursae cantantes, embedded in a pair of tight connective tissue lips, as well as several pairs of nasal air sacs and a nasal plug further down in the respiratory tract (Fig. 4). The bursae cantantes and the connective tissue lips have been coined the monkey lips and dorsal bursae (MLDB) complex (Cranford et al., 1996). All toothed whales except the sperm whale posses both a left and a right MLDB complex. Early studies have debated whether the source of sound production in toothed whales (reviewed in Cranford et al., 1996; Dormer, 1979) was primarily the larynx (Purves & Pilleri, 1983; Schenkkan & Purves, 1973), the nasal plug or nasal system (Diercks et al., 1971; Norris & Harvey, 1972) or a combination of laryngeal (whistles) and nasal plug (clicks) activity (Evans & Prescott, 1962). However, it is now recognized that the MLDB complexes are responsible for the generation of both echolocation signals (Diercks et al., 1971; Dormer, 1979; Norris & Harvey, 1972; Ridgway, 1980) and tonal sounds (Ridgway, 1980; Ridgway & Carder, 1988), and the MLDB structures are now termed simply the phonic lips (Cranford et al., 1996).
Sound generation in the odontocete nasal
complex is a pneumatic process taking place in a closed system (Amundin & Andersen, 1983; Dormer, 1979; Ridgway, 1980). Most knowledge of toothed whale sound production
Figure 4: Schematical reconstruction of an adult harbor porpoise (Phocoena phocoena) head showing the nasal structures and the position of the larynx (LA). (a) overview. (b) detail of boxed area in (a). Blue, air spaces of the upper respiratory tract; gray, digestive system; light gray, cartilage, and bone of the skull; yellow, fat bodies. AB, rostral bursa cantantis; AL, rostral phonic lip; AN, anterior nasofrontal sac; AS, angle of nasofrontal sac; BC, brain cavity; BH, blowhole; BL, blowhole ligament; BM, blowhole ligament septum; C, caudal; CS, caudal sac; DI, diagonal membrane; DP, low density pathway; IV, inferior vestibulum; MA, mandible; ME, melon; MT, melon terminus; NA, nasal passage; NP, nasal plug; NS, nasofrontal septum; PB, caudal bursa cantantis; PE, premaxillary eminence; PN, posterior nasofrontal sac; PS, premaxillary sac; PX, pharynx; RO, rostrum; sm, sphincter muscle of larynx; TO, tongue; TR, trachea; TT, connective tissue theca; V, ventral; VE, vertex of skull; VP, vestibulum of nasal passage; VS, vestibular sac; VV, folded ventral wall of vestibular sac. From Huggenberger et al. 2009.
Chapter I
Page 23Page 23
FRANTS�H.�JENSEN,�PHD�THESIS,�2011�
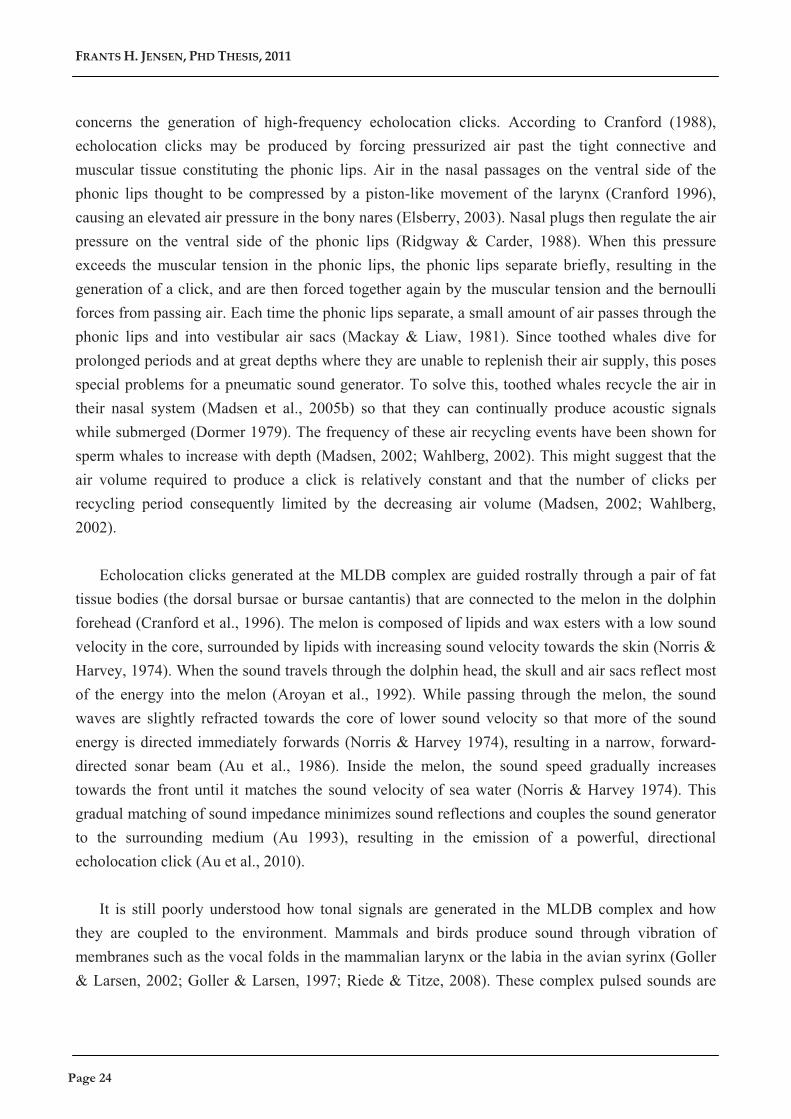
concerns the generation of high-frequency echolocation clicks. According to Cranford (1988), echolocation clicks may be produced by forcing pressurized air past the tight connective and muscular tissue constituting the phonic lips. Air in the nasal passages on the ventral side of the phonic lips thought to be compressed by a piston-like movement of the larynx (Cranford 1996), causing an elevated air pressure in the bony nares (Elsberry, 2003). Nasal plugs then regulate the air pressure on the ventral side of the phonic lips (Ridgway & Carder, 1988). When this pressure exceeds the muscular tension in the phonic lips, the phonic lips separate briefly, resulting in the generation of a click, and are then forced together again by the muscular tension and the bernoulli forces from passing air. Each time the phonic lips separate, a small amount of air passes through the phonic lips and into vestibular air sacs (Mackay & Liaw, 1981). Since toothed whales dive for prolonged periods and at great depths where they are unable to replenish their air supply, this poses special problems for a pneumatic sound generator. To solve this, toothed whales recycle the air in their nasal system (Madsen et al., 2005b) so that they can continually produce acoustic signals while submerged (Dormer 1979). The frequency of these air recycling events have been shown for sperm whales to increase with depth (Madsen, 2002; Wahlberg, 2002). This might suggest that the air volume required to produce a click is relatively constant and that the number of clicks per recycling period consequently limited by the decreasing air volume (Madsen, 2002; Wahlberg, 2002).
Echolocation clicks generated at the MLDB complex are guided rostrally through a pair of fat
tissue bodies (the dorsal bursae or bursae cantantis) that are connected to the melon in the dolphin forehead (Cranford et al., 1996). The melon is composed of lipids and wax esters with a low sound velocity in the core, surrounded by lipids with increasing sound velocity towards the skin (Norris & Harvey, 1974). When the sound travels through the dolphin head, the skull and air sacs reflect most of the energy into the melon (Aroyan et al., 1992). While passing through the melon, the sound waves are slightly refracted towards the core of lower sound velocity so that more of the sound energy is directed immediately forwards (Norris & Harvey 1974), resulting in a narrow, forward-directed sonar beam (Au et al., 1986). Inside the melon, the sound speed gradually increases towards the front until it matches the sound velocity of sea water (Norris & Harvey 1974). This gradual matching of sound impedance minimizes sound reflections and couples the sound generator to the surrounding medium (Au 1993), resulting in the emission of a powerful, directional echolocation click (Au et al., 2010).
It is still poorly understood how tonal signals are generated in the MLDB complex and how
they are coupled to the environment. Mammals and birds produce sound through vibration of membranes such as the vocal folds in the mammalian larynx or the labia in the avian syrinx (Goller & Larsen, 2002; Goller & Larsen, 1997; Riede & Titze, 2008). These complex pulsed sounds are
Page 24Page 24
� � �
subsequently filtered through associated air spaces, producing the timbre of mammalian and avian calls (Nowicki, 1987). In contrast, human whistles are produced aerodynamically by blowing air past a sharp edge, where the resulting air vortices excite resonant air spaces such as the mouth cavity (Wilson et al., 1971). In this case, the fundamental frequency would be determined by the resonance frequency of the air spaces rather than the vibration frequency of the vocal folds. Toothed whales have also been argued to produce whistles aerodynamically (Lilly, 1962). However, toothed whales vocalizing at great depths, where air spaces are necessarily small, seem to have the energy of their whistles shifted to higher harmonics (Ridgway et al., 2001) and no effect on the fundamental frequency is evident (Chapter VII: Jensen et al.). Following up on this evidence, our recent investigations with dolphins breathing a heliox mixture do not support the idea that tonal sounds are produced aerodynamically like human whistles (Chapter V: Madsen et al.). Rather, analogously to the vibrations of mammalian vocal cords, tonal sounds in toothed whales seem to be produced by the phonic lips vibrating continuously rather than snapping open periodically as when producing a click (Chapter V: Madsen et al.). This is also illustrated in the pneumatic driving force since it appears that a greater nasal pressure is required to produce a whistle compared to a click train (Elsberry, 2003; Ridgway & Carder, 1988). Modulating the frequency of a whistle might then happen by changing the muscular tension of the phonic lips or perhaps by altering the nasal pressure driving the vibration as is the case for birds (Mindlin and Raje 2005) rather than changing the size of air sacs as postulated by Lilly (1962).
Toothed whales (with the exception of the sperm whale) have two functionally separate phonic
lips pairs, one for each nasal passage (Cranford 1996). In whistling delphinids, these complexes are asymmetric whereas in porpoises and non-whistling delphinids of the Cephalorhynchus and Lagenorhynchus genera, the MLDB complexes are symmetric. This has given rise to speculations that the two sound production organs can be activated simultaneously to produce a single click (Cranford et al. 1996) with the advantage that the click would contain double the acoustic energy and that the timing between activation of the sound sources could result in dynamic beamforming in the horizontal plane (Cranford et al. 1996). While a single study has claimed support for this hypothesis (Lammers & Castellote, 2009), porpoises generate echolocation signals with the right pair of phonic lips (Madsen et al., 2010) and many previous studies have reported click production preferably from the right side of the odontocete head (reviewed in Madsen et al. 2010). While the possibilities for using the two sound generators to generate a single click are questionable, multiple studies report simultaneous click and whistle production (Lammers et al., 2003; Lilly, 1962; Markov & Ostrovskaya, 1990) and possibly even simultaneous production of several tonal sounds (Caldwell & Caldwell, 1969) making it likely that both sound production complexes can be activated at the same time.
Chapter I
Page 25Page 25
FRANTS�H.�JENSEN,�PHD�THESIS,�2011�
It is possible that the asymmetric MLDB complexes in whistling delphinids may be functionally specialized. The MLDB complex in the left side is always smaller than the MLDB complex in the right side of whistling delphinids (Cranford 1996). This might lead us to hypothesize that the left pair of phonic lips is adapted to produce whistles since the mass of the phonic lips is smaller and less energy is needed to vibrate the membranes back and forth. In contrast, the greater mass of the right phonic lips might favour a slower excitation pattern, such as the pulsed generation of clicks. In fact, studies do seem to indicate that whistles are preferentially associated with the left MLDB complex (Cranford 2000, Dormer 1979) and clicks with the right MLDB complex (Dormer 1979, Mackay and Liaw 1981, Au et al. 2010). While investigations on the tension and structure of the two pairs of phonic lips are needed to properly evaluate this hypothesis, interesting parallels can be found by examining the functional morphology of the avian syrinx. In songbirds, the size and tension of the syringeal labia as well as the subsyringeal air pressure seems to determine the fundamental frequency of their vocalizations (Mindlin & Laje, 2005; Riede & Goller, 2010). Small birds may even produce lower fundamental frequencies than large birds if they possess larger labia (Riede & Goller, 2010). While a direct analogy to the asymmetric sound generation complexes cannot be found among birds or non-odontocete mammals, it is nevertheless fascinating to speculate on the functional significance of this asymmetry.
Modifications to the sound production apparatus are not adequate to convert artiodactyls into
efficient echolocating toothed whales. Through the next two sections, I will therefore describe the modifications to the auditory system and the auditory capabilities that toothed whales have.
Why toothed whales inhale before
diving while pinnipeds don’t - A lung reservoir hypothesis
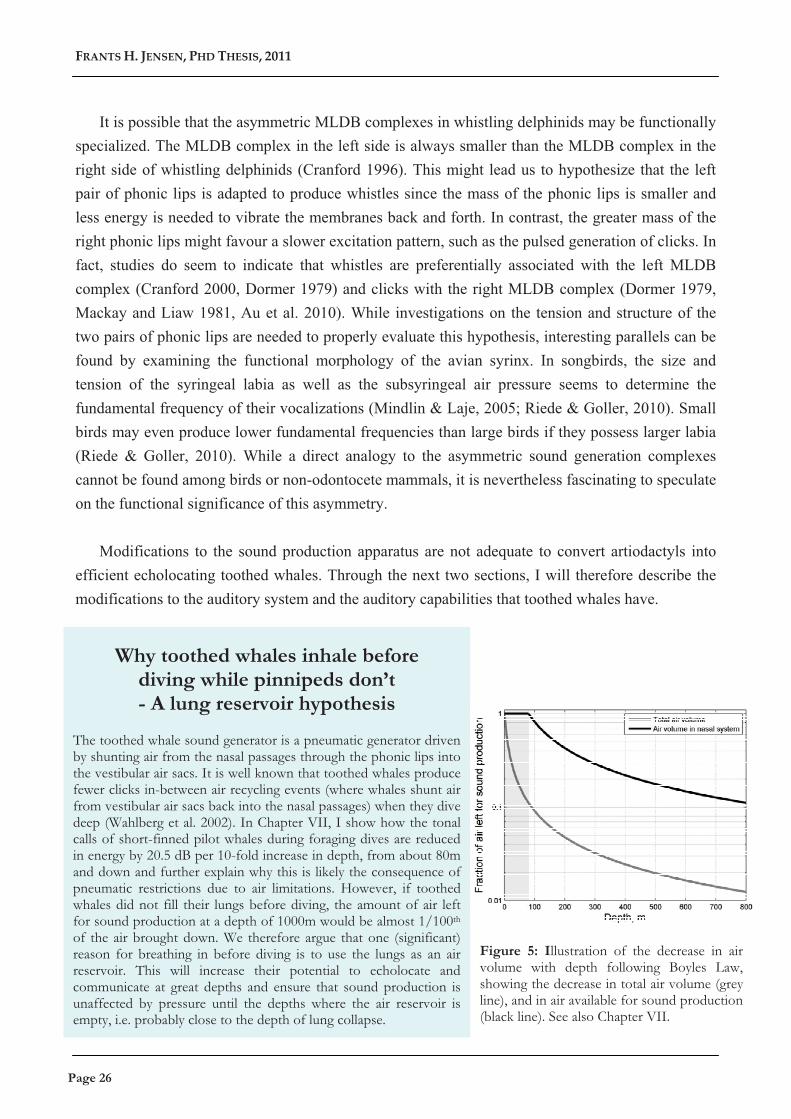
The toothed whale sound generator is a pneumatic generator driven by shunting air from the nasal passages through the phonic lips into the vestibular air sacs. It is well known that toothed whales produce fewer clicks in-between air recycling events (where whales shunt air from vestibular air sacs back into the nasal passages) when they dive deep (Wahlberg et al. 2002). In Chapter VII, I show how the tonal calls of short-finned pilot whales during foraging dives are reduced in energy by 20.5 dB per 10-fold increase in depth, from about 80m and down and further explain why this is likely the consequence of pneumatic restrictions due to air limitations. However, if toothed whales did not fill their lungs before diving, the amount of air left for sound production at a depth of 1000m would be almost 1/100th of the air brought down. We therefore argue that one (significant) reason for breathing in before diving is to use the lungs as an air reservoir. This will increase their potential to echolocate and communicate at great depths and ensure that sound production is unaffected by pressure until the depths where the air reservoir is empty, i.e. probably close to the depth of lung collapse. (black line). See also Chapter VII.
Figure 5: Illustration of the decrease in air volume with depth following Boyles Law, showing the decrease in total air volume (grey line), and in air available for sound production
Page 26Page 26
� � �
ODONTOCETE SOUND RECEPTION
The mammalian auditory system is subdivided into three parts consisting of the outer ear, the middle ear and the inner ear. In contrast to land-living mammals, toothed whales do not have any external, visible ears or air-filled external channels (Ketten, 1992). Instead, sound is received primarily through the lower jaw and transmitted to the middle and inner ears through a small channel in the mandible (Brill et al., 1988). This channel is filled with lipids similar to those found in the melon (Varanasi & Malins, 1971). Due to the low sound absorption and role in sound conduction, this tissue is commonly termed acoustic fat (Varanasi & Malins, 1971). Once sound has been picked up by the lower jaw and transmitted to the tympanic bullae and the middle ear, it is coupled to the oval window of the inner ear through vibrations in a part of the middle ear termed the tympanic plate (Hemila et al., 1999; Nummela et al., 1999a; Nummela et al., 1999b). The middle ear acts as an impedance matching device that counteracts the transmission loss between the surrounding water and cochlear fluid by amplifying the particle velocity of incoming sound vibrations (Hemila et al., 1999; Nummela et al., 1999a; Nummela et al., 1999b). Middle ear bones also possess characteristic resonance frequencies that may have an impact on the hearing range and hearing sensitivity (Rosowski, 1992). Once transferred to the oval window at the start of the inner ear, sound vibrations travel down through the fluid of the mammalian cochlea. The cochlea is coiled and contains the basilar membrane and associated hair cells. Displacement of the basilar membrane is detected by associated mechanoreceptive inner hair cells that encode the stimuli intensity into a repetition rate of neuronal impulses relayed to the central nervous system (Brill et al., 2001). The stiffness of the basilar membrane decreases with distance from the oval window (Moffet et al. 1993). Frequency partitioning in the cochlea is thought to result from this stiffness gradient because high-frequency sounds would accelerate parts of the basilar membrane close to the oval window, whereas sounds of lower frequencies accelerate parts of the basilar membrane further from the oval window (Moffet et al. 1993, Randall et al. 2001). The morphology of odontocete inner-ear laminae seems to reflect acoustic specializations across odontocete species (Ketten, 1992) and may to a large part explain species-specific differences in auditory capacities.
Chapter I
Page 27Page 27

FRANTS�H.�JENSEN,�PHD�THESIS,�2011�
AUDITORY CAPABILITIES The hearing abilities of toothed whales have been well studied over the last 50 years. A key difference compared to their terrestrial ancestors is that toothed whales are able to detect very high frequencies (Johnson, 1968a) and achieve much better temporal resolution (Popov & Supin, 1997), both abilities are crucial for echolocation. Auditory threshold curves describing the hearing sensitivities at different frequencies have been measured for a variety of toothed whales, generally showing good sensitivity up to 120-150 kHz for bottlenose dolphins (T. truncatus) for both pure-tone signals (Johnson, 1968a) and broadband transients (Au 2002). Audiograms vary considerably across individuals (Popov et al. 2007), and this might be the result of a gradual hearing loss with age (Houser & Finneran, 2006; Kloepper et al., 2010).
Toothed whales are able to resolve very small time differences, an ability that is essential for range estimation during echolocation. The integration time for tonal signals around 4 kHz is approximately 200 ms for bottlenose dolphins (Johnson, 1968b) and slightly higher for porpoises (Kastelein et al., 2010), close to the integration time of humans at this frequency. However, above 4 kHz, the integration time decreases, giving a better temporal resolution for tones at higher frequencies. The reception of transients such as biosonar clicks, the auditory resolution is even better. For high-frequency echolocation clicks, delphinids have an acute temporal resolution as short as 2-300 μs (Au, 1993; Supin & Popov, 1995) and studies have reported that individual clicks can be followed up to click repetition rates from 800 clicks per second (Szymanski et al., 1998) to more than 1250 clicks per second (Dolphin et al., 1995; Mooney et al., 2009). An accurate angular auditory resolution within a few degrees, both during echolocation and passive listening, further facilitates the task of locating prey items acoustically (Au, 1993; Branstetter & Mercado, 2006).
The auditory specializations of toothed whales also include acute frequency discrimination
capabilities necessary for detailed target discrimination (Yovel & Au, 2010). Delphinds can detect tiny differences in the wall thickness of cylinders (Au & Pawloski, 1992) and may extract enough information from returning target echoes to discriminate between different prey items (Au et al., 2009; Yovel & Au, 2010). Curiously, few studies have addressed the basis for this prey discrimination. We know that bottlenose dolphins tasked to discriminate between tones of slightly different frequencies are able to discriminate sounds differing in frequency by less than 1.3% and down to 0.2% within the entire hearing range of 1-140 kHz (Thompson & Herman, 1975). However, we have little knowledge on how well frequency difference limens derived from pure tones translate into difference limens for biosonar signals. An animal tasked with discriminating targets with its biosonar would have to detect subtle spectral differences in very short echoes rather than long sinusoidal signals. Although the frequency resolution for tonal signals coupled with
Page 28Page 28
� � �
behavioural studies of discrimination abilities may hint at the exceptional biosonar frequency resolution, it has yet to be measured.
Critical ratios and critical bands (Fletcher, 1940) are important for determining the masking
potential of noise. For narrowband signals, noise at frequencies close to the signal frequency will interfere with signal detection. The auditory frequency analyzer in the mammalian cochlea is normally modelled as a bank of overlapping filters thought to represent the frequency response of individual inner ear hair cells (Fletcher 1940). Auditory filters in the bottlenose dolphin auditory system are reportedly roughly proportional to the center frequency of the test signal (constant Q, meaning that the auditory tuning does not change with frequency) (Au & Moore, 1990; Johnson, 1968a). Au & Moore (1990) measured critical bandwidths slightly higher than one-third of an octave for bottlenose dolphins (roughly 23% of the center frequency), which is the typically assumed masking bandwidths for mammals detecting pure tones in white noise. However, estimates of critical ratios, indicating the ratio between masked detection levels and Gaussian spectral noise levels, are typically somewhat lower than 1/3rd of an octave and closer to 1/12th of an octave (Au & Moore, 1990; Johnson, 1968a). Notched-noise experiments estimating the equivalent rectangular bandwidths of the dolphin auditory system also seem to be intermediate between 1/3rd and 1/12th of an octave and shows that critical bandwith may depend on center frequency and noise level (Finneran et al., 2002; Lemonds et al., 2000). Furthermore, some toothed whales differ in their auditory specializations. Porpoises and a few non-whistling delphinids use echolocation signals with most of the energy concentrated around 120-140 kHz (Kyhn et al., 2010; Kyhn et al., 2009), and both species of porpoises investigated so far have very narrow auditory bandwidths around echolocation frequencies (Popov et al., 2006). Furthermore, the spectral resolution of porpoises is completely unknown, but it may be speculated that these animals need a highly accurate spectral resolution around echolocation frequencies in order to maximize the information that can be extracted from returning narrow-band echoes.
SOUND PROPAGATION Effective underwater biosonar and acoustic communication not only depends on the transmitting and receiving systems but also on propagation through the intermediate medium as well as the masking noise in the habitat. When sound waves travel from the sender to receiver, they are filtered and attenuated depending on their wavelength. Sound attenuation is usually divided into the two components of spreading loss and sound absorption (Urick, 1983). When a sound is broadcast into the environment, it will travel away from the source in a sphere of increasing radius. The total sound energy in the propagating wave is constant but will cover a gradually increasing area. If the sound propagates in an acoustic free field, the sound pressure at a point on this surface will diminish with 20 log(R) in what is coined spherical spreading (Urick, 1983). In contrast, sounds that
Chapter I
Page 29Page 29
FRANTS�H.�JENSEN,�PHD�THESIS,�2011�
propagate in an ideal channel where reflections from surface and bottom add up with the direct signal will undergo cylindrical spreading, with the sound pressure diminishing with 10 log(R) (Urick 1983). Since sound waves will refract towards areas with lower sound velocity, such near-cylindrical spreading can be found in the SOFAR channel, a zone of low sound velocity in the deep oceans at moderate depths, surrounded by increasing sound velocity towards the surface and bottom (Bradbury & Vehrenkamp, 1998). In natural settings, spreading loss is often more intermediate between these two theoretical spreading estimates and may depend on the length and frequency of the signal and especially also on depth. For the shallow-water habitat of the bottlenose dolphins studied here, I find that long-duration vessel noise suffers much less spreading loss than tones and sweeps do (Chapter VI and Chapter IX. See also Fig. 2 in box). In addition to spreading loss, the kinematic part of the sound field that gives rise to a travelling pressure wave will generate friction in the medium. As the wave travels, some of the acoustic energy is converted into heat due to this friction in proportion to the linear propagation distance. The frequency-dependent sound absorption coefficient increases exponentially with the frequency of the sound wave so that low-frequency sounds will suffer less absorption than high-frequency sounds.
UNDERWATER AMBIENT NOISE Acoustic signals arriving at a receiver need to be detected or discriminated from the ambient noise before successful transmission has taken place. Increased noise in frequencies close to the signal may therefore decrease the detection probability and mask the signal. The critical bands within the hearing system (Fletcher 1940) generally determine the susceptibility to noise for narrowband signals. However, for broadband signals covering several critical bands, the total masking noise would be integrated over the entire signal bandwidth under normal circumstances.
Ambient noise in the ocean is generated by many different sources. Wind and waves are among the most important natural contributors to noise in the oceans, increasing ambient noise levels in relation to the wind speed at the surface of the water (Wenz, 1962). Close to coastlines, surf noise generated at the interface between land and water may generate additional underwater noise, and also precipitation and seismic activities may influence noise spectra (Richardson et al., 1995). Furthermore, many marine organisms produce sounds that travel far and may contribute significantly to noise levels in some areas. Chorusing humpback whales during the mating season may elevate noise levels over great distances (Au & Green, 2000), but the marine organism with the most profound impact on noise levels in many subtropical coastal areas is the snapping shrimp (Au & Banks, 1998). These animals are the primary cause of the higher levels of ambient noise found in Bunbury Bay when compared to the deeper Tenerife study site (Chapter IX: Jensen et al., 2009b). Finally, it has become evident that a wide range of anthropogenic activities may contribute to, or
Page 30Page 30
� � �
even dominate, ambient noise levels in many areas (Richardson 1995). Although much recent research has tried to address the effects of human activities on cetacean populations, specifically effects of underwater noise (Nowacek et al., 2007; Weilgart, 2007), our knowledge is still limited and lacking in many areas. Chapter IX in this thesis tries to alleviate this by quantifying the effects of noise generated from small vessels on the natural communication range of two delphinids. In this chapter, I demonstrate that wild delphinids are occasionally subjected to high levels of anthropogenic noise that may affect their communication behaviour and hinder communication between group members. Noise levels generated by small vessels are primarily determined by their speed, increasing for higher speeds as a result of greater cavitation noise (Ross, 1976). The elevated noise levels from a fast moving vessel may have a severe effect on the communication range of nearby cetaceans, even at great distance. Keeping speeds below 5 knots and maintaining reasonable distance (following the allowed approach distances for whale watch vessels, for instance) will greatly reduce the impact of masking on delphinids.
Through the next section, I will describe the different categories of sounds produced by toothed whales, before turning to the more functional aspects of these sounds.
STRUCTURAL CATEGORIES OF ACOUSTIC SIGNALS
Traditionally, underwater sounds of dolphins have been grouped into three structural categories consisting of clicks, burst-pulse sounds and whistles (Caldwell et al., 1990) and two functional categories consisting of echolocation clicks used for navigation and prey detection, and burst-pulsed sounds and whistles used for communication (Herzing, 2000). Because of the difficulty in ascribing some signals to a specific function, the structural categorization is most frequently used.
Clicks are high-frequency, directional transients produced by all studied toothed whales.
They primarily function in gathering information about the environment and potential prey, a concept that will be addressed further in the following section on echolocation. However, some animals such as sperm whales, porpoises and non-whistling delphinids, do not produce tonal sounds and seem to use clicks for social communication as well (Clausen et al., 2010; Dawson, 1991; Madsen et al., 2005a).
Burst-pulse sounds are clicks emitted at a high repetition rate so that they appear tonal to the
investigator. Whether they serve in prey catching situations like echolocation buzzes or creaks (Miller et al., 2004) is debatable. Some toothed whales such as killer whales seem to use them as calls with communicative significance (Foote et al., 2008). Some confusion have arisen previously
Chapter I
Page 31Page 31
FRANTS�H.�JENSEN,�PHD�THESIS,�2011�
because of their apparent tonal qualities, but it is important to bear in mind that the acute temporal resolution of delphinids determine whether a burst-pulsed sound is perceived as individual clicks or as a tonal sound. Most studies indicate that individual clicks can be followed for repetition rates as high as 800-1450 clicks per second depending on the species studied (Dolphin 1995, Popov and Supin 1995, Mooney et al. 2009a,b).
Whistles are narrowband tonal sounds that are often modulated in frequency (Herzing
2000). They are highly varied, consisting of a fundamental frequency contour and often several harmonics that occur at multiples of the fundamental. Because of their relatively low frequencies compared to echolocation clicks and burst pulses, they have been well studied through the last half a decade and a lot of our understanding of delphinid communication derives from studies of bottlenose dolphin whistles.
Apart from these three groups, many toothed whales exhibit other behaviours that may function as signals or cues to conspecifics. These include tail or flipper slaps, breaching, and producing underwater jaw-claps (Herzing 2000) and pops (Connor & Smolker, 1996). Lusseau (2007) suggests that aerial activities function as short-range communication signals within bottlenose dolphin groups, and several of these signals have been observed in close-range social communication, including aggressive displays (Connor & Smolker, 1996).
ECHOLOCATION
Active echolocation or biosonar is the process of emitting sound signals and then locating and discriminating ensonified objects based on the returning echoes (Griffin, 1958). The characteristics of echolocation signals depend on the sound producing and receiving organs and on the acoustic ecology of the species in question. Toothed whales have evolved several different types of echolocation signals depending on their size as well as the evolutionary pressures from habitats, prey items and predators. Most delphinids, including pilot whales and bottlenose dolphins, produce high-frequency broadband clicks with centroid frequencies generally higher than 50-60 kHz (Au 1993). Three other click types have evolved among beaked whales, sperm whales and a diverse assembly of porpoises, kogia and some non-whistling delphinids, possibly as a result of different phylogenetic histories or ecological pressures (e.g. Morisaka & Connor, 2007).
Toothed whale echolocation signals are short, ultrasonic transients that are projected out of
the melon in a narrow beam. They are often characterized by a combination of spectral and temporal source parameters such as their duration and frequency content, directionality, and amplitude. All biosonar signals have a high frequency compared to the size of the transducer
Page 32Page 32
� � �
(Urick, 1983) and are therefore highly directional. As a consequence, it is essential to quantify biosonar signals in the direction of the acoustic axis (the center of the sound beam), where most of the sound energy is focused by the skeletal structures, air sacs and melon in the toothed whale head (Aroyan 1992, Au 1993). The sound level of the echolocation click measured 1m in front of the animal on its acoustic axis is defined as the source level (Madsen & Wahlberg, 2007), a quantitative assessment of the amplitude of the biosonar click produced by the animal.
For the toothed whale to receive any information about the environment, the generated
echolocation click needs to travel to a potential target, generate an echo by reflecting off the target, and then be received at a signal to noise ratio (SNR) that allows the toothed whale to detect and classify the ensonified object. While propagating through the environment, the signal will undergo spherical spreading loss and frequency-dependent absorption, the combination of which equals the transmission loss. Once the sonar signal reaches the target, a fraction of the energy given by the target strength will be reflected back towards the source. The amount of reflected energy increases with the size of the target and also depends on the impedance mismatch between water and body composition if the prey. The echo, containing spectral cues of the target structure based on its impulse response, then undergoes spherical spreading and absorbtion loss before returning to the echolocating animal.
When the echo arrives back at the ears of the echolocating toothed whale, the echo has to be
detected and interpreted. This means that the level of the echo should (1) exceed the absolute hearing threshold of the animal, (2) be discernible above the background noise, clutter or reverberation noise in the signal frequency band and (3) be classified as a potential prey item.
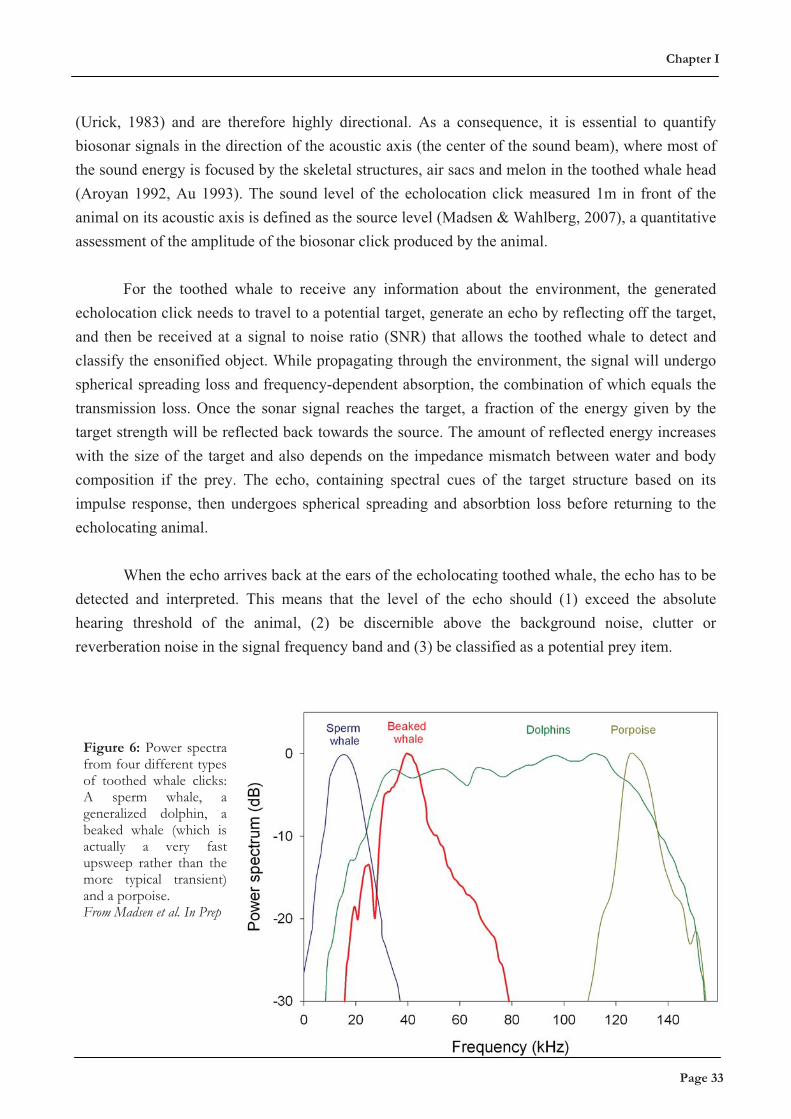
Figure 6: Power spectra from four different types of toothed whale clicks: A sperm whale, a generalized dolphin, a beaked whale (which is actually a very fast upsweep rather than the more typical transient) and a porpoise. From Madsen et al. In Prep
Chapter I
Page 33Page 33
FRANTS�H.�JENSEN,�PHD�THESIS,�2011�
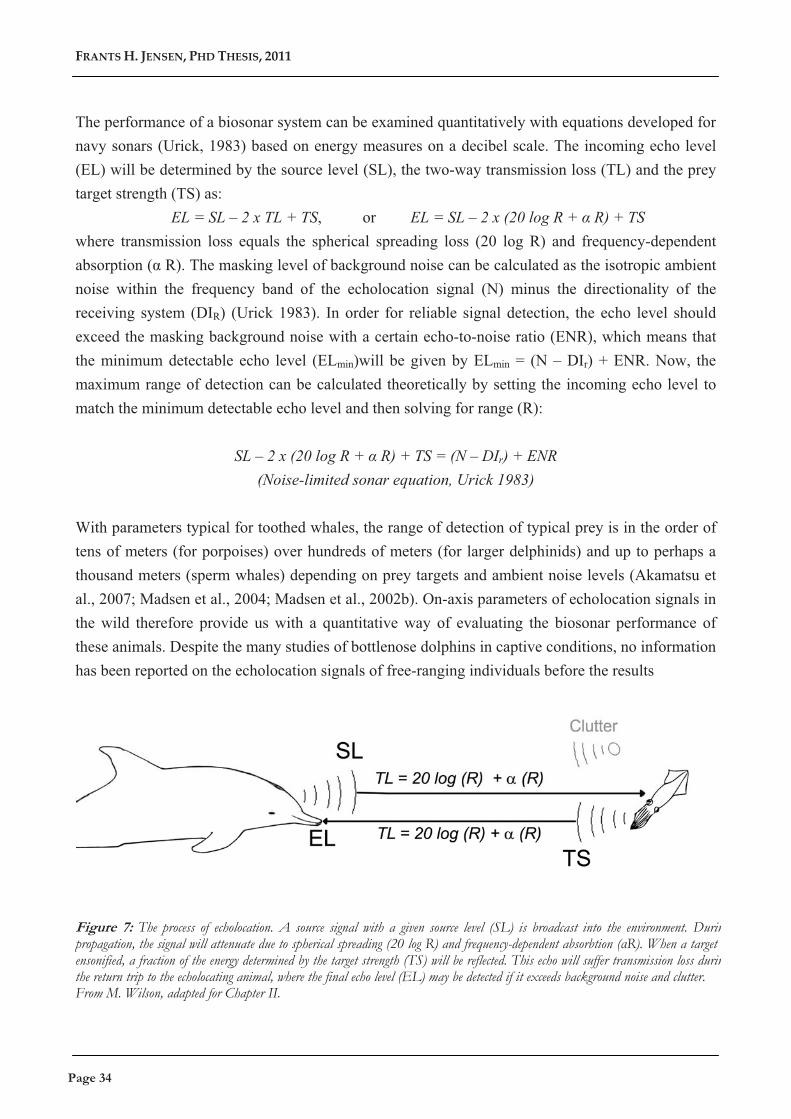
The performance of a biosonar system can be examined quantitatively with equations developed for navy sonars (Urick, 1983) based on energy measures on a decibel scale. The incoming echo level (EL) will be determined by the source level (SL), the two-way transmission loss (TL) and the prey target strength (TS) as:
EL = SL – 2 x TL + TS, or EL = SL – 2 x (20 log R + � R) + TS where transmission loss equals the spherical spreading loss (20 log R) and frequency-dependent absorption (� R). The masking level of background noise can be calculated as the isotropic ambient noise within the frequency band of the echolocation signal (N) minus the directionality of the receiving system (DIR) (Urick 1983). In order for reliable signal detection, the echo level should exceed the masking background noise with a certain echo-to-noise ratio (ENR), which means that the minimum detectable echo level (ELmin)will be given by ELmin = (N – DIr) + ENR. Now, the maximum range of detection can be calculated theoretically by setting the incoming echo level to match the minimum detectable echo level and then solving for range (R):
SL – 2 x (20 log R + � R) + TS = (N – DIr) + ENR
(Noise-limited sonar equation, Urick 1983)
With parameters typical for toothed whales, the range of detection of typical prey is in the order of tens of meters (for porpoises) over hundreds of meters (for larger delphinids) and up to perhaps a thousand meters (sperm whales) depending on prey targets and ambient noise levels (Akamatsu et al., 2007; Madsen et al., 2004; Madsen et al., 2002b). On-axis parameters of echolocation signals in the wild therefore provide us with a quantitative way of evaluating the biosonar performance of these animals. Despite the many studies of bottlenose dolphins in captive conditions, no information has been reported on the echolocation signals of free-ranging individuals before the results
Figure 7: The process of echolocation. A source signal with a given source level (SL) is broadcast into the environment. Durinpropagation, the signal will attenuate due to spherical spreading (20 log R) and frequency-dependent absorbtion (�R). When a target iensonified, a fraction of the energy determined by the target strength (TS) will be reflected. This echo will suffer transmission loss durinthe return trip to the echolocating animal, where the final echo level (EL) may be detected if it exceeds background noise and clutter. From M. Wilson, adapted for Chapter II.
Page 34Page 34
� � �
presented in this dissertation (Chapter III: Wahlberg et al.). In this study, we find that bottlenose dolphins in Bunbury Bay use biosonar signals of much higher source levels than in concrete pools, but lower source level and slightly higher directionality compared to signals recorded in net pens doing target detection trials (Au et al. 1993). We also find very consistent and stereotyped on-axis power spectra of these animals that does not support the grouping of bottlenose dolphin clicks into 4 different signal categories (Au, 1993) but such a stereotyped energy distribution may be useful for quick target recognition using spectral cues in the echoes.
Figure 8: Comparison between the power spectrum of a bottlenose dolphin click averaged over all on-axis clicks (Chapter III) and the power spectrum of a pilot whale recorded at the surface (Jensen et al. unpublished data). Using similar methodology to Chapter II and Chapter III, I found that pilot whale clicks recorded at the surface had source levels of 195 dB re. 1 μPa (rms), ranging from 184-204, comparable to the levels recorded for Tursiops. Mean centroid frequencies were around 69 ±3 kHz, lower than the Tursiops clicks recorded in Bunbury. However, subsequent DTAG analyses revealed that pilot whales use much higher click amplitudes during actual foraging.
BIOSONAR BEHAVIOUR The acoustic world of an echolocating odontocete is composed of sequential echolocation clicks, each of which produces echoes from different objects ensonified by the acoustic beam. On top of this, additional information may be derived from other sound sources such as potential predators or conspecifics through passive listening. The information generated by the animal itself through its echolocation clicks is often termed the actively generated auditory scene (Moss & Surlykke, 2001) and can be changed by the animal itself through changes in the properties and timing of biosonar signals. For a mobile predator trying to intercept a moving prey item in a complex, three-dimensional world cluttered with other objects and with varying levels of masking noise, considerable evolutionary pressure must have shaped this biosonar behaviour to optimize the chance of successfully catching prey (Kalko & Schnitzler, 1993; Siemers et al., 2001)
Bat foraging is typically divided into three phases consisting of sequential search, approach and capture behaviour (Kalko, 1995)and these phases can overall be found in foraging toothed whales as well (Madsen et al., 2005b). The initial search phase in toothed whales is characterized by high-amplitude echolocation clicks that are emitted at regular, low click intervals (Miller et al., 2004) that may reflect the typical search distance (Au, 1993; Verfuss et al., 2009). During the capture event, click source levels decrease and repetition rates increase for both bats (Kalko, 1995)
Chapter I
Page 35Page 35
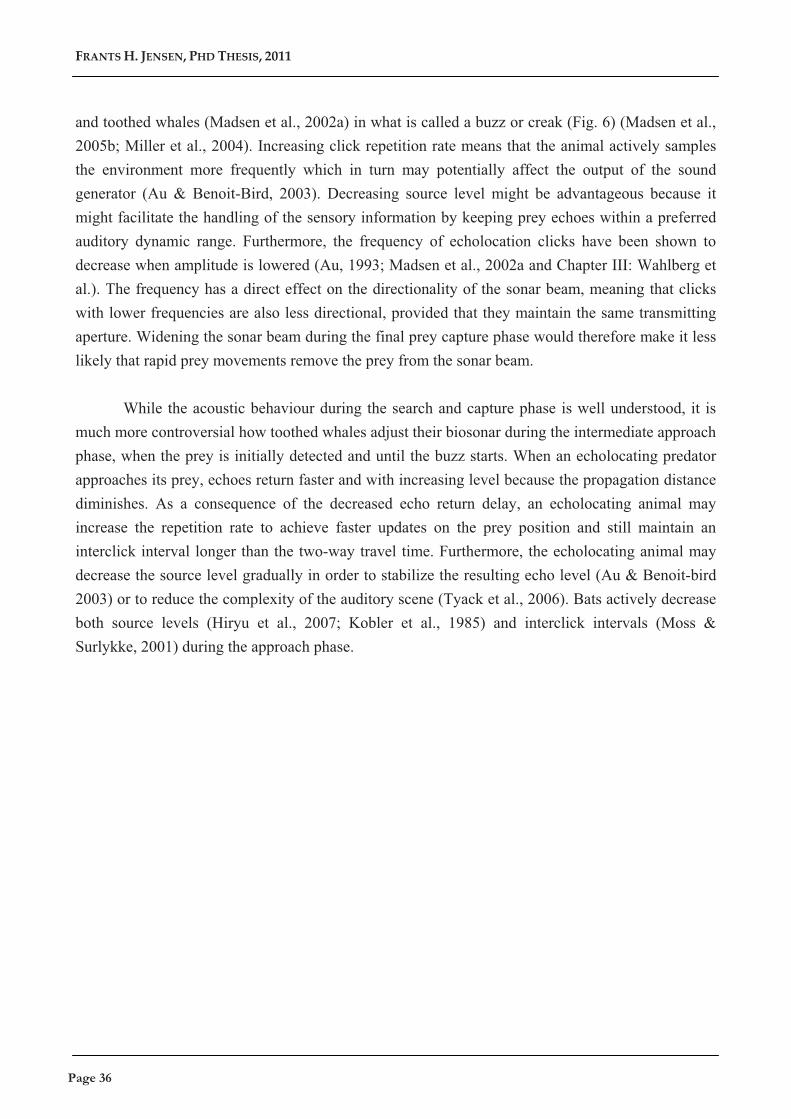
FRANTS�H.�JENSEN,�PHD�THESIS,�2011�
and toothed whales (Madsen et al., 2002a) in what is called a buzz or creak (Fig. 6) (Madsen et al., 2005b; Miller et al., 2004). Increasing click repetition rate means that the animal actively samples the environment more frequently which in turn may potentially affect the output of the sound generator (Au & Benoit-Bird, 2003). Decreasing source level might be advantageous because it might facilitate the handling of the sensory information by keeping prey echoes within a preferred auditory dynamic range. Furthermore, the frequency of echolocation clicks have been shown to decrease when amplitude is lowered (Au, 1993; Madsen et al., 2002a and Chapter III: Wahlberg et al.). The frequency has a direct effect on the directionality of the sonar beam, meaning that clicks with lower frequencies are also less directional, provided that they maintain the same transmitting aperture. Widening the sonar beam during the final prey capture phase would therefore make it less likely that rapid prey movements remove the prey from the sonar beam.
While the acoustic behaviour during the search and capture phase is well understood, it is
much more controversial how toothed whales adjust their biosonar during the intermediate approach phase, when the prey is initially detected and until the buzz starts. When an echolocating predator approaches its prey, echoes return faster and with increasing level because the propagation distance diminishes. As a consequence of the decreased echo return delay, an echolocating animal may increase the repetition rate to achieve faster updates on the prey position and still maintain an interclick interval longer than the two-way travel time. Furthermore, the echolocating animal may decrease the source level gradually in order to stabilize the resulting echo level (Au & Benoit-bird 2003) or to reduce the complexity of the auditory scene (Tyack et al., 2006). Bats actively decrease both source levels (Hiryu et al., 2007; Kobler et al., 1985) and interclick intervals (Moss & Surlykke, 2001) during the approach phase.
Page 36Page 36
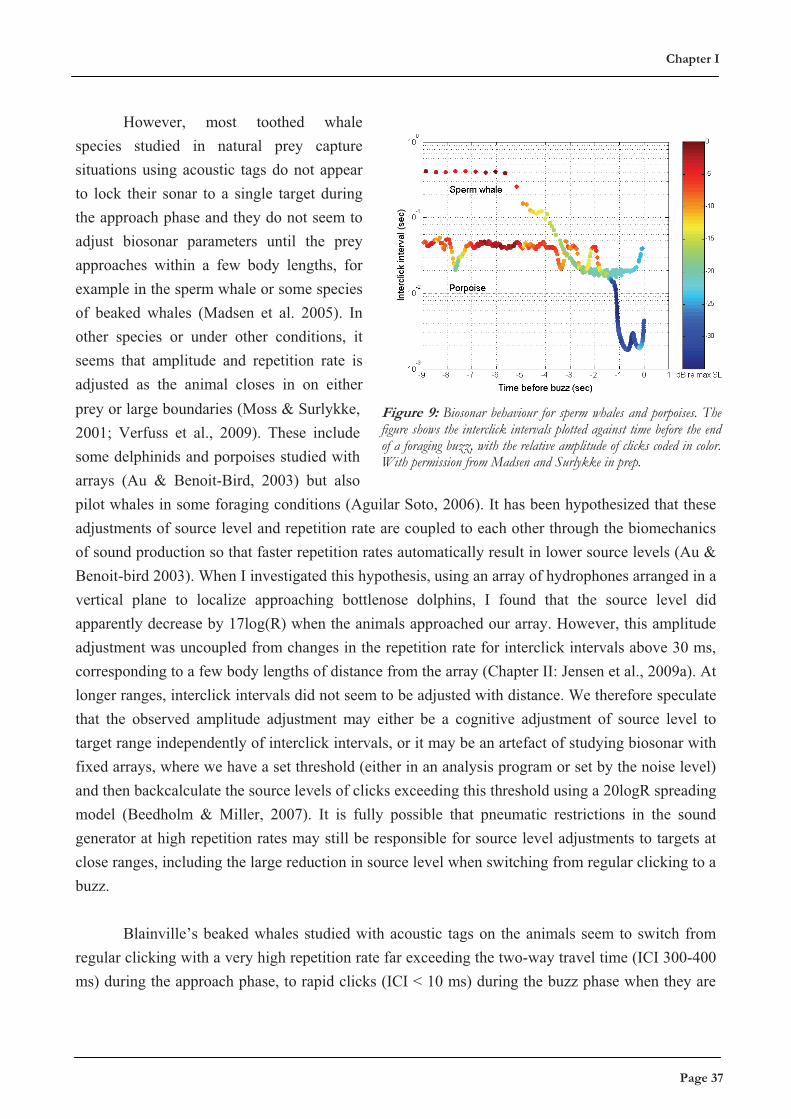
� � �
However, most toothed whale species studied in natural prey capture situations using acoustic tags do not appear to lock their sonar to a single target during the approach phase and they do not seem to adjust biosonar parameters until the prey approaches within a few body lengths, for example in the sperm whale or some species of beaked whales (Madsen et al. 2005). In other species or under other conditions, it seems that amplitude and repetition rate is adjusted as the animal closes in on either prey or large boundaries (Moss & Surlykke, 2001; Verfuss et al., 2009). These include some delphinids and porpoises studied with arrays (Au & Benoit-Bird, 2003) but also pilot whales in some foraging conditions (Aguilar Soto, 2006). It has been hypothesized that these adjustments of source level and repetition rate are coupled to each other through the biomechanics of sound production so that faster repetition rates automatically result in lower source levels (Au & Benoit-bird 2003). When I investigated this hypothesis, using an array of hydrophones arranged in a vertical plane to localize approaching bottlenose dolphins, I found that the source level did apparently decrease by 17log(R) when the animals approached our array. However, this amplitude adjustment was uncoupled from changes in the repetition rate for interclick intervals above 30 ms, corresponding to a few body lengths of distance from the array (Chapter II: Jensen et al., 2009a). At longer ranges, interclick intervals did not seem to be adjusted with distance. We therefore speculate that the observed amplitude adjustment may either be a cognitive adjustment of source level to target range independently of interclick intervals, or it may be an artefact of studying biosonar with fixed arrays, where we have a set threshold (either in an analysis program or set by the noise level) and then backcalculate the source levels of clicks exceeding this threshold using a 20logR spreading model (Beedholm & Miller, 2007). It is fully possible that pneumatic restrictions in the sound generator at high repetition rates may still be responsible for source level adjustments to targets at close ranges, including the large reduction in source level when switching from regular clicking to a buzz.
Figure 9: Biosonar behaviour for sperm whales and porpoises. The figure shows the interclick intervals plotted against time before the end of a foraging buzz, with the relative amplitude of clicks coded in color. With permission from Madsen and Surlykke in prep.
Blainville’s beaked whales studied with acoustic tags on the animals seem to switch from
regular clicking with a very high repetition rate far exceeding the two-way travel time (ICI 300-400 ms) during the approach phase, to rapid clicks (ICI < 10 ms) during the buzz phase when they are
Chapter I
Page 37Page 37
FRANTS�H.�JENSEN,�PHD�THESIS,�2011�
within a body length of the prey. They exhibit a bimodal pattern of interclick intervals that drop drastically when they decide to attempt a capture by buzzing, and where interclick intervals are adjusted to the prey distance only during the final buzz (Johnson et al., 2008; Madsen et al., 2005b). This pattern seems to be evident in also Cuvier’s beaked whales and sperm whales (Madsen et al., 2005b). Judging from the amount of incoming echoes on beaked whale tags, these whales have to navigate a very complex auditory scene with many echoes cluttering the detection of prey items, which may require a longer processing time and partly explain the late target lock (Madsen et al., 2005b).
The behaviour of free-ranging animals navigating a complex auditory scene therefore seems
like a very flexible process that may depend on both target type and the surroundings, especially in terms of acoustic clutter. Acoustic tags allow us to study such adaptations in detail while animals are foraging in their natural environment, and they have already started to unveil different biosonar behaviours in some toothed whales that may vary according to foraging strategy (Aguilar Soto, 2006). In the near future, smaller acoustic tags may be able to shed further light on the biosonar behaviour of free-ranging bottlenose dolphins chasing actual prey items rather than scientific equipment, and potentially allow us to tease apart different biosonar foraging strategies adapted for different prey items or environments and improving our understanding of the dynamics of biosonar operation in free-ranging animals.
Through the next section, I will switch to the topic of communication and discuss the
functions of acoustic communication signals in toothed whales as well as our new knowledge.
COMMUNICATION All group-living animals, including social toothed whales, need signalling mechanisms for maintaining contact between individuals and ensuring that the group retains its spatial cohesiveness over longer time periods and through different behavioural transitions such as from foraging to socializing. Toothed whales possess exceptional vocal production learning capabilities (Janik & Slater, 1997) and their capacity for imitating sounds has been recognized for many years (Lilly, 1965). Vocal production learning occurs when animals modify their own vocalizations through experience with signals from other individuals, and may work to either increase or decrease the similarity (Janik & Slater, 2000). By this mechanism, the vocal repertoire of an individual may change to reflect the social companions of the individual (Tyack, 1997) that in turn may help stabilize the social bonds formed by these highly social mammals (Tyack, 2008).
Page 38Page 38
� � �
Communication is normally defined as the production and transmission of a signal that increases the probability of certain behaviours in the receiver (Altmann, 1967). A variety of hypotheses have been put forth to explain some functional aspects of acoustic signals in toothed whales (Tyack, 2000). Acoustic signals have been thought useful for very diverse functions such as mate advertising and competition (Tyack, 1981), feeding cooperation (Janik, 2000a), group cohesion (Foote et al., 2008; Janik & Slater, 1998), aggressive encounters (Connor & Smolker, 1996; Mccowan & Reiss, 1995) and mother-offspring interactions (Mccowan & Reiss, 1995). The function of naturally occurring signals may also be more complex (Hebets & Papaj, 2005), with several cues available to receivers at potentially different ranges (Brenowitz, 1982). For example, dolphins may use binaural time, intensity or phase cues to obtain a bearing or direction to the source of any signal (Kastelein et al., 2007), and possibly an estimate on range or orientation as well (Miller, 2002). Higher whistle harmonics increase in directionality in lieau with bird calls (Larsen & Dabelsteen, 1990) as a physical consequence of the increasing frequency (Madsen and Wahlberg 2007), and this mixed directionality might serve as a cue to the orientation of the vocalizing animal, helping group coordination (Lammers & Au, 2003; Miller, 2002). Furthermore, spectral properties of the signals, or repertoire differences between individuals, may contain vital information about the sender, such as its species, group or pod affiliation (Ford, 1991; Weilgart & Whitehead, 1997), or the identity of the sender (Miller & Bain, 2000). Some differences may even reveal physical properties of the sender. In this way, the pulse structure of sperm whale clicks has been shown to reveal honest cues to the size of the sperm whale (Norris & Harvey, 1972). Killer whales have also been reported to encode the sex of the sender in the relationship between energy in the fundamental contour and the first harmonic, with females having significantly more energy in the harmonic (Miller et al., 2007). This is likely a consequence of the resonance frequency of the air sacs. Female killer whales are normally quite smaller than male killer whales (Baird, 2000) and the resonance of their air sacs would therefore be higher. Given that this affects the distribution of energy within harmonics (Chapter V: Madsen et al.), females will on average have more energy located in higher harmonics. However, if these energy ratios are the only cues, a young male or a male at depth may be difficult to tell apart from an adult female.
Much of our experimentally-derived knowledge of acoustic communication in toothed
whales derives from studies of bottlenose dolphins. These animals have been shown to use very stereotyped whistles (Caldwell & Caldwell, 1965) that are stable across long time periods (Sayigh et al., 1990). It is thought that these signature whistles may be used as an individual identifier for these animals living in very fluid societies (Caldwell et al., 1990; Sayigh et al., 1999). Signature whistles of individuals in male alliances converge with time (Smolker & Pepper, 1999; Watwood et al., 2004) as a result of the close association between the individuals. The use of these whistles has been connected to episodes of temporary separations of highly associated individuals such as
Chapter I
Page 39Page 39
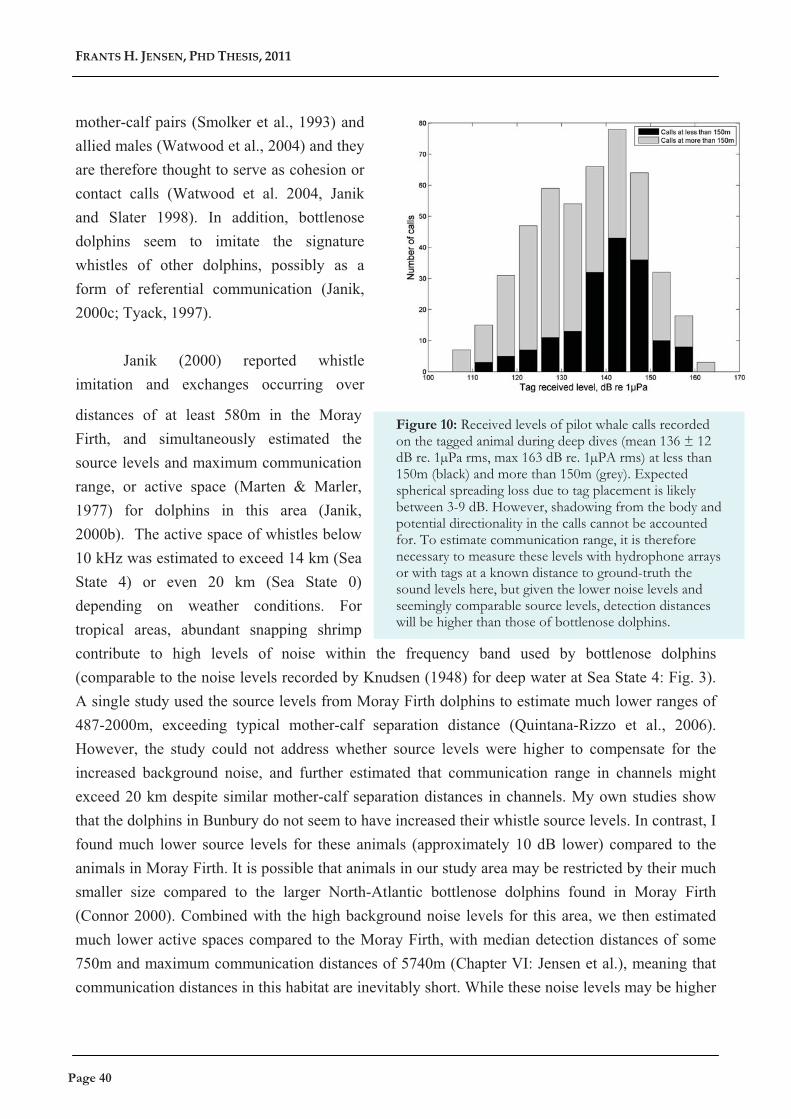
FRANTS�H.�JENSEN,�PHD�THESIS,�2011�
mother-calf pairs (Smolker et al., 1993) and allied males (Watwood et al., 2004) and they are therefore thought to serve as cohesion or contact calls (Watwood et al. 2004, Janik and Slater 1998). In addition, bottlenose dolphins seem to imitate the signature whistles of other dolphins, possibly as a form of referential communication (Janik, 2000c; Tyack, 1997).
Janik (2000) reported whistle
imitation and exchanges occurring over
distances of at least 580m in the Moray Firth, and simultaneously estimated the source levels and maximum communication range, or active space (Marten & Marler, 1977) for dolphins in this area (Janik, 2000b). The active space of whistles below 10 kHz was estimated to exceed 14 km (Sea State 4) or even 20 km (Sea State 0) depending on weather conditions. For tropical areas, abundant snapping shrimp contribute to high levels of noise within the frequency band used by bottlenose dolphins (comparable to the noise levels recorded by Knudsen (1948) for deep water at Sea State 4: Fig. 3). A single study used the source levels from Moray Firth dolphins to estimate much lower ranges of 487-2000m, exceeding typical mother-calf separation distance (Quintana-Rizzo et al., 2006). However, the study could not address whether source levels were higher to compensate for the increased background noise, and further estimated that communication range in channels might exceed 20 km despite similar mother-calf separation distances in channels. My own studies show that the dolphins in Bunbury do not seem to have increased their whistle source levels. In contrast, I found much lower source levels for these animals (approximately 10 dB lower) compared to the animals in Moray Firth. It is possible that animals in our study area may be restricted by their much smaller size compared to the larger North-Atlantic bottlenose dolphins found in Moray Firth (Connor 2000). Combined with the high background noise levels for this area, we then estimated much lower active spaces compared to the Moray Firth, with median detection distances of some 750m and maximum communication distances of 5740m (Chapter VI: Jensen et al.), meaning that communication distances in this habitat are inevitably short. While these noise levels may be higher
Figure 10: Received levels of pilot whale calls recorded on the tagged animal during deep dives (mean 136 ± 12 dB re. 1μPa rms, max 163 dB re. 1μPA rms) at less than 150m (black) and more than 150m (grey). Expected spherical spreading loss due to tag placement is likely between 3-9 dB. However, shadowing from the body and potential directionality in the calls cannot be accounted for. To estimate communication range, it is therefore necessary to measure these levels with hydrophone arrays or with tags at a known distance to ground-truth the sound levels here, but given the lower noise levels and seemingly comparable source levels, detection distances will be higher than those of bottlenose dolphins.
Page 40Page 40
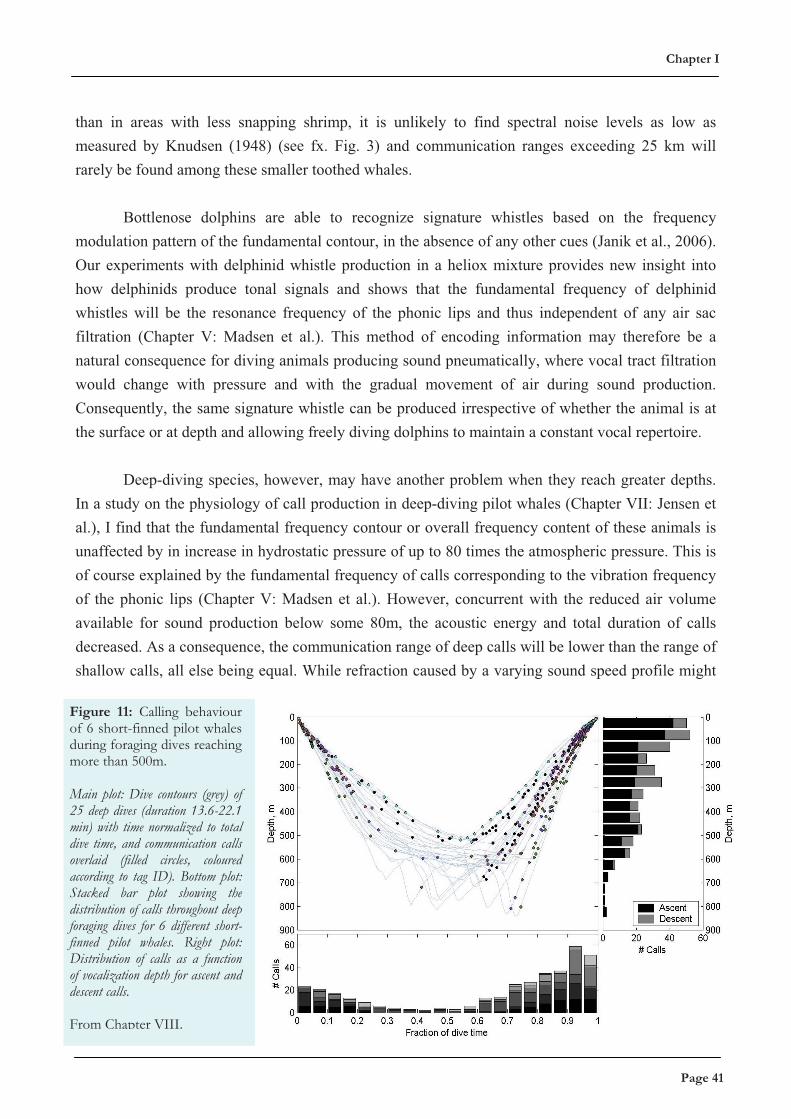
� � �
than in areas with less snapping shrimp, it is unlikely to find spectral noise levels as low as measured by Knudsen (1948) (see fx. Fig. 3) and communication ranges exceeding 25 km will rarely be found among these smaller toothed whales.
Bottlenose dolphins are able to recognize signature whistles based on the frequency
modulation pattern of the fundamental contour, in the absence of any other cues (Janik et al., 2006). Our experiments with delphinid whistle production in a heliox mixture provides new insight into how delphinids produce tonal signals and shows that the fundamental frequency of delphinid whistles will be the resonance frequency of the phonic lips and thus independent of any air sac filtration (Chapter V: Madsen et al.). This method of encoding information may therefore be a natural consequence for diving animals producing sound pneumatically, where vocal tract filtration would change with pressure and with the gradual movement of air during sound production. Consequently, the same signature whistle can be produced irrespective of whether the animal is at the surface or at depth and allowing freely diving dolphins to maintain a constant vocal repertoire.
Deep-diving species, however, may have another problem when they reach greater depths.
In a study on the physiology of call production in deep-diving pilot whales (Chapter VII: Jensen et al.), I find that the fundamental frequency contour or overall frequency content of these animals is unaffected by in increase in hydrostatic pressure of up to 80 times the atmospheric pressure. This is of course explained by the fundamental frequency of calls corresponding to the vibration frequency of the phonic lips (Chapter V: Madsen et al.). However, concurrent with the reduced air volume available for sound production below some 80m, the acoustic energy and total duration of calls decreased. As a consequence, the communication range of deep calls will be lower than the range of shallow calls, all else being equal. While refraction caused by a varying sound speed profile might
Figure 11: Calling behaviour of 6 short-finned pilot whales during foraging dives reaching more than 500m. Main plot: Dive contours (grey) of 25 deep dives (duration 13.6-22.1 min) with time normalized to total dive time, and communication calls overlaid (filled circles, coloured according to tag ID). Bottom plot: Stacked bar plot showing the distribution of calls throughout deep foraging dives for 6 different short-finned pilot whales. Right plot: Distribution of calls as a function of vocalization depth for ascent and descent calls. From Chapter VIII.
Chapter I
Page 41Page 41
FRANTS�H.�JENSEN,�PHD�THESIS,�2011�
alleviate this effect slightly, the vertical communication range of the animals, which may well reflect the range to the natal group, will not be affected by this phenomenon. Furthermore, if the information broadcast in these social calls is encoded in the frequency contour like signature whistles, the limited duration of the signals may prevent the production of some signals at depth. The shorter and simpler call structure at depth, coupled with a high calling rate at the final part of the ascent and occasionally following the dive as well (Chapter VIII: Jensen et al.) may be indications that whales either choose to, or are restricted to, broadcast simpler signals at depth, perhaps containing cues on the natal group membership or simply indicating the presence of a diving pilot whale.
I also find that the temporal context of calls produced during these deep dives is highly
suggestive of an important role in mediating social cohesion (Chapter VIII: Jensen et al.). Calling activity is at its lowest during the middle part of the dive where whales are at their deepest, probably reflecting the pneumatic constraints on producing calls. During the ascent phase, most tagged animals start to call out again, leading to an average vocal rate in the ascent phase significantly higher than during descent and during surface time. In addition, observed patterns of call exchanges during the later part of the ascent phase further corroborate the idea that these calls may function as contact calls to re-establish acoustic contact with the social group after the vertical separations necessary for feeding. Calling tends to continue until the animal reaches the surface, and in some cases even longer. It is possible that the tonal calls therefore also serve an important affiliative role as well (Biben et al., 1986).
Page 42Page 42
� � �
FUTURE RESEARCH In this dissertation, I have aimed at answering basic questions about the foraging behaviour and social communication of the two studied species. However, studying these animals in the wild is not a trivial thing, especially for deep-diving species that regularly disappear from the prying eyes of marine biologists. Many interesting questions therefore remain unanswered, and new avenues for continued research have opened up throughout the last four years. In the following section, I describe a variety of scientific questions that I find of significant interest. Chapter VIII of this thesis presents a progress report of an ongoing study with short-finned pilot whales in Tenerife. I have investigated the context of tonal calls produced during deep dives and suspect that these signals serve a role in maintaining (for shallow depths) or re-establishing (for deeper dives) acoustic contact with the social group. In order to do this, I hope to examine the acoustic exchanges between the diving whale and the surface group, possibly aided by simultaneously tagged but non-diving whales within the group, as well as locomotory responses to calls from the surface group, such as changes in heading. Simultaneously, I have now started work on long-finned pilot whales in the Mediterranean in a large collaborative study with colleagues from Woods Hole Oceanographic University. These whales are much more synchronous in their foraging behaviour (Hickmott et al. in prep) and studies of their baseline behaviour, including social communication, are of interest to better evaluate the results of mid-frequency sonar playback experiments. In this area, Woods Hole collaborators and I will tag pairs of long-finned pilot whales in compact social groups to address hypotheses of how calls are used to mediate close-range associations when both tagged whales are doing foraging dives and to mediate long-range signalling between diving animals and the surface group. Combined with behavioural observations from the surface conducted at the same time this may further allow us to understand the acoustic signalling that goes on when several groups meet and re-separate at the surface throughout the day and whether some individuals are more interactive in these contexts than others. It has been shown that males mate outside the natal group to avoid inbreeding, and nothing is known of how males, or females, advertise themselves during such group meetings. Ideally, these studies of social communication might lead up to the identification of key individuals that facilitate social group cohesion. Very little is known about social dominance in cetaceans, and it would be fascinating if the vocal behaviour and interactions within the group might enable us to address the hierarchies within social groups of different composition.
Chapter I
Page 43Page 43
FRANTS�H.�JENSEN,�PHD�THESIS,�2011�
A very important aspect of understanding the information hauled in from a DTAG would be the possibility to objectively identify behavioural states using the three-dimensional accelerometer and magnetometer data. This has been done for one-dimensional accelerometers placed on birds. Finding patterns in accelerometer data related to specific behavioural states may open up for further interesting questions about whether and how free-ranging toothed whales coordinate group movement and transitions between behavioural states, and how decisions are made within these social groups.
Page 44Page 44
� � �
References Aguilar Soto, N. (2006). Acoustic and diving behaviour of pilot whales (Globicephala macrorhynchus) and Blainville's beaked whales (Mesoplodon densirostris) off the Canary Islands, with implications for effects of man-made noise and ship strikes. Ph.D. thesis: La Laguna University, Tenerife. Aguilar Soto, N., Johnson, M. P., Madsen, P. T., Diaz, F., Dominguez, I., Brito, A. and Tyack, P. (2008). Cheetahs of the deep sea: deep foraging sprints in short-finned pilot whales off Tenerife (Canary Islands). Journal of Animal Ecology 77, 936-47. Akamatsu, T., Teilmann, J., Miller, L. A., Tougaard, J., Dietz, R., Wang, D., Wang, K. X., Siebert, U. and Naito, Y. (2007). Comparison of echolocation behaviour between coastal and riverine porpoises. Deep-Sea Research Part II - Topical Studies in Oceanography 54, 290-297. Allen, S. J., Bejder, L. and Krützen, M. (2010). Why do Indo-Pacific bottlenose dolphins (Tursiops sp.) carry conch shells (Turbinella sp.) in Shark Bay, Western Australia? Marine Mammal Science, no-no. Altmann, S. A. (1967). The structure of primate social communication. In Social communication among primates, (ed. S. A. Altmann). Chicago: University of Chicago Press. Amos, B., Schlotterer, C. and Tautz, D. (1993). Social structure of pilot whales revealed by analytical DNA profiling. Science 260, 670-672. Amundin, M. and Andersen, S. H. (1983). Bony nares air-pressure and nasal plug muscle-activity during click production in the harbor porpoise, Phocoena phocoena, and the bottlenosed dolphin, Tursiops truncatus. Journal of Experimental Biology 105, 275-282. Aroyan, J. L., Cranford, T. W., Kent, J. and Norris, K. S. (1992). Computer Modeling of Acoustic Beam Formation in Delphinus-Delphis. Journal of the Acoustical Society of America 92, 2539-2545. Au, W. W. L. (1993). The Sonar of Dolphins: New York: Springer Verlag. Au, W. W. L. and Banks, K. (1998). The acoustics of the snapping shrimp Synalpheus parneomeris in Kaneohe Bay. Journal of the Acoustical Society of America 103, 41-47. Au, W. W. L. and Benoit-Bird, K. J. (2003). Automatic gain control in the echolocation system of dolphins. Nature 423, 861-863. Au, W. W. L., Branstetter, B. K., Benoit-Bird, K. J. and Kastelein, R. A. (2009). Acoustic basis for fish prey discrimination by echolocating dolphins and porpoises. The Journal of the Acoustical Society of America 126, 460-467. Au, W. W. L. and Green, M. (2000). Acoustic interaction of humpback whales and whale-watching boats. Marine Environmental Research 49, 469-481. Au, W. W. L., Houser, D. S., Finneran, J. J., Lee, W.-J., Talmadge, L. A. and Moore, P. W. (2010). The acoustic field on the forehead of echolocating Atlantic bottlenose dolphins (Tursiops truncatus). The Journal of the Acoustical Society of America 128, 1426-1434. Au, W. W. L. and Moore, P. W. B. (1990). Critical ratio and critical bandwidth for the atlantic bottlenose dolphin. Journal of the Acoustical Society of America 88, 1635-1638. Au, W. W. L., Moore, P. W. B. and Pawloski, D. (1986). Echolocation transmitting beam of the Atlantic bottlenose dolphin. The Journal of the Acoustical Society of America 80, 688-691. Au, W. W. L. and Pawloski, D. A. (1992). Cylinder wall thickness difference discrimination by an echolocating Atlantic bottlenose dolphin. Journal of Comparative Physiology A: Neuroethology, Sensory, Neural, and Behavioral Physiology 170, 41-47. Baird, R. W. (2000). The killer whale - foraging specializations and group hunting. In Cetacean societies: Field studies of dolphins and whales, (eds. J. Mann R. C. Connor P. L. Tyack and H. Whitehead), pp. 127-153. Chicago: University of Chicago Press. Baird, R. W., Borsani, J. F., Hanson, M. B. and Tyack, P. L. (2002). Diving and night-time behavior of long-finned pilot whales in the Ligurian Sea. Marine Ecology-Progress Series 237, 301-305. Beedholm, K. and Miller, L. A. (2007). Automatic gain control in harbour porpoises (Phocoena phocoena)? Central versus peripheral mechanisms. Aquatic Mammals 33, 69-75. Biben, M., Symmes, D. and Masataka, N. (1986). Temporal and structural analysis of affiliative vocal exchanges in squirrel monkeys (Saimiri sciureus). Behaviour 98, 259-273. Bradbury, J. W. and Vehrenkamp, S. L. (1998). Principles of acoustic communication. Sunderland, MA: Sinauer Associates. Branstetter, B. K. and Mercado, E., III. (2006). Sound Localization by Cetaceans. International journal of comparative psychology 19. Brenowitz, E. A. (1982). Long-range communication of species identity by song in the Red-winged Blackbird. Behavioral Ecology and Sociobiology 10, 29-38.
Chapter I
Page 45Page 45
FRANTS�H.�JENSEN,�PHD�THESIS,�2011�
Brill, R. L., Moore, P. W. B. and Dankiewicz, L. A. (2001). Assessment of dolphin (Tursiops truncatus) auditory sensitivity and hearing loss using jawphones. The Journal of the Acoustical Society of America 109, 1717-1722. Brill, R. L., Sevenich, M. L., Sullivan, T. J., Sustman, J. D. and Witt, R. E. (1988). Behavioral Evidence for Hearing through the Lower Jaw by an Echolocating Dolphin (Tursiops-Truncatus). Marine Mammal Science 4, 223-230. Caldwell, M. C. and Caldwell, D. K. (1965). Individualized Whistle Contours in Bottle-Nosed Dolphins (Tursiops Truncatus). Nature 207, 434-&. Caldwell, M. C. and Caldwell, D. K. (1969). Simultaneous but different narrow-band sound emissions by a captive eastern pacific pilot whale, Globicephala scammoni. Mammalia 33, 505-508. Caldwell, M. C., Caldwell, D. K. and Tyack, P. L. (1990). Review of the signature-whistle hypothesis for the atlantic bottlenose dolphin. In The Bottlenose Dolphin, (eds. S. Leatherwood and R. R. Reeves), pp. 199-234: New York: Academic Press. Clarke, M. R. (1996). Cephalopods as Prey. III. Cetaceans. Philosophical Transactions: Biological Sciences 351, 1053-1065. Clausen, K. T., Wahlberg, M., Beedholm, K., DeRuiter, S. and Madsen, P. T. (2010). Click communication in harbour porpoises (Phocoena phocoena). Bioacoustics 20, 1-28. Cockroft, V. G. and Ross, G. J. B. (1990). Age, growth, and reproduction of bottlenose dolphins Tursiops truncatus from the east coast of southern Africa. Fishery Bulletin 88, 289-302. Connor, R. C., Heithaus, M. R. and Barre, L. M. (1999). Superalliance of bottlenose dolphins. Nature 397, 571-572. Connor, R. C. and Smolker, R. A. (1996). 'Pop' goes the dolphin: A vocalization male bottlenose dolphins produce during consortships. Behaviour 133, 643-662. Connor, R. C., Smolker, R. A. and Richards, A. F. (1992). Two levels of alliance formation among male bottlenose dolphins (Tursiops Sp). Proceedings of the National Academy of Sciences 89, 987-990. Connor, R. C., Wells, R. S., Mann, J. and Read, A. J. (2000). The Bottlenose Dolphin. In Cetacean Societies: Field studies of whales and dolphins, (eds. J. Mann R. C. Connor P. L. Tyack and H. Whitehead). Chicago: Univ. Chicago Press. Cranford, T. W. (1988). The anatomy of acoustic structures in the spinner dolphin forehead as shown by x-ray computed tomography and computer graphics. In Animal Sonar: Processes and performance, (eds. P. E. Nachtigall and P. W. B. Moore), pp. 67-77. New York: Plenum Press. Cranford, T. W., Amundin, M. and Norris, K. S. (1996). Functional morphology and homology in the odontocete nasal complex: Implications for sound generation. Journal of Morphology 228, 223-285. Dawson, S. M. (1991). Clicks and Communication - the Behavioral and Social Contexts of Hector Dolphin Vocalizations. Ethology 88, 265-276. Diercks, K. J., Trochta, R. T., Greenlaw, C. F. and Evans, W. E. (1971). Recording and analysis of dolphin echolocation signals. Journal of the Acoustical Society of America 49, 1729-1732. Dolphin, W. F., Au, W. W. L., Nachtigall, P. E. and Pawloski, J. (1995). Modulation Rate Transfer-Functions to Low-Frequency Carriers in 3 Species of Cetaceans. Journal of Comparative Physiology a-Sensory Neural and Behavioral Physiology 177, 235-245. Dormer, K. J. (1979). Mechanism of sound production and air recycling in delphinids - cineradiographic evidence. Journal of the Acoustical Society of America 65, 229-239. Elsberry, W. R. (2003). Interrelationships between intranarial pressure and biosonar clicks in bottlenose dolphins (Tursiops truncatus). PhD Thesis: Texas A&M University. Evans, W. E. and Prescott, J. H. (1962). Observations of the sound capabilities of the bottlenose porpoise: A study of whistles and clicks. Zoologica 47, 121-128. Finneran, J. J., Schlundt, C. E., Carder, D. A. and Ridgway, S. H. (2002). Auditory filter shapes for the bottlenose dolphin (Tursiops truncatus) and the white whale (Delphinapterus leucas) derived with notched noise. Journal of the Acoustical Society of America 112, 322-328. Fletcher, H. (1940). Auditory Patterns. Reviews of Modern Physics 12, 47. Foote, A. D. (2008). Mortality rate acceleration and post-reproductive lifespan in matrilineal whale species. Biology Letters 4, 189-191. Foote, A. D., Osborne, R. W. and Rus Hoelzel, A. (2008). Temporal and Contextual Patterns of Killer Whale (Orcinus orca) Call Type Production. Ethology 114, 599-606. Ford, J. K. B. (1991). Vocal Traditions among Resident Killer Whales (Orcinus-Orca) in Coastal Waters of British-Columbia. Canadian Journal of Zoology 69, 1454-1483. Fraser, F. C. (1974). Report on Cetacea stranded on the British coasts from 1948-1966. Publications of the British Museum of Natural History 14. Goller and Larsen. (2002). New perspectives on mechanisms of sound generation in songbirds. Journal of Comparative Physiology A: Neuroethology, Sensory, Neural, and Behavioral Physiology 188, 841-850.
Page 46Page 46
� � �
Goller, F. and Larsen, O. N. (1997). A new mechanism of sound generation in songbirds. Proceedings of the National Academy of Sciences of the United States of America 94, 14787-14791. Griffin, D. R. (1958). Listening in the dark: the acoustic orientation of bats and men. New Haven CT: Yale University Press. Hebets, E. A. and Papaj, D. R. (2005). Complex signal function: developing a framework of testable hypotheses. Behavioral Ecology and Sociobiology 57, 197-214. Heimlich-Boran, J. R. (1993). Social organisation of the short finned pilot-whale, with special reference to the comparative social ecology of delphinids: Ph.D. thesis. University of Cambridge. Heithaus, M. R. (2001a). Predator-prey and competitive interactions between sharks (order Selachii) and dolphins (suborder Odontoceti): a review. Journal of Zoology 253, 53-68. Heithaus, M. R. (2001b). Shark attacks on bottlenose dolphins (Tursiops aduncus) in Shark Bay, Western Australia: Attack rate, bite scar frequencies and attack seasonality. Marine Mammal Science 17, 526-539. Hemila, S., Nummela, S. and Reuter, T. (1999). A model of the odontocete middle ear. Hearing Research 133, 82-97. Herzing, D. L. (2000). Acoustics and social behavior of wild dolphins: implications for a sound society. In Hearing by whales and dolphins, (eds. W. W. L. Au A. N. Popper and R. E. Fay). London: Springer Press. Hiryu, S., Hagino, T., Riquimaroux, H. and Watanabe, Y. (2007). Echo-intensity compensation in echolocating bats (Pipistrellus abramus) during flight measured by a telemetry microphone. Journal of the Acoustical Society of America 121, 1749-1757. Hoelzel, A. R., Potter, C. W. and Best, P. B. (1998). Genetic differentiation between parapatric ‘nearshore’ and ‘offshore’ populations of the bottlenose dolphin. Proceedings of the Royal Society of London. Series B: Biological Sciences 265, 1177-1183. Houser, D. S. and Finneran, J. J. (2006). A comparison of underwater hearing sensitivity in bottlenose dolphins (Tursiops truncatus) determined by electrophysiological and behavioral methods. Journal of the Acoustical Society of America 120, 1713-1722. Janik, V. M. (2000a). Food-related bray calls in wild bottlenose dolphins (Tursiops truncatus). Proceedings of the Royal Society B 267, 923-927. Janik, V. M. (2000b). Source levels and the estimated active space of bottlenose dolphin (Tursiops truncatus) whistles in the Moray Firth, Scotland. Journal of comparative physiology A 186, 673-680. Janik, V. M. (2000c). Whistle matching in wild bottlenose dolphins (Tursiops truncatus). Science 289, 1355-1357. Janik, V. M., Sayigh, L. S. and Wells, R. S. (2006). Signature whistle shape conveys identity information to bottlenose dolphins. Proceedings of the National Academy of Sciences of the United States of America 103, 8293-8297. Janik, V. M. and Slater, P. J. (1998). Context-specific use suggests that bottlenose dolphin signature whistles are cohesion calls. Animal Behaviour 56, 829-838. Janik, V. M. and Slater, P. J. B. (1997). Vocal learning in mammals. In Advances in the Study of Behavior, vol. 26 (eds. P. Slater C. Snowdon J. Rosenblatt and M. Milinski), pp. 59-99. San Diego: Elsevier Academic Press. Janik, V. M. and Slater, P. J. B. (2000). The different roles of social learning in vocal communication. Animal Behaviour 60, 1-11. Jensen, F. H., Bejder, L., Wahlberg, M. and Madsen, P. T. (2009a). Biosonar adjustments to target range of echolocating bottlenose dolphins (Tursiops sp.) in the wild. Journal of Experimental Biology 212, 1078-1086. Jensen, F. H., Bejder, L., Wahlberg, M., Soto, N. A., Johnson, M. and Madsen, P. T. (2009b). Vessel noise effects on delphinid communication. Marine Ecology Progress Series 395, 161-175. Johnson, C. S. (1968a). Masked tonal thresholds in bottlenosed porpoise. Journal of the Acoustical Society of America 44, 965-967. Johnson, C. S. (1968b). Relation between absolute threshold and duration-of-tone pulses in the bottlenosed porpoise. The Journal of the Acoustical Society of America 43, 757-763. Johnson, M., Hickmott, L. S., Soto, N. A. and Madsen, P. T. (2008). Echolocation behaviour adapted to prey in foraging Blainville's beaked whale (Mesoplodon densirostris). Proceedings of the Royal Society B 275, 133-139. Johnson, M. P. and Tyack, P. L. (2003). A digital acoustic recording tag for measuring the response of wild marine mammals to sound. Ieee Journal of Oceanic Engineering 28, 3-12. Johnstone, R. A. and Cant, M. A. (2010). The evolution of menopause in cetaceans and humans: the role of demography. Proceedings of the Royal Society B-Biological Sciences 277, 3765-3771. Kalko, E. K. V. (1995). Insect Pursuit, Prey Capture and Echolocation in Pipistrelle Bats (Microchiroptera). Animal Behaviour 50, 861-880. Kalko, E. K. V. and Schnitzler, H. U. (1993). Plasticity in Echolocation Signals of European Pipistrelle Bats in Search Flight - Implications for Habitat Use and Prey Detection. Behavioral Ecology and Sociobiology 33, 415-428.
Chapter I
Page 47Page 47
FRANTS�H.�JENSEN,�PHD�THESIS,�2011�
Kastelein, R. A., de Haan, D. and Verboom, W. C. (2007). The influence of signal parameters on the sound source localization ability of a harbor porpoise (Phocoena phocoena). The Journal of the Acoustical Society of America 122, 1238-1248. Kastelein, R. A., Hoek, L., Jong, C. A. F. d. and Wensveen, P. J. (2010). The effect of signal duration on the underwater detection thresholds of a harbor porpoise (Phocoena phocoena) for single frequency-modulated tonal signals between 0.25 and 160 kHz. The Journal of the Acoustical Society of America 128, 3211-3222. Kasuya, T. and Marsh, H. (1984). Life history and reproductive biology of the short-finned pilot whale, Globicephala macrorhynchus, off the Pacific coast of Japan. IWC Special Issue 6, 259-310. Kasuya, T. and Tai, S. (1993). Life history of short finned pilot whale stocks off Japan and a description of the fishery. IWC Special Issue 14, 439-476. Ketten, D. R. (1992). The marine mammal ear: Specializations for aquatic audition and echolocation. In The evolutionary biology of hearing, (eds. D. Webster R. Fay and A. Popper): Springer Verlag. Kloepper, L. N., Nachtigall, P. E. and Breese, M. (2010). Change in echolocation signals with hearing loss in a false killer whale (Pseudorca crassidens). The Journal of the Acoustical Society of America 128, 2233-2237. Knudsen, V. O., Alford, R. S. and Emling, J. W. (1948). Underwater ambient noise. Journal of marine research 7, 410-429. Kobler, J. B., Wilson, B. S., Henson, O. W. and Bishop, A. L. (1985). Echo intensity compensation by echolocating bats. Hearing Research 20, 99-108. Krutzen, M., Mann, J., Heithaus, M. R., Connor, R. C., Bejder, L. and Sherwin, W. B. (2005). Cultural transmission of tool use in bottlenose dolphins. Proceedings of the National Academy of Sciences of the United States of America 102, 8939-8943. Kyhn, L. A., Jensen, F. H., Beedholm, K., Tougaard, J., Hansen, M. and Madsen, P. T. (2010). Echolocation in sympatric Peale's dolphins (Lagenorhynchus australis) and Commerson's dolphins (Cephalorhynchus commersonii) producing narrow-band high-frequency clicks. Journal of Experimental Biology 213, 1940-1949. Kyhn, L. A., Tougaard, J., Jensen, F., Wahlberg, M., Stone, G., Yoshinaga, A., Beedholm, K. and Madsen, P. T. (2009). Feeding at a high pitch: Source parameters of narrow band, high-frequency clicks from echolocating off-shore hourglass dolphins and coastal Hector's dolphins. Journal of the Acoustical Society of America 125, 1783-1791. Lammers, M. O. and Au, W. W. L. (2003). Directionality in the whistles of Hawaiian spinner dolphins (Stenella longirostris): A signal feature to cue direction of movement? Marine Mammal Science 19, 249-264. Lammers, M. O., Au, W. W. L. and Herzing, D. L. (2003). The broadband social acoustic signaling behavior of spinner and spotted dolphins. Journal of the Acoustical Society of America 114, 1629-1639. Lammers, M. O. and Castellote, M. (2009). The beluga whale produces two pulses to form its sonar signal. Biology Letters 5, 297-301. Larsen, O. N. and Dabelsteen, T. (1990). Directionality of Blackbird Vocalization - Implications for Vocal Communication and Its Further Study. Ornis Scandinavica 21, 37-45. Lemonds, D. W., Au, W. W. L., Nachtigall, P. E., Roitblat, H. L. and Vlachos, S. A. (2000). High-frequency auditory filter shapes in an Atlantic bottlenose dolphin. The Journal of the Acoustical Society of America 108, 2614-2614. Lilly, J. C. (1962). Vocal behavior of the bottlenose dolphin. Proceedings of the American Philosophical Society 106, 520-529. Lilly, J. C. (1965). Vocal mimicry in tursiops: Ability to match numbers and durations of human vocal bursts. Science 147, 300-301. Liu, Y., Rossiter, S. J., Han, X. Q., Cotton, J. A. and Zhang, S. Y. (2010). Cetaceans on a Molecular Fast Track to Ultrasonic Hearing. Current Biology 20, 1834-1839. Lockyer, C. and Morris, R. J. (1985). A wild but sociable dolphin off Portreath, north Cornwall. Journal of Zoology 207, 605-607. Lusseau, D. (2003). The emergent properties of a dolphin social network. Proceedings of the Royal Society of London Series B-Biological Sciences 270, S186-S188. Lusseau, D. (2007). Evidence for social role in a dolphin social network. Evolutionary Ecology 21, 357-366. Lusseau, D., Schneider, K., Boisseau, O. J., Haase, P., Slooten, E. and Dawson, S. M. (2003). The bottlenose dolphin community of Doubtful Sound features a large proportion of long-lasting associations. Behavioral Ecology and Sociobiology 54, 396-405. Mackay, R. S. and Liaw, H. M. (1981). Dolphin Vocalization Mechanisms. Science 212, 676-678. Madsen, P. T. (2002). Sperm whale sound production. PhD Thesis: University of Aarhus, Denmark. Madsen, P. T., Carder, D. A., Beedholm, K. and Ridgway, S. H. (2005a). Porpoise clicks from a sperm whale nose - convergent evolution of 130 kHz pulses in toothed whale sonars? Bioacoustics 15. Madsen, P. T., Johnson, M., de Soto, N. A., Zimmer, W. M. X. and Tyack, P. (2005b). Biosonar performance of foraging beaked whales (Mesoplodon densirostris). Journal of Experimental Biology 208, 181-194.
Page 48Page 48
� � �
Madsen, P. T., Kerr, I. and Payne, R. (2004). Echolocation clicks of two free-ranging, oceanic delphinids with different food preferences: false killer whales Pseudorca crassidens and Risso's dolphins Grampus griseus. Journal of Experimental Biology 207, 1811-1823. Madsen, P. T., Payne, R., Kristiansen, N. U., Wahlberg, M., Kerr, I. and Mohl, B. (2002a). Sperm whale sound production studied with ultrasound time/depth-recording tags. Journal of Experimental Biology 205, 1899-1906. Madsen, P. T. and Wahlberg, M. (2007). Recording and quantification of ultrasonic echolocation clicks from free-ranging toothed whales. Deep-Sea Research Part I - Oceanographic Research Papers 54, 1421-1444. Madsen, P. T., Wahlberg, M. and Mohl, B. (2002b). Male sperm whale (Physeter macrocephalus) acoustics in a high-latitude habitat: implications for echolocation and communication. Behavioral Ecology and Sociobiology 53, 31-41. Madsen, P. T., Wisniewska, D. and Beedholm, K. (2010). Single source sound production and dynamic beam formation in echolocating harbour porpoises (Phocoena phocoena). Journal of Experimental Biology 213, 3105-3110. Mann, J., Connor, R. C., Tyack, P. L. and Whitehead, H. (2000). Cetacean Societies. Field studies of dolphins and whales. Chicago: University of Chicago Press. Markov, V. I. and Ostrovskaya, V. M. (1990). Organization of communication system in Tursiops truncatus, Montagu. In Sensory abilities of cetaceans: Laboratory and field evidence, (eds. J. A. Thomas and R. A. Kastelein), pp. 567-580. New York: Plenum Publishing Corporation. Marten, K. and Marler, P. (1977). Sound transmission and its significance for animal vocalization. Behavioral Ecology and Sociobiology 2, 271-290. McAuliffe, K. and Whitehead, H. (2005). Eusociality, menopause and information in matrilineal whales. Trends in Ecology & Evolution 20, 650-650. Mccowan, B. and Reiss, D. (1995). Maternal Aggressive Contact Vocalizations in Captive Bottle-Nosed Dolphins (Tursiops-Truncatus) - Wide-Band, Low-Frequency Signals during Mother-Aunt-Infant Interactions. Zoo Biology 14, 293-309. McGowen, M. R., Spaulding, M. and Gatesy, J. (2009). Divergence date estimation and a comprehensive molecular tree of extant cetaceans. Molecular Phylogenetics and Evolution 53, 891-906. Mead, J. G. (1975). Anatomy of the external nasal passages and facial complex in the Delphinidae (Mammalia: Cetacea). Smithsonian Contributions in Zoology 207, 1-72. Miller, P. J. O. (2002). Mixed-directionality of killer whale stereotyped calls: a direction of movement cue? Behavioral Ecology and Sociobiology 52, 262-270. Miller, P. J. O. and Bain, D. E. (2000). Within-pod variation in the sound production of a pod of killer whales, Orcinus orca. Animal Behaviour 60, 617-628. Miller, P. J. O., Johnson, M. P. and Tyack, P. L. (2004). Sperm whale behaviour indicates the use of echolocation click buzzes 'creaks' in prey capture. Proceedings of the Royal Society B 271, 2239-2247. Miller, P. J. O., Samarra, F. I. P. and Perthuison, A. D. (2007). Caller sex and orientation influence spectral characteristics of "two-voice" stereotyped calls produced by free-ranging killer whales. Journal of the Acoustical Society of America 121, 3932-3937. Mindlin, B. G. and Laje, R. (2005). The physics of birdsong. Berlin: Springer Verlag. Mooney, T. A., Nachtigall, P. E., Taylor, K. A., Rasmussen, M. H. and Miller, L. A. (2009). Auditory temporal resolution of a wild white-beaked dolphin (Lagenorhynchus albirostris). Journal of Comparative Physiology a-Neuroethology Sensory Neural and Behavioral Physiology 195, 375-384. Morisaka, T. and Connor, R. C. (2007). Predation by killer whales (Orcinus orca) and the evolution of whistle loss and narrow-band high frequency clicks in odontocetes. Journal of Evolutionary Biology 20, 1439-1458. Moss, C. F. and Surlykke, A. (2001). Auditory scene analysis by echolocation in bats. Journal of the Acoustical Society of America 110, 2207-2226. Natoli, A., Birkun, A., Aguilar, A., Lopez, A. and Hoelzel, A. R. (2005). Habitat structure and the dispersal of male and female bottlenose dolphins (Tursiops truncatus). Proceedings of the Royal Society B: Biological Sciences 272, 1217-1226. Nores, C. and Perez, C. (1988). Overlapping range between Globicephala macrorhynchus and Globicephala melaena in the Northeastern Atlantic. Mammalia 52, 51-55. Norris, K. S. and Harvey, G. W. (1972). A theory for the function of the spermaceti organ of the sperm whale (Physeter catodon L.). In Animal Orientation and Navigation, pp. 397-417. Washington, DC: Science and Technology office, NASA. Norris, K. S. and Harvey, G. W. (1974). Sound-Transmission in Porpoise Head. Journal of the Acoustical Society of America 56, 659-664. Nowacek, D. P., Thorne, L. H., Johnston, D. W. and Tyack, P. L. (2007). Responses of cetaceans to anthropogenic noise. Mammal Review 37, 81-115. Nowicki, S. (1987). Vocal tract resonances in oscine bird sound production - Evidence from birdsongs in a helium atmosphere. Nature 325, 53-55.
Chapter I
Page 49Page 49
FRANTS�H.�JENSEN,�PHD�THESIS,�2011�
Nummela, S., Reuter, T., Hemila, S., Holmberg, P. and Paukku, P. (1999a). The anatomy of the killer whale middle ear (Orcinus orca). Hearing Research 133, 61-70. Nummela, S., Wagar, T., Hemila, S. and Reuter, T. (1999b). Scaling of the cetacean middle ear. Hearing Research 133, 71-81. Payne, R. and Webb, D. (1971). Orientation by means of long range acoustic signalling in baleen whales. Annals of the New York Academy of Sciences 188, 110-141. Perrin, W. F. (1989). Dolphins, porpoises and whale. An action plan for the conservation of biological diversity: 1988–1992, 2nd ed. Gland, Switzerland: IUCN. Popov, V. V. and Supin, A. Y. (1997). Detection of temporal gaps in noise in dolphins: Evoked-potential study. Journal of the Acoustical Society of America 102, 1169-1176. Popov, V. V., Supin, A. Y., Wang, D. and Wang, K. X. (2006). Nonconstant quality of auditory filters in the porpoises, Phocoena phocoena and Neophocaena phocaenoides (Cetacea, Phocoenidae). Journal of the Acoustical Society of America 119, 3173-3180. Purves, P. E. and Pilleri, G. E. (1983). Echolocation in whales and dolphins. London: Academic Press. Quintana-Rizzo, E., Mann, D. A. and Wells, R. S. (2006). Estimated communication range of social sounds used by bottlenose dolphins (Tursiops truncatus). The Journal of the Acoustical Society of America 120, 1671-1683. Reeves, R. R., Stewart, B. S., Clapham, P. J. and Powell, J. A. (2002). Sea mammals of the world: A complete guide to whales, dolphins, seals, sea lions and sea cows. London: A & C Black. Reidenberg, J. S. and Laitman, J. T. (1988). Existence of vocal folds in the larynx of odontoceti (toothed whales). The Anatomical Record 221, 884-891. Reidenberg, J. S. and Laitman, J. T. (2007). Discovery of a low frequency sound source in mysticeti (Baleen whales): Anatomical establishment of a vocal fold homolog. Anatomical Record-Advances in Integrative Anatomy and Evolutionary Biology 290, 745-759. Richardson, W. J., Greene, C. R. J., Malme, C. I. and Thomson, D. H. (1995). Marine Mammals And Noise: Academic Press, London. Ridgway, S. H. (1980). Electrophysiological experiments on hearing in odontocetes. In Animal Sonar Systems, (eds. R. G. Busnel and J. F. Fish), pp. 483-493. New York: Plenum. Ridgway, S. H. and Carder, D. A. (1988). Nasal pressure and sound production in an echolocating white whale, Delphinapterus leucas. In Animal Sonar: Processes and Performance, (eds. P. E. Nachtigall and P. W. B. Moore), pp. 53-60. New York and London: Plenum. Ridgway, S. H., Carder, D. A., Kamolnick, T., Smith, R. R., Schlundt, C. E. and Elsberry, W. R. (2001). Hearing and whistling in the deep sea: depth influences whistle spectra but does not attenuate hearing by white whales (Delphinapterus leucas) (Odontoceti, Cetacea). Journal of Experimental Biology 204, 3829-3841. Riede, T. and Goller, F. (2010). Functional morphology of the sound-generating labia in the syrinx of two songbird species. Journal of Anatomy 216, 23-36. Riede, T. and Titze, I. R. (2008). Vocal fold elasticity of the Rocky Mountain elk (Cervus elaphus nelsoni) - producing high fundamental frequency vocalization with a very long vocal fold. Journal of Experimental Biology 211, 2144-2154. Rosowski, J. J. (1992). Hearing in Transitional Mammals - Predictions from the Middle-Ear Anatomy and Hearing Capabilities of Extant Mammals. Evolutionary Biology of Hearing, 615-631 859. Ross, D. (1976). Mechanics of Underwater Noise: Pergamon Press, New York. Sayigh, L. S., Tyack, P. L., Wells, R. S. and Scott, M. D. (1990). Signature whistles of free-ranging bottlenose dolphins <i>Tursiops truncatus</i>: stability and mother-offspring comparisons. Behavioral Ecology and Sociobiology 26, 247-260. Sayigh, L. S., Tyack, P. L., Wells, R. S., Solow, A. R., Scott, M. D. and Irvine, A. B. (1999). Individual recognition in wild bottlenose dolphins: a field test using playback experiments. Animal Behaviour 57, 41-50. Schenkkan, E. J. and Purves, P. E. (1973). The comparative anatomy of the nasal tract and the function of the spermaceti organ in the Physeteridae (Mammalia, Odontoceti). Bijdragen tot de Dierkunde 43, 93-112. Shane, S. H., Wells, R. S. and Würsig, B. (1986). Ecology, behavior and social organization of the bottlenose dolphin: A Review. Marine Mammal Science 2, 34-63. Siemers, B. M., Kalko, E. K. V. and Schnitzler, H. U. (2001). Echolocation behavior and signal plasticity in the Neotropical bat Myotis nigricans (Schinz, 1821) (Vespertilionidae): a convergent case with European species of Pipistrellus? Behavioral Ecology and Sociobiology 50, 317-328. Sinclair, E. H. (1992). Stomach contents of four short-finned pilot whales (Globicephala macrorhynchus) from the southern California Bight. Marine Mammal Science 8, 76-81.
Page 50Page 50
� � �
Smolker, R. and Pepper, J. W. (1999). Whistle convergence among allied male bottlenose dolphins (Delphinidae, Tursiops sp.). Ethology 105, 595-617. Smolker, R., Richards, A., Connor, R., Mann, J. and Berggren, P. (1997). Sponge carrying by dolphins (Delphinidae, Tursiops sp.): A foraging specialization involving tool use? Ethology 103, 454-465. Smolker, R. A., Mann, J. and Smuts, B. B. (1993). Use of signature whistles during separations and reunions by wild bottlenose dolphin mothers and infants. Behavioral Ecology and Sociobiology 33, 393-402. Steeman, M. E., Hebsgaard, M. B., Fordyce, R. E., Ho, S. Y. W., Rabosky, D. L., Nielsen, R., Rahbek, C., Glenner, H., Sørensen, M. V. and Willerslev, E. (2009). Radiation of extant cetaceans driven by restructuring of the oceans. Systematic Biology 58, 573-585. Supin, A. Y. and Popov, V. V. (1995). Temporal Resolution in the Dolphins Auditory-System Revealed by Double-Click Evoked-Potential Study. Journal of the Acoustical Society of America 97, 2586-2593. Szymanski, M. D., Supin, A. Y., Bain, D. E. and Henry, K. R. (1998). Killer whale (Orcinus orca) auditory evoked potentials to rhythmic clicks. Marine Mammal Science 14, 676-691. Thewissen, J. G. M., Cooper, L. N., Clementz, M. T., Bajpai, S. and Tiwari, B. N. (2007). Whales originated from aquatic artiodactyls in the Eocene epoch of India. Nature 450, 1190-1194. Thompson, R. K. R. and Herman, L. M. (1975). Underwater frequency discrimination in the bottlenosed dolphin (1--140 kHz) and the human (1--8 kHz). The Journal of the Acoustical Society of America 57, 943-948. Tyack, P. (1981). Interactions between Singing Hawaiian Humpback Whales and Conspecifics Nearby. Behavioral Ecology and Sociobiology 8, 105-116. Tyack, P. L. (1997). Development and social functions of signature whistles in bottlenose dolphins tursiops truncatus. Bioacoustics 8, 21-46. Tyack, P. L. (2000). Functional aspects of cetacean communication. In Cetacean societies: field studies of dolphins and whales, (eds. J. Mann R. C. Connor P. L. Tyack and H. Whitehead). Chicago: Univ. Chicago Press. Tyack, P. L. (2008). Convergence of Calls as Animals Form Social Bonds, Active Compensation for Noisy Communication Channels, and the Evolution of Vocal Learning in Mammals. Journal of Comparative Psychology 122, 319-331. Tyack, P. L., Johnson, M. P., Zimmer, W. M. X., de Soto, N. A. and Madsen, P. T. (2006). Acoustic behavior of beaked whales, with implications for acoustic monitoring. Oceans 2006, Vols 1-4, 509-514 1972. Uhen, M. D. (2010). The Origin(s) of Whales. Annual Review of Earth and Planetary Sciences 38, 189-219. Urick, R. J. (1983). Principles of Underwater Sound: Peninsula, Los Altos. Varanasi, U. and Malins, D. C. (1971). Unusual Wax Esters from Porpoise Acoustic and Nonacoustic Tissues. Journal of the American Oil Chemists Society 48, A85-&. Verfuss, U. K., Miller, L. A., Pilz, P. K. D. and Schnitzler, H. U. (2009). Echolocation by two foraging harbour porpoises (Phocoena phocoena). Journal of Experimental Biology 212, 823-834. Wahlberg, M. (2002). The acoustic behaviour of diving sperm whales observed with a hydrophone array. Journal of Experimental Marine Biology and Ecology 281, 53-62. Warrant, E. J. and Locket, N. A. (2004). Vision in the deep sea. Biological Reviews 79, 671-712. Watwood, S. L., Tyack, P. L. and Wells, R. S. (2004). Whistle sharing in paired male bottlenose dolphins, Tursiops truncatus. Behavioral Ecology and Sociobiology 55, 531-543. Weilgart, L. (2007). The impacts of anthropogenic ocean noise on cetaceans and implications for management. Canadian Journal of Zoology 85, 1091-1116. Weilgart, L. and Whitehead, H. (1997). Group-specific dialects and geographical variation in coda repertoire in South Pacific sperm whales. Behavioral Ecology and Sociobiology 40, 277-285. Wenz, G. M. (1962). Acoustic ambient noise in ocean - spectra and sources. Journal of the Acoustical Society of America 34, 1936-1956. Wilson, T. A., Beavers, G. S., DeCoster, M. A., Holger, D. K. and Regenfuss, M. D. (1971). Experiments on the fluid mechanics of whistling. The Journal of the Acoustical Society of America 50, 366-372. Yovel, Y. and Au, W. W. L. (2010). How can dolphins recognize fish according to their echoes? A statistical analysis of fish echoes. PLoS ONE 5, e14054. Zachos, J., Pagani, M., Sloan, L., Thomas, E. and Billups, K. (2001). Trends, Rhythms, and Aberrations in Global Climate 65 Ma to Present. Science 292, 686-693.
Chapter I
Page 51Page 51

FRANTS�H.�JENSEN,�PHD�THESIS,�2011�
Page 52Page 52

� � �
Manuscripts
Chapter I
Page 53Page 53

FRANTS�H.�JENSEN,�PHD�THESIS,�2011�
Page 54Page 54
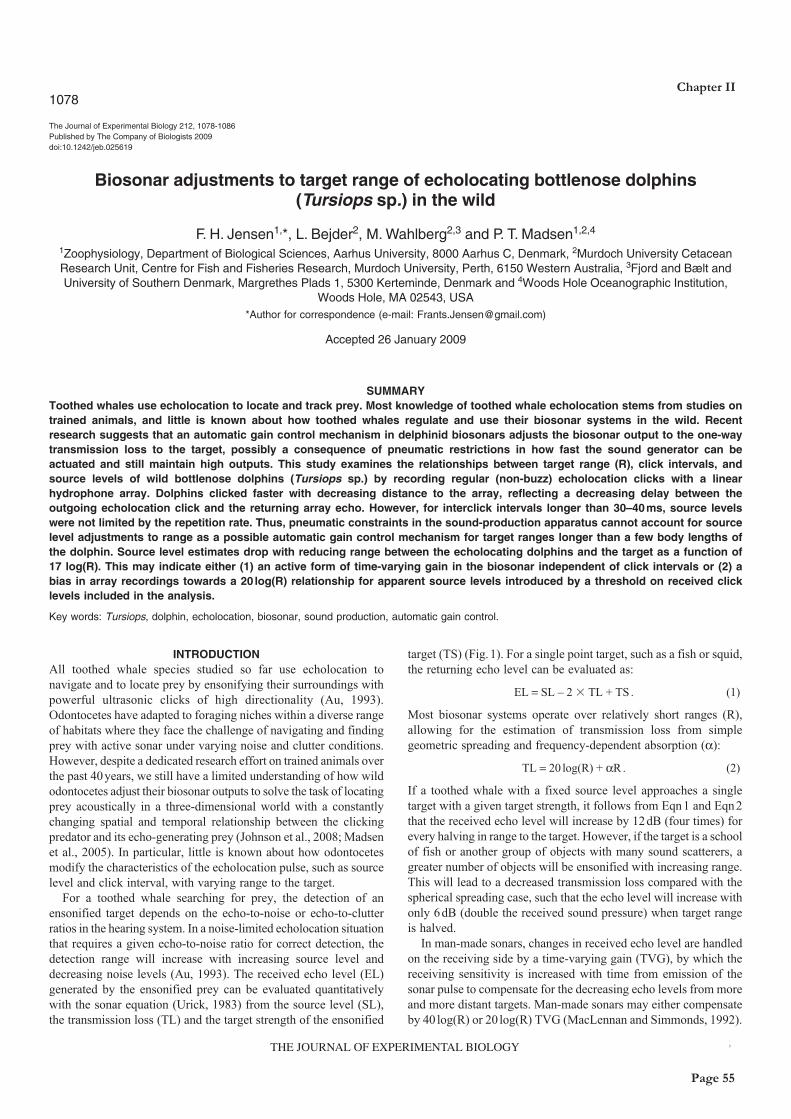
1078
INTRODUCTIONAll toothed whale species studied so far use echolocation tonavigate and to locate prey by ensonifying their surroundings withpowerful ultrasonic clicks of high directionality (Au, 1993).Odontocetes have adapted to foraging niches within a diverse rangeof habitats where they face the challenge of navigating and findingprey with active sonar under varying noise and clutter conditions.However, despite a dedicated research effort on trained animals overthe past 40years, we still have a limited understanding of how wildodontocetes adjust their biosonar outputs to solve the task of locatingprey acoustically in a three-dimensional world with a constantlychanging spatial and temporal relationship between the clickingpredator and its echo-generating prey (Johnson et al., 2008; Madsenet al., 2005). In particular, little is known about how odontocetesmodify the characteristics of the echolocation pulse, such as sourcelevel and click interval, with varying range to the target.
For a toothed whale searching for prey, the detection of anensonified target depends on the echo-to-noise or echo-to-clutterratios in the hearing system. In a noise-limited echolocation situationthat requires a given echo-to-noise ratio for correct detection, thedetection range will increase with increasing source level anddecreasing noise levels (Au, 1993). The received echo level (EL)generated by the ensonified prey can be evaluated quantitativelywith the sonar equation (Urick, 1983) from the source level (SL),the transmission loss (TL) and the target strength of the ensonified
target (TS) (Fig.1). For a single point target, such as a fish or squid,the returning echo level can be evaluated as:
EL = SL – 2 � TL + TS . (1)
Most biosonar systems operate over relatively short ranges (R),allowing for the estimation of transmission loss from simplegeometric spreading and frequency-dependent absorption (α):
TL = 20 log(R) + αR. (2)
If a toothed whale with a fixed source level approaches a singletarget with a given target strength, it follows from Eqn1 and Eqn2that the received echo level will increase by 12dB (four times) forevery halving in range to the target. However, if the target is a schoolof fish or another group of objects with many sound scatterers, agreater number of objects will be ensonified with increasing range.This will lead to a decreased transmission loss compared with thespherical spreading case, such that the echo level will increase withonly 6dB (double the received sound pressure) when target rangeis halved.
In man-made sonars, changes in received echo level are handledon the receiving side by a time-varying gain (TVG), by which thereceiving sensitivity is increased with time from emission of thesonar pulse to compensate for the decreasing echo levels from moreand more distant targets. Man-made sonars may either compensateby 40 log(R) or 20 log(R) TVG (MacLennan and Simmonds, 1992).
The Journal of Experimental Biology 212, 1078-1086Published by The Company of Biologists 2009doi:10.1242/jeb.025619
Biosonar adjustments to target range of echolocating bottlenose dolphins(Tursiops sp.) in the wild
F. H. Jensen1,*, L. Bejder2, M. Wahlberg2,3 and P. T. Madsen1,2,4
1Zoophysiology, Department of Biological Sciences, Aarhus University, 8000 Aarhus C, Denmark, 2Murdoch University CetaceanResearch Unit, Centre for Fish and Fisheries Research, Murdoch University, Perth, 6150 Western Australia, 3Fjord and Bælt andUniversity of Southern Denmark, Margrethes Plads 1, 5300 Kerteminde, Denmark and 4Woods Hole Oceanographic Institution,
Woods Hole, MA 02543, USA*Author for correspondence (e-mail: [email protected])
Accepted 26 January 2009
SUMMARYToothed whales use echolocation to locate and track prey. Most knowledge of toothed whale echolocation stems from studies ontrained animals, and little is known about how toothed whales regulate and use their biosonar systems in the wild. Recentresearch suggests that an automatic gain control mechanism in delphinid biosonars adjusts the biosonar output to the one-waytransmission loss to the target, possibly a consequence of pneumatic restrictions in how fast the sound generator can beactuated and still maintain high outputs. This study examines the relationships between target range (R), click intervals, andsource levels of wild bottlenose dolphins (Tursiops sp.) by recording regular (non-buzz) echolocation clicks with a linearhydrophone array. Dolphins clicked faster with decreasing distance to the array, reflecting a decreasing delay between theoutgoing echolocation click and the returning array echo. However, for interclick intervals longer than 30–40ms, source levelswere not limited by the repetition rate. Thus, pneumatic constraints in the sound-production apparatus cannot account for sourcelevel adjustments to range as a possible automatic gain control mechanism for target ranges longer than a few body lengths ofthe dolphin. Source level estimates drop with reducing range between the echolocating dolphins and the target as a function of17 log(R). This may indicate either (1) an active form of time-varying gain in the biosonar independent of click intervals or (2) abias in array recordings towards a 20 log(R) relationship for apparent source levels introduced by a threshold on received clicklevels included in the analysis.
Key words: Tursiops, dolphin, echolocation, biosonar, sound production, automatic gain control.
Chapter II
Page 55
Page 55
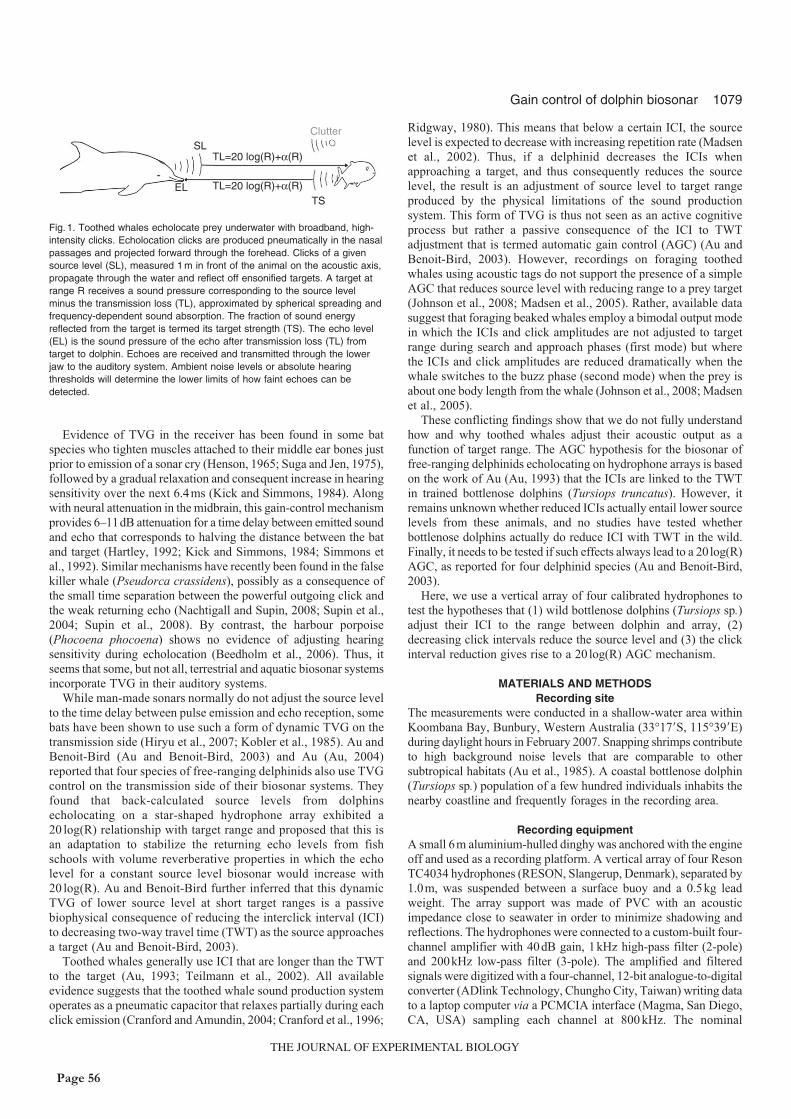
1079Gain control of dolphin biosonar
Evidence of TVG in the receiver has been found in some batspecies who tighten muscles attached to their middle ear bones justprior to emission of a sonar cry (Henson, 1965; Suga and Jen, 1975),followed by a gradual relaxation and consequent increase in hearingsensitivity over the next 6.4ms (Kick and Simmons, 1984). Alongwith neural attenuation in the midbrain, this gain-control mechanismprovides 6–11dB attenuation for a time delay between emitted soundand echo that corresponds to halving the distance between the batand target (Hartley, 1992; Kick and Simmons, 1984; Simmons etal., 1992). Similar mechanisms have recently been found in the falsekiller whale (Pseudorca crassidens), possibly as a consequence ofthe small time separation between the powerful outgoing click andthe weak returning echo (Nachtigall and Supin, 2008; Supin et al.,2004; Supin et al., 2008). By contrast, the harbour porpoise(Phocoena phocoena) shows no evidence of adjusting hearingsensitivity during echolocation (Beedholm et al., 2006). Thus, itseems that some, but not all, terrestrial and aquatic biosonar systemsincorporate TVG in their auditory systems.
While man-made sonars normally do not adjust the source levelto the time delay between pulse emission and echo reception, somebats have been shown to use such a form of dynamic TVG on thetransmission side (Hiryu et al., 2007; Kobler et al., 1985). Au andBenoit-Bird (Au and Benoit-Bird, 2003) and Au (Au, 2004)reported that four species of free-ranging delphinids also use TVGcontrol on the transmission side of their biosonar systems. Theyfound that back-calculated source levels from dolphinsecholocating on a star-shaped hydrophone array exhibited a20 log(R) relationship with target range and proposed that this isan adaptation to stabilize the returning echo levels from fishschools with volume reverberative properties in which the echolevel for a constant source level biosonar would increase with20 log(R). Au and Benoit-Bird further inferred that this dynamicTVG of lower source level at short target ranges is a passivebiophysical consequence of reducing the interclick interval (ICI)to decreasing two-way travel time (TWT) as the source approachesa target (Au and Benoit-Bird, 2003).
Toothed whales generally use ICI that are longer than the TWTto the target (Au, 1993; Teilmann et al., 2002). All availableevidence suggests that the toothed whale sound production systemoperates as a pneumatic capacitor that relaxes partially during eachclick emission (Cranford and Amundin, 2004; Cranford et al., 1996;
Ridgway, 1980). This means that below a certain ICI, the sourcelevel is expected to decrease with increasing repetition rate (Madsenet al., 2002). Thus, if a delphinid decreases the ICIs whenapproaching a target, and thus consequently reduces the sourcelevel, the result is an adjustment of source level to target rangeproduced by the physical limitations of the sound productionsystem. This form of TVG is thus not seen as an active cognitiveprocess but rather a passive consequence of the ICI to TWTadjustment that is termed automatic gain control (AGC) (Au andBenoit-Bird, 2003). However, recordings on foraging toothedwhales using acoustic tags do not support the presence of a simpleAGC that reduces source level with reducing range to a prey target(Johnson et al., 2008; Madsen et al., 2005). Rather, available datasuggest that foraging beaked whales employ a bimodal output modein which the ICIs and click amplitudes are not adjusted to targetrange during search and approach phases (first mode) but wherethe ICIs and click amplitudes are reduced dramatically when thewhale switches to the buzz phase (second mode) when the prey isabout one body length from the whale (Johnson et al., 2008; Madsenet al., 2005).
These conflicting findings show that we do not fully understandhow and why toothed whales adjust their acoustic output as afunction of target range. The AGC hypothesis for the biosonar offree-ranging delphinids echolocating on hydrophone arrays is basedon the work of Au (Au, 1993) that the ICIs are linked to the TWTin trained bottlenose dolphins (Tursiops truncatus). However, itremains unknown whether reduced ICIs actually entail lower sourcelevels from these animals, and no studies have tested whetherbottlenose dolphins actually do reduce ICI with TWT in the wild.Finally, it needs to be tested if such effects always lead to a 20log(R)AGC, as reported for four delphinid species (Au and Benoit-Bird,2003).
Here, we use a vertical array of four calibrated hydrophones totest the hypotheses that (1) wild bottlenose dolphins (Tursiops sp.)adjust their ICI to the range between dolphin and array, (2)decreasing click intervals reduce the source level and (3) the clickinterval reduction gives rise to a 20 log(R) AGC mechanism.
MATERIALS AND METHODSRecording site
The measurements were conducted in a shallow-water area withinKoombana Bay, Bunbury, Western Australia (33°17�S, 115°39�E)during daylight hours in February 2007. Snapping shrimps contributeto high background noise levels that are comparable to othersubtropical habitats (Au et al., 1985). A coastal bottlenose dolphin(Tursiops sp.) population of a few hundred individuals inhabits thenearby coastline and frequently forages in the recording area.
Recording equipmentA small 6m aluminium-hulled dinghy was anchored with the engineoff and used as a recording platform. A vertical array of four ResonTC4034 hydrophones (RESON, Slangerup, Denmark), separated by1.0m, was suspended between a surface buoy and a 0.5kg leadweight. The array support was made of PVC with an acousticimpedance close to seawater in order to minimize shadowing andreflections. The hydrophones were connected to a custom-built four-channel amplifier with 40dB gain, 1kHz high-pass filter (2-pole)and 200kHz low-pass filter (3-pole). The amplified and filteredsignals were digitized with a four-channel, 12-bit analogue-to-digitalconverter (ADlink Technology, Chungho City, Taiwan) writing datato a laptop computer via a PCMCIA interface (Magma, San Diego,CA, USA) sampling each channel at 800 kHz. The nominal
SLClutter
TL=20 log(R)+α(R)
TL=20 log(R)+α(R)ELTS
Fig. 1. Toothed whales echolocate prey underwater with broadband, high-intensity clicks. Echolocation clicks are produced pneumatically in the nasalpassages and projected forward through the forehead. Clicks of a givensource level (SL), measured 1 m in front of the animal on the acoustic axis,propagate through the water and reflect off ensonified targets. A target atrange R receives a sound pressure corresponding to the source levelminus the transmission loss (TL), approximated by spherical spreading andfrequency-dependent sound absorption. The fraction of sound energyreflected from the target is termed its target strength (TS). The echo level(EL) is the sound pressure of the echo after transmission loss (TL) fromtarget to dolphin. Echoes are received and transmitted through the lowerjaw to the auditory system. Ambient noise levels or absolute hearingthresholds will determine the lower limits of how faint echoes can bedetected.
Page 56
Page 56
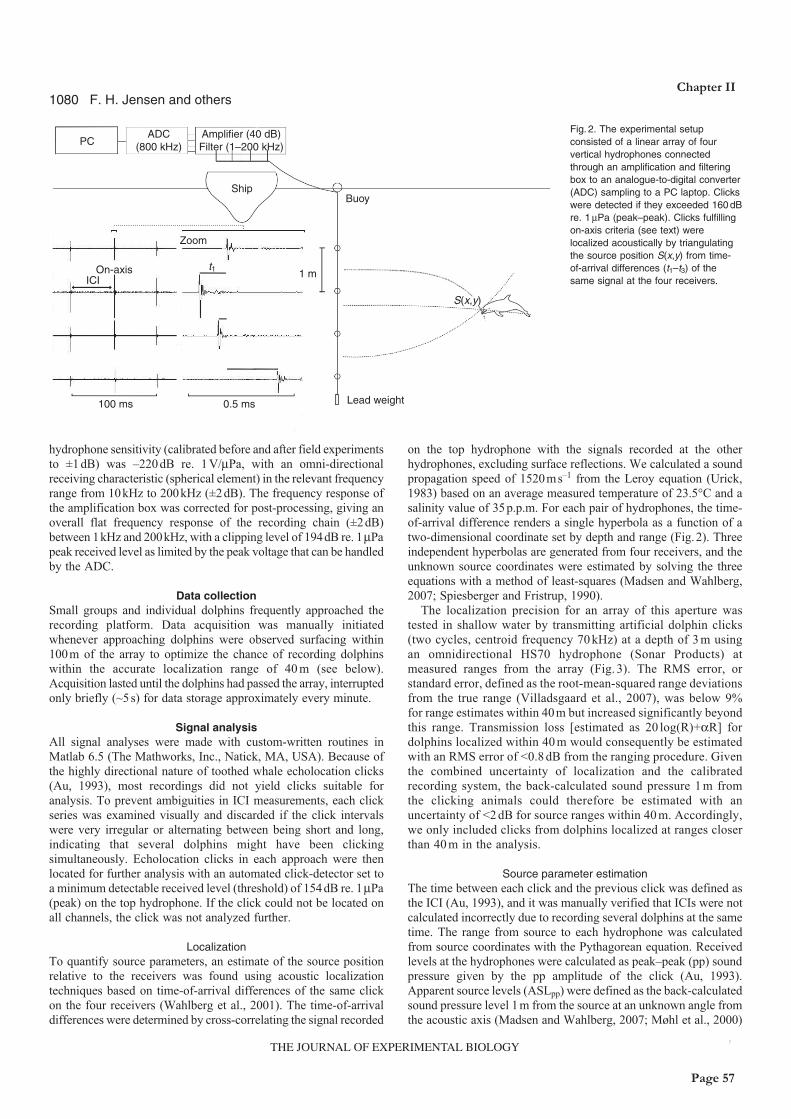
1080
hydrophone sensitivity (calibrated before and after field experimentsto ±1 dB) was –220 dB re. 1 V/μPa, with an omni-directionalreceiving characteristic (spherical element) in the relevant frequencyrange from 10kHz to 200kHz (±2dB). The frequency response ofthe amplification box was corrected for post-processing, giving anoverall flat frequency response of the recording chain (±2dB)between 1kHz and 200kHz, with a clipping level of 194dB re. 1μPapeak received level as limited by the peak voltage that can be handledby the ADC.
Data collectionSmall groups and individual dolphins frequently approached therecording platform. Data acquisition was manually initiatedwhenever approaching dolphins were observed surfacing within100m of the array to optimize the chance of recording dolphinswithin the accurate localization range of 40 m (see below).Acquisition lasted until the dolphins had passed the array, interruptedonly briefly (~5s) for data storage approximately every minute.
Signal analysisAll signal analyses were made with custom-written routines inMatlab 6.5 (The Mathworks, Inc., Natick, MA, USA). Because ofthe highly directional nature of toothed whale echolocation clicks(Au, 1993), most recordings did not yield clicks suitable foranalysis. To prevent ambiguities in ICI measurements, each clickseries was examined visually and discarded if the click intervalswere very irregular or alternating between being short and long,indicating that several dolphins might have been clickingsimultaneously. Echolocation clicks in each approach were thenlocated for further analysis with an automated click-detector set toa minimum detectable received level (threshold) of 154dB re. 1μPa(peak) on the top hydrophone. If the click could not be located onall channels, the click was not analyzed further.
LocalizationTo quantify source parameters, an estimate of the source positionrelative to the receivers was found using acoustic localizationtechniques based on time-of-arrival differences of the same clickon the four receivers (Wahlberg et al., 2001). The time-of-arrivaldifferences were determined by cross-correlating the signal recorded
F. H. Jensen and others
on the top hydrophone with the signals recorded at the otherhydrophones, excluding surface reflections. We calculated a soundpropagation speed of 1520ms–1 from the Leroy equation (Urick,1983) based on an average measured temperature of 23.5°C and asalinity value of 35p.p.m. For each pair of hydrophones, the time-of-arrival difference renders a single hyperbola as a function of atwo-dimensional coordinate set by depth and range (Fig.2). Threeindependent hyperbolas are generated from four receivers, and theunknown source coordinates were estimated by solving the threeequations with a method of least-squares (Madsen and Wahlberg,2007; Spiesberger and Fristrup, 1990).
The localization precision for an array of this aperture wastested in shallow water by transmitting artificial dolphin clicks(two cycles, centroid frequency 70 kHz) at a depth of 3 m usingan omnidirectional HS70 hydrophone (Sonar Products) atmeasured ranges from the array (Fig. 3). The RMS error, orstandard error, defined as the root-mean-squared range deviationsfrom the true range (Villadsgaard et al., 2007), was below 9%for range estimates within 40m but increased significantly beyondthis range. Transmission loss [estimated as 20 log(R)+αR] fordolphins localized within 40 m would consequently be estimatedwith an RMS error of <0.8 dB from the ranging procedure. Giventhe combined uncertainty of localization and the calibratedrecording system, the back-calculated sound pressure 1 m fromthe clicking animals could therefore be estimated with anuncertainty of <2 dB for source ranges within 40 m. Accordingly,we only included clicks from dolphins localized at ranges closerthan 40 m in the analysis.
Source parameter estimationThe time between each click and the previous click was defined asthe ICI (Au, 1993), and it was manually verified that ICIs were notcalculated incorrectly due to recording several dolphins at the sametime. The range from source to each hydrophone was calculatedfrom source coordinates with the Pythagorean equation. Receivedlevels at the hydrophones were calculated as peak–peak (pp) soundpressure given by the pp amplitude of the click (Au, 1993).Apparent source levels (ASLpp) were defined as the back-calculatedsound pressure level 1m from the source at an unknown angle fromthe acoustic axis (Madsen and Wahlberg, 2007; Møhl et al., 2000)
PCADC
(800 kHz)
Zoom
Ship
1 m
Buoy
Lead weight0.5 ms100 ms
On-axisICI
t1
S(x,y)
Amplifier (40 dB)Filter (1–200 kHz)
Fig. 2. The experimental setupconsisted of a linear array of fourvertical hydrophones connectedthrough an amplification and filteringbox to an analogue-to-digital converter(ADC) sampling to a PC laptop. Clickswere detected if they exceeded 160 dBre. 1μPa (peak–peak). Clicks fulfillingon-axis criteria (see text) werelocalized acoustically by triangulatingthe source position S(x,y) from time-of-arrival differences (t1–t3) of thesame signal at the four receivers.
Chapter II
Page 57
Page 57
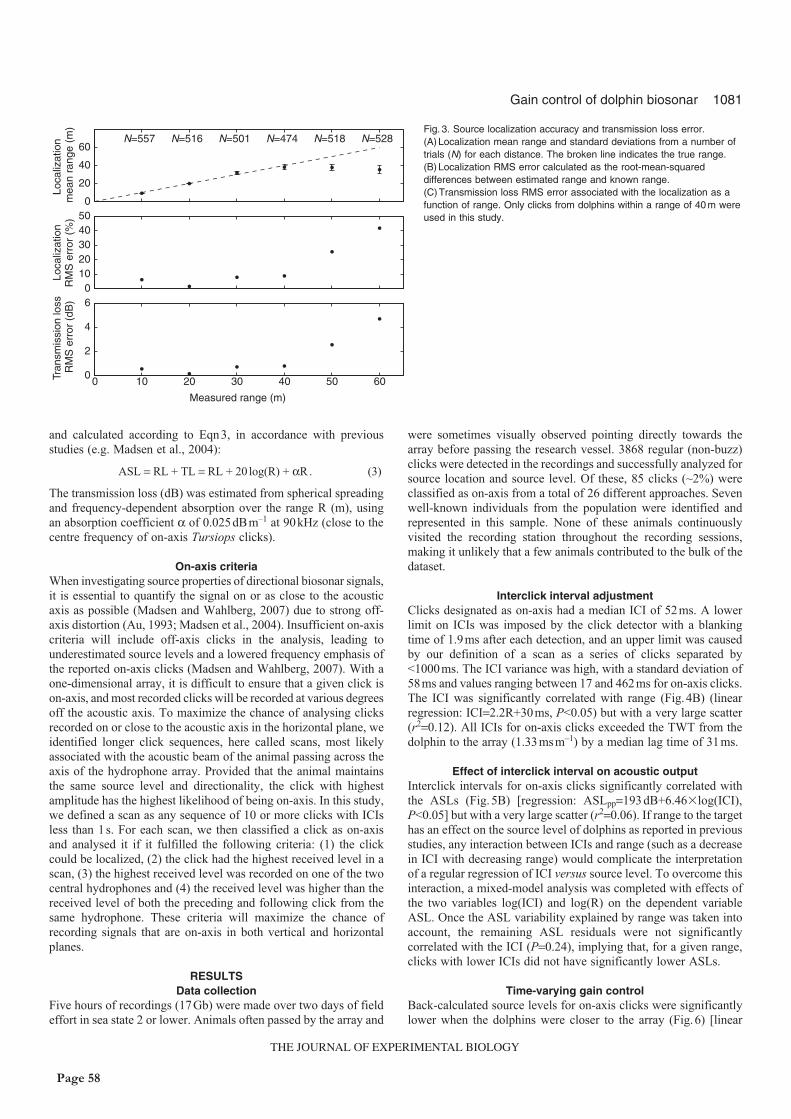
1081Gain control of dolphin biosonar
and calculated according to Eqn3, in accordance with previousstudies (e.g. Madsen et al., 2004):
ASL = RL + TL = RL + 20 log(R) + αR. (3)
The transmission loss (dB) was estimated from spherical spreadingand frequency-dependent absorption over the range R (m), usingan absorption coefficient α of 0.025dBm–1 at 90kHz (close to thecentre frequency of on-axis Tursiops clicks).
On-axis criteriaWhen investigating source properties of directional biosonar signals,it is essential to quantify the signal on or as close to the acousticaxis as possible (Madsen and Wahlberg, 2007) due to strong off-axis distortion (Au, 1993; Madsen et al., 2004). Insufficient on-axiscriteria will include off-axis clicks in the analysis, leading tounderestimated source levels and a lowered frequency emphasis ofthe reported on-axis clicks (Madsen and Wahlberg, 2007). With aone-dimensional array, it is difficult to ensure that a given click ison-axis, and most recorded clicks will be recorded at various degreesoff the acoustic axis. To maximize the chance of analysing clicksrecorded on or close to the acoustic axis in the horizontal plane, weidentified longer click sequences, here called scans, most likelyassociated with the acoustic beam of the animal passing across theaxis of the hydrophone array. Provided that the animal maintainsthe same source level and directionality, the click with highestamplitude has the highest likelihood of being on-axis. In this study,we defined a scan as any sequence of 10 or more clicks with ICIsless than 1s. For each scan, we then classified a click as on-axisand analysed it if it fulfilled the following criteria: (1) the clickcould be localized, (2) the click had the highest received level in ascan, (3) the highest received level was recorded on one of the twocentral hydrophones and (4) the received level was higher than thereceived level of both the preceding and following click from thesame hydrophone. These criteria will maximize the chance ofrecording signals that are on-axis in both vertical and horizontalplanes.
RESULTSData collection
Five hours of recordings (17Gb) were made over two days of fieldeffort in sea state 2 or lower. Animals often passed by the array and
were sometimes visually observed pointing directly towards thearray before passing the research vessel. 3868 regular (non-buzz)clicks were detected in the recordings and successfully analyzed forsource location and source level. Of these, 85 clicks (~2%) wereclassified as on-axis from a total of 26 different approaches. Sevenwell-known individuals from the population were identified andrepresented in this sample. None of these animals continuouslyvisited the recording station throughout the recording sessions,making it unlikely that a few animals contributed to the bulk of thedataset.
Interclick interval adjustmentClicks designated as on-axis had a median ICI of 52ms. A lowerlimit on ICIs was imposed by the click detector with a blankingtime of 1.9ms after each detection, and an upper limit was causedby our definition of a scan as a series of clicks separated by<1000ms. The ICI variance was high, with a standard deviation of58ms and values ranging between 17 and 462ms for on-axis clicks.The ICI was significantly correlated with range (Fig.4B) (linearregression: ICI=2.2R+30ms, P<0.05) but with a very large scatter(r2=0.12). All ICIs for on-axis clicks exceeded the TWT from thedolphin to the array (1.33msm–1) by a median lag time of 31ms.
Effect of interclick interval on acoustic outputInterclick intervals for on-axis clicks significantly correlated withthe ASLs (Fig. 5B) [regression: ASLpp=193 dB+6.46�log(ICI),P<0.05] but with a very large scatter (r2=0.06). If range to the targethas an effect on the source level of dolphins as reported in previousstudies, any interaction between ICIs and range (such as a decreasein ICI with decreasing range) would complicate the interpretationof a regular regression of ICI versus source level. To overcome thisinteraction, a mixed-model analysis was completed with effects ofthe two variables log(ICI) and log(R) on the dependent variableASL. Once the ASL variability explained by range was taken intoaccount, the remaining ASL residuals were not significantlycorrelated with the ICI (P=0.24), implying that, for a given range,clicks with lower ICIs did not have significantly lower ASLs.
Time-varying gain controlBack-calculated source levels for on-axis clicks were significantlylower when the dolphins were closer to the array (Fig.6) [linear
0 10 20 30 40 50 600
2
4
6
Measured range (m)
Tran
smis
sion
loss
RM
S e
rror
(dB
)
01020304050
Loca
lizat
ion
RM
S e
rror
(%
)
0
20
40
60
Loca
lizat
ion
mea
n ra
nge
(m)
N=557 N=516 N=501 N=474 N=518 N=528Fig. 3. Source localization accuracy and transmission loss error.(A) Localization mean range and standard deviations from a number oftrials (N) for each distance. The broken line indicates the true range.(B) Localization RMS error calculated as the root-mean-squareddifferences between estimated range and known range.(C) Transmission loss RMS error associated with the localization as afunction of range. Only clicks from dolphins within a range of 40 m wereused in this study.
Page 58
Page 58
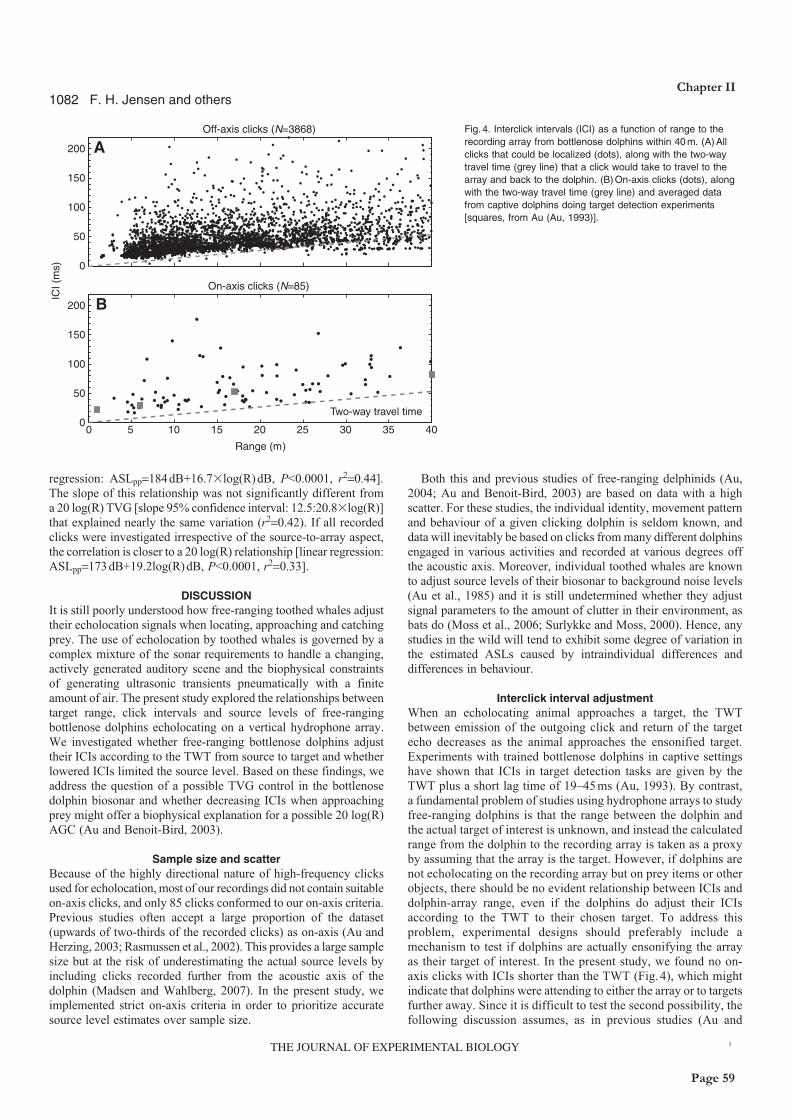
1082
regression: ASLpp=184dB+16.7�log(R)dB, P<0.0001, r2=0.44].The slope of this relationship was not significantly different froma 20 log(R) TVG [slope 95% confidence interval: 12.5:20.8�log(R)]that explained nearly the same variation (r2=0.42). If all recordedclicks were investigated irrespective of the source-to-array aspect,the correlation is closer to a 20 log(R) relationship [linear regression:ASLpp=173dB+19.2log(R)dB, P<0.0001, r2=0.33].
DISCUSSIONIt is still poorly understood how free-ranging toothed whales adjusttheir echolocation signals when locating, approaching and catchingprey. The use of echolocation by toothed whales is governed by acomplex mixture of the sonar requirements to handle a changing,actively generated auditory scene and the biophysical constraintsof generating ultrasonic transients pneumatically with a finiteamount of air. The present study explored the relationships betweentarget range, click intervals and source levels of free-rangingbottlenose dolphins echolocating on a vertical hydrophone array.We investigated whether free-ranging bottlenose dolphins adjusttheir ICIs according to the TWT from source to target and whetherlowered ICIs limited the source level. Based on these findings, weaddress the question of a possible TVG control in the bottlenosedolphin biosonar and whether decreasing ICIs when approachingprey might offer a biophysical explanation for a possible 20 log(R)AGC (Au and Benoit-Bird, 2003).
Sample size and scatterBecause of the highly directional nature of high-frequency clicksused for echolocation, most of our recordings did not contain suitableon-axis clicks, and only 85 clicks conformed to our on-axis criteria.Previous studies often accept a large proportion of the dataset(upwards of two-thirds of the recorded clicks) as on-axis (Au andHerzing, 2003; Rasmussen et al., 2002). This provides a large samplesize but at the risk of underestimating the actual source levels byincluding clicks recorded further from the acoustic axis of thedolphin (Madsen and Wahlberg, 2007). In the present study, weimplemented strict on-axis criteria in order to prioritize accuratesource level estimates over sample size.
F. H. Jensen and others
Both this and previous studies of free-ranging delphinids (Au,2004; Au and Benoit-Bird, 2003) are based on data with a highscatter. For these studies, the individual identity, movement patternand behaviour of a given clicking dolphin is seldom known, anddata will inevitably be based on clicks from many different dolphinsengaged in various activities and recorded at various degrees offthe acoustic axis. Moreover, individual toothed whales are knownto adjust source levels of their biosonar to background noise levels(Au et al., 1985) and it is still undetermined whether they adjustsignal parameters to the amount of clutter in their environment, asbats do (Moss et al., 2006; Surlykke and Moss, 2000). Hence, anystudies in the wild will tend to exhibit some degree of variation inthe estimated ASLs caused by intraindividual differences anddifferences in behaviour.
Interclick interval adjustmentWhen an echolocating animal approaches a target, the TWTbetween emission of the outgoing click and return of the targetecho decreases as the animal approaches the ensonified target.Experiments with trained bottlenose dolphins in captive settingshave shown that ICIs in target detection tasks are given by theTWT plus a short lag time of 19–45 ms (Au, 1993). By contrast,a fundamental problem of studies using hydrophone arrays to studyfree-ranging dolphins is that the range between the dolphin andthe actual target of interest is unknown, and instead the calculatedrange from the dolphin to the recording array is taken as a proxyby assuming that the array is the target. However, if dolphins arenot echolocating on the recording array but on prey items or otherobjects, there should be no evident relationship between ICIs anddolphin-array range, even if the dolphins do adjust their ICIsaccording to the TWT to their chosen target. To address thisproblem, experimental designs should preferably include amechanism to test if dolphins are actually ensonifying the arrayas their target of interest. In the present study, we found no on-axis clicks with ICIs shorter than the TWT (Fig. 4), which mightindicate that dolphins were attending to either the array or to targetsfurther away. Since it is difficult to test the second possibility, thefollowing discussion assumes, as in previous studies (Au and
0 5 10 15 20 25 30 35 400
50
100
150
200
Range (m)
ICI (
ms)
On-axis clicks (N=85)
Two-way travel time
0
50
100
150
200 A
B
Off-axis clicks (N=3868) Fig. 4. Interclick intervals (ICI) as a function of range to therecording array from bottlenose dolphins within 40 m. (A) Allclicks that could be localized (dots), along with the two-waytravel time (grey line) that a click would take to travel to thearray and back to the dolphin. (B) On-axis clicks (dots), alongwith the two-way travel time (grey line) and averaged datafrom captive dolphins doing target detection experiments[squares, from Au (Au, 1993)].
Chapter II
Page 59
Page 59
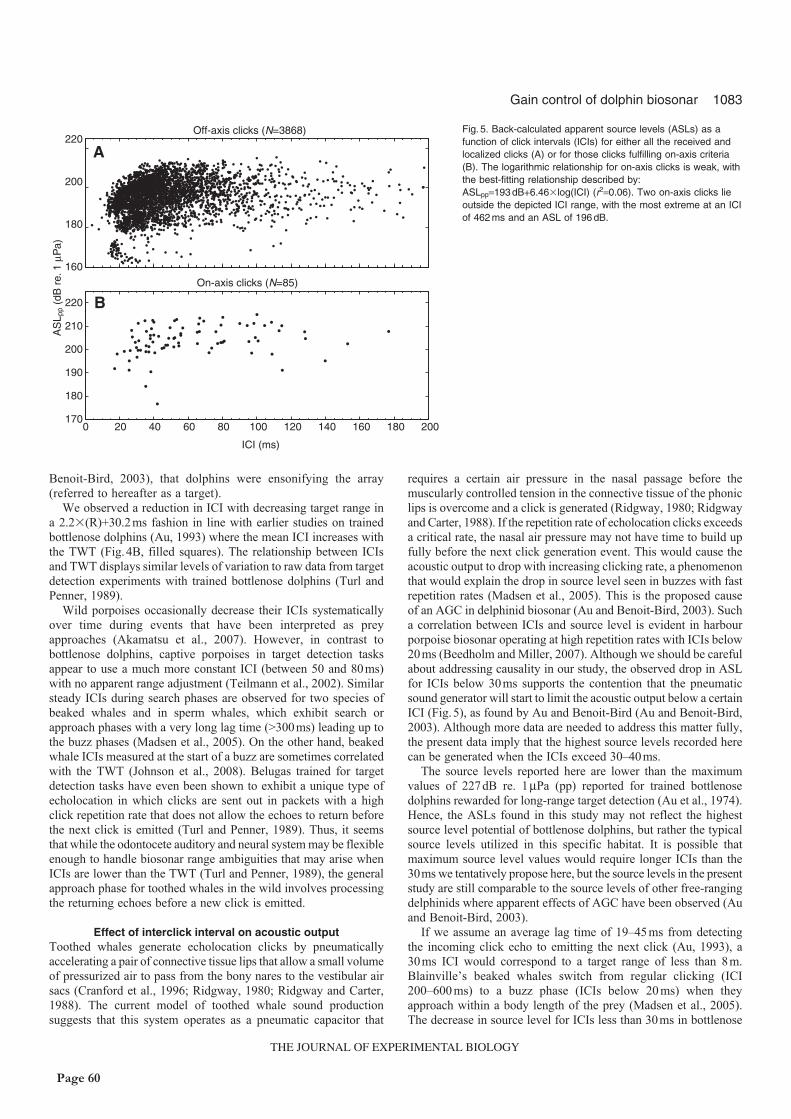
1083Gain control of dolphin biosonar
Benoit-Bird, 2003), that dolphins were ensonifying the array(referred to hereafter as a target).
We observed a reduction in ICI with decreasing target range ina 2.2�(R)+30.2ms fashion in line with earlier studies on trainedbottlenose dolphins (Au, 1993) where the mean ICI increases withthe TWT (Fig.4B, filled squares). The relationship between ICIsand TWT displays similar levels of variation to raw data from targetdetection experiments with trained bottlenose dolphins (Turl andPenner, 1989).
Wild porpoises occasionally decrease their ICIs systematicallyover time during events that have been interpreted as preyapproaches (Akamatsu et al., 2007). However, in contrast tobottlenose dolphins, captive porpoises in target detection tasksappear to use a much more constant ICI (between 50 and 80ms)with no apparent range adjustment (Teilmann et al., 2002). Similarsteady ICIs during search phases are observed for two species ofbeaked whales and in sperm whales, which exhibit search orapproach phases with a very long lag time (>300ms) leading up tothe buzz phases (Madsen et al., 2005). On the other hand, beakedwhale ICIs measured at the start of a buzz are sometimes correlatedwith the TWT (Johnson et al., 2008). Belugas trained for targetdetection tasks have even been shown to exhibit a unique type ofecholocation in which clicks are sent out in packets with a highclick repetition rate that does not allow the echoes to return beforethe next click is emitted (Turl and Penner, 1989). Thus, it seemsthat while the odontocete auditory and neural system may be flexibleenough to handle biosonar range ambiguities that may arise whenICIs are lower than the TWT (Turl and Penner, 1989), the generalapproach phase for toothed whales in the wild involves processingthe returning echoes before a new click is emitted.
Effect of interclick interval on acoustic outputToothed whales generate echolocation clicks by pneumaticallyaccelerating a pair of connective tissue lips that allow a small volumeof pressurized air to pass from the bony nares to the vestibular airsacs (Cranford et al., 1996; Ridgway, 1980; Ridgway and Carter,1988). The current model of toothed whale sound productionsuggests that this system operates as a pneumatic capacitor that
requires a certain air pressure in the nasal passage before themuscularly controlled tension in the connective tissue of the phoniclips is overcome and a click is generated (Ridgway, 1980; Ridgwayand Carter, 1988). If the repetition rate of echolocation clicks exceedsa critical rate, the nasal air pressure may not have time to build upfully before the next click generation event. This would cause theacoustic output to drop with increasing clicking rate, a phenomenonthat would explain the drop in source level seen in buzzes with fastrepetition rates (Madsen et al., 2005). This is the proposed causeof an AGC in delphinid biosonar (Au and Benoit-Bird, 2003). Sucha correlation between ICIs and source level is evident in harbourporpoise biosonar operating at high repetition rates with ICIs below20ms (Beedholm and Miller, 2007). Although we should be carefulabout addressing causality in our study, the observed drop in ASLfor ICIs below 30ms supports the contention that the pneumaticsound generator will start to limit the acoustic output below a certainICI (Fig.5), as found by Au and Benoit-Bird (Au and Benoit-Bird,2003). Although more data are needed to address this matter fully,the present data imply that the highest source levels recorded herecan be generated when the ICIs exceed 30–40ms.
The source levels reported here are lower than the maximumvalues of 227dB re. 1μPa (pp) reported for trained bottlenosedolphins rewarded for long-range target detection (Au et al., 1974).Hence, the ASLs found in this study may not reflect the highestsource level potential of bottlenose dolphins, but rather the typicalsource levels utilized in this specific habitat. It is possible thatmaximum source level values would require longer ICIs than the30ms we tentatively propose here, but the source levels in the presentstudy are still comparable to the source levels of other free-rangingdelphinids where apparent effects of AGC have been observed (Auand Benoit-Bird, 2003).
If we assume an average lag time of 19–45ms from detectingthe incoming click echo to emitting the next click (Au, 1993), a30ms ICI would correspond to a target range of less than 8m.Blainville’s beaked whales switch from regular clicking (ICI200–600 ms) to a buzz phase (ICIs below 20 ms) when theyapproach within a body length of the prey (Madsen et al., 2005).The decrease in source level for ICIs less than 30ms in bottlenose
0 20 40 60 80 100 120 140 160 180 200
ICI (ms)
AS
L pp
(dB
re.
1 μ
Pa)
On-axis clicks (N=85)
A
B
Off-axis clicks (N=3868)220
200
180
160
220
210
200
190
180
170
Fig. 5. Back-calculated apparent source levels (ASLs) as afunction of click intervals (ICIs) for either all the received andlocalized clicks (A) or for those clicks fulfilling on-axis criteria(B). The logarithmic relationship for on-axis clicks is weak, withthe best-fitting relationship described by:ASLpp=193 dB+6.46�log(ICI) (r2=0.06). Two on-axis clicks lieoutside the depicted ICI range, with the most extreme at an ICIof 462 ms and an ASL of 196 dB.
Page 60
Page 60
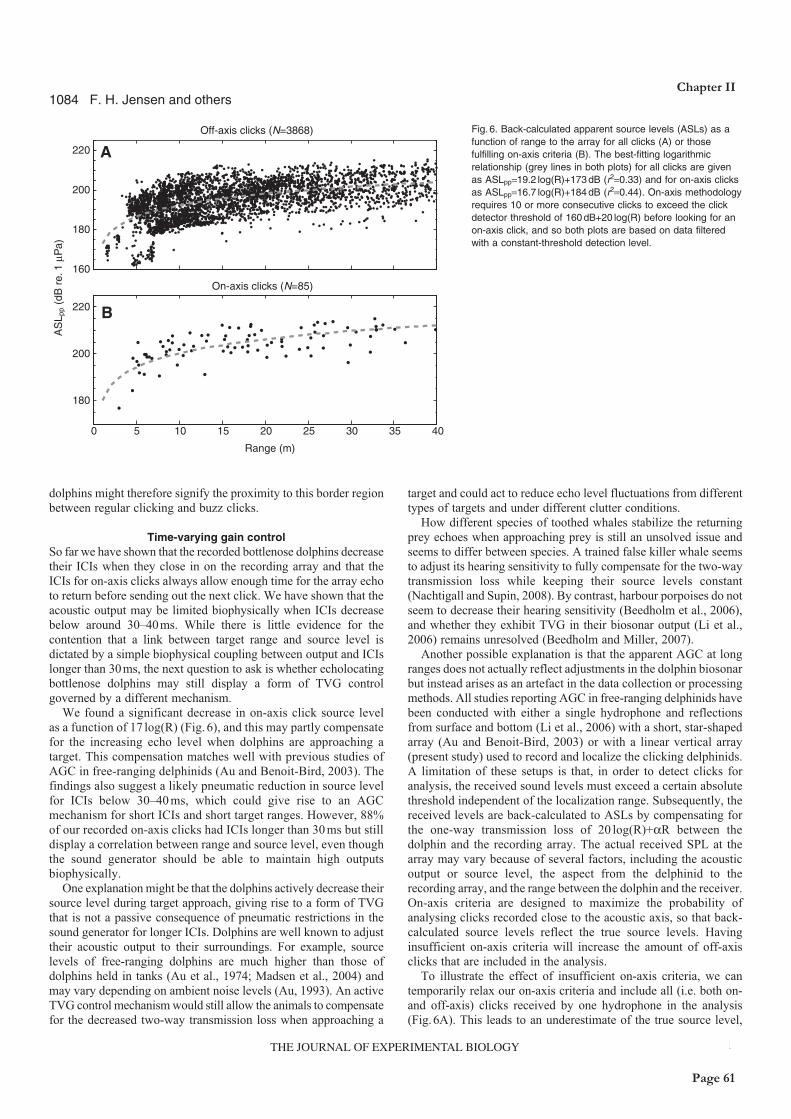
1084
dolphins might therefore signify the proximity to this border regionbetween regular clicking and buzz clicks.
Time-varying gain controlSo far we have shown that the recorded bottlenose dolphins decreasetheir ICIs when they close in on the recording array and that theICIs for on-axis clicks always allow enough time for the array echoto return before sending out the next click. We have shown that theacoustic output may be limited biophysically when ICIs decreasebelow around 30–40ms. While there is little evidence for thecontention that a link between target range and source level isdictated by a simple biophysical coupling between output and ICIslonger than 30ms, the next question to ask is whether echolocatingbottlenose dolphins may still display a form of TVG controlgoverned by a different mechanism.
We found a significant decrease in on-axis click source levelas a function of 17 log(R) (Fig. 6), and this may partly compensatefor the increasing echo level when dolphins are approaching atarget. This compensation matches well with previous studies ofAGC in free-ranging delphinids (Au and Benoit-Bird, 2003). Thefindings also suggest a likely pneumatic reduction in source levelfor ICIs below 30–40 ms, which could give rise to an AGCmechanism for short ICIs and short target ranges. However, 88%of our recorded on-axis clicks had ICIs longer than 30 ms but stilldisplay a correlation between range and source level, even thoughthe sound generator should be able to maintain high outputsbiophysically.
One explanation might be that the dolphins actively decrease theirsource level during target approach, giving rise to a form of TVGthat is not a passive consequence of pneumatic restrictions in thesound generator for longer ICIs. Dolphins are well known to adjusttheir acoustic output to their surroundings. For example, sourcelevels of free-ranging dolphins are much higher than those ofdolphins held in tanks (Au et al., 1974; Madsen et al., 2004) andmay vary depending on ambient noise levels (Au, 1993). An activeTVG control mechanism would still allow the animals to compensatefor the decreased two-way transmission loss when approaching a
F. H. Jensen and others
target and could act to reduce echo level fluctuations from differenttypes of targets and under different clutter conditions.
How different species of toothed whales stabilize the returningprey echoes when approaching prey is still an unsolved issue andseems to differ between species. A trained false killer whale seemsto adjust its hearing sensitivity to fully compensate for the two-waytransmission loss while keeping their source levels constant(Nachtigall and Supin, 2008). By contrast, harbour porpoises do notseem to decrease their hearing sensitivity (Beedholm et al., 2006),and whether they exhibit TVG in their biosonar output (Li et al.,2006) remains unresolved (Beedholm and Miller, 2007).
Another possible explanation is that the apparent AGC at longranges does not actually reflect adjustments in the dolphin biosonarbut instead arises as an artefact in the data collection or processingmethods. All studies reporting AGC in free-ranging delphinids havebeen conducted with either a single hydrophone and reflectionsfrom surface and bottom (Li et al., 2006) with a short, star-shapedarray (Au and Benoit-Bird, 2003) or with a linear vertical array(present study) used to record and localize the clicking delphinids.A limitation of these setups is that, in order to detect clicks foranalysis, the received sound levels must exceed a certain absolutethreshold independent of the localization range. Subsequently, thereceived levels are back-calculated to ASLs by compensating forthe one-way transmission loss of 20 log(R)+αR between thedolphin and the recording array. The actual received SPL at thearray may vary because of several factors, including the acousticoutput or source level, the aspect from the delphinid to therecording array, and the range between the dolphin and the receiver.On-axis criteria are designed to maximize the probability ofanalysing clicks recorded close to the acoustic axis, so that back-calculated source levels reflect the true source levels. Havinginsufficient on-axis criteria will increase the amount of off-axisclicks that are included in the analysis.
To illustrate the effect of insufficient on-axis criteria, we cantemporarily relax our on-axis criteria and include all (i.e. both on-and off-axis) clicks received by one hydrophone in the analysis(Fig.6A). This leads to an underestimate of the true source level,
0 5 10 15 20 25 30 35 40
180
200
220
Range (m)
160
180
200
220
AS
L pp
(dB
re.
1 μ
Pa)
On-axis clicks (N=85)
A
B
Off-axis clicks (N=3868) Fig. 6. Back-calculated apparent source levels (ASLs) as afunction of range to the array for all clicks (A) or thosefulfilling on-axis criteria (B). The best-fitting logarithmicrelationship (grey lines in both plots) for all clicks are givenas ASLpp=19.2 log(R)+173 dB (r2=0.33) and for on-axis clicksas ASLpp=16.7 log(R)+184 dB (r2=0.44). On-axis methodologyrequires 10 or more consecutive clicks to exceed the clickdetector threshold of 160 dB+20 log(R) before looking for anon-axis click, and so both plots are based on data filteredwith a constant-threshold detection level.
Chapter II
Page 61
Page 61
1085Gain control of dolphin biosonar
and the data fit closer to a 20 log(R) function. This would implythat dolphins echolocating at targets other than the array still adjusttheir biosonar to the array in a 20 log(R) fashion. However, the mainreason for these perplexing results is that clicks with low sourcelevels recorded from afar will fall below the detection thresholdbecause of a large transmission loss whereas clicks with equallylow source levels recorded close to the array are more likely toexceed the received level detection threshold and be included in theanalysis. Regardless of the detector type, click detection will alwaysultimately be limited by a set threshold or by a background or systemnoise floor in the recordings. The geometric spreading loss modelof 20 log(R) used will therefore effectively filter clicks in a fashionthat excludes clicks with low SLs at longer ranges and hence biasthe data towards a 20 log(R) relationship, irrespective of whetherdolphins actually adjust their source levels at all.
In conclusion, we have shown that free-ranging bottlenosedolphins emit echolocation clicks at ICIs that exceed the roundtriptravel time to the target, and with some adjustment to thedecreasing TWT as they approach a target. At the regular (non-buzz) echolocation click rates studied here, the acoustic outputgenerated by the pneumatic sound generator is only limited bythe repetition rate when the ICI drops below 30–40 ms. Thissupports the idea of a pneumatic constraint in the sound productionsystem that may account for the large reductions in source levelof fast repetition rate buzzes. We observe an apparent AGC of17 log(R) that is close to the 20 log(R) relationship reported inprevious studies. For targets within a few body lengths (whenICIs decrease below 30–40 ms), the adjustment of source levelsto target range may be a passive consequence of adjusting ICIsto target range to a degree where the nasal pressure does not havetime to build up fully. By contrast, this study suggests that theadjustment of source level to target ranges beyond a few bodylengths cannot be explained by pneumatic restrictions in the soundgenerator. Instead, they may stem from (1) an active, cognitiveadjustment of source level to target range to reduce fluctuationsin received echo levels or (2) an inherent observer bias causedby using click detectors with fixed received level thresholds andback-calculating source levels with a geometric spreading lossmodel of 20 log(R). Thus, bottlenose dolphins do adjust theirsound production to target range in terms of ICIs, and to somedegree also in terms of the biosonar output, but the question ofoverall TVG in the bottlenose dolphin biosonar remains unclear.This matter should be addressed experimentally in studies withvariable target location and constant source-to-array geometry (forexample, experiments with phantom echoes) or with onboardacoustic tags on animals that use their biosonars to echolocateon prey rather than recording arrays.
LIST OF ABBREVIATIONSAGC automatic gain controlASL apparent source levelEL echo levelICI interclick intervalR rangeRL received levelSL source levelTL transmission lossTS target strengthTVG time-varying gainTWT two-way travel time
This work was supported by the Danish Ph.D. School of Aquatic Sciences(SOAS), Aarhus University, Denmark, WWF Verdensnaturfonden and Aase andEjnar Danielsens Foundation, the Siemens Foundation, the Faculty of Science at
the Aarhus University, Denmark and the Danish Natural Science Foundation via aSteno scholarship and a logistics grant to P.T.M. We thank M. Hansen, M. Wilson,H. Schack, H. Smith and J. Knust for assistance in the field as well as MurdochUniversity and Bunbury Dolphin Discovery for logistics support. We are grateful toWhitlow Au, Hugh Finn and two anonymous reviewers for constructive commentson this paper. Research in Australia was conducted under a permit to L.B. fromthe Department of Environment and Conservation and Ethics Approval fromMurdoch University.
REFERENCESAkamatsu, T., Teilmann, J., Miller, L. A., Tougaard, J., Dietz, R., Wang, D., Wang,
K. X., Siebert, U. and Naito, Y. (2007). Comparison of echolocation behaviourbetween coastal and riverine porpoises. Deep-Sea Res. Part II 54, 290-297.
Au, W. W. L. (1993). The Sonar of Dolphins. New York: Springer Verlag.Au, W. W. L. (2004). Echolocation signals of wild dolphins. Acoust. Phys. 50, 454-462.Au, W. W. L. and Benoit-Bird, K. J. (2003). Automatic gain control in the
echolocation system of dolphins. Nature 423, 861-863.Au, W. W. L. and Herzing, D. L. (2003). Echolocation signals of wild Atlantic spotted
dolphin (Stenella frontalis). J. Acoust. Soc. Am. 113, 598-604.Au, W. W. L., Floyd, R. W., Penner, R. H. and Murchison, A. E. (1974).
Measurement of echolocation signals of atlantic bottlenose dolphin, Tursiopstruncatus Montagu, in open waters. J. Acoust. Soc. Am. 56, 1280-1290.
Au, W. W. L., Carder, D. A., Penner, R. H. and Scronce, B. L. (1985).Demonstration of adaptation in beluga whale echolocation signals. J. Acoust. Soc.Am. 77, 726-730.
Beedholm, K. and Miller, L. A. (2007). Automatic gain control in harbour porpoises(Phocoena phocoena)? Central versus peripheral mechanisms. Aquat. Mamm. 33,69-75.
Beedholm, K., Miller, L. A. and Blanchet, M. A. (2006). Auditory brainstem responsein a harbor porpoise show lack of automatic gain control for simulated echoes. J.Acoust. Soc. Am. 119, EL41-EL46.
Cranford, T. W. and Amundin, M. (2004). Biosonar pulse production in odontocetes:the state of our knowledge. In Echolocation in Bats and Dolphins (ed. J. A. Thomas,C. F. Moss and M. Vater), pp. 27-35. Chicago, IL: The University of Chicago Press.
Cranford, T. W., Amundin, M. and Norris, K. S. (1996). Functional morphology andhomology in the odontocete nasal complex: implications for sound generation. J.Morphol. 228, 223-285.
Hartley, D. J. (1992). Stabilization of perceived echo amplitudes in echolocating bats.I. Echo detection and automatic gain-control in the big brown bat, Eptesicus fuscus,and the fishing bat, Noctilio-leporinus. J. Acoust. Soc. Am. 91, 1120-1132.
Henson, O. W. (1965). Activity and function of middle-ear muscles in echo-locatingbats. J. Physiol. Lond. 180, 871-887.
Hiryu, S., Hagino, T., Riquimaroux, H. and Watanabe, Y. (2007). Echo-intensitycompensation in echolocating bats (Pipistrellus abramus) during flight measured by atelemetry microphone. J. Acoust. Soc. Am. 121, 1749-1757.
Johnson, M., Hickmott, L. S., Soto, N. A. and Madsen, P. T. (2008). Echolocationbehaviour adapted to prey in foraging Blainville’s beaked whale (Mesoplodondensirostris). Proc. Biol. Sci. 275, 133-139.
Kick, S. A. and Simmons, J. A. (1984). Automatic gain-control in the bats sonarreceiver and the neuroethology of echolocation. J. Neurosci. 4, 2725-2737.
Kobler, J. B., Wilson, B. S., Henson, O. W. and Bishop, A. L. (1985). Echo intensitycompensation by echolocating bats. Hear. Res. 20, 99-108.
Li, S. H., Wang, D., Wang, K. X. and Akamatsu, T. (2006). Sonar gain control inecholocating finless porpoises (Neophocaena phocaenoides) in an open water (L). J.Acoust. Soc. Am. 120, 1803-1806.
MacLennan, D. N. and Simmonds, J. (1992). Fisheries Acoustics. London: Chapman& Hall.
Madsen, P. T., Johnson, M., de Soto, N. A., Zimmer, W. M. X. and Tyack, P.(2005). Biosonar performance of foraging beaked whales (Mesoplodon densirostris).J. Exp. Biol. 208, 181-194.
Madsen, P. T., Kerr, I. and Payne, R. (2004). Echolocation clicks of two free-ranging,oceanic delphinids with different food preferences: false killer whales Pseudorcacrassidens and Risso’s dolphins Grampus griseus. J. Exp. Biol. 207, 1811-1823.
Madsen, P. T., Payne, R., Kristiansen, N. U., Wahlberg, M., Kerr, I. and Mohl, B.(2002). Sperm whale sound production studied with ultrasound time/depth-recordingtags. J. Exp. Biol. 205, 1899-1906.
Madsen, P. T. and Wahlberg, M. (2007). Recording and quantification of ultrasonicecholocation clicks from free-ranging toothed whales. Deep-Sea Res. Part I 54,1421-1444.
Møhl, B., Wahlberg, M., Madsen, P. T., Miller, L. A. and Surlykke, A. (2000). Spermwhale clicks: directionality and source level revisited. J. Acoust. Soc. Am. 107, 638-648.
Moss, C. F., Bohn, K., Gilkenson, H. and Surlykke, A. (2006). Active listening forspatial orientation in a complex auditory scene. Plos Biol. 4, 615-626.
Nachtigall, P. E. and Supin, A. Y. (2008). A false killer whale adjusts its hearingwhen it echolocates. J. Exp. Biol. 211, 1714-1718.
Rasmussen, M. H., Miller, L. A. and Au, W. W. L. (2002). Source levels of clicksfrom free-ranging white-beaked dolphins (Lagenorhynchus albirostris Gray 1846)recorded in Icelandic waters. J. Acoust. Soc. Am. 111, 1122-1125.
Ridgway, S. H. (1980). Electrophysiological experiments on hearing in odontocetes. InAnimal Sonar Systems (ed. R. G. Busnel and J. F. Fish), pp. 483-493. New York:Plenum Press.
Ridgway, S. H. and Carter, D. A. (1988). Nasal pressure and sound production in anecholocating white whale, Delphinapterus leucas. In Animal Sonar: Processes andPerformance (ed. P. E. Nachtigall and P. W. B. Moore), pp. 53-60. New York:Plenum Press.
Simmons, J. A., Moffat, A. J. M. and Masters, W. M. (1992). Sonar gain-control andecho detection thresholds in the echolocating bat, Eptesicus fuscus. J. Acoust. Soc.Am. 91, 1150-1163.
Page 62
Page 62
Spiesberger, J. L. and Fristrup, K. M. (1990). Passive localization of calling animalsand sensing of their acoustic environment using acoustic tomography. Am. Nat. 135,107-153.
Suga, N. and Jen, P. H. S. (1975). Peripheral control of acoustic-signals in auditory-system of echolocating bats. J. Exp. Biol. 62, 277-311.
Supin, A. Y., Nachtigall, P. E., Au, W. W. L. and Breese, M. (2004). The interactionof outgoing echolocation pulses and echoes in the false killer whale’s auditorysystem: evoked-potential study. J. Acoust. Soc. Am. 115, 3218-3225.
Supin, A. Y., Nachtigall, P. E. and Breese, M. (2008). Forward masking as amechanism of automatic gain control in odontocete biosonar: a psychophysicalstudy. J. Acoust. Soc. Am. 124, 648-656.
Surlykke, A. and Moss, C. F. (2000). Echolocation behavior of big brown bats,Eptesicus fuscus, in the field and the laboratory. J. Acoust. Soc. Am. 108, 2419-2429.
Teilmann, J., Miller, L. A., Kirketerp, T., Kastelein, R. A., Madsen, P. T., Nielsen,B. K. and Au, W. W. L. (2002). Characteristics of echolocation signals used by aharbour porpoise (Phocoena phocoena) in a target detection experiment. Aquat.Mamm. 28, 275-284.
Turl, C. W. and Penner, R. H. (1989). Differences in echolocation click patterns of thebeluga (Delphinapterus leucas) and the bottlenose dolphin (Tursiops truncatus). J.Acoust. Soc. Am. 86, 497-502.
Urick, R. J. (1983). Principles of Underwater Sound. New York: McGraw Hill.Villadsgaard, A., Wahlberg, M. and Tougaard, J. (2007). Echolocation signals of wild
harbour porpoises, Phocoena phocoena. J. Exp. Biol. 210, 56-64.Wahlberg, M., Mohl, B. and Madsen, P. T. (2001). Estimating source position
accuracy of a large-aperture hydrophone array for bioacoustics. J. Acoust. Soc. Am.109, 397-406.
F. H. Jensen and others1086Chapter II
Page 63
Page 63

Page 64Page 64
Wahlberg�et�al.�Tursiops�clicks�January�2011��
Drafted�for�JASA�1�
2�
3�
4�
5�
6�
7�
8�
9�
10�
11�
12�
13�
14�
15�
16�
17�
�
Source�Parameters�of�Echolocation�Clicks�from��
wild�Bottlenose�Dolphins�(Tursiops�aduncus)�
�Magnus�Wahlberg1,�3,�Frants�H�Jensen2,��
Kristian�Beedholm2,�Lars�Bejder3,�Peter�T.�Madsen2,�3��
1Fjord�&�Bælt�and�Marine�Research�Laboratory,�University�of�Southern�Denmark,�Margrethes�Plads�1,�
5300�Kerteminde,�Denmark,�magnus@fjord�baelt.dk�2�Zoophysiology,�Department�of�Biological�Sciences,�Aarhus�University,�C.�F.�Møllers�Alle�Building�
1131,�8000�Aarhus�C,�Denmark�3�Cetacean�Research�Unit,�Centre�for�Fish�and�Fisheries�Research,�Murdoch�University,�Perth,�West�
Australia,�Australia�
�
�
�
Chapter III
Page 65
Page 65
Wahlberg�et�al.�Tursiops�clicks�January�2011��
ABSTRACT�18�
19�
20�
21�
22�
23�
24�
25�
26�
27�
28�
29�
30�
31�
32�
33�
34�
35�
The� bottlenose� dolphin� (Tursiops� truncatus� and� T.� aduncus)� is� one� of� the� best� studied� species� of�
toothed�whales.�Almost�all�echolocation�studies�on�this�species�have�been�made�with�trained�animals�
in�captivity�and�the�echolocation�signals�of�free�ranging�animals�have�not�yet�been�quantified.�To�fill�
this� lack�of�data�the�source�parameters�of�clicks�from�wild�Tursiops�aduncus�were�measured�with�a�
linear�4�hydrophone�array.�89�clicks,�recorded�on�the�acoustic�axis,�had�a�source�level�of�205�±7�dB�re�
1μPa� pp� (mean±1� s.d.,� range� 177�219� dB� re� 1� μPa� pp),� a� duration� of� 18±6� μs� (range� 8�48� μs),� a�
centroid�frequency�of�91±13�kHz�(range�45�109�kHz)�and�an�rms�bandwidth�of�35±3�kHz�(range�25�43�
kHz).�The�transmission�directionality�index�was�29�dB,�which�is�3�dB�higher�than�previous�estimates�
from� trained� animals.� The� results� show� that� except� for� transmission� directionality,� the� source�
properties�of�clicks�of� free�ranging�Tursiops�are�similar� to� those�recorded� from�animals� in�captivity�
echolocating� in� open�water� conditions,� but� significantly� different� from� those� of� captive� animals�
recorded� in� acoustically�more� constrained� environments� in� tanks.� The� high� directionality� found� in�
free�ranging�individuals�is�likely�not�a�result�of�the�animal�modulating�the�frequency�properties�of�the�
transmitted�signal,�but�rather�caused�by�changes�in�the�internal�properties�of�the�sound�production�
system.��
�
PACS:��43.80.Ka,.�43.60.Cg.�43�60.Qv�
Page 66
Page 66
Wahlberg�et�al.�Tursiops�clicks�January�2011��
INTRODUCTION�36�
37�
38�
39�
40�
41�
42�
43�
44�
45�
46�
47�
48�
49�
50�
51�
52�
53�
54�
55�
56�
57�
58�
59�
60�
61�
62�
63�
Echolocation�has�evolved�as�the�primary�sensory�modality�in�both�toothed�whales�and�bats.�Since�the�
discovery� of� echolocation� in� bats� in� the� 1930s� (summarized� by� Griffin� 1958)� and� dolphins� in� the�
1950s� and� 1960s� (Kellog� 1958,� Norris� et� al.� 1961),� this� sensory� system� has� been� under� intense�
scientific�investigation�both�in�the�field�and�in�the�laboratory.�Trained�animals�in�captivity�have�been�
studied�to�describe�the�hearing�sensitivity,�target�detection�and�target�discrimination�abilities�of�both�
bats� and� dolphins� (Griffin� 1958,� Au� 1993,� Supin� et� al.� 2001).� � These� findings� have� been�
complemented�with�acoustic�recordings�and�behavioural�studies�of�animals�both�in�captivity�and�in�
the�field,�with�a�main�focus�on�addressing�how�echolocation�is�used�when�approaching�targets,�and�
quantifying�the�types�of�echolocation�signals�used�under�different�circumstances�(e.g.�Evans�&�Powell�
1967,�Johnson�et�al.�2006,�Verfuss�et�al.�2009,�Jakobsen�&�Surlykke�2010).�
�
In� field� studies� of� echolocation�we�obtain� data� from�animals� under� the� conditions� for�which� their�
sonar� evolved.� However,� there� is� little� or� no� experimental� control� to� test� specific� features� of�
echolocation.� Therefore,� carefully�designed� laboratory� studies�are�needed� to�understand� the�basic�
functions�of�echolocation,� such�as� the�hearing�and� target�detection�abilities�of� the�animal.�On� the�
other�hand,� in� the� laboratory� there� is�always� the� lurking�doubt�of�whether� trained�animals�held� in�
captivity�will�operate�their�sonar�in�a�manner�that�is�representative�of�free�ranging�animals.�Studies�
made� in� captivity� and� in� the� field� are� therefore� complementary� for� our� understanding� of� animal�
echolocation.�
��
For� toothed� whales,� an� overwhelming� amount� of� studies� have� been�made� on� captive� bottlenose�
dolphins� (Tursiops� truncatus;�Au,�1993).�Bottlenose�dolphins� lend� themselves�well� to� captivity� and�
are�ideal�for�training�using�methods�of�positive�reinforcement.�Therefore,�this�was�the�first�toothed�
whale�species� in�which�biosonar�was�unequivocally�demonstrated�(Kellog�1958,�Norris�et�al.�1961).�
Since�then,�there�has�been�a�range�of�studies�on�the�hearing�abilities�and�biosonar�performance�of�
these�animals�(Au�1993,�Supin�et�al.�2001).��
�
Chapter III
Page 67
Page 67
Wahlberg�et�al.�Tursiops�clicks�January�2011��
In�earlier�recordings�of�bottlenose�dolphins,�click�source�levels�were�estimated�to�be�around�170�dB�
re� 1� μPa� pp,� with� a� frequency� emphasis� around� 35�60� kHz� (Evans� 1973).� � These� recordings�were�
made�in�relatively�small�tanks�that�hence�were�highly�reverberant.�To�test�what�bottlenose�dolphins�
were� capable� of� under�much� less� reverberant� conditions,� Au�et� al.� (1974)� and�Murchinson� (1980)�
performed� long� range� target� detection� experiments� with� animals� in� an� open�water� environment.�
They�measured�source�levels�of�up�to�228�dB�re�1μPa�pp�@�1�m�when�the�bottlenose�dolphins�were�
pushed� to� detect� a� 5� cm� steel� sphere� at� the� longest� possible� ranges� out� to� 89� meters.�
Simultaneously,�‘the�peak�frequency�of�the�clicks�increased�to�above�100�kHz.�
64�
65�
66�
67�
68�
69�
70�
71�
72�
73�
74�
75�
76�
77�
78�
79�
80�
81�
82�
83�
84�
85�
86�
87�
88�
89�
90�
91�
92�
��
Later�studies�have�shown�that�bottlenose�dolphins�can�not�only�modulate�the�click�source�levels�and�
the� frequency� contents� but� also� the� interclick� intervals,� depending� on� the� echolocation� task,� the�
range�to�the�target,�the�background�noise�level,�and�the�amount�of�clutter�(Moore�&�Pawloski�1988,�
Penner�1988,�Au�1993,�Supin�et�al.�2001,� Ibsen�et�al.�2010,� Jensen�et�al.�2009a).�The�direction�and�
width�of�the�beam�can�be�changed�to�facilitate�the�detection�of�targets�slightly�off�the�dolphin�body�
axis�(Moore�et�al.�2008).�There�is�a�positive�correlation�between�the�emitted�frequency�content�and�
the� directionality� of� the� signals,� as�well� as� between� the� frequency� content� of� the� clicks� and� their�
source�level�(Au�1993,�Au�et�al.�1995).�The�various�signal�waveforms�and�spectral�patterns�have�been�
used�to�define�different�click�types�for�automated�classification�of�bottlenose�dolphin�echolocation�
signals� (Houser� et� al.� 1999,� Muller� et� al.� 2008).� � However,� these� studies� were� carried� out� in�
experimental�conditions�with�relatively�short�target�ranges�resulting�in�most�clicks�having�low�source�
levels,�low�centroid�frequencies�and�narrow�bandwidths�compared�to�the�open�water�experiments�of�
Au�et�al.�(1974)�and�Murchinson�(1980).��
�
The�discrepancies�in�signal�shape�and�intensity�between�animals�kept�in�small�tanks�and�under�open�
water�conditions�are�probably�due�to�the�fact�that�in�confined�quarters,�strong�echoes�from�nearby�
structures�will� interfere�with�the�biosonar�performance�of�the�animal�that� in�turn�therefore�reduce�
the�output� level� and,�mainly� as� a� passive� consequence,� also� the� frequency� content� of� the� signals.�
Both� these� parameters� have� a� significant� effect� on� the� biosonar� performance,� as� both� target�
discrimination�and�target�ranging�abilities�critically�depend�on�them�(Au�1993,�Siemers�&�Schnitzler�
Page 68
Page 68
Wahlberg�et�al.�Tursiops�clicks�January�2011��
2004,� Kloepper� et� al.� 2010).� � This� raises� the� question� of�whether� the� results� from� psychophysical�
echolocation� trials�made�on�bottlenose�dolphins� in� captivity� are�directly� applicable�when� trying� to�
understand�the�biosonar�performance�of�animals�in�the�field.�Furthermore,�the�properties�of�captive�
Tursiops�clicks�have�also�been�used�to�estimate�the�performance�on�echolocating�Tursiops�in�the�wild�
in�terms�of�detection�ranges�(Au�et�al.�2007;�Madsen�et�al�2007)�and�target�discrimination�abilities�
(Au� et� al.� 2009;� Yovel� &� Au� 2010).� While� such� ecophysiological� inferences� are� important� for�
understanding�the�evolution�and�use�of�biosonars�in�the�wild,�they�critically�hinge�on�the�fact�that�the�
chosen� parameters� (out� of� many)� from� the� captive� Tursiops� are� representative� for� their� wild�
conspecifics.��
93�
94�
95�
96�
97�
98�
99�
100�
101�
102�
103�
104�
105�
106�
107�
108�
109�
110�
111�
112�
113�
114�
115�
116�
117�
118�
119�
120�
121�
�
The� problem� of� assuming� that� captive� animals� behave� similarly� to� animals� in� the� field� has� been�
emphasized�also�in�the�bat�literature.�The�big�brown�bat�(Eptesicus�fuscus)�produces�long,�powerful�
signals�in�the�wild�that�have�never�been�recorded�in�any�setting�in�the�lab,�even�though�this�species�is�
one�of�the�most�well�studied�of�all�bat�species�in�captivity�(Surlykke��&��Moss�2000).�The�danger� in�
extrapolating� from� the� lab� to� the� wild� is� that� the� lab� settings� may� on� purpose� or� inadvertently�
(clutter,� noise)� have� led� the� animals� to� produce� signals� with� source� properties� that� are� not�
representative�for�wild�conspecifics.�Aspects�of�the�acoustic�behaviour�of�echolocating�free�ranging�
bottlenose�dolphins�have�recently�been�reported�by�Jensen�et�al.� (2009a)�and�Simard�et�al.� (2009),�
but�basic� source�parameters�have�yet� to�be� reported� for�wild� specimens�of� this� species,�despite� it�
being�the�most�studied�toothed�whale�species�in�captivity.��
�
To�alleviate�that�lack�of�data�we�recorded�echolocation�signals�of�free�ranging�Tursiops�using�a�four�
element,�vertical�hydrophone�array.�For�the�first�time�we�report�on�the�detailed�source�properties�of�
echolocation� signals� from� free�ranging� Tursiops� and� compare� those� to� what� is� known� about� the�
echolocation�signals�of�this�species�from�animals�held�in�captivity.��
�
MATERIAL�AND�METHODS�
Recordings� were� made� with� a� linear� 4�hydrophone� array.� The� hydrophones� were� aligned� by�
mounting�them�with�an�interconnected�set�of�PVC�pipes.�The�distance�between�the�hydrophones�was�
Chapter III
Page 69
Page 69
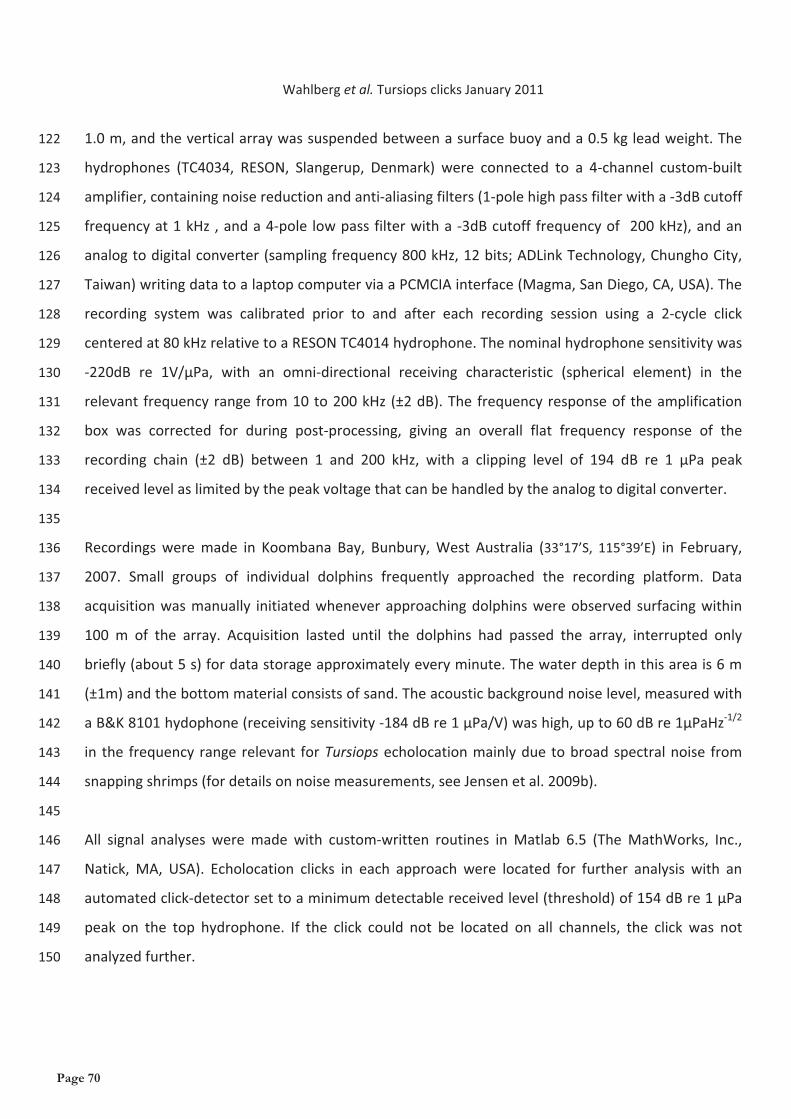
Wahlberg�et�al.�Tursiops�clicks�January�2011��
1.0�m,�and�the�vertical�array�was�suspended�between�a�surface�buoy�and�a�0.5�kg�lead�weight.�The�
hydrophones� (TC4034,� RESON,� Slangerup,� Denmark)� were� connected� to� a� 4�channel� custom�built�
amplifier,�containing�noise�reduction�and�anti�aliasing�filters�(1�pole�high�pass�filter�with�a��3dB�cutoff�
frequency�at�1�kHz� ,�and�a�4�pole� low�pass�filter�with�a��3dB�cutoff� frequency�of� �200�kHz),�and�an�
analog�to�digital�converter�(sampling�frequency�800�kHz,�12�bits;�ADLink�Technology,�Chungho�City,�
Taiwan)�writing�data�to�a�laptop�computer�via�a�PCMCIA�interface�(Magma,�San�Diego,�CA,�USA).�The�
recording� system� was� calibrated� prior� to� and� after� each� recording� session� using� a� 2�cycle� click�
centered�at�80�kHz�relative�to�a�RESON�TC4014�hydrophone.�The�nominal�hydrophone�sensitivity�was�
�220dB� re� 1V/μPa,� with� an� omni�directional� receiving� characteristic� (spherical� element)� in� the�
relevant� frequency�range�from�10�to�200�kHz�(±2�dB).�The� frequency�response�of� the�amplification�
box� was� corrected� for� during� post�processing,� giving� an� overall� flat� frequency� response� of� the�
recording� chain� (±2� dB)� between� 1� and� 200� kHz,� with� a� clipping� level� of� 194� dB� re� 1� μPa� peak�
received�level�as�limited�by�the�peak�voltage�that�can�be�handled�by�the�analog�to�digital�converter.�
122�
123�
124�
125�
126�
127�
128�
129�
130�
131�
132�
133�
134�
135�
136�
137�
138�
139�
140�
141�
142�
143�
144�
145�
146�
147�
148�
149�
150�
�
Recordings�were�made� in� Koombana� Bay,� Bunbury,�West� Australia� (33°17’S,� 115°39’E)� in� February,�
2007.� Small� groups� of� individual� dolphins� frequently� approached� the� recording� platform.� Data�
acquisition�was�manually� initiated�whenever�approaching�dolphins�were�observed� surfacing�within�
100� m� of� the� array.� Acquisition� lasted� until� the� dolphins� had� passed� the� array,� interrupted� only�
briefly�(about�5�s)�for�data�storage�approximately�every�minute.�The�water�depth�in�this�area�is�6�m�
(±1m)�and�the�bottom�material�consists�of�sand.�The�acoustic�background�noise�level,�measured�with�
a�B&K�8101�hydophone�(receiving�sensitivity��184�dB�re�1�μPa/V)�was�high,�up�to�60�dB�re�1μPaHz�1/2�
in� the� frequency� range�relevant� for�Tursiops�echolocation�mainly�due�to�broad�spectral�noise� from�
snapping�shrimps�(for�details�on�noise�measurements,�see�Jensen�et�al.�2009b).�
�
All� signal� analyses� were�made� with� custom�written� routines� in�Matlab� 6.5� (The�MathWorks,� Inc.,�
Natick,�MA,� USA).� Echolocation� clicks� in� each� approach� were� located� for� further� analysis� with� an�
automated�click�detector�set�to�a�minimum�detectable�received�level�(threshold)�of�154�dB�re�1�μPa�
peak� on� the� top� hydrophone.� If� the� click� could� not� be� located� on� all� channels,� the� click� was� not�
analyzed�further.�
Page 70
Page 70
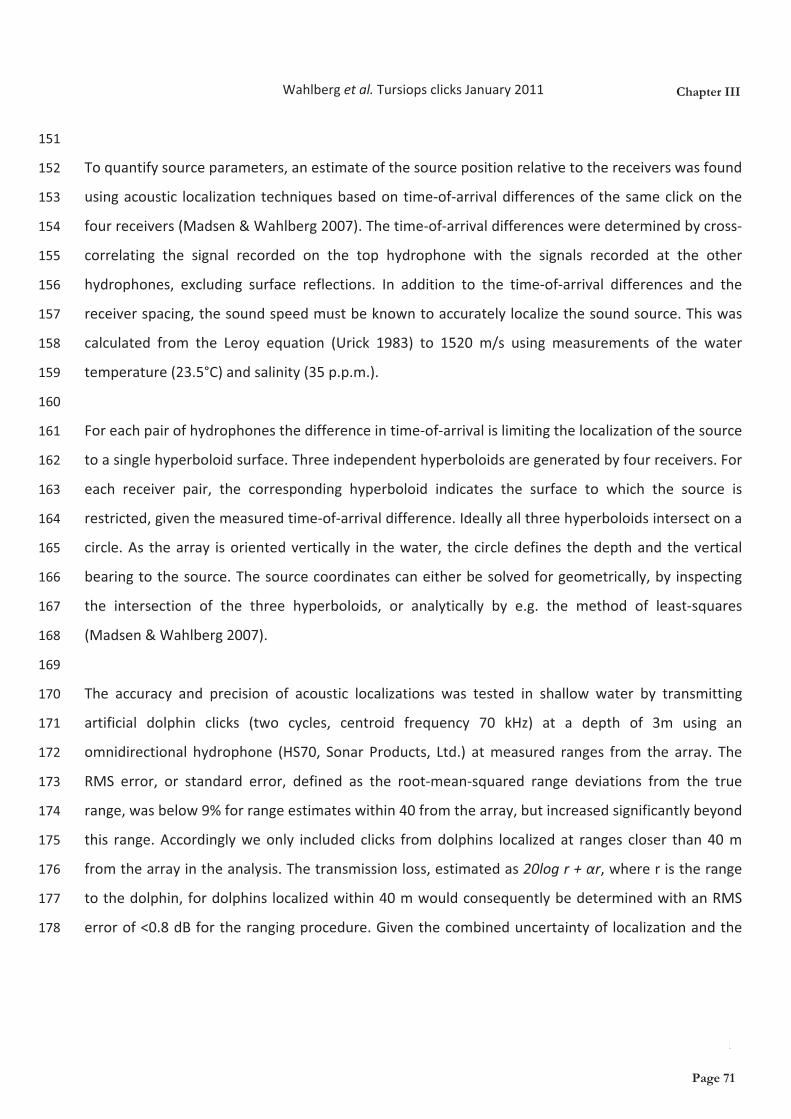
Wahlberg�et�al.�Tursiops�clicks�January�2011��
�151�
152�
153�
154�
155�
156�
157�
158�
159�
160�
161�
162�
163�
164�
165�
166�
167�
168�
169�
170�
171�
172�
173�
174�
175�
176�
177�
178�
To�quantify�source�parameters,�an�estimate�of�the�source�position�relative�to�the�receivers�was�found�
using�acoustic� localization�techniques�based�on�time�of�arrival�differences�of� the�same�click�on�the�
four�receivers�(Madsen�&�Wahlberg�2007).�The�time�of�arrival�differences�were�determined�by�cross�
correlating� the� signal� recorded� on� the� top� hydrophone� with� the� signals� recorded� at� the� other�
hydrophones,� excluding� surface� reflections.� In� addition� to� the� time�of�arrival� differences� and� the�
receiver�spacing,�the�sound�speed�must�be�known�to�accurately�localize�the�sound�source.�This�was�
calculated� from� the� Leroy� equation� (Urick� 1983)� to� 1520� m/s� using� measurements� of� the� water�
temperature�(23.5°C)�and�salinity�(35�p.p.m.).�
�
For�each�pair�of�hydrophones�the�difference�in�time�of�arrival�is�limiting�the�localization�of�the�source�
to�a�single�hyperboloid�surface.�Three�independent�hyperboloids�are�generated�by�four�receivers.�For�
each� receiver� pair,� the� corresponding� hyperboloid� indicates� the� surface� to� which� the� source� is�
restricted,�given�the�measured�time�of�arrival�difference.�Ideally�all�three�hyperboloids�intersect�on�a�
circle.�As� the�array� is�oriented�vertically� in� the�water,� the�circle�defines� the�depth�and� the�vertical�
bearing�to�the�source.�The�source�coordinates�can�either�be�solved�for�geometrically,�by� inspecting�
the� intersection� of� the� three� hyperboloids,� or� analytically� by� e.g.� the� method� of� least�squares�
(Madsen�&�Wahlberg�2007).�
�
The� accuracy� and� precision� of� acoustic� localizations� was� tested� in� shallow� water� by� transmitting�
artificial� dolphin� clicks� (two� cycles,� centroid� frequency� 70� kHz)� at� a� depth� of� 3m� using� an�
omnidirectional� hydrophone� (HS70,� Sonar� Products,� Ltd.)� at�measured� ranges� from� the� array.� The�
RMS� error,� or� standard� error,� defined� as� the� root�mean�squared� range� deviations� from� the� true�
range,�was�below�9%�for�range�estimates�within�40�from�the�array,�but�increased�significantly�beyond�
this� range.�Accordingly�we�only� included� clicks� from�dolphins� localized�at� ranges� closer� than�40�m�
from�the�array�in�the�analysis.�The�transmission�loss,�estimated�as�20log�r�+��r,�where�r�is�the�range�
to�the�dolphin,�for�dolphins� localized�within�40�m�would�consequently�be�determined�with�an�RMS�
error�of�<0.8�dB�for�the�ranging�procedure.�Given�the�combined�uncertainty�of� localization�and�the�
Chapter III
Page 71
Page 71
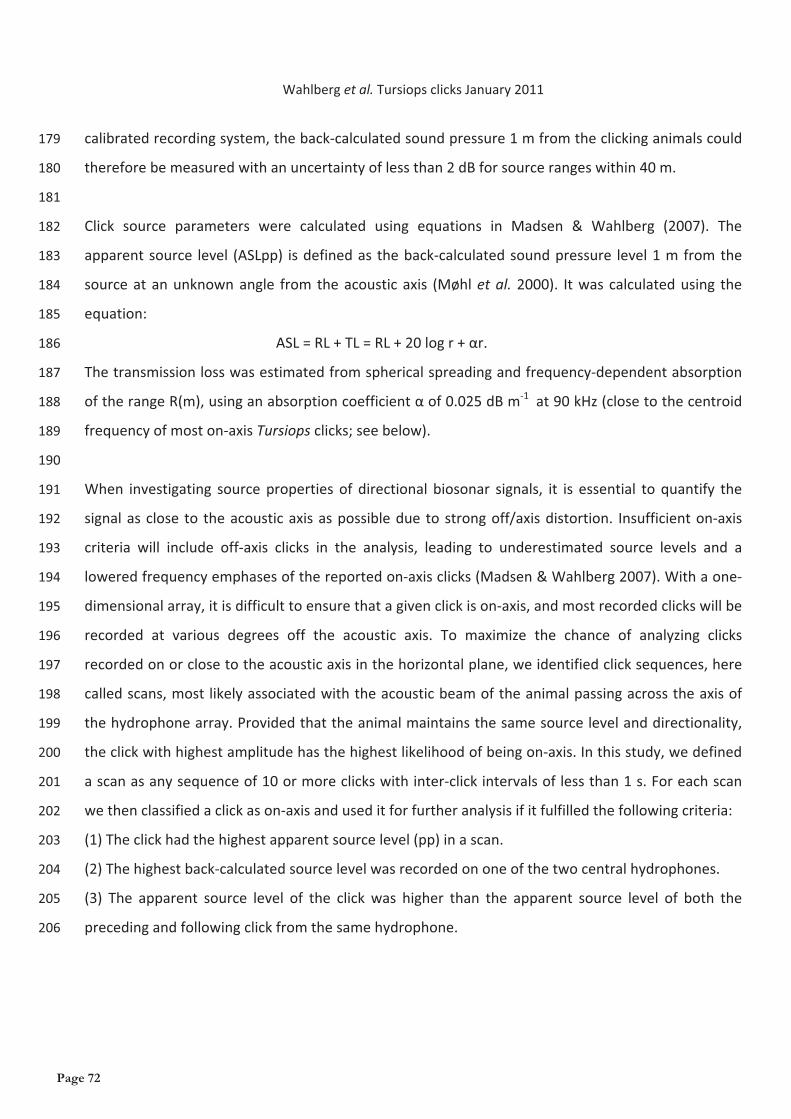
Wahlberg�et�al.�Tursiops�clicks�January�2011��
calibrated�recording�system,�the�back�calculated�sound�pressure�1�m�from�the�clicking�animals�could�
therefore�be�measured�with�an�uncertainty�of�less�than�2�dB�for�source�ranges�within�40�m.��
179�
180�
181�
182�
183�
184�
185�
186�
187�
188�
189�
190�
191�
192�
193�
194�
195�
196�
197�
198�
199�
200�
201�
202�
203�
204�
205�
206�
�
Click� source� parameters� were� calculated� using� equations� in� Madsen� &� Wahlberg� (2007).� The�
apparent�source� level� (ASLpp)� is�defined�as� the�back�calculated�sound�pressure� level�1�m�from�the�
source�at�an�unknown�angle� from� the�acoustic�axis� (Møhl�et�al.� 2000).� It�was� calculated�using� the�
equation:�
� � � � ASL�=�RL�+�TL�=�RL�+�20�log�r�+��r.�
The�transmission�loss�was�estimated�from�spherical�spreading�and�frequency�dependent�absorption�
of�the�range�R(m),�using�an�absorption�coefficient���of�0.025�dB�m�1��at�90�kHz�(close�to�the�centroid�
frequency�of�most�on�axis�Tursiops�clicks;�see�below).�
�
When� investigating� source�properties� of� directional� biosonar� signals,� it� is� essential� to� quantify� the�
signal�as�close� to� the�acoustic�axis�as�possible�due� to�strong�off/axis�distortion.� Insufficient�on�axis�
criteria� will� include� off�axis� clicks� in� the� analysis,� leading� to� underestimated� source� levels� and� a�
lowered�frequency�emphases�of�the�reported�on�axis�clicks�(Madsen�&�Wahlberg�2007).�With�a�one�
dimensional�array,�it�is�difficult�to�ensure�that�a�given�click�is�on�axis,�and�most�recorded�clicks�will�be�
recorded� at� various� degrees� off� the� acoustic� axis.� To� maximize� the� chance� of� analyzing� clicks�
recorded�on�or�close�to�the�acoustic�axis�in�the�horizontal�plane,�we�identified�click�sequences,�here�
called�scans,�most�likely�associated�with�the�acoustic�beam�of�the�animal�passing�across�the�axis�of�
the�hydrophone�array.�Provided�that�the�animal�maintains�the�same�source�level�and�directionality,�
the�click�with�highest�amplitude�has�the�highest�likelihood�of�being�on�axis.�In�this�study,�we�defined�
a�scan�as�any�sequence�of�10�or�more�clicks�with�inter�click�intervals�of�less�than�1�s.�For�each�scan�
we�then�classified�a�click�as�on�axis�and�used�it�for�further�analysis�if�it�fulfilled�the�following�criteria:��
(1)�The�click�had�the�highest�apparent�source�level�(pp)�in�a�scan.�
(2)�The�highest�back�calculated�source�level�was�recorded�on�one�of�the�two�central�hydrophones.��
(3)� The� apparent� source� level� of� the� click�was� higher� than� the� apparent� source� level� of� both� the�
preceding�and�following�click�from�the�same�hydrophone.�
Page 72
Page 72
Wahlberg�et�al.�Tursiops�clicks�January�2011��
(4)� The� source� position� was� estimated� to� within� 40m�where� localization� precision� was� good� (see�
above).�
207�
208�
209�
210�
211�
212�
213�
214�
215�
216�
217�
218�
219�
220�
221�
222�
223�
224�
225�
226�
227�
228�
229�
230�
231�
232�
233�
234�
235�
�
The�directionality�of�the�signals�was�estimated�from�the�measurements�of�apparent�source�level,�as�a�
function� of� the� calculated� off�axis� direction� to� each� hydrophone� for� each� click.� All� the� clicks�were�
aligned�relative�to�the�estimated�on�axis�direction�and�normalized�so�that� they�all�had�a�maximum�
level�of�0�dB�in�the�on�axis�direction.�The�peak�intensity�and�the�angle�was�adjusted�using�Lagrange�
interpolation�in�which�a�second�degree�polynomial�is�fitted�to�the�three�points�made�up�by�the�peak�
and� the� two� neighboring� estimates� (Menne� &� Hackbarth� 1986).� This� means� that� the� highest�
measured�value�was�not�necessarily� set� to�0�dB�and�0�degrees.� � Thereafter�all�off�axis� levels�were�
plotted�as�a�function�of�the�off�axis�angle�in�one�single�diagram.�The�transmission�beam�pattern�was�
fitted�to�the�beam�pattern�of�a�generic�on�axis�click�exiting�a�spherical�piston�of� the�diameter� that�
resulted� in� the� least� squared� error.� The� piston� model� was� used� to� estimate� the� directionality�
properties� of� the� measured� beam� pattern,� such� as� the� �3dB� and� �10� dB� beam� width� and� the�
directionality� index� using� the� methods� described� in� Madsen� &� Wahlberg� (2007).For� statistical�
analysis�we�used�Analysis�of�variances�(ANOVA,�Zar�1996).�
�
RESULTS�
A� total� of� 4202� clicks�were�detected.�Out� of� these,� 89� clicks�passed� the�on�axis� and� range� criteria�
given�above.�The�measured�source�parameters�are�given�in�Table�I�and�compared�to�previous�data�on�
trained� bottlenose� dolphins� echolocating� in� open� waters� during� psychophysical� tasks.� The�
measurements� were� made� on� clicks� from� 26� different� approaches.� Seven� well�known� individuals�
from� the� population� were� identified� and� represented� in� this� sample.� None� of� these� animals�
continuously�visited�the�recording�station�throughout�the�recording�sessions,�making�it�unlikely�that�
only�a�few�animals�contributed�to�the�bulk�of�the�dataset.�
�
The�source�properties�of�the�clicks�are�summarized�in�Table�I�together�with�measurements�to�studies�
of� trained� individuals� in� open� waters� and� small� tanks.� Examples� of� waveforms� of� Tursiops�
echolocation�clicks�are�shown�in�Fig.�2.�High�level�on�axis�clicks�have�a�stereotyped�shape�consisting�
Chapter III
Page 73
Page 73
Wahlberg�et�al.�Tursiops�clicks�January�2011��
of�very�few�oscillations�(Fig.�2b).�Low�level�clicks�are�either�similar�in�shape�to�the�high�level�clicks,�or�
they�have�a�much�longer�duration�and�more�messy�appearance�(Fig.�2a).�The�normalized�spectra�of�
all�measured�on�axis�clicks�are�shown� in�Fig.�3.�The�shape�of� the�spectra� is�very�stereotyped�being�
uni�modal�with�a�high�frequency�emphasis,�both�for�low�level�and�high�level�clicks.�
236�
237�
238�
239�
240�
241�
242�
243�
244�
245�
246�
247�
248�
249�
250�
251�
252�
253�
254�
255�
256�
257�
258�
259�
260�
261�
262�
263�
264�
�
The�clicks�differed�significantly�in�duration,�sound�level,�peak�frequency�and�bandwidth�in�on��and�off�
axis�directions�of�the�dolphin�(Fig.�4).�There�is�a�notch�present�in�spectra�of�off�axis�directions�that�is�
consistently�progressing�toward�lower�frequencies�for�larger�off�axis�angles�(marked�with�an�arrow).�
The�centroid�frequency�of�the�clicks�increased�as�a�function�of�the�click�source�level�(Fig.�5).�A�least�
square�regression�line�on�data�from�Pseudorca�(Au�et�al.�2005)�is� included�in�Fig.�5�for�comparison.�
The�least�square�regression�line�of�the�Tursops�data�has�a�significantly�(ANOVA,�p<0.05)�smaller�slope�
than�the�Pseudorca�regression�line.�
�
The� composite� transmission� beam� pattern� has� a� �3� and� �10� dB� beam� width� of� 8°� and� 10.5°,�
respectively,� and� a� directivity� index� of� 29� dB� (Table� I,� Fig.� 6).� This� is� significantly� narrower� than�
previous�measurements�on�trained�animals�echolocating�in�open�waters�(Table�I).�
�
DISCUSSION�
Bottlenose�dolphins�have�over�the�last�six�decades�been�used�as�the�most�common�laboratory�animal�
in� experimental� studies� of� toothed� whale� biosonar.� It� is� for� this� species� that� we� have� the� most�
detailed� measurements� of� the� directionality� pattern� and� characteristics� of� the� ultrasonic�
echolocation� signals,� as� well� as� the� most� profound� knowledge� of� their� biosonar� performance.�
However,� essentially� all� these� measurements� have� been� made� on� animals� in� captivity� while�
performing�echolocating�tasks�in�a�stationary�position.�This�study�is�one�of�the�first�where�biosonar�
source�parameters�recorded�from�free�ranging�Tursiops�are�presented.��
�
When� comparing� the� source� properties� measured� from� animals� in� the� field� with� previous�
measurements�from�captive�animals,�it�is�important�to�carefully�read�the�footnotes�attached�to�many�
of�the�measurements�in�Table�I.�The�signals�have�not�been�measured�using�exactly�the�same�metric�in�
Page 74
Page 74
Wahlberg�et�al.�Tursiops�clicks�January�2011��
the� various� studies.� Still,� there� are� some� clear� similarities� as� well� as� differences� between� the�
measurements� from� the� different� studies.� The� frequency� content� and� signal� shape� of� the� signals�
reported�from�the�field�are�very�similar�to�the�ones�reported�from�captive�animals�involved�in� long�
range� target� detection� in� open�water� conditions� (Table� I� and� Figs.� 2� and� 3).� This� indicates� that�
Tursiops� in� the� field� and� in� captivity�has� a� similar� palette�of� possibilities� for�modulating� the� signal�
shape,�duration�and�frequency�content�of�the�signals.�However,�there�are�very�noticeable�differences�
in� the�way�bottlenose�dolphins�make�use�of� their�echolocation� signals� in� the� field�as� compared� to�
captive�specimens.�The�source�level�and�frequency�content�of�the�signals�are�much�higher�than�for�
signals�recorded�from�animals�kept�in�small�tanks�(Table�I).�The�low�source�levels�reported�from�such�
studies�are�most� likely�because� there�are� inconveniently�high�echo� levels� from�the� tank�walls,�This�
forces�the�dolphin�to�reduce�its�output�level.�The�frequency�content�of�the�clicks�recorded�in�a�tank�
are�lowered�compared�to�free�ranging�animals,�probably�because�of�the�source�level�and�frequency�
emphasis�are�positively�correlated�(Fig.�5).�
265�
266�
267�
268�
269�
270�
271�
272�
273�
274�
275�
276�
277�
278�
279�
280�
281�
282�
283�
284�
285�
286�
287�
288�
289�
290�
291�
292�
293�
�
The�free�ranging�animals�emit�similar�source�levels�compared�to�the�levels�from�dolphins�performing�
long�range�target�detection�trials� in�an�open�water�environment�(Table� I).�There� is�however�a�9�dB�
difference� in� the�maximum� level�of� signals� recorded� in� the� two�situations,�with� the� trained�animal�
reaching� the�highest� source� levels.�The� reason� for� this�may�be� that�we�did�not� record� the�animals�
while�they�were�producing�their�highest�outputs�in�the�wild.�Only�measurements�of�clicks�within�40�
m�range�of�the�recording�equipment�were�analysed�in�the�field�recordings,�so�the�animals�may�not�
have�been�challenged�to�detect�small�objects�at�extreme�ranges�under�these�circumstances.�It�may�
also� be� that� our�methodology� and� on�axis� criteria� were� not� strict� enough� and� that� we� therefore�
never� recorded� them� exactly� on� the� acoustic� axis.� Another� explanation� may� be� that� the� species�
recorded� in� the� field� (T.�aduncus)� is� smaller� than� the�specimen�of�T.� truncatus� that�performed� the�
psychophysical� trials� (Connor� 2000).� Larger� individuals� can� be� assumed� to� produce� higher� source�
levels�than�smaller�ones�(Gillooly�&�Ophir�2010).�In�addition,�the�ambient�noise�level�was�at�least�10�
dB�higher�during�the�long�range�target�detection�trials�as�compared�to�the�field�measurements�(Au�
1993,�Jensen�et�al.�2009b).�It�is�known�that�a�trained�beluga�whale�(Delphinapterus�leucas)�that�was�
moved�to�a�facility�with�a�higher�ambient�noise�level�increased�its�source�level�click�output�(Au�et�al.�
Chapter III
Page 75
Page 75
Wahlberg�et�al.�Tursiops�clicks�January�2011��
1985).� Bottlenose� dolphins� would� probably� adjust� their� source� level� in� a� similar� manner� when�
encountering� higher� background� noise� levels.� Finally� the�maximum� ranges� that� the� animals� were�
trained� to� achieve� in� the� long� range� target� detection� trials�may� not� be� representative� of� the�way�
dolphins� normally� make� use� of� their� sonar� in� the� field.� It� may� well� be� that� the� training� and�
psychophysical� trial� situation� enforces� the� dolphin� to� produce� higher� sound� levels� than� it� would�
normally�produce�in�daily�life,�where�other�ecological�variables�such�as�reverberation�or�clutter�levels�
may�constrain�the�biosonar�detection�range.�
294�
295�
296�
297�
298�
299�
�300�
301�
302�
303�
304�
305�
306�
307�
308�
309�
310�
311�
312�
313�
314�
315�
316�
317�
318�
319�
320�
321�
322�
�
The� source� levels� of� free�ranging� Tursiops� clicks� reported� here� are� similar� to� the� ones� by� other�
delphinids�of�similar�size,�such�as�the�whitebeaked�dolphin�(Rasmussen�et�al.�2002)�and�the�Risso’s�
dolphin� (Madsen� et� al.� 2004).� It� seems� likely� that� free�ranging� dolphins� in� in� shallow�waters� have�
little�reason�to�echolocate�prey�items�at� longer�distances�than�some�50�m,�even�though�studies�on�
trained� animals� indicate� that� they� could�most� likely� detect� prey� items� of� up� to� almost� twice� this�
distance� (Au�et� al.� 2007).� At� longer� distances� the� animals�would� probably� be� limited� by� clutter� in�
shallow�waters.�Thus,�the�data�here�indicates�a�slightly�different�use�of�echolocation�signals�between�
trained� animals� in� a� captive� situation� and� free�ranging� specimens.� However,� because� both� the�
present�study�and�similar�earlier�studies�are�all�performed�with�a�relatively�short�range�between�the�
animal� and� the� recording� equipment,� it� is� not� possible� to� use� the� existing� data� to� rule� out� the�
possibility�that�dolphins�may�use�their�biosonar�in�a�different�way�in�other�situations�that�the�ones�in�
which�they�were�recorded.�The�range�at�which�Tursiops�and�other�toothed�whales�may�detect�fish,�
gill�nets�and�other�structures�in�the�water�has�been�of�keen�interest�in�many�biosonar�studies�(e.g.�Au�
et� al.� 2007,� Kastelein� et� al.� 2000,� Larsen� et� al.� 2007).� These� studies� are� usually� based� on� the�
performance�of�captive�animals�in�psychophysical�tasks�and�on�target�strength�measurements�of�the�
targets�of�interest.�There�are,�however,�both�acoustic�and�behavioural�reasons�why�toothed�whales�
may� not� use� their� maximum� biosonar� abilities� under� normal� circumstances,� and� that� possibility�
should�be�considered�when�modeling�detection�distances.�
�
The� large�difference�between�echolocation�signals�under�open�water�conditions�(in�the�wild�and� in�
open� pens)� and� those� observed� in� smaller� tanks� are�mainly�manifested� in� the� source� level� of� the�
Page 76
Page 76
Wahlberg�et�al.�Tursiops�clicks�January�2011��
signals.�Because�of�the�clear�tendency�of�lower�source�levels�leading�to�a�lower�centroid�frequency�of�
the�signals,�the�difference�in�signal�shape�between�the�animals�recorded�in�the�tank�and�in�the�field�
can�most�likely�be�explained�mainly�by�the�animals�being�forced�to�lower�the�sound�level�when�living�
in�a�small,�highly�reverberant�tank.�Judging�from�their�lack�of�identified�on�axis�criteria,�it�is�also�likely�
that�some�of�the�older�recordings�have�been�made�without�securing�that�the�animal�was�facing�the�
hydrophone�completely.�Off�axis�clicks�will,�as�observed� in�Figs.�2�and�3,�have�similar�properties�as�
low�amplitude� on�axis� clicks,� even� though� there� exist� special� techniques� to� tell� them� apart�
(Beedholm� &� Møhl� 2006):� A� click� that� has� been� transmitted� from� a� large� structure� or� through�
collimating� tissue� will� have� its� waveshape� and� spectrum� changed� in� a� predictable� manner� when�
observed� off� the� acoustic� axis.� This� is� observed� in� Fig.� 4,� where� the� spectra� of� off�axis� clicks� are�
plotted.�A�clearly�visible�notch�in�the�spectra�is�progressively�moving�towards�lower�frequencies,�the�
further�off�axis�the�signal�is�recorded.�Similar�notches�have�been�reported�from�presumable�on�axis�
clicks�of�this�and�other�species�(e.g.�Au�et�al.�1995,�Madsen�et�al.,�2004,�Houser�et�al.�2008).�In�this�
study,� no� such� clicks� were� found� among� those� classified� as� being� on�axis.� The� reason� for� this�
discrepancy� may� be� either� that� this� study� did� not� fully� sample� the� true� clicking� repertoire� of�
bottlenose� dolphins,� or� that� in� previous� recordings� some� off� axis� clicks� have� erroneously� been�
classified�as�having�been�recorded�on�the�acoustc�axis.��
323�
324�
325�
326�
327�
328�
329�
330�
331�
332�
333�
334�
335�
336�
337�
338�
339�
340�
341�
342�
343�
344�
345�
346�
347�
348�
349�
350�
351�
�
The�relationship�between�source�level�and�frequency�content�of�the�clicks�as�shown�in�Fig�5�has�been�
well� established� not� only� for�Tursiops� and�Pseudorca,� but� also� for� smaller� pelagic� dolphins� of� the�
genus� Stenella� (Au� et� al.� 2003),� and� the� largest� of� all� toothed�whales,� the� sperm�whale,�Physeter�
catodon� (Møhl� et� al.� 2000).� It� therefore� seems� to� be� common� trait� across� different� species� of�
toothed� whales.� The� simplest� explanation� for� this� pattern� seems� to� be� found� in� the� odontocete�
sound�production�system:�The�sound�production�system�of�toothed�whales�rely�on�air�being�forced�
through�a�set�of�lips,�the�so�called�phonic�lips,�in�the�nasal�passages�(Cranford�et�al.�2006).�When�the�
source� level�decreases,� less�air�pressure� is�built�up�at� the�monkey� lips,�and� they� therefore�may�be�
forced�to�oscillate�at�a�lower�frequency.� �The�causality�behind�the�events�leading�up�to�the�pattern�
observed�in�Fig.�5�is�not�known,�but�there�are�good�reasons�to�believe�that�that�the�animal�increases�
the�source�level�by�which�the�frequency�of�the�clicks�is�automatically�increased.�However,�one�may�
Chapter III
Page 77
Page 77
Wahlberg�et�al.�Tursiops�clicks�January�2011��
speculate� that� it� could� just�as�well�be� that� the�dolphin� requires�a�higher� frequency�content�of� the�
signals� rather� than� an� increased� source� level.� This� would� automatically� result� in� a� higher�
directionality�and�may�thereby�secondarily�lead�to�a�higher�source�level�of�the�signals.��
352�
353�
354�
355�
356�
357�
358�
359�
360�
361�
362�
363�
364�
365�
366�
367�
368�
369�
370�
371�
372�
373�
374�
375�
376�
377�
378�
379�
380�
�
Moore�&�Pawloski�(1988)�trained�bottlenose�dolphins�to�vary�the�amplitude�and�spectral�content�of�
their� echolocation� signals.� However,� during� psychophysical� target� detection� trials� it� seems� that�
dolphins�are�not�making�any�changes�to�the�temporal�and�spectral�shape�of�their�biosonar�signals�(Au�
et�al.�1993),�except�for�the�slight�changes�in�frequency�content�connected�to�variations�in�the�source�
level�of�the�signal�as�described�above�and�also�seen�in�the�field�recordings�(Fig.�5).�When�comparing�
with� previous� data� from� another� delphinid,� Pseudorca� crassidens� (Au� et� al.� 1995),� the� frequency�
content� of� the�Tursiops�clicks� recorded�here� seems� actually� to� be�much� less� dependent� of� source�
level,�as� indicated�by�the�significantly� lower�regressions�slope�in�Fig.�5.�Thus,�even�though�dolphins�
can�be�trained�to�modulate�their�source�parameters,�such�as�the�frequency�content�and�source�level,�
independently,� in�real�situation�this�does�not�seem�to�happen.�Emitting�a�rather�stereotyped�signal�
probably� help� the� dolphin� when� discriminating� targets,� as� any� changes� in� temporal� and� spectral�
features�of�the�returning�echo�can�be�attributed�to�the�acoustic�properties�of�the�target�rather�than�
to�variations�in�the�outgoing�click.�The�alternative�would�involve�that�the�dolphin�stores�memory�of�
the�template�for�each�outgoing�click�and�that�each�returning�echo�must�be�compared�to�the�template�
of�the�click�that�gave�rise�to�that�particular�echo.�
�
The�clicks�recorded�here�seem�noticeably�more�directional�compared�to�those�of�animals�in�captivity.�
Increased�directionality� from� recordings� in� the� field�has�also�been�noticed� for�bats� (Surlykke�et�al.��
2009).�There�may�be�an�adaptive�value�to�decrease�the�beam�width�in�many�biosonar�situations,�as�
the� sonar� performance� can� be� restricted� by� clutter� and� ambient� noise.� The�most� obvious�way� to�
regulate� the� directionality� by� the� signal� is� to� increase� the� frequency� of� the� signals.� This� seems,�
however,�not� to�be� the�case� from� the�observations�made�here,�as� the� signals� recorded� from� free�
ranging� individuals� were� not� significantly� different� in� frequency� content� when� compared� to� the�
signals� from� the� animals� in� captivity� from�whom� the� previous� directionality� data� were�measured�
(Table� I).� � Instead,� these� data� indicate� that� the� animal� is� using� other� means� to� increase� the�
Page 78
Page 78
Wahlberg�et�al.�Tursiops�clicks�January�2011��
directionality�of� the�signals.�Possibly� the�air� sacs�connected� to� the�nasal�passages�and�surrounding�
the� sound�production� organ� (Cranford�et� al.� 1996)�may� play� a� crucial� role� here:� by� regulating� the�
amount�of� air� in� these�air� sacs�and� the�conformation�of� the� soft� structures�of� the�melon� it� seems�
plausible� that� the� directionality� pattern� of� the� signals� may� change� even� for� the� same� centroid�
frequency�(Moore�et�al.�2008,�Au�et�al.�2010,�Miller�2010,�Madsen�et�al.,�2010).�
381�
382�
383�
384�
385�
386�
387�
388�
389�
390�
391�
392�
393�
394�
395�
396�
397�
398�
399�
400�
401�
402�
403�
404�
405�
406�
407�
408�
409�
�
There� is� a� striking� parallel� between� the� findings� reported� here� from� the� ‘white� rat’� of� dolphin�
echolocation�studies,�the�bottlenose�dolphin,�and�the�‘white�rat’�of�bat�echolocation�studies,�the�big�
brown� bat� (Surlykke� &� Moss� 2001).� The� fact� that� so� many� detailed� studies� have� been� made� on�
captive�specimen�whereas�data�is�almost�completely�lacking�from�animals�in�the�field�is�true�both�for�
the�dolphin�and�the�bat.�This�is�not�surprising�from�a�technical�and�logistic�point�of�view:�even�though�
there� have� recently� been� tremendous� advances� in� the� technical� development� of� devices� to� study�
animals� in� the� field,� it� is� still� often�difficult� to�obtain�high�quality�observations� in�many� situations.�
Keeping�animals� in� captivity� gives� a�much�more� controlled� situation� to�perform�carefully� designed�
experiments� to� understand� the� mechanisms� of� biosonar� operation.� However,� as� we� have�
documented�here,� field�studies�are�critical� to�understand� if� the�mechanisms�reported�from�captive�
specimen�are�also�valid�for�the�challenges�experienced�by�animals�in�the�field.�The�fact�that�we�find�
significantly� differences� in� the�biosonar� signals� of� both� the�brown�bat� and� the�bottlenose�dolphin�
strongly� implies� that� the� differences� in� echolocation� performance� between� animals� in� captive�
situations�and� in�the�field�may�be�significant�also� in�other�species�of�bats�and�toothed�whales.� It� is�
therefore� very� instructive� to� complement� studies� made� in� captivity� with� field� recordings� of�
conspecifics�before�too�elaborate�ecophysiological�and�evolutionary�conclusions�are�drawn�for�their�
biosonar�performances�in�the�wild.�
��
A�good�example�of�how�studies�made�in�captivity�and�in�the�field�can�work�in�parallel�in�this�manner�
is� found�from�studies�of�the�Risso’s�dolphin,�Grampus�griseus.�A�specimen�kept� in�a�captive�facility�
was�reported�to�have�a�hearing�range�of�up�to�about�70�kHz�(Nachtigall�et�al.�1995).�Later�on,�field�
recordings�showed�that�the�biosonar�signals�of�free�ranging�animals�had�peak�energies�well�beyond�
100�kHz�(Madsen�et�al.�2004).�Thus�there�seemed�to�be�a�mismatch�in�the�hearing�and�biosonar�data�
Chapter III
Page 79
Page 79
Wahlberg�et�al.�Tursiops�clicks�January�2011��
from�this�species.�A�recent�hearing�study�on�a�second�captive�specimen�showed�that�this�individual�
was�capable�of�hearing�well�above�100�kHz,�indicating�that�the�first�captive�individual�had�a�hearing�
deficiency�(Nachtigall�et�al.�2005).�We�believe�there�are�likely�many�such�examples�where�studies�on�
animals�in�the�field�and�in�captivity�could�work�hand�in�hand�to�give�us�a�better�understanding�of�the�
biosonar�performance�of�both�dolphins�and�bats.�
410�
411�
412�
413�
414�
415�
416�
417�
418�
419�
420�
421�
422�
423�
424�
425�
426�
427�
428�
429�
430�
431�
432�
433�
434�
435�
436�
437�
438�
�
The�source�parameters�estimated�from�wild�bottlenose�dolphins�are�not�only�relevant�for�assessing�
the�performance�of�the�biosonar�of�this�species�in�the�wild.�Field�measurements�are�also�crucial�for�
identifying� the� right� input� parameters� in� passive� acoustic� monitoring� and� detection.� There� is�
currently� a� rapid� development� in� such� methods� as� a� tool� for� studying� e.g.� the� effects� of� marine�
animals�on�human�induced�sounds�in�the�underwater�environment,�or�to�understand�the�habitat�use�
of�certain�species�when�establishing�mitigation�rules�such�as�marine�reserves,�fishery�regulations�et�
cetera.�Passive�acoustic�monitoring�has�also�become�a�popular�complement�to�visual�surveys�to�get�
data�on�population�abundance� in�many�species�of�marine�mammals.�To�give�accurate�and�relevant�
data,�they�naturally�rely�on�an�adequate�set�of�input�data�that�are�true�to�the�situation�in�the�wild.�It�
does�not�seem�enough�only�to�rely�on�animals�recorded�in�captivity�in�this�respect.�Field�recordings�
are� necessary� to� ascertain� that� the� input� data� is� realistic� in� the� circumstances�where� the� passive�
acoustic�monitoring�system�is�to�be�used.�Used�appropriately,�such�techniques�will�not�only�help�us�
to�better�understand�the�biology�of�bottlenose�dolphins�and�other�species,�but�also�help�to�protect�
and�conserve�them�in�their�natural�habitat.�
�
CONCLUSION�
We� have� shown� that� the� echolocation� signals� from� bottlenose� dolphins� are� similar� in� frequency�
content� to� trained� individuals� echolocating� out� into� open� waters.� However,� none� of� the� on�axis�
signals�measured�here�have�the�biomodal� frequency�pattern�reported� in� for�example�Houser�et�al.�
(1999).� The� source� levels� measured� in� the� field� do� not� reach� the� maximum� levels� from� animals�
involved�in�long�range�target�detection.�It�may�be�that�free�ranging�animals�are�never�forced�to�use�
the�maximum�level�clicks�that�trained�animals�can�be�pushed�to�use�when�solving�extremely�difficult�
echolocation�tasks.��At�the�same�time,�the�source�levels�reported�here�from�field�measurements�are�
Page 80
Page 80
Wahlberg�et�al.�Tursiops�clicks�January�2011��
considerably� higher� than� for� animals� recorded� in� tanks.� We� also� demonstrate� that� the� click�
directionality� of�wild� animals� is� higher� compared� to�measurements� from� trained� specimen.� These�
discrepancies� between� biosonar� signals� in� the� field� and� in� the� laboratory� may� be� important�
adaptations�to�the�animal’s�sonar�working�in�an�environment�restricted�by�clutter�and�ambient�noise.�
439�
440�
441�
442�
443�
444�
445�
446�
447�
448�
449�
450�
451�
452�
453�
454�
The�data�suggest�that�field�recordings�serve�as�a�crucial�complement�to�studies�made�in�captivity�to�
understand� the� biosonar� performance� in� this� species� and� probably� also� for� all� other� species� of�
toothed�whales.�
�
ACKNOWLEDGEMENTS�
Fieldwork� was� funded� by� the� Carlsberg� Foundation,� the� Oticon� Fundation,� the� World� Wildlife�
Foundation,� the� Siemens� Foundation� and� the�Danish�National� Research� Foundation.�We� thank�M.�
Hansen,�M.�Wilson,�H.�Schack,�H.�Smith�and�J.�Knust�for�assistance�in�the�field�as�well�as�Murdoch�
University�and�Bunbury�Dolphin�Discovery�for�logistical�support.�Research�in�Australia�was�conducted�
under�a�permit�to�L.B.�from�the�Department�of�Environment�and�Conservation�and�Ethics�Approval�
from�Murdoch�University.��
�
Chapter III
Page 81
Page 81
Wahlberg�et�al.�Tursiops�clicks�January�2011��
REFERENCES�455�
456�
457�
458�
459�
460�
461�
462�
463�
464�
465�
466�
467�
468�
469�
470�
471�
472�
473�
474�
475�
476�
477�
478�
479�
480�
481�
482�
483�
Au,�W.�W.�L.��(1993).�The�Sonar�of�Dolphins�(Springer�Verlag,�New�York).�
Au,�W.�W.�L.,�Floyd,�R.�W.,�Penner,�R.�H.,�Murchison,�A.�E.�(1974).�”Measurement�of�echolocation�
signals�of�the�Atlantic�bottlenose�dolphin,�Tursiops�truncatus�Mantagu,�in�open�waters,”�J.�Acoust.�
Soc.�Am.�56,�1280�1290.��
Au,�W.�W.�L.,�Carder,�D.�A.,�Penner,�R.�H.,�Scronce,�B.�L.�(1985).�“Demonstration�of�adaptation�in�
beluga�whale�echolocation�signals.”�J.�Acoust.�Soc.�Am.,�77(2),�726�730.�
Au,�W.�W.�L.,�Floyd,�R.�W.,�Haun,�J.�E.�(1978).�”Propagation�of�Atlantic�bottlenose�dolphin�
echolocation�signals,”�J.�Acoust.�Soc.�Am.�64(2),�411�422.�
Au,�W.�W.�L.,�Pawloski,�J.�L.,�Nachtigall,�P.�E.,�Blonz,�M.�(1995).�“Echolocation�transmission�beam�
pattern�of�a�false�killer�whale,�(Pseudorca�crassidens),”�J.�Acoust.�Soc.�Am.�98(1),�51�59.�
Au,�W.�W.�L.,�Herzing,�D.�L.�(2003).�“Echolocation�signals�of�wild�Atlantic�spotted�dolphin�(Stenella�
frontalis),“�J.�Acoust.�Soc.�Am.�113,�598�604.�
Au,�W.�W.�L.,�Benoit�Bird,�K.�J.,�Kastelein,�R.�A.�(2007).�“Modeling�the�detection�range�of�fish�by�
echolocating�bottlenose�dolphins�and�harbour�porpises,”�J.�Acoust.�Soc.�Am.�121�(6),�3954�3962.��
Au,�W.�W.�L.,�Branstetter,�B.�K.,�Benoit�Bird,�K.�J.,�Kastelein,�R.�A.�(2009).�“Acoustic�basis�for�fish�prey�
disctimination�by�echolocating�dolphins�and�porpoises,”�J.�Acoust.�Soc.�Am.,�126�(1),�460�467.���
Au,�W.�W.�L.,�Houser,�D.�S.,�Finneran,�J.�J.,�Lee,�W.�J.,�Talmadge,�L.�A.,�Moore,�P.�W.�(2010).�“The�
acoustic�field�on�the�forehead�of�echolocating�Atlantic�bottlenose�dolphins�(Tursiops�truncatus),”�
J.�Acoust.�Soc.�Am.,�128�(3),�1426�1434.��
Beedholm,�K.,�Møhl,�B.�(2006).�“Directionality�of�sperm�whale�sonar�clicks�and�its�relation�to�piston�
radiation�theory,”�JASA�Express�Letters�DOI:�10.1121/1.2161799,�EL14�EL19.�
Cranford,�T.�W.,�Amundin,�M.,�Norris,�K.�S.�(1996).�“Functional�morphology�and�homology�in�the�
odontocete�nasal�complex:�Implications�for�sound�generation,”�J.�Morph.�228,�223�285.�
Connor,�R.�C.,�Wells,�R.�S.,�Mann,�J.�and�Read,�A.�J.�(2000).�The�Bottlenose�Dolphin.�In�Cetacean�
Societies:�Field�studies�of�whales�and�dolphins,�eds.�J.�Mann�R.�C.�Connor�P.�Tyack�and�H.�
Whitehead.�Chicago:�Univ.�Chicago�Press.�
Evans,�W.�E.�(1973).�“Echolocation�by�marine�delphinids�and�one�species�and�fresh�water�dolphin,”�J.�
Acoust.�Soc.�Am�54,�191�199.�
Page 82
Page 82
Wahlberg�et�al.�Tursiops�clicks�January�2011��
Evans,�E.�W.,�Powell,�B.�A.�(1967).�“Discrimination�of�different�metallic�plates�by�an�echolocating�
delphinid,”�In:�R.�G.�Busnel,�ed.�Animal�Sonar�Systems,�Biology�and�Bionics.�Labortoire�de�
Physiologie�Acousticque,�Jouy�en�Josas,�France,�pp.�363�383.�
484�
485�
486�
487�
488�
489�
490�
491�
492�
493�
494�
495�
496�
497�
498�
499�
500�
501�
502�
503�
504�
505�
506�
507�
508�
509�
510�
511�
512�
Griffin,�D.�(1958).�Listening�in�the�Dark,”�Yale�University�Press,�New�Haven,�2nd�ed.�
Gillooly,�J.�F.,�Ophir,�A.�G.�(2010).�“The�energetic�basis�of�acoustic�communication,”�Proc.�Roy.�Soc.�B�
277,�1325�1331.
Houser,�D.�S.,�Helweg,�D.�A.,�Moore,�P.�W.�(1999).�“Classification�of�dolphin�echolocation�clicks�by�
energy�and�frequency�distributions,”�J.�Acoust.�Soc.�Am.,�106�(3),�1579�1585.���
Ibsen,�S.�D.,�Au,�W.�W.�L.,�Nachtigall,�P.�E.,�DeLong,�C.�M.,�Breese,�M.�(2010).�“Changes�in�consistency�
patterns�of�click�frequency�content�over�time�of�an�echolocating�Atlantic�bottlenose�dolphin,”�J.�
Acoust.�Soc.�Am.�127(6),�3821�3829.��
Jakobsen,�F.�A.�M.�Surlykke�(2010).�“Vespertilionit�bats�control�the�width�of�their�biosonar�sound�
beam�dyna�ically�during�prey�pursuit,”�Proc.�Nat.�Acad.�Sci.�107(31):�13930�13935.�
Jensen,�F.�H.,�Bejder,�L.�Wahlberg,�M.,�Madsen,�P.�T.�(2009a).�“Biosonar�adjustments�to�target�range�
of�echolocating�bottlenose�dolphins,”�J.�Exp.�Biol.�212,�1078�1086.�
Jensen,�F.�H.,�Bejder,�L.,�Wahlberg,�M.,�Aguilar�Soto,�N.,�Johnson,�M.,�Madsen,�P.�T.�(2009b).�“Vessel�
noise�effects�on�delphinid�communication,”�Mar.�Ecol.�Progr.�Ser.�395,�161�175.�
Johnson,�M.,�Madsen,�P.�T.,�Zimmer,�W.�M.�X.,�de�Soto,�N.�A.,�Tyack,�P.�L.�(2006).�“Foraging�Blainville’s�
beaked�whales�(Mesoplodon�densitorstris)�produce�distinct�click�types�matched�to�different�
phases�of�echolocation,”�J.�Exp.�Biol.�209,�5038�5050.�
Kastelein,�R.�A.,�Au,�W.�W.�L.,�Haan,�D.�De�(2000).�“Detection�distances�of�bottom�set�gillnets�by�
harbour�porpoises�(Phocoena�phocoena)�and�bottlenose�dolphins�(Tursiops�truncatus),”�Mar.�Env.�
Res.�49,�359�375.�
Kellogg,�W.�N.�(1958).�“Echo�ranging�in�the�porpoise,“�Science�128,�982�988.��
Kloepper,�L.�N.,�Nachtigall,�P.�E.,�Gisiner,�R.,�Breese,�M.�(2010).�“Decreased�echolocation�performance�
following�high��frequency�hearing�loss�in�the�false�killer�whale�(Pseudorca�crassidens),”�J.�Exp.�
Biol.�213,�3717�3722.�
Larsen,�F.�Eigaard,�O.�R.,�Tougaard,�J.�(2007).�“�Reduction�of�harbour�porpoise�(Phocoena�phocoena)�
bycatch�by�iron�oxide�gillnets,”�Fish.�Res�85,�270�278.�
Chapter III
Page 83
Page 83
Wahlberg�et�al.�Tursiops�clicks�January�2011��
513�
514�
515�
516�
517�
518�
519�
520�
521�
522�
523�
524�
525�
526�
527�
528�
529�
530�
531�
532�
533�
534�
535�
536�
537�
538�
539�
Madsen,�P.�T.,�Kerr,�I.,�Paune,�R.�(2004).�”Echolocation�clicks�of�two�free�ranging,�oceanic�delphinids�
with� different� food� preferences:� false� killer�whales� Pseudorca� crassidens� and�Risso’s� dolphins�
Grampus�griseus,”�J.�Exp.�Biol.�207,�1811�1823.�
Madsen,�P.�T.,�Wahlberg,�M.�(2007).�“Recording�and�quantification�of�ultrasonic�echolocation�clicks�
from�free�ranging�toothed�whales,”�Deep�Sea�Res.�54(8),�1421�1444.�
Madsen,�P.T.,�Wilson,�M.,�Johnson,�M.,�Hanlon,�R.T.,�Bocconcelli,�A.,�Aguilar�Soto,�N.,�Tyack,�P.L.�
(2007).�"Clicking�for�calamari:�toothed�whales�can�echolocate�squid�Loligo�pealeii�,"�Aq.�Biol.,�1,�
141�150.�
Madsen,�P.�T.,�Wisniewska,�D.,�Beedholm,�K.�(2010).�“Single�source�sound�production�and�dynamic�
beam�formation�in�echolocating�harbour�porpoises�(Phocoena�phocoena),”�J.�Exp.�Biol.,�213,�
3105�3110.�
Menne�D.,�Hackbarth,�H.�(1986).�“Accuracy�of�range�measurement�in�the�bat�Eptesicus�fuscus:�
Theoretical�aspects�and�computer�simulations,”�J.�Acoust.�Soc.�79,�386�397.�
Miller,�L.�A.�(2010).�“Prey�capture�by�harbour�porpoises�(Phocoena�phocoena):�A�comparison�
between�echolocators�in�the�field�and�in�captivity,”�J.�Mar.�Acous.�Soc.�Japan�37(3),�156�168
Møhl,� B.,� Wahlberg,� M.,� Madsen,� P.� T.,� Miller,� L.� A.,� Surlykke,� A.� (2000).� Sperm� whale� clicks:�
Directionality�and�source�level�revisited,”�J.�Acoust.�Soc.�Am.�107(1),�638�648.��
Moore,�P.W.B.,�Pawloski,�D.�A.�(1988).�“Investigations�on�the�control�of�echolocation�pulses�in�the�
dolphin�(Tursiops�truncatus),”� In�Animal�Biosonar� (PE�Nachtigall�and�PW�Moore,�Eds.),�Plenum�
Press,�New�York.�
Moore,� P.� W.� B.,� Dankiewicz,� L.� A.� Houser,� D.� S.� (2008).� Beamdith� control� and� angular� target�
detection�in�an�echolocating�bottlenose�dolphin�(Tursiops�truncatus).�J.�Acoust.�Soc.�Am.�124�(5),�
3324�3332.�
Muller,�M.�W.,�Allen�III,�J.�S.,�Au,�W.�W.�L.,�Nachtigall,�P.�E.�(2008).�”Time�frequency�analysis�and�
modeling�of�the�backscatter�of�categorization�dolphin�echolocation�clicks�for�target�
discrimination”,�J.�Acoust.�Soc.�Am.�124(1),�657�666.�
Murchinson,�A.�E.�(1980).�“Maximum�detection�range�and�range�resolution�in�echolocating�
bottlenose�porpoise�(Tursiops�truncatus),”�RG�Busnel�and�JF�Fish�eds,�Animal�Sonar�Systems,�
Plenum�Press,�New�York,�pp�43�70.�
Page 84
Page 84
Wahlberg�et�al.�Tursiops�clicks�January�2011��
Nachtigall,�P.�E.,�Au,�W.�W.�L.,�Pawloski,�J.,�Moore,�P.�(1995).�“Risso’s�dolphin�(Grampus�griseus)�
hearing�threshold�in�Kaneohe�Bay,�Hawaii.�In�Sensory�systems�of�aquatic�mammals�(ed.�R.�
Kastelein,�J.�Thomas,�P.�E.�Nacthigall),�pp�49�53.�Worden:�De�Spil�Publishers.�
540�
541�
542�
543�
544�
545�
546�
547�
548�
549�
550�
551�
552�
553�
554�
555�
556�
557�
558�
559�
560�
561�
562�
563�
564�
565�
566�
567�
568�
Nachtigall,�P.�E.,�Yuen,�M.�E.,�Mooney,�T.�A.,�Taylor,�K.�A.�(2005).�”Hearing�measurements�from�a�
stranded�infant�Risso’s�dolphin�(Grampus�griseus),”�J.�Exp.�Biol.�208,�4181�4188.�
Norris,�K.�S.,�Prescott,�J.�H.,�Asa�Dorian,�P.�V.,�Perkins,�P.��(1961).�“An�experimental�demonstration�of�
echolocation�behaviour�in�the�porpoirs,�Tursiops�truncatus�(Montagu),”�Biol.�Bull.�120,�163�176.�
Norris,�K.�(1969).�“The�echolocation�of�marine�mammals,”�in�The�biology�of�marine�mammals,�edited�
by�S.�Anderson�(Academic,�New�York,�1969),�pp�391�423.�
Penner,�R.�H.�(1988).�“Attention�and�detection�in�dolphin�echolocation,”�In:�Animal�Biosonar�(PE�
Nachtigall,�PWB��Moore,�Ed.s),�Plenum�Press,�New�York,�pp.�707�713.�
Rasmussen,�M.�H.,�Miller,�L.�A.,�Au,�W.�W.�L.�(2002).�“Source�level�of�clicks�from�free�ranging�white�
beaked�dolphins�(Lagenrhynchus�albirostris�Gray�1846)�recorded�in�Icelandic�waters,”�J.�Acoust.�
Soc.�Am.�111�(2)�1122�1125.����
Siemers,�B.�M.,�Schnitzler,�H�U�(2004).�“Echolocation�signals�reflect�niche�differentiation�in�five�
sympatric�congeneric�bat�species,”�Nature�429:�657�661.�
Simard,�P.,�Hibbard,�A.�L.,�McCallister,�K.�A.,�Frankel,�A.�S.,�Zeddies,�D.�G.,�Sisson,�G.�M.,�Gowans,�S.,�
Forys,�E.�A.,�Mann,�D.�A.�(2009).�“Depth�dependent�variation�of�the�echolocation�pulse�rate�of�
bottlenose�dolphins�(Tursiops�truncatus).”�J.�Acoust.�Soc.�Am.�127(1),�568�578.�
Supin,�A.�Ya.,�Popov,�V.�V.�Mass,�A.�M.�(2001).�The�sensory�physiology�of�aquatic�mammals�Springer�
Verlag,�New�York,�344�pp.�
Surlykke,�A.�M.,�Moss,�C.�F.��(2001).�“Echolocation�behaviour�of�big�brown�bats,�Eptesicus�fuscus,�in�
the�field�and�the�laboratory,”�J.�Acoust.�Soc.�Am.�108(5�Pt.�1),�2419�2429.�
Urick,�R.�J.�(1983).�Principles�of�underwater�sound.�Prentice�Hall.�
Verfuss,�U.,�Schnitzler,�H.�U.,�Miller,�L.�A.�(2009).�“Echolocation�by�two�foraging�harbour�porpoises�
(Phocoean�phocoena),“�J.�Exp.�Biol.�212,�823�834.��
Youvel,�Y.,�Au,�W.�W.�L.�(2010).�“How�can�dolphins�recognize�fish�according�to�their�echoes?��A�
statistical�analysis�of�fish�echoes,”�PLOS�One,�5(11),�1�10.�
Zar,�J.�H.�(1996).�Biostatistical�Analysis�Prentice�Hall,�Englewood�Cliffs,�NJ,�3rd�ed.,�pp.�327�330.�
Chapter III
Page 85
Page 85
Wahlberg�et�al.�Tursiops�clicks�January�2011��
Zaytseva,�K.�A.,�Akopian,�A.�I.,�Morozov,�V.P.�(1975).�”Noise�resistance�of�the�dolphin�auditory�
analyzer�as�a�function�of�noise�direction,”�Biofizika�20,�519�521�(in�Russian;�quoted�in�Au�et�al.�
1978).�
569�
570�
571�
572�
573�
�
�
Page 86
Page 86
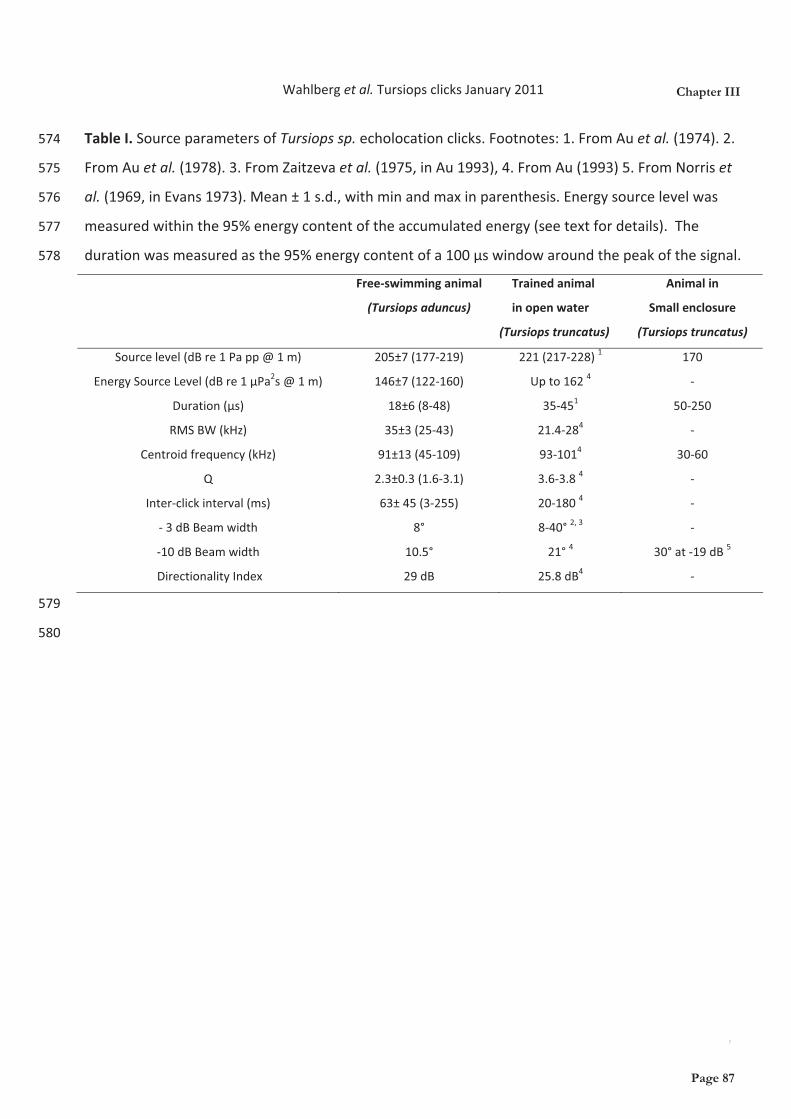
Wahlberg�et�al.�Tursiops�clicks�January�2011��
Table�I.�Source�parameters�of�Tursiops�sp.�echolocation�clicks.�Footnotes:�1.�From�Au�et�al.�(1974).�2.�
From�Au�et�al.�(1978).�3.�From�Zaitzeva�et�al.�(1975,�in�Au�1993),�4.�From�Au�(1993)�5.�From�Norris�et�
al.�(1969,�in�Evans�1973).�Mean�±�1�s.d.,�with�min�and�max�in�parenthesis.�Energy�source�level�was�
measured�within�the�95%�energy�content�of�the�accumulated�energy�(see�text�for�details).��The�
duration�was�measured�as�the�95%�energy�content�of�a�100�μs�window�around�the�peak�of�the�signal.�
574�
575�
576�
577�
578�
� Free�swimming�animal�
(Tursiops�aduncus)�
Trained�animal�
in�open�water�
(Tursiops�truncatus)�
Animal�in��
Small�enclosure��
(Tursiops�truncatus)�
Source�level�(dB�re�1�Pa�pp�@�1�m)� 205±7�(177�219)� 221�(217�228)�1� 170�
Energy�Source�Level�(dB�re�1�μPa2s�@�1�m)�� 146±7�(122�160)�� Up�to�162�4�� ��
Duration�(μs)� 18±6�(8�48)� 35�451� 50�250�
RMS�BW�(kHz)� 35±3�(25�43)� 21.4�284� ��
Centroid�frequency�(kHz)� 91±13�(45�109)� 93�1014� 30�60�
Q� 2.3±0.3�(1.6�3.1)� 3.6�3.8�4� ��
Inter�click�interval�(ms)� 63±�45�(3�255)� 20�180�4� ��
��3�dB�Beam�width� 8°� 8�40°�2,�3� ��
�10�dB�Beam�width� 10.5°� 21°�4� 30°�at��19�dB�5�
�Directionality�Index� 29�dB� 25.8�dB4� ��
�579�
580� �
Chapter III
Page 87
Page 87
Wahlberg�et�al.�Tursiops�clicks�January�2011��
Figure�legends�581�
582�
583�
584�
585�
586�
587�
588�
589�
590�
591�
592�
593�
594�
595�
596�
597�
598�
599�
600�
601�
602�
603�
604�
605�
606�
607�
608�
609�
Figure�1.�Recording�setup.�From:�Jensen�et�al.�2009a,�reprinted�with�permission�from�J.�Exp.�Biol.�
�
Figure�2.�Echolocation�click�signal�waveforms�(sampling�rate�800�kHz,�linearly�interpolated�10�times)�
and�spectra�(Hann�window,�FFT�size�256�points,�sampling�rate�800�kHz,�linearly�interpolated�10�
times)�from�bottlenose�dolphins,�Tursiops�aduncus,�from�a.�low�source�level�(177�192�dB�re�1�μPa�pp;�
N=5)�clicks,�and�b.�high�source�level�(�212+219�dB�re�1�μPa�pp;�N=16)�clicks.�
�
Figure�3.�Individual�spectra�and�averaged�spectrum�of�all�on�axis�echolocation�clicks�from�bottlenose�
dolphins,�Tursiops�aduncus.�Sampling�rate�800�kHz,�FFT�size�128�points,�Hann�window,�spectrum�
interpolated�10�times.�
�
Figure�4.��Spectra�of�echolocation�clicks�recorded�from�bottlenose�dolphins,�Tursiops�aduncus.�The�
spectra�are�shown�for�various�degrees�of�off�axis�recordings�for�two�clicks�recorded�on�the�four�
channel�array.�Sampling�rate�800�kHz,�FFT�size�128�points,�Hann�window,�spectrum�interpolated�10�
times.�The�off�axis�angle�in�the�vertical�plane,�calculated�from�a�Lagrange�interpolation�of�each�click�
measurement�(see�text�for�details),�is�indicated�for�each�spectrum.�The�y�axis�is�calculated�from�the�
normalised�amplitude�spectrum,�to�which�the�peak�to/peak�broadband�source�level�has�been�added.�
�
Figure�5.�The�centroid�frequency�of�on�axis�clicks�as�a�function�of�the�apparent�source�level�(see�text�
for�details)�of�clicks�from�Tursiops�aduncus.�The�linear�regression�line�intersects�with�the�y�axis�at�(0,��
166)�and�has�a�slope�of�1.26.�The�linear�regression�line�of�data�from�a�false�killer�whale�(Pseudorca�
crassidens)�from�Au�et�al.�(1995)�is�given�as�comparison�(intersection�with�y�axis�at�(0,��456)�and�slope�
2.55).���
�
Figure�6.�Composite�directionality�plot�of�signals�from�Tursiops�aduncus.�The�off�axis�angle�for�each�
click�has�been�adjusted�by�finding�the�maximum�of�an�Lagrange�interpolated�quadratic�curve�through�
the�measurements�(see�text�for�detail).�Solid�line�is�a�piston�model�using�an�on�axis�click�from�a�free�
ranging�bottlenose�dolphin,�assuming�a�piston�radius�of�12.7�cm�(see�Au�1993�for�details).�
Page 88
Page 88
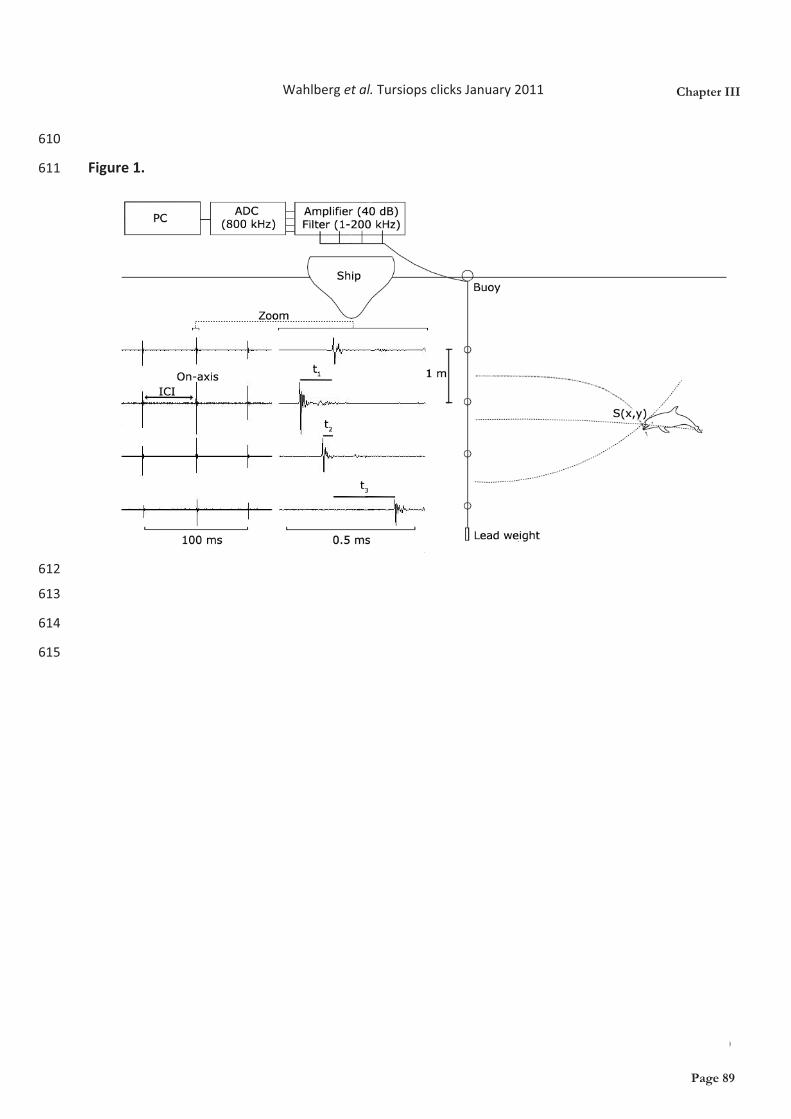
Wahlberg�et�al.�Tursiops�clicks�January�2011��
�610�
611� �Figure�1.��
�612�
613�
614�
615�
�
�
�
Chapter III
Page 89
Page 89
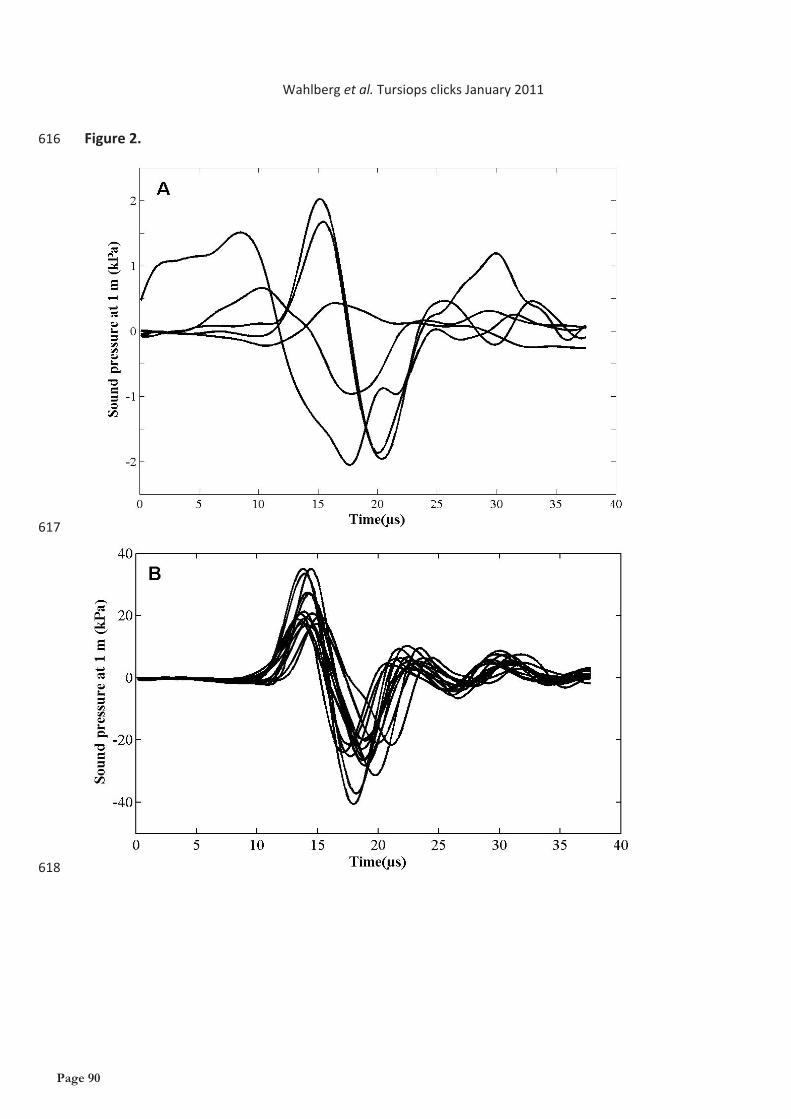
Wahlberg�et�al.�Tursiops�clicks�January�2011��
Figure�2.��616�
�617�
�618�
Page 90
Page 90
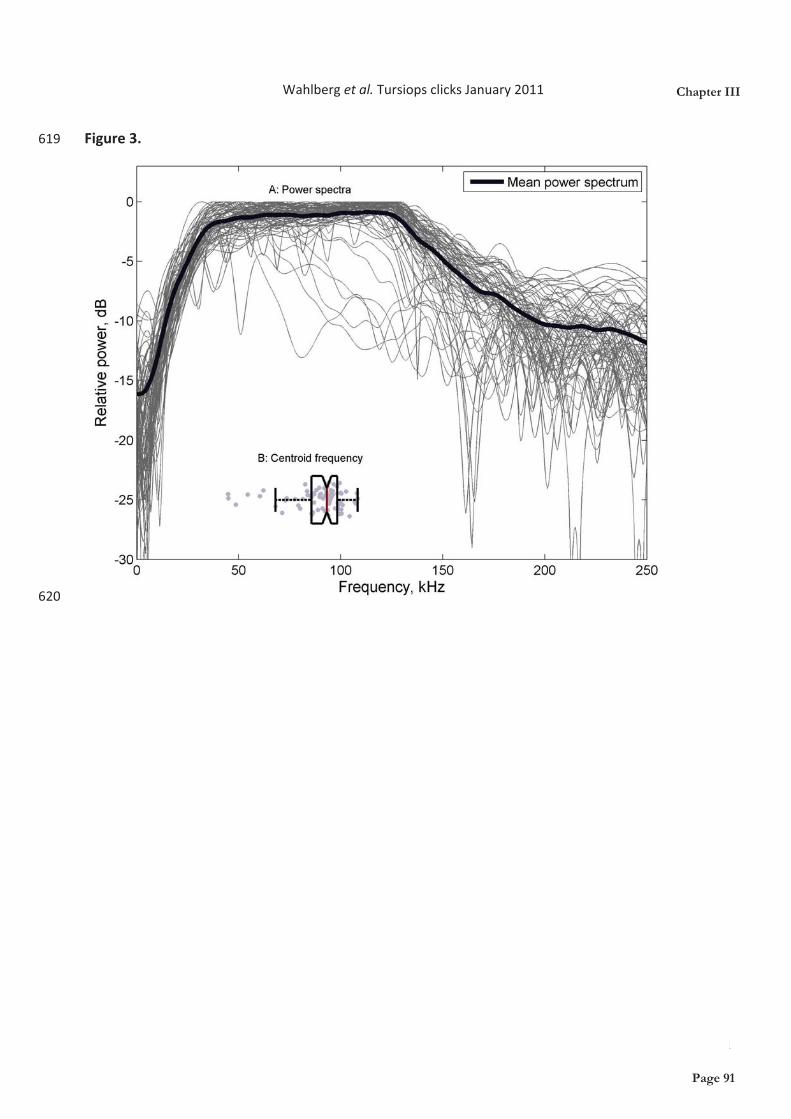
Wahlberg�et�al.�Tursiops�clicks�January�2011��
Figure�3.��619�
�620�
Chapter III
Page 91
Page 91
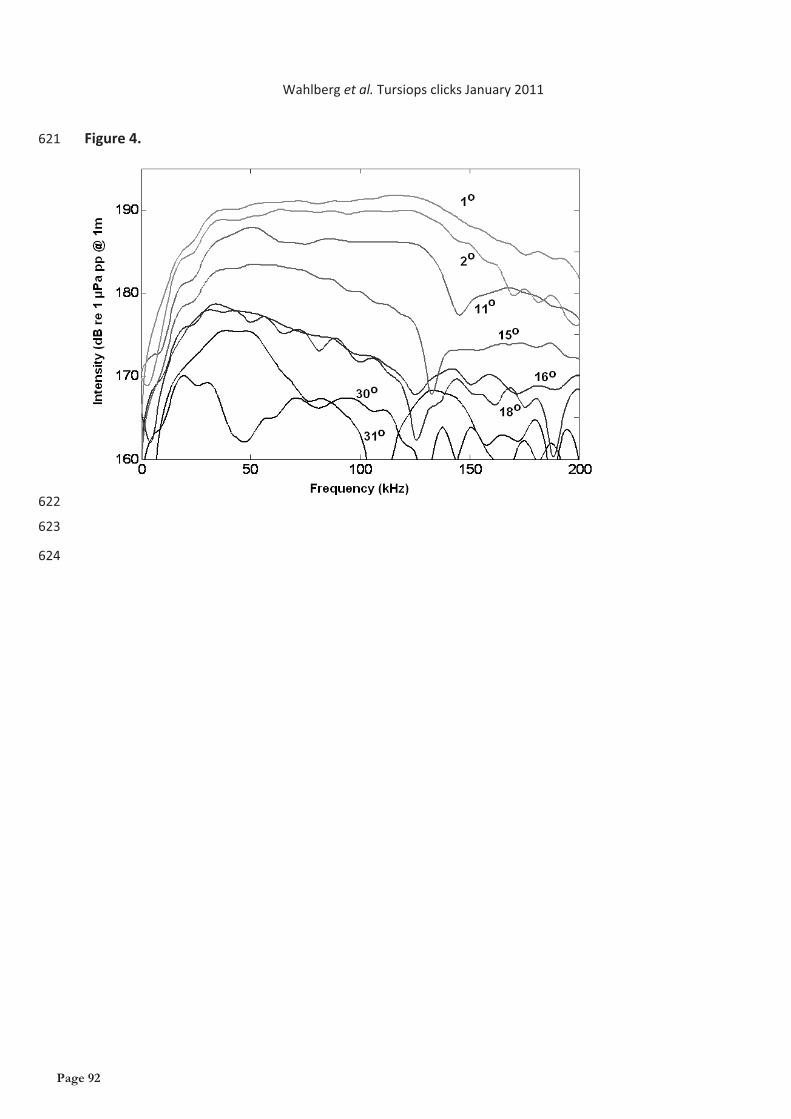
Wahlberg�et�al.�Tursiops�clicks�January�2011��
Figure�4.�621�
�622�
623�
624�
��
�
Page 92
Page 92
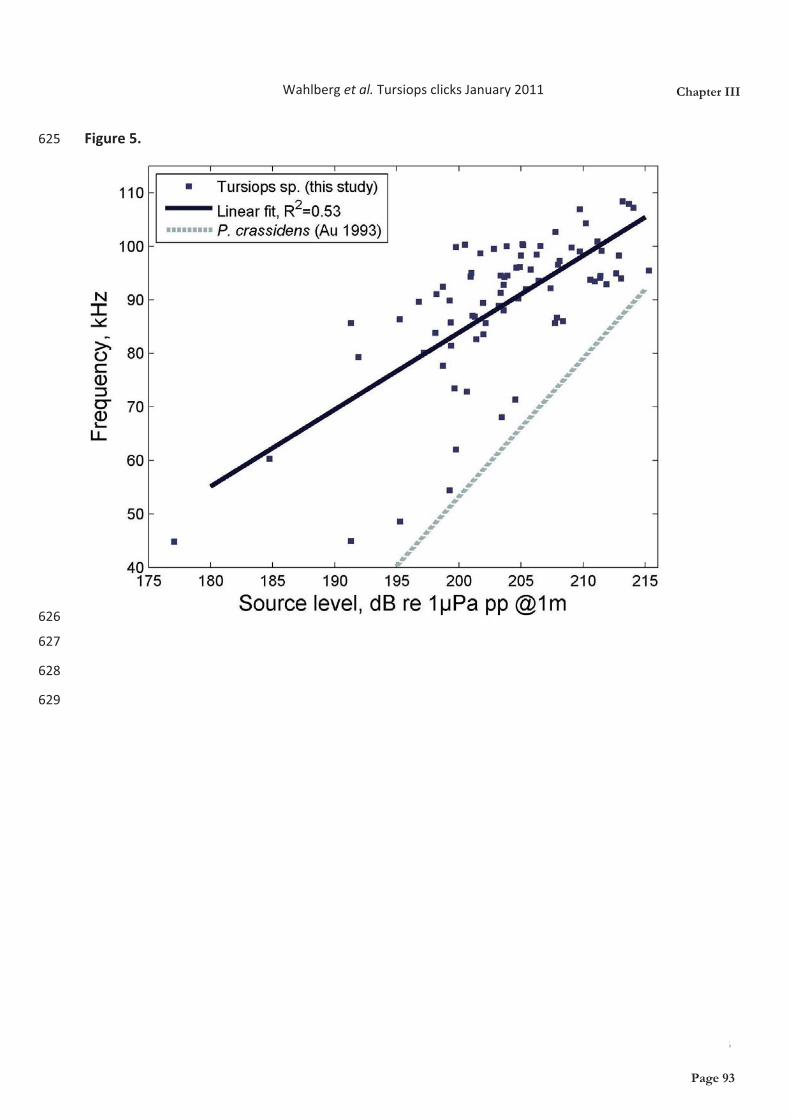
Wahlberg�et�al.�Tursiops�clicks�January�2011��
Figure�5.�625�
�626�
627�
628�
629�
�
�
�
Chapter III
Page 93
Page 93
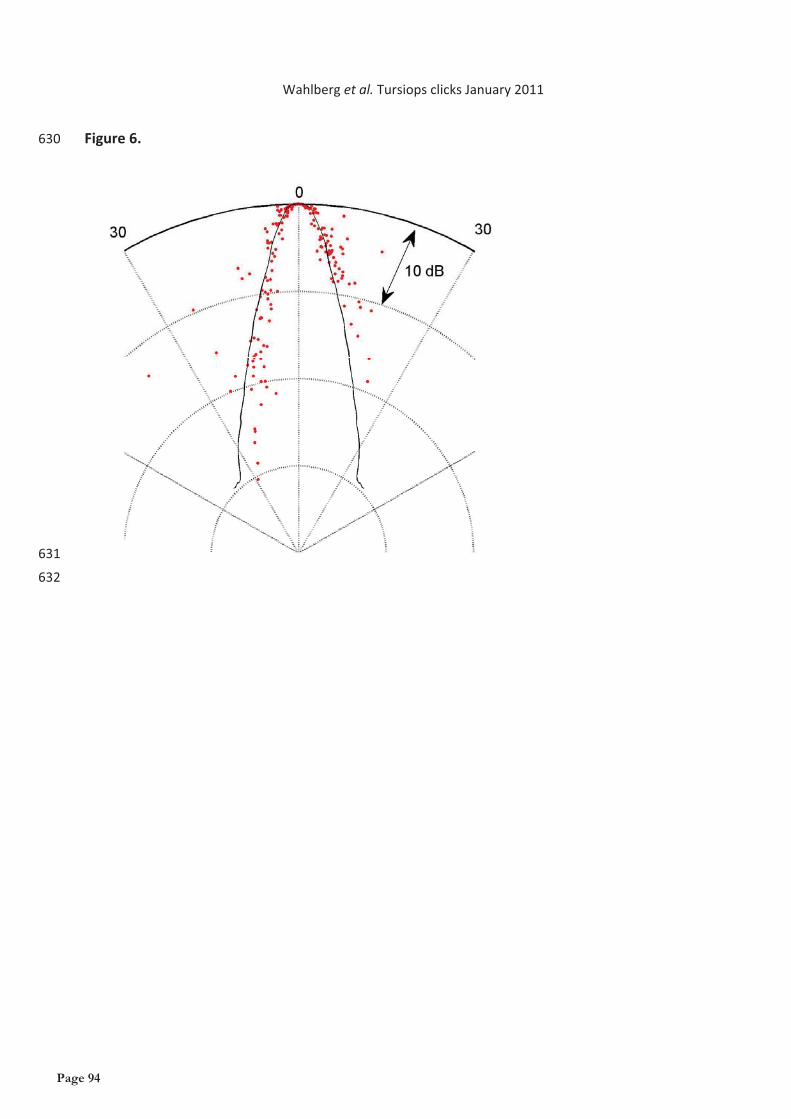
Wahlberg�et�al.�Tursiops�clicks�January�2011��
630� Figure�6.��
�631�
632� �
Page 94
Page 94
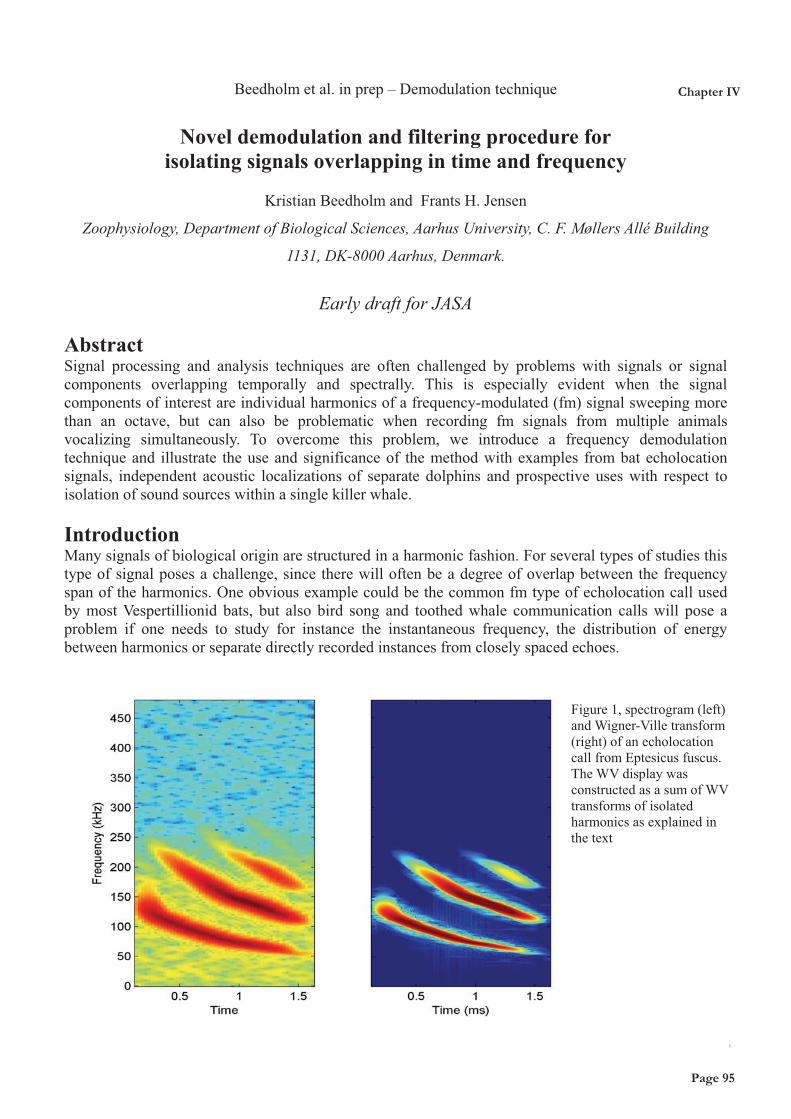
Beedholm et al. in prep – Demodulation technique
Novel demodulation and filtering procedure for
isolating signals overlapping in time and frequency
Kristian Beedholm and Frants H. Jensen
Zoophysiology, Department of Biological Sciences, Aarhus University, C. F. Møllers Allé Building
1131, DK-8000 Aarhus, Denmark.
Early draft for JASA
Abstract Signal processing and analysis techniques are often challenged by problems with signals or signal components overlapping temporally and spectrally. This is especially evident when the signal components of interest are individual harmonics of a frequency-modulated (fm) signal sweeping more than an octave, but can also be problematic when recording fm signals from multiple animals vocalizing simultaneously. To overcome this problem, we introduce a frequency demodulation technique and illustrate the use and significance of the method with examples from bat echolocation signals, independent acoustic localizations of separate dolphins and prospective uses with respect to isolation of sound sources within a single killer whale. Introduction Many signals of biological origin are structured in a harmonic fashion. For several types of studies this type of signal poses a challenge, since there will often be a degree of overlap between the frequency span of the harmonics. One obvious example could be the common fm type of echolocation call used by most Vespertillionid bats, but also bird song and toothed whale communication calls will pose a problem if one needs to study for instance the instantaneous frequency, the distribution of energy between harmonics or separate directly recorded instances from closely spaced echoes.
Figure 1, spectrogram (left) and Wigner-Ville transform (right) of an echolocation call from Eptesicus fuscus. The WV display was constructed as a sum of WV transforms of isolated harmonics as explained in the text
Chapter IV
Page 95
Page 95
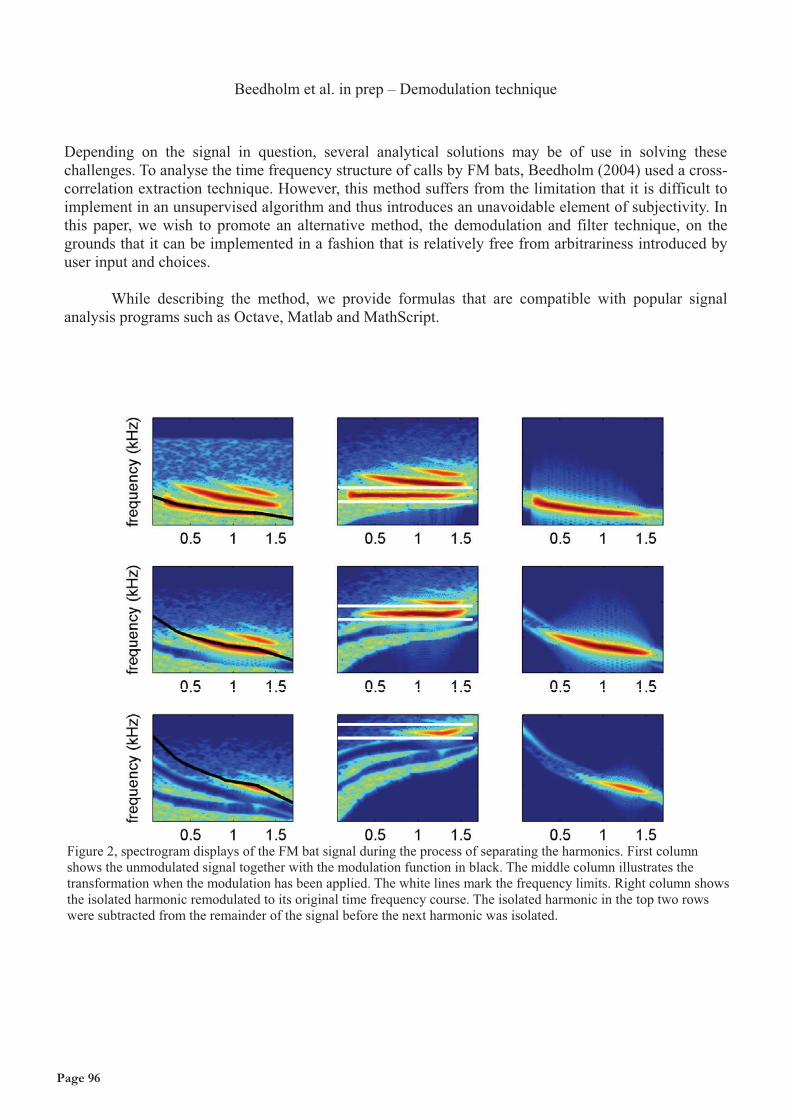
Beedholm et al. in prep – Demodulation technique
Depending on the signal in question, several analytical solutions may be of use in solving these challenges. To analyse the time frequency structure of calls by FM bats, Beedholm (2004) used a cross-correlation extraction technique. However, this method suffers from the limitation that it is difficult to implement in an unsupervised algorithm and thus introduces an unavoidable element of subjectivity. In this paper, we wish to promote an alternative method, the demodulation and filter technique, on the grounds that it can be implemented in a fashion that is relatively free from arbitrariness introduced by user input and choices. While describing the method, we provide formulas that are compatible with popular signal analysis programs such as Octave, Matlab and MathScript.
Figure 2, spectrogram displays of the FM bat signal during the process of separating the harmonics. First column shows the unmodulated signal together with the modulation function in black. The middle column illustrates the transformation when the modulation has been applied. The white lines mark the frequency limits. Right column shows the isolated harmonic remodulated to its original time frequency course. The isolated harmonic in the top two rows were subtracted from the remainder of the signal before the next harmonic was isolated.
Page 96
Page 96
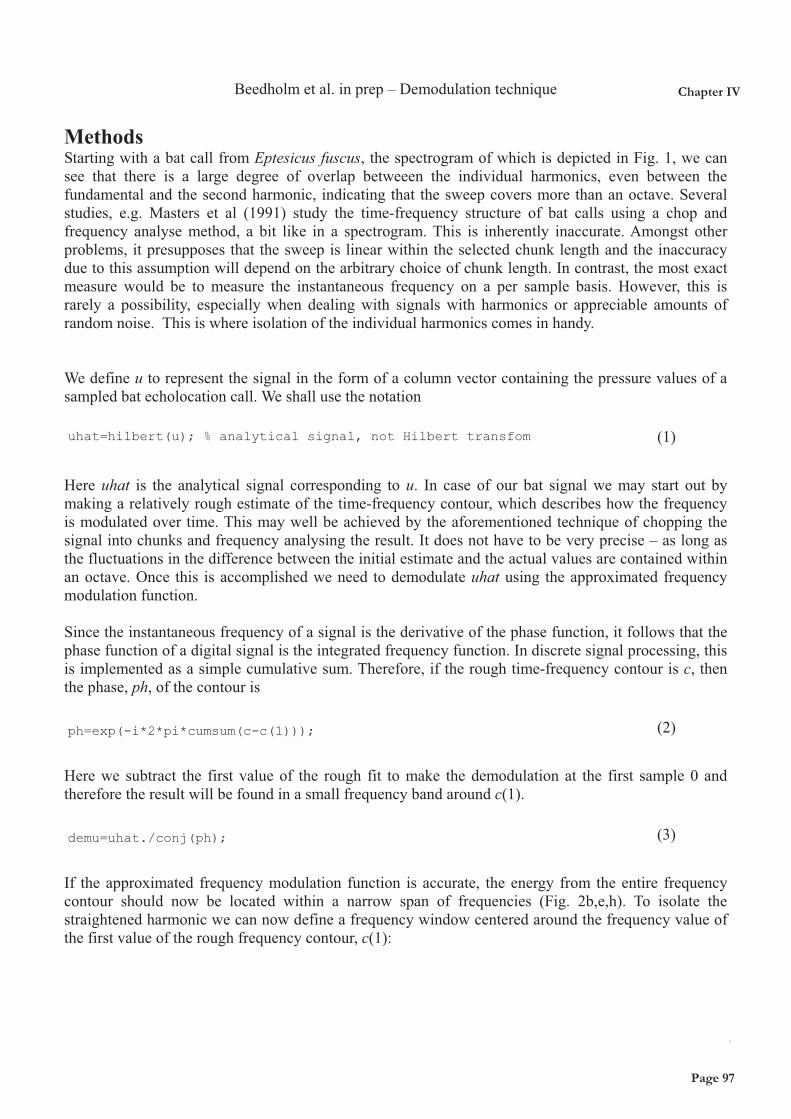
Beedholm et al. in prep – Demodulation technique
Methods Starting with a bat call from Eptesicus fuscus, the spectrogram of which is depicted in Fig. 1, we can see that there is a large degree of overlap betweeen the individual harmonics, even between the fundamental and the second harmonic, indicating that the sweep covers more than an octave. Several studies, e.g. Masters et al (1991) study the time-frequency structure of bat calls using a chop and frequency analyse method, a bit like in a spectrogram. This is inherently inaccurate. Amongst other problems, it presupposes that the sweep is linear within the selected chunk length and the inaccuracy due to this assumption will depend on the arbitrary choice of chunk length. In contrast, the most exact measure would be to measure the instantaneous frequency on a per sample basis. However, this is rarely a possibility, especially when dealing with signals with harmonics or appreciable amounts of random noise. This is where isolation of the individual harmonics comes in handy. We define u to represent the signal in the form of a column vector containing the pressure values of a sampled bat echolocation call. We shall use the notation uhat=hilbert(u); % analytical signal, not Hilbert transfom (1)
Here uhat is the analytical signal corresponding to u. In case of our bat signal we may start out by making a relatively rough estimate of the time-frequency contour, which describes how the frequency is modulated over time. This may well be achieved by the aforementioned technique of chopping the signal into chunks and frequency analysing the result. It does not have to be very precise – as long as the fluctuations in the difference between the initial estimate and the actual values are contained within an octave. Once this is accomplished we need to demodulate uhat using the approximated frequency modulation function. Since the instantaneous frequency of a signal is the derivative of the phase function, it follows that the phase function of a digital signal is the integrated frequency function. In discrete signal processing, this is implemented as a simple cumulative sum. Therefore, if the rough time-frequency contour is c, then the phase, ph, of the contour is ph=exp(-i*2*pi*cumsum(c-c(1))); (2)
Here we subtract the first value of the rough fit to make the demodulation at the first sample 0 and therefore the result will be found in a small frequency band around c(1). demu=uhat./conj(ph); (3)
If the approximated frequency modulation function is accurate, the energy from the entire frequency contour should now be located within a narrow span of frequencies (Fig. 2b,e,h). To isolate the straightened harmonic we can now define a frequency window centered around the frequency value of the first value of the rough frequency contour, c(1):
Chapter IV
Page 97
Page 97
Beedholm et al. in prep – Demodulation technique
df=0.02; %this figure depends on the quality of the initial fit win=u*0; %zero-initialize win to same size as u flim=round([(c(1)-df) (c(1)+df)]*length(u)); %frequency span win(lims(1):lims(2))=1; %hard limit
(4)
The signal is then isolated by band-limiting or filtering the signal, for instance using simply a window applied to the Fourier transform and then remodulated by re-applying the correct phase. Here, we store the first harmonic in the first row of a matrix: h(:,j)=ifft(fft(demu).*win).*conj(ph); (5)
To isolate more harmonics, we can then continue with a loop variable, j, describing the higher harmonics using the same initial track, c, but multiplied by the harmonic number in question. Some of the above steps are illustrated in Fig. 2. For this to work best, it may be a good idea to gradually subtract the isolated harmonics from the original signal before isolating the next harmonic, as demonstrated in Fig. 2d and 2g. This may serve to remove noise in some cases, but more importantly it offers a check on the quality of the operation. The hard frequency limit used in (4) is not very elegant since it is the solution that results in the maximum amount of ”time splatter”. But if the harmonic is affected by the cutting it becomes very obvious in the spectrogram and so it does provide us with a better quality control than a more gently tapering window. In Fig 2 the signal was upsampled before the harmonic isolation began. This is often advisable since it reduces the risk of the modulation process pushing the signal components over the DC or the sampling rate border (analytical signals do not fold around the Nyquist frequency). One intriguing possibility that opens up once the harmonics are in separate vectors, is displaying multiharmonic signals in a Wigner-Ville (WV) transform as it was done in Fig. 1b. The WV gives the best possible joint time-frequency resolution (Cohen, 1989) but also inherently results in intermodulation products if multiple components are present in either time or frequency. As was the case with the instantaneous frequency representation, the criterion for when WV is a good choice is that the group delay plot coincides more or less with the instantaneous frequency plot. This excludes most bat signals, but the individual harmonics may be WV transformed and the absolute values of the transforms can then be added together to form a display like Fig. 1b. Naturally, for this display to be informative it must be justified that the signal is indeed harmonically structured. This is fulfilled for bat calls.
Page 98
Page 98
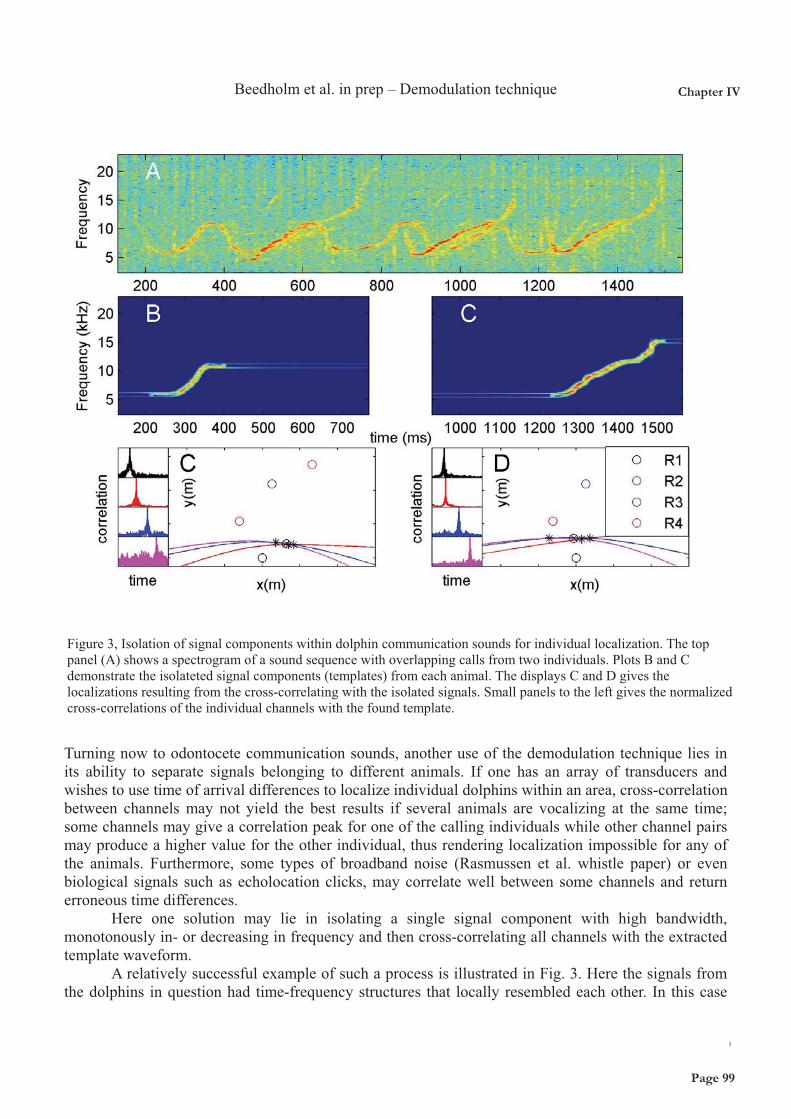
Beedholm et al. in prep – Demodulation technique
Figure 3, Isolation of signal components within dolphin communication sounds for individual localization. The top panel (A) shows a spectrogram of a sound sequence with overlapping calls from two individuals. Plots B and C demonstrate the isolateted signal components (templates) from each animal. The displays C and D gives the localizations resulting from the cross-correlating with the isolated signals. Small panels to the left gives the normalized cross-correlations of the individual channels with the found template.
Turning now to odontocete communication sounds, another use of the demodulation technique lies in its ability to separate signals belonging to different animals. If one has an array of transducers and wishes to use time of arrival differences to localize individual dolphins within an area, cross-correlation between channels may not yield the best results if several animals are vocalizing at the same time; some channels may give a correlation peak for one of the calling individuals while other channel pairs may produce a higher value for the other individual, thus rendering localization impossible for any of the animals. Furthermore, some types of broadband noise (Rasmussen et al. whistle paper) or even biological signals such as echolocation clicks, may correlate well between some channels and return erroneous time differences. Here one solution may lie in isolating a single signal component with high bandwidth, monotonously in- or decreasing in frequency and then cross-correlating all channels with the extracted template waveform. A relatively successful example of such a process is illustrated in Fig. 3. Here the signals from the dolphins in question had time-frequency structures that locally resembled each other. In this case
Chapter IV
Page 99
Page 99
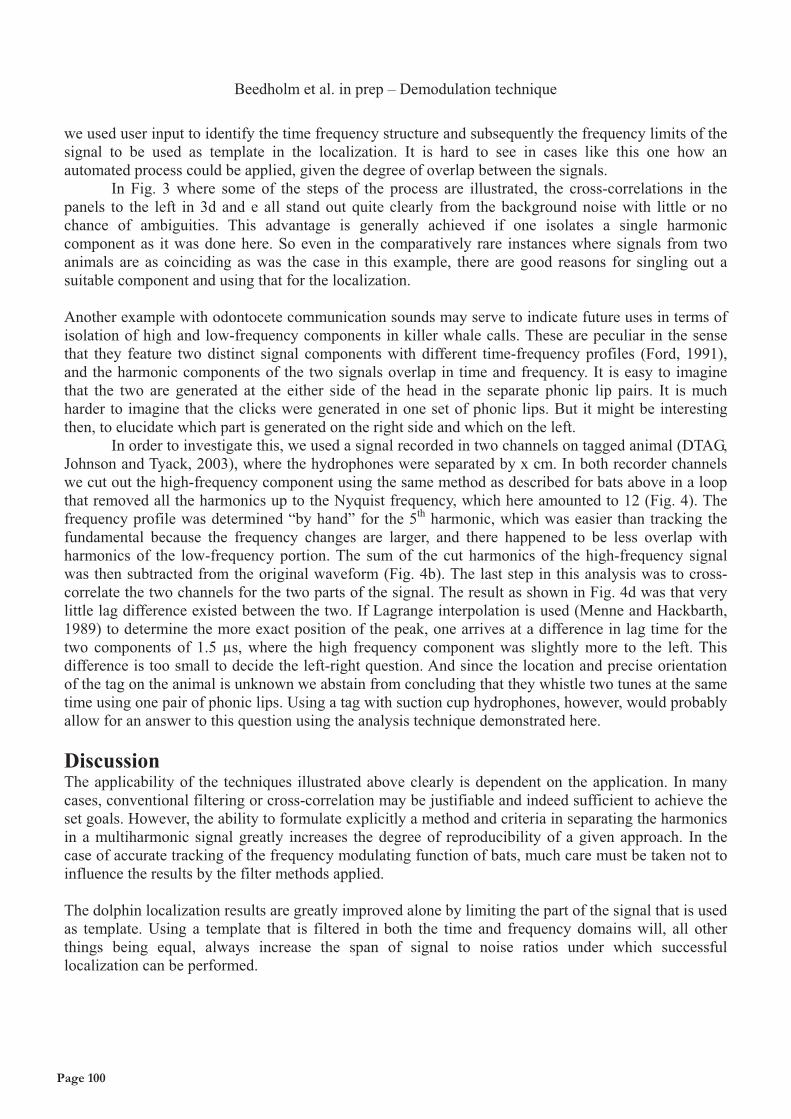
Beedholm et al. in prep – Demodulation technique
we used user input to identify the time frequency structure and subsequently the frequency limits of the signal to be used as template in the localization. It is hard to see in cases like this one how an automated process could be applied, given the degree of overlap between the signals. In Fig. 3 where some of the steps of the process are illustrated, the cross-correlations in the panels to the left in 3d and e all stand out quite clearly from the background noise with little or no chance of ambiguities. This advantage is generally achieved if one isolates a single harmonic component as it was done here. So even in the comparatively rare instances where signals from two animals are as coinciding as was the case in this example, there are good reasons for singling out a suitable component and using that for the localization. Another example with odontocete communication sounds may serve to indicate future uses in terms of isolation of high and low-frequency components in killer whale calls. These are peculiar in the sense that they feature two distinct signal components with different time-frequency profiles (Ford, 1991), and the harmonic components of the two signals overlap in time and frequency. It is easy to imagine that the two are generated at the either side of the head in the separate phonic lip pairs. It is much harder to imagine that the clicks were generated in one set of phonic lips. But it might be interesting then, to elucidate which part is generated on the right side and which on the left. In order to investigate this, we used a signal recorded in two channels on tagged animal (DTAG, Johnson and Tyack, 2003), where the hydrophones were separated by x cm. In both recorder channels we cut out the high-frequency component using the same method as described for bats above in a loop that removed all the harmonics up to the Nyquist frequency, which here amounted to 12 (Fig. 4). The frequency profile was determined “by hand” for the 5th harmonic, which was easier than tracking the fundamental because the frequency changes are larger, and there happened to be less overlap with harmonics of the low-frequency portion. The sum of the cut harmonics of the high-frequency signal was then subtracted from the original waveform (Fig. 4b). The last step in this analysis was to cross-correlate the two channels for the two parts of the signal. The result as shown in Fig. 4d was that very little lag difference existed between the two. If Lagrange interpolation is used (Menne and Hackbarth, 1989) to determine the more exact position of the peak, one arrives at a difference in lag time for the two components of 1.5 μs, where the high frequency component was slightly more to the left. This difference is too small to decide the left-right question. And since the location and precise orientation of the tag on the animal is unknown we abstain from concluding that they whistle two tunes at the same time using one pair of phonic lips. Using a tag with suction cup hydrophones, however, would probably allow for an answer to this question using the analysis technique demonstrated here. Discussion The applicability of the techniques illustrated above clearly is dependent on the application. In many cases, conventional filtering or cross-correlation may be justifiable and indeed sufficient to achieve the set goals. However, the ability to formulate explicitly a method and criteria in separating the harmonics in a multiharmonic signal greatly increases the degree of reproducibility of a given approach. In the case of accurate tracking of the frequency modulating function of bats, much care must be taken not to influence the results by the filter methods applied. The dolphin localization results are greatly improved alone by limiting the part of the signal that is used as template. Using a template that is filtered in both the time and frequency domains will, all other things being equal, always increase the span of signal to noise ratios under which successful localization can be performed.
Page 100
Page 100
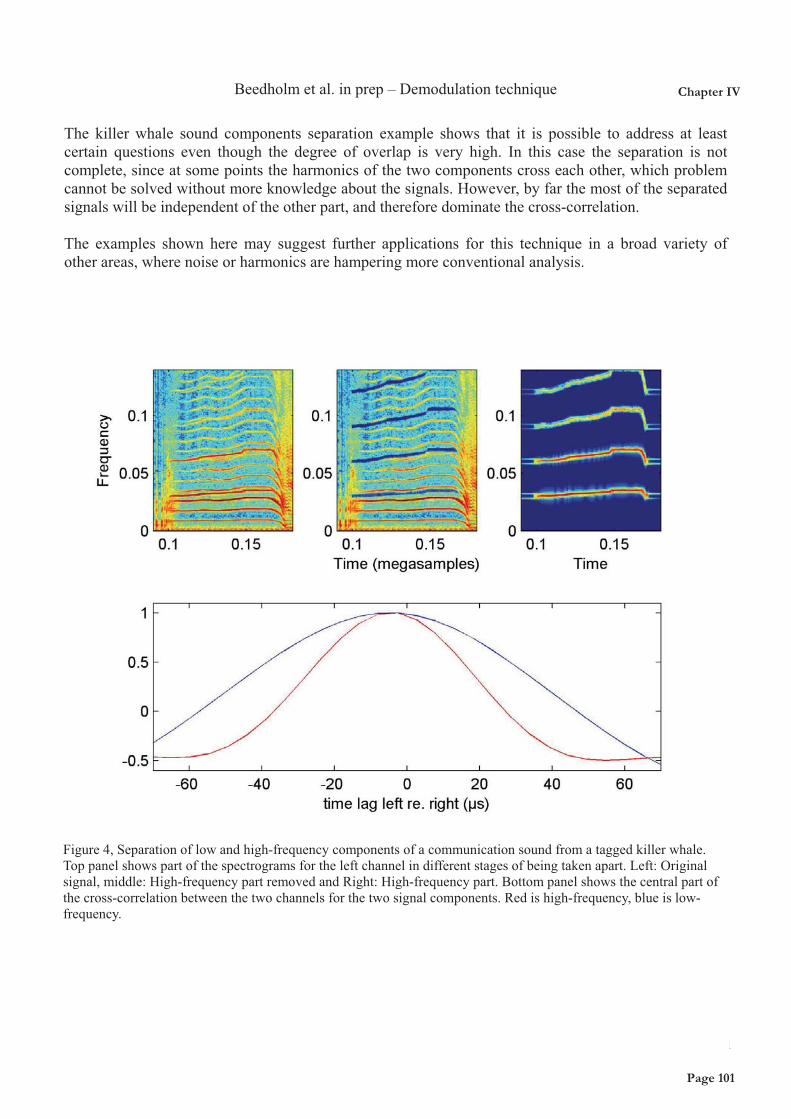
Beedholm et al. in prep – Demodulation technique
The killer whale sound components separation example shows that it is possible to address at least certain questions even though the degree of overlap is very high. In this case the separation is not complete, since at some points the harmonics of the two components cross each other, which problem cannot be solved without more knowledge about the signals. However, by far the most of the separated signals will be independent of the other part, and therefore dominate the cross-correlation. The examples shown here may suggest further applications for this technique in a broad variety of other areas, where noise or harmonics are hampering more conventional analysis.
Figure 4, Separation of low and high-frequency components of a communication sound from a tagged killer whale. Top panel shows part of the spectrograms for the left channel in different stages of being taken apart. Left: Original signal, middle: High-frequency part removed and Right: High-frequency part. Bottom panel shows the central part of the cross-correlation between the two channels for the two signal components. Red is high-frequency, blue is low-frequency.
Chapter IV
Page 101
Page 101
Beedholm et al. in prep – Demodulation technique
References Beedholm, K. 2004 “Aspects of signals and signal processing in echolocation by FM-bats for target range,” See http://w210.ub.uni-tuebingen.de/dbt/volltexte/2004/1150/pdf/Beedholm.pdf. Cohen, L, 1989 “Time-frequency distributions—a review,” Proc. IEEE, 77:941–981 Ford, John K B. 1991. ”Vocal traditions among resident killer whales (Orcinus orca) in coastal waters of British Columbia.” Canadian Journal of Zoology 69:1454-1483. Johnson, M. P. and Tyack, P. L. 2003. ”A digital acoustic recording tag for measuring the response of wild marine mammals to sound.” IEEE J. Ocean. Eng. 28, 3-12. Masters, W. M., Jacobs, S. C., and Simmons, J. A. 1991 "The structure of echolocation sounds used by the big brown bat Eptesicus fuscus: Some consequences for echo processing," J. Acoust. Soc. Am. 89, 1402–1413. Menne, D. and Hackbarth, H., 1986 ”Accuracy of distance measurements in the bat Eptesicus fuscus: Theoretical aspects and computer simulations.” J Acoust Soc Am 79:386-397 Rasmussen , M.H, Lammers, M, Beedholm K and Miller LA (2006) Source levels and harmonic content of whistles in white-beaked dolphins (Lagenorhynchus albirostris) J. Acoust. Soc. Am. 120, 510 (2006)
Page 102
Page 102
Madsen�et�al.�In�prep���Dolphins�don’t�whistle�
1
2
3
4
5
6
7
8
9
10
11
�
�
�
�
�
�
Dolphins�don’t�whistle:��
Vocal�tract�resonances�affect�formants�of�dolphin�tonal�calls,��
but�not�the�fundamental�contours�
�
�
P.T.�Madsen1*�and�F.H.�Jensen1��12
13
14
15
16
17
18
19
20
21
�
1)�Zoophysiology,�Department�of�Biological�Sciences,�Aarhus�University,�Build.�1131,�
CF�Mollers�Alle,�8000�Aarhus�C,�Denmark�
�
�
�
This� chapter� is�a�drafted�manuscript�based�on�a� joint�project�with�Drs.� S.�Ridgway�and�D.�Carder�who�
collected� the� data.� PTM� and� FHJ� performed� the� analysis� and� drafted� this� version� that� will� be� further�
revised�and�submitted�for�Biology�Letters�after�final�approval�of�Dr.�S.�Ridgway�and�D.�Carder.�
1
Chapter V
Page 103
Page 103
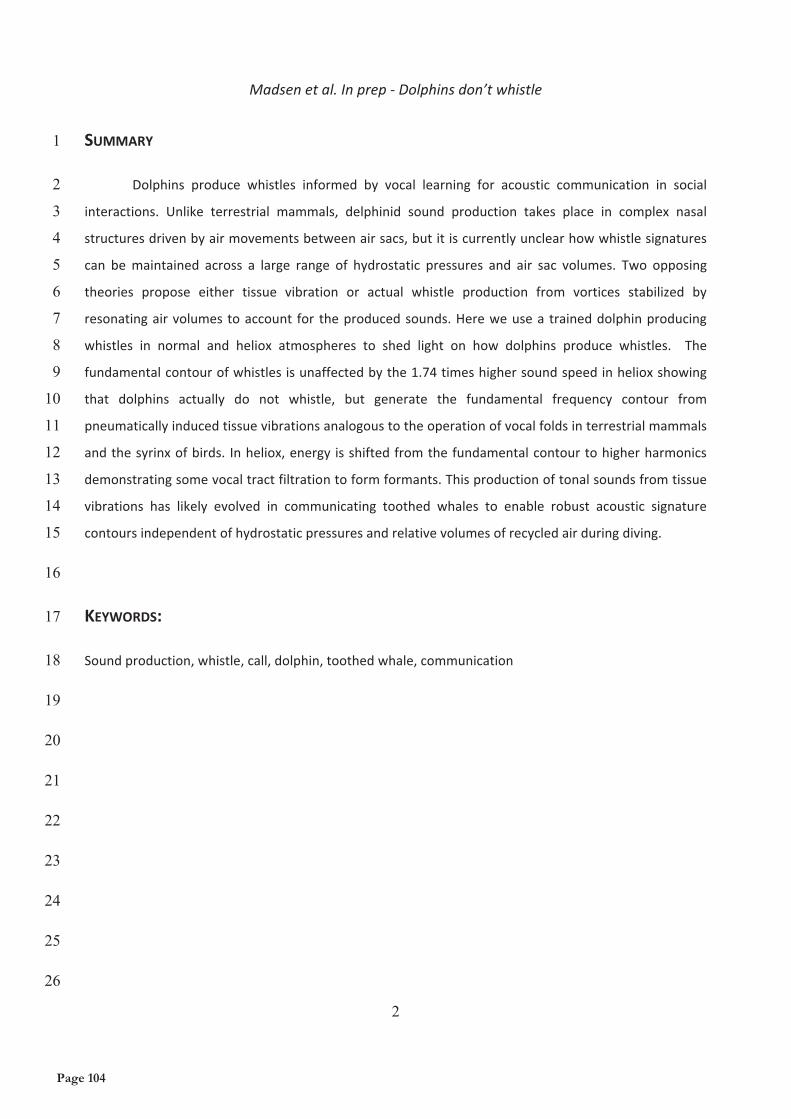
Madsen�et�al.�In�prep���Dolphins�don’t�whistle�
SUMMARY�1
2
3
4
5
6
7
8
9
10
11
12
13
14
15
16
17
18
19
20
21
22
23
24
25
26
Dolphins� produce� whistles� informed� by� vocal� learning� for� acoustic� communication� in� social�
interactions.� Unlike� terrestrial� mammals,� delphinid� sound� production� takes� place� in� complex� nasal�
structures�driven�by�air�movements�between�air�sacs,�but�it�is�currently�unclear�how�whistle�signatures�
can� be�maintained� across� a� large� range� of� hydrostatic� pressures� and� air� sac� volumes.� Two� opposing�
theories� propose� either� tissue� vibration� or� actual� whistle� production� from� vortices� stabilized� by�
resonating�air�volumes�to�account� for� the�produced�sounds.�Here�we�use�a� trained�dolphin�producing�
whistles� in� normal� and� heliox� atmospheres� to� shed� light� on� how� dolphins� produce� whistles.� � The�
fundamental�contour�of�whistles�is�unaffected�by�the�1.74�times�higher�sound�speed�in�heliox�showing�
that� dolphins� actually� do� not� whistle,� but� generate� the� fundamental� frequency� contour� from�
pneumatically�induced�tissue�vibrations�analogous�to�the�operation�of�vocal�folds�in�terrestrial�mammals�
and�the�syrinx�of�birds.� In�heliox,�energy� is�shifted�from�the�fundamental�contour�to�higher�harmonics�
demonstrating�some�vocal�tract�filtration�to�form�formants.�This�production�of�tonal�sounds�from�tissue�
vibrations� has� likely� evolved� in� communicating� toothed� whales� to� enable� robust� acoustic� signature�
contours�independent�of�hydrostatic�pressures�and�relative�volumes�of�recycled�air�during�diving.�
�
KEYWORDS:�
Sound�production,�whistle,�call,�dolphin,�toothed�whale,�communication�
�
�
�
�
�
�
�
�
2
Page 104
Page 104
Madsen�et�al.�In�prep���Dolphins�don’t�whistle�
INTRODUCTION�1
2
3
4
5
6
7
8
9
10
11
12
13
14
15
16
17
18
19
20
21
22
23
24
25
26
27
28
29
30
31
Toothed�whales�produce�a�rich�acoustic�repertoire�consisting�of�clicks�for�echolocation�and�whistles�for�
communication.�Most� of� these�whistles� are� used� in� complex� social� interactions� that� are�mediated� by�
vocal� learning� so� that� a� dolphin� can� imitate� frequency�modulated� whistles� produced� by� conspecifics�
(Tyack� 1986).� Unlikely� terrestrial� mammals,� dolphins� produce� these� sounds� in� their� nasal� foreheads�
(Ridgway�and�Carder,�1988)�but�little�is�known�about�how�they�generate�these�sounds.�Most�terrestrial�
vertebrates�vocalize�by�using�an�air�driven�sound�generator�in�the�larynx�that�is�coupled�to�a�vocal�tract�
that�may�filter�the�produced�sounds.�While�sounds�are�produced�by�two�different�organs�(the�syrinx�in�
birds� and� the� vocal� cords� in� mammals)� both� groups� are� capable� of� producing� long� tonal� calls� for�
communication.�Vocalizations�in�terrestrial�vertebrates�are�produced�using�air�both�as�a�propellant�and�
as� a� propagation�medium� in� two� different� ways� where� sounds� are� either� produced� aerodynamically�
when�vortices�from�a�fast�air�flow�over�an�edge�create�fluctuations�in�the�air�pressure�that�are�stabilized�
in�accordance�with�the�resonance�frequency�of�associated�airspaces,�or�sounds�are�produced�by�air�flow�
that� causes� membranes� in� the� form� of� syringeal� membranes� or� vocal� folds� to� vibrate,� setting� the�
fundamental� frequency� (Goller� and� Larsen,� 1999).� Thus,� the� primary� frequency� modulation� of� vocal�
outputs�can�either�happen�by�changing�the�resonance�frequency�of�associated�air�spaces�in�the�case�of�
aerodynamic� sound� production� or� by� changing� the� stiffness� of� and� airflow� over� vibrating� vocal�
membranes.�So�while�many�birds�and�mammals�do�produce�long�pure�tone�like�signals�that�are�coined�
“whistles”,� whistles� are� strictly� defined� as� tonal� signals� produced� aerodynamically� (such� as� a� human�
whistle)� by� airflow� through� any� orifice� or� past� an� edge� that� creates� vortices� resulting� in� pressure�
fluctuations�that�may�be�stabilized�by�the�resonance�frequency�of�an�associated�cavity� � (Wilson�et�al.,�
1971).����
While� it� is�established�that�dolphin�whistles� like�clicks�are�produced� in�the�nasal�complex,�and�
that�they�require�much�more�air�and�higher�air�pressure�in�the�nasal�cavity�compared�to�clicks�(Ridgway�
and� Carder,� 1988),� only� a� few� theories� have� been� advanced� to� explain� how� toothed� whale� nasal�
structures�may�produce�tonal�signals.�Lilly�(1962)�argued�that�dolphins�produce�true�whistles�generated�
aerodynamically� and� that� the� frequency�of�whistles� is� changed�by� changing� the� volumes� of� the�nasal�
sacs.�Mackay� and� Liaw� (1981)� proposed� that� whistling� involves� “tissue� vibrations� [that]� would� excite�
resonances,�rather�than�use�of�an�evolved�air�vibration�mechanism”�akin�to�the�situation�for�mammalian�
vocal�cords�and�the�bird�syrinx.��However,�they�conclude�the�paper�by�saying�“The�whistle�is�produced�by�
some�edge��or�hole�tone,�vortex�shedding�mechanism�related�to�how�humans�whistle”�that�in�turn�seems�
3
Chapter V
Page 105
Page 105
Madsen�et�al.�In�prep���Dolphins�don’t�whistle�
1
2
3
4
5
6
7
8
9
10
11
12
13
14
15
16
17
18
19
20
21
22
23
24
25
26
27
28
29
30
to� contradict� their� previous� statement.� So� is� a� whistle� a� true� whistle� in� the� sense� that� it� is�
aerodynamically�produced?�Or�is�the�delphinid�whistle�sound�source�completely�or�partially�decoupled�
from� associated� air� volumes� by� which� the� resonance� frequency� of� these� will� have� only� some� or� no�
impact�on�the�frequency�of�the�produced�tonal�call�that�in�this�case�will�not�follow�the�strict�definition�of�
a�whistle� (Wilson�et�al.,�1971)?�To�address�these�questions,�we�conducted�a�heliox�experiment�with�a�
bottlenose�dolphin�trained�to�whistle�while�breathing�heliox�from�a�cone�over� its�blowhole�to�test�the�
following�hypotheses:�i)�If�the�dolphin�whistle�is�a�true�whistle�and�hence�produced�aerodynamically,�the�
fundamental�contour�will�be�shifted�upwards�by�a�factor�1.74�(Nowicki�1987).�ii)�if�the�dolphin�whistle�is�
produced� like� the� tonal� calls�of�most�birds�and� terrestrial�mammals,� the� fundamental� contour� should�
remain� the� same,� whereas� there� will� be� more� energy� in� the� harmonics� as� the� higher� resonance�
frequency�of�the�vocal�tract�will�deemphasize�the�fundamental�and�emphasize�higher�harmonics.� iii)� If�
there�is�no�or�very�little�effect�of�air�resonances�(as�found�for�some�frogs�(Rand�and�Dudley�1993))�both�
the�fundamental�and�the�harmonics�should�be�the�same�when�breathing�heliox�compared�to�air.�
MATERIALS�AND�METHODS�
An� resting� adult� bottlenose�dolphin� (Tursiops� truncatus)�was� given�a�heliox�mixture� (80%�Helium�and�
20%� oxygen)� through� a� cone� fit� snugly� over� the� blowhole.� The� animal� was� administered� the� heliox�
mixture� through� a� U.� S.� Navy� Fenzy� breather.� � Periodically,� the� breather� cone�was� removed� and� the�
animal�breathed�air�for�several�minutes.�Sound�recordings�were�performed�using�an�LC10�hydrophone�in�
a�custom�made�suction�cup�on�the�melon�of�the�animal.�The�hydrophone�output�was�amplified�by�40�dB�
with� a� Celesco� 1364� amplifier� and� recorded� at� 38� cm/sec� on� an� Ampex� FR� 1300� instrumentation�
recorder,�where�the�voice�track�was�used�to�note�when�heliox�was�on�or�off.�The�frequency�response�of�
the�recording�chain�was�flat�(±2�dB)�between�3.2�and�75�kHz.��
The�data�were�digitized�using�a�PC�based�12�bit�ADC�sampling�at�500�kHz,�providing�stereo�wave�
files� of� the� hydrophone� recording� and� the� voice� track� that� subsequently� was� analyzed� using� custom�
scripts�written�in�Matlab�7.5�(Mathworks).�All�whistles�were�identified�by�auditing�the�wave�files�while�
displayed� in� a� spectrogram� format,� and� it� was� noted� based� on� the� voice� track� if� the� animal� was�
breathing�air�or�heliox.�The�sound�speed�of� the�heliox�mixture� is� some�590�m/sec�and� that�of�air�340�
m/sec� by� which� the� resonance� frequency� of� a� fixed� air� volume� should� increase� by� a� factor� of� 1.74�
(Nowicki�1987).�Gain�settings�were�constant�across�the�recording�and�so�was�the�hydrophone�placement�
allowing� for� comparison� of� relative� levels� between� and�within� whistles� with� and�without� heliox.�We�
4
Page 106
Page 106
Madsen�et�al.�In�prep���Dolphins�don’t�whistle�
1
2
3
4
5
6
7
8
9
10
11
12
13
14
15
16
17
18
19
20
21
22
23
24
25
26
27
28
29
computed� relative� rms� sound� level,� duration� and� centroid� frequency� of� each� whistle.� An� extraction�
program� developed� by� K.� Beedholm� was� used� to� track� and� extract� the� fundamental� and� harmonic�
frequency�contours�so�that�the�relative�energy�contents�for�each�of�these�could�be�computed�(figure�1)�
RESULTS�
During�a�1�hour�period,� the�vocal�output�was� recorded� from�the�dolphin�placed� in�a�cradle� in�a� small�
tank�filled�with�water.�The�blow�hole�was�above�the�water�line,�and�10�minutes�of�recordings�were�made�
while�the�animal�was�breathing�air�during�which� it�produced�4�whistles.�The�animal�was�subsequently�
breathing�heliox�for�some�20�minutes,�and�it�produced�the�first�of�19�whistles�after�the�13th�breath�on�
heliox.� Following� this�period� the�animal�was�on�air� again� for�30�minutes�during�which� it�produced�30�
whistles.��
First� we� tested� the� hypothesis� that� whistles� are� true� whistles� and� hence� produced�
aerodynamically.�As�seen�from�figure�1,�there�were�no�significant�changes�in�the�fundamental�contour�
when�changing�from�air�to�heliox�in�a�manner�consistent�with�a�1.74�times�shift�upwards�in�frequency.�
All�whistles�in�air�started�around�4�kHz�and�underwent�an�upwards�sweep�to�some�20�kHz,�and�13�out�of�
19�of�the�heliox�whistles�did�the�same.�Six�of�the�heliox�whistles�were�shorter,�weaker�and�had�a�starting�
frequency� between� 7� and� 17� kHz,� and� were� produced� in� between� those� of� normal� contours� while�
breathing�heliox.�The�heliox�whistles�had�a�median�received�level�3.5�dB�lower�than�whistles�produced�in�
air,�but�not�significantly�so�(Kruskal�Wallis:�p=0.176).�There�were�no�significant�differences�between�air�
and� heliox�whistles� in� duration,� peak� frequency,� centroid� frequency� or�mean� contour� frequency.�We�
then� tested�whether� the� production� of�whistles� is� partially� or� completely� independent� of� vocal� tract�
filtration�by� looking�at�the�decay�rate� in�energy�from�the�fundamental�contour�to�the�first�and�second�
harmonics.� As� seen� from� figure� 2a� there� is� a� significantly� smaller� decay� rate� from� the� fundamental�
contour�to�both�the�first�and�second�harmonics�during�heliox�breathing.�The�median�decay�rate�for�the�
first�harmonic�in�heliox�is�3�dB�smaller�than�for�air,�and�for�the�second�harmonic�it�is�3.5�dB�smaller�than�
in�air.�This�redistribution�of�energy�is�caused�by�a�decrease�in�energy�within�the�fundamental�frequency�
while�the�energy�within�the�harmonics�is�apparently�unchanged�(figure�2b).��
�
�
�
5
Chapter V
Page 107
Page 107
Madsen�et�al.�In�prep���Dolphins�don’t�whistle�
DISCUSSION�1
2
3
4
5
6
7
8
9
10
11
12
13
14
15
16
17
18
19
20
21
22
23
24
25
26
27
28
29
30
31
The� lack�of� frequency�shift� in� the�fundamental�contour�while�breathing�heliox�shows�that�dolphins�do�
not�produce�tonal�sounds�aerodynamically,�and�that�a�dolphin�whistle�therefore�strictly�speaking�is�not�a�
whistle� (Wilson� et� al.,� 1971).� Our� findings� do� therefore� not� support� the� sound� production� model�
advanced� by� Lilly� (1962)� suggesting� that� the� frequency�modulation� in� a� dolphin� whistle� happens� via�
changes�in�nasal�air�sac�sizes�and�hence�changes�in�resonance�frequencies.�Rather,�the�present�findings�
are� consistent� with� recent� measurements� by� Jensen� et� al� (in� press)� showing� that� the� fundamental�
contour�of�pilot�whale�whistles�does�not�change�with�depth�as�would�be�predicted�if�they�were�made�as�
true�whistles� formed�by�diminishing� resonating� air� volumes� at� depth.� The� alternative� to� Lilly's� (1962)�
model� is� that� the� fundamental� frequency� of� the� produced� whistles� is� actually� set� by� vibrations� of� a�
functional� analogue� of�mammalian� vocal� cords� or� a� bird� syrinx,�where� the� fundamental� frequency� is�
changed�by�changing�membrane�stiffness�and�airflow�over�them.��
The� supercranial� airways� of� dolphins� consist� of� a� complex� system�of� nasal� passages,� air� sacs,�
nasal�plugs�and�the�phonic�lips�responsible�for�click�production�(Cranford�et�al.,�1996).�We�propose�that�
a� good� candidate� for� a� vibrating� source� that� can� produce� the� whistles� is� the� left� pair� of� phonic� lips�
(Cranford,�et�al.�1996)�or�perhaps�less�likely�the�diagonal�membranes�on�the�posterior�margin�just�above�
the� phonic� lip.� If� we� are� correct� that� the� phonic� lips� (or� the� diagonal� � membranes� in� a� certain�
configuration),�different� from�when�clicking,�may�vibrate� to�produce� tonal� calls,� they�must�be�able� to�
oscillate� when� air� flows� past� them� at� frequencies� between� 4� and� 20� kHz� where� the� fundamental�
contours� of� most� dolphins� whistles� are� found.� That� dolphins� with� phonic� lips� 2�5� times� bigger� than�
human� vocal� cords� surprisingly� produce� tonal� sounds� about� an� order� of� magnitude� above� the�
fundamental�contours�of�human�tonal�calls�may�be�explained�by�the�differences�and�mass�and�stiffness:�
the� posterior� phonic� lips� are� supported� by� strong� cartilage� and� the� anterior� ones� consist� of� a�
conglomerate�of�connective�tissue�and�fat�bursae�and�are�much�stiffer�and�with�a�higher�mass�than�the�
vocal� folds�of� terrestrial�mammals� (Cranford�et� al.,� 1996).�With� this� vibration�model� it� is� implied� that�
dolphins� produce� frequency�modulated� whistles� by� changing� the� conformation� and� stiffness� of� their�
phonic� lips�and�the�air�flow�across�them,�rather�than�by�changing�the�volume�and�resulting�resonance�
frequencies� of� their� nasal� air� sacs.� Given� that� clicks� are� also� produced� by� pneumatic� acceleration� of�
phonic� lips� (Cranford� et� al.,� 1996),� it� therefore� seems� that� the� production�mechanisms� for� tonal� and�
discrete�click�sounds�are�not�as�different�as�they�would�be�if�the�whistles�were�true�whistles,�which�may�
explain� the� apparent� continuum� sometimes� seen� between� burst� pulsed� calls� and� tonal� calls� of�
6
Page 108
Page 108

Madsen�et�al.�In�prep���Dolphins�don’t�whistle�
1
2
3
4
5
6
7
8
9
10
11
12
13
14
15
16
17
18
19
20
21
22
23
24
25
26
27
28
29
30
31
delphinids.�
While�vocalizing�anurans�seemingly�have�a�sound�source�largely�decoupled�from�resonating�air�
volumes�(Rand�and�Dudley,�1993),�most�mammals�and�birds�have�a�vocal�tract�that�will�not�affect�the�
fundamental� frequency,� but� filter� sounds� produced� at� the� vocal� cords/syrinx� to� produce� formants�
(Nowicki�1987).�We�find�that�there�is�relatively�more�energy�at�the�1.�and�2.�harmonics�when�breathing�
heliox,�indicating�some�vocal�tract�effects�on�dolphin�whistles.�Thus,�while�the�fundamental�contour�of�a�
dolphins� whistle� apparently� is� determined� alone� by� the� vibrations� of� tissue,� it� seems� that� the� nasal�
passages� and� air� sacs� will� act� as� resonators� to� form� formants� in� whistles� through� broad� band�pass�
filtering�of�the�radiated�sounds.�The�de�emphasis�of�the�contour�compared�to�both�the�first�and�second�
harmonic� in�heliox,� suggest� that� the�vocal� tract�works�as�a� low�Q�band�pass� filter� that� in�air� covers�a�
broad� frequency� range� of� a� normal�whistle� contour.�When� breathing� heliox� the� pass� band� is� shifted�
upwards,� leading� to� the�observed� reduction�of� energy�within� the� fundamental� compared� to�both� the�
first� and� second� harmonics� that� are� now� in� the� pass� band.� That� is� consistent�with� the� suggestion� of�
Miller� et� al� (2007)� that� the� different� energy� ratios� between� male� and� female� killer� whales� can� be�
explained� by� different� air� sac� volumes.� Such� timbre� generated� from� formant� formation� provides� the�
voice�features�often�used�for�individual�recognition.�However,�the�vocal�tract�filtration�and�hence�timbre�
of�delphinid�calls�are�predicted�to�change�with�the�air�sac�volumes�that�in�turn�will�be�affected�by�where�
in� the�air� recycling� cycles� the�dolphin� is� and� the�depth�at�which� it� is� vocalizing.� The� latter�effect�may�
explain�the�observations�by�Ridgway�et�al�(2001)�that�whistling�belugas�had�relatively�more�energy�in�the�
harmonics� at� 300�meters� depth� compared� to� the� surface.� It� is� therefore� implied� that� voice� features�
formed�by�vocal�tract�filtration�will�change�with�depth,�and�it� is�hence�not�a�reliable�cue�for�individual�
recognition� unless� carefully� compensated� for� through� vocal�motor� feedback.� Interestingly,� Janik� et� al�
(2006)�have�demonstrated�that�identity� information�in�dolphin�whistles�seemingly�can�be�conveyed�by�
the�fundamental�contour�alone�and�does�not�require�voice�features�in�the�form�of�formants.�That�means�
that� because� the� fundamental� frequency� is� produced� by� tissue� vibrations� and� not� by� resonating� air�
volumes,�dolphins�can�convey� information�and� identity� independent�of� their�depth�and�how�much�air�
they�have�moved�from�the�nasal�cavity�to�the�vestibular�sacs.�It�therefore�seems�that�dolphins�have�not�
evolved� the�ability� to�whistle�with� their�nose,�but� rather� to�produce� tonal� sounds�by�air�driven� tissue�
vibrations� within� the� nasal� system� to� enable� robust� acoustic� communication� across� a� large� range� of�
hydrostatic�pressures�during�diving.�
�
7
Chapter V
Page 109
Page 109
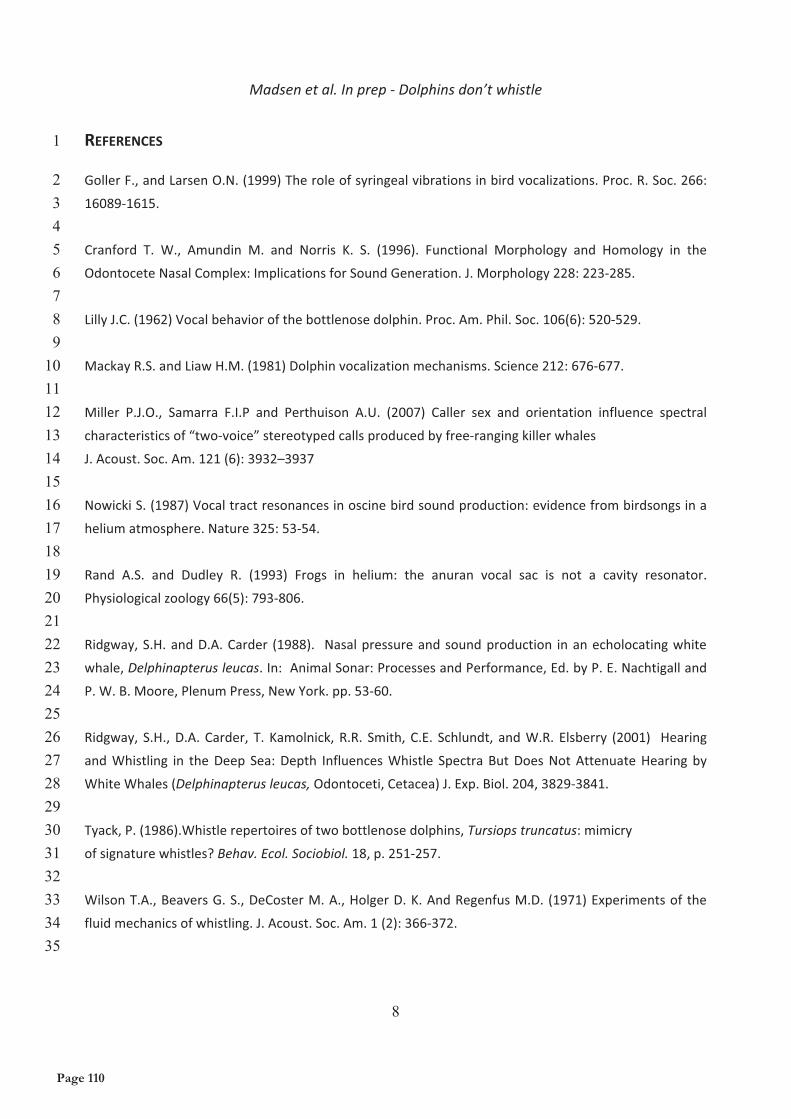
Madsen�et�al.�In�prep���Dolphins�don’t�whistle�
REFERENCES�1
2 3 4 5 6 7 8 9
10 11 12 13 14 15 16 17 18 19 20 21 22 23 24 25 26 27 28 29 30 31 32 33 34 35
Goller�F.,�and�Larsen�O.N.�(1999)�The�role�of�syringeal�vibrations�in�bird�vocalizations.�Proc.�R.�Soc.�266:�
16089�1615.�
�
Cranford� T.� W.,� Amundin� M.� and� Norris� K.� S.� (1996).� Functional� Morphology� and� Homology� in� the�
Odontocete�Nasal�Complex:�Implications�for�Sound�Generation.�J.�Morphology�228:�223�285.�
�
Lilly�J.C.�(1962)�Vocal�behavior�of�the�bottlenose�dolphin.�Proc.�Am.�Phil.�Soc.�106(6):�520�529.�
�
Mackay�R.S.�and�Liaw�H.M.�(1981)�Dolphin�vocalization�mechanisms.�Science�212:�676�677.�
�
Miller� P.J.O.,� Samarra� F.I.P� and� Perthuison� A.U.� (2007)� Caller� sex� and� orientation� influence� spectral�
characteristics�of�“two�voice”�stereotyped�calls�produced�by�free�ranging�killer�whales�
J.�Acoust.�Soc.�Am.�121�(6):�3932–3937�
�
Nowicki�S.�(1987)�Vocal�tract�resonances�in�oscine�bird�sound�production:�evidence�from�birdsongs�in�a�
helium�atmosphere.�Nature�325:�53�54.�
�
Rand� A.S.� and� Dudley� R.� (1993)� Frogs� in� helium:� the� anuran� vocal� sac� is� not� a� cavity� resonator.�
Physiological�zoology�66(5):�793�806.�
�
Ridgway,�S.H.�and�D.A.�Carder� (1988).� �Nasal�pressure�and�sound�production� in�an�echolocating�white�
whale,�Delphinapterus�leucas.�In:��Animal�Sonar:�Processes�and�Performance,�Ed.�by�P.�E.�Nachtigall�and�
P.�W.�B.�Moore,�Plenum�Press,�New�York.�pp.�53�60.�
�
Ridgway,� S.H.,�D.A.�Carder,� T.�Kamolnick,�R.R.� Smith,�C.E.� Schlundt,� and�W.R.� Elsberry� (2001)� �Hearing�
and�Whistling� in� the�Deep� Sea:�Depth� Influences�Whistle� Spectra�But�Does�Not�Attenuate�Hearing�by�
White�Whales�(Delphinapterus�leucas,�Odontoceti,�Cetacea)�J.�Exp.�Biol.�204,�3829�3841.�
�
Tyack,�P.�(1986).Whistle�repertoires�of�two�bottlenose�dolphins,�Tursiops�truncatus:�mimicry�
of�signature�whistles?�Behav.�Ecol.�Sociobiol.�18,�p.�251�257.�
�
Wilson�T.A.,�Beavers�G.�S.,�DeCoster�M.�A.,�Holger�D.�K.�And�Regenfus�M.D.�(1971)�Experiments�of�the�
fluid�mechanics�of�whistling.�J.�Acoust.�Soc.�Am.�1�(2):�366�372.�
�
8
Page 110
Page 110
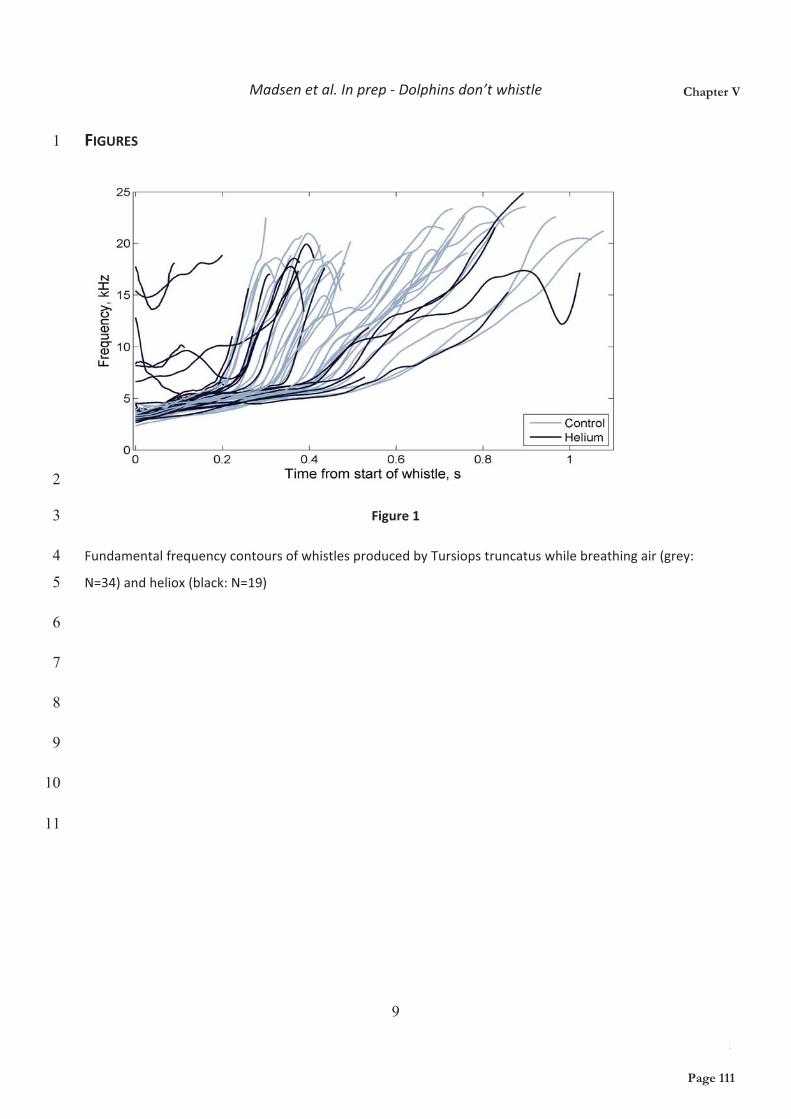
Madsen�et�al.�In�prep���Dolphins�don’t�whistle�
FIGURES� �1
�2
3
4
5
6
7
8
9
10
11
Figure�1�
Fundamental�frequency�contours�of�whistles�produced�by�Tursiops�truncatus�while�breathing�air�(grey:�
N=34)�and�heliox�(black:�N=19)�
�
�
�
�
�
9
Chapter V
Page 111
Page 111
Madsen�et�al.�In�prep���Dolphins�don’t�whistle�
10
1 2 �
�3 4
5
6
7
8
�A)�Ratio�of�sound�intensity�in�the�first�and�second�harmonics�relative�to�the�sound�intensity�of�
the�fundamental�frequency.�B)�Sound�intensity�within�fundamental�frequency�and�the�first�two�
harmonics.�*�denotes�significant�differences�(Kruskal�Wallis,�p<0.05).�
�
Figure�2�
Page 112
Page 112
Jensen et al. in prep - Bottlenose dolphin short-range communication
Short detection ranges of
bottlenose dolphin whistles in a tropical habitat
Frants H. Jensen1*, Beedholm, K.1, Wahlberg M.2,3,
Bejder, L.2, Peter T. Madsen1,2,4
1 Zoophysiology, Department of Biological Sciences, Aarhus University, 8000 Aarhus, Denmark.
2 Murdoch University Cetacean Research Unit, Centre for Fish and Fisheries Research, Murdoch
University, 6150 Western Australia
3 Fjord & Bælt and University of Southern Denmark,
Margrethes Plads 1, 5300 Kerteminde, Denmark
4 Woods Hole Oceanographic Institution, Woods Hole, MA 02543, USA.
*Corresponding author:
Short title: Bottlenose dolphin short-range communication
Chapter VI
Page 113Page 113
Jensen et al. in prep - Bottlenose dolphin short-range communication
ABSTRACT
Aquatic mammals depend on acoustic signals for mediating many aspects of their social
behaviour, especially for locating and maintaining contact with group members. The amplitude
and frequency content of animal vocalizations will influence the maximum distance at which
they can be detected in a given environment. Many ecological factors may shape the signaling
amplitude depending on the various costs and benefits involved. Bottlenose dolphins (Tursiops
sp.) depend on frequency-modulated whistles for many aspects of their social behavior,
including group cohesion and recognition of familiar individuals. In this study, we investigate
the source levels and energy content of whistles used by bottlenose dolphins in a typical
shallow-water environment with high ambient noise levels. We use a GPS-synchronized
hydrophone array to localize the source of individual whistles and estimate the source level.
We show that bottlenose dolphins produce whistles with mean source levels of 146.7±6.2 dB
re. 1 μPa (rms). These levels are lower than source levels previously estimated for a population
inhabiting the quieter Moray Firth, indicating that dolphins do not compensate for the high
noise levels found in our study habitat by increasing their source level. Combining these data
with measured transmission loss and noise levels for the habitat, we estimate median
communication ranges of 750 m and maximum communication ranges up to 5740 m. Whistles
contain less than 17 mJ of acoustic energy, and we argue that the energetic costs of whistling
are minimal compared to the high metabolic rate of these aquatic mammals, and not likely to
shape the vocal activity of toothed whales in general.
PACS number: 43.80.+p
KEYWORDS
Bottlenose dolphin, acoustic communication, whistles, active space, sound propagation, energetic cost
Page 114Page 114
Jensen et al. in prep - Bottlenose dolphin short-range communication
INTRODUCTION
Group living offers many evolutionary advantages that may include various strategies for
decreasing predation, increasing foraging efficiency, or evolving cooperative breeding or nursing
systems (Gowans et al., 2007; Krebs & Davies, 1993; Norris & Schilt, 1988). Social groups are
common in many animal species ranging from single-celled algae over eusocial insects to large
African elephants (Anderson & McShea, 2001; Hamilton, 1964). One of the key requisites of group
living is the ability to locate and remain with other individuals, including the evolution of signaling
mechanisms to facilitate these tasks (Da Cunha & Byrne, 2009). Acoustic signals are well suited for
rapid, long-range communication in many habitats and consequently mediate group cohesion in
many insect, bird and mammalian species (Boinski, 1993; Brenowitz, 1982; Cortopassi &
Bradbury, 2006). This is especially true for mammals in aquatic habitats where acoustic signals
propagate faster and attenuate less rapidly than in air (Janik, 2005; Urick, 1983). Cetaceans, for
example, rely heavily on acoustic signals, both for active sensing of their environment using
echolocation signals, and for communicating with conspecifics (Tyack 2001).
The effective range over which a communication signal can be detected by a conspecific is often
termed the active space (Marten & Marler, 1977). This communication range shapes the structure
and dispersal of social groups as well as the vocal behaviour of individuals. Low-frequency acoustic
signals of animals such as elephants and baleen whales are likely to be detected over very long
distances of tens to thousands of kilometres (Garstang et al., 1995; Payne & Webb, 1971), and such
long-range communication may result in very extensive social networks such as seen in African
savanna elephants (McComb et al., 2000; McComb et al., 2003). In contrast, Asian corn borer
moths produce very silent acoustic signals for courting females at a distance of 2 cm in order to
prevent eavesdropping by conspecifics or detection by predators (Nakano et al., 2009). These very
different active spaces are determined by a variety of physical and behavioral factors. The benefits
of social communication, such as finding a mate or maintaining cohesion within a social group, will
select for higher amplitude signals as this will increase the chance of detecting the signal in ambient
noise, increasing the effective range of the signal. On the other hand, the potential energetic costs of
generating the signal (Prestwich et al., 1989) as well as the increased risk of being detected by
predators (Deecke et al., 2002; Morisaka & Connor, 2007; Nakano et al., 2009; Ryan et al., 1982),
prey (Deecke et al., 2005), or social competitors (McGregor, 2005) will select for lower amplitude
and consequently a shorter detection range.
Chapter VI
Page 115Page 115
Jensen et al. in prep - Bottlenose dolphin short-range communication
The bottlenose dolphin (Tursiops sp.) is one of the most studied toothed whale species (Connor et
al., 2000). Studies in Sarasota Bay (Florida) and Shark Bay (West Australia) have shown that these
animals are organized in fission-fusion societies where animals leave and rejoin associates
frequently (Connor et al., 2000; Wells & Scott, 1999). Interactions between groups and between
individuals are primarily mediated by acoustic signals (Herzing, 2000; Tyack, 2000; Watwood et
al., 2004) where individually specific signatures of whistles (Janik et al., 2006; Sayigh et al., 1999)
may facilitate long-term maintenance of social bonds despite periodic separations (Connor et al.,
1992; Tyack, 2008). These whistles are purported to have a large active space that may facilitage
long-range group cohesion (Janik, 2000; Janik & Slater, 1998).
The detection range of whistles will determine the maximum separation distances over which
individuals may still remain in acoustic contact as well as the maximum distances over which
conspecifics may eavesdrop on vocal interactions (Janik, 2000). Estimating the range over which
conspecifics can detect or discriminate acoustic signals requires either careful playback experiments
(McComb et al., 2003) or modelling (Brenowitz, 1982). While playback experiments may reveal
biologically relevant communication ranges (McComb et al., 2003), they necessitate clearly
quantifiable reactions to the stimulus playback. Instead, the active space can be estimated using
knowledge on the psychophysical detection and discrimination of calls in noise (Brumm &
Slabbekoorn, 2005), as well as careful measurements of signal source properties, sound propagation
(Marten & Marler, 1977) and background noise levels (Brenowitz, 1982).
A signal broadcast into the environment with a given source level (SL) will attenuate gradually
when propagating through the environment and eventually become masked by the background
noise. At any point from the source, the received level (RL) of the signal can be described as the
signal source level (SL) minus the transmission loss (TL) from source to receiver. A conspecific is
expected to detect this signal if the received sound pressure level exceeds the psychophysical
detection threshold (DT) of the animal (equation 1).
TLSLDT �� (equation 1)
For a pure tone, the detection threshold equals the sum of the spectral noise level (N0) and the
critical ratio (CR), both at the test frequency for signal levels above the hearing threshold of young
individuals. The transmission loss is the sum of spreading loss and frequency-dependent absorbtion,
both increasing as a function of range (R), so that equation 1 can be rewritten as:
Page 116Page 116
Jensen et al. in prep - Bottlenose dolphin short-range communication
))(log( 100 RRkSLCRN ������ (equation 2)
The spreading loss constant k depends on habitat and bathymetry, but normally it ranges from
spherical spreading loss given by 20 log10(R) in deep water, to cylindrical spreading loss given by
10 log10(R) in very shallow water for continuous noise (Urick, 1983).
The first study to investigate the range of Tursiops whistles estimated an active space up to 25 km
in calm weather (sea state 0) in the Moray Firth, Scotland (Janik, 2000). This estimate was based on
measurements of whistle source levels combined with assumptions on shallow water sound
propagation (Marsh & Schulkin, 1962) and noise level profiles for deep water (Knudsen et al.,
1948). In contrast, Quintana-Rizzo and colleagues (2006) reported much smaller estimates of
communication ranges on the order of 500m in a shallow habitat with high noise levels, but with the
potential for long-range (>20 km) signal transmission through sound channels (Quintana-Rizzo et
al., 2006). However, while Quintana-Rizzo and colleagues measured both habitat-specific sound
propagation and noise levels, they could not address whether the resident dolphin populations had
adapted to these higher noise levels by increasing whistle source levels as non-human primates,
birds, and killer whales seem to do dynamically (Brumm, 2004; Holt et al., 2009; Sinnott et al.,
1975). Given that most research on the social organization of bottlenose dolphins comes from
tropical, shallow habitats such as Shark Bay and Sarasota Bay (the field site studied by Quintana-
Rizzo and colleagues), a detailed understanding of communication ranges in these habitats may help
uncover the spatial limits of contact between individuals and further advance our understanding of
the evolutionary factors shaping different levels of sociality in odontocetes. However, to do so in a
reliable fashion, it is important to measure the whistle source levels, ambient noise levels and
transmission loss in the habitat in question.
In this study, we attempt to meet these requirements by integrating measurements of environmental
background noise levels and transmission loss with estimates of source parameters of bottlenose
dolphins (Tursiops sp., presumably T. aduncus) in a shallow-water tropical habitat to test whether
tropical bottlenose dolphins use whistles of higher source level than populations living in more
temperate, and less noisy, habitats. We estimate the active space and metabolic energy cost for
Tursiops whistles and discuss implications for communication range and acoustic behaviour in this
habitat.
Chapter VI
Page 117Page 117
Jensen et al. in prep - Bottlenose dolphin short-range communication
MATERIALS AND METHODS
Recording habitat
The study was conducted in the shallow waters of Koombana Bay, Bunbury, Western Australia
(33°17�S, 115°39�E) in February 2007. A population of coastal bottlenose dolphins (Tursiops sp.) of
a few hundred individuals inhabits the nearby coastline and frequently forages in the recording area.
Background noise levels in this subtropical habitat are high (Fig. 1), generally dominated by the
sounds of snapping shrimp, but also influenced by the close proximity of the coast and a busy
harbour (Jensen et al., 2009).
Sound propagation measurements
Sound transmission experiments were conducted using two small aluminium-hulled vessels as
transmission and reception platforms. Sound propagation was investigated for a nearly homogenous
water depth of 5-7meters along a transect line running approximately 270m parallel to the coast.
Along this transect, the bottom consisted primarily of sand with occasional patches of sea grass.
Transmission source levels were <162 dB re. 1 �Pa RMS, less than the source levels of dolphin
whistles reported previously (Janik, 2000). However, one observer on each vessel continuously
scanned the area for dolphins throughout the experiment so that transmissions could be halted if
dolphins were closer than 100m.
One anchored vessel deployed a recording array of 3 calibrated B&K 8101 hydrophones with
preamplifiers (-184 dB re 1 V/�Pa ± 2 dB from 0.1 to 80 kHz). The three hydrophones were
suspended at depths of 0.5m, 3m and 5.5m between a surface buoy and a 0.5kg lead weight (water
depth 6m). The hydrophones were connected through custom-built low-noise amplifiers (20-40 dB
gain, 4-pole bandpass filter, -3dB points: 100 Hz to 50 kHz) to a four-channel, 12-bit analogue-to-
digital converter (ADlink Technology, Chungho City, Taiwan), digitizing each channel with a
sample rate of 150 kHz and writing data to a labtop computer via a PCMCIA interface (Magma,
San Diego, CA, USA).
A second vessel deployed an underwater speaker and power amplifier set (Lubell 3300, Lubell
Labs, Columbus, OH, USA) [300 Hz to 20 khz, ±4dB], connected to a stereo compact-flash
Page 118Page 118
Jensen et al. in prep - Bottlenose dolphin short-range communication
playback device (M-Audio Microtrack 24/96: M-Audio, Irwindale, CA, USA) for sound
transmission. The transmitting vessel was anchored at distances of 6m, 20m, 50m, 100m, and 250m
along the transect line from the recording array, measured with a measuring rope (6 and 20m) or a
laser rangefinder (±1m accuracy) At each location, transmissions were conducted at each of three
depths: At the surface (0.5m depth), in the middle of the water column (2.5-3.5m depth), and near
the bottom (0.5m from the bottom), mirroring the setup of the recording array. Each transmission
consisted of an upsweep (1-21 kHz, 0.5s duration) followed by individual pure-tone signals (0.5s
duration) spanning the frequencies from 1-21 kHz in 2 kHz steps. Transmissions were repeated 10
times at each location and at each transmitting depth.
Pure-tone TL: Each 0.5s tone was extracted, windowed with a Tukey window (length 75000
samples, 128 points tapering) and fourier-transformed to find the power spectrum (FFT size 75000,
spectral resolution 2 Hz). The received level of the test tone was then found as the spectral sound
pressure level at the test frequency (dB re 1 �Pa, rms). Finally, transmission loss was calculated as
the slope of a linear regression of received level against log-transformed distance using the 10
transmissions.
Sweep TL: Each 0.5s upsweep was extracted and filtered with a matched filter (400 Hz bandwidth,
centered on the instantaneous frequency of the upsweep) to maximize signal-to-noise ratio (SNR).
Subsequently, a power spectrum (FFT size 75000, spectral resolution 2 Hz) was derived and
averaged over the 10 repeated transmissions. The averaged power spectrum was downsampled with
a factor of 50, for a final spectral resolution of 100 Hz, and corrected for amplification and
hydrophone sensitivity. Transmission loss was then calculated as the difference between the
averaged power spectrums for the 250m transmission and the 20m transmission, and corrected for
the difference between the actual range increase and a 10-fold range increase.
Whistle recording setup
Bottlenose dolphin whistles were recorded using a dispersed array of 4 GPS synchronized
hydrophones (Møhl et al., 2001). The recording array consisted of four small anchored vessels, each
deploying a calibrated B&K 8101 hydrophone and preamplifier (sensitivity -184 dB re 1 V/�Pa) at
a recording depth of 3m which is approximately in the middle of the water column. Each
hydrophone was connected to a custom made amplifier box (20-40 dB gain, 4-pole bandpass filter, -
3dB points: 100 Hz to 50 kHz) and recorded with a sampling rate of 96 kHz on one channel of a 16
Chapter VI
Page 119Page 119
Jensen et al. in prep - Bottlenose dolphin short-range communication
bit stereo sigma-delta recorder (M-Audio Microtrack 24/96: M-Audio, Irwindale, CA, USA).
Recording stations were GPS synchronized using the methodology of Møhl et al. (2001): A GPS
antenna and receiver (Garmin GPS25 LV, 12-channel receiver) on each vessel received GPS
position and GPS time continuously. The GPS unit was connected to a custom built frequency-shift
keying device (Møhl et al., 2001), converting the serial GPS information into a tone signal where
information was coded in binary form as a series of 17 kHz (ones) and 20 kHz (zeroes) components.
The GPS unit emitted a 20 ms timing pulse each second, synchronized to the atomic clocks of the
satellites, that was encoded by the frequency-shift keying device as an abrupt decrease in signal
amplitude. The final frequency-encoded signal was recorded on the second channel of the sound
recorder so that sound and GPS information was sampled simultaneously and so that sound
recordings from all platforms could be synchronized using the GPS pulse to within 50 μs.
Acoustic localization
Recordings were examined in custom written Matlab 6.5 (Mathworks) software. Whistles were
identified in synchronized spectrograms (FFT size 2048, 75% overlap) of all 4 recording stations
and stored for subsequent analysis. Receiver locations were extracted from the GPS information and
converted from spherical WGS84 data into Cartesian coordinates. A source location estimate for
each whistle was derived using time-of-arrival differences for a two-dimensional array of receivers
(Møhl et al., 2001; Wahlberg et al., 2001).
To improve the localization accuracy of whistles recorded at a low SNR on some receivers, time-of-
arrival differences (Fig. 2) were found by cross-correlating each synchronized recording with a
replica of the whistle constructed by filtering the whistle with best SNR with a frequency-
modulated filter tracing the whistle fundamental frequency contour (Beedholm et al. in prep). This
step was used to remove unnecessary noise as well as to remove broadband dolphin clicks that
correlate well between channels and return an erroneous time difference for the whistle in question.
For each pair of receivers, a hyperboloid equation of the possible location of the source can be
constructed from the time-of-arrival difference, sound speed and receiver locations (Spiesberger &
Fristrup, 1990). Localization was constrained to two dimensions because of the shallow depth
compared to the large aperture of the recording array. With four receivers, three independent
hyperbola equations can be derived, yielding an overdetermined 2D localization system (Madsen &
Wahlberg, 2007; Wahlberg et al., 2001). The hyperbola equations were examined graphically and
Page 120Page 120
Jensen et al. in prep - Bottlenose dolphin short-range communication
the source position was estimated as the mean intersection between hyperbolas (Fig. 2). In cases
where the array geometry was quasi-linear, hyperbolas might intersect once on each side of the
array and the location of the source would be ambiguous. In such cases, ambiguity was solved by
selecting the set of intersections with the smallest least-squared distance between them, and
locations of dolphins confirmed by examining records of visual observations taken from the
recording vessels.
Derivation of whistle source parameters
Whistles were subdivided into three groups based on their fundamental time-frequency contour
(following Janik et al., 1994). A fundamental frequency contour increasing throughout most of the
whistle was classified as a rise or upsweep whistle. A fundamental frequency contour with small
variations in frequency content was classified as a flat or constant-frequency (CF) whistle. An
ascending/descending fundamental frequency contour, often with several repetitions, was classified
as a sine or loop whistle. Temporal gaps between repetitions of the same whistle may be important
for the information conveyed between dolphins (Esch et al., 2009). However, since this study
focused on the source level of whistles rather than their information content, similar but
unconnected whistles were regarded as discrete entities for the analysis.
Whistles with a successful source location estimate were analysed for source parameters using one
recording station. This was often the same station that was chosen for the cross-correlation template
because of the best SNR. However, if the sound source was localized within 30m of this station, a
more distant recording station was chosen so as to reduce the influence of localization errors when
estimating source levels.
To maximize the SNR, whistles were filtered with a 6-pole bandpass filter with -3 dB cutoff
frequencies adjusted to the minimum and maximum fundamental frequencies estimated from the
whistle model. A root-mean-square (RMS) noise measure was derived from a 0.1s window
following each whistle, and the whistle duration was then defined as the length of the smallest
window containing 95% of the total signal energy after subtracting the noise power (Madsen &
Wahlberg, 2007). The SNR was calculated as the difference in RMS signal amplitude and RMS
noise amplitude on a dB scale, and signals with less than 6 dB SNR were removed from further
analysis.
Chapter VI
Page 121Page 121
Jensen et al. in prep - Bottlenose dolphin short-range communication
A spectrogram was computed with 5 ms Hanning windows (480 samples, zero-padded to 4096
samples for FFT computation) with 50% overlap for a spectral resolution of 200 Hz and a temporal
resolution of 2.5 ms. A supervised trace of the fundamental frequency contour (similar to Deecke et
al., 1999) was used to derive the fundamental minimum (Fmin), mean (Fmean) and maximum (Fmax)
frequency over the 95% energy window. Spectral power distribution was estimated using the Welch
method (Welch, 1967) by summing power spectrums within the 95% energy window. The peak
frequency, Fp (defined as the frequency with highest spectral power) and the centroid frequency,
Fc, (defined as the frequency separating the power spectrum into two halves with the same amount
of total energy) were computed from the power spectrum (Au, 1993).
Source levels: Two amplitude measures were extracted: First, the average sound pressure was
calculated as the RMS amplitude over the 95% energy window. Second, the highest sound pressure
was calculated as the maximum value of a running-average RMS sound pressure level with a
duration of 200 ms (95% overlap), corresponding to the pure-tone integration time of dolphins
around the frequencies measured here (Johnson, 1968b). Absolute received levels (RL) were then
computed from the calibrated recording chain clip level. Finally, source levels were estimated from
received levels by compensating for the transmission loss (TL) using eq. 1:
(R)logkRLTLRLSL 10����� (equation 3)
Where k is the frequency-dependent transmission loss coefficient extrapolated from pure tone TL
estimates in Fig. 2 (18 log R) using the derived centroid frequency of each whistle, R is the range
between source and receiver in meters, and all sound level values are in dB re. 1 μPa (rms).
Active space: Detection ranges were modelled based on the source levels, background noise and
measured habitat-specific transmission loss. To estimate the masking noise level, the noise-
integration bandwidth of the auditory system for a given sound must be taken into account. Fletcher
(1940) proposed a technique for estimating the critical bandwidth by measuring the masked
detection threshold of a tone in broadband noise. He defined the critical ratio (CR) as the ratio of
tone power to noise power spectral density at threshold (Fletcher, 1940) so that a tone in broadband
noise would be detected 50% of the time if the received level equalled the sum of noise spectral
density and the critical ratio for the tone frequency. The detection levels were therefore calculated
as the sum of the spectral level of background noise and the auditory critical ratios measured for
Page 122Page 122
Jensen et al. in prep - Bottlenose dolphin short-range communication
bottlenose dolphins (Johnson, 1968a). The appropriate detection level for a given whistle was
derived by interpolating estimated masking levels (Fig. 2) to the centroid frequency of each whistle.
Energy content: The average source level energy flux density (SL95% EFD: dB re. 1 μPa2*s) was
calculated for each whistle as the sum of the squared instantaneous sound pressure integrated over
the 95% energy window (Madsen & Wahlberg, 2007; Madsen et al., 2006). The acoustic energy
content (E95%: J) was then calculated as the energy flux density (on a linear scale) divided by the
acoustic impedance of seawater, and multiplied by the surface area of a sphere with a radius of 1m
(reference distance for source level), assuming that signals are approximately omnidirectional.
RESULTS
Sound propagation
Transmissions conducted with the transducer and receiver located at different depths yielded very
similar average transmission loss coefficients. The transmission loss coefficient with both receiver
and transducer located in the middle of the water column was measured to be 18 dB per 10-fold
increase in distance for frequencies equal to and below 8 kHz for both pure tone and sweep
transmissions (Fig. 2). TL estimates from sweeps and whistles corresponded well with each other
(Fig. 2) up to and including estimates at 11 kHz, but deviated from each other at higher frequencies.
Whistles
A total of 180 whistles (consisting of 134 rise, 24 flat, and 22 sine whistles) were successfully
localized (Fig. 3) with a high enough SNR for analysis. No significant differences in source levels
were found between the three different classes of whistles (Fig. 4: Kruskal-Wallis: p=0.73) and the
three classes were accordingly pooled together. Results of the pooled whistle analyses are
summarized in table 1. RMS source levels were measured to be 146.7±6.2 dB re. 1μPa using the
95% energy RMS measure and at 147.6±6.4 dB re. 1μPa when evaluated over a 200 ms time
window (mean difference +0.9 dB, greatest difference +4.1 dB). These source levels were
significantly lower than the mean found for bottlenose dolphin whistles in the Moray Firth
(Wilcoxon signed-rank test: p<0.0001).
Active space
Chapter VI
Page 123Page 123
Jensen et al. in prep - Bottlenose dolphin short-range communication
Active space estimates using 95% energy rms source levels were highly variable, with 95% of all
whistles detectable at a range of 220m, median detection ranges of 740m, and 5% of whistles
detectable at a range of 3240m. The highest source level whistle measured had a modelled
detection range of 5740m.
Energy
As a consequence of the relatively low SL, both acoustic power and total energy content (Fig. 4)
was very low. Mean backcalculated energy flux densities were at 142.0±6.6 dB re. 1 μPa2s, and
95% of whistles were found to have SL95% EFD less than 153.3 dB re. 1 μPa2s. Assuming an
omnidirectional sound radiation for whistles, the total acoustic energy content was calculated to be
very low, with a median of 1.1 mJ of energy contained in whistles, and 95 percent of all whistles
containing less than 17 mJ of acoustic energy.
DISCUSSION
We hypothesized that tropical bottlenose dolphins would produce higher source levels than
temperate conspecifics due to the high ambient noise levels from snapping shrimp in the tropics.
However, the source levels of 147.6±6.4 (max 164) dB re. 1μPa found in this study were
significantly lower than the 158±6.4 (max 169) dB re. 1μPa previously estimated in the Moray
Firth, Scotland (Janik, 2000), despite that the levels of ambient noise in the whistle frequency band
in our study area are likely much higher than in Moray Firth.
Some of this difference may be due to different methodology and quantification of source levels
between studies. Source levels for toothed whale whistles have been quantified using windows
covering 100 ms (Rasmussen et al., 2006) to 125 ms (Janik, 2000) and in some cases using
undefined windows presumably covering the length of the signal (Lammers & Au, 2003; Miller,
2006). Since RMS measures depend on the window length (Madsen et al., 2006), comparisons
between studies are hampered somewhat by the use of different window lengths. Window lengths
smaller than the pure-tone integration time, such as the 125 ms of Janik (2000) (corresponding to
the integration time of a tone around 20 kHz: Johnson, 1968b), may also lead to overestimates of
source levels that are not representative for how the animals detect whistles in noise. Furthermore,
small windows will also be more sensitive to overlying transients and to sporadic amplitude
variations caused by multipath propagation. Here we show that there are only small differences
between source levels found using a well-defined 95% energy window and a 200 ms integration
Page 124Page 124
Jensen et al. in prep - Bottlenose dolphin short-range communication
window. However, we did not test smaller window lengths and it is plausible that at least part of the
explanation for the higher source levels of Janik (2000) may relate to using very short window
lengths.
One possible explanation that may help account for the higher whistle SL found in Moray Firth is
the size difference between the animals of the two habitats. Bottlenose dolphins in the northeastern
Atlantic Ocean (including the Moray Firth) are among the largest Tursiops populations, reaching
lengths of 350-410 cm (Fraser, 1974; Lockyer & Morris, 1985). In contrast, bottlenose dolphins on
the west coast of Australia are much smaller, reported to reach lengths of 220-230 cm (Cockroft &
Ross, 1990; Hale et al., 2000). It has been shown across species that acoustic power scales with
body mass (Gillooly & Ophir, 2010; Ophir et al., 2010) and it is possible that the different source
levels reflect the maximum acoustic power output of these animals to some degree.
The high noise levels and lower source levels found in this study inevitably results in much lower
estimates of active space than in studies of delphinid communication in more temperate areas
(Janik, 2000; Miller, 2006). Our noise levels are about 6 dB lower than used to model detection
ranges in Sarasota (Quintana-Rizzo et al., 2006), but are comparable to noise levels found in other
subtropical habitats with snapping shrimp (Au et al., 1985). Noise levels used in this study were
obtained under ideal, low-noise conditions (flat sea with no vessels and little to no wind), so if
anything, the active space will on average likely be lower than reported here due to increased noise
from wind, waves and rain. Together, these results imply that communication range of tropical,
coastal dolphins is inherently short-range where 50% of the whistles are unlikely to be detected
beyond a range of 800m, more than an order of magnitude lower than previous studies of delphinids
(Janik, 2000; Miller, 2006).
In the studies of Janik (2000) for bottlenose dolphins and Miller (2006) for killer whales, theoretical
deep sea noise levels were used (Knudsen et al., 1948; Wenz, 1962). These low deep sea noise
profiles are considerably lower than the spectral noise levels normally measured at more shallow
depths, especially in the frequency range where delphinids vocalize (McConnell et al., 1992;
Piggott, 1964; Wenz, 1962). A one-year study of ambient noise in the Gulf of Finland, with little
vessel noise and few loud, biological sources of noise, demonstrates a variation in spectral noise
levels of up to 40 dB (Poikonen & Madekivi, 2010; Poikonen, 2010). Even the lowest noise levels
measured (when the Gulf had frozen over) still exceed the Knudsen curves above 2 kHz (Poikonen,
Chapter VI
Page 125Page 125
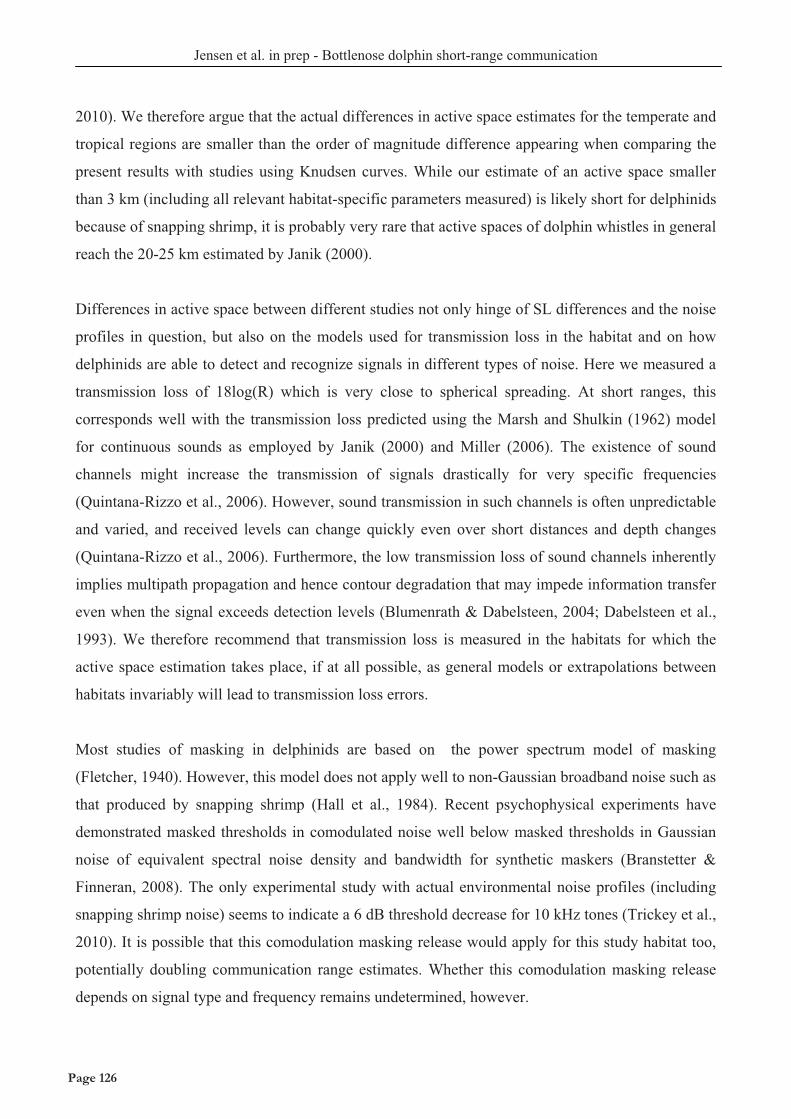
Jensen et al. in prep - Bottlenose dolphin short-range communication
2010). We therefore argue that the actual differences in active space estimates for the temperate and
tropical regions are smaller than the order of magnitude difference appearing when comparing the
present results with studies using Knudsen curves. While our estimate of an active space smaller
than 3 km (including all relevant habitat-specific parameters measured) is likely short for delphinids
because of snapping shrimp, it is probably very rare that active spaces of dolphin whistles in general
reach the 20-25 km estimated by Janik (2000).
Differences in active space between different studies not only hinge of SL differences and the noise
profiles in question, but also on the models used for transmission loss in the habitat and on how
delphinids are able to detect and recognize signals in different types of noise. Here we measured a
transmission loss of 18log(R) which is very close to spherical spreading. At short ranges, this
corresponds well with the transmission loss predicted using the Marsh and Shulkin (1962) model
for continuous sounds as employed by Janik (2000) and Miller (2006). The existence of sound
channels might increase the transmission of signals drastically for very specific frequencies
(Quintana-Rizzo et al., 2006). However, sound transmission in such channels is often unpredictable
and varied, and received levels can change quickly even over short distances and depth changes
(Quintana-Rizzo et al., 2006). Furthermore, the low transmission loss of sound channels inherently
implies multipath propagation and hence contour degradation that may impede information transfer
even when the signal exceeds detection levels (Blumenrath & Dabelsteen, 2004; Dabelsteen et al.,
1993). We therefore recommend that transmission loss is measured in the habitats for which the
active space estimation takes place, if at all possible, as general models or extrapolations between
habitats invariably will lead to transmission loss errors.
Most studies of masking in delphinids are based on the power spectrum model of masking
(Fletcher, 1940). However, this model does not apply well to non-Gaussian broadband noise such as
that produced by snapping shrimp (Hall et al., 1984). Recent psychophysical experiments have
demonstrated masked thresholds in comodulated noise well below masked thresholds in Gaussian
noise of equivalent spectral noise density and bandwidth for synthetic maskers (Branstetter &
Finneran, 2008). The only experimental study with actual environmental noise profiles (including
snapping shrimp noise) seems to indicate a 6 dB threshold decrease for 10 kHz tones (Trickey et al.,
2010). It is possible that this comodulation masking release would apply for this study habitat too,
potentially doubling communication range estimates. Whether this comodulation masking release
depends on signal type and frequency remains undetermined, however.
Page 126Page 126
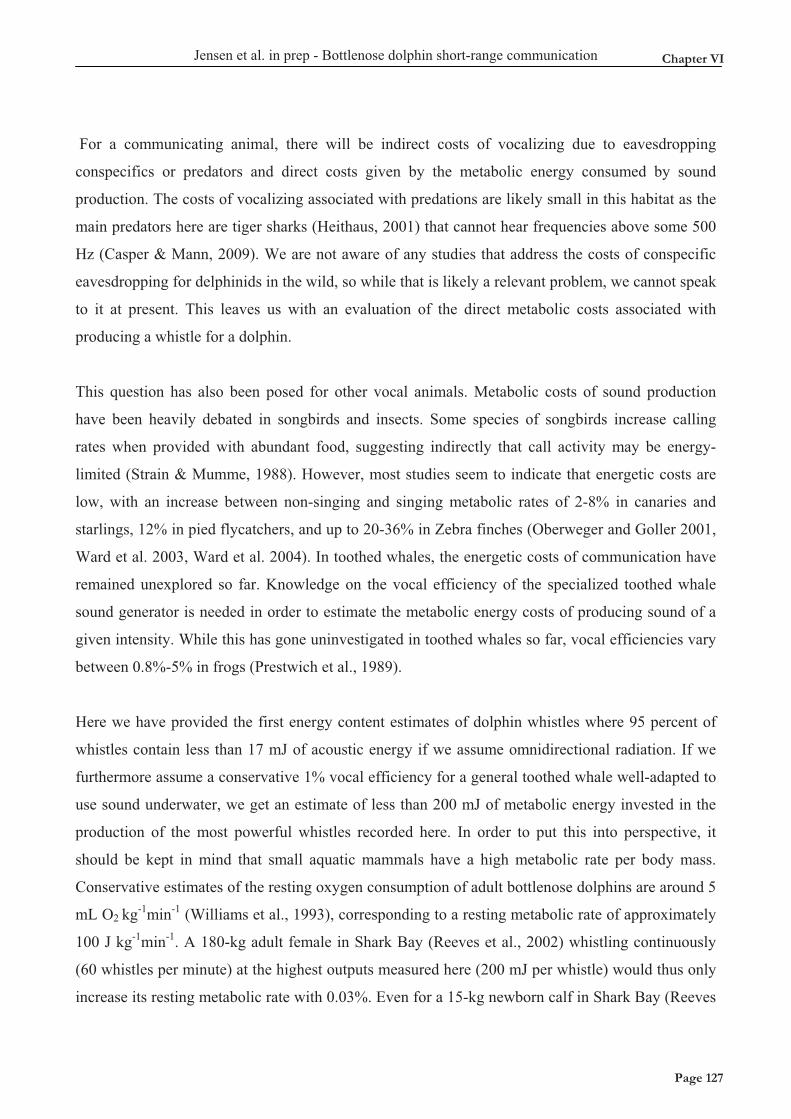
Jensen et al. in prep - Bottlenose dolphin short-range communication
For a communicating animal, there will be indirect costs of vocalizing due to eavesdropping
conspecifics or predators and direct costs given by the metabolic energy consumed by sound
production. The costs of vocalizing associated with predations are likely small in this habitat as the
main predators here are tiger sharks (Heithaus, 2001) that cannot hear frequencies above some 500
Hz (Casper & Mann, 2009). We are not aware of any studies that address the costs of conspecific
eavesdropping for delphinids in the wild, so while that is likely a relevant problem, we cannot speak
to it at present. This leaves us with an evaluation of the direct metabolic costs associated with
producing a whistle for a dolphin.
This question has also been posed for other vocal animals. Metabolic costs of sound production
have been heavily debated in songbirds and insects. Some species of songbirds increase calling
rates when provided with abundant food, suggesting indirectly that call activity may be energy-
limited (Strain & Mumme, 1988). However, most studies seem to indicate that energetic costs are
low, with an increase between non-singing and singing metabolic rates of 2-8% in canaries and
starlings, 12% in pied flycatchers, and up to 20-36% in Zebra finches (Oberweger and Goller 2001,
Ward et al. 2003, Ward et al. 2004). In toothed whales, the energetic costs of communication have
remained unexplored so far. Knowledge on the vocal efficiency of the specialized toothed whale
sound generator is needed in order to estimate the metabolic energy costs of producing sound of a
given intensity. While this has gone uninvestigated in toothed whales so far, vocal efficiencies vary
between 0.8%-5% in frogs (Prestwich et al., 1989).
Here we have provided the first energy content estimates of dolphin whistles where 95 percent of
whistles contain less than 17 mJ of acoustic energy if we assume omnidirectional radiation. If we
furthermore assume a conservative 1% vocal efficiency for a general toothed whale well-adapted to
use sound underwater, we get an estimate of less than 200 mJ of metabolic energy invested in the
production of the most powerful whistles recorded here. In order to put this into perspective, it
should be kept in mind that small aquatic mammals have a high metabolic rate per body mass.
Conservative estimates of the resting oxygen consumption of adult bottlenose dolphins are around 5
mL O2 kg-1min-1 (Williams et al., 1993), corresponding to a resting metabolic rate of approximately
100 J kg-1min-1. A 180-kg adult female in Shark Bay (Reeves et al., 2002) whistling continuously
(60 whistles per minute) at the highest outputs measured here (200 mJ per whistle) would thus only
increase its resting metabolic rate with 0.03%. Even for a 15-kg newborn calf in Shark Bay (Reeves
Chapter VI
Page 127Page 127
Jensen et al. in prep - Bottlenose dolphin short-range communication
et al., 2002) that was able to produce the same source levels measured here, and with a mass-
specific metabolic rate of an adult bottlenose dolphin (which is essentially some 5x lower than the
mass-specific metabolic rate for a calf when scaled with M0.75), continuous whistling would still
only lead to a meagre 0.8% increase in metabolic rate. Direct energetic costs of communication in
delphinids therefore seem to be of little importance to the animals. Other costs, such as detection by
predators (Morisaka and Connor 2005), prey (Deecke et al. 2005) or eavesdropping by conspecifics
(Janik 2009) are much more likely to shape the acoustic behaviour of delphinids, as well as the time
allocated to social communication rather than foraging.
In conclusion, we have shown that bottlenose dolphins in a shallow-water, noisy habitat do not
seem to compensate for the high background noise levels by increasing the source level of whistles
but rather use lower source levels than previously reported. These low source levels combined with
the high background noise in the habitat leads to low communication ranges for these animals. We
have also shown how the acoustic energy in whistles, and the metabolic energy to produce them, is
insignificant compared to the field metabolic rate of a normal bottlenose dolphin and indeed would
not be expected to constitute much of a cost for any toothed whale. Other ecological factors such as
increased risk of being detected by predators, prey, or social competitors, are probably more
important in shaping the acoustic behaviour of these animals.
ACKNOWLEDGEMENTS
This study received support from the Danish PhD School of Aquatic Sciences (SOAS), Aarhus
University, DK, WWF Verdensnaturfonden and Aase & Ejnar Danielsens Foundation, the Siemens
Foundation, the Faculty of Science at the University of Aarhus, DK and the Danish Natural Science
Foundation via a Steno scholarship and a logistics grant to PTM. We greatly appreciate the
assistance in the field provided by M. Hansen, M. Wilson, H. Schack, H. Smith and J. Knust, the
technical help given by N. U. Kristiansen and J. Svane as well as the logistical support provided by
Murdoch University and Bunbury Dolphin Discovery. Research in Australia was conducted under a
permit to LB from the Department of Environment and Conservation and Ethics Approval from
Murdoch University.
Page 128Page 128
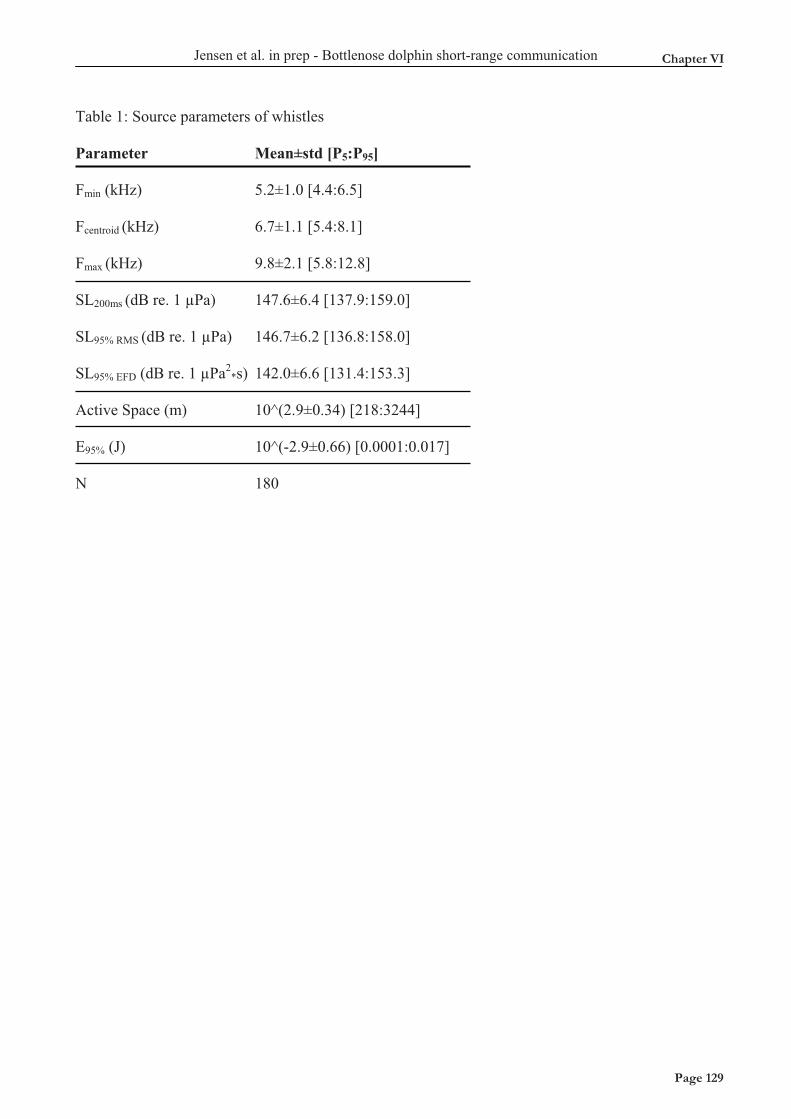
Jensen et al. in prep - Bottlenose dolphin short-range communication
Table 1: Source parameters of whistles
Parameter Mean±std [P5:P95]
Fmin (kHz) 5.2±1.0 [4.4:6.5]
Fcentroid (kHz) 6.7±1.1 [5.4:8.1]
Fmax (kHz) 9.8±2.1 [5.8:12.8]
SL200ms (dB re. 1 μPa) 147.6±6.4 [137.9:159.0]
SL95% RMS (dB re. 1 μPa) 146.7±6.2 [136.8:158.0]
SL95% EFD (dB re. 1 μPa2*s) 142.0±6.6 [131.4:153.3]
Active Space (m) 10^(2.9±0.34) [218:3244]
E95% (J) 10^(-2.9±0.66) [0.0001:0.017]
N 180
Chapter VI
Page 129Page 129
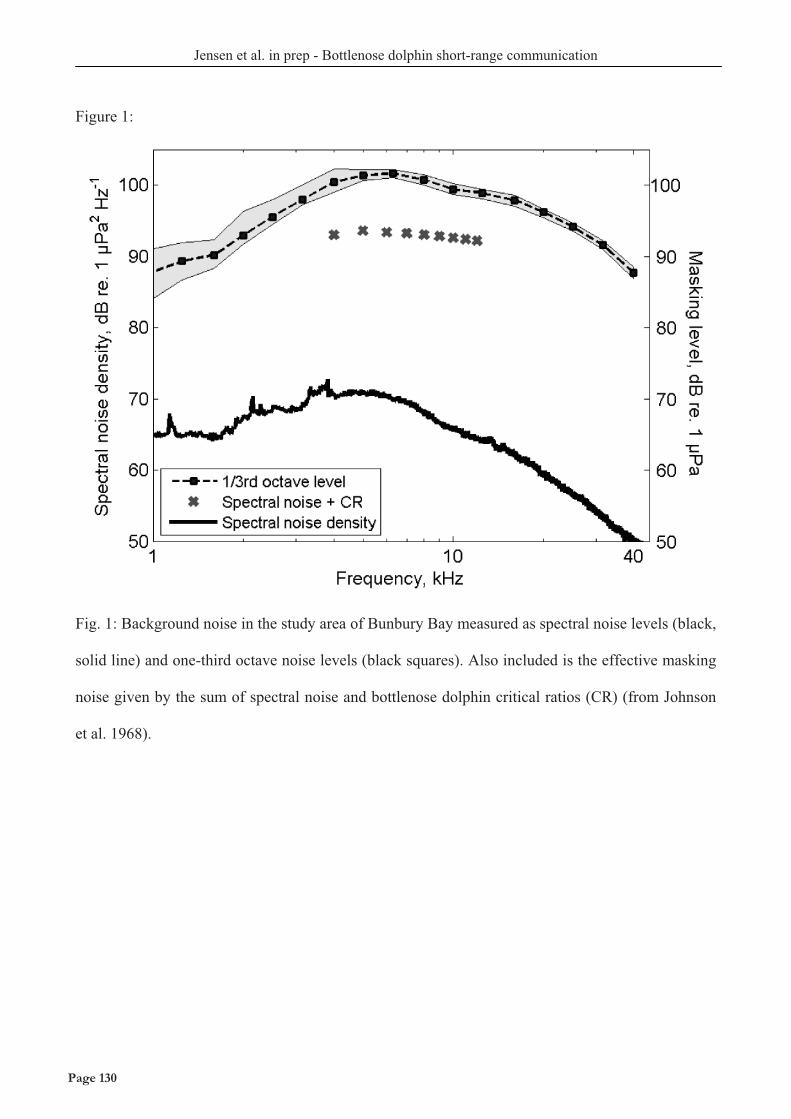
Jensen et al. in prep - Bottlenose dolphin short-range communication
Figure 1:
Fig. 1: Background noise in the study area of Bunbury Bay measured as spectral noise levels (black,
solid line) and one-third octave noise levels (black squares). Also included is the effective masking
noise given by the sum of spectral noise and bottlenose dolphin critical ratios (CR) (from Johnson
et al. 1968).
Page 130Page 130
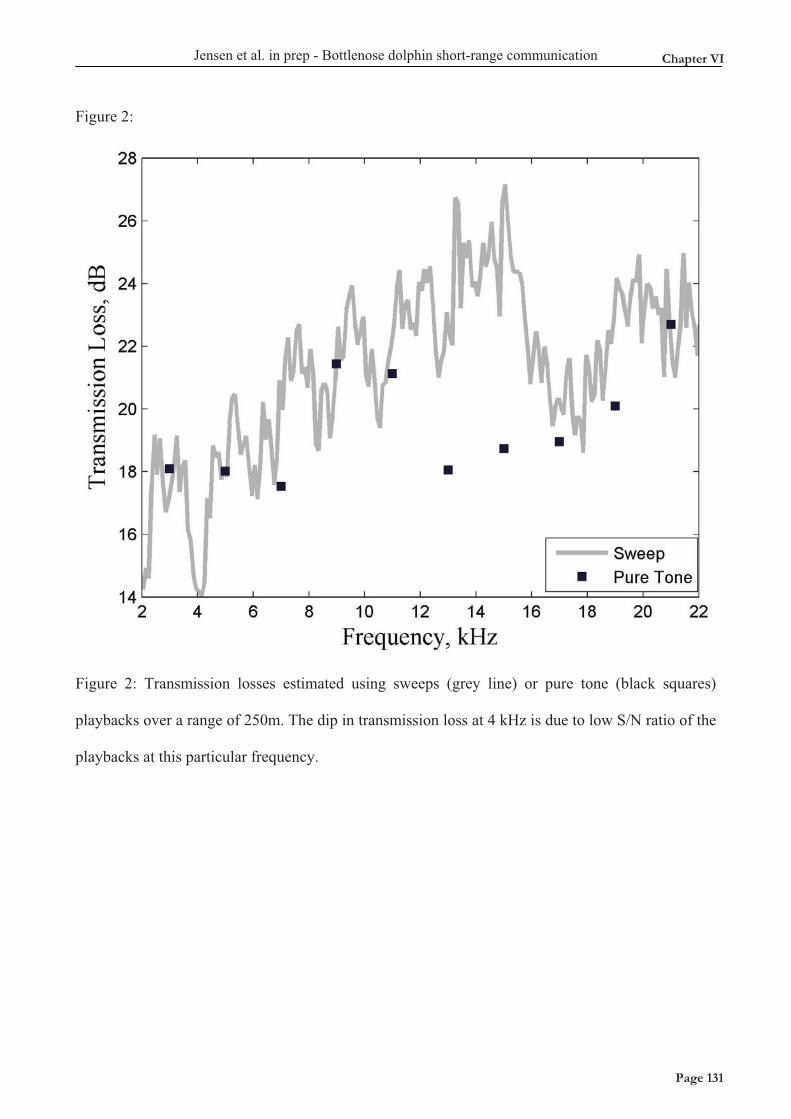
Jensen et al. in prep - Bottlenose dolphin short-range communication
Figure 2:
Figure 2: Transmission losses estimated using sweeps (grey line) or pure tone (black squares)
playbacks over a range of 250m. The dip in transmission loss at 4 kHz is due to low S/N ratio of the
playbacks at this particular frequency.
Chapter VI
Page 131Page 131
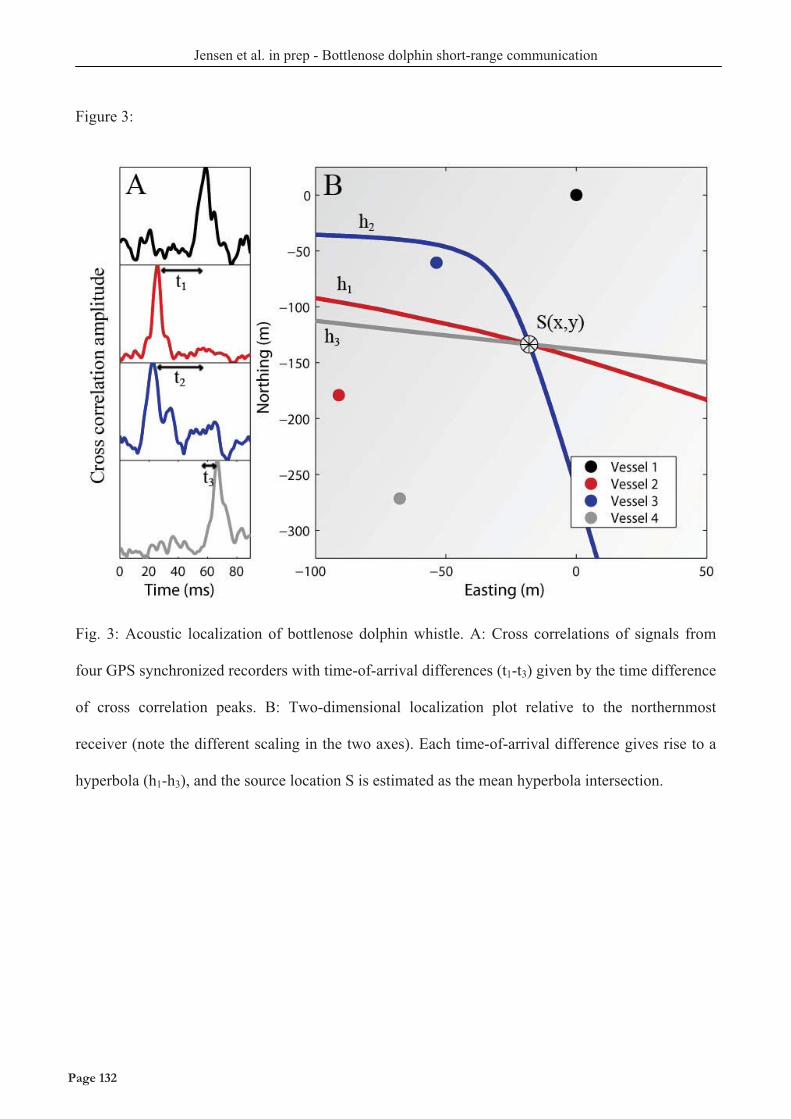
Jensen et al. in prep - Bottlenose dolphin short-range communication
Figure 3:
Fig. 3: Acoustic localization of bottlenose dolphin whistle. A: Cross correlations of signals from
four GPS synchronized recorders with time-of-arrival differences (t1-t3) given by the time difference
of cross correlation peaks. B: Two-dimensional localization plot relative to the northernmost
receiver (note the different scaling in the two axes). Each time-of-arrival difference gives rise to a
hyperbola (h1-h3), and the source location S is estimated as the mean hyperbola intersection.
Page 132Page 132
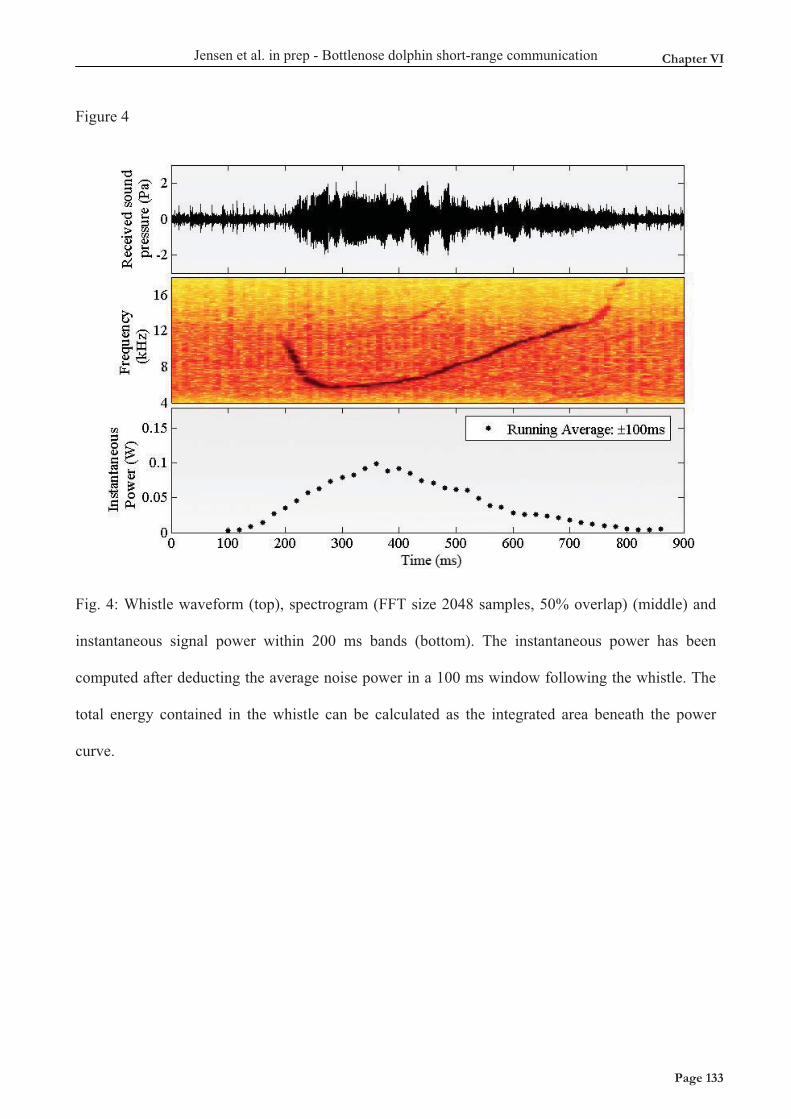
Jensen et al. in prep - Bottlenose dolphin short-range communication
Figure 4
Fig. 4: Whistle waveform (top), spectrogram (FFT size 2048 samples, 50% overlap) (middle) and
instantaneous signal power within 200 ms bands (bottom). The instantaneous power has been
computed after deducting the average noise power in a 100 ms window following the whistle. The
total energy contained in the whistle can be calculated as the integrated area beneath the power
curve.
Chapter VI
Page 133Page 133
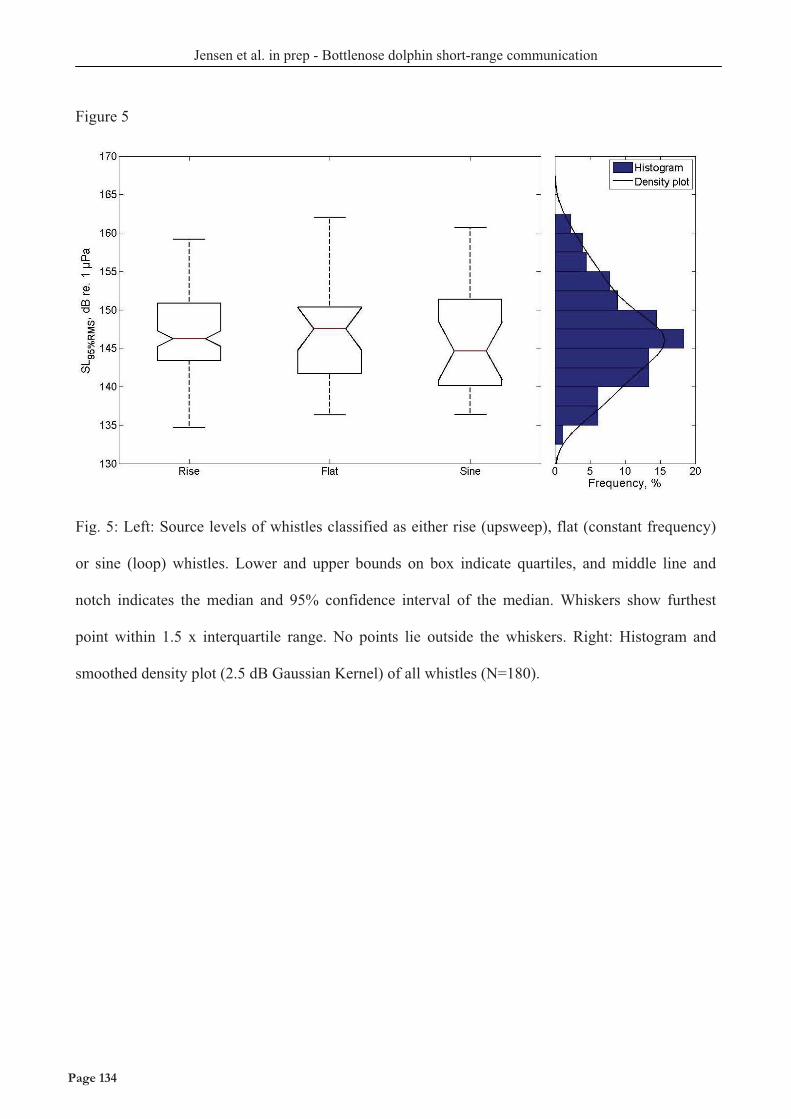
Jensen et al. in prep - Bottlenose dolphin short-range communication
Figure 5
Fig. 5: Left: Source levels of whistles classified as either rise (upsweep), flat (constant frequency)
or sine (loop) whistles. Lower and upper bounds on box indicate quartiles, and middle line and
notch indicates the median and 95% confidence interval of the median. Whiskers show furthest
point within 1.5 x interquartile range. No points lie outside the whiskers. Right: Histogram and
smoothed density plot (2.5 dB Gaussian Kernel) of all whistles (N=180).
Page 134Page 134
Jensen et al. in prep - Bottlenose dolphin short-range communication
REFERENCES
Anderson, C. and McShea, D. W. (2001). Individual versus social complexity, with particular
reference to ant colonies. Biological Reviews 76, 211-237.
Au, W. W. L. (1993). The Sonar of Dolphins: New York: Springer Verlag.
Au, W. W. L., Carder, D. A., Penner, R. H. and Scronce, B. L. (1985). Demonstration of
adaptation in beluga whale echolocation signals. The Journal of the Acoustical Society of America
77, 726-730.
Blumenrath, S. H. and Dabelsteen, T. (2004). Degradation of great tit (Parus major) song before
and after foliation: Implications for vocal communication in a deciduous forest. Behaviour 141,
935-958.
Boinski, S. (1993). Vocal coordination of troop movement among white-faced capuchin monkeys,
Cebus capucinus. American Journal of Primatology 30, 85-100.
Branstetter, B. K. and Finneran, J. J. (2008). Comodulation masking release in bottlenose
dolphins (Tursiops truncatus). The Journal of the Acoustical Society of America 124, 625-633.
Brenowitz, E. A. (1982). Long-range communication of species identity by song in the Red-winged
Blackbird. Behavioral Ecology and Sociobiology 10, 29-38.
Brumm, H. (2004). The impact of environmental noise on song amplitude in a territorial bird.
Journal of Animal Ecology 73, 434-440.
Brumm, H. and Slabbekoorn, H. (2005). Acoustic communication in noise. In Advances in the
Study of Behavior, vol. 35, pp. 151-209. San Diego: Elsevier Academic Press Inc.
Casper, B. M. and Mann, D. A. (2009). Field hearing measurements of the Atlantic sharpnose
shark Rhizoprionodon terraenovae. Journal of Fish Biology 75, 2768-2776.
Cockroft, V. G. and Ross, G. J. B. (1990). Age, growth, and reproduction of bottlenose dolphins
Tursiops truncatus from the east coast of southern Africa. Fishery Bulletin 88, 289-302.
Connor, R. C., Smolker, R. A. and Richards, A. F. (1992). Two levels of alliance formation
among male bottlenose dolphins (Tursiops Sp). Proceedings of the National Academy of Sciences
89, 987-990.
Connor, R. C., Wells, R. S., Mann, J. and Read, A. J. (2000). The Bottlenose Dolphin. In
Cetacean Societies: Field studies of whales and dolphins, (eds. J. Mann R. C. Connor P. L. Tyack
and H. Whitehead). Chicago: Univ. Chicago Press.
Cortopassi, K. A. and Bradbury, J. W. (2006). Contact call diversity in wild orange-fronted
parakeet pairs, Aratinga canicularis. Animal Behaviour 71, 1141-1154.
Chapter VI
Page 135Page 135
Jensen et al. in prep - Bottlenose dolphin short-range communication
Da Cunha, R. G. T. and Byrne, R. W. (2009). The use of vocal communication in keeping the
spatial cohesion of groups: Intentionality and specific functions. In South American Primates, (eds.
P. A. Garber A. Estrada J. C. Bicca-Marques E. W. Heymann and K. B. Strier), pp. 341-363:
Springer New York.
Dabelsteen, T., Larsen, O. N. and Pedersen, S. B. (1993). Habitat-induced degradation of sound
signals - quantifying the effects of communication sounds and bird location on blur ratio, excess
attenuation, and signal-to-noise ratio in blackbird song. Journal of the Acoustical Society of
America 93, 2206-2220.
Deecke, V. B., Ford, J. K. B. and Slater, P. J. B. (2005). The vocal behaviour of mammal-eating
killer whales: communicating with costly calls. Animal Behaviour 69, 395-405.
Deecke, V. B., Ford, J. K. B. and Spong, P. (1999). Quantifying complex patterns of bioacoustic
variation: Use of a neural network to compare killer whale (Orcinus orca) dialects. Journal of the
Acoustical Society of America 105, 2499-2507.
Deecke, V. B., Slater, P. J. B. and Ford, J. K. B. (2002). Selective habituation shapes acoustic
predator recognition in harbour seals. Nature 420, 171-173.
Esch, H. C., Sayigh, L. S. and Wells, R. S. (2009). Quantifying parameters of bottlenose dolphin
signature whistles. Marine Mammal Science 25, 976-986.
Fletcher, H. (1940). Auditory Patterns. Reviews of Modern Physics 12, 47.
Fraser, F. C. (1974). Report on Cetacea stranded on the British coasts from 1948-1966.
Publications of the British Museum of Natural History 14.
Garstang, M., Larom, D., Raspet, R. and Lindeque, M. (1995). Atmospheric controls on
elephant communication. Journal of Experimental Biology 198, 939-951.
Gillooly, J. F. and Ophir, A. G. (2010). The energetic basis of acoustic communication.
Proceedings of the Royal Society B 277, 1325-1331.
Gowans, S., Würsig, B., Karczmarski, L. and David, W. S. (2007). The social structure and
strategies of delphinids: Predictions based on an ecological framework. Advances in marine biology
53, 195-294.
Hale, P. T., Barreto, A. S. and Ross, G. J. B. (2000). Comparative morphology and distribution of
the aduncus and truncatus forms of bottlenose dolphin Tursiops in the Indian and Western Pacific
Oceans. Aquatic Mammals 26, 101-110.
Hall, J. W., Haggard, M. P. and Fernandes, M. A. (1984). Detection in noise by spectro-
temporal pattern analysis. The Journal of the Acoustical Society of America 76, 50-56.
Page 136Page 136
Jensen et al. in prep - Bottlenose dolphin short-range communication
Hamilton, W. D. (1964). The genetical evolution of social behaviour. II. Journal of Theoretical
Biology 7, 17-52.
Heithaus, M. R. (2001). Predator-prey and competitive interactions between sharks (order Selachii)
and dolphins (suborder Odontoceti): a review. Journal of Zoology 253, 53-68.
Herzing, D. L. (2000). Acoustics and social behavior of wild dolphins: implications for a sound
society. In Hearing by whales and dolphins, (eds. W. W. L. Au A. N. Popper and R. E. Fay).
London: Springer Press.
Holt, M. M., Noren, D. P., Veirs, V., Emmons, C. K. and Veirs, S. (2009). Speaking up: Killer
whales (Orcinus orca) increase their call amplitude in response to vessel noise. The Journal of the
Acoustical Society of America 125, EL27-EL32.
Janik, V., Todt, D. and Dehnhardt, G. (1994). Signature whistle variations in a bottlenosed
dolphin, Tursiops truncatus. Behavioral Ecology and Sociobiology 35, 243-248.
Janik, V. M. (2000). Source levels and the estimated active space of bottlenose dolphin (Tursiops
truncatus) whistles in the Moray Firth, Scotland. Journal of comparative physiology A 186, 673-
680.
Janik, V. M. (2005). Underwater acoustic communication networks in marine mammals. In Animal
Communication Networks, (ed. P. K. McGregor). Cambridge: Cambridge University Press.
Janik, V. M., Sayigh, L. S. and Wells, R. S. (2006). Signature whistle shape conveys identity
information to bottlenose dolphins. Proceedings of the National Academy of Sciences of the United
States of America 103, 8293-8297.
Janik, V. M. and Slater, P. J. (1998). Context-specific use suggests that bottlenose dolphin
signature whistles are cohesion calls. Animal Behaviour 56, 829-838.
Jensen, F. H., Bejder, L., Wahlberg, M., Soto, N. A., Johnson, M. and Madsen, P. T. (2009).
Vessel noise effects on delphinid communication. Marine Ecology Progress Series 395, 161-175.
Johnson, C. S. (1968a). Masked tonal thresholds in bottlenosed porpoise. Journal of the Acoustical
Society of America 44, 965-967.
Johnson, C. S. (1968b). Relation between absolute threshold and duration-of-tone pulses in the
bottlenosed porpoise. The Journal of the Acoustical Society of America 43, 757-763.
Knudsen, V. O., Alford, R. S. and Emling, J. W. (1948). Underwater ambient noise. Journal of
marine research 7, 410-429.
Krebs, J. R. and Davies, N. B. (1993). An introduction to behavioural ecology: Blackwell
Publishing.
Chapter VI
Page 137Page 137
Jensen et al. in prep - Bottlenose dolphin short-range communication
Lammers, M. O. and Au, W. W. L. (2003). Directionality in the whistles of Hawaiian spinner
dolphins (Stenella longirostris): A signal feature to cue direction of movement? Marine Mammal
Science 19, 249-264.
Lockyer, C. and Morris, R. J. (1985). A wild but sociable dolphin off Portreath, north Cornwall.
Journal of Zoology 207, 605-607.
Madsen, P. T. and Wahlberg, M. (2007). Recording and quantification of ultrasonic echolocation
clicks from free-ranging toothed whales. Deep-Sea Research Part I - Oceanographic Research
Papers 54, 1421-1444.
Madsen, P. T., Wahlberg, M., Tougaard, J., Lucke, K. and Tyack, P. (2006). Wind turbine
underwater noise and marine mammals: implications of current knowledge and data needs. Marine
Ecology Progress Series 309, 279-295.
Marsh, H. W. and Schulkin, M. (1962). Shallow-water transmission. Journal of the Acoustical
Society of America 34, 863-&.
Marten, K. and Marler, P. (1977). Sound transmission and its significance for animal
vocalization. Behavioral Ecology and Sociobiology 2, 271-290.
McComb, K., Moss, C., Sayialel, S. and Baker, L. (2000). Unusually extensive networks of vocal
recognition in African elephants. Animal Behaviour 59, 1103-1109.
McComb, K., Reby, D., Baker, L., Moss, C. and Sayialel, S. (2003). Long-distance
communication of acoustic cues to social identity in African elephants. Animal Behaviour 65, 317-
329.
McConnell, S. O., Schilt, M. P. and Dworski, J. G. (1992). Ambient noise measurements from
100 Hz to 80 kHz in an Alaskan fjord. The Journal of the Acoustical Society of America 91, 1990-
2003.
McGregor, P. K. (2005). Animal Communication Networks. Cambridge: Cambridge University
Press.
Miller, P. (2006). Diversity in sound pressure levels and estimated active space of resident killer
whale vocalizations. Journal of Comparative Physiology A: Neuroethology, Sensory, Neural, and
Behavioral Physiology 192, 449-459.
Morisaka, T. and Connor, R. C. (2007). Predation by killer whales (Orcinus orca) and the
evolution of whistle loss and narrow-band high frequency clicks in odontocetes. Journal of
Evolutionary Biology 20, 1439-1458.
Page 138Page 138
Jensen et al. in prep - Bottlenose dolphin short-range communication
Møhl, B., Wahlberg, M. and Heerfordt, A. (2001). A large-aperture array of nonlinked receivers
for acoustic positioning of biological sound sources. Journal of the Acoustical Society of America
109, 434-437.
Nakano, R., Takanashi, T., Fujii, T., Skals, N., Surlykke, A. and Ishikawa, Y. (2009). Moths
are not silent, but whisper ultrasonic courtship songs. Journal of Experimental Biology 212, 4072-
4078.
Norris, K. S. and Schilt, C. R. (1988). Cooperative societies in three-dimensional space - on the
origins of aggregations, flocks, and schools, with special reference to dolphins and fish. Ethology
and Sociobiology 9, 149-179.
Ophir, A. G., Schrader, S. B. and Gillooly, J. F. (2010). Energetic cost of calling: general
constraints and species-specific differences. Journal of Evolutionary Biology 23, 1564-1569.
Payne, R. and Webb, D. (1971). Orientation by means of long range acoustic signalling in baleen
whales. Annals of the New York Academy of Sciences 188, 110-141.
Piggott, C. L. (1964). Ambient sea noise at low frequencies in shallow water of the scotian shelf.
The Journal of the Acoustical Society of America 36, 2152-2163.
Poikonen, A. and Madekivi, S. (2010). Wind-generated ambient noise in a shallow brackish water
environment in the archipelago of the Gulf of Finland. The Journal of the Acoustical Society of
America 127, 3385-3393.
Poikonen, A. A. (2010). High-frequency wind-driven ambient noise in shallow brackish water:
Measurements and spectra. The Journal of the Acoustical Society of America 128, EL242-EL247.
Prestwich, K. N., Brugger, K. E. and Topping, M. (1989). Energy and communication in three
species of hylid frogs - power input, power output and efficiency. Journal of Experimental Biology
144, 53-80.
Quintana-Rizzo, E., Mann, D. A. and Wells, R. S. (2006). Estimated communication range of
social sounds used by bottlenose dolphins (Tursiops truncatus). The Journal of the Acoustical
Society of America 120, 1671-1683.
Rasmussen, M. H., Lammers, M., Beedholm, K. and Miller, L. A. (2006). Source levels and
harmonic content of whistles in white-beaked dolphins (Lagenorhynchus albirostris). Journal of the
Acoustical Society of America 120, 510-517.
Reeves, R. R., Stewart, B. S., Clapham, P. J. and Powell, J. A. (2002). Sea mammals of the
world: A complete guide to whales, dolphins, seals, sea lions and sea cows. London: A & C Black.
Ryan, M. J., Tuttle, M. D. and Rand, A. S. (1982). Bat predation and sexual advertisement in a
neotropical anuran. American Naturalist 119, 136-139.
Chapter VI
Page 139Page 139
Jensen et al. in prep - Bottlenose dolphin short-range communication
Sayigh, L. S., Tyack, P. L., Wells, R. S., Solow, A. R., Scott, M. D. and Irvine, A. B. (1999).
Individual recognition in wild bottlenose dolphins: a field test using playback experiments. Animal
Behaviour 57, 41-50.
Sinnott, J. M., Stebbins, W. C. and Moody, D. B. (1975). Regulation of voice amplitude by the
monkey. The Journal of the Acoustical Society of America 58, 412-414.
Spiesberger, J. L. and Fristrup, K. M. (1990). Passive localization of calling animals and sensing
of their acoustic environment using acoustic tomography. American Naturalist 135, 107-153.
Strain, J. G. and Mumme, R. L. (1988). Effects of food supplementation, song playback, and
temperature on vocal territorial behavior of Carolina Wrens. Auk 105, 11-16.
Trickey, J. S., Branstetter, B. K. and Finneran, J. J. (2010). Auditory masking of a 10 kHz tone
with environmental, comodulated, and Gaussian noise in bottlenose dolphins (Tursiops truncatus).
The Journal of the Acoustical Society of America 128, 3799-3804.
Tyack, P. L. (2000). Functional aspects of cetacean communication. In Cetacean societies: field
studies of dolphins and whales, (eds. J. Mann R. C. Connor P. L. Tyack and H. Whitehead).
Chicago: Univ. Chicago Press.
Tyack, P. L. (2008). Convergence of Calls as Animals Form Social Bonds, Active Compensation
for Noisy Communication Channels, and the Evolution of Vocal Learning in Mammals. Journal of
Comparative Psychology 122, 319-331.
Urick, R. J. (1983). Principles of Underwater Sound: Peninsula, Los Altos.
Wahlberg, M., Mohl, B. and Madsen, P. T. (2001). Estimating source position accuracy of a
large-aperture hydrophone array for bioacoustics. Journal of the Acoustical Society of America 109,
397-406.
Watwood, S. L., Tyack, P. L. and Wells, R. S. (2004). Whistle sharing in paired male bottlenose
dolphins, Tursiops truncatus. Behavioral Ecology and Sociobiology 55, 531-543.
Welch, P. D. (1967). Use of Fast Fourier Transform for estimation of power spectra - a method
based on time averaging over short modified periodograms. IEEE Transactions on Audio and
Electroacoustics AU-15, 70-73.
Wells, R. S. and Scott, M. D. (1999). Bottlenose dolphin Tursiops truncatus (Montagu, 1821). In
Handbook of marine mammals, vol. 6 (eds. S. H. Ridgway and R. Harrison). San Diego: Academic
Press.
Wenz, G. M. (1962). Acoustic ambient noise in ocean - spectra and sources. Journal of the
Acoustical Society of America 34, 1936-1956.
Page 140Page 140

Jensen et al. in prep - Bottlenose dolphin short-range communication
Williams, T. M., Friedl, W. A. and Haun, J. E. (1993). The physiology of bottlenosed dolphins
(Tursiops truncatus) - Heart rate, metabolic rate and plasma lactate concentration during exercise.
Journal of Experimental Biology 179, 31-46.
Chapter VI
Page 141Page 141

Jensen et al. in prep - Bottlenose dolphin short-range communication
Page 142Page 142
Jensen et al. 2011 - Pilot whale social calls at depth
1
2
3
4
5
6
7
8
9
10
11
12
13
14
15
16
17
18
19
20
21
22
Calling under pressure:
Short-finned pilot whales make social calls during deep foraging dives
Frants H. Jensen1*, Jacobo Marrero Perez2, Mark Johnson3,
Natacha Aguilar Soto2,4, Peter T. Madsen1,3
1 Zoophysiology, Department of Biological Sciences, Aarhus University, 8000 Aarhus, Denmark.
2 BIOECOMAC, Dept. Animal Biology, La Laguna University, La Laguna 38206, Tenerife, Spain
3 Woods Hole Oceanographic Institution, Woods Hole, MA 02543, USA.
4 Leigh Marine Laboratory, University of Auckland, New Zealand
*Corresponding author:
Short title: Pilot whale social calls at depth
Chapter VII
Page 143Page 143
Jensen et al. 2011 - Pilot whale social calls at depth
Summary 23
24
25
26
27
28
29
30
31
32
33
34
35
36
37
38
39
40
Toothed whales rely on sound to echolocate prey and communicate with conspecifics, but little is
known about how extreme pressure affects pneumatic sound production in deep-diving species with
a limited air supply. The short-finned pilot whale (Globicephala macrorhynchus) is a highly social
species among the deep diving toothed whales, in which individuals socialize at the surface but
leave their social group in pursuit of prey at depths of up to 1000m. To investigate if these animals
communicate acoustically at depth and test whether hydrostatic pressure affects communication
signals, acoustic DTAGs logging sound, depth and orientation were attached to 12 pilot whales.
Tagged whales produced tonal calls during deep foraging dives at depths of up to 800 meters. Mean
call output and duration decreased with depth despite the increased distance to conspecifics at the
surface. This shows that the energy content of calls is lower at depths where lungs are collapsed and
where the air volume available for sound generation is limited by ambient pressure. Frequency
content was unaffected, providing a possible cue for group or species identification of diving
whales. Social calls may be important to maintain social ties for foraging animals, but may be
impacted adversely by vessel noise.
Keywords:
Communication, sound production, social organization, pilot whales, acoustic tags, ecophysiology
Page 144Page 144
Jensen et al. 2011 - Pilot whale social calls at depth
Introduction 41
42
43
44
45
46
47
48
49
50
51
52
53
54
55
56
57
58
59
60
61
62
63
64
65
66
67
68
69
70
71
72
Environmental conditions affect the production and propagation of sound and hence play a role in
the evolution of acoustic signalling in animals. Ambient temperature influences the sound
production of poikilotherm animals, and changes in frequency, duration and amplitude of calls in
response to temperature variations have been documented for various phyla such as insects [1; 2],
frogs [3; 4] and fish [5]. Some endotherm mammals may have juveniles that are unable to maintain
a constant body temperature, and where temperature variations may influence the production of
signals such as the isolation calls of vespertillionid bat pups [6]. However, most birds and mammals
are functionally homeotherm and their sound production system is consequently unaffected by local
temperature variations. In these species, signal characteristics mainly reflect adaptations to
environmental differences in sound attenuation, reverberation and ambient noise levels that
optimize the transmission distance of the signal [7; 8]. However, some mammals have adapted to
habitats of extreme pressure that may also affect their sound production. Toothed whales,
comprising around 72 extant species, produce a variety of acoustic signals to communicate with
conspecifics as well as to navigate and find prey at depths that may exceed 1000m [9]. This raises
the question of how the large span in hydrostatic pressure might affect air driven sound production
in these marine mammals that rely on sound for foraging and communication in the deep sea [10].
Most toothed whales produce dedicated tonal signals for communication and clicks for
echolocation. Echolocation clicks are produced pneumatically by forcing pressurized air from
ventral nasal passages past the phonic lips [11; 12]. Each time the phonic lips separate, a small
volume of air is passed through the phonic lips into vestibular air sacs [13]. When whales are
submerged, they must recycle air in their nasal system to maintain continued sound production [14].
In contrast to echolocation signals, little is known about how tonal sounds are generated and
coupled to the environment. Presumably, tonal sounds arise when phonic lips vibrate continuously
instead of separating in discrete instances as in click generation [12; 15]. This has been corroborated
by studies showing that, at least at atmospheric pressure, a higher nasal pressure and more air
volume is required to generate tonal sounds compared to echolocation clicks [16; 17].
As a whale dives, hydrostatic pressure increases with depth and air volumes in the body are
compressed following Boyle’s Law. Alveolar collapse is estimated to occur in bottlenose dolphins
around 70-100m depth [18; 19], and the remaining compressed air volume is shunted to the less
Chapter VII
Page 145Page 145
Jensen et al. 2011 - Pilot whale social calls at depth
73
74
75
76
77
78
79
80
81
82
83
84
85
86
87
88
89
90
91
92
93
94
95
96
97
98
99
100
101
102
103
compressible nasal passages where it is available for sound production [14; 20] and where it
continues to be further compressed as the whale descends. Diving toothed whales therefore face the
challenge of producing echolocation clicks, and possibly communication sounds, with a dwindling
supply of air available for pneumatic sound production. Several tag studies have demonstrated that
the production of echolocation clicks can be maintained during very deep dives [20-22], but whales
seem to recycle air more often at depth where remaining air volume is smaller [23]. Tonal sounds
are longer and require a greater nasal pressure to produce than do echolocation clicks [16; 17]. It
would therefore follow that tonal sounds would more likely be affected by depth. In the only study
addressing production of communication sounds at depth so far, Ridgway and colleagues found that
whistle amplitude generally decreased with depth for two beluga whales trained to emit a response
whistle, and that one animal was seemingly unable to produce whistles at 300m [10]. This suggests
that deep diving social toothed whales may have difficulty producing whistles and maintaining
acoustic communication during deep dives.
The short-finned pilot whale (Globicephala macrorhynchus) is an example of a social, deep-diving
toothed whale with long-lasting inter-individual associations within their social group [24]. It has
been hypothesized that these groups are similar to the matriarchal groups found in the related long-
finned pilot whales [25; 26] and resident killer whales [27; 28]. Recent studies using acoustic tags
have shown that short-finned pilot whales make deep daytime foraging dives exceeding 1000m
[29], and indicate that the whales forage individually or in small groups [30]. Although pilot whales
are known to be highly vocal when socializing at the surface, nothing is known about the effects of
extreme pressure on pneumatic sound production and how the deep-diving ecology of pilot whales
may have shaped the evolution of their acoustic communication capacity. The Ridgway et al. (2001)
study suggests that deep-diving toothed whales are impeded in their ability to produce tonal
communication sounds at depth and may even be unable to produce tonal communication signals
below a certain depth. Here we test this hypothesis by analyzing data from sound and orientation
recording DTAGs [31] on short-finned pilot whales in the wild. We show that short-finned pilot
whales produce communication calls during deep foraging dives down to depths greater than 800
meters. We demonstrate that the energy output of calls at great depths is reduced by an order of
magnitude, and that the calls are shorter at depth compared to shallow calls, but do not seem to be
restricted in frequency content. We discuss these findings in the light of models for pneumatic
Page 146Page 146
Jensen et al. 2011 - Pilot whale social calls at depth
104
105
106
107
108
109
110
111
112
113
114
115
116
117
118
119
120
121
122
123
124
125
126
127
128
129
130
131
132
133
134
135
sound production, and address implications of these effects on the function of acoustic
communication and foraging ecology at depth in this highly social delphinid.
Materials and methods
Two tagging cruises were conducted in the spring of 2006 and 2008 off the south-west coast of
Tenerife, Canary Islands, where there is a resident population of G. macrorhynchus [24]. DTAGs
[31] were attached with suction cups to record sound (two channels, 96 or 192 kHz sampling rate
per channel, 16-bit resolution), 3D orientation (derived from three-axis accelerometers and
magnetometers) and depth of the tagged pilot whales.
Sound recordings were analysed using Matlab 6.5 (Mathworks) to identify the time and depth of
vocalizations from the tagged animal. Vocalizations were broadly classified into tonal, intermediate
and pulsed sounds [32] based on visual inspection of the waveforms and spectrograms of each call.
Vocalizations from the tagged animal were discriminated from conspecific vocalizations based on
their increased low-frequency content (propagating through the body of the tagged whale but poorly
coupled to the surrounding water) and generally higher received levels [9]. Subsequently, each call
was cross-correlated between the two tag hydrophones (separation 23 mm) to get an estimate of the
angle-of-arrival of the call. If conspecific clicks or extraneous noise sources overlapped with the
call, an angle-of-arrival was found by using interference-free parts of calls for cross-correlation.
Calls were only accepted if angle-of-arrival could be measured unambiguously. For each whale,
vocalizations initially classified as tagged whale sounds but with an angle-of-arrival more than 10
degrees from the mean angle-of-arrival of calls produced by that whale were discarded from the
analysis to reduce the possibility of including calls from conspecifics [9; 33]. Despite these
analytical steps, it cannot be entirely excluded that some conspecific calls may have been
erroneously classified as tagged whale calls. However, the high received levels of these calls
indicate that they were produced near the tagged whale and so would be subject to similar depth
effects. Furthermore, given the number of calls investigated here, it is unlikely that a few
misclassifications would change the overall conclusions.
All tonal calls interpreted as produced by the tagged whale during deep dives were filtered with a 6-
pole variable high-pass filter (low-frequency cutoff between 500 and 2000 Hz, but always well
below the minimum fundamental frequency) to reduce flow noise from the recording. A root-mean-
Chapter VII
Page 147Page 147
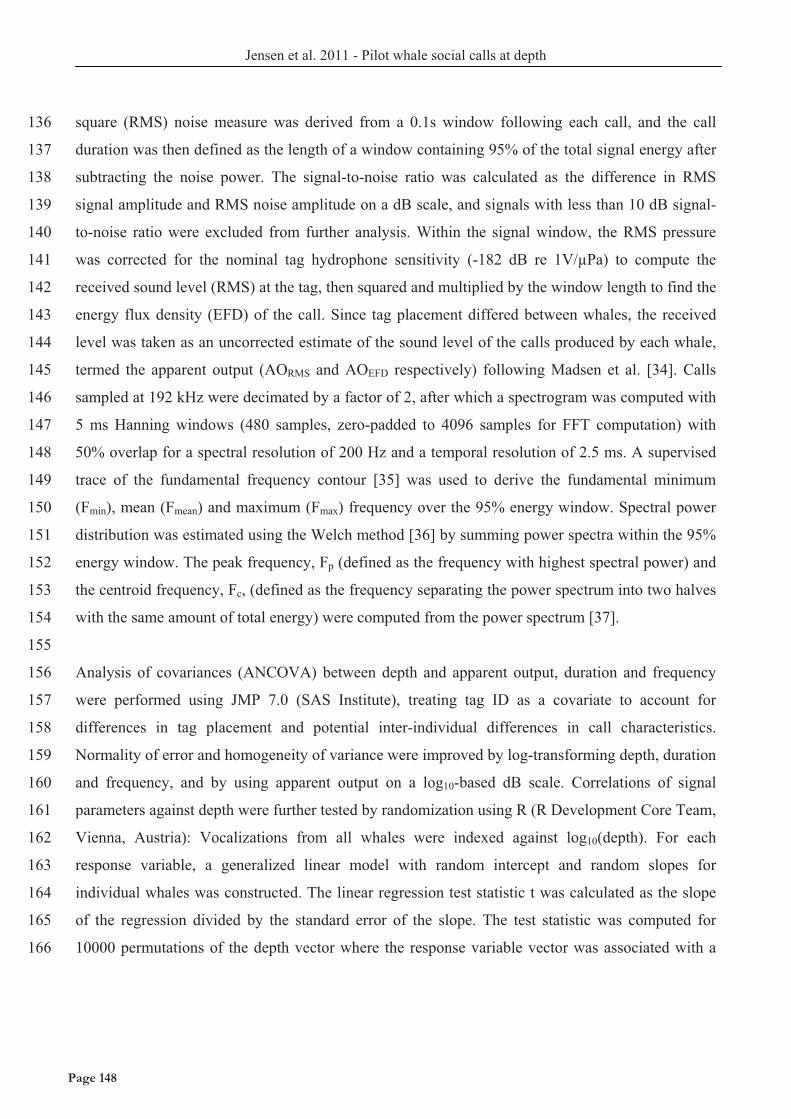
Jensen et al. 2011 - Pilot whale social calls at depth
136
137
138
139
140
141
142
143
144
145
146
147
148
149
150
151
152
153
154
155
156
157
158
159
160
161
162
163
164
165
166
square (RMS) noise measure was derived from a 0.1s window following each call, and the call
duration was then defined as the length of a window containing 95% of the total signal energy after
subtracting the noise power. The signal-to-noise ratio was calculated as the difference in RMS
signal amplitude and RMS noise amplitude on a dB scale, and signals with less than 10 dB signal-
to-noise ratio were excluded from further analysis. Within the signal window, the RMS pressure
was corrected for the nominal tag hydrophone sensitivity (-182 dB re 1V/μPa) to compute the
received sound level (RMS) at the tag, then squared and multiplied by the window length to find the
energy flux density (EFD) of the call. Since tag placement differed between whales, the received
level was taken as an uncorrected estimate of the sound level of the calls produced by each whale,
termed the apparent output (AORMS and AOEFD respectively) following Madsen et al. [34]. Calls
sampled at 192 kHz were decimated by a factor of 2, after which a spectrogram was computed with
5 ms Hanning windows (480 samples, zero-padded to 4096 samples for FFT computation) with
50% overlap for a spectral resolution of 200 Hz and a temporal resolution of 2.5 ms. A supervised
trace of the fundamental frequency contour [35] was used to derive the fundamental minimum
(Fmin), mean (Fmean) and maximum (Fmax) frequency over the 95% energy window. Spectral power
distribution was estimated using the Welch method [36] by summing power spectra within the 95%
energy window. The peak frequency, Fp (defined as the frequency with highest spectral power) and
the centroid frequency, Fc, (defined as the frequency separating the power spectrum into two halves
with the same amount of total energy) were computed from the power spectrum [37].
Analysis of covariances (ANCOVA) between depth and apparent output, duration and frequency
were performed using JMP 7.0 (SAS Institute), treating tag ID as a covariate to account for
differences in tag placement and potential inter-individual differences in call characteristics.
Normality of error and homogeneity of variance were improved by log-transforming depth, duration
and frequency, and by using apparent output on a log10-based dB scale. Correlations of signal
parameters against depth were further tested by randomization using R (R Development Core Team,
Vienna, Austria): Vocalizations from all whales were indexed against log10(depth). For each
response variable, a generalized linear model with random intercept and random slopes for
individual whales was constructed. The linear regression test statistic t was calculated as the slope
of the regression divided by the standard error of the slope. The test statistic was computed for
10000 permutations of the depth vector where the response variable vector was associated with a
Page 148Page 148
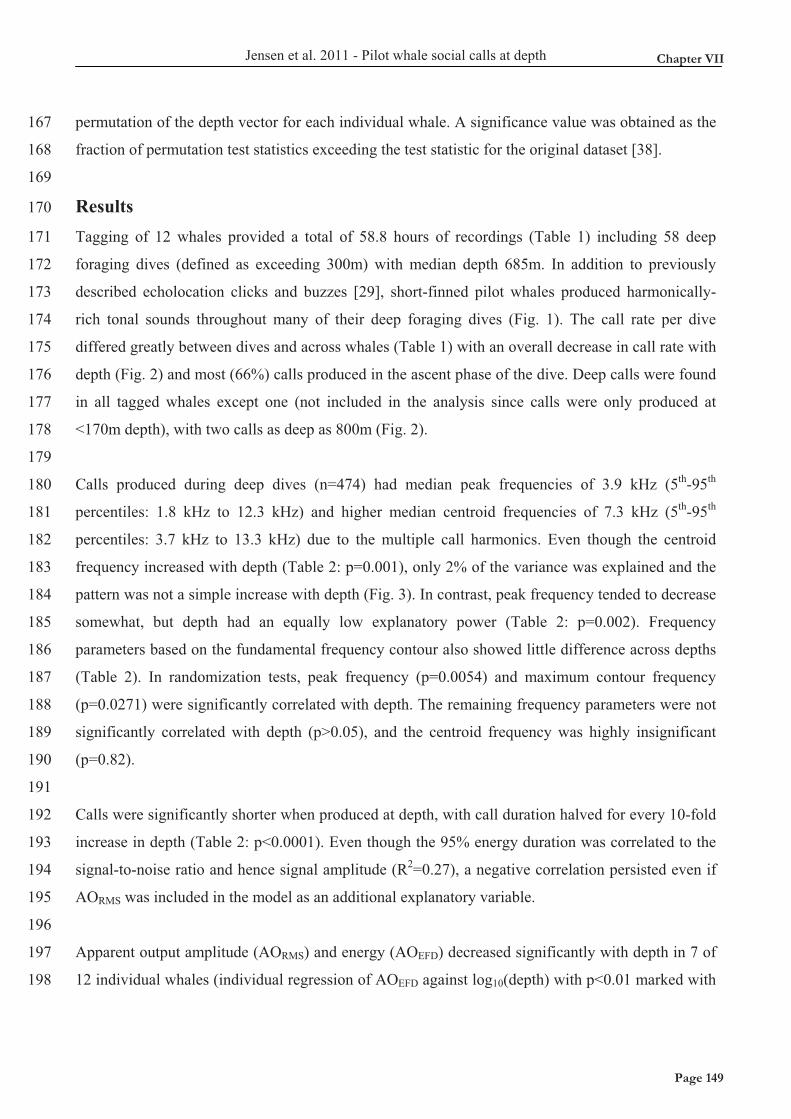
Jensen et al. 2011 - Pilot whale social calls at depth
167
168
169
170
171
172
173
174
175
176
177
178
179
180
181
182
183
184
185
186
187
188
189
190
191
192
193
194
195
196
197
198
permutation of the depth vector for each individual whale. A significance value was obtained as the
fraction of permutation test statistics exceeding the test statistic for the original dataset [38].
Results
Tagging of 12 whales provided a total of 58.8 hours of recordings (Table 1) including 58 deep
foraging dives (defined as exceeding 300m) with median depth 685m. In addition to previously
described echolocation clicks and buzzes [29], short-finned pilot whales produced harmonically-
rich tonal sounds throughout many of their deep foraging dives (Fig. 1). The call rate per dive
differed greatly between dives and across whales (Table 1) with an overall decrease in call rate with
depth (Fig. 2) and most (66%) calls produced in the ascent phase of the dive. Deep calls were found
in all tagged whales except one (not included in the analysis since calls were only produced at
<170m depth), with two calls as deep as 800m (Fig. 2).
Calls produced during deep dives (n=474) had median peak frequencies of 3.9 kHz (5th-95th
percentiles: 1.8 kHz to 12.3 kHz) and higher median centroid frequencies of 7.3 kHz (5th-95th
percentiles: 3.7 kHz to 13.3 kHz) due to the multiple call harmonics. Even though the centroid
frequency increased with depth (Table 2: p=0.001), only 2% of the variance was explained and the
pattern was not a simple increase with depth (Fig. 3). In contrast, peak frequency tended to decrease
somewhat, but depth had an equally low explanatory power (Table 2: p=0.002). Frequency
parameters based on the fundamental frequency contour also showed little difference across depths
(Table 2). In randomization tests, peak frequency (p=0.0054) and maximum contour frequency
(p=0.0271) were significantly correlated with depth. The remaining frequency parameters were not
significantly correlated with depth (p>0.05), and the centroid frequency was highly insignificant
(p=0.82).
Calls were significantly shorter when produced at depth, with call duration halved for every 10-fold
increase in depth (Table 2: p<0.0001). Even though the 95% energy duration was correlated to the
signal-to-noise ratio and hence signal amplitude (R2=0.27), a negative correlation persisted even if
AORMS was included in the model as an additional explanatory variable.
Apparent output amplitude (AORMS) and energy (AOEFD) decreased significantly with depth in 7 of
12 individual whales (individual regression of AOEFD against log10(depth) with p<0.01 marked with
Chapter VII
Page 149Page 149
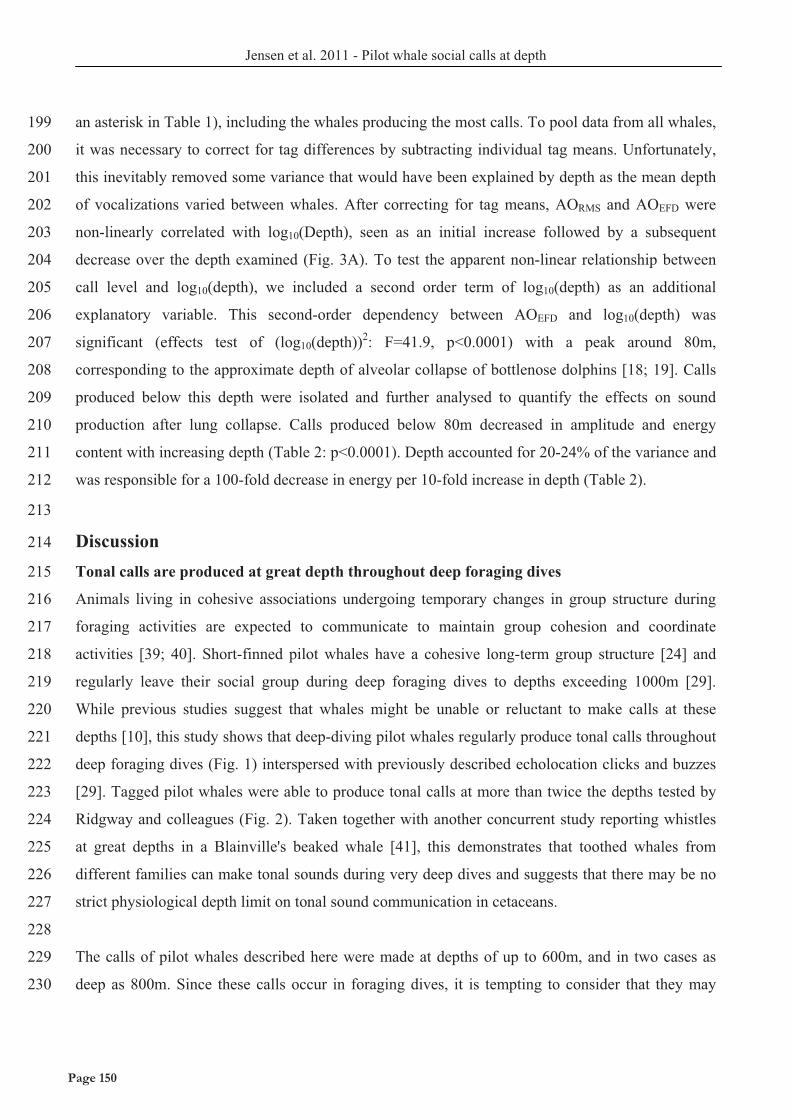
Jensen et al. 2011 - Pilot whale social calls at depth
199
200
201
202
203
204
205
206
207
208
209
210
211
212
213
214
215
216
217
218
219
220
221
222
223
224
225
226
227
228
229
230
an asterisk in Table 1), including the whales producing the most calls. To pool data from all whales,
it was necessary to correct for tag differences by subtracting individual tag means. Unfortunately,
this inevitably removed some variance that would have been explained by depth as the mean depth
of vocalizations varied between whales. After correcting for tag means, AORMS and AOEFD were
non-linearly correlated with log10(Depth), seen as an initial increase followed by a subsequent
decrease over the depth examined (Fig. 3A). To test the apparent non-linear relationship between
call level and log10(depth), we included a second order term of log10(depth) as an additional
explanatory variable. This second-order dependency between AOEFD and log10(depth) was
significant (effects test of (log10(depth))2: F=41.9, p<0.0001) with a peak around 80m,
corresponding to the approximate depth of alveolar collapse of bottlenose dolphins [18; 19]. Calls
produced below this depth were isolated and further analysed to quantify the effects on sound
production after lung collapse. Calls produced below 80m decreased in amplitude and energy
content with increasing depth (Table 2: p<0.0001). Depth accounted for 20-24% of the variance and
was responsible for a 100-fold decrease in energy per 10-fold increase in depth (Table 2).
Discussion
Tonal calls are produced at great depth throughout deep foraging dives
Animals living in cohesive associations undergoing temporary changes in group structure during
foraging activities are expected to communicate to maintain group cohesion and coordinate
activities [39; 40]. Short-finned pilot whales have a cohesive long-term group structure [24] and
regularly leave their social group during deep foraging dives to depths exceeding 1000m [29].
While previous studies suggest that whales might be unable or reluctant to make calls at these
depths [10], this study shows that deep-diving pilot whales regularly produce tonal calls throughout
deep foraging dives (Fig. 1) interspersed with previously described echolocation clicks and buzzes
[29]. Tagged pilot whales were able to produce tonal calls at more than twice the depths tested by
Ridgway and colleagues (Fig. 2). Taken together with another concurrent study reporting whistles
at great depths in a Blainville's beaked whale [41], this demonstrates that toothed whales from
different families can make tonal sounds during very deep dives and suggests that there may be no
strict physiological depth limit on tonal sound communication in cetaceans.
The calls of pilot whales described here were made at depths of up to 600m, and in two cases as
deep as 800m. Since these calls occur in foraging dives, it is tempting to consider that they may
Page 150Page 150
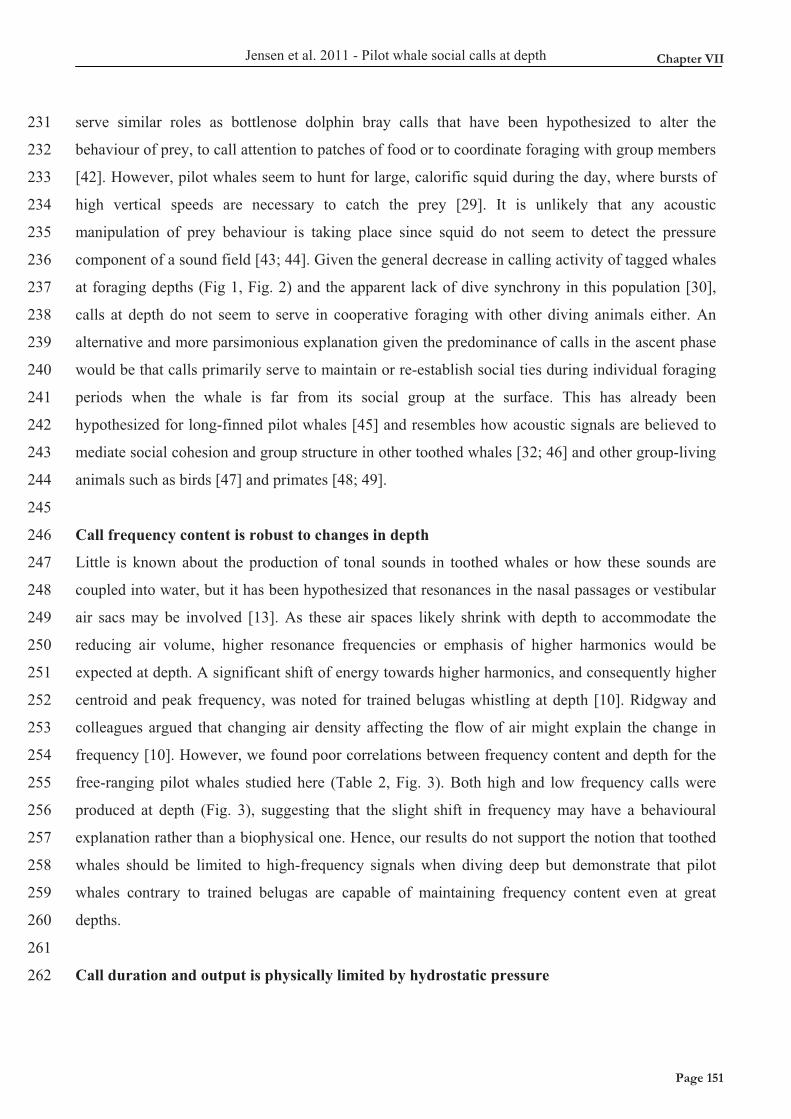
Jensen et al. 2011 - Pilot whale social calls at depth
231
232
233
234
235
236
237
238
239
240
241
242
243
244
245
246
247
248
249
250
251
252
253
254
255
256
257
258
259
260
261
262
serve similar roles as bottlenose dolphin bray calls that have been hypothesized to alter the
behaviour of prey, to call attention to patches of food or to coordinate foraging with group members
[42]. However, pilot whales seem to hunt for large, calorific squid during the day, where bursts of
high vertical speeds are necessary to catch the prey [29]. It is unlikely that any acoustic
manipulation of prey behaviour is taking place since squid do not seem to detect the pressure
component of a sound field [43; 44]. Given the general decrease in calling activity of tagged whales
at foraging depths (Fig 1, Fig. 2) and the apparent lack of dive synchrony in this population [30],
calls at depth do not seem to serve in cooperative foraging with other diving animals either. An
alternative and more parsimonious explanation given the predominance of calls in the ascent phase
would be that calls primarily serve to maintain or re-establish social ties during individual foraging
periods when the whale is far from its social group at the surface. This has already been
hypothesized for long-finned pilot whales [45] and resembles how acoustic signals are believed to
mediate social cohesion and group structure in other toothed whales [32; 46] and other group-living
animals such as birds [47] and primates [48; 49].
Call frequency content is robust to changes in depth
Little is known about the production of tonal sounds in toothed whales or how these sounds are
coupled into water, but it has been hypothesized that resonances in the nasal passages or vestibular
air sacs may be involved [13]. As these air spaces likely shrink with depth to accommodate the
reducing air volume, higher resonance frequencies or emphasis of higher harmonics would be
expected at depth. A significant shift of energy towards higher harmonics, and consequently higher
centroid and peak frequency, was noted for trained belugas whistling at depth [10]. Ridgway and
colleagues argued that changing air density affecting the flow of air might explain the change in
frequency [10]. However, we found poor correlations between frequency content and depth for the
free-ranging pilot whales studied here (Table 2, Fig. 3). Both high and low frequency calls were
produced at depth (Fig. 3), suggesting that the slight shift in frequency may have a behavioural
explanation rather than a biophysical one. Hence, our results do not support the notion that toothed
whales should be limited to high-frequency signals when diving deep but demonstrate that pilot
whales contrary to trained belugas are capable of maintaining frequency content even at great
depths.
Call duration and output is physically limited by hydrostatic pressure
Chapter VII
Page 151Page 151
Jensen et al. 2011 - Pilot whale social calls at depth
263
264
265
266
267
268
269
270
271
272
273
274
275
276
277
278
279
280
281
282
283
284
285
286
287
288
289
290
291
292
293
294
Calls produced at depth were generally shorter and contained much less energy compared to
shallower calls (Fig. 3). Average call duration was halved for every ten-fold increase in depth, while
AOEFD decreased 100 times (20 dB) for similar depth increases below about 80m. Given that there
is little evidence for synchronous diving in this population [30], the most plausible receivers of calls
made during dives would be members of the social group remaining at the surface. During these
regular separations from their group, foraging whales have to transmit information over greater
distances the deeper they descend, and would need to produce calls with more energy to
compensate for the increased distance to the social group. This might be achieved by producing
higher amplitude calls, as communication distance increases, or longer calls as has been shown in
both macaques and squirrel monkeys [50; 51].The observed reduction in pilot whale vocal output
and duration at great depth is in sharp contrast with these predictions. During foraging at depth,
more air might be invested in echolocation signals at the cost of potentially decreasing duration,
amplitude or number of calls at depth. However, the prevalence of calls during the ascent phase of
foraging dives, after most foraging events and where echolocation click series are more sporadic,
makes it difficult to explain our results by an increased focus on foraging efforts with depth.
Instead, the decrease in call amplitude and duration in spite of an increasing communication range
is consistent with the hypothesis that the pneumatic sound generator is limited by the high ambient
pressure at depth [10].
In contrast with our results, Ridgway and colleagues did not find any changes in the duration of
whistles with increasing depth [10]. However, this might be a consequence of the training procedure
if the animals perceived the duration of the response whistle as important to receive a reward [52].
Furthermore, it is noteworthy that whistles in the Ridgway study were already short (duration ~0.1s
and ~0.3s for the two belugas) and that the beluga producing the longer whistles switched to a pulse
train instead of a whistle at 300m depth. Trained beluga whales did decrease their whistle amplitude
with depth much like the pilot whales studied here [10]. Ridgway and colleagues argued that this
might indicate a biophysical constraint on sound communication related with the increasing density
of air used for sound production at depth. If this were the case, the call amplitude should decrease
inversely with increasing hydrostatic pressure as whales dive. However, this hypothesis is not
supported by our data (Fig. 3). Rather, the gradual reduction in sound level beginning around 80 m
depth suggests that the air volume available for sound generation in the nasal passages is limiting
the output of the whale, rather than air density. While the total air volume in the body of the whale
Page 152Page 152
Jensen et al. 2011 - Pilot whale social calls at depth
295
296
297
298
299
300
301
302
303
304
305
306
307
308
309
310
311
312
313
314
315
316
317
318
319
320
321
322
323
324
325
326
is compressed from the very beginning of the deep dive, air from the lungs is gradually shunted to
less compressible nasal passages throughout the first part of the dive until the lungs are collapsed
[18]. At shallow depths, the toothed whale lungs may act as a reservoir of air for the nasal system,
ensuring that sound production is unaffected by pressure until lungs are collapsed. Beyond that
point, the volume of air available for sound production decreases, leading to progressively weaker
calls.
One possible way to alleviate restrictions on vocal output due to the limited air in nasal passages
might be to switch to click-based communication signals [32] that require less nasal pressure and
consequently less air volume to produce [10; 16]. However, high-frequency clicks are more
directional than low-frequency signals radiated from the same aperture [37; 53] meaning that a
switch to click-based signals would come at the cost of restricting the possible audience [54]. The
fact that tonal calls are produced by pilot whales even at depths of 800m suggests that these calls
carry information or reach an audience that would be unavailable with clicks, and that they are
important enough to produce despite biophysical limitations in output.
However, the weak calls at depth will have a much lower detection range than calls produced close
to the surface. AOEFD of calls decreased as 20.5 log10(depth) below 80m, which means that a whale
diving from 80m to 800m depth would produce calls approximately 20 dB lower and with less than
10% of the active space of shallow calls depending on propagation conditions [55]. These weak,
short-range signals, addressed to distant conspecifics, are especially susceptible to masking from
increased ambient noise [56] that may be introduced by motorized vessels approaching the whales
for prolonged, short-range encounters as in whale watching [57]. Since the signals may serve a role
in group coordination [46; 58], noise from vessels navigating close to the surface group may delay
or impede the contact between foraging animals and their social group [57], potentially influencing
group coordination and cohesion in these social animals.
Limited call duration at depth may impose constraints on information transfer
When social birds and mammals rejoin, a variety of different cues can help individuals recognize
each other. For many animals, acoustic recognition systems are of prime importance. In situations
where the risk of confusion is low, or where acoustic identification can be aided by visual or
olfactory cues, acoustic cues can be relatively simple. Sheep and some species of penguins
Chapter VII
Page 153Page 153
Jensen et al. 2011 - Pilot whale social calls at depth
327
328
329
330
331
332
333
334
335
336
337
338
339
340
341
342
343
344
345
346
347
348
349
350
351
352
353
354
355
356
357
358
recognize individuals based on the frequency content of calls aided by olfactory and topographical
cues [59; 60]. In situations where risk of confusion is high, such as the large and dense colonies of
some birds, acoustic recognition cues can be more sophisticated. For example, king and emperor
penguins use a combination of spectral and temporal characteristics [61], and bats also seem to use
time-frequency contours for individual recognition [62]. Given that acoustic signals propagate faster
and with less attenuation in water compared to in air [55], and that visual and especially olfactory
cues are much less reliable, it would be expected that acoustic recognition systems in toothed
whales were equally complex. In bottlenose dolphins, identity information is encoded in the time-
frequency contour of highly diverse signature whistles [63]. If similar identity encoding is used by
pilot whales, reduced call duration at depth must limit the diversity of potential individually-specific
signature calls. In fact, calls at depth tend towards simpler, shorter downsweeps (e.g. Fig. 1)
whereas surface calls may be much more complex and modulated, indicating that deep calls may be
restricted to more primal recognition cues. For some animals, individual-specific recognition cues
may be no more beneficial than more basic cues for kin, group or even species recognition. For
example, sperm whales have been hypothesized to primarily encode the identity of their social unit
into coda clicks [64]. Furthermore, if cues for individual recognition are complex, an increased
propagation distance might obscure those cues for a potential receiver. Studies of red-winged
blackbirds have shown how complex song components revealing the identity of the singer attenuate
quickly, whereas simpler frequency cues reveal the species of the singer at greater distances [65].
Since the primary social groups of short-finned pilot whales often cluster together in larger
aggregations within one area [24], a deep-diving pilot whale may be within hearing range of several
social groups. It is therefore quite possible that the simpler calls used at depth may contain group-
specific cues. If such cues were encoded in the overall frequency content of deep calls, they would
be robust to changes in depth and therefore well suited to the deep-diving lifestyle of pilot whales.
Selection acts on signal production, transmission and reception
This study has shown how environmental factors in the form of hydrostatic pressure affect the
communication capacity of homeotherm deep-diving toothed whales by limiting the communication
range and information transfer at great depths. However, the communication potential of pilot
whales is not only affected by pneumatic limitations in their sound production system, but also
shaped by other environmental factors such as absorption, reverberation and background noise [7].
Page 154Page 154
Jensen et al. 2011 - Pilot whale social calls at depth
359
360
361
362
363
364
365
366
367
368
369
370
371
372
373
374
375
376
377
378
379
380
381
382
383
384
385
386
387
388
389
390
Changes in the sound speed throughout a medium will result in refraction of sound waves that
shapes the communication space of vertically moving animals [55]. In terrestrial environments, this
can result in time periods or spatial locations that optimize sound propagation, creating effective
signalling opportunities that different animals, such as birds or frogs, have evolved to exploit [66;
67]. Models of the propagation of humpback whale song indicate that song depth can likewise be a
major determinant in the propagation of songs in an aquatic environment [68]. Therefore, pilot
whales trying to maximize their calling distance during a deep dive would have to account for both
the physical sound transmission properties of the environment, such as sound refraction, absorption
and background noise, as well as the biophysical constraints on their pneumatic sound generator.
Conclusion
We have shown that short-finned pilot whales use acoustic communication during deep foraging
dives by producing harmonically rich tonal calls at depths of up to 800m. Frequency content of
deep calls is not shifted towards higher frequencies and does not seem to be limited by the
mechanisms of pneumatic sound production under great ambient pressure, providing a possible
depth-resilient cue for group or species recognition of deep-diving animals. However, despite an
increasing distance to likely receivers at the surface that would dictate increased source levels, both
call amplitude and duration is reduced at depth. This is likely a consequence of the diminishing air
volume used to power pneumatic sound production, but may be further influenced by behavioural
factors. The short and weak signals produced at depth may be difficult to detect for group members
remaining at the surface, and will be especially prone to masking. Increases in ambient noise near
the surface group due to motorized vessels will therefore have implications for the acoustic contact
between foraging individuals and their social group.
Acknowledgements
Fieldwork was funded by the National Oceanographic Partnership Program via a research
agreement between La Laguna University and the Woods Hole Oceanographic Institution, with
additional support from the PhD School of Aquatic Sciences (SOAS), Aarhus University, DK,
WWF Denmark and Aase & Ejnar Danielsens Foundation. MJ and NA were funded by the National
Oceanographic Partnership Program, NA is currently funded by a Marie Curié International
Outgoing Fellowship within the 7th European Framework Programme and PTM by frame grants
from the Danish Natural Science Foundation. Thanks to I. Domínguez, F. Díaz and L. Martinez for
Chapter VII
Page 155Page 155
Jensen et al. 2011 - Pilot whale social calls at depth
391
392
393
394
395
helping with DTAG analysis, to C. Aparicio, P. Arranz, C. Gonzalez and P. Aspas for their
assistance during tagging cruises, to T. Hurst for his work with the DTAGs and to D. Wisniewska
for valuable input. P. Tyack, S. King and two anonymous reviewers provided much helpful critique
to previous versions of this manuscript. Research was performed under a permit from the Canary
Islands Government granted to La Laguna University.
Page 156Page 156
Jensen et al. 2011 - Pilot whale social calls at depth
References 396
397
398
399
400
401
402
403
404
405
406
407
408
409
410
411
412
413
414
415
416
417
418
419
420
421
422
423
424
425
426
1 Contrera, F. & Nieh, J. 2007 The effect of ambient temperature on forager sound production and
thoracic temperature in the stingless bee, Melipona panamica. Behav. Ecol. Sociobiol. 61, 887-
897. 2 Walker, T. J. 1962 Factors Responsible for Intraspecific Variation in Calling Songs of Crickets.
Evolution 16, 407-&. 3 Gerhardt, H. C. & Mudry, K. M. 1980 Temperature effects on frequency preferences and mating
call frequencies in the green treefrog, Hyla cinerea (Anura: Hylidae). J Comp. Physiol. A 137, 1-
6. 4 Lüddecke, H. & Sínchez, O. R. 2002 Are Tropical Highland Frog Calls Cold–adapted? The Case
of the Andean Frog Hyla labialis1. Biotropica 34, 281-288. 5 Connaughton, M. A., Fine, M. L. & Taylor, M. H. 2002 Weakfish sonic muscle: influence of
size, temperature and season. J. Exp. Biol. 205, 2183-2188. 6 Camaclang, A. E., Hollis, L. & Barclay, R. M. R. 2006 Variation in body temperature and
isolation calls of juvenile big brown bats, Eptesicus fuscus. Anim. Behav. 71, 657-662. (DOI
10.1016/j.anbehav.2005.07.009) 7 Brumm, H. & Naguib, M. 2009 Environmental acoustics and the evolution of bird song. In
Advances in the Study of Behavior, vol. 40 (ed. M. Naguib, V. Janik, N. Clayton & K.
Zuberbuhler), pp. 1-33. San Diego: Elsevier Academic Press. 8 Brumm, H. & Slabbekoorn, H. 2005 Acoustic communication in noise. In Advances in the Study
of Behavior, vol. 35, pp. 151-209. San Diego: Elsevier Academic Press Inc. 9 Johnson, M., de Soto, N. A. & Madsen, P. T. 2009 Studying the behaviour and sensory ecology
of marine mammals using acoustic recording tags: a review. Mar. Ecol. Progr. Ser. 395, 55-73.
(DOI 10.3354/meps08255) 10 Ridgway, S. H., Carder, D. A., Kamolnick, T., Smith, R. R., Schlundt, C. E. & Elsberry, W. R.
2001 Hearing and whistling in the deep sea: depth influences whistle spectra but does not
attenuate hearing by white whales (Delphinapterus leucas) (Odontoceti, Cetacea). J. Exp. Biol.
204, 3829-3841. 11 Cranford, T. W. 1988 The anatomy of acoustic structures in the spinner dolphin forehead as
shown by x-ray computed tomography and computer graphics. In Animal Sonar: Processes and
performance (ed. P. E. Nachtigall & P. W. B. Moore), pp. 67-77. New York: Plenum Press.
Chapter VII
Page 157Page 157
Jensen et al. 2011 - Pilot whale social calls at depth
12 Cranford, T. W., Amundin, M. & Norris, K. S. 1996 Functional morphology and homology in
the odontocete nasal complex: Implications for sound generation. J. Morphol. 228, 223-285.
427
428
429
430
431
432
433
434
435
436
437
438
439
440
441
442
443
444
445
446
447
448
449
450
451
452
453
454
455
456
13 Mackay, R. S. & Liaw, H. M. 1981 Dolphin Vocalization Mechanisms. Science 212, 676-678. 14 Dormer, K. J. 1979 Mechanism of sound production and air recycling in delphinids -
cineradiographic evidence. J. Acoust. Soc. Am. 65, 229-239. 15 Murray, S. O., Mercado, E. & Roitblat, H. L. 1998 Characterizing the graded structure of false
killer whale (Pseudorca crassidens) vocalizations. J. Acoust. Soc. Am. 104, 1679-1688. 16 Elsberry, W. R. 2003 Interrelationships between intranarial pressure and biosonar clicks in
bottlenose dolphins (Tursiops truncatus). PhD Thesis: Texas A&M University. 17 Ridgway, S. H. & Carder, D. A. 1988 Nasal pressure and sound production in an echolocating
white whale, Delphinapterus leucas. In Animal Sonar: Processes and Performance (ed. P. E.
Nachtigall & P. W. B. Moore), pp. 53-60. New York and London: Plenum. 18 Ridgway, S. H. & Howard, R. 1979 Dolphin lung collapse and intramuscular circulation during
free diving - Evidence from nitrogen washout. Science 206, 1182-1183. 19 Ridgway, S. H., Scronce, B. L. & Kanwisher, J. 1969 Respiration and deep diving in bottlenose
porpoise. Science 166, 1651. 20 Madsen, P. T., Payne, R., Kristiansen, N. U., Wahlberg, M., Kerr, I. & Mohl, B. 2002 Sperm
whale sound production studied with ultrasound time/depth-recording tags. J. Exp. Biol. 205,
1899-1906. 21 Johnson, M., Madsen, P. T., Zimmer, W. M. X., de Soto, N. A. & Tyack, P. L. 2004 Beaked
whales echolocate on prey. Proc. R. Soc. Lond. B. 271, S383-S386. (DOI
10.1098/rsbl.2004.0208) 22 Tyack, P. L., Johnson, M., Soto, N. A., Sturlese, A. & Madsen, P. T. 2006 Extreme diving of
beaked whales. J. Exp. Biol. 209, 4238-4253. (DOI 10.1242/jeb.02505) 23 Wahlberg, M. 2002 The acoustic behaviour of diving sperm whales observed with a hydrophone
array. J. Exp. Mar. Biol. Ecol. 281, 53-62. 24 Heimlich-Boran, J. R. 1993 Social organisation of the short finned pilot-whale, with special
reference to the comparative social ecology of delphinids: Ph.D. thesis. University of Cambridge. 25 Amos, B., Schlotterer, C. & Tautz, D. 1993 Social structure of pilot whales revealed by
analytical DNA profiling. Science 260, 670-672.
Page 158Page 158
Jensen et al. 2011 - Pilot whale social calls at depth
26 Kasuya, T. & Marsh, H. 1984 Life history and reproductive biology of the short-finned pilot
whale, Globicephala macrorhynchus, off the Pacific coast of Japan. IWC Special Issue 6, 259-
310.
457
458
459
460
461
462
463
464
465
466
467
468
469
470
471
472
473
474
475
476
477
478
479
480
481
482
483
484
485
486
27 Bigg, M. A., Olesiuk, P. F., Ellis, G. M. & Ford, J. K. B. 1990 Social organization and genealogy
of resident killer whales (Orcinus orca) in the coastal waters of British Columbia and
Washington State. Report of the International Whaling Commission Special Issue, 382-405. 28 Baird, R. W. 2000 The killer whale - foraging specializations and group hunting. In Cetacean
societies: Field studies of dolphins and whales (ed. J. Mann, R. C. Connor, P. L. Tyack & H.
Whitehead), pp. 127-153. Chicago: University of Chicago Press. 29 Aguilar Soto, N., Johnson, M. P., Madsen, P. T., Diaz, F., Dominguez, I., Brito, A. & Tyack, P.
2008 Cheetahs of the deep sea: deep foraging sprints in short-finned pilot whales off Tenerife
(Canary Islands). J. Anim. Ecol. 77, 936-47. 30 Aguilar Soto, N. 2006 Acoustic and diving behaviour of pilot whales (Globicephala
macrorhynchus) and Blainville's beaked whales (Mesoplodon densirostris) off the Canary
Islands, with implications for effects of man-made noise and ship strikes. Ph.D. thesis: La
Laguna University, Tenerife. 31 Johnson, M. P. & Tyack, P. L. 2003 A digital acoustic recording tag for measuring the response
of wild marine mammals to sound. IEEE J. Ocean. Eng. 28, 3-12. 32 Herzing, D. L. 2000 Acoustics and social behavior of wild dolphins: implications for a sound
society. In Hearing by whales and dolphins (ed. W. W. L. Au, A. N. Popper & R. E. Fay).
London: Springer Press. 33 Akamatsu, T., Matsuda, A., Suzuki, S., Wang, D., Wang, K. X., Suzuki, M., Muramoto, H.,
Sugiyama, N. & Oota, K. 2005 New stereo acoustic data logger for free-ranging dolphins and
porpoises. Mar. Technol. Soc. J. 39, 3-9. 34 Madsen, P. T., Johnson, M., de Soto, N. A., Zimmer, W. M. X. & Tyack, P. 2005 Biosonar
performance of foraging beaked whales (Mesoplodon densirostris). J. Exp. Biol. 208, 181-194.
(DOI 10.1242/jeb.01327) 35 Deecke, V. B., Ford, J. K. B. & Spong, P. 1999 Quantifying complex patterns of bioacoustic
variation: Use of a neural network to compare killer whale (Orcinus orca) dialects. J. Acoust.
Soc. Am. 105, 2499-2507.
Chapter VII
Page 159Page 159
Jensen et al. 2011 - Pilot whale social calls at depth
36 Welch, P. D. 1967 Use of Fast Fourier Transform for estimation of power spectra - a method
based on time averaging over short modified periodograms. IEEE Trans. Audio Electroacoust.
AU-15, 70-73.
487
488
489
490
491
492
493
494
495
496
497
498
499
500
501
502
503
504
505
506
507
508
509
510
511
512
513
514
515
516
517
37 Au, W. W. L. 1993 The Sonar of Dolphins: New York: Springer Verlag. 38 Manly, B. F. J. 1997 Randomization, bootstrap and Monte Carlo methods in biology. Boca
Raton: Chapman & Hall. 39 Boinski, S. 1993 Vocal coordination of troop movement among white-faced capuchin monkeys,
Cebus capucinus. Am. J. Primat. 30, 85-100. 40 Radford, A. N. 2004 Vocal Coordination of Group Movement by Green Woodhoopoes
(Phoeniculus purpureus). Ethology 110, 11-20. 41 Aguilar Soto, N., Johnson, M., Tyack, P., Arranz, P., Marrero, J., Fais, A. & Madsen, P. T.
(submitted) Cryptic at the surface, broadcast at depth: deep social communication in Blainville's
beaked whales. 42 Janik, V. M. 2000 Food-related bray calls in wild bottlenose dolphins (Tursiops truncatus). Proc.
R. Soc. Lond. B. 267, 923-927. 43 Mooney, T. A., Hanlon, R. T., Christensen-Dalsgaard, J., Madsen, P. T., Ketten, D. R. &
Nachtigall, P. E. 2010 Sound detection by the longfin squid (Loligo pealeii) studied with
auditory evoked potentials: sensitivity to low-frequency particle motion and not pressure. J. Exp.
Biol. 213, 3748-3759. (DOI 10.1242/jeb.048348) 44 Wilson, M., Hanlon, R. T., Tyack, P. L. & Madsen, P. T. 2007 Intense ultrasonic clicks from
echolocating toothed whales do not elicit anti-predator responses or debilitate the squid Loligo
pealeii. Biol. Let. 3, 225-227. (DOI 10.1098/rsbl.2007.0005) 45 Weilgart, L. S. & Whitehead, H. 1990 Vocalizations of the north-atlantic pilot whale
(Globicephala melas) as related to behavioral contexts. Behav. Ecol. Sociobiol. 26, 399-402. 46 Tyack, P. L. 2000 Functional aspects of cetacean communication. In Cetacean societies: field
studies of dolphins and whales (ed. J. Mann, R. C. Connor, P. L. Tyack & H. Whitehead).
Chicago: Univ. Chicago Press. 47 Marler, P. 2004 Bird calls - Their potential for behavioral neurobiology. Behavioral
Neurobiology of Birdsong 1016, 31-44. (DOI 10.1196/annals.1298.034) 48 Daschbach, N., Schein, M. & Haines, D. 1981 Vocalizations of the Slow Loris, Nycticebus
coucang (Primates, Lorisidae). Int. J. Primat. 2, 71-80.
Page 160Page 160
Jensen et al. 2011 - Pilot whale social calls at depth
49 Palombit, R. 1992 A preliminary study of vocal communication in wild long-tailed macaques
(Macaca fascicularis). II. Potential of calls to regulate intragroup spacing. Int. J. Primat. 13,
183-207.
518
519
520
521
522
523
524
525
526
527
528
529
530
531
532
533
534
535
536
537
538
539
540
541
542
543
544
545
546
547
548
549
50 Masataka, N. & Symmes, D. 1986 Effect of separation distance on isolation call structure in
squirrel monkeys (Saimiri sciureus). Am. J. Primat. 10, 271-278. 51 Sugiura, H. 2007 Effects of proximity and behavioral context on acoustic variation in the coo
calls of Japanese Macaques. Am. J. Primat. 69, 1412-1424. (DOI 10.1002/ajp.20447) 52 Ramirez, K. 1999 Animal Training: Successful animal management through positive
reinforcement. Chicago: Shedd Aquarium Society. 53 Miller, P. J. O. 2002 Mixed-directionality of killer whale stereotyped calls: a direction of
movement cue? Behav. Ecol. Sociobiol. 52, 262-270. (DOI 10.1007/s00265-002-0508-9) 54 Yorzinski, J. L. & Patricelli, G. L. 2010 Birds adjust acoustic directionality to beam their
antipredator calls to predators and conspecifics. Proc. R. Soc. Lond. B. 277, 923-932. (DOI
10.1098/rspb.2009.1519) 55 Urick, R. J. 1983 Principles of Underwater Sound: Peninsula, Los Altos. 56 Richardson, W. J., Greene, C. R. J., Malme, C. I. & Thomson, D. H. 1995 Marine Mammals And
Noise: Academic Press, London. 57 Jensen, F. H., Bejder, L., Wahlberg, M., Soto, N. A., Johnson, M. & Madsen, P. T. 2009 Vessel
noise effects on delphinid communication. Mar. Ecol. Progr. Ser. 395, 161-175. (DOI
10.3354/meps08204) 58 Janik, V. M. & Slater, P. J. 1998 Context-specific use suggests that bottlenose dolphin signature
whistles are cohesion calls. Anim. Behav. 56, 829-838. 59 Searby, A. & Jouventin, P. 2003 Mother-lamb acoustic recognition in sheep: a frequency coding.
Proc. R. Soc. Lond. B. 270, 1765-1771. (DOI 10.1098/rspb.2003.2442) 60 Searby, A., Jouventin, P. & Aubin, T. 2004 Acoustic recognition in macaroni penguins: an
original signature system. Anim. Behav. 67, 615-625. 61 Jouventin, P. & Aubin, T. 2002 Acoustic systems are adapted to breeding ecologies: individual
recognition in nesting penguins. Anim. Behav. 64, 747-757. (DOI 10.1006/anbe.2002.4002) 62 Scherrer, J. A. & Wilkinson, G. S. 1993 Evening bat isolation calls provide evidence for
heritable signatures. Anim. Behav. 46, 847-860. 63 Janik, V. M., Sayigh, L. S. & Wells, R. S. 2006 Signature whistle shape conveys identity
information to bottlenose dolphins. Proc. Natl. Acad. Sci. Unit. States Am. 103, 8293-8297.
Chapter VII
Page 161Page 161
Jensen et al. 2011 - Pilot whale social calls at depth
64 Weilgart, L. & Whitehead, H. 1997 Group-specific dialects and geographical variation in coda
repertoire in South Pacific sperm whales. Behav. Ecol. Sociobiol. 40, 277-285.
550
551
552
553
554
555
556
557
558
559
560
561
562
65 Brenowitz, E. A. 1982 Long-range communication of species identity by song in the Red-winged
Blackbird. Behav. Ecol. Sociobiol. 10, 29-38. 66 Dabelsteen, T. & Mathevon, N. 2002 Why do songbirds sing intensively at dawn? Acta
ethologica 4, 65-72. 67 Mathevon, N., Dabelsteen, T. & Blumenrath, S. H. 2005 Are high perches in the blackcap Sylvia
atricapilla song or listening posts? A sound transmission study. J. Acoust. Soc. Am. 117, 442-
449. 68 Mercado III, E. & Frazer, L. N. 1999 Environmental constraints on sound transmission by
humpback whales. J. Acoust. Soc. Am. 106, 3004-3016.
Page 162Page 162
Jensen et al. 2011 - Pilot whale social calls at depth
Legends 563
564
565
566
567
568
569
570
571
572
573
574
575
576
577
578
579
580
581
Figure 1: Annotated dive profile of a tagged short-finned pilot whale comprising a period of surface
resting or socializing followed by two deep foraging dives. Two tonal calls from the last ascent (see
letters in dive profile) are shown as inset waveforms and spectrograms (sampling rate 192 kHz, FFT
size 4096 samples, 50% overlap): Call A was produced by the tagged whale near the end of the
dive, close to the surface and call B was produced at the bottom of the dive. Note the lower
amplitude and shorter duration of the deep call.
Figure 2: Histogram showing the number of tonal calls produced during deep dives by 12 tagged
short-finned pilot whales (Globicephala macrorhynchus) as a function of depth.
Figure 3: Acoustic parameters of tonal calls produced during deep dives by 12 tagged short-finned
pilot whales (Globicephala macrorhynchus) as a function of depth: [A] Energy flux density
(AOEFD) corrected for tag differences by subtracting mean tag values, [B] 95% energy duration
(Dur95%), and [C] centroid frequency (Fc). Pooled data points from all whales (grey) have been
grouped into geometrically increasing depth bins (demarcated by vertical grid lines) to form
notched box plots, showing the 25th, 50th (median) and 75th percentile (lower, mid and upper lines in
box) of the calls within each depth bin. Whiskers mark the lowest and highest datum within 1.5
IQR. Notched boxes are centred on the mean depth of calls produced in each depth bin.
Chapter VII
Page 163Page 163
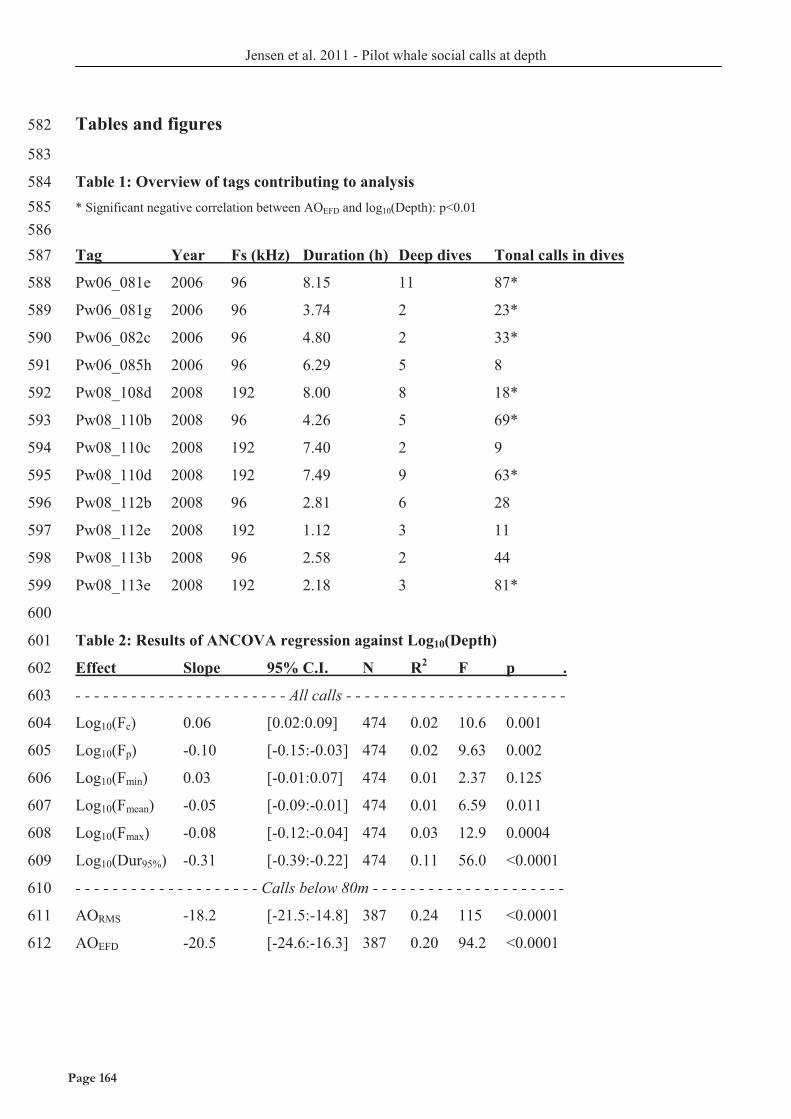
Jensen et al. 2011 - Pilot whale social calls at depth
Tables and figures 582
583
584 585 586
Table 1: Overview of tags contributing to analysis
* Significant negative correlation between AOEFD and log10(Depth): p<0.01
Tag Year Fs (kHz) Duration (h) Deep dives Tonal calls in dives 587
588
589
590
591
592
593
594
595
596
597
598
599
600
601
Pw06_081e 2006 96 8.15 11 87*
Pw06_081g 2006 96 3.74 2 23*
Pw06_082c 2006 96 4.80 2 33*
Pw06_085h 2006 96 6.29 5 8
Pw08_108d 2008 192 8.00 8 18*
Pw08_110b 2008 96 4.26 5 69*
Pw08_110c 2008 192 7.40 2 9
Pw08_110d 2008 192 7.49 9 63*
Pw08_112b 2008 96 2.81 6 28
Pw08_112e 2008 192 1.12 3 11
Pw08_113b 2008 96 2.58 2 44
Pw08_113e 2008 192 2.18 3 81*
Table 2: Results of ANCOVA regression against Log10(Depth)
Effect Slope 95% C.I. N R2 F p . 602
603
604
605
606
607
608
609
610
611
612
- - - - - - - - - - - - - - - - - - - - - - - All calls - - - - - - - - - - - - - - - - - - - - - - - -
Log10(Fc) 0.06 [0.02:0.09] 474 0.02 10.6 0.001
Log10(Fp) -0.10 [-0.15:-0.03] 474 0.02 9.63 0.002
Log10(Fmin) 0.03 [-0.01:0.07] 474 0.01 2.37 0.125
Log10(Fmean) -0.05 [-0.09:-0.01] 474 0.01 6.59 0.011
Log10(Fmax) -0.08 [-0.12:-0.04] 474 0.03 12.9 0.0004
Log10(Dur95%) -0.31 [-0.39:-0.22] 474 0.11 56.0 <0.0001
- - - - - - - - - - - - - - - - - - - - Calls below 80m - - - - - - - - - - - - - - - - - - - - -
AORMS -18.2 [-21.5:-14.8] 387 0.24 115 <0.0001
AOEFD -20.5 [-24.6:-16.3] 387 0.20 94.2 <0.0001
Page 164Page 164
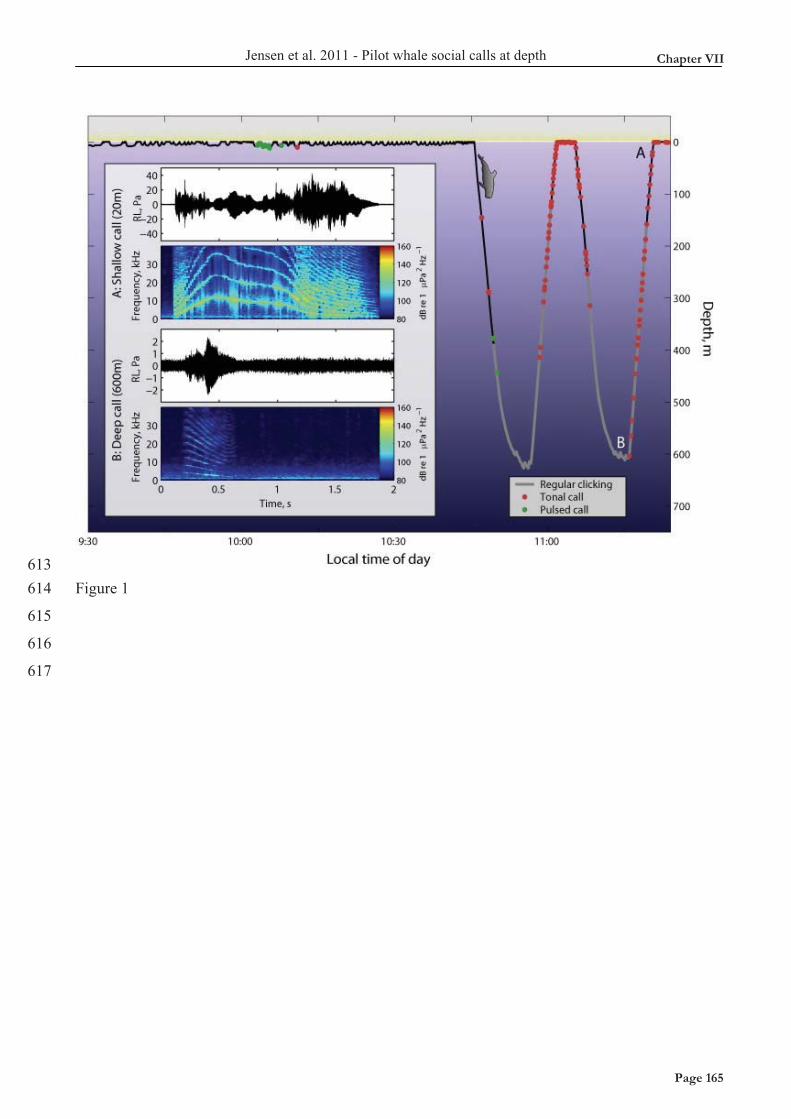
Jensen et al. 2011 - Pilot whale social calls at depth
613 614
615
616
617
Figure 1
Chapter VII
Page 165Page 165
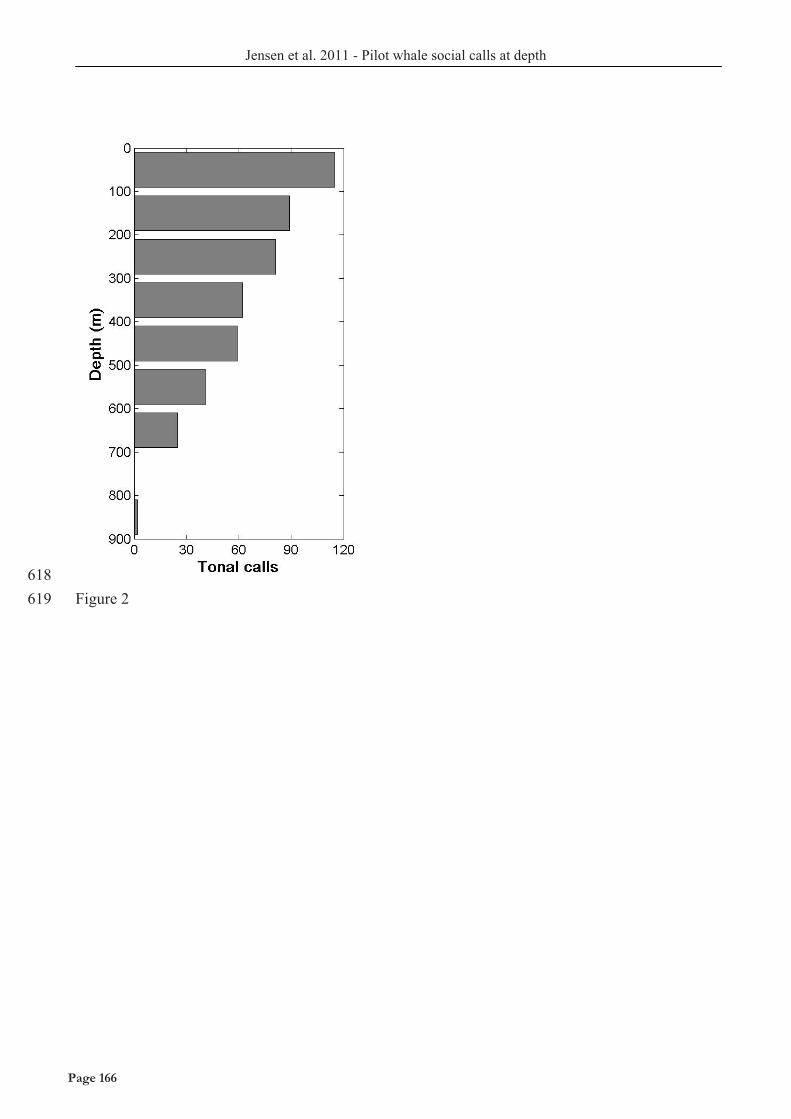
Jensen et al. 2011 - Pilot whale social calls at depth
618 619 Figure 2
Page 166Page 166
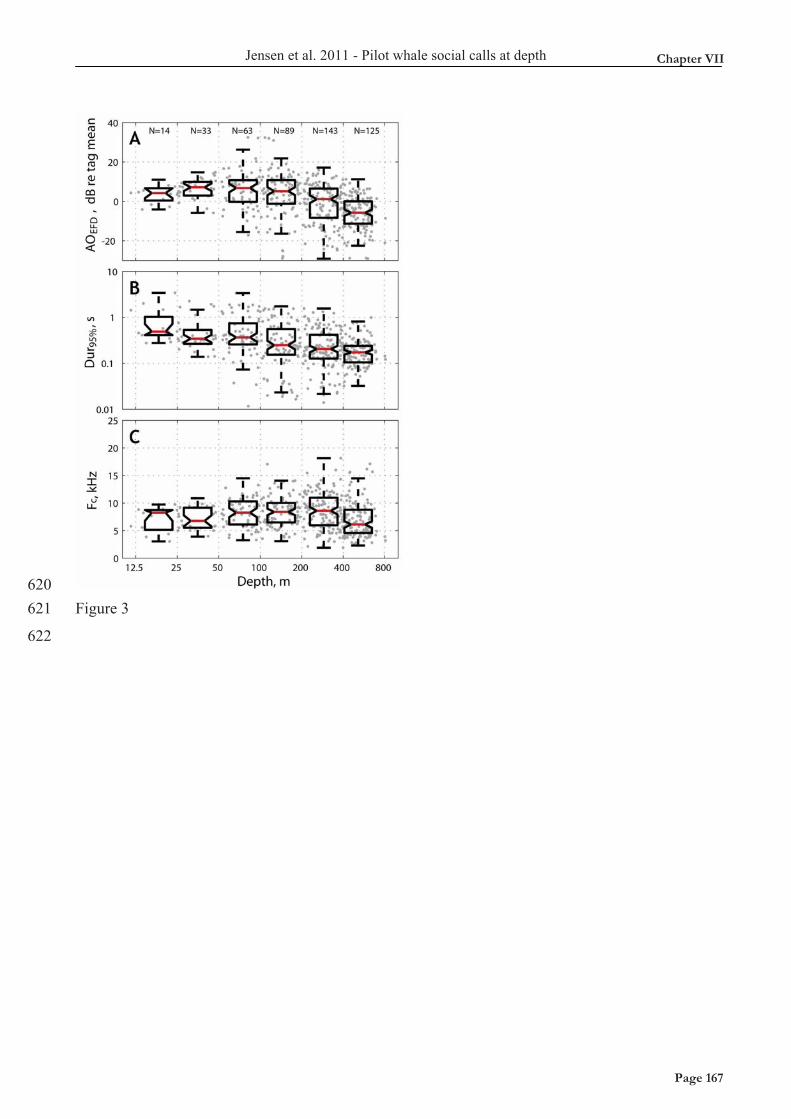
Jensen et al. 2011 - Pilot whale social calls at depth
620 621
622
Figure 3
Chapter VII
Page 167Page 167

Page 168Page 168
Jensen et al. Progress Report
1
2
3
4
5
6
7
8
9
10
11
12
13
14
15
16
17
18
19
20
21
SHORT-FINNED PILOT WHALE
CONTACT CALLING DURING DEEP DIVES
Frants H. Jensen1*, Jacobo Marrero Perez2, Mark Johnson3,
Natacha Aguilar Soto2,4, Peter T. Madsen1,3
1 Zoophysiology, Department of Biological Sciences, Aarhus University, 8000 Aarhus, Denmark.
2 BIOECOMAC, Dept. Animal Biology, La Laguna University, La Laguna 38206, Tenerife, Spain
3 Woods Hole Oceanographic Institution, Woods Hole, MA 02543, USA.
4 Leigh Marine Laboratory, University of Auckland, New Zealand
*Corresponding author: [email protected]
Short title: Pilot whale contact calls
Progress report of ongoing study
This chapter is a preliminary report of a study on the functional aspects of pilot whale calls.
Further studies will continue in collaboration with Dr. P. Tyack and L. Sayigh.
Chapter VIII
Page 169Page 169
Jensen et al. Progress Report
Introduction 22
23
24
25
26
27
28
29
30
31
32
33
34
35
36
37
38
39
40
41
42
43
44
45
46
47
48
49
50
51
52
53
Group-living species depend on signalling mechanisms to retain contact between individuals and
prevent the group from loosing its spatial coherence (Da Cunha & Byrne, 2009). Many species of
group-living animals, especially those inhabiting areas of low visibility such as forests or aquatic
environments, use preferentially acoustic signals for social communication (Fichtel & Manser,
2010). Such social calls may include calls that facilitate the coordinated movement of groups such
as seen in flocks of birds (Farnsworth, 2005) and troops of monkeys (Boinski, 1993; Boinski et al.,
1994) or calls that serve to maintain (Byrne, 1981; Harcourt et al., 1993) or regain (Daschbach et
al., 1981) acoustic contact between group members. Such contact or cohesion calls have been
identified in almost all studied species of primates and birds (Cortopassi & Bradbury, 2006; Da
Cunha & Byrne, 2009).
In contrast with our understanding of communication signals in terrestrial species, the function of
cetacean acoustic signals remains more speculative, in part because of their lesser accessibility and
the difficulty in ascribing calls in the wild to specific individuals. Bottlenose dolphins use
individually specific signature whistles (Caldwell et al., 1990; Sayigh et al., 1990) to identify
familiar individuals (Sayigh et al., 1999). Mother-calf pairs and allied males are two examples of a
very tight association pattern between individuals within the otherwise fluid fission-fusion society
of bottlenose dolphins (Connor et al., 2001; Connor et al., 2000). Signature whistles have been
connected to the temporary separation and subsequent reunion of both mother-calf pairs and allied
male pairs in the wild (Smolker et al., 1993; Watwood et al., 2005; Watwood et al., 2004), and
experimental separation of affiliated animals also increase the frequency of signature whistling,
suggesting a role in group cohesion (Janik & Slater, 1998). It has been suggested that dolphins use
whistles for initiating a reunion when separation is at its greatest (Watwood et al., 2004), as also
observed for spider monkeys living in similar fission-fusion societies (Ramos-Fernandez, 2005)
Short-finned pilot whales (Globicephala macrorhynchus) are highly social, deep-diving animals
that regularly leave their social group at the surface to forage individually or in smaller subgroups at
depth of up to 1000m (Aguilar Soto, 2006; Aguilar Soto et al., 2008). They are capable of
producing communication signals at all depths (Chapter VII: Jensen et al.) and therefore provide a
perfect setting for studying how these animals communicate when separating and reuniting with
their social group at vertical distances up to 1000m.
Page 170Page 170
Jensen et al. Progress Report
54
55
56
57
58
59
60
61
62
63
64
65
In this study, we therefore set out to investigate the role of tonal calls produced during deep
foraging dives, with special focus on their possible role in mediating group cohesion in these
animals. We hypothesize that: a) A consistent calling behaviour throughout the foraging dive might
indicate that calls function as cohesion calls to maintain continuous contact with the social group
throughout a dive. b) An elevated calling rate during the deepest part of the foraging dive or in
connection with feeding buzzes might indicate that calls may function as bray calls (Janik, 2000) to
alert conspecifics to prey patches, manipulate prey, or coordinate foraging with conspecifics. c) An
increased calling rate during ascent might indicate that calls function as contact calls to reunite the
forager with the surface group after separations.
Chapter VIII
Page 171Page 171
Jensen et al. Progress Report
Methods 66
67
68
69
70
71
72
73
74
75
76
77
78
79
80
81
82
83
84
85
86
87
88
89
90
91
92
93
94
95
96
97
Two tagging cruises were conducted in the spring of 2006 and 2008 off the south-west coast of
Tenerife, Canary Islands, to investigate a resident population of G. macrorhynchus of some 3-400
individuals (Heimlich-Boran, 1993). DTAGs (Johnson & Tyack, 2003) were attached with suction
cups to record sound (two channels, 96 or 192 kHz sampling rate per channel, 16-bit resolution), 3D
orientation (derived from three-axis accelerometers and magnetometers) and depth of the tagged
pilot whales.
Sound recordings were analysed using Matlab 6.5 (Mathworks) to identify the time and depth of
vocalizations from the tagged animal. Vocalizations were broadly classified into tonal, intermediate
and pulsed sounds (Herzing, 2000) based on visual inspection of the waveforms and spectrograms
of each call. Vocalizations from the tagged animal were discriminated from conspecific
vocalizations based on their increased low-frequency content (propagating through the body of the
tagged whale but poorly coupled to the surrounding water) and generally higher received levels
(Johnson et al., 2009). Subsequently, each call was cross-correlated between the two tag
hydrophones (separation 23 mm) to get an estimate of the angle-of-arrival of the call. If conspecific
clicks or extraneous noise sources overlapped with the call, an angle-of-arrival was found by using
interference-free parts of calls for cross-correlation. Calls were only accepted if angle-of-arrival
could be measured unambiguously: For each whale, vocalizations initially classified as tagged
whale sounds but with an angle-of-arrival more than 10 degrees from the mean angle-of-arrival of
calls produced by that whale were discarded from the analysis to reduce the possibility of including
calls from conspecifics (Akamatsu et al., 2005; Johnson et al., 2009). Despite these analytical steps,
it cannot be entirely excluded that some conspecific calls may have been erroneously classified as
tagged whale calls. However, the high received levels of these calls indicate that they were
produced near the tagged whale and so would be subject to similar depth effects. Furthermore,
given the number of calls investigated here, it is unlikely that a few misclassifications would change
the overall conclusions.
Pilot whale foraging dives, where individuals naturally separate from the social group, were defined
as any dive reaching depths greater than 300m. Three broad dive-related behavioural categories
were defined based on the calibrated depth profile. Any time spent outside of a foraging dive was
considered surface activity. The period from the start of each deep dive to the deepest point of the
Page 172Page 172
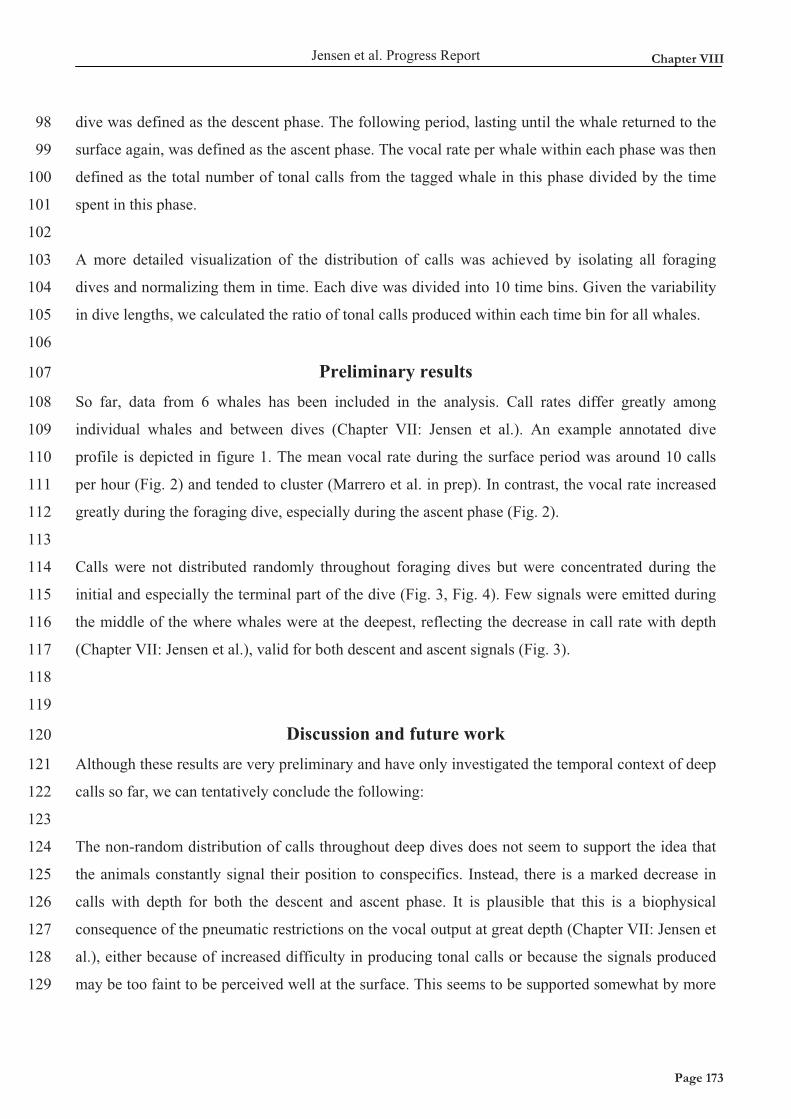
Jensen et al. Progress Report
98
99
100
101
102
103
104
105
106
107
108
109
110
111
112
113
114
115
116
117
118
119
120
121
122
123
124
125
126
127
128
129
dive was defined as the descent phase. The following period, lasting until the whale returned to the
surface again, was defined as the ascent phase. The vocal rate per whale within each phase was then
defined as the total number of tonal calls from the tagged whale in this phase divided by the time
spent in this phase.
A more detailed visualization of the distribution of calls was achieved by isolating all foraging
dives and normalizing them in time. Each dive was divided into 10 time bins. Given the variability
in dive lengths, we calculated the ratio of tonal calls produced within each time bin for all whales.
Preliminary results
So far, data from 6 whales has been included in the analysis. Call rates differ greatly among
individual whales and between dives (Chapter VII: Jensen et al.). An example annotated dive
profile is depicted in figure 1. The mean vocal rate during the surface period was around 10 calls
per hour (Fig. 2) and tended to cluster (Marrero et al. in prep). In contrast, the vocal rate increased
greatly during the foraging dive, especially during the ascent phase (Fig. 2).
Calls were not distributed randomly throughout foraging dives but were concentrated during the
initial and especially the terminal part of the dive (Fig. 3, Fig. 4). Few signals were emitted during
the middle of the where whales were at the deepest, reflecting the decrease in call rate with depth
(Chapter VII: Jensen et al.), valid for both descent and ascent signals (Fig. 3).
Discussion and future work
Although these results are very preliminary and have only investigated the temporal context of deep
calls so far, we can tentatively conclude the following:
The non-random distribution of calls throughout deep dives does not seem to support the idea that
the animals constantly signal their position to conspecifics. Instead, there is a marked decrease in
calls with depth for both the descent and ascent phase. It is plausible that this is a biophysical
consequence of the pneumatic restrictions on the vocal output at great depth (Chapter VII: Jensen et
al.), either because of increased difficulty in producing tonal calls or because the signals produced
may be too faint to be perceived well at the surface. This seems to be supported somewhat by more
Chapter VIII
Page 173Page 173
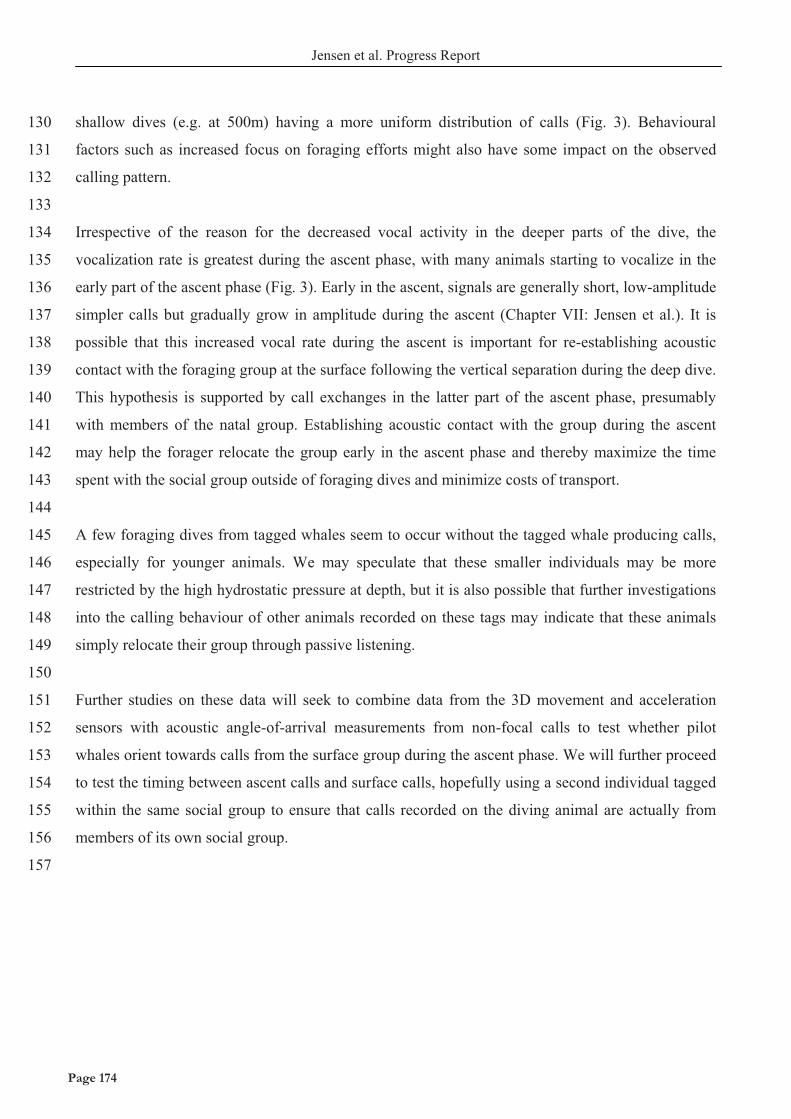
Jensen et al. Progress Report
130
131
132
133
134
135
136
137
138
139
140
141
142
143
144
145
146
147
148
149
150
151
152
153
154
155
156
157
shallow dives (e.g. at 500m) having a more uniform distribution of calls (Fig. 3). Behavioural
factors such as increased focus on foraging efforts might also have some impact on the observed
calling pattern.
Irrespective of the reason for the decreased vocal activity in the deeper parts of the dive, the
vocalization rate is greatest during the ascent phase, with many animals starting to vocalize in the
early part of the ascent phase (Fig. 3). Early in the ascent, signals are generally short, low-amplitude
simpler calls but gradually grow in amplitude during the ascent (Chapter VII: Jensen et al.). It is
possible that this increased vocal rate during the ascent is important for re-establishing acoustic
contact with the foraging group at the surface following the vertical separation during the deep dive.
This hypothesis is supported by call exchanges in the latter part of the ascent phase, presumably
with members of the natal group. Establishing acoustic contact with the group during the ascent
may help the forager relocate the group early in the ascent phase and thereby maximize the time
spent with the social group outside of foraging dives and minimize costs of transport.
A few foraging dives from tagged whales seem to occur without the tagged whale producing calls,
especially for younger animals. We may speculate that these smaller individuals may be more
restricted by the high hydrostatic pressure at depth, but it is also possible that further investigations
into the calling behaviour of other animals recorded on these tags may indicate that these animals
simply relocate their group through passive listening.
Further studies on these data will seek to combine data from the 3D movement and acceleration
sensors with acoustic angle-of-arrival measurements from non-focal calls to test whether pilot
whales orient towards calls from the surface group during the ascent phase. We will further proceed
to test the timing between ascent calls and surface calls, hopefully using a second individual tagged
within the same social group to ensure that calls recorded on the diving animal are actually from
members of its own social group.
Page 174Page 174
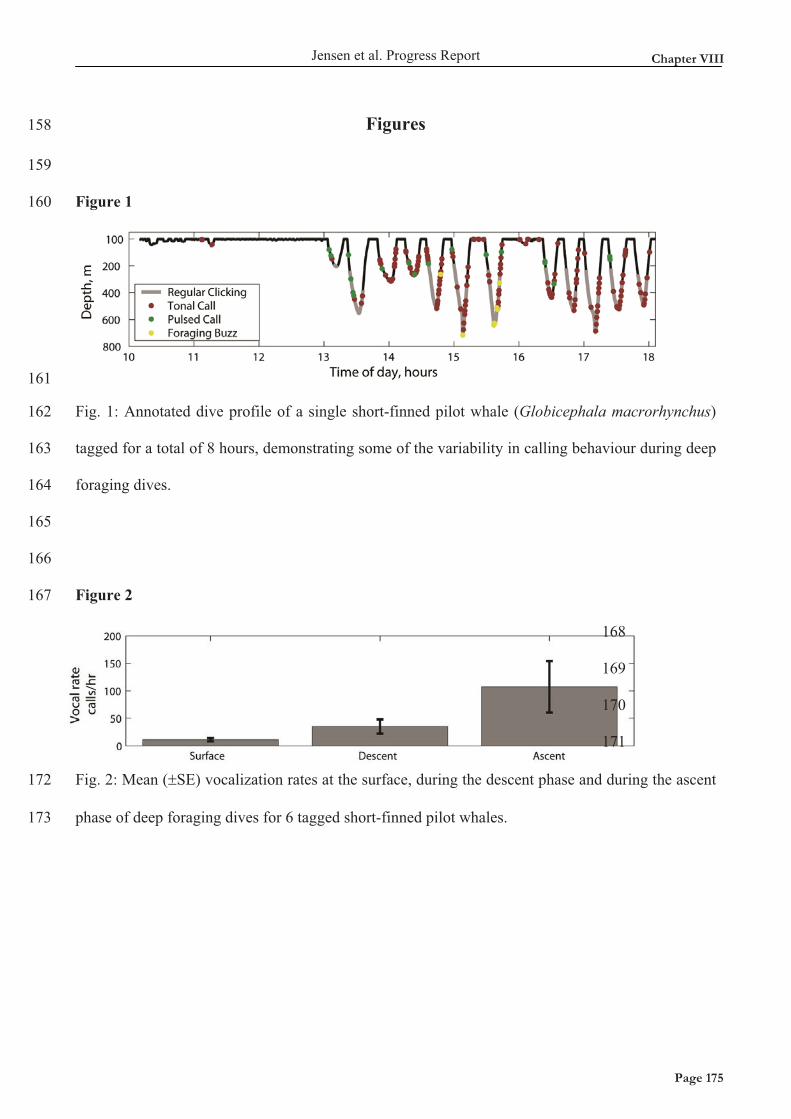
Jensen et al. Progress Report
Figures 158
159
160
Figure 1
161
162
163
164
165
166
167
168
169
170
171
172
173
Fig. 1: Annotated dive profile of a single short-finned pilot whale (Globicephala macrorhynchus)
tagged for a total of 8 hours, demonstrating some of the variability in calling behaviour during deep
foraging dives.
Figure 2
Fig. 2: Mean (�SE) vocalization rates at the surface, during the descent phase and during the ascent
phase of deep foraging dives for 6 tagged short-finned pilot whales.
Chapter VIII
Page 175Page 175
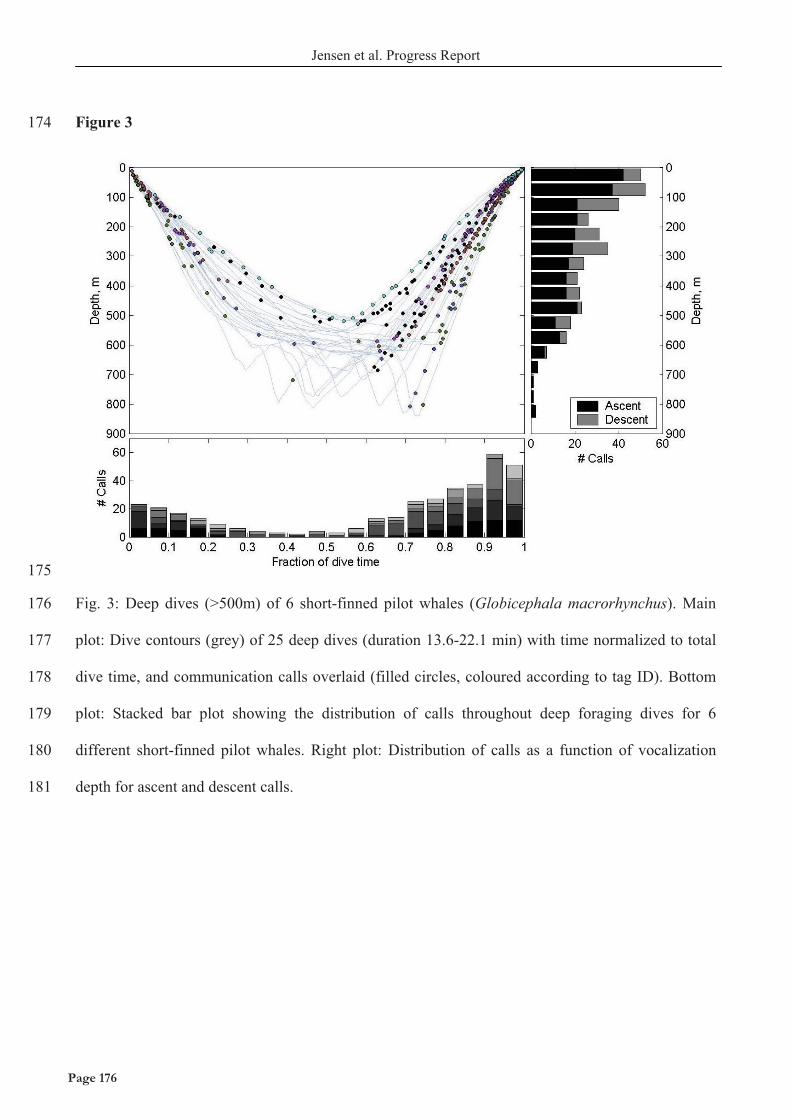
Jensen et al. Progress Report
Figure 3 174
175
176
177
178
179
180
181
Fig. 3: Deep dives (>500m) of 6 short-finned pilot whales (Globicephala macrorhynchus). Main
plot: Dive contours (grey) of 25 deep dives (duration 13.6-22.1 min) with time normalized to total
dive time, and communication calls overlaid (filled circles, coloured according to tag ID). Bottom
plot: Stacked bar plot showing the distribution of calls throughout deep foraging dives for 6
different short-finned pilot whales. Right plot: Distribution of calls as a function of vocalization
depth for ascent and descent calls.
Page 176Page 176
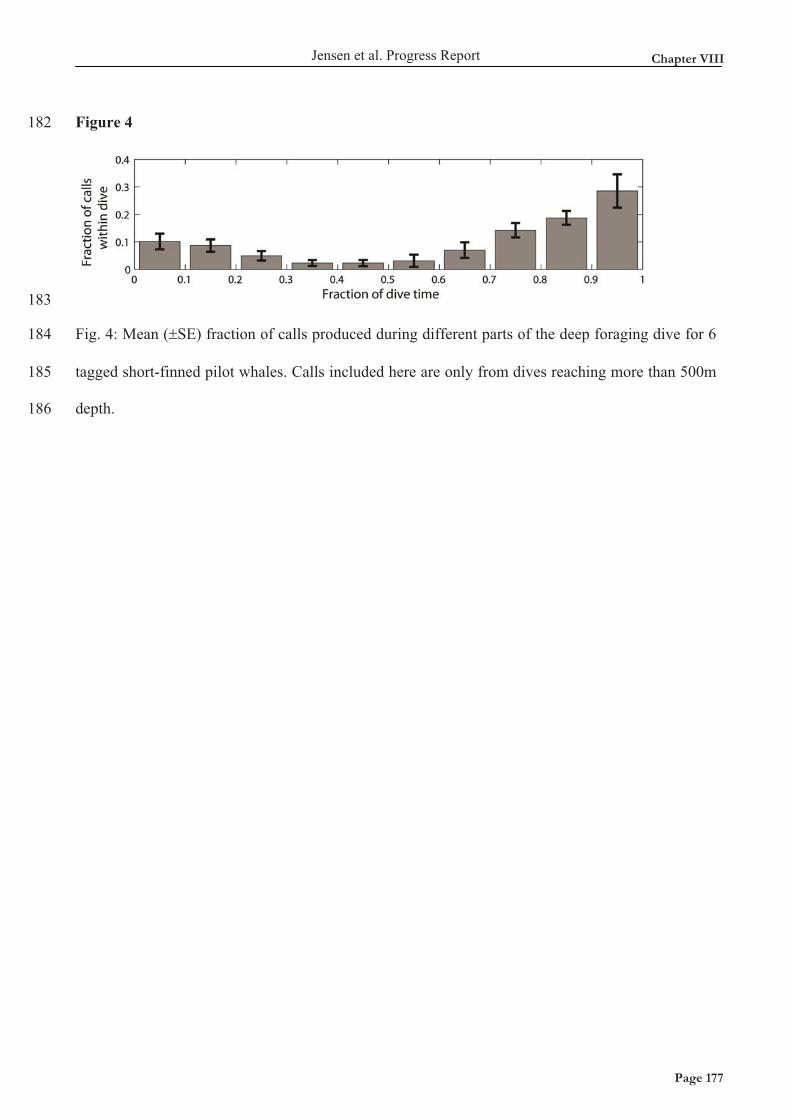
Jensen et al. Progress Report
Figure 4 182
183
184
185
186
Fig. 4: Mean (�SE) fraction of calls produced during different parts of the deep foraging dive for 6
tagged short-finned pilot whales. Calls included here are only from dives reaching more than 500m
depth.
Chapter VIII
Page 177Page 177
Jensen et al. Progress Report
References 187
188
189
190
191
192
193
194
195
196
197
198
199
200
201
202
203
204
205
206
207
208
209
210
Aguilar Soto, N. (2006). Acoustic and diving behaviour of pilot whales (Globicephala
macrorhynchus) and Blainville's beaked whales (Mesoplodon densirostris) off the Canary Islands,
with implications for effects of man-made noise and ship strikes. Ph.D. thesis: La Laguna
University, Tenerife.
Aguilar Soto, N., Johnson, M. P., Madsen, P. T., Diaz, F., Dominguez, I., Brito, A. and Tyack,
P. (2008). Cheetahs of the deep sea: deep foraging sprints in short-finned pilot whales off Tenerife
(Canary Islands). Journal of Animal Ecology 77, 936-47.
Akamatsu, T., Matsuda, A., Suzuki, S., Wang, D., Wang, K. X., Suzuki, M., Muramoto, H.,
Sugiyama, N. and Oota, K. (2005). New stereo acoustic data logger for free-ranging dolphins and
porpoises. Marine Technology Society Journal 39, 3-9.
Boinski, S. (1993). Vocal coordination of troop movement among white-faced capuchin monkeys,
Cebus capucinus. American Journal of Primatology 30, 85-100.
Boinski, S., Moraes, E., Kleiman, D. G., Dietz, J. M. and Baker, A. J. (1994). Intra-Group Vocal
Behaviour in Wild Golden Lion Tamarins, Leontopithecus Rosalia: Honest Communication of
Individual Activity. Behaviour 130, 53-75.
Byrne, R. W. (1981). Distance vocalisations of Guinea Baboons (Papio papio) in Senegal: An
analysis of function. Behaviour 78, 283-313.
Caldwell, M. C., Caldwell, D. K. and Tyack, P. L. (1990). Review of the signature-whistle
hypothesis for the atlantic bottlenose dolphin. In The Bottlenose Dolphin, (eds. S. Leatherwood and
R. R. Reeves), pp. 199-234: New York: Academic Press.
Connor, R. C., Heithaus, M. R. and Barre, L. M. (2001). Complex social structure, alliance
stability and mating access in a bottlenose dolphin 'super-alliance'. Proceedings of the Royal Society
of London Series B-Biological Sciences 268, 263-267.
Page 178Page 178
Jensen et al. Progress Report
Connor, R. C., Wells, R. S., Mann, J. and Read, A. J. (2000). The Bottlenose Dolphin. In
Cetacean Societies: Field studies of whales and dolphins, (eds. J. Mann R. C. Connor P. L. Tyack
and H. Whitehead). Chicago: Univ. Chicago Press.
211
212
213
214
215
216
217
218
219
220
221
222
223
224
225
226
227
228
229
230
231
232
233
234
Cortopassi, K. A. and Bradbury, J. W. (2006). Contact call diversity in wild orange-fronted
parakeet pairs, Aratinga canicularis. Animal Behaviour 71, 1141-1154.
Da Cunha, R. G. T. and Byrne, R. W. (2009). The use of vocal communication in keeping the
spatial cohesion of groups: Intentionality and specific functions. In South American Primates, (eds.
P. A. Garber A. Estrada J. C. Bicca-Marques E. W. Heymann and K. B. Strier), pp. 341-363:
Springer New York.
Daschbach, N., Schein, M. and Haines, D. (1981). Vocalizations of the Slow Loris, Nycticebus
coucang (Primates, Lorisidae). International Journal of Primatology 2, 71-80.
Farnsworth, A. (2005). Evolution of nocturnal flight calls in migrating wood-warblers: apparent
lack of morphological constraints. Journal of Avian Biology 36, 337-347.
Fichtel, C. and Manser, M. (2010). Vocal communication in social groups. In Animal Behaviour:
Evolution and Mechanisms, (ed. P. Kappeler), pp. 29-54: Springer Berlin Heidelberg.
Harcourt, A. H., Stewart, K. J. and Hauser, M. (1993). Functions of wild gorilla 'close' calls. I.
Repertoire, context, and interspecific comparison. Behaviour 124, 89-122.
Heimlich-Boran, J. R. (1993). Social organisation of the short finned pilot-whale, with special
reference to the comparative social ecology of delphinids: Ph.D. thesis. University of Cambridge.
Herzing, D. L. (2000). Acoustics and social behavior of wild dolphins: implications for a sound
society. In Hearing by whales and dolphins, (eds. W. W. L. Au A. N. Popper and R. E. Fay).
London: Springer Press.
Janik, V. M. (2000). Food-related bray calls in wild bottlenose dolphins (Tursiops truncatus).
Proceedings of the Royal Society B 267, 923-927.
Chapter VIII
Page 179Page 179
Jensen et al. Progress Report
Janik, V. M. and Slater, P. J. (1998). Context-specific use suggests that bottlenose dolphin
signature whistles are cohesion calls. Animal Behaviour 56, 829-838.
235
236
237
238
239
240
241
242
243
244
245
246
247
248
249
250
251
252
253
254
255
256
257
258
Johnson, M., de Soto, N. A. and Madsen, P. T. (2009). Studying the behaviour and sensory
ecology of marine mammals using acoustic recording tags: a review. Marine Ecology Progress
Series 395, 55-73.
Johnson, M. P. and Tyack, P. L. (2003). A digital acoustic recording tag for measuring the
response of wild marine mammals to sound. Ieee Journal of Oceanic Engineering 28, 3-12.
Ramos-Fernandez, G. (2005). Vocal communication in a fission-fusion society: Do spider
monkeys stay in touch with close associates? International Journal of Primatology 26, 1077-1092.
Sayigh, L. S., Tyack, P. L., Wells, R. S. and Scott, M. D. (1990). Signature whistles of free-
ranging bottlenose dolphins <i>Tursiops truncatus</i>: stability and mother-offspring
comparisons. Behavioral Ecology and Sociobiology 26, 247-260.
Sayigh, L. S., Tyack, P. L., Wells, R. S., Solow, A. R., Scott, M. D. and Irvine, A. B. (1999).
Individual recognition in wild bottlenose dolphins: a field test using playback experiments. Animal
Behaviour 57, 41-50.
Smolker, R. A., Mann, J. and Smuts, B. B. (1993). Use of signature whistles during separations
and reunions by wild bottlenose dolphin mothers and infants. Behavioral Ecology and Sociobiology
33, 393-402.
Watwood, S. L., Owen, E. C. G., Tyack, P. L. and Wells, R. S. (2005). Signature whistle use by
temporarily restrained and free-swimming bottlenose dolphins, Tursiops truncatus. Animal
Behaviour 69, 1373-1386.
Watwood, S. L., Tyack, P. L. and Wells, R. S. (2004). Whistle sharing in paired male bottlenose
dolphins, Tursiops truncatus. Behavioral Ecology and Sociobiology 55, 531-543.
Page 180Page 180
MARINE ECOLOGY PROGRESS SERIESMar Ecol Prog Ser
Vol. 395: 161–175, 2009doi: 10.3354/meps08204
Published December 3
INTRODUCTION
Marine organisms are exposed to an array of humanpollutants, including increasing levels of anthropo-genic noise (Nowacek et al. 2007, Weilgart 2007, Tyack2008). Most marine vertebrates exploit the low absorp-tion of sound underwater to acquire information abouttheir environment and to communicate (Tyack & Miller2002, Popper 2003, Montgomery et al. 2006). Ceta-ceans, in particular, have evolved auditory and soundproduction systems that allow them to use sound for aseries of vital processes, including communication,navigation and detection of predators or prey (Au1993). This makes cetaceans susceptible to the nega-
tive effects of man-made noise if the exposures causebehavioural or physical changes or impede the processof conveying or acquiring information acoustically(Richardson et al. 1995).
The most widespread source of anthropogenicunderwater noise is that of motorized vessels, whichincludes shipping and increasing numbers of recre-ational and whale-watching boats (NRC 1994, 2003,McCarthy 2004). Vessels generate underwater noisefrom mechanical vibrations of the engine or hull, butmost of the medium- and high-frequency componentsof vessel noise stem from cavitation, a phenomenonwhereby air bubbles form and collapse on the edge offast-moving propeller blades (Ross 1976). The level of
© Inter-Research 2009 · www.int-res.com*Email: [email protected]
Vessel noise effects on delphinid communication
F. H. Jensen1,*, L. Bejder2, M. Wahlberg2, 3, N. Aguilar Soto4, M. Johnson5, P. T. Madsen1, 2, 5
1Zoophysiology, Build. 1131, Department of Biological Sciences, University of Aarhus, 8000 Aarhus C, Denmark2Murdoch University Cetacean Research Unit, Centre for Fish and Fisheries Research, Murdoch University,
6150 Western Australia, Australia3Fjord & Bælt and University of Southern Denmark, Margrethes Plads 1, 5300 Kerteminde, Denmark
4BIOECOMAC, Department of Animal Biology, La Laguna University, Tenerife, Canary Islands, Spain5Woods Hole Oceanographic Institution, Woods Hole, Massachusetts 02543, USA
ABSTRACT: Increasing numbers and speeds of vessels in areas with populations of cetaceans mayhave the cumulative effect of reducing habitat quality by increasing the underwater noise level.Here, we first use digital acoustic tags to demonstrate that free-ranging delphinids in a coastal deep-water habitat are subjected to varying and occasionally intense levels of vessel noise. Vessel noiseand sound propagation measurements from a shallow-water habitat are then used to model thepotential impact of high sound levels from small vessels on delphinid communication in both shallowand deep habitats, with bottlenose dolphins Tursiops sp. and short-finned pilot whales Globicephalamacrorhynchus as model organisms. We find that small vessels travelling at 5 knots in shallow watercan reduce the communication range of bottlenose dolphins within 50 m by 26%. Pilot whales in aquieter deep-water habitat could suffer a reduction in their communication range of 58% caused bya vessel at similar range and speed. Increased cavitation noise at higher speeds drastically increasesthe impact on the communication range. Gear shifts generate high-level transient sounds (peak–peak source levels of up to 200 dB re 1 μPa) that may be audible over many kilometres and may dis-turb close-range animals. We conclude that noise from small vessels can significantly mask acousti-cally mediated communication in delphinids and contribute to the documented negative impacts onanimal fitness.
KEY WORDS: Acoustic communication · Vessel noise · Masking · Bottlenose dolphins · Pilot whales ·Recreational vessels · Whale watching
Resale or republication not permitted without written consent of the publisher
Contribution to the Theme Section ‘Acoustics in marine ecology’ OPENPEN ACCESSCCESS
Chapter IX
Page 181
Page 181
Mar Ecol Prog Ser 395: 161–175, 2009
cavitation noise increases with the speed of the pro-peller and therefore also with the speed of the vessel(Arveson & Vendittis 2000). Since cavitation noise isvery broadband, it overlaps with the frequency rangeof many cetacean sounds (e.g. Aguilar Soto et al. 2006).Given that detection of an acoustic signal is ultimatelylimited by the ambient noise levels in the same fre-quency band as the signal, introducing broadbandanthropogenic noise into the environment will de-crease the chance of detecting a signal and thus maskthe signal for the receiver (Gelfand 2004). If featureswithin the signal convey information, it may be impor-tant to receive the full signal with an adequate signal-to-noise ratio to recognize the signal and resolve theessential features (Brumm & Slabbekoorn 2005). Asambient noise or transmission range increases, infor-mation will be lost at the receiver, ranging from subtlefeatures to complete failure to detect the signal(Gelfand 2004). Consequently, the active space inwhich animals are able to detect the signal of a conspe-cific (Marten & Marler 1977) will decrease withincreased masking noise.
In many coastal areas, motorized vessels used forvarious purposes may constitute an important source ofdisturbance for cetacean populations. As motorizedvessels become faster and more widespread, they con-tribute significantly to the ambient noise level at thecommunication frequencies used by many marine ani-mals (Haviland-Howell et al. 2007). Given the high andincreasing number of vessels in many habitats ofimportance for marine mammals (McCarthy 2004),there is a pressing need to study the impact of boatingactivity on cetaceans and to quantify the mechanismsbehind these impacts (NRC 2005).
Whale-watching vessels constitute a particular typeof vessel traffic that deserves special mention becausethese vessels actively approach and congregatearound specific cetacean populations. Whale-watchingis a growing industry with significant socioeconomicimplications for coastal communities in >119 countries(O’Connor et al. 2009). Even though whale-watchinghas often been termed benign (Hoyt 1993), attentionhas recently focused on the potential disturbance ofcetaceans targeted by this industry. Varying degrees ofbehavioural changes in cetaceans linked to vesselactivities have been shown in short-term studies(Richardson et al. 1995, Nowacek et al. 2001, Bejder &Samuels 2003), and the effects of noise from whale-watching vessels have been addressed (Au & Green2000, Erbe 2002, Buckstaff 2004). However, interpreta-tion of vessel impacts around cetaceans is often con-founded by complex behavioural patterns, lack ofbaseline data, correlations between fitness and theability to react (Stillman & Goss-Custard 2002, Beale &Monaghan 2004), prior displacement of the most sensi-
tive individuals (Bejder et al. 2006a), and even bybiases introduced by the observation platform itself(Bejder & Samuels 2003). A recent study has linkedlong-term declines in dolphin abundance to an in-crease in vessel activity (Bejder 2005, Bejder et al.2006b). The study demonstrated that interpretation ofshort-term studies may lead to erroneous conclusionsabout the actual impact on cetaceans (Bejder 2005,Bejder et al. 2006b). The International Whaling Com-mission (IWC) has recently stated that ‘[t]here is com-pelling evidence that the fitness of individual odonto-cetes repeatedly exposed to whale-watching vesseltraffic can be compromised and that this can lead topopulation level effects’ (IWC 2006, p. 47).
In the present study, we investigate under what cir-cumstances the noise levels generated by small vesselsare sufficient to mask delphinid communication sig-nals. We show that wild cetaceans are routinelyexposed to high noise levels from nearby vessels in thefrequency bands used for communication. We quantifythe source levels produced by 2 small vessels repre-sentative of vessels used in recreation, research andsmall-scale whale-watching, and estimate their poten-tial to impact acoustic communication in 2 commondelphinid species.
MATERIALS AND METHODS
Vessel noise experienced by free-ranging short-finned pilot whales. We deployed digital acousticrecording tags (DTAGs; Johnson & Tyack 2003) onshort-finned pilot whales Globicephala macrorhyn-chus (pilot whales hereafter) off the coast of Tenerife,Canary Islands, Spain, during 2003 and 2005. The tagssampled 16 bit audio at 96 kHz (2003) or 192 kHz(2005). Several sequences of elevated noise levels fromvessels in the vicinity of tagged whales were identi-fied. To document the variability of noise levels experi-enced by free-ranging pilot whales, we quantified thenoise level of 2 sequences of background noise and 6sequences of vessel noise in which the tagged whalemoved little and consequently produced little flownoise. A 50 s window from each sequence, centred onthe point of highest noise intensity, was filtered (2 to12.5 kHz, 4-pole Butterworth filter) and analysed in1 s blocks for RMS (root mean square) noise level incommunication frequencies.
Background noise. We measured background noiselevels in 2 different habitats. Koombana Bay, Bunbury,Western Australia (33° 17’ S, 115° 39’ E) was chosen asrepresentative of a shallow-water habitat close toshore. The bay is close to a busy port and is often fre-quented by recreational boats. Snapping shrimp con-tribute significantly to the underwater noise levels in a
162
Page 182
Page 182
Jensen et al.: Vessel noise effects on delphinid communication
broad frequency band in this habitat. A coastal bot-tlenose dolphin population (Tursiops sp.) resides in andaround the bay, and a single dolphin-watching com-pany operates a daily tour. We suspended a calibratedB&K 8101 hydrophone with preamplifier (–184 dB re1 V μPa–1 sensitivity) in mid-water (3 m depth), 50 mfrom the recording vessel in Sea State 0 (glassy seasurface). The hydrophone was connected through acustom-built, low-noise amplification and filtering box(40 dB gain, bandpass filter: 10 Hz to 50 kHz) to anM-Audio Microtrack 24/96 compact-flash recorder(calibrated peak clip level of 148 dB re 1 μPa), whichdigitized and stored data in 96 kHz/16 bit WAV-formatfiles for later processing. Background noise measure-ments were made when no boats were observed visu-ally 5 min before and after each recording, and whenno cetaceans were detected either visually or acousti-cally during the recordings.
An area off the SW coast of Tenerife in the CanaryIslands was chosen as representative of a deep-waterhabitat. The water depth here falls rapidly to several100s of metres close to the shore. Recordings of ambi-ent noise were made at 2 to 4 km from the coast and ata water depth of >1 km. A population of bottlenosedolphins and >300 short-finned pilot whales residingin this area (Heimlich-Boran & Heimlich-Boran 1990,Heimlich-Boran 1993) are the subjects of a substantialboat-based whale-watching industry. We used a cali-brated Reson TC4032 hydrophone with preamplifier(–172 dB re 1 V μPa–1 sensitivity) connected through afilter and amplifier (40 dB gain, bandpass filter: 100 Hzto 40 kHz) to a digital audio tape recorder (Sony DAT)sampling at 48 kHz (calibrated peak clip level of137 dB re 1 μPa). The hydrophone was lowered fromthe recording platform to a depth of 3 m at Sea State 0.Again, no other vessels or cetaceans were detectedvisually or acoustically within several minutes of anybackground noise recordings.
All data analyses were performed with custom-written Matlab 6.5 scripts. One minute of backgroundnoise for both habitats was divided into 60 non-overlapping 1 s chunks and used to quantify the back-ground noise and the variation resulting from usingshort (1 s) chunks for analysis.
Vessel noise and transmission measurements. Mea-surements of vessel noise were done in Koombana Bayfrom 10 to 16 February 2007. Sound recordings weremade during early morning until noon with a Sea State<2 (smooth sea surface). All measurements were con-ducted approximately 270 m parallel to the coast in 5 to7 m water. The bottom sloped evenly from the shore andconsisted of sand with occasional sea grass patches.
We investigated 2 small boats representative of ves-sels involved in recreational boating, research activi-ties and small-scale whale-watching. The first vessel
(hereafter termed ‘2-stroke’) was a 6.0 m aluminium-hulled vessel equipped with a Mercury 2-stroke,135-horsepower outboard engine. The second vessel(hereafter termed ‘4-stroke’) was a 5.0 m Quintrex alu-minium-hulled vessel propelled by an outboardYamaha 4-stroke, 80-horsepower outboard engine.
Underwater ambient noise levels (the sum of vesselnoise and background noise) were recorded from infront of the source (vessel approaching the recordingplatform) and from the side of the source (vessel cir-cling the recording platform). Each boat was recordedat 3 speeds (2.5, 5 and 10 knots) and at 5 distances fromthe recording platform (10, 30, 50, 100 and 200 m).Marker buoys were moored for range estimation dur-ing vessel approaches, and distance was confirmed bymeasurements with a laser rangefinder. For measure-ments of vessel noise, we suspended a linear array of3 calibrated B&K 8101 hydrophones (0.5, 3 and 5.5 mdepths) from a buoy off the side of the recording ves-sel. The hydrophones were connected through cus-tom-built, low-noise amplification and filtering boxes(variable gain, bandpass filter: 10 Hz to 50 kHz) to a4-channel, 16-bit Wavebook sampling at 150 kHz. Therecording chain had a flat frequency response (±2 dB)from 10 Hz up to 48 kHz and peak clip levels of 145 to166 dB re 1 μPa, depending on amplification settingsand hydrophone. At the end of each day, we recordedplatform noise with no vessels close to the recordingplatform to control for slight changes in backgroundlevels from day to day.
To estimate transmission loss and back-calculatedsource levels (SL) for continuous vessel noise, we fittedthe broadband (0.2 to 40 kHz, 4-pole Butterworth fil-ter) received RMS sound pressure level from the 2 ves-sels approaching or circling at 10 knots to a geometricspreading loss model, SL – k × log(range), to estimatek. Frequency-dependent absorption was ignored forthe low frequencies and short ranges considered here(Urick 1983). Only recordings at 10 knots were used forthe transmission loss estimates to ensure a good signal-to-noise ratio at all ranges. Source levels at speeds of5 knots were calculated from received levels at 10 mdistance and corrected for the derived transmissionloss. Source levels were not estimated for 2.5 knots dueto low signal-to-noise ratio at this speed.
Recordings were analysed in 1 s windows centred atthe time when the vessel passed each of the markerbuoys. Selections were checked for interfering Tur-siops sp. vocalizations, and noise levels were quanti-fied as broadband RMS sound pressure (0.2 to 48 kHz)and RMS sound pressure over the vocalization fre-quency range (2 to 12.5 kHz, 4-pole Butterworth filter)encompassing the frequency band of both model spe-cies. Finally, we filtered (0.2 to 48 kHz, 4-pole Butter-worth filter) and quantified transient sounds from gear
163Chapter IX
Page 183
Page 183
Mar Ecol Prog Ser 395: 161–175, 2009
shifts of vessels at each range by their peak-to-peakpressures (dB re 1 μPapp) and sound exposure levels(dB re 1 μPa2 s–1) and back-calculated these to sourcelevels assuming spherical spreading for these transientsounds (Urick 1983, Madsen et al. 2006).
Impact assessment. Auditory masking occurs whenthe perception of one sound is affected by the presenceof another sound within the same auditory filter band(Gelfand 2004). The mammalian auditory system isusually approximated by a bank of one-third octave fil-ter bands (Fay 1988). Filters with constant fractionalbandwidth are also used for toothed whales to modelthe extent to which detection of pure tones will bemasked by noise, with 1/12 octave (Erbe 2002) to one-third octave filter bands (Richardson et al. 1995, Mad-sen et al. 2006) being applied depending on frequencyrange. For all species where it has been investigated,the critical bandwidth remains constant over a fairlywide range of noise levels so that a 10 dB increase innoise level will result in a 10 dB increase in the detec-tion threshold of the signal (Lohr et al. 2003). In orderto make the present results comparable with the mainbody of existing studies, we approximated the del-phinid auditory system as a bank of one-third octavefilters for communication frequencies. The RMS soundpressure in each one-third octave band is termed theone-third octave level (TOL). For frequencies >2 kHz,the detection thresholds reported for Tursiops spp.(Johnson 1967) are all lower than background TOLs inboth habitats, meaning that detection of whistles inbottlenose dolphins will be limited by ambient noiserather than by the absolute hearing threshold. Thiswas also assumed for pilot whales since no audiogramshave been reported for this species.
In bottlenose dolphins, the fundamental whistle con-tours seem to convey information between the animals(Janik et al. 2006). Bottlenose dolphins use whistlesmodulated between 4 and 20 kHz (Caldwell & Cald-well 1969, Janik & Slater 1998), but fundamentals>10 kHz were only rarely observed in Koombana Bay(F. H. Jensen et al. unpubl. data). Consequently, we in-cluded 5 one-third octave bands with centroid fre-quencies from 4 to 10 kHz to estimate the potentialmasking impacts on bottlenose dolphin communica-tion. Fundamental frequencies of short-finned pilotwhale tonal sounds are reported to be between 2 and14 kHz (Caldwell & Caldwell 1969) or between 6 and11 kHz (Rendell et al. 1999). However, tagged pilotwhales residing around Tenerife regularly use tonalsounds as low as 2 kHz (F. H. Jensen et al. unpubl.data), and we therefore chose to model masking effectson pilot whale communication over 9 one-third octavebands with centroid frequencies from 2 to 12.5 kHz.Frequency bands analysed for the 2 species are de-picted in Fig. 2.
For both species, we assumed that: (1) the whistle ismodulated over the full frequency span and detectionof signal elements in all one-third octave bands is ulti-mately limited by noise; (2) source level and funda-mental frequency do not change in response to ahigher background noise level; (3) the animals have alow receiving directionality at whistling frequencies(Au & Moore 1984); and (4) the communication soundsattenuate spherically according to 20 log(range) trans-mission loss.
Following Madsen et al. (2006), we considered anincrease in the ambient TOL of >3 dB as being capableof significantly masking a narrowband signal. Thisthreshold is reached when the sound intensity gener-ated by a passing vessel equals or exceeds the soundintensity of the background noise so that the totalpower of the 2 noise components (expressed in deci-bels) would be at least 3 dB greater than the back-ground noise component alone. For any receiver, aminimum signal-to-noise ratio (SNR) is necessary forthe detection and processing of a signal. An increase inambient noise means that the receiver has to be closerto the source to maintain the same SNR and the activespace will consequently be smaller. Even when thesource level and absolute range of a communicationsignal is unknown, the relative effect on range due toan increase in in-band ambient noise can be estimated(Møhl 1981, Aguilar Soto et al. 2006). For a narrow-band signal processed by one-third octave filters, wecalculated how much closer a receiver would need tobe in order to maintain the same SNR using Eqs. (1) &(2):
Residual communication range = (1)
Communication range reduction =
(2)
where TOLShip and TOLBG (dB re 1 μPa(RMS)) are theRMS sound pressures for ship noise and backgroundnoise, respectively, measured in one-third octavebands of the signal.
Since the signals of the 2 model species may be mod-ulated over a range of species-specific frequencies, weused 3 different statistics of the recorded vessel noise asproxies to quantify the potential for masking whistles.Measure A: The largest noise level increase in any of
the species-specific TOLs.Measure B: The increase in broadband noise over the
full frequency range of the whistle.Measure C: The smallest noise level increase in any of
the species-specific TOLs.The 3 measures quantify a range of potential mask-
ing effects that may apply to communication sounds:Measure A is an upper boundary estimate of the effectof noise on signalling range. It implies that all the fre-
1 10 20−( )−( )TOLShip TOLBG– /
10 20−( )TOLShip TOLBG– /
164
Page 184
Page 184
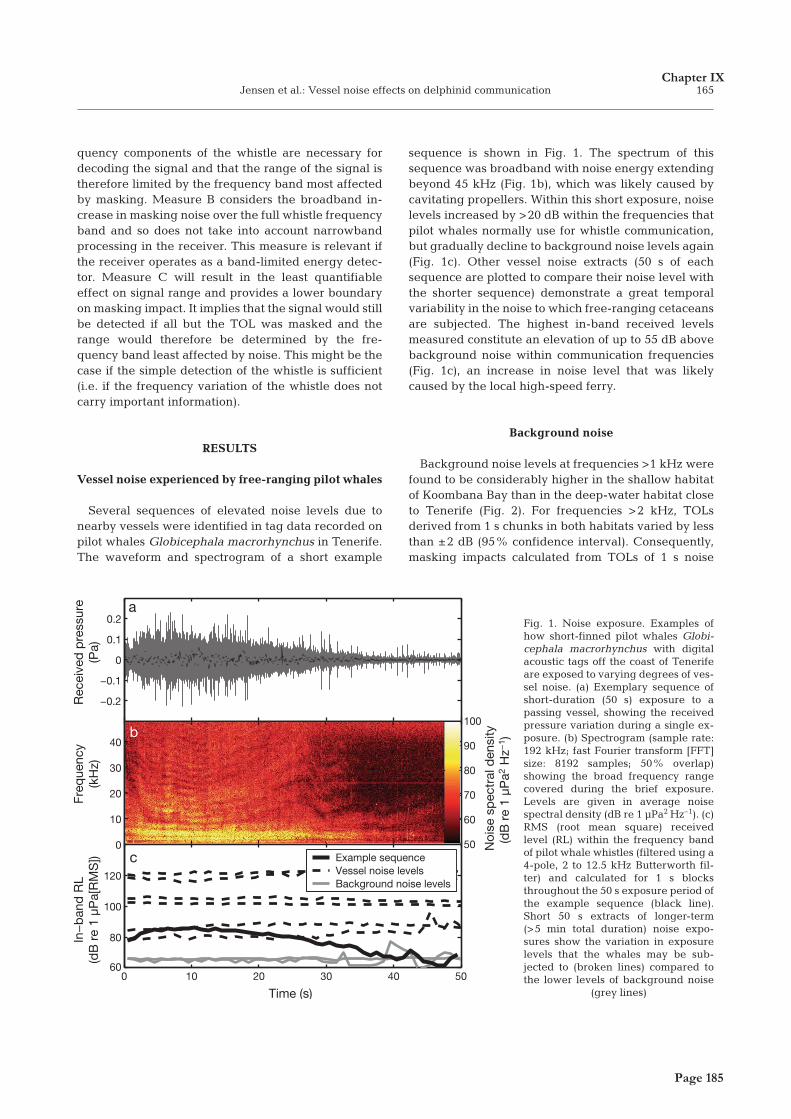
Jensen et al.: Vessel noise effects on delphinid communication
quency components of the whistle are necessary fordecoding the signal and that the range of the signal istherefore limited by the frequency band most affectedby masking. Measure B considers the broadband in-crease in masking noise over the full whistle frequencyband and so does not take into account narrowbandprocessing in the receiver. This measure is relevant ifthe receiver operates as a band-limited energy detec-tor. Measure C will result in the least quantifiableeffect on signal range and provides a lower boundaryon masking impact. It implies that the signal would stillbe detected if all but the TOL was masked and therange would therefore be determined by the fre-quency band least affected by noise. This might be thecase if the simple detection of the whistle is sufficient(i.e. if the frequency variation of the whistle does notcarry important information).
RESULTS
Vessel noise experienced by free-ranging pilot whales
Several sequences of elevated noise levels due tonearby vessels were identified in tag data recorded onpilot whales Globicephala macrorhynchus in Tenerife.The waveform and spectrogram of a short example
sequence is shown in Fig. 1. The spectrum of thissequence was broadband with noise energy extendingbeyond 45 kHz (Fig. 1b), which was likely caused bycavitating propellers. Within this short exposure, noiselevels increased by >20 dB within the frequencies thatpilot whales normally use for whistle communication,but gradually decline to background noise levels again(Fig. 1c). Other vessel noise extracts (50 s of eachsequence are plotted to compare their noise level withthe shorter sequence) demonstrate a great temporalvariability in the noise to which free-ranging cetaceansare subjected. The highest in-band received levelsmeasured constitute an elevation of up to 55 dB abovebackground noise within communication frequencies(Fig. 1c), an increase in noise level that was likelycaused by the local high-speed ferry.
Background noise
Background noise levels at frequencies >1 kHz werefound to be considerably higher in the shallow habitatof Koombana Bay than in the deep-water habitat closeto Tenerife (Fig. 2). For frequencies >2 kHz, TOLsderived from 1 s chunks in both habitats varied by lessthan ±2 dB (95% confidence interval). Consequently,masking impacts calculated from TOLs of 1 s noise
165
−0.2
−0.1
0
0.1
0.2a
Rec
eive
d p
ress
ure
(Pa)
Freq
uenc
y(k
Hz)
0
10
20
30
40
Noi
se s
pec
tral
den
sity
(dB
re
1 μP
a2 H
z−1 )
50
60
70
80
90
100
0 10 20 30 40 5060
80
100
120
In−
ban
d R
L(d
B r
e 1
μPa[
RM
S])
Time (s)
Example sequenceVessel noise levelsBackground noise levels
b
c
Fig. 1. Noise exposure. Examples ofhow short-finned pilot whales Globi-cephala macrorhynchus with digitalacoustic tags off the coast of Tenerifeare exposed to varying degrees of ves-sel noise. (a) Exemplary sequence ofshort-duration (50 s) exposure to apassing vessel, showing the receivedpressure variation during a single ex-posure. (b) Spectrogram (sample rate:192 kHz; fast Fourier transform [FFT]size: 8192 samples; 50% overlap)showing the broad frequency rangecovered during the brief exposure.Levels are given in average noisespectral density (dB re 1 μPa2 Hz–1). (c)RMS (root mean square) receivedlevel (RL) within the frequency bandof pilot whale whistles (filtered using a4-pole, 2 to 12.5 kHz Butterworth fil-ter) and calculated for 1 s blocksthroughout the 50 s exposure period ofthe example sequence (black line).Short 50 s extracts of longer-term(>5 min total duration) noise expo-sures show the variation in exposurelevels that the whales may be sub-jected to (broken lines) compared tothe lower levels of background noise
(grey lines)
Chapter IX
Page 185
Page 185
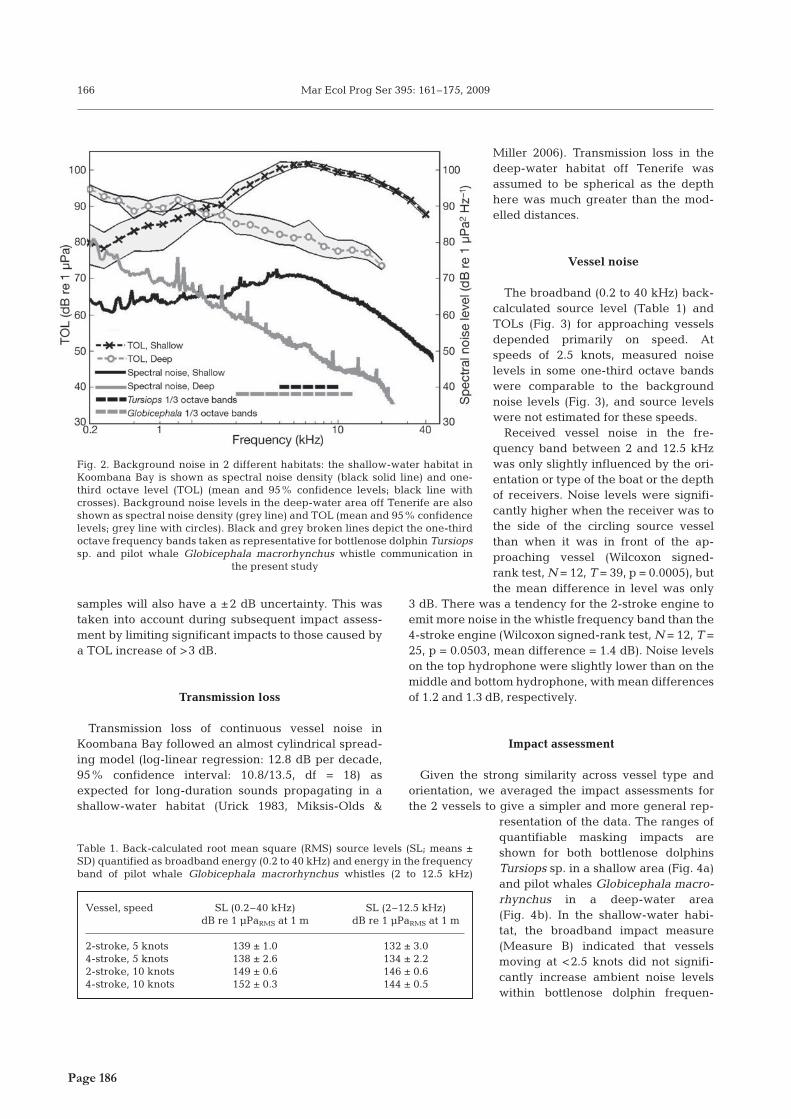
Mar Ecol Prog Ser 395: 161–175, 2009
samples will also have a ±2 dB uncertainty. This wastaken into account during subsequent impact assess-ment by limiting significant impacts to those caused bya TOL increase of >3 dB.
Transmission loss
Transmission loss of continuous vessel noise inKoombana Bay followed an almost cylindrical spread-ing model (log-linear regression: 12.8 dB per decade,95% confidence interval: 10.8/13.5, df = 18) asexpected for long-duration sounds propagating in ashallow-water habitat (Urick 1983, Miksis-Olds &
Miller 2006). Transmission loss in thedeep-water habitat off Tenerife wasassumed to be spherical as the depthhere was much greater than the mod-elled distances.
Vessel noise
The broadband (0.2 to 40 kHz) back-calculated source level (Table 1) andTOLs (Fig. 3) for approaching vesselsdepended primarily on speed. Atspeeds of 2.5 knots, measured noiselevels in some one-third octave bandswere comparable to the backgroundnoise levels (Fig. 3), and source levelswere not estimated for these speeds.
Received vessel noise in the fre-quency band between 2 and 12.5 kHzwas only slightly influenced by the ori-entation or type of the boat or the depthof receivers. Noise levels were signifi-cantly higher when the receiver was tothe side of the circling source vesselthan when it was in front of the ap-proaching vessel (Wilcoxon signed-rank test, N = 12, T = 39, p = 0.0005), butthe mean difference in level was only
3 dB. There was a tendency for the 2-stroke engine toemit more noise in the whistle frequency band than the4-stroke engine (Wilcoxon signed-rank test, N = 12, T =25, p = 0.0503, mean difference = 1.4 dB). Noise levelson the top hydrophone were slightly lower than on themiddle and bottom hydrophone, with mean differencesof 1.2 and 1.3 dB, respectively.
Impact assessment
Given the strong similarity across vessel type andorientation, we averaged the impact assessments forthe 2 vessels to give a simpler and more general rep-
resentation of the data. The ranges ofquantifiable masking impacts areshown for both bottlenose dolphinsTursiops sp. in a shallow area (Fig. 4a)and pilot whales Globicephala macro-rhynchus in a deep-water area(Fig. 4b). In the shallow-water habi-tat, the broadband impact measure(Measure B) indicated that vesselsmoving at <2.5 knots did not signifi-cantly increase ambient noise levelswithin bottlenose dolphin frequen-
166
Fig. 2. Background noise in 2 different habitats: the shallow-water habitat inKoombana Bay is shown as spectral noise density (black solid line) and one-third octave level (TOL) (mean and 95% confidence levels; black line withcrosses). Background noise levels in the deep-water area off Tenerife are alsoshown as spectral noise density (grey line) and TOL (mean and 95% confidencelevels; grey line with circles). Black and grey broken lines depict the one-thirdoctave frequency bands taken as representative for bottlenose dolphin Tursiopssp. and pilot whale Globicephala macrorhynchus whistle communication in
the present study
Vessel, speed SL (0.2–40 kHz) SL (2–12.5 kHz)dB re 1 μPaRMS at 1 m dB re 1 μPaRMS at 1 m
2-stroke, 5 knots 139 ± 1.0 132 ± 3.04-stroke, 5 knots 138 ± 2.6 134 ± 2.22-stroke, 10 knots 149 ± 0.6 146 ± 0.64-stroke, 10 knots 152 ± 0.3 144 ± 0.5
Table 1. Back-calculated root mean square (RMS) source levels (SL; means ±SD) quantified as broadband energy (0.2 to 40 kHz) and energy in the frequencyband of pilot whale Globicephala macrorhynchus whistles (2 to 12.5 kHz)
Page 186
Page 186
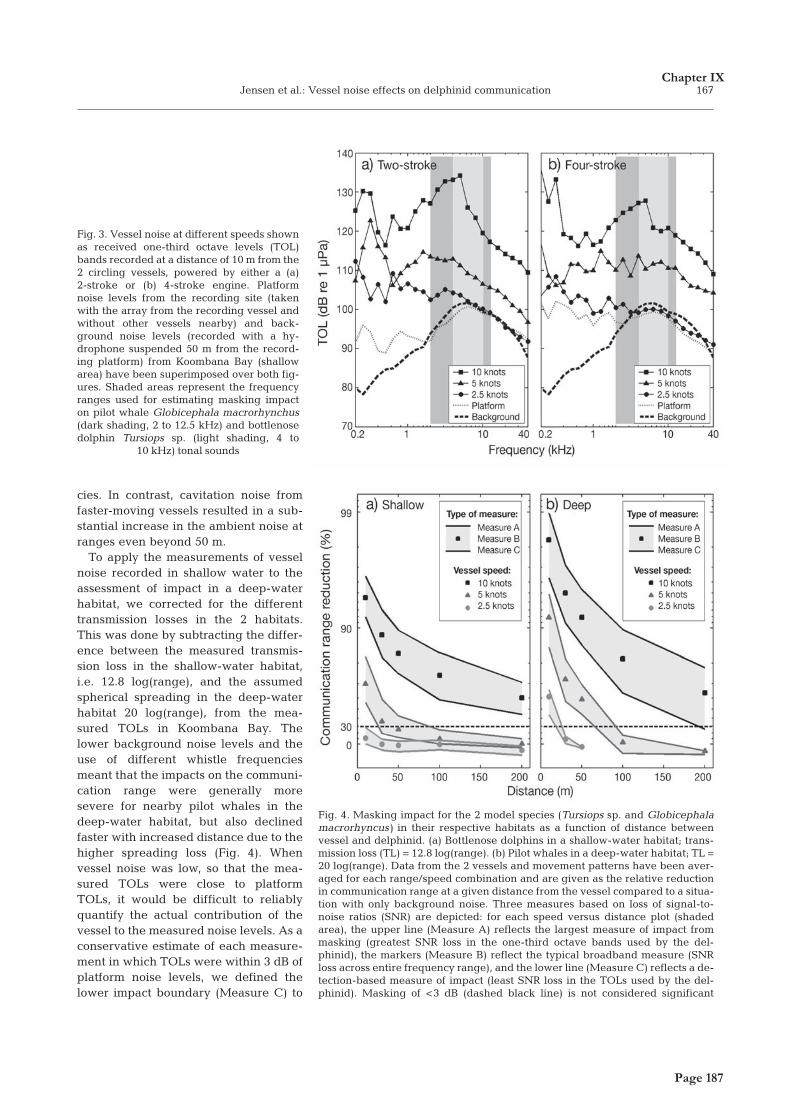
Jensen et al.: Vessel noise effects on delphinid communication
cies. In contrast, cavitation noise fromfaster-moving vessels resulted in a sub-stantial increase in the ambient noise atranges even beyond 50 m.
To apply the measurements of vesselnoise recorded in shallow water to theassessment of impact in a deep-waterhabitat, we corrected for the differenttransmission losses in the 2 habitats.This was done by subtracting the differ-ence between the measured transmis-sion loss in the shallow-water habitat,i.e. 12.8 log(range), and the assumedspherical spreading in the deep-waterhabitat 20 log(range), from the mea-sured TOLs in Koombana Bay. Thelower background noise levels and theuse of different whistle frequenciesmeant that the impacts on the communi-cation range were generally moresevere for nearby pilot whales in thedeep-water habitat, but also declinedfaster with increased distance due to thehigher spreading loss (Fig. 4). Whenvessel noise was low, so that the mea-sured TOLs were close to platformTOLs, it would be difficult to reliablyquantify the actual contribution of thevessel to the measured noise levels. As aconservative estimate of each measure-ment in which TOLs were within 3 dB ofplatform noise levels, we defined thelower impact boundary (Measure C) to
167
Fig. 3. Vessel noise at different speeds shownas received one-third octave levels (TOL)bands recorded at a distance of 10 m from the2 circling vessels, powered by either a (a)2-stroke or (b) 4-stroke engine. Platformnoise levels from the recording site (takenwith the array from the recording vessel andwithout other vessels nearby) and back-ground noise levels (recorded with a hy-drophone suspended 50 m from the record-ing platform) from Koombana Bay (shallowarea) have been superimposed over both fig-ures. Shaded areas represent the frequencyranges used for estimating masking impacton pilot whale Globicephala macrorhynchus(dark shading, 2 to 12.5 kHz) and bottlenosedolphin Tursiops sp. (light shading, 4 to
10 kHz) tonal sounds
Fig. 4. Masking impact for the 2 model species (Tursiops sp. and Globicephalamacrorhyncus) in their respective habitats as a function of distance betweenvessel and delphinid. (a) Bottlenose dolphins in a shallow-water habitat; trans-mission loss (TL) = 12.8 log(range). (b) Pilot whales in a deep-water habitat; TL =20 log(range). Data from the 2 vessels and movement patterns have been aver-aged for each range/speed combination and are given as the relative reductionin communication range at a given distance from the vessel compared to a situa-tion with only background noise. Three measures based on loss of signal-to-noise ratios (SNR) are depicted: for each speed versus distance plot (shadedarea), the upper line (Measure A) reflects the largest measure of impact frommasking (greatest SNR loss in the one-third octave bands used by the del-phinid), the markers (Measure B) reflect the typical broadband measure (SNRloss across entire frequency range), and the lower line (Measure C) reflects a de-tection-based measure of impact (least SNR loss in the TOLs used by the del-phinid). Masking of <3 dB (dashed black line) is not considered significant
Chapter IX
Page 187
Page 187
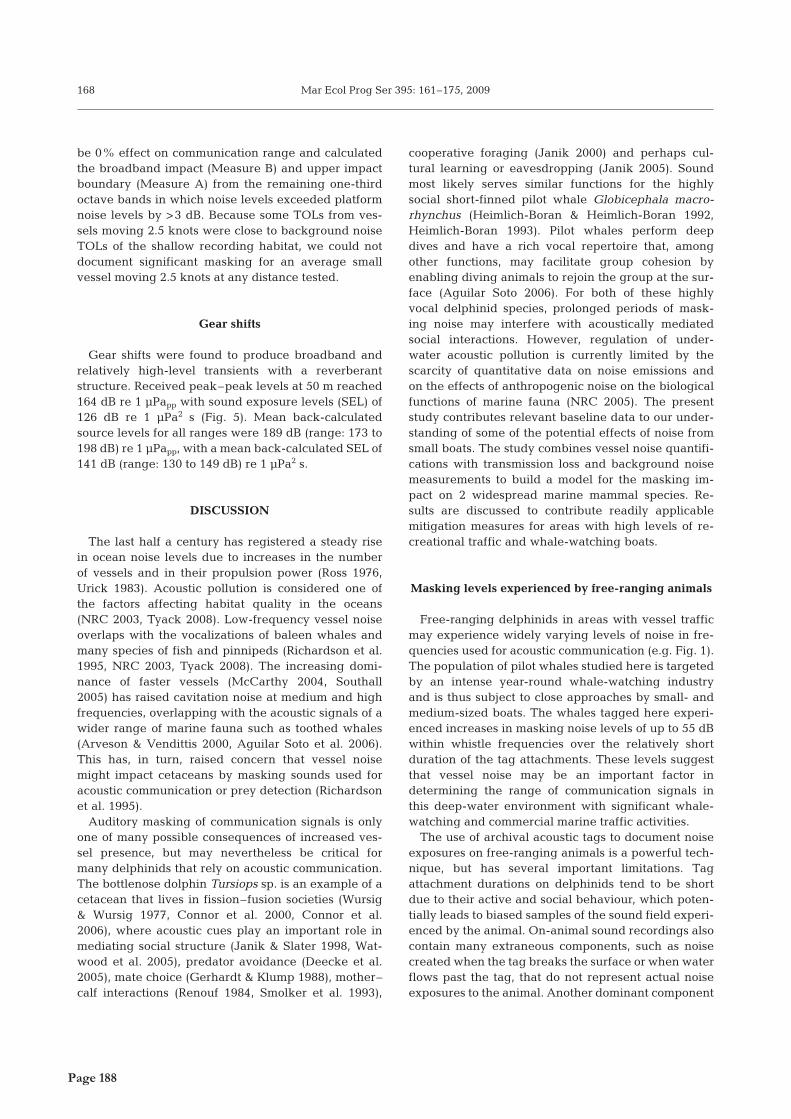
Mar Ecol Prog Ser 395: 161–175, 2009
be 0% effect on communication range and calculatedthe broadband impact (Measure B) and upper impactboundary (Measure A) from the remaining one-thirdoctave bands in which noise levels exceeded platformnoise levels by >3 dB. Because some TOLs from ves-sels moving 2.5 knots were close to background noiseTOLs of the shallow recording habitat, we could notdocument significant masking for an average smallvessel moving 2.5 knots at any distance tested.
Gear shifts
Gear shifts were found to produce broadband andrelatively high-level transients with a reverberantstructure. Received peak–peak levels at 50 m reached164 dB re 1 μPapp with sound exposure levels (SEL) of126 dB re 1 μPa2 s (Fig. 5). Mean back-calculatedsource levels for all ranges were 189 dB (range: 173 to198 dB) re 1 μPapp, with a mean back-calculated SEL of141 dB (range: 130 to 149 dB) re 1 μPa2 s.
DISCUSSION
The last half a century has registered a steady risein ocean noise levels due to increases in the numberof vessels and in their propulsion power (Ross 1976,Urick 1983). Acoustic pollution is considered one ofthe factors affecting habitat quality in the oceans(NRC 2003, Tyack 2008). Low-frequency vessel noiseoverlaps with the vocalizations of baleen whales andmany species of fish and pinnipeds (Richardson et al.1995, NRC 2003, Tyack 2008). The increasing domi-nance of faster vessels (McCarthy 2004, Southall2005) has raised cavitation noise at medium and highfrequencies, overlapping with the acoustic signals of awider range of marine fauna such as toothed whales(Arveson & Vendittis 2000, Aguilar Soto et al. 2006).This has, in turn, raised concern that vessel noisemight impact cetaceans by masking sounds used foracoustic communication or prey detection (Richardsonet al. 1995).
Auditory masking of communication signals is onlyone of many possible consequences of increased ves-sel presence, but may nevertheless be critical formany delphinids that rely on acoustic communication.The bottlenose dolphin Tursiops sp. is an example of acetacean that lives in fission–fusion societies (Wursig& Wursig 1977, Connor et al. 2000, Connor et al.2006), where acoustic cues play an important role inmediating social structure (Janik & Slater 1998, Wat-wood et al. 2005), predator avoidance (Deecke et al.2005), mate choice (Gerhardt & Klump 1988), mother–calf interactions (Renouf 1984, Smolker et al. 1993),
cooperative foraging (Janik 2000) and perhaps cul-tural learning or eavesdropping (Janik 2005). Soundmost likely serves similar functions for the highlysocial short-finned pilot whale Globicephala macro-rhynchus (Heimlich-Boran & Heimlich-Boran 1992,Heimlich-Boran 1993). Pilot whales perform deepdives and have a rich vocal repertoire that, amongother functions, may facilitate group cohesion byenabling diving animals to rejoin the group at the sur-face (Aguilar Soto 2006). For both of these highlyvocal delphinid species, prolonged periods of mask-ing noise may interfere with acoustically mediatedsocial interactions. However, regulation of under-water acoustic pollution is currently limited by thescarcity of quantitative data on noise emissions andon the effects of anthropogenic noise on the biologicalfunctions of marine fauna (NRC 2005). The presentstudy contributes relevant baseline data to our under-standing of some of the potential effects of noise fromsmall boats. The study combines vessel noise quantifi-cations with transmission loss and background noisemeasurements to build a model for the masking im-pact on 2 widespread marine mammal species. Re-sults are discussed to contribute readily applicablemitigation measures for areas with high levels of re-creational traffic and whale-watching boats.
Masking levels experienced by free-ranging animals
Free-ranging delphinids in areas with vessel trafficmay experience widely varying levels of noise in fre-quencies used for acoustic communication (e.g. Fig. 1).The population of pilot whales studied here is targetedby an intense year-round whale-watching industryand is thus subject to close approaches by small- andmedium-sized boats. The whales tagged here experi-enced increases in masking noise levels of up to 55 dBwithin whistle frequencies over the relatively shortduration of the tag attachments. These levels suggestthat vessel noise may be an important factor indetermining the range of communication signals inthis deep-water environment with significant whale-watching and commercial marine traffic activities.
The use of archival acoustic tags to document noiseexposures on free-ranging animals is a powerful tech-nique, but has several important limitations. Tagattachment durations on delphinids tend to be shortdue to their active and social behaviour, which poten-tially leads to biased samples of the sound field experi-enced by the animal. On-animal sound recordings alsocontain many extraneous components, such as noisecreated when the tag breaks the surface or when waterflows past the tag, that do not represent actual noiseexposures to the animal. Another dominant component
168
Page 188
Page 188
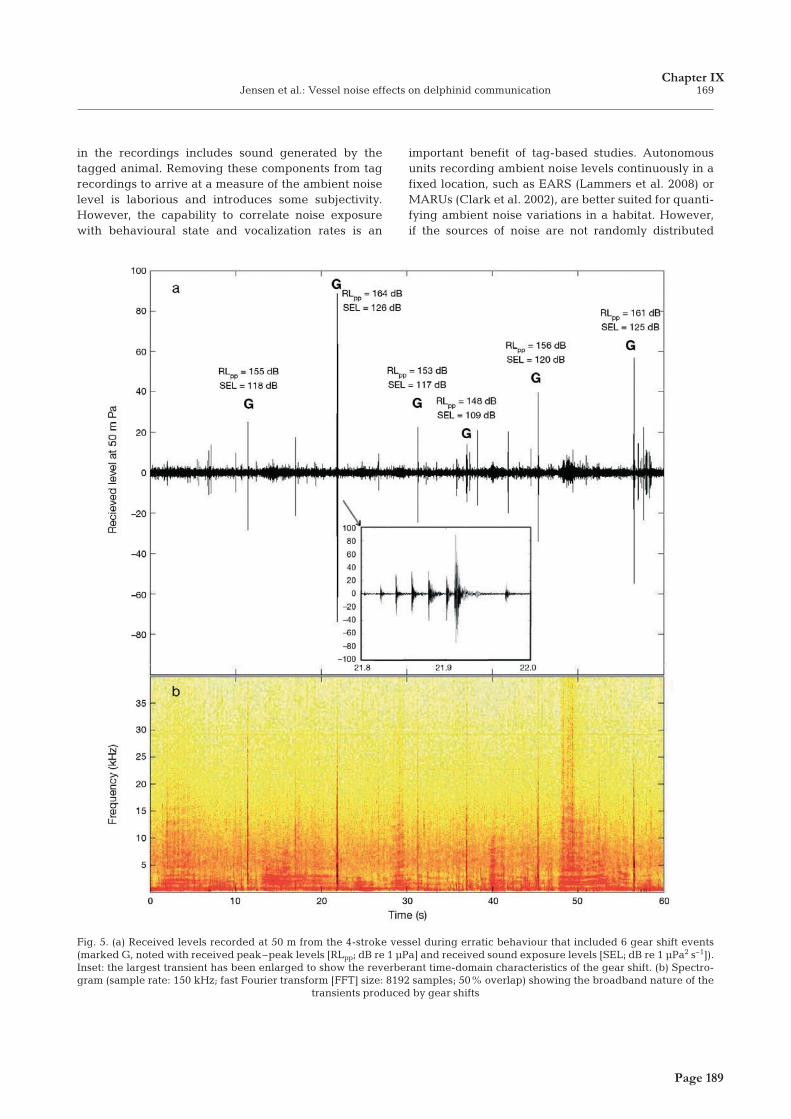
Jensen et al.: Vessel noise effects on delphinid communication
in the recordings includes sound generated by thetagged animal. Removing these components from tagrecordings to arrive at a measure of the ambient noiselevel is laborious and introduces some subjectivity.However, the capability to correlate noise exposurewith behavioural state and vocalization rates is an
important benefit of tag-based studies. Autonomousunits recording ambient noise levels continuously in afixed location, such as EARS (Lammers et al. 2008) orMARUs (Clark et al. 2002), are better suited for quanti-fying ambient noise variations in a habitat. However,if the sources of noise are not randomly distributed
169
Fig. 5. (a) Received levels recorded at 50 m from the 4-stroke vessel during erratic behaviour that included 6 gear shift events(marked G, noted with received peak–peak levels [RLpp; dB re 1 μPa] and received sound exposure levels [SEL; dB re 1 μPa2 s–1]).Inset: the largest transient has been enlarged to show the reverberant time-domain characteristics of the gear shift. (b) Spectro-gram (sample rate: 150 kHz; fast Fourier transform [FFT] size: 8192 samples; 50% overlap) showing the broadband nature of the
transients produced by gear shifts
Chapter IX
Page 189
Page 189
Mar Ecol Prog Ser 395: 161–175, 2009
through the habitat but rather concentrated aroundcetaceans, as is the case for whale-watch vessels,autonomous recorders will provide measures of am-bient noise that do not represent what the animalsexperience.
One downside of using recordings from archival tagsor autonomous acoustic recorders is the difficulty inascribing changes in noise levels to identified sourcesin the environment. To better understand how a singlesource, such as a vessel, affects the ambient noise lev-els impinging on an animal, it is more robust to mea-sure the noise source properties and model their con-tribution to a given noise exposure to the animal. In thefollowing, we discuss several parameters required tomodel the effect of noise on marine mammal communi-cation: (1) measurements of the background noiselevel experienced by the animal; (2) estimates of thesource level of the noise source under representativeoperating conditions and measurements of soundpropagation through the model habitat; and (3) knowl-edge on how increased sound levels may affect thedetection and recognition of acoustic signals used bythe animal.
Background noise in shallow and deep water
The deep-water habitat off the coast of Tenerife wasfound to be much quieter than the shallow-water habi-tat of Koombana Bay (Fig. 1). The smaller transmissionloss (12.8 dB per logarithmic increase in distance)imposed on continuous noise sources in the shallow-water area implies that vessel noise would propagatefurther, thus elevating noise levels further from thesource. The abundant snapping shrimp in KoombanaBay also contributed to the difference in noise levels.
All background noise measurements in the presentstudy are based on measurement periods restricted to1 min from each habitat where no recreational vesselsor dolphin sounds were evident, so as to prevent suchintermittent sound sources from affecting measure-ments of background noise levels. Ambient noise isknown to fluctuate over time (Parks et al. 2009) de-pending on weather (Knudsen et al. 1948, Richardsonet al. 1995), daily, or seasonal variations in biologicalsounds such as those from snapping shrimp or whales(Everest et al. 1948, Au & Green 2000) and on changesin anthropogenic activities (Holt et al. 2009). However,the measured background noise levels in the shallow-water environment (Fig. 2) for frequencies >2 to 3 kHzwere similar to the noise levels recorded in low-speedvessel trials (Fig. 3) measured on different days withsimilar weather conditions, suggesting that our evalu-ations of vessel impacts are representative for theseconditions.
Vessel noise and transmission loss
The 2 outboard vessels investigated here emittedsimilar noise levels, with broadband (0.2 to 40 kHz)and in-band (2 to 12.5 kHz) noise emissions that wereprimarily determined by vessel speed as found in otherstudies (Ross 1976, Erbe 2002). Vessel noise sufferedclose to cylindrical spreading loss when propagatingthrough the shallow-water habitat so that source levelswould be overestimated if they were back-calculatedfrom received levels in the present study, using thestandard assumption of 20 log(range) spreading loss.Received noise levels were similar at different depthsof the water column (0.5 to 5.5 m in a water column of6 m depth), meaning that this would not offer del-phinids any vertical refuge from increased noise levelsin the shallow habitat, except very close to the surfacewhere the pressure release and Lloyd mirror effect(Urick 1983) might reduce noise levels. In contrast,stratification of water layers in a deep-water areacauses differences in sound speed, making it likelythat noise levels will vary throughout the water columnthat deep-diving cetaceans, such as pilot whales,utilize. Since sound refraction influences both signalsand noise, models that include the relative position ofsource, receiver and noise sources would be requiredto uncover the consequences for impact estimates.
Au & Green (2000) measured noise emissions atspeeds of 10 knots from similar vessels with outboardengines. They found back-calculated TOLs between2 and 6 kHz to be about 160 dB re 1 μPa at 1 m as-suming spherical spreading loss. This is almost 20 dBhigher than the TOLs in the present study (Fig. 3) cor-rected for the measured transmission loss of 12.3 dB.Likewise, Williams et al. (2002) estimated muchhigher source levels of a small vessel for speeds of 3and 12 knots, while also assuming spherical spread-ing loss. While it is possible that vessels in these 2studies were louder than the vessels investigatedhere, the discrepancy illustrates the importance ofmeasuring transmission loss along with vessel noiseemissions when estimating vessel source levels, bothto facilitate data comparisons and to subsequentlymodel noise propagation.
Masking impacts
In-band received noise levels for vessel speeds of2.5 knots were close to background noise levels andonly impacted the communication range at very closerange. Our model indicates that vessels moving at anintermediate speed of 5 knots will reduce the commu-nication range of shallow-water dolphins within 50 mby 26%. A range of 50 m corresponds to the recom-
170
Page 190
Page 190
Jensen et al.: Vessel noise effects on delphinid communication
mended minimum distance for vessels near delphinidsin many areas (Garrod & Fennell 2004). Our resultssupport that speed limits <5 knots within these dis-tances do indeed reduce the potential masking of com-munication signals for delphinids, although a potentiallong-term impact of any low-level masking still cannotbe discounted. If vessel speed is increased to 10 knots,cavitation noise increases across a broad spectrum offrequencies (Fig. 3) and impacts acoustic communica-tion at much greater distances (Fig. 4). These reduc-tions in communication range rely on an approxima-tion of 20 log(range) spreading loss for both habitats. Inthe shallow-water habitat, this approximation may notnecessarily be valid since reflections from the surfaceand bottom will add up with the direct signal duringpropagation, shifting the transmission loss towards thelower transmission loss found for continuous vesselnoise (Urick 1983). If communication signals encoun-tered a transmission loss of <20 log(range), the actualreduction in communication range for a given increasein noise levels would be decreased.
The variability of cetacean signalling and the sparseinformation available on their auditory processingintroduce some uncertainties in the assessment ofnoise impacts. To account for species-specific fre-quency use and auditory processing, we integratednoise in one-third octave bands covering the funda-mental frequencies of whistles for the 2 model species.Masking impacts were modelled on the fundamentalwhistle contour because this has been shown to conveyimportant information between animals (Janik et al.2006). It is possible that some species put more acousticenergy into the harmonics than in the fundamentalcontour (Lammers et al. 2003), but it is unknown howinformation is distributed between the fundamentalcontour and the harmonics. Our assumption that noisemasking narrow band signals is integrated by theauditory system over one-third octave bands roughlycorresponds to the critical bandwidths found in bot-tlenose dolphins (Johnson 1968). Some other toothedwhales seem to have quite different auditory band-widths, especially at higher frequencies (e.g. por-poises; Popov et al. 2006). The implications of narrowerauditory filters (higher quality, as quantified by the Q-value) would be that the upper (Measure A) and lower(Measure C) impact estimates for the present study(Fig. 4) were moved further apart, increasing the un-certainty as to the potential for masking of communica-tion signals.
Anthropogenic sources have changed ocean ambi-ent noises significantly over the last 50 yr (NRC 2003).The temporal scale of these changes is comparable toonly a few life spans of delphinids (60 yr for femalepilot whales and 20 to 30 yr for smaller delphinids),meaning that evolutionary adaptations to higher
ambient noise levels are unlikely to have occurred.However, temporary changes in signalling mayenable animals to cope with different noise levels(Miksis-Olds & Tyack 2009). Many animal species,including birds (Brumm & Todt 2002, Slabbekoorn &Peet 2003) and frogs (Sun & Narins 2005, Bee &Swanson 2007), change the frequency content orsource level of their sounds to decrease the maskingeffects of anthropogenic noise whenever possible.Given the importance of acoustic communication formany cetaceans, they will likely also attempt to com-pensate for increased masking noise by changing thefrequency, source level, redundancy, or timing of theirsignals (Lesage et al. 1999, Foote et al. 2004, Morisakaet al. 2005, Holt et al. 2009). This vocal plasticity is notyet fully understood, and its extent will depend on theability of the cetacean to change source characteris-tics as well as the costs associated with such compen-sations. Changes in frequency use will alter the mask-ing level of background noise and the energy lostto sound absorption. On the other hand, increasingcall amplitude or redundancy may be metabolicallyexpensive and requires that communication range isnot already maximized. While changes in signal para-meters may adequately compensate for small in-creases in masking noise and are not likely to haveany adverse effects during short periods of time, theymay not be sufficient to compensate for more severelevels of masking (Wartzok et al. 2003). Measure Cprovides a lower boundary on the reduction in com-munication range that might be applicable if the ani-mal shifted its energy to the one-third octave band,where noise levels were least affected by the nearbyvessel. However, as in human communication, thereare likely multiple layers of information available inthe communication signals made by delphinids. Lossof signal intelligibility, as well as accessory cues suchas the bearing, behavioural state, or identity of thecaller, will be gradual and may occur at much smallerincrements in ambient noise than those that wouldpreclude detection of the sound altogether. It is cur-rently unknown whether or how such progressive lossof information transforms animal behaviour or leads tolong-term population effects (Brumm & Slabbekoorn2005).
Other acoustic vessel impacts
In addition to broadband masking noise, vessels pro-duce occasional high level transients that could poten-tially impact cetaceans by causing behavioural disrup-tion at substantial ranges. The high back-calculatedgear shift source levels of up to 200 dB re 1 μPapp arenot likely to cause temporary threshold shifts in
171Chapter IX
Page 191
Page 191
Mar Ecol Prog Ser 395: 161–175, 2009
toothed whales (Finneran et al. 2000), but could causebehavioural disruption (Richardson et al. 1995).Whale-watching vessels focusing on dolphins mayswitch gears as often as every 21 s to maintain theirposition with respect to the nearby animals (Bejderet al. 2006b). Vessels behaving unpredictably tend toelicit more powerful short-term responses (Williams etal. 2002), and so steps taken to lessen the erratic move-ment and number of gear shifts of vessels that repeat-edly approach wild animals will lessen the impact onthese animals.
Since vessels may be audible over much longer dis-tances than expressed by the masking range estimatedhere, delphinids may potentially react to vessels atmuch greater distances (Richardson et al. 1995, Erbe2002). While behavioural reactions may be beneficialto the animals in some respects, by preventing colli-sions and avoiding areas with high levels of noise, theymay also have detrimental effects on the animals bydisplacing animals from preferred feeding or breedinghabitats and by altering their behavioural time budget(Lusseau 2003, Bejder 2005, Lusseau et al. 2009). Anadditional factor not considered here is that the high-frequency noise generated by cavitation has the poten-tial to impact foraging toothed whales by maskingweak echoes from their echolocation signals, whichmay have a direct bearing on the fitness of the animal(Aguilar Soto et al. 2006). While the noise levels andconsequent masking impacts presented in this papermay not necessarily be the most important reason fordecreased fitness in delphinids frequented by vessels,they may serve as an overall proxy for negative effectsof boat presence around cetaceans and, thus, may beindicative of the potential habitat degradation associ-ated with anthropogenic noise. Conversely, measurestaken to reduce the exposure of cetacean populationsto vessel noise will reduce the behavioural impact onexposed animals.
Implications and relevance
The vessels investigated here are representative oftypical recreational and coastal research vessels, aswell as some smaller whale-watch vessels. Recre-ational boating is both widespread and increasing inmany areas with coastal delphinids (McCarthy 2004)and has been identified as the most important contrib-utor to mid-frequency ambient noise in some coastalhabitats (Haviland-Howell et al. 2007, Miksis-Olds etal. 2007). Since many small populations of delphinidsare located near shore, it is essential to evaluate thefrequency of vessel traffic and the noise contributionfrom each vessel to estimate the total noise exposure toresident populations.
The whale-watching industry is another importantcontributor to underwater noise levels in certain ceta-cean habitats. Vessel noise emissions at a given speedcan vary greatly in level and frequency compositiondepending on vessel, engine and propeller types (Ross1976). Larger whale-watch vessels with inboard en-gines may emit comparable or slightly less noise thanthe outboard boats studied here within the frequencybands of delphinids (Au & Green 2000). However,cetacean populations in areas with whale-watchingare often visited by boats for prolonged periods andmay be approached by several boats at once. Singlegroups of pilot whales in Tenerife may be followed bydifferent whale-watching vessels for hours (AguilarSoto et al. 2001), while up to 120 boats at a time havebeen observed following killer whale groups inCanada (Koski 2004). The effects of such heavy whale-watching activity is currently unknown, but even amoderate increase from 1 to 2 tour companies has beenshown to have a negative long-term effect on bot-tlenose dolphin fitness, displacing sensitive individualsand reducing calf recruitment of the remaining indi-viduals (Bejder 2005, Bejder et al. 2006b). Still otherhabitats show signs of long-term declines in local pop-ulations that may also be caused by high-intensitytourism (Lusseau et al. 2006). Results presented herecorroborate the guidelines for sustainable dolphin-watching that some areas already utilize (Garrod &Fennell 2004) by showing that masking impacts fromsingle vessels are minimized by maintaining speeds<5 knots and keeping >50 m distance between ani-mals and vessels. Unfortunately, our study cannot ad-dress the cumulative effects of multiple whale-watchvessels overlapping with each other, nor can it accountfor vessels with unusual noise emissions or that ap-proach whales inadvertently. Further studies that in-vestigate the prevalence and severity of masking noiselevels under natural conditions, by measuring or esti-mating the noise budget of free-ranging toothedwhales, will improve our understanding of the acousticconsequences of focused whale-watch activities.
Finally, close focal follow techniques are often usedby scientists studying free-ranging cetaceans. Sincesmall motorized vessels are often used for these stud-ies, the nearby animals may encounter similar maskingeffects to those quantified here. Following an animal ata distance and at slow speeds of 2.5 knots will cause lit-tle masking of delphinid communication, but followinga dolphin at close range for a long time and at greaterspeeds could significantly impede acoustic contactbetween the focal individual and conspecifics, in addi-tion to any effects of stress from the persistent boatpresence to which the animal may be subjected. Thus,our data suggest that the behaviour and noise profilesof research vessels may be a source of potential bias in
172
Page 192
Page 192
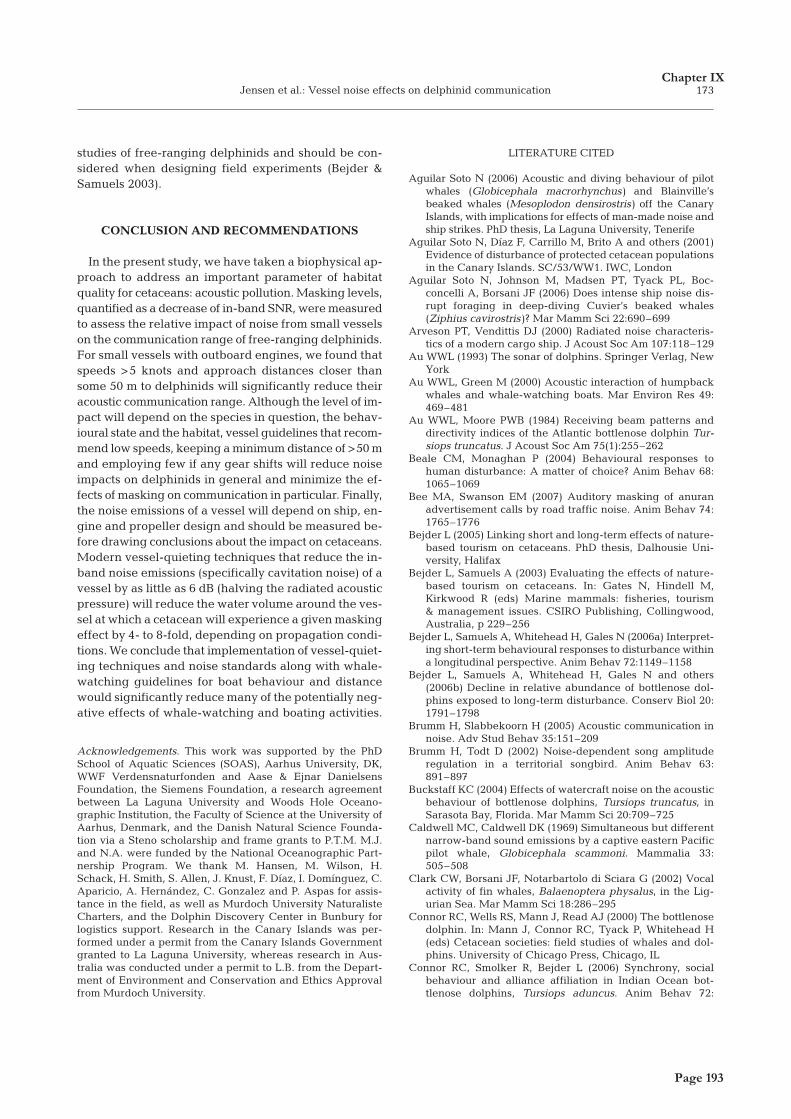
Jensen et al.: Vessel noise effects on delphinid communication
studies of free-ranging delphinids and should be con-sidered when designing field experiments (Bejder &Samuels 2003).
CONCLUSION AND RECOMMENDATIONS
In the present study, we have taken a biophysical ap-proach to address an important parameter of habitatquality for cetaceans: acoustic pollution. Masking levels,quantified as a decrease of in-band SNR, were measuredto assess the relative impact of noise from small vesselson the communication range of free-ranging delphinids.For small vessels with outboard engines, we found thatspeeds >5 knots and approach distances closer thansome 50 m to delphinids will significantly reduce theiracoustic communication range. Although the level of im-pact will depend on the species in question, the behav-ioural state and the habitat, vessel guidelines that recom-mend low speeds, keeping a minimum distance of >50 mand employing few if any gear shifts will reduce noiseimpacts on delphinids in general and minimize the ef-fects of masking on communication in particular. Finally,the noise emissions of a vessel will depend on ship, en-gine and propeller design and should be measured be-fore drawing conclusions about the impact on cetaceans.Modern vessel-quieting techniques that reduce the in-band noise emissions (specifically cavitation noise) of avessel by as little as 6 dB (halving the radiated acousticpressure) will reduce the water volume around the ves-sel at which a cetacean will experience a given maskingeffect by 4- to 8-fold, depending on propagation condi-tions. We conclude that implementation of vessel-quiet-ing techniques and noise standards along with whale-watching guidelines for boat behaviour and distancewould significantly reduce many of the potentially neg-ative effects of whale-watching and boating activities.
Acknowledgements. This work was supported by the PhDSchool of Aquatic Sciences (SOAS), Aarhus University, DK,WWF Verdensnaturfonden and Aase & Ejnar DanielsensFoundation, the Siemens Foundation, a research agreementbetween La Laguna University and Woods Hole Oceano-graphic Institution, the Faculty of Science at the University ofAarhus, Denmark, and the Danish Natural Science Founda-tion via a Steno scholarship and frame grants to P.T.M. M.J.and N.A. were funded by the National Oceanographic Part-nership Program. We thank M. Hansen, M. Wilson, H.Schack, H. Smith, S. Allen, J. Knust, F. Díaz, I. Domínguez, C.Aparicio, A. Hernández, C. Gonzalez and P. Aspas for assis-tance in the field, as well as Murdoch University NaturalisteCharters, and the Dolphin Discovery Center in Bunbury forlogistics support. Research in the Canary Islands was per-formed under a permit from the Canary Islands Governmentgranted to La Laguna University, whereas research in Aus-tralia was conducted under a permit to L.B. from the Depart-ment of Environment and Conservation and Ethics Approvalfrom Murdoch University.
LITERATURE CITED
Aguilar Soto N (2006) Acoustic and diving behaviour of pilotwhales (Globicephala macrorhynchus) and Blainville’sbeaked whales (Mesoplodon densirostris) off the CanaryIslands, with implications for effects of man-made noise andship strikes. PhD thesis, La Laguna University, Tenerife
Aguilar Soto N, Díaz F, Carrillo M, Brito A and others (2001)Evidence of disturbance of protected cetacean populationsin the Canary Islands. SC/53/WW1. IWC, London
Aguilar Soto N, Johnson M, Madsen PT, Tyack PL, Boc-concelli A, Borsani JF (2006) Does intense ship noise dis-rupt foraging in deep-diving Cuvier’s beaked whales(Ziphius cavirostris)? Mar Mamm Sci 22:690–699
Arveson PT, Vendittis DJ (2000) Radiated noise characteris-tics of a modern cargo ship. J Acoust Soc Am 107:118–129
Au WWL (1993) The sonar of dolphins. Springer Verlag, NewYork
Au WWL, Green M (2000) Acoustic interaction of humpbackwhales and whale-watching boats. Mar Environ Res 49:469–481
Au WWL, Moore PWB (1984) Receiving beam patterns anddirectivity indices of the Atlantic bottlenose dolphin Tur-siops truncatus. J Acoust Soc Am 75(1):255–262
Beale CM, Monaghan P (2004) Behavioural responses tohuman disturbance: A matter of choice? Anim Behav 68:1065–1069
Bee MA, Swanson EM (2007) Auditory masking of anuranadvertisement calls by road traffic noise. Anim Behav 74:1765–1776
Bejder L (2005) Linking short and long-term effects of nature-based tourism on cetaceans. PhD thesis, Dalhousie Uni-versity, Halifax
Bejder L, Samuels A (2003) Evaluating the effects of nature-based tourism on cetaceans. In: Gates N, Hindell M,Kirkwood R (eds) Marine mammals: fisheries, tourism& management issues. CSIRO Publishing, Collingwood,Australia, p 229–256
Bejder L, Samuels A, Whitehead H, Gales N (2006a) Interpret-ing short-term behavioural responses to disturbance withina longitudinal perspective. Anim Behav 72:1149–1158
Bejder L, Samuels A, Whitehead H, Gales N and others(2006b) Decline in relative abundance of bottlenose dol-phins exposed to long-term disturbance. Conserv Biol 20:1791–1798
Brumm H, Slabbekoorn H (2005) Acoustic communication innoise. Adv Stud Behav 35:151–209
Brumm H, Todt D (2002) Noise-dependent song amplituderegulation in a territorial songbird. Anim Behav 63:891–897
Buckstaff KC (2004) Effects of watercraft noise on the acousticbehaviour of bottlenose dolphins, Tursiops truncatus, inSarasota Bay, Florida. Mar Mamm Sci 20:709–725
Caldwell MC, Caldwell DK (1969) Simultaneous but differentnarrow-band sound emissions by a captive eastern Pacificpilot whale, Globicephala scammoni. Mammalia 33:505–508
Clark CW, Borsani JF, Notarbartolo di Sciara G (2002) Vocalactivity of fin whales, Balaenoptera physalus, in the Lig-urian Sea. Mar Mamm Sci 18:286–295
Connor RC, Wells RS, Mann J, Read AJ (2000) The bottlenosedolphin. In: Mann J, Connor RC, Tyack P, Whitehead H(eds) Cetacean societies: field studies of whales and dol-phins. University of Chicago Press, Chicago, IL
Connor RC, Smolker R, Bejder L (2006) Synchrony, socialbehaviour and alliance affiliation in Indian Ocean bot-tlenose dolphins, Tursiops aduncus. Anim Behav 72:
173Chapter IX
Page 193
Page 193
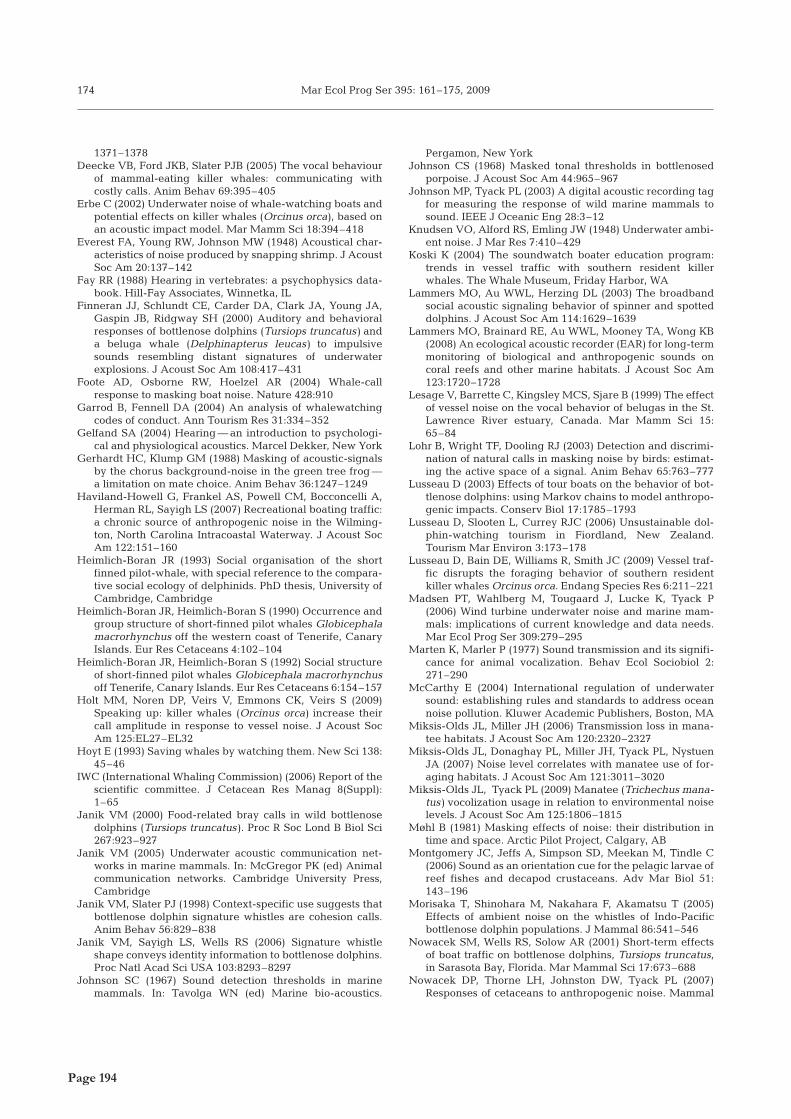
Mar Ecol Prog Ser 395: 161–175, 2009
1371–1378 Deecke VB, Ford JKB, Slater PJB (2005) The vocal behaviour
of mammal-eating killer whales: communicating withcostly calls. Anim Behav 69:395–405
Erbe C (2002) Underwater noise of whale-watching boats andpotential effects on killer whales (Orcinus orca), based onan acoustic impact model. Mar Mamm Sci 18:394–418
Everest FA, Young RW, Johnson MW (1948) Acoustical char-acteristics of noise produced by snapping shrimp. J AcoustSoc Am 20:137–142
Fay RR (1988) Hearing in vertebrates: a psychophysics data-book. Hill-Fay Associates, Winnetka, IL
Finneran JJ, Schlundt CE, Carder DA, Clark JA, Young JA,Gaspin JB, Ridgway SH (2000) Auditory and behavioralresponses of bottlenose dolphins (Tursiops truncatus) anda beluga whale (Delphinapterus leucas) to impulsivesounds resembling distant signatures of underwaterexplosions. J Acoust Soc Am 108:417–431
Foote AD, Osborne RW, Hoelzel AR (2004) Whale-callresponse to masking boat noise. Nature 428:910
Garrod B, Fennell DA (2004) An analysis of whalewatchingcodes of conduct. Ann Tourism Res 31:334–352
Gelfand SA (2004) Hearing — an introduction to psychologi-cal and physiological acoustics. Marcel Dekker, New York
Gerhardt HC, Klump GM (1988) Masking of acoustic-signalsby the chorus background-noise in the green tree frog —a limitation on mate choice. Anim Behav 36:1247–1249
Haviland-Howell G, Frankel AS, Powell CM, Bocconcelli A,Herman RL, Sayigh LS (2007) Recreational boating traffic:a chronic source of anthropogenic noise in the Wilming-ton, North Carolina Intracoastal Waterway. J Acoust SocAm 122:151–160
Heimlich-Boran JR (1993) Social organisation of the shortfinned pilot-whale, with special reference to the compara-tive social ecology of delphinids. PhD thesis, University ofCambridge, Cambridge
Heimlich-Boran JR, Heimlich-Boran S (1990) Occurrence andgroup structure of short-finned pilot whales Globicephalamacrorhynchus off the western coast of Tenerife, CanaryIslands. Eur Res Cetaceans 4:102–104
Heimlich-Boran JR, Heimlich-Boran S (1992) Social structureof short-finned pilot whales Globicephala macrorhynchusoff Tenerife, Canary Islands. Eur Res Cetaceans 6:154–157
Holt MM, Noren DP, Veirs V, Emmons CK, Veirs S (2009)Speaking up: killer whales (Orcinus orca) increase theircall amplitude in response to vessel noise. J Acoust SocAm 125:EL27–EL32
Hoyt E (1993) Saving whales by watching them. New Sci 138:45–46
IWC (International Whaling Commission) (2006) Report of thescientific committee. J Cetacean Res Manag 8(Suppl):1–65
Janik VM (2000) Food-related bray calls in wild bottlenosedolphins (Tursiops truncatus). Proc R Soc Lond B Biol Sci267:923–927
Janik VM (2005) Underwater acoustic communication net-works in marine mammals. In: McGregor PK (ed) Animalcommunication networks. Cambridge University Press,Cambridge
Janik VM, Slater PJ (1998) Context-specific use suggests thatbottlenose dolphin signature whistles are cohesion calls.Anim Behav 56:829–838
Janik VM, Sayigh LS, Wells RS (2006) Signature whistleshape conveys identity information to bottlenose dolphins.Proc Natl Acad Sci USA 103:8293–8297
Johnson SC (1967) Sound detection thresholds in marinemammals. In: Tavolga WN (ed) Marine bio-acoustics.
Pergamon, New YorkJohnson CS (1968) Masked tonal thresholds in bottlenosed
porpoise. J Acoust Soc Am 44:965–967 Johnson MP, Tyack PL (2003) A digital acoustic recording tag
for measuring the response of wild marine mammals tosound. IEEE J Oceanic Eng 28:3–12
Knudsen VO, Alford RS, Emling JW (1948) Underwater ambi-ent noise. J Mar Res 7:410–429
Koski K (2004) The soundwatch boater education program:trends in vessel traffic with southern resident killerwhales. The Whale Museum, Friday Harbor, WA
Lammers MO, Au WWL, Herzing DL (2003) The broadbandsocial acoustic signaling behavior of spinner and spotteddolphins. J Acoust Soc Am 114:1629–1639
Lammers MO, Brainard RE, Au WWL, Mooney TA, Wong KB(2008) An ecological acoustic recorder (EAR) for long-termmonitoring of biological and anthropogenic sounds oncoral reefs and other marine habitats. J Acoust Soc Am123:1720–1728
Lesage V, Barrette C, Kingsley MCS, Sjare B (1999) The effectof vessel noise on the vocal behavior of belugas in the St.Lawrence River estuary, Canada. Mar Mamm Sci 15:65–84
Lohr B, Wright TF, Dooling RJ (2003) Detection and discrimi-nation of natural calls in masking noise by birds: estimat-ing the active space of a signal. Anim Behav 65:763–777
Lusseau D (2003) Effects of tour boats on the behavior of bot-tlenose dolphins: using Markov chains to model anthropo-genic impacts. Conserv Biol 17:1785–1793
Lusseau D, Slooten L, Currey RJC (2006) Unsustainable dol-phin-watching tourism in Fiordland, New Zealand.Tourism Mar Environ 3:173–178
Lusseau D, Bain DE, Williams R, Smith JC (2009) Vessel traf-fic disrupts the foraging behavior of southern residentkiller whales Orcinus orca. Endang Species Res 6:211–221
Madsen PT, Wahlberg M, Tougaard J, Lucke K, Tyack P(2006) Wind turbine underwater noise and marine mam-mals: implications of current knowledge and data needs.Mar Ecol Prog Ser 309:279–295
Marten K, Marler P (1977) Sound transmission and its signifi-cance for animal vocalization. Behav Ecol Sociobiol 2:271–290
McCarthy E (2004) International regulation of underwatersound: establishing rules and standards to address oceannoise pollution. Kluwer Academic Publishers, Boston, MA
Miksis-Olds JL, Miller JH (2006) Transmission loss in mana-tee habitats. J Acoust Soc Am 120:2320–2327
Miksis-Olds JL, Donaghay PL, Miller JH, Tyack PL, NystuenJA (2007) Noise level correlates with manatee use of for-aging habitats. J Acoust Soc Am 121:3011–3020
Miksis-Olds JL, Tyack PL (2009) Manatee (Trichechus mana-tus) vocolization usage in relation to environmental noiselevels. J Acoust Soc Am 125:1806–1815
Møhl B (1981) Masking effects of noise: their distribution intime and space. Arctic Pilot Project, Calgary, AB
Montgomery JC, Jeffs A, Simpson SD, Meekan M, Tindle C(2006) Sound as an orientation cue for the pelagic larvae ofreef fishes and decapod crustaceans. Adv Mar Biol 51:143–196
Morisaka T, Shinohara M, Nakahara F, Akamatsu T (2005)Effects of ambient noise on the whistles of Indo-Pacificbottlenose dolphin populations. J Mammal 86:541–546
Nowacek SM, Wells RS, Solow AR (2001) Short-term effectsof boat traffic on bottlenose dolphins, Tursiops truncatus,in Sarasota Bay, Florida. Mar Mammal Sci 17:673–688
Nowacek DP, Thorne LH, Johnston DW, Tyack PL (2007)Responses of cetaceans to anthropogenic noise. Mammal
174
Page 194
Page 194
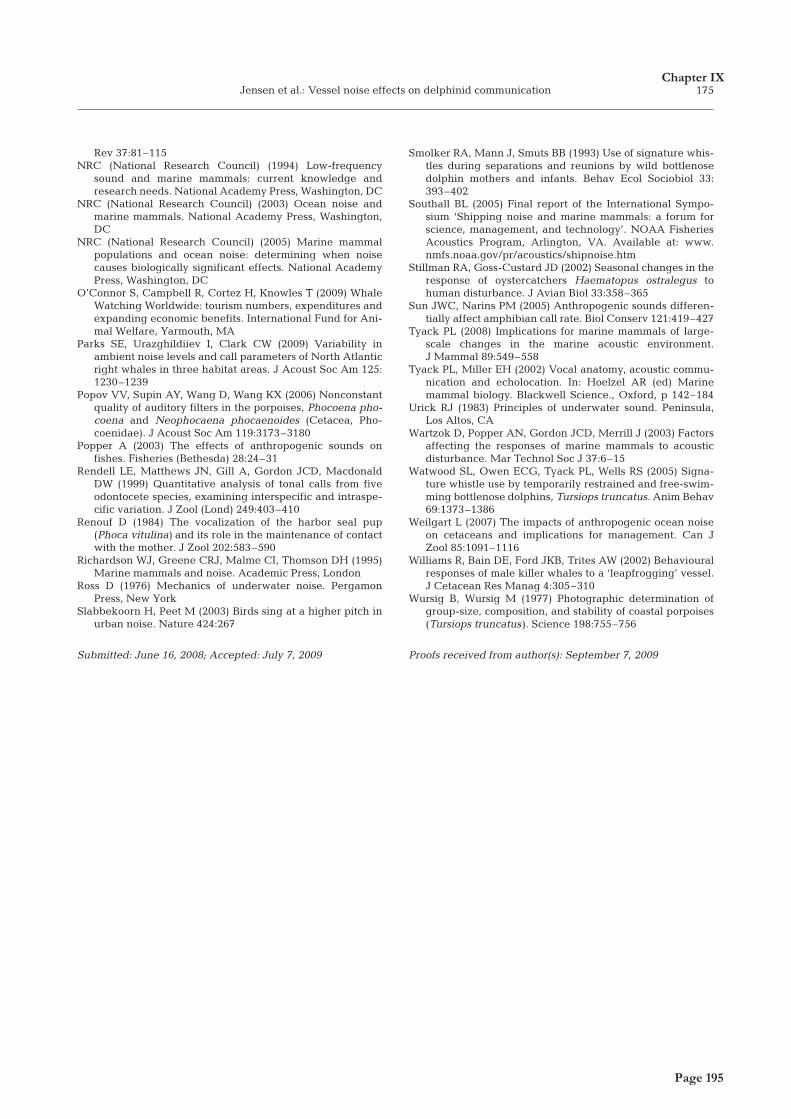
Jensen et al.: Vessel noise effects on delphinid communication
Rev 37:81–115 NRC (National Research Council) (1994) Low-frequency
sound and marine mammals: current knowledge andresearch needs. National Academy Press, Washington, DC
NRC (National Research Council) (2003) Ocean noise andmarine mammals. National Academy Press, Washington,DC
NRC (National Research Council) (2005) Marine mammalpopulations and ocean noise: determining when noisecauses biologically significant effects. National AcademyPress, Washington, DC
O’Connor S, Campbell R, Cortez H, Knowles T (2009) WhaleWatching Worldwide: tourism numbers, expenditures andexpanding economic benefits. International Fund for Ani-mal Welfare, Yarmouth, MA
Parks SE, Urazghildiiev I, Clark CW (2009) Variability inambient noise levels and call parameters of North Atlanticright whales in three habitat areas. J Acoust Soc Am 125:1230–1239
Popov VV, Supin AY, Wang D, Wang KX (2006) Nonconstantquality of auditory filters in the porpoises, Phocoena pho-coena and Neophocaena phocaenoides (Cetacea, Pho-coenidae). J Acoust Soc Am 119:3173–3180
Popper A (2003) The effects of anthropogenic sounds onfishes. Fisheries (Bethesda) 28:24–31
Rendell LE, Matthews JN, Gill A, Gordon JCD, MacdonaldDW (1999) Quantitative analysis of tonal calls from fiveodontocete species, examining interspecific and intraspe-cific variation. J Zool (Lond) 249:403–410
Renouf D (1984) The vocalization of the harbor seal pup(Phoca vitulina) and its role in the maintenance of contactwith the mother. J Zool 202:583–590
Richardson WJ, Greene CRJ, Malme CI, Thomson DH (1995)Marine mammals and noise. Academic Press, London
Ross D (1976) Mechanics of underwater noise. PergamonPress, New York
Slabbekoorn H, Peet M (2003) Birds sing at a higher pitch inurban noise. Nature 424:267
Smolker RA, Mann J, Smuts BB (1993) Use of signature whis-tles during separations and reunions by wild bottlenosedolphin mothers and infants. Behav Ecol Sociobiol 33:393–402
Southall BL (2005) Final report of the International Sympo-sium ‘Shipping noise and marine mammals: a forum forscience, management, and technology’. NOAA FisheriesAcoustics Program, Arlington, VA. Available at: www.nmfs.noaa.gov/pr/acoustics/shipnoise.htm
Stillman RA, Goss-Custard JD (2002) Seasonal changes in theresponse of oystercatchers Haematopus ostralegus tohuman disturbance. J Avian Biol 33:358–365
Sun JWC, Narins PM (2005) Anthropogenic sounds differen-tially affect amphibian call rate. Biol Conserv 121:419–427
Tyack PL (2008) Implications for marine mammals of large-scale changes in the marine acoustic environment.J Mammal 89:549–558
Tyack PL, Miller EH (2002) Vocal anatomy, acoustic commu-nication and echolocation. In: Hoelzel AR (ed) Marinemammal biology. Blackwell Science., Oxford, p 142–184
Urick RJ (1983) Principles of underwater sound. Peninsula,Los Altos, CA
Wartzok D, Popper AN, Gordon JCD, Merrill J (2003) Factorsaffecting the responses of marine mammals to acousticdisturbance. Mar Technol Soc J 37:6–15
Watwood SL, Owen ECG, Tyack PL, Wells RS (2005) Signa-ture whistle use by temporarily restrained and free-swim-ming bottlenose dolphins, Tursiops truncatus. Anim Behav69:1373–1386
Weilgart L (2007) The impacts of anthropogenic ocean noiseon cetaceans and implications for management. Can JZool 85:1091–1116
Williams R, Bain DE, Ford JKB, Trites AW (2002) Behaviouralresponses of male killer whales to a ‘leapfrogging’ vessel.J Cetacean Res Manag 4:305–310
Wursig B, Wursig M (1977) Photographic determination ofgroup-size, composition, and stability of coastal porpoises(Tursiops truncatus). Science 198:755–756
175
Submitted: June 16, 2008; Accepted: July 7, 2009 Proofs received from author(s): September 7, 2009
Chapter IX
Page 195
Page 195


![· Bottlenose dolphin Tursiops truncatus 2006tFIOH28H . 201 (Ëfl]) (ËfRl) ropbcs Topics Toplcs 201 IÊ jobs Topics](https://img.pdfslide.us/doc/110x75/5b5c7e327f8b9ac6028c617d/-bottlenose-dolphin-tursiops-truncatus-2006tfioh28h-201-efl-efrl-ropbcs.jpg)