Embed Size (px)
Citation preview
Acoustic and Vibration Environment for Crew Launch Vehicle Mobile Launcher
Bruce Vu Structures and Analysis Branch NASA- Kennedy Space Center
A launch-induced acoustic environment represents a dynamic load on the exposed facilities and ground support equipment (GSE) in the form of random pressures fluctuating around the ambient atmospheric pressure. In response to these fluctuating pressures, structural vibrations are generated and transmitted throughout the structure and to the equipment items supported by the structure. Certain equipment items are also excited by the direct acoustic input as well as by the vibration transmitted through the supporting structure.
This paper presents the predicted acoustic and vibration environments induced by the launch of the Crew Launch Vehicle (CLV) from Launch Complex (LC) 39. The predicted acoustic environment depicted in this paper was calculated by scaling the statistically processed measured data available from Saturn V launches to the anticipated environment of the CLV launch. The scaling was accomplished by using the 5-segment Solid Rocket Booster (SRB) engine parameters. Derivation of vibration environment for various Mobile Launcher (ML) structures throughout the base and tower was accomplished by scaling the Saturn V vibration environment.
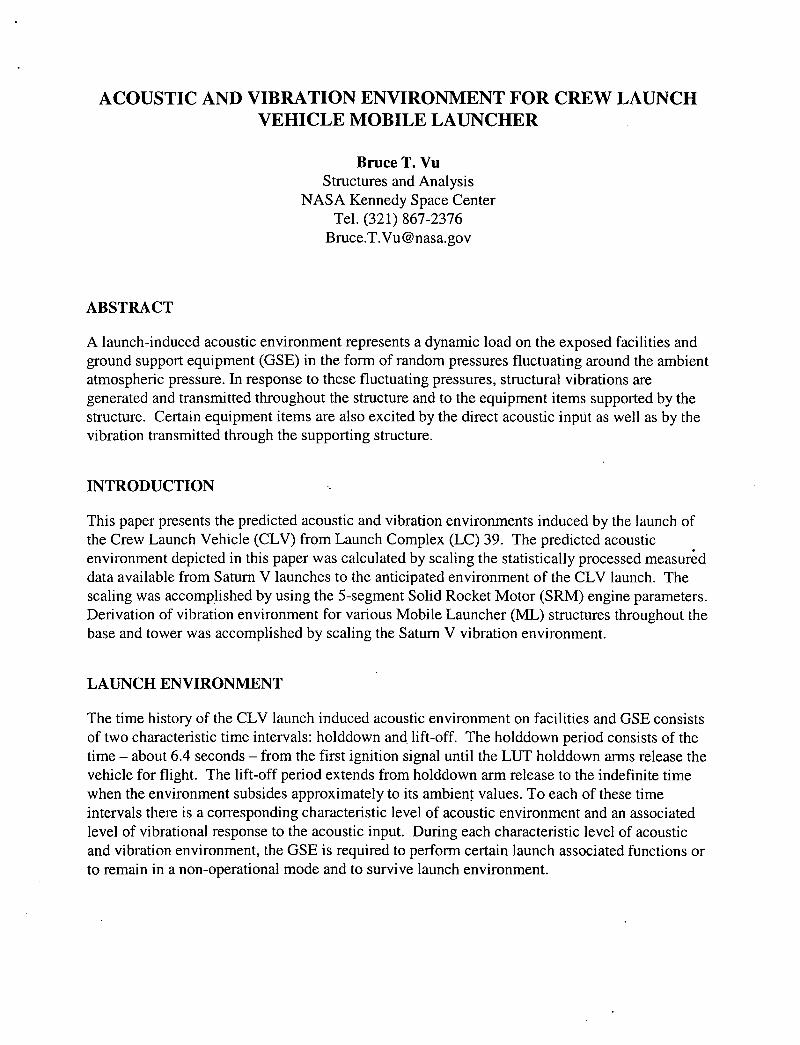
ACOUSTIC AND VIBRATION ENVIRONMENT FOR CREW LAUNCH VEHICLE MOBILE LAUNCHER
Bruce T. Vu Structures and Analysis
NASA Kennedy Space Center Tel. (321) 867-2376
Bruce.T.Vu @nasa.gov
ABSTRACT
A launch-induced acoustic environment represents a dynamic load on the exposed facilities and ground support equipment (GSE) in the form of random pressures fluctuating around the ambient atmospheric pressure. In response to these fluctuating pressures, structural vibrations are generated and transmitted throughout the structure and to the equipment items supported by the structure. Certain equipment items are also excited by the direct acoustic input as well as by the vibration transmitted through the supporting structure.
INTRODUCTION.
This paper presents the predicted acoustic and vibration environments induced by the launch of the Crew Launch Vehicle (CLV) from Launch Complex (LC) 39. The predicted acoustic environment depicted in this paper was calculated by scaling the statistically processed measured data available from Saturn V launches to the anticipated environment of the CLV launch. The scaling was accomplished by using the 5-segment Solid Rocket Motor (SRM) engine parameters. Derivation of vibration environment for various Mobile Launcher (ML) structures throughout the base and tower was accomplished by scaling the Saturn V vibration environment.
LAUNCH ENVIRONMENT
The time history of the CLV launch induced acoustic environment on facilities and GSE consists of two characteristic time intervals: holddown and lift-off. The holddown period consists of the time - about 6.4 seconds - from the first ignition signal until the LUT holddown arms release the vehicle for flight. The lift-off period extends from holddown arm release to the indefinite time when the environment subsides approximately to its ambient values. To each of these time intervals there is a corresponding characteristic level of acoustic environment and an associated level of vibrational response to the acoustic input. During each characteristic level of acoustic and vibration environment, the GSE is required to perform certain launch associated functions or to remain in a non-operational mode and to survive launch environment.
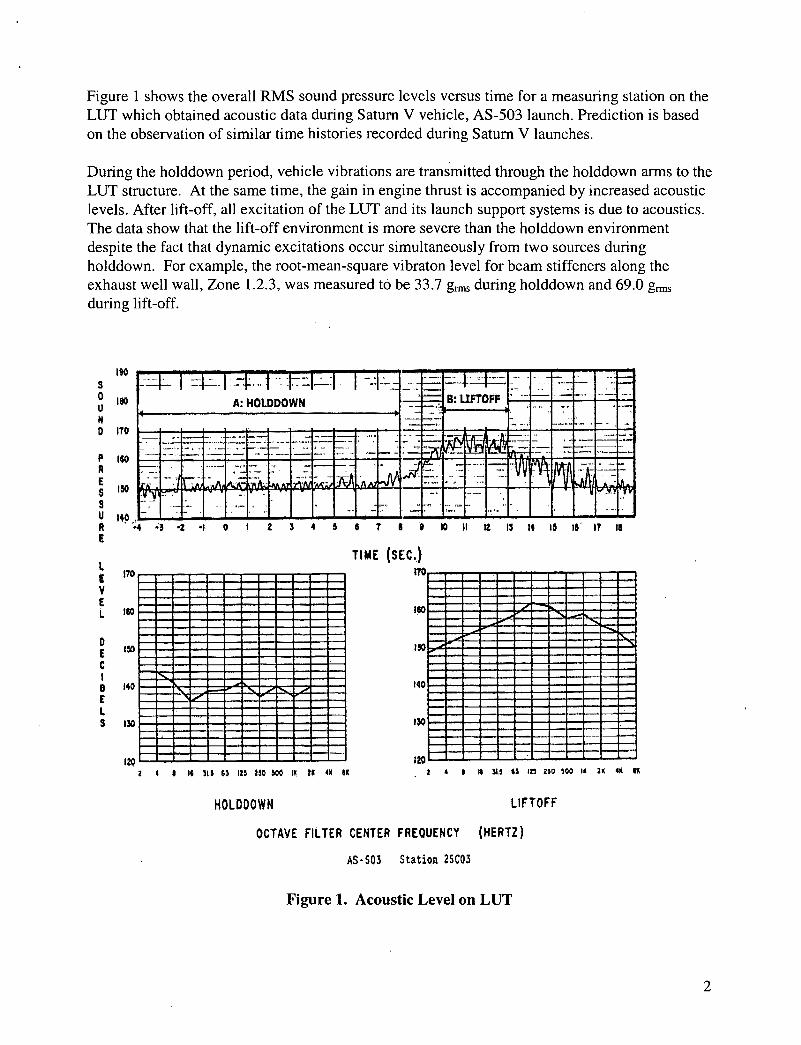
Figure 1 shows the overall RMS sound pressure levels versus time for a measuring station on the LUT which obtained acoustic data during Saturn V vehicle, AS-503 launch. Prediction is based on the observation of similar time histories recorded during Saturn V launches.
During the holddown period, vehicle vibrations are transmitted through the hoiddown arms to the LUT structure. At the same time, the gain in engine thrust is accompanied by increased acoustic levels. After lift-off, all excitation of the LUT and its launch support systems is due to acoustics. The data show that the lift-off environment is more severe than the holddown environment despite the fact that dynamic excitations occur simultaneously from two sources during holddown. For example, the root-mean-square vibraton level for beam stiffeners along the exhaust well wall, Zone 1.2.3, was measured to be 33.7 grn during hoiddown and 69.0 g during lift-off.
iJ!iJ 11II11liIII IIIuIliTIME (stc.)
190
'50
D 170
P 160 R
150
S U 140 R £
ITO
V E L 150
50
C
a 140
£ I. $ 130
120 . 2 S I IS 31.1 53 t 2O 100 II 2$ 45 U
US S S $ 3L 13 123 230 300 5 20 45 50
HOL000WN LIFTOFF
OCTAVE FILTER CENTER FREQUENCY (HERTZ)
AS-S03 Station 25CO3
Figure 1. Acoustic Level on LUT
2
I
w
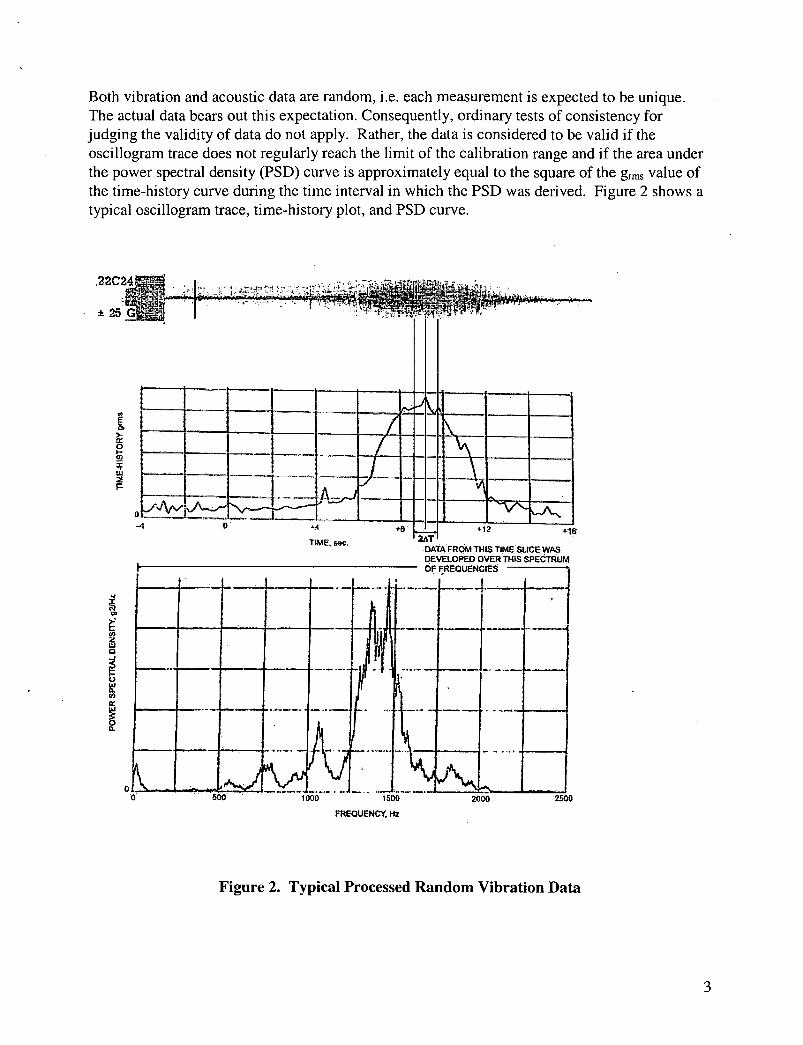
Both vibration and acoustic data are random, i.e. each measurement is expected to be unique. The actual data bears out this expectation. Consequently, ordinary tests of consistency for judging the validity of data do not apply. Rather, the data is considered to be valid if the oscillogram trace does not regularly reach the limit of the calibration range and if the area under the power spectral density (PSD) curve is approximately equal to the square of the g-n value of the time-history curve during the time interval in which the PSD was derived. Figure 2 shows a typical oscillogram trace, time-history plot, and PSD curve.
22C24Y1
-, ._I_ -. - ± 25 .ci1j
FREQUENC' Hz
Figure 2. Typical Processed Random Vibration Data
3
ZONING
To ensure accurate definition of the CLV system environment at specific areas, it is necessary to divide the ML Base and ML Tower into zones. To maintain continuity of zoning and to effectively apply data obtained during the Saturn/Apollo Program, the zoning method depicted and utilized in the Saturn V measurements has been utilized in this CLV scaling except where major differences occurred and consequently new zoning was required. Zone descriptions are specified as follows:
• ML Base interior zones for acoustic
• ML Tower exterior and farfield zones for acoustic
• ML Base interior zones for vibration
• ML Tower exterior zones for vibration
• ML Tower interior zones for vibration
The following nomenclature is used to define a zone:
Zone Identifier—i X. Y . Z. U
Wide Region Narrow Region
The first two identifiers, X.Y, are used to define a wide region. The extent of this region coincides with an acoustic field defined by the average sound pressure level (SPL) spectrum and associated dispersion within this region during characteristic time intervals of a launch. All near field acoustic specifications are presented for zones defined only by the first two identifiers.
Other identifiers, Z.U, are used to narrow the region of definition. The extent of the narrow region is defined by the similarity of structural components expected to exhibit similar vibrational response to the launch-induced excitation. All vibration specifications are presented for zones defined by either three, X.Y.Z, or four, X.Y.Z.U, identifiers. Far field acoustic specifications are presented without referencing them to any zone since a unique definition of the region of application is given by the radial distance to the center of the ML Base.
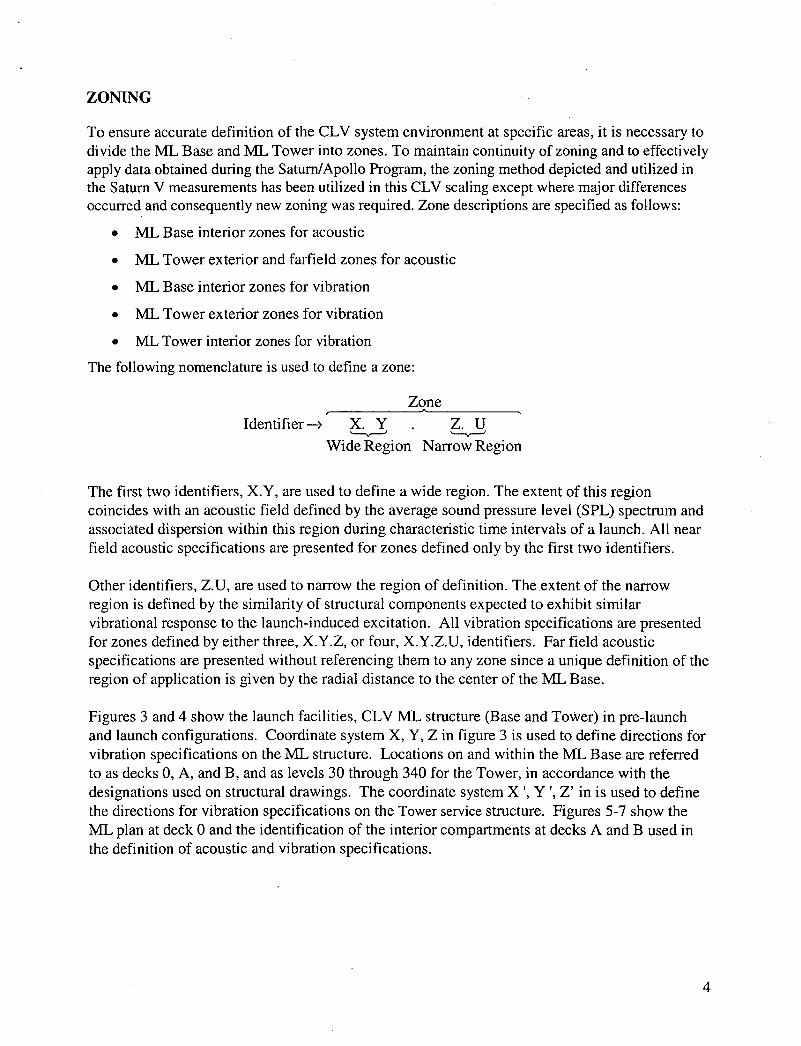
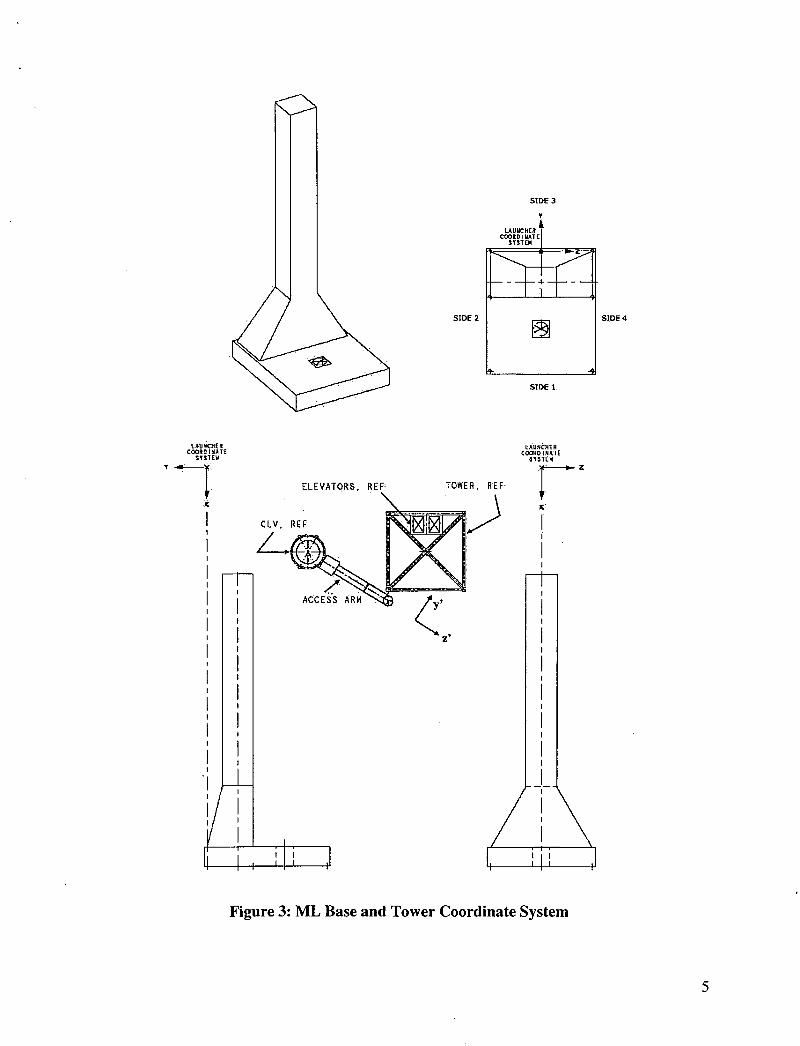
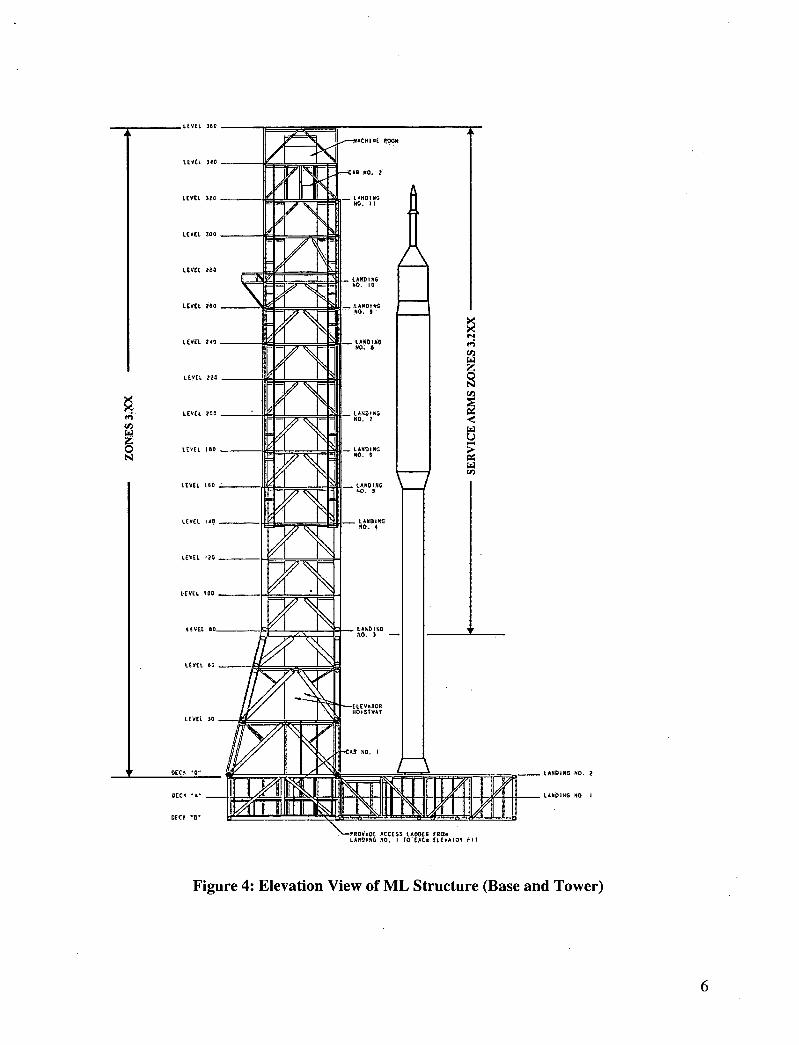
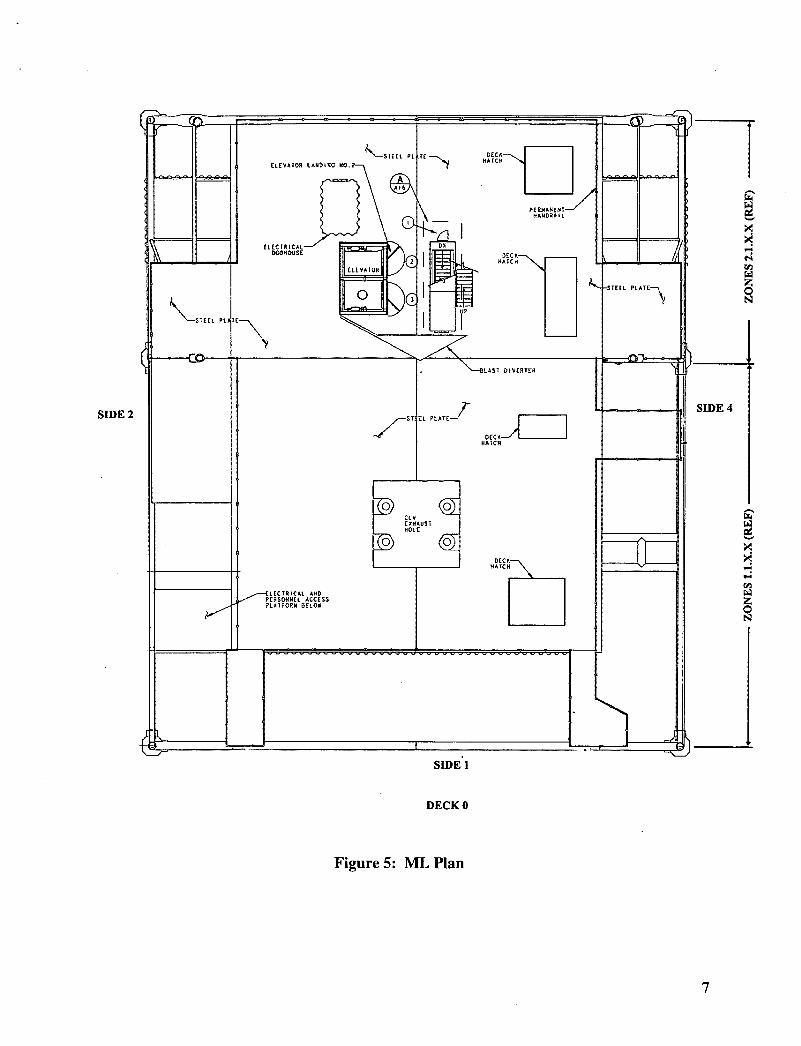
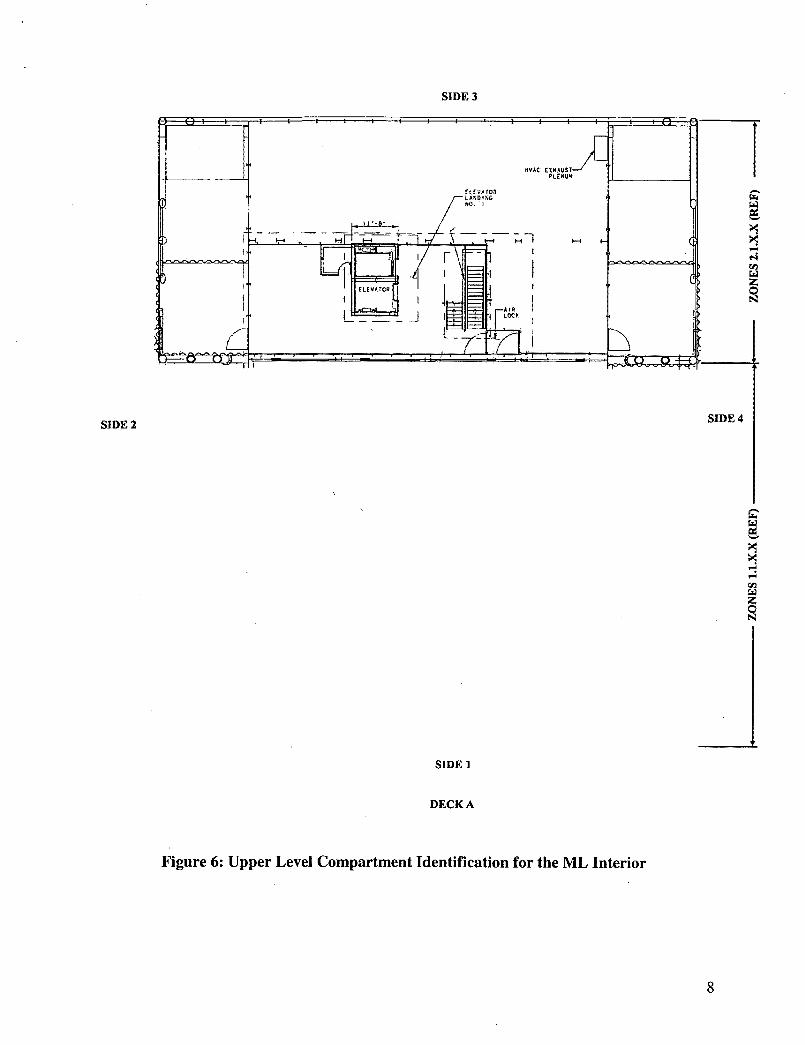
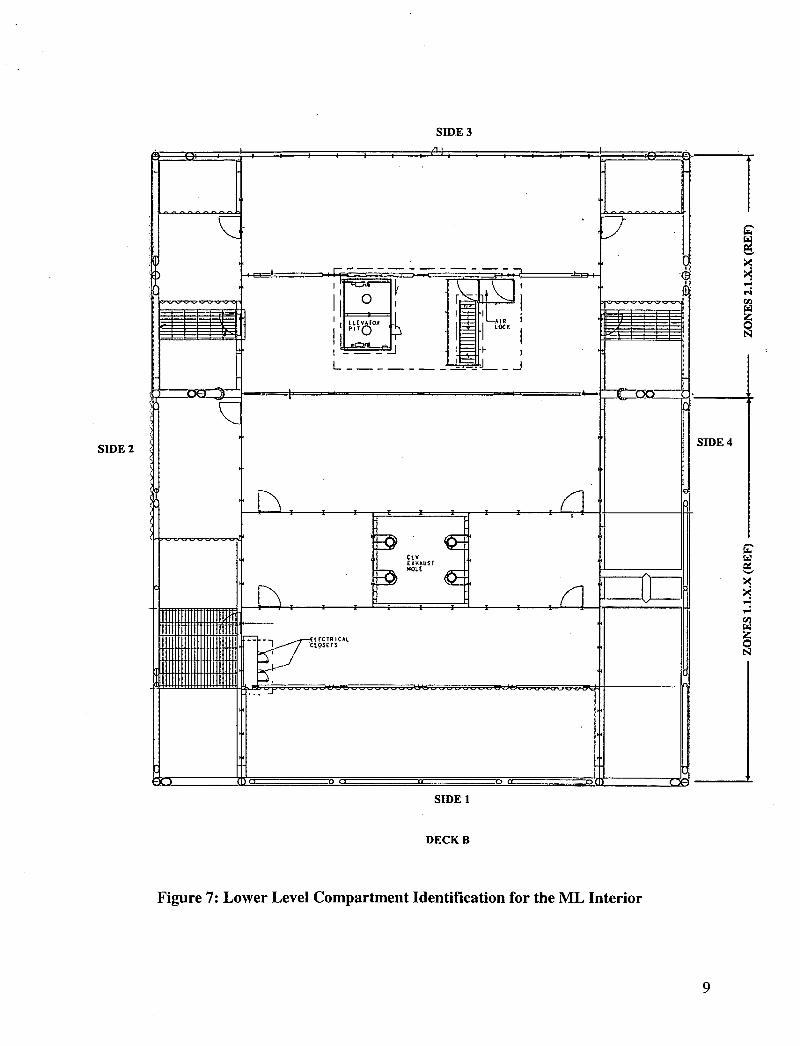
Figures 3 and 4 show the launch facilities, CLV ML structure (Base and Tower) in pre-launch and launch configurations. Coordinate system X, Y, Z in figure 3 is used to define directions for vibration specifications on the ML structure. Locations on and within the ML Base are referred to as decks 0, A, and B, and as levels 30 through 340 for the Tower, in accordance with the designations used on structural drawings. The coordinate system X ', Y ',Z' in is used to define the directions for vibration specifications on the Tower service structure. Figures 5-7 show the ML plan at deck 0 and the identification of the interior compartments at decks A and B used in the definition of acoustic and vibration specifications.
4
SIDE I SIDE 4
SIDE 3
SIDE I
LAUNCHER COORD IRATE
SUllEN ,
LAUNCHER COUlD NATE
ITUTEM
ELEVATORS. REV TOWER REF
Figure 3: ML Base and Tower Coordinate System
5
L(VEL
LCV(L
LVCL
LZE1
L(V(L
LEVtL
"vu
L(YtL I
UVEt
"vu
t[V(L
cv
OtC
D(CK 8
LAP4'I4 'SO.
LADIIG Nb.
Figure 4: Elevation View of ML Structure (Base and Tower)
[1
SIDE 2
SiDE 1
DECK 0
Figure 5: ML Plan
SIDE 3
SIDE 2 SIDE 4
z
SIDE I
DECK A
Figure 6: Upper Level Compartment Identification for the ML Interior
SIDE 3
SIDE 2
iTrT9 oO— -
__
____
I I I I I I I I
ii. ctv £ Z1AUST
j
iii . iiiiI.t- III
ur ___________________ _______________( j
z
SIDE 4
x
(I)
z
SIDE 1
DECK B
Figure 7: Lower Level Compartment Identification for the ML Interior
ACOUSTIC ENVIRONMENT
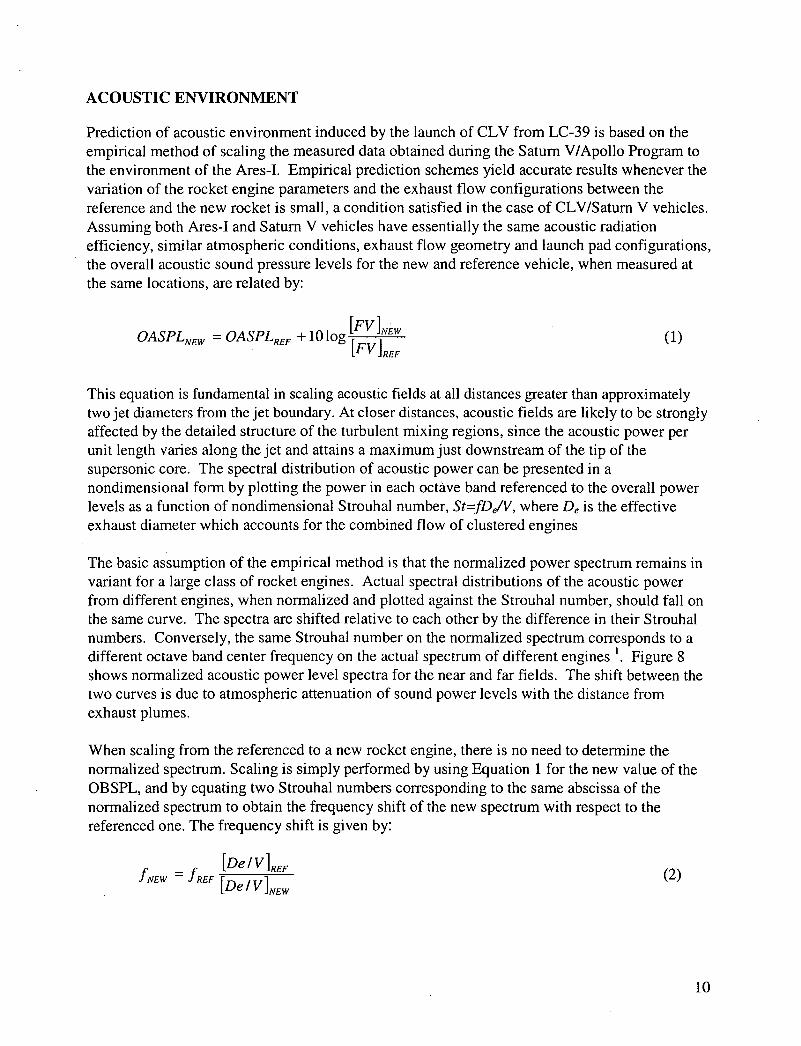
Prediction of acoustic environment induced by the launch of CLV from LC-39 is based on the empirical method of scaling the measured data obtained during the Saturn V/Apollo Program to the environment of the Ares-I. Empirical prediction schemes yield accurate results whenever the variation of the rocket engine parameters and the exhaust flow configurations between the reference and the new rocket is small, a condition satisfied in the case of CLV/Satum V vehicles. Assuming both Ares-I and Saturn V vehicles have essentially the same acoustic radiation efficiency, similar atmospheric conditions, exhaust flow geometry and launch pad configurations, the overall acoustic sound pressure levels for the new and reference vehicle, when measured at the same locations, are related by:
OASPLNEW = OASPLREF + 101og [FV]NEW (1) [Fv JREF
This equation is fundamental in scaling acoustic fields at all distances greater than approximately two jet diameters from the jet boundary. At closer distances, acoustic fields are likely to be strongly affected by the detailed structure of the turbulent mixing regions, since the acoustic power per unit length varies along the jet and attains a maximum just downstream of the tip of the supersonic core. The spectral distribution of acoustic power can be presented in a nondimensional form by plotting the power in each octave band referenced to the overall power levels as a function of nondimensional Strouhal number, St=fDe/V, where De is the effective exhaust diameter which accounts for the combined flow of clustered engines
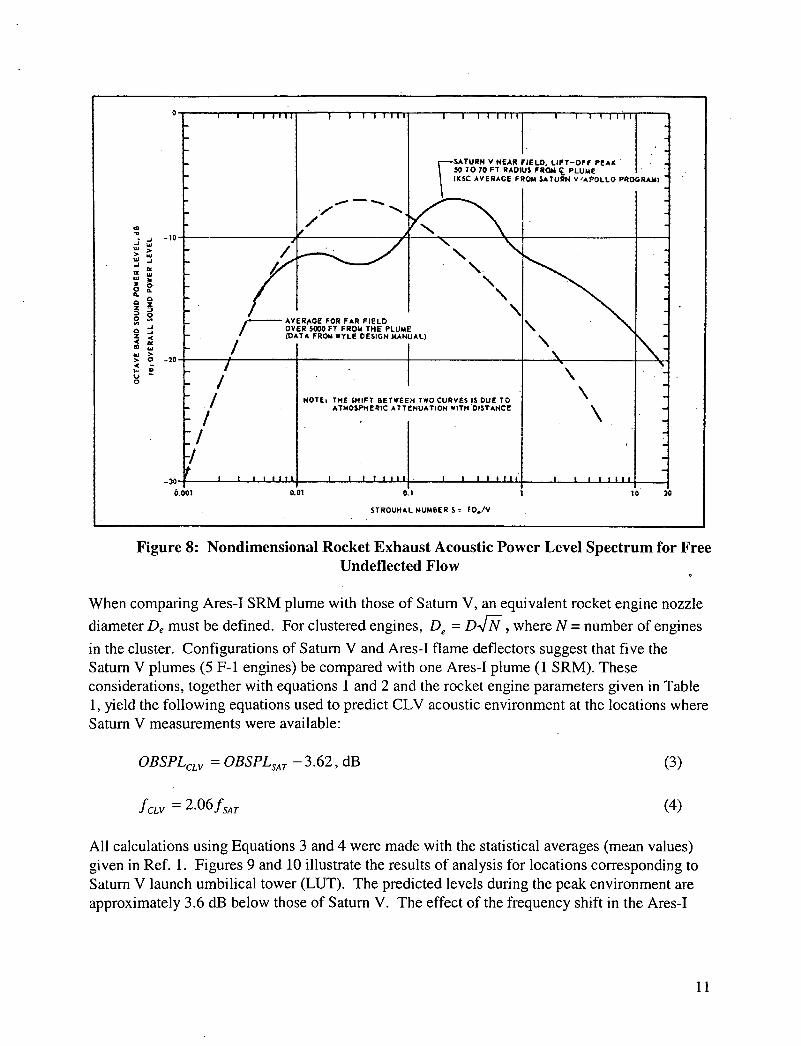
The basic assumption of the empirical method is that the normalized power spectrum remains in variant for a large class of rocket engines. Actual spectral distributions of the acoustic power from different engines, when normalized and plotted against the Strouhal number, should fall on the same curve. The spectra are shifted relative to each other by the difference in their Strouhal numbers. Conversely, the same Strouhal number on the normalized spectrum corresponds to a different octave band center frequency on the actual spectrum of different engines Figure 8 shows normalized acoustic power level spectra for the near and far fields. The shift between the two curves is due to atmospheric attenuation of sound power levels with the distance from exhaust plumes.
When scaling from the referenced to a new rocket engine, there is no need to determine the normalized spectrum. Scaling is simply performed by using Equation 1 for the new value of the OBSPL, and by equating two Strouhal numbers corresponding to the same abscissa of the normalized spectrum to obtain the frequency shift of the new spectrum with respect to the referenced one. The frequency shift is given by:
[Del V]REF fNEW =
fREF [DeIV]NEW(2)
10
0' 11111) I I 111111 I I 411111 I I 111111
• 4—SATURN V NEAR FIELD. UFT-OFF PEAK 50 TO 70 FT RADIUS PROM ç PLUME
• (EEC AVERAGE FROM SATURN V'APOLLO PROGRAMI
___________ __________ L fi: _ A YE RAGE FOR F AR F IE LO
-JOVER 5000 FT FROM THE PLUM
z IDATA FROM WYLE DESIGN MANUAL)
/ N :/ NOTEt TIlE SHIFT BETWEEN TWOCURVESI5 DUE TO
ATMOSPHERIC ATTENUATION WITh DISTANCE
:1 /
30•I 111114 I I IIIII I I 111141 I I IIIIII_
&00) 0.01 0.1 o
STROUNALNUM5ER5 fDa/V
Figure 8: Nondimensional Rocket Exhaust Acoustic Power Level Spectrum for Free Undeflected Flow
When comparing Ares-I SRM plume with those of Saturn V, an equivalent rocket engine nozzle
diameter De must be defined. For clustered engines, De D-Ji, where N = number of engines
in the cluster. Configurations of Saturn V and Ares-I flame deflectors suggest that five the Saturn V plumes (5 F-i engines) be compared with one Ares-I plume (1 SRM). These considerations, together with equations 1 and 2 and the rocket engine parameters given in Table 1, yield the following equations used to predict CLV acoustic environment at the locations where Saturn V measurements were available:
OBSPLCLV = OBSPLSAT —3.62, dB
(3)
fCLV 2.O6fsAT (4)
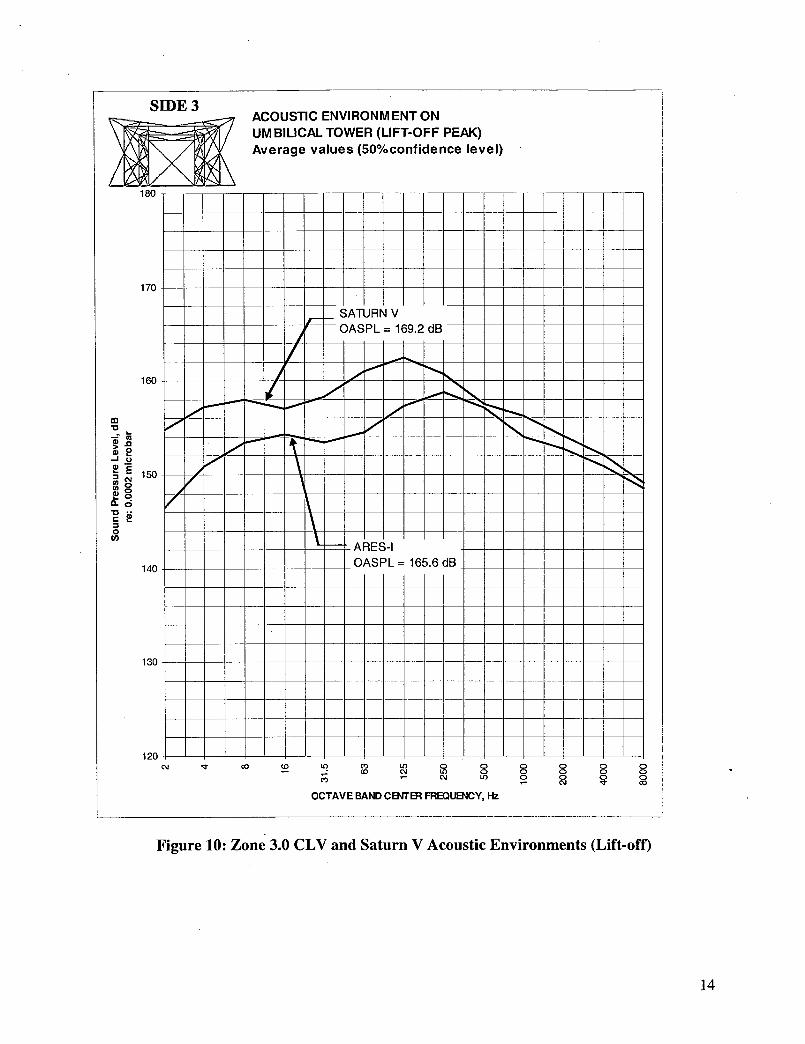
All calculations using Equations 3 and 4 were made with the statistical averages (mean values) given in Ref. 1. Figures 9 and 10 illustrate the results of analysis for locations corresponding to Saturn V launch umbilical tower (LUT). The predicted levels during the peak environment are approximately 3.6 dB below those of Saturn V. The effect of the frequency shift in the Ares-I
11
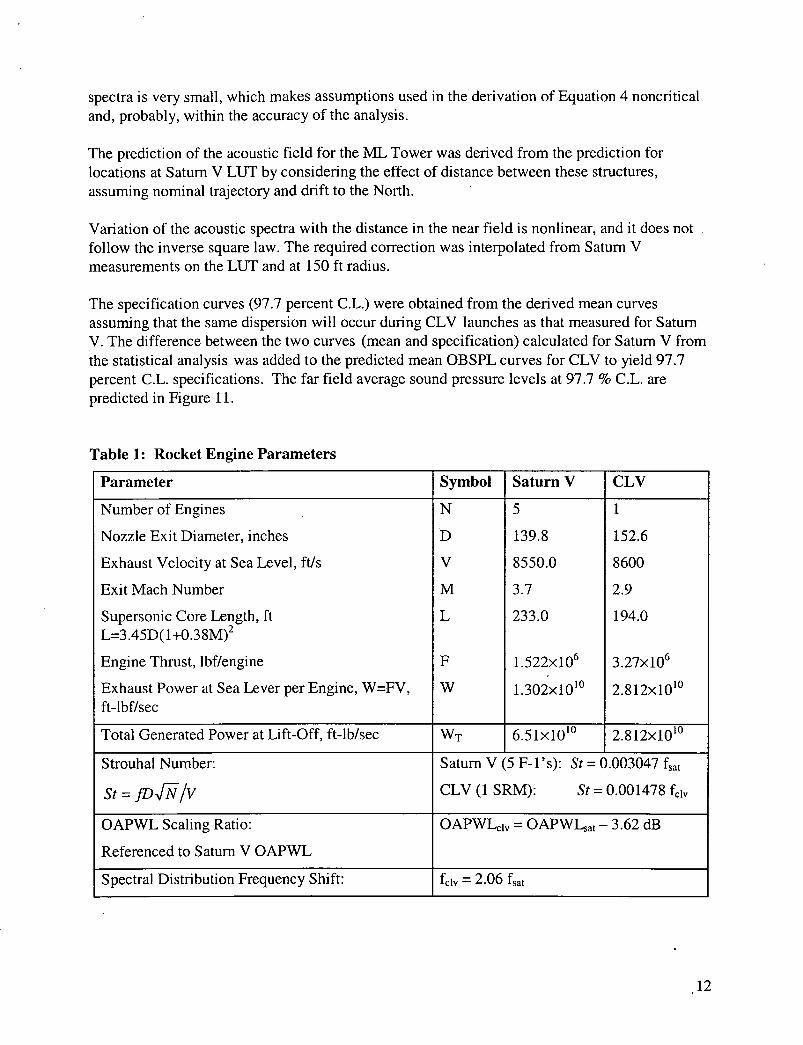
spectra is very small, which makes assumptions used in the derivation of Equation 4 noncritical and, probably, within the accuracy of the analysis.
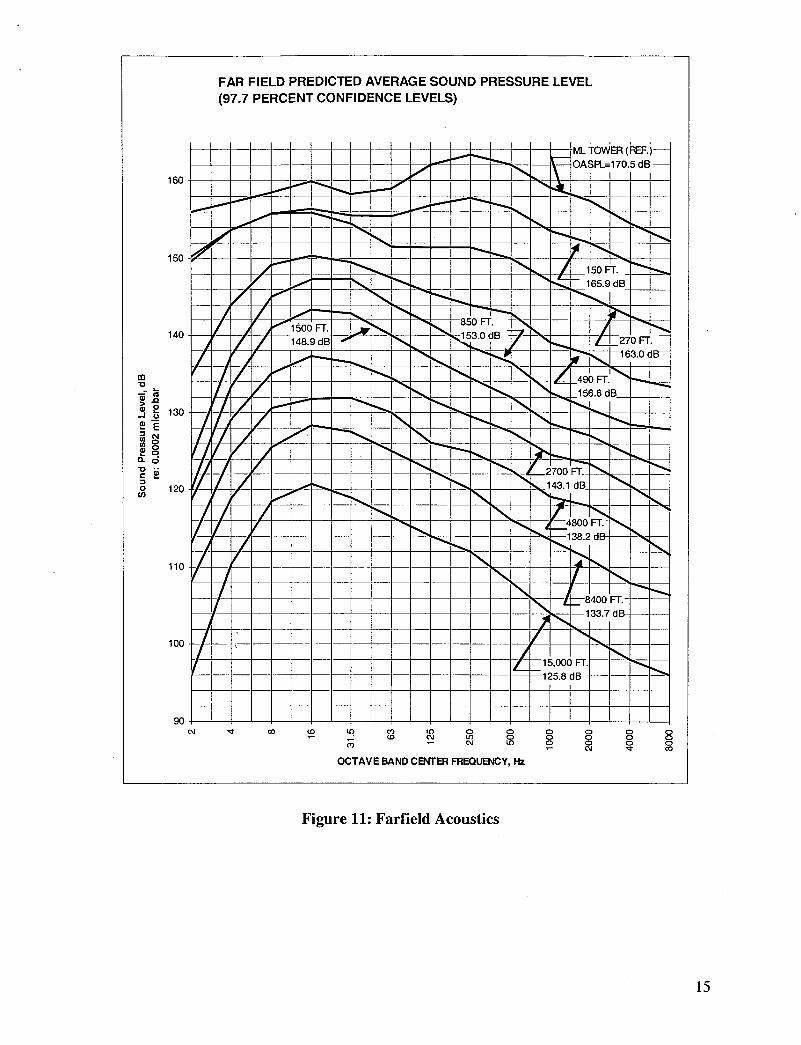
The prediction of the acoustic field for the ML Tower was derived from the prediction for locations at Saturn V LUT by considering the effect of distance between these structures, assuming nominal trajectory and drift to the North.
Variation of the acoustic spectra with the distance in the near field is nonlinear, and it does not follow the inverse square law. The required correction was interpolated from Saturn V measurements on the LUT and at 150 ft radius.
The specification curves (97.7 percent C.L.) were obtained from the derived mean curves assuming that the same dispersion will occur during CLV launches as that measured for Saturn V. The difference between the two curves (mean and specification) calculated for Saturn V from the statistical analysis was added to the predicted mean OBSPL curves for CLV to yield 97.7 percent C.L. specifications. The far field average sound pressure levels at 97.7 % C.L. are predicted in Figure ii.
Table 1: Rocket Engine Parameters
Parameter Symbol Saturn V CLV
Number of Engines N 5 1
Nozzle Exit Diameter, inches D 139.8 152.6
Exhaust Velocity at Sea Level, ftls V 8550.0 8600
Exit Mach Number M 3.7 2.9
Supersonic Core Length, ft L 233.0 194.0 L=3.45D(1+0.38M)2
Engine Thrust, lbf/engine F 1.522x10⁶ 3.27x10⁶
Exhaust Power at Sea Lever per Engine, W=FV, W 1.302x10'° 2.812x10'° ft-lbf/sec
Total Generated Power at Lift-Off, ft-lb/sec WT 6.51x10'° 2.812x101°
Strouhal Number: Saturn V (5 F-i's): St = 0.003047 fsat
St = CLV (1 SRM): St = 0.00 1478 f1
OAPWL Scaling Ratio: OAPWL1 OAPWLsat - 3.62 dB
Referenced to Saturn V OAPWL
Spectral Distribution Frequency Shift: f1 = 2.06 fsat
12
SIDE 3ACOUSTIC ENVIRONMENT ON
\ ft- i1/ UMBILICAL TOWER (HOLD-DOWN) Average values (50%confidence level)
180 - - - - - - - - - - - - - - - - -
170 - - - - - - - - - - - - - - - - - - - - - - - -
-
160 - - - - - - - - - - - - - - - - - - - - - - - -
SA11JRNV IIIIIII1B:IIIIIIIIII 150 - - - - - - - - - - - - - -
0- - - - - - -
O-d •0 ••
0- -_--
'I)
140S7
EEE OASPL= 150.2dB 130--———=-ARESI
120 - - - - - - - - - - - - - - C'J ' (0 U) C) U) 0 0 0 0 0 0 (0 C'J LO 0 0 0 0 0 CSJ U) 0 0 0 0 cJ '1 (0
OCTAVE BAND CITER FREQLJB'ICY, Hz
Figure 9: Zone 3.0 CLV and Saturn V Acoustic Environments (Hold-down)
13
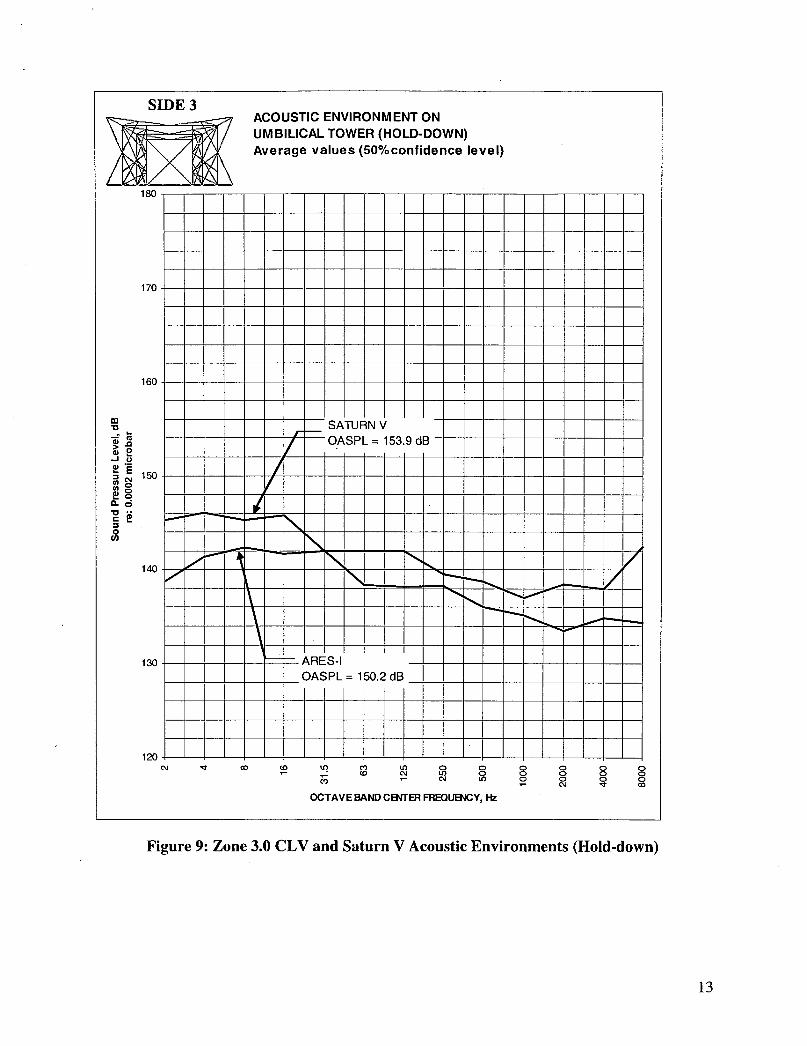
SIDE3ACOUS11C ENVIRONMENT ON
/ UMBILICAL TOWER (LIFT-OFF PEAK) Average values (50%confidence level)
180 - - ------ - - - - - - - -
170 - - - - - - - - - - -
- SATURN V
OASPL=169.2dB - - - -
-- ---------
160-- -- -- -- -----------
I' /
_ /
..-. — - __ >n wE
/
H15°
IIII_\__IIII_III-__---I
0 - - ------ - - - - - - Cl)
140 -_ OASPL=165.6dB -
130 - - - - - - - - - - - - -
120 - - - - - - - -- -- - - - C'J Co CO U C U 0 0 0 0 0 0
CO 04 CO 0 0 0 0 0 -04 Co 0 0 0 0
04 Co
OCTAVE BAND CENTER FREQUENCY, Hz
Figure 10: Zone 3.0 CLV and Saturn V Acoustic Environments (Lift-off)
14
p.- p p - S p.- -
- S P
•
S.: ::::up
• ..: U.
a ifA .4 •• •. ::
• •
I • I :
Figure 11: Farfield Acoustics
15
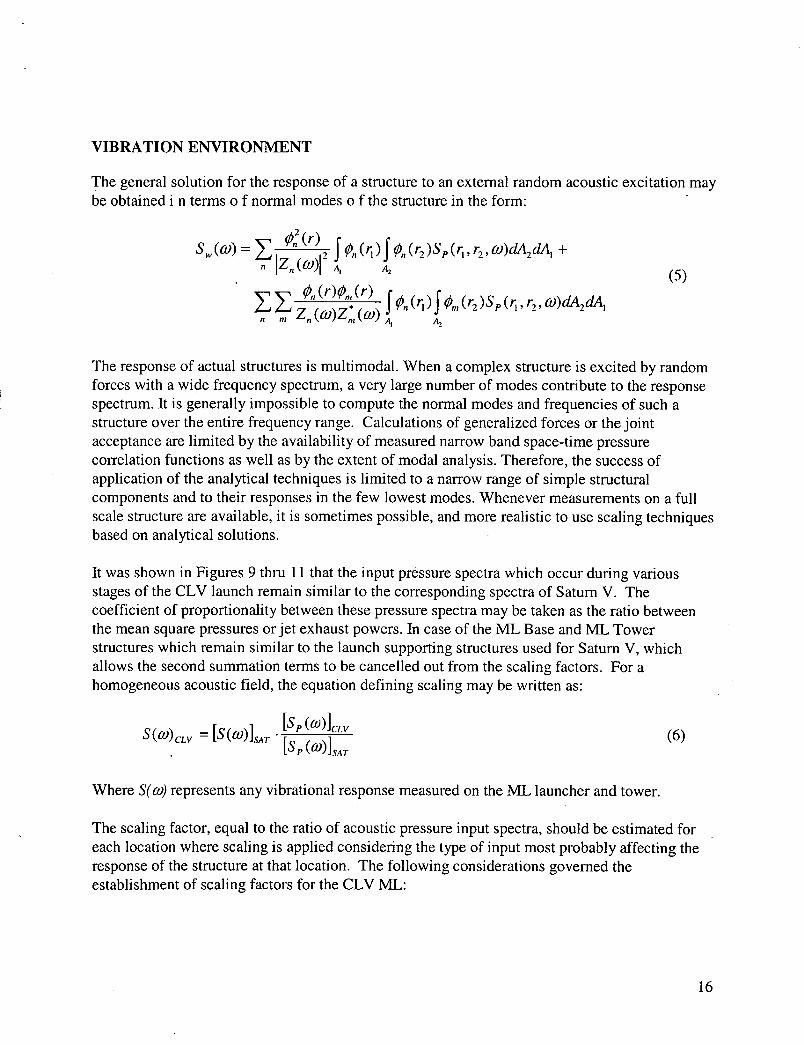
VIBRATION ENVIRONMENT
The general solution for the response of a structure to an external random acoustic excitation may be obtained i n terms o f normal modes o f the structure in the form:
S(w)= _Ø(r)
+
(5) Ø(r)Ø(r)
Z(w)Z(w) A
The response of actual structures is multimodal. When a complex structure is excited by random forces with a wide frequency spectrum, a very large number of modes contribute to the response spectrum. It is generally impossible to compute the normal modes and frequencies of such a structure over the entire frequency range. Calculations of generalized forces or the joint acceptance are limited by the availability of measured narrow band space-time pressure correlation functions as well as by the extent of modal analysis. Therefore, the success of application of the analytical techniques is limited to a narrow range of simple structural components and to their responses in the few lowest modes. Whenever measurements on a full scale structure are available, it is sometimes possible, and more realistic to use scaling techniques based on analytical solutions.
It was shown in Figures 9 thru 11 that the input pressure spectra which occur during various stages of the CLV launch remain similar to the corresponding spectra of Saturn V. The coefficient of proportionality between these pressure spectra may be taken as the ratio between the mean square pressures or jet exhaust powers. In case of the ML Base and ML Tower structures which remain similar to the launch supporting structures used for Saturn V, which allows the second summation terms to be cancelled out from the scaling factors. For a homogeneous acoustic field, the equation defining scaling may be written as:
S(w) CLV = [S(w)]SAT [s (w)]cLv
[Sp(w)]SAT
(6)
Where S(w) represents any vibrational response measured on the ML launcher and tower.
The scaling factor, equal to the ratio of acoustic pressure input spectra, should be estimated for each location where scaling is applied considering the type of input most probably affecting the response of the structure at that location. The following considerations governed the establishment of scaling factors for the CLV ML:
16
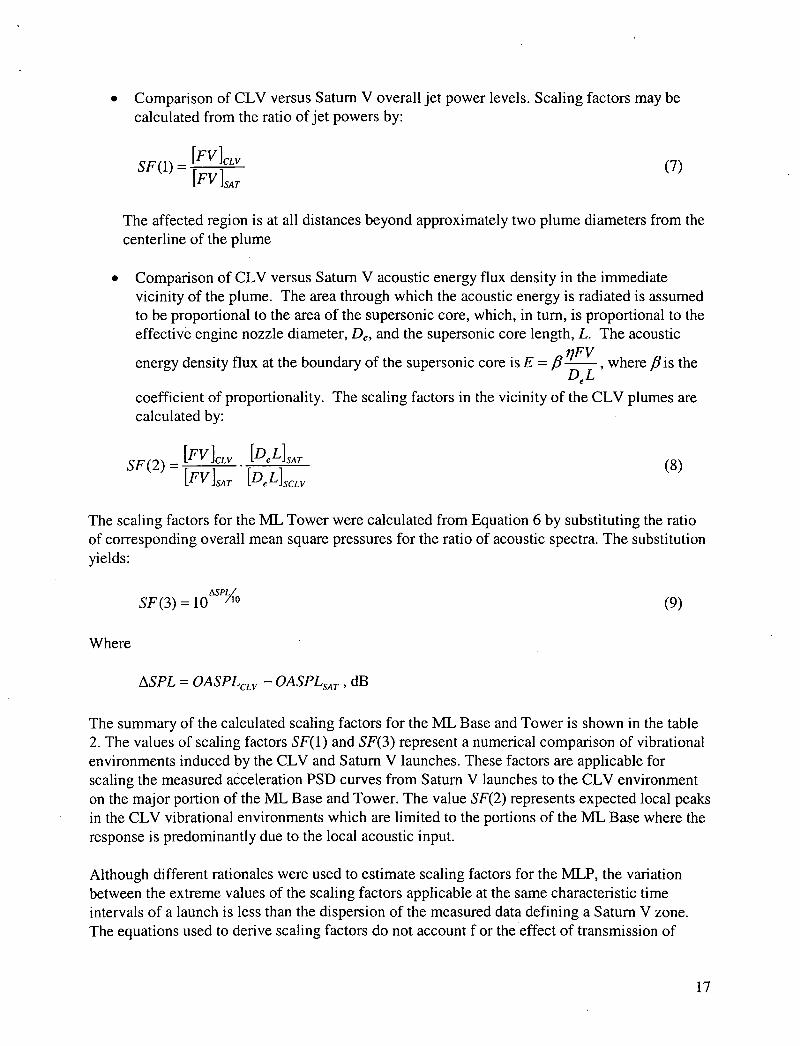
Comparison of CLV versus Saturn V overall jet power levels. Scaling factors may be calculated from the ratio of jet powers by:
SF(1) = [FV]CLV
[FV}SAT
The affected region is at all distances beyond approximately two plume diameters from the centerline of the plume
• Comparison of CLV versus Saturn V acoustic energy flux density in the immediate vicinity of the plume. The area through which the acoustic energy is radiated is assumed to be proportional to the area of the supersonic core, which, in turn, is proportional to the effective engine nozzle diameter, De, and the supersonic core length, L. The acoustic
energy density flux at the boundary of the supersonic core is E = fi , where flis the
coefficient of proportionality. The scaling factors in the vicinity of the CLV plumes are calculated by:
- [FV ]CLV [DeLISAT SF(2) - [
FV ]SAT [DeLISCLV
The scaling factors for the ML Tower were calculated from Equation 6 by substituting the ratio of corresponding overall mean square pressures for the ratio of acoustic spectra. The substitution yields:
tSPL/ SF(3)=1O /'° (9)
Where
ASPL OASPLCLV - OASPLSAT , dB
The summary of the calculated scaling factors for the ML Base and Tower is shown in the table 2. The values of scaling factors SF(1) and SF(3) represent a numerical comparison of vibrational environments induced by the CLV and Saturn V launches. These factors are applicable for scaling the measured acceleration PSD curves from Saturn V launches to the CLV environment on the major portion of the ML Base and Tower. The value SF(2) represents expected local peaks in the CLV vibrational environments which are limited to the portions of the ML Base where the response is predominantly due to the local acoustic input.
Although different rationales were used to estimate scaling factors for the MLP, the variation between the extreme values of the scaling factors applicable at the same characteristic time intervals of a launch is less than the dispersion of the measured data defining a Saturn V zone. The equations used to derive scaling factors do not account f or the effect of transmission of
(7)
(8)
17
vibration through the structure, whibh should reduce the difference between the extreme values of the scaling factors. Therefore, engineering judgment was used to aid the final selection of a scaling factor and to interpolate between the limiting values calculated in table 2.
Table 2: Summary of Scaling Analysis
Scaling Factors on Structure Rational for Scaling Analysis Acceleration Response
______ ________________________________________ PSD of Saturn V ________ Mt Base SF(1) Total generated acoustic power 0.43
ML Base SF(2) Acoustic energy density flux in the immediate 1.05 vicinity outside of the supersonic core
ML SF(3) Comparison between acoustic fields at Saturn V 0.43 Tower ____ LUT and CLV ML Tower ________________
The final steps in the derivation of vibration specifications were to comply with the requirements pertinent to the use of these specifications for testing of GSE as outlined in the following.
The specifications must reflect the actual vibration environment in a simplified form. The shape of the specified PSD curve should allow the equalization tine to be minimized and the number of different PSD shapes should be reduced. Most of the measured data from the Saturn V Program shows similar PSD response curves for holddown and lift-off time intervals. Whenever differences in the shape of PSD curves were reflected in SP-4-38-D 2 an effort was made to revise the measured data prior to scaling to reduce Saturn V holddown and lift-off specifications to the same shape. In a number of cases where the preceding specifications were based on a small number of measurements in a zone, these measurements were reexamined and specifications revised to reflect trends consistent with the adjacent or similar zones.
The specifications must provide a safe level with a low probability that this level may be exceeded by the actual environment. They must contain an allowance for the variation of vibration levels within the zone and for the input dispersion from launch to launch. The main effort was directed toward the establishment of a safe overall rms acceleration level without undue penalty to the test items. The use of the superimposed narrow-band sweep fulfills the requirements to cover local protruding resonance peaks of actual response power spectra with only a small increase in the overall rms accelerations. To cover uncertainties related to scaling and changes in the structural configuration, the frequency range of the superimposed sweep was specified to cover the entire frequency range of these specifications.
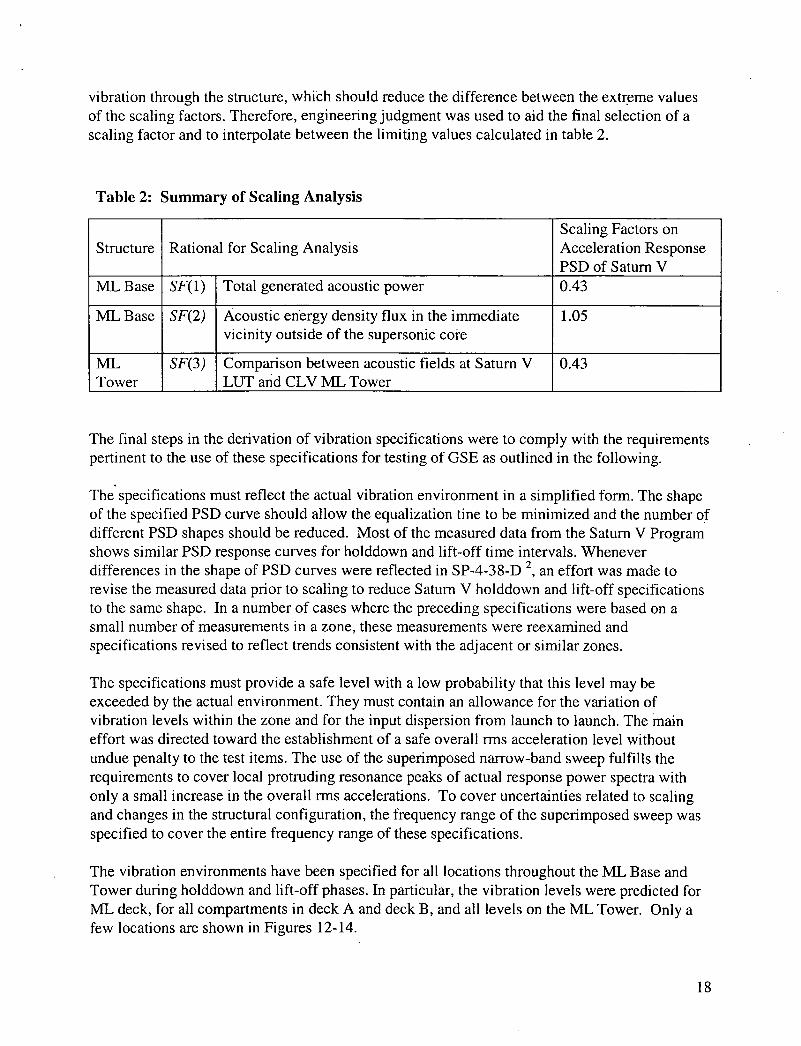
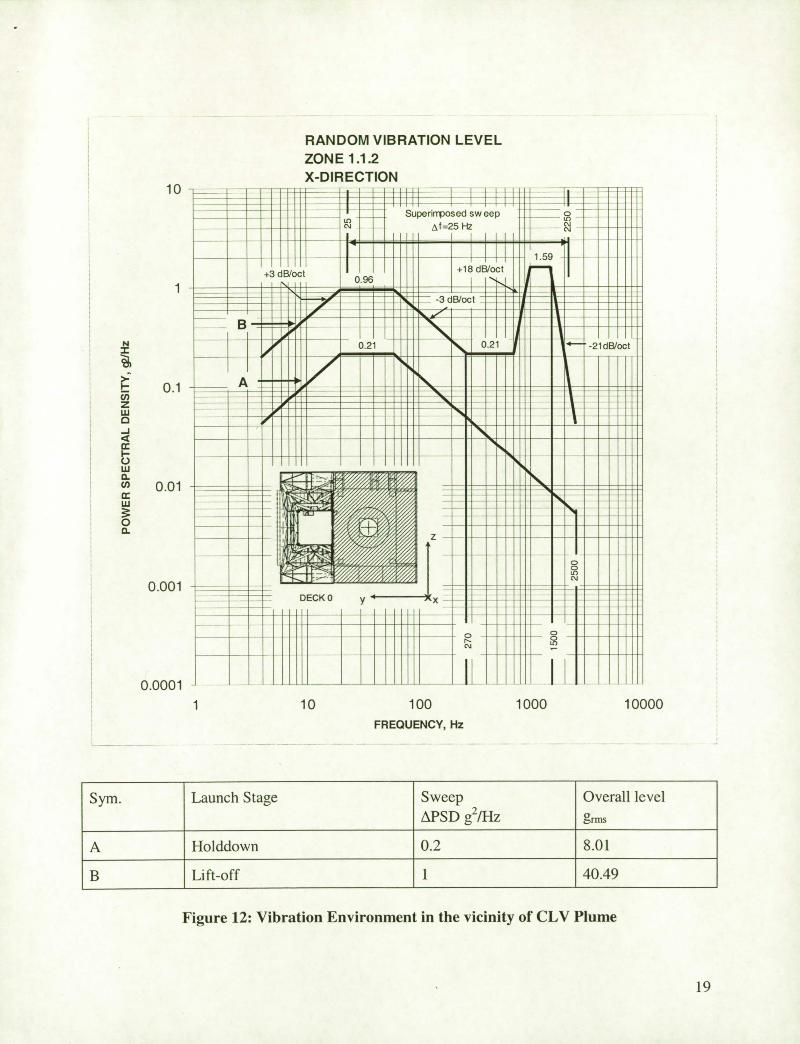
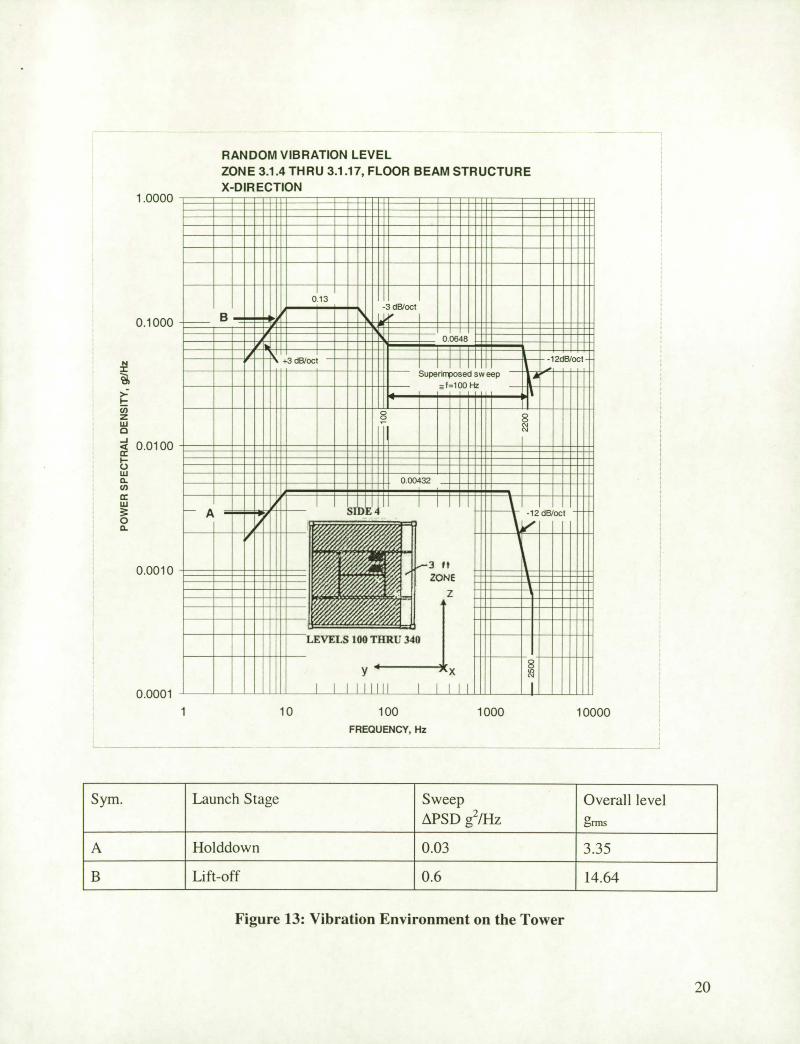
The vibration environments have been specified for all locations throughout the ML Base and Tower during holddown and lift-off phases. In particular, the vibration levels were predicted for ML deck, for all compartments in deck A and deck B, and all levels on the ML Tower. Only a few locations are shown in Figures 12-14.
18
RANDOM VIBRATION LEVEL ZONE 1.1.2 X-DIRECTION
10
1
0.001
0.0001
Ifl..IIE!IitRiU!UI. Iuo11:fl:H ::::u:: __iiIiIIi'_IIlII!iHI 1Ii!iIPiFui1H
. I - •!II11Ifi !!!IP!pIIIiijjiiI91
--- 4 III1IIIL I iii _... ••••1111111 • . ______.. --- _
UUUU •UU•• •U••
•r4•• '41uu U4U — — — — — .••• • ••••u
. I III • ••U•UII
111! .1!! I!$JI1I ___________________ __uI1Ii1IiiIiiiiiiN
1iI1'i'IiiIi ! !L4II!!iHiH iu..iuuuu••••uuu
II I II ___uuuuuui•••••••II •1•1I1 •••••••
•iiuuuuiuiuiuiuuiiiii . •uuunuuuuuiu u•uuuuii •uiiiiii •uunnisiuiniiiuuiiinioiiiinini
N I
0.1 Cl) z LU
—J
I-0 LU 0.
Cl)
0.01
LU
0 0
1 10 100 1000 10000 FREQUENCY, Hz
Sym. Launch Stage Sweep APSD g2/Hz
Overall level grms
A Holddown 0.2 8.01 B Lift-off 1 40.49
Figure 12: Vibration Environment in the vicinity of CLV Plume
19
RANDOM VIBRATION LEVEL
ZONE 3.1.4 THRU 3.1.17, FLOOR BEAM STRUCTURE
X-DIR ECTION
I-...JII=IIuIIIIII i•Uk
i••lhI . UI..
II"--..".
8
r
•••••• S S' U
_______
U
II V4I !L Nil liii
II •
ill'
1.0000
0.1000 B
N I
>-I—U) z w 0
0.0100
0 Ui a-U)
Ui
0 a-
0.0010
0.0001
-12dB/oct -I-
8 c'J c.J
12dB/oct ltt
r
10 100
1000 10000
FREQUENCY, Hz
Sym. Launch Stage Sweep APSD g2/Hz
Overall level
grms
A Holddown 0.03 3.35
B Lift-off 0.6 14.64
Figure 13: Vibration Environment on the Tower
20
RANDOM VIBRATION LEVEL
ZONE 3.1.4.1 THRU 3.1 .17.1, FLOOR BEAM STRUCTURE
X-DIR ECTION iI,I,I,IIøI
0.1 000
Cl) z Lii
0.0100
0.0010
ri rnni
1 10 100 1000 10000
FREQUENCY, Hz
Sym. Launch Stage Sweep APSD g2/Hz
Overall level g
A Holddown 0.25 4.99
B Lift-off 8 36.33
Figure 14: Vibration Environment on the Tower
21
CONCLUSIONS
The vibration and acoustic levels induced by CLV ML due to the launch of ARES-I vehicle have been predicted. The prediction is based on the scaling of the Saturn V/ Apollo launch environment. The Saturn V was selected for this scaling method because of its similarities, in terms of time histories, vehicle configurations and launch pad geometry. Also, Saturn V measured data were sufficient for the scaling. This scaling approach does provide the benefits of time and cost savings, but is limited by the assumptions required to derive the approach. The method was successfully implemented in the Shuttle program and is expected to predict well in the CLV ML environments. Since the predicted environments are intended to be used by the Constellation program office and their contractors, the earlier in the program these environments are recognized and utilized the more cost effective the implementation will be and the less chance that critical design will be overlooked.
ACKNOWLEDGEMENTS
The author would like to acknowledge Mr. Larry Schultz, the CLV ML manager, for his continual support in the Launch Induced Environment tasks.
REFERENCES
Sonic and Vibration Environment for Ground Facilities - A Design Manual, Wyle Lab Report No. WR-68-2, NASA Contract NAS8-1 1217, March 1968.
2. Acoustic and Vibration Environment and Test Specification Levels, Launch Complex 39, Ground Support Equipment, NASA/KSC Document, SP-4-38-D, Revision B, June 1969.
Environment and Test Specification Levels Ground Support Equipment for Space Shuttle System Launch Complex 39, Acoustic and Vibration, Volume I of II, NASAJKSC Document, GP-1059, Revision A, September 15, 1976.
22
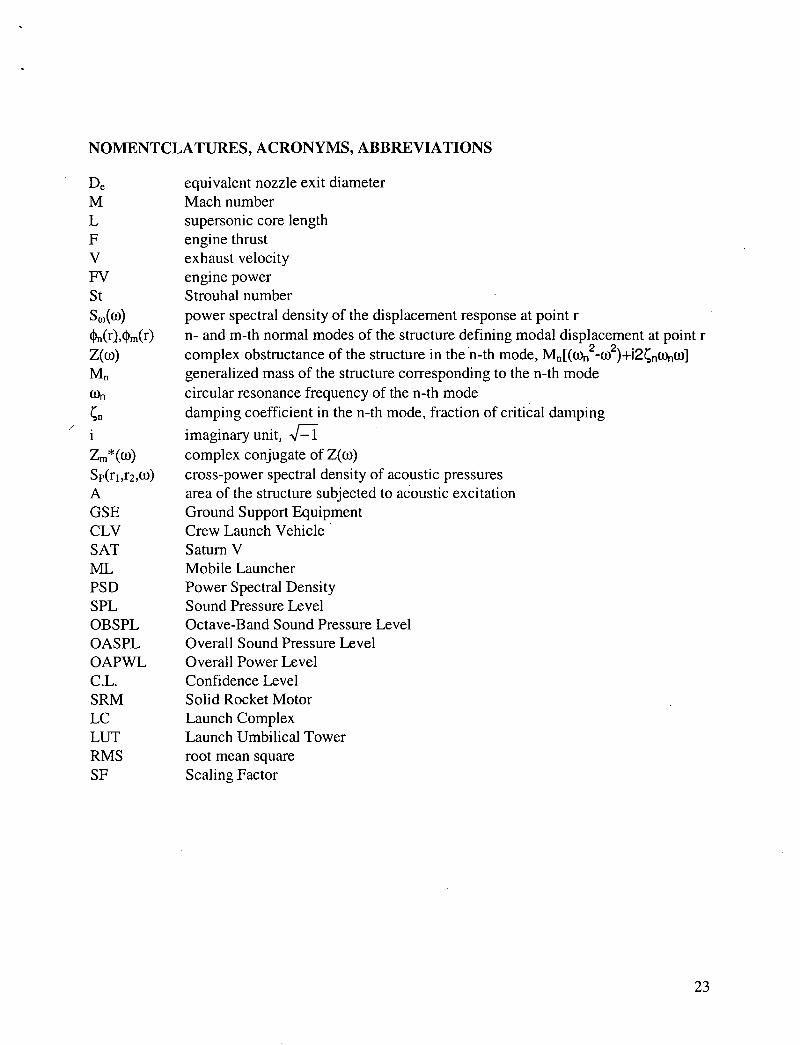
NOMENTCLATURES, ACRONYMS, ABBREVIATIONS
De equivalent nozzle exit diameter M Mach number L supersonic core length F engine thrust V exhaust velocity FV engine power St Strouhal number S(u)) power spectral density of the displacement response at point r
n- and m-th normal modes of the structure defining modal displacement at point r Z(w) complex obstructance of the structure in the n-th mode, M[(w2-w2)+i2çwwJ M generalized mass of the structure conesponding to the n-th mode
circular resonance frequency of the n-th mode damping coefficient in the n-th mode, fraction of critical damping
/imaginary unit, sJi
Zm*(W) complex conjugate of Z(w) Sp(r1 ,r2 ,w) cross-power spectral density of acoustic pressures A area of the structure subjected to acoustic excitation GSE Ground Support Equipment CLV Crew Launch Vehicle SAT Saturn V ML Mobile Launcher PSD Power Spectral Density SPL Sound Pressure Level OBSPL Octave-Band Sound Pressure Level OASPL Overall Sound Pressure Level OAPWL Overall Power Level C.L. Confidence Level SRM Solid Rocket Motor LC Launch Complex LUT Launch Umbilical Tower RMS root mean square SF Scaling Factor
23