Embed Size (px)
Citation preview

ACORN H"RODUC'HTION DURING THINNING
William E. Drake'
Abstract: Large poletimber size, mixed oak (eraarcus spp.) stands in Cenm Cou~ty, Pemsy'lvania were tthirlned ts detemiine whether acorn prduction could be improved by retainirrg the best acom grduclng oaks as compared with conventiond thinning gracdces. Sound acorn prduction averaged 291 and 339 [cfflha in the acom pmducnion and conventionally thinned ssemds, respecriveEy, psior to thinning. Average yields cfecliraed by 79 and 129 kgha in the acorn prduction and conventionrefly thinned stands, wspecfively, following thinning. Although declines were less in stdnnnds thinned for acorn prduction, they were not significmtfy different (PN.25) Piom those in conventionally thinned stands. Gown dominance was a11 iqo~bant fator affecting acom prduction in this study. Ninety-six md 76 percent of the dominant and co-do~nant oaks prcxlkaced acorns. Conversely, only 40 and 8 percent of the inatemediate and suppressed oaks were productive. Results of this study indicate that improvements in acorn yields were not sufficient to justify the additional effort and cost of identifying and retaining to best acom producing oaks prior to thinning.
INTRODUCTION
Factors affecting the a c m production of oaks have been intensively studied over the years because of the importance of acorns in regenerating oak stands and as a f d source for many wildlife species. Vigorously growing oaks with well delleloped crowns are regarded as generally superior acorn producers (Downs and McQuiliketa 11944, Cypero 1951, and S h q 1958). Kumesous studies also indicate that some intiividual oaks are consistently good or poor acorn producers and suggest that this may be due to their inherent genetic potentid for producing acorns (Downs and McQuilken 1944, Harlow and Eikurn 1963, S h q and Sgrague
m et al. 1971, and Christisen a& Kearby '1984).
Harlow and Eikum (19631, Sharp and Sprague (196?), Shaw (1971) and Cmr%rum et al. (1971) recommended that g d acom prducing oaks be retained during t%ninsaing to improve acom yields relative to conven~onally thinned stands. This study was u n d e ~ e a r to evaluate the effectiveness of such a ncomen&tion.
'wildlife Biologist, Pennsylvania Game C o d s s i a n , 2WEElmenun Ave., Harrisburg, PA 17 110-9797.
429 8th Centraf. Hardwood Forest Coraferenree
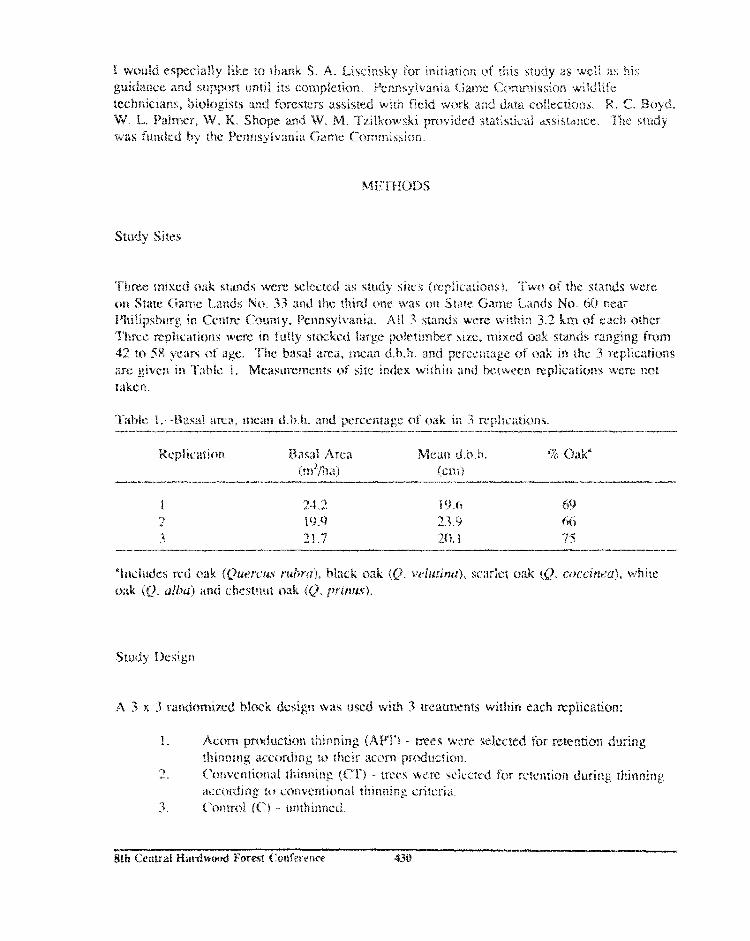
i ~ o u i i l especiaily like to r$?ank S. A. Liscinsky fur ir:ieia:iot; of this btiddy 2.s WCII his glrid;ti.nce and sng;\p,n iirstit i t 3 ctsm;.,p!eeian. Ksc-cnnt;y!vania C;arnc tl:i~rexx~El;sior, wiIdlEfe tecilnicianr, biologists and foresters arsi:ircd with fieid work, arrtl ce.illectictns. R . (.I. Boyd. 'tap. k, Palmer, W. K. S h o p and W. M. -F'xilknwski pnwided stixi~ticnl asiii;tilr:ce. "!lie study was ftlntfcd 'E?y the Pcnt~syivania C;ar;.re kl't~rrrmissir~ii.
P , F%xec mixcil oak stanifs wen: selccrerf its study sites (mgr8icaxionsf. 'i'wo of the s~n%~drs were ctrr Statc Ga1~1, I .;taztk No. 23 2nd tlre ? h i d {cane cuss o n Stare Ciirme Il.:ands f i l near I'tlilipslsrmrg i n f3c:ntw C:<ru~\ty, ISetln~yivaniii. All 3 s~inds were within 3.2 kin of tach othcr. 'I't~rce: ~plitr;ttictns were in fu!1y sftxkcd I;irgc !11>1~ti!l$l~b;r SIZC, r~aixed oak stamds xat~ging from 42 to 5% yc.;rrs ~ t f sge, 'I'hr: basral arcit, rlmearr d.b,h. xr~d pcrct:ntags; of oak irr a!tr 3 aeplictiriorts arts given in l";tttle 1 . Measwtrerncnz!: c.rf site ir,ctzx wirhirl :~nd bcawt.t:r.r eplicrrtinrrs were not 1i3kcn.
*Knciiratlcrs rctl oak (<l~t'rc.lu PLLPPIE), bi;tck :1ak (0 t'td&rirlt~), scarlet trak (Q. core- i ~ ~ ~ t a l , white crsk (Q. anlfss ir i i r ~ t l cE~e\ttrttt n;tk (Q. / ~ ~ d f i l l ~ i ) .
A 2 x 3 rrtrtdcm~ized b4ock dcsigrr was used with 3 treli'l~'t?c=nts within each ~ p l i c a ~ s n :
1. Ac6tn.t prtdtar:fiot~ thinning (AT!') - tees tvesr se%rrca@d for naerrrion during tibinning acci!rding ti, tttcir acorn prrwfilacrioii.
2. <-'it:!vcntio~~d rt.rinr.rialg { C T I .-. trrrs w r x scHrcard for. sctc.r.trion bitring t f~inning acctvcfing eo canv:rtniorr:rl r h i n n i r ? ~ crir::ria.
'1 . C'oalrrr~l [C) - urarhirrtvcti.
8th Central kIadwcd Formt 6:ralafer.a.erne 430

"411 n~tk. i:r ?he '4-0.8 ha AIyw' !fi;;itm~e~la blwkr; wcrc tagged with ralurx~inunn labels. Their pcater~rl;:! for atcorn pn(~!ucriors bvrtz; evalalarcrd by i:rsi;cction of b:iif~c&cs in she crown with hirnncwri1an.s iSirnrp 1958). Nui:lhcrs of a6:osris urt :hi: A rnr.tsr iae;avily &xari:lg bs~nches were cotla~fed fca;' en it^ 03k ( I ,3 I8 @t.:e6;f OF. 3 YcilTS p ~ i i ) ~ to til'at~r~i~!g {1!574 thni 1976). '%host oaks witlt i ? ~ best acrm pscxdt!crion for 3 years prior rai rhinrairsg wcrc rsp:t;tincd in APT matnlcrst blocks. hli nun-.o;iks were rcnlc~vecf first dinirrg tlliinnlrrg to nl:n,xfn~izc acttrra yieidr;. 'Then ,713.
ntzn..prrkicdi;cir?p anti s fern. of the ptmresr prrxtucirig rr;rks wcrc rcrnctved umil r31:p;iciu;il basal nreii irr the Aib'T' b i c ~ l i ~ v/;ei the same as tilift i r r tlnc C:"r b1~xks. Also, each of the oaks in ttlc !In' b i t ~ k s .ivcrc visuially ixxsprc~ed prior lo t?lirtnlng arid pf;aced in a cfonninanr, cu-d<>rsrirrant, intei-rnedi:lr:: ttr supp~ssed cn>wrm dc~snin21~nce crgtegrrv.
a'abtr- 2.-.-bPrr-thinrting species cc3mg1cnsiiii3n (I'4 of biasel ares) in APT and CT rreaerxucnts for 3 rt:~lirratir)ns - 4nr~i.rr~m, 19'77.
Spzcic\ Repiication # I Rcplicatit sra #2 Replication #J AFT CT AIYI' C'I' APH' CT
1-cd oak black itak scierlet rjak white oak ~hei;trll jt oak red n~aple sassirfras hickory spp. bSack gun1 aspen spg.
32 30 27 20 10 6 4 2 5 6
25 35 1 trace
trace 1 0 0 O Q

%?I January, 1977, dia~nmeter measurements of all Qeefi :n all f i~ep!i~atio~~s of rile /+,pr arid yr &eatrent blocks were conducred to determine par..-rhinnitsg spzcks t:~mpositkm (Table 21 -- 1
size class compcssitian and basal area (Table 3). Prism plot cruises were used ro deremligle bas& area in the C blwks. k-treatment bwaI a,re;i means were 22.9, 23.9 a n d 20.7 in the APT, CT, and C treatment blocks, respectively .
Table 3.--P:<e-thinning , t i x cc1;ihs cttsn1,ol;ition of !,;ass) ;ired) in AIT and CB" h ~ ~ f ~ l ~ ~ ~ ~ ~ t ~ ft,f
3 reglncatlaa~s - January, 1977. I " . - - - -
Sizr: class Replication .W 1 Rrplicarra,n #2 Keplizatlo~~ #3 (dbh-inches) APT CT APT CIS am- CT
49 $5 I3 9 12 I 1 15 12 3 7 "'3
9 3 1P 2 *
I Iracc trace trace trace C?
0 0 O trace
32 26 18 L 5 7 2
trace trace trace trace 0
trace
In Much, 1977, the CT blcxks were rerfuced by about 30 percent to 16.3 m 2 b a of basini tircii
tising esaahlished fcjrtlstr?, and wildlife practices. The API' bicxks were tFhin~led ra the :ilkme basal area by resnc~vsl of all raon--oaks as wcl! ns the n<stl-prtd~icing and pmscst acorn prducing oaks. Pose-ttminning tZIT matmcrat specics and size class cornposificrn for Rcjtlications # I , 182 :snil #3 arc irt 'rabies 4, 5 and 6! respectively. Pctst-thinning Ca' Ixidtnlt:nl
species arad size class coanpoxitiun fk~r Replications W I , tC"I;ukd $3 ;Ire in Tables 7 , 8 2nd 9, respectively.
Degirarring in the 9980 growing sttascrn, rlhc study amim experiencttd 5 ye;Ks of gypsy mrxh (Lyn~b~nlria dispar) dcloliation. Dcfoli atiurir was maierote in 1 4iXI), in I 5% 1
and 1982, light in 1983 and very light in 1981. By 1984, there was si.gnificmr O& monditj. throughout ail 3 rcpiisati<jns. To insure ctjrxai stcxking levels following the basal
area of all Xivc trees in ehc APT umd C T blsxks was xneiksurcd in May of 198.4 ra~.e% J u ~ a i : of and 1986. By 1984, basaf area in the Ai'y bibictzks had declirletf by ar.1 average of 34
~ f ~ c " : " "'0111 ahe oTigi~l;tl rhinning E S I 1077. C'I' h!~~:k;s hiad C ~ , ~ s i ~ i s r \ t i ~ less mortdity. h s a l area i!? the a' hlrxks av;is the: s:at.rme in Miry, 1'154 (16. I ia.l"/%a, a.; rhar rcnlaini~?g f'0iiowi:lg
8th Central H s s c E w d Forest Co~fere*a~f 432
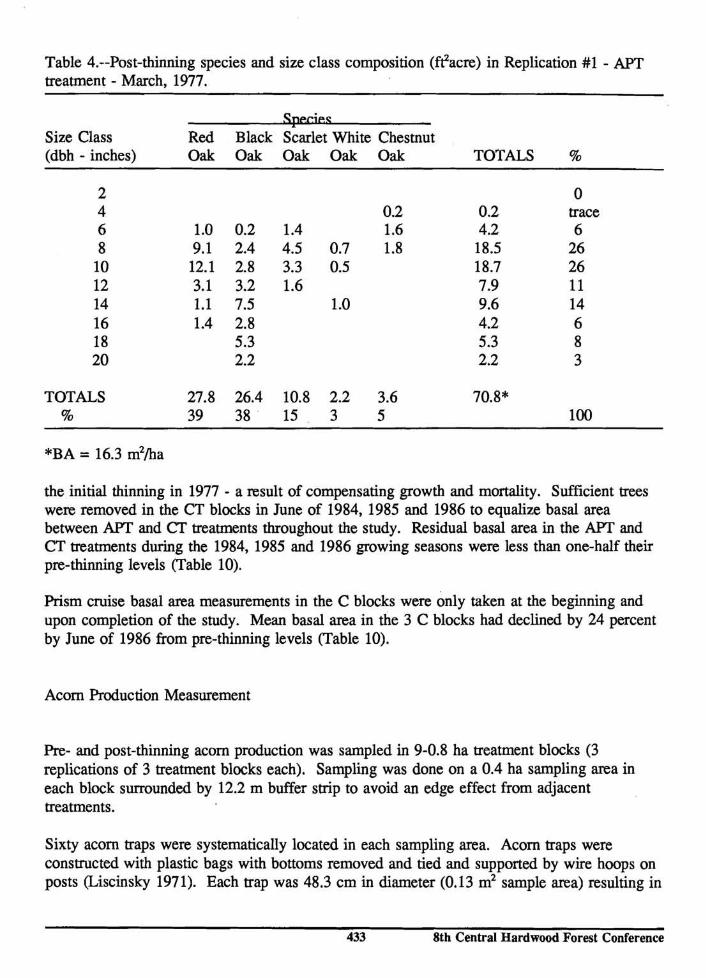
Table 4.--Post-thinning species and size class composition (ffacre) in Replication #1 - APT treatment - March, 1977.
C&s
Size Class Red Black Scarlet White Chestnut (dbh - inches) Oak Oak Oak Oak Oak TOTALS %
TOTALS %
0 trace 6
26 26 11 14 6 8 3
the initial thinning in 1977 - a result of compensating growth and mortality. Sufficient trees were removed in the CT blocks in June of 1984, 1985 and 1986 to equalize basal area between APT and CT treatments throughout the study. Residual basal area in the AFT and CT treatments during the 1984, 1985 and 1986 growing seasons were less than one-half their pre-thinning levels (Table 10).
Prism cruise basal area measurements in the C blocks were only taken at the beginning and upon completion of the study. Mean basal area in the 3 C blocks had declined by 24 percent by June of 1986 from pre-thinning levels (Table 10).
Acorn Production Measurement
Re- and post-thinning acorn production was sampled in 9-0.8 ha treatment blocks (3 replications of 3 treatment blocks each). Sampling was done on a 0.4 ha sampling area in each block surrounded by 12.2 m buffer strip to avoid an edge effect from adjacent treatments.
Sixty acorn traps were systematically located in each sampling area. Acorn traps were constructed with plastic bags with bottoms removed and tied and supported by wire hoops on posts (Liscinsky 1971). Each trap was 48.3 cm in diameter (0.13 m2 sample area) resulting in
433 8th Central Hardwood Forest Conference

Table 5.--Post-thinning species and size class composition (fflacre) in Replication #2 - APT treatment - March, 1977.
c
Size Class Red Black Scarlet White Chestnut (dbh - inches) Oak Oak Oak Oak Oak TOTALS %
TOTALS %
7.8 m2 being sampled in each sampling area. Four collections were made each fall. Sound acorns captured were weighed within 24 hours of collection. Weights were converted to estimates of sound acorn production in kg (fresh weight) per ha.
All 9 treatment blocks were sampled for 3 years (1974 t h 1976) to obtain estimates of mean pre-thinning acorn production. Each treatment block was then sampled for 10 years (1977 thru 1986) to determine post-thinning means.
Data Analysis
Friedrnan's randomized block analysis of variance test was used to test the H, that changes in acorn yields following thinning were the same for all 3 treatments. Since mean pre-thinning acorn yields were not equal in all 3 treatments, comparisons of response to the 2 types of thinning were based on percentage changes in mean acorn yields following these thinnings. x2 tables were used to determine the significance of Friedrnan's critical value (x2r, P=0.05, 2 df, Zar 1974).
The Kruskal-Wallis single factor analysis of variance by ranks test was used to test the H, that the percentage of oaks in the AFT treatment blocks producing acorns was the same regardless of crown dominance (%,,3,3,3,3, Zar 1974).
8th Central Hardwood Forest Conference 434

Table: 6.--iiaosr-thinning species a~ td size class composldon (ft2/acxj in Replication #3 - APT maamen$ - Much, 1977.
S i x Class Red Black Scarislee White Chestnut fdhh - inches) Orrk Oak Oak O& Oak TOTALS %
TOTAL 5%
RESULTS AND DISCUSSION
Annual Acorn Producd?an Trends
T ~ n d s in mean acorn prducrion in 3 @eatmenis aver 13 years rnre presented in Table I I. As in other studies (Downs and McQuiaen 1944, G m u m et al. 1971, and Christisen md Kexby 1984), acorn yields varied considerably between yews. There were bumper crops (>'?MI k&a or > 600 poundsjacre) of acorns in 3 of 13 years. One (1976) was before and 2 (1979 and 1985) were after thinning Figure I ) . Only 1 other year (1984) had mean acorn yields in excess s f I50 kgjha. The acorn crops of 1980 thrta I984 were heavily affected by gypsy moth &foliation. Trends in annual acorn yields between treatments were fairly consistent throtnghsut the study. All treatments had excellent yields in bumper years and vice versa in yeas sf poor a c m prduction.
Acorn Roduc~on Thinning Versus Conventiond Thinning
Mean pre-thinning ~ c o m yields for AFT and CT mamena blmks were 221 and 339 Brg%a, respectively. Mean acorn yield declined d d n g the 10 yeas following thinning ii?a both

Table 7.--Posr-tBainning species and size class composition (ft/'acre) in Replication #I - C T zeatraaent - March, B9'37,
Size Class Wed Black Scarlet White Chestnut (dbh - inches) Oak Oak Oak Oak Oak Orhers** ?'OFrALS %
TOTALS %
trace trace 0.2 0.3
2,o 19.6
0,6 27.5 7.9 4.3 2.8 3.5 2.2
*BA = 16.1 m21&a ""Includes red maple, hickory spp. and sassafras.
and C'T blocks to 217 and 210 kg&a, respectively (Table I I). Post-thinning declines may have been pmlatly duc to gypsy ~raoth defoliation. Acorn yields declined less following thinning in the APT blocks (-74 k@a) than in the CT blocks (-129 icaa) . Friedman's rest indicated tllst changes in acorn yields were. not different (x2r-1.962, PA3.25, 2 dfS regadless of" the thinning techniques used.
There could be several reasons why acorn yields were not improved significantly by reaining the best acorn prcxfucing oaks during thinning. Perhaps oaks with the best genetic potential for ~orlsistarltly gcmi acorn production were not well Identified by counting acorns on the 6 best producing branches. However, this should he a practical phenotypic criteria for selecting oaks with the best genetic pcentiral for acom prduction (Sharp 1958). In addition, all 5 oak species (red, black, sealet, white md chestnut) had at lease I year of good acorn production during the 3 years when branches were inspected prior to thinning. All 5 oak species had sat least fair acorn production during the bumper 1976 crop. If poor or superior acom producing oaks are relatively consistant in this respect, they should have been easily identified.
Results nf this study were heavily influenced by bumper acorn yields in 1979 and 1985. Perhiaps continuation of the study would have given different results. However, If the acom grduction pstenrtial of she oaks retained during thinning was a relatively consistant factor zffccting acorn yields, it should have been demonstrrtted in these bumper yeas.
8th <:entral H a s d w d Forest Conference 436

Table 8.--Post-thinning species ;aild size cilass composition (fgacrej in Replication #2 - C'T Eeatx-neni - Mxch, 1977,
Size Class Red BBiack Scarlet White Chestnut fdbh - inches) Oak Oak Oak Oak Oak Orhers** TOTALS %
TOTALS %
*BA = 16.6 m2ha **Includes: red maple and hickory spp .
Cmwn Dominance Venus Acorn IPPoduceion
Studies by Downs and McQuilken (1944), Cypert (19511, Burns et al. (1954), Sharp md Sprague (1967) and m ee d. (1971) have indicated the importance of crown dominance on acorn yields. The impoflance of crown dominance was also appaen? in the study. Ninety-six and 76 percent of the dominant and co-dominmt oaks produced acorns, respectively. Conversely, only 40 and 8 percent of the inaemediate and suppressed oaks, respecaively, were productive (Table 12). Crown dominance was an extremely impo~ant factor (Pl;=10.37, P<8.051) infauencing whether or not oaks in th"tePT treatment blocks produced acorns.
All the non-grducing oaks as well as some sf the poorest grdtacers, were removed during thinning. lPoozse prducing oaks Jso tended to be suppressed and intemdiates. S i n ~ e many of the suppressed and intermediates were removed in the C T blocks, size class dis~ibutions of trees retained in the APT blmks were similar to those in the CT blocks (see Tables 3 through 9). Even the spacing of residual trees was observed to be similar in the

Table 9.--Post-ehinni~2g species and size class composition ffgacre-e) in Replication #3 - C T matm.ent - i V ~ ~ h , 1977,
9-s
Size Class Red Black Scasfet. White Chestnut (dbh - inches) Oak Oak Oak Oak Oak Others*" 'b'OTAES %
TOTALS %
*BA = 16.2 m2ka **Includes red maple, hickory spp., sassafms, aspen spp., armd blackgum.
Table 10.--Meal basal are:% fm2ha) in 3 Eeamenrs.
Date APT* CT* C**
B;BbBEowing gypsy moth mowaliey May, 1984 10.6 16.1 ? June, I984 18.6 10.6 ? June, 1985 10.3 10.3 ? June, 1986 11.3 1'1.3 15.6
* Based ori diameter measurement of all mes in 3 replications. **Rased c ~ n I 0 BAF-IO prism plots in all 3 replications.
8th Central H s s d s v d Forest Conference 431

Table I. 1.--Mem pre- and pst-thinning acorn prducfiosr for 3 Eeatnrents*.
Year
1977 1978 1979 1980 198 1 11982 1983 1984 1985 1986 Mean (10 yrs.)
Change % change
Post thinning 33 2
952 62 5 I 8
293 680 59
210
*Figures represent mem (for 3 replica~~ws) estimated sound acorn pMarctisn in kg ( f ~ s h weightlha.
Table 12.--Percentage of producing oaks, by crown dominzence c h i k g ~ ~ in 3 APT reolications- 1874 thm 18%.
Replication D o ~ n m t Co-Dominmhne Interndate Sagpressd
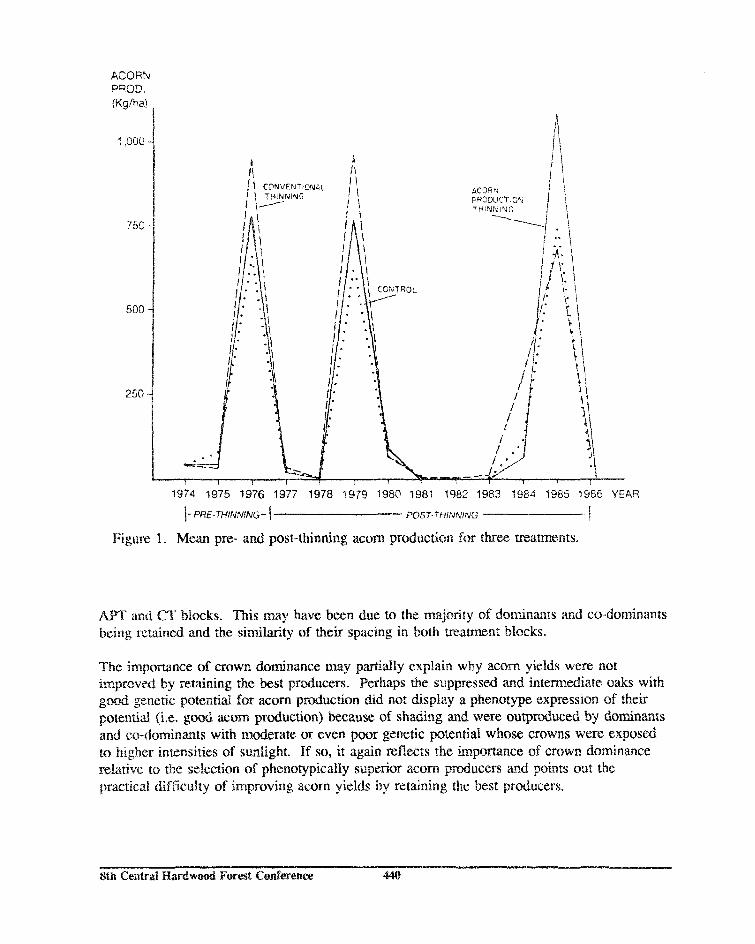
ACORN PROD. (Kg/ha)
1974 1975 1976 1977 1978 1979 1980 1981 1982 1983 1984 1985 1986 YEAR
1-PRE-THINN!NG- 1 POST-TffiNWlNC; 1 Figure I. Mean pre- and post-thinning acorn production for thee treatments.
APT and CT blocks. This may have been due to the majority of hminants and eo-dominants being retained livid the s i m i l ~ t y of their spacing in both treatment blocks.
The inlportance of crown doaninance may gmialBy explain why acorn yields were not improved by retaining the best producers. Perhaps the suppressed and internedate oaks with g a d genetic potential for acorn pductiorn did not display a phenotype expressian of their potential (i.e. g d acorn proclraction) because, of shading and were ouegrduced by dodnmts and co-dominants with mderate or even gaor genetic potential whose crowns were exposed to higher intensities of sunlight. If so, it again reflects the hpomnce of crown dominance relative to the selection of phenotglpicalHy superior acorn producers and points out the practical difficulty of improving acorn yields by reieldning the best producers,
$th Central H a r d w d Forest Conference 440

SUMMARY
Crown dominmce was an imponma factor affecting the acorn grdirction of incBividud oaks in this study. Conversely, acorn yields were not appreciably improved by retaining gaud aconl producing oaks during thinning relative to conventiondly thinned stands. Results of this study indicate that improvetnents in acorn yields were rnot sufficient to jusdfy the ad&fonal effort and cast of idendfying and netaining the best acorn prducing oaks prior to she thinning.
Bums, P.V., D.M. CBrristisen and J. M. Nichols. 1954. Acorn prducaion in the -R¶issouni Ozarks, Univ. of Missouri A@. Expt. Sta. Bull. 61 1. 8 pp,
Christisen, D. M. and W. H. Kearby. 1984. Mast measuzmens and prduction in Missouri (with special reference to acorns). Terrestrial Series #13, M i s s o ~ Dept. of Cons., Jefferson City, MO. 34 pp,
Cypert, E. 1951. Suggestions for the management of oak P'orests for mast prduetion. Presented at the Southeastern Asscx, Came and Fish Commissioners Conf. 8pp Mimeo.
Downs, A.A. and W. En McQuilken. 194. Seed production of southern Appaltachian oaks. J. Forestry 42(12):913-920.
n , P.D., V. H. Reid anti G.E. Boyd. 1971. Acorn yields, charactefistics and management criteria of oaks for wildlife. J. Wiidf. Mgmt. 35(3):520-53 1.
Harlow, R.F. and R. %. Eikum. 1963. The effect of stand density on the acorn ~ F ~ H C ~ ~ O R of turkey oaks. 17th Ann. emf. S.E. Assoc. of Game and Fish e30mmissioners: 126-133.
14iscinsky, S.A. 1971. Measu~ng seed tree craps. Prsg. Rept. W-48-R, Job 2 -5, PA Game Co&ssion, Hbg. 3pp.
S h q , W. M. 1958. Evaluating mast yields in the oaks. PA Ag. Exper. Sta. Bull. No. 4'35, Cmiv. Bark, PA. 22pp.
Sharp, W. M. and V. G. Sprague. 1967. Flowering and fruiting in the white oaks: pistilfate flowering, acorn deveiopment, weather and yields. Ecology 48(2): 243-25 1.
Shaw, S.P. 1971. WiPdlZe and oak management in oak. Symposiumla bceedings, USDA P;E For. Exper, Sra., Upper Darby, PA: 84-89.
Zar, f . Hf. 1974. Biostatisricat analysis. Rentice-Ha31 Inc., Eng lewd Cliffs, NJ, 61 l pp.