Embed Size (px)
Citation preview
July 14, 2017
ACO Technical Assistance: Population Management from Empanelment to
Care Coordination
Presented By: Art Jones, MD and Lisa Whittemore, MSW

2
AGENDA
1. Introduction and Goals
2. Provider-Led Medicaid ACOs: A
National Context
3. Population Health Overview
(Exercise 1)
4. Care Management Structure and
Staffing (Exercise 2)
5. Risk Stratification and Social
Determinants of Health (Exercise 3)
6. Improving Quality Performance
7. Care Management’s Role in
Behavioral Health Integration
8. Incenting Care Management
Performance via Distribution of
Value-based Payments
9. Wrap up

INTRODUCTION & GOALS
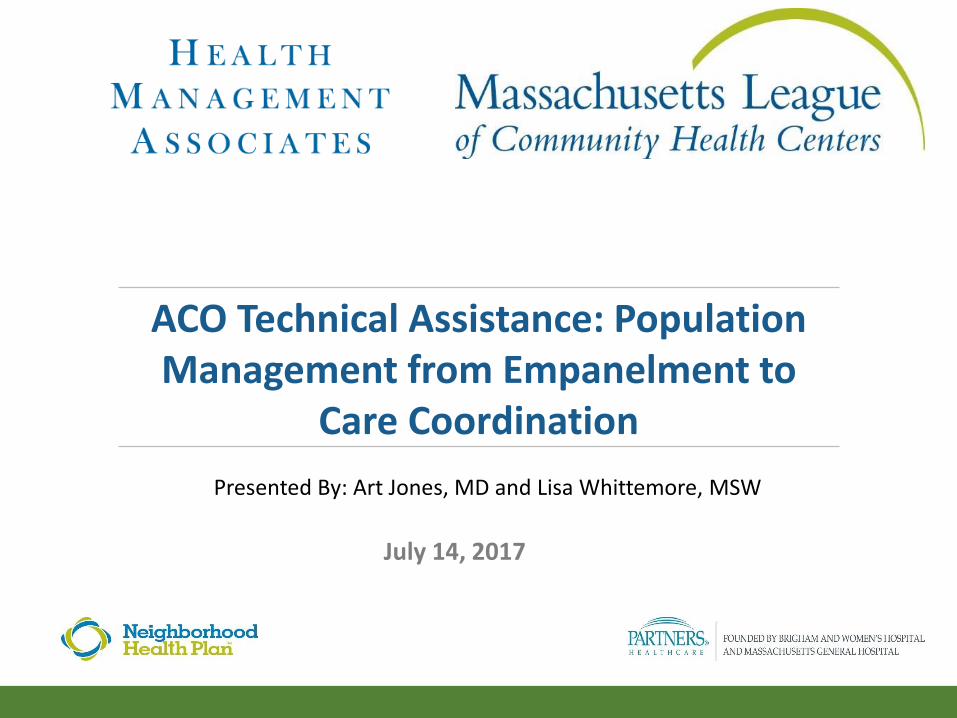
Four-Part Series on Value Based Payment Readiness: Overview
4
Overview of Readiness Roadmap:
How to Succeed in New
Environment
• Setting the tone for change
• Review of roadmap
• Building the pyramid: risk
stratification
Elements for Success – Finances and
Infrastructure:
• Negotiation strategies
• Funds flow, infrastructure
investments and levels of risk
• Division of Responsibilities: MCO
and ACO
• Compensation systems to align
incentives
Elements for Success –
Population Management:
• Empanelment/engagement
• Population Management tasks
and division of responsibilities
• Care Management Staffing & ROI
• Risk stratification: who to care
manage
• BH Integration
Elements for Success: ACO Risk
Stratification and Coding for
Improvement
• Coding in new MassHealth
environment
• Approaches to risk stratification for
financial and quality improvements
• Role of social determinants
5
+ Discuss aspects of population management important to consider when establishing your models for ACO
+ Learn from the experience of successful ACO (Medical Health Network) in establishing infrastructure for system transformation and population management
+ Explore Care Coordination/ Care Management structure and staffing patterns with impact on cost
+ Risk stratification and impact on Care Management program and decisions
+ Discuss integration of Behavioral Health and Primary Care
+ Hear model for funds flow and incentives within the ACO
GOALS FOR THE DAY

PROVIDER-LED MEDICAID ACOS
A NATIONAL CONTEXT

7
+Change provider focus from simply service provision to client outcomes
+Increase the delivery of evidence-based care
+Support access to services in the most member-centric fashion
+Expand the use of non-traditional workforce team members
+Improve client safety
+Reduce waste
+Improve provider collaboration across the full continuum of care
THE ONGOING EVOLUTION OF HIGH-VALUE CHCs

8
MEDICAID ACO: STATE ACTIVITIES
Source: Retrieved from http://www.chcs.org/resource/medicaid-aco-state-update/
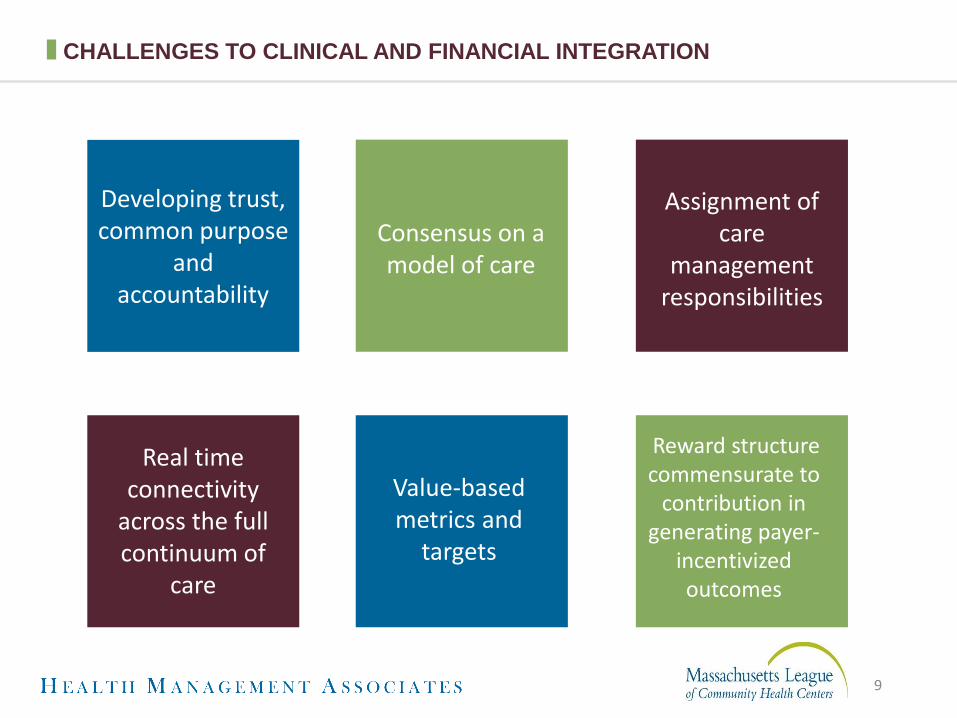
Developing trust, common purpose
and accountability
Consensus on a model of care
Assignment of care
management responsibilities
Real time connectivity
across the full continuum of
care
Value-based metrics and
targets
Reward structure commensurate to
contribution in generating payer-
incentivized outcomes
CHALLENGES TO CLINICAL AND FINANCIAL INTEGRATION
9

Consensus on a model of care
Assignment of care
management responsibilities
Reward structure commensurate to
contribution in generating payer-
incentivized outcomes
TOP FOCUS AREAS FOR 2017
10
0% 10% 20% 30% 40% 50% 60% 70% 80% 90% 100%
Long term care integration
Supply chain efficiencies
Surgical care standardization
Overuse of speclty./redund. imaging & diagnostics
Palliative care
Patient engagement
Pharmacy or medication adherence
End-of-life care assessment
Mental health care integration
Post-acute care integration
Prevent. ED visits/inpatient admissions
Management of chronic conditions
Prevent. readmissions/transt. care improvement
Yes Non=168
Many ACOs have identified one or a few focus areas for improving efficiency and reducing the total cost of care. Which of these focus areas are your top three priorities for 2017?

Consensus on a model of care
Assignment of care
management responsibilities
Reward structure commensurate to
contribution in generating payer-
incentivized outcomes
ADDRESSING UNSCHEDULED CARE
11
Please indicate the priority your ACO is placing on each of the following strategies to address acute unscheduled care (e.g. emergency department (ED), urgent care).
73%65% 60% 56% 51%
40%
18%19% 24%
24% 24%
25%
10% 16% 16% 21% 21%35%
0%
10%
20%
30%
40%
50%
60%
70%
80%
90%
100%
Primary care redesign Creating alterantive sitesto the ED for acuteunscheduled care
Expanding carecoordination from the ED
Measures or incentivesfor primary care providers
to reduce ED visits
Expanding alternatives toinpatient hospitalization
for ED patients
Measures or incentivesfor ED provider to reduceinpatient hospitalizations
High Priority Medium Priority Low Priority
Insight: There is greater consensus around preventing ED use with outpatient options than strategies within the ED. Measures and incentives for ED providers lack the most consensus.

12
HEALTH CARE’S INFLUENCE ON HEALTH IS LIMITED
90% of health outcomes are associated with
factors other than health care
Only 10% of health outcomes are associated
with health care
Source: Schroeder,2007
Health Outcomes
10% Health Care 30% Genetics
60% Behavioral, social, environmental
(individual behavioral patterns = 40%
social circumstances = 15% Environmental = 5%)
Upstream Evolution

13
INTRODUCTION TO MEDICAL HOME NETWORK: INTEGRATION DRIVING
TRANSFORMATION
9 FQHCs
3 Hospital Systems
86 Medical Homes
*486 PCPs
150+ Care Managers
1,200 Specialists
6 Hospitals
*Includes PAs & APNs
MHN ACO Providers
Medicaid
Members
ACO % of
Total
ACA 24,347 30%
FHP 55,170 68%
SPD 1,589 2%
Total 81,106 100%
MHN ACO Population
Medical Home Network |©2016-17 All Rights Reserved | Proprietary & Confidential
MHN Geography

14
LIFE EXPECTANCY ON CHICAGO’S WEST SIDE
Medical Home Network |©2016-17 All Rights Reserved | Proprietary & Confidential

15
CHICAGO HARDSHIP INDEX
16
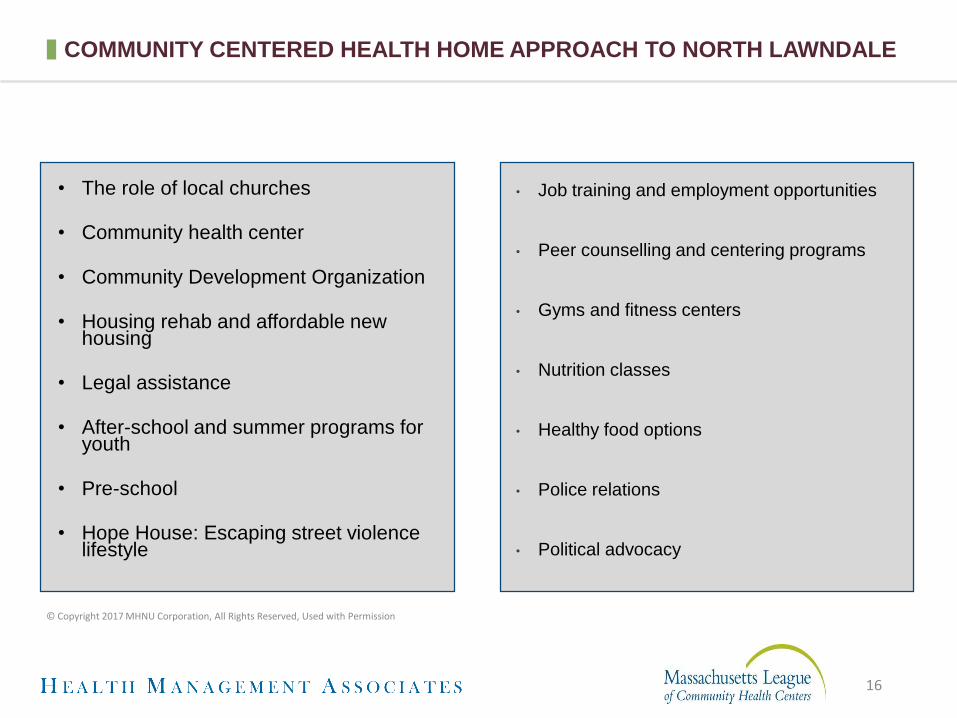
COMMUNITY CENTERED HEALTH HOME APPROACH TO NORTH LAWNDALE
© Copyright 2017 MHNU Corporation, All Rights Reserved, Used with Permission
• The role of local churches
• Community health center
• Community Development Organization
• Housing rehab and affordable new housing
• Legal assistance
• After-school and summer programs for youth
• Pre-school
• Hope House: Escaping street violence lifestyle
• Job training and employment opportunities
• Peer counselling and centering programs
• Gyms and fitness centers
• Nutrition classes
• Healthy food options
• Police relations
• Political advocacy

The difference in cost of care for MHN versus other Medicaid
patients in IL is 3.5% in Year 1 and 5% in Year 2
Total Cost of Care – State Medicaid Pilot
Total Cost of Care - ACOACA Utilization - ACO
-6%
-4%
-2%
0%
Year 0Year 1Year 2
Difference is MHN risk adjusted cohort vs Non-MHN risk adjusted cohort percent change in cost of care
Source: Findings of the MHN HFS Care Coordination Pilot for the Illinois Health Connect population
5% LOWER COST(risk adjusted)
ED Visits/1000Inpatient Days/1000
External
Network
MHN
659
568
ExternalNetwork
MHN
YEAR 1 Jul14–Jun15
14% BETTER OUTCOME
YEAR 2 Jul15– Jun16
21% BETTER OUTCOME
Year 1 Acute
Days/1000
Year 2 Acute
Days/1000
Year 1 ED
Visits/1000
907743
ExternalNetwork
MHN
903750
ExternalNetwork
MHN
YEAR 1 Jul14–Jun15
18% BETTER OUTCOME
YEAR 2 Jul15–Jun16
17% BETTER OUTCOME
Year 2 ED
Visits/1000
$17.7m SAVINGS
+12.1% variance
from target
Contract Year 1
$6.6m SAVINGS
+18% variance
from target
Contract Year 2 Q1
Patient Engagement - ACO
Period: July 1, 2014 – Present
MHN ACO:
86% COMPLETE
772608
ExternalNetwork
MHN
17
MHNU Corporation l © Copyright 2016-2017 All Rights Reserved l Used with Permission
MEDICAL HOME NETWORK ACO RESULTS: IMPACT ON COST AND OUTCOMES

Medical Home Network |©2016-17 All Rights Reserved | Proprietary & Confidential
18
THE BUILDING BLOCKS FOR DELIVERY SYSTEM TRANSFORMATION &
POPULATION MANAGEMENT

© Copyright 2017 MHNU Corporation, All Rights Reserved, Used with Permission
19
THE BUILDING BLOCKS FOR TRANSFORMATION & POPULATION MANAGEMENT
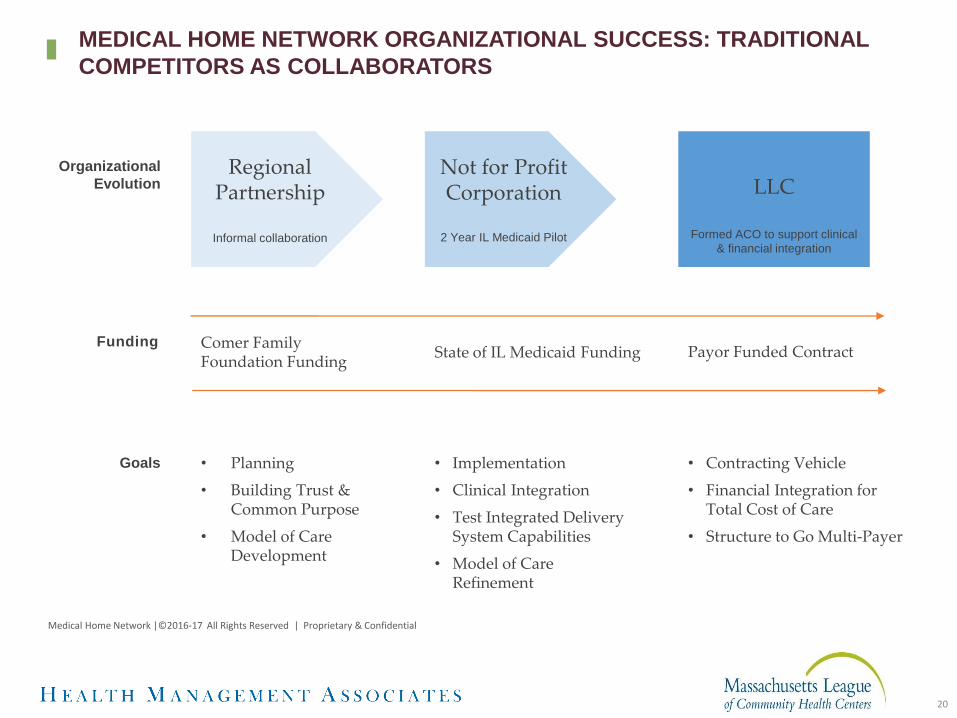
Organizational
EvolutionRegional
Partnership
Informal collaboration
Not for Profit Corporation
2 Year IL Medicaid Pilot
LLC
Formed ACO to support clinical
& financial integration
Funding
• Planning
• Building Trust & Common Purpose
• Model of Care Development
• Implementation
• Clinical Integration
• Test Integrated Delivery System Capabilities
• Model of Care Refinement
• Contracting Vehicle
• Financial Integration for Total Cost of Care
• Structure to Go Multi-Payer
Comer Family Foundation Funding
State of IL Medicaid Funding Payor Funded Contract
Goals
Medical Home Network |©2016-17 All Rights Reserved | Proprietary & Confidential
20
MEDICAL HOME NETWORK ORGANIZATIONAL SUCCESS: TRADITIONAL
COMPETITORS AS COLLABORATORS

21
+ Success is a team effort, not an individual competition.
+ CEO participation and emphasis is essential.
+ Involve the health plan in your operations meetings in a transparent fashion.
+ Create clear expectations for the health plan and hold them accountable for their performance (timely claims data, carved out services, etc.).
+ Anticipate that some participants will only deliver when faced with deadlines and significant consequences; plan accordingly.
MHN: LESSONS LEARNED, USUALLY THE HARD WAY
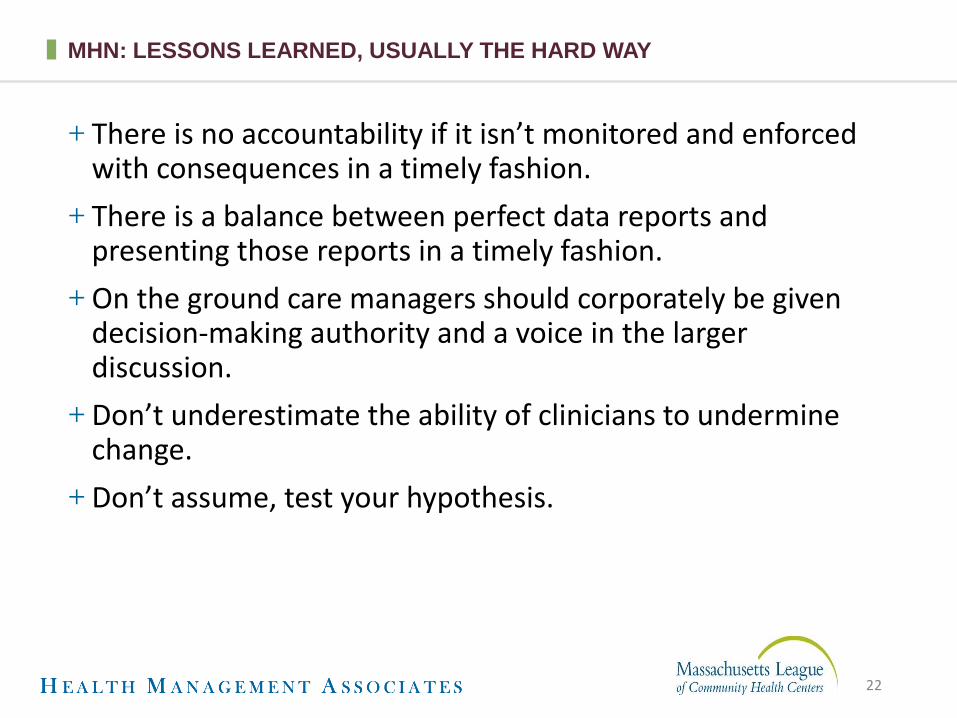
22
+ There is no accountability if it isn’t monitored and enforced with consequences in a timely fashion.
+ There is a balance between perfect data reports and presenting those reports in a timely fashion.
+ On the ground care managers should corporately be given decision-making authority and a voice in the larger discussion.
+ Don’t underestimate the ability of clinicians to undermine change.
+ Don’t assume, test your hypothesis.
MHN: LESSONS LEARNED, USUALLY THE HARD WAY

POPULATION HEALTHAN OVERVIEW
24
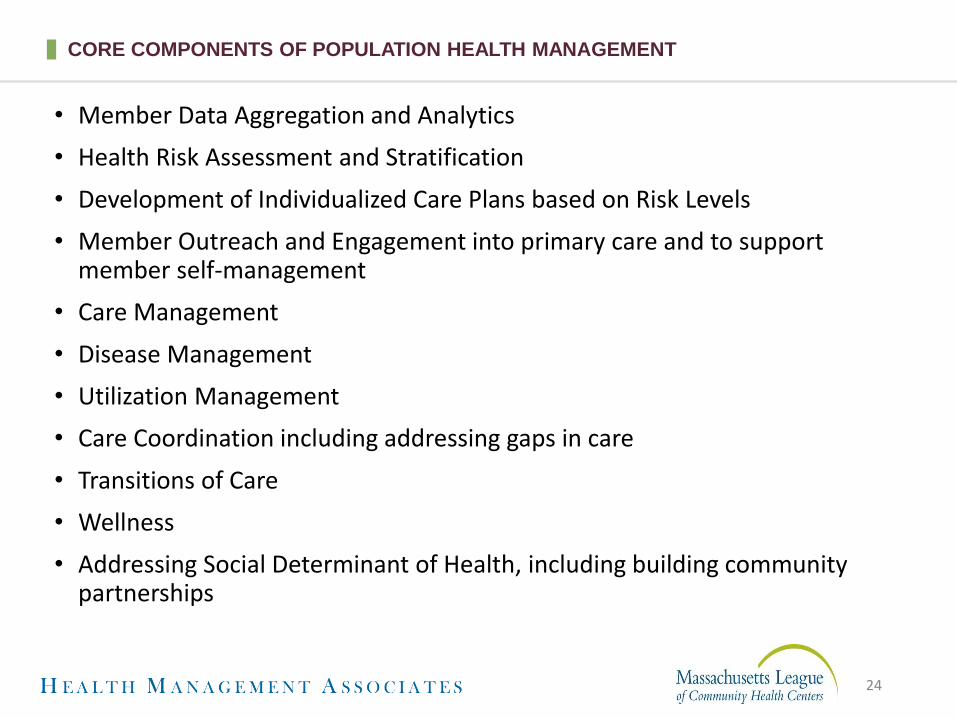
• Member Data Aggregation and Analytics
• Health Risk Assessment and Stratification
• Development of Individualized Care Plans based on Risk Levels
• Member Outreach and Engagement into primary care and to support member self-management
• Care Management
• Disease Management
• Utilization Management
• Care Coordination including addressing gaps in care
• Transitions of Care
• Wellness
• Addressing Social Determinant of Health, including building community partnerships
CORE COMPONENTS OF POPULATION HEALTH MANAGEMENT
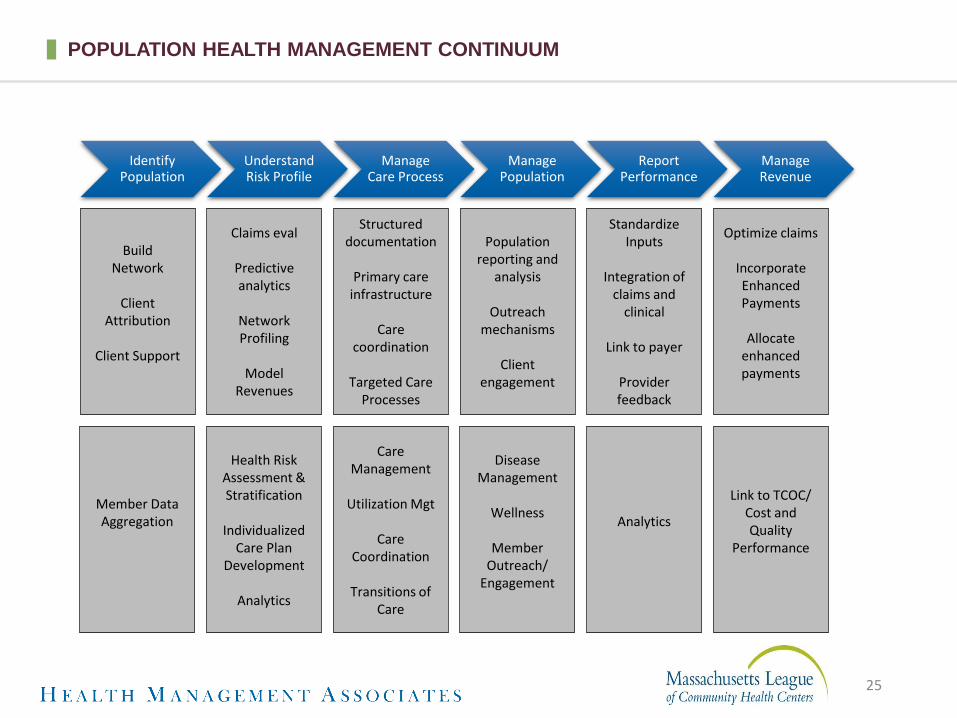
Identify Population
Understand Risk Profile
Manage Care Process
Manage Population
Report Performance
Manage Revenue
BuildNetwork
ClientAttribution
Client Support
Claims eval
Predictive analytics
Network Profiling
Model Revenues
StandardizeInputs
Integration of claims and
clinical
Link to payer
Provider feedback
Population reporting and
analysis
Outreach mechanisms
Client engagement
Structured documentation
Primary care infrastructure
Care coordination
Targeted Care Processes
Optimize claims
Incorporate Enhanced Payments
Allocate enhanced payments
Member Data Aggregation
Health Risk Assessment & Stratification
Individualized Care Plan
Development
Analytics
Care Management
Utilization Mgt
Care Coordination
Transitions of Care
Disease Management
Wellness
Member Outreach/
Engagement
Analytics
Link to TCOC/Cost and Quality
Performance
POPULATION HEALTH MANAGEMENT CONTINUUM
25

• Process of determining how accountability is assigned to providers for members/patients enrolled in a value-based care program
• Attribution can form the basis for quality measurement, performance reporting, and/or payment
• Goal is to improve the quality of care, patient experience and cost of healthcare through direct provider accountability
• Attribution implies responsibility for patient care regardless of whether that client has ever seen you
• Attribution becomes the linchpin for all population health management work; how patients/members are attributed guides engagement in different levels of PHM work
ATTRIBUTION
26

ATTRIBUTION ELEMENTS
✚ Patient Declaration or Choice This is the “gold standard”
✚ Claims AnalysisImportant to identify what elements will be factored into the analysis
✚ Provider Buy-In
27

28
CHALLENGE OF ATTRIBUTION
PROVIDER VIEW:
Is this my patient?
PLAN VIEW:
Touches both
STATE or ACCOUNT VIEW:
Is this individual eligible?Is this my employee?
• Providers typically define “patients” as individuals who have had a visit with them in the past 2 or 3 years
• A PHM attribution methodology requires engagement of individuals who are identified as “attributed” to a provider even without a visit
• A VBC Model encourages shared accountability for engaging all individuals in the appropriate level of care
• Plans can support provider organizations to engage individuals in connecting with the appropriate level of care

29
POPULATION HEALTH OR POPULATION HEALTH MANAGEMENT?
Population Health:
“The health outcomes of a group of individuals, including the distribution of such outcomes within the group.”
+ Addresses social determinants of health, population rates
+ Useful definition for policy discussions
Population Health Management:
“…a data-driven healthcare delivery model that provides individualized care plans to populations based on health risks and conditions. PHM uses data aggregation, risk stratification, and analytics to design and monitor the effectiveness of treatments and interventions tailored to individual health profiles. The PHM model requires functional integration to deliver coordinated care, clinical integration of providers, and advanced health informatics capabilities to risk stratify and manage the population for quality outcomes.”1
+ Addresses care needs in populations who are engaged in OR attributed to care organizations.
+ Recognizes the components of population health that a health plan and its providers can address alone or in partnership with CBOs upon referral.
+ “…encompasses both the population to be managed and the approach chosen to accomplish that goal.”2
1 (J. Andrieni, Chapter 9: Population Health Management, the Lynchpin of Emerging Healthcare Delivery Models. From “America’s Healthcare Transformation: Strategies and Innovations,” edited by R. Phillips. http://tinyurl.com/h8we2th)
2 (Richard Hodach and Karen Handmaker, Population Health Management Technologies for Accountable Care: Phytel Whitepaper 2013 http://app.compendium.com/uploads/user/863cc3c6-3316-459a-a747-3323bd3b6428/4c5909e8-1708-4751-873e-4129cb2ed878/File/c21a7b736ea6c223bbe82dca72691c33/1389040500553.pdf)

30
POPULATION HEALTH MANAGEMENT RISK STRATIFICATION PYRAMID
CLIENT POPULATION INTERVENTION
High Risk
Moderate Risk
Low Risk
No or Limited Risk
High Need, High Cost
Chronic Conditions
Well Populations
Elevated Need, Elevated Cost Care Management
Care Coordination
Complex Care Management
Wellness Initiatives
Attributed Members/Not Yet Clients Engagement and Outreach
In care management models, clients are stratified and cared for based on their needs, diagnoses, risk level/utilization
patterns, and eligibility for programs.
Engagement and outreach is continuous.
CBHOs, LTSS
Risk Management
Risk Mitigation
Expense Management
Revenue Management

31
POPULATION HEALTH MANAGEMENT FRAMEWORK
Primary Care/Health Home or Other Accountable
Entity
Engaged in Care
elsewhere but
accountable to ACO
Engaged in Care
Not engaged in
Care
PopulationPopulation Health Management Goal:
+ Ensure all clients engaged in appropriate level of care
+ This could be different for clients with SMI diagnosis as psychiatric provider may act as the PCP

Ancillary services (e.g. lab)
EBMguidelines /
care protocols
Telemedicine
QA for network providers
Patient billingfor services
rendered
Procurement
Disease screening
Capacity or access
management
Outpatientcare
ACO: financial/data management
Compliance management
Provider function Payer function
Plan billing for consumers
Utilization management
Line of business and underwriting
Disease management
Quality measures /
analytics
Care management
Physician credentialing& privileging
Member enrollment
HIE / connectivity
Physician performance/
quality directory
Wellness programs
Pre-auth for non-
formulary
Medical monitoring
Compliance enhancement
Provider process &
quality improvement
Government Relations
Medical management
Care enhancement
Network management
Admin. services
Member acquisition/
management
Quality/informatics
Plan sales and marketing
Member services
Alternative payment
structures
Provider management
servicesCare delivery Pharmacy
Claims processing/
payment
Risk-pooling
Care coordination
Scheduling services
Inpatient care
Data warehousing
Formulary management
Provider contracting /
network participation
Product development and pricing
VBP Payer/Provider Service Continuum: Assess ACO Participants Current State
32

33
POPULATION HEALTH MANAGEMENT: DIFFERENT PERSPECTIVES – PAYERS
AND PROVIDERS
Providers and payers have different perspectives of the activities that are included in utilization management, case management, and chronic condition management.
The highly regulated nature of the health insurance industry presently requires that payers maintain oversight of functions that they shift to providers.
The current process for function oversight is tightly managed and highly controlled which poses challenges to making it scalable across a large network.
There is a significant change management challenge in sharing accountability between payers and providers. Clear communication of the driving factors behind the strategy to shift accountability will need top-down executive reinforcement as well as bottom-up operational buy-in
Not all providers within your ACO have the same capacity, expertise, or desire to perform these functions.

34
POPULATION HEALTH MANAGEMENT FRAMEWORK
Member Engagement and
Care Needs Screening
RiskStratification
Comprehensive Assessment
Person-Centered Care Planning
Coordination of Care and Services
Reassessment
Population Health Management Model
Fundamental Approach• Member-Centered, Culturally Competent• Whole Person • Integrated and Team-based• Care Management at the point of service (CMs located in provider offices)• Data-driven: patterns in needs, results of interventions
Member
Attribution and Empanelment
35
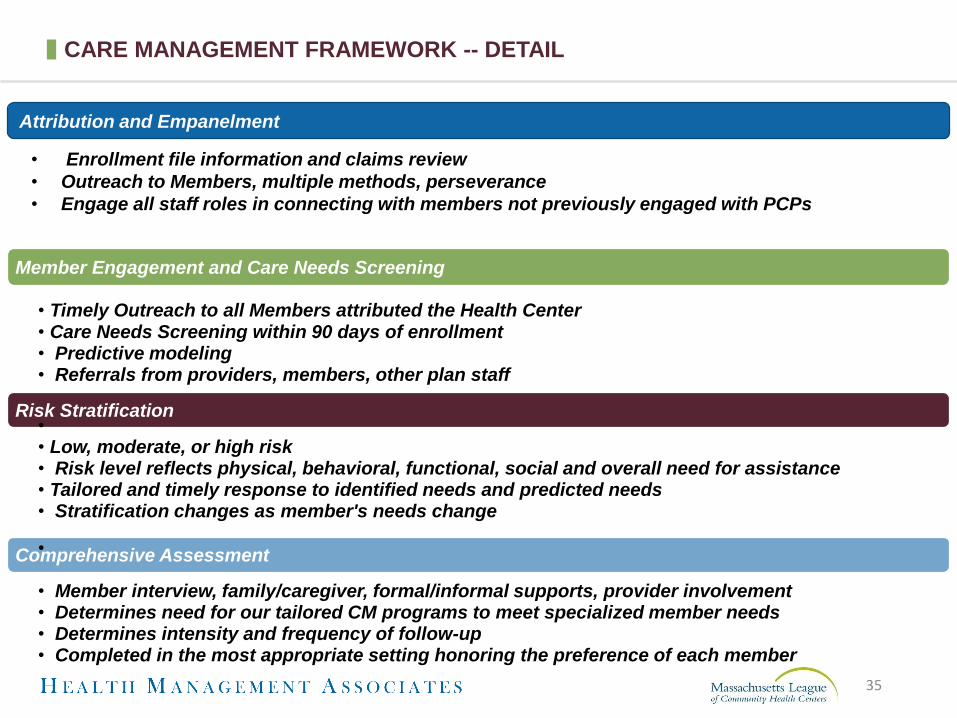
CARE MANAGEMENT FRAMEWORK -- DETAIL
Member Engagement and Care Needs Screening
• Timely Outreach to all Members attributed the Health Center • Care Needs Screening within 90 days of enrollment • Predictive modeling• Referrals from providers, members, other plan staff
Risk Stratification•• Low, moderate, or high risk• Risk level reflects physical, behavioral, functional, social and overall need for assistance• Tailored and timely response to identified needs and predicted needs• Stratification changes as member's needs change
Comprehensive Assessment•
• Member interview, family/caregiver, formal/informal supports, provider involvement• Determines need for our tailored CM programs to meet specialized member needs• Determines intensity and frequency of follow-up• Completed in the most appropriate setting honoring the preference of each member
Attribution and Empanelment
• Enrollment file information and claims review
• Outreach to Members, multiple methods, perseverance
• Engage all staff roles in connecting with members not previously engaged with PCPs

36
CARE MANAGEMENT FRAMEWORK – DETAIL (CONTINUED)
Person-Centered Care Planning
• Single point of contact (Care Coordinator or Clinical Care Manager) • Individualized and person-centered, member is decision-maker• Establishment of Care Team based on member preferences (minimum member, PCP, CM, BH or LTSS provider)• Documented Care Plan, available to Care Team, based on assessment and member goals and desires with action steps and ongoing communication plan• Identification and referral of providers, services and supports (including authorization for LTSS)• Engagement of PCP treating providers throughout
Coordination of Care and Services
• Ensure providers have authorizations and that services are delivered per the care plan• Facilitate ongoing communication among the member's Care Team • Coordinate with State and county agencies, public assistance programs, and other entities serving the member
Care Monitoring
• Measure progress against care plan goals• Monitor adherence to provider treatment plan and medications• Quickly identify and address new or changed needs
Reassessment
• Regular frequency based on risk level (no less than annually)• Whenever the member has a new or changed condition or event

37
FOR EACH COMPONENT WITHIN CARE MANAGEMENT, NEED TO DEFINE:
• Vision for the future shared of care management accountability
• Your priority populations and plan interventions for those populations
• Your current capabilities, the capabilities of your ACO partner, the capabilities of your MCO partner
• What you need to do to get to the future vision• How you are going to measure performance• The implications for staffing at your Health Center,
at the ACO, at the MCO
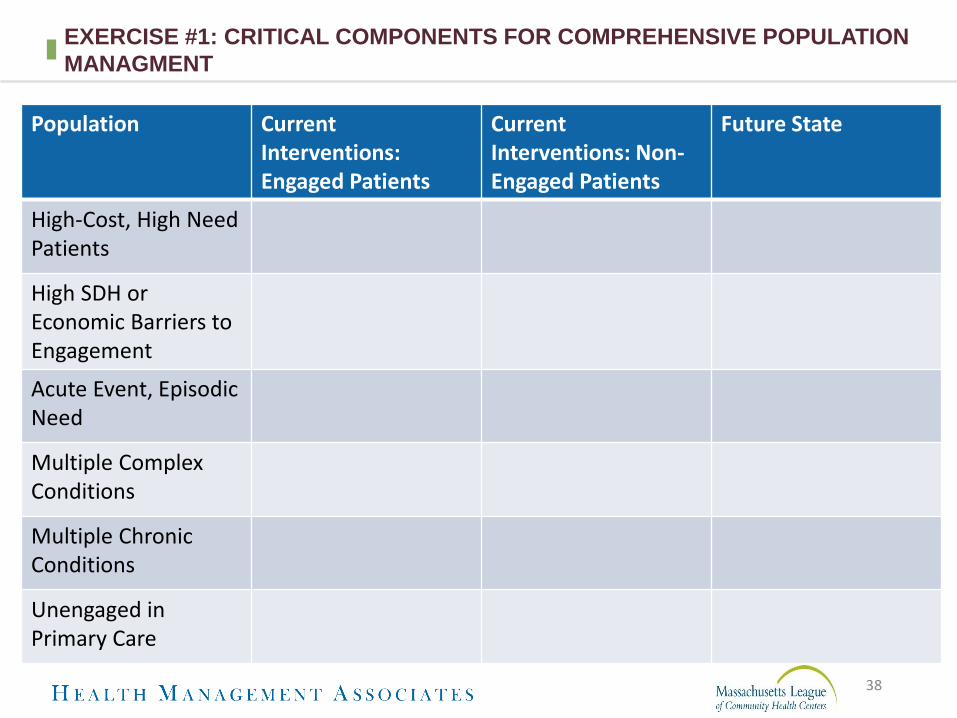
38
EXERCISE #1: CRITICAL COMPONENTS FOR COMPREHENSIVE POPULATION
MANAGMENT
Population CurrentInterventions: Engaged Patients
CurrentInterventions: Non-Engaged Patients
Future State
High-Cost, High Need Patients
High SDH or Economic Barriers to Engagement
Acute Event, EpisodicNeed
Multiple Complex Conditions
Multiple Chronic Conditions
Unengaged in Primary Care

39
EXERCISE #1: CRITICAL COMPONENTS FOR COMPREHENSIVE POPULATION
MANAGMENT , CONTINUED
Population CurrentInterventions: Engaged Patients
CurrentInterventions: Non-Engaged Patients
Future State
BH Condition
BH Condition Co-Morbid with Chronic Medical Condition
Substance Use Disorder
Chronic Pain
Unknown to the Health Center
n/a
Well Patients

CARE MANAGEMENT STRUCTURE AND
STAFFING

Medical Home Network |©2016-17 All Rights Reserved | Proprietary & Confidential
41
THE BUILDING BLOCKS FOR DELIVERY SYSTEM TRANSFORMATION &
POPULATION MANAGEMENT
42
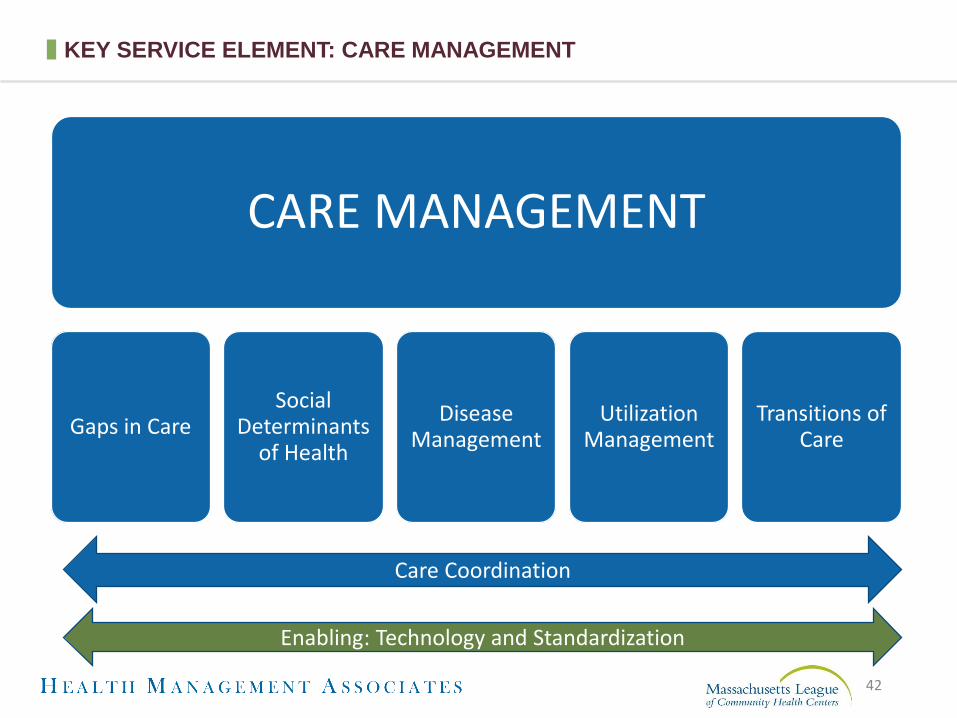
KEY SERVICE ELEMENT: CARE MANAGEMENT
CARE MANAGEMENT
Gaps in CareSocial
Determinants of Health
Disease Management
Utilization Management
Transitions of Care
Care Coordination
Enabling: Technology and Standardization

Consensus on a model of care
Assignment of care
management responsibilities
Reward structure commensurate to
contribution in generating payer-
incentivized outcomes
HOW ARE ACOs DEPLOYING CARE COORDINATORS?
43
Which of the following services do care coordinators in your ACO provide?
0
10
20
30
40
50
60
70
80
87% of ACOs say care coordinators are very important or
extremely important to the success of the ACO
n=174
Insight: Care coordinators are more likely to be used as connectors than for administrative tasks

44
CARE MANAGEMENT AND CARE COORDINATION – HOW ARE THEY DIFFERENT?
• Population level management and monitoring
• More “High Tech” than “High Touch”
• Supports Care Management
• Individually focused coordination and monitoring
• More “High Touch” than “High Tech”
• Supports Individual and Family
Care ManagementCare Coordination
45
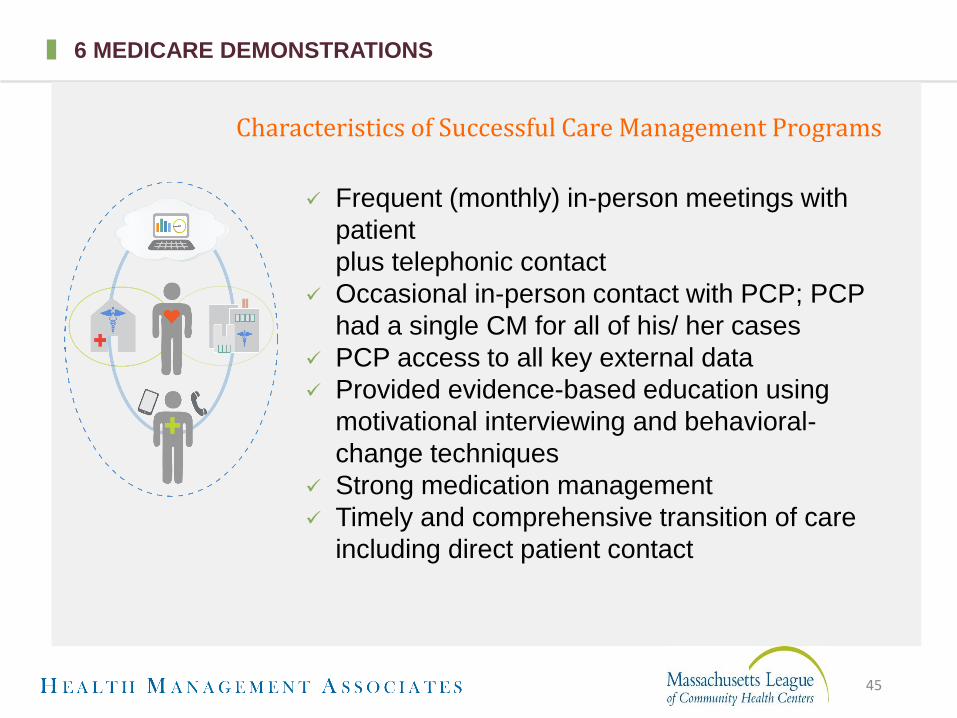
6 MEDICARE DEMONSTRATIONS
Frequent (monthly) in-person meetings with
patient
plus telephonic contact
Occasional in-person contact with PCP; PCP
had a single CM for all of his/ her cases
PCP access to all key external data
Provided evidence-based education using
motivational interviewing and behavioral-
change techniques
Strong medication management
Timely and comprehensive transition of care
including direct patient contact
Characteristics of Successful Care Management Programs
46
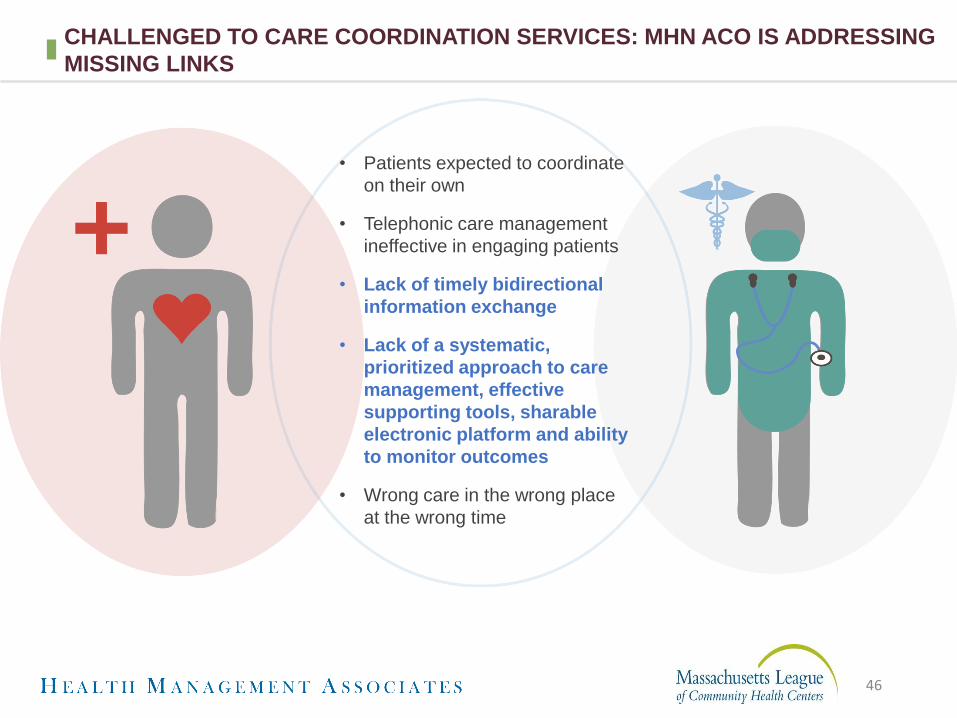
CHALLENGED TO CARE COORDINATION SERVICES: MHN ACO IS ADDRESSING
MISSING LINKS
• Patients expected to coordinate
on their own
• Telephonic care management
ineffective in engaging patients
• Lack of timely bidirectional
information exchange
• Lack of a systematic,
prioritized approach to care
management, effective
supporting tools, sharable
electronic platform and ability
to monitor outcomes
• Wrong care in the wrong place
at the wrong time

47
PROCESS AND TECHNOLOGY REQUIRED TO IMPROVE CARE MANAGEMENT
Care managers employed as part of
the care team
Complex interdisciplinary care team consultations
Structure and staff to achieve a positive ROI
Supplemental, electronic patient communication
Risk stratification that expands beyond
claims data
© Copyright 2017 MHNU Corporation, All Rights Reserved, Used with Permission
48
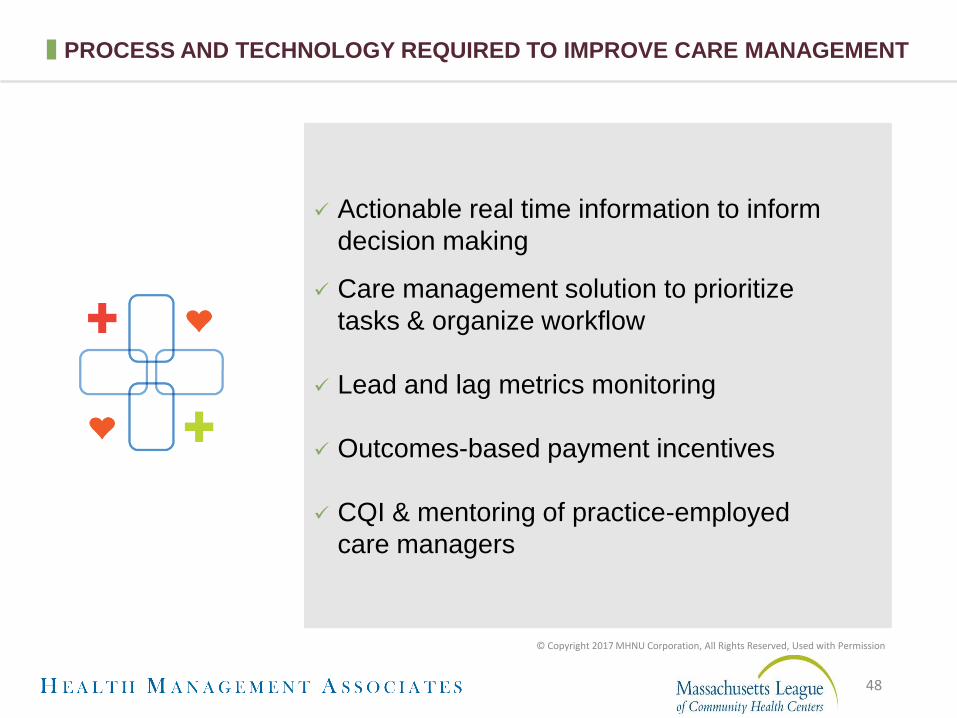
PROCESS AND TECHNOLOGY REQUIRED TO IMPROVE CARE MANAGEMENT
Actionable real time information to inform
decision making
Care management solution to prioritize
tasks & organize workflow
Lead and lag metrics monitoring
Outcomes-based payment incentives
CQI & mentoring of practice-employed
care managers
© Copyright 2017 MHNU Corporation, All Rights Reserved, Used with Permission

49
+ Payers depend on effective care management to handle financial risk; don’t expect delegation without assuming some of the latter
+ Delegate care management responsibilities based on strengths and competencies
+ Must be able to exchange data and share care plans
+ Meet NCQA and any state specific care management delegation requirements
+ Agree to clear deliverables, metrics, targets and methods for monitoring performance
+ Negotiate a value-based payment that recognizes upfront investment but is ultimately supported by savings from improved management of the full continuum of care
IMPLICATIONS FOR WORKING WITHIN AN PAYER/ACO CONTEXT

50
+ Imbedding the care manager as part of the care team
+ Create a common, structured approach to care management with tools, processes, staffing and sharing of care plans
+ Create a model with a positive return on investment
+ Improve on current risk stratification methodology by adding addressable barriers to treatment plan adherence to the usual claims-based diagnosis, utilization and cost factors
+ Inform care management staff with real time information placed in historical context
+ Follow task completion, lead and lag metrics aimed at improved utilization and cost across the full continuum of care
IMPLEMENTATION CHALLENGES TO PROVIDER LEVEL CARE MANAGEMENT

51
+ Chief Executive Officer- Connects care management to the mission and conveys vision to all Directors
+ Medical Director and Provider Champion- Engage peers into process by keeping them informed about practice changes, addressing concerns and provide behavior change support. (During provider meetings, rounding and emails)
+ Care Manager Lead- Directs care management and care coordination teams that execute the process
+ Chief Information Officer- Creates connectivity with disparity provider entities and actionable data to inform decision-making
+ CFO- creates a budget with a return-on-investment mentality and monitors performance from that perspective
CARE MANAGEMENT: A TEAM APPROACH

52
+ Someone that has natural leadership skills, respect from their peer physicians
+ They may be in a formal leadership role or not – but they are seen as having a respected opinion by their colleagues and peers (formal or informal leader)
+ Understand the integration and team approach to all care –respecting various roles and that while typically clinicians are leading the team, the other roles are vitally important and need to be respected. They can lead other clinicians to that approach and ability to “let go” of some of the work that they think they are the only ones that can do.
+ Committed to the work and most ideal would be that they are given some time to truly lead the work and be the “champion” –attending meetings, helping to aid in implementation , education to clinicians and other team members
PROVIDER CHAMPION

53
PCP “BUY-IN”
• This is going to slow me down
• I don’t have time to address one more problem
• This is going to be an anchor
• I already do a good job of treating mental illness
• This takes a load off my plate
• This speeds me up
• I always want to practice like this
• I am giving better care to my patients
• This gives me time to finish my note
Before Implementation After Implementation

54
CARE MANAGEMENT: AN INTEGTRATED TEAM APPROACH
Care Manager Role
• Comprehensive risk assessment
• Goal setting
• Medication reconciliation
• Disease management education
• Transitions of care
• Behavioral health referral
• Specialist referral coordination
• Care team communication and supervision
Care Coordinator Role
• Screening health risk assessment
• Low-intensity social needs referrals
• Assist with coordination needs (appointments, housing, food resources, and transportation)
• Closing gaps in care
• Disease management education as delegated
• Coach patient how to effectively communicate with PCP and care team

Reassessment
Identify & Stratify
Engage & Connect
Moderate & High Risk
Plan & Support
Follow Up & Reassess Risk
Transition to
Low-Risk Reevaluation
in Response to Triggers
Health Risk
Assessment
(HRA)
Care Plan
Comprehensive
Risk Assessment
(CRA)
Medication
Reconciliation
© Copyright 2017 MHNU Corporation, All Rights Reserved, Used with Permission
55
MHN ACO – TECHNOLOGY-ENABLED RISK STRATIFICATION DRIVES
PRIORITIZED, STRUCTURED WORKFLOWS
Medical Home Network | © 2009 – 2016 All Rights Reserved | Proprietary & Confidential
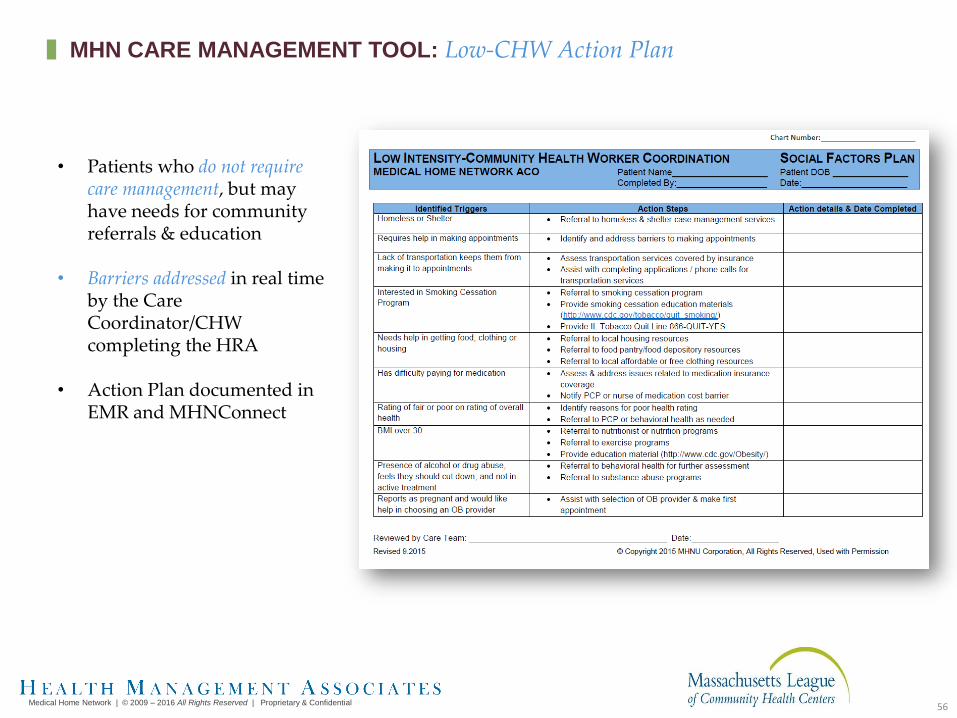
• Patients who do not require care management, but may have needs for community referrals & education
• Barriers addressed in real time by the Care Coordinator/CHW completing the HRA
• Action Plan documented in EMR and MHNConnect
56
MHN CARE MANAGEMENT TOOL: Low-CHW Action Plan

Complex Care
Management
Care Coordination
57
MHNU Corporation l © Copyright 2016-2017 All Rights Reserved l Used with Permission
MEDICAL HOME NETWORK APPROACH: CARE MANAGEMENT

Complex Care
Payor
Practice-level Care Management
• Builds on established patient relationships
• Requires structure and oversight
• Drives shared incentives and alignment
Centralized Care Management
• Challenged engaging patients
• Challenged engaging PCPs
• Limited access to EMR data
$
External Network
Medical Homes Medical HomesRush
Care Management Funding Care Management Funding
Care Management &
Coordination
$$
Medical Home Network |©2016-17 All Rights Reserved | Proprietary & Confidential
58
PRACTICE- LEVEL VS. CENTRALIZED CARE MANAGEMENT

Medical Home Network |©2016-17 All Rights Reserved | Proprietary & Confidential
59
CONNECTIVITY, COMMUNICATION & COLLABORATION ACROSS THE CONTINUUM

Texture Health | All Rights Reserved | Proprietary & Confidential
© 2017 Texture Health
Health Risk Assessment
Comprehensive Risk Assessment
Patient Care Plan
High-level responses drive
more detailed assessments
(e.g., PHQ-2 to PHQ-9)
Goals
created
based on
assessment
results
Integrates care plan
tasks across patient care
team (e.g., BH and PCP)
Technology Connects Risk Assessment to Care Planning
© 2017 Texture Health All Rights Reserved
60
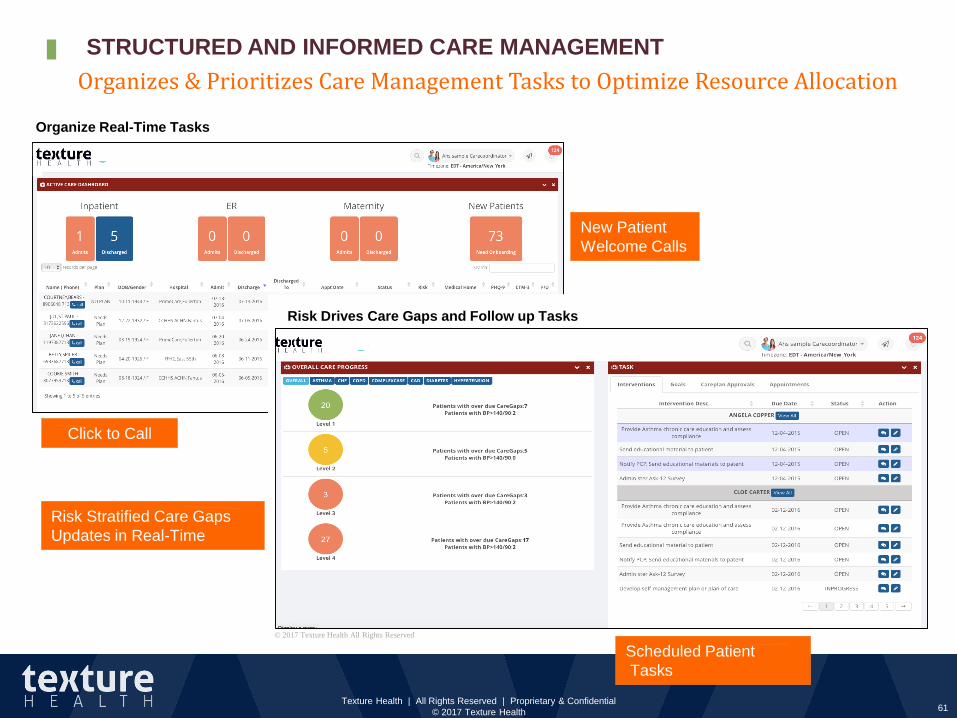
CARE COORDINATOR WORK SPACE
Texture Health | All Rights Reserved | Proprietary & Confidential
© 2017 Texture Health
Organize Real-Time Tasks
Risk Drives Care Gaps and Follow up Tasks
Risk Stratified Care Gaps
Updates in Real-Time
Scheduled Patient
Tasks
New Patient
Welcome Calls
Click to Call
© 2017 Texture Health All Rights Reserved
Organizes & Prioritizes Care Management Tasks to Optimize Resource Allocation
61
STRUCTURED AND INFORMED CARE MANAGEMENT
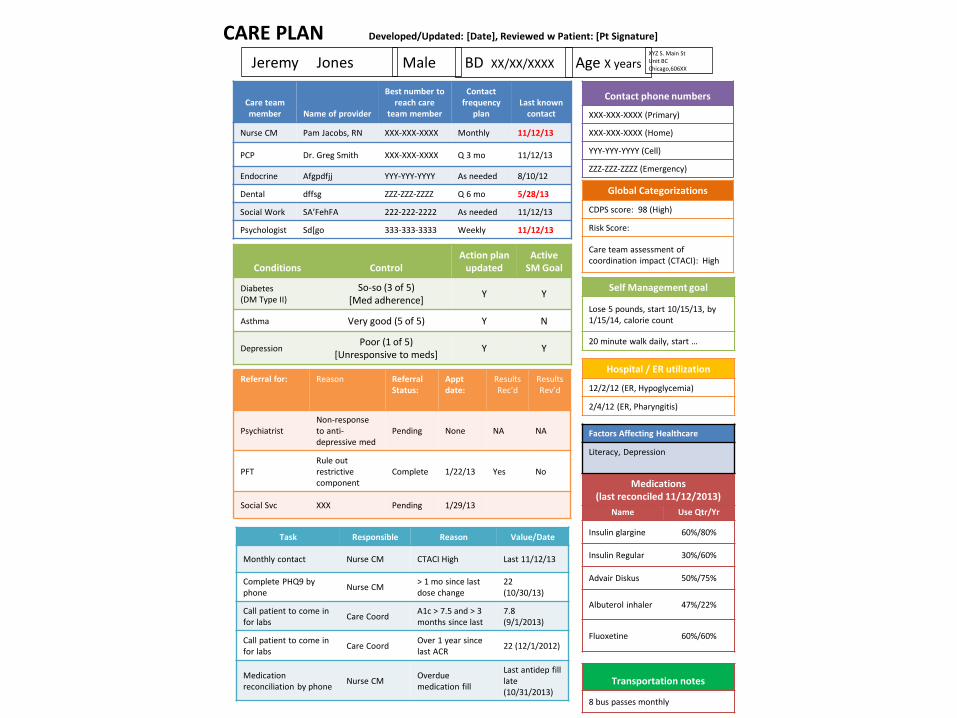
CARE PLAN Developed/Updated: [Date], Reviewed w Patient: [Pt Signature]
Jeremy Jones BD XX/XX/XXXX Age X yearsMale XYZ S. Main StUnit BC Chicago,606XX
Contact phone numbers
XXX-XXX-XXXX (Primary)
XXX-XXX-XXXX (Home)
YYY-YYY-YYYY (Cell)
ZZZ-ZZZ-ZZZZ (Emergency)
Care team member Name of provider
Best number to reach care
team member
Contact frequency
planLast known
contact
Nurse CM Pam Jacobs, RN XXX-XXX-XXXX Monthly 11/12/13
PCP Dr. Greg Smith XXX-XXX-XXXX Q 3 mo 11/12/13
Endocrine Afgpdfjj YYY-YYY-YYYY As needed 8/10/12
Dental dffsg ZZZ-ZZZ-ZZZZ Q 6 mo 5/28/13
Social Work SA’FehFA 222-222-2222 As needed 11/12/13
Psychologist Sd[go 333-333-3333 Weekly 11/12/13
Conditions ControlAction plan
updatedActive
SM Goal
Diabetes(DM Type II)
So-so (3 of 5)[Med adherence]
Y Y
Asthma Very good (5 of 5) Y N
DepressionPoor (1 of 5)
[Unresponsive to meds]Y Y
Medications (last reconciled 11/12/2013)
Name Use Qtr/Yr
Insulin glargine 60%/80%
Insulin Regular 30%/60%
Advair Diskus 50%/75%
Albuterol inhaler 47%/22%
Fluoxetine 60%/60%
Global Categorizations
CDPS score: 98 (High)
Risk Score:
Care team assessment of coordination impact (CTACI): High
Referral for: Reason Referral Status:
Apptdate:
Results Rec’d
ResultsRev’d
PsychiatristNon-responseto anti-depressive med
Pending None NA NA
PFTRule out restrictive component
Complete 1/22/13 Yes No
Social Svc XXX Pending 1/29/13
Task Responsible Reason Value/Date
Monthly contact Nurse CM CTACI High Last 11/12/13
Complete PHQ9 by phone
Nurse CM> 1 mo since last dose change
22(10/30/13)
Call patient to come in for labs
Care CoordA1c > 7.5 and > 3 months since last
7.8(9/1/2013)
Call patient to come in for labs
Care CoordOver 1 year since last ACR
22 (12/1/2012)
Medicationreconciliation by phone
Nurse CMOverduemedication fill
Last antidep fill late(10/31/2013)
Transportation notes
8 bus passes monthly
Hospital / ER utilization
12/2/12 (ER, Hypoglycemia)
2/4/12 (ER, Pharyngitis)
Self Management goal
Lose 5 pounds, start 10/15/13, by 1/15/14, calorie count
20 minute walk daily, start …
Factors Affecting Healthcare
Literacy, Depression

Texture Health | All Rights Reserved | Proprietary & Confidential
© 2017 Texture Health
• Patient-Caregiver 1-on-1 communications
• Care Team communications can include family, others
• Outreach Campaigns templates, lists, track results
• Educate Patients deliver text, images, video
• Assess Patients to identify risk, track outcomes
• Biometric data capture and report measures
• Multiple modes web, mobile, text, IVR, and live video
• Integrated with provider and patient workflows
© 2017 Texture Health All Rights Reserved
63
ENHANCING CARE MANAGEMENT WITH INTEGRATED MULTI-MODALITY PATIENT COMMUNICATION

8/3/2017 64
Targeted reporting to improve Care Manager resource allocation and efficiency
Self-Query
Reports
Care Manager
Reports
Population
Reports
Texture Health |©2016-17 All Rights Reserved | Proprietary & Confidential
CARE MANAGEMENT REPORTING

Dashboard provided courtesy of Medical Home Network – not for duplication
SAMPLE CARE MANAGEMENT DASHBOARD
65

EXERCISE 2CREATING A CARE TEAM
WITH A POSITIVE ROI

RISK STRATIFICATION INCLUSIVE OF SOCIAL
DETERMINANTS OF HEALTH
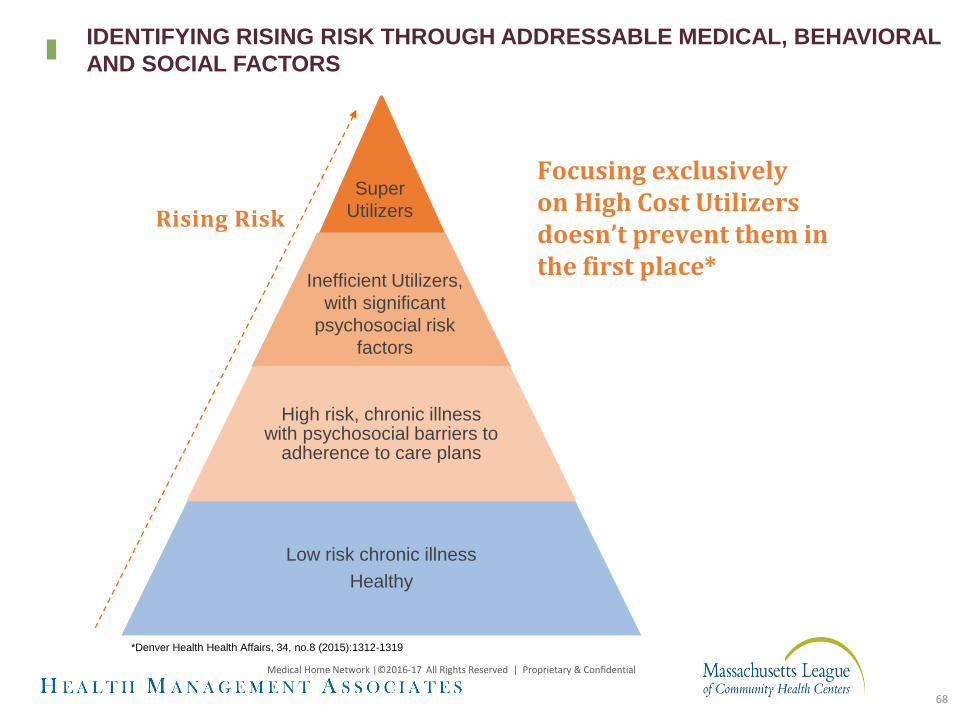
High risk, chronic illnesswith psychosocial barriers to
adherence to care plans
Low risk chronic illness
Healthy
Super
Utilizers
Inefficient Utilizers,
with significant
psychosocial risk
factors
Focusing exclusivelyon High Cost Utilizers doesn’t prevent them in the first place*
*Denver Health Health Affairs, 34, no.8 (2015):1312-1319
Rising Risk
Medical Home Network |©2016-17 All Rights Reserved | Proprietary & Confidential
68
IDENTIFYING RISING RISK THROUGH ADDRESSABLE MEDICAL, BEHAVIORAL
AND SOCIAL FACTORS

MHN judges effective care management by its ability to lower patient risk
Medical
Complexity
Behavioral Health
Complexity
Level of Risk
Social
Complexity
High Risk High Risk High Risk
Low Risk Low Risk Low Risk
Criteria
• Frequent ED Use
• Avoidable
Hospitalization
• Chronic PQI
(potentially avoidable
hospitalization)
• Gaps in Care
Criteria
• Hospitalization or
ED Use for SMI or
SA
• High PHQ9
• Untreated SA
Criteria
• Barriers to
therapeutic
compliance
69
MHNU Corporation l © Copyright 2016-2017 All Rights Reserved l Used with Permission
MEDICAL HOME NETWORK DRIVING EFFECTIVE POPULATION HEALTH
Medical Home Network | © 2009 – 2016 All Rights Reserved | Used With Permission
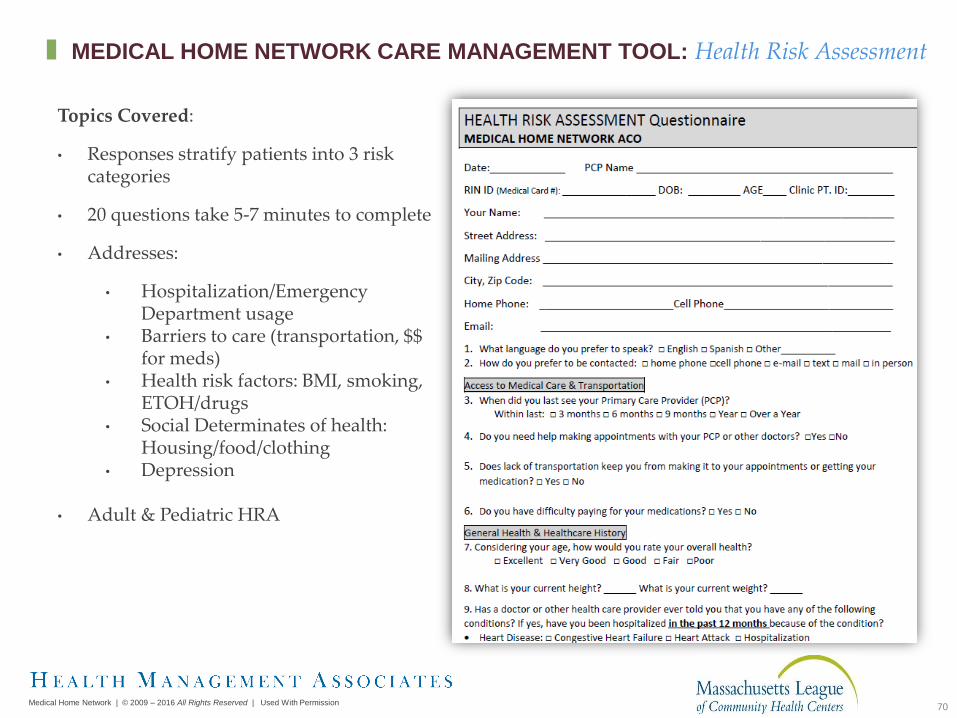
Topics Covered:
• Responses stratify patients into 3 risk categories
• 20 questions take 5-7 minutes to complete
• Addresses:
• Hospitalization/Emergency Department usage
• Barriers to care (transportation, $$ for meds)
• Health risk factors: BMI, smoking, ETOH/drugs
• Social Determinates of health: Housing/food/clothing
• Depression
• Adult & Pediatric HRA
70
MEDICAL HOME NETWORK CARE MANAGEMENT TOOL: Health Risk Assessment

71
+ Engage the whole care team; train registration, operators, MAs, nurses on appropriate workflow to complete HRA on all ACO patients;
+ Use enrollment staff by completing HRAs on all patients when they apply for Medicaid;
+ Update financial class for all ACO patients in EHR/PM system on a monthly basis and flag patients that are due for HRA;
+ Check all available systems to find correct phone number (practice EMR, hospital EMR/portal, health plan portal). Missing and incorrect telephone numbers are an issue and need to be validated each and every time there is an encounter with the patient;
MEMBER OUTREACH AND ENGAGEMENT: LESSONS LEARNED

72
+ Develop and follow a HRA Script• When you reach the patient, identify yourself as being an assistant
to Dr. (PCP) or as working for the health center
• Engage in a conversation at first and then bring up completion of the HRA, its purpose and the confidentiality of the information
• Prepare them that it will only take 5 minutes to complete;
+ Adjust staff schedules to do HRA calls during evenings and on Saturdays; run HRA reports to identify the best times and days for successful HRA completion for your sites;
+ Use real time ADT feeds to contact members while they are in the ER/Inpatient to do HRA over the phone
MEMBER OUTREACH AND ENGAGEMENT: LESSONS LEARNED

73
+ Track staff HRA completion performance and set weekly goals; reward highest performer; overtime can be awarded to the most productive individuals; provide feedback; celebrate successes;
+ Create friendly competitions within the ACO;
+ Have HRA drives;
+ Persistence is key; multiple attempts (at least three on different dates and times) even for disconnected numbers; minutes may have run out on patient phones and they may be renewed for the month;
+ Mailing out HRAs and home visits had very low ROI.
MEMBER OUTREACH AND ENGAGEMENT: LESSONS LEARNED

74

PROSPECTIVE ANALYSIS FINDINGS
1. MHN ACO’s risk stratification algorithm accurately correlates with subsequent cost of care
2. Presence of impactable risk factors even in the absence of historical high inpatient or emergency room
utilization predicts increased hospital utilization and total cost of care
Source: MHNConnect & CountyCare Claims Data
MHN ACO Medicaid Expansion Population Experience
HRA Risk Profile Count
%
Members
with
No
Claims
ER Visits
/1000
Inpatient
Admits
/1000
Medical
& Rx
Cost
Relative
Cost
Low by Utilization without any Impactable
Risk Factors--- --- --- ---
Low by Impactable Risk Factors ↑ ↑ ↑ ↑
Medium by Impactable Risk Factors ↑ ↑↑ ↑↑ ↑↑
High by Utilization +/- Impactable Risk
Factors↑↑↑↑ ↑↑↑↑ ↑↑↑↑ ↑↑↑↑
High by Impactable Risk Factors ↑↑↑↑ ↑↑ ↑↑↑ ↑↑↑
Total 5,798
Medical Home Network |©2016-17 All Rights Reserved | Proprietary & Confidential
75
ENHANCED RISK STRATIFICATION: KEY TO CARE MANAGEMENT EFFICIENCY &
IMPROVED OUTCOMES
EXERCISE 3RISK STRATIFICATION
ALGORITHMS

TANF Adult Population
• Combines number of social factors reported from HRA and CDPS scores for a hybrid risk stratification method.
• CDPS score breakouts too granular to use, but confirms 3.5+ threshold for high risk.
Claims incurred January – June 2016
Social Factors
>=4
Social
Factors<4 No HRA Total
CDPS >=3.5 % Population 0.14% 1.29% 0.24% 1.67%
Average PMPM 1,062$ 1,855$ 1,241$ 1,700$
3.0<=CDPS<3.5 % Population 0.13% 0.60% 0.08% 0.81%
Average PMPM 641$ 438$ 822$ 509$
2.5<=CDPS<3.0 % Population 0.12% 0.93% 0.20% 1.25%
Average PMPM 593$ 528$ 704$ 563$
2.0<=CDPS<2.5 % Population 0.15% 1.71% 0.28% 2.13%
Average PMPM 664$ 643$ 434$ 617$
CDPS<2.0 % Population 3.15% 70.32% 20.67% 94.14%
Average PMPM 227$ 187$ 92$ 168$
Total % Population 3.68% 74.85% 21.47% 100.00%
Average PMPM 301$ 232$ 118$ 210$
Total population= 15,847
© Copyright 2017 MHNU Corporation, All Rights Reserved, Used with Permission
RISK STRATIFICATION INCLUDING SOCIAL DETERMINANTS OF
HEALTH: WHERE TO PUT CARE MANAGEMENT RESOURCES?
Self-Reported IP
Only/ IP+ER Self-Reported ER
No Self-Reported
Utilization No HRA Total
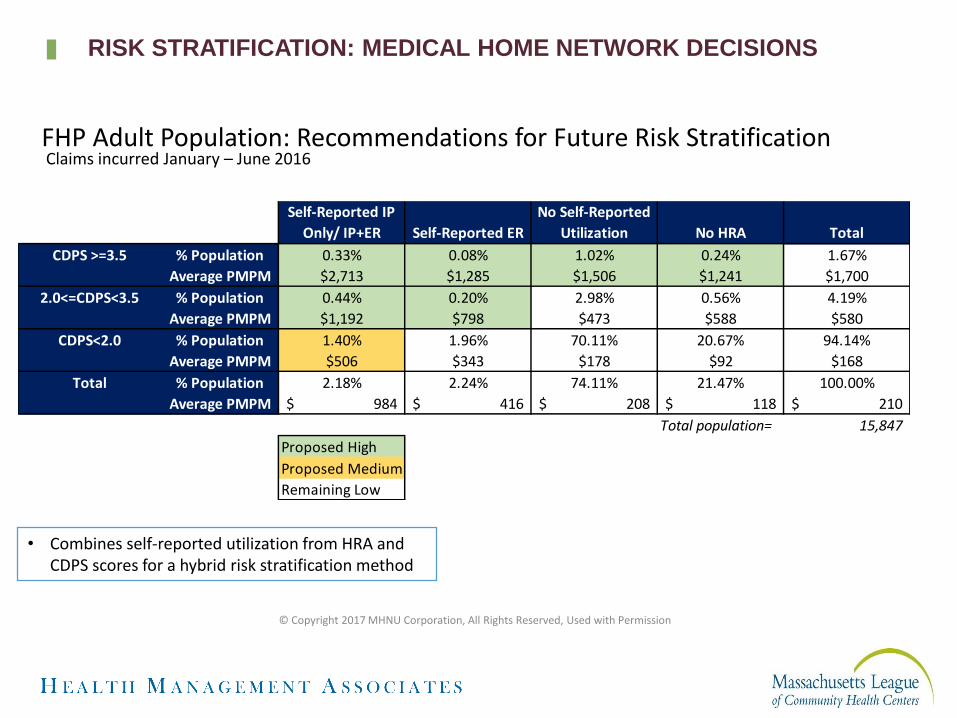
CDPS >=3.5 % Population 0.33% 0.08% 1.02% 0.24% 1.67%
Average PMPM $2,713 $1,285 $1,506 $1,241 $1,700
2.0<=CDPS<3.5 % Population 0.44% 0.20% 2.98% 0.56% 4.19%
Average PMPM $1,192 $798 $473 $588 $580
CDPS<2.0 % Population 1.40% 1.96% 70.11% 20.67% 94.14%
Average PMPM $506 $343 $178 $92 $168
Total % Population 2.18% 2.24% 74.11% 21.47% 100.00%
Average PMPM 984$ 416$ 208$ 118$ 210$
Total population= 15,847
Proposed High
Proposed Medium
Remaining Low
FHP Adult Population: Recommendations for Future Risk Stratification
• Combines self-reported utilization from HRA and CDPS scores for a hybrid risk stratification method
Claims incurred January – June 2016
© Copyright 2017 MHNU Corporation, All Rights Reserved, Used with Permission
RISK STRATIFICATION: MEDICAL HOME NETWORK DECISIONS

PROCESS FOR IMPROVING QUALITY
PERFORMANCE

80
QUALITY STRATEGY SUBCOMMITTEE – RAPID IMPROVEMENT EVENT
Hosted on May 18th, 2017 12:00pm – 4:30pm
• Goals • Analyze current HEDIS performance
• Review all eight HEDIS P4P measures and identify best practices/recommendations
• Identify next steps as an ACO and at an organization level to improve HEDIS performance
• Priority• Member-PCP bonding
• P4P dollars
• Default assignment of members
Why a RIE?

81
EXAMPLE: RAPID IMPROVEMENT EVENT
HEDIS Year 2017 (Calendar Year 2016)Medical Home Numerator Denominator Rate Goal # Patients to Goal Practice #1 195 219 89.0% 87% 0Practice #2 224 266 84.2% 87% 7Practice #3 139 159 87.4% 87% 0Practice #4 454 530 85.7% 87% 7Practice #5 457 533 85.7% 87% 7Practice #6 413 504 81.9% 87% 25Practice #7 531 601 88.4% 87% 0Practice #8 414 452 91.6% 87% 0Practice #9 287 320 89.7% 87% 0Practice #10 340 398 85.4% 87% 6Practice #11 65 88 73.9% 87% 12Grand Total 3519 4070 86.5% 87% 22
HEDIS Year 2018 (Calendar Year 2017)Medical Home Numerator Denominator Rate Goal # Patients to Goal Practice #1 20 218 9.2% 90% 176Practice #2 71 249 28.5% 90% 153Practice #3 47 153 30.7% 90% 91Practice #4 141 503 28.0% 90% 312Practice #5 160 527 30.4% 90% 314Practice #6 179 468 38.2% 90% 242Practice 0 3 0.0% 90% 3Practice #7 135 580 23.3% 90% 387Practice #8 140 428 32.7% 90% 245Practice #9 169 304 55.6% 90% 105Practice #10 120 401 29.9% 90% 241Practice #11 18 87 20.7% 90% 60Grand Total 1200 3921 30.6% 90% 2329
CDC- A1c
82
EXAMPLE: RAPID IMPROVEMENT EVENT
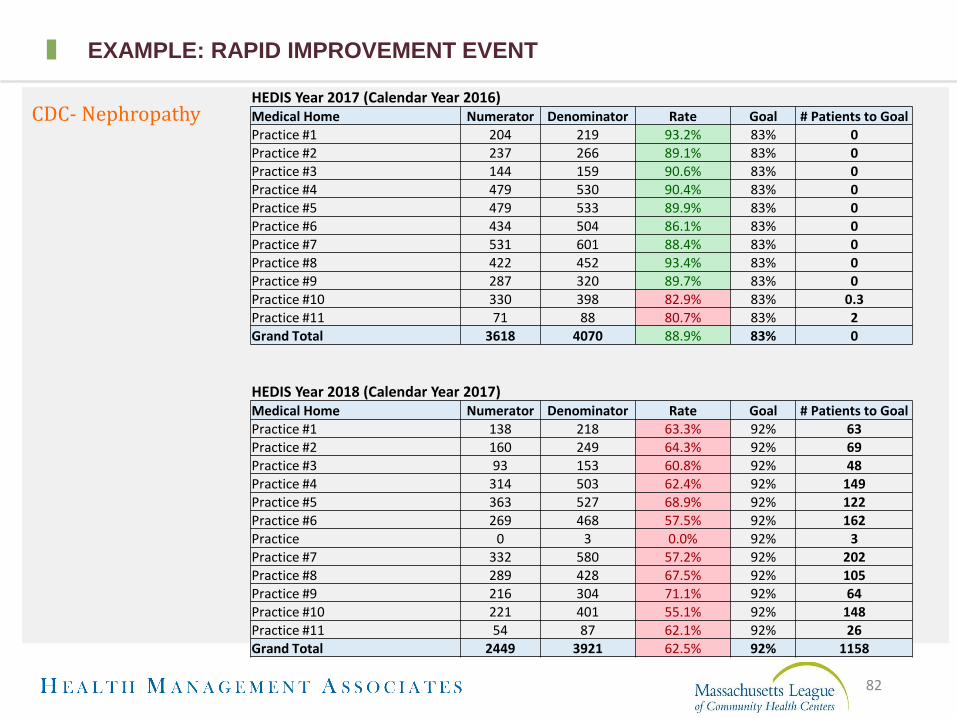
HEDIS Year 2017 (Calendar Year 2016)Medical Home Numerator Denominator Rate Goal # Patients to Goal Practice #1 204 219 93.2% 83% 0Practice #2 237 266 89.1% 83% 0Practice #3 144 159 90.6% 83% 0Practice #4 479 530 90.4% 83% 0Practice #5 479 533 89.9% 83% 0Practice #6 434 504 86.1% 83% 0Practice #7 531 601 88.4% 83% 0Practice #8 422 452 93.4% 83% 0Practice #9 287 320 89.7% 83% 0Practice #10 330 398 82.9% 83% 0.3Practice #11 71 88 80.7% 83% 2Grand Total 3618 4070 88.9% 83% 0
HEDIS Year 2018 (Calendar Year 2017)Medical Home Numerator Denominator Rate Goal # Patients to Goal Practice #1 138 218 63.3% 92% 63Practice #2 160 249 64.3% 92% 69Practice #3 93 153 60.8% 92% 48Practice #4 314 503 62.4% 92% 149Practice #5 363 527 68.9% 92% 122Practice #6 269 468 57.5% 92% 162Practice 0 3 0.0% 92% 3Practice #7 332 580 57.2% 92% 202Practice #8 289 428 67.5% 92% 105Practice #9 216 304 71.1% 92% 64Practice #10 221 401 55.1% 92% 148Practice #11 54 87 62.1% 92% 26Grand Total 2449 3921 62.5% 92% 1158
CDC- Nephropathy
83
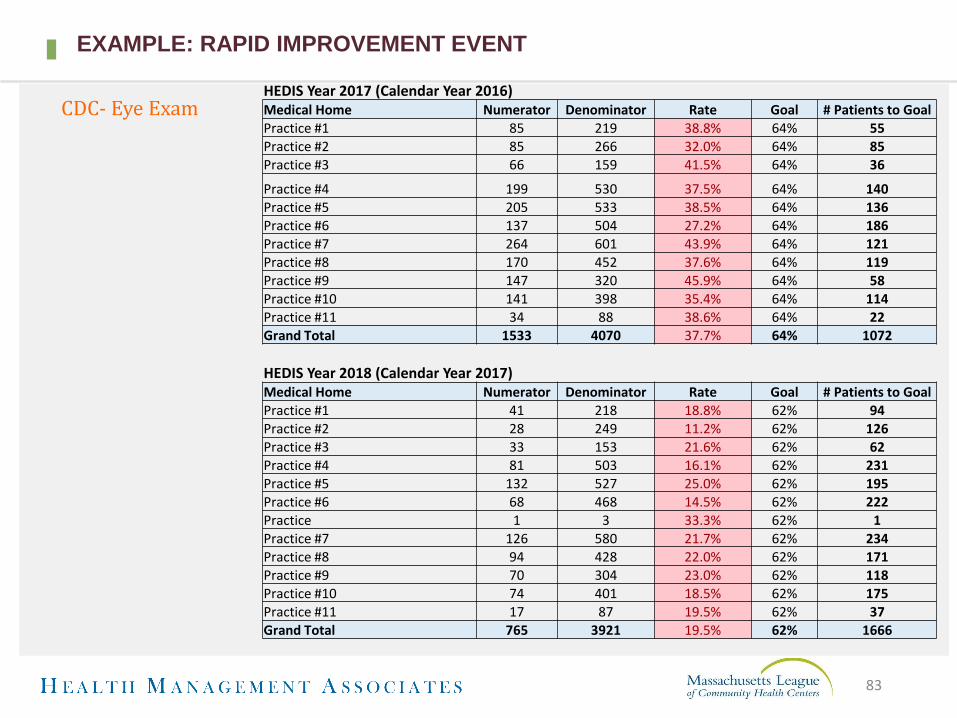
EXAMPLE: RAPID IMPROVEMENT EVENT
HEDIS Year 2017 (Calendar Year 2016)Medical Home Numerator Denominator Rate Goal # Patients to Goal Practice #1 85 219 38.8% 64% 55Practice #2 85 266 32.0% 64% 85Practice #3 66 159 41.5% 64% 36
Practice #4 199 530 37.5% 64% 140Practice #5 205 533 38.5% 64% 136Practice #6 137 504 27.2% 64% 186Practice #7 264 601 43.9% 64% 121Practice #8 170 452 37.6% 64% 119Practice #9 147 320 45.9% 64% 58Practice #10 141 398 35.4% 64% 114Practice #11 34 88 38.6% 64% 22Grand Total 1533 4070 37.7% 64% 1072
HEDIS Year 2018 (Calendar Year 2017)Medical Home Numerator Denominator Rate Goal # Patients to Goal Practice #1 41 218 18.8% 62% 94Practice #2 28 249 11.2% 62% 126Practice #3 33 153 21.6% 62% 62Practice #4 81 503 16.1% 62% 231Practice #5 132 527 25.0% 62% 195Practice #6 68 468 14.5% 62% 222Practice 1 3 33.3% 62% 1Practice #7 126 580 21.7% 62% 234Practice #8 94 428 22.0% 62% 171Practice #9 70 304 23.0% 62% 118Practice #10 74 401 18.5% 62% 175Practice #11 17 87 19.5% 62% 37Grand Total 765 3921 19.5% 62% 1666
CDC- Eye Exam

HEDIS Measure Issues Root Causes Solutions CountyCare Questions/Issues
CDC – Eye
Exam
Provider sends referral but does
not follow up
Lengthy referral process (auth
issues, missed appt, no consult
note, unable to reach patient)
Authorization issues – website
says authorized but ophth still
wants proof
Provider did not refer for eye
exam
Provider identification of gaps
not easy
New patients with no diagnosis
of CM present in chart
Patients do not associate eyes
with diabetes (don’t understand
necessity of eye exam)
Lack of resources to manage
patients timely
No retinal camera – have to
refer out
Authorizations delay
process
Complex patients, too many
specialty referrals to go to
Unsure how to bill for
service
Lack of education
Do not get report back from
specialist
Don’t know exam was done
Access difficulty to
specialists
Release of information
required to get info from
specialist
Camera breaks
Do eye exam in
house/telemedicine (5 votes)
Cameras in clinic (12 votes)
Follow-up process to obtain
referrals (care managers/care
coordinators) (1 vote)
Close referral loop
Change standard to every 2 years
Care coordination navigators to
obtain results (8 votes)
Automate referral back once
result is completed “hospital
connect” (2 votes)
Information exchange agreement
(2 votes)
Diabetes health care event
(multiple services/one stop shop)
(3 votes)
Incentive program (1 vote)
Education that release not needed
Patients included in
measure who don’t have
diabetes
CDC-
Nephropath
y
Tested, billed but not reflected
as met
Patient does not have diabetes
Did not come back for lab testing
Provider sent referral but patient
has not followed up
Failure of patients showing up for
visit
Resolved diabetes
No provider reminder
Hospital or external billing
Patient not compliant
Provider reminder not built
into system
Care coordinator follow-up (6
votes)
Broad outreach calls
Use population health to identify
care gap (8 votes)
Add health alerts in medical
record
Follow-up call if missed (5 votes)
Chronic no show refer to BH (1
vote)
Patients included in the
measure who don't have
diabetes, patient tested
and billed to CountyCare
but not reflected in Vision
data?
Can we get a process of
how to submit proof to
CountyCare?
84Medical Home Network |©2016-17 All Rights Reserved | Proprietary & Confidential
RAPID IMPROVEMENT EVENT: EVENT NOTES

HEDIS Measure Issues Root Causes Solutions CountyCare
Questions/Issues
CCS –
cervical
cancer
screening
PCP not doing paps
Male patient in denominator
Patient had different insurance/no
insurance on date of service
Patient had an order but test wasn’t
completed
Providers not educating patients
Lack of history on pap documentation in
chart
Patient non-compliant
Lack of preventive out-reach
Lack of data and tools
Clinical practice guidelines say if normal,
paps can be completed every 5 years
instead of 3
No wellness visits
PCPs not conducting
paps, not collecting
history (not enough
time during visit)
Clinical guidelines
don’t align with
HEDIS
Outreach using patient
reports (9 votes)
Transparent provider
dashboard (5 votes)
Individual provider
improvement plans (1)
Provider incentivization
Provide preventive health
education to patients (based
on gaps of care) (2 votes)
Texting apps, based on age
and sex e.g. Text for Baby (8
votes)
Males in
denominator
FUH- follow-up
after
hospitalization
for mental
illness
Non-compliant patients
No discharge documentation
Not proper authorization on file to get records
Disconnect between the psych providers and
PCP
Unable to retrieve outside psych records
Lack of discharge planning – no follow up appt
scheduled
Lack of information about patients
f/u happened but was too late
Not all hospitals are in
portal, unable to be
aware of discharge
No access to patient
information, hard to get
records
Release of information
needs to be signed
Unaware patient was
hospitalized
Cant reach patient
Cant tell in
MHNConnect if BH
admission
BH network to address social
determinants
Joint case conferences (2 votes)
Variety of type of appointments
Complete care plans together
with BH And medical
Rush send BH auths to clinics (7
votes)
Schedule for PCP f/u and do
warm hand-off to BH (prevents
stigma issues) (9 votes)
Add hospitals to portal (7 votes)
TOC type intervention (3 votes)
Plan for complex patients (2
votes)
85Medical Home Network |©2016-17 All Rights Reserved | Proprietary & Confidential
RAPID IMPROVEMENT EVENT: EVENT NOTES
86
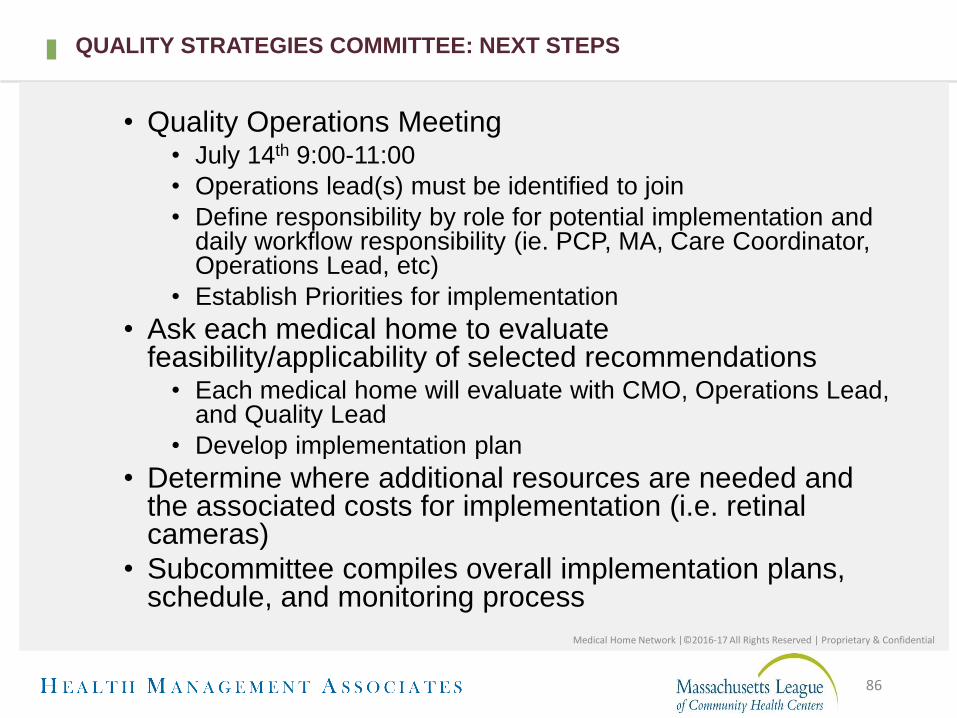
QUALITY STRATEGIES COMMITTEE: NEXT STEPS
• Quality Operations Meeting• July 14th 9:00-11:00
• Operations lead(s) must be identified to join
• Define responsibility by role for potential implementation and daily workflow responsibility (ie. PCP, MA, Care Coordinator, Operations Lead, etc)
• Establish Priorities for implementation
• Ask each medical home to evaluate feasibility/applicability of selected recommendations
• Each medical home will evaluate with CMO, Operations Lead, and Quality Lead
• Develop implementation plan
• Determine where additional resources are needed and the associated costs for implementation (i.e. retinal cameras)
• Subcommittee compiles overall implementation plans, schedule, and monitoring process
Medical Home Network |©2016-17 All Rights Reserved | Proprietary & Confidential
CARE MANAGEMENT’S ROLE IN BEHAVIORAL HEALTH INTEGRATION
88
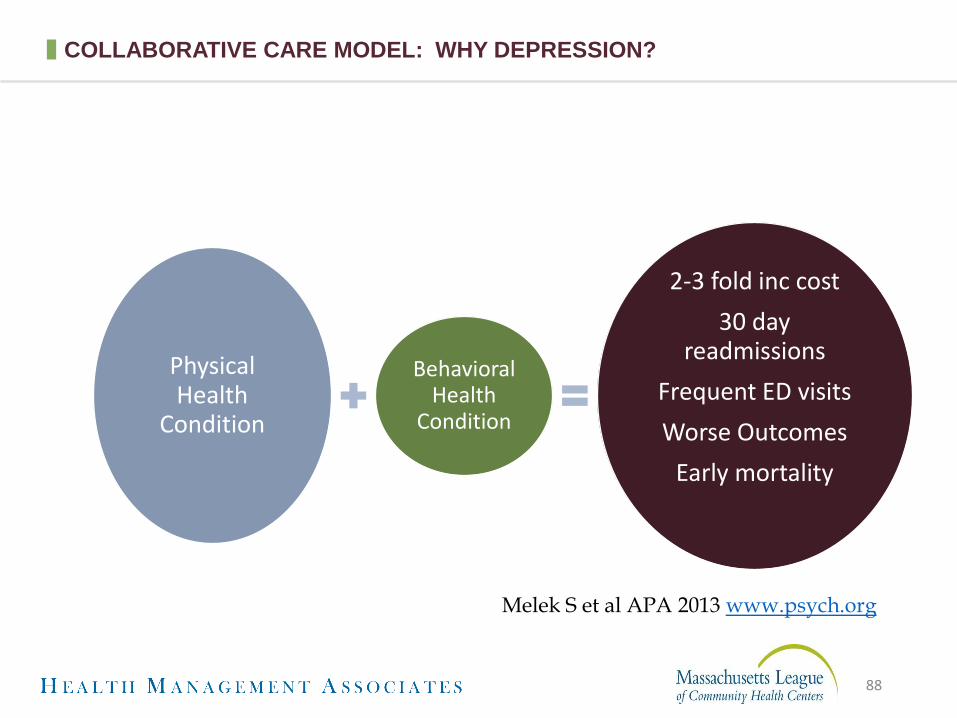
COLLABORATIVE CARE MODEL: WHY DEPRESSION?
Physical Health
Condition
Behavioral Health
Condition
2-3 fold inc cost
30 day readmissions
Frequent ED visits
Worse Outcomes
Early mortality
Melek S et al APA 2013 www.psych.org
89
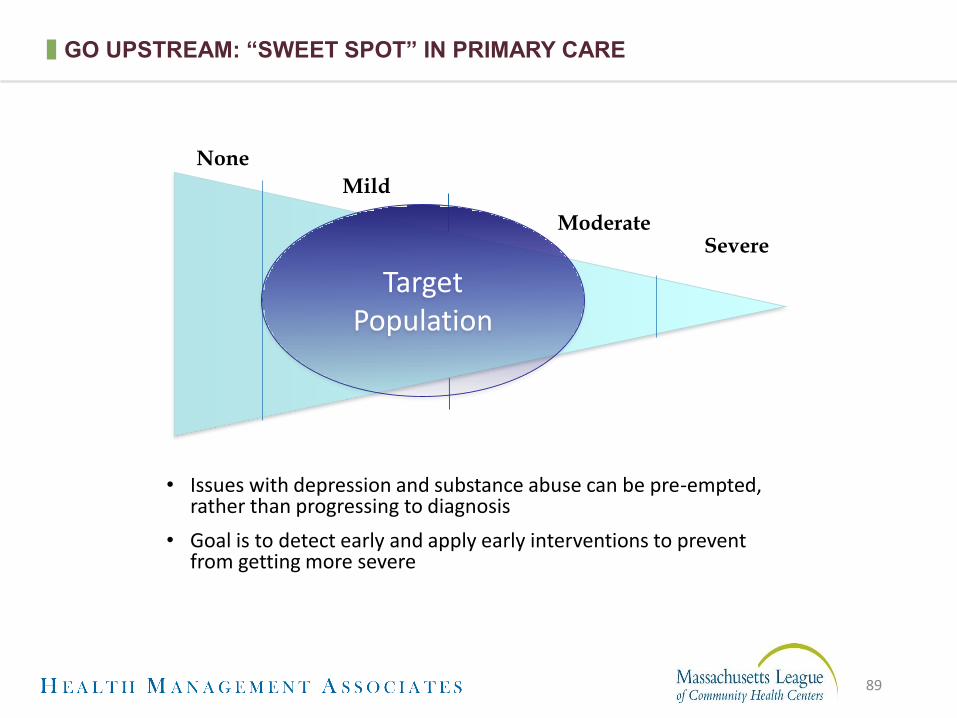
GO UPSTREAM: “SWEET SPOT” IN PRIMARY CARE
• Issues with depression and substance abuse can be pre-empted, rather than progressing to diagnosis
• Goal is to detect early and apply early interventions to prevent from getting more severe
None
Mild
ModerateSevere
Target Population
Medical Home Network | © 2009 – 2016 All Rights Reserved | Proprietary & Confidential 90
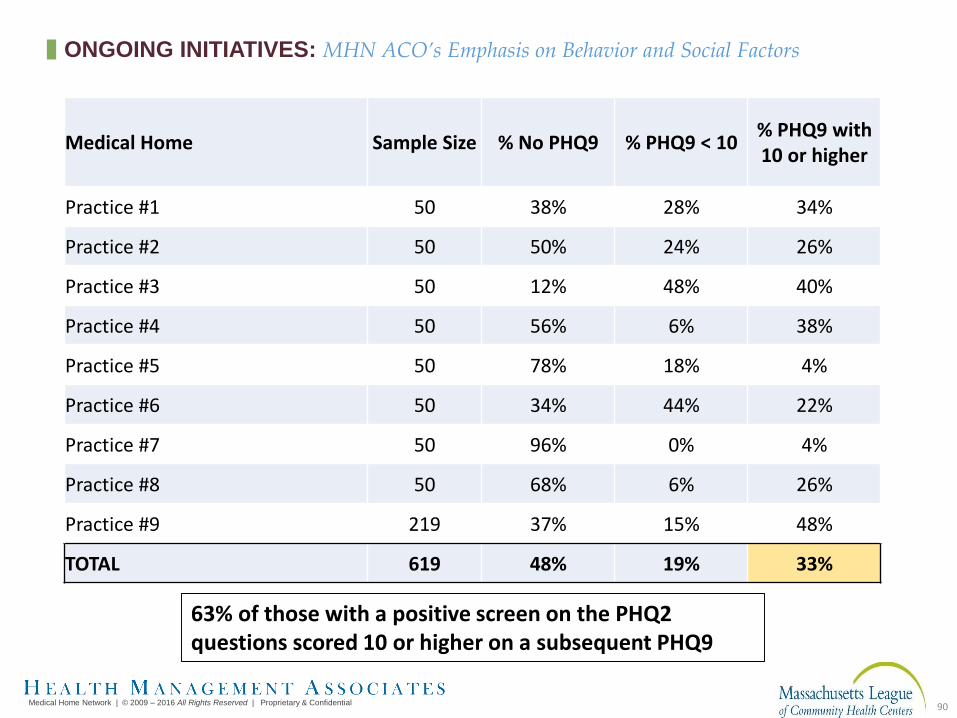
Medical Home Sample Size % No PHQ9 % PHQ9 < 10% PHQ9 with 10 or higher
Practice #1 50 38% 28% 34%
Practice #2 50 50% 24% 26%
Practice #3 50 12% 48% 40%
Practice #4 50 56% 6% 38%
Practice #5 50 78% 18% 4%
Practice #6 50 34% 44% 22%
Practice #7 50 96% 0% 4%
Practice #8 50 68% 6% 26%
Practice #9 219 37% 15% 48%
TOTAL 619 48% 19% 33%
63% of those with a positive screen on the PHQ2 questions scored 10 or higher on a subsequent PHQ9
ONGOING INITIATIVES: MHN ACO’s Emphasis on Behavior and Social Factors
91
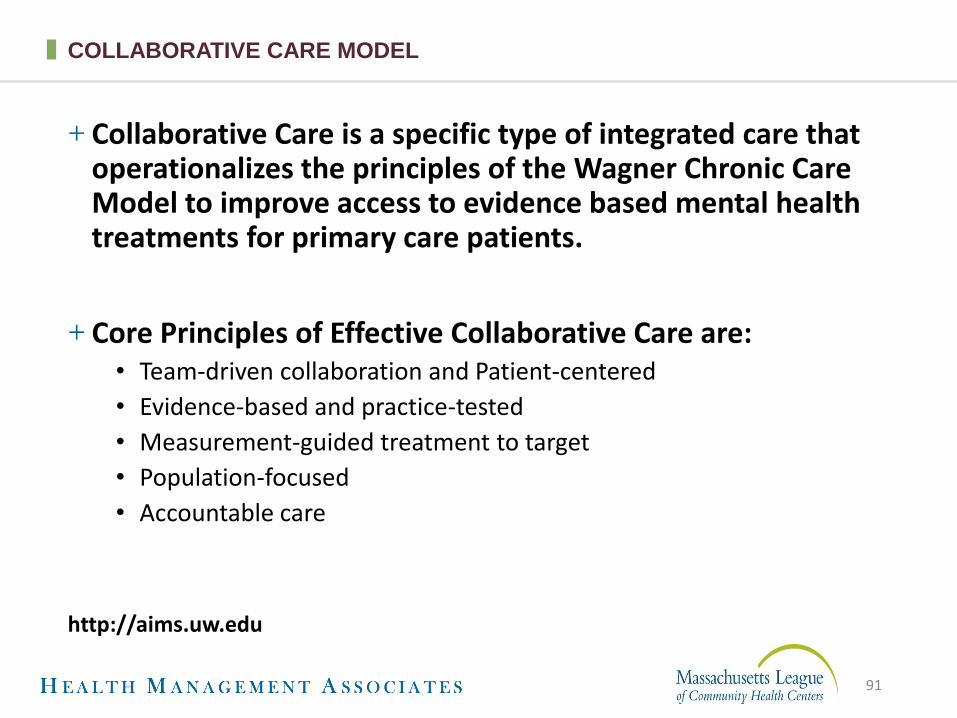
+ Collaborative Care is a specific type of integrated care that operationalizes the principles of the Wagner Chronic Care Model to improve access to evidence based mental health treatments for primary care patients.
+ Core Principles of Effective Collaborative Care are: • Team-driven collaboration and Patient-centered
• Evidence-based and practice-tested
• Measurement-guided treatment to target
• Population-focused
• Accountable care
http://aims.uw.edu
COLLABORATIVE CARE MODEL

Collaborative Team Approach
PCP
PatientBHCC/CareManager
Consulting Psychiatric Provider
Other Behavioral Health Clinicians
CoreProgram
Additional ClinicResources
OutsideResources
Substance Treatment, Vocational Rehabilitation, CMHC,
Other Community Resources
New Roles
92
Medical Home Network | © 2009 – 2016 All Rights Reserved | Proprietary & Confidential
COLLABORATIVE CARE: USING E-CONSULTS
93
COLLABORATIVE CARE: MEASUREMENT BASED CARE
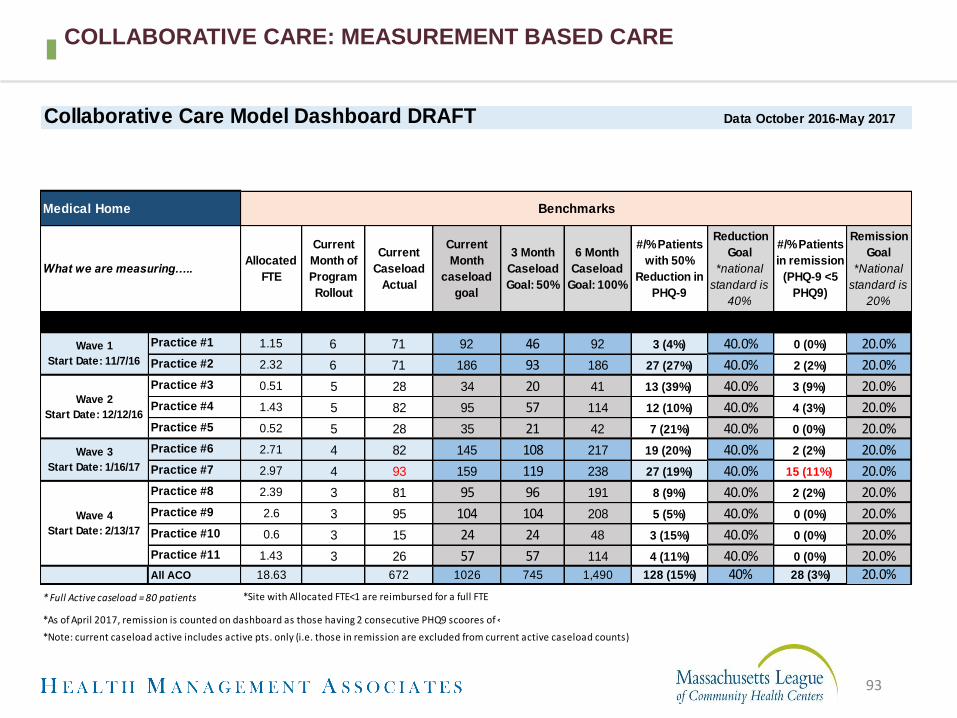
Collaborative Care Model Dashboard DRAFT
What we are measuring…..Allocated
FTE
Current
Month of
Program
Rollout
Current
Caseload
Actual
Current
Month
caseload
goal
3 Month
Caseload
Goal: 50%
6 Month
Caseload
Goal: 100%
#/% Patients
with 50%
Reduction in
PHQ-9
Reduction
Goal
*national
standard is
40%
#/% Patients
in remission
(PHQ-9 <5
PHQ9)
Remission
Goal
*National
standard is
20%
Practice #1 1.15 6 71 92 46 92 3 (4%) 40.0% 0 (0%) 20.0%
Practice #2 2.32 6 71 186 93 186 27 (27%) 40.0% 2 (2%) 20.0%
Practice #3 0.51 5 28 34 20 41 13 (39%) 40.0% 3 (9%) 20.0%
Practice #4 1.43 5 82 95 57 114 12 (10%) 40.0% 4 (3%) 20.0%
Practice #5 0.52 5 28 35 21 42 7 (21%) 40.0% 0 (0%) 20.0%
Practice #6 2.71 4 82 145 108 217 19 (20%) 40.0% 2 (2%) 20.0%
Practice #7 2.97 4 93 159 119 238 27 (19%) 40.0% 15 (11%) 20.0%
Practice #8 2.39 3 81 95 96 191 8 (9%) 40.0% 2 (2%) 20.0%
Practice #9 2.6 3 95 104 104 208 5 (5%) 40.0% 0 (0%) 20.0%
Practice #10 0.6 3 15 24 24 48 3 (15%) 40.0% 0 (0%) 20.0%
Practice #11 1.43 3 26 57 57 114 4 (11%) 40.0% 0 (0%) 20.0%All ACO 18.63 672 1026 745 1,490 128 (15%) 40% 28 (3%) 20.0%
* Full Active caseload = 80 patients
*As of April 2017, remission is counted on dashboard as those having 2 consecutive PHQ9 scoores of <5
*Note: current caseload active includes active pts. only (i.e. those in remission are excluded from current active caseload counts)
Data October 2016-May 2017
*Site with Allocated FTE<1 are reimbursed for a full FTE
Wave 4
Start Date: 2/13/17
Wave 1
Start Date: 11/7/16
Medical Home Benchmarks
Wave 2
Start Date: 12/12/16
Wave 3
Start Date: 1/16/17

94
Positive HRA/CRA38%
Elevated PHQ-91%
Ongoing Care Mgmt13%
BH Referral23%
PCP Referral7%
TOC/Hospitalization1%
Other16%
Unspecified1%
Medical Home Network |©2016-17 All Rights Reserved | Proprietary & Confidential
COLLABORATIVE CARE REGISTRY DATA: TYPES OF REFERRALS FOR CoCM
PATIENTS (N = 665)

95
74%
26%
Existing Dx = 493
New Dx = 171
Unspecified
Medical Home Network |©2016-17 All Rights Reserved | Proprietary & Confidential
COLLABORATIVE CARE REGISTRY DATA: STATUS OF THE DIAGNOSIS (N = 665)

96
DISTRIBUTION OF PHQ-9 SCORES: HIGH PREVALENCE OF DEPRESSION
0
50
100
150
200
250
300
22
274225
134
10
Nu
mb
er o
f Pa
tien
ts
Initial PHQ-9 Scores
Initial PHQ-9 Scores By Category (N=665)

INCENTING CARE MANAGEMENT
PERFORMANCE VIA DISTRIBUTION OF VALUE-
BASED PAYMENTS

Medical Home Network |©2016-17 All Rights Reserved | Proprietary & Confidential
98
BUILDING BLOCKS FOR DELIVERY SYSTEM TRANSFORMATION AND
POPULATION MANAGEMENT

MHN ACO ContractACA, FHP, ICP
Expense
OffsetShared Savings Distribution
(Migrating to Shared Risk) Direct Contract
Health
Plan
Hospitals & Specialists
Care Management
Capitation
Medical Homes/Primary Care Practice Sites
Direct Provider Contracts
All Products
Provider Payment
(FFS or Cap)Clinical
Investment
Fund
Reserves
At Risk P4P
Complex Care Management
Annual Settlement
Monthly PMPM Quarterly
Expense
Offset
Assured Infrastructure Funding Earned Savings Funding
Medical Home Network |©2016-17 All Rights Reserved | Proprietary & Confidential
99
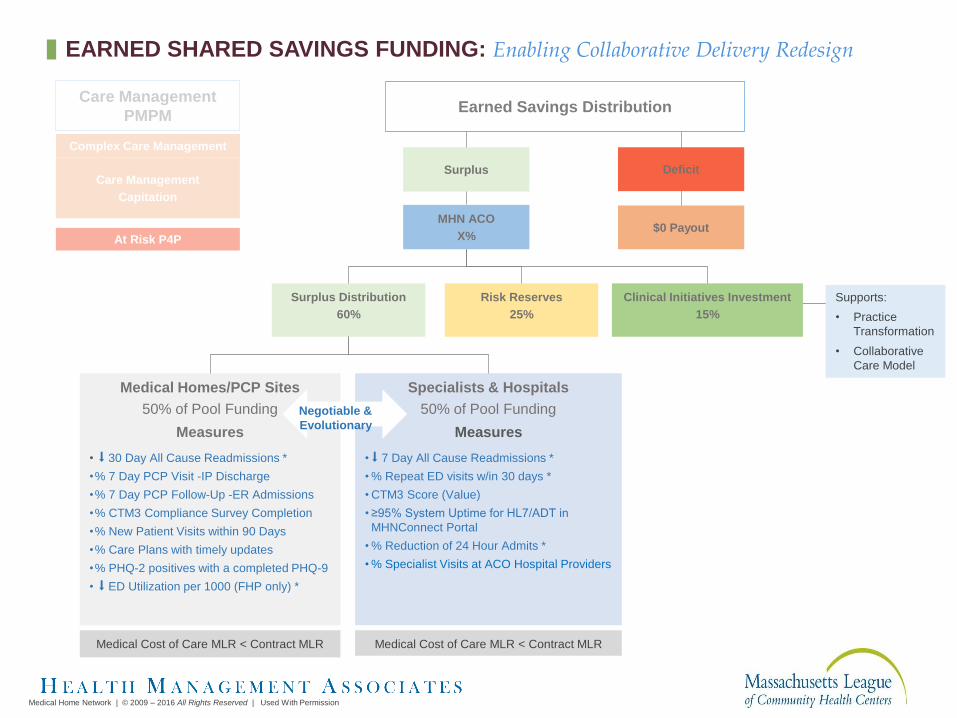
MEDICAL HOME NETWORK VALUE BASED CONTRACTING CONSTRUCT
Medical Home Network | © 2009 – 2016 All Rights Reserved | Used With Permission
MHN ACO
X%
Earned Savings Distribution
Medical Homes/PCP Sites
50% of Pool Funding
Measures
• ⬇ 30 Day All Cause Readmissions *
•% 7 Day PCP Visit -IP Discharge
•% 7 Day PCP Follow-Up -ER Admissions
•% CTM3 Compliance Survey Completion
•% New Patient Visits within 90 Days
•% Care Plans with timely updates
•% PHQ-2 positives with a completed PHQ-9
• ⬇ ED Utilization per 1000 (FHP only) *
Surplus
Surplus Distribution
60%
Risk Reserves
25%
Clinical Initiatives Investment
15%
Specialists & Hospitals
50% of Pool Funding
Measures
• ⬇ 7 Day All Cause Readmissions *
• % Repeat ED visits w/in 30 days *
• CTM3 Score (Value)
• ≥95% System Uptime for HL7/ADT in
MHNConnect Portal
• % Reduction of 24 Hour Admits *
• % Specialist Visits at ACO Hospital Providers
$0 Payout
Deficit
Medical Cost of Care MLR < Contract MLRMedical Cost of Care MLR < Contract MLR
Supports:
• Practice
Transformation
• Collaborative
Care Model
Negotiable &
Evolutionary
Care Management
Capitation
At Risk P4P
Complex Care Management
Care Management
PMPM
EARNED SHARED SAVINGS FUNDING: Enabling Collaborative Delivery Redesign
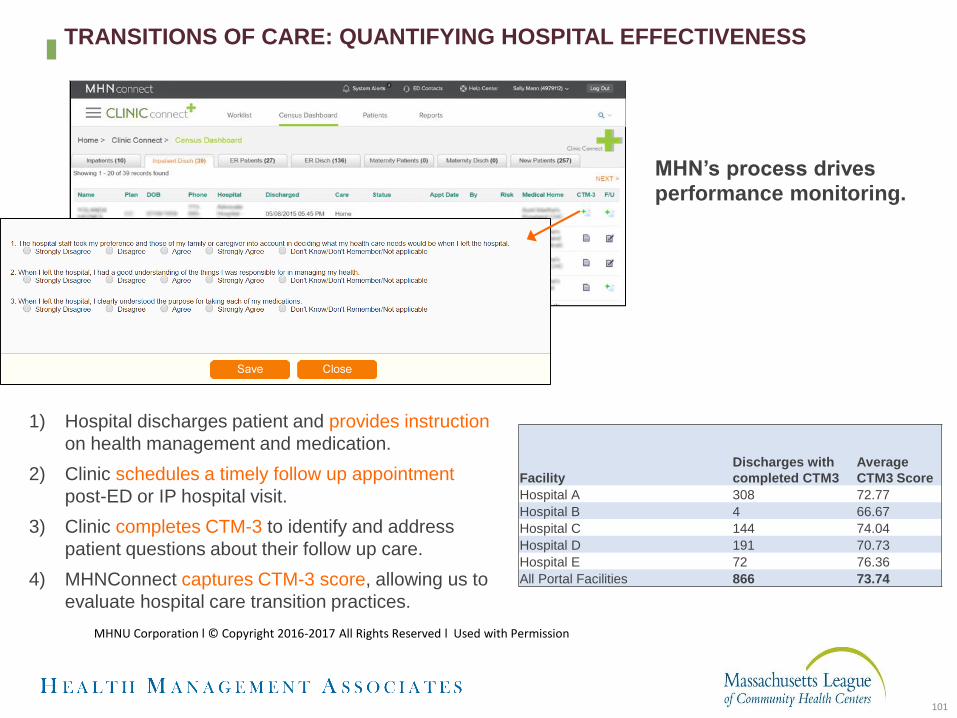
MHN’s process drives
performance monitoring.
1) Hospital discharges patient and provides instruction
on health management and medication.
2) Clinic schedules a timely follow up appointment
post-ED or IP hospital visit.
3) Clinic completes CTM-3 to identify and address
patient questions about their follow up care.
4) MHNConnect captures CTM-3 score, allowing us to
evaluate hospital care transition practices.
Facility
Discharges with
completed CTM3
Average
CTM3 Score
Hospital A 308 72.77
Hospital B 4 66.67
Hospital C 144 74.04
Hospital D 191 70.73
Hospital E 72 76.36
All Portal Facilities 866 73.74
101
MHNU Corporation l © Copyright 2016-2017 All Rights Reserved l Used with Permission
TRANSITIONS OF CARE: QUANTIFYING HOSPITAL EFFECTIVENESS
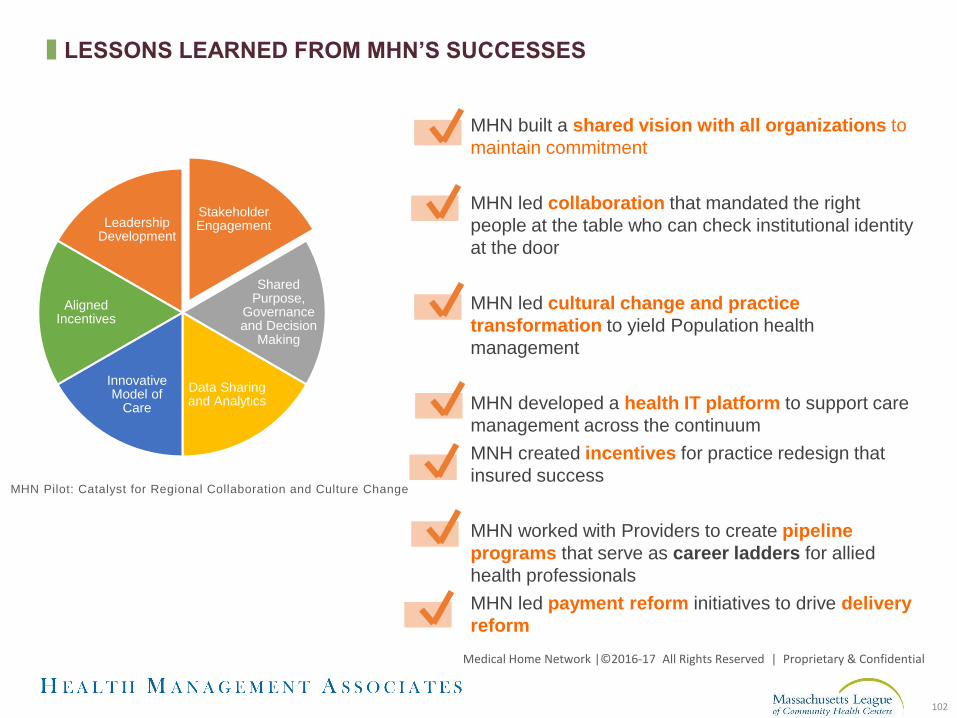
MHN built a shared vision with all organizations to
maintain commitment
MHN led collaboration that mandated the right
people at the table who can check institutional identity
at the door
MHN led cultural change and practice
transformation to yield Population health
management
MHN developed a health IT platform to support care
management across the continuum
MNH created incentives for practice redesign that
insured success
MHN worked with Providers to create pipeline
programs that serve as career ladders for allied
health professionals
MHN led payment reform initiatives to drive delivery
reform
Stakeholder Engagement
Shared Purpose,
Governance and Decision
Making
Data Sharing and Analytics
Innovative Model of
Care
Aligned Incentives
Leadership Development
MHN Pilot: Catalyst for Regional Collaboration and Culture Change
Medical Home Network |©2016-17 All Rights Reserved | Proprietary & Confidential
102
LESSONS LEARNED FROM MHN’S SUCCESSES

WRAP-UP
104
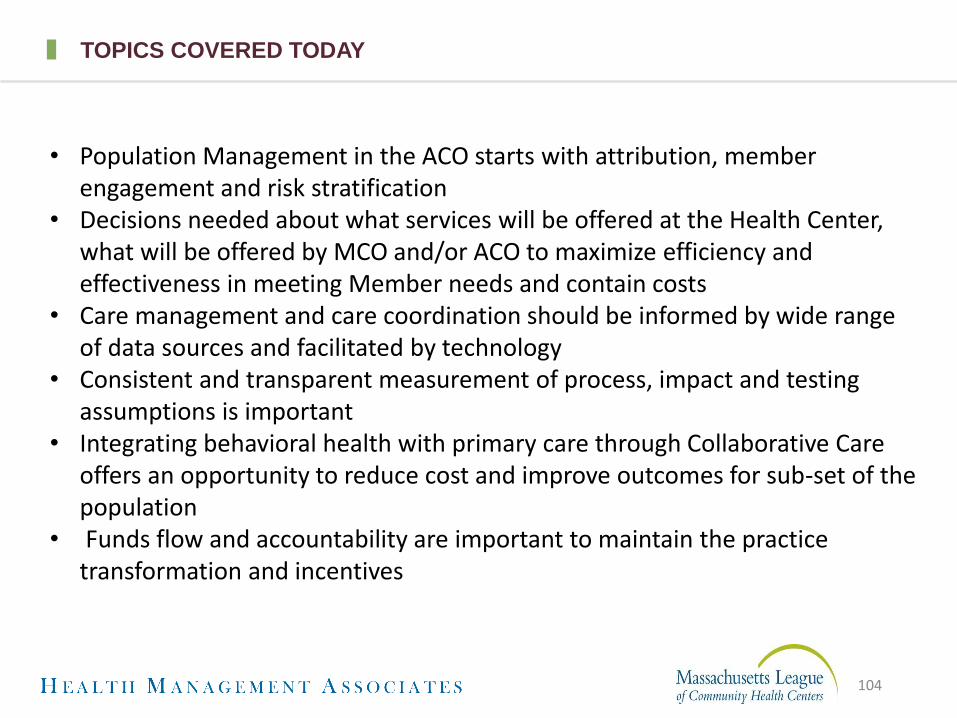
TOPICS COVERED TODAY
• Population Management in the ACO starts with attribution, member engagement and risk stratification
• Decisions needed about what services will be offered at the Health Center, what will be offered by MCO and/or ACO to maximize efficiency and effectiveness in meeting Member needs and contain costs
• Care management and care coordination should be informed by wide range of data sources and facilitated by technology
• Consistent and transparent measurement of process, impact and testing assumptions is important
• Integrating behavioral health with primary care through Collaborative Care offers an opportunity to reduce cost and improve outcomes for sub-set of the population
• Funds flow and accountability are important to maintain the practice transformation and incentives

105
NEXT SESSION
October 20, 2017
See You Then!
APPENDIX
COORDINATING MEMBER-CENTRIC SPECIALTY
CARE

eConsult: DrivingImpact
Medical Home Network | © 2009 – 2016 All Rights Reserved | Proprietary & Confidential
• Improve access to specialty care• Increase specialty capacity• Reduce no-show rates• Streamline scheduling process
and increase patient choice• Strengthen the specialty
network and provider relationships
• Expand scope of PCP practice
108

eConsult Workflow: Meeting a Patient’s Specialty Care Needs
Medical Home Network | © 2009 – 2016 All Rights Reserved | Proprietary & Confidential
109

eConsult
Services Available
• 27 Adult Specialties and 12 Pediatric
AD
ULT
SP
EC
IALT
IES
Allergy/ Immunology
ENT Nephrology Orthopedics Rheumatology
PE
DIA
TR
IC S
PE
CIA
LTIE
S
Adolescent & Young Adult Clinic
Hematology/ Oncology
Cardiology ENT: Head And
Neck Tumor Neurology
Pain Management
Sleep Disorders
Allergy/ Immunology
OMFS: Jaw Tumor
Cardiothoracic Surgery
Gastroenterology Neuro-Surgery Physical
Medicine & Rehab
Urology Cardiology OMFS: Oral & Maxillofacial
Surgery
Colorectal General Surgery OB/GYN Podiatry
Dermatology Orthopedics
Dermatology Hepatology OMFS: Jaw
Tumor Psychiatry
Endocrinology Pain
Management
Endocrinology Infectious Disease OMFS: Oral & Maxillofacial
Surgery Pulmonary
Gastroenterology Urology
Medical Home Network |©2016-17 All Rights Reserved | Proprietary & Confidential
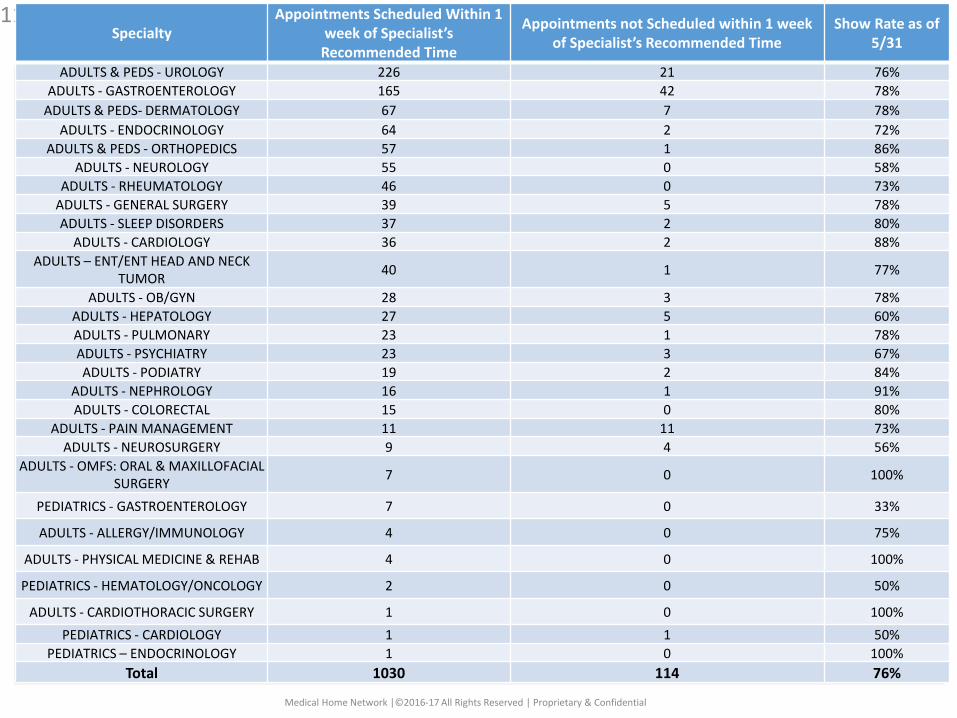
111Specialty
Appointments Scheduled Within 1 week of Specialist’s
Recommended Time
Appointments not Scheduled within 1 week of Specialist’s Recommended Time
Show Rate as of 5/31
ADULTS & PEDS - UROLOGY 226 21 76%
ADULTS - GASTROENTEROLOGY 165 42 78%
ADULTS & PEDS- DERMATOLOGY 67 7 78%
ADULTS - ENDOCRINOLOGY 64 2 72%
ADULTS & PEDS - ORTHOPEDICS 57 1 86%
ADULTS - NEUROLOGY 55 0 58%
ADULTS - RHEUMATOLOGY 46 0 73%
ADULTS - GENERAL SURGERY 39 5 78%
ADULTS - SLEEP DISORDERS 37 2 80%
ADULTS - CARDIOLOGY 36 2 88%
ADULTS – ENT/ENT HEAD AND NECK TUMOR
40 1 77%
ADULTS - OB/GYN 28 3 78%
ADULTS - HEPATOLOGY 27 5 60%
ADULTS - PULMONARY 23 1 78%
ADULTS - PSYCHIATRY 23 3 67%
ADULTS - PODIATRY 19 2 84%
ADULTS - NEPHROLOGY 16 1 91%
ADULTS - COLORECTAL 15 0 80%
ADULTS - PAIN MANAGEMENT 11 11 73%
ADULTS - NEUROSURGERY 9 4 56%
ADULTS - OMFS: ORAL & MAXILLOFACIAL SURGERY
7 0 100%
PEDIATRICS - GASTROENTEROLOGY 7 0 33%
ADULTS - ALLERGY/IMMUNOLOGY 4 0 75%
ADULTS - PHYSICAL MEDICINE & REHAB 4 0 100%
PEDIATRICS - HEMATOLOGY/ONCOLOGY 2 0 50%
ADULTS - CARDIOTHORACIC SURGERY 1 0 100%
PEDIATRICS - CARDIOLOGY 1 1 50%
PEDIATRICS – ENDOCRINOLOGY 1 0 100%
Total 1030 114 76%
Medical Home Network |©2016-17 All Rights Reserved | Proprietary & Confidential

Program Impact
Patient:
Reduced wait times for specialty care
Less travel
Fewer days off work
Better coordination of care -transitions of care better managed, process more
transparent
Specialist more informed at the time initial visit
Fewer specialty visits required to devise treatment plan
Primary Care:
Improved access to specialty expertise
Connected to larger system of care (reduced isolation)
Opportunity to enhance clinical capability (eConsult
“CME”)
Reduced wait times
Co-mgmt. of complex patients
Transparent scheduling process- improves tracking of
visits
Shared notes- improves team communication
Potential to reduce specialty costs
Specialist:
When indicated, face to face visits are more productive:
Pre-visit testing is completed
Avoidance of inappropriate referrals
Increased complexity of clinic patients
Improved communication with primary care
Alternative source of revenue when patents no-show for
face-to-face visits
112Medical Home Network | © 2009 – 2016 All Rights Reserved | Proprietary & Confidential

EOHHS DEFINITIONS
✚ Clinical Care Manager - a licensed Registered Nurse or other individual, employed by the Contractor or an Enrollee’s PCP and licensed to provide clinical care management, including intensive monitoring, follow-up, and care coordination, clinical management of high-risk Enrollees, as further specified by EOHHS.
✚ Care Coordinator – a provider-based clinician or other trained individual who is employed or contracted by the Contractor or an Enrollee’s PCP. The Care Coordinator is accountable for providing care coordination activities, which include assuring appropriate referrals and timely two-way transmission of useful patient information; obtaining reliable and timely information about services other than those provided by the PCP; participating in the Enrollee’s Comprehensive Assessment, if any; and supporting safe transitions in care for Enrollees moving between settings in accordance with the Contractor’s Transitional Care Management program. The Care Coordinator may serve on one or more care teams, coordinate and facilitates meetings and other activities of those care teams.

EOHHS DEFINITIONS
✚ Disease Management – the Contractor’s disease or condition specific packages of ongoing services and assistance for specific disease and/or conditions. Services include specific interventions and education/outreach targeted to Enrollees with, or at risk for, these conditions.
✚ Utilization Management – a process of evaluating and determining coverage for, and appropriateness of, medical care services and Behavioral Health Services, as well as providing needed assistance to clinicians or patients, in cooperation with other parties, to ensure appropriate use of resources, which can be done on a prospective or retrospective basis, including service authorization and prior authorization.
✚ Transitional Care Management – the evaluation of an Enrollee’s medical care needs and coordination of any other support services in order to arrange for safe and appropriate care after discharge from one level of care to another level of care, including referral to appropriate services.