Embed Size (px)
Citation preview

Cutting and Coatings Technology Leader
Acme United Corporation 2009 Annual Report

We believe Acme United is well positioned to serve
global customers by leveraging our coating technologies
– including titanium nitride, ceramic non-stick and
titanium carbonitride – which are covered by pending
and issued utility patents.
Above: The Clauss rotary cutting tool is designed with an ergonomic handle and a retractable titanium-bonded blade for comfort, performance and safety.
On the cover: The next-generation iPoint pencil sharpener, which won the prestigious Good Design award for product innovation in 2009.
Right: This Camillus folding knife with a patented titanium carbonitride blade sets the standard for high performance.

(Amounts in thousands except per share data) 2007 2008 2009
Operating Results
Net Sales $ 63,173 $ 68,719 $ 59,149
Net Income 4,022 4,467 2,842
Net Income Per Share 1.09 1.24 0.85
Financial Positions at December 31
Working Capital $ 29,378 $ 29,820 $ 28,953
Total Assets 42,222 45,424 42,309
Shareholders’ Equity 23,047 22,887 24,541
Financial Highlights
Net Sales ($ in thousands)
68,71963,173
59,149
49,946
0
56,863
2005 2006 2008 20092007
1
2009 Annual R
eport

We have just completed a very challenging year and emerged a much stronger Company. Our team pulled together and focused on our customers and their needs. We cut back expenses but funded new product development. We reduced inventory, achieved solid earnings and cut net debt by 60%. We raised our dividend and repurchased 6% of the Company’s shares. Most importantly, we entered 2010 with momentum and strength.
Revenues were $59.1 million in 2009 compared to $68.7 million in 2008. Net income was $2.8 million versus $4.5 million the prior year. Earnings per share were $0.85 in 2009 compared to $1.24 in 2008. Gross margins averaged 37% versus 40% achieved last year, primarily because our fi xed costs were spread over lower volumes.
During the year we thoroughly reviewed our costs and saved over $1 million in fi xed selling, general and administrative expenses. We believe Acme United is one of the lowest-cost suppliers of our products in the world, and our efforts to become more productive continue.
Although we held costs tight, we continued to fund innovation. The most important new technical innovation was a proprietary, ceramic non-stick coating that we believe will change the way people use our products. The
Dear Fellow Shareholders
These Westcott scissors, featuring a non-stick ceramic coating, cut through tapes and adhesives without residue.
2
Acm
e United C
orporation

fi rst scissor with this coating was introduced in May 2009, and it has had outstanding customer reaction.
The Company introduced the iPoint non-stick titanium pencil sharpener at mid-year. The new iPoint sharpens wood, composite and colored pencils, and effi ciently cuts crayons that jam traditional pencil sharpeners. This new product line is expected to be sold at leading retailers in 2010 and beyond.
We launched a family of non-stick scissors in the Clauss industrial and professional categories. These high-quality products provide superior adhesion resistance, are anti-corrosive and are fi ve times harder than stainless steel. In 2009, we brought the advantages of our non-stick technology to SpeedPak, the innovative Clauss titanium-bonded utility knife that features interchangeable cartridges. This product line has gained broad distribution, and our non-stick coatings enhance its performance with glues, tars and tapes.
We believe our patent work in the new non-stick technology will become fundamental as we leverage it across many different cutting products. We envision the use of this proprietary coating everywhere our customers cut in the craft, school, offi ce, home, industrial and food processing markets.
The new non-stick hooked blade on our award-winning Clauss SpeedPak utility knife facilitates easy cutting of fl ooring and roofi ng materials.
3
2009 Annual R
eport

Two years ago, Acme United bought the patents and intellectual property of Camillus Cutlery, the oldest knife company in the United States. In 2009, we launched a new Camillus knife family with proprietary designs and high-performance titanium carbonitride coatings. These knives have superior hardness and outstanding cutting performance.
Our Westcott brand introduced a family of recycled products in bright, appealing colors. Recycled products are usually black because the plastics come from many different sources and the coloring is inconsistent. Acme United uncovered a way to modify the process to produce school and offi ce supplies that are both recycled and attractively colored.
Our PhysiciansCare brand of fi rst-aid and safety products is a leading supplier to offi ce and industrial channels. In 2009 we introduced anti-microbial products for hearing, eye and head protection.
We believe there are substantial opportunities in 2010 to increase sales to our current customers, build our distribution channels and introduce the next generation of new products. We intend to look carefully for appropriate acquisitions and are upbeat about the future.
Our management team and employees were responsible for our performance in 2009 and we would like to thank them for their strong effort. We appreciate the work of all who contributed in 2009 and look forward to continuing to build in 2010. Thank you for your continued support.
Sincerely,
Walter C. Johnsen Brian S. Olschan
Chairman and CEO President and COO
Walter C. Johnsen
Chairman and CEO
Brian S. Olschan
President and COO
4
Acm
e United C
orporation

Offi cers
International Key Management
Directors
Walter C. JohnsenChairman of the Board and Chief Executive Offi cer
Brian S. OlschanPresident and Chief Operating Offi cer
Paul G. DriscollVice President, Chief Financial Offi cer, Secretary and Treasurer
Larry H. BuchtmannVice President of Technology
Harry G. WanlessGeneral ManagerAcme United Limited(Canada)
Dennis LiangGeneral ManagerAcme United (Asia Pacifi c) Limited(Hong Kong)
Willi EngelsbergManaging DirectorAcme United Europe, GmbH(Germany)
Rex L. DavidsonPresidentRex Davidson Associates, LLC
Executive DirectorLas Cumbres Community Services
Richmond Y. Holden, Jr.PresidentEducators Publishing Service
Walter C. JohnsenChairman and Chief Executive Offi cerAcme United Corporation
Susan H. MurphyVice President for Studentand Academic ServicesCornell University
Brian S. OlschanPresident and Chief Operating Offi cerAcme United Corporation
Stevenson E. Ward IIIVice President and Chief Financial Offi cerTriton Thalassic Technologies, Inc.
More Information
Corporate Offi ceAcme United Corporation60 Round Hill RoadFairfi eld, CT 06824
Transfer AgentAmerican Stock Transfer Company40 Wall StreetNew York, NY 10005
CounselBrody Wilkinson PCSouthport, CT
Stock ListingThe stock of Acme United Corporationis traded on the NYSE AMEXunder the symbol of ACU
AuditorUHY LLPHartford, CT
Annual MeetingWill be held at 11am onMonday, April 19, 2010 atThe Cornell Club6 East 44th StreetNew York, NY 10017
On the back cover: Our PhysiciansCare kits provide ready solutions for specifi c emergency needs.

Acme United Corporation | 60 Round Hill Road, Fairfi eld, CT 06824 U.S.A. | 203.254.6060 | acmeunited.com

UNITED STATES SECURITIES AND EXCHANGE COMMISSIONWashington, D. C. 20549
FORM 10-K
() ANNUAL REPORT PURSUANT TO SECTION 13 OR 15 (d) OF THE SECURITIES EXCHANGE ACT OF 1934For the fi scal year ended December 31, 2009
OR
(X) TRANSITION REPORT PURSUANT TO SECTION 13 OR 15 (d) OF THE SECURITIES EXCHANGE ACT OF 1934
Commission fi le number 01-07698
ACME UNITED CORPORATION Exact name of registrant as specifi ed in its charter
Connecticut 06-0236700 (State or other jurisdiction of (I.R.S. Employer incorporation or organization) Identifi cation No.)
60 Round Hill Road Fairfi eld, Connecticut 06824 (Address of principal executive offi ces) (Zip Code)
Registrant’s telephone number, including area code 203-254-6060
Securities registered pursuant to Section 12(b) of the Act:
Title of each class Name of each exchange on which registered $2.50 par value Common Stock NYSE Amex
Securities registered pursuant to Section 12 (g) of the Act: None
Indicate by check mark whether the registrant is a well-known seasoned issuer, as defi ned in Rule 405 of the Securities Act. YES ()NO ()
Indicate by check mark if the registrant is not required to fi le reports pursuant to Section 13 or Section 15(d) of the Act. YES ()NO ()
Indicate by check mark whether the registrant (l) has fi led all reports required to be fi led by Section 13 or 15 (d) of the Securities Exchange Act of 1934 during the preceding 12 months (or for such shorter period that the registrant was required to fi le such reports) and (2) has been subject to such fi ling requirements for the past 90 days. YES ()NO ()
Indicate by check mark if disclosure of delinquent fi lers pursuant to Item 405 of Regulation S-K is not contained herein, and will not be contained, to the best of registrant’s knowledge, in defi nitive proxy or information statements incorporated by reference in Part III of this Form 10-K or any amendment to this Form 10-K. YES ()NO ()

6
Indicate by check mark whether the Registrant is a large accelerated fi ler, an accelerated fi ler, a non-accelerated fi ler, or a smaller reporting company. See defi nition of “accelerated fi ler and large accelerated fi ler” in Rule 12b-2 of the Exchange Act (Check one). Large accelerated fi ler ()Accelerated fi ler ()Non-accelerated fi ler ()Smaller Reporting Company ()
Indicate by check mark whether the registrant is a shell company as defi ned in Rule 12b-2 of the Exchange Act. YES ()NO ()
The aggregate market value of the voting stock held by non affi liates of the registrant as of the last business day of the registrant’s most recently completed second fi scal quarter was $21,960,360. Registrant had 3,174,109 shares of its $2.50 par value Common Stock outstanding as of March 2, 2010.
Documents Incorporated By Reference
(1) Certain portions of the Company’s Proxy Statement for the Annual Meeting scheduled for April 19, 2010 is incorporated into the Company’s 2009 Annual Report on Form 10 K, Part III.

7
Part I
Item 1. Business 8
Item 1A. Risk Factors 10
Item 1B. Unresolved Staff Comments 13
Item 2. Properties 13
Item 3. Legal Proceedings 13
Item 4. Reserved 13
Part II
Item 5. Market for Registrant’s Common Equity, Related Stockholder Matters and Issuer Purchases of Equity Securities. 14
Item 6. Selected Financial Data 16
Item 7. Management’s Discussion and Analysis of Financial Condition and Results of Operations 16
Item 7A. Quantitative and Qualitative Disclosure about Market Risk 21
Item 8. Financial Statements and Supplementary Data 22
Item 9. Changes In and Disagreements with Accountants on Accounting and Financial Disclosure 40
Item 9A(T). Controls and Procedures 40
Item 9B. Other Information 40
Part III
Item 10. Directors, Executive Offi cers and Corporate Governance 41
Item 11. Executive Compensation 43
Item 12. Security Ownership of Certain Benefi cial Owners and Management 43
Item 13. Certain Relationships and Related Transactions, and Director Independence 43
Item 14. Principal Accountant Fees and Services 43
Part IV
Item 15. Exhibits and Financial Statement Schedules 44
Schedule II Valuation and Qualifying Accounts 46
Signatures 47

8
PART I
Item 1. Business
General
Acme United Corporation (together with its subsidiaries, the “Company”) was organized as a partnership in l867 and incorporated in l882 under the laws of the State of Connecticut. The Company is a leading worldwide supplier of innovative cutting, measuring and safety products to the school, home, offi ce, hardware and industrial markets. The Company’s operations are in the United States, Canada, Europe (located in Germany) and Asia (located in Hong Kong and China). The operations in the United States, Canada and Europe are primarily involved in product development, marketing, sales, administrative and distribution activities. The operations in Asia consist of sourcing, product development, production planning, quality control and sales activities. Net sales in 2009 were: United States (including Asia) – $44.9 million, Canada – $7.0 million, and Europe – $7.2 million.
The Company has grouped its operations into three reportable segments based on the Company’s geographical organization and structure: (1) United States (which includes its Asian operations); (2) Canada and (3) Europe. Refer to Note 10 of the Notes to Consolidated Financial Statements for additional segment information.
Business Strategy
The Company’s business strategy includes the following key elements:
• a commitment to technological innovation achieved through consumer insight, creativity and speed to market;
• a broad selection of products in both brand and private label;
• prompt response and same-day shipping;
• superior customer service; and
• value pricing.
Principal Products
The Company markets and sells under four main brands – Westcott®, Clauss®, Camillus® and PhysiciansCare®.
CuttingPrincipal products within the cutting device category are scissors, shears, guillotine paper trimmers, rotary paper trimmers, rotary cutters, knives, hobby knives and blades, utility knives, manicure products, medical cutting instruments and pencil sharpeners. Products introduced in 2008 and 2009 included Westcott Ultra Soft Handle anti-microbial scissors, True Professional™ sewing shears as well as a line of iPoint® pencil sharpeners utilizing the Company’s proprietary non-stick coating. The Company also added to its KleenEarth® family of recycled products by modifying the production process to allow for multi-colored products as opposed to the traditional black. Two years ago, the Company acquired the patents and intellectual property of Camillus Cutlery, the oldest knife company in the United States and in 2009, launched a new family of knives with proprietary designs and high performance titanium carbonitride coatings. Also, in 2008 the Company began shipping the Clauss Speedpak utility knife with replaceable cartridges.
MeasuringPrincipal products within the measuring instrument category are rulers, math tools and tape measures. Products introduced in 2009 included Westcott branded erasers, compasses and protractors. Products introduced in 2008 included Westcott anti-microbial rulers and math kits.

9
SafetyPrincipal products within the safety product category are fi rst aid kits, personal protection products and over-the-counter medication refi lls. Products introduced in 2009 included PhysiciansCare Emergency Care Responder Kits, Flu Care Kits and a line of safety products with Microban. Products introduced in 2008 included PhysiciansCare Ready Care Kits and Triage First Aid Stations.
Product Development
Our strong commitment to understanding our consumers and defi ning products that fulfi ll their needs through innovation drives our product development strategy, which we believe is and will be a key contributor to our success. The Company incurred research and development costs of $440,378 in 2009 and $529,685 in 2008.
Intellectual Property
The Company has many patents and trademarks that are important to its business. The Company’s success depends in part on its ability to maintain patent protection for its products, to preserve its proprietary technology and to operate without infringing upon the patents or proprietary rights of others. The Company generally fi les patent applications in the United States and foreign countries where patent protection for its technology is appropriate and available. The Company also considers its trademarks important to the success of its business. The more signifi cant trademarks include Westcott, Clauss, Camillus and PhysiciansCare.
Product Distribution
Independent manufacturer representatives and direct sales are primarily used to sell the Company’s line of consumer products to wholesale, contract and retail stationery distributors, offi ce supply super stores, school supply distributors, industrial distributors, wholesale fl orists, mass market retailers and hardware chains. In 2009, the Company had one customer that individually exceeded 10% of consolidated net sales and three customers that individually exceeded 10% of consolidated net sales in 2008. Net sales to these customers amounted to approximately 20% in 2009 and 19%, 12% and 10% in 2008. Sales to no other customer exceeded 10% of consolidated net sales in 2009 and 2008.
Competition
The Company competes with many companies in each market and geographic area. The major competitor in the cutting category is Fiskars Corporation. The major competitor in the measuring category is Helix International Ltd. The major competitor in the safety category is Johnson and Johnson.
Seasonality
Traditionally, the Company’s sales are stronger in the second and third quarters of the fi scal year due to the seasonal nature of the back-to-school business.
Compliance with Environmental Laws
The Company believes that it is in compliance with applicable environmental laws. The Company believes that there are no environmental matters that could have a signifi cant fi nancial impact. The Company believes that no major adverse fi nancial impact is expected to result from compliance with current environmental rules and regulations. In December 2008, the Company sold property it owned in Bridgeport, CT. Under the terms of the sales agreement, the Company is responsible for environmental remediation on the property in accordance with the Connecticut Transfer Act. Please refer to Note 16 of the Notes to Consolidated Financial Statements for additional information regarding the sale of the Bridgeport property.

10
Employees
As of December 31, 2009, the Company employed 134 people, all of whom are full time and none of whom is covered by union contracts. Employee relations are considered good and no foreseeable problems with the work force are evident.
Available Information
The Company fi les its annual reports on Form 10-K, quarterly reports on Form 10-Q and current reports on Form 8-K pursuant to Section 13(a) or 15(d) of the Securities Exchange Act of 1934 with the SEC electronically. The public may read or copy any materials fi led by the Company with the SEC at the SEC’s Public Reference Room at 100 F Street, NE, Washington, DC 20549 on offi cial business days during the hours of 10:00 a.m. and 3:00 p.m. The public may obtain information on the operation of the Public Reference Room by calling the SEC at 1-800-SEC-0330. The SEC maintains a website that contains reports, proxy and information statements, and other information regarding issuers that fi le electronically with the SEC. The address of that site is http://www.sec.gov.
You may obtain a free copy of the Company’s annual reports on Form 10-K, quarterly reports on Form 10-Q and current reports on Form 8-K and amendments to those reports on the Company’s website at http://www.acmeunited.com or by contacting the Investor Relations Department at the Company’s corporate offi ces by calling (203) 254-6060. Such reports and other information are made available as soon as reasonably practicable after such material is fi led with or furnished to the SEC.
Item 1A. Risk FactorsThe Company is subject to a number of signifi cant risks that might cause the Company’s actual results to vary materially from its forecasts, targets or projections, including:
• achieving planned revenue and profi t growth in each of the Company’s business segments;
• changes in customer requirements and in the volume of sales to principal customers;
• the timing of orders and shipments;
• emergence of new competitors or consolidation of existing competitors; and
• industry demand fl uctuations.
The Company’s expectations for both short- and long-term future net revenues are based on the Company’s estimates of future demand. Orders from the Company’s principal customers are ultimately based on demand from end-users and end-user demand can be diffi cult to predict. Low end-user demand would negatively affect orders the Company receives from distributors and other principal customers which could, in turn adversely affect the Company’s revenues in any fi scal period. If the Company’s estimates of sales are not accurate and the Company experiences unforeseen variability in its revenues and operating results, the Company may be unable to adjust its expense levels accordingly and its profi t margins could be adversely affected.
A number of the Company’s products are sold through distributors and large retailers. No assurances can be given that any or all of such distributors or retailers will continue their relationships with the Company. Distributors and other signifi cant retail customers cannot easily be replaced and the loss of revenues and the Company’s inability to reduce expenses to compensate for the loss of revenues could adversely affect the Company’s net revenues and profi t margins.
Adverse conditions in the global economy and disruption of fi nancial markets could negatively impact our ability to obtain fi nancing. Financial markets in the United States, Europe and Asia have experienced signifi cant disruption during 2009, including, among other things, reduced consumer spending, fl uctuations in foreign currency exchange rates, signifi cant volatility in security prices, severely diminished liquidity and credit availability, and declines in asset valuation. While currently these conditions have not impaired our ability to access credit markets

11
and fi nance our operations, there can be no assurance that any deterioration in fi nancial markets in major economies will not have an impact on the Company’s ability to fi nance its operation.
The ongoing uncertainty in the global economy could negatively impact our business. The ongoing uncertainty in the global economy could adversely affect our customers and our suppliers and businesses such as ours. In addition, the uncertainty could have a variety of negative effects on the Company such as reduction in revenues, increased costs, lower gross margin percentages, increased allowances for doubtful accounts and/or write-offs of accounts receivable and could otherwise have material adverse effects on our business, results of operations, fi nancial condition and cash fl ows.
Loss of a major customer could result in a decrease in the Company’s future sales and earnings. In 2009, the Company had one customer that individually exceeded 10% of consolidated net sales and three customers that individually exceeded 10% of consolidated net sales in 2008. Net sales to these customers amounted to approximately 20% in 2009 and 19%, 12% and 10% in 2008. The Company anticipates that a limited number of customers may account for a substantial portion of its total net revenues for the foreseeable future. The loss of a major customer or a disruption in sales to such a customer could result in a decrease of the Company’s future sales and earnings.
Reliance on foreign suppliers could adversely affect the Company’s business. The Company purchases the majority of its products from foreign manufacturing partners and, as a result, its business is exposed to risks due to:
• Increases in transportation costs;
• New or increased import duties;
• Transportation delays;
• Work stoppages;
• Capacity constraints;
• Poor quality; and
• Infl ation and exchange rate fl uctuations that could increase the cost of foreign manufactured goods.
The loss of key management could adversely affect the Company’s ability to run its business. The Company’s success depends, to a large extent, on the continued service of its executive management team, operating offi cers and other key personnel. The Company must therefore continue to recruit, retain and motivate management and operating personnel suffi cient to maintain its current business and support its projected growth.
The Company’s inability to meet its staffi ng requirements in the future could adversely affect its results of operations.
Failure to protect the Company’s proprietary rights or the costs of protecting these rights could adversely affect its business. The Company’s success depends in part on its ability to obtain patents and licenses and to preserve other intellectual property rights covering its products and processes. The Company obtained certain domestic and foreign patents, and intends to continue to seek patents on its inventions when appropriate. The process of seeking patent protection can be time consuming and expensive. There can be no assurance that pending patents related to any of the Company’s products will be issued, in which case the Company may not be able to legally prevent others from producing similar and/or compatible competing products. If other companies were to sell similar and/or compatible products, the Company’s results of operations could be adversely affected. Furthermore, there can be no assurance that the Company’s efforts to protect its intellectual property will be successful. Any infringement of the Company’s intellectual property or legal defense of such action could have a material adverse effect on the Company.
The Company may need to raise additional capital to fund its operations. The Company’s management believes that, under current conditions, the Company’s current cash and cash equivalents, cash generated by operations, together with the borrowing availability under its revolving loan

12
agreement with Wachovia Bank, will be suffi cient to fund planned operations for the next twelve months. However, if the Company is unable to generate suffi cient cash from operations, it may be required to fi nd additional funding sources. If adequate fi nancing is unavailable or is unavailable on acceptable terms, the Company may be unable to maintain, develop or enhance its operations, products and services, take advantage of future opportunities or respond to competitive pressures.
The Company may not be able to maintain or to raise prices in response to infl ation and increasing costs.Future market and competitive pressures may prohibit the Company from raising prices to offset increased product costs, freight costs and other infl ationary items. The inability to pass these costs through to the Company’s customers could have a negative effect on its results of operations.
The Company is subject to intense competition in all of the markets in which it competes. The Company’s products are sold in highly competitive markets. The Company believes that the principal points of competition in these markets are product innovation, quality, price, merchandising, design and engineering capabilities, product development, timeliness and completeness of delivery, conformity to customer specifi cations and post-sale support. Competitive conditions may require the Company to match or better competitors’ prices to retain business or market shares. The Company believes that its competitive position will depend on continued investment in innovation and product development, manufacturing and sourcing, quality standards, marketing and customer service and support. The Company’s success will depend in part on its ability to anticipate and offer products that appeal to the changing needs and preferences of our customers in the various market categories in which it competes. The Company may not have suffi cient resources to make the investments that may be necessary to anticipate those changing needs and the Company may not anticipate, identify, develop and market products successfully or otherwise be successful in maintaining its competitive position. There are no signifi cant barriers to entry into the markets for most of the Company’s products.
Product liability claims or regulatory actions could adversely affect the Company’s fi nancial results and reputation.Claims for losses or injuries allegedly caused by some of the Company’s products arise in the ordinary course of its business. In addition to the risk of substantial monetary judgments, product liability claims or regulatory actions could result in negative publicity that could harm the Company’s reputation in the marketplace or the value of its brands. The Company also could be required to recall possible defective products, which could result in adverse publicity and signifi cant expenses. Although the Company maintains product liability insurance coverage, potential product liability claims are subject to a deductible or could be excluded under the terms of the policy.
The Company’s business is subject to risks associated with seasonality which could adversely affect its cash fl ow, fi nancial condition, or results of operations.The Company’s business, historically, has experienced higher sales volume in the second and third quarters of the calendar year, when compared to the fi rst and fourth quarters. The Company is a major supplier of products related to the “back-to-school” season, which occurs principally during the months of May, June, July and August. If this typical seasonal increase in sales of certain portions of the Company’s product line does not materialize, the Company could experience a material adverse effect on its business, fi nancial condition and results of operations.
To compete successfully, the Company must develop and commercialize a continuing stream of innovative new products that create consumer demand.The Company’s long-term success in the current competitive environment depends on its ability to develop and commercialize a continuing stream of innovative new products that create and maintain consumer demand. The Company also faces the risk that its competitors will introduce innovative new products that compete with the Company’s products. The Company’s strategy includes increased investment in new product development and increased focus on innovation. There are, nevertheless, numerous uncertainties

13
inherent in successfully developing and commercializing innovative new products on a continuing basis, and new product launches may not provide expected growth results.
The Company is subject to environmental regulation and environmental risks. The Company is subject to national, state, provincial and/or local environmental laws and regulations that impose limitations and prohibitions on the discharge and emission of, and establish standards for the use, disposal and management of, certain materials and waste. These environmental laws and regulations also impose liability for the costs of investigating and cleaning up sites, and certain damages resulting from present and past spills, disposals, or other releases of hazardous substances or materials. Environmental laws and regulations can be complex and may change often. Capital and operating expenses required to comply with environmental laws and regulations can be signifi cant, and violations may result in substantial fi nes and penalties. In addition, environmental laws and regulations, such as the Comprehensive Environmental Response, Compensation and Liability Act, or CERCLA, in the United States impose liability on several grounds for the investigation and cleanup of contaminated soil, ground water and buildings and for damages to natural resources on a wide range of properties. For example, contamination at properties formerly owned or operated by the Company, as well as at properties it will own and operate, and properties to which hazardous substances were sent by the Company, may result in liability for the Company under environmental laws and regulations. The costs of complying with environmental laws and regulations and any claims concerning noncompliance, or liability with respect to contamination in the future could have a material adverse effect on the Company’s fi nancial condition or results of operations. Refer to Note 16 – Sale of Property of the Notes to Consolidated Financial Statements for further discussion on the environmental costs related to the sale of property.
Item 1B. Unresolved Staff CommentsNot applicable to smaller reporting companies.
Item 2. PropertiesThe Company is headquartered at 60 Round Hill Road, Fairfi eld, Connecticut in 7,500 square feet of leased space. The Company owns and leases manufacturing and warehousing facilities in the United States totaling 205,000 square feet, and leases 44,000 square feet of warehousing space in Canada. The Company also leases approximately 2,000 square feet of offi ce space in Canada. Distribution for Europe is presently being conducted at a 35,000 square foot facility owned by the Company in Solingen, Germany. The Company also leases offi ce space in Hong Kong and Guangzhou, China.
Management believes that the Company’s facilities, whether leased or owned, are adequate to meet its current needs and should continue to be adequate for the foreseeable future.
Item 3. Legal ProceedingsThe Company is involved, from time to time, in disputes and other litigation in the ordinary course of business and may encounter other contingencies, which may include environmental and other matters. The Company presently believes that none of these matters, individually or in the aggregate, would be likely to have a material adverse impact on its fi nancial position, results of operations or liquidity.
Item 4. Reserved

14
PART II
Item 5. Market for Registrant’s Common Equity, Related Stockholder Matters and Issuer Purchases of Equity Securities.The Company’s Common Stock is traded on the NYSE Amex under the symbol “ACU”. The following table sets forth the high and low sale prices on the NYSE Amex for the Common Stock for the periods indicated:
High Low Dividends Declared
Year Ended December 31, 2009
Fourth Quarter $ 10.29 $ 8.11 $ 0.05
Third Quarter 9.30 7.82 0.05
Second Quarter 8.24 6.53 0.05
First Quarter 8.37 5.95 0.05
Year Ended December 31, 2008
Fourth Quarter $ 12.30 $ 5.33 $ 0.05
Third Quarter 14.10 12.10 0.05
Second Quarter 14.87 12.92 0.04
First Quarter 14.40 12.60 0.04
As of March 3, 2010 there were approximately 1,225 holders of record of the Company’s Common Stock.
Performance Graph
The graph compares the yearly cumulative total shareholder return on the Company’s Common Stock with the yearly cumulative total return of the following for the period 2005 to 2009: (a) the NYSE Amex Index and (b) a peer group of companies that, like the Company, (i) are currently listed on the NYSE Amex, and (ii) have a market capitalization of $30 million to $35 million.
The Company does not believe that it can reasonably identify a peer group of companies, on an industry or line-of-business basis, for the purpose of developing a comparative performance index. While the Company is aware that some other publicly-traded companies market products in the Company’s line-of-business, none of these other companies provide most or all of the products offered by the Company, and many offer products or services not offered by the Company. Moreover, some of these other companies that engage in the Company’s line-of-business do so through divisions or subsidiaries that are not publicly-traded. Furthermore, many of these other companies are substantially more highly capitalized than the Company. For these reasons, any such comparison would not, in the opinion of the Company, provide a meaningful index of comparative performance.

15
The comparisons in the graph below are based on historical data and are not indicative of, or intended to forecast, the possible future performance of the Company’s Common Stock.
Comparison of 5-Year Cumulative Total Return Among Acme United Corp., NYSE Amex Market Index and Peer Group Index
2004
100
50
150
Do
llars
2005 2006 2007 2008 2009
Acme United Corp. Peer Group IndexNYSE Amex Market Index
Assumes $100 invested on January 1, 2005
Assumes dividend reinvested
Fiscal year ending December 31, 2009
Issuer Purchases of Equity Securities
During 2009, the Company announced a Common Stock repurchase program of 200,000 shares. This program does not have an expiration date. During the twelve months ended December 31, 2009, the Company repurchased 205,509 shares of its Common Stock at an average price of $8.46, of which 154,335 were purchased under a previously announced program and 51,174 were purchased under the program announced in 2009. As of December 31, 2009, there were 148,826 shares that may be purchased under this repurchase program announced in 2009.
Set forth in the table below is certain information regarding purchases of Common Stock by the Company during the quarter ended December 31, 2009.
PeriodTotal Number of Shares Purchased
Average Price Paid per Share
Total Number of Shares Purchased
as Part of Publicly Announced Plans
or Programs
Maximum Number of Shares that
May Yet be Purchased Under these
Plans or Programs
October 1-31 — — — 249,335
November 1-30 100,509 $ 8.65 100,509 148,826
December 1-31 — — — 148,826

16
Item 6. Selected Financial Data
Five Year Summary of Selected Financial Data(All fi gures in thousands except per share data)
2009 2008 2007 2006 2005
Net sales $ 59,149 $ 68,719 $ 63,173 $ 56,863 $ 49,947
Net income $ 2,842 $ 4,467 $ 4,022 $ 3,886 $ 2,937
Total assets $ 42,309 $ 45,424 $ 42,222 $ 35,021 $ 28,194
Long-term debt, less current portion $ 9,154 $ 11,749 $ 10,187 $ 10,218 $ 5,577
Net income
Per share (Basic) $ 0.86 $ 1.28 $ 1.14 $ 1.11 $ 0.84
Per share (Diluted) $ 0.85 $ 1.24 $ 1.09 $ 1.05 $ 0.78
Dividends per share $ 0.20 $ 0.18 $ 0.16 $ 0.12 $ 0.11
Item 7. Management’s Discussion and Analysis of Financial Condition and Results of Operations
Forward-Looking Information
The Company may from time to time make written or oral “forward-looking statements” including statements contained in this report and in other communications by the Company, which are made in good faith by the Company pursuant to the “safe harbor” provisions of the Private Securities Litigation Reform Act of 1995.
These forward-looking statements include statements of the Company’s plans, objectives, expectations, estimates and intentions, which are subject to change based on various important factors (some of which are beyond the Company’s control). The following factors, in addition to others not listed, could cause the Company’s actual results to differ materially from those expressed in forward looking statements: the strength of the domestic and local economies in which the Company conducts operations, the impact of current uncertainties in global economic conditions and the ongoing fi nancial crisis affecting the domestic and foreign banking system and fi nancial markets, including the impact on the Company’s suppliers and customers, changes in client needs and consumer spending habits, the impact of competition and technological change on the Company, the Company’s ability to manage its growth effectively, including its ability to successfully integrate any business which it might acquire, and currency fl uctuations. All forward-looking statements in this report are based upon information available to the Company on the date of this report. The Company undertakes no obligation to publicly update or revise any forward-looking statement, whether as a result of new information, future events, or otherwise, except as required by law.
Critical Accounting Policies
The following discussion and analysis of fi nancial condition and results of operations are based upon the Company’s consolidated fi nancial statements, which have been prepared in conformity with accounting principles generally accepted in the United States of America. The Company’s signifi cant accounting policies are more fully described in Note 2 of the Notes to Consolidated Financial Statements. Certain accounting estimates are particularly important to the understanding of the Company’s fi nancial position and results of operations and require the application of signifi cant judgment by the Company’s management or can be materially affected by changes from period to period in economic factors or conditions that are outside the control of management. The Company’s management uses their judgment to determine the appropriate assumptions to be used in the determination of certain estimates. Those estimates are based on historical operations, future business plans and projected fi nancial results, the terms of existing contracts, the observance
17
of trends in the industry, information provided by customers and information available from other outside sources, as appropriate. The following discusses the Company’s critical accounting policies and estimates.
Estimates. Operating results may be affected by certain accounting estimates. The most sensitive and signifi cant accounting estimates in the fi nancial statements relate to customer rebates, valuation allowances for deferred income tax assets, obsolete and slow moving inventories, potentially uncollectible accounts receivable, and accruals for income taxes. Although the Company’s management has used available information to make judgments on the appropriate estimates to account for the above matters, there can be no assurance that future events will not signifi cantly affect the estimated amounts related to these areas where estimates are required. However, historically, actual results have not been materially different than original estimates.
Revenue Recognition. The Company recognizes revenue from the sales of its products when ownership transfers to the customers, which occurs either at the time of shipment or upon delivery based upon contractual terms with the customer. The Company recognizes customer program costs, including rebates, cooperative advertising, slotting fees and other sales related discounts, as a reduction to sales.
Allowance for doubtful accounts. The Company provides an allowance for doubtful accounts based upon a review of outstanding accounts receivable, historical collection information and existing economic conditions. The allowance for doubtful accounts represents estimated uncollectible accounts receivables associated with potential customer defaults on contractual obligations, usually due to potential insolvencies. The allowance includes amounts for certain customers where a risk of default has been specifi cally identifi ed. In addition, the allowance includes a provision for customer defaults based on historical experience. The Company actively monitors its accounts receivable balances and its historical experience of annual accounts receivable write offs has been negligible.
Customer Rebates. Customer rebates and incentives are a common practice in the offi ce products industry. We incur customer rebate costs to obtain favorable product placement, to promote sell-through of products and to maintain competitive pricing. Customer rebate costs and incentives, including volume rebates, promotional funds, catalog allowances and slotting fees, are accounted for as a reduction to gross sales. These costs are recorded at the time of sale and are based on individual customer contracts. Management periodically reviews accruals for these rebates and allowances, and adjusts accruals when appropriate.
Obsolete and Slow Moving Inventory. Inventories are stated at the lower of cost, determined on the fi rst-in, fi rst-out method, or market. An allowance is established to adjust the cost of inventory to its net realizable value. Inventory allowances are recorded for obsolete or slow moving inventory based on assumptions about future demand and marketability of products, the impact of new product introductions and specifi c identifi cation of items, such as discontinued products. These estimates could vary signifi cantly from actual requirements if future economic conditions, customer inventory levels or competitive conditions differ from expectations.
Income Taxes. Deferred income tax liabilities or assets are established for temporary differences between fi nancial and tax reporting bases and are subsequently adjusted to refl ect changes in tax rates expected to be in effect when the temporary differences reverse. A valuation allowance is recorded to reduce deferred income tax assets to an amount that is more likely than not to be realized.
Intangible Assets. Intangible assets with fi nite useful lives are recorded at cost upon acquisition and amortized over the term of the related contract, if any, or useful life, as applicable. Intangible assets held by the Company with fi nite useful lives include patents and trademarks. The weighted average amortization period for intangible assets at December 31, 2009 was 14 years. The Company periodically reviews the values recorded for intangible assets to assess recoverability from future operations whenever events or changes in circumstances indicate that its carrying amount may not be recoverable. At December 31, 2009 and 2008, the Company assessed the recoverability of its long-lived assets and believed that there were no events or circumstances present that would that would require a test of recoverability on those assets. As a result, there was no impairment of the carrying amounts of such assets and no reduction in their estimated useful lives. The net book value of the Company’s intangible assets increased to $1,863,648 as of December 31, 2009, from $1,845,391 as of December 31, 2008.

18
Pension Obligation. The pension benefi t obligation is based on various assumptions used by third-party actuaries in calculating this amount. These assumptions include discount rates, expected return on plan assets, mortality rates and other factors. Revisions in assumptions and actual results that differ from the assumptions affect future expenses, cash funding requirements and obligations. Our funding policy is to fund the Plan in accordance with the Internal Revenue Code and regulations.
These assumptions are reviewed annually and updated as required. The Company has a frozen defi ned benefi t pension plan. Two assumptions, the discount rate and the expected return on plan assets, are important elements of expense and liability measurement.
We determine the discount rate used to measure plan liabilities as of the December 31 measurement date. The discount rate refl ects the current rate at which the associated liabilities could be effectively settled at the end of the year. In estimating this rate, we look at rates of return on fi xed-income investments of similar duration to the liabilities in the plan that receive high, investment grade ratings by recognized ratings agencies. Using these methodologies, we determined a discount rate of 5.06% to be appropriate as of December 31, 2009, which is a decrease of 1.13 percentage points from the rate used as of December 31, 2008. An increase of 1.0% in the discount rate would have decreased our plan liabilities as of December 31, 2009 by $0.2 million.
The expected long-term rate of return on assets considers the Company’s historical results and projected returns for similar allocations among asset classes. In accordance with generally accepted accounting principles, actual results that differ from the Company’s assumptions are accumulated and amortized over future periods and, therefore, affect expense and obligation in future periods. For the U.S. pension plan, our assumption for the expected return on plan assets was 8.25% for 2009. For more information concerning these costs and obligations, see the discussion in Note 6 – Pension and Profi t Sharing, in the Notes to the Company’s Consolidated Financial Statements.
Accounting for Stock-Based Compensation. Stock based compensation cost is measured at the grant date fair value of the award and is recognized as expense over the requisite service period. The Company uses the Black-Scholes option – pricing model to determine fair value of the awards, which involves certain subjective assumptions. These assumptions include estimating the length of time employees will retain their vested stock options before exercising them (“expected term”), the estimated volatility of the Company’s common stock price over the expected term (“volatility”) and the number of options for which vesting requirements will not be completed (“forfeitures”). Changes in the subjective assumptions can materially affect estimates of fair value stock-based compensation, and the related amount recognized on the consolidated statements of operations. Refer to Note 11 “Stock Option Plans” in the Notes to Consolidated Financial Statements in this report for a more detailed discussion.
Results of Operations 2009 Compared with 2008
Net Sales
Net sales decreased by $9,570,465 or 13.9% (17% in constant currency) in 2009 to $59,148,547 compared to $68,719,012 in 2008. The U.S. segment sales decreased by $8,640,000 or 16.1% in 2009 compared to 2008. Sales in Canada declined by $1,062,000 or 13.1% (6% in local currency) in 2009 compared to 2008. European sales increased by $131,000 or 2% in U.S. dollars (8% in local currency) in 2009 compared to 2008.
The declines in net sales for the twelve months ended December 31, 2009 in the U.S. and Canadian segments were primarily due to a reduction in customer orders across all of our product lines as a result of the economic downturn. The increase in net sales in Europe for the twelve months ended December 31, 2009 was primarily due to an increase in sales of manicure products, which include scissors, clippers and other related items.

19
Gross Profi t
Gross profi t was 37% of net sales in 2009 compared to 40% of net sales in 2008. The gross margin decline for 2009 was primarily due to fi xed costs spread over lower sales, the weaker Canadian dollar, which raised the cost of our products in our Canadian operating segment, and a product mix which consisted of a higher proportion of sales of our lower cost, lower margin products.
Selling, General and Administrative
Selling, general and administrative expenses were $19,046,864 in 2009 compared with $20,778,093 in 2008, a decrease of $1,731,229 or 8.3%. SG&A expenses were 32% of net sales in 2009 compared to 30% in 2008. The decrease in SG&A expenses was primarily related to the result of cost cutting initiatives, lower freight and commission costs as a result of lower sales and a lower impact from foreign currency translation as a result of a weaker Euro and Canadian dollar.
Operating Income
Operating income was $3,026,623 in 2009, compared with $6,878,794 in 2008, a decrease of $3,852,171. Operating income in the U.S. segment declined by approximately $3,490,000. Operating income decreased in Canada by $371,000. The declines in operating income for 2009 in the U.S. and Canadian segments are principally due to the lower sales and associated gross profi ts partially offset by lower selling, general and administrative costs. The European operating loss remained relatively constant compared to 2008.
Interest Expense, Net
Net interest expense for 2009 was $25,674, compared with $395,548 for 2008, a decrease of $369,874. The decrease in interest expense, net was primarily the result of lower average interest rates under the Company’s bank revolving loan agreement combined with lower average borrowings. The Company also received $118,550 of interest income related to the mortgage it holds on the Bridgeport property which it sold in 2008. Refer to Note 16 – Sale of Property, in the Notes to the Company’s Consolidated Financial Statements for further details related to the Bridgeport property.
Other Income, Net
Net other income was $452,005 in 2009 compared to $192,855 in 2008. The increase in other income, net for 2009 was primarily related to a $460,000 benefi t recorded for the change in estimated costs associated with the remediation of the Bridgeport property. Net other income in 2008 included a gain of $265,000 related to the sale of our Bridgeport property. Refer to Note 16 – Sale of Property, in the Notes to the Company’s Consolidated Financial Statements for further details related to the Bridgeport property.
Income Tax
The effective tax rate in 2009 was 18%, compared to 33% in 2008. The decrease in the effective tax rate for the year ended December 31, 2009 was primarily the result of approximately $500,000 of tax savings related to the Company’s donation of medical products to AmeriCares and the donation of land to the City of Bridgeport, CT. This donation of land, which occurred in December 2009, consisted of waterfront property adjacent to the property the Company sold in December 2008. Without these credits, the effective tax rate would have been approximately 32% for the year ended December 31, 2009.
Off-Balance Sheet Transactions
The Company did not engage in any off-balance sheet transactions during 2009.

20
Liquidity and Capital Resources
During 2009, the Company experienced the effects of the continuing global economic crisis. Demand for the Company’s products softened and sales and earnings were negatively impacted. In response, management took strong actions to control costs. Entering 2010, management believes that the market for its products is improving as sales in the fourth quarter of 2009 increased 7% over the same period in 2008.
During 2009, working capital decreased by approximately $0.9 million compared to December 31, 2008. Inventory decreased by approximately $4.4 million principally due to the Company managing inventory levels to compensate for lower sales in the trailing twelve months ended December 31, 2009. Inventory turnover, calculated using a twelve month average inventory balance, decreased to 1.9 from 2.0 at December 31, 2008.
Receivables remained approximately the same at December 31, 2009 compared to December 31, 2008. The average number of days sales outstanding in accounts receivable was 61 days in 2009 compared to 64 days in 2008.
The Company’s working capital, current ratio and long-term debt to equity ratio follow:
2009 2008
Working Capital $ 28,952,754 $ 29,819,680
Current Ratio 5.26 4.38
Long-Term Debt to Equity Ratio 37.3% 44.2%
During 2009, total debt outstanding under the Company’s revolving credit facility, (referred to below) decreased by approximately $2.6 million compared to total debt at December 31, 2008. As of December 31, 2009, $9,154,000 was outstanding and $10,846,000 was available for borrowing under the revolving credit facility.
On January 26, 2010, the Company modifi ed its revolving loan agreement with Wachovia Bank; the amendments include (a) a decrease in the maximum borrowing amount from $20 million to $18 million; (b) an extension of the maturity date of the loan from June 30, 2010 to February 1, 2012; (c) an increase in the interest rate to LIBOR plus 2% (from LIBOR plus 7/8%) and (d) modifi cation of certain covenant restrictions. Funds borrowed under the Modifi ed Loan Agreement may be used for working capital, general operating expenses, share repurchases and certain other purposes.
Under the provisions of the Modifi ed Loan Agreement, the Company, among other things, is restricted with respect to outside borrowings, investments and mergers. Further, the Modifi ed Loan Agreement requires the Company to maintain specifi c amounts of tangible net worth, a specifi ed debt service coverage ratio and a fi xed charge coverage ratio. The Company was in compliance with all fi nancial covenants under the revolving loan agreement as of and through December 31, 2009, and believes it will be able to continue to comply with these covenants under the Modifi ed Loan Agreement for the remainder of the term of the credit facility.
Capital expenditures during 2009 and 2008 were $566,939 and $742,429, respectively, which were, in part, fi nanced with debt. Capital expenditures in 2010 are not expected to differ materially from recent years.
The Company believes that cash generated from operating activities, together with funds available under its current loan agreement, are expected, under current conditions, to be suffi cient to fi nance the Company’s planned operations for the next twelve months.

21
Recently Issued Accounting Standards
In June 2009, the Financial Accounting Standards Board (FASB) issued FASB Accounting Standards Codifi cation (ASC) 105, Generally Accepted Accounting Principles, which established the FASB Accounting Standards Codifi cation as the sole source of authoritative generally accepted accounting principles. Pursuant to the provisions of the FASB ASC 105, the Company has updated references to GAAP in its fi nancial statements. The adoption of FASB ASC 105 did not impact the Company’s fi nancial position or results of operations.
In April 2009, the FASB issued authoritative guidance requiring publicly traded companies to include certain fair value disclosures related to fi nancial instruments in their interim fi nancial statements. This guidance, which was incorporated into ASC Topic 825, “Financial Instruments,” was effective for interim periods ending after June 15, 2009. The adoption did not have a material impact on the Company’s consolidated fi nancial statements.
In May 2009, the FASB issued authoritative guidance establishing general standards of accounting for and disclosure of events that occur after the balance sheet date but before fi nancial statements are issued. This guidance, which was incorporated into ASC Topic 855, “Subsequent Events”, was effective for interim or annual fi nancial periods ending after June 15, 2009. The adoption did not have any impact on the Company’s consolidated fi nancial statements.
Item 7A. Quantitative and Qualitative Disclosure about Market RiskNot applicable to smaller reporting companies.

22
Item 8. Financial Statements and Supplementary Data
Acme United Corporation and SubsidiariesCONSOLIDATED STATEMENTS OF OPERATIONS
For the years ended December 31, 2009 2008
Net sales $ 59,148,547 $ 68,719,012
Cost of goods sold 37,075,060 41,062,125
Gross profi t 22,073,487 27,656,887
Selling, general and administrative expenses 19,046,864 20,778,093
Operating income 3,026,623 6,878,794
Non operating items:
Interest:
Interest expense (155,008) (497,308)
Interest income 129,334 101,760
Interest expense, net (25,674) (395,548)
Other income 452,005 192,855
Total other income (expense), net 426,331 (202,643)
Income before income tax expense 3,452,954 6,676,101
Income tax expense 610,867 2,209,030
Net income $ 2,842,087 $ 4,467,071
Earnings per share:
Basic $ 0.86 $ 1.28
Diluted $ 0.85 $ 1.24
See accompanying Notes to Consolidated Financial Statements.

23
Acme United Corporation and SubsidiariesCONSOLIDATED BALANCE SHEETS
December 31, 2009 December 31, 2008
Assets
Current assets:
Cash and cash equivalents $ 6,519,065 $ 5,224,564
Accounts receivable, less allowance 10,703,433 10,564,097
Inventories 17,400,270 21,769,304
Deferred income taxes 180,241 209,172
Prepaid expenses and other current assets 952,946 879,222
Total current assets 35,755,955 38,646,359
Property, plant and equipment:
Land 171,660 167,003
Buildings 2,558,572 2,515,641
Machinery and equipment 8,169,641 7,454,662
Total property, plant and equipment 10,899,873 10,137,306
Less: accumulated depreciation 8,811,705 7,867,863
Net property, plant and equipment 2,088,168 2,269,443
Note receivable 1,891,604 2,000,000
Intangible assets, less accumulated amortization 1,863,648 1,845,391
Deferred income taxes 621,270 574,051
Other assets 88,828 88,828
Total assets $ 42,309,473 $ 45,424,072
Liabilities
Current liabilities:
Accounts payable $ 3,546,139 $ 3,668,689
Other accrued liabilities 3,257,062 5,157,990
Total current liabilities 6,803,201 8,826,679
Long-term debt 9,154,000 11,719,000
Other 1,811,022 1,990,730
Total liabilities 17,768,223 22,536,409
Stockholders’ Equity
Common stock, par value $2.50: authorized 8,000,000 shares; issued – 4,313,024 shares in 2009 and 4,293,024 shares in 2008, including treasury stock 10,782,555 10,732,555
Treasury stock, at cost, 1,155,165 shares in 2009 and 949,656 shares in 2008 (10,144,325) (8,406,722)
Additional paid-in capital 4,208,112 3,906,000
Accumulated other comprehensive loss (812,970) (1,663,361)
Retained earnings 20,507,878 18,319,191
Total stockholders’ equity 24,541,250 22,887,663
Total liabilities and stockholders’ equity $ 42,309,473 $ 45,424,072
See accompanying Notes to Consolidated Financial Statements.

24
Acme United Corporation and SubsidiariesCONSOLIDATED STATEMENTS OF CHANGES IN STOCKHOLDERS’ EQUITY
OutstandingShares ofCommon
StockCommon
StockTreasury
Stock
Additional Paid-InCapital
Accumulated Other
Comprehensive Income (Loss)
RetainedEarnings Total
Balances, December 31, 2007 3,552,883 $ 10,668,185 $ (5,929,999) $ 3,550,053 $ 285,842 $ 14,472,662 $ 23,046,743
Net income 4,467,071 4,467,071
Translation adjustment (1,309,018) (1,309,018)
Change in pension plan net prior service credit and actuarial losses, net of tax benefi t of $373,575 (640,185) (640,185)
Comprehensive income 2,517,868
Stock compensation expense 277,577 277,577
Tax benefi t from exercise of employee stock options 9,928 9,928
Distribution to shareholders (620,542) (620,542)
Issuance of common stock 25,750 64,370 68,443 132,813
Purchase of treasury stock (235,265) (2,476,723) (2,476,723)
Balances, December 31, 2008 3,343,368 10,732,555 (8,406,722) 3,906,000 (1,663,361) 18,319,191 22,887,663
Net income 2,842,087 2,842,087
Translation adjustment 709,421 709,421
Change in pension plan net prior service credit and actuarial losses, net of tax of $82,218 140,970 140,970
Comprehensive income 3,692,478
Stock compensation expense 308,337 308,337
Distribution to shareholders (653,400) (653,400)
Issuance of common stock 20,000 50,000 (6,225) 43,775
Purchase of treasury stock (205,509) (1,737,603) (1,737,603)
Balances, December 31, 2009 3,157,859 $ 10,782,555 $ (10,144,325) $ 4,208,112 $ (812,970) $ 20,507,878 $ 24,541,250
See accompanying Notes to Consolidated Financial Statements.

25
Acme United Corporation and SubsidiariesCONSOLIDATED STATEMENTS OF CASH FLOW
For the years ended December 31, 2009 2008
Operating activities:
Net income $ 2,842,087 $ 4,467,071
Adjustments to reconcile net income to net cash provided by operating activities
Depreciation 803,902 899,142
Amortization 113,987 108,828
Stock compensation expense 308,337 277,577
Deferred income taxes (280,188) (213,353)
Change in estimated cost of environmental remediation (457,379) —
Gain on disposal of property, plant and equipment — (260,984)
Tax benefi t on exercise of stock options — 9,928
Changes in operating assets and liabilities
Accounts receivable 49,438 1,842,262
Inventories 4,668,500 (3,473,436)
Prepaid expenses and other current assets 43,310 254,127
Accounts payable (149,341) (854,450)
Other accrued liabilities (1,361,210) 208,919
Total adjustments 3,739,356 (1,201,439)
Net cash provided by operating activities 6,581,443 3,265,632
Investing activities:
Purchase of property, plant and equipment (566,939) (742,429)
Purchase of patents and trademarks (132,244) (295,339)
Net cash used by investing activities (699,183) (1,037,767)
Financing activities:
Net (repayments) borrowings of long-term debt (2,565,000) 1,568,825
Distributions to shareholders (662,547) (594,631)
Purchase of treasury stock (1,737,603) (2,476,723)
Issuance of common stock 43,775 132,813
Net cash used by fi nancing activities (4,921,375) (1,369,716)
Effect of exchange rate changes 333,616 (621,574)
Net change in cash and cash equivalents 1,294,501 236,573
Cash and cash equivalents at beginning of year 5,224,564 4,987,991
Cash and cash equivalents at end of year $ 6,519,065 $ 5,224,564
Supplemental cash fl ow information
Cash paid for income taxes $ 1,334,358 $ 1,700,324
Cash paid for interest expense $ 165,092 $ 495,113
See accompanying Notes to Consolidated Financial Statements.

26
Acme United Corporation and Subsidiaries
NOTES TO CONSOLIDATED FINANCIAL STATEMENTS
1. Operations
The operations of Acme United Corporation (the “Company”) consist of three reportable segments. The operations of the Company are structured and evaluated based on geographic location. The three reportable segments operate in the United States (including Asian operations), Canada and Germany. Principal products across all segments are scissors, shears, knives, rulers, pencil sharpeners, fi rst aid kits, and related products which are sold primarily to wholesale, contract and retail stationery distributors, offi ce supply super stores, school supply distributors, drug store retailers, industrial distributors, wholesale fl orists, mass market retailers and hardware chains.
2. Accounting Policies
Estimates – The preparation of fi nancial statements in conformity with accounting principles generally accepted in the United States requires management to make estimates and assumptions that affect the reported amounts of assets and liabilities and the disclosure of contingent assets and liabilities at the date of the fi nancial statements and the reported amounts of revenues and expenses during the reporting period. The most sensitive and signifi cant accounting estimates relate to customer rebates, valuation allowances for deferred income tax assets, obsolete and slow-moving inventories, potentially uncollectible accounts receivable and accruals for income taxes. Actual results could differ from those estimates.
Principles of Consolidation – The consolidated fi nancial statements include the accounts of the Company and its subsidiaries, all of which are wholly owned by the Company. All signifi cant intercompany accounts and transactions are eliminated in consolidation.
Translation of Foreign Currency – For foreign operations, assets and liabilities are translated at rates in effect at the end of the year; revenues and expenses are translated at average rates in effect during the year. Resulting translation adjustments are made directly to accumulated other comprehensive loss. Foreign currency transaction gains and losses are recognized in operating results. Foreign currency transaction losses, which are included in other income, net, were $35,519 in 2009 and $101,355 in 2008.
Cash Equivalents – Investments with an original maturity of three months or less at the date of purchase are considered cash equivalents.
Accounts Receivable – Accounts receivable are shown less an allowance for doubtful accounts of $71,629 in 2009 and $64,105 in 2008.
Inventories – Inventories are stated at the lower of cost, determined by the fi rst-in, fi rst-out method, or market.
Property, Plant and Equipment and Depreciation – Property, plant and equipment is recorded at cost. Depreciation is computed by the straight-line method over the estimated useful lives of the assets, which range from 3 to 30 years.
Intangible Assets– Intangible assets with fi nite useful lives are recorded at cost upon acquisition, and amortized over the term of the related contract or useful life, as applicable. Intangible assets held by the Company with fi nite useful lives include patents and trademarks. Patents and trademarks are amortized over their estimated useful lives. The weighted average amortization period for intangible assets at December 31, 2009 was 14 years. The Company periodically reviews the values recorded for intangible assets to assess recoverability from future operations whenever events or changes in circumstances indicate that their carrying amounts may not be recoverable. At December 31, 2009 and 2008, the Company assessed the recoverability of its long-lived assets and believed that there were no events or circumstances present that would that would require a test of recoverability on those assets. As a result, there was no impairment of the carrying amounts of such assets and no reduction in their estimated useful lives.

27
Deferred Income Taxes – Deferred income taxes are provided for the differences between the fi nancial statement and tax bases of assets and liabilities, and on operating loss carryovers, using tax rates in effect in years in which the differences are expected to reverse.
Revenue Recognition – The Company recognizes revenue from the sales of its products when ownership transfers to the customers, which occurs either at the time of shipment or upon delivery based upon contractual terms with the customer. The Company recognizes customer program costs, including rebates, cooperative advertising, slotting fees and other sales related discounts, as a reduction to sales.
Research and Development – Research and development costs ($440,378 in 2009 and $529,685 in 2008) are expensed as incurred.
Shipping Costs – Shipping costs ($2,529,743 in 2009 and $3,073,673 in 2008) are included in selling, general and administrative expenses.
Advertising Costs – The Company expenses the production costs of advertising the fi rst time that the related advertising takes place. Advertising costs ($1,066,860 in 2009 and $1,159,462 in 2008) are included in selling, general and administrative expenses.
Subsequent events – The Company has evaluated events and transactions subsequent to December 31, 2009 through the date our consolidated fi nancial statements were included in this Form 10-K and fi led with the SEC.
Concentrations – The Company performs ongoing credit evaluations of its customers and generally does not require collateral for the extension of credit. Allowances for credit losses are provided and have been within management’s expectations. In 2009, with respect to concentration risk related to accounts receivable, the Company had one customer that accounted for greater than 10% of total net receivables. In 2009 the Company had one customer with net sales exceeding 10% of consolidated net sales and three customers in 2008 with net sales to each that exceeded 10% of consolidated sales in those years. The approximate percentage of consolidated net sales to these customers respectively was 20% in 2009 and 19%, 12% and 10% in 2008.
3. Inventories
Inventories consist of: 2009 2008
Finished goods $ 16,337,034 $ 20,824,717
Work in process 97,297 21,151
Materials and supplies 965,939 923,436
$ 17,400,270 $ 21,769,304
Inventories are stated net of valuation allowances for slow moving and obsolete inventory of $421,685 as of December 31, 2009 and $498,887 as of December 31, 2008.
4. Intangible Assets
Intangible assets consist of: 2009 2008
Patents $ 1,695,881 $ 1,577,580
Trademarks 534,058 520,115
2,229,939 2,097,695
Accumulated amortization 366,291 252,304
$ 1,863,648 $ 1,845,391
Amortization expense for patents and trademarks for the years ended December 31, 2009, and 2008 were $113,987 and $108,828, respectively. The estimated aggregate amortization expense for each of the next fi ve succeeding years, calculated on a similar basis, is as follows: 2010 – $114,870; 2011 – $113,768; 2012 – $112,312; 2013 – $112,172; and 2014 – $100,406.

28
5. Other Accrued Liabilities
Other current and long-term accrued liabilities consist of: 2009 2008
Customer rebates $ 2,489,410 $ 2,506,807
Remediation liability 681,444 1,724,000
Pension liability 1,308,655 1,380,890
Other 588,575 1,537,022
$ 5,068,084 $ 7,148,720
The decline in other accrued liabilities is primarily related to a decrease in income taxes payable.
6. Pension and Profi t Sharing
United States employees, hired prior to July 1, 1993, are covered by a funded, defi ned benefi t pension plan. The benefi ts of this pension plan are based on years of service and the average compensation of the highest three consecutive years during the last ten years of employment. In December 1995, the Company’s Board of Directors approved an amendment to the United States pension plan that terminated all future benefi t accruals as of February 1, 1996, without terminating the pension plan.
The Company’s funding policy with respect to its qualifi ed plan is to contribute at least the minimum amount required by applicable laws and regulations. In 2009, the Company contributed $107,740 to the plan and expects to contribute approximately $265,000 during 2010.
The plan asset weighted average allocation at December 31, 2009 and December 31, 2008, by asset category, were as follows:
Asset Category 2009 2008
Equity Securities 70% 67%
Fixed Income Securities 30% 30%
Other Securities / Investments 0% 3%
Total 100% 100%
The Company’s investment policy for the pension plan is to minimize risk by balancing investments between equity securities and fi xed income securities, utilizing a weighted average approach of 65% equity securities, 30% fi xed income securities, and 5% cash investments. Plan funds are invested in long-term obligations with a history of moderate to low risk.
As of each December 31, 2009 and 2008, equity securities in the pension plan included 10,000 shares of the Company’s Common Stock, having a market value of $91,993 and $70,500, respectively.
The pension plan asset information included below is presented at fair value. ASC 820 establishes a framework for measuring fair value and requires disclosures about assets and liabilities measured at fair value. The fair value hierarchy prioritizes the inputs to valuation techniques used to measure fair value into three levels as follows:
• Level 1 – Inputs to the valuation methodology based on unadjusted quoted market prices in active markets that are accessible at the measurement date.
• Level 2 – Inputs to the valuation methodology that include quoted market prices that are not considered to be active or fi nancial instruments for which all signifi cant inputs are observable, either directly or indirectly.
• Level 3 – Inputs to the valuation methodology are unobservable and signifi cant to the fair value measurement.

29
The following table presents the pension plan assets by level within the fair value hierarchy as of December 31, 2009.
Level 1 Level 2 Level 3 Total
Money market fund $ 9,595 — — $ 9,595
Acme United common stock 91,993 — — 91,993
Equity common and collected funds — 779,225 — 779,225
Fixed income common and collected funds — 365,728 — 365,728
Total $ 101,588 $ 1,144,953 $ — $ 1,246,541
Other disclosures related to the pension plan follow:
2009 2008
Assumptions used to determine benefi t obligation:
Discount rate 5.06% 6.19%
Changes in benefi t obligation:
Benefi t obligation at beginning of year $ (2,641,926) $ (2,919,276)
Interest cost (151,990) (175,481)
Service cost (25,000) (25,000)
Amendment — (6,508)
Actuarial loss (99,923) (159,484)
Benefi ts and plan expenses paid 363,643 643,823
Benefi t obligation at end of year (2,555,196) (2,641,926)
Changes in plan assets:
Fair value of plan assets at beginning of year 1,261,036 2,632,142
Actual return on plan assets 241,408 (727,283)
Employer contribution 107,740 —
Benefi ts and plan expenses paid (363,643) (643,823)
Fair value of plan assets at end of year 1,246,541 1,261,036
Funded status $ (1,308,655) $ (1,380,890)
Accrued benefi ts costs are included in other accrued liabilities (non-current).
2009 2008
Assumptions used to determine net periodic benefi t cost:
Discount rate 6.19% 6.25%
Expected return on plan assets 8.25% 8.25%
Components of net benefi t expense:
Interest cost $ 151,990 $ 175,481
Service cost 25,000 25,000
Expected return on plan assets (94,951) (202,570)
Amortization of prior service costs 9,154 8,612
Amortization of actuarial loss 167,500 71,310
Net periodic benefi t cost $ 258,693 $ 77,833
30
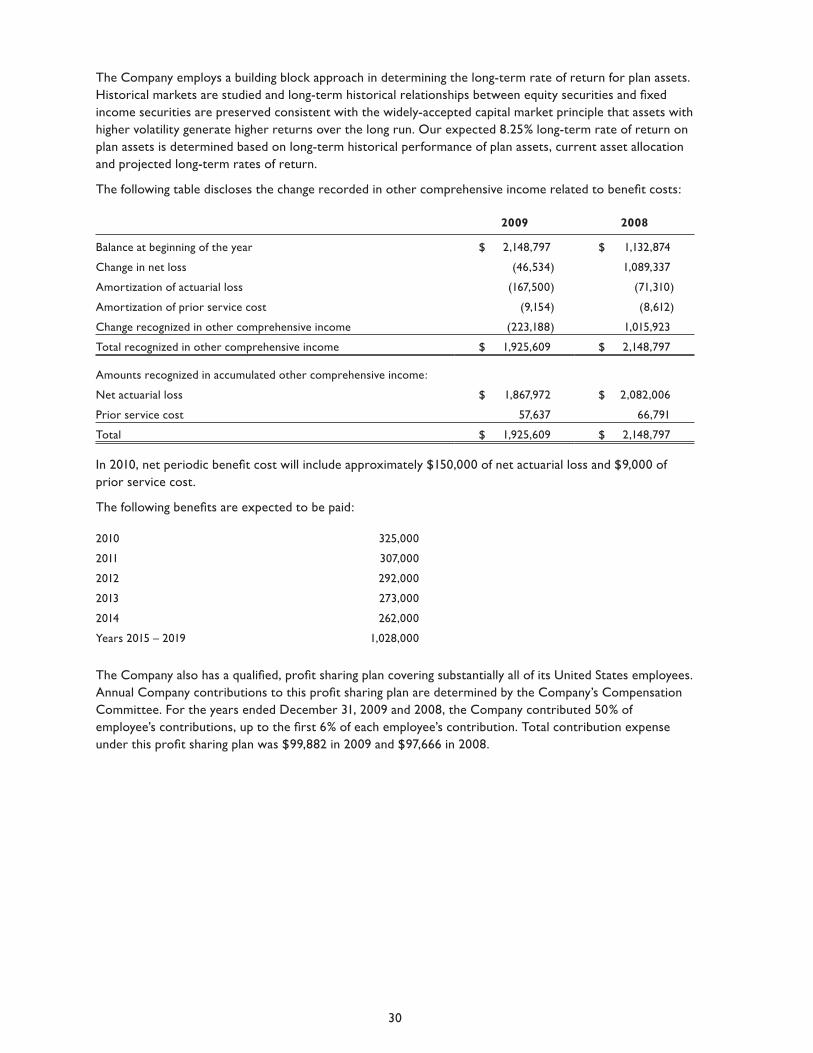
The Company employs a building block approach in determining the long-term rate of return for plan assets. Historical markets are studied and long-term historical relationships between equity securities and fi xed income securities are preserved consistent with the widely-accepted capital market principle that assets with higher volatility generate higher returns over the long run. Our expected 8.25% long-term rate of return on plan assets is determined based on long-term historical performance of plan assets, current asset allocation and projected long-term rates of return.
The following table discloses the change recorded in other comprehensive income related to benefi t costs:
2009 2008
Balance at beginning of the year $ 2,148,797 $ 1,132,874
Change in net loss (46,534) 1,089,337
Amortization of actuarial loss (167,500) (71,310)
Amortization of prior service cost (9,154) (8,612)
Change recognized in other comprehensive income (223,188) 1,015,923
Total recognized in other comprehensive income $ 1,925,609 $ 2,148,797
Amounts recognized in accumulated other comprehensive income:
Net actuarial loss $ 1,867,972 $ 2,082,006
Prior service cost 57,637 66,791
Total $ 1,925,609 $ 2,148,797
In 2010, net periodic benefi t cost will include approximately $150,000 of net actuarial loss and $9,000 of prior service cost.
The following benefi ts are expected to be paid:
2010 325,000
2011 307,000
2012 292,000
2013 273,000
2014 262,000
Years 2015 – 2019 1,028,000
The Company also has a qualifi ed, profi t sharing plan covering substantially all of its United States employees. Annual Company contributions to this profi t sharing plan are determined by the Company’s Compensation Committee. For the years ended December 31, 2009 and 2008, the Company contributed 50% of employee’s contributions, up to the fi rst 6% of each employee’s contribution. Total contribution expense under this profi t sharing plan was $99,882 in 2009 and $97,666 in 2008.

31
7. Income Taxes
The amounts of income tax expense (benefi t) refl ected in operations follow:
2009 2008
Current:
Federal $ 246,910 $ 1,403,689
State 28,055 216,310
Foreign 630,500 813,298
905,465 2,433,307
Deferred:
Federal (257,441) (200,126)
State (22,747) (12,911)
Foreign (14,410) (11,240)
(294,598) (224,277)
$ 610,867 $ 2,209,030
The current state tax provision was comprised of taxes on income, the minimum capital tax and other franchise taxes related to the jurisdictions in which the Company’s facilities are located.
A summary of United States and foreign income before income taxes follows:
2009 2008
United States $ 814,582 $ 3,373,597
Foreign 2,638,372 3,302,504
$ 3,452,954 $ 6,676,101
The following schedule reconciles the amounts of income taxes computed at the United States statutory rates to the actual amounts reported in operations.
2009 2008
Federal income taxes at 34% statutory rate $ 1,174,004 $ 2,269,874
State and local taxes, net of federal income tax effect 3,503 135,059
Permanent items 39,505 255,332
Charitable donations (345,009) —
Foreign tax rate difference (494,861) (175,726)
(Recognition) Non-recognition of foreign tax loss carryforwards and credits 233,815 (275,509)
Provision for income taxes $ 610,867 $ 2,209,030

32
The following summarizes deferred income tax assets and liabilities:
2009 2008
Deferred income tax liabilities:
Property, plant, and equipment $ 356,726 $ 203,727
356,726 203,727
Deferred income tax assets:
Asset valuations 122,921 209,172
Contribution carryforward 373,925 —
Operating loss carryforwards and credits 1,850,929 1,617,114
Pension 576,114 561,964
Foreign tax credit 142,000 242,000
Other 85,277 115,814
3,151,166 2,746,064
Net deferred income tax asset before valuation allowance 2,794,440 2,542,337
Valuation allowance (1,992,929) (1,759,114)
Net deferred income tax asset $ 801,511 $ 783,223
In 2009, the Company evaluated its tax positions, for years which remain subject to examination by major tax jurisdictions, in accordance with the requirements of ASC 740 and as a result concluded no adjustment was necessary. The Company fi les income tax returns in the U.S. federal jurisdiction, and various state and foreign jurisdictions. The Company’s evaluation of uncertain tax positions was performed for the tax years ended December 31, 2006 and forward, the tax years which remain subject to examination by major tax jurisdictions as of December 31, 2009.
In accordance with the Company’s accounting policies, any interest and penalties related to uncertain tax positions are recognized as a component of income tax expense.
The Company provides deferred income taxes on foreign subsidiary earnings, which are not considered permanently reinvested. Earnings permanently reinvested would become taxable upon the sale or liquidation of a foreign subsidiary or upon the remittance of dividends. During 2009, the Company repatriated $1,000,000 of foreign earnings from its Canadian subsidiary. U.S. income taxes on those repatriated earnings have been offset by foreign tax credits. The Company plans to continue to repatriate future earnings of its Canadian subsidiary and will provide for U.S. income taxes accordingly. Foreign subsidiary earnings of $7,220,529 and $5,729,313 are considered permanently reinvested as of December 31, 2009 and 2008, respectively, and no deferred income taxes have been provided on these foreign earnings.
Due to the uncertain nature of the realization of the Company’s deferred income tax assets based on past performance and carry forward expiration dates, the Company has recorded a valuation allowance for the amount of deferred income tax assets which are not expected to be realized. This valuation allowance is subject to periodic review, and if the allowance is reduced, the tax benefi t will be recorded in future operations as a reduction of the Company’s tax expense.
At December 31, 2009, the Company has tax operating loss carry forwards aggregating $6,078,072, all of which are applicable to Germany, and can be carried forward indefi nitely.

33
8. Debt
Long term debt consists of borrowings under the Company’s revolving loan agreement with Wachovia Bank. As of December 31, 2009, $9,154,000 was outstanding and $10,846,000 was available for borrowing under the Company’s revolving loan agreement.
Under the revolving loan agreement, the Company is required to maintain specifi c amounts of tangible net worth, a specifi ed debt service coverage ratio, and a fi xed charge coverage ratio. The Company was in compliance with these fi nancial covenants at December 31, 2009.
On January 26, 2010, the Company modifi ed its revolving loan agreement with Wachovia Bank to amend certain provisions of the original agreement. The amendments include (a) a decrease in the maximum borrowing amount from $20 million to $18 million; (b) an extension of the maturity date of the loan from June 30, 2010 to February 1, 2012; (c) an increase in the interest rate to LIBOR plus 2% (from LIBOR plus 7/8%) and (d) modifi cation of certain covenant restrictions. This Modifi ed Loan Agreement continues to be secured by the assets of the U.S. parent company. Funds borrowed under the Modifi ed Loan Agreement may be used for working capital, general operating expenses, share repurchases and certain other purposes.
9. Commitments and Contingencies
The Company leases certain offi ce, manufacturing and warehouse facilities and various equipment under non-cancelable operating leases. Total rent expense was $668,297 and $643,162 in 2009 and 2008. Minimum annual rental commitments under non-cancelable leases with remaining terms of one year or more as of December 31, 2009: 2010 – $578,632; 2011 – $124,000; 2012 – $43,297; and 2013 – $30,642.
The Company is involved, from time to time, in disputes and other litigation in the ordinary course of business, including certain environmental and other matters. The Company presently believes that none of these matters, individually or in the aggregate, would be likely to have a material adverse effect on fi nancial position, results of operations, or liquidity of the Company.
10. Segment Information
The Company reports fi nancial information based on the organizational structure used by management for making operating and investment decisions and for assessing performance. The Company’s reportable business segments include (1) United States; (2) Canada and (3) Europe. The fi nancial results of the Company’s Asian operations have been aggregated with the results of its United States operations to form one reportable segment called the “United States segment”. Each reportable segment derives its revenue from the sales of cutting devices, measuring instruments and safety products for school, offi ce, home, hardware and industrial use.
The Chief Operating Decision Maker evaluates the performance of each operating segment based on segment revenues and operating income. Segment revenues are defi ned as total revenues, including both external customer revenue and intersegment revenue. Segment operating earnings are defi ned as segment revenues, less cost of goods sold and operating expenses. Identifi able assets by segment are those assets used in the respective reportable segment’s operations. Intersegment amounts are eliminated to arrive at consolidated fi nancial results.

34
Financial data by segment:
(000’s omitted) United States Canada Europe Consolidated
2009
Sales to unaffi liated customers $ 44,908 $ 7,033 $ 7,207 $ 59,149
Operating income 3,158 416 (547) 3,027
Assets 31,377 5,606 5,326 42,309
Additions to property, plant and equipment 534 14 20 567
Depreciation and amortization 771 62 85 918
2008
Sales to unaffi liated customers $ 53,548 $ 8,095 $ 7,076 $ 68,719
Operating income 6,648 787 (556) 6,879
Assets 33,719 5,890 5,815 45,424
Additions to property, plant and equipment 656 49 37 742
Depreciation and amortization 856 65 87 1,008
The following is a reconciliation of segment operating income to consolidated income before taxes:
2009 2008
Total operating income $ 3,027 $ 6,879
Interest (income) expense, net 26 395
Other income (expense), net 452 193
Consolidated income before taxes 3,453 6,677
Net income $ 2,842 $ 4,467
11. Stock Option Plans
The Company has two stock option plans: (1) the 2002 Employee Stock Option Plan, as amended (the “Employee Plan”) and (2) the 2005 Non-Salaried Director Stock Option Plan (the “Director Plan”).
The Employee Plan provides for the issuance of incentive and nonqualifi ed stock options at an exercise price equal to the fair market value of the Common Stock on the date the option is granted. The terms of the options granted are subject to the provisions of the Employee Plan. Options granted under the Employee Plan vest 25% one day after the fi rst anniversary of the grant date and 25% one day after each of the next three anniversaries. As of December 31, 2009, the number of shares available for grant under the Employee Plan was 72,438.
The Director Plan provides for the issuance of stock options for up to 50,000 shares of the Company’s common stock to non-salaried directors. Under the Director Plan, Directors elected on April 25, 2005 and at subsequent Annual Meetings who have not received any prior grant under this or previous plans receive an initial grant of an option to purchase 5,000 shares of Common Stock (the “Initial Option”). Each year, each elected Director not receiving an Initial Option will receive a 2,500 share option (the “Annual Option”). The Initial Option vests 25% on the date of grant and 25% on the anniversary of the grant date in each of the following 3 years. Each Annual Option becomes fully exercisable one day after the date of grant. The exercise price of all options granted equals the fair market value of the Common Stock on the date the option is granted and expires ten (10) years from the date of grant. As of December 31, 2009, the number of shares available for grant under the Director Plan was 26,500.

35
A summary of changes in options issued under the Company’s stock option plans follows:
2009
2008
Options outstanding at the beginning of the year 608,500 565,750
Options granted 151,000 80,500
Options forfeited (17,000) (12,000)
Options exercised (20,000) (25,750)
Options outstanding at the end of the year 722,500 608,500
Options exercisable at the end of the year 482,125 439,688
Common stock available for future grants at the end of the year 98,938 82,938
Weighted average price of options:
Granted $ 7.84 $ 13.24
Forfeited 15.36 14.64
Exercised 2.19 5.19
Outstanding 9.96 10.38
Exercisable 9.62 8.91
A summary of options outstanding at December 31, 2009 is as follows:
Options Outstanding Options Exercisable
Range of Exercise Prices
Number Outstanding
Weighted-Average
Remaining Contractual Life
(Years)
Weighted-Average Exercise
PriceNumber
Exercisable
Weighted-Average Exercise
Price
$1.25 to $2.49 20,300 <1 $ 1.90 20,300 $ 1.90
$2.50 to $3.65 125,200 3 3.10 125,200 3.10
$3.66 to $5.00 53,750 3 3.99 53,750 3.99
$5.01 to $7.99 159,000 7 7.71 24,000 6.67
$8.00 to $17.02 364,250 7 14.62 258,875 14.83
722,500 482,125
The weighted average remaining contractual life of all outstanding stock options is 6 years.
Stock Based CompensationStock-based compensation cost is measured at the grant date based on the fair value of the award and is recognized as expense over the requisite service period, which is generally the vesting period. The Company uses the Black-Scholes option pricing model to determine the fair value of employee and non-employee director stock options. The determination of the fair value of stock-based payment awards on the date of grant, using an option-pricing model, is affected by the Company’s stock price as well as assumptions regarding a number of complex and subjective variables. These assumptions include estimating the length of time employees will retain their vested stock options before exercising them (“expected term”), the estimated volatility of the Company’s common stock price over the expected term (“volatility”) and the number of options that will not fully vest in accordance with applicable vesting requirements (“forfeitures”).
The Company estimates the expected term of options granted by evaluating various factors, including the vesting period, historical employee information, as well as current and historical stock prices and market conditions. The Company estimates the volatility of its common stock by calculating historical volatility based on the closing stock price on the last day of each of the 60 months leading up to the month the option was

36
granted. The risk-free interest rate that the Company uses in the option valuation model is the interest rate on U.S. Treasury zero-coupon bond issues with remaining terms similar to the expected term of the options granted. Historical information was the basis for calculating the dividend yield. The Company is required to estimate forfeitures at the time of grant and to revise those estimates in subsequent periods if actual forfeitures differ from those estimates. The Company used a mix of historical data and future assumptions to estimate pre-vesting option forfeitures and to record stock-based compensation expense only for those awards that are expected to vest. All stock-based payment awards are amortized over the requisite service periods of the awards, which are generally the vesting periods.
The assumptions used to value option grants for the twelve months ended December 31, 2009 and December 31, 2008 were as follows:
2009 2008
Expected life in years 5 5
Interest rate 1.82 – 2.95% 2.95 – 3.30%
Volatility 0.38 – 0.39 0.28 – 0.31
Dividend yield 2.50% 1.17 – 1.20%
Total stock-based compensation recognized in the Company’s consolidated statement of operations for the years ended December 31, 2009 and 2008 was $308,377 and $277,577, respectively. As of December 31, 2009, there was approximately $528,815 of unrecognized compensation cost, adjusted for estimated forfeitures, related to non-vested stock-based payments granted to the Company’s employees. As of December 31, 2009, the remaining unamortized expense is expected to be recognized over a weighted average period of 3 years.
The weighted average fair value at the date of grant for options granted during 2009 and 2008 was $2.34 and $3.66 per option, respectively. The aggregate intrinsic value of outstanding options was $1,428,174 at December 31, 2009. The aggregate intrinsic value of exercisable options was $1,252,674 at December 31, 2009. The aggregate intrinsic value of options exercised during 2009 was $110,026.
12. Earnings Per Share
The calculation of earnings per share follows:
2009 2008
Numerator:
Net income $ 2,842,087 $ 4,467,071
Denominator:
Denominator for basic earnings per share
Weighted average shares outstanding 3,165,984 3,486,370
Effect of dilutive employee stock options 99,501 125,503
Denominator for dilutive earnings per share 3,265,485 3,611,873
Basic earnings per share $ 0.86 $ 1.28
Dilutive earnings per share $ 0.85 $ 1.24
For 2009 and 2008, respectively, 364,250 and 381,250 stock options were excluded from diluted earnings per share calculations because they would have been anti-dilutive.
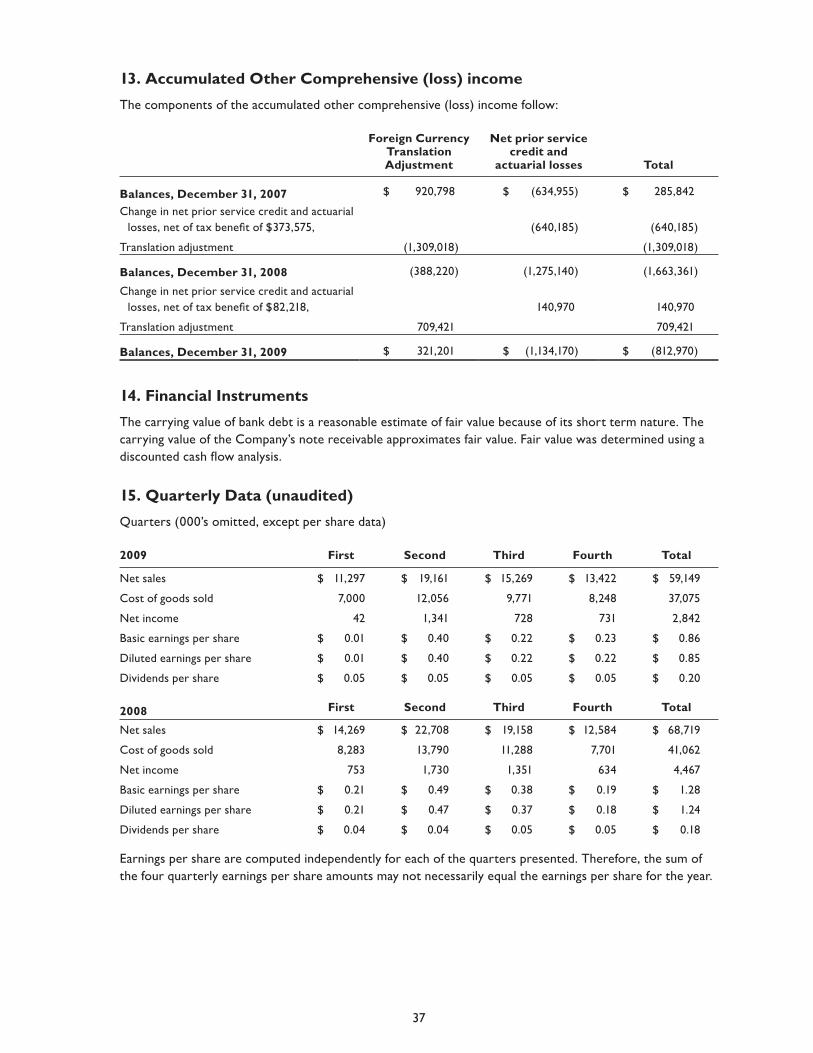
37
13. Accumulated Other Comprehensive (loss) income
The components of the accumulated other comprehensive (loss) income follow:
Foreign Currency Translation Adjustment
Net prior service credit and
actuarial losses Total
Balances, December 31, 2007 $ 920,798 $ (634,955) $ 285,842
Change in net prior service credit and actuarial losses, net of tax benefi t of $373,575, (640,185) (640,185)
Translation adjustment (1,309,018) (1,309,018)
Balances, December 31, 2008 (388,220) (1,275,140) (1,663,361)
Change in net prior service credit and actuarial losses, net of tax benefi t of $82,218, 140,970 140,970
Translation adjustment 709,421 709,421
Balances, December 31, 2009 $ 321,201 $ (1,134,170) $ (812,970)
14. Financial Instruments
The carrying value of bank debt is a reasonable estimate of fair value because of its short term nature. The carrying value of the Company’s note receivable approximates fair value. Fair value was determined using a discounted cash fl ow analysis.
15. Quarterly Data (unaudited)
Quarters (000’s omitted, except per share data)
2009 First Second Third Fourth Total
Net sales $ 11,297 $ 19,161 $ 15,269 $ 13,422 $ 59,149
Cost of goods sold 7,000 12,056 9,771 8,248 37,075
Net income 42 1,341 728 731 2,842
Basic earnings per share $ 0.01 $ 0.40 $ 0.22 $ 0.23 $ 0.86
Diluted earnings per share $ 0.01 $ 0.40 $ 0.22 $ 0.22 $ 0.85
Dividends per share $ 0.05 $ 0.05 $ 0.05 $ 0.05 $ 0.20
2008 First Second Third Fourth Total
Net sales $ 14,269 $ 22,708 $ 19,158 $ 12,584 $ 68,719
Cost of goods sold 8,283 13,790 11,288 7,701 41,062
Net income 753 1,730 1,351 634 4,467
Basic earnings per share $ 0.21 $ 0.49 $ 0.38 $ 0.19 $ 1.28
Diluted earnings per share $ 0.21 $ 0.47 $ 0.37 $ 0.18 $ 1.24
Dividends per share $ 0.04 $ 0.04 $ 0.05 $ 0.05 $ 0.18
Earnings per share are computed independently for each of the quarters presented. Therefore, the sum of the four quarterly earnings per share amounts may not necessarily equal the earnings per share for the year.

38
16. Sale of Property
In December 2008, the Company sold property it owned in Bridgeport, Connecticut to B&E Juices, Inc. for $2.5 million. The property consists of approximately four acres of land and 48,000 sq. feet of warehouse space. The property was the site of the original Acme United scissor factory which opened in 1887 and was closed in 1996.
Under the terms of the sale agreement, and as required by the Connecticut Transfer Act, the Company is responsible to remediate any environmental contamination on the property. During 2008, the Company hired an independent environmental consulting fi rm to conduct environmental studies in order to identify the extent of the environmental contamination on the property and to develop a remediation plan. As a result of those studies and the estimates prepared by the independent environmental consulting fi rm, the Company recorded an undiscounted liability of approximately $1.8 million in the fourth quarter of 2008, related to the remediation of the property. This accrual includes the costs of required investigation, remedial activities, and post-remediation operating and maintenance.
Remediation work on the project began in the third quarter of 2009 and a major portion of the work has been completed. As of December 31, 2009, the Company paid approximately $583,000 for work related to the remediation and has approximately $681,000 remaining in its accrual for environmental remediation, of which approximately $362,000 was classifi ed as a current liability.
In addition to the remediation work, the Company, with the assistance of its independent environmental consulting fi rm, must continue to monitor contaminant levels on the property to ensure they comply with set governmental standards. The Company expects that the monitoring period could last a minimum of three years from the completion of the remediation work.
In connection with the remediation work completed in the third quarter of 2009, the environmental study was updated by the independent environmental consulting fi rm. The results of this study showed that the extent of contamination on the site was not as extensive as originally estimated which allowed the Company, along with its environmental consulting fi rm, to refi ne the original project plan resulting in a new estimate of costs to complete the project. The change in estimated costs resulted in a benefi t of approximately $460,000 which the Company recorded as other non-operating income during the third quarter of 2009.
The change in the accrual for environmental remediation for the year ended December 31, 2009 follows (in thousands):
Balances, December 31, 2008 Payments Change in Estimate
Balances, December 31, 2009
$ 1,724 $ (583) $ (460) $ 681
Also, as part of the sale, the Company has provided the buyer with a mortgage of $2.0 million at six percent interest The mortgage is payable in monthly installments with the outstanding balance due in full, one year after remediation and monitoring on the property have been completed. It is estimated that the remediation project will be completed within fi ve years from the date of the sale.

39
Report of Independent Registered Public Accounting Firm
To the Board of Directors and Stockholders of Acme United CorporationWe have audited the accompanying consolidated balance sheets of Acme United Corporation and subsidiaries (the “Company”) as of December 31, 2009 and 2008, and the related consolidated statements of operations, changes in stockholders’ equity, and cash fl ows for the years then ended. Our audits also included the fi nancial statement schedule listed in the Index at Item 15(a)(2). These consolidated fi nancial statements and fi nancial statement schedule are the responsibility of the Company’s management. Our responsibility is to express an opinion on these fi nancial statements and fi nancial statement schedule based on our audits.
We conducted our audits in accordance with the standards of the Public Company Accounting Oversight Board (United States). Those standards require that we plan and perform the audit to obtain reasonable assurance about whether the fi nancial statements are free of material misstatement. We were not engaged to perform an audit of the Company’s internal controls over fi nancial reporting. Our audits included consideration of internal control over fi nancial reporting as a basis for designing audit procedures that are appropriate in the circumstances, but not for the purpose of expressing an opinion on the effectiveness of the Company’s internal control over fi nancial reporting. Accordingly, we express no such opinion. An audit also includes examining, on a test basis, evidence supporting the amounts and disclosures in the fi nancial statements, assessing the accounting principles used and signifi cant estimates made by management, and evaluating the overall fi nancial statement presentation. We believe that our audits provide a reasonable basis for our opinion.
In our opinion, the fi nancial statements referred to above present fairly, in all material respects, the consolidated fi nancial position of the Company as of December 31, 2009 and 2008, and the consolidated results of its operations and its cash fl ows for the years then ended in conformity with accounting principles generally accepted in the United States of America. Also in our opinion, the related fi nancial statement schedule, when considered in relation to the basic consolidated fi nancial statements taken as a whole, presents fairly, in all material respects, the information set forth therein.
/s/UHY LLP
Hartford, Connecticut March 8, 2010

40
Item 9. Changes In and Disagreements with Accountants on Accounting and Financial DisclosureThere have been no disagreements with accountants related to accounting and fi nancial disclosures in 2009.
Item 9A(T). Controls and Procedures
Evaluation of Internal Controls and Procedures
Under the supervision and with the participation of our management, including the Chief Executive Offi cer and Chief Financial Offi cer, we have evaluated the effectiveness of our disclosure controls and procedures as required by Exchange Act Rule 13a-15(b) as of the end of the period covered by this report. Based on that evaluation, the Chief Executive Offi cer and Chief Financial Offi cer have concluded that these disclosure controls and procedures are effective.
Management’s Report on Internal Control over Financial Reporting
Management of the Company is responsible for establishing and maintaining adequate internal control over fi nancial reporting. The Company’s internal control over fi nancial reporting is designed to provide reasonable assurance regarding the reliability of fi nancial reporting and the preparation of fi nancial statements for external purposes in accordance with generally accepted accounting principles in the United States of America. The Company’s internal control over fi nancial reporting includes those policies and procedures that: (i) pertain to the maintenance of records that, in reasonable detail, accurately and fairly refl ect the transactions and dispositions of the assets of the Company; (ii) provide reasonable assurance that transactions are recorded as necessary to permit preparation of fi nancial statements in accordance with generally accepted accounting principles in the United States of America, and that receipts and expenditures of the Company are being made only in accordance with authorizations of management and directors of the Company; and (iii) provide reasonable assurance regarding prevention or timely detection of unauthorized acquisition, use or disposition of the Company’s assets that could have a material effect on the fi nancial statements.
Any system of internal control, no matter how well designed, has inherent limitations, including the possibility that a control can be circumvented or overridden and misstatements due to error or fraud may occur and not be detected in a timely manner. Also, because of changes in conditions, internal control effectiveness may vary over time. Accordingly, even an effective system of internal control will provide only reasonable assurance with respect to fi nancial statement preparation.
Management assessed the effectiveness of the Company’s internal control over fi nancial reporting as of December 31, 2009. In making this assessment, management used the criteria set forth by the Committee of Sponsoring Organizations of the Treadway Commission (COSO) in “Internal Control-Integrated Framework.” Based on management’s assessment using the COSO criteria, management has concluded that the Company’s internal control over fi nancial reporting was effective as of December 31, 2009.
This annual report does not include an attestation report of the Company’s registered public accounting fi rm regarding internal control over fi nancial reporting. Management’s report was not subject to attestation by the Company’s registered public accounting fi rm pursuant to temporary rules of the Securities and Exchange Commission that permit the Company to provide only management’s report in this Annual Report.
Changes in Internal Control over Financial Reporting
During the quarter ended December 31, 2009, there were no changes in the Company’s internal control over fi nancial reporting that materially affected, or was reasonably likely to materially affect, our internal control over fi nancial reporting.
Item 9B. Other InformationNone.

41
PART III
Item 10. Directors, Executive Offi cers and Corporate GovernanceThe following table sets forth certain information with respect to the directors and executive offi cers of the Company. All directors of the Company hold offi ce until the next annual meeting of the shareholders or until their successors have been elected and qualifi ed. Executive offi cers are elected by the Board of Directors to hold offi ce until their successors are elected and qualifi ed.
Name Age Position Held with Company
Walter C. Johnsen 59 Chairman of the Board and Chief Executive Offi cer
Brian S. Olschan 53 President, Chief Operating Offi cer and Director
Paul G. Driscoll 49 Vice President, Chief Financial Offi cer, Secretary and Treasurer
Rex L. Davidson 60 Director
Richmond Y. Holden, Jr. 56 Director
Susan H. Murphy 58 Director
Stevenson E. Ward III 64 Director
Walter C. Johnsen has served as Chairman of the Board and Chief Executive Offi cer of the Company since January 1, 2007; President and Chief Executive Offi cer of the Company from November 30, 1995 to December 31, 2006. He formerly served as Vice Chairman and a principal of Marshall Products, Inc., a medical supply distributor. Mr. Johnsen’s qualifi cations to serve on the Board include the in-depth knowledge of all facets of the Company’s business which he has gained during his more than fi fteen years of service as the Company’s Chief Executive Offi cer.
Brian S. Olschan has served as President and Chief Operating Offi cer of the Company since January 1, 2007; Executive Vice President and Chief Operating Offi cer of the Company from January 25, 1999 to December 31, 2006; Senior Vice President – Sales and Marketing of the Company from September 12, 1996 to January 24, 1999; formerly served as Vice President and General Manager of the Cordset and Assembly Business of General Cable Corporation, an electrical wire and cable manufacturer. Mr. Olschan’s qualifi cations to serve on the Board include his detailed knowledge of the Company’s operations which he has gained in his capacity as a member of senior management for more than eleven years, including as Chief Operating Offi cer since January 1999 and President since January 2007.
Paul G. Driscoll has served as Vice President and Chief Financial Offi cer, Secretary and Treasurer since October 2, 2002. Mr. Driscoll joined Acme as Director International Finance on March 19, 2001. From 1997 to 2001 he was employed by Ernest and Julio Gallo Winery including Director of Finance and Operations in Japan. Prior to Gallo he served in several increasingly responsible fi nance positions in Sterling Winthrop Inc. in New York City and Sanofi S.A. in France.
Rex L. Davidson has served as director since April, 2006. He is currently President of Rex Davidson Associates, LLC, a management consulting service and Executive Director of Las Cumbres Community Services which provides developmental disability and mental health services to children, adults and families in Northern New Mexico. Past President and Chief Executive Offi cer of Goodwill Industries of Greater New York and Northern New Jersey, Inc., and Past President of Goodwill Industries Housing Corporation. Mr. Davidson’s qualifi cations to serve on the Board include signifi cant management experience at the highest level, having been responsible for the management of an organization with over 2,000 employees and revenues in excess of $100 million. Mr. Davidson’s experience in the areas of compensation of personnel at all levels, his experience relating to retail matters, such as retail trends and pricing, and diversity policies are of signifi cant benefi t to the company.

42
Richmond Y. Holden, Jr. has served as director since 1998. Since 2007, President of Educators Publishing Service, a supplementary publisher of education materials and a subsidiary of School Specialty Inc. Previously, President and Chief Executive Offi cer of J.L. Hammett Co. from 1992 to 2006, a reseller, of educational products. The qualifi cations of Mr. Holden to serve on the Board include his senior management level experience of large complex companies in the educational markets. In particular, as a result of his experience with School Specialty Inc., a $1 billion reseller of educational products, Mr. Holden has broad knowledge of educational markets and operational matters relating to educational products, such as marketing, sourcing, pricing and distribution.
Susan H. Murphy has served as director since 2003. She is presently Vice President for Student and Academic Services at Cornell University since 1994. From 1985 through 1994, Ms. Murphy served as Dean of Admissions and Financial Aid. Ms. Murphy has been employed at Cornell since 1978. Ms. Murphy received a Ph.D. from Cornell University. Ms. Murphy has broad senior management level experience in a large, complex organization. In particular, her experience in employee compensation matters and the development and implementation of diversity policies is helpful to the Company.
Stevenson E. Ward III has served as director since 2001. He is presently Vice President and Chief Financial Offi cer of Triton Thalassic Technologies, Inc. From 1999 through 2000, Mr. Ward served as Senior Vice President – Administration of Sanofi -Synthelabo, Inc. He also served as Executive Vice President (1996 – 1999) and Chief Financial Offi cer (1994 – 1995) of Sanofi , Inc. and Vice President, Pharmaceutical Group, Sterling Winthrop, Inc. (1992 – 1994). Prior to joining Sterling he was employed by General Electric with assignments in Purchasing, Corporate Audit and Financial Management. Mr. Ward’s qualifi cations for service on the Board include his extensive experience in senior executive level fi nance positions at Fortune 100 multinational corporations.
Code of Conduct
The Company has adopted a Code of Conduct that is applicable to its employees, including the Chief Executive Offi cer, Chief Financial Offi cer and Controller. The Code of Conduct is available in the investor relations section on the Company’s website at www.acmeunited.com
If the Company makes any substantive amendments to the Code of Conduct which apply to its Chief Executive Offi cer, Chief Financial Offi cer or Controller, or grants any waiver, including any implicit waiver, from a provision of the Code of Conduct to the Company’s executive offi cers, the Company will disclose the nature of the amendment or waiver on its website or in a report on Form 8-K.
Information regarding Section 16(a) Benefi cial Ownership Reporting Compliance and Corporate Governance is incorporated herein by reference to the sections entitled (i) “Compliance with Section 16(a) of the Securities Exchange Act of 1934”, (ii) “Nominations for Directors”, and (iii) “Audit Committee” contained in the Company’s Proxy Statement to be fi led with the Securities and Exchange Commission in connection with its 2010 Annual Meeting of Shareholders.

43
Item 11. Executive CompensationInformation with respect to executive compensation is incorporated herein by reference to the section entitled “Executive Compensation” contained in the Company’s Proxy Statement to be fi led with the Securities and Exchange Commission in connection with the Company’s 2010 Annual Meeting of Shareholders.
Item 12. Security Ownership of Certain Benefi cial Owners and ManagementInformation regarding security ownership of certain benefi cial owners, directors and executive offi cers is incorporated herein by reference to the information in the section entitled “Security Ownership of Directors and Offi cers” contained in the Company’s Proxy Statement to be fi led with the Securities and Exchange Commission in connection with its 2010 Annual Meeting of Shareholders.
Item 13. Certain Relationships and Related Transactions, and Director IndependenceThe Company has not engaged in any transactions with related persons in the fi scal year ended December 31, 2009 and there are no transactions with related persons currently proposed.
Information regarding Director Independence is incorporated herein by reference to the section entitled “Independence Determinations” contained in the Company’s Proxy Statement to be fi led with the Securities and Exchange Commission in connection with the Company’s 2010 Annual Meeting of Shareholders
Item 14. Principal Accountant Fees and ServicesInformation regarding principal accountant fees and services is incorporated herein by reference to the section entitled “Fees to Auditors” contained in the Company’s Proxy Statement to be fi led with the Securities and Exchange Commission in connection with its 2010 Annual Meeting of Shareholders.

44
PART IV
Item 15. Exhibits and Financial Statement Schedules(a) (1) Financial Statements.
• Consolidated Balance Sheets
• Consolidated Statements of Operations
• Consolidated Statements of Changes in Stockholders’ Equity
• Consolidated Statements of Cash Flows
• Notes to Consolidated Financial Statements
• Report of Independent Registered Public Accounting Firm
(a) (2) Financial Statement Schedules
• Schedule 2 – Valuation and Qualifying Accounts
• Schedules other than those listed above have been omitted because of the absence of conditions under which they are required or because the required information is presented in the Financial Statements or Notes thereto.
(a) (3) The exhibits listed under Item 15(b) are fi led or incorporated by reference herein.
(b) Exhibits.

45
The exhibits listed below are fi led as part of this Annual Report on Form 10-K. Certain of the exhibits, as indicated, have been previously fi led and are incorporated herein by reference.
Exhibit No. Identifi cation of Exhibit
3(i) Certifi cate of Organization of the Company(1)
Amendment to Certifi cate of Organization of Registrant dated September 24, 1968(1)
Amendment to Certifi cate of Incorporation of the Company dated April 27, 1971(2)
Amendment to Certifi cate of Incorporation of the Company dated June 29, 1971(2)
3(ii) Amendment to the Company’s Bylaws(10)
4 Specimen of Common Stock certifi cate(2)
10.1 Non-Salaried Director Stock Option Plan dated April 22, 1996*(3)
10.1(a) Amendment No. 1 to the Non-Salaried Director Stock Option Plan*(4)
10.1(b) Amendment No. 2 to the Non-Salaried Director Stock Option Plan*(5)
10.2 1992 Amended and Restated Stock Option Plan*(6)
10.2(a) Amendment No. 1 to the Amended and Restated Stock Option Plan*(7)
10.2(b) Amendment No. 2 to the Amended and Restated Stock Option Plan*(8)
10.2(c) Amendment No. 3 to the Amended and Restated Stock Option Plan*(9)
10.2(d) Amendment No. 4 to the Amended and Restated Stock Option Plan*(9)
10.3 Acme United Employee Stock Option Plan dated February 26, 2002* as amended(11)
10.4 Severance Pay Plan dated September 28, 2004*
10.5 Salary Continuation Plan dated September 28, 2004*
10.6 2005 Non-Salaried Director Stock Option Plan(12)
10.8 Deferred Compensation Plan dated October 2, 2007
10.9 Fifth Modifi cation to Revolving Promissory Note and Revolving Credit and Security Agreement, and Reaffi rmation of Guaranty
21 Subsidiaries of the Registrant
23.1 Consent of Independent Registered Public Accounting Firm
31.1 Certifi cation of Walter Johnsen pursuant to Rule 13a-14(a) and 15d-14(a) and Section 302 of the Sarbanes-Oxley Act of 2002
31.2 Certifi cation of Paul Driscoll pursuant to Rule 13a-14(a) and 15d-14(a) and Section 302 of the Sarbanes-Oxley Act of 2002
32.1 Certifi cation of Walter Johnsen pursuant to Section 906 of the Sarbanes-Oxley Act of 2002
32.2 Certifi cation of Paul Driscoll pursuant to Section 906 of the Sarbanes-Oxley Act of 2002
* Indicates a management contract or a compensatory plan or arrangement(1) Previously fi led in S-1 Registration Statement No. 230682 fi led with the Commission on November 7, 1968 and amended by
Amendment No. 1 on December 31, 1968 and by Amendment No. 2 on January 31, 1969.(2) Previously fi led as an exhibit to the Company’s Form 10-K fi led in 1971.(3) Previously fi led in the Company’s Form S-8 Registration Statement No. 333-26739 fi led with the Commission on May 9, 1997.(4) Previously fi led in the Company’s Form S-8 Registration Statement No. 333-84505 fi led with the Commission on August 4, 1999.(5) Previously fi led in the Company’s Form S-8 Registration Statement No. 333-70348 fi led with the Commission on September 21, 2000. (6) Previously fi led as an exhibit to the Company’s Proxy Statement fi led on March 29, 1996.(7) Previously fi led in the Company’s Form S-8 Registration Statement No. 333-26737 fi led with the Commission on May 9, 1997. (8) Previously fi led in the Company’s Form S-8 Registration Statement No. 333-84499 fi led with the Commission on August 4, 1999. (9) Previously fi led in the Company’s Form S-8 Registration Statement No. 333-70346 fi led with the Commission on September 27, 2001. (10) Previously fi led in the Company’s form 8-K fi led on February 28, 2006.(11) Previously fi led in the Company’s Proxy statement for the 2005 Annual Meeting of Shareholders.
(12) Previously fi led in the Company’s Form S-8 Registration Statement No. 333-126478 fi led with the Commission on July 8, 2005.

46
Schedule II
Acme United Corporation and Subsidiaries
Valuation and Qualifying Accounts
For the years ended December 31, 2009 and 2008
2009
Balance at Beginning of Period
Charged to Costs and Expenses
Deductions and Other
AdjustmentsBalance at
End of Period
Allowance for doubtful accounts $ 64,105 $ 26,910 $ 19,386 $ 71,629
Allowance for inventory obsolescence 498,887 120,974 198,176 421,685
Deferred income tax asset valuation allowance 1,759,114 233,815 — 1,992,929
2008
Allowance for doubtful accounts $ 89,856 $ 6,033 $ 31,784 $ 64,105
Allowance for inventory obsolescence 461,467 76,909 39,489 498,887
Deferred income tax asset valuation allowance 2,034,623 142,000 417,509 1,759,114

47
Pursuant to the requirements of Section 13 or 15(d) of the Securities Exchange Act of 1934, the registrant has duly caused this report to be signed on its behalf by the undersigned, thereunto duly authorized, on March 8, 2010.
ACME UNITED CORPORATION
(Registrant)
Signatures Titles
/s/ Walter C. Johnsen
Walter C. Johnsen Chairman and Chief Executive Offi cer
/s/ Brian S. Olschan
Brian S. Olschan President, Chief Operating Offi cer and Director
/s/ Paul G. Driscoll
Paul G. Driscoll Vice President, Chief Financial Offi cer, Secretary and Treasurer
/s/ Rex L. Davidson
Rex L. Davidson Director
/s/ Richmond Y. Holden, Jr.
Richmond Y. Holden, Jr. Director
/s/ Susan H. Murphy
Susan H. Murphy Director
/s/ Stevenson E. Ward III
Stevenson E. Ward III Director
48
EXHIBIT 21
PARENTS AND SUBSIDIARIESThe Company was organized as a partnership in 1867 and incorporated in 1882 under the laws of the State of Connecticut as The Acme Shear Company. The corporate name was changed to Acme United Corporation in 1971.
There is no parent of the registrant.
Registrant has the following subsidiaries, all of which are wholly owned by the registrant:
Name Country of Incorporation
Acme United Limited Canada
Acme United Europe GmbH Germany
Acme United (Asia Pacifi c) Limited Hong Kong
All subsidiaries are active and included in the Company’s consolidated fi nancial statements included in this Form 10-k.
EXHIBIT 23.1
Consent of Independent Registered Public Accounting FirmWe consent to the incorporation by reference in the Registration Statements on Form S-8 (Nos. 333-161392, 333-145516, 333-126478, 333-70348, 333-70346, 333-84505, 333-84509, 333-84499, 333-26739, 333-26737, and 33-98918) of our report dated March 8, 2010 with respect to the consolidated fi nancial statements and schedule of Acme United Corporation and subsidiaries which is included in this Annual Report on Form 10-K for the year ended December 31, 2009.
/s/ UHY LLP
Hartford, ConnecticutMarch 8, 2010

49
EXHIBIT 31.1
CERTIFICATION PURSUANT TO 18 U.S.C. SECTION 1350, AS ADOPTED PURSUANT TO SECTION 906 OF THE SARBANES-OXLEY ACT OF 2002
The undersigned offi cer of Acme United Corporation (the “Company”) hereby certifi es to my knowledge that the Company’s annual report on Form 10-K for the annual period ended December 31, 2009 (the “Report”), as fi led with the Securities and Exchange Commission on the date hereof, fully complies with the requirements of section 13(a) or 15(d), as applicable, of the Securities Exchange Act of 1934, as amended, and that the information contained in the Report fairly presents, in all material respects, the fi nancial condition and results of operations of the Company. This certifi cation is provided solely pursuant to 18 U.S.C. Section 1350, as adopted pursuant to Section 906 of the Sarbanes-Oxley Act of 2002, and shall not be deemed to be a part of the Report or “fi led” for any purpose whatsoever.
By /s/ Walter C. Johnsen
Walter C. Johnsen Chairman and Chief Executive Offi cer
Dated: March 8, 2010
A signed original of this written statement required by Section 906, or other document authenticating, acknowledging, or otherwise adopting the signature that appears in typed form within the electronic version of this written statement required by Section 906, has been provided to Acme United Corporation and will be retained by Acme United Corporation and furnished to the Securities and Exchange Commission or its staff upon request.

50
EXHIBIT 31.2
CERTIFICATION PURSUANT TO 18 U.S.C. SECTION 1350, AS ADOPTED PURSUANT TO SECTION 906 OF THE SARBANES-OXLEY ACT OF 2002
The undersigned offi cer of Acme United Corporation (the “Company”) hereby certifi es to my knowledge that the Company’s annual report on Form 10-K for the annual period ended December 31, 2009 (the “Report”), as fi led with the Securities and Exchange Commission on the date hereof, fully complies with the requirements of section 13(a) or 15(d), as applicable, of the Securities Exchange Act of 1934, as amended, and that the information contained in the Report fairly presents, in all material respects, the fi nancial condition and results of operations of the Company. This certifi cation is provided solely pursuant to 18 U.S.C. Section 1350, as adopted pursuant to Section 906 of the Sarbanes-Oxley Act of 2002, and shall not be deemed to be a part of the Report or “fi led” for any purpose whatsoever.
By /s/ Paul G. Driscoll
Paul G. Driscoll Vice President and Chief Financial Offi cer
Dated: March 8, 2010
A signed original of this written statement required by Section 906, or other document authenticating, acknowledging, or otherwise adopting the signature that appears in typed form within the electronic version of this written statement required by Section 906, has been provided to Acme United Corporation and will be retained by Acme United Corporation and furnished to the Securities and Exchange Commission or its staff upon request.

51
EXHIBIT 32.1
CERTIFICATION PURSUANT TO 18 U.S.C. SECTION 1350, AS ADOPTED PURSUANT TO SECTION 302 OF THE SARBANES-OXLEY ACT OF 2002
I, WALTER C. JOHNSEN, certify that:
I have reviewed this annual report on Form 10-K of Acme United Corporation;
Based on my knowledge, this report does not contain any untrue statement of a material fact or omit to state a material fact necessary to make the statements made, in light of the circumstances under which such statements were made, not misleading with respect to the period covered by this report;
Based on my knowledge, the fi nancial statements, and other fi nancial information included in this report, fairly present in all material respects the fi nancial condition, results of operations and cash fl ows of the registrant as of, and for, the periods presented in this report;
The registrant’s other certifying offi cer(s) and I are responsible for establishing and maintaining disclosure controls and procedures (as defi ned in Exchange Act Rules 13a-15(e) and 15d-15(e)) and internal control over fi nancial reporting (as defi ned in Exchange Act Rules 13a-15(f) and 15d-15(f)) for the registrant and have:
(a) Designed such disclosure controls and procedures, or caused such disclosure controls and procedures to be designed under our supervision, to ensure that material information relating to the registrant, including its consolidated subsidiaries, is made known to us by others within those entities, particularly during the period in which this report is being prepared;
(b) Designed such internal control over fi nancial reporting, or caused such internal control over fi nancial reporting to be designed under our supervision, to provide reasonable assurance regarding the reliability of fi nancial reporting and the preparation of fi nancial statements for external purposes in accordance with generally accepted accounting principles;
(c) Evaluated the effectiveness of the registrant’s disclosure controls and procedures and presented in this report our conclusions about the effectiveness of the disclosure controls and procedures, as of the end of the period covered by this report based on such evaluation; and
(d) Disclosed in this report any change in the registrant’s internal control over fi nancial reporting that occurred during the registrant’s most recent fi scal quarter that has materially affected, or is reasonably likely to materially affect, the registrant’s internal control over fi nancial reporting; and
The registrant’s other certifying offi cer(s) and I have disclosed, based on our most recent evaluation of internal control over fi nancial reporting, to the registrant’s auditors and the audit committee of the registrant’s board of directors (or persons performing the equivalent functions):
(a) All signifi cant defi ciencies and material weaknesses in the design or operation of internal control over fi nancial reporting which are reasonably likely to adversely affect the registrant’s ability to record, process, summarize and report fi nancial information; and
(b) Any fraud, whether or not material, that involves management or other employees who have a signifi cant role in the registrant’s internal control over fi nancial reporting.
By /s/ Walter C. Johnsen
Walter C. Johnsen Chairman and Chief Executive Offi cer
Dated: March 8, 2010

52
EXHIBIT 32.2
CERTIFICATION PURSUANT TO 18 U.S.C. SECTION 1350, AS ADOPTED PURSUANT TO SECTION 302 OF THE SARBANES-OXLEY ACT OF 2002
I, PAUL G. DRISCOLL, certify that:
I have reviewed this Annual Report on Form 10-K of Acme United Corporation;
Based on my knowledge, this report does not contain any untrue statement of a material fact or omit to state a material fact necessary to make the statements made, in light of the circumstances under which such statements were made, not misleading with respect to the period covered by this report;
Based on my knowledge, the fi nancial statements, and other fi nancial information included in this report, fairly present in all material respects the fi nancial condition, results of operations and cash fl ows of the registrant as of, and for, the periods presented in this report;
The registrant’s other certifying offi cer(s) and I are responsible for establishing and maintaining disclosure controls and procedures (as defi ned in Exchange Act Rules 13a-15(e) and 15d-15(e)) and internal control over fi nancial reporting (as defi ned in Exchange Act Rules 13a-15(f) and 15d-15(f)) for the registrant and have:
(a) Designed such disclosure controls and procedures, or caused such disclosure controls and procedures to be designed under our supervision, to ensure that material information relating to the registrant, including its consolidated subsidiaries, is made known to us by others within those entities, particularly during the period in which this report is being prepared;
(b) Designed such internal control over fi nancial reporting, or caused such internal control over fi nancial reporting to be designed under our supervision, to provide reasonable assurance regarding the reliability of fi nancial reporting and the preparation of fi nancial statements for external purposes in accordance with generally accepted accounting principles;
(c) Evaluated the effectiveness of the registrant’s disclosure controls and procedures and presented in this report our conclusions about the effectiveness of the disclosure controls and procedures, as of the end of the period covered by this report based on such evaluation; and
(d) Disclosed in this report any change in the registrant’s internal control over fi nancial reporting that occurred during the registrant’s most recent fi scal quarter that has materially affected, or is reasonably likely to materially affect, the registrant’s internal control over fi nancial reporting; and
The registrant’s other certifying offi cer(s) and I have disclosed, based on our most recent evaluation of internal control over fi nancial reporting, to the registrant’s auditors and the audit committee of the registrant’s board of directors (or persons performing the equivalent functions):
(a) All signifi cant defi ciencies and material weaknesses in the design or operation of internal control over fi nancial reporting which are reasonably likely to adversely affect the registrant’s ability to record, process, summarize and report fi nancial information; and
(b) Any fraud, whether or not material, that involves management or other employees who have a signifi cant role in the registrant’s internal control over fi nancial reporting.
By /s/ Paul G. Driscoll
Paul G. Driscoll Vice President and Chief Financial Offi cer
Dated: March 8, 2010