Embed Size (px)
Citation preview
ACL ANALYTICS Tell Your Story. Connect to any data, analyze any risk, and visualize your results.
Strategic risks look like icebergs in annual reports, but the reality is that they manifest as tiny needles in the haystack of your organization’s transactional data.
ACL™ Analytics connects you to any data source, and let’s you run sophisticated risk analytics and detect anomalies or patterns that you simply can’t illuminate with any amount of random sampling, spreadsheet ninjutsu or generic business intelligence. It’s designed for you, the GRC professional.
Regardless of your department or assurance role, ACL technology enables you to tackle the areas where data analysis will make a material difference to your organization:
RISK ANALYTICSSuspicious? Test your hunch fast. You’re the expert. ACL Analytics is designed to perform risk analytics against finance, IT and business operations data. If you’re suspicious, interrogate your data and get answers fast.
CONNECT TO ANY DATA SOURCEIf you have data, you can analyze it. Access and consolidate data from all of your sources—even that 22-year-old system only Judy knows how to use. A billion records from your ERP system? Spreadsheets? Unstructured report PDFs? No problem. No other tool can access any data as economically as ACL Analytics.
FLAG MORE ACCURATE MATCHESSometimes the greatest breakthroughs start out…fuzzy. With advanced fuzzy matching tools, find more duplicates or join tables even when the data is not exactly the same, common vendor fuzzy billing errors can cost seven figures.
DATA VISUALIZATIONVisually detect patterns and share. Explore and build a better understanding of your data by creating interactive visualizations that can be shared with stakeholders to tell your story.
INDEPENDENT. PROVABLE. REPEATABLE.Litigation? Don’t get caught without your activity log. Your entire data set is protected in read-only format. Every analytic step is recorded to provide assurance and repeatability.
INVESTIGATIONS – REPUTATIONAL INTEGRITYBig data analytics for forensics, accounting and investigations. You can never go wrong with best. ACL Analytics is the industry standard for interactive data analysis against the entire dataset population.
AUTOMATE RECURRING ANALYSISAutomate those manual tasks your boss asked you to do. Recurring analysis can be easily automated to free up time and ensure analysis is consistently performed every time.
PRODUCTIVITY ECOSYSTEM
Training, best-practices and productivity boosters built-in. To help you succeed, we have heavily invested in creating a productivity ecosystem to provide more value. Your subscription includes access to
online training, a library of pre-built risk analysis scripts, a rich knowledge base, an inspirations platform of ideas, and complete user guides.
1
PRODUCT SHEET
© 2015 ACL Services Ltd. ACL and the ACL logo are trademarks or registered trademarks of ACL Services Ltd. All other trademarks are the property of their respecti ve owners.product_sheet_acl_analyti cs
Learn more about what you can accomplish with ACL.Call +27 11 507-0123 to speak with a representati ve
Visit our website at www.acl.software Email us at [email protected]
Customer ROI survey results:
of customers report that using ACL Analyti cs has improved the value their team delivers to
stakeholders
of customers say using ACL Analyti cs has improved how their department is perceived by
senior management
of customers say the ability to test enti re data populati ons vs sampling is valuable to criti cal
94%
96%
81%
94%
96%
81%
94%
96%
81%
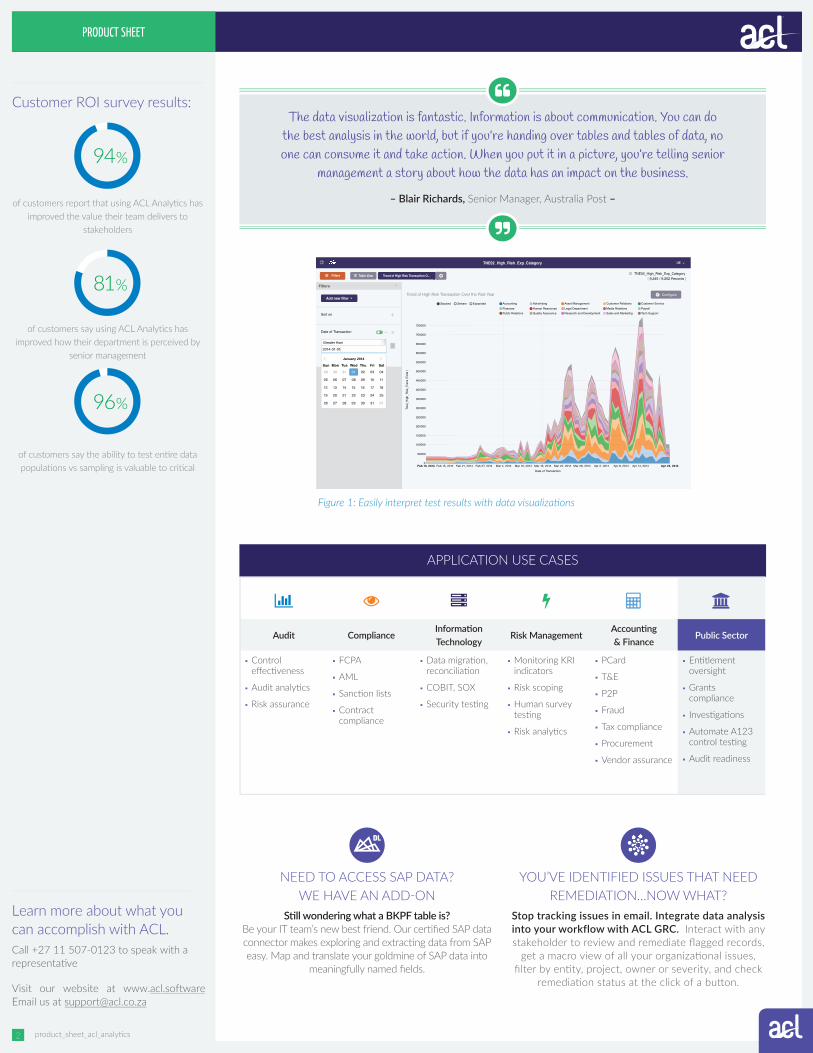
The data visualization is fantastic. Information is about communication. You can do
the best analysis in the world, but if you’re handing over tables and tables of data, no
one can consume it and take action. When you put it in a picture, you’re telling senior
management a story about how the data has an impact on the business.
– Blair Richards, Senior Manager, Australia Post –
APPLICATION USE CASES
Audit ComplianceInformati on Technology
Risk ManagementAccounti ng & Finance
Public Sector
■ Control eff ecti veness
■ Audit analyti cs ■ Risk assurance
■ FCPA ■ AML■ Sancti on lists■ Contract
compliance
■ Data migrati on, reconciliati on
■ COBIT, SOX■ Security testi ng
■ Monitoring KRI indicators
■ Risk scoping■ Human survey
testi ng■ Risk analyti cs
■ PCard ■ T&E■ P2P■ Fraud■ Tax compliance■ Procurement■ Vendor assurance
■ Enti tlement oversight
■ Grants compliance
■ Investi gati ons ■ Automate A123 control testi ng
■ Audit readiness
NEED TO ACCESS SAP DATA? WE HAVE AN ADD-ON
Sti ll wondering what a BKPF table is? Be your IT team’s new best friend. Our certi fi ed SAP data connector makes exploring and extracti ng data from SAP easy. Map and translate your goldmine of SAP data into
meaningfully named fi elds.
YOU’VE IDENTIFIED ISSUES THAT NEED REMEDIATION…NOW WHAT?
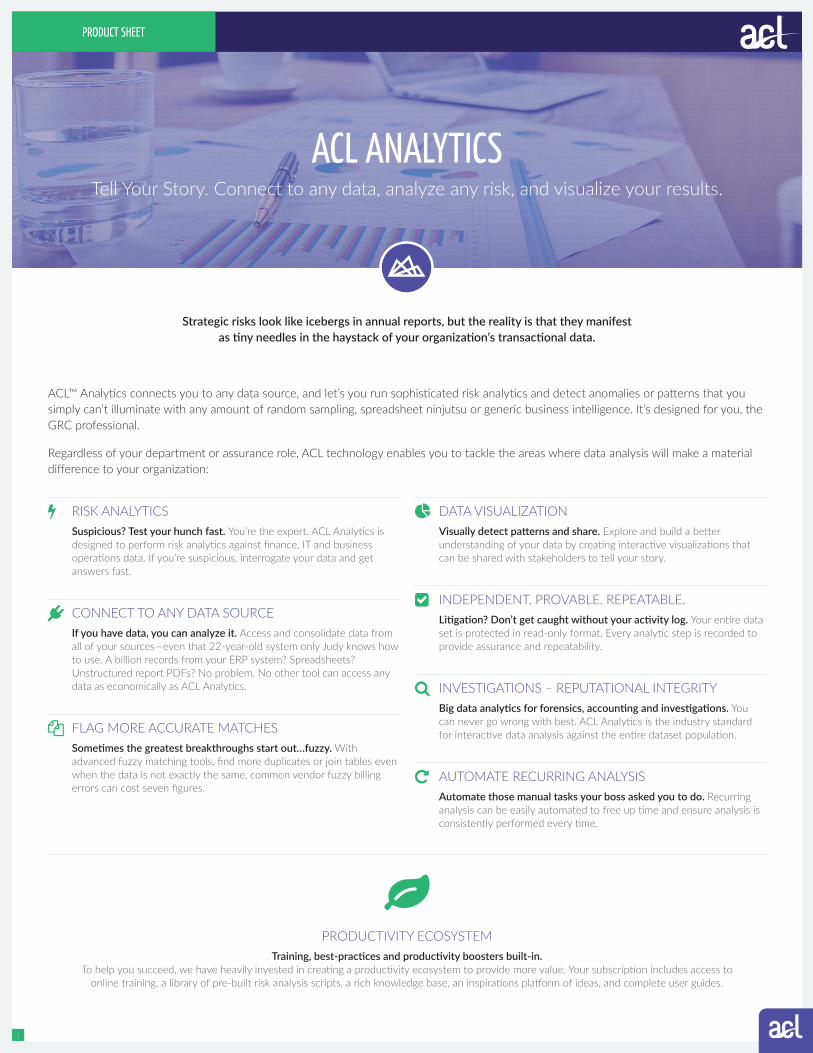
Stop tracking issues in email. Integrate data analysis into your workflow with ACL GRC. Interact with any stakeholder to review and remediate fl agged records,
get a macro view of all your organizati onal issues, fi lter by enti ty, project, owner or severity, and check
remediati on status at the click of a butt on.
[ 9,245 / 9,252 Records ]TNE02_High_Risk_Exp_Category
Configure
TNE02_High_Rish_Exp_Category
Filters Table View Trend of High Risk Transaction O...
Filters
Add new filterTrend of High Risk Transaction Over the Past Year
Stacked Stream Expanded AccountingFinancesPublic Relations
AdvertisingHuman ResourcesQuality Assurance
Asset ManagementLegal DepartmentResearch and Development
Customer RelationsMedia Relations
Customer ServicePayrollTech SupportSales and Marketing
700000
750000
650000
600000
550000
500000
450000
400000
350000
300000
250000
200000
150000
100000
50000
0
Sort on
Date of Transaction
Greater than
2014-01-01
January 2014
Sun Mon Tue Wed Thu Fri Sat
29 30 31 01 02 03 04
11100908070605
12 13 14 15 16 17 18
19 20 21 22 23 24 25
26 27 28 29 30 31 01
Feb 10, 2014 Feb 15, 2014 Feb 21, 2014 Feb 27, 2014 Mar 4, 2014 Mar 10, 2014 Mar 16, 2014 Mar 22, 2014Date of Transaction
Mar 28, 2014 Apr 2, 2014 Apr 8, 2014 Apr 14, 2014 Apr 23, 2014
Tota
l_H
igh_
Risk
_Tra
ns (T
otal
)
Figure 1: Easily interpret test results with data visualizati ons
2
PRODUCT SHEET