Embed Size (px)
Citation preview
iii
ACKNOWLEDGMENTS
It would not have been possible to run this marathon without the help and support of
all the people that were around me, during the experience of pursuing my PhD. To all of
them, I am truly grateful. Naturally, the names that will be mentioned here are those of the
people that cannot be left unsaid – the special ones.
My foremost thank goes to my supervisor, Professor Paulo Mateus Mendes, for all his
contributions of time, ideas, support and guidance to make my PhD a productive and
stimulating experience. He has always helped me to become a more independent researcher
and to think out of the box. The enthusiasm he has for his research was contagious and
motivational.
An indebted thank to my co-supervisor, Professor José Higino Correia for his support
and guidance and for giving me the pleasure of being his student and part of his research
group.
I would also like to take this opportunity to express my appreciation to Professor
Rajeev Ram for accepting me as a visiting student at his research group at MIT. It was a
pleasure to be able to learn, discuss ideas and to be a part of his group. A special thanks, also,
to my group colleagues, especially to Kevin Lee and Harry Lee for helping me with the
research and for all the interesting brainstorming.
There is no doubt that I would have never been able to get with all the bureaucratic
issues and questions regarding the MIT-Portugal Program without the help of Professor
Eugénio Ferreira.
As a MIT-Portugal Program student, I had the privilege to become part of this network
of professors, researchers and students. I strongly believe that this opportunity changed my
way of facing research and prepared me for a new way of thinking. It was a pleasure to share
my doctoral studies with my amazing colleagues from the Bioengineering focus area and to
share all those crazy, funny and even stressful moments. A special thanks to Daniela Couto
and João Guerreiro, my dearest friends and “10 Fulkerson” housemates. For the meals, the
talks throughout the evening, the movies, the surprises..and most importantly, for being my
family.
During the three years of lab work, I had the pleasure of the company of my
laboratory colleagues Alexandre Ferreira da Silva, Amândio Barbosa, Carlos Pereira, Celso
Figueiredo, Débora Ferreira, Helena Fernandez, João Ribeiro, Fábio Rodrigues, Doctor Luís
Acknowledgments Photonic platform for bioelectric signal acquisition in wearable devices
iv
Rocha, Manuel Silva, Doctor Nuno Dias, Pedro Anacleto, Sérgio Dias, Susana Catarino
Rosana Dias, Rui Rocha. To them I need to thank for the fun breaks we did, the ideias
exchanged, the lunchs we all had together, as well as the Thursday and, sometimes, Friday’s
Cake day!
I am especially grateful to Alexandre Ferreira da Silva and Débora Ferreira that have
been accompanying me since the beginning of my Academia adventure. Both of them had
helped me as group colleagues, and mostly, as true friends. Without my endless talks with
Débora and our crazy stories, it would have been much more difficult to surpass this
challenge. To Alexandre, I have to thank not only for listening to my stupid jokes, ideas,
questions, but also for the strong support that he has always been able to give me.
Furthermore, without his equipment, most of the experiments herein described would not
have been possible. “Double 02, where are you?”. As I always say: “Alexandre, és um anjo, a
minha salvação” J.
To the Industrial Electronics Department professors, technicians and secretaries, I
express my gratitude for the availability of services. In particular, I would like to express my
thankfulness to Professor Graça Minas, Professor Luis Rocha and Doctor Nuno Dias for
providing some of the necessary equipment for the accomplishment of this PhD.
Now is the time of thanking all the beloved friends that helped me through this
journey, either by sharing meals and coffees, watching movies, dancing, laughing,
crying…everything. Frist, to my oldest, best and core friends, in particular Azz, Cris, Daniela,
Betinha, Jonas, Jorge (my “brother” and my “pés-na-terra”), Liliana, Luisinho, Luis Carlos,
Negras, Nhoca, Pãpã and Rui Pedro, Schroeder, Tiago, Renata and Valter thank you for being
there and for all the patience and support.
I cannot proceed without saying a few words to some of them. Cris, Pãpã, Liliana
thank you for being my best friends for a long long time. Each one of you contributed in a
specific way, more than you can imagine. For you guys, our song “Amigos para sempre”,
with lyrics adapted, of course. And Daniela, I don’t have the words..literally. Basically, you
followed me (or vice-versa) in each step of our academia path, and always found a way to
make me fell happier. From the first group works, to the last talks we had towards the end of
writing this. Actually, right now I’m talking to you about not having words to describe how
grateful I am. From the vast list of music we shared throughout these 4 years, I chose the one
that always pushed us a step forward in thesis writing: dance ‘til you’re dead, heads will roll.
Daniela, “Heads will Roll”. Thank you for everything and how you always say “desculpa
qualquer coisinha”
v
A new round of friends appeared, and since the group is almost 30 people, I will only
mention a few names that cannot be forgotten, the funny guys: Gil, Manel, Mário, Mope and
Zé. Thank you for all the fun moments, the dinners and the movies.
To my second family, D. Sameiro, Sr. Fernandes, Adriana e Luís, thank you for all the
support and love. For welcoming me in your home and in your lifes as a member of your
family, a thousand thanks.
Now the most important people for me, my partners in life and to whom I dedicate this
thesis: my family and boyfriend. The best family in the world, from my grandparents to my
little nephews! To my mother, father, sister, brother-in-law, my beloved nephews António and
Rodrigo (as minhas perdições J), and Pedro, I cannot express how thankful I am. I feel like
the luckiest person in this world to have you all in my life. Thank you for being there, for
your unconditional love and support, for making me who I am, and for making this possible.
Pedro, the one that “suffered” the most, thank you for being unconditionally there as
my boyfriend and my friend, right from the beginning of the most important years of my life.
I owe you everything right now.
The final sentence should not be for anyone, but for my parents and my sister. They
raised me, supported me, taught me, and, most of all, loved me unconditionally. A million
times, thank you.

Acknowledgments Photonic platform for bioelectric signal acquisition in wearable devices
vi
This work was supported by Portuguese Foundation for Science and Technology
(SFRH/BD/42705/2007). The author would like also to acknowledge the MIT Portugal Program
for supporting this work
vii
ABSTRACT
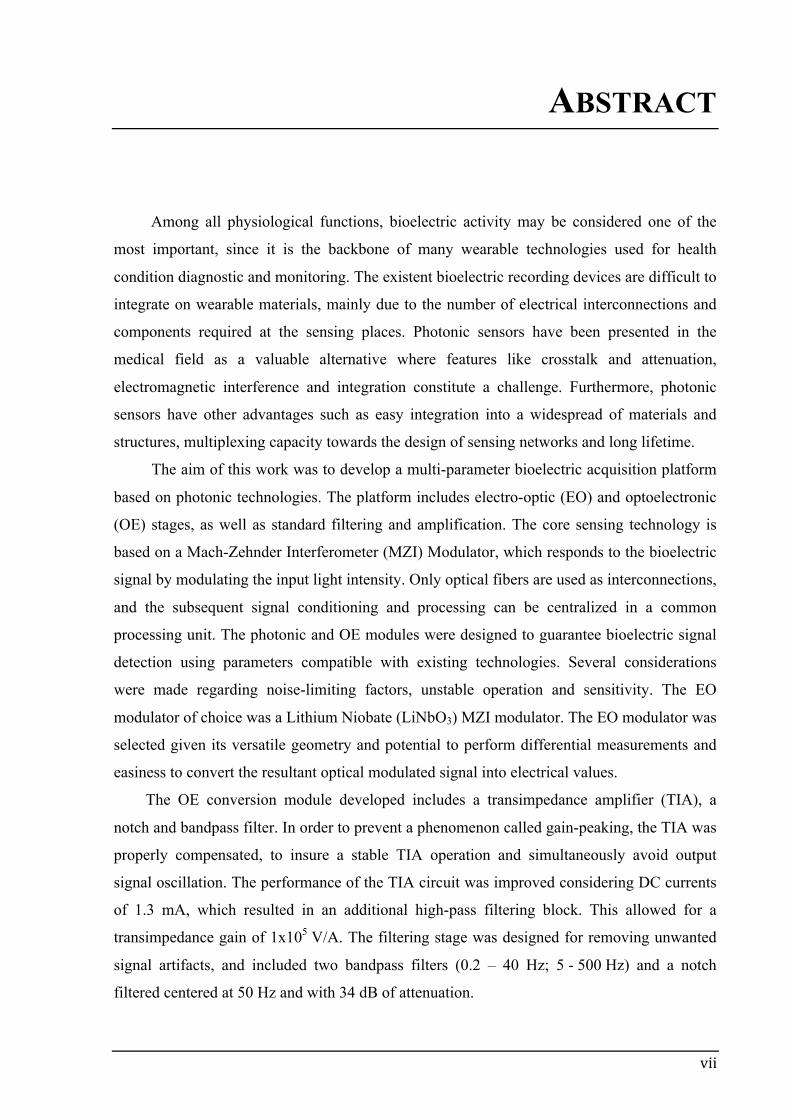
Among all physiological functions, bioelectric activity may be considered one of the
most important, since it is the backbone of many wearable technologies used for health
condition diagnostic and monitoring. The existent bioelectric recording devices are difficult to
integrate on wearable materials, mainly due to the number of electrical interconnections and
components required at the sensing places. Photonic sensors have been presented in the
medical field as a valuable alternative where features like crosstalk and attenuation,
electromagnetic interference and integration constitute a challenge. Furthermore, photonic
sensors have other advantages such as easy integration into a widespread of materials and
structures, multiplexing capacity towards the design of sensing networks and long lifetime.
The aim of this work was to develop a multi-parameter bioelectric acquisition platform
based on photonic technologies. The platform includes electro-optic (EO) and optoelectronic
(OE) stages, as well as standard filtering and amplification. The core sensing technology is
based on a Mach-Zehnder Interferometer (MZI) Modulator, which responds to the bioelectric
signal by modulating the input light intensity. Only optical fibers are used as interconnections,
and the subsequent signal conditioning and processing can be centralized in a common
processing unit. The photonic and OE modules were designed to guarantee bioelectric signal
detection using parameters compatible with existing technologies. Several considerations
were made regarding noise-limiting factors, unstable operation and sensitivity. The EO
modulator of choice was a Lithium Niobate (LiNbO3) MZI modulator. The EO modulator was
selected given its versatile geometry and potential to perform differential measurements and
easiness to convert the resultant optical modulated signal into electrical values.
The OE conversion module developed includes a transimpedance amplifier (TIA), a
notch and bandpass filter. In order to prevent a phenomenon called gain-peaking, the TIA was
properly compensated, to insure a stable TIA operation and simultaneously avoid output
signal oscillation. The performance of the TIA circuit was improved considering DC currents
of 1.3 mA, which resulted in an additional high-pass filtering block. This allowed for a
transimpedance gain of 1x10⁵ V/A. The filtering stage was designed for removing unwanted
signal artifacts, and included two bandpass filters (0.2 – 40 Hz; 5 - 500 Hz) and a notch
filtered centered at 50 Hz and with 34 dB of attenuation.
Abstract Photonic platform for bioelectric signal acquisition in wearable devices
viii
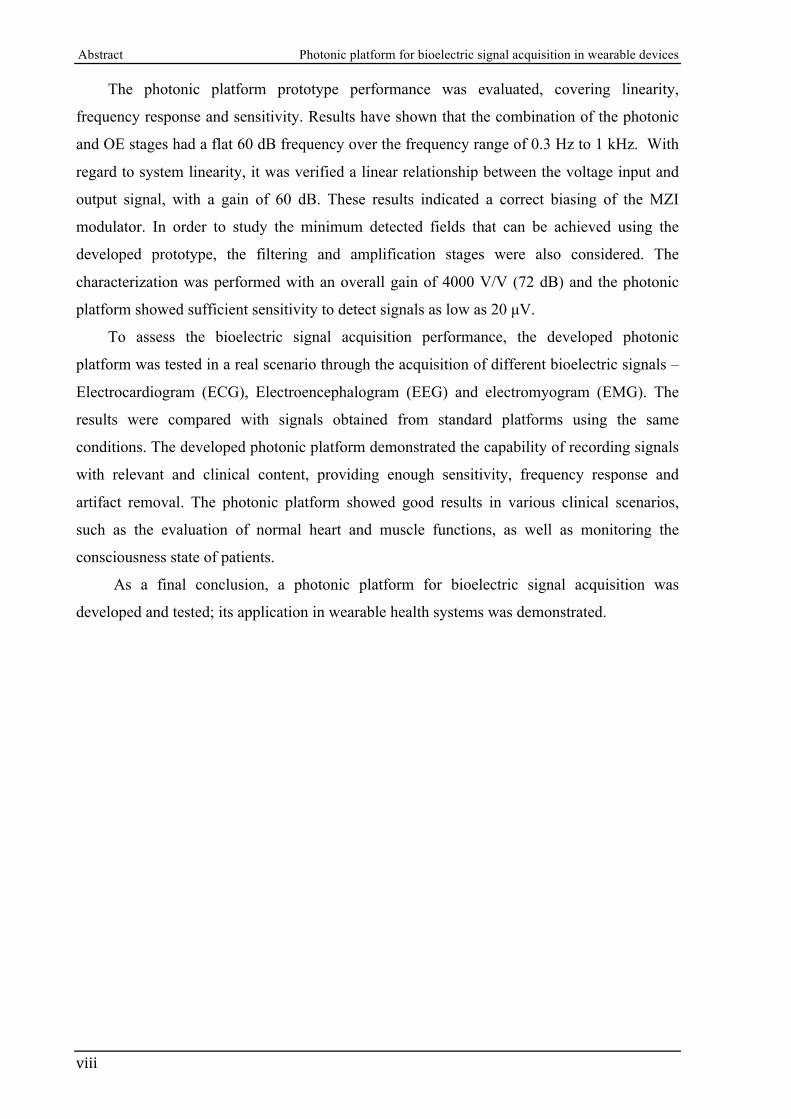
The photonic platform prototype performance was evaluated, covering linearity,
frequency response and sensitivity. Results have shown that the combination of the photonic
and OE stages had a flat 60 dB frequency over the frequency range of 0.3 Hz to 1 kHz. With
regard to system linearity, it was verified a linear relationship between the voltage input and
output signal, with a gain of 60 dB. These results indicated a correct biasing of the MZI
modulator. In order to study the minimum detected fields that can be achieved using the
developed prototype, the filtering and amplification stages were also considered. The
characterization was performed with an overall gain of 4000 V/V (72 dB) and the photonic
platform showed sufficient sensitivity to detect signals as low as 20 µV.
To assess the bioelectric signal acquisition performance, the developed photonic
platform was tested in a real scenario through the acquisition of different bioelectric signals –
Electrocardiogram (ECG), Electroencephalogram (EEG) and electromyogram (EMG). The
results were compared with signals obtained from standard platforms using the same
conditions. The developed photonic platform demonstrated the capability of recording signals
with relevant and clinical content, providing enough sensitivity, frequency response and
artifact removal. The photonic platform showed good results in various clinical scenarios,
such as the evaluation of normal heart and muscle functions, as well as monitoring the
consciousness state of patients.
As a final conclusion, a photonic platform for bioelectric signal acquisition was
developed and tested; its application in wearable health systems was demonstrated.
ix
RESUMO
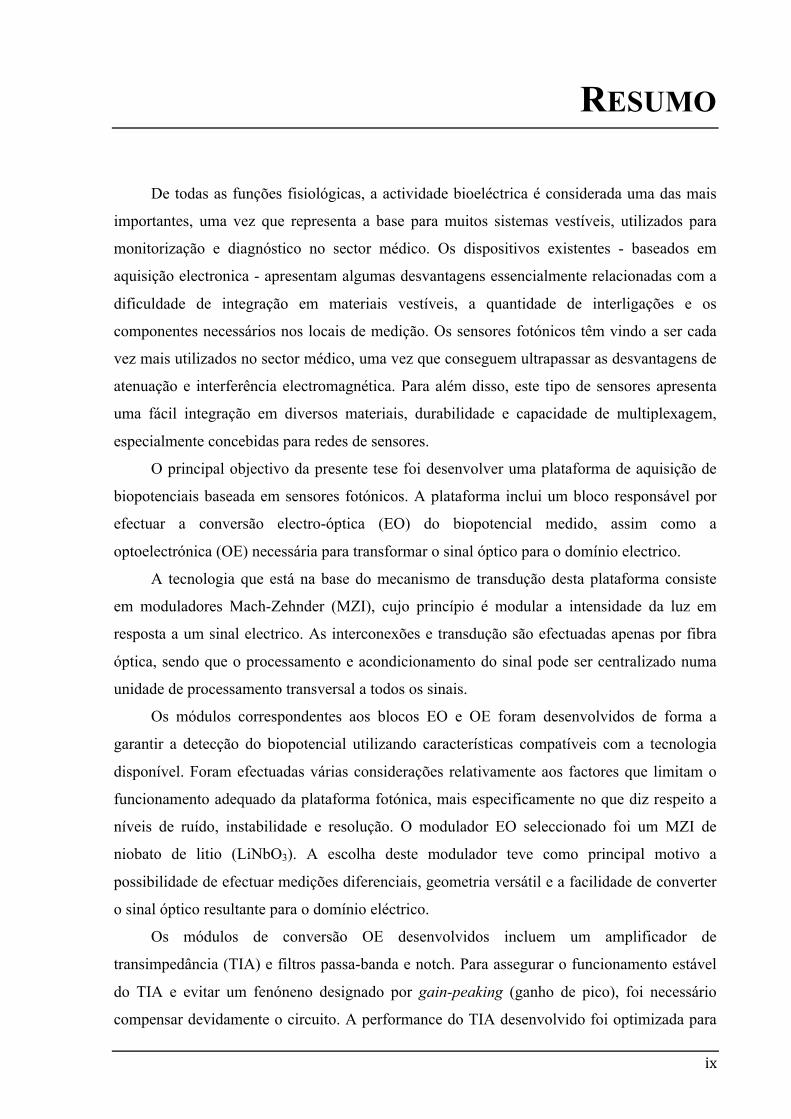
De todas as funções fisiológicas, a actividade bioeléctrica é considerada uma das mais
importantes, uma vez que representa a base para muitos sistemas vestíveis, utilizados para
monitorização e diagnóstico no sector médico. Os dispositivos existentes - baseados em
aquisição electronica - apresentam algumas desvantagens essencialmente relacionadas com a
dificuldade de integração em materiais vestíveis, a quantidade de interligações e os
componentes necessários nos locais de medição. Os sensores fotónicos têm vindo a ser cada
vez mais utilizados no sector médico, uma vez que conseguem ultrapassar as desvantagens de
atenuação e interferência electromagnética. Para além disso, este tipo de sensores apresenta
uma fácil integração em diversos materiais, durabilidade e capacidade de multiplexagem,
especialmente concebidas para redes de sensores.
O principal objectivo da presente tese foi desenvolver uma plataforma de aquisição de
biopotenciais baseada em sensores fotónicos. A plataforma inclui um bloco responsável por
efectuar a conversão electro-óptica (EO) do biopotencial medido, assim como a
optoelectrónica (OE) necessária para transformar o sinal óptico para o domínio electrico.
A tecnologia que está na base do mecanismo de transdução desta plataforma consiste
em moduladores Mach-Zehnder (MZI), cujo princípio é modular a intensidade da luz em
resposta a um sinal electrico. As interconexões e transdução são efectuadas apenas por fibra
óptica, sendo que o processamento e acondicionamento do sinal pode ser centralizado numa
unidade de processamento transversal a todos os sinais.
Os módulos correspondentes aos blocos EO e OE foram desenvolvidos de forma a
garantir a detecção do biopotencial utilizando características compatíveis com a tecnologia
disponível. Foram efectuadas várias considerações relativamente aos factores que limitam o
funcionamento adequado da plataforma fotónica, mais especificamente no que diz respeito a
níveis de ruído, instabilidade e resolução. O modulador EO seleccionado foi um MZI de
niobato de litio (LiNbO3). A escolha deste modulador teve como principal motivo a
possibilidade de efectuar medições diferenciais, geometria versátil e a facilidade de converter
o sinal óptico resultante para o domínio eléctrico.
Os módulos de conversão OE desenvolvidos incluem um amplificador de
transimpedância (TIA) e filtros passa-banda e notch. Para assegurar o funcionamento estável
do TIA e evitar um fenóneno designado por gain-peaking (ganho de pico), foi necessário
compensar devidamente o circuito. A performance do TIA desenvolvido foi optimizada para
Resumo Photonic platform for bioelectric signal acquisition in wearable devices
x
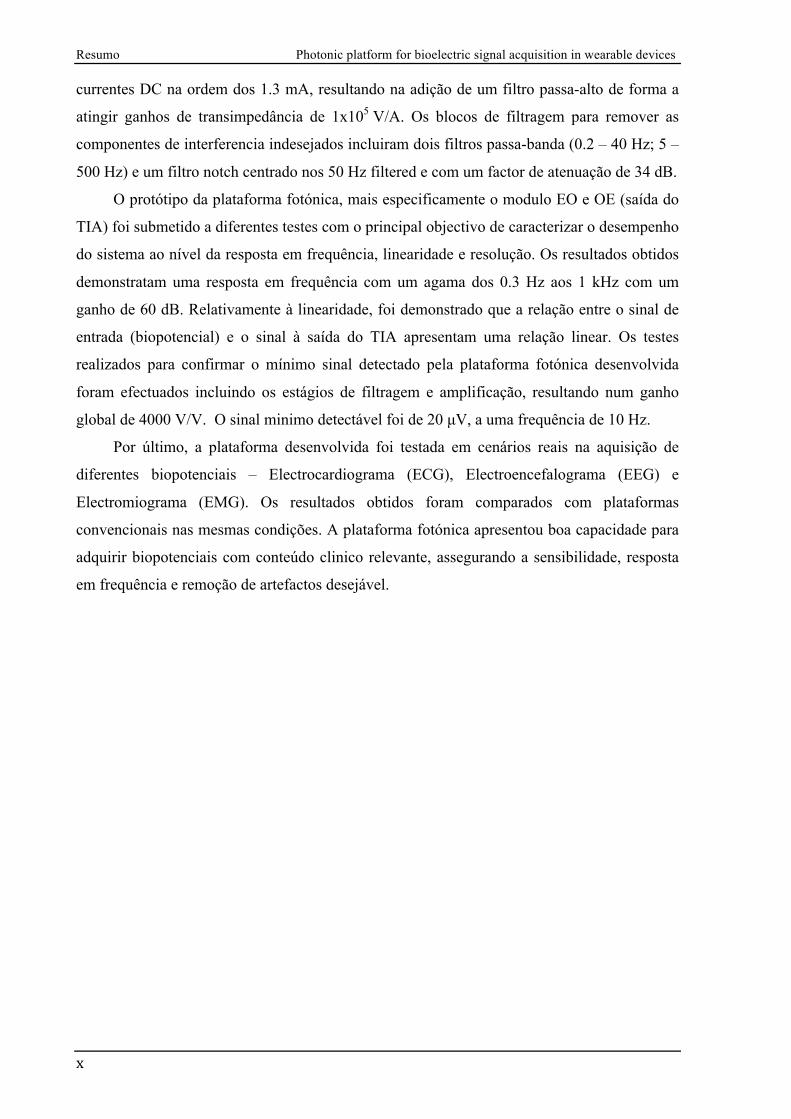
currentes DC na ordem dos 1.3 mA, resultando na adição de um filtro passa-alto de forma a
atingir ganhos de transimpedância de 1x10⁵ V/A. Os blocos de filtragem para remover as
componentes de interferencia indesejados incluiram dois filtros passa-banda (0.2 – 40 Hz; 5 –
500 Hz) e um filtro notch centrado nos 50 Hz filtered e com um factor de atenuação de 34 dB.
O protótipo da plataforma fotónica, mais especificamente o modulo EO e OE (saída do
TIA) foi submetido a diferentes testes com o principal objectivo de caracterizar o desempenho
do sistema ao nível da resposta em frequência, linearidade e resolução. Os resultados obtidos
demonstratam uma resposta em frequência com um agama dos 0.3 Hz aos 1 kHz com um
ganho de 60 dB. Relativamente à linearidade, foi demonstrado que a relação entre o sinal de
entrada (biopotencial) e o sinal à saída do TIA apresentam uma relação linear. Os testes
realizados para confirmar o mínimo sinal detectado pela plataforma fotónica desenvolvida
foram efectuados incluindo os estágios de filtragem e amplificação, resultando num ganho
global de 4000 V/V. O sinal minimo detectável foi de 20 µV, a uma frequência de 10 Hz.
Por último, a plataforma desenvolvida foi testada em cenários reais na aquisição de
diferentes biopotenciais – Electrocardiograma (ECG), Electroencefalograma (EEG) e
Electromiograma (EMG). Os resultados obtidos foram comparados com plataformas
convencionais nas mesmas condições. A plataforma fotónica apresentou boa capacidade para
adquirir biopotenciais com conteúdo clinico relevante, assegurando a sensibilidade, resposta
em frequência e remoção de artefactos desejável.
xi
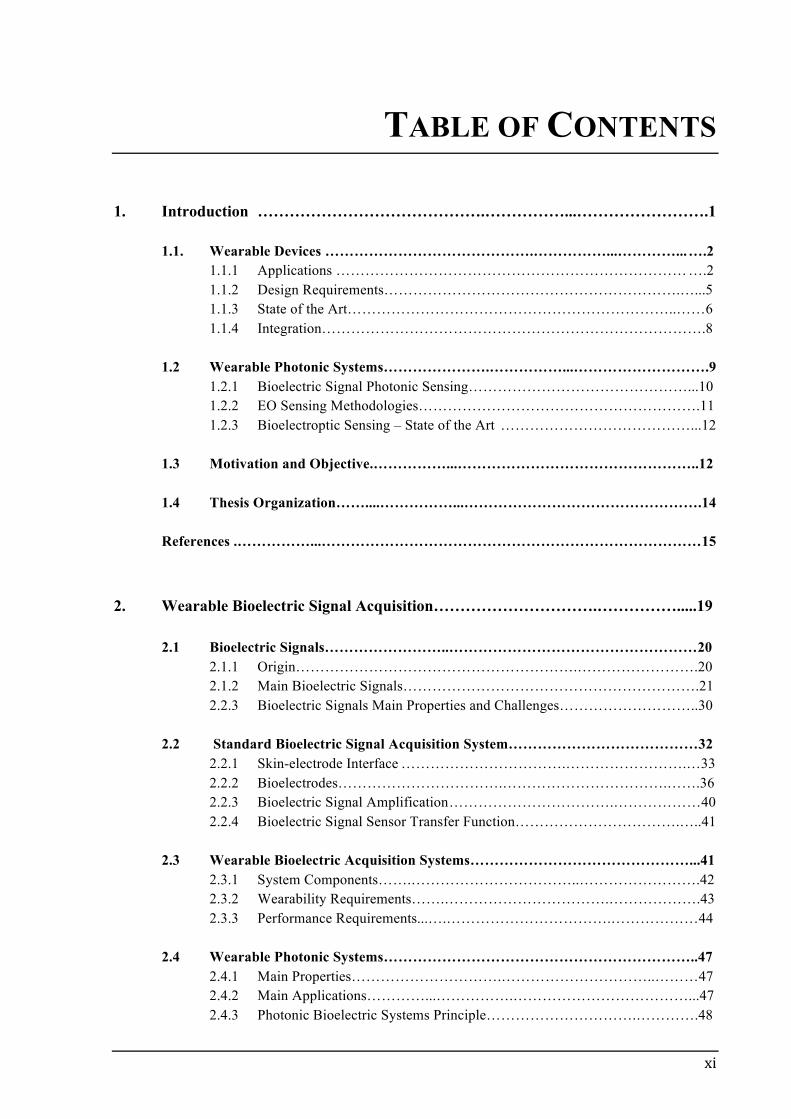
TABLE OF CONTENTS 1. Introduction …………………………………….……………...…………………….1
1.1. Wearable Devices …………………………………….……………...…………... ….2
1.1.1 Applications ……………………………………………………………… ….2 1.1.2 Design Requirements…………………………………………………….…...5 1.1.3 State of the Art…………………………………………………………..……6 1.1.4 Integration…………………………………………………………………….8
1.2 Wearable Photonic Systems………………….……………...……………………….9 1.2.1 Bioelectric Signal Photonic Sensing………………………………………...10 1.2.2 EO Sensing Methodologies………………………………………………….11 1.2.3 Bioelectroptic Sensing – State of the Art …………………………………...12
1.3 Motivation and Objective.……………...…………………………………………..12 1.4 Thesis Organization……....……………...………………………………………….14
References .……………...……………………………………………………………………15
2. Wearable Bioelectric Signal Acquisition………………………….…………….....19
2.1 Bioelectric Signals……………………..……………………………………………20 2.1.1 Origin………………………………………………….…………………….20 2.1.2 Main Bioelectric Signals…………………………………………………….21 2.2.3 Bioelectric Signals Main Properties and Challenges………………………..30
2.2 Standard Bioelectric Signal Acquisition System…………………………………32 2.2.1 Skin-electrode Interface …………………………….…………………….…33 2.2.2 Bioelectrodes…………………………….…………………………….…….36 2.2.3 Bioelectric Signal Amplification …………………………….………………40 2.2.4 Bioelectric Signal Sensor Transfer Function…………………………….…..41
2.3 Wearable Bioelectric Acquisition Systems………………………………………...41 2.3.1 System Components…….……………………………..…………………….42 2.3.2 Wearability Requirements…….…………………………….……………….43 2.3.3 Performance Requirements...….…………………………….………………44
2.4 Wearable Photonic Systems………………………………………………………..47 2.4.1 Main Properties………………………….…………………………..………47 2.4.2 Main Applications…………...…………….………………………………...47 2.4.3 Photonic Bioelectric Systems Principle………………………….………….48
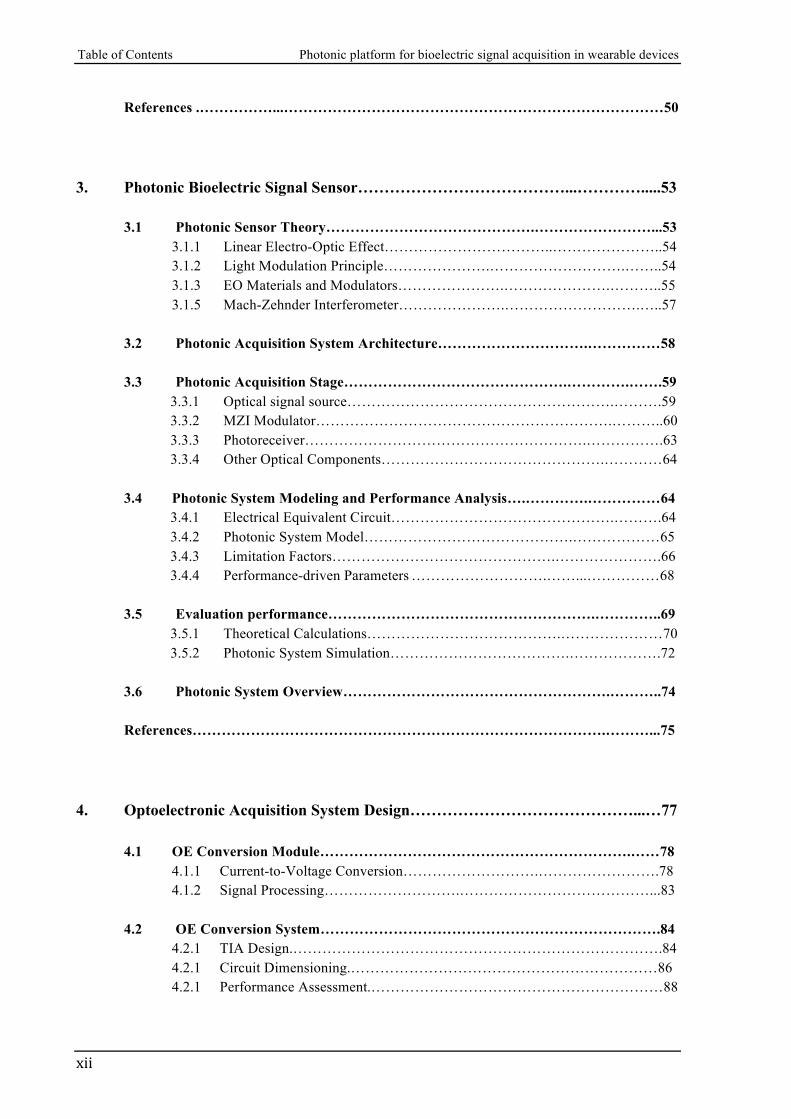
Table of Contents Photonic platform for bioelectric signal acquisition in wearable devices
xii
References .……………...……………………………………………………………………50
3. Photonic Bioelectric Signal Sensor…………………………………...………….....53
3.1 Photonic Sensor Theory…………………………………….……………………...53
3.1.1 Linear Electro-Optic Effect……………………………..…………………..54 3.1.2 Light Modulation Principle………………….……………………….……..54 3.1.3 EO Materials and Modulators………………….………………….………..55 3.1.5 Mach-Zehnder Interferometer………………….……………………….…..57
3.2 Photonic Acquisition System Architecture………………………….……………58
3.3 Photonic Acquisition Stage……………………………………….………….…….59
3.3.1 Optical signal source……………………………………………….……….59 3.3.2 MZI Modulator…………………………………………………….………..60 3.3.3 Photoreceiver………………………………………………….…………….63 3.3.4 Other Optical Components……………………………………….…………64
3.4 Photonic System Modeling and Performance Analysis….………….……………64
3.4.1 Electrical Equivalent Circuit……………………………………….……….64 3.4.2 Photonic System Model…………………………………….………………65 3.4.3 Limitation Factors……………………………………….………………….66 3.4.4 Performance-driven Parameters ……………………….……...……………68
3.5 Evaluation performance……………………………………………….…………..69
3.5.1 Theoretical Calculations………………………………….…………………70 3.5.2 Photonic System Simulation……………………………….……………….72
3.6 Photonic System Overview……………………………………………….………..74
References………………………………………………………………………….………...75 4. Optoelectronic Acquisition System Design……………………………………...…77
4.1 OE Conversion Module……………………………………………………….……78 4.1.1 Current-to-Voltage Conversion……………………….…………………….78 4.1.2 Signal Processing……………………….…………………………………...83
4.2 OE Conversion System…………………………………………………………….84
4.2.1 TIA Design.………………………………………………………………….84 4.2.1 Circuit Dimensioning.………………………………………………………86 4.2.1 Performance Assessment.……………………………………………………88
xiii
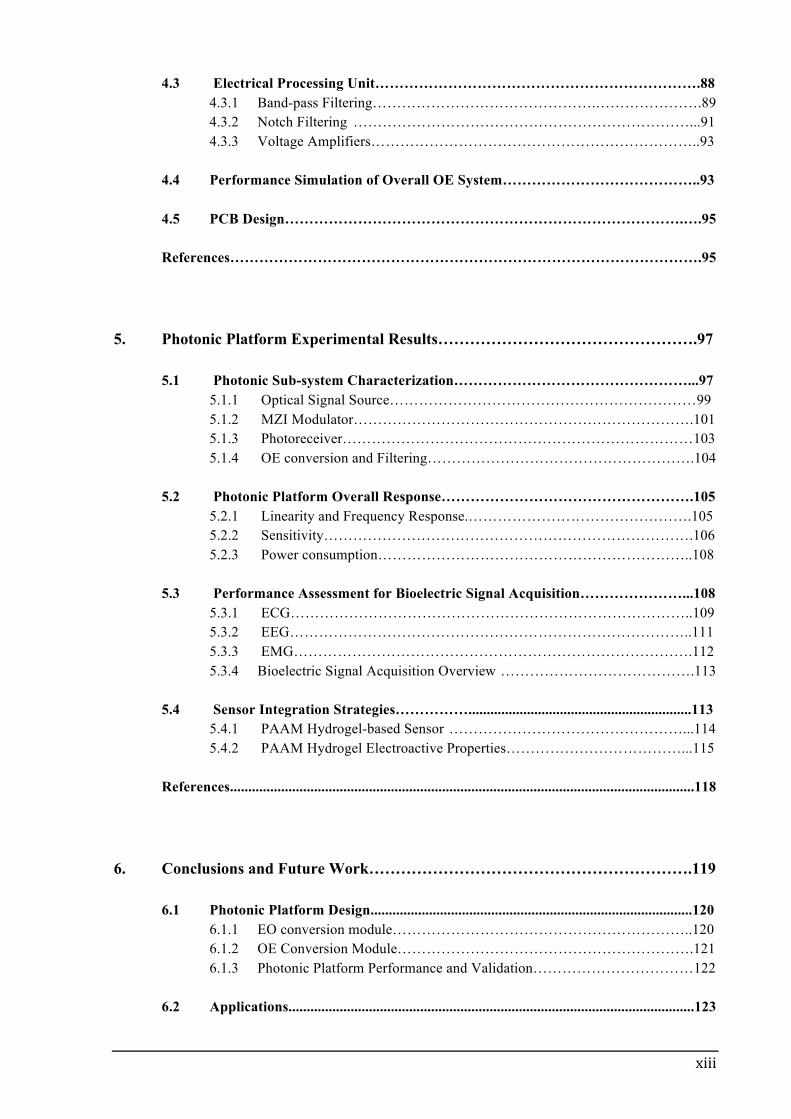
4.3 Electrical Processing Unit………………………………………………………….88 4.3.1 Band-pass Filtering……………………………………….………………….89 4.3.2 Notch Filtering ……………………………………………………………...91 4.3.3 Voltage Amplifiers…………………………………………………………..93
4.4 Performance Simulation of Overall OE System…………………………………..93 4.5 PCB Design……………………………………………………………………….….95 References…………………………………………………………………………………….95
5. Photonic Platform Experimental Results………………………………………….97
5.1 Photonic Sub-system Characterization…………………………………………...97 5.1.1 Optical Signal Source………………………………………………………99 5.1.2 MZI Modulator…………………………………………………………….101 5.1.3 Photoreceiver………………………………………………………………103 5.1.4 OE conversion and Filtering……………………………………………….104
5.2 Photonic Platform Overall Response…………………………………………….105 5.2.1 Linearity and Frequency Response.……………………………………….105 5.2.2 Sensitivity………………………………………………………………….106 5.2.3 Power consumption………………………………………………………..108
5.3 Performance Assessment for Bioelectric Signal Acquisition…………………...108 5.3.1 ECG………………………………………………………………………..109 5.3.2 EEG………………………………………………………………………..111 5.3.3 EMG……………………………………………………………………….112 5.3.4 Bioelectric Signal Acquisition Overview ………………………………….113
5.4 Sensor Integration Strategies…………….............................................................113 5.4.1 PAAM Hydrogel-based Sensor …………………………………………...114 5.4.2 PAAM Hydrogel Electroactive Properties………………………………...115
References...............................................................................................................................118
6. Conclusions and Future Work…………………………………………………….119
6.1 Photonic Platform Design........................................................................................120 6.1.1 EO conversion module……………………………………………………..120 6.1.2 OE Conversion Module…………………………………………………….121 6.1.3 Photonic Platform Performance and Validation……………………………122
6.2 Applications...............................................................................................................123
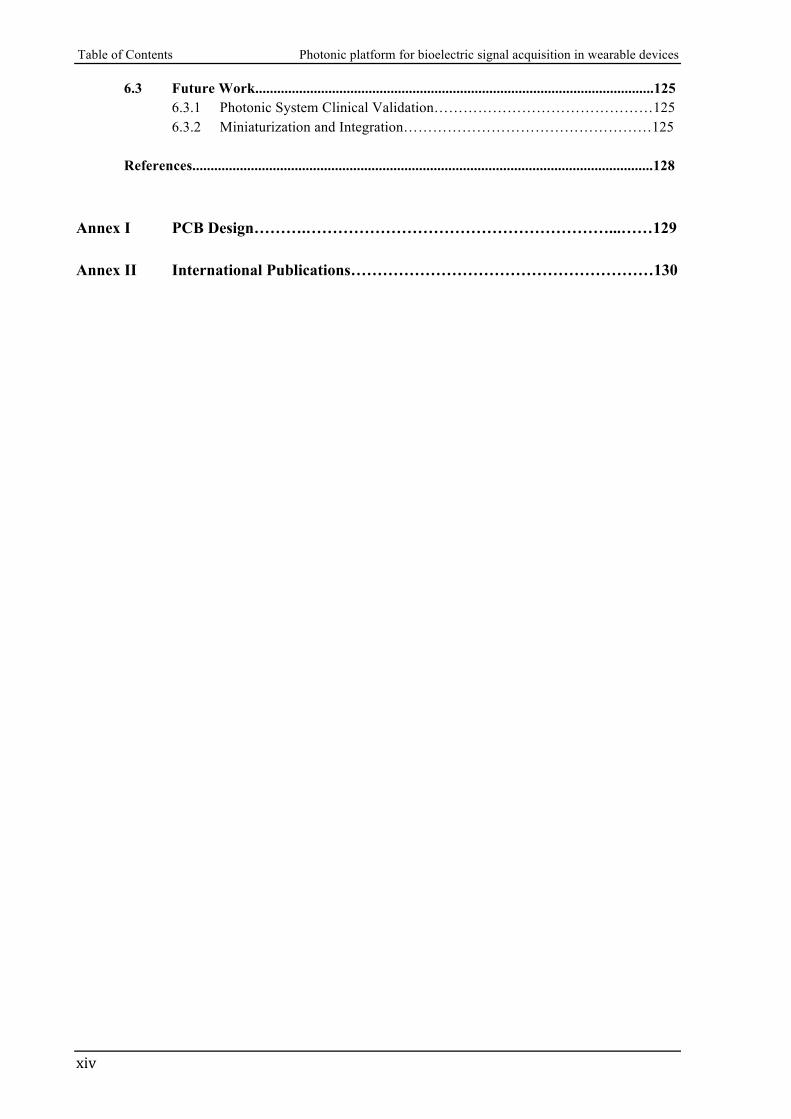
Table of Contents Photonic platform for bioelectric signal acquisition in wearable devices
xiv
6.3 Future Work.............................................................................................................125 6.3.1 Photonic System Clinical Validation………………………………………125 6.3.2 Miniaturization and Integration……………………………………………125
References..............................................................................................................................128
Annex I PCB Design……….…………………………………………………...……129 Annex II International Publications…………………………………………………130
xv
LIST OF FIGURES
Figure 1.1 Ten leading causes of death in high-income countries in 2008.
Data is taken over a sample population of 100000 inhabitants. …………..………..…3
Figure 1.2 Main requirements for wearable devices acceptance by users and clinicians/technicians…………………………………………………………………..5
Figure 1.3 Categories of Wearable Devices and examples. Examples from the 1st generation of wearable devices from the left to the right are a a) wrist-worn device AMON, b) a braincap with a wireless Electroencephalography acquisition module and c) a ring monitoring sensor. The 2nd generation includes d) a monitoring t-shirt Lifeshirt, e) a sensorized T-shirt developed within the VTAM project and f) a sensor jacket for context awareness. The 3rd generation examples are g) a shirt developed by Smartex within the European integrated project WEALTHY, h) SmartShirt developed by Sensatex and i) sensorized leotard developed .………………….………………………………………………………….6
Figure 1.4 Optical sensor acquisition block diagram. ……………………………………….…..10
Figure 1.5 Photonic platform for bioelectric signal acquisition on wearable devices,
developed in this thesis…………………………………………………………...…..14
Figure 2.1 Action potential generation mechanism. Each step is represented in the action potential plot, as a colored region………………………….21
Figure 2.2 Heart anatomy and major bioelectric events of a typical ECG……………………... 22
Figure 2.3 Einthoven lead system: a) limb leads, and b) chest leads (leads are incrementally numerated from V1 to V6)………………………………………..23
Figure 2.4 Brain main lobes and associated functions…………………………………………...25
Figure 2.5 EEG brain waves according to different states of consciousness…………………….26
Figure 2.6 International 10-20 system of EEG electrode placement…………………………….27
Figure 2.7 EMG signals from a) a static contraction and b) a series of contraction and relaxation………………………………………………………………...………28
Figure 2.8 Example of an EOG signal obtained with three electrodes…………………………29
Figure 2.9 Bioelectric signal acquisition typical setup………………………………………….32
List of Tables Photonic platform for bioelectric signal acquisition in wearable devices
xvi
Figure 2.10 a) Human skin cross section. b) Skin-electrode interface and equivalent circuit for wet and dry electrodes………………………………………...33
Figure 2.11 Skin-electrode interface and equivalent circuit for capacitive electrodes…………...35
Figure 2.12 Skin-electrode impedance as a function of signal frequency………………………..35
Figure 2.13 a) Equivalent circuit of bioelectric signal electrode –electrolyte interface; b) Impedance plot for equivalent circuit…………………………………..39
Figure 2.14 Architectural layer of an ideal wearable bioelectric system………………………….42
Figure 2.15 a) Extrinsic and b) Intrinsic light modulation schemes………………………………49
Figure 3.1 a) Longitudinal and b) Transverse EO modulation…………………………………..57
Figure 3.2 MZI a) geometry and functioning, and b) cross-section view of single and dual drive configuration………………………………………….58
Figure 3.3 Photonic sensor design for bioelectric acquisition…………………………………...58
Figure 3.4 LiNbO3 MZI modulator geometry………………………………………………...………61
Figure 3.5 MZI transfer function obtained through (3.7), and considering
an IL of 6 dB and a vbias from -0,2 to 6V…………………………………..………....62
Figure 3.6 Equivalent electrical circuit of the LiNbO3 MZI modulator…………………………64
Figure 3.7 Photonic setup used in the simulation software OptiSystems………………………..73 Figure 3.8 Simulation results for MZI single drive configuration, in:
a) Optical; and b) Electrical domain. Inset in b) represents the raw signal obtained at the output of the TIA……………………………………..74
Figure 3.9 Simulation results for MZI dual drive configuration in:
a) Optical; and b) Electrical domain. Inset in b) represents the raw signal obtained at the output of the TIA……………………………………..74
Figure 4.1 Standard circuit of a transimpedance amplifier with photodiode
in the photovoltaic mode……………………………………………………………..78
Figure 4.2 Bode plot of NG and opamp Open Loop Gain. The inset shows the gain peaking effect on the I-V response curve…………………………………...80
Figure 4.3 TIA circuit with phase compensation and photodiode electrical equivalent….……...81
Figure 4.4 TIA circuit schematic, with DC suppression block and compensation block………..85
xvii
Figure 4.5 Block diagram of the acquisition electronics, including an optional voltage amplifier…………………………………………………………89
Figure 4.6 Circuit schematic of the Sallen-key band-pass filter…………………………………90
Figure 4.7 Frequency response of the band-pass filter for: ECG and EEG
filter obtained in a)Matlab® from the transfer function and b) TINA®
from circuit simulation; EMG filter obtained in c) Matlab® from the transfer function and d) TINA® from circuit simulation. Arrows indicate the low and high cut-off frequencies………………………………………………....91
Figure 4.8 Circuit schematic of twin-t notch filter………………………………………………92
Figure 4.9 Frequency response of the notch filter obtained in a) Matlab®
from the transfer function and b) TINA® from circuit simulation. Arrows indicate the notch frequency……………………………………………….. 92
Figure 4.10 Frequency response obtained in TINA® for the overall acquisition
electronics setup using band–pass filter for a) ECG and EEG acquisition (0.2 – 40 Hz); and b) 5 – 500 Hz………………………………………...93
Figure 4.11 Simulation results obtained in TINA® for the overall acquisition
electronics setup in terms of a) Input noise; and b) SNR…………………………….94 Figure 4.12 PCB of the OE system designed for bioelectric signal acquisition.
a) top view and b) bottom view………………………………………………………95
Figure 5.1 Photonic stage prototype: a) optical signal source and b) MZI modulator…………..98
Figure 5.2 Prototype of the OE stage comprising PIN photodiode, TIA, band-pass and notch filter, and an optional voltage amplifier. The instrumentation amplifier (INA119) is also included in this module, although it’s only used for comparison purposes………………………99
Figure 5.3 C-band broadband ASE light source power spectrum.
Measurements were performed with a power supply of 5V/1A…………………….100
Figure 5.4 Relationship between optical power fluctuation and output voltage………………..100 Figure 5.5 MZI EO transfer function. Arrows indicate linear modulation regions…………….101
Figure 5.6 Output voltage of the photonic sensor when using a MZI a) single-drive
and b) dual-drive configuration……………………………………………………..103
List of Tables Photonic platform for bioelectric signal acquisition in wearable devices
xviii
Figure 5.7 Photonic platform linear response. The output voltage is detected at the output of the TIA……………………………………………………………..105
Figure 5.8 Frequency response of the photonic platform. The output is considered at the end of the TIA……………………………………………………106
Figure 5.9 Photonic platform output voltages with 10 Hz –modulation signals with amplitudes of: a) 1 mV; b) 100 µV; c) 50 µV and d) 20 µV. Signals were processed using 50 Hz-notch filters, 0.5 to 35 Hz band-pass filter…..107
Figure 5.10 Gain deembedded ECG signals obtained with: a) standard BrainVision
recording setup and b) photonic platform…………………………………………..109
Figure 5.11 ECG signals obtained using: INA119 a) after filtering and b) raw signal at the INA119 output; and photonic platform c) after filtering and d) TIA output…………………………………………………………………...110
Figure 5.12 ECG signals spectrum power obtained using: INA119 a) after filtering and b) raw signal at the INA119 output; and photonic platform c) after filtering and d) TIA output………………………………………………….110
Figure 5.13 Gain deembedded EEG signals obtained with a) standard BrainVision recording setup; and photonic platform in the following conditions: b) awake and concentrated in an object; c) relaxed and with eyes closed; and d) sleeping……………………………………………………………...112
Figure 5.14 Gain deembedded EMG signals obtained with: a) standard BrainVision
recording setup and b) photonic platform…………………………………………..113 Figure 5.15 Experimental setup for testing the electroactive properties of PAAM gel…………115 Figure 5.16 PAAM hydrogel frequency response………………………………………………116
Figure 6.1 Thesis milestones towards the development of a photonic platform for bioelectric acquisition…………………………………………………120
Figure 6.2 Smart material based on photonic platform technology developed
in this thesis. Optical components can be embedded in a substrate material……….124 Figure 6.3 Schematic representation of the prospective integration of the photonic
platform in a wearable monitoring garment. Three different solutions can be obtained with the photonic platform for monitoring EEG, ECG and EMG……..124
Figure 6.4 EO and OE functions merged into a single integrated device.
Main limiting factors are optical signal generation and photodetection……………126
xix
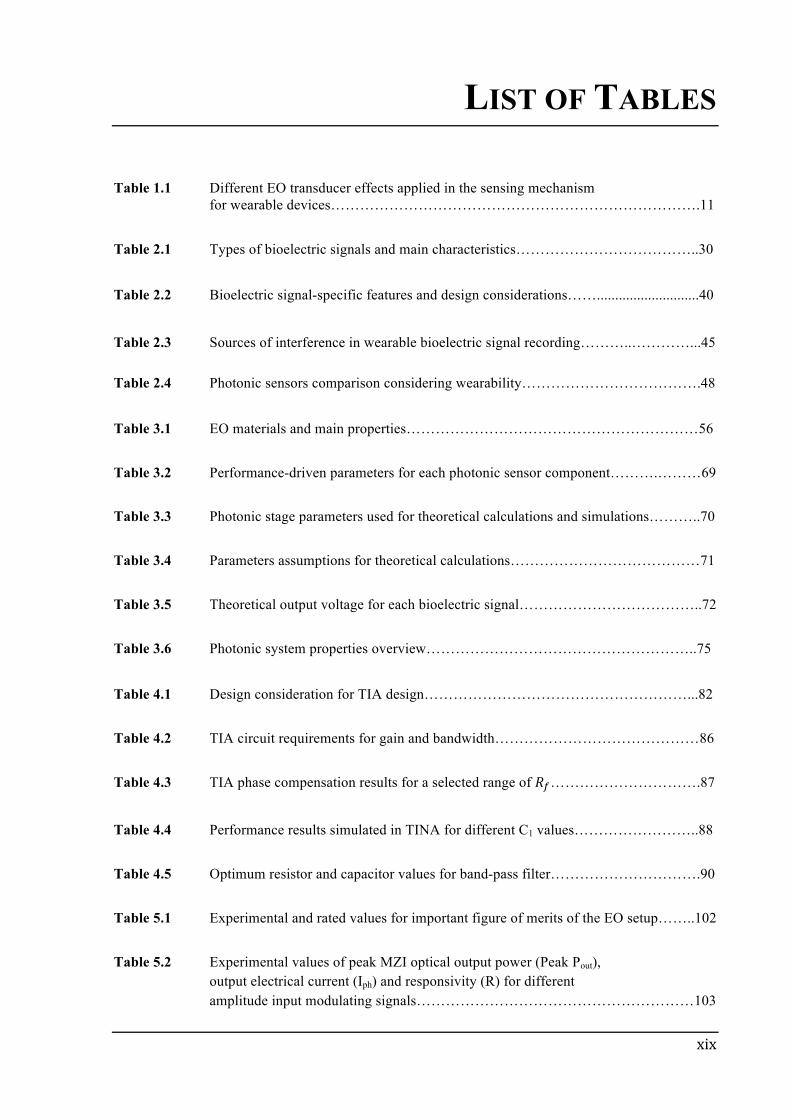
LIST OF TABLES
Table 1.1 Different EO transducer effects applied in the sensing mechanism for wearable devices………………………………………………………………….11
Table 2.1 Types of bioelectric signals and main characteristics………………………………..30
Table 2.2 Bioelectric signal-specific features and design considerations……............................40
Table 2.3 Sources of interference in wearable bioelectric signal recording………..…………...45
Table 2.4 Photonic sensors comparison considering wearability……………………………….48
Table 3.1 EO materials and main properties……………………………………………………56
Table 3.2 Performance-driven parameters for each photonic sensor component……….………69
Table 3.3 Photonic stage parameters used for theoretical calculations and simulations………..70
Table 3.4 Parameters assumptions for theoretical calculations…………………………………71
Table 3.5 Theoretical output voltage for each bioelectric signal………………………………..72
Table 3.6 Photonic system properties overview………………………………………………..75
Table 4.1 Design consideration for TIA design………………………………………………...82
Table 4.2 TIA circuit requirements for gain and bandwidth……………………………………86
Table 4.3 TIA phase compensation results for a selected range of !!………………………….87
Table 4.4 Performance results simulated in TINA for different C1 values……………………..88
Table 4.5 Optimum resistor and capacitor values for band-pass filter………………………….90
Table 5.1 Experimental and rated values for important figure of merits of the EO setup……..102
Table 5.2 Experimental values of peak MZI optical output power (Peak Pout), output electrical current (Iph) and responsivity (R) for different amplitude input modulating signals…………………………………………………103
List of Tables Photonic platform for bioelectric signal acquisition in wearable devices
xx
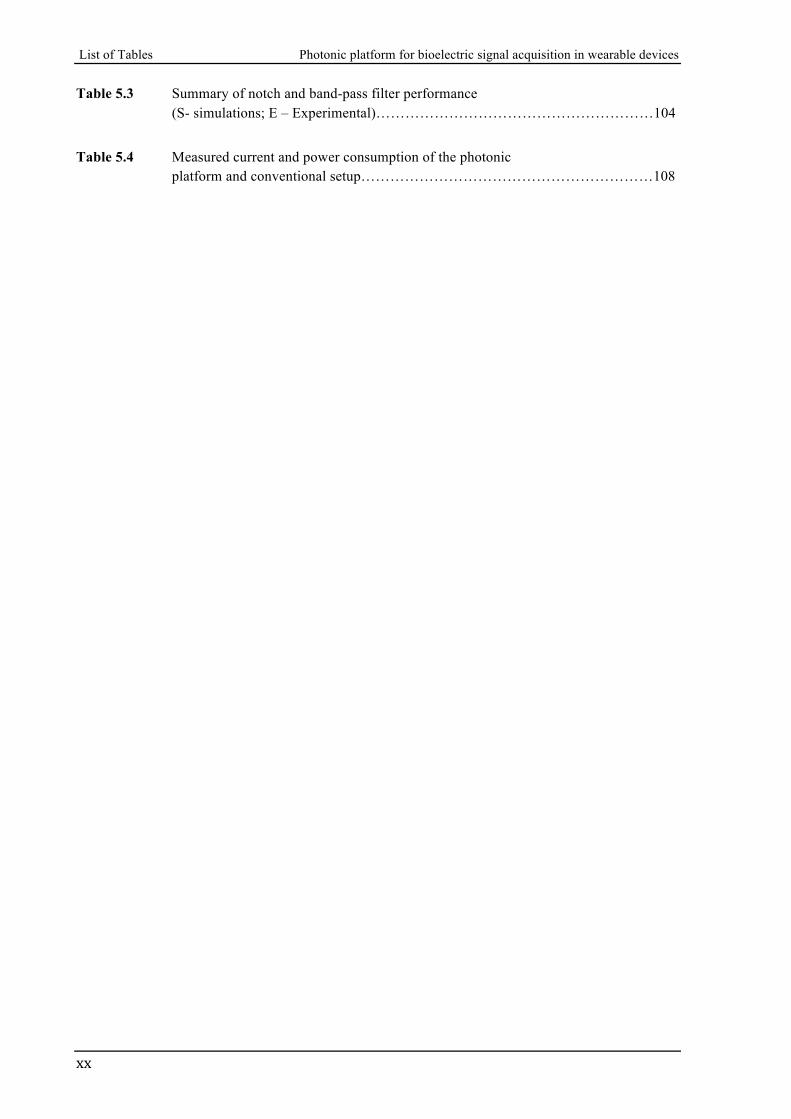
Table 5.3 Summary of notch and band-pass filter performance (S- simulations; E – Experimental)…………………………………………………104
Table 5.4 Measured current and power consumption of the photonic platform and conventional setup……………………………………………………108
xxi
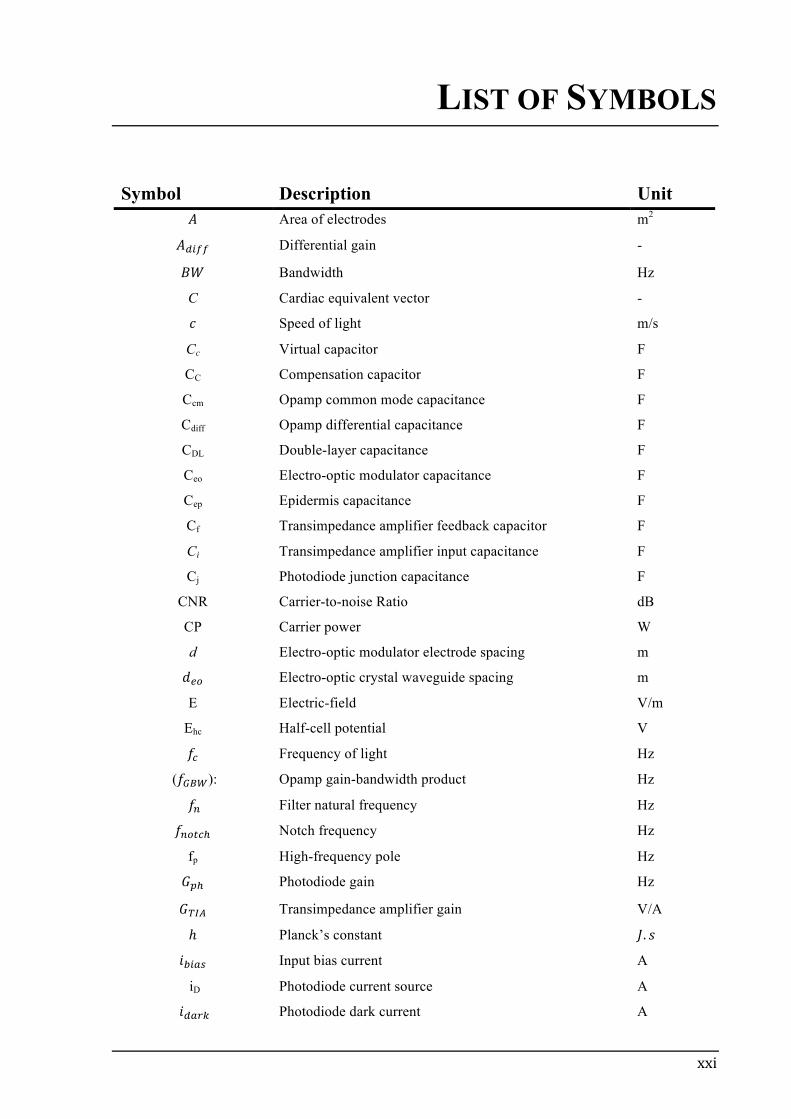
LIST OF SYMBOLS
Symbol Description Unit ! Area of electrodes m2
!!"## Differential gain -
!" Bandwidth Hz
C Cardiac equivalent vector -
! Speed of light m/s
Cc Virtual capacitor F
CC Compensation capacitor F
Ccm Opamp common mode capacitance F
Cdiff Opamp differential capacitance F
CDL Double-layer capacitance F
Ceo Electro-optic modulator capacitance F
Cep Epidermis capacitance F
Cf Transimpedance amplifier feedback capacitor F
Ci Transimpedance amplifier input capacitance F
Cj Photodiode junction capacitance F
CNR Carrier-to-noise Ratio dB
CP Carrier power W
d Electro-optic modulator electrode spacing m
!!" Electro-optic crystal waveguide spacing m
E Electric-field V/m
Ehc Half-cell potential V
!! Frequency of light Hz
(!!"#): Opamp gain-bandwidth product Hz
!! Filter natural frequency Hz
!!"#$! Notch frequency Hz
fp High-frequency pole Hz
!!! Photodiode gain Hz
!!"# Transimpedance amplifier gain V/A
ℎ Planck’s constant !. !
!!"#$ Input bias current A
iD Photodiode current source A
!!"#$ Photodiode dark current A
List of Symbols Photonic platform for bioelectric signal acquisition in wearable devices
xxii
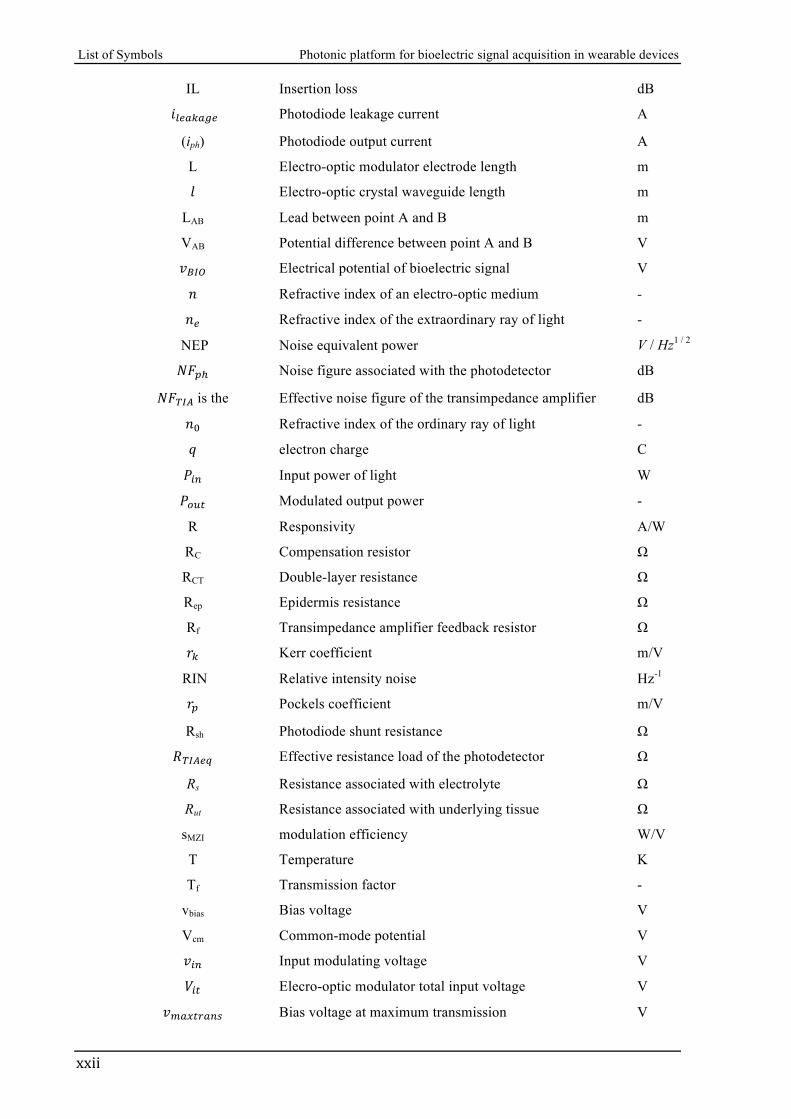
IL Insertion loss dB
!!"#$#%" Photodiode leakage current A
(iph) Photodiode output current A
L Electro-optic modulator electrode length m
! Electro-optic crystal waveguide length m
LAB Lead between point A and B m
VAB Potential difference between point A and B V
!!"# Electrical potential of bioelectric signal V
! Refractive index of an electro-optic medium -
!! Refractive index of the extraordinary ray of light -
NEP Noise equivalent power V / Hz1 / 2
!"!! Noise figure associated with the photodetector dB
!"!"# is the Effective noise figure of the transimpedance amplifier dB
!! Refractive index of the ordinary ray of light -
! electron charge C
!!" Input power of light W
!!"# Modulated output power -
R Responsivity A/W
RC Compensation resistor Ω
RCT Double-layer resistance Ω
Rep Epidermis resistance Ω
Rf Transimpedance amplifier feedback resistor Ω
!! Kerr coefficient m/V
RIN Relative intensity noise Hz-1
!! Pockels coefficient m/V
Rsh Photodiode shunt resistance Ω
!!"#$% Effective resistance load of the photodetector Ω
Rs Resistance associated with electrolyte Ω
Rut Resistance associated with underlying tissue Ω
sMZI modulation efficiency W/V
T Temperature K
Tf Transmission factor -
vbias Bias voltage V
Vcm Common-mode potential V
!!" Input modulating voltage V
!!" Elecro-optic modulator total input voltage V
!!"#$%"&' Bias voltage at maximum transmission V
xxiii
!!"# Minimum detected voltage V
!!"#$%&#' Bias voltage at minimum transmission V
!!"# Transimpedance amplifier output voltage V
!!! Thermal voltage V
!! Noninverting electrical potential at the input of the
amplifier
V
!! Inverting electrical potential at the input of the amplifier V
vπ Half-wave voltage V
! Electro-optic crystal width m
Zt Total impedance Ω
Zin Input impedance Ω
∆! Phase variation rad
!! Medium permittivity -
!! Relative static permittivity -
! Quantum efficiency -
λ Wavelength m
ϕ Phase shift rad
!! High–pass cut-off frequency rad/s
!! Low–pass cut-off frequency rad/s

xxv
LIST OF TERMS
Term Designation Ag Silver
ASE Amplified spontaneous emission
AV Atrioventricular node
BCI Brain-computer interface
CdTe Cadmium telluride Cl Chloride
CMMR Common-mode rejection ratio
CMOS Complementary metal-oxide-semiconductor
CW Continuous wave
EAP Electroactive polymer
ECG Electrocardiogram
ECoG Electrocortigram
EEG Electroencephalograms
EMG Electromyogram
EO Electro-optic
EOG Electroocculogram
ENG Electroneurogram
ERG Electroretinogram
GTWM Georgia Tech Wearable Motherboard
IC Integrated circuit
InGaAs Indium gallium arsenide
KD*P Potassium dideuterium phosphate
LA Left arm
LL Left leg
LED Light-emitting devices
LiNbO3 Lithium niobate
LiTaO3 Lithium tantalite
MM Multimode
List of Terms Photonic platform for bioelectric signal acquisition in wearable devices
xxvi
MRI Magnetic resonance imaging
MZI Mach-Zehnder interferometer
MU Motor units
OE Optoelectronic
OSA Optical spectrum analyzer
PCB Printed circuit board
PC-CLD-1 Polycarbonate with CDL-1 chromophore
PDA Personal digital assistant
PIC Photonic integrated circuit
PM Polarization maintaining
PMMA-CDL1 Poly(methylmethacrylate) with CDL-1 chromophore
PVDF Polyvinylidene fluoride
RA Right arm
RF Radiofrequency
SA Sinoatrial node
Si Silicium
SLED Superluminescent light-emitting diode
SM Single mode
SNR Signal-to-noise ratio
TF Transfer function
TIA Transimpedance amplifier
UV Ultraviolet
WHO World Health Organization
ZnTe Zinc telluride