Embed Size (px)
Citation preview


National Employment Agency 1 | 71
Acknowledgments
This report presents the findings of the employer survey conducted in Cambodia by the National
Employment Agency (NEA), under the technical support of the Swedish International Development
Cooperation Agency (SIDA). NEA expresses our sincere gratitude to Mr. Lars-Ake Svensson, the
Project Director of SIDA Project “Support Skills Development and Employment for Youth in
Cambodia”, for his initiative and support of the study. In addition, we offer our gratitude and special
thanks to technical staff at Arbetsformedlingen, the Swedish Public Employment Service, who provide
invaluable advice on designing questionnaires, developing the list of occupations, analysis and making
relevant suggestions to improve the report. For this, we express our most sincere thanks to Mr. Torbjorn
Israelsson and Mr. Jens Sandahl, Labour Market Specialists. We appreciate their expertise and
dedication in enhancing the quality of the report.
This study is only possible with the initiative and technical support of H.E. Dr. HONG Choeun, the
Head of NEA. At the same time, we address our thanks to Mr. TOUCH Sophat, Chief of Information
Collection and Dissemination (ICD), and Mr. Phoung Sam Ath, Deputy Chief of ICD for their help and
support throughout the course of the survey, particularly during the field work. We also thank Dr. HAY
Hunleng, Deputy Head of NEA, for his time in reviewing and providing feedback. We thank Mrs. LY
Vouchcheng, Deputy Head of NEA; Mr. KIM Keoreaksmey, Deputy Head of NEA; and Mrs. Dy
ChangKolney, Chief of the Planning and Cooperation Unit of NEA for their cooperation and
administrative supports during the survey process. We offer our thanks to all Directors of Job Center of
NEA for their most valued time and their support to the realisation of this study.
For conducting this research, particularly for the work in data cleaning, coding, tabulation, analysing, and
report writing, we acknowledge NEA’s research team members: Mr. KUOCH Somean, Deputy Head of
NEA; Mr. KY Sereyvuth, Advisor of NEA; Ms. LY Reasey, and Ms. UNG Channeary, NEA officials.
Finally, we offer our thanks to all contacted establishments for their generous cooperation and
agreement to be interviewed, as well as their valued time answering our questions. We also thank NEA
staff whose names have not been mentioned here, but have shared time, supported and contributed to
this report.
2 | 71 National Employment Agency
Table of Contents
1. Introduction ...................................................................................................................................... 9
2. Overview of Cambodian Labour Market ....................................................................................... 10
2.1. Economic situation................................................................................................................. 10
2.2. Labour Market Situation ........................................................................................................ 11
2.2.1. Demographic Trends ............................................................................................................ 11
2.2.2. Education and Skills Attainment ......................................................................................... 14
2.2.3. Employment and Demand trend .......................................................................................... 15
3. Establishments’ Characteristics and Market Development ........................................................... 17
3.1. Establishments’ Characteristics ............................................................................................. 17
3.2. Market Development and outlook for the coming years ....................................................... 19
3.3. Business Development Strategies .......................................................................................... 20
3.4. Capacity Utilization ............................................................................................................... 21
4. Demand of Labour ......................................................................................................................... 22
4.1. Employment Growth by Sector ............................................................................................. 22
4.2. Employment Structure ........................................................................................................... 22
4.3. Turnover Rates by Sector and Occupation ............................................................................ 24
5. Recruitment Situation .................................................................................................................... 25
5.1. Incidence and Density of Vacancies by Sector ...................................................................... 25
5.2. Recruitment Difficulties by Sector ........................................................................................ 26
5.3. Skills Shortages by Sector ..................................................................................................... 30
5.4. Impacts of recruitment difficulties ......................................................................................... 33
6. Skills Gaps and Workforce Development...................................................................................... 36
6.1. Incidence and Density of Skills Gaps by Sector .................................................................... 36
6.2. Causes of Skills Gaps............................................................................................................. 37
6.3. Workforce Development ........................................................................................................ 38
6.4. Work’s Preparedness of First Time Jobseekers ..................................................................... 41
7. Conclusion ..................................................................................................................................... 43
Bibliography ......................................................................................................................................... 47
Appendix ................................................................................................................................................ 48

National Employment Agency 3 | 71
List of Tables
Table 2.1: Cambodian GDP growth rates; 1993-2017........................................................................... 10
Table 2.2: Education level of population aged 15-64 by age group in 2016. ........................................ 14
Table 2.3: Actual and Forecast Employment Growth Rate by Sector, 1993-2019 ................................ 16
Table 3.1: Ownership of establishments and registration rates by sectors ............................................ 19
Table 4.1: Employment growth by sector .............................................................................................. 22
Table 4.2: Distribution of employment by ISCO major group, sex and nationality in 2017................. 23
Table 4.3: Classification of four broad occupation groups .................................................................... 23
Table 5.1: Distribution and density of vacancies by sector ................................................................... 26
Table 5.2: Distribution of vacancies by sector and occupation ............................................................. 26
Table 5.3: Distribution and density of hard to fill vacancies by sector ................................................. 28
Table 5.4: Distribution and density of hard to fill vacancies by occupation ......................................... 28
Table 5.5: Distribution and density of skills shortages vacancies by sector (% of total vacancies) ...... 31
Table 5.6: Distribution and density of skills shortages vacancies by occupation
(% of total vacancies) ........................................................................................................... 32
Table 5.7: Top 5 of skills shortages by occupation in 2017 .................................................................. 33
Table 5.8: Top 5 of skills shortages by sector in 2017 .......................................................................... 33
Table 6.1: Top 5 training courses offered in 2017 by sector ................................................................. 40
Table 6.2: Skills and competence that need to improve by educational level ....................................... 42
List of Figures
Figure 2.1: Cambodian GDP share by sector; 1993-2017 ..................................................................... 10
Figure 2.2: Total population; yearly average growth rate; 1950-2020 .................................................. 12
Figure 2.3: Population structure by age and gender in Cambodia, 2018 and 2030 ............................... 12
Figure 2.4: Cambodian training age population by age group; yearly values in thousands
from 1950 to 2100 ............................................................................................................... 13
Figure 2.5: Cambodian WAP (15-64); annual entries, exits and total balance;
1970-2100 (in thousands) .................................................................................................... 13
Figure 2.6: Total employed people aged 15-64; distribution by educational attainment;
2009 and 2016 ..................................................................................................................... 15
Figure 2.7: Employed people aged 15-64 by sectors, 2004 &2007-2016 ............................................. 15
Figure 3.1: Outlook of demand for goods and services ......................................................................... 19
Figure 3.2: Share of establishments that planned to introduce new products, services or
technologies or to expand or switch to new market ............................................................ 20
Figure 3.3: Approaches that establishment intended to adopt to introduce new products,
services or technologies or to expand or switch to new market .......................................... 21
Figure 3.4: Capacity utilization among personnel by sector .................................................................. 21
Figure 4.1: Share of employment by broad occupation group and sector in 2017 ................................ 24
Figure 4.2: Average turnover rates ........................................................................................................ 24

4 | 71 National Employment Agency
Figure 5.1: Share of establishment with at least one vacancies by sector ............................................. 25
Figure 5.2: Index of recruitment difficulties by sector .......................................................................... 27
Figure 5.3: Share of establishments reporting hard to fill vacancies
(% of establishments with at least one vacancy) ................................................................. 27
Figure 5.4: Causes of hard to fill vacancies (% of establishment reporting hard to fill vacancies) ...... 29
Figure 5.5: Share of establishments with skills shortage vacancies
(% of establishments with at least one vacancy) ................................................................. 30
Figure 5.6: Type of skills shortage (% of establishments reported skills shortage) .............................. 32
Figure 5.7: Impact of recruitment difficulties on recruitment process
(% of establishments reporting recruitment difficulties) ...................................................... 34
Figure 5.8: Share of establishment refraining from trying to recruit because of
recruitment difficulties (% of total establishments with recruitment difficulties) .............. 35
Figure 5.9: Density of hidden vacancies by sector (% of total vacancies) ............................................ 35
Figure 5.10: Measures taken to address hard-to-fill vacancies .............................................................. 36
Figure 6.1: Share of establishments affected by skills gaps by sector ................................................... 36
Figure 6.2: Density of skills gaps by sector ........................................................................................... 37
Figure 6.3: Density of skills gaps by ISCO major group ....................................................................... 37
Figure 6.4: Factors associated with employees not performing to the required level ........................... 38
Figure 6.5: Share of establishment providing training in 2017 ............................................................. 38
Figure 6.6: Share of establishment having training plan and budget ..................................................... 39
Figure 6.7: Training courses offered in 2017 (% of establishments providing training) ....................... 39
Figure 6.8: Difficulty in organizing training courses in 2017
(% of establishments providing training) ............................................................................ 40
Figure 6.9: Reasons for difficulty in organising training course
(% of establishment having difficulty in organizing training courses) ............................... 41
Figure 6.10: Share of establishment hiring first time jobseeker in 2017
(% of total establishments) ................................................................................................. 41
Figure 6.11: Index of employers’ perception on first time jobseekers .................................................. 42

National Employment Agency 5 | 71
Executive Summary
Aims of the study
Cambodia has relied on labour intensive manufacturing and low skilled service sectors to support its
growth. As the country develops toward an emerging market economy, more sophisticated production
processes and high-skilled labour force are required to sustain its rapid growth, as well as to compete in
global markets. Thus, as stated in the Rectangular Strategy Phase III (2014 to 2018), the Royal
Government of Cambodia has emphasized that growth, employment, equity and efficiency are key
objectives in Cambodia’s economic and social development planning. In addition, the Cambodia’s
Industrial Policy (IDP) 2015-2025, which was adopted in 2015, highlighted a new growth strategy aiming
at transforming and modernizing industrial structure from a labour intensive to a skill-based one, as well
as linking Cambodian industry and economy with the global value chain and integrate them into regional
production networks.
Nevertheless, the link between education and vocational training, and industrial policies is weak. The
government, thus, launched various employment and human development policies such as National
Employment Policy (NEP) 2015-2025 and National Technical and Vocational Education and Training
Policy 2017-2025, in 2015 and 2017 respectively in order to enhance skills and human resources
development to meet the country’s development and market demands. Therefore, the employer skill need
survey, which is a demand-side survey or employers’ survey, aims at understanding the needs of
employers, and will be beneficial in tackling labour market problems in the future.
Specifically, the employer survey 2017 is the fourth installment of the survey conducted previously by
National Employment Agency (2012, 2014, and 2015). This survey is the key primary data source on
employer demand for and investment in skills. During the survey, 605 establishments are interviewed at
the national level across 10 important sectors, which are the major driving engines for employment
generation as well as having a greater share in Cambodia’s GDP. The 10 selected sectors include Food
and Beverages; Garment, Apparel and Footwear; Rubber and Plastics; Construction; Finance and
Insurance; Accommodation; Transportation; Warehouse and Logistics; Health; Education; and
Information and Communication Technology (ICT). Regarding the size of the establishment, the survey
covered establishments employing 10 employees or more because those establishments were more likely
to provide accurate data on jobs and staff turnover by occupation and were able to provide a good estimate
of future skills demands.
The survey covers topics such as the characteristics of the selected sectors, their employment structures,
and especially the work readiness of first time job-seekers, recruitment difficulties, skills shortages, skills
gaps, workforce training, and business strategies. Additionally, using the findings from this study, we try
to underline the key information on skills shortages, skills gaps, and skills mismatches in Cambodia. This
report offers insightful information to its readers, especially policymaker or decision-maker, inducing
them to come up with more appropriate and more effective actions or solutions for short-term or long-
term development perspectives.
Establishments’ characteristics
The 605 sampling establishments represents the total establishments of 4,571, accounting for about
962,972 employments in 2017. The establishments interviewed were relatively young. Only 5.6% started
their business before 1993, 6.6% started during 1993-1997, while other 87.7% started theirs after 1998.
The most common type of business entity is individual proprietor representing 60.6% of total
establishments, followed by private limited establishments (12.8%). Last but not least, general partnership
comes in third place with 9.8%.
Around two-third of establishments (65.5%) are owned by Cambodians, while 22.9% of establishments
are owned by foreigners and the rest of 9.2% are joint ownership. The survey shows that 71.0% of
6 | 71 National Employment Agency
Cambodian owned establishments, 99.0% of foreign owned establishments, and 97.5% of joint ownership
establishments are registered with Ministry of Commerce or other related institutions.
The majority of establishments sell their products or services in domestic market, accounting for 72.6%
of total establishments, while the rest of 27.4% targets international market via either direct means or
through an intermediary.
As for employment distribution; garments, footwear and apparel; accommodation; food and beverage,
and finance and insurance; are the sectors absorbing the most employments. Together, these four sectors
accounted for 80.3% of the total number of establishments, employing 90.1% of total employment
covering by the survey.
Market development
The aggregated demand for all these sectors was at the boundary between balance and high demand in
2017, and are expected to slightly increase in 2018 and 2019. Finance and insurance, ICT, education, and
health sectors experienced the higher demand in 2017 compared to 2016 and are expected to have a
continued high demand for both 2018 and 2019. Complimentary to the assessment of demand, the results
of the survey show consistently that the highest proportion of establishments planning to introduce new
products, services or technologies, and to acquire new markets in the next year were in the education
sectors (86.3% of total establishments within this sector), followed by finance and insurance (80.6%).
Overall, 45.7% of all establishments planned to introduce new products, services or technologies or to
expand or switch to new market in 2018.
Employment structure and turnover rates
One noteworthy observation that emerged from the survey was the positive employment growth between
2016 and 2017 and its expectation for the upcoming two years 2018 and 2019. Between 2016 and 2017,
the total employment level of ten sectors increased by a positive growth rate of 1.5%, approximately
14,123 additional jobs and it is expected to continue its increasing trend with an annual growth rate of
2.2% between 2017 and 2019, equivalent to the annual creation of 21,546 additional jobs.
An analysis by occupation shows that the skill level required for the jobs was quite low. Plant and machine
operators had the largest share, accounting for 62.2% of total employment. Craft and related trades
workers and elementary occupations together accounted for 15.4% of the workers. In the occupations that
required at least a high school diploma, technicians accounted for 4.8% of the total employments,
professionals for 3.4%, and managers for 3.7%.
The turnover rate is defined by the percentage of staff in the total employed people that leaves during a
certain period of time. According to the survey, the average turnover rate of the ten investigated sectors
was 16.5% during 2017, and this is higher compared to 13.7% in 2016. In 2017, the highest turnover rate
(22.5%) was found in accommodation sector, followed by rubber and plastics (18.8%), and garment,
footwear, and apparel sector (17.2%). In 2018, the employers seem to be optimistic and expected the
turnover rate to be lowered to around 6.2%. The expected turnover rate in 2018 has quite the same pattern
as the previous year.
Recruitment situation
More than one third of the establishments (37.1%) declared having available vacancies, a decrease by
17.3% compared to the previous survey. However, the percentage varied between different sectors;
Finance and insurance sector stood in the first rank and the last ranks was food and beverage sector. Job
vacancies in 2017 were reported of 6,421 vacancies during the fieldwork of survey, a decrease of 2,376
vacancies compared to 2015. This decline was mainly due to the lower labour demand in garment,
footwear and apparel of -3,388.

National Employment Agency 7 | 71
The survey also pointed out that the available vacancies' reporting by the ten sectors were concentrated in
three main occupations: plant and machine operators, and assemblers (32.1%), which is mainly driven by
its high number in garment, footwear, and apparel sector which already took 90.1% of the available
vacancies in this sector; technical and associated professionals (18.5%), and sale and services workers
(16.4%).
The study also reported that around 47.5% of establishments with vacancies claimed to have experienced
recruitment difficulties. This proportion was varied across sectors from the highest value of 77.9% in
accommodation to the minimum of 7.3% in rubber and plastics.
The vacancies which were difficult to fill were measured by density of hard-to-fill vacancies: the vacancies
which were likely hard-to-fill were those of technician and associate professionals (70.2%), managers
(61.9%), service and sale workers (41.0%), professionals (39.1%), elementary occupations (30.6%),
clerical and support workers (27.1%), craft and related trades workers (22.3%), plant and machine
operators and assemblers (8.9%), and skilled agricultural workers (0.9%).
When asked why vacancies were hard to fill, the most usual cause (41.0%) was low number of applicants with
the required skills. This first reason suggested that the education system has not yet produced enough skilled
workers to respond to the demands of employers. The second reason was there were too much competition
from other employers. The third reason was linked to the lack of work experiences the company demands.
In overall, the perceived causes of hard-to-fill vacancies vary according to sector, notable differences include:
- Too much competition from other employers was very pronounced in accommodation, finance
and insurance, garment, health, ICT, and logistics.
- Not enough people interested in doing this type of job was more likely to cause hard-to-fill
vacancies in accommodation, finance and insurance, health and ICT
- The low number of applicants with the required skills was pronounced in in accommodation,
education, finance and insurance, garment, health, ICT, and rubber and plastics.
- Low of number of applicants in general caused the main problem of hard-to-fill vacancies for the
sector of accommodation, education, food and beverage, and garment.
- Lack of work experience demanded by the company was particularly the cause of hard-to-fill
vacancies in the accommodation, construction, education, garment, health, and ICT.
- Low number of applicants with the required attitude, motivation or personality and poor career
progression/lack of prospects caused the major problems of hard-to-fill vacancies for the sector
of food and beverage.
About one-fourth of total establishments experience skills shortages (24.9% of establishments with at least
one vacancies). Notably, the highest proportion of establishment facing skills shortages was found in
accommodation with 44.5% of establishments with at least one vacancies, followed by health with 37.3%
and education with 33.0%. Finance and insurance, and ICT sectors followed with the proportion above
the average level,at 31.0% and 26.2% respectively.
The analysis of skills-shortage vacancies by major occupation and sector suggested that the skills
shortages affected:
in accommodation, mainly clerical and support workers (65.5%), followed by service and sales
workers (20.4%);
in construction, professionals (68.2%) and technicians and associated professionals (22.7%);
in education, professionals (87.7%);
in finance, technicians and associated professionals (87.2%), and service and sales workers (10.2%);
in food and beverages, service and sales workers (71.2%), and elementary occupations (22.7%);
in garment, plant and machine operators (67.9%), and professionals (13.6%);
in health, professionals (44.4%), technicians and associated professionals (22.2%), and service
and sales workers (11.1%);
in ICT, professionals (40.0%), technicians and associated professionals (33.8%), and service and
sales workers (22.5%);
8 | 71 National Employment Agency
in logistics, plant and machine operators (46.7%), managers (20.0%), and professionals (20.0%);
and in rubber and plastics, service and sales workers (66.7%), and professionals (33.3%).
The survey also tries to identify which skills are lacking among job-seekers. Foreign language skills,
which was the top skills lacking in previous survey in 2015, remained on the top spot of skills lacking
among job-seekers. The second rank was technical or practical skills, followed by customer handing, oral
communication, team work, and problem-solving skills.
Skill gaps and workforce development
The survey indicates that about one-third (29.2%) of the establishments interviewed declared to have
encountered the issue of skills gaps. Notably, the survey show that there were high skills gaps within the
construction and the finance and insurance sector (44.0% and 41.3%, respectively). Despite the high share
of establishments (29.2%) experiencing skill gaps, about 13,403 of total 962,972 workers (1.4%) were
considered to have skill gaps. Remarkably, “construction” was the highest in density of the skill gaps sector.
The main cause of skill gaps is “New to the role” reported by 41.9% of the establishments with skill gaps,
a reason that could be connected to the high turnover that characterizes the Cambodian labour market.
The second reason, cited by 24.2% of the establishments, was the fact that training is currently only
partially completed. Problem of retaining staff ranked only third in most cases with 19.4%.
Overall, during the 12 months preceding the survey, around one-fifths of establishments (15.9%) had
funds or arranged some forms of training for their employees, but this proportion is varied roughly across
different sectors; the highest percentage was found in finance and insurance sector (38.8%) and the lowest
one was in rubber and plastics sector (2.2%).
However, there is only 18.6% of all establishments providing training had both training plans and budget
that specified in advance, and also the level and type of training that would be needed in the coming year.
Some of establishments (28.0%) stated that, while having training budget, they had no training plan.
Among the establishments that stated to have had training in the last 12 months, 45.7% of them provided
training in technical or practical skills. Other trainings such as customer handling skills (40.8%) and oral
communication skills (35.1%) came second and third rank, respectively.
Among the establishments that provide training to their staff in the last 12 months, 22.0% of them
experienced difficulties in organizing training courses and/or finding trainers. This proportion is
particularly high in education section, where 54.0% of establishments within this sector encountered this
issue. The second one was in accommodation with 37.3%, followed by food and beverage (30.8%), health
(28.6%), and construction (27.7%).
Employers’ perception of first time jobseekers (FTJS)
Overall, 40.1% of all establishments hired first time jobseekers (FTJS) over the last 12 months. The rates
were found to be very high for some sectors such as finance and insurance (73.4%), education (71.0%),
health (58.9%), and construction (58.3%). In general, employers reported good level of work preparedness
of university graduates, which is better than any other graduates, particularly for finance and insurance,
rubber and plastics, and health sector. As for TVET graduates on the other hand, employers rated post-
secondary TVET better than pre-secondary TVET.
The poor work preparedness of FTJS are concentrated on four main areas: English language skills, poor
attitude/personality, lack of working world/life experience, and basic IT skills. The degree and types of
complaint depend on their education levels. Notably, among several skills, English language skills is
reported by all level of education. For pre-secondary TVET, it is particularly important to improve
attitude/personality, technical and practical skills, while lack of experiences is needed to reinforce for
post-secondary TVET schools. For university student, the knowledge of Basic IT and experiences has
become very important to find the first job.
National Employment Agency 9 | 71
1. Introduction
Cambodia has relied on labour intensive manufacturing and low skilled service sectors to support its
growth. As the country develops toward an emerging market economy, more sophisticated production
processes and high-skilled labour force are required to sustain its rapid growth, as well as to compete in
global markets. Thus, as stated in the Rectangular Strategy Phase III (2014 to 2018), the Royal
Government of Cambodia has emphasized that growth, employment, equity and efficiency are the key
objectives in Cambodia’s economic and social development planning. In addition, the Cambodia’s
Industrial Policy (IDP) 2015 - 2025, which was adopted in 2015, highlighted a new growth strategy aiming
at transforming and modernizing industrial structure from a labour intensive to a skill-based one, as well
as linking Cambodian industry and economy with the global value chain and integrate them into regional
production networks. Nevertheless, the link between education and vocational training, and industrial
policies is thin. The government, thus, launched various employment and human development policies
such as National Employment Policy (NEP) 2015 - 2025 and National Technical and Vocational
Education and Training (TVET) Policy 2017 - 2025, launched in 2015 and 2017, respectively in order to
enhance skills and human resources development to meet the country’s development and market demands.
However, there is still little discussions on how to make education and vocational training respond to
new or higher value-added activities targeted by IDP. If Cambodia commits to become a higher value-
added economy, building human capital that can manage new technology and be employed in the new
emerging or higher value-added sectors is a key success factor. Therefore, the identification of the new
or higher value-added sectors and the linking of education to those value-added activities is very
important.
Therefore, employer skill need survey, which is a demand-side survey or employers’ survey, aims at
understanding the needs of employers, and will be beneficial in tackling labour market problems in the
future. Hence, in order to be able to explain the nature of Cambodia’s labour market from the demand side,
605 establishments were interviewed at the national level across ten sectors, which have high growth
potential, and are major drivers of employment generation. These selected ten sectors are food and beverage;
garment, apparel and footwear; rubber and plastics; construction; finance and insurance; accommodation;
transportation, warehouse and logistics; human health; education; and information and communication
technology (ICT). In short, the main objectives of this survey are to contribute towards effective employment
and skills development policies by providing the necessary information required to:
Analyze the current Cambodian labour market situation
Explore employers’ perceptions of first time job seekers
Analyze the employment structure
Assess the skills shortages and skills gaps by occupations in each selected sector
Build a short term occupational barometer (please read a separated report on “Cambodia
Job Outlook 2018”)
Contribute to skills development programs coherent with the future labour demand
Allow designing and implementing of the employment related policies needed
Develop the labour market information system in Cambodia.
In order to provide structural and concise information, the structure of the study is as follows: Firstly,
the next part provides a brief summary of some basic information about the Cambodian labour market
covering the macro economic situation, demographic trends as well as the most relevant elements of
labour demand and supply. The other following parts focus on the main findings of the survey including:
(i) characteristics of establishment, market development and capacity utilization within the existing
workforce, (ii) employment structure and turnover, (iii) current situation of recruitment and skills
shortages, and (iv) skills gaps, workforce training, and work readiness of first time job-seekers. The last
part is a brief conclusion that recapitulates and highlights key findings for each sector.
10 | 71 National Employment Agency
2. Overview of Cambodian Labour Market
Before starting to analyze the results of the survey, it seems relevant to briefly summarize some basic
information about Cambodian economy, demographic trends, as well as the most relevant elements of
the evolution and structure of the education and training systems, and of the labour market. The
objective is to provide the background information necessary to better interpret the results of the survey.
2.1. Economic situation
After regaining peace and stability nation-wide in 1998, Cambodian economy began to pick up and
grew at a remarkably high rate, and enhanced by active open economic and export led policies. Since
then, remarkable inflows of both foreign aid and foreign direct investment (FDI) have been observed.
During 1998-2008, although it was affected by a violent political conflict and Asian financial crisis in
1997, Cambodia’s economic performance managed to achieve an average growth rate of GDP of 9.5%,
according to the data from ministry of economics and finance. During this period, the industrial sector
registered the highest growth with average annual rate of 15.3%, and was followed by service sector of
10.4% and agriculture sector of only 4.5%. Although, the good performance of economic growth was
negatively affected by the global financial crisis in 2008-2009, it rapidly recovered, and the average
growth rate of GDP between 2009 and 2017 was around 7.0% and industry still remain the engine of
growth by maintain its growth rate of 11.3%, followed by services and agriculture sector at 6.8%, and
2.1%, respectively. This had contributed to the doubling of GDP per capita from around USD 753 dollars
in 2009 to about 1,435 in 2017. Consequently, in 2015, Cambodia has moved from a low-income status
to a lower middle-income status as defined by the World Bank (2017).
Table 2.1: Cambodian GDP growth rates; 1993-2017
1993-1998 1998-2008 2008-2009 2009-2017e
Agriculture, Fishery & Forestry 5.0% 4.5% 5.4% 2.1%
Industry 12.1% 15.3% -9.5% 11.3%
Services 5.2% 10.4% 2.3% 6.8%
Annual Real GDP Growth 6.3% 9.5% 0.1% 7.0%
Source: Ministry of Economics and Finance
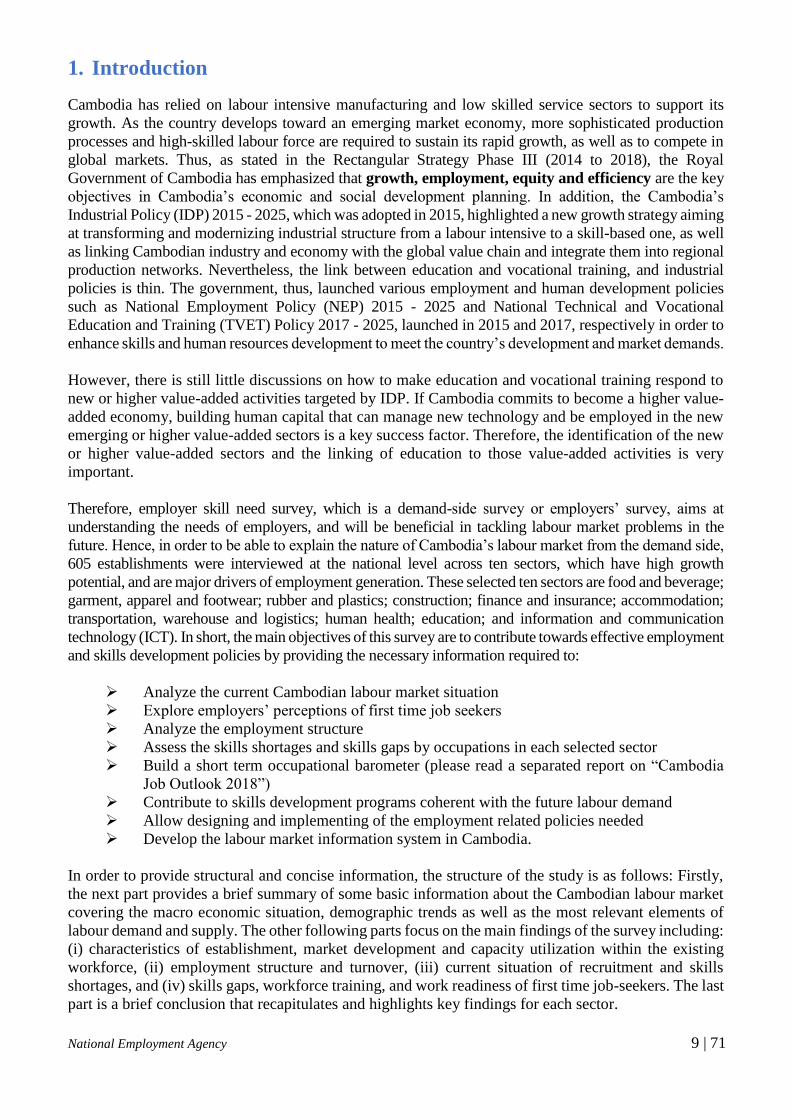
Figure 2.1: Cambodian GDP share by sector; 1993-2017
Source: Ministry of Economics and Finance
In addition to this vibrant performance of economic growth, dynamic changes in the economic structure
and the labour market landscape in Cambodia were also remarkable. Figure 2.1 presents the value-added
shares of each economic sector from 1993 to 2017. From the figure, it can be seen that the share of the
0%
10%
20%
30%
40%
50%
199
3
199
4
199
5
199
6
199
7
199
8
199
9
200
0
200
1
200
2
200
3
200
4
200
5
200
6
200
7
200
8
200
9
201
0
201
1
201
2
201
3
201
4
201
5
201
6
201
7e
Agriculture, Fishery & Forestry Industry Services

National Employment Agency 11 | 71
industrial sector in the GDP was almost triple between 1993 and 2017, while the share of the agriculture
decreased significantly over the same period. In 2017, however, the base of Cambodia is still
concentrated in a few sectors, i.e., crops, garment, construction, and tourism related sectors.
Along with this achievement of economic growth and development, a dynamic change in the labour
landscape is also observed. After the fall of the Khmer Rouge regime, Cambodia experienced a baby
boom in the 1980s and 1990s, in which the annual increase of the number of new births were about
401,000 in 1980-85 and 417,000 in 1990-95. As a result, the total population has increased from about
6.7 million in 1980 to an estimation of 16.3 million in 2018. The share of the population between the
ages of 15 and 64 was around 64.2% of the total population and the share of population ages below 24
was around 50.2% in 2018. There is no doubt that this abundance in the young working age population
has played an important role in supplying the labour force for the Cambodian economy. At the same
time, this economic performance, as mentioned above, has also played an important role in job creation
for a large share of the young population too. However, the labour force and labour market in Cambodia
are still facing challenges and issues, as will be discussed in this report.
In addition, from the Cambodia social economic survey data, the decrease in the share of employment in
the agricultural sector in total employment (aged 15-64) went from about 72.1% in 1993 to about 36.4%
2016, while the share of employment in the industrial sector increased from less than 5.0% to about 26.6%
over the same period. It is evident that the employment structure in Cambodia has evolved toward a more
industry-based pattern with the economic growth and development over the 1990s to 2010s.
2.2. Labour Market Situation
2.2.1. Demographic Trends
Before examining the current situation of labour market in Cambodia, it is important to understand its
demographic trends. During the Khmer Rouge regime between 1975 and 1979, about one third of the
Cambodian population died from starvation, diseases and massacre. Cambodia is currently in the
“demographic transition”, which is defined as the passage from a traditional demographic regime (high
fertility and high mortality) to a modern demographic regime (low fertility and low mortality).
Specifically, the fertility rates in 1980-85 were 6.4%, but it progressively declined to about 2.5% in
2015-2020, whilst the deaths declined from 716 thousand to 472 thousand during the same period. In
the early stage of the transition, it generates the new wave of new-born children with increasing
magnitude, and followed by waves of decreasing magnitude. For instance, after the war, Cambodia
experienced the baby boom in the 1980s and 1990s. The number of births climbed to its maximum
yearly average value of 368 thousand in the 1980-85 period from a value of 315 thousand in the previous
five-year period. But in the following years started to progressively decline, and it is now estimated at
around 358.8 thousand in 2017.As a result, the total population increased from about 6.7 million in 1980
to 15.6 million in 2015.
In this situation, the trend in total population has been determined mainly by the trend in births. As
shown in table below, the yearly average growth of total population has progressively declined in the
last 30 years from a value of 3.0% during 1980s to a present still rather consistent value of 1.5% during
2015-2020. As a result, the total population has increased from about 6.7 million in 1980 to an
estimation of 16.3 million in 2018.

12 | 71 National Employment Agency
Figure 2.2: Total population; yearly average growth rate; 1950-2020
Source: United Nations Population Division, World Population Prospects: The 2015 Revision.
The population pyramid in Figure 2.3 below illustrates the population structure by age and gender in
Cambodia in 2018 and 2030. For the most recent pattern in 2018, the figure indicates that the population
under age 35 accounts for the very large share in the Cambodian population, accounting for 68.0% of
the total population in 2018. This young and dynamic population continues to play important roles in
the future, as indicated in the figure below, and can have various socio-economic consequences. It can
be a good resource or a burden for Cambodia, depending on how they can be transformed into good
human capital for the country’s development. For gender structure, in general, the total female
population size is slightly larger than that of the male population. The share of female population was
around 51.2% of the total population in 2018.
Figure 2.3: Population structure by age and gender in Cambodia, 2018 and 2030
Source: United Nations Population Division, World Population Prospects: The 2015 Revision.
In the last 30 years, the abrupt demographic revolution we have just described has obliged Cambodia
to face two notable demographic challenges related; the first is the increase in School Age Population
(SAP), the second is the explosion of Working Age Population (WAP). The SAP, here defined between
6 and 24, and divided in 4 age-groups that correspond to the four educational levels present in
Cambodia: Primary school (6-11); Lower-secondary school (12-14) (together these two age groups form
the compulsory school age population); Upper-secondary school (15-17) and University (18-24).
15 10 5 0 5 10 15
0-4
10-14
20-24
30-34
40-44
50-54
60-64
70-74
80-84
90-94
100+
%Male_2030 Female_2030 Female_2018 Male_2018

National Employment Agency 13 | 71
Between 1980 and 2015, SAP had more than doubled from 3 million to 6 million due to the sudden
increase in the number of births registered in 1980s. The dynamic of the four age groups has been quite
different because abrupt magnitude in the number of new born children have affected these four groups
in different moments in time. Obviously, it was the primary school age population that was the first to
be affected by the increase in the number of births. This age group was increased more than double
between 1980 and 2000 and then reached about 2 million cohorts annually between 2000 and 2015. The
Lower-secondary school population followed with a maximum value of 1.08 million in 2005. It was
then the turn of the upper-secondary population, in which will reach its maximum of 1.1 million during
2030-2035 and university population will peak about 2.4 million during 2035-40.
Figure 2.4: Cambodian training age population by age group; yearly values in thousands from 1950
to 2100
Source: United Nations Population Division, World Population Prospects: The 2015 Revision.
Another big demographic challenge faced by Cambodia was the extraordinary increase in working age
population (WAP). WAP, aged 15-64, increased from about 4 million in 1980 to about 10.5 million in 2018.
However, the annual increase in WAP had already passed its peak of about 315 thousand in 1999 (Figure 2.4).
Its rate of growth has declined steadily from 4.6% in 1995-00 to 1.5% in 2015-2020. Under this demographic
pressure, if the labour force participation rate remained 84.0% as in its level in 2016, Cambodian economy
need to generate 118.3 thousand additional jobs in order to maintain its level of employment rate.
Figure 2.5: Cambodian WAP (15-64); annual entries, exits and total balance; 1970-2100 (in thousands)
Source: United Nations Population Division, World Population Prospects: The 2015 Revision.
-
1,000
2,000
3,000
4,000
5,000
6,000
7,000
1950
1955
1960
1965
1970
1975
1980
1985
1990
1995
2000
2005
2010
2015
2020
2025
2030
2035
2040
2045
2050
2055
2060
2065
2070
2075
2080
2085
2090
2095
2100
Primary education (6-11)
Lower secondary (12-14)
Upper secondary (15-17)
University (18-24)
-100
0
100
200
300
400
19
70
19
75
19
80
19
85
19
90
19
95
20
00
20
05
20
10
20
15
20
20
20
25
20
30
20
35
20
40
20
45
20
50
20
55
20
60
20
65
20
70
20
75
20
80
20
85
20
90
20
95
21
00
Balance Entries Exits

14 | 71 National Employment Agency
WAP in Cambodia will continue to have positive growth till 2045 and then it is projected to
progressively decline due to the continuing decline in both population generational entries defined by
the people who become 15 years old, and balances represented by people 15 years or older who die or
migrate to other countries. After that, Cambodia will probably face issues related to labour shortage,
which other countries in region has already been facing such as Singapore, Malaysia and Thailand.
2.2.2. Education and Skills Attainment
As a consequence of the civil war,1 the educational attainment of the Cambodia population remains
extremely limited, in spite of the good progress registered by the educational system in the last 3
decades. The education level of population aged 15-64 has its details in table 2.2 below for each age
group. The data from this table shows that there is a steady increase in school enrolment rates over time,
reflected by the decrease in the share of the Cambodian labour force with no or only some education.
This effect can be seen by comparing age groups of the share of labour force with none or only some
education. About 9.9% of the population aged 15-64 has “none or only some education”, compared to
only 2.8% in the youngest age group and to 22.5% in the eldest age groups.
Table 2.2: Education level of population aged 15-64 by age group in 2016.
Age
Group
None or
only some
education
Primary
school not
completed
Primary
school
completed
Lower
secondary
completed
Upper
secondary
completed
Higher
education Total
15-24 94,226 610,461 1,290,696 840,263 285,517 249,072 3,370,235
25-34 192,630 750,088 766,508 454,477 248,876 319,920 2,732,499
35-44 224,124 658,707 411,170 187,433 109,347 94,027 1,684,809
45-54 288,547 659,975 299,057 162,214 72,720 43,671 1,526,183
55-64 213,885 487,265 151,683 69,983 21,188 7,609 951,613
Total 1,013,412 3,166,497 2,919,115 1,714,370 737,648 714,298 10,265,340
Row percentage 15-24 2.8 18.1 38.3 24.9 8.5 7.4 100.0
25-34 7.0 27.5 28.1 16.6 9.1 11.7 100.0
35-44 13.3 39.1 24.4 11.1 6.5 5.6 100.0
45-54 18.9 43.2 19.6 10.6 4.8 2.9 100.0
55-64 22.5 51.2 15.9 7.4 2.2 0.8 100.0
Total 9.9 30.8 28.4 16.7 7.2 7.0 100.0
Source: NEA’s calculation based on CSES 2016
This data also suggests that, although endowed with labour surplus, Cambodia’s labour force is still
characterized by low-education and low-skills. 40.7% of the population aged 15-64 have no schooling
or have not completed primary education, while only 14.2% have an upper secondary diploma or more.
In addition to this, given the high employment to population ratio (83.9% in 2016), the educational
attainment of the employed does not notably differ from that of the corresponding population. In 2009,
56.1% of the employed had less than primary education and 6.5% an upper secondary diploma or more
(Figure 2.5). Between 2009 and 2014 the improvement was considerable. There were still around 42.0% of
the employed that had less than primary education. Nevertheless, the percentage of people with at least
compulsory education having however increased from 18.2% to 29.0%. In 2016, the push toward higher
education was not yet felt and the percentage of people with higher diploma slightly increased by 4.6
percentage points.
1 During the Khmer Rouge period, the Cambodia education system was systematically abolished: publishing houses were
closed, teaching materials and textbooks destroyed, the buildings of schools and universities put to other uses. Large numbers
of qualified teachers, researchers and technicians either fled the country or died.
National Employment Agency 15 | 71
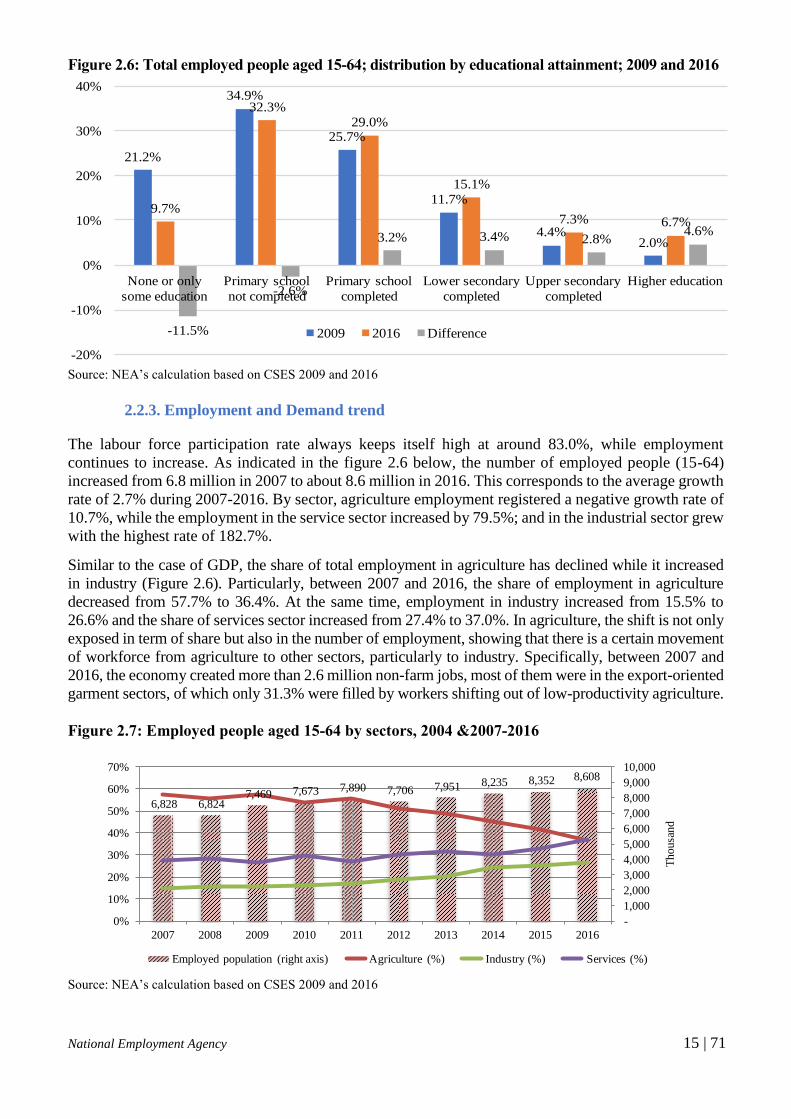
Figure 2.6: Total employed people aged 15-64; distribution by educational attainment; 2009 and 2016
Source: NEA’s calculation based on CSES 2009 and 2016
2.2.3. Employment and Demand trend
The labour force participation rate always keeps itself high at around 83.0%, while employment
continues to increase. As indicated in the figure 2.6 below, the number of employed people (15-64)
increased from 6.8 million in 2007 to about 8.6 million in 2016. This corresponds to the average growth
rate of 2.7% during 2007-2016. By sector, agriculture employment registered a negative growth rate of
10.7%, while the employment in the service sector increased by 79.5%; and in the industrial sector grew
with the highest rate of 182.7%.
Similar to the case of GDP, the share of total employment in agriculture has declined while it increased
in industry (Figure 2.6). Particularly, between 2007 and 2016, the share of employment in agriculture
decreased from 57.7% to 36.4%. At the same time, employment in industry increased from 15.5% to
26.6% and the share of services sector increased from 27.4% to 37.0%. In agriculture, the shift is not only
exposed in term of share but also in the number of employment, showing that there is a certain movement
of workforce from agriculture to other sectors, particularly to industry. Specifically, between 2007 and
2016, the economy created more than 2.6 million non-farm jobs, most of them were in the export-oriented
garment sectors, of which only 31.3% were filled by workers shifting out of low-productivity agriculture.
Figure 2.7: Employed people aged 15-64 by sectors, 2004 &2007-2016
Source: NEA’s calculation based on CSES 2009 and 2016
21.2%
34.9%
25.7%
11.7%
4.4%2.0%
9.7%
32.3%
29.0%
15.1%
7.3% 6.7%
-11.5%
-2.6%
3.2% 3.4% 2.8%4.6%
-20%
-10%
0%
10%
20%
30%
40%
None or only
some education
Primary school
not completed
Primary school
completed
Lower secondary
completed
Upper secondary
completed
Higher education
2009 2016 Difference
6,828 6,824 7,469 7,673 7,890 7,706 7,951 8,235 8,352 8,608
-
1,000
2,000
3,000
4,000
5,000
6,000
7,000
8,000
9,000
10,000
0%
10%
20%
30%
40%
50%
60%
70%
2007 2008 2009 2010 2011 2012 2013 2014 2015 2016
Th
ousa
nd
Employed population (right axis) Agriculture (%) Industry (%) Services (%)

16 | 71 National Employment Agency
The level of employment of 8.6 million people corresponded with an employment-to-population ratio
of 83.9%. The share of female worker is around 48.4%. The employment connected with agriculture,
forestry and fishery was around 28.2% and 13.3% in elementary occupations. These two major-
occupations register a very high percentage of people with low education. The amount of people
employed in technicians and associated professionals, and professional occupation (that would require
higher education) together still represent around 3.9% of total employment.
Table 2.3: Actual and Forecast Employment Growth Rate by Sector, 1993-2019
1993-2014 1993-1998 1998-2008 2008-2009 2009-2014 2014-2019
Total 217,569 192,703 214,819 670,251 157,400 139,083
Agriculture 50,355 148,730 20,751 674,999 -113,739 -109,814
Crops 4,565 112,142 -85,114 675,210 -57,782 -26,671 Livestock & Poultry 30,742 20,883 69,520 -43,100 -22,188 -39,642
Forestry & Logging 5,105 6,601 15,876 74,551 -31,823 -17,367
Fisheries 9,943 9,103 20,468 -31,662 -1,946 -26,134 Industry 87,370 32,058 80,046 58,021 163,200 99,241
Mining 1,225 -209 -33 17,624 1,894 4,145
Food, Beverages & Tobacco 5,483 5,172 9,691 -12,270 929 -4,082
Textile, Wearing Apparel & Footwear 43,987 17,342 25,784 55,526 104,731 55,689 Wood, Paper & Publishing 4,544 2,875 16,135 -43,353 -7,390 -11,267
Rubber Manufacturing 582 -201 -20 100 2,663 1,058
Other Manufacturing 4,455 -2,875 5,643 5,840 9,131 15,237
Construction 25,389 8,600 19,877 -14,532 61,188 36,836 Utilities 1,706 1,354 2,969 49,087 -9,946 1,624
Services 79,844 11,916 114,022 -62,769 107,939 149,656
Trade 24,952 3,428 50,782 -69,004 13,607 64,580
Hotel & Restaurants 12,641 637 1,265 187,371 12,451 55,181
Transport & Communications 10,988 -1,898 15,400 -12,617 19,772 13,634
Finance 2,850 651 -143 14,842 8,637 8,258 Public Administration 4,357 380 6,366 -29,994 11,185 5,638
Real Estate & Business 12,554 -353 17,251 -36,944 25,968 8,275
Other services 11,501 9,070 23,101 -116,423 16,319 -5,911
Source: NEA’s forecast based on CSES data from 1993-2014 and sectoral macro forecasting 1993-2019 of Ministry of
Economics and Finance (unpublished paper)
Based on the forecasting of NEA, the annual employment growth rates are -3.0%, 4.5%, and 5.2% for
agriculture, industry and services, respectively, and the overall annual employment growth rate is
projected to be 1.6% during 2014 and 2019. The major observation from this work are following:
The services sector is expected to be an important driver of employment activities in the
economy for 2014-2019. The fastest employment annual growth rates are expected in services
sectors of hotels and restaurants (14.9%) and finance (10.3%), and then followed by industrial
sector (mining) (9.1%) and other manufacturing (6.0%). The major increases in employment (in
terms of absolute number) are likely to happen in trade (64,580), garment (55,689), hotel and
restaurant (55,181), construction (36,836), other manufacturing (15,237), and transport and
communication (13,634), as shown in the table below.
The structural adjustments in the agricultural sector will be important to manage the structural
shifts in the economy from agriculture to manufacturing and services activities in the economy.
The most significant decline in absolute and relative terms is expected for the agricultural
occupation (peasant), which is expected to decrease by 243,738 annually over the period of
2014-2019. This a continuous trend which is observed over the last decade.

National Employment Agency 17 | 71
We will also observe large decline in demand for employment related to 'none and only some
education' in terms of relative share and absolute number. This could lead to structural
unemployment in the economy.
The share of 'none and only some education' employment dropped from 63.8% in 2003 to 47.5%
in 2014, and is expected to further decline to 37.2% in 2019. In terms of absolute number, the
employment linked to none or only some education is estimated to drop by half in 2019
compared to its level in 2014, which equal to 642,924. The most dramatic decline is likely to
occur in agriculture, which accounting 78.0% of the total employment is declining between 2014
and 2019. As expected, this type of employment is expected to decline in industrial sector by
74,787 between 2014 and 2019, and by 62,562 in service sector.
In the future, the presence of technical skills requiring at least compulsory education plays a
fundamental role in allowing Cambodia to diversify to higher value added as well as to move to high
productive employment, the insufficiency of the general education system represents the primary
bottleneck for the socio-economic development of Cambodia.
3. Establishments’ Characteristics and Market Development
3.1. Establishments’ Characteristics
This section describes the key characteristics of the establishments’ populations estimated from the
survey, and more specifically may or may not on their establishment and employment representation,
business registration, size, occupation concentration, and ownership’s nationality by sector. The
observations are weighted using the establishment sampling weights or employment sampling weights
in order to obtain the representative distribution of establishments or employment in the population (see
details in appendix-A). The 605 sampling establishments are representing the 4,571 of total
establishments, accounting for about 962,972 employments as of 2017. Briefly by sector, there are ten
sectors that are undergoing investigation such as accommodation; construction; education; finance and
insurance; food and beverage; garment, footwear and apparel; health; ICT; logistic, warehousing and
transportation; and rubber and plastics.
First, establishments in accommodation sector share about 15% of total establishments and cover 3.7% of
employment. They are mostly owned by Cambodians, and half of them were established after 2008.
Furthermore, the majority of occupations in this sector concentrated on services and sales workers and
elementary occupations covering about 33.9% and 24% of total employment in this sector, respectively.
As for sizes of this sector, they are shared evenly among small (10-19), medium (20-99) and large (100+).
Second, construction sector comprises of only a small amount of percentage share of both
establishments (2.5%) and employment (0.8%) in the sampling frame. This is due to the short-term
contracts basis type of employment. Despite the small share in terms of establishments and
employments distribution, construction sector is currently one of the highly demand sector in terms of
goods and services and is expected to continue its increase in the upcoming year (see figure 3.1).
Moreover, occupations’ concentration in this sector are craft and related trades workers; plant and
machine operators, and assemblers; and elementary occupations covering about 19%, 20.3%, and
19.2%, respectively. Establishments in construction sector are mostly medium and small size (63.1% &
25.4%, respectively) and about 30% are operated under private limited establishment.
Third, education sector is on the right track with the increasing number of private and public school
since ownership of establishments in education sector comprises of individual proprietor and state
owned which is a comparable reflection on its continuous increase in demand for services. In addition,
education sector represents 2.9% of total establishments in the sampling frame and 1.5% of total
employment. More than 70% of occupations in education sector are high skilled workers ranging from

18 | 71 National Employment Agency
technical and associated professionals up to managerial level. This sector mostly comprises of medium
and large size establishments and 40% are stated owned while the rest are private owned.
Fourth, finance and insurance, which shares 9.8% of total establishments and 8% of total employment,
are the most phenomenal demanded sector and surprisingly are evenly owned by Cambodians and a
joint ownership with foreigners (43.3% & 32.9%, respectively). Most of finance and insurance
establishments are not individual proprietors; they are either general partnership or limited partnership
with 22% and 22.3% of total establishments respectively, operating in this sector. Without a doubt, the
main occupations in this sector are from services and sales workers up to managerial level; naturally,
clerical support workers and technical and associated professionals share the most of employment by
32.2% and 28.5%, respectively.
Fifth, establishments in food and beverage sector are mostly owned by Cambodians and are individual
proprietors representing 12% of overall establishments and 1.7% of total employment. More than 70%
of the establishments in this sector are in medium and large size, and the registration rate in these two
sizes are considerably low/below average. In addition, occupations are concentrated on service and sales
workers and elementary occupations covering about 55% of total employment in this sector.
Sixth, garment, footwear and apparel is one of the most shared establishments and employment cover up
to 43.6% and 77.4%, respectively; however, the demand for goods and service for this sector increase at
a slower rate compared to other nine sectors. Differing from establishments in food and beverage sector,
establishments in garment, footwear and apparel sector have a low registration rate in all sizes especially
in small and medium size (41.9% & 38%, respectively); in addition, most of the unregistered
establishments are owned by Cambodians. Furthermore, this sector employment is concentrated on skilled
manual workers, specifically 79.8% are plant and machine operators and assemblers. In addition, more
than half of establishments in garment, footwear and apparel sector orient to export market either directly
or through an intermediary; therefore, this sector is exposed to more external risk than any other sector.
Seventh, health sector which is mostly owned by government (66%) is consistently 100% registered in
Ministry of Commerce, mostly are established before 2002 (78.3%), and the size of the establishments
mostly are small (62.3%) and medium (24.6%). Notably, health sector is the most demanded sector for
both goods and services given a small share of establishments (2.8%) and employment (0.9%). In
addition, due to its nature, health sector employs only high skilled workers (70% of total employment
within this sector).
Eighth, ICT is one the sector known for high demand of goods and services, newly established (about
70% of establishments in ICT sector were established after 2008), and the predominantly owned by
foreigners. Given high demand of goods and services, more than half of total establishments in ICT
sector are relatively small size; still this sector employs 1.4% of total employment and represents 4.1%
of total establishments. In addition, employment in ICT sector mostly concentrates on technicians and
associate professionals and service and sales worker (24.8% & 25.5%, respectively).
Ninth, logistic, warehousing and transportation whose sector share 4.3% of total establishments and
employment 1% of total employments is mostly individual proprietor and private limited
establishments. Furthermore, the most occupation concentration in this sector are technicians and
associated professionals (16.8%), plant and machine operators, and assemblers (19.5%), and elementary
occupations (25.2%), and as for sizes this sector is shared evenly.
Finally, rubber and plastics sector whose sector is mostly owned by foreigners shares 3.1% of total
establishments and employs 3.4% of total employment, and is one of the most employed skill in
agricultural, forestry and fishery profession (46.6%). Furthermore, in terms of demand for goods and
services, this sector is not doing well, the second worse after food and beverage, given that about half
of the establishments are large size.

National Employment Agency 19 | 71
Table 3.1: Ownership of establishments and registration rates by sectors
Sector Ownership (%) Registration
Rates (%) Cambodian Foreign Joint share
Accommodation 89.9 9.1 1.0 99.0
Construction 79.4 16.8 3.8 95.3
Education 96.2 2.3 1.5 100.0
Finance and insurance 45.1 20.7 34.2 100.0
Food and beverage 96.7 2.9 0.5 75.2
Garment, footwear and apparel 55.2 34.1 10.6 63.0
Health 87.9 4.7 7.4 100.0
ICT 42.5 39.5 18.0 98.7
Logistics, warehousing and transportation 81.2 16.6 2.2 91.8
Rubber and plastics 43.7 54.4 1.8 90.7
Total 65.5 22.9 9.2 79.9
N (total weighted establishments) = 4,571
3.2. Market Development and outlook for the coming years
The NEA’s ESNS 2017 included series of questions to ask establishments to evaluate the level of demand
for goods or services in 2017, and in the coming years of 2018 and 2019. This indicator could serve as the
proxy of the business cycle for different sectors, as reflected by the average weighted index of demand of
single establishments. The average weighted assessment of the demand for goods and services ranges
between 1 and 3. The higher the value means the higher demand for goods and services compared to the
previous year. In order to simplify the interpretation of this weighted value, the results are classified as
following in scales: If the value is below 1.8, it means that it is in less demand, If it is between 1.8 and
2.2, it means that there is a balance between supply and demand of goods and services and if it is more
than 2.2, it means that there is higher demand for goods and services.
Figure 3.1: Outlook of demand for goods and services
N (total weighted establishments) = 4,571
The result of survey shown that finance and insurance, ICT, education, and health sectors experienced
a higher demand in 2017 compared to 2016 and are expected to have a continued high demand for both
2018 and 2019. Construction; and logistics, warehousing and transportation faced a balanced demand
for goods and services in 2017, but their demands are evaluated to be on the path of increase for 2018
and 2019. For garment and accommodation, the assessment for demand was in balance in 2017, and are
0 2 4 6 8 10 12 14 16 18 20
0.0
0.5
1.0
1.5
2.0
2.5
3.0
Foo
d an
d be
vera
ge
Gar
men
t, fo
otw
ear
and
appa
rel
Rub
ber
and
plas
tics
Con
stru
ctio
n
Acc
omm
odat
ion
Fin
ance
and
insu
ranc
e
ICT
Log
istic
s, w
areh
ousi
ng a
nd
tran
spor
tatio
n
Edu
catio
n
Hea
lth
Tota
l
2017 2018 2019

20 | 71 National Employment Agency
expected to be in balance in 2018 and more likely to increase in 2019. At the same time, food and
beverage, and rubber and plastics sector faced a balanced demand in 2017, and were evaluated to
maintain same magnitude in 2018 and 2019. Overall, the aggregated demand for all these sectors was
at the boundary between balance and high demand in 2017, and are expected to slightly increase in 2018
and 2019.
3.3. Business Development Strategies
Complimentary to the index of demand, the results of the survey shown consistently that the highest
proportion of establishments planning to introduce new products, services or technologies, and to
acquire new markets in the next year were found in education sectors 86.3% of total establishments
within this sector, followed by finance and insurance (80.6%), health (60.4%), and construction
(58.0%). For the other sectors, these proportions ranged between the minimum of 34.9% in garment,
footwear and apparel and 49.8% in accommodation. Overall, 45.7% of all establishments planned to
introduce new products, services or technologies or to expand or switch to new market in 2018.
Figure 3.2: Share of establishments that planned to introduce new products, services or
technologies or to expand or switch to new market
N (total weighted establishments) = 4,571
To meet the objective of introduce new products, services, or technologies, or to expand to new markets,
most of the establishments (68.3%) put at first place the policy of training of their current staffs, before
the policy on recruitment new staffs, or internal re-organisation to better use available staffs and
competences.

National Employment Agency 21 | 71
Figure 3.3: Approaches that establishment intended to adopt to introduce new products, services
or technologies or to expand or switch to new market
N (weighted establishments) = 2,088
3.4. Capacity Utilization
A very relevant issue identified by the survey is the level of capacity utilization among personnel in
establishments operating in Cambodia. This suggests that if an establishment has a low level of capacity
utilization among existing personnel or does not fully utilize the capacity of its personnel, the establishments
theoretically can increase their production by improving the capacity utilization of its workers before
recruiting additional staff. In contrast, if it is high, the establishments can only increase the productions or
expansion of their business activities by recruiting new workers. In overall, the establishments indicated that
capacity utilization among their existing personnel was about 93.6%. The level of this capacity utilization
varied quite modestly from one sector to another ranging. The highest value was found in the garment,
footwear, and apparel sector at 97.8%, while the lowest one was in ICT sector at 77.7%.
Combining this data with the index of demand for goods and services, overall establishments will most
likely recruit new, additional workers to increase their productivity in order to respond to future demand
in 2017, particularly establishments in the garment, footwear and apparel; food and beverage; and rubber
and plastics.
Figure 3.4: Capacity utilization among personnel by sector
N (total weighted establishments) = 4,571
96.4 97.8 93.3 89.0 87.8 88.6 77.7
87.9 88.1 87.9 93.6
0102030405060708090
100
Fo
od
an
d b
ev
era
ge
Garm
en
t, f
ootw
ear
an
d a
pp
are
l
Ru
bb
er
an
d p
lastics
Co
nstr
ucti
on
Acco
mm
odatio
n
Fin
ance a
nd
insura
nce
ICT
Log
isti
cs,
ware
hou
sin
g a
nd
tran
spo
rtatio
n
Edu
catio
n
Health
Overa
ll

22 | 71 National Employment Agency
4. Demand of Labour Employment Growth by Sector
One noteworthy observation that emerged from the survey was the positive employment growth between
2016 and 2017 and its expectation for the upcoming two years 2018 and 2019. Between 2016 and 2017,
the total employment level of ten sectors increased by a positive growth rate of 1.5%, approximately
14,123 additional jobs and it is expected to continue its increasing trend with an annual growth rate of
2.2% between 2017 and 2019, equivalent to the annual creation of 21,546 additional jobs.
Of course, the expected growth is different among sectors. The sector that was estimated to have the
fastest annual growth rate for 2017-2019 is food and beverage sector (7.5%), followed by finance and
insurance (5.7%), and ICT sector (5.7%). The garment, footwear and apparel sector, with the largest
share of employment, also was estimated to a positive annual growth rate of 1.5% from 2017 to 2019.
Other sectors were also expected to have positive growth rates; ranging from 4.0% in accommodation
to the lowest one of 1.3% in the construction sector.
The largest contribution to employment growth between 2017 and 2019 is expected to come from the
garment, footwear and apparel sector (52.6%), followed by finance and insurance (21.5%), and food
and accommodation (6.9%) as complementary to their high expectation on demand for goods and
services as discussed in previous section.
Table 4.1: Employment growth by sector
Sector 2016 2017 2018 2019
2017-2019
Annual
absolute
change
Annual
growth
rate
(%)
Contribution
to change
(%)
Food and beverage 16,815 17,035 17,788 19,672 1,319 7.5 6.1
Garment, footwear and apparel 742,737 742,944 760,399 765,630 11,343 1.5 52.6
Rubber and plastics 30,760 32,858 34,763 34,911 1,026 3.1 4.8
Construction 7,135 7,542 7,624 7,743 101 1.3 0.5
Accommodation 34,652 36,680 38,534 39,633 1,476 4.0 6.9
Finance and insurance 73,882 78,611 83,822 87,863 4,626 5.7 21.5
ICT 12,757 14,012 15,429 15,639 814 5.7 3.8
Logistics, warehousing and
transportation 9,010 10,233 10,867 10,902 334 3.3 1.6
Education 13,378 14,561 14,757 15,176 308 2.1 1.4
Health 7,724 8,497 8,775 8,896 199 2.3 0.9
Total 948,850 962,972 992,757 1,006,064 21,546 2.2 100.0
N (total weighted employment) = 962,972
4.2. Employment Structure
It is also important to look at the employment structure of the selected sector in order to understand the
level of skill required. An analysis by ISCO major occupation shows that the skill level required for the
jobs was quite low. Plant and machine operators accounting for 62.2% had the largest share. Craft and
related trades workers; and elementary occupations accounted for another 15.4% of the workers. In the
occupations that require at least a high school diploma, technicians accounted for 4.8% of the total
employments, professionals for 3.4%, and managers for 3.7%.
The proportion of female in the total employment is about 58.3%. The highest proportion is found in
elementary occupations for 71.4% and the lowest one is craft and related trades workers for 31.0%.
However, the majority of female worked as plant and machine operators, and assemblers mostly due to
high number of this occupation in garment sector.

National Employment Agency 23 | 71
Foreign workers accounted for 1.4% of total employment. However, the majority of them work in
managerial position 61.6%, which equals to 22.6% of employed people in this type occupation.
Table 4.2: Distribution of employment by ISCO major group, sex and nationality in 2017
N (total weighted employment) = 962,972
The workforce structure by major occupation differed substantially between sectors. Hence, in order to
illustrate the characteristics of each sector in relation to education and skill level, the nine ISCO major
groups were regrouped into four broad occupation groups.
Table 4.3: Classification of four broad occupation groups
Broad occupation group ISCO major group Skill level High skilled ISCO_1: Managers
ISCO_2: Professionals
ISCO_3: Technician and associated professionals
Tertiary
(ISCED 5-6)
Skilled non-manual ISCO_4: Clerical support workers
ISCO_5: Service and sale workers Secondary
(ISCED 2-4) Skilled manual ISCO_6: Skilled agricultural, forestry, and fishery workers
ISCO_7: Craft and related trades workers
ISCO_8: Plant and machine operators and assemblers
Unskilled ISCO_9: Elementary occupations Primary (ISCED 1)
The result, shown in figure 4.1, illustrates that the more educated segment of the labour force (high
skilled) played major roles in the education (76.2%), health (69.8%), finance and insurance (49.6%),
ICT sector (48.5%), construction (34.6%), and logistic (31.3%). Skilled non-manual was predominant
in accommodation (50.6%), and also played consistent roles in finance and insurance sector (41.8%),
and the ICT (40.3%). The garment (85.1%), and food and beverage (78.9%) sector specialized in skilled
manual workers. This group of occupation also plays a major role in construction (39.6%). At the same
time, unskilled labour represented the majority of employment in the food and beverage (33.5%),
logistic (25.2%), accommodation (24.0%). The detailed distribution of employment by ISCO major
group and sector is presented in appendix D.
Total_female Total_male Foreign workers Total Total_female Total_male Foreign workers Total
Managers 16,305 19,723 8,137 36,028 2.9% 4.9% 61.6% 3.7%
Professionals 10,104 22,162 1,780 32,267 1.8% 5.5% 13.5% 3.4%
Technicians and associate professionals 17,574 28,518 1,259 46,092 3.1% 7.1% 9.5% 4.8%
Clerical support workers 23,045 20,549 319 43,594 4.1% 5.1% 2.4% 4.5%
Service and sales workers 15,615 19,019 95 34,634 2.8% 4.7% 0.7% 3.6%
Skilled agricultural, forestry and fishery 11,243 11,246 - 22,489 2.0% 2.8% 0.0% 2.3%
Craft and related trades workers 14,718 32,836 24 47,554 2.6% 8.2% 0.2% 4.9%
Plant and machine operators, and assemblers 381,029 218,227 1,411 599,256 67.8% 54.4% 10.7% 62.2%
Elementary occupations 72,139 28,919 187 101,058 12.8% 7.2% 1.4% 10.5%
Total 561,773 401,199 13,213 962,972 100.0% 100.0% 100.0% 100.0%
Female Male Foreign workers Total
Managers 45.3% 54.7% 22.6% 100.0%
Professionals 31.3% 68.7% 5.5% 100.0%
Technicians and associate professionals 38.1% 61.9% 2.7% 100.0%
Clerical support workers 52.9% 47.1% 0.7% 100.0%
Service and sales workers 45.1% 54.9% 0.3% 100.0%
Skilled agricultural, forestry and fishery 50.0% 50.0% 0.0% 100.0%
Craft and related trades workers 31.0% 69.0% 0.0% 100.0%
Plant and machine operators, and assemblers 63.6% 36.4% 0.2% 100.0%
Elementary occupations 71.4% 28.6% 0.2% 100.0%
Total 58.3% 41.7% 1.4% 100.0%
Absolute value Column percentage
Row percentage
Occupational group
Occupational group

24 | 71 National Employment Agency
Figure 4.1: Share of employment by broad occupation group and sector in 2017
N (total weighted employment) = 962,972
4.3. Turnover Rates by Sector and Occupation
Staff turnover is a natural part of business in each sector; however, a high staff turnover rate can be a serious
obstacle to productivity, quality, and profitability (related costs of new recruitment and training). The
turnover rate is defined by the percentage of staff in a workforce that leaves during a certain period of time.
According to the survey, the average turnover rate of ten investigated sectors was 16.5% during 2017, and
this is higher compared to 13.7% in 2016. In 2017, the highest turnover rate (22.5%) was found in
accommodation sector, followed by rubber and plastics (18.8%), and garment, footwear, and apparel sector
(17.2%). The other sectors had turnover rate below the average; with the lowest rates found in the sector of
education, and health (figure below). Overall, the employers seem to be optimistic and expect the turnover
rate to be lower in 2018 around 6.2%. The expected turnover rate in 2018 has quite the same pattern as the
previous year (2017): high rate for accommodation, and rubber and plastics sector; and low rate for education
and health sector. However, it is important to note that garment, footwear, and textile is more optimistic than
others to expect its turnover rate to go down to 5.3%, which is lower than the average of last years.
Figure 4.2: Average turnover rates
N (total weighted employment) = 962,972
0% 10% 20% 30% 40% 50% 60% 70% 80% 90% 100%
Garment, footwear and apparel
Rubber and plastics
Accommodation
Food and beverage
Logistics, warehousing and transportation
Construction
ICT
Finance and insurance
Health
Education
High skilled Skilled non manual Skilled manual Unskilled

National Employment Agency 25 | 71
5. Recruitment Situation
This section discusses the current recruitment situation and defines hard-to-fill vacancies and skills
shortages in the Cambodian labour market in the selected sectors. Specifically, it illustrates and
evaluates the abilities of the Cambodian labour market to respond to labour demand by employers, and
the level of hard-to-fill vacancies. Moreover, it identifies the causes of recruitment difficulties in each
ISCO major and in each selected sector. Last but not least, it examines the effects of hard-to-fill
vacancies on business prospects, and the measures used to address those problems.
5.1. Incidence and Density of Vacancies by Sector
More than one third of the establishments (37.1%) declared available vacancies, a decrease by 17.3%
compared to the previous survey. However, the percentage varied between different sectors as shown
in the figure below. Finance and insurance sector stood in the first rank and the last ranks was food and
beverage sector.
Figure 5.1: Share of establishment with at least one vacancies by sector
N (total weighted establishments) = 4,571
The table below refers to the distribution of vacancies and the density of vacancies, as measured by the
ratio of vacancies to total employment by sector. Job vacancies in 2017 were reported at 6,421 vacancies
during the fieldwork of survey, a decrease of 2,376 vacancies compared to 2015. This decline was
mainly due to the lower labour demand in garment, footwear and apparel of -3,388. However, the
garment, footwear and apparel sector is still main sector of driven employment, since it alone already
took 31.4% of the share due to its high number in total employment in the sector compared to other
sectors, and it was followed by accommodation (21.2%), and finance and insurance (19.0%). At the
same time, the share of other sectors ranged between 5.7% in logistic, warehousing, and transportation
and the lowest proportion of 1.4% in health. In terms of density, accommodation (11.3%) and food and
beverage (7.2%) sectors were in the first and second places, respectively. The garment, footwear and
apparel sector, which had the largest share of vacancies, recorded about 2.2% in terms of density of
vacancies. In general, the vacancy density was 4.0%.
The survey also pointed out that the available vacancies reported by ten sectors were concentrated in three
main ISCO groups: plant and machine operators, and assemblers (32.1%), which is mainly driven by its
high number in garment, footwear, and apparel sector which already took 90.1% of the available vacancies
in this sector, technical and associated professionals (18.5%), and sale and services workers (16.4%).

26 | 71 National Employment Agency
Table 5.1: Distribution and density of vacancies by sector
Sector Distribution (%) Density (%)
Accommodation 21.2 11.3
Construction 2.5 4.6
Education 5.5 5.4
Finance and insurance 19.0 6.2
Food and beverage 5.5 7.2
Garment, footwear and apparel 31.4 2.2
Health 1.4 2.1
ICT 3.8 5.1
Logistics, warehousing and transportation 5.7 6.8
Rubber and plastics 4.0 3.4
Total 100.0 4.0
The result differs when the analysis is broken down by each sector. For instance, the proportion of
available vacancies associated with professionals was very high for education (76.3%) and health sector
(76.1%), but extremely low in rubber and plastics (0.4%); garment, footwear and apparel (0.5%); and
accommodation (1.9%).
Table 5.2: Distribution of vacancies by sector and occupation
Sector ISCO_
1
ISCO
_2
ISCO
_3
ISC
O_4
ISC
O_5
ISC
O_6
ISC
O_7
ISC
O_8
ISCO
_9 Total
Accommodation 0.1 1.9 2.3 37.6 42.8 0.3 1.8 0.2 12.9 100.0
Construction 0.6 19.6 14.1 4.3 3.7 0.0 9.8 1.2 46.6 100.0
Education 1.1 76.3 5.4 6.9 8.0 0.0 1.7 0.0 0.6 100.0
Finance and insurance 0.4 2.6 84.0 7.4 5.0 0.0 0.0 0.0 0.6 100.0
Food and beverage 0.6 8.8 1.7 1.7 62.7 0.0 9.7 2.3 12.5 100.0
Garment, footwear and apparel 0.0 0.5 0.3 1.0 0.9 0.0 4.5 90.1 2.6 100.0
Health 3.4 76.1 12.5 4.5 2.3 0.0 1.1 0.0 0.0 100.0
ICT 0.8 42.9 21.1 3.2 21.5 0.0 10.5 0.0 0.0 100.0
Logistics, warehousing and
transportation 0.8 2.2 2.2 7.9 18.5 0.0 0.0 60.8 7.6 100.0
Rubber and plastics 0.0 0.4 0.4 0.4 4.7 89.5 0.0 4.7 0.0 100.0
Total 0.3 9.0 18.5 10.9 16.4 3.6 3.1 32.1 6.0 100.0
Note:
ISCO_1: Managers ISCO_6: Skilled agricultural, forestry, and fishery workers
ISCO_2: Professionals ISCO_7: Craft and related trades workers
ISCO_3: Technical and associated professionals ISCO_8: Plant and machine operators, and assemblers
ISCO_4: Clerical support workers ISCO_9: Elementary occupations
ISCO_5: Service and sales workers n (unweighted establishment with vacancies) =294
5.2. Recruitment Difficulties by Sector
Overall, the recruitment situation was evaluated to be difficult as reflected by the index value of 2.5. Some
sectors might have more difficulties in recruitment than others, and vice versa. The sectors that faced high
recruitment difficulties, where indexes were above 2.2, were accommodation; health; logistics,
warehousing, and transportation; food and beverage; finance and insurance; construction, and education.
The recruitment situation in garment, footwear, and apparel; and ICT sectors were in the boundary
between difficult and balance, between demand and supply of labour. At the same time, for rubber and
plastics sector, the recruitment situation is in the balance between demand and supply of labour. However,

National Employment Agency 27 | 71
the higher index of recruitment situation also means better opportunities for work, from the perspective
of a jobseeker. According to the result, there were good opportunities for jobs in those ten sectors.
Figure 5.2: Index of recruitment difficulties by sector
N (weighted establishments with hard-to-fill vacancies) = 1,696
The study also reported that around 47.5% of establishments with vacancies claimed to have
experienced recruitment difficulties. This proportion was varied across sectors from the highest value
of 77.9% in accommodation sector to the minimum of 7.3% in rubber and plastic sector, as shown in
the figure below. In addition, share of establishments reporting hard to fill vacancies above average are
finance and insurance; food and beverage; education; health; logistics, warehousing and transportation;
and accommodation.
Figure 5.3: Share of establishments reporting hard to fill vacancies (% of establishments with at
least one vacancy)
N (weighted establishments with hard-to-fill vacancies) = 1,696
Regarding the density, as shown in figure below, in total, 31.7% of available vacancies were considered
as hard to fill. It means that among 10 available vacancies, 3 vacancies were difficult to fill. As indicated
in the table below, the highest percentage of hard-to-fill vacancies (density of hard-to-fill vacancies) was
found in finance and insurance (70.1%), followed by ICT (57.9%), and food and beverage (54.7%). On
the other hand, the top three with lowest density of hard-to-fill vacancies were rubber and plastics (1.2%),
logistics (9.0%), and garment (10.7%). Notably, more than half of establishments in accommodation
sector, which is one of the highest turnover rate sector and is also facing very high recruitment difficulties;
consequently, experiencing hard-to-fill vacancies (31.7%) (See figure 4.2 & table 5.3). At the same time,
2.52.2 2.1
2.3
2.9
2.52.2
2.6 2.52.7
2.5
0 2 4 6 8 10 12 14 16 18 20
0.0
0.5
1.0
1.5
2.0
2.5
3.0
Foo
d an
d be
vera
ge
Gar
men
t, fo
otw
ear
and
appa
rel
Rub
ber
and
plas
tics
Con
stru
ctio
n
Acc
omm
odat
ion
Fin
ance
and
insu
ranc
e
ICT
Log
istic
s, w
areh
ousi
ng
and
tran
spor
tatio
n
Edu
catio
n
Hea
lth
Tota
l
7.3%
29.0%34.4% 36.5%
50.7% 51.7% 53.0%58.3%
64.1%
77.9%
47.5%
0%
20%
40%
60%
80%
100%
Rub
ber
and
plas
tics
Gar
men
t, fo
otw
ear
and
appa
rel
Con
stru
ctio
n
ICT
Fin
ance
and
insu
ranc
e
Foo
d an
d be
vera
ge
Edu
catio
n
Hea
lth
Log
istic
s,
war
ehou
sing
and
tran
spor
tatio
n
Acc
omm
odat
ion
Tota
l

28 | 71 National Employment Agency
density of hard to fill for other sectors varied between the proportions of 25.7% in education to 37.5% in
health. However, when we look at the distribution of hard-to-fill vacancies by sector, about 70% of them
were concentrated in finance and insurance, accommodation, and garment, footwear and apparel.
Table 5.3: Distribution and density of hard to fill vacancies by sector
Sector Distribution (%) Density (%) Accommodation 21.1 31.5 Construction 2.1 26.4 Education 4.4 25.7 Finance and insurance 42.0 70.1 Food and beverage 9.4 54.7 Garment, footwear and apparel 10.6 10.7 Health 1.6 37.5 ICT 7.0 57.9 Logistics, warehousing and transportation 1.6 9.0 Rubber and plastics 0.1 1.2
Total 100.0 31.7
By occupational classification, about 70% of total hard-to-fill vacancies were in technical and associated
professionals, service and sale workers, and professionals (see table 5.4). This suggests that the
vacancies that were more difficult to fill were those that required the skilled.
The vacancies which were difficult to fill were measured by density of hard-to-fill vacancies: the
vacancies that were likely hard-to-fill were those of technician and associate professionals (70.2%),
managers (61.9%), service and sale workers (41.9%), elementary occupations (30.6%), clerical and
support workers (27.1%), craft and related trades workers (22.3%), plant and machine operators and
assemblers (8.9%), and skill agricultural workers (0.9%). The details of hard to fill vacancies by sectors
and occupations is reported in table in appendix D.
Table 5.4: Distribution and density of hard to fill vacancies by occupation
ISCO major group Distribution
(%) ISCO major group
Density
(%) Technical and associated professionals 40.7 Technical and associated professionals 70.2 Service and sales workers 21.1 Managers 61.9 Professionals 11.2 Service and sales workers 41.0 Clerical support workers 9.3 Professionals 39.1 Plant and machine operators, and assemblers 9.0 Elementary occupations 30.6 Elementary occupations 5.8 Clerical support workers 27.1 Craft and related trades workers 2.2 Craft and related trades workers 22.3 Managers 0.6 Plant and machine operators, and assemblers 8.9
Total 100.0 Total 31.8
There are several reasons behind those hard-to-fill vacancies matter. Understanding these causes is an
essential precondition to design and introduce active measures aimed at easing the recruitment problems
and improving the functioning of the labour market.
When asked why vacancies were hard to fill, the most usual cause (41.0%) was low number of applicants
with the required skills (see figure 5.4). This first reason suggested that the education system has not yet
produced enough skilled workers to respond to the demands of employers. The second reason was there
were too much competition from other employers. The third reason was linked to the lack of work
experiences the company demands. Low number of applicants in general and not enough people interested
in doing the job ranked in four and five, which was reported by 31.0% and 30.6% of establishments,
respectively. However, as seen in the figure below, it seemed to be not really related to seasonal work,

National Employment Agency 29 | 71
remote location/poor public transport, or poor career progression/lack of prospects, or unsociable hours
of the jobs. It was possibly more related to poor terms and conditions (e.g. pay) offered for the post.
Figure 5.4: Causes of hard to fill vacancies (% of establishment reporting hard to fill vacancies)
Note:
- The figure shows the proportion of hard-to-fill vacancies caused by each factor reported by employers.
- The sum of percentages exceeds 100% because of multiple choices.
n (unweighted establishments with hard-to-fill vacancies) = 158
In overall, the perceived causes of hard-to-fill vacancies vary according to sector (see table in appendix
D), notable differences include:
- Too much competition from other employers was very pronounced in accommodation, finance
and insurance, garment, health, ICT, and logistics.
- Not enough people interested in doing this type of job was more likely to cause hard-to-fill
vacancies in accommodation, finance and insurance, health and ICT
- The low number of applicants with the required skills was pronounced in in accommodation,
education, finance and insurance, garment, health, ICT, and rubber and plastics.
- Low of number of applicants in general caused the main problem of hard-to-fill vacancies for
the sector of accommodation, education, food and beverage, and garment.
- Lack of work experience demanded by the company was particularly to cause hard-to-fill
vacancies in the accommodation, construction, education, garment, health, and ICT.
- Low number of applicants with the required attitude, motivation or personality and poor career
progression/lack of prospects caused the major problems of hard-to-fill vacancies for the sector
of food and beverage.
The analysis of causes by skills by ISCO provides some remarkable notes as following (see table in appendix
D for details):
- For managers: Low number of applicants with the required skills, low number of applicants
generally, and lack of qualifications the company demands.
- For professionals: Low number of applicants with the required skills, and lack of work experience
the company demands.
2.2%
4.1%
5.5%
8.5%
8.9%
16.6%
19.2%
21.8%
30.6%
31.0%
31.4%
38.0%
41.0%
0% 5% 10% 15% 20% 25% 30% 35% 40% 45%
Others
Seasonal work
Remote location / poor public transport
Poor career progression / lack of prospects
Job entails shift work / unsociable hours
Poor terms and conditions (e.g. pay) offered for post
Lack of qualifications the company demands
Low number of applicants with the required attitude,
motivation or personality
Not enough people interested in doing this type of job
Low number of applicants generally
Lack of work experience the company demands
Too much competition from other employers
Low number of applicants with the required skills

30 | 71 National Employment Agency
- For technical and associated professionals: Not enough people interested in doing this type of
job, low number of applicants with the required skills, and lack of work experience the company
demands
- For clerical support workers: Too much competition from other employers, not enough people
interested in doing this type of job, Low number of applicants with the required skills, and low
number of applicants generally.
- For service and sales workers: Too much competition from other employers, not enough people
interested in doing this type of job, and low number of applicants with the required skills
- Craft and related trades workers: Too much competition from other employers, low number of
applicants with the required skills, and lack of work experience the company demands
- Plant and machine operators, and assemblers: Too much competition from other employers, and
low number of applicants generally.
- Elementary occupations: Too much competition from other employers, not enough people
interested in doing this type of job, and low number of applicants generally
5.3. Skills Shortages by Sector
The recruitment difficulties are quite commonly caused by issues relating to the quality of applicants, along
with other contextual factors such as terms and conditions offered for the post, career progression
perspectives, or location....The hard-to-fill vacancies caused specifically by the lack of skills, qualifications,
and/or experience among the applicants are considered as “skills shortages vacancies” (see appendix B).
The figure below shows the information on the share of establishments with skills shortage vacancies. About
one-fourth of total establishments experience skills shortages (24.9% of establishments with at least one
vacancies). Notably, the highest of proportion of establishment facing skills shortages was found in
accommodation with 44.5% of establishments with at least one vacancies, followed by health with 37.3%
and education with 33.0%. In addition to accommodation sector, it is worth highlighting that a high share of
establishments with skills shortage result in a high turnover rate as discussed in previous section. Finance
and insurance, and ICT sectors followed with the proportion above the average level of 31.0% and 26.2%,
respectively. At the same time, the percentages of the other sector were between 17.7% in logistics and 2.9%
in food and beverage sector, as shown in the figure below.
Figure 5.5: Share of establishments with skills shortage vacancies (% of establishments with at
least one vacancy)
N (weighted establishments with skills shortage vacncies) = 1,696
The following table gives the information on distribution and density of skills shortage by sector. In
terms of distribution of skills shortage vacancies, the majority of skills shortage vacancies were
2.9%7.3%
16.1% 16.4% 17.7%
26.2%31.0% 33.0%
37.3%
44.5%
24.9%
0%
10%
20%
30%
40%
50%
Foo
d an
d be
vera
ge
Rub
ber
and
plas
tics
Con
stru
ctio
n
Gar
men
t, fo
otw
ear
and
appa
rel
Log
istic
s,
war
ehou
sing
and
tran
spor
tatio
n ICT
Fin
ance
and
insu
ranc
e
Edu
catio
n
Hea
lth
Acc
omm
odat
ion
Tota
l

National Employment Agency 31 | 71
concentrated in accommodation (27.7%), finance and insurance (26.3%), garment, footwear and apparel
(10.9%), and ICT (10.8%); resulting in a high turnover rate among these four sectors. While, in terms
of density of skills shortage vacancies, it differed between sectors and the highest value was found in
ICT sector with 32.4% of total vacancies within this sector.
Table 5.5: Distribution and density of skills shortages vacancies by sector (% of total vacancies)
Sector Distribution (%) Density (%) Accommodation 27.7 15.1 Construction 3.0 13.5 Education 7.7 16.3 Finance and insurance 26.3 16.1 Food and beverage 8.9 18.8 Garment, footwear and apparel 10.9 4.0 Health 2.4 20.5 ICT 10.8 32.4 Logistics, warehousing and transportation 2.0 4.1 Rubber and plastics 0.4 1.2 Total 100.0 11.6
On the other hand, it is worth noting that the occupations that had highest density of skills shortage are
managers (47.6%), professionals (21.5%), clerical support workers (20.4%), and technical and
associated professionals (18.5%). In terms of distribution, the highest share was found in technical and
associated professional at 29.4%, followed by clerical support workers at 19.2% and services and sale
workers at 17.6%, as shown in the table below. The analysis of skills-shortage vacancies by major
occupation and sector, as shown in table in appendix D, suggested that the skills shortages affected:
in accommodation, mainly clerical and support workers (65.5%), followed by service and sales
workers (20.4%);
in construction, professionals (68.2%) and technicians and associated professionals (22.7%);
in education, professionals (87.7%);
in finance, technicians and associated professionals (87.2%), and service and sales workers
(10.2%);
in food and beverages, service and sales workers (71.2%), and elementary occupations (22.7%);
in garment, plant and machine operators (67.9%), and professionals (13.6%);
in health, professionals (44.4%), technicians and associated professionals (22.2%), managers
(16.7%), and service and sales workers (11.1%);
in ICT, professionals (40.0%), technicians and associated professionals (33.8%), and service and
sales workers (22.5%);
in logistics, plant and machine operators (46.7%), managers (20.0%), and professionals (20.0%);
and in rubber and plastics, service and sales workers (66.7%), and professionals (33.3%).

32 | 71 National Employment Agency
Table 5.6: Distribution and density of skills shortages vacancies by occupation (% of total vacancies)
ISCO major group Distribu-
tion (%) ISCO major group
Density
(%)
Technical and associated professionals 29.4 Managers 47.6
Clerical support workers 19.2 Professionals 21.5
Service and sales workers 17.6 Clerical support workers 20.4
Professionals 16.8 Technical and associated professionals 18.5 Plant and machine operators, and assemblers 8.3 Service and sales workers 12.5
Elementary occupations 4.0 Craft and related trades workers 11.1
Craft and related trades workers 3.0 Elementary occupations 7.8
Managers 1.3 Plant and machine operators, and assemblers 3.0
Total 100.0 Total 11.6
The survey also tries to identify which skills are lacking among jobseekers. As shown in the figure
below, foreign language skills, which was the top skills lacking in previous survey in 2015, remained
on the top spot of skills that are lacking among jobseekers. The second rank was technical or practical
skills, followed by customer handing, oral communication, team work, and problem-solving skills.
Figure 5.6: Type of skills shortage (% of establishments reported skills shortage)
n (unweighted establishments with skills shortages) = 158
3.4%
4.8%
5.4%
7.5%
11.6%
12.2%
15.6%
19.0%
19.7%
27.2%
27.9%
28.6%
31.3%
33.3%
45.6%
Strategic management skills
Other job specific skills
Literacy skills
Numeracy skills
Written communication skills
Office admin skills
Planning and organization skills
Advanced IT or software
Basic computer literacy/using IT
Problem solving skills
Team work skills
Oral communication skills
Customer handing skills
Technical or practical skills
Foreign language skills
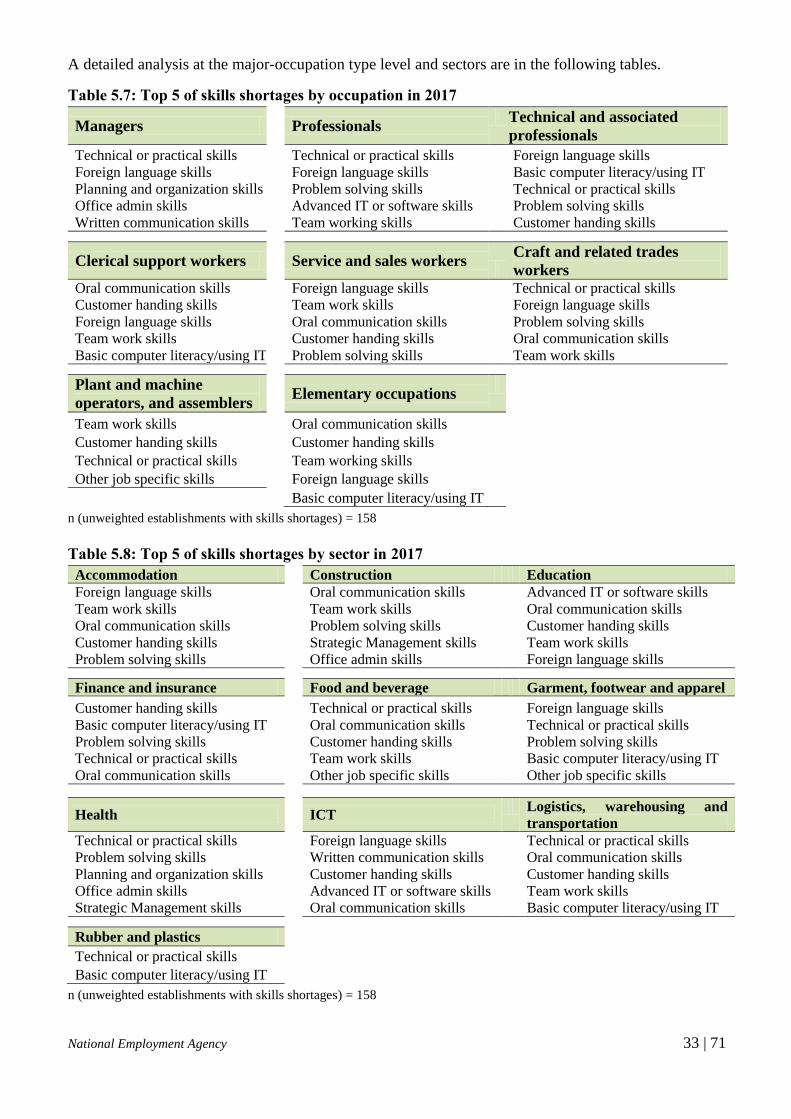
National Employment Agency 33 | 71
A detailed analysis at the major-occupation type level and sectors are in the following tables.
Table 5.7: Top 5 of skills shortages by occupation in 2017
Managers
Professionals Technical and associated
professionals
Technical or practical skills Technical or practical skills Foreign language skills
Foreign language skills Foreign language skills Basic computer literacy/using IT
Planning and organization skills Problem solving skills Technical or practical skills
Office admin skills Advanced IT or software skills Problem solving skills
Written communication skills Team working skills Customer handing skills
Clerical support workers
Service and sales workers
Craft and related trades
workers Oral communication skills Foreign language skills Technical or practical skills
Customer handing skills Team work skills Foreign language skills
Foreign language skills Oral communication skills Problem solving skills
Team work skills Customer handing skills Oral communication skills
Basic computer literacy/using IT Problem solving skills Team work skills
Plant and machine
operators, and assemblers Elementary occupations
Team work skills Oral communication skills
Customer handing skills Customer handing skills
Technical or practical skills Team working skills
Other job specific skills Foreign language skills
Basic computer literacy/using IT
n (unweighted establishments with skills shortages) = 158
Table 5.8: Top 5 of skills shortages by sector in 2017
Accommodation Construction Education
Foreign language skills Oral communication skills Advanced IT or software skills
Team work skills Team work skills Oral communication skills
Oral communication skills Problem solving skills Customer handing skills
Customer handing skills Strategic Management skills Team work skills
Problem solving skills Office admin skills Foreign language skills
Finance and insurance Food and beverage Garment, footwear and apparel
Customer handing skills Technical or practical skills Foreign language skills
Basic computer literacy/using IT Oral communication skills Technical or practical skills
Problem solving skills Customer handing skills Problem solving skills
Technical or practical skills Team work skills Basic computer literacy/using IT
Oral communication skills Other job specific skills Other job specific skills
Health
ICT Logistics, warehousing and
transportation
Technical or practical skills Foreign language skills Technical or practical skills
Problem solving skills Written communication skills Oral communication skills
Planning and organization skills Customer handing skills Customer handing skills
Office admin skills Advanced IT or software skills Team work skills
Strategic Management skills Oral communication skills Basic computer literacy/using IT
Rubber and plastics
Technical or practical skills
Basic computer literacy/using IT
n (unweighted establishments with skills shortages) = 158
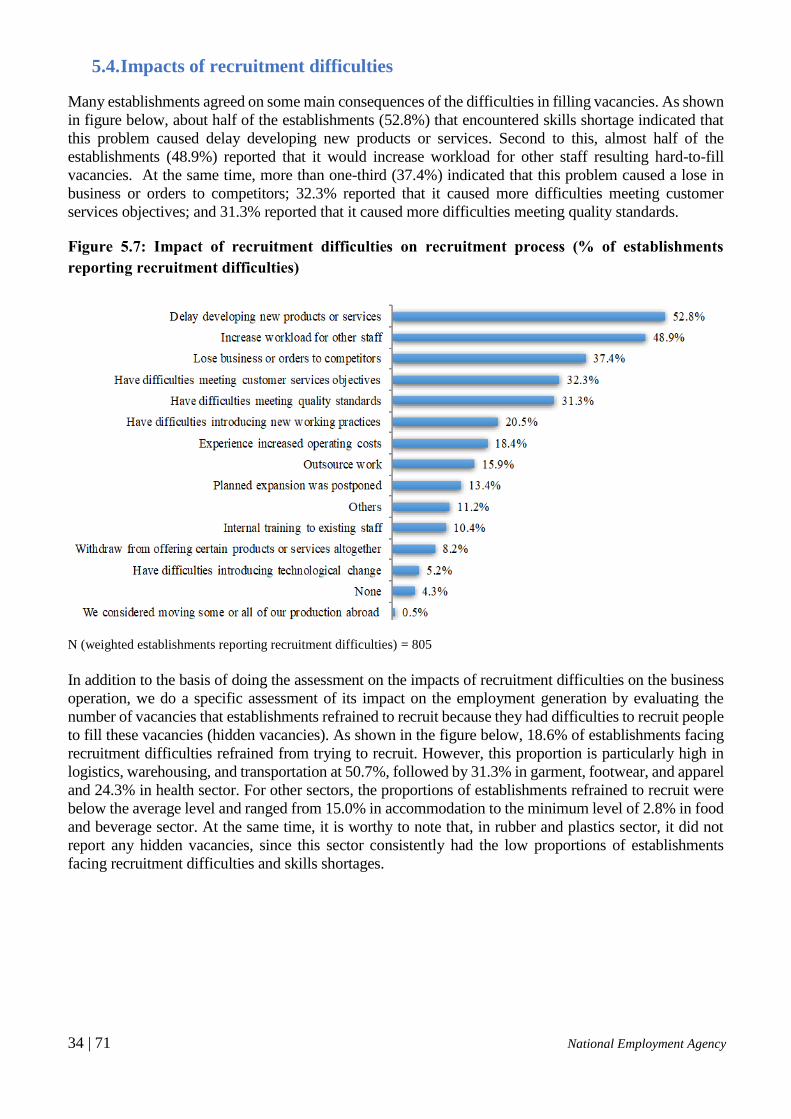
34 | 71 National Employment Agency
5.4. Impacts of recruitment difficulties
Many establishments agreed on some main consequences of the difficulties in filling vacancies. As shown
in figure below, about half of the establishments (52.8%) that encountered skills shortage indicated that
this problem caused delay developing new products or services. Second to this, almost half of the
establishments (48.9%) reported that it would increase workload for other staff resulting hard-to-fill
vacancies. At the same time, more than one-third (37.4%) indicated that this problem caused a lose in
business or orders to competitors; 32.3% reported that it caused more difficulties meeting customer
services objectives; and 31.3% reported that it caused more difficulties meeting quality standards.
Figure 5.7: Impact of recruitment difficulties on recruitment process (% of establishments
reporting recruitment difficulties)
N (weighted establishments reporting recruitment difficulties) = 805
In addition to the basis of doing the assessment on the impacts of recruitment difficulties on the business
operation, we do a specific assessment of its impact on the employment generation by evaluating the
number of vacancies that establishments refrained to recruit because they had difficulties to recruit people
to fill these vacancies (hidden vacancies). As shown in the figure below, 18.6% of establishments facing
recruitment difficulties refrained from trying to recruit. However, this proportion is particularly high in
logistics, warehousing, and transportation at 50.7%, followed by 31.3% in garment, footwear, and apparel
and 24.3% in health sector. For other sectors, the proportions of establishments refrained to recruit were
below the average level and ranged from 15.0% in accommodation to the minimum level of 2.8% in food
and beverage sector. At the same time, it is worthy to note that, in rubber and plastics sector, it did not
report any hidden vacancies, since this sector consistently had the low proportions of establishments
facing recruitment difficulties and skills shortages.

National Employment Agency 35 | 71
Figure 5.8: Share of establishment refraining from trying to recruit because of recruitment
difficulties (% of total establishments with recruitment difficulties)
N (weighted establishments reporting recruitment difficulties) = 805
However, in terms of number of hidden vacancies, it is quite modest but varied across sectors, as
indicated in the figure below. Health sector is reported to have the highest density of hidden vacancies
at 10.2% of total vacancies within this sector, while for other sectors, this density was less than 4.0%.
One of the reason of health sector having the highest density of hidden vacancies is due to its nature of
high requirements for applicants and occupations concentration mostly on high skilled workers and so
is their hard to fill vacancies.
Figure 5.9: Density of hidden vacancies by sector (% of total vacancies)
n (unweighted total vacancies) = 6,421
The establishments had adopted different sets of measures to address the hard-to-fill vacancies. The most
common was to raise wages, a measure taken by 36.0% of the establishments affected by the problem of
hard-to-fill vacancies, as shown in figure below. This also confirmed the fact that establishments
understand that wages are a critical variable in acquiring the workforce they need and to reduce staff
turnover. Other measures were directed towards recruitment and to reducing the need for new employees.
The former type of measures included improvements in advertisement and recruitment spending (30.7%),
and recruitment methods (28.6%); the latter, increasing on-the-job training and redefining existing jobs.
0.0%
2.8%
6.9%
8.3%
12.3%
13.5%
15.0%
24.3%
31.3%
50.7%
18.6%
0% 10% 20% 30% 40% 50% 60%
Rubber and plastics
Food and beverage
ICT
Education
Construction
Finance and insurance
Accommodation
Health
Garment, footwear and apparel
Logistics, warehousing and transportation
Total

36 | 71 National Employment Agency
Figure 5.10: Measures taken to address hard-to-fill vacancies
N (weighted establishments reporting recruitment difficulties) = 805
6. Skills Gaps and Workforce Development
6.1. Incidence and Density of Skills Gaps by Sector
A skill gap is defined when the existing staff cannot perform up to the level required by employers. The
survey indicates that about one-third (29.2%) of the establishments interviewed declared to have
encountered the issue of skills gaps (fairly decreased if compared to previous 2015 survey which was
39.4%). Notably, the survey shows that there were high skills gaps among “construction” and “finance
and insurance” sector (44.0% and 41.3%, respectively). As shown in figure below, the share did vary,
but not hugely between sectors, and lowest percentage was found in health sector at about 19.1%.
Figure 6.1: Share of establishments affected by skills gaps by sector
N (total weighted establishments) = 4,571
19.1% 20.8%26.0%
31.2% 32.6% 33.7% 35.1% 35.8%41.3%
44.0%
29.2%
0%
10%
20%
30%
40%
50%
Hea
lth
Foo
d an
d B
ever
age
Gar
men
t, fo
otw
ear
and
appa
rel
Log
istic
s,
war
ehou
sing
and
tran
spor
tatio
n
Acc
omm
odat
ion
ICT
Rub
ber
and
plas
tics
Edu
catio
n
Fin
ance
and
insu
ranc
e
Con
stru
ctio
n
Tota
l

National Employment Agency 37 | 71
Despite the high share of establishments (29.2%) experiencing skills gaps, about 13,482 of total 962,972
workers (1.4%) were considered to have skills gaps. This percentage varied between sectors as shown
in figure below. Remarkably, “construction” was the highest density of skills gaps sector. On an
important note, “garment, footwear and apparel” sector given the lowest density of skills gaps in terms
of percentage share within its sector total employment (1.1%) had the highest distribution of 60.0%;
second to this, “accommodation” represents 9.2%.
Figure 6.2: Density of skills gaps by sector
N (total weighted employment) = 962,972
By ISCO major group, craft and related trades workers were the highest density of skills gaps at 12.3%,
followed by services and sales workers at 6.5%. At the same time, other occupational groups had the
density of skills gaps less than 3.0%, as indicated in the figure below.
Figure 6.3: Density of skills gaps by ISCO major group
N (total weighted employment) = 962,972
6.2. Causes of Skills Gaps
The main causes of employees not performing up to the required level are presented in figure below as
the percentage of all occupations with skills gaps rather than the percentage of establishments with skills
gaps. The establishments could give more than one factor that caused skills gaps for their establishment.
0.1% 0.1% 0.5% 0.7%1.5% 2.0%
2.8%
6.5%
12.3%
0%2%4%6%8%
10%12%14%
Skil
led
agri
cultu
ral,
fore
stry
and
fis
her
y
Man
ager
s
Pla
nt
and m
achin
e
oper
ators
, an
d
asse
mble
rs
Ele
men
tary
occ
upat
ion
s
Pro
fess
ion
als
Cle
rica
l su
ppo
rt
work
ers
Tec
hn
icia
ns
and
asso
ciat
e
pro
fess
ion
als
Ser
vic
e an
d s
ales
work
ers
Cra
ft a
nd
rel
ated
trad
es w
ork
ers

38 | 71 National Employment Agency
Figure 6.4: Factors associated with employees not performing to the required level
N (weighted establishments with skills gaps) = 1,337
“New to the role” is the main cause of skills gaps reported by 41.9% of the establishments with skills gaps,
a reason that could be connected to the high turnover that characterizes the Cambodian labour market. The
second reason, cited by 24.2% of the establishments, was the fact that training is currently only partially
completed. Problem of retaining staff ranked only third in most cases at 19.4%. Last but not least, it is worth
highlight that 18.9% of establishments with skills gaps are faced with “lack of work commitment”, 18.6%
with “unable to recruit staff with the required skills”, 18.5% with “the staff being on training but their
performance not improved”, and 15.2% “due to introduction of new technology”. For other reasons, they
are cited less than 15% as shown in figure above.
6.3. Workforce Development
Overall, during the 12 months preceding the survey, around one fifths of establishments (15.9%) had funds
or arranged some form of training for their employees, but this proportion is varied roughly across different
sectors: the highest percentage was found in finance and insurance sector (38.8%) and the lowest one was
in rubber and plastics sector (2.2%). In addition to finance and insurance sector, it can be explained by a
high share of establishments reporting hard to fill vacancies and high skills shortage within this sector;
therefore, they are eager to provide training.
Figure 6.5: Share of establishment providing training in 2017
N (total weighted establishments) = 4,571
6.5%
11.2%
13.1%
13.9%
15.2%
18.5%
18.6%
18.9%
19.4%
24.2%
41.9%
0% 5% 10% 15% 20% 25% 30% 35% 40% 45%
Poor working attitude
Introduction of new working practices
Not received the appropriate training
Lack of motivation
Introduction of new technology
Been on training but their performance not improved
Unable to recruit staff with the required skills
Lack of work commitment
Problem of retaining staff
Training is currently only partially completed
New to the role

National Employment Agency 39 | 71
However, there is only 18.6% of all establishments providing training that had both training plans and budget
that specified in advance the level and type of training that would be needed in the coming year. Some of
establishments (28.0%) stated that, while having training budget, they had no training plan, the highest share
of 53.4% of establishment stated that they had only training plan but they didn’t have training budget. It was
harmonized if the establishments have at the same time training plan and training budget available.
Figure 6.6: Share of establishment having training plan and budget
N (weighted establishments providing training) = 745
As shown in figure below, among the establishments that stated to have training in the last 12 months,
45.7% of them provided training in technical or practical skills. Other trainings such as customer
handling skills (40.8%) and oral communication skills (35.1%) came second and third rank,
respectively; consistent with the nature of finance and insurance sector that have the highest rate of
providing trainings. At the same time, team work skill (30.7%) and problem-solving skills (29.4%) were
also among a top 5 skills that establishment offers in the last 12 months. Thus, four among top five
skills that establishment offered were related to the soft skills. For the other skills, it is ranged between
25.5% for strategic management skills and the minimum one of 2.2% for literacy, as shown in the figure
below.
Figure 6.7: Training courses offered in 2017 (% of establishments providing training)
N (weighted establishments providing training) = 745
53.4%
28.0%
18.6% Only training plan
Only training budget plan
Both training and budget plan

40 | 71 National Employment Agency
However, the top five of area of skills that establishments provided to their workforce in the last 12
months varied across sectors, as summarized in the table below.
Table 6.1: Top 5 training courses offered in 2017 by sector
Accommodation Construction Education
Oral communication skills Technical or practical skills Technical or practical skills
Customer handing skills Accounting and Finance Foreign language skills
Technical or practical skills Occupational health and safety Strategic Management skills
Foreign language skills Foreign language skills Oral communication skills
Team working skills Induction training Team working skills
Finance and insurance Food and beverage Garment, footwear and apparel
Customer handing skills Occupational health and safety Technical or practical skills
Oral communication skills Customer handing skills Occupational health and safety
Problem solving skills Team working skills Team working skills
Accounting and Finance Technical or practical skills Strategic Management skills
Team working skills Accounting and Finance Problem solving skills
Health ICT Logistics, warehousing and
transportation
Technical or practical skills Customer handing skills Human Resource Management Occupational health and safety Oral communication skills Technical or practical skills
Team working skills Technical or practical skills Advanced IT or software skills
Oral communication skills Advanced IT or software skills Team working skills
Customer handing skills Basic computer literacy/using IT skills Problem solving skills
Rubber and plastics
Technical or practical skills
N (weighted establishments providing training) = 745
Among the establishments that provide training to their staff in the last 12 months, 22.0% of them
experienced difficulties in organizing training courses and/or finding trainers. This proportion is particularly
high in education section, where 54.0% of establishments within this sector encountered this issue. The
second one was in accommodation with 37.3%, followed by food and beverage (30.8%), health (28.6%),
and construction (27.7%). For other sectors, where their proportions were less than the average of all selected
sectors, was in garment, footwear and apparel; logistics, warehousing and transportation; finance and
insurance; and ICT.
Figure 6.8: Difficulty in organizing training courses in 2017 (% of establishments providing training)
N (weighted establishments providing training) = 745
7.8%11.2% 12.3%
15.4%
27.7% 28.6% 30.8%
37.3%
54.0%
22.0%
0%
10%
20%
30%
40%
50%
60%
ICT
Fin
ance
and
insu
ranc
e
Log
istic
s,w
areh
ousi
ng
and
tran
spor
tatio
n
Gar
men
t, fo
otw
ear
and
appa
rel
Con
stru
ctio
n
Hea
lth
Foo
d an
d be
vera
ge
Acc
omm
odat
ion
Edu
catio
n
Tota
l

National Employment Agency 41 | 71
Regarding the causes of difficulty in organizing training courses, the first reason is no available or lack of
courses or trainers, which was reported by 35.6% of all establishment encountering this issue; as a result of
the natural requirement for trainer in education sector (a sector that require and consist of high skill workers).
The second one was low quality of courses offered (or the trainer), followed by no or poor information on
courses or trainers (27.4% & 20.4%, respectively). The staff lacking of motivation to join the training is also
one of issues reported by 19.5% of establishment facing difficulties. Lack of training budget and the issue
of staff capacity to join the training course are raised by 9.5% and 7.5% of establishments, respectively as
the reasons for difficulty in organising training course.
Figure 6.9: Reasons for difficulty in organising training course (% of establishment having
difficulty in organizing training courses)
N (weighted establishments having difficulty in organizing training course) = 164
6.4. Work’s Preparedness of First Time Jobseekers
This section examines the incidence of recruitment, work-preparedness, and skills endowment of first time
jobseekers coming directly from either upper secondary school, pre- and post-secondary technical and
vocational training school (TVET), or university. More specifically, we look at the proportion of employers
that recruited first time jobseekers over the last 12 months prior to the survey, and identify their perception
on the preparedness for work, and lack of skills of new recruits.
Figure 6.10: Share of establishment hiring first time jobseeker in 2017 (% of total establishments)
N (total weighted establishments) = 4,571
Overall, 40.1% of all establishments hired first time jobseekers (FTJS) over the last 12 months. The rates
were found to be very high for some sectors such as finance and insurance (73.4%), education (71%), health
(58.9%), and construction (58.3%), as pointed in the figure above.

42 | 71 National Employment Agency
Upper Secondary School University
English language skills Basic IT skills
Lack of working world/life experience Lack of working world/life experience
Team work skills Communication skills
Communication skills Technical skills
Practical skills English language skills
Post-Secondary TVET Pre-secondary TVET
Lack of working world/life experience Poor attitude/personality
English language skills Technical skills
Basic IT skills Practical skills
Chinese language skills English language skills
Other langugae skills Poor education/training
Basic IT skills
The survey also tried to valuate work preparedness of FTJS from the perspectives of employers. The figure
below shows that index (a scale of from 1 to 5, 1-very poorly prepared & 5-very well prepared, with the
average of 3) of FTJS as preparedness perceived by employers in different sectors: the higher index means
the higher level of preparedness, and vice versa.
Overall, post-secondary TVET level of work preparedness rating was the highest of all other education level,
followed by university and upper secondary school graduates, and the lowest rating was found in pre-secondary
TVET. By sectors, employers reported good level of work preparedness of university graduates, which is better
than any other graduates, particularly for “finance and insurance”, “rubber and plastics”, and “health” sector.
TVET graduates, on the other hand, employers rated post-secondary TVET better than pre-secondary TVET.
For instance, in garment footwear and apparel, construction, and health sector, employers rated post-secondary
TVET better than pre-secondary TVET with overall average rate of 3.4 and 2.9, respectively.
Figure 6.11: Index of employers’ perception on first time jobseekers
N (total weighted establishments) = 4,571
The poor work preparedness of FTJS were concentrated on four main areas: English language skills, poor
attitude/personality, lack of working world/life experience, and lack of basic IT skills. However, as shown in
table below, the degree and types of complaint depended on their education levels. Notably, among several
skills, English language skills is reported by all level of education. For pre-secondary TVET, it is particularly
important to improve attitude/personality, technical and practical skills, while lack of experiences is needed to
reinforce for post-secondary TVET schools. For university student, the knowledge of Basic IT and experiences
has become very important to find the first job.
Table 6.2: Skills and competence that need to improve by educational level
N (total weighted establishments) = 4,571

National Employment Agency 43 | 71
7. Conclusion
The last part of this report will provide a short conclusion for each of the ten sectors in our study. It
would provide a short highlight and recapitulation of the characteristics and the interesting findings for
each sector.
Accommodation
Despite being a young industry (53.6% started after 2008), accommodation sector shares about 15% of
total establishments and covers 3.7% of employment and also is one of the fastest employment annual
growth rate (4%) doubling the average growth rate. Moreover, the majority of occupations in this sector
concentrated on services and sales workers and elementary occupations (16.3% and 23.3%,
respectively). However, accommodation sector, which has the highest turnover rate (22.5%) and also is
one of the sector that have the most available vacancies (21.2% of 6421 available vacancies), is
experiencing recruitment difficulties the most. In addition to available vacancies, distribution of
vacancies concentrated on clerical support workers (37.6%) and service and sales workers (42.8%). This
sector also associated with highest density of hard-to-fill vacancies of 31.5%. The main causes of hard-
to-fill vacancies were mainly too much competition from other employers and low number of applicants
with the required skills. Furthermore, this sector also experienced skills gaps issue accounting for 3.5%
of 35,839 workers, the second highest as per head count. As for the top five skills that needed to improve
were oral communication skills, customer handiing skills, technical or practical skills, foreign language
skills, and team working skills. It is worth highlighting that more than half of establishments in
accommodation sector hired first time jobseekers and surprisingly the level of preparedness rating by
employers are fairly good.
Construction
Construction sector comprises of only a small amount of percentage shared of both establishments (2.5%)
and employment (0.8%) in the sampling frame. This is due to the short-term contracts basis type of
employment. Despite the small share in terms of establishments and employments distribution, construction
sector is currently one of the highly demanded sector in terms of goods and services and is expected to
continue its increase in the upcoming year; however, on the prospect of employment growth, construction
sector is the slowest growth rate (1.3%). Moreover, occupations’ concentration in this sector are technicians
and associate professionals; craft and related trades workers; plant and machine operators, and assemblers;
and elementary occupations covering about 15.4%, 18.6%, 19.8%, and 18.8%, respectively. Despite having
low turnover rate, half of the establishments in this sector declared to have available vacancies and the top
two vacancies were professional and elementary occupations. Regarding skills gaps issue, this sector ranked
first in both percentage share of establishments (44%) and density (6.8%). As for the top five skills that
needed to improve were technical or practical skills, accounting and finance, occupational health and safety,
foreign language skills, and induction training. Similarly to accommodation, more than half of
establishments in construction sector hired first time jobseekers and surprisingly the level of preparedness
rating by employers are decently good.
Education
Education sector is on the right track with the increasing number of private and public school since
ownership of establishments in education sector comprises of individual proprietor and state owned. In
addition, education sector represents 2.9% of total establishments and 1.5% of total employment. More
than 70% of occupation in education sector are high skilled workers ranging from technicians and
associate professionals up to managerial levels. Given low turnover rate, 55.3% of establishments in
this sector declared to have available vacancies accounting for 5.4% of total sectoral employment;
however, the difficulties in recruitment in this sector is considerably hard due to high skilled
requirement. Notably, this sector is one of the top three shares of establishment facing skills shortages
44 | 71 National Employment Agency
(33%). Furthermore, 35.8% of establishments experience skills gaps equivalent to 2.1% of total sectoral
employment. Surprisingly, among the top five skills that needed to improve, foreign language skills is
still an issue and interestingly, technical or practical skills is the top skills needed to improve in a sector
consisting of mostly high skilled workers.
Finance and Insurance
Finance and insurance, which shares 9.8% of total establishments and 8% of total employment, is the
most phenomenal demanded sector and surprisingly are evenly owned by Cambodians and a joint
ownership with foreigners (43.3% & 32.9%, respectively). Without a doubt, the main occupations in
this sector are from services and sales workers up to managers’ level; naturally, clerical supports
workers and technicians and associate professionals share the most of employment by 32% and 28.3%,
respectively. Also, it is the sector that has reported the highest percentage in term of employment growth
rate in 2016 (5.7%). Given high proportion of available vacancies (19% distribution), this sector was
experiencing recruitment difficulty and half of the establishments reported hard-to-fill vacancies due to
lack of applicants with require skills especially technicians and associated professionals and service and
sales workers. On the other hand, this sector also faced a serious issue with skills gaps, about 40% of
establishments. Being the sector having the most establishments (73.4%) hiring first time jobseekers,
about 40% of total establishments in this sector in particular offered training courses such as customer
handling skills, oral communication skills, problem solving skills, accounting and finance, and team
working skills.
Food and Beverage
Establishments in food and beverage sector are mostly owned by Cambodian and are individual
proprietors representing 12% of overall establishments and 1.7% of total employment. It is expected to
have a very high employment growth rate of 7.5% in the upcoming years 2018 and 2019. In addition,
this sector seemed to be labour intensive and less advanced in technology: occupations concentrate on
service and sales workers and elementary occupations covering about 55% of total employment in this
sector. Moreover, this sector’s available vacancies mostly concentrated on service and sales workers
given the least share of establishments with at least one vacancies. Even though this sector demand for
labour concentrated only on one occupation, it still had an issue with hard-to-fill vacancies (51.7% of
establishments with at least one vacancies) and 71% of service and sales workers occupation was
considered hard-to-fill vacancies in food and beverage sector. Above all else, this sector had the second
least share of establishments affected by skills gaps after health sector and also, the lowest share of
establishments that provided training.
Garment, Footwear and Apparel
Garment, footwear and apparel is one of the most in shares of establishments and employment, covering
up to 43.6% and 77.4%, respectively; however, the demand for goods and service for this sector
increases at a slower rate comparing to other nine sectors and also the employment growth rate is below
average (1.5%). Moreover, this sector employment concentrates on skilled manual workers specifically
74.9% are plant and machine operators and assemblers. Given the small share of establishments reported
to have vacancies, the distribution of vacancies to total vacancies in this sector is the largest accounting
for 31.4%. The recruitment situation in this sector was in moderate zone of recruitment difficulties and
only one-third of establishments reported having hard-to-fill vacancies (the second lowest after rubber
and plastics). Furthermore, about one-third of establishments were affected by skills gaps and given the
lowest density of skills gaps in terms of percentage share within its total sectoral employment (1.1%)
had the highest distribution of total skill gaps (60%). In addition, more than half of establishments in
garment, footwear and apparel sector orient to export market either directly or through an intermediary;
therefore, this sector is exposed to more external risk than the other sectors.

National Employment Agency 45 | 71
Health
Health sector which is mostly owned by government (66%) is consistently 100% registered in Ministry
of Commerce, and established before 2002 (78.3%). Notably, health sector is the most demanded sector
for both goods and services (see figure 2.2.1) given a small share of establishments (2.8%) and
employment (0.9%). In addition, health sector employs only high skill workers (70%) including
managers (6.7%), professionals (23.7%), and technicians and associate professionals (39.7%).
Surprisingly, the proportion of establishments planning to introduce new products, services or
technologies, and to acquire new markets in the next year in health sector was very high (57%). Due to
its nature and as a public sector, employment growth rate is rather slow while also a small share of the
establishments has at least one vacancies. Moreover, since this sector comprised of high skill workers,
index of recruitment difficulties in this sector was very high and a huge shared of establishments
reported hard to fill vacancies (58.3%). In health sector, professionals (44.4%), technicians and
associated professionals (22.2%), and service and sales workers (11.1%) were the main skills shortage
vacancies; as a result, health sector have the most hidden vacancies that the sector is refraining from
recruit due to its difficulties. Remarkably, health sector had the least shared of establishments affected
by skills gaps.
Information and Communication Technology
ICT is one sector known for high demand of goods and services, newly established (about 70% of
establishments in ICT sector were established after 2008), and the top dominant owned by foreigners.
Given high demand of goods and services, more than half of total establishments in ICT sector are
relatively small size; still this sector employs 1.4% of total employment and represents 4.1% of total
establishments. In addition, employment in ICT sector mostly concentrates on technicians and associate
professionals and service and sales worker (22.5% & 23.2%, respectively), while the rest evenly
distributed to managers, professionals and clerical support workers at about 13%. In addition, ICT
employments growth rate is considerably as fast as finance and insurance (5.7%); complement to their
above average density of vacancies. Differing from previous survey result, ICT had improved their
recruitment difficulty to moderate difficulty; in other words, only one-third of establishments in ICT
sector reported hard-to-fill vacancies. Worth noting is that even with a small share of establishments
reporting hard-to-fill vacancies, occupations that were likely hard-to-fill were of those in ICT
employments’ concentration such as technician and associate professionals, and service and sales
workers. Furthermore, worth highlighting is that skills shortages in ICT, one among the top five was
advanced IT or software skills as a result of the second highest foreigner employed sector after education
sector. However, the top five training course offered in ICT sector consisted three training that counter
the effect of skills shortages namely technical or practical skills, advanced IT or software skills, and
basic computer literacy/using IT skills.
Logistic, Warehousing and Transportation
Logistic, warehousing and transportation sector shared 4.3% of total establishments and employed 1%
of total. Moreover, the most occupation concentration in this sector are technicians and associated
professionals (16.8%), plant and machine operators, and assemblers (19.5%), and elementary
occupations (25.2%), and as for sizes in this sector it is shared evenly. In addition, the employment
growth rate is slightly above average (3.3%) and only one-third of establishments declared to have
available vacancies and 64% of them were hard to fill vacancies. In logistic, warehousing and
transportation sector, managers (20%), professionals (20%) and plant and machines operators (46.7%),
are the main skills shortage vacancies. About one-third of establishments were affected by skills gap
and the top five training offered by this sector are human resource management, technical or practical
skills, advanced IT or software skills, team working skills, and problem solving skills.

46 | 71 National Employment Agency
Rubber and Plastics
Rubber and plastics sector is a sector is mostly owned by foreigners and shares 3.1% of total
establishments and employs 3.4% of total employment.Ait is one of the sectors that mostly emplo skilled
agricultural, forestry and fishery profession (73.1% of total skilled agriculture, forestry, and fishery
workers). In addition, this sector employment growth rate is slightly above average (3.1%) and
occupation is mainly concentrated on skilled manual workers such as skilled agricultural, forestry and
fishery (46.6%) and craft and related trades workers (28.6%). Furthermore, in term of demand for goods
and services, this sector is not doing well, the second worse after food and beverage, given that about
half of the establishments are large in size. One-third of establishments reported having available
vacancies, the recruitment difficulties was moderate, and among them only 7.3% were hard-to-fill
vacancies. Only a small percentage of establishments are affected by skills shortages (7.3%); however,
one-third of establishments are affected by skills gaps. Unfortunately, this sector did not provide any
training only a plan to provide training.

National Employment Agency 47 | 71
Bibliography
Bruni, M. Luch, K. Kuoch, S. 2013 “Skills shortages and skills gaps in the Cambodian labour market:
Evidence from employer skills needs survey 2012”
CEDEFOP. (2013). User Guide to Developing an Employer Survey on Skill Needs. European Centre
for the Development of Vocational Training. Luxembourg: European Centre for the Development of
Vocational Training.
International Labour Organization. 2008. “International Standard Classification of Occupations (ISCO-
08) – Conceptual Framework”, www.ilo.org/public/english/bureau/stat/isco/docs/annex1.doc.
Morrison, T.; Maciejewski, B.; Giffi, C.; DeRocco, E.S.; McNelly, J.; Carrick, G. 2011. “Boiling point?
The skills gaps in US manufacturing”, Deloitte Consulting and the Manufacturing Institute. Available
at: www.themanufacturinginstitute.org [31 Oct. 2013].
Shah, C., & Burke, G. 2003. Skills shortages: Concepts, Measurement and Implication. Monash
University – Centre of the Economics of Education and Training.
Strietska-Ilina, O. 2008. "Skills shortagess", Fourth Report on Vocational Training Research in Europe:
Background Report. Belgium: European Centre for the Development of Vocational Training.
UKCES. 2010. A theoretical view of Skills shortagess and skill needs, Evidence report 20.
UKCES. 2012. UK Commission's Employer Skill Surey 2011: Wales Result. UK Commission for
Employment and Skills.

48 | 71 National Employment Agency
Appendix
A- Research Methodology
Operational Terminologies and Concepts
Although skills gaps and skills shortages have been studied all over the world, such studies are new in
developing countries. In addition, the lack of uniformity of definition has been a major problem in the
study. In this report, the following terms will be defined: skills, skills shortages, recruitment difficulties,
and skills gaps in order to provide conformity to the international study, particularly to the user guide
to develop an employer survey on the skills needs of CEDEFOP.
The term “skills” is defined as “the ability to perform specified tasks” (Holt, Sawicki, & Sloan, 2010),
or to perform “a productive task at a certain level of competence” (Shah & Burke, 2003; Trendle, 2008).
In practice, skills are classified into two dimensions, according to: (1) what the particular tasks are, and
(2) the level of ability that is needed. This implies that jobs are classified into occupation on that basis
(see Appendix B – International Standard Classification of Occupation). Skills can be acquired through
either practical experience or study undertaken by the students. Skills needs are defined in terms of the
jobs that employers require to be done (Holt, Sawicki, & Sloan, 2010).
From a microeconomic perspective, skills shortages are generated from “excess demand” and the
inability of employers to switch their demand composition or to substitute production factors (e.g.
sourcing labour from different locations or sectors) in the short term due to asymmetric information on
applicants’ ability, or due to vested interests in hiring decisions that could lead to risk aversion and
hence skills shortages (Shah & Burke, 2003). Skills shortages also refer to a lack of available skilled
people, which results in recruitment difficulties (Strietska-Ilina, 2008). Skills shortages arise in a
situation in which employers face difficulties in recruiting staff that have the skills needed. This can be
due to a significant geographical imbalance and shortfall in the number of skilled people (Strietska-
Ilina, 2008). More practically, “skills shortage vacancies” are hard-to-fill vacancies due to a lack of
skills, lack of qualifications, and lack of experience, as shown in figure 0-1. On the other hand, those
hard-to-fill vacancies that arise due to poor attitude or personality, lack of motivation, or insufficient
number of applicants, are not skills-shortage vacancies. Skills-shortage vacancies are, therefore, a subset
of hard-to-fill vacancies defined by the three reasons noted above.
Recruitment difficulties cover all forms of recruitment problems faced by employers (Strietska-Ilina,
2008), including the situation in which employers are unable to hire qualified candidates to perform
given tasks even though there is a sufficient supply of labour in the market (Shah & Burke, 2003).
Skills gaps refer to a situation in which employers are hiring workers whom they consider under- skilled,
or their existing workforce are under-skilled relative to some desired levels (Shah & Burke, 2003). Skills
gaps exist where employers feel that their existing workforce have inadequate skills types or levels to
meet their business objectives, or where new entrants appear to be qualified but in fact are not (Strietska-
Ilina, 2008). Practically, skills gaps are where employees are not fully proficient, that is, they are not
able to perform their jobs to the required level (UKCES, 2012).2
2 To identify the incidence of employees with skills gaps, the respondents were asked: Do you have any problems related to
your employees who do not perform jobs at the required level? Could you please indicate, in which occupations, the
number of people that do not perform jobs at the required level, and the total number of employees in that occupation?
(See appendix E: Employers’ Skills Needs Survey Questionnaires 2017).

National Employment Agency 49 | 71
Figure A-1: Skills-shortage vacancies “route map”
Source: (UKCES, 2012, p. 48)
Sampling
The study covers ten sectors which have high growth potential and are major drivers of employment
generation, and whose shares are important in Cambodian GDP in order to be able to explain the
dynamics of the Cambodian labour market from the demand side. The sectors investigated include food
and beverage; garments; apparel and footwear; rubber and plastics; construction; finance and insurance;
accommodation; transportation, warehouse and logistics; human health; education; and ICT (see
appendix C: International Standard of Industrial Classification).
Regarding the sampling process, the most challenging work is to build a sound and complete sampling
frame due to the fact that there is no updated list of total establishments running their occupation in
Cambodia. Therefore, in order to get the best list of sampling frame, all sources of information were
used and utilized. For instance, the sampling frame of survey in 2017 was built from the sampling frame
of the previous survey, and updated with other ad-hoc sources in order to build a representative sampling
frame. The process of updating sampling frame in 2017 is the following:
Sampling frame in 2012: It was based mainly on Establishment Census 2011 conducted by the
National Institute of Statistics (NIS), with some additional establishments updated from the
Yellow Pages 2011 and administrative records of the Ministry of Labour and Vocational
Training (MoLVT).
Sampling frame in 2013: It was built on the sampling frame in 2012, with some additional
establishments updated from the Yellow Pages 2013 and administrative records of the MoLVT.
Sampling frame in 2015: It was built on the sampling frame in 2013, updating with list of
establishments from Cambodia Inter-Censal Economic Survey 2014 and with some additional
establishments from the Yellow Pages 2014 and administrative records of the MoLVT.
Sampling frame in 2017: It was built from sampling frame in 2015, with some additional
establishments updated from the Yellow Pages 2017 and administrative records of the MoLVT
and NEA.
However, it transpired that some enterprises were no longer in existence, and some information is out
of date. To deal with these potential pitfalls of sample selection and attrition, all the selected
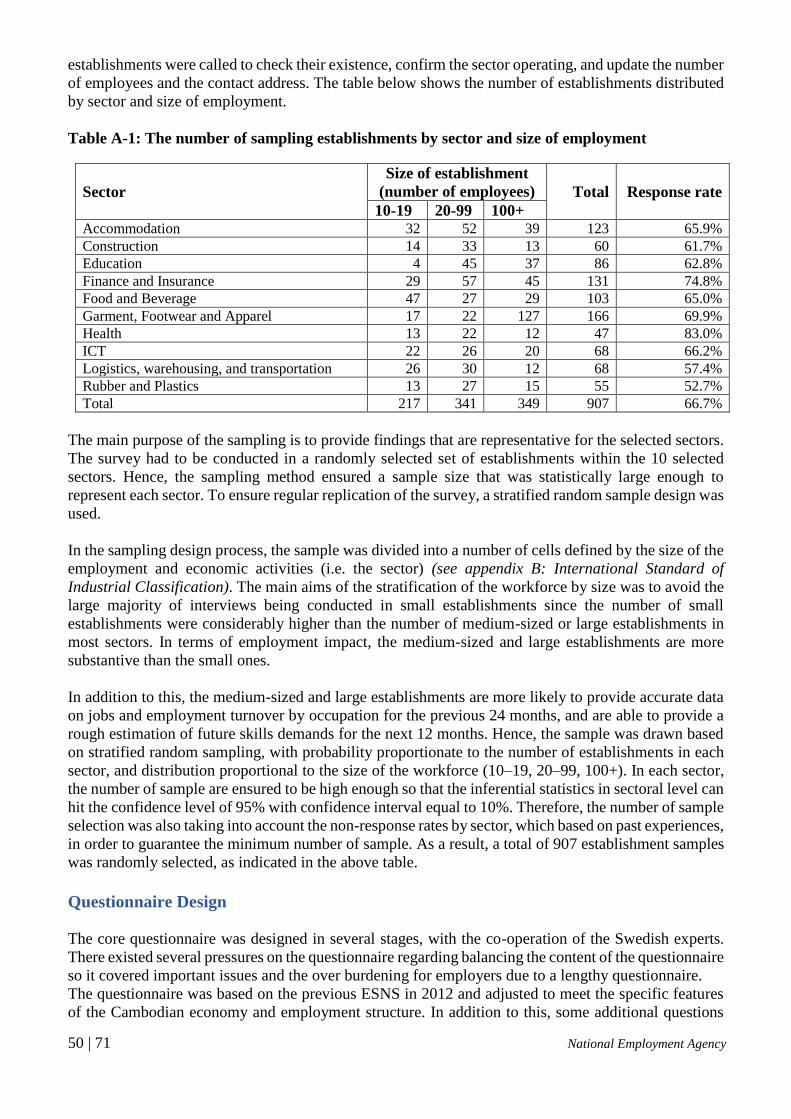
50 | 71 National Employment Agency
establishments were called to check their existence, confirm the sector operating, and update the number
of employees and the contact address. The table below shows the number of establishments distributed
by sector and size of employment.
Table A-1: The number of sampling establishments by sector and size of employment
Sector
Size of establishment
(number of employees) Total Response rate
10-19 20-99 100+ Accommodation 32 52 39 123 65.9%
Construction 14 33 13 60 61.7%
Education 4 45 37 86 62.8%
Finance and Insurance 29 57 45 131 74.8%
Food and Beverage 47 27 29 103 65.0%
Garment, Footwear and Apparel 17 22 127 166 69.9%
Health 13 22 12 47 83.0%
ICT 22 26 20 68 66.2%
Logistics, warehousing, and transportation 26 30 12 68 57.4%
Rubber and Plastics 13 27 15 55 52.7%
Total 217 341 349 907 66.7%
The main purpose of the sampling is to provide findings that are representative for the selected sectors.
The survey had to be conducted in a randomly selected set of establishments within the 10 selected
sectors. Hence, the sampling method ensured a sample size that was statistically large enough to
represent each sector. To ensure regular replication of the survey, a stratified random sample design was
used.
In the sampling design process, the sample was divided into a number of cells defined by the size of the
employment and economic activities (i.e. the sector) (see appendix B: International Standard of
Industrial Classification). The main aims of the stratification of the workforce by size was to avoid the
large majority of interviews being conducted in small establishments since the number of small
establishments were considerably higher than the number of medium-sized or large establishments in
most sectors. In terms of employment impact, the medium-sized and large establishments are more
substantive than the small ones.
In addition to this, the medium-sized and large establishments are more likely to provide accurate data
on jobs and employment turnover by occupation for the previous 24 months, and are able to provide a
rough estimation of future skills demands for the next 12 months. Hence, the sample was drawn based
on stratified random sampling, with probability proportionate to the number of establishments in each
sector, and distribution proportional to the size of the workforce (10–19, 20–99, 100+). In each sector,
the number of sample are ensured to be high enough so that the inferential statistics in sectoral level can
hit the confidence level of 95% with confidence interval equal to 10%. Therefore, the number of sample
selection was also taking into account the non-response rates by sector, which based on past experiences,
in order to guarantee the minimum number of sample. As a result, a total of 907 establishment samples
was randomly selected, as indicated in the above table.
Questionnaire Design
The core questionnaire was designed in several stages, with the co-operation of the Swedish experts.
There existed several pressures on the questionnaire regarding balancing the content of the questionnaire
so it covered important issues and the over burdening for employers due to a lengthy questionnaire.
The questionnaire was based on the previous ESNS in 2012 and adjusted to meet the specific features
of the Cambodian economy and employment structure. In addition to this, some additional questions

National Employment Agency 51 | 71
were added based on the Swedish Employer Survey in order to obtain the data necessary to build the
occupational barometer.
The questionnaire was translated into the Khmer language in order to assist the interviewers and the
employers. Before the final questionnaire was put into use, it was tested through a pilot survey, to
determine if the questions were properly worded, sequenced, and could be understood. The pilot survey
revealed important issues that were not covered by the initial formulation, and tested the skip pattern
for inconsistencies and errors. The questionnaire was re-examined and revised again by Swedish experts
before being put in place.
As mentioned above, in order to provide a comprehensive picture of the ten sectors included in the
survey, the questionnaire covered a number of issues – mainly, but not uniquely, from a labour market
perspective. The first part of the questionnaire aimed to collect data that identified the persons
interviewed and the background of establishment. The main body of the questionnaire was structured
into seven sections, with a total of 48 questions, covering the following sections (see Appendix D):
(A) General information of the establishment (questions A1–A21). This first section aimed at
collecting information on the date on which the establishments started the business, to ascertain
whether or not the establishment was legally registered, the type of business entity, the type of
ownership, their main activities and products, and the extent of the market.
(B) Market development and capacity (questions B1–B2): This section aimed at evaluating the
demand for goods or services of sampled establishments as well as identifying free capacity
utilization among personnel.
(C) Employment (questions C1–C5). In this section, each establishment was asked to report and
estimate the total number of workers, as well its employment structure classified by ISCO. In
addition to this, each establishment was asked to indicate the number of people that have been
or are expected to be recruited or leave in the past 12 months or in the next 12 months in order
to determine the staff turnover rate.
(D) Employers’ perceptions of the first time job seekers (questions D1–D4). In this section, the
questions aimed to evaluate how many establishments have recruited first time job seekers who
were coming from: 1) upper secondary schools; 2) technical and vocational schools (TVET); or
3) university or other higher education institutions. It tried, moreover, to evaluate the level of
preparation of the newly hired and the weak areas in their preparation.
(E) Skills gaps and workforce training (questions E1–E8). After having ascertained whether the
establishments were facing problems of the existing staff not performing jobs up to the
requirements of employer, the following set of questions aimed to find out which proportion of
staff was inadequate in the five more relevant occupations of the establishments, which factors
were responsible for the situation, and which skills need to be improved. A second set of
questions concerned training programs provided by the company. The first question aimed to
find out if the staff of the establishments did take part in any training programs, and eventually
if the establishments did finance it, completely or partially. The following questions aimed to
understand if the establishments found any difficulties in organizing the courses and if so what
the reasons were and in which fields of training they found shortages or low quality of courses
and/or trainers.
(F) Vacancies (questions F1–F9). This set of questions was the heart of the survey and it was
devoted to the issue of vacancies and to occupational forecasting. In particular, it focuses on:
- The number of employees that are or will be recruited by establishments in the next six
months,
- The current recruitment situation as well as the number of vacancies with a lack of potential
employees or recruitment difficulty,

52 | 71 National Employment Agency
- Whether and in which occupations the vacancies are hard-to-fill, what the reasons are and
which skills are presently lacking in the Cambodian labour market, and the wage offered
by establishment in each occupation,
- Determining the impact of recruitment difficulties on business operations, as well as on
recruitment process, which may cause employer to refrain from recruiting new staff.
- Finally, the establishment was asked whether the hard-to-fill vacancies had negative effects
and, in that case, what the establishment was doing to overcome the difficulty.
(G) (G)Business strategy (questions G1–G2). This last section attempted to ascertain whether the
establishments planned to introduce new products, services, or technologies, or to expand or
switch to new markets. In this case, the questionnaire inquired whether the establishment would
complement the innovation process with training, reorganization, and/or recruitment of new
staff.
Fieldwork
The owners, human resource managers, directors, and senior managers were interviewed face-to- face
using the structured questionnaire. The advantage of this approach was that it allowed the collection of
both quantitative and qualitative data on skills gaps and skills shortages in occupation types. The
fieldwork was carried out between the 1st and 31st of October 2017, and the total sample of 907
establishments had been collected across 15 provinces and Phnom Penh capital (figure A-2). The
average length of the interview was around 60 minutes.
Figure A-2: Sample distribution by province
Prior to the fieldwork, the preparation of a fieldwork operation manual for the enumerators and survey
team leaders was undertaken in order to ensure that all, both enumerators and survey team leaders
thoroughly understood the survey instruments, and that they were consistent with each other.
Moreover, to properly conduct the nationwide employers’ survey, intensive training programmes were
arranged for the five survey team leaders and enumerators. The training covered the general instruction
of interviewing techniques, fieldwork procedures, and a detailed discussion of each question in the
questionnaire, particularly on frequently asked questions/situations. To ensure that the survey went
smoothly, the selected establishments were called directly and also received formal letters to inform,
make appointments, and seek close collaboration.
433
9256 50 39 35 33 31 27 24 21 18 18 13 13 4
0
100
200
300
400
500
Phnom
Pen
h
Sie
m R
eap
Pre
ah S
ihan
ouk
Bat
tam
ban
g
Tak
eo
Tboung K
hm
um
Kan
dal
Ban
teay
Mea
nch
ey
Pre
y V
eng
Svay
Rie
ng
Kam
pong C
ham
Kam
pong T
hom
Kam
pot
Kam
pong C
hhnan
g
Kam
pong S
peu
Kep

National Employment Agency 53 | 71
The overall response rate for the survey was 66.7%, calculated as “the number of achieved interviews”
as a proportion of the “total establishments selected for interview”. The response rate slightly higher
compared to the previous survey in 2015 which was 66.1%. A detailed breakdown of response rates by
sector is shown in Table A-1.
During the field survey, the interviews were monitored by survey team leaders who were responsible
for tracking the survey and quality control. Completed questionnaires were checked and rechecked by
the technical team before they were approved.
Data Entry and Data Analysis
The Epidata application was used for data entry. This allowed for the creation of a questionnaire form
and to establish possible correlations and skipped codes (logical relations between answers in different
questions) and to check for data error. In order to ensure the data were correct, the double entry
technique was adopted. By using Epidata, the survey database could be exported into the Stata and Excel
application for analysis and to make the necessary tabulation.
To ensure comparability with the previous study and other studies conducted in other countries, the
International Standard Industrial Classification (see appendix C) and the International Standard
Classification of Occupations (see appendix B) were used to identify the sub-sectors and occupation
types relevant for the analysis.
Weighting
Data for the survey was weighted and grossed up to estimate the total number of establishments and the
total number of employment. The weighting was designed on an interlocking grid of sector by group
size of employment. The sampling weights, by definition, are nothing other than the inverse of sampling
fractions. Separate weights have been undertaken in order to present the finding based on the number
of establishments and the number of employees.
Problems Countered and Solutions Adopted
ESNS 2017 is the fourth installment of ESNS survey, a large-scale skills survey, conducted by NEA.
Despite fourth installment, there was no doubt that the remaining lack of experiences and technical
capacity were challenges for the team in carrying out the study, but at the same time it provided a very
important opportunity to continue to learn and improve the basic techniques for labour market analysis.
The second problem was the lack of updated list of establishments for the sampling frame. In addition
to this, some of the names and addresses of the establishments listed by the NIS were obsolete. It was
therefore time-consuming to locate the establishments, contact them, and schedule meetings. As a result,
more time and resources were spent for the fieldwork (18.6% of total samples could not be interviewed
due to invalid contact numbers).
Last but not least, difficulty is regarding the questionnaire’s design: the difficulty to adapt the
questionnaire from developed countries to the Cambodian context because of the different structure of
the economy, technology, education, policy goals/purposes, etc. These posed problems during data
collection and analysis. Also, another problem is the balance between the details of information to be
collected and the length of questionnaire being short and simple enough that could well respond by the
interviewees.

54 | 71 National Employment Agency
B- International Standard Classification of Occupations (ISCO)
The ISCO is one of the main international classifications, and was developed by the ILO. ISCO is a tool
for organizing jobs into a clearly defined set of groups according to the tasks and duties undertaken in the
job. Its main aims are to provide: a basis for the international reporting, comparison, and exchange of
statistical and administrative data about occupations; a model for the development of national and regional
classifications of occupations; and a system that can be used directly in countries that have not developed
their own national classifications. Definitions of each of the four ISCO skill levels are given below. These
definitions do not change the boundaries between the skills levels used in ISCO_88. They serve to clarify
these boundaries and to deal with cases where formal educational requirements may not be the most
suitable method of measuring the skill level of a particular occupation. Each definition provides examples
of the typical or characteristic tasks performed at each skill level, the types of skill required (in broad
terms), and the typical occupations classified at that skill level.
Skill Level 1: Occupations at Skill Level 1 typically require the performance of simple and routine physical
or manual tasks. They may require the use of hand-held tools such as shovels, or of simple electrical equipment
such as vacuum cleaners. They involve tasks such as cleaning, digging, lifting and carrying materials by hand,
sorting, storing or assembling goods by hand (sometimes in the context of mechanized operations), operating
non-motorized vehicles, and picking fruit and vegetables. Many occupations at Skill Level 1 may require
physical strength and/or endurance. For some jobs, basic skills in literacy and numeracy may be required. If
required, these skills would not form a major part of the job. For competent performance in some occupations
at Skill Level 1, completion of primary education or the first stage of basic education (International Standard
Classification of Education Level 1 [ISCED]) may be required. A short period of on-the-job training may be
required for some jobs. Occupations classified at Skill Level 1 include office cleaners, freight handlers, garden
labourers, and kitchen assistants.
Skill Level 2: Occupations at Skill Level 2 typically involve the performance of tasks such as operating
machinery and electronic equipment; driving vehicles; maintenance and repair of electrical and
mechanical equipment; and manipulation, ordering, and storage of information. For almost all occupations
at Skill Level 2, the ability to read information such as safety instructions, to make written records of work
completed, and to accurately perform simple arithmetical calculations is essential. Many occupations at
this skill level require relatively advanced literacy and numeracy skills, and good interpersonal
communication skills. In some occupations, these skills are required for a major part of the work. Many
occupations at this skill level require a high level of manual dexterity. The knowledge and skills required
for competent performance in all occupations at Skill Level 2 are generally obtained through completion
of the first stage of secondary education (ISCED Level 2). Some occupations require the completion of
the second stage of secondary education (ISCED Level 3), which may include a significant component of
specialized vocational education and on-the-job training. Some occupations require completion of
vocation-specific education undertaken after completion of secondary education (ISCED Level 4). In
some cases, experience and on-the-job training may substitute for the formal education. Occupations
classified at Skill Level 2 include butchers, bus-drivers, secretaries, accounts clerks, sewing-machinists,
dressmakers, shop sales assistants, police officers, hairdressers, building electricians, and motor vehicle
mechanics.
Skill Level 3: Occupations at Skill Level 3 typically involve the performance of complex technical and
practical tasks that require an extensive body of factual, technical, and procedural knowledge in a
specialized field. Occupations at this skill level generally require a high level of literacy and numeracy,
and well-developed interpersonal communication skills. These skills may include the ability to understand
complex written material, prepare factual reports, and communicate with people who are distressed. The
knowledge and skills required at Skill Level 3 are usually obtained as the result of study at a higher
educational institution following completion of secondary education for a period of one to three years
(ISCED Level 5b). In some cases, extensive relevant work experience and prolonged on-the-job training
may substitute for the formal education. Occupations classified at Skill Level 3 include shop managers,

National Employment Agency 55 | 71
medical laboratory technicians, legal secretaries, commercial sales representatives, computer support
technicians, and broadcasting and recording technicians.
Skill Level 4: Occupations at Skill Level 4 typically involve the performance of tasks that require complex
problem solving and decision-making based on an extensive body of theoretical and factual knowledge in
a specialized field. The tasks performed typically include analysis and research to extend the body of
human knowledge in a particular field; diagnosis and treatment of disease; imparting knowledge to others;
design of structures or machinery; and of processes for construction and production. Occupations at this
skill level generally require extended levels of literacy and numeracy, sometimes at a very high level, and
excellent interpersonal communication skills. These skills generally include the ability to understand
complex written material and communicate complex ideas in media such as books, reports, and oral
presentations. The knowledge and skills required at Skill Level 4 are usually obtained as the result of study
at a higher educational institution for a period of three to six years leading to the award of a first degree
or higher qualification (ISCED Level 5a or higher). In some cases, experience and on-the-job training
may substitute for the formal education. In many cases, appropriate formal qualifications are an essential
requirement for entry to the occupation. Occupations classified at Skill Level 4 include sales and
marketing managers, civil engineers, secondary school teachers, medical practitioners, operating theatre
nurses, and computer systems analysts.
The relationship between the first digit of ISCO-08 and the four ISCO-08 skill levels is summarized below:
ISCO-08 major groups Skill level
1-Managers, senior officials, and legislators 3 + 4
2-Professionals 4
3-Technicians and associated professionals 3
4-Clerks
5-Service and sales workers
6-Skilled agricultural and fishery workers
7-Craft and related trades workers
8-Plant and machine operators, and assemblers
2
9-Elementary occupations 1 Note: A significant problem regarding the application of the concept of “skill level” in ISCO_88 relates to occupations with
similar tasks and duties (or content) but with a different (higher or lower) “skill level” requirement, as measured in
particular countries. This is because, given realistic differences in national education systems, the same occupation (with
the same set of tasks and duties) can be undertaken by individuals with different educational levels without affecting the
level of skill required for competent performance of the tasks. This is the case for some elementary, craft, and technical
occupations, which in many countries require higher education levels than those assigned in ISCO_88. Source: (ILO, 2012)
Formal education and training requirement are used as part of the measurement of the skill level of an
occupation and these requirements are defined in terms of ISCED-97. However, the use of ISCED
categories to assist in defining the four-skill level does not imply that the skills necessary to perform
the tasks and duties of a given job can be acquired only through formal education. The skills may be,
and often are, acquired through informal training and experience. In addition, it should be emphasized
that the focus in ISCO-08 is on the skills required to carry out the tasks and duties of an occupation and
not on whether a worker employed in a particular occupation is more or less skilled than another worker
in the same occupation. A mapping between ISCO skill levels and levels of education in ISCED-97 is
provided in table below:
Skill levels ISCED-97
4 6- Second stage of tertiary education (leading to an advanced research qualification)
5a- First stage of tertiary education, 1st degree (medium duration)
3 5b- First stage of tertiary education (short or medium duration)
2 4- Post-secondary, non-tertiary education
3- Upper secondary level of education
2- Lower secondary level of education
1 1- Primary level of education
Source: (ILO, 2012)

56 | 71 National Employment Agency
C- International Standard Industrial Classification (ISIC)
The table below shows the 10 sectors covered by the survey and their corresponding ISIC (revision 4)
definitions.
Code Description Code Description
2023Manufacture of soap and detergents, cleaning and polishing
preparations, perfumes and toilet preparations
10 Manufacture of food products 2029 Manufacture of other chemical products n.e.c.
1010 Processing and preserving of meat 2030 Manufacture of man-made fibres
1020 Processing and preserving of fish, crustaceans and molluscs 22 Manufacture of rubber and plastics products
1030 Processing and preserving of fruit and vegetables 2211Manufacture of rubber tyres and tubes; retreading and rebuilding
of rubber tyres
1040 Manufacture of vegetable and animal oils and fats 2219 Manufacture of other rubber products
1050 Manufacture of dairy products 2220 Manufacture of plastics products
1061 Manufacture of grain mill products
1062 Manufacture of starches and starch products 41 Construction of buildings
1071 Manufacture of bakery products 4100 Construction of buildings
1072 Manufacture of sugar 42 Civil engineering
1073 Manufacture of cocoa, chocolate and sugar confectionery 4210 Construction of roads and railways
1074Manufacture of macaroni, noodles, couscous and similar
farinaceous products4220 Construction of utility projects
1075 Manufacture of prepared meals and dishes 4290 Construction of other civil engineering projects
1079 Manufacture of other food products n.e.c. 43 Specialized construction activities
1080 Manufacture of prepared animal feeds 4311 Demolition
11 Manufacture of beverages 4312 Site preparation
1101 Distilling, rectifying and blending of spirits 4321 Electrical installation
1102 Manufacture of wines 4322 Plumbing, heat and air-conditioning installation
1103 Manufacture of malt liquors and malt 4329 Other construction installation
1104Manufacture of soft drinks; production of mineral waters and
other bottled waters4330 Building completion and finishing
4390 Other specialized construction activities
13 Manufacture of textiles
1311 Preparation and spinning of textile fibres 49 Land transport and transport via pipelines
1312 Weaving of textiles 4911 Passenger rail transport, interurban
1313 Finishing of textiles 4912 Freight rail transport
1391 Manufacture of knitted and crocheted fabrics 4921 Urban and suburban passenger land transport
1392 Manufacture of made-up textile articles, except apparel 4922 Other passenger land transport
1393 Manufacture of carpets and rugs 4923 Freight transport by road
1394 Manufacture of cordage, rope, twine and netting 4930 Transport via pipeline
1399 Manufacture of other textiles n.e.c. 50 Water transport
14 Manufacture of wearing apparel 5011 Sea and coastal passenger water transport
1410 Manufacture of wearing apparel, except fur apparel 5012 Sea and coastal freight water transport
1420 Manufacture of articles of fur 5021 Inland passenger water transport
1430 Manufacture of knitted and crocheted apparel 5022 Inland freight water transport
15 Manufacture of leather and related products 51 Air transport
1511 Tanning and dressing of leather; dressing and dyeing of fur 5110 Passenger air transport
1512Manufacture of luggage, handbags and the like, saddlery and
harness5120 Freight air transport
1520 Manufacture of footwear 52 Warehousing and support activities for transportation
5210 Warehousing and storage
20 Manufacture of chemicals and chemical products 5221 Service activities incidental to land transportation
2011 Manufacture of basic chemicals 5222 Service activities incidental to water transportation
2012 Manufacture of fertilizers and nitrogen compounds 5223 Service activities incidental to air transportation
2013 Manufacture of plastics and synthetic rubber in primary forms 5224 Cargo handling
2021 Manufacture of pesticides and other agrochemical products 5229 Other transportation support activities
2022Manufacture of paints, varnishes and similar coatings, printing
ink and mastics
Construction
Food and beverages
Rubber and Plastics
Transportation, Warehousing and Logistics
Garment, Footwear and Apparel
National Employment Agency 57 | 71
Code Description Code Description
6491 Financial leasing
55 Accommodation 6492 Other credit granting
5510 Short term accommodation activities 6499Other financial service activities, except insurance and pension
funding activities, n.e.c.
5520 Camping grounds, recreational vehicle parks and trailer parks 65Insurance, reinsurance and pension funding, except compulsory
social security
5590 Other accommodation 6511 Life insurance
6512 Non-life insurance
61 Telecommunications 6520 Reinsurance
6110 Wired telecommunications activities 6530 Pension funding
6120 Wireless telecommunications activities 66 Activities auxiliary to financial service and insurance activities
6130 Satellite telecommunications activities 6611 Administration of financial markets
6190 Other telecommunications activities 6612 Security and commodity contracts brokerage
62 Computer programming, consultancy and related activities 6619 Other activities auxiliary to financial service activities
6201 Computer programming activities 6621 Risk and damage evaluation
6202Computer consultancy and computer facilities management
activities6622 Activities of insurance agents and brokers
6209 Other information technology and computer service activities 6629 Other activities auxiliary to insurance and pension funding
63 Information service activities 6630 Fund management activities
6311 Data processing, hosting and related activities
6312 Web portals 85 Education
6391 News agency activities 8521 General secondary education
6399 Other information service activities n.e.c. 8522 Technical and vocational secondary education
8530 Higher education
64Financial service activities, except insurance and pension
funding
6411 Central banking 86 Human health activities
6419 Other monetary intermediation 8610 Hospital activities
6420 Activities of holding companies 8620 Medical and dental practice activities
6430 Trusts, funds and similar financial entities 8690 Other human health activities
Accommodation
Education
Human Health Activities
Finance and Insurance
Information Communication Technology

58 | 71 National Employment Agency
D- Additional Figures and Tables Figure D.1: Year of starting business by nationality of ownership
Figure D-2: Share of establishment by type of market
Table D-1: Distribution of establishment by sector and type of business entity
Sector Individual
proprietor
General
partnership
Limited
partnership
Private limited
establishment
Public limited
establishment
State owned
organization NGO
Others Total Absolute Value
Accommodation 538 32 9 101 0 0 0 680
Construction 58 10 11 36 0 0 0 116
Education 42 6 14 12 0 52 6 134
Finance and insurance 64 99 107 88 67 12 14 449
Food and beverage 459 31 2 26 2 0 29 549
Garment, footwear and apparel 1327 179 178 221 11 0 79 1993
Health 19 2 7 6 0 84 9 127
ICT 83 34 6 30 0 27 7 187
Logistics, warehousing and
transportation 105 19 23 43 0 3 3 195
Rubber and plastics 76 34 3 22 3 3 0 141
Total 2769 446 361 586 82 181 146 4571
Percentage composition by type of business entity (%)
Accommodation 79.0 4.7 1.4 14.9 0 0 0 100
Construction 50.3 9.0 9.8 31.0 0 0 0 100 Education 31.6 4.7 10.7 9.2 0 39.0 4.7 100
Finance and insurance 14.2 22.0 23.8 19.6 14.8 2.6 3.0 100
Food and beverage 83.6 5.6 0.4 4.8 0.4 0 5.3 100 Garment, footwear and apparel 66.5 9.0 8.9 11.1 0.5 0 4.0 100
Health 14.6 1.7 5.6 5.0 0 66.0 7.2 100
ICT 44.4 18.4 3.3 16.1 0 14.3 3.5 100 Logistics, warehousing and
transportation 53.6 9.9 11.5 22.1 0 1.6 1.3 100
Rubber and plastics 53.7 23.9 2.2 15.8 2.2 2.2 0 100 Total 60.6 9.8 7.9 12.8 1.8 4.0 3.2 100
72.6%
17.0%
10.4%Sold Domestically (3279)
Export Directly (768)
Exported through an intermediary (466)

National Employment Agency 59 | 71
Table D-2: Ownership of establishments and registration rates by sectors
Sector Ownership (%) Registration
Rates (%) Cambodian Foreign Joint share
Accommodation 89.9 9.1 1.0 99.0
Construction 79.4 16.8 3.8 95.3
Education 96.2 2.3 1.5 100.0
Finance and insurance 45.1 20.7 34.2 100.0
Food and beverage 96.7 2.9 0.5 75.2
Garment, footwear and apparel 55.2 34.1 10.6 63.0
Health 87.9 4.7 7.4 100.0
ICT 42.5 39.5 18.0 98.7
Logistics, warehousing and transportation 81.2 16.6 2.2 91.8
Rubber and plastics 43.7 54.4 1.8 90.7
Total 65.5 22.9 9.2 79.9
Table D-3: Employment structure by occupation and sector in 2017
Note:
ISCO_1: Managers
ISCO_2: Professionals
ISCO_3: Technical and associated professionals
ISCO_4: Clerical support workers
ISCO_5: Service and sales workers
ISCO_6: Skilled agriculture, forestry, and fishery workers
ISCO_7: Craft and related trades workers
ISCO_8: Plant and machine operators, and assemblers
ISCO_9: Elementary occupations
DistributionofemployedbysectorandISCOmajorgroupin2017
% Absolute Value
Row percentage
Accommodation 5.6% 3.2% 5.6% 16.7% 33.9% 1.3% 3.3% 6.4% 24.0% 100.0% 36,680
Construction 7.4% 11.5% 15.7% 2.9% 3.7% 0.3% 19.0% 20.3% 19.2% 100.0% 7,542
Education 9.8% 52.8% 13.6% 9.0% 4.5% 0.3% 0.2% 0.5% 9.3% 100.0% 14,561
Finance and insurance 7.5% 13.7% 28.5% 32.2% 9.6% 0.0% 0.2% 0.6% 7.7% 100.0% 78,611
Food and Beverage 9.9% 9.9% 4.3% 5.9% 25.9% 0.2% 5.2% 5.2% 33.5% 100.0% 17,035
Garment, footwear and apparel 2.8% 0.6% 1.0% 0.6% 0.5% 0.7% 4.5% 79.8% 9.5% 100.0% 742,944
Health 6.6% 23.7% 39.5% 9.3% 1.6% 0.0% 0.5% 1.1% 17.8% 100.0% 8,497
ICT 10.0% 13.6% 24.8% 14.8% 25.5% 0.0% 1.0% 5.8% 4.5% 100.0% 14,012
Logistics, warehousing and transportation 6.7% 7.8% 16.8% 9.5% 11.5% 0.0% 2.9% 19.5% 25.2% 100.0% 10,233
Rubber and plastics 3.5% 1.4% 3.8% 2.3% 1.9% 46.6% 28.6% 3.8% 8.1% 100.0% 32,858
Total 3.7% 3.4% 4.8% 4.5% 3.6% 2.3% 4.9% 62.2% 10.5% 100.0% 962,972
Column composition
Accommodation 5.7% 3.7% 4.5% 14.2% 36.2% 2.2% 2.6% 0.4% 8.8%
Construction 1.6% 2.8% 2.7% 0.5% 0.8% 0.1% 3.1% 0.3% 1.5%
Education 4.0% 23.9% 4.3% 3.0% 1.9% 0.2% 0.1% 0.0% 1.4%
Finance and insurance 16.8% 34.6% 50.2% 60.1% 22.4% 0.0% 0.4% 0.1% 6.2%
Food and Beverage 4.8% 5.4% 1.6% 2.4% 13.2% 0.2% 1.9% 0.2% 5.8%
Garment, footwear and apparel 56.7% 13.9% 16.1% 9.7% 10.7% 24.3% 69.9% 98.5% 69.3%
Health 1.6% 6.5% 7.6% 1.9% 0.4% 0.0% 0.1% 0.0% 1.6%
ICT 3.7% 5.7% 7.2% 4.5% 9.9% 0.0% 0.3% 0.1% 0.6%
Logistics, warehousing and transportation 1.5% 2.0% 2.9% 1.8% 2.7% 0.0% 0.5% 0.3% 2.0%
Rubber and plastics 3.4% 1.6% 2.9% 1.9% 1.9% 73.1% 21.2% 0.2% 2.8%
% 100.0% 100.0% 100.0% 100.0% 100.0% 100.0% 100.0% 100.0% 100.0%
Absolute Value 36,028 32,267 46,092 43,594 34,634 22,489 47,554 599,256 101,058
ISCO_9Grand Total
Grand Total
ISCO_1 ISCO_2 ISCO_3 ISCO_4 ISCO_5 ISCO_6 ISCO_7 ISCO_8
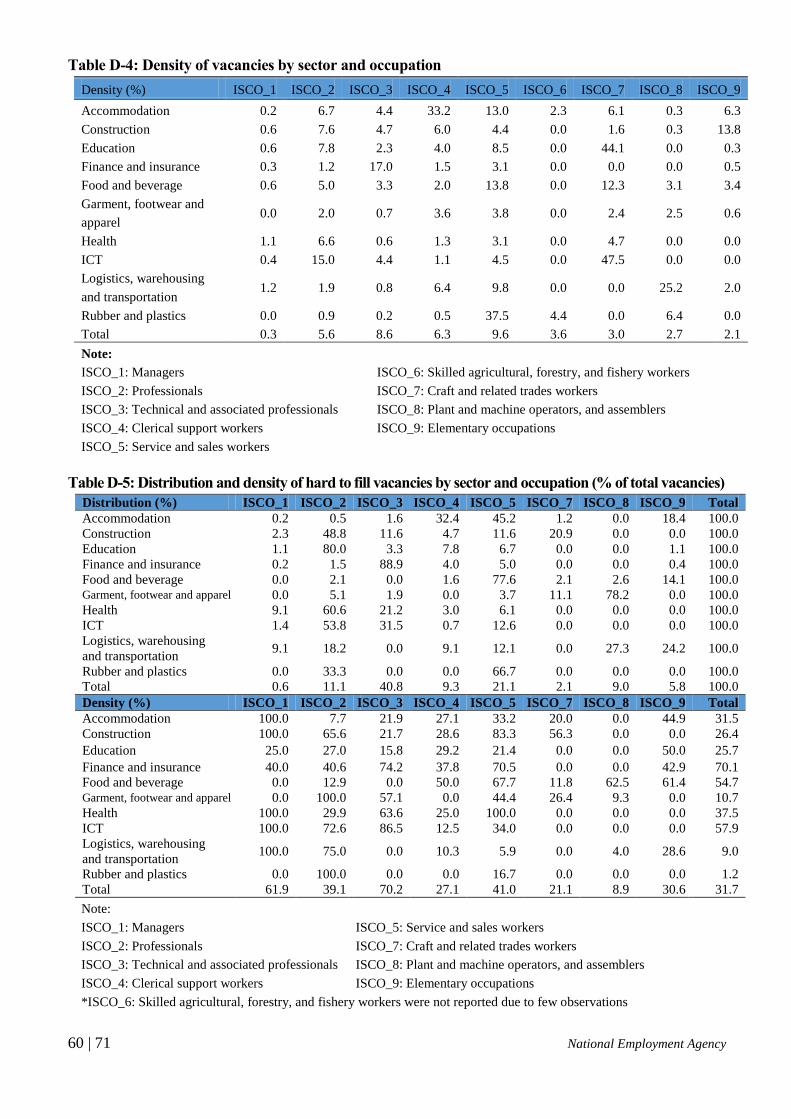
60 | 71 National Employment Agency
Table D-4: Density of vacancies by sector and occupation
Density (%) ISCO_1 ISCO_2 ISCO_3 ISCO_4 ISCO_5 ISCO_6 ISCO_7 ISCO_8 ISCO_9
Accommodation 0.2 6.7 4.4 33.2 13.0 2.3 6.1 0.3 6.3
Construction 0.6 7.6 4.7 6.0 4.4 0.0 1.6 0.3 13.8
Education 0.6 7.8 2.3 4.0 8.5 0.0 44.1 0.0 0.3
Finance and insurance 0.3 1.2 17.0 1.5 3.1 0.0 0.0 0.0 0.5
Food and beverage 0.6 5.0 3.3 2.0 13.8 0.0 12.3 3.1 3.4
Garment, footwear and
apparel 0.0 2.0 0.7 3.6 3.8 0.0 2.4 2.5 0.6
Health 1.1 6.6 0.6 1.3 3.1 0.0 4.7 0.0 0.0
ICT 0.4 15.0 4.4 1.1 4.5 0.0 47.5 0.0 0.0
Logistics, warehousing
and transportation 1.2 1.9 0.8 6.4 9.8 0.0 0.0 25.2 2.0
Rubber and plastics 0.0 0.9 0.2 0.5 37.5 4.4 0.0 6.4 0.0
Total 0.3 5.6 8.6 6.3 9.6 3.6 3.0 2.7 2.1
Note:
ISCO_1: Managers ISCO_6: Skilled agricultural, forestry, and fishery workers
ISCO_2: Professionals ISCO_7: Craft and related trades workers
ISCO_3: Technical and associated professionals ISCO_8: Plant and machine operators, and assemblers
ISCO_4: Clerical support workers ISCO_9: Elementary occupations
ISCO_5: Service and sales workers
Table D-5: Distribution and density of hard to fill vacancies by sector and occupation (% of total vacancies)
Distribution (%) ISCO_1 ISCO_2 ISCO_3 ISCO_4 ISCO_5 ISCO_7 ISCO_8 ISCO_9 Total
Accommodation 0.2 0.5 1.6 32.4 45.2 1.2 0.0 18.4 100.0
Construction 2.3 48.8 11.6 4.7 11.6 20.9 0.0 0.0 100.0
Education 1.1 80.0 3.3 7.8 6.7 0.0 0.0 1.1 100.0
Finance and insurance 0.2 1.5 88.9 4.0 5.0 0.0 0.0 0.4 100.0
Food and beverage 0.0 2.1 0.0 1.6 77.6 2.1 2.6 14.1 100.0 Garment, footwear and apparel 0.0 5.1 1.9 0.0 3.7 11.1 78.2 0.0 100.0
Health 9.1 60.6 21.2 3.0 6.1 0.0 0.0 0.0 100.0
ICT 1.4 53.8 31.5 0.7 12.6 0.0 0.0 0.0 100.0
Logistics, warehousing
and transportation 9.1 18.2 0.0 9.1 12.1 0.0 27.3 24.2 100.0
Rubber and plastics 0.0 33.3 0.0 0.0 66.7 0.0 0.0 0.0 100.0
Total 0.6 11.1 40.8 9.3 21.1 2.1 9.0 5.8 100.0
Density (%) ISCO_1 ISCO_2 ISCO_3 ISCO_4 ISCO_5 ISCO_7 ISCO_8 ISCO_9 Total
Accommodation 100.0 7.7 21.9 27.1 33.2 20.0 0.0 44.9 31.5
Construction 100.0 65.6 21.7 28.6 83.3 56.3 0.0 0.0 26.4
Education 25.0 27.0 15.8 29.2 21.4 0.0 0.0 50.0 25.7
Finance and insurance 40.0 40.6 74.2 37.8 70.5 0.0 0.0 42.9 70.1
Food and beverage 0.0 12.9 0.0 50.0 67.7 11.8 62.5 61.4 54.7 Garment, footwear and apparel 0.0 100.0 57.1 0.0 44.4 26.4 9.3 0.0 10.7
Health 100.0 29.9 63.6 25.0 100.0 0.0 0.0 0.0 37.5
ICT 100.0 72.6 86.5 12.5 34.0 0.0 0.0 0.0 57.9
Logistics, warehousing
and transportation 100.0 75.0 0.0 10.3 5.9 0.0 4.0 28.6 9.0
Rubber and plastics 0.0 100.0 0.0 0.0 16.7 0.0 0.0 0.0 1.2
Total 61.9 39.1 70.2 27.1 41.0 21.1 8.9 30.6 31.7
Note:
ISCO_1: Managers ISCO_5: Service and sales workers
ISCO_2: Professionals ISCO_7: Craft and related trades workers
ISCO_3: Technical and associated professionals ISCO_8: Plant and machine operators, and assemblers
ISCO_4: Clerical support workers ISCO_9: Elementary occupations
*ISCO_6: Skilled agricultural, forestry, and fishery workers were not reported due to few observations
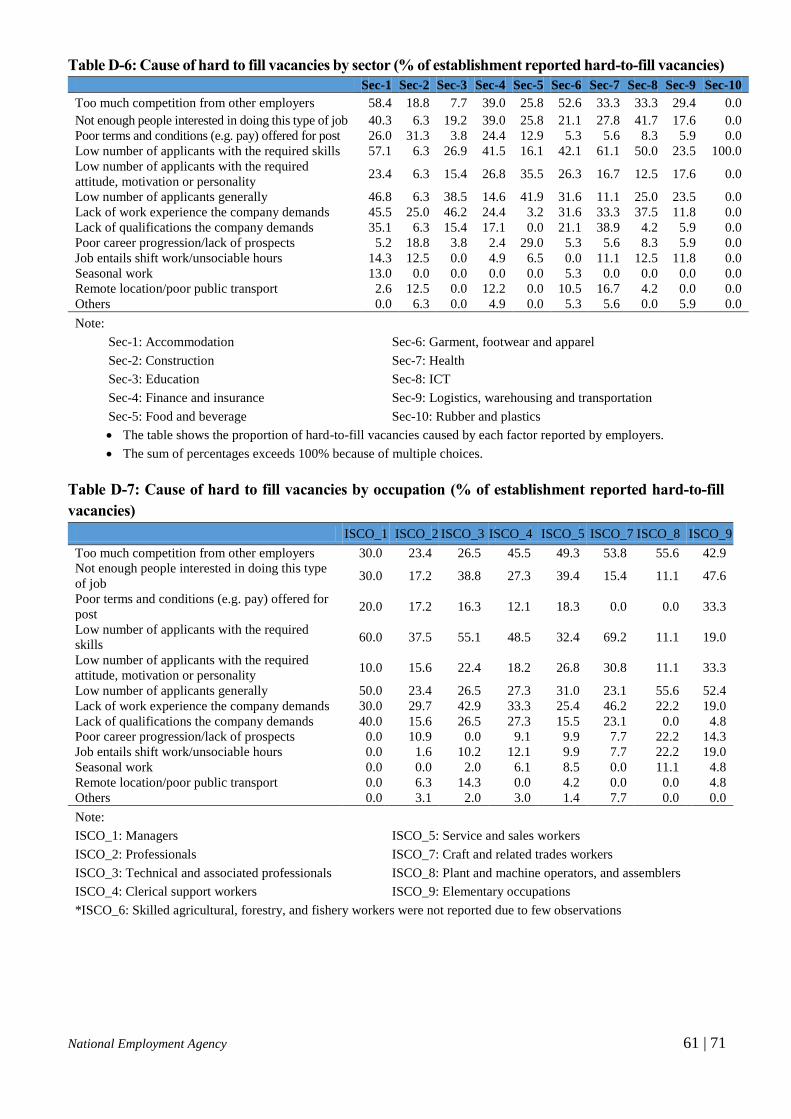
National Employment Agency 61 | 71
Table D-6: Cause of hard to fill vacancies by sector (% of establishment reported hard-to-fill vacancies)
Sec-1 Sec-2 Sec-3 Sec-4 Sec-5 Sec-6 Sec-7 Sec-8 Sec-9 Sec-10
Too much competition from other employers 58.4 18.8 7.7 39.0 25.8 52.6 33.3 33.3 29.4 0.0
Not enough people interested in doing this type of job 40.3 6.3 19.2 39.0 25.8 21.1 27.8 41.7 17.6 0.0
Poor terms and conditions (e.g. pay) offered for post 26.0 31.3 3.8 24.4 12.9 5.3 5.6 8.3 5.9 0.0
Low number of applicants with the required skills 57.1 6.3 26.9 41.5 16.1 42.1 61.1 50.0 23.5 100.0
Low number of applicants with the required
attitude, motivation or personality 23.4 6.3 15.4 26.8 35.5 26.3 16.7 12.5 17.6 0.0
Low number of applicants generally 46.8 6.3 38.5 14.6 41.9 31.6 11.1 25.0 23.5 0.0
Lack of work experience the company demands 45.5 25.0 46.2 24.4 3.2 31.6 33.3 37.5 11.8 0.0
Lack of qualifications the company demands 35.1 6.3 15.4 17.1 0.0 21.1 38.9 4.2 5.9 0.0
Poor career progression/lack of prospects 5.2 18.8 3.8 2.4 29.0 5.3 5.6 8.3 5.9 0.0
Job entails shift work/unsociable hours 14.3 12.5 0.0 4.9 6.5 0.0 11.1 12.5 11.8 0.0
Seasonal work 13.0 0.0 0.0 0.0 0.0 5.3 0.0 0.0 0.0 0.0
Remote location/poor public transport 2.6 12.5 0.0 12.2 0.0 10.5 16.7 4.2 0.0 0.0
Others 0.0 6.3 0.0 4.9 0.0 5.3 5.6 0.0 5.9 0.0
Note:
Sec-1: Accommodation Sec-6: Garment, footwear and apparel
Sec-2: Construction Sec-7: Health
Sec-3: Education Sec-8: ICT
Sec-4: Finance and insurance Sec-9: Logistics, warehousing and transportation
Sec-5: Food and beverage Sec-10: Rubber and plastics
The table shows the proportion of hard-to-fill vacancies caused by each factor reported by employers.
The sum of percentages exceeds 100% because of multiple choices.
Table D-7: Cause of hard to fill vacancies by occupation (% of establishment reported hard-to-fill
vacancies)
ISCO_1 ISCO_2 ISCO_3 ISCO_4 ISCO_5 ISCO_7 ISCO_8 ISCO_9
Too much competition from other employers 30.0 23.4 26.5 45.5 49.3 53.8 55.6 42.9
Not enough people interested in doing this type
of job 30.0 17.2 38.8 27.3 39.4 15.4 11.1 47.6
Poor terms and conditions (e.g. pay) offered for
post 20.0 17.2 16.3 12.1 18.3 0.0 0.0 33.3
Low number of applicants with the required
skills 60.0 37.5 55.1 48.5 32.4 69.2 11.1 19.0
Low number of applicants with the required
attitude, motivation or personality 10.0 15.6 22.4 18.2 26.8 30.8 11.1 33.3
Low number of applicants generally 50.0 23.4 26.5 27.3 31.0 23.1 55.6 52.4
Lack of work experience the company demands 30.0 29.7 42.9 33.3 25.4 46.2 22.2 19.0
Lack of qualifications the company demands 40.0 15.6 26.5 27.3 15.5 23.1 0.0 4.8
Poor career progression/lack of prospects 0.0 10.9 0.0 9.1 9.9 7.7 22.2 14.3
Job entails shift work/unsociable hours 0.0 1.6 10.2 12.1 9.9 7.7 22.2 19.0
Seasonal work 0.0 0.0 2.0 6.1 8.5 0.0 11.1 4.8
Remote location/poor public transport 0.0 6.3 14.3 0.0 4.2 0.0 0.0 4.8
Others 0.0 3.1 2.0 3.0 1.4 7.7 0.0 0.0
Note:
ISCO_1: Managers ISCO_5: Service and sales workers
ISCO_2: Professionals ISCO_7: Craft and related trades workers
ISCO_3: Technical and associated professionals ISCO_8: Plant and machine operators, and assemblers
ISCO_4: Clerical support workers ISCO_9: Elementary occupations
*ISCO_6: Skilled agricultural, forestry, and fishery workers were not reported due to few observations

62 | 71 National Employment Agency
Table D-8: Distribution and density of skills shortages vacancies by sector and occupation (% of total
vacancies)
Distribution ISCO_1 ISCO_2 ISCO_3 ISCO_4 ISCO_5 ISCO_7 ISCO_8 ISCO_9 Total
Accommodation 0.5 0.5 2.9 65.5 20.4 2.4 0.0 6.8 100.0
Construction 0.0 68.2 22.7 0.0 0.0 9.1 0.0 0.0 100.0
Education 1.8 87.7 3.5 7.0 0.0 0.0 0.0 0.0 100.0
Finance and insurance 0.0 2.0 87.2 0.5 10.2 0.0 0.0 0.0 100.0
Food and beverage 0.0 0.0 0.0 0.0 71.2 6.1 0.0 22.7 100.0
Garment, footwear and apparel 0.0 13.6 4.9 0.0 0.0 13.6 67.9 0.0 100.0
Health 16.7 44.4 22.2 5.6 11.1 0.0 0.0 0.0 100.0
ICT 2.5 40.0 33.8 1.3 22.5 0.0 0.0 0.0 100.0
Logistics, warehousing and
transportation 20.0 20.0 0.0 6.7 0.0 0.0 46.7 6.7 100.0
Rubber and plastics 0.0 33.3 0.0 0.0 66.7 0.0 0.0 0.0 100.0
Total 1.3 16.8 29.4 19.2 17.6 3.0 8.3 4.0 100.0
Density ISCO_1 ISCO_2 ISCO_3 ISCO_4 ISCO_5 ISCO_7 ISCO_8 ISCO_9 Total
Accommodation 100.0 3.8 18.8 26.3 7.2 20.0 0.0 8.0 15.1
Construction 0.0 46.9 21.7 0.0 0.0 12.5 0.0 0.0 13.5
Education 25.0 18.7 10.5 16.7 0.0 0.0 0.0 0.0 16.3
Finance and insurance 0.0 12.5 16.7 1.1 32.8 0.0 0.0 0.0 16.1
Food and beverage 0.0 0.0 0.0 0.0 21.4 11.8 0.0 34.1 18.8
Garment, footwear and apparel 0.0 100.0 57.1 0.0 0.0 12.1 3.0 0.0 4.0
Health 100.0 11.9 36.4 25.0 100.0 0.0 0.0 0.0 20.5
ICT 100.0 30.2 51.9 12.5 34.0 0.0 0.0 0.0 32.4
Logistics, warehousing and
transportation 100.0 37.5 0.0 3.4 0.0 0.0 3.1 3.6 4.1
Rubber and plastics 0.0 100.0 0.0 0.0 16.7 0.0 0.0 0.0 1.2
Total 47.6 21.5 18.5 20.4 12.5 11.1 3.0 7.8 11.6
Note:
ISCO_1: Managers ISCO_6: Skilled agricultural, forestry, and fishery workers
ISCO_2: Professionals ISCO_7: Craft and related trades workers
ISCO_3: Technical and associated professionals ISCO_8: Plant and machine operators, and assemblers
ISCO_4: Clerical support workers ISCO_9: Elementary occupations
ISCO_5: Service and sales workers
National Employment Agency 63 | 71
E- Employer Survey Questionnaire 2017
Good morning/afternoon. My name is………………………..I am from the National Employment
Agency of the Ministry of Labour and Vocational Training. We are conducting a survey of employer,
which aims to identify skills required and future skills needed in your establishment. The information
collected is strictly confidential and will be used only for statistical purpose. We would appreciate if you
would dedicate some of your time to answer all the following questions.
Ordinal Number of Questionnaire: ___________________
Interview Record
Interviewer’s name: ___
Telephone number:
Date of interview:
Time started: Time completed:
Quality Control by team leader
Survey team leader’s name: Date:
Telephone number: signature:
Remarks:
Quality Control by NEA team
Survey team leader’s name: Date:
Telephone number: signature:
Remarks: __________________________________________
Quality Control by technical team
Name: Time: signature:
Remarks:
Data Entry Record
Name of data encoder: Date:
Remarks:
Records on data cleaning and entry
Name of data cleaning person: Date:
Remarks:

64 | 71 National Employment Agency
Section A – Firmographics
A1. Name of the establishment in Khmer: ___
A2. Name of the establishment in English: ___
A3. Address of the establishment: Building no ____________ street ___
village________________commune/sangkat ____district ______province/city ___
A4. Address note: _________________________________________________________________ _
A5. Name of contact person: A6. Position of contact person __
A7. Contact person (Tel. no.) (1) (2)
A8. Office Tel. no. A9. Contact person (email) __
If the interviewee is different from contact person
A10. Name of the interviewee A11. Position of the interviewee __
A12. Interviewee phone no. A13. Interviewee’s office tel. no. ________
A14. Interviewee (email)
A15. When did your establishment start business? Year: |__|__|__|__|
A16. Has your establishment been registered at the Ministry of Commerce
or Provincial Department of Commerce or other institution?
Registered 1
Not registered 2
A17. The establishment is
a/an:
Individual proprietor 1
General partnership 2
Limited partnership 3
Private limited establishment 4
Public limited establishment 5
State owned organization (Include Autonomous organization) 6
Others (specify:__________________________________) 7
A18. The establishment is a: Single unit 1
Head office 2
Branch Office 3
A19. What share of this
company is owned:
Cambodian (100%) 1
Foreign (100%); Specify nationalities:_______________ 2
Joint share;
Specify the majority of share’s nationalities:____________ 3
A20. Could you please briefly describe the main business activity of the establishment, and indicate
your main products or services, and your customers: ____
____
Code ISIC: |__|__|__|__|
A21. Of the total output,
please indicate what share
is:
Sold domestically _______%
Exported directly _______%
Exported through an intermediary (indirect export) _______%

National Employment Agency 65 | 71
Section B - Market development and capacity
B1. Could you please give an assessment of demand for your goods/services/production?
Decreased Unchanged Increased
Last year
Next year
Next two years
B2. By how much can your workplace increase production or operation responding to the increase of
sales of products and services before you need to increase the workforce by hiring new staff?
(Percentage) 0 1-5 6-10 11-20 21-30 30+
Section C - Employment
C1. Could you please indicate the number of employees at your workplace in the following years,
including yourself? (Estimate the approximate number based on your knowledge of your enterprise and
your industry).
31/12/2016 Present 31/12/2017 31/12/2018 31/12/2019
Total ______ ______ ______ ______ ______
Female ______ ______ ______ ______ ______
Foreigner ______ ______ ______ ______ ______
C2. Could you please indicate how many employees of your establishment work in each of the following
occupations (In case of more than one occupation, choose the main one i.e. the one that takes up the greatest
proportion of time and please write 0 if the occupation is not applicable):
Occupation
Number of people
Present
Total Female Foreigner
Managers (This category includes chief executives; general and corporate managers; managing director;
administrative, finance, production, service and sale manager; and regional and branch manager who plan,
direct and coordinate the policies and activities of business and other organization.)
Professionals (Professionals increase the existing of knowledge, apply scientific or artistic concepts and theories, or teach in a
systematic manner. Most occupations in this category- such as engineers, lawyers, economists, computing
professionals, teachers and health professionals- require skills at graduate and postgraduate education.)
Technicians and associate professionals (This category performs mostly technical and related tasks connect with research and application of scientific,
artistic, or operational methods. These occupations include accounting associate professionals, office supervisors,
construction supervisor, industrial robot controllers, photographers, medical assistants, and chef which typically require skills at upper secondary or tertiary education,.)
Clerical support workers (This category performs clerical duties with associated with money-handling operations, travel arrangements,
requests for information and arrangement. Most of these jobs, such as general office clerks, payroll clerks, stock clerks, receptionists, transport clerks, secretariesand HR assistant, or bank tellers and bank clerks require skills at
least lower secondary educations.)
Service and sale workers (This category provides personal services related to travel, housekeeping, catering, personal care, or protection, or they demonstrate and sell goods. These occupations include cleaning and housekeeping, stall salespersons,
cooks, cashiers and ticket clerks, or contact center salespersons which require skills at least lower secondary
education.)
Skilled agricultural, forestry, and fishery workers (This group includes occupations that require skills at least secondary education or equivalent critical skills and
knowledge such as agricultural crop growers, mixed crop growers, gardeners, animal producers, and dairy and
livestock producers.)
Craft and related trades workers (This group applies their skills in the fields of mining and construction, making or repairing machinery, printing,
processed food, textiles, or articles including handicrafts goods which involve the performance of complex physical
duties that normally involve initiative, manual dexterity and other practical skills. Most of these occupations, such as bakers, garment workers, welders, builders, plumbers, air conditioning and refrigerator mechanics, bricklayers,
or electronic mechanics require a substantial period of training.)
Plant and machine operators, and assemblers (This group operates and monitors industrial and agricultural machinery and equipment, drives and operates
66 | 71 National Employment Agency
motor vehicles and mobile machinery, or assembles products. Most occupations have not a particular standard of education but will usually have formal experience related training which include drivers, chemical products
plant and machine operators, glass plant operators, electrical and electronic equipment assemblers.)
Elementary occupations (This group consists of simple and routine tasks that mainly require the use of hand tools plus physical effort. Most occupations in this group, such as kitchen helpers, manufacturing labourers, hand packers, construction workers,
messengers package deliverers and luggage porters, vehicle and laundry cleaning workers, cleaners, building
caretakers, or laborers do not require formal education qualification.)
C3. Could you please indicate the number of people have left or will leave and the number of people
have been or will be recruited at your establishment? (State the number of persons and make an estimate
about the future)
Last 12 months Next 12 months
Number of people have left or will leave (Retirement and other departures) ________ ________ Number of people have been or will be recruited (Replacements and new recruits) ________ ________
C4. Could you please indicate the number of persons that has left from your establishment in the last 12
months? (Quits are generally voluntary separations initiated by the employee. Layoffs or discharges are
involuntary separations initiated by the employer. Other separations include separations due to retirement,
death, disability, and transfers to other locations of the same firm).
Total Foreigner
Quit layoffs or
discharges
other
separations Quit
layoffs or
discharges
other
separations
Managers
Professionals
Technicians and associate professionals
Clerical support workers
Service and sale workers
Skilled agricultural, forestry, and fishery workers
Craft and related trades workers
Plant and machine operators, and assemblers
Elementary occupations
C5. Could you please indicate the number of persons that has been recruited in the last 12 months?
Total (Cambodian and
Foreigner)
Foreigner
Total
number of
recruits
No. of recruit to replace
people who left, retired,
or promoted
Total
number of
recruits
No. of recruit to replace
people who left, retired,
or promoted
Managers
Professionals
Technicians and associate professionals
Clerical support workers
Service and sale workers
Skilled agricultural, forestry, and fishery workers
Craft and related trades workers
Plant and machine operators, and assemblers
Elementary occupations
Section D – Employers’ perception on first time job seeker
D1. In the last 12 months, has your establishment filled any vacant full-time or part-time positions?
Yes 1 Go to D.2
No 2 Go to E.1

National Employment Agency 67 | 71
D2. If yes, has your establishment hired any first time job seekers that were leaving higher secondary
school; technical and vocational schools; or university?
Yes; specify the number:__________ 1 Go to D.3
No 2 Go to E.1
D3. Which type of education have any of these been first time job seeker coming from? How well did
they prepare for work for each category? (Please using from 1- very poorly prepared to 5 very well
prepared to evaluate their readiness) Specify number of hired Score (from 1 to 5)
Higher secondary school
Pre-secondary technical and vocational school (TVET)
Post- secondary technical and vocational school (TVET)
University or other higher educational institutions IF THE PREPARATION FOR WORK OF THE NEWLY HIRED WAS EVALUATED 1 OR 2, GO TO D.4. OTHERWISE, GO
TO E1
D4. In which of the following areas was the preparation of the newly hired was lacking (you can select
up to 5 relevant fields for each group):
Higher
secondary
school
Pre-secondary
TVET
Post-secondary
TVET
University
or other HE
institutions
Literacy/numeracy skills 1 1 1 1
Poor education/training 2 2 2 2
Lack of common sense 3 3 3 3
Poor attitude/personality 4 4 4 4
Lack of working world/life experience 5 5 5 5
Lack of self motivation 6 6 6 6
English language skills 7 7 7 7
Chinese language skills 8 8 8 8
Other language skills 9 9 9 9
Communication skills 10 10 10 10
Team work skills 11 11 11 11
Basic IT skills 12 12 12 12
Technical skill 13 13 13 13
Practical skill 14 14 14 14
Other (Specify_________________) 15 15 15 15
Section E - Skills Gaps
E1. Do you have any problems related to your employees who do not perform jobs at the required level?
Yes , number of employee___________ 1 Go to E.2
No 2 Go to E.4

68 | 71 National Employment Agency
E2. Could you please indicate in which occupations the problem is more severe, the number of people
does not perform jobs at the required level, and total number of employees in that occupation? (List up
to 5 occupations in order of severity of the problem)
Occupations
Number of employees
do not perform jobs at
the required level
Total number of
employees in this
occupation
1:_____________________________________
2:_____________________________________
3:_____________________________________
4:_____________________________________
5:_____________________________________
E3. Which of the following factors cause your employees not being able to do their jobs up to the required
level (You can select all relevant answers)
E4. In the last 12 months, did your employees participate in any external or internal training courses,
completely or partially financed by the establishment?
Yes 1 Go to E.5
No 2 Go to F.1
E5. Does your establishment have a training plan or budget that specifies in advance the level and type
of training employee will need in the coming year?
Training plan 1
Training budget 2
E6. In which areas did your establishment finance or arrange the training? (You can select all relevant
answers)
Basic computer literacy / using IT skills 1
Advanced IT or software skills 2
Oral communication skills 3
Written communication skills 4
Customer handing skills 5
Team working skills 6
Foreign language skills 7
Problem solving skills 8
Planning and organization skills 9
Strategic Management skills 10
Numeracy skills 11
Literacy skills 12
Office administrative skills 13
Technical or practical skills 14
Training is currently only partially completed 1
New to the role 2
Been on training but their performance has not improve sufficiently 3
Staff lack motivation 4
Introduction of new working practices 5
Not received the appropriate training 6
Introduction of new technology 7
Unable to recruit staff with the required skills 8
Problem retaining staff 9
Other factors (please specify_______________________________________________) 10
National Employment Agency 69 | 71
Introduction training 15
Occupational health and safety 16
Accounting and Finance 17
Human Resource Management 18
Other skills (please specify…………………………..) 19
E7. Did your establishment experience difficulties in organizing the courses or in finding the trainers?
Yes 1 Go to E.8
No 2 Go to F.1
E8. What were the main reasons of the difficulties? (Select all that apply)
No or poor information on courses/ trainers 1
No or lack courses / trainers available 2
Low quality of courses on offer / low quality of trainers 3
Others (please specify…………………………..) 4
Section F - Vacancies
F1. In this moment, do you have vacancies?
Yes (Number of vacancies____________________) 1 Go to F.2
No 2 Go to G.1
F2. What is the overall recruitment situation currently faced by your company?
Very easy 1 Go to F.7
Easy 2 Go to F.7
Difficult 3 Go to F.3
Very difficult 4 Go to F.3
F3. If difficult and very difficult, state the number of vacancies where you have encountered recruitment
difficulty: ______
F4. Have you refrained from trying to recruit because of recruitment difficulty?
Yes 1 Go to F.5
No 2 Go to F.6
F5. If yes, state the number of vacancies for which you have not even tried to recruit owing to a shortage
of qualified labour or recruitment difficulty: __________________
F6. How was recruitment affected by the recruitment difficulty?
We were unable to recruit staff 1
It took longer than normal to recruit 2
We lowered our requirements for qualification (Education/Training) 3
We lowered our requirements for experience 4
We lowered our requirements for skills 5
We recruited abroad 6
We offered higher pay 7
We offered other benefits 8
None 9
Other affects (specify:_______________________________________) 10

70 | 71 National Employment Agency
F7. Could you please tell us in which occupations do you have the most vacancies and its situation of recruitment? (Please list up to 10 occupations)
ISCO
Code Occupation names
Number of
current
employed
people
Number of
vacancies
Are any of these
vacancies proving
hard to fill? (if no
hard to fill, go to
next occupation)
Number of hard-to-fill
vacancies
Ask only occupation with difficult recruitment
situation
Reason for recruitment
difficulty answer
(up to 5 options)
(if G=4, 7, or 8, go to H
and otherwise go to next
occupation)
Skill Lacking (up to 5
options)
A B C D E F G H
1.
2.
3.
4.
5.
6.
7.
8.
9.
10.
Note:
Code G-Reason for recruitment difficulty answer (up to 5 options) Code H-Skill Lacking (up to 5 options)
1-Too much competition from other employers 1-Basic computer literacy / using IT 9-Planning and organization skills
2-Not enough people interested in doing this type of job 2-Advanced IT or software skills (Software) 10-Strategic Management skills
3-Poor terms and conditions (e.g. pay) offered for post 3-Oral communication skills 11-Numeracy skills
4-Low number of applicants with the required skills 4-Written communication skills 12-Literacy skills
5-Low number of applicants with the required attitude, motivation or personality 5-Customer handing skills 13-Office admin skills
6-Low number of applicants generally 6-Team working skills 14-Technical or practical skills
7-Lack of work experience the company demands 7-Foreign language skills 15-Any other job specific skills
8-Lack of qualifications the company demands 8-Problem solving skills
9-Poor career progression / lack of prospects
10-Job entails shift work / unsociable hours
11-Seasonal work
12-Remote location / poor public transport
13-Others

National Employment Agency 71 | 71
F8. Are hard-to-fill vacancies causing this establishment to… (You can select all relevant answers)
Lose business or orders to competitors 1
Delay developing new products or services 2
Have difficulties meeting quality standards 3
Experience increased operating costs 4
Have difficulties introducing new working practices 5
Increase workload for other staff 6
Outsource work 7
Withdraw from offering certain products or services altogether 8
Have difficulties meeting customer services objectives 9
Have difficulties introducing technological change 10
Internal training to existing staff 11
Planned expansion was postponed 12
We considered moving some or all of our production abroad 13
None 14
Others (specify:______________________________________________________) 15
F9. What, if anything, is your establishment doing to overcome the difficulties that you are having
finding candidates to fill these hard-to-fill vacancies? (You can select all relevant answers)
Increasing salaries 1
Increasing the training given to your existing workforce 2
Redefining existing jobs 3
Increasing advertising / recruitment spend 4
Increasing / expanding trainee programs 5
Using NEW recruitment methods or channels 6
Recruiting workers who are non-Cambodian nationals 7
Bringing in contractors to do the work, or contracting it out 8
Being prepared to offer training to less well qualified recruits 9
Increase labour productivity in the establishment 10
Increase working hours in the establishment 11
Nothing 12
Other (please specify…………………………………………………………………….) 13
Section G - Establishment‘s Business strategy
G1. Does your establishment plan to introduce new products,
services, technologies or expand/switch to new markets?
Yes 1
No (End interview here) 2
G2. Linked to these plans, does your
establishment plan to apply any of the
following measures to address newly
emerging tasks?
Training of available staff 1
Internal re-organization to better use available
staff and competences
2
Recruitment of new staff 3
Other measures (Specify__________________) 4
Thank you very much for taking your time to answer all the questions!