Embed Size (px)
Citation preview
ACKNOWLEDGMENTS
The City of Napa Sustainability Plan is funded by the U.S. Department of Energy, Energy Efficiency and Conservation Block Grant (EECBG) Program. Thank you to the following City of Napa staff and community members that contributed to the creation of this document.
SUSTAINABIL ITY PLAN TASK FORCE
City of Napa StaffCassandra Walker, Community Development DirectorDave Perazzo, Parks SuperintendentChris Burgeson, Fleet ManagerJennifer LaLiberte, Economic Development ManagerKevin Miller, Recycling ManagerDan Kavarian, Building Inspection SupervisorPat Costello, Water Resources AnalystJulianne Ward, Associate PlannerAndrea Fox, Sustainability Coordinator
Community MembersLisa Batto, Past Napa Chamber of Commerce President/CEOJeri Gill, Sustainable Napa County CEOArmando Navarro, Pacific Gas and Electric CompanyEd Shenk, Napa County Hispanic Network Board Member
ADDIT IONAL C ITY OF NAPA STAFF
Community Development Department (CDD)Rick Tooker, Planning ManagerMicah Hinkle, Senior Project CoordinatorRobin Klingbeil, Economic Development Project Coordinator
FinanceAnn Mehta, Purchasing Services Manager
Information Technology (IT)Scott Nielsen, IT Manager
Parks and RecreationBill Mentzer, Parks Maintenance Worker III
Public WorksJacques LaRochelle, Public Works DirectorPhil Brun, Deputy Public Works Director – OperationsSteve Crego, Electrical SupervisorJason Holley, Senior Civil EngineerMichael Hether, Associate Civil EngineerGerardo Mendez, Engineering AssistantChris Shoop, Materials Diversion Analyst
COMMUNITY MEMBERS
Napa residents participated in the creation of the Sustainability Plan through a variety of channels; the names of those listed below attended at least one of 16 public meetings, provided important feedback through community leader interviews, and/or shared strategic advice. Additionally, nearly 400 Napa residents completed an online survey, the names of whom may not necessarily be reflected below.
Ken Allen, CanDo
Debbie Alter-Starr, Somos Napa / We Are Napa
Johnny Apodaca, Serenity Builders
Darcy Aston, Napa Sanitation District
Chris Auld, Vintage High School
Ernie Bean, Napa Apts.
Diane Beere
Bill Bennett, Sustainable Napa County
Brooke Bledsoe
Janeen Breyman, Heifer International
Rejane Brito, Puertas Abiertas
Kara Brunzell, Napa County Landmarks
Leisa Bush, Bay Area Air Quality Management District
Aileen Carroll, Napa Bike Coalition
Lloyd Coker, Pacific Gas and Electric Company
Mike Costanzo, Napa Bike Coalition
Stephen Cuddy, MCA Architecture
Darla Dangler
Tim Dewey-Mattia, Napa Recycling and Waste Services
Teresa Dickinson
Linda Dietike-Yolo, CanDo and Heifer International
Jon Dillson
Emanuel Donoval
Lowell Downey, Green Team Wisdom and Art & Clarity
Noah Eckert, Norcal Solar
Ellyn Elson, Sustainable Napa County & USGBC
Larry Elson, USGBC
Georgina Enriquez, Napa Valley Community Housing
Olivia Ervin
Nancy Evans, Heifer International
Donna Feingold, Moving Forward
Marinito Fernandez
Warren Flint, Five E’s Unlimited
Peggy Frances
Karen Garcia, CanDo
Julie Garrett
Cathy George, Transition Napa
Joan Gladieux
Bob Gligorea, Slow Food Napa Valley
Henry Gundling, Gasser Foundation & Sustainable Napa County
Alexandra Hensley
Mark Hiddleson, Specialized Storage Solutions
David Horobin, Estudio Verde Architects & Napa Design Partners
Sarah Huete, Cope Family Center and Napa Valley
College Community Garden
B.B. Huff, Land Trust of Napa County
Nanette Humer, Food & Vine
Valentin Humer, Food & Vine
Eliot Hurwitz, Napa County Transportation & Planning Agency
Aimee Inglis, Cope Family Center
Juliana Inman, City of Napa City Council
Alicia Jaramillo, Napa Hispanic Network
Josie Jenkins
Karl Johnson
Brian Kelly
Sorel Klein, Solano-Napa Commuter Information
Frances Knapczyk, Napa County Resource
Conservation District
Steve Lederer, Napa County Environmental Management
Carol Lilleberg
Grania Lindberg, CanDo
Carol Lorraine
Antonette Louscher
Linda Lucas
Mark Lucas, Napa Bike
Jason Luros, Hudson & Luros, LLP
Mary Luros, Hudson & Luros, LLP
Sharon Macklin, Office of Assemblyman Michael Allen
Anette Madsen, Anette’s Chocolate Factory
Maria Manzo
Marquita Marquis, Napa County Public Health
Conchita Marusich, Marusich Environmental Consulting
Rick Marusich, Marusich Environmental Consulting
Bob Massaro, Healthy Buildings & Thrive Napa Valley
Cara Mae McGarry, Napa County Public Health
Tom McNicholas
Bonny Meyer, Thrive Napa Valley
Charlie Monahan, Napa Valley College
Conchita Murillo
Casey Myers
Sue Nahass, Napa Valley Community Housing
Gregory Neal, Merry Go Round Ranch
Jennifer Nichols, Napa Valley College Garden Club & ASNVC Senator of Environment
Tony Norris, Napa County Regional Park and Open Space District
Montgomery Norton
Frances Ortiz-Chavez, Puertas Abiertas
Tom Pace, Serenity Builders
Craig Payne
Peri Payne
Joaquina Peña
Louis Penning, Napa Bike
Sylvie Petitarmand, Napa County Farm Bureau
Connie Piesinger
Shaun Rau
Chuck Reed, Sensible Green Solutions
Betty Rhodes, Napa County Commission on Aging
Tom Roberts, Napa County Transportation & Planning Agency
Steven Rodriguez
Dalfred Ross
Danielle Schmitz, Napa County Transportation & Planning Agency
Karen Schuppert, Napa County Local Food Advisory Council
Sally Seymour, Sustainable Napa County
Patrick Shannon
Tim Shea, FRG Waste Resources
Julia Smith, Napa County Workforce Investment Board
Irma Solorio
Julio Soriano, Eagle Cycling Club
John Stallcup
John Stephens
Jennifer Sturm
Rachel Sturm
Marilee Talley, Sierra Club
Tim Thulin, Napa Bike
Pat Turcanik
Jeff Vander Clute, Thrive Napa Valley
TR Vierra, Vierra Environmental Consulting
Lisa Volkman
Joanna Winter, Napa County Local Food Advisory Council
David Ybarra
E. Young
Chino Yip, Napa County Regional Park and Open Space District
Special thanks to Karen Schuppert, Napa Bike and Napa CanDo for providing Sustainability Plan photos.
Consultants
Palladin Law Group, LLP
Sustainametrics
Media
Chantal M. Lovell, Napa Valley Register
Kari Ruel, Sustainable Life radio show
INTRODUCTION
VISIONING A SUSTAINABLE NAPA
SECTION 1 - CITY GOVERNMENT SUSTAINABILITY PLAN
ENERGY
TRANSPORTATION
WATER
RECYCLING & WASTE REDUCTION
PLANNING & LAND USE
SECTION 2 – COMMUNITY SUSTAINABILITY PLAN
ENERGY
MOBILITY & TRANSPORTATION
RECYCLING & WASTE REDUCTION
LOCAL FOOD
NATURAL & BUILT ENVIRONMENT
LOCAL BUSINESS & ECONOMY
COMMUNITY CONNECTEDNESS
CONCLUSION
APPENDICES
APPENDIX A – CITY PLAN CALCULATIONS
APPENDIX B – COMMUNITY PLAN INITIATIVES
APPENDIX C – CITY OF NAPA SUSTAINABILITY SURVEY SUMMARY FINDINGS
APPENDIX D – REFERENCES & RESOURCES
APPENDIX E – ASSUMPTIONS & METHODOLOGY
APPENDIX F – LOCAL PLANS, POLICIES, & GUIDELINES
01
04
05
07
12
16
20
23
27
32
36
40
44
48
52
55
59
TABLE OF CONTENTS
01INTRODUCT ION
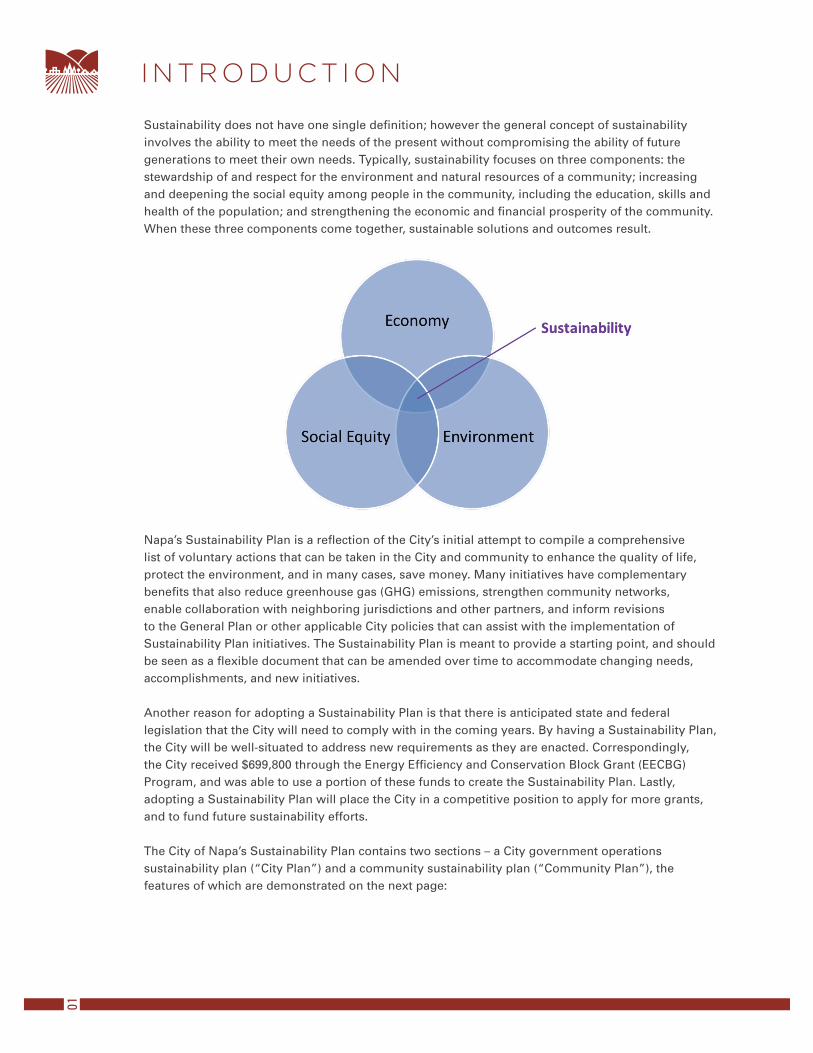
Sustainability does not have one single definition; however the general concept of sustainability involves the ability to meet the needs of the present without compromising the ability of future generations to meet their own needs. Typically, sustainability focuses on three components: the stewardship of and respect for the environment and natural resources of a community; increasing and deepening the social equity among people in the community, including the education, skills and health of the population; and strengthening the economic and financial prosperity of the community. When these three components come together, sustainable solutions and outcomes result.
Napa’s Sustainability Plan is a reflection of the City’s initial attempt to compile a comprehensive list of voluntary actions that can be taken in the City and community to enhance the quality of life, protect the environment, and in many cases, save money. Many initiatives have complementary benefits that also reduce greenhouse gas (GHG) emissions, strengthen community networks, enable collaboration with neighboring jurisdictions and other partners, and inform revisions to the General Plan or other applicable City policies that can assist with the implementation of Sustainability Plan initiatives. The Sustainability Plan is meant to provide a starting point, and should be seen as a flexible document that can be amended over time to accommodate changing needs, accomplishments, and new initiatives.
Another reason for adopting a Sustainability Plan is that there is anticipated state and federal legislation that the City will need to comply with in the coming years. By having a Sustainability Plan, the City will be well-situated to address new requirements as they are enacted. Correspondingly, the City received $699,800 through the Energy Efficiency and Conservation Block Grant (EECBG) Program, and was able to use a portion of these funds to create the Sustainability Plan. Lastly, adopting a Sustainability Plan will place the City in a competitive position to apply for more grants, and to fund future sustainability efforts.
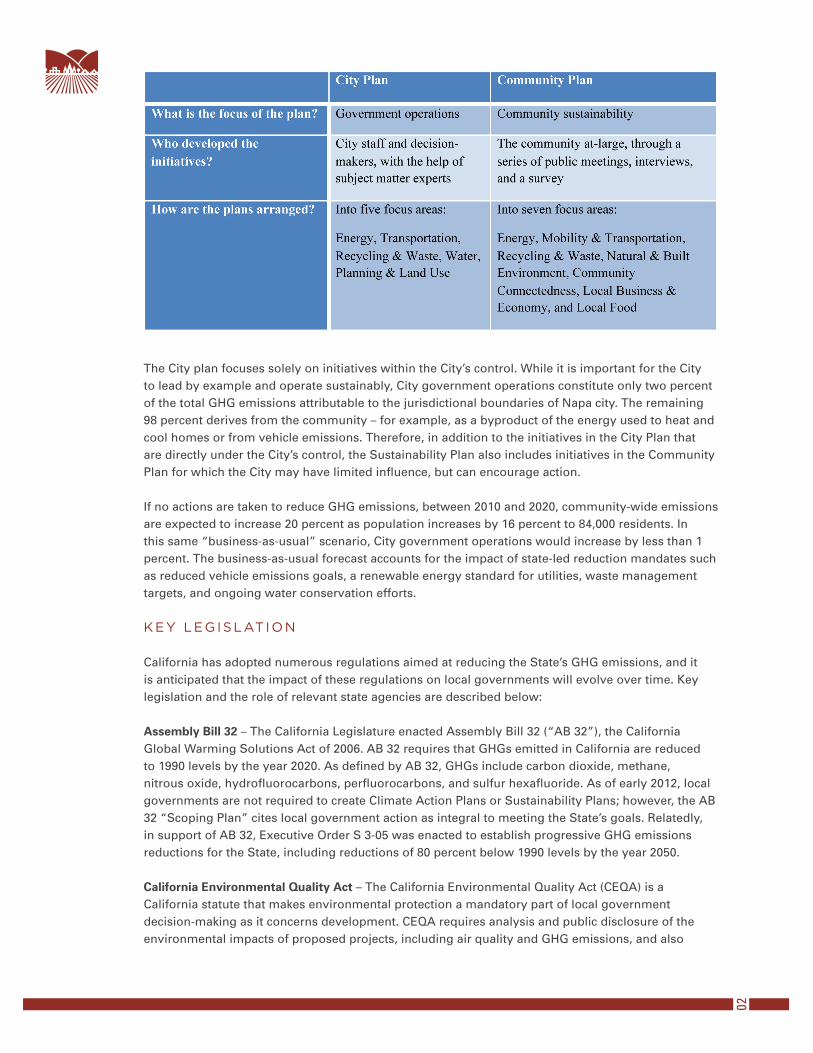
The City of Napa’s Sustainability Plan contains two sections – a City government operations sustainability plan (“City Plan”) and a community sustainability plan (“Community Plan”), the features of which are demonstrated on the next page:
02
The City plan focuses solely on initiatives within the City’s control. While it is important for the City to lead by example and operate sustainably, City government operations constitute only two percent of the total GHG emissions attributable to the jurisdictional boundaries of Napa city. The remaining 98 percent derives from the community – for example, as a byproduct of the energy used to heat and cool homes or from vehicle emissions. Therefore, in addition to the initiatives in the City Plan that are directly under the City’s control, the Sustainability Plan also includes initiatives in the Community Plan for which the City may have limited influence, but can encourage action.
If no actions are taken to reduce GHG emissions, between 2010 and 2020, community-wide emissions are expected to increase 20 percent as population increases by 16 percent to 84,000 residents. In this same “business-as-usual” scenario, City government operations would increase by less than 1 percent. The business-as-usual forecast accounts for the impact of state-led reduction mandates such as reduced vehicle emissions goals, a renewable energy standard for utilities, waste management targets, and ongoing water conservation efforts.
KEY LEG ISLAT ION
California has adopted numerous regulations aimed at reducing the State’s GHG emissions, and it is anticipated that the impact of these regulations on local governments will evolve over time. Key legislation and the role of relevant state agencies are described below:
Assembly Bill 32 – The California Legislature enacted Assembly Bill 32 (“AB 32”), the California Global Warming Solutions Act of 2006. AB 32 requires that GHGs emitted in California are reduced to 1990 levels by the year 2020. As defined by AB 32, GHGs include carbon dioxide, methane, nitrous oxide, hydrofluorocarbons, perfluorocarbons, and sulfur hexafluoride. As of early 2012, local governments are not required to create Climate Action Plans or Sustainability Plans; however, the AB 32 “Scoping Plan” cites local government action as integral to meeting the State’s goals. Relatedly, in support of AB 32, Executive Order S 3-05 was enacted to establish progressive GHG emissions reductions for the State, including reductions of 80 percent below 1990 levels by the year 2050.
California Environmental Quality Act – The California Environmental Quality Act (CEQA) is a California statute that makes environmental protection a mandatory part of local government decision-making as it concerns development. CEQA requires analysis and public disclosure of the environmental impacts of proposed projects, including air quality and GHG emissions, and also
03mandates the adoption of feasible measures to mitigate impacts. CEQA applies to many projects that require a government permit or entitlement. For CEQA compliance, the City of Napa is within the jurisdiction of the Bay Area Air Quality Management District (“BAAQMD”).
Senate Bill 375 – Because the majority of California’s GHG emissions stem from transportation, the legislature passed the Sustainable Communities and Climate Protection Act of 2008 (“SB 375”) to align regional transportation planning efforts, GHG reduction targets, and housing allocations. Napa’s designated Metropolitan Planning Organization, the Metropolitan Transportation Commission (MTC), is required to adopt either a Sustainable Communities Strategy (SCS) or Alternative Planning Strategy (APS) as part of its Regional Transportation Plan. Qualified projects consistent with an approved SCS or APS and categorized as “transit priority projects” receive incentives under new CEQA provisions. At the time this plan was written, Napa County and the jurisdictions therein (including the City of Napa) had partnered to create a sub-region to consider where housing needs could be better allocated within the county to reduce impacts on GHG emissions.
04
An aspirational vision was created to guide the development of the Sustainability Plan and encourage participants to “think big” about what is possible. Through input collected during public meetings, Green Team meetings, community interviews, and the survey, visionary themes began to emerge. These themes were reviewed and considered by the Sustainability Plan Task Force, which served as a steering committee for the Sustainability Plan, and included City staff and community leaders. The Sustainability Plan Task Force considered community input and the vision and mission statements of other communities and organizations to develop the following vision and mission statements:
VIS ION STATEMENT (COLLECT IVE GU ID ING BEL IEFS) :
We are a thriving community that values diversity, history, and the environment.
Napans have a strong sense of history, and public meetings often reflect the balance between preserving history, learning from history to avoid future missteps, and progressing forward. Part of progressing forward also entails embracing Napa’s diversity and creating a more inclusive, whole community. By valuing the environment, we are protecting it for future generations, and ensuring our children and grandchildren are able to experience the same quality of life that we enjoy.
MISS ION STATEMENT (PLAN OBJECT IVES) :
Napa is a model of sustainability where bold ideas create prosperity by balancing economic vitality, respect for natural resources, and social well-being.
The mission statement reflects the importance of balance and boldness to Napa residents. These concepts are not mutually exclusive; when considering recommended actions for inclusion in the Sustainability Plan, the associated economic, environmental, and social ramifications of actions were considered. This does not necessarily entail that the ideas are common or typical, and many of the balanced ideas are also bold.
In order to realize the above-mentioned Vision and Mission statements, a commitment is required of both City leadership and the community. City government can do its part by initiating recommended actions that are directly under its control, as stated in either the City Plan or the Community Plan. The remaining recommended actions will fall to other agencies, non-profits, and individual community members. The City will help facilitate the implementation of actions where possible and practical.
VIS ION ING A SUSTA INABLE NAPA
BACKGROUND
Napa’s City Government Sustainability Plan (“City Plan”) focuses on enhancing sustainability in City government operations, and addresses the City’s challenge to provide leadership and create a policy and regulatory environment that enables citizens and businesses to make cost-effective sustainable choices. This may include the City’s adoption of ordinances, implementation of programs, or other such measures that support community sustainability.
In 2007, the City Council passed a resolution in support of the U.S. Mayors’ Climate Protection Agreement (“Agreement”), which sought to meet or beat Kyoto Protocol targets through the implementation of 12 suggested actions. The Agreement provides broad suggestions for cities, many of which are included as recommended actions in the City Plan. Two years later, the City received Energy Efficiency and Conservation Block Grant funds, which provided the financial resources to complete facility and streetlight retrofit projects and implement a fluorescent recycling program, which reduced energy consumption and encouraged the use of energy-saving technologies.
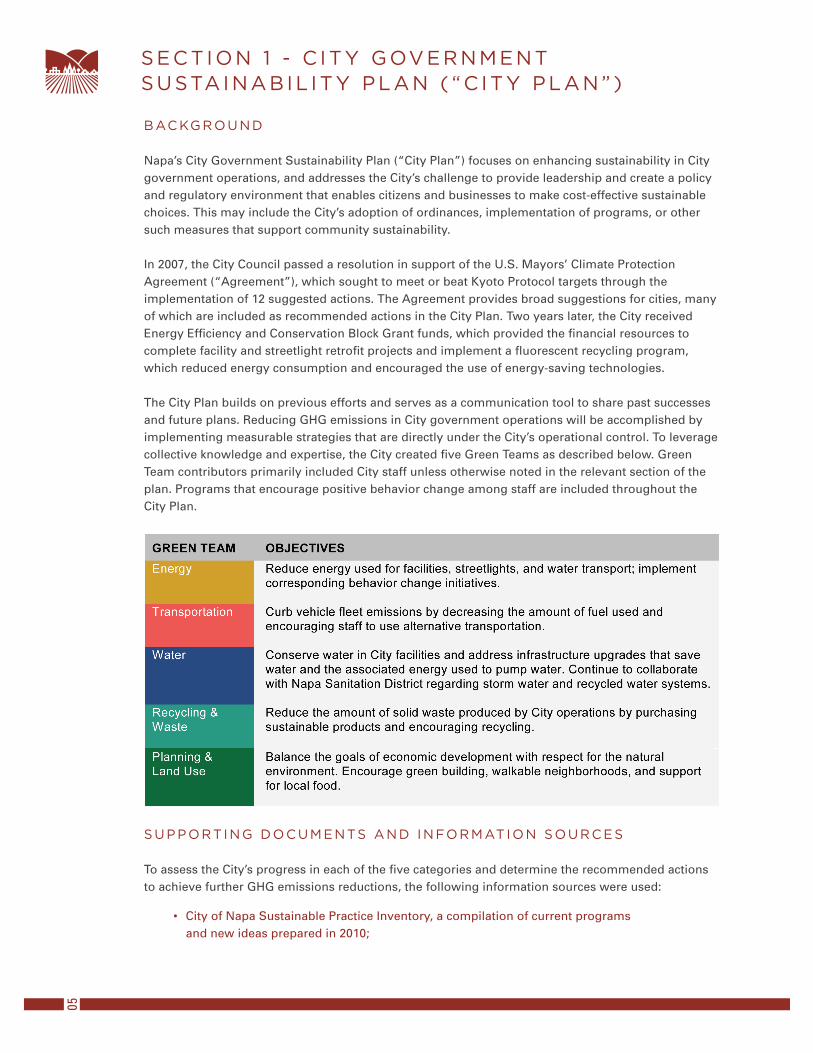
The City Plan builds on previous efforts and serves as a communication tool to share past successes and future plans. Reducing GHG emissions in City government operations will be accomplished by implementing measurable strategies that are directly under the City’s operational control. To leverage collective knowledge and expertise, the City created five Green Teams as described below. Green Team contributors primarily included City staff unless otherwise noted in the relevant section of the plan. Programs that encourage positive behavior change among staff are included throughout the City Plan.
SUPPORT ING DOCUM ENTS AND INFORMATION SOURCES
To assess the City’s progress in each of the five categories and determine the recommended actions to achieve further GHG emissions reductions, the following information sources were used:
City of Napa Sustainable Practice Inventory, a compilation of current programs • and new ideas prepared in 2010;
05SUSTAINABIL ITY PLAN ( “C ITY PLAN”)SECT ION 1 - C ITY GOVERNMENT
City of Napa 2005 and 2010 Local Government Operations Greenhouse • Gas Emissions Inventories;
review of existing reports and operating data; •
review of adopted plans, policies, and guidelines (see Appendix F, “Local Plans, • Policies, and Guidelines”); and
extensive communications with City staff•
The City of Napa General Plan, Envision Napa 2020, outlines goals, policies, standards, and programs that provide a comprehensive, long-term plan for physical development within the City. The goals and policies outlined in the General Plan articulate the City’s long-term vision and implementation plan as it pertains to land use, housing, transportation, historic preservation, open space and other areas. Relevant General Plan goals and policies are included in Appendix F.
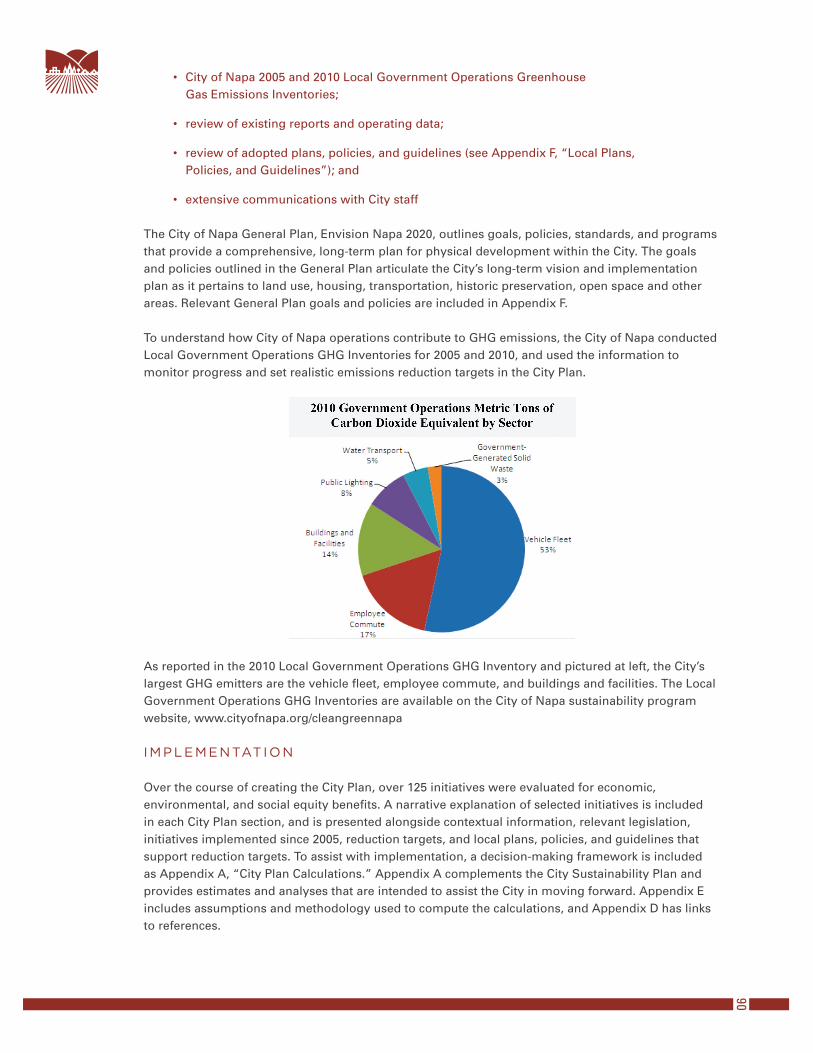
To understand how City of Napa operations contribute to GHG emissions, the City of Napa conducted Local Government Operations GHG Inventories for 2005 and 2010, and used the information to monitor progress and set realistic emissions reduction targets in the City Plan.
As reported in the 2010 Local Government Operations GHG Inventory and pictured at left, the City’s largest GHG emitters are the vehicle fleet, employee commute, and buildings and facilities. The Local Government Operations GHG Inventories are available on the City of Napa sustainability program website, www.cityofnapa.org/cleangreennapa
IMPLEMENTAT ION
Over the course of creating the City Plan, over 125 initiatives were evaluated for economic, environmental, and social equity benefits. A narrative explanation of selected initiatives is included in each City Plan section, and is presented alongside contextual information, relevant legislation, initiatives implemented since 2005, reduction targets, and local plans, policies, and guidelines that support reduction targets. To assist with implementation, a decision-making framework is included as Appendix A, “City Plan Calculations.” Appendix A complements the City Sustainability Plan and provides estimates and analyses that are intended to assist the City in moving forward. Appendix E includes assumptions and methodology used to compute the calculations, and Appendix D has links to references.
06
CONTEXT
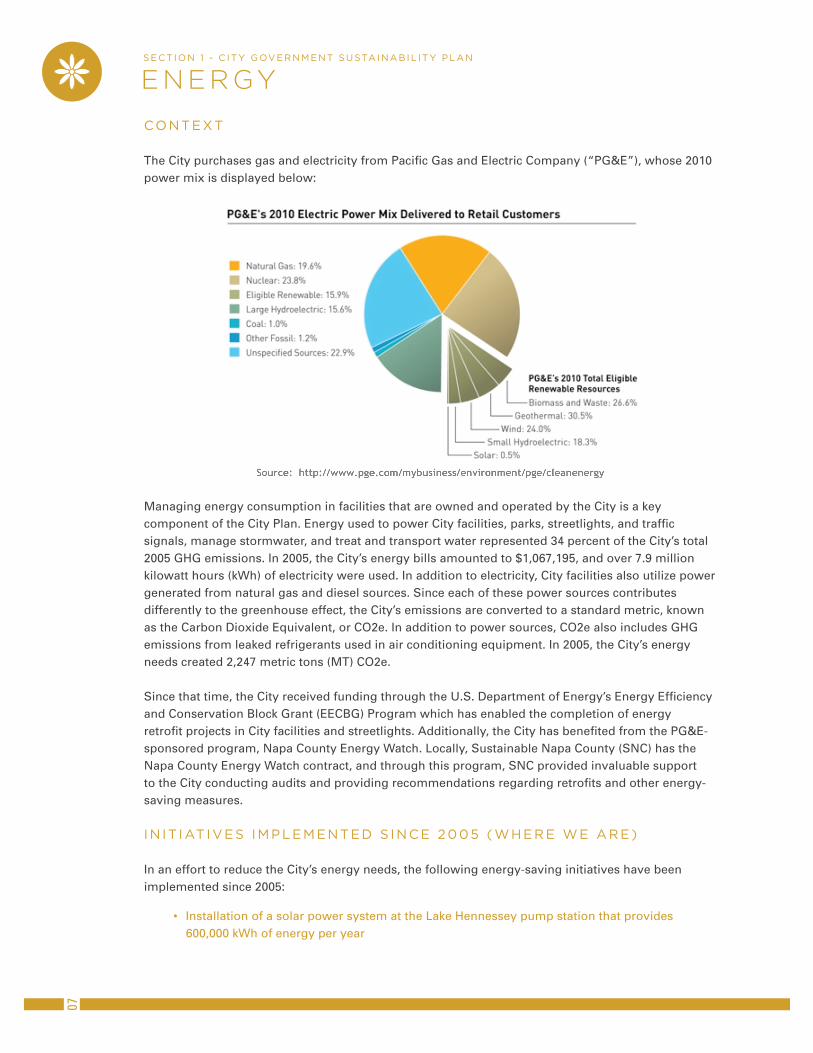
The City purchases gas and electricity from Pacific Gas and Electric Company (“PG&E”), whose 2010 power mix is displayed below:
Managing energy consumption in facilities that are owned and operated by the City is a key component of the City Plan. Energy used to power City facilities, parks, streetlights, and traffic signals, manage stormwater, and treat and transport water represented 34 percent of the City’s total 2005 GHG emissions. In 2005, the City’s energy bills amounted to $1,067,195, and over 7.9 million kilowatt hours (kWh) of electricity were used. In addition to electricity, City facilities also utilize power generated from natural gas and diesel sources. Since each of these power sources contributes differently to the greenhouse effect, the City’s emissions are converted to a standard metric, known as the Carbon Dioxide Equivalent, or CO2e. In addition to power sources, CO2e also includes GHG emissions from leaked refrigerants used in air conditioning equipment. In 2005, the City’s energy needs created 2,247 metric tons (MT) CO2e.
Since that time, the City received funding through the U.S. Department of Energy’s Energy Efficiency and Conservation Block Grant (EECBG) Program which has enabled the completion of energy retrofit projects in City facilities and streetlights. Additionally, the City has benefited from the PG&E-sponsored program, Napa County Energy Watch. Locally, Sustainable Napa County (SNC) has the Napa County Energy Watch contract, and through this program, SNC provided invaluable support to the City conducting audits and providing recommendations regarding retrofits and other energy-saving measures.
IN IT IAT IVES IMPLEM ENTED S INCE 2005 (WHERE WE ARE)
In an effort to reduce the City’s energy needs, the following energy-saving initiatives have been implemented since 2005:
Installation of a solar power system at the Lake Hennessey pump station that provides • 600,000 kWh of energy per year
07SECT ION 1 - C ITY GOVERNMENT S U STAI NAB I L I TY P LAN
ENERGY
Retrofits of 279 streetlights with Light Emitting Diodes (LEDs) •
Retrofits of nearly 35 traffic lights and over 50 pedestrian signals with LEDs •
Lighting audits of all City facilities and full energy audits of 4 City facilities•
Retrofits of 10 City facilities with energy-efficient lights •
Reduction in the number of servers supporting the City’s information technology from 35 to 4 •
Installation of window glazing at City facilities•
Establishment of building controls such as sensors and programmable thermostats •
Implementation of new operational policies in Parks and Recreation facilities•
Replacement of heating, ventilation, and air conditioning (HVAC) units with energy-efficient • models as they fail or are scheduled for replacement
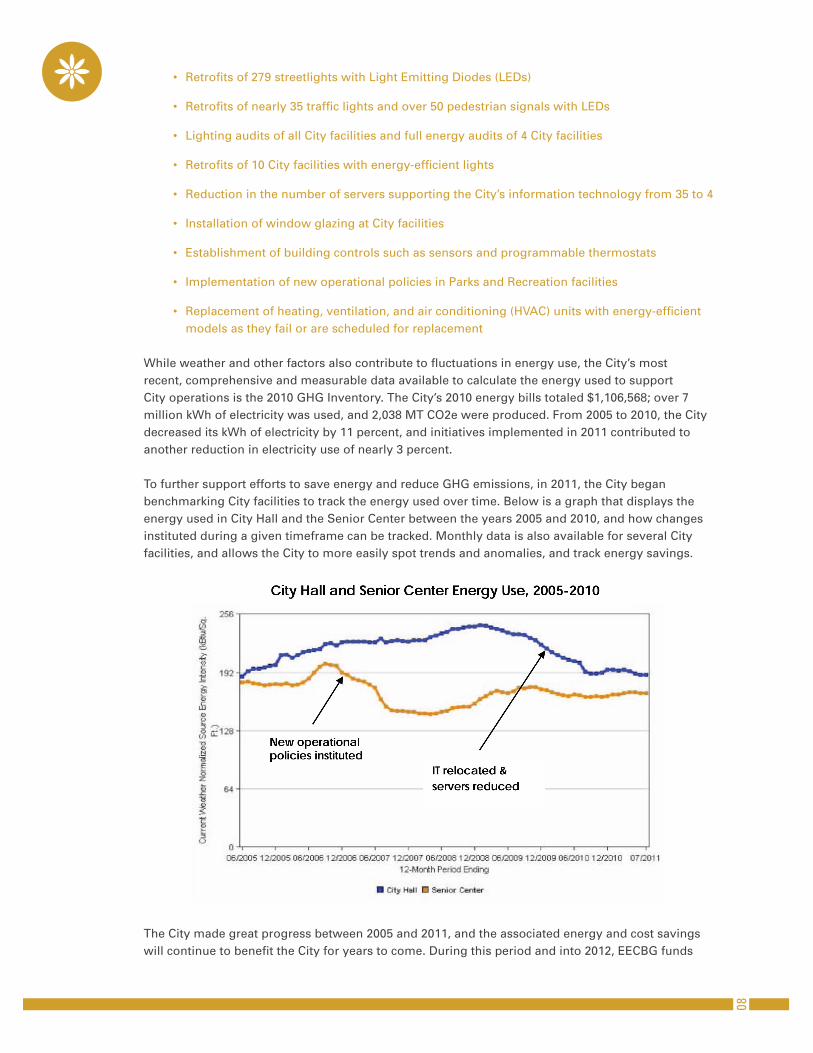
While weather and other factors also contribute to fluctuations in energy use, the City’s most recent, comprehensive and measurable data available to calculate the energy used to support City operations is the 2010 GHG Inventory. The City’s 2010 energy bills totaled $1,106,568; over 7 million kWh of electricity was used, and 2,038 MT CO2e were produced. From 2005 to 2010, the City decreased its kWh of electricity by 11 percent, and initiatives implemented in 2011 contributed to another reduction in electricity use of nearly 3 percent.
To further support efforts to save energy and reduce GHG emissions, in 2011, the City began benchmarking City facilities to track the energy used over time. Below is a graph that displays the energy used in City Hall and the Senior Center between the years 2005 and 2010, and how changes instituted during a given timeframe can be tracked. Monthly data is also available for several City facilities, and allows the City to more easily spot trends and anomalies, and track energy savings.
The City made great progress between 2005 and 2011, and the associated energy and cost savings will continue to benefit the City for years to come. During this period and into 2012, EECBG funds
08
were available and many of the initiatives implemented were the “low hanging fruit,” or items that were relatively inexpensive to implement, and/or have a short return on investment. Continued success will be more challenging, and will require more collaboration, planning and research, the use of new technologies, and the exploration of available financing mechanisms as costs associated with implementation are expected to be greater. E NERGY REDUCT ION TARGET (WHERE WE ’D L IKE TO BE)
During the years 2012-2020, the City will remain focused on decreasing energy use, with the specific target to:
Reduce City government energy use to 15 percent below 2005 levels by 2020.
This goal is consistent with the statewide GHG reduction goal set forth in AB 32. Long term, the goal will be to reduce energy use to 15 percent below 2005 by 2020, and the interim 2015 target, which is the average of the 2011 actual energy use and the 2020 target, will help the City focus its efforts and stay on-track. At the end of 2011, energy used to support City government operations had decreased almost 14 percent since 2005. However, due to enhanced water treatment technologies, energy use is expected to increase by nearly 530,000 kWh per year starting in 2012, which effectively offsets the installation of a 600,000 kWh solar power system in 2006.
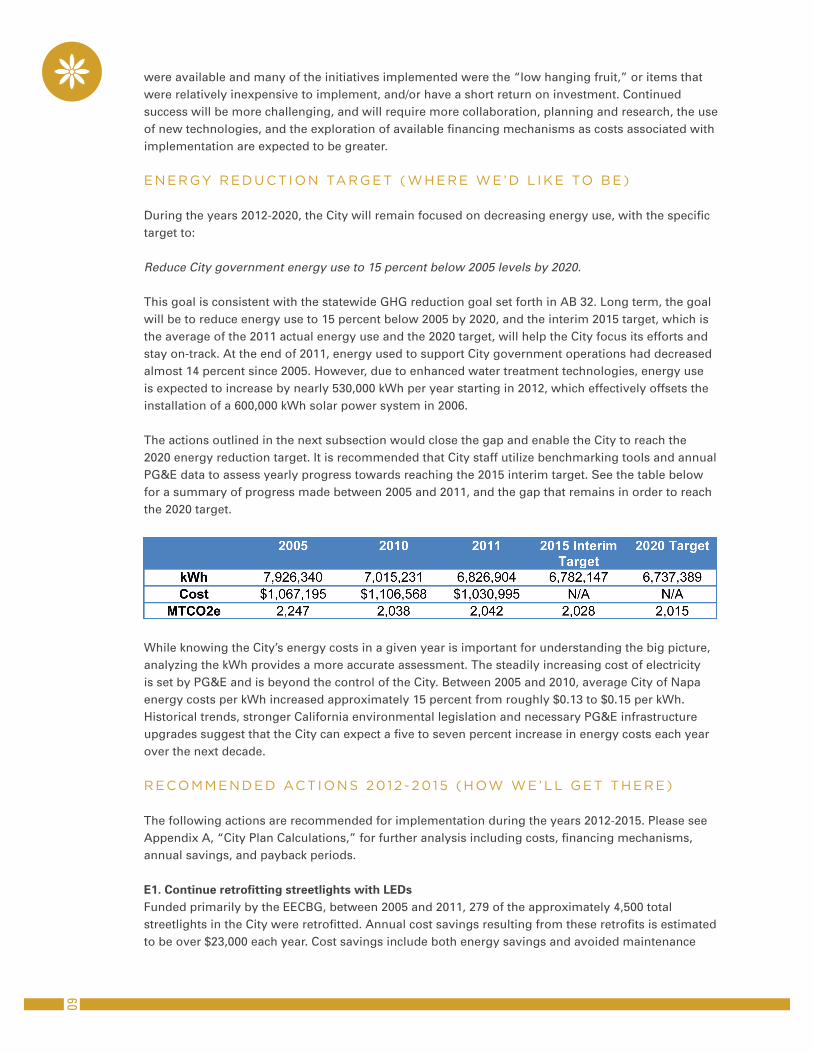
The actions outlined in the next subsection would close the gap and enable the City to reach the 2020 energy reduction target. It is recommended that City staff utilize benchmarking tools and annual PG&E data to assess yearly progress towards reaching the 2015 interim target. See the table below for a summary of progress made between 2005 and 2011, and the gap that remains in order to reach the 2020 target.
While knowing the City’s energy costs in a given year is important for understanding the big picture, analyzing the kWh provides a more accurate assessment. The steadily increasing cost of electricity is set by PG&E and is beyond the control of the City. Between 2005 and 2010, average City of Napa energy costs per kWh increased approximately 15 percent from roughly $0.13 to $0.15 per kWh. Historical trends, stronger California environmental legislation and necessary PG&E infrastructure upgrades suggest that the City can expect a five to seven percent increase in energy costs each year over the next decade.
RECOMMENDED ACT IONS 2012 -2015 (HOW WE’LL GET THERE)
The following actions are recommended for implementation during the years 2012-2015. Please see Appendix A, “City Plan Calculations,” for further analysis including costs, financing mechanisms, annual savings, and payback periods.
E1. Continue retrofitting streetlights with LEDsFunded primarily by the EECBG, between 2005 and 2011, 279 of the approximately 4,500 total streetlights in the City were retrofitted. Annual cost savings resulting from these retrofits is estimated to be over $23,000 each year. Cost savings include both energy savings and avoided maintenance
09
costs, since LEDs typically have a longer life than traditional lightbulbs. For the time period 2012-2015, the City will establish a schedule to retrofit additional streetlights and explore available financing mechanisms.
E2. Continue lighting retrofits in City facilitiesFunded by the EECBG, over $100,000 was invested in City facility lighting retrofits in 2011. The retrofits took place over two phases and are estimated to save over $50,000 each year. The remaining retrofit opportunities have been identified for phase three and are recommended for implementation as funding opportunities become available. An additional consideration is that the City of Napa and Napa County are analyzing the consolidation of facilities and departments. Until a decision is made, it is recommended that the City continues to pursue retrofits with less than a three-year return on investment for the buildings being analyzed for consolidation.
E3. Continue replacing HVAC units with energy efficient models and develop a replacement scheduleExcluding water treatment facilities and the Materials Diversion Facility, the City has 122 HVAC units with a total capacity of 402 tons. As funding is available or units fail, the City replaces them with energy efficient HVAC units. To identify areas of opportunity, a replacement schedule will be created based on energy efficiency and cost savings opportunities, and in accordance with the outcome of facility consolidation discussions. As funding becomes available, duct work will also be inspected in high-use facilities, and a maintenance schedule determined.
E4. Continue server virtualizationThe City’s Information Technology (IT) Division has substantially decreased the amount of energy used in City facilities by utilizing technology known as virtual computing. This emerging technology has allowed the City to decrease its total number of physical servers from 35 to 4, and there are opportunities to virtualize more servers.
E5. Utilize virtual computing technology to reduce the number of physical desktops and save energyThe IT Division has further identified an opportunity to virtualize the servers in desktop computers used by City staff. This switch has energy and cost saving implications, but does require some up-front investment.
E6. Support behavior change and install micro-controlsWhile much of the City’s energy-savings will be realized by utilizing specific technologies, changing staff behavior can go a long way to reducing a facility’s energy footprint. It is recommended that a team be established to prioritize initiatives, and identify departments or facilities to use in pilot programs. In some instances, micro-controls that save energy in vending machines may be installed. Another initiative could include development of a campaign to power down computers and printers in the evening. Team members should include the City’s IT Manager, Recycling Manager, Parks Superintendent, Electrical Supervisor, and Sustainability Coordinator.
E7. Explore feasibility of adding more renewable energy on City propertyAs of early 2012, the only renewable energy supporting City government operations was a 356 kW solar photovoltaic (PV) system installed by the City’s Water Division in 2006. Going forward, the City’s Water and Recycling Divisions are exploring the possibility of installing more renewable
10

energy systems that would provide 500 kW of renewable energy to support City operations at the water treatment plants and Materials Diversion Facility sites. Additionally, as the City of Napa and Napa County reach a consensus on a facilities consolidation plan, the City should consider adding renewable energy to other City facilities.
11
CONTEXT
In 2010, the City’s vehicle fleet was the single largest contributor to GHG emissions in City operations. At approximately 53 percent of total emissions attributable to City operations, the primary fleet included 263 vehicles for police, fire, facilities maintenance, other services, and vehicles operated by the City’s contracted waste hauler, Napa Recycling and Waste Services (NRWS). Over 340,000 gallons of diesel, gasoline, or propane were used by City vehicles and the NRWS hauling fleet, at a cost of $1.2 million. The Public Works Department operated the largest number of vehicles with 92, and NRWS operated 18 diesel-fueled heavy waste route vehicles, as well as on-site equipment such as forklifts and loaders.
Past and current efforts to reduce GHG emissions from the City’s vehicle fleet are focused on three key variables; vehicle type, fuel type, and vehicle miles traveled (VMT). Two primary fuel types are used in the City of Napa – unleaded gasoline and diesel. Compressed natural gas (“CNG”) has a much lower emissions factor than traditional fossil fuels; however it is not currently a convenient or readily available option for the general fleet. Despite these challenges, as of early 2012, the City’s Waste Diversion Division had converted seven hauling trucks to CNG, with hopes of converting more in the future with the construction of an anaerobic digester biomass plant (which is discussed in more detail in the Recycling & Waste section of the Community Plan).
KEY RELEVANT LEG ISLAT ION
In 2009, the California Air Resources Board adopted regulations that reduce GHG emissions in new passenger vehicles from 2009-2016. These regulations were based on the passage of Assembly Bill (AB) 1493. This legislation applies to passenger vehicles in the City fleet, and is expected to reduce GHG emissions from California passenger vehicles by nearly 22 percent in 2012 and 30 percent in 2016. Additionally, the U.S. Environmental Protection Agency has mandated Corporate Average Fuel Efficiency (CAFE) standards, which are regulated by the U.S. Department of Transportation and focus on miles per gallon (MPG). The combination of the CAFE standards coupled with AB 1493 ensures that new vehicles (including those in the City fleet) will have increased MPG and decreased emissions.
INITIATIVES AND POLICIES IMPLEMENTED SINCE 2005 (WHERE WE ARE)
In an effort to reduce the gallons of fuel and VMT attributable to City operations, the following • initiatives have been implemented since 2005:
In 2011, the City adopted the “Electronic Tracking Technology Policy” for fleet vehicles. • Electronic tracking technology allows the City to monitor vehicle performance, location, elevation, and velocity, and provides indications where certain practices or policies could be adopted related to fuel efficiency, speeding, idling, etc. The policy was adopted to provide guidance to department heads, managers, supervisors, and employees regarding the City’s use of electronic tracking technology in vehicles it owns or leases.
Conversion of seven waste hauling trucks from Diesel to CNG •
Right-sizing vehicles in the City fleet so that efficient vehicles are used where appropriate, • such as the addition of 11 hybrid vehicles
Improvement to data collected on City vehicles to support future policy decisions•
SECT ION 1 - C ITY GOVERNMENT S U STAI NAB I L I TY P LAN
TRANSPORTAT ION
12
The City’s Public Works department began testing cold-in-place recycling in 2011. This • technology uses existing pavement, crushes and mixes it on-site with emulsifying agents, compacts it, and then re-uses the pavement on the roadway from which it was taken. This process emits 80 percent fewer GHGs than traditional methods, and uses far less fuel since the crushed pavement is re-used on-site and does not have to be hauled to a plant.
VMT AND FUEL REDUCT ION TARGET (WHERE WE ’D L IKE TO BE)
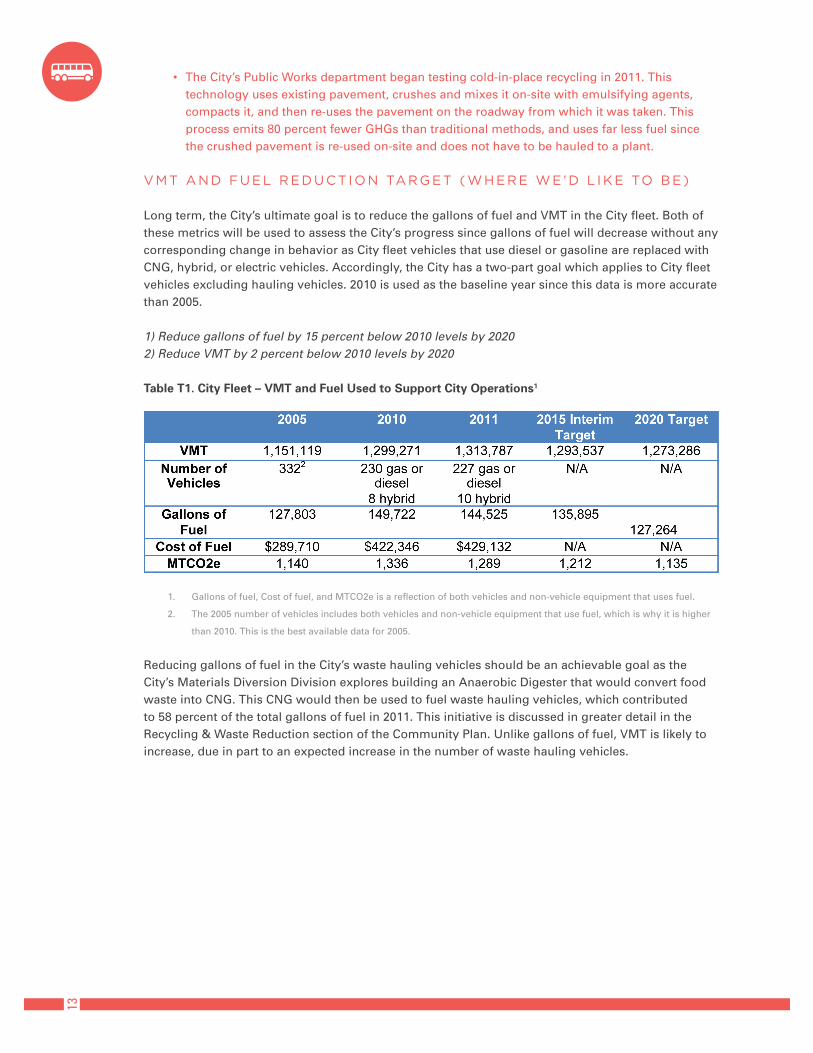
Long term, the City’s ultimate goal is to reduce the gallons of fuel and VMT in the City fleet. Both of these metrics will be used to assess the City’s progress since gallons of fuel will decrease without any corresponding change in behavior as City fleet vehicles that use diesel or gasoline are replaced with CNG, hybrid, or electric vehicles. Accordingly, the City has a two-part goal which applies to City fleet vehicles excluding hauling vehicles. 2010 is used as the baseline year since this data is more accurate than 2005.
1) Reduce gallons of fuel by 15 percent below 2010 levels by 20202) Reduce VMT by 2 percent below 2010 levels by 2020
Table T1. City Fleet – VMT and Fuel Used to Support City Operations1
Gallons of fuel, Cost of fuel, and MTCO2e is a reflection of both vehicles and non-vehicle equipment that uses fuel.1.
The 2005 number of vehicles includes both vehicles and non-vehicle equipment that use fuel, which is why it is higher 2.
than 2010. This is the best available data for 2005.
Reducing gallons of fuel in the City’s waste hauling vehicles should be an achievable goal as the City’s Materials Diversion Division explores building an Anaerobic Digester that would convert food waste into CNG. This CNG would then be used to fuel waste hauling vehicles, which contributed to 58 percent of the total gallons of fuel in 2011. This initiative is discussed in greater detail in the Recycling & Waste Reduction section of the Community Plan. Unlike gallons of fuel, VMT is likely to increase, due in part to an expected increase in the number of waste hauling vehicles.
13
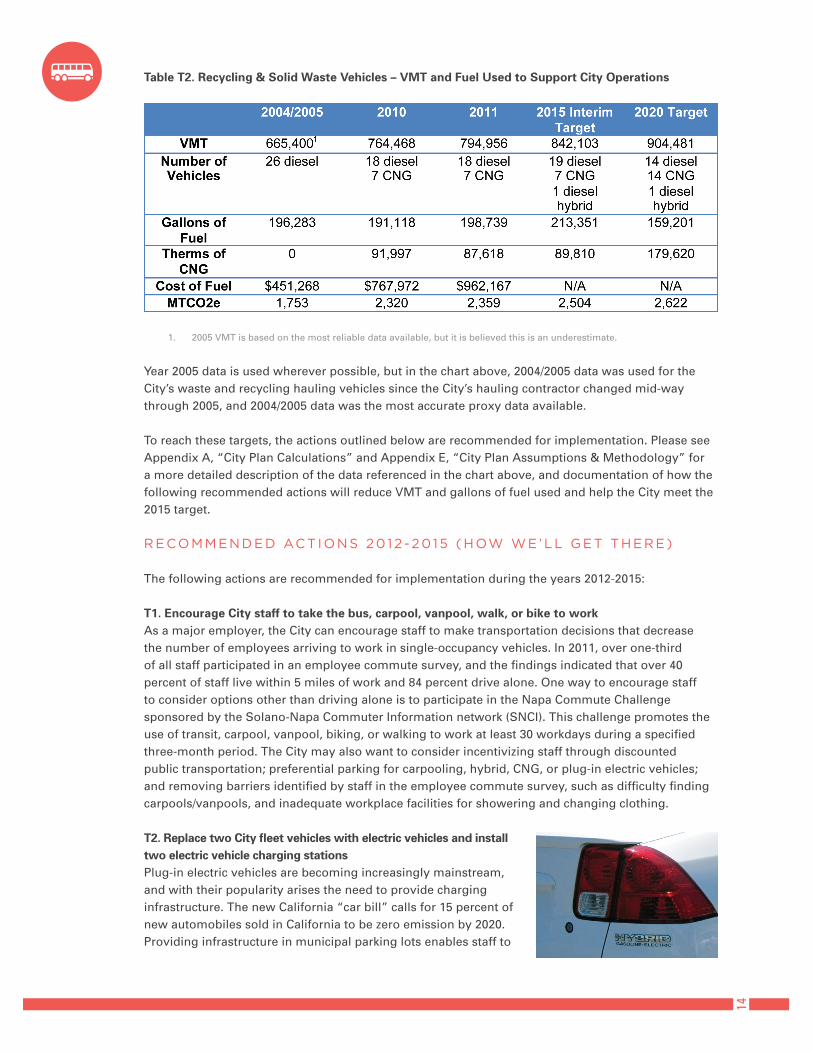
Table T2. Recycling & Solid Waste Vehicles – VMT and Fuel Used to Support City Operations
2005 VMT is based on the most reliable data available, but it is believed this is an underestimate.1.
Year 2005 data is used wherever possible, but in the chart above, 2004/2005 data was used for the City’s waste and recycling hauling vehicles since the City’s hauling contractor changed mid-way through 2005, and 2004/2005 data was the most accurate proxy data available.
To reach these targets, the actions outlined below are recommended for implementation. Please see Appendix A, “City Plan Calculations” and Appendix E, “City Plan Assumptions & Methodology” for a more detailed description of the data referenced in the chart above, and documentation of how the following recommended actions will reduce VMT and gallons of fuel used and help the City meet the 2015 target.
RECOMMENDED ACT IONS 2012 -2015 (HOW WE’LL GET THERE)
The following actions are recommended for implementation during the years 2012-2015:
T1. Encourage City staff to take the bus, carpool, vanpool, walk, or bike to work As a major employer, the City can encourage staff to make transportation decisions that decrease the number of employees arriving to work in single-occupancy vehicles. In 2011, over one-third of all staff participated in an employee commute survey, and the findings indicated that over 40 percent of staff live within 5 miles of work and 84 percent drive alone. One way to encourage staff to consider options other than driving alone is to participate in the Napa Commute Challenge sponsored by the Solano-Napa Commuter Information network (SNCI). This challenge promotes the use of transit, carpool, vanpool, biking, or walking to work at least 30 workdays during a specified three-month period. The City may also want to consider incentivizing staff through discounted public transportation; preferential parking for carpooling, hybrid, CNG, or plug-in electric vehicles; and removing barriers identified by staff in the employee commute survey, such as difficulty finding carpools/vanpools, and inadequate workplace facilities for showering and changing clothing.
T2. Replace two City fleet vehicles with electric vehicles and install two electric vehicle charging stations Plug-in electric vehicles are becoming increasingly mainstream, and with their popularity arises the need to provide charging infrastructure. The new California “car bill” calls for 15 percent of new automobiles sold in California to be zero emission by 2020. Providing infrastructure in municipal parking lots enables staff to
14
adopt this technology for their personal vehicles, and establishes plug-in vehicles as a viable option for the City fleet. It is recommended that staff determine feasible locations for the installation of two charging stations in City parking facilities for City employees and fleet utilization, examine potential financing mechanisms (including public-private partnerships), and install two charging stations and purchase two electric vehicles.
T3. Install electronic tracking technology in remaining City fleet vehiclesElectronic tracking technology is installed in approximately half of all light-duty vehicles in the City fleet. This technology allows the City to monitor vehicle performance, location, elevation, and velocity. Adding electronic tracking to the remaining vehicles would enable the City’s Fleet Manager to collect data on a broader cross-section of vehicles. Analyzing this data would provide indications where certain practices or policies could be adopted related to fuel efficiency, speeding, route logistics, idling, etc.
T4. Create an Anti-Idling Policy for City vehiclesAn Anti-Idling Policy for City fleet vehicles would improve air quality through reduced GHG emissions, save on fuel and maintenance expenses, and provide an opportunity for the City to lead by example. Another component of the policy will be to educate staff about the policy, and the importance of reducing emissions. The City’s Fleet Manager would be able to monitor City fleet users’ compliance with the anti-idling policy on an as-needed basis by using the City’s telematics system.
T5. Continue right-sizing the City fleet to appropriate vehicle sizesAs vehicles are replaced, the City’s Fleet Manager considers how the new vehicle will be used, and when possible, purchases the most fuel-efficient vehicle that is appropriate for the task. In some instances, this may mean replacing a V8 or V6 vehicle with a more efficient four-cylinder or hybrid model.
T6. Initiate a pooling concept in the City fleetThe concept of “pooling” means staff would reserve fleet vehicles online for necessary trips, rather than being assigned to a specific vehicle. Although the vehicles still use fuel, car sharing can impact the travel behavior of the pool participants by reducing the number and length of trips. Additionally, because fewer vehicles are required, pool vehicles tend to be newer, more efficient models with lower overall emissions. A “pay as you go” model with a database of available vehicles could also be initiated for departments that do not depend on the daily use of vehicles.
15
CONTEXT
The City operates three water treatment facilities and provides a safe and reliable source of water to more than 86,000 people in the City of Napa and adjacent areas. During peak summer demand, all three sources are tapped and the associated water treatment plants run at partial or near-full capacity. Most of the City’s water is received through the State Water Project (SWP) allotment.
There are two key factors affecting the City’s water demand that are outside of the City’s control - the economy and the region’s Mediterranean climate. The recent recessionary economy has contracted water demand as developers have scaled back new construction. The climate, normally characterized by hot dry summers and cool moist winters can cause massive swings in demand between July and January. This fluctuation is primarily driven by landscape irrigation needs that represent more than half of the City’s annual water demand – needs that could partially be met by using recycled water, as discussed later in this section. More recently, unpredictable weather patterns have made it particularly difficult to plan for or adjust to changing conditions. In future years, the climate may play an increasingly impactful role and will require close attention.
The scope of this section includes water pumping, transport, and water conservation for residential and commercial drinking water, irrigation, and all other uses. The City’s wastewater is not included as it is pumped, transported, and treated by the Napa Sanitation District (NSD); however, the Water Green Team included a representative from NSD as the two agencies work closely together on infrastructure projects. For example, NSD processes wastewater into non-potable recycled water at the Soscol Water Recycling Facility for sale to large irrigation users. At the end of 2011, 14 large customers that would otherwise use the City’s potable water had opted to purchase recycled water to meet their irrigation needs.
Water conservation protects a natural resource, reduces wear and tear of City infrastructure and treatment facilities, and decreases the amount of energy needed to pump and treat water. In 2010, the electricity used by the City to treat and transport water was 20 percent of the entire electricity used to support all City operations.
KEY RELEVANT LEG ISLAT ION
Water conservation efforts by the City of Napa have largely been driven by a proactive response to meet mandated and voluntary regulation in the State of California. Most recently, the Water Conservation Act of 2009 (Senate Bill x7-7 or “SBx7-7”) requires all water suppliers to set water use reduction targets, and report efforts and targets to the California Department of Water Resources (DWR). The legislation sets an overall goal to reduce statewide urban per capita water use 20 percent by December 31, 2020; in Napa’s case, the 2020 target is 132 gallons per capita per day (GPCD), 20 percent below Napa’s 1995-2004 average of 165 GPCD. Effective 2016, if the City does not meet SBx7-7 water conservation requirements, it will not be eligible for state water grants or loans.
Additional legislation includes SB 407, which was effective January 1, 2010, and establishes requirements for replacing non-water conserving plumbing fixtures in residential and commercial real property built before January 1, 1994. The law becomes progressively more stringent beginning in 2014 when water-conserving plumbing fixtures will be required in all remodels as a condition for issuance of a certificate of final completion and occupancy or final permit approval by the City Building Division.
SECT ION 1 - C ITY GOVERNMENT S U STAI NAB I L I TY P LAN
WATE R
16
In addition to mandatory conservation practices, the City is a voluntary signatory of the Memorandum of Understanding Regarding Urban Water Conservation in California, which commits the City to implement best management practices (BMPs) that will help ensure future water supply reliability. From 1997 to 2002, demand on the City’s water system averaged 170 GPCD. Since 2003 when the City began to implement more California BMPs, demand has averaged just 154 GPCD, including lows of 138 and 136 GPCD in 2010 and 2011. The overall downward trend in GPCD results from the evolution of water-efficient appliances, City ordinances and programs, and water recycling; however, the economic downturn and mild summers were significant factors in the very low 2010 and 2011 demand figures.
INITIATIVES AND POLICIES IMPLEMENTED SINCE 2005 (WHERE WE ARE)
To remain in compliance with legislation and to voluntarily reduce the amount of water used, the following water-saving initiatives have been implemented by the City since 2005:
City Council adopted the most recent Water Efficient Landscaping Ordinance (WELO) in 2010. • It imposes tighter water budgets and other prescriptive measures on new landscape projects. The WELO is more stringent than the State Model Water Efficient Landscape Ordinance. Collectively, the High Performance Building Ordinance (also adopted by City Council in 2010) and the WELO are expected to reduce the water use of new development by 25 percent, saving up to 1 GPCD for the City overall.
“Water-Wise” home and business audits that provide water customers with a variety of free • water-saving devices and educational information. Since 2005, nearly 350 of these audits have been conducted.
An indoor fixture and appliance rebate program that includes items such as toilet • replacement, high-efficiency clothes washer rebates, low-flow showerhead distribution, commercial waterless urinals, and low-flow pre-rinse spray valve installation.
Prompt detection and repair of visible main and service line leaks and the replacement of • aging mains and plastic service lines has helped reduce the system’s annual unaccounted-for water
A weather-based irrigation system that controls more than 40 parks and fields maintained by • the City and the Napa Valley Unified School District
Of the 14 customers currently using recycled water to fulfill irrigation needs instead of City • potable water, 6 made the switch since 2005
Improvements to the Edward I. Barwick Jamieson Canyon Water Treatment Plant. The plant • includes a state-of-the-art ozone treatment system to improve the taste of tap water, and its increased treatment capacity will enable the City to better preserve its local reservoir supplies for drought periods.
City Council adopted a water rate structure beginning in October 2011 for single-family • residential customers, to provide the funds necessary to operate, maintain and improve infrastructure over multiple years. The water rates include a tiered structure that reflects the incremental additional costs associated with serving increased quantities of water. These tiered water rates tend to encourage water conservation, and it is anticipated that there will be a resulting decrease in discretionary landscape irrigation, potentially saving up to 1.5 GPCD.
17
WATER REDUCT ION TARGET (WHERE WE ’D L IKE TO BE)
In compliance with SBx7-7, the City’s target for water use is:
Reduce City of Napa water demand to below 132 gallons per capita per day by 2020.
Long term, the goal will be to reduce water use below 132 GPCD by 2020, but an interim 2015 goal will help the City focus its efforts and stay on-track. As previously mentioned, since climate and the economy can affect water use over the course of a given year, more emphasis will be placed on achieving a downward trend in GPCD rather than drawing conclusions based on a single year. The actions outlined below would close the gap and enable the City to make progress towards the 2020 water conservation target. See the table below for a summary of recent progress and future targets. Note that with improved economic conditions and a more typical summer, GPCD in 2015 is expected to be slightly higher than the extraordinary 2010 and 2011, but significantly lower than 2005 and previous long-term historical averages.
RE COMMENDED ACT IONS 2012 -2015 (HOW WE’LL GET THERE)
The following actions are recommended for implementation during the years 2012-2015. Please see Appendix A, “City Plan Calculations,” for further analysis including costs, financing mechanisms, and payback periods.
W1. Identify and convert additional customers to recycled water Recycled water is highly treated and disinfected wastewater that meets stringent water quality guidelines set by the California Department of Public Health. In Napa, recycled water is used for irrigation purposes and is typically targeted at very large users such as golf courses, parks, and commercial businesses. There are currently 14 large irrigation customers that purchase recycled water who would otherwise be using City potable, and the City plans to continue working with NSD to add more recycled water customers. New potential customers include Napa State Hospital, Napa Valley Corporate Park, South Napa Marketplace, and the Stanly Ranch area.
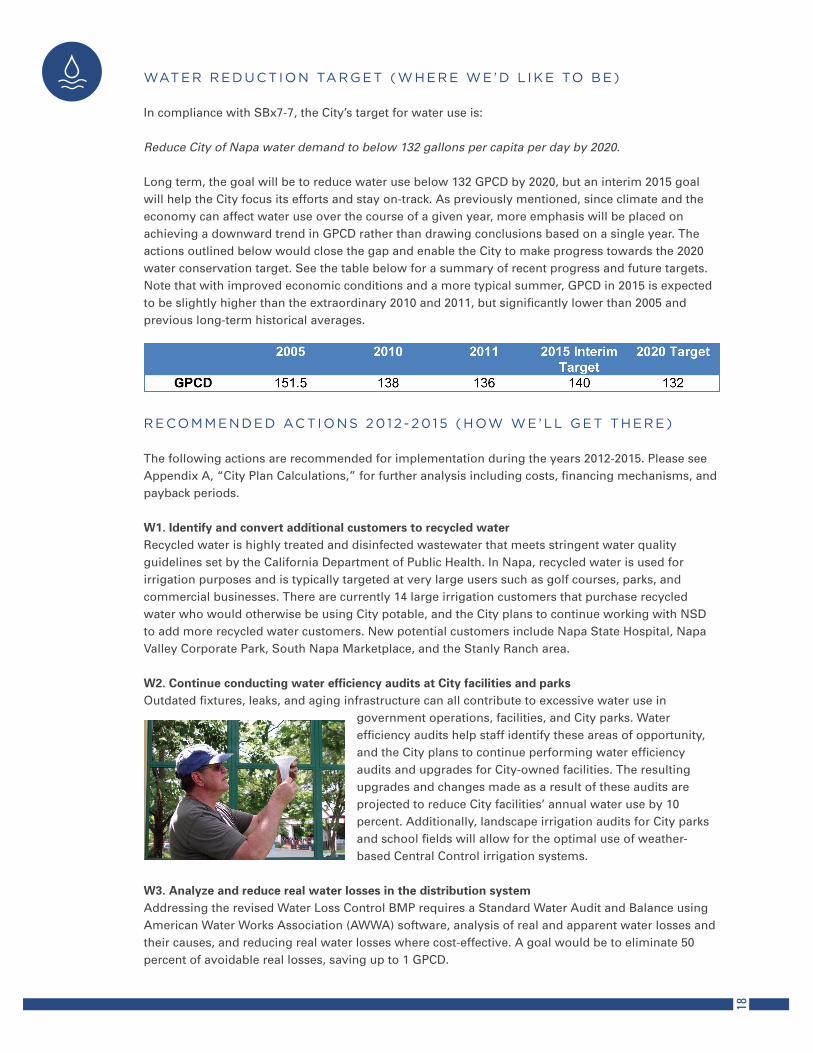
W2. Continue conducting water efficiency audits at City facilities and parksOutdated fixtures, leaks, and aging infrastructure can all contribute to excessive water use in
government operations, facilities, and City parks. Water efficiency audits help staff identify these areas of opportunity, and the City plans to continue performing water efficiency audits and upgrades for City-owned facilities. The resulting upgrades and changes made as a result of these audits are projected to reduce City facilities’ annual water use by 10 percent. Additionally, landscape irrigation audits for City parks and school fields will allow for the optimal use of weather-based Central Control irrigation systems.
W3. Analyze and reduce real water losses in the distribution systemAddressing the revised Water Loss Control BMP requires a Standard Water Audit and Balance using American Water Works Association (AWWA) software, analysis of real and apparent water losses and their causes, and reducing real water losses where cost-effective. A goal would be to eliminate 50 percent of avoidable real losses, saving up to 1 GPCD.
18
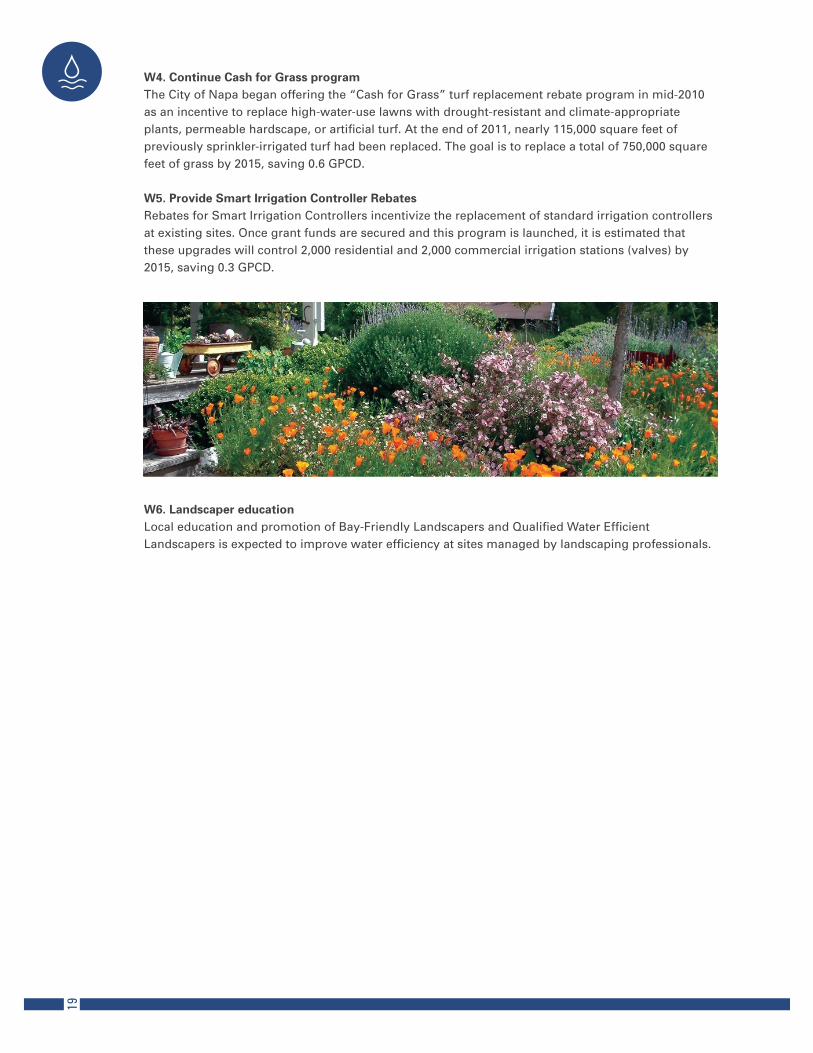
W4. Continue Cash for Grass program The City of Napa began offering the “Cash for Grass” turf replacement rebate program in mid-2010 as an incentive to replace high-water-use lawns with drought-resistant and climate-appropriate plants, permeable hardscape, or artificial turf. At the end of 2011, nearly 115,000 square feet of previously sprinkler-irrigated turf had been replaced. The goal is to replace a total of 750,000 square feet of grass by 2015, saving 0.6 GPCD.
W5. Provide Smart Irrigation Controller RebatesRebates for Smart Irrigation Controllers incentivize the replacement of standard irrigation controllers at existing sites. Once grant funds are secured and this program is launched, it is estimated that these upgrades will control 2,000 residential and 2,000 commercial irrigation stations (valves) by 2015, saving 0.3 GPCD.
W6. Landscaper educationLocal education and promotion of Bay-Friendly Landscapers and Qualified Water Efficient Landscapers is expected to improve water efficiency at sites managed by landscaping professionals.
19
CONTEXT
Recycling and solid waste services in Napa are handled by the City’s Materials Diversion Division (MDD). The City owns the Napa Recycling and Composting Facility (known formally as the Materials Diversion Facility or MDF), and a contractor, Napa Recycling and Waste Services, LLC (NRWS) operates the facility and owns and maintains the trucks that collect garbage, recycling, and yard waste. While recycling and yard waste is taken to the Napa Recycling and Composting Facility, garbage is taken to the Devlin Road Transfer Station and eventually winds up at the Keller Canyon landfill in Contra Costa County. The Devlin Road Transfer Station is publicly owned by the Napa-Vallejo Waste Management Authority (NVWMA), which is a joint powers authority comprised of the member jurisdictions of Napa County and the cities of Napa, American Canyon, and Vallejo. The Devlin Road Transfer Station is currently operated under contract to the NVWMA by a private contractor, Northern Recycling Operations and Waste Services, LLC. The Keller Canyon landfill is owned by Republic Services which is also under contract for disposal services with the NVWMA.
Since the MDD provides recycling and solid waste services to both City government and the community, it plays a dual role of seeking to reduce solid waste in City operations as well as implement policies that reduce solid waste in the community at-large. From a City government perspective, emissions from solid waste accounted for less than 3 percent of the City’s total 2010 GHG emissions, but this relatively small number can have a large impact. When organic materials and other waste are discarded, it decomposes and generates methane gas, which has a GHG warming potential 20 times more potent than CO2.
The concept of “zero waste” is frequently discussed in progressive waste management operations, and is commonly thought to be achieved when the diversion rate is greater than 90 percent. A diversion rate is the percentage of waste materials that are diverted from a landfill and are recycled, composted, or re-used instead. Consistent with statewide goals, Napa is likely to consider adoption of a “disposal reduction policy” or “DRP” that would set a minimum diversion rate of 75 percent by 2020. In Napa, the MDD has already instituted a number of programs and policies that have brought the City and the community as a whole much closer to zero waste as a more attainable objective. These programs and policies are referenced in the following pages, and will also be discussed in the Recycling & Solid Waste section of the Community Plan since successful implementation rests largely with household practices.
KE Y RELEVANT LEG ISLAT ION
The MDD maintains compliance with the California Integrated Waste Management Act of 1989 (“AB 939”), which requires the City to prepare, adopt, and implement source reduction and recycling plans and programs to reach landfill diversion goals. Among other requirements, cities must divert 50 percent of their waste by January 1, 2000. In Napa, the diversion rate has been in excess of 50 percent since 1998, making it one of the highest in the country. Failure to meet AB 939’s solid waste diversion goals can result in fines of up to $10,000 a day. Statewide, the passage of AB 32 and AB 341 instituted mandatory commercial recycling and 75 percent diversion from landfill by 2020. Locally, these can be formally adopted with a Disposal Reduction Policy (“DRP”).
INITIATIVES AND POLICIES IMPLEMENTED SINCE 2005 (WHERE WE ARE)
Below is a sampling of programs and practices the City has instituted since 2005 to reduce the
SECT ION 1 - C ITY GOVERNMENT S U STAI NAB I L I TY P LAN
RE CYCL ING & WASTE REDUCT ION
20
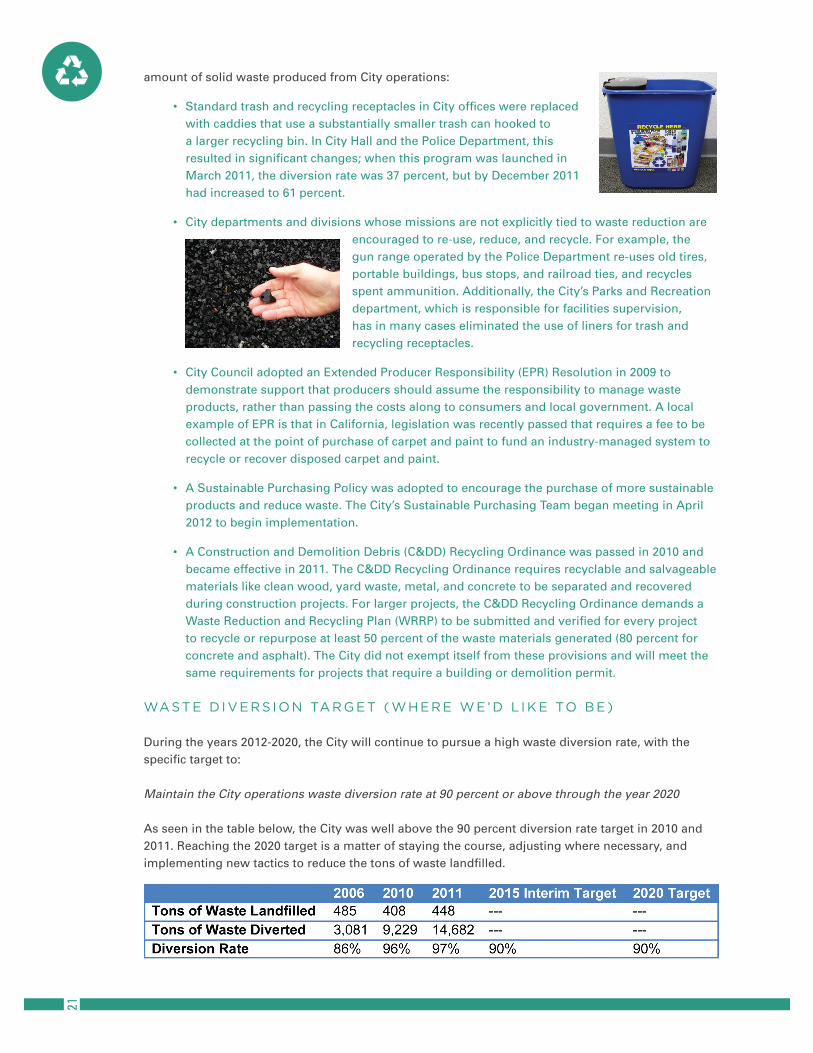
amount of solid waste produced from City operations:
Standard trash and recycling receptacles in City offices were replaced • with caddies that use a substantially smaller trash can hooked to a larger recycling bin. In City Hall and the Police Department, this resulted in significant changes; when this program was launched in March 2011, the diversion rate was 37 percent, but by December 2011 had increased to 61 percent.
City departments and divisions whose missions are not explicitly tied to waste reduction are • encouraged to re-use, reduce, and recycle. For example, the gun range operated by the Police Department re-uses old tires, portable buildings, bus stops, and railroad ties, and recycles spent ammunition. Additionally, the City’s Parks and Recreation department, which is responsible for facilities supervision, has in many cases eliminated the use of liners for trash and recycling receptacles.
City Council adopted an Extended Producer Responsibility (EPR) Resolution in 2009 to • demonstrate support that producers should assume the responsibility to manage waste products, rather than passing the costs along to consumers and local government. A local example of EPR is that in California, legislation was recently passed that requires a fee to be collected at the point of purchase of carpet and paint to fund an industry-managed system to recycle or recover disposed carpet and paint.
A Sustainable Purchasing Policy was adopted to encourage the purchase of more sustainable • products and reduce waste. The City’s Sustainable Purchasing Team began meeting in April 2012 to begin implementation.
A Construction and Demolition Debris (C&DD) Recycling Ordinance was passed in 2010 and • became effective in 2011. The C&DD Recycling Ordinance requires recyclable and salvageable materials like clean wood, yard waste, metal, and concrete to be separated and recovered during construction projects. For larger projects, the C&DD Recycling Ordinance demands a Waste Reduction and Recycling Plan (WRRP) to be submitted and verified for every project to recycle or repurpose at least 50 percent of the waste materials generated (80 percent for concrete and asphalt). The City did not exempt itself from these provisions and will meet the same requirements for projects that require a building or demolition permit.
WASTE D IVERS ION TARGET (WHERE WE ’D L IKE TO BE)
During the years 2012-2020, the City will continue to pursue a high waste diversion rate, with the specific target to:
Maintain the City operations waste diversion rate at 90 percent or above through the year 2020
As seen in the table below, the City was well above the 90 percent diversion rate target in 2010 and 2011. Reaching the 2020 target is a matter of staying the course, adjusting where necessary, and implementing new tactics to reduce the tons of waste landfilled.
21
RECOMMENDED ACT IONS 2012 -2015 (HOW WE’LL GET THERE)
The following actions are recommended for implementation during the years 2012-2015. Please see Appendix A, “City Plan Calculations,” for further analysis including costs, financing mechanisms, annual savings, and payback periods. R1. Implement the Sustainable Purchasing PolicyThe adoption of the Sustainable Purchasing Policy in May 2011 was an important first step. Cities with sustainable purchasing policies benefit from increased waste diversion rates and newfound eligibility to apply for certain grants. Implementing a sustainable purchasing policy represents an opportunity to reduce waste, lead by example, and in many instances, save money. The City’s Sustainable Purchasing Team, comprised of staff members who represent a broad cross-section of City functions, began convening in April 2012 and will determine which products and services can be more sustainably purchased.
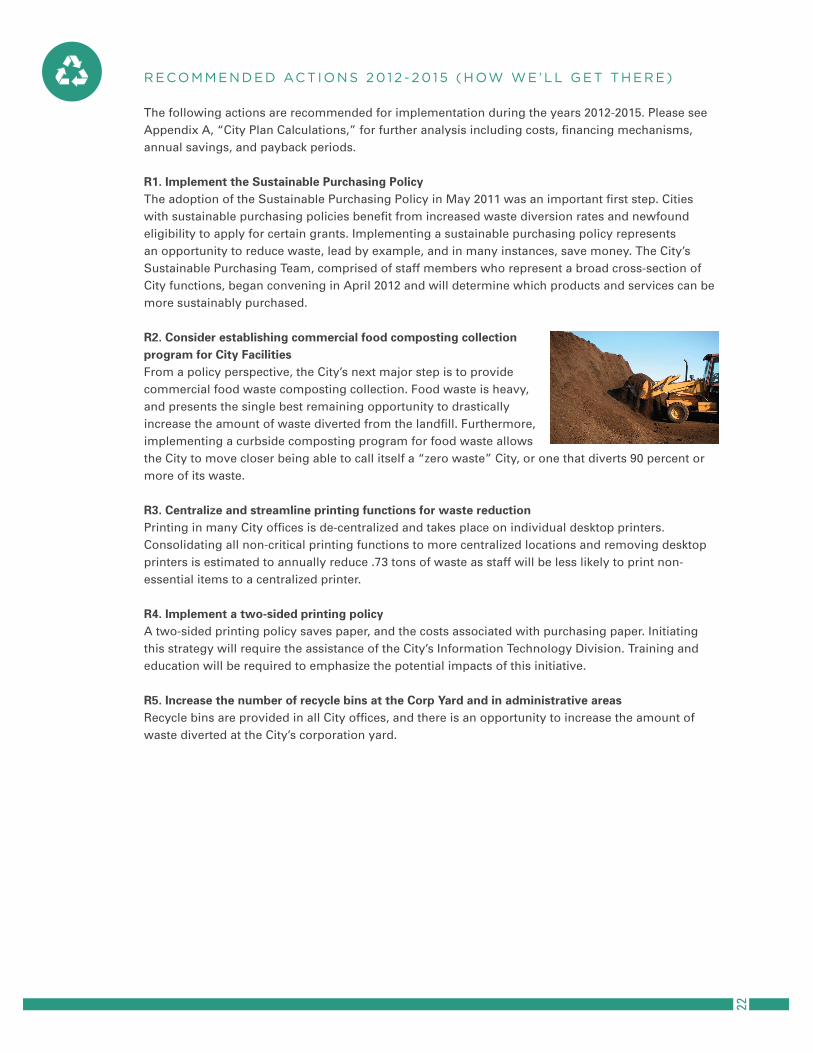
R2. Consider establishing commercial food composting collection program for City Facilities From a policy perspective, the City’s next major step is to provide commercial food waste composting collection. Food waste is heavy, and presents the single best remaining opportunity to drastically increase the amount of waste diverted from the landfill. Furthermore, implementing a curbside composting program for food waste allows the City to move closer being able to call itself a “zero waste” City, or one that diverts 90 percent or more of its waste. R3. Centralize and streamline printing functions for waste reductionPrinting in many City offices is de-centralized and takes place on individual desktop printers. Consolidating all non-critical printing functions to more centralized locations and removing desktop printers is estimated to annually reduce .73 tons of waste as staff will be less likely to print non-essential items to a centralized printer.
R4. Implement a two-sided printing policyA two-sided printing policy saves paper, and the costs associated with purchasing paper. Initiating this strategy will require the assistance of the City’s Information Technology Division. Training and education will be required to emphasize the potential impacts of this initiative.
R5. Increase the number of recycle bins at the Corp Yard and in administrative areasRecycle bins are provided in all City offices, and there is an opportunity to increase the amount of waste diverted at the City’s corporation yard.
22
CONTEXT
A balance between natural and built environments ensures a healthy community and creates economic value. Natural assets such as clean air, abundant clean water and fertile soil provide the basic human needs for survival. In recognition of this important balance, in 1982, the City of Napa established a Rural Urban Limit (“RUL”) Line in order to encourage urban development within the City’s sphere of influence (as approved by the Local Agency Formation Commission of Napa County), and preserve agricultural land in the rural areas outside the RUL.
Additionally, the City’s General Plan, Envision Napa 2020, is a comprehensive planning document required by the State of California that includes goals and policies for future land use and development. It is a “long-term vision for the physical evolution of Napa and outlines policies, standards, and programs to guide day-to-day decisions concerning Napa’s development through the year 2020.”
The General Plan touches on many topics relevant to sustainability. It was adopted on December 1, 1998, and the most recent update occurred in March 2011. The General Plan sets the framework for future growth and development in Napa. The major themes of the plan are “maintaining the physical and social qualities of Napa within an economically healthy and self-sufficient economy.” When the City embarks on a General Plan update, the incorporation of relevant goals and policies recommended in the Sustainability Plan will help ensure that future planning and development within the City are undertaken with sustainability in mind.
KEY RELEVANT LEG ISLAT ION
As mentioned in the Introduction section of the Sustainability Plan, AB 32, SB 375, and CEQA are all important and complex pieces of California legislation that promote responsible planning and land use by: recommending that local governments take proactive steps to reduce GHG emissions; making environmental protection a mandatory part of local government decision-making; and aligning regional transportation planning efforts, GHG reduction targets, and affordable housing allocations.
INITIATIVES AND POLICIES IMPLEMENTED SINCE 2005 (WHERE WE ARE)
City Council adopted a High Performance Building Ordinance (HPBO) in multiple phases • beginning in 2008. The most recent iteration of the HPBO was adopted in December 2010, and integrates sustainable building practices into all new construction projects. The HPBO goes beyond the 2010 California Green Building Standard Code, and with respect to energy, requires projects to achieve at least 15 percent greater efficiency than the minimum state-mandated Title 24 standard. The next phase of the HPBO will apply to remodels and additions and will be consistent with the State Green Building Code Update.
City Council first adopted a Density Bonus in 2000, concurrent with the requirements of • the State Density Bonus Law (California Government Code Title 7, Division 1, Chapter 4.3, Sections 65915, et seq.) and the City’s Housing Element. The Density Bonus was updated most recently in 2011, and specifies how the City shall provide density bonuses and other incentives, concessions, or waivers for certain housing projects affordable to lower income, very low income, senior citizen housing, moderate income condominium projects, and child care facilities. Developers may build higher density than current district regulations allow by providing affordable housing that is close to services and transportation.
SECT ION 1 - C ITY GOVERNMENT S U STAI NAB I L I TY P LAN
PLANNING & LAND USE23
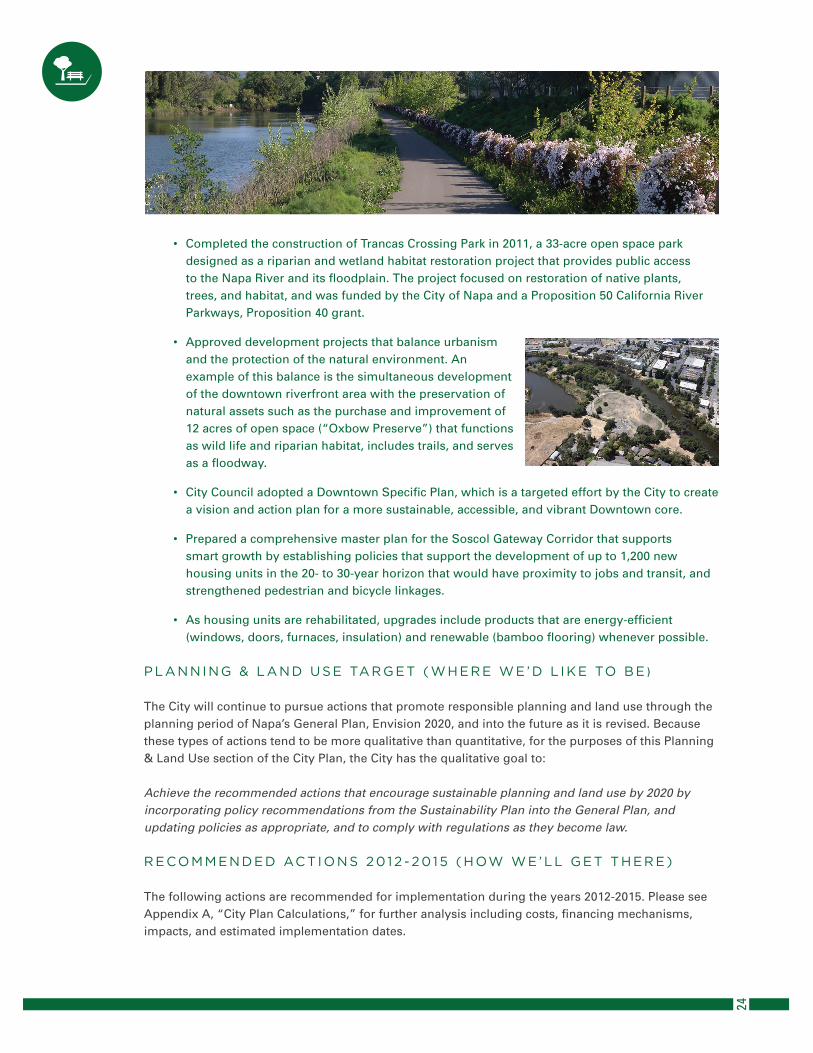
Completed the construction of Trancas Crossing Park in 2011, a 33-acre open space park • designed as a riparian and wetland habitat restoration project that provides public access to the Napa River and its floodplain. The project focused on restoration of native plants, trees, and habitat, and was funded by the City of Napa and a Proposition 50 California River Parkways, Proposition 40 grant.
Approved development projects that balance urbanism • and the protection of the natural environment. An example of this balance is the simultaneous development of the downtown riverfront area with the preservation of natural assets such as the purchase and improvement of 12 acres of open space (“Oxbow Preserve”) that functions as wild life and riparian habitat, includes trails, and serves as a floodway.
City Council adopted a Downtown Specific Plan, which is a targeted effort by the City to create • a vision and action plan for a more sustainable, accessible, and vibrant Downtown core.
Prepared a comprehensive master plan for the Soscol Gateway Corridor that supports • smart growth by establishing policies that support the development of up to 1,200 new housing units in the 20- to 30-year horizon that would have proximity to jobs and transit, and strengthened pedestrian and bicycle linkages.
As housing units are rehabilitated, upgrades include products that are energy-efficient • (windows, doors, furnaces, insulation) and renewable (bamboo flooring) whenever possible.
PLANNING & LAND USE TARGET (WHERE WE ’D L IKE TO BE )
The City will continue to pursue actions that promote responsible planning and land use through the planning period of Napa’s General Plan, Envision 2020, and into the future as it is revised. Because these types of actions tend to be more qualitative than quantitative, for the purposes of this Planning & Land Use section of the City Plan, the City has the qualitative goal to:
Achieve the recommended actions that encourage sustainable planning and land use by 2020 by incorporating policy recommendations from the Sustainability Plan into the General Plan, and updating policies as appropriate, and to comply with regulations as they become law.
RECOMMENDED ACT IONS 2012 -2015 (HOW WE’LL GET THERE)
The following actions are recommended for implementation during the years 2012-2015. Please see Appendix A, “City Plan Calculations,” for further analysis including costs, financing mechanisms, impacts, and estimated implementation dates.
24
P1. Prepare and implement the next phase of the High Performance Building Ordinance (HPBO) for remodels and additionsCity Council adopted a High Performance Building Ordinance (HPBO) in multiple phases beginning in 2008. The most recent iteration of the HPBO was adopted in December 2010, and integrates sustainable building practices into all new construction projects and goes beyond the 2010 California Green Building Standard Code. The next phase of the HPBO will address remodels and additions, and it is anticipated that this project will begin in summer 2012 and will take approximately one year to complete. P2. Implement the policies in the Downtown Napa Specific PlanThe Downtown Napa Specific Plan (“Specific Plan”) creates a vision and action plan for a more sustainable, accessible and vibrant Downtown core, and dovetails very well with the Sustainability Plan. The Specific Plan was adopted by City Council in 2012, and is a detailed policy tool that complements the City’s General Plan and facilitates development while encouraging sustainable economic development in downtown Napa. The Specific Plan addresses aspects of new development and construction such as land use, design, circulation, infrastructure and financing. The Specific Plan recognizes downtown as a connected and integrated center of the community, and aims to create a more pedestrian-oriented environment, which has associated GHG reduction benefits. It encourages higher density housing within the downtown core, closer to jobs and public transit; promotes integration of walkable corridors and crosswalks; low-water use landscaping; energy efficient lighting; high performance building methods; and expanded bicycle parking throughout the area.
P3. Develop policies that support the citywide installation of electric vehicle charging infrastructure and solar panels in parking facilitiesAs new parking facilities are planned and built in the future, the City should consider the inclusion of electric vehicle charging stations in public structures and surface lots. Additionally, the City should consider incorporation of solar panels on new public parking structures, like those found on the top level of the Fifth Street Parking Garage, through a cost-benefit analysis. The solar panels would provide an important on-site power source and would allow plug-in electric vehicles to operate as sustainably as possible, by utilizing renewable energy. The City should also explore the merits of requiring charging stations and solar panels on privately developed parking facilities as a future policy consideration.
P4. Ramp up the existing sidewalk repair programPrior to 2012, the main program through which sidewalks were repaired was a cost-share program between the City and property owners. Due to a backlog of sidewalk repair requests, in 2012 the City will dedicate more funding and staff time to repairing sidewalks, and will pour 1,200-cubic-yards of concrete before year’s end, doubling previous efforts. This will provide for greater safety, access for disabled residents, and connectivity. Nationwide, 60 percent of all trips one mile or less are made using a private vehicle; by enhancing the sidewalk repair program, the City is removing a barrier and encouraging more foot traffic.
P5. Initiate a regional economic development strategy with Napa County and other jurisdictions in the countyBy collaborating with the County to create high-quality jobs that are close to home, the City will remain competitive regionally and nationally, and help reduce GHG emissions as more residents find work closer to home. As a first step, the City will work with the County and other jurisdictions to prepare a Comprehensive Economic Development Strategy (CEDS). The CEDS will identify business attraction opportunities to be pursued on a regional level, and will help to consolidate public resources and strengthen economic development partnerships. The City anticipates initiating the CEDS effort in the 2012-13 fiscal year.
25
P6. Pursue funding as a designated Priority Development Areas (PDA) to accomplish sustainability goals in the Soscol Gateway and Downtown corridor The Soscol Gateway Corridor has long been an area that the City and community have worked together to revitalize, starting with the Soscol Gateway Vision (2004) followed by the Soscol Gateway Implementation Plan (2005) and the Soscol Gateway Redevelopment Plan (2007). Building on these plans, the City is seeking PDA designation for the Soscol Gateway and Downtown Corridor, and envisions expanded residential and mixed-use development with access to a variety of transportation opportunities. Additionally, emphasis would be placed on the creation of new residential uses that are connected to the established community through numerous linkages, and protection of natural resources important to the community such as agricultural land, open space, and the Napa River. If the Soscol Gateway and Downtown Corridor receive PDA designation, the City will be in a stronger position to obtain grants for planning, design, and construction of infrastructure projects that support the goals of the PDA and this Sustainability Plan.
26
BACKGROUND
Napa’s Community Sustainability Plan (“Community Plan”) documents programs and initiatives that are currently supporting a more sustainable city, and identifies new voluntary initiatives that will lead to a more sustainable future. In contrast to the City Plan, which features initiatives carried out by the City, the Community Plan makes recommendations for the community and requires participation of residents and businesses to be effective. Due to data limitations, the Community Plan is necessarily written in a manner that is more qualitative than quantitative. As the City obtains the resources to revise the 2005 Community GHG Inventory and conduct a 2010 Community GHG Inventory, the Community Plan can be updated and more data and analysis included.
Actions taken by the City of Napa government to reduce GHG emissions are an important aspect of the Sustainability Plan, especially given the City’s opportunity to lead by example, and to make policy changes that affect the community at large. Nevertheless, it is important to understand that in 2005, Napa City government operations accounted for less than two percent of the total GHG emissions attributable to Napa city boundaries. A Community Sustainability Plan is crucial because the other 98 percent of GHG emissions result from activities like driving vehicles, and lighting, heating, and cooling homes and businesses.
Between 2010 and 2020, the population of the city of Napa is projected to grow by 16 percent to over 84,000 residents. Left unchecked, community-generated emissions are expected to increase 20 percent in the city of Napa in the same time period, with the largest increases attributable to transportation and growth in the commercial and industrial sectors. As the commercial sector grows, the impacts from businesses (emissions from buildings and operations) will increase along with the number of people driving in and out of the city for work. In this “business-as-usual” scenario, the transportation and residential sectors will contribute the majority of emissions, totaling nearly 73 percent.
Napa’s Community Plan benefited from substantial community engagement. The Community Plan was created through a series of community engagement sessions that provided Napa residents an opportunity to contribute and share their vision of a sustainable community. Input was collected via one-on-one interviews of community leaders; a web-based bilingual (English and Spanish) survey that delivered nearly 400 responses; and 16 public meetings, including one large event, 14 smaller focus groups, and one Spanish-language meeting. Key input from the interviews and survey are incorporated into the Sustainability Plan and summary survey results are included as Appendix C, “City of Napa Sustainability Survey Summary Findings.”
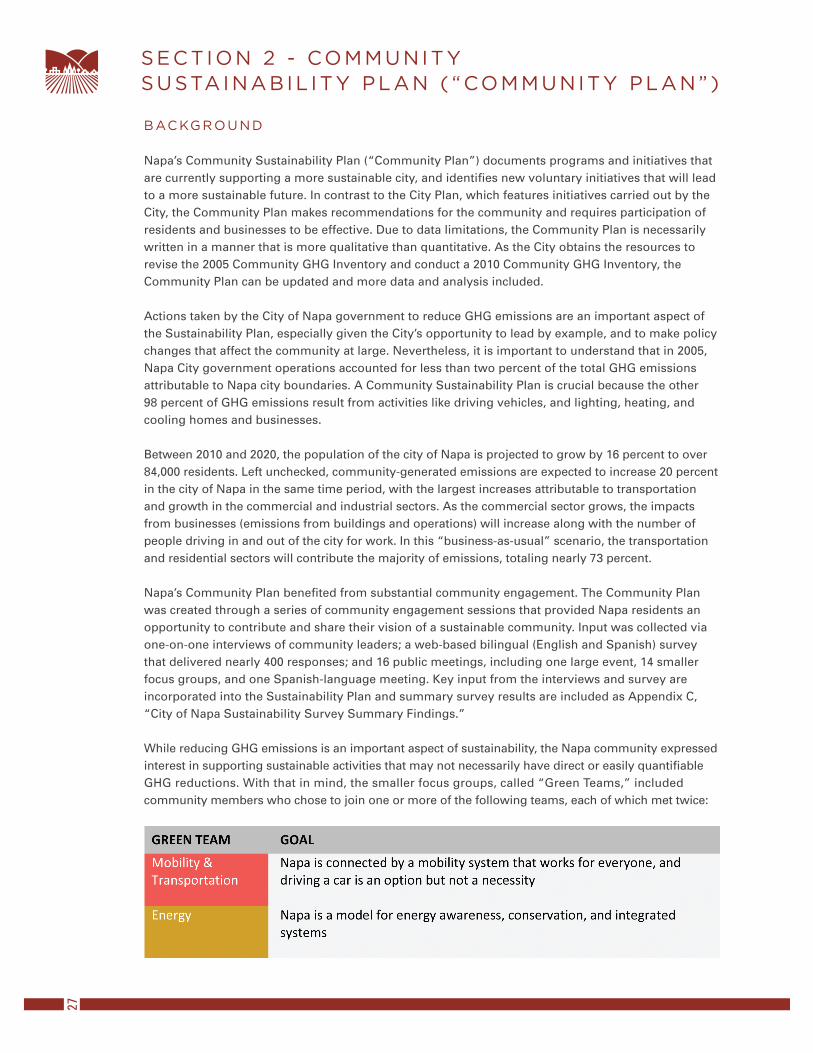
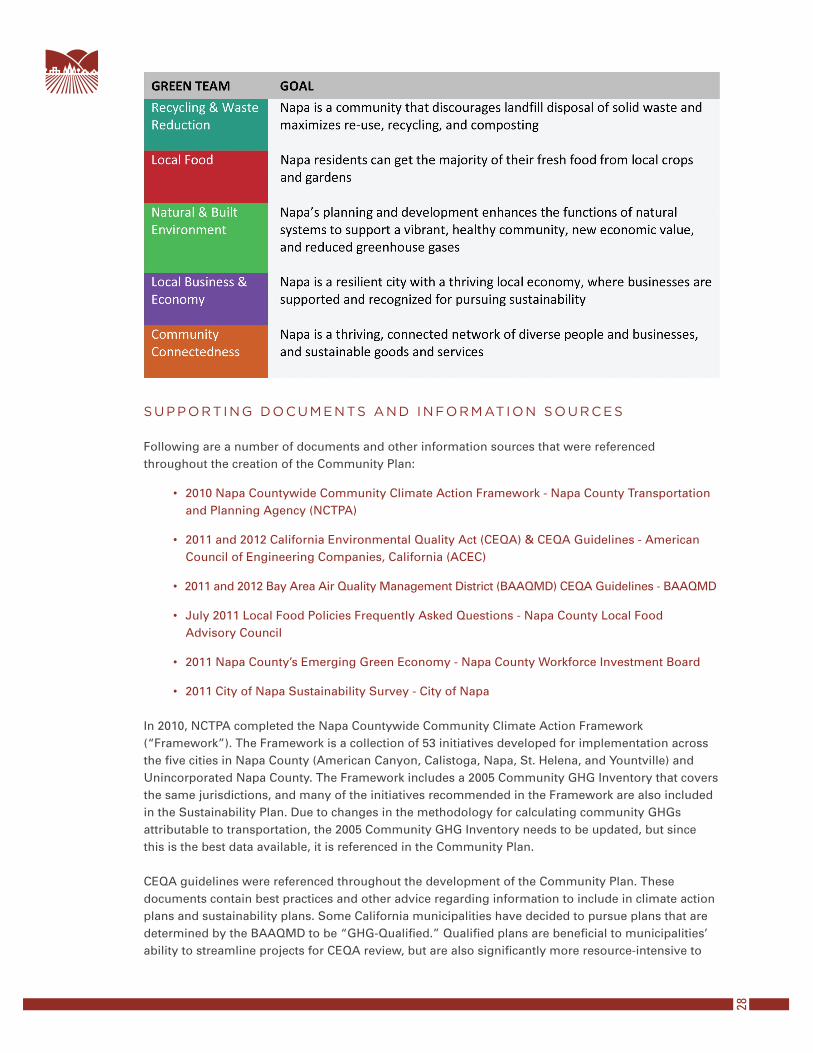
While reducing GHG emissions is an important aspect of sustainability, the Napa community expressed interest in supporting sustainable activities that may not necessarily have direct or easily quantifiable GHG reductions. With that in mind, the smaller focus groups, called “Green Teams,” included community members who chose to join one or more of the following teams, each of which met twice:
27SUSTAINABIL ITY PLAN ( “COMMUNITY PLAN”)SECT ION 2 - COMMUNITY
SUPPORT ING DOCUM ENTS AND INFORMATION SOURCES
Following are a number of documents and other information sources that were referenced throughout the creation of the Community Plan:
2010 Napa Countywide Community Climate Action Framework - Napa County Transportation • and Planning Agency (NCTPA)
2011 and 2012 California Environmental Quality Act (CEQA) & CEQA Guidelines - American • Council of Engineering Companies, California (ACEC)
2011 and 2012 Bay Area Air Quality Management District (BAAQMD) CEQA Guidelines - BAAQMD•
July 2011 Local Food Policies Frequently Asked Questions - Napa County Local Food • Advisory Council
2011 Napa County’s Emerging Green Economy - Napa County Workforce Investment Board•
2011 City of Napa Sustainability Survey - City of Napa•
In 2010, NCTPA completed the Napa Countywide Community Climate Action Framework (“Framework”). The Framework is a collection of 53 initiatives developed for implementation across the five cities in Napa County (American Canyon, Calistoga, Napa, St. Helena, and Yountville) and Unincorporated Napa County. The Framework includes a 2005 Community GHG Inventory that covers the same jurisdictions, and many of the initiatives recommended in the Framework are also included in the Sustainability Plan. Due to changes in the methodology for calculating community GHGs attributable to transportation, the 2005 Community GHG Inventory needs to be updated, but since this is the best data available, it is referenced in the Community Plan.
CEQA guidelines were referenced throughout the development of the Community Plan. These documents contain best practices and other advice regarding information to include in climate action plans and sustainability plans. Some California municipalities have decided to pursue plans that are determined by the BAAQMD to be “GHG-Qualified.” Qualified plans are beneficial to municipalities’ ability to streamline projects for CEQA review, but are also significantly more resource-intensive to
28
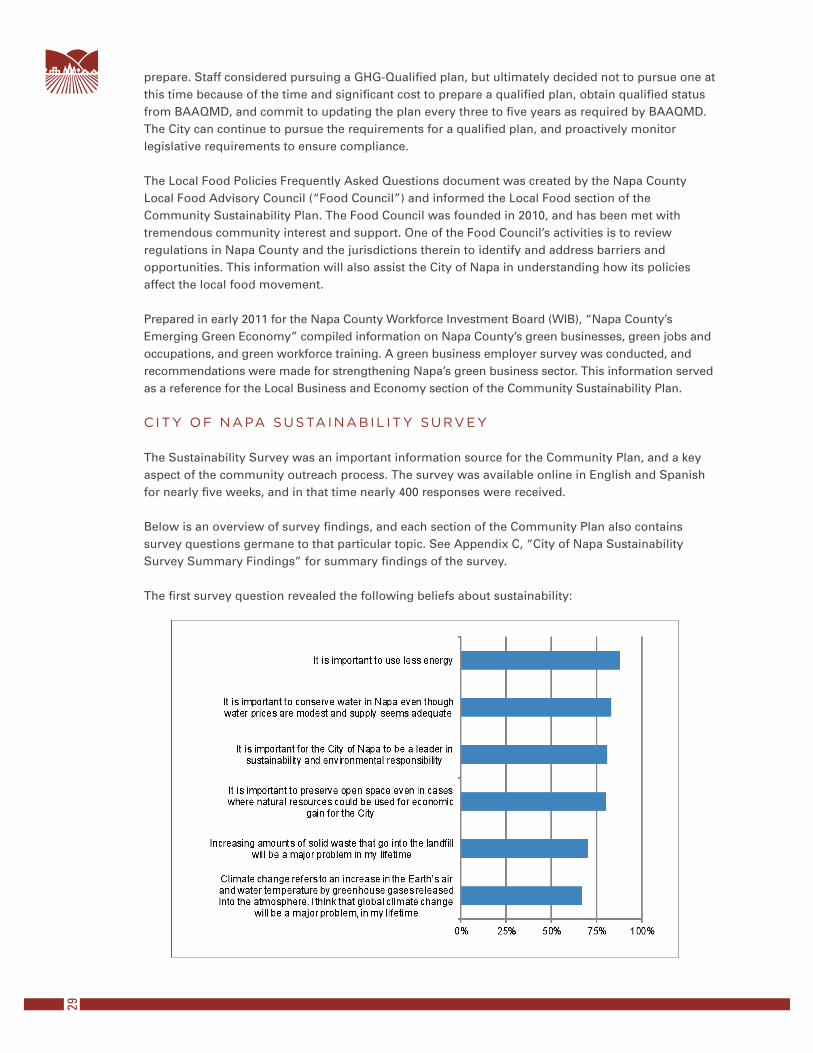
prepare. Staff considered pursuing a GHG-Qualified plan, but ultimately decided not to pursue one at this time because of the time and significant cost to prepare a qualified plan, obtain qualified status from BAAQMD, and commit to updating the plan every three to five years as required by BAAQMD. The City can continue to pursue the requirements for a qualified plan, and proactively monitor legislative requirements to ensure compliance.
The Local Food Policies Frequently Asked Questions document was created by the Napa County Local Food Advisory Council (“Food Council”) and informed the Local Food section of the Community Sustainability Plan. The Food Council was founded in 2010, and has been met with tremendous community interest and support. One of the Food Council’s activities is to review regulations in Napa County and the jurisdictions therein to identify and address barriers and opportunities. This information will also assist the City of Napa in understanding how its policies affect the local food movement.
Prepared in early 2011 for the Napa County Workforce Investment Board (WIB), “Napa County’s Emerging Green Economy” compiled information on Napa County’s green businesses, green jobs and occupations, and green workforce training. A green business employer survey was conducted, and recommendations were made for strengthening Napa’s green business sector. This information served as a reference for the Local Business and Economy section of the Community Sustainability Plan.
CITY OF NAPA SUSTAINABIL ITY SURVEY
The Sustainability Survey was an important information source for the Community Plan, and a key aspect of the community outreach process. The survey was available online in English and Spanish for nearly five weeks, and in that time nearly 400 responses were received.
Below is an overview of survey findings, and each section of the Community Plan also contains survey questions germane to that particular topic. See Appendix C, “City of Napa Sustainability Survey Summary Findings” for summary findings of the survey.
The first survey question revealed the following beliefs about sustainability:
29
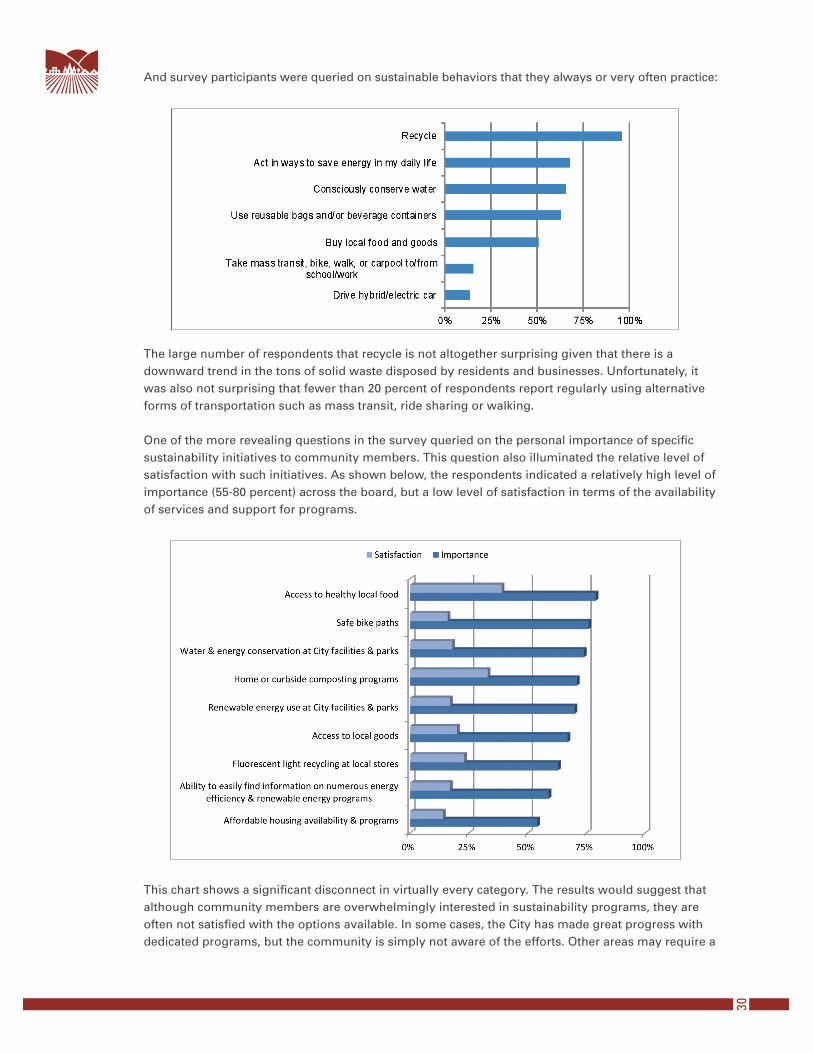
And survey participants were queried on sustainable behaviors that they always or very often practice:
The large number of respondents that recycle is not altogether surprising given that there is a downward trend in the tons of solid waste disposed by residents and businesses. Unfortunately, it was also not surprising that fewer than 20 percent of respondents report regularly using alternative forms of transportation such as mass transit, ride sharing or walking.
One of the more revealing questions in the survey queried on the personal importance of specific sustainability initiatives to community members. This question also illuminated the relative level of satisfaction with such initiatives. As shown below, the respondents indicated a relatively high level of importance (55-80 percent) across the board, but a low level of satisfaction in terms of the availability of services and support for programs.
This chart shows a significant disconnect in virtually every category. The results would suggest that although community members are overwhelmingly interested in sustainability programs, they are often not satisfied with the options available. In some cases, the City has made great progress with dedicated programs, but the community is simply not aware of the efforts. Other areas may require a
30
concerted effort and development of new programs or improvement of existing programs.
IMPLEMENTAT ION AND MONITORING
Over the course of creating the Community Plan, initiatives were proposed, vetted, and evaluated for their economic, environmental, and social equity benefits. A narrative explanation of these initiatives is included in each section of the Community Plan, along with contextual information, relevant legislation, survey results, and existing efforts. To assist with the implementation process, a decision-making framework is included as Appendix B, “Community Plan Initiatives.” Appendix B complements the Community Sustainability Plan and provides initial analysis that would likely be considered before the City or community groups would move forward on an initiative.
31
CONTEXT
Energy consumed in residential, commercial, and industrial buildings accounted for 39 percent of Napa’s total GHG emissions in 2005. While this is a significant portion of Napa’s overall emissions, reducing energy in new and existing buildings is one of the most cost-effective strategies for lowering GHGs, because the cost of upgrades and retrofits can be offset by energy savings realized over time.
To reduce energy consumption in existing buildings, programs have been developed by PG&E, the City of Napa, state agencies, the federal government, and other entities that offer rebates and incentives on energy efficient products, home energy audits, and energy-saving measures. Although there is not yet widespread community adoption of these programs, as energy prices rise, homeowners and business owners may recognize opportunities to save energy and money by taking advantage of these programs.
There are also a number of policies aimed at reducing energy consumption. The California Green Building Code (“CALGreen”) serves as the basis for the design and construction of buildings in California. Title 24 is the section of CALGreen focused on energy efficiency standards for residential and nonresidential buildings. To achieve even greater energy savings, the City of Napa adopted a High Performance Building Ordinance (HPBO) that goes beyond CALGreen and requires projects to achieve at least 15 percent greater efficiency than Title 24.
AB 1103 is the Commercial Building Energy Use Disclosure Program that requires nonresidential building owners or operators to disclose U.S. Environmental Protection Agency Energy Star Portfolio Manager benchmarking data and ratings for the most recent 12-month period to a prospective buyer, lessee, or lender. Initial compliance will begin on January 1, 2013 for commercial buildings over 50,000 square feet and will phase in to smaller buildings over several years.
By 2020, California utilities will be required to generate 33 percent of their electricity supply from renewable sources due to the passage of SB 2X. California’s electricity is currently sourced from approximately 25 percent renewable sources including hydroelectric, solar and wind. SB 2X is expected to spur investment and create green jobs in the renewable energy sector.
SB 843, also known as the Wolk bill, or the Community-Based Renewable Energy Self-Generation Program, authorizes a retail energy customer to purchase a subscription in a community facility for the purpose of receiving a bill credit to offset all or a portion of their electricity usage. Common examples are community solar gardens that allow non-property owners (tenants) to buy shares in a nearby solar plant to receive the benefits of solar energy without installing panels on their own roof.
AB 758 is pending legislation aimed at energy efficiency in existing buildings. The legislation is planned to develop over three distinct and overlapping phases and should come into effect by 2014.
CITY OF NAPA SUSTAINABIL ITY SURVEY
In the Energy section of the survey, respondents’ awareness of incentive and rebate programs scored a relatively high 69 percent. While awareness does not always lead to adoption of energy efficient practices or technologies in the community at large, the results among survey respondents were promising and indicated that a majority of respondents have invested in energy conservation
SECT ION 2 - COMMUNITY SUSTAINAB I L I TY P LAN
ENERGY
32
upgrades such as fixtures or appliances for their home or business; only 16 percent indicated that they had not invested anything.
The primary reasons for investing were cited as follows:
Help the environment by using less of a finite resource (48 percent)•
Save money on PG&E bills (30 percent)•
The number one reason for not investing in energy efficient upgrades was that the respondents were renters. Almost half of the respondents showed interest in educational programs and workshops on available incentives and rebates, and there was also support for courses teaching do-it-yourself and low cost upgrades.
EX IST ING EFFORTS
There are many organizations whose work supports reduced energy consumption. Among the most active are those listed below:
Energy Savings Assistance Program (ESAP) is a partnership of California Human • Development, PG&E, and SNC, to reduce electricity and gas consumption by providing income-qualified customers with free energy education, weatherization measures, and in some instances, energy-efficient appliances.
Energy Upgrade California (EUC)™ is a partnership among California jurisdictions and the • state’s investor-owned utilities (including PG&E). Since the program is funded in-part by the American Recovery and Reinvestment Act, it is set to expire in 2012. Up to $4,000 in energy efficiency rebates per household can be subsidized by EUC, and the EUC website has a comprehensive list of available incentives and rebates, including those offered by PG&E, or local, state, or federal government agencies.
PG&E has a number of tools on its website to help consumers, such as how to read their • energy bill, and how to use a smart meter. Customers with an electric SmartMeter™ and a My Energy account can track their energy use by month, day, or hour, and receive alerts when their electricity bill is moving towards a higher-cost tier.
SNC is the provider for PG&E’s Local Government Partnership (LGP) program, called • Napa County Energy Watch (NCEW). Through NCEW, municipal governments, nonprofit organizations, small commercial, and certain residential customers are provided with assistance to help change behavior, build capacity, and ultimately, lower electricity bills.
The state Department of Community Services & Development administers the federally • funded Low-Income Home Energy Assistance Program (LIHEAP) that provides low-income households with energy bill payment assistance, free weatherization and minor home repair services, and energy efficiency upgrades. Sustainable Napa County (SNC) and Puertas Abiertas provide local outreach about this program.
FUTURE PLANS AND RECOMMENDED ACT IONS
Based on the survey results and information shared during stakeholder discussions, the following goal was created for Energy in Napa:
Napa is a model for energy awareness, conservation, and integrated systems
33
Following are initiatives that are planned for implementation or were recommended for consideration to move Napa towards meeting the stated objective. Please see Appendix B for a decision-making framework that lists each recommended action and the corresponding responsible parties, requirements for implementation, and three indicators: the relative term (short, medium, long); level of effort (low, medium, high); and funding (low, medium, high) required to achieve the initiative.
CEC1. Educate homeowners and businesses on affordable energy conservation techniquesMany energy conservation methods can be accomplished with little or no investment, i.e. duct work leaks, attic insulation, lighting retrofits, and eliminating phantom loads. Education could be provided via workshops or other means, and outreach channels could include community leaders, the real estate community, schools, churches, scouts, youth groups, and/or neighborhood associations.
CEC2. Create energy audit program for residents and businesses Energy audits are an important first step in understanding how a home or business is consuming energy, and to identify opportunities to use less energy. Trained and certified local contractors are available to provide professional energy audits and by establishing a formal program, clients could be connected with these contractors, helping homeowners and businesses save money, and providing additional work to contractors. Volunteers or students may also be able to assist contractors and learn hands-on lessons about energy.
CEC3. Hold an “Energy Day” event An energy day event could provide a unique learning venue for participants to attend sessions and learn about topics such as do-it-yourself energy conservation ideas, the various rebates and incentives available, steps to take before considering the installation of renewable energy or electric vehicle charging stations, and an opportunity to meet with local vendors and contractors that provide energy-related services and products.
CEC4. Encourage local schools to incorporate energy education in the classroomLocally, the Environmental Education Coalition of Napa County (EECNC) provides resources to educators and is an excellent model for incorporating environmental issues into the classroom. While some Napa schools already address energy, by expanding both the number of schools that incorporate energy education, and the depth of the energy education provided, Napa’s schoolchildren will learn important lessons that will benefit their families and the community for years to come.
CEC5. Provide trainings on benchmarking facilities Benchmarking facilities enables building operators to analyze energy trends over time and spot anomalies. By encouraging building operators to utilize benchmarking, they will have one more tool available to reduce energy usage, and consequently, reduce greenhouse gas emissions. Businesses could be connected with interns and graduate students who can perform benchmarking services.
CEC6. Connect homeowners and businesses for bulk purchasing power of renewable energyOne of the tools available to homeowners and businesses interested in installing renewable energy is to utilize bulk purchasing for better prices. There are Bay Area businesses that provide this service, or Solarize Portland could be studied as a model program. Neighborhood associations or other active community groups could be potential organizers of this program.
CEC7. Promote existing energy conservation programsThere are many programs that promote energy conservation in California, but there is a general lack of awareness about the programs. Though it does not always translate to action, awareness of energy conservation programs is an important first step. Community groups like Sustainable Napa County provide education about the available programs, and serve as a resource connecting
34
homeowners, small businesses, and existing programs.
CEC8. Research Energy Disclosure Ordinances passed in other citiesSimilar to the disclosure of fuel efficiency in vehicles, some local governments require property owners to disclose a facility’s energy use at the time of sale. It is recommended that City staff research energy disclosure ordinances adopted by other cities and analyze the pros and cons, and the time required to implement and manage an energy disclosure ordinance.
CEC9. Investigate the viability of a local commercial Property Assessed Clean Energy (PACE) programPACE is a financing mechanism that allows property owners to pay for certain energy efficiency and renewable energy investments over time via their property tax bill. While most residential PACE programs are on-hold due to push back from the Federal Housing Finance Agency (FHFA), many local governments are successfully launching commercial PACE programs. It is recommended that the City of Napa collaborate with Napa County to determine if a local commercial PACE program is feasible.
35
CONTEXT
A healthy mobility and transportation system connects people to communities and helps determine where people live, work and thrive. In 2005, 49 percent of Napa’s GHG emissions were attributable to transportation, and to reduce these emissions, mobility modes like transit, walking, or cycling will need to become more common, with a parallel decreasing dependence on single-occupancy vehicles.
The Napa County Transportation & Planning Agency (NCTPA) operates Napa’s bus system (the VINE) and oversees the planning and funding of paratransit (transportation for special needs and disabled riders), highway maintenance and improvement, streets and roads, and bicycle transit. The City of Napa plays a key role in mobility and transportation by providing and maintaining safe roads, sidewalks, and biking infrastructure that links neighborhoods to destinations.
As oil prices continue to rise, mobility and transportation will become an increasingly important topic, affecting commuters and generating negative economic impacts on the community. Additionally, as the fuel efficiency of vehicles improves and more consumers purchase hybrid or electric vehicles to offset higher prices at the pump, communities will be challenged by the loss of gas taxes that currently fund road repair.
While facing these challenges, municipalities are concurrently complying with state legislation. Since the majority of California’s GHG emissions stem from transportation, the legislature passed the Sustainable Communities and Climate Protection Act of 2008 (“SB 375”) to align regional transportation planning efforts, GHG reduction targets, and housing allocations. Please see page 3 in the Introduction section for a more thorough description of SB 375.
Legislation that supports the walk-able community goal of SB 375 includes AB 1475, which established Safe Routes to Schools, and the 2011 amendment, AB 516. Safe Routes to Schools is a grant program for the construction of bicycle and pedestrian safety and traffic calming projects. The 2011 amendment specified a required public participation process to identify community priorities and secure support from relevant community stakeholders.
CITY OF NAPA SUSTAINABIL ITY SURVEY
The survey’s mobility and transportation questions focused on the commute patterns of Napa residents, and key findings include:
18 percent live within a mile of their primary commute location, 43 percent within 1-5 miles•
11 percent carpool, vanpool, take public transportation, or bike, 5-7 times per week•
50 percent would consider biking if it was convenient•
33 percent would consider taking public transportation if it was more convenient•
29 percent would consider carpooling•
30 percent would consider walking•
32 percent would enjoy more flexible and supportive telecommuting options•
36
SECT ION 2 - COMMUNITY SUSTAINAB I L I TY P LAN
MOBIL ITY & TRANSPORTAT ION
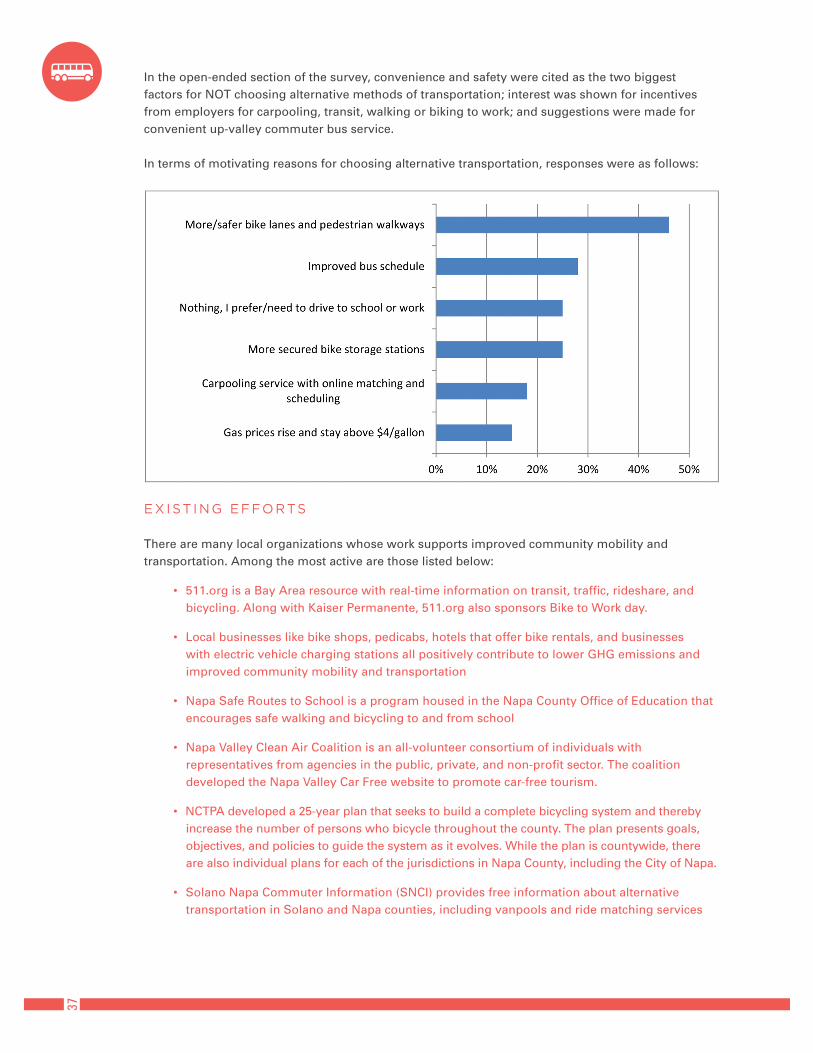
In the open-ended section of the survey, convenience and safety were cited as the two biggest factors for NOT choosing alternative methods of transportation; interest was shown for incentives from employers for carpooling, transit, walking or biking to work; and suggestions were made for convenient up-valley commuter bus service.
In terms of motivating reasons for choosing alternative transportation, responses were as follows:
E X IST ING EFFORTS
There are many local organizations whose work supports improved community mobility and transportation. Among the most active are those listed below:
511.org is a Bay Area resource with real-time information on transit, traffic, rideshare, and • bicycling. Along with Kaiser Permanente, 511.org also sponsors Bike to Work day.
Local businesses like bike shops, pedicabs, hotels that offer bike rentals, and businesses • with electric vehicle charging stations all positively contribute to lower GHG emissions and improved community mobility and transportation
Napa Safe Routes to School is a program housed in the Napa County Office of Education that • encourages safe walking and bicycling to and from school
Napa Valley Clean Air Coalition is an all-volunteer consortium of individuals with • representatives from agencies in the public, private, and non-profit sector. The coalition developed the Napa Valley Car Free website to promote car-free tourism.
NCTPA developed a 25-year plan that seeks to build a complete bicycling system and thereby • increase the number of persons who bicycle throughout the county. The plan presents goals, objectives, and policies to guide the system as it evolves. While the plan is countywide, there are also individual plans for each of the jurisdictions in Napa County, including the City of Napa.
Solano Napa Commuter Information (SNCI) provides free information about alternative • transportation in Solano and Napa counties, including vanpools and ride matching services
37
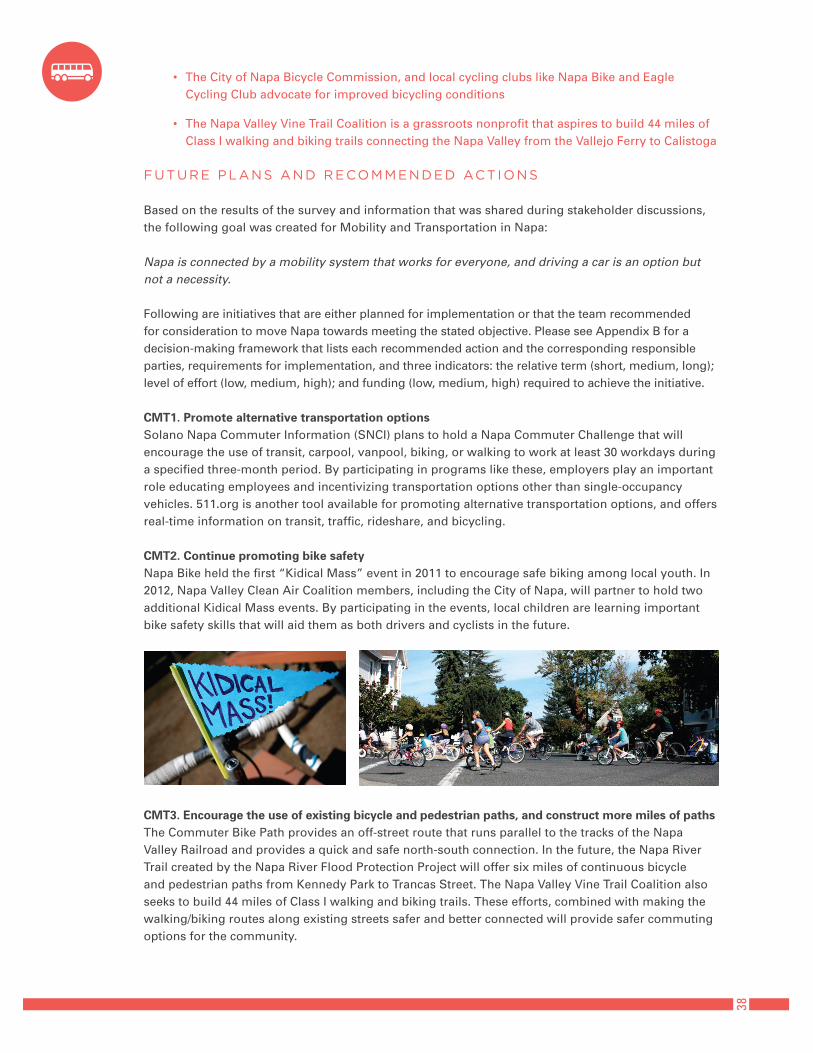
The City of Napa Bicycle Commission, and local cycling clubs like Napa Bike and Eagle • Cycling Club advocate for improved bicycling conditions
The Napa Valley Vine Trail Coalition is a grassroots nonprofit that aspires to build 44 miles of • Class I walking and biking trails connecting the Napa Valley from the Vallejo Ferry to Calistoga
FUTURE PLANS AND RECOMMENDED ACT IONS
Based on the results of the survey and information that was shared during stakeholder discussions, the following goal was created for Mobility and Transportation in Napa:
Napa is connected by a mobility system that works for everyone, and driving a car is an option but not a necessity.
Following are initiatives that are either planned for implementation or that the team recommended for consideration to move Napa towards meeting the stated objective. Please see Appendix B for a decision-making framework that lists each recommended action and the corresponding responsible parties, requirements for implementation, and three indicators: the relative term (short, medium, long); level of effort (low, medium, high); and funding (low, medium, high) required to achieve the initiative.
CMT1. Promote alternative transportation optionsSolano Napa Commuter Information (SNCI) plans to hold a Napa Commuter Challenge that will encourage the use of transit, carpool, vanpool, biking, or walking to work at least 30 workdays during a specified three-month period. By participating in programs like these, employers play an important role educating employees and incentivizing transportation options other than single-occupancy vehicles. 511.org is another tool available for promoting alternative transportation options, and offers real-time information on transit, traffic, rideshare, and bicycling.
CMT2. Continue promoting bike safetyNapa Bike held the first “Kidical Mass” event in 2011 to encourage safe biking among local youth. In 2012, Napa Valley Clean Air Coalition members, including the City of Napa, will partner to hold two additional Kidical Mass events. By participating in the events, local children are learning important bike safety skills that will aid them as both drivers and cyclists in the future.
CMT3. Encourage the use of existing bicycle and pedestrian paths, and construct more miles of pathsThe Commuter Bike Path provides an off-street route that runs parallel to the tracks of the Napa Valley Railroad and provides a quick and safe north-south connection. In the future, the Napa River Trail created by the Napa River Flood Protection Project will offer six miles of continuous bicycle and pedestrian paths from Kennedy Park to Trancas Street. The Napa Valley Vine Trail Coalition also seeks to build 44 miles of Class I walking and biking trails. These efforts, combined with making the walking/biking routes along existing streets safer and better connected will provide safer commuting options for the community.
38
CMT4. Remove barriers and provide incentives for an improved mobility and transportation systemEncouraging behavior change often starts with the removal of barriers. For mobility and transportation, these barriers may include adequate bike storage, availability of showers, and convenient electric vehicle charging infrastructure. Potential solutions include installing bike cages in parking garages for greater security, installing bike lockers that can be reserved in advance online, and creating an app to easily locate empty bike racks.
CMT5. Support NCTPA planned overhaul of the transit systemTransit service in Napa is coordinated by the NCTPA, and the primary transit offering is the region’s fixed route bus system, The Vine. In 2012, the Vine will be substantially overhauled and will switch to a “hub and spoke” system that will make it easier to plan trips, connections and transfers. The community could show their support of the investment in transit by taking the bus as individuals, or as part of a coordinated campaign.
CMT6. Examine how City policies can encourage bicyclingIt is recommended that when a project is reviewed for a permit, City staff consider how the Bicycle Plan is incorporated and if adequate bike parking is available. It was also suggested that the City review processes to receive a permit to build bike racks and remove any potential barriers.
CMT7. Consider applying the complete streets requirements for state-funded projects to City projectsCity staff will examine the feasibility of adopting the State requirements for City purposes.
CMT8. Encourage a safe and connected system of bike and walking pathsThe City is encouraged to consider adopting policies that would require new subdivisions to be connected with existing pedestrian and bike paths. Better signage is also recommended for transitions from one type of bike way to another, both in developments and system-wide.
CMT9. Examine City policies regarding residential electric vehicle charging infrastructure and support the development of CNG stationsTo promote the use of alternative transportation, the City should examine its policies regarding the installation of residential electric vehicle charging infrastructure and remove barriers. CNG is another option that may be more widely adopted if more fueling options are available.
CMT10. Support a well-utilized bus system that works for allThe City is encouraged to coordinate with NCTPA on regional planning to link people with their jobs, schools, homes, and cultural activities. The Napa Chamber of Commerce could be another effective partner.
39
CONTEXT
Since successful waste reduction and recycling programs are dependent upon the implementation of City policies as well as the community’s adoption of programs, the Recycling & Waste Reduction sections of the City Plan and Community Plan are more interlinked than other sections.
The City of Napa’s Materials Diversion Division (MDD) provides the infrastructure and support that has earned Napa one of the highest diversion rates in the country. A diversion rate is the percentage of waste materials that are diverted from a landfill and are recycled, composted, or re-used instead, and in 2011, 57 percent of waste materials were diverted from the landfill through recycling, composting, or re-use. This has been achieved through the adoption and implementation of programs such as yard waste composting, carpet recycling, electronics recycling, and a Construction Demolition and Debris Ordinance, among many others.
Achieving this high level of diversion has put the City and community within reach of eventually becoming a zero waste community. Zero Waste is commonly thought of as a visionary goal where at least 90 percent of waste is diverted and composting is required. The MDD is aware of the steps that would need to be taken to achieve zero waste status, and many of these initiatives are included in the “Future Plans and Recommended Actions” heading of this section.
In addition to implementing new programs and handling the daily operations of the City’s Materials Diversion Facility, the MDD also maintains compliance with state legislation including the California Integrated Waste Management Act of 1989 (“AB 939”), which requires the City to prepare, adopt, and implement source reduction and recycling plans and programs to reach a goal of at least 50 percent landfill diversion. At a statewide level, AB 341 builds upon the foundation of AB 939 to set a statewide goal that 75 percent of waste is diverted from landfill disposal by the year 2020. To reach this goal, the City’s MDD is considering a “Disposal Reduction Policy” or “DPR” that would align the City’s goal with the statewide 75 percent goal. Among the practical programs that would get help the City achieve 75 percent or greater landfill diversion are the expansion of the current food composting pilot program, and increased source separation and landfill diversion requirements in the City’s Construction and Demolition Debris Recycling Ordinance.
To simplify and build upon AB 939, SB 1016 was adopted to change the requirement to a disposal-based per capita indicator. Napa is well-within compliance, and has a daily disposal rate of a little over 4 pounds per capita compared to the State’s minimum target of 7.3 pounds.
CITY OF NAPA SUSTAINABIL ITY SURVEY
The solid waste and recycling programs in Napa have been largely embraced, and over 96 percent of survey respondents reported their participation in the City’s curbside recycling program.
A clear opportunity exists to reduce curbside solid waste tonnage by expanding home composting education; 53 percent of respondents indicated they do not compost on their own. Additionally, the survey asked about respondents’ level of support for expanding the current curbside composting service to include food scraps, and what they would be willing to pay for an expanded program:
81 percent would be willing to pay $.50 more per month •
69 percent would be willing to pay $1.00 more per month•
SECT ION 2 - COMMUNITY SUSTAINAB I L I TY P LAN
RECYCL ING & WASTE REDUCT ION
40
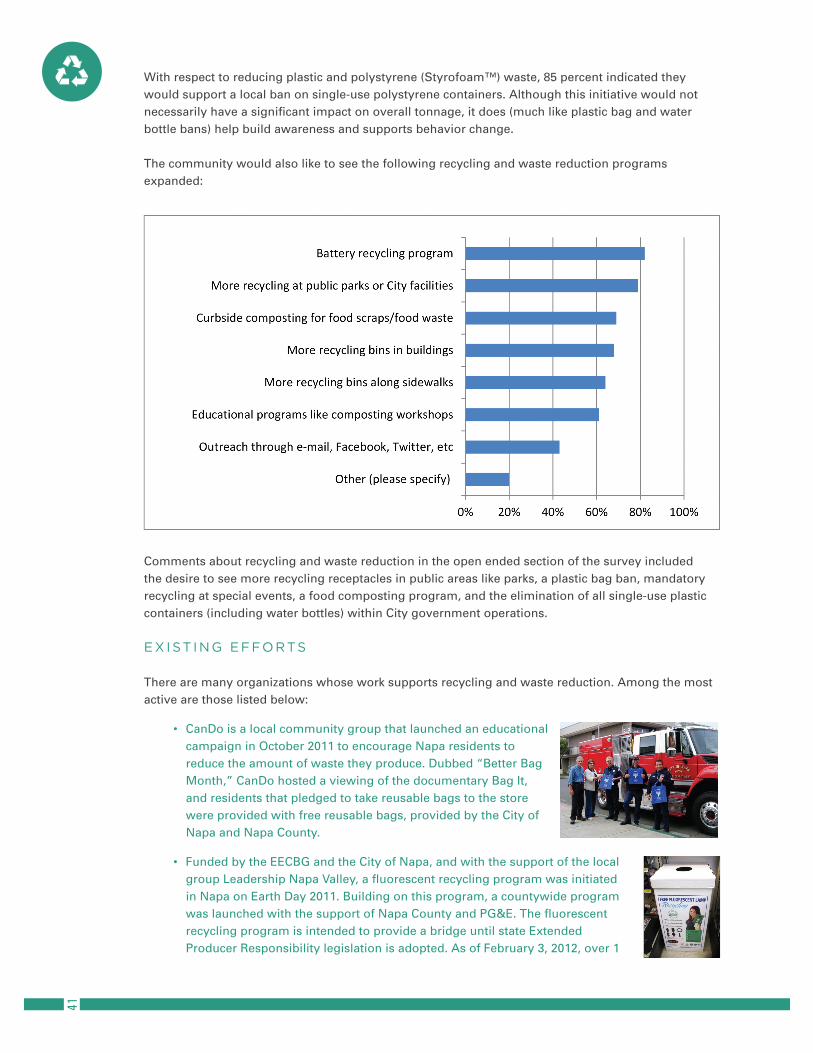
With respect to reducing plastic and polystyrene (Styrofoam™) waste, 85 percent indicated they would support a local ban on single-use polystyrene containers. Although this initiative would not necessarily have a significant impact on overall tonnage, it does (much like plastic bag and water bottle bans) help build awareness and supports behavior change.
The community would also like to see the following recycling and waste reduction programs expanded:
Comments about recycling and waste reduction in the open ended section of the survey included the desire to see more recycling receptacles in public areas like parks, a plastic bag ban, mandatory recycling at special events, a food composting program, and the elimination of all single-use plastic containers (including water bottles) within City government operations.
EX IST ING EFFORTS
There are many organizations whose work supports recycling and waste reduction. Among the most active are those listed below:
CanDo is a local community group that launched an educational • campaign in October 2011 to encourage Napa residents to reduce the amount of waste they produce. Dubbed “Better Bag Month,” CanDo hosted a viewing of the documentary Bag It, and residents that pledged to take reusable bags to the store were provided with free reusable bags, provided by the City of Napa and Napa County.
Funded by the EECBG and the City of Napa, and with the support of the local • group Leadership Napa Valley, a fluorescent recycling program was initiated in Napa on Earth Day 2011. Building on this program, a countywide program was launched with the support of Napa County and PG&E. The fluorescent recycling program is intended to provide a bridge until state Extended Producer Responsibility legislation is adopted. As of February 3, 2012, over 1
41
ton of fluorescents were collected in the City program.
With the support of the City Council, a number of programs have been instituted with the goal • of increasing the diversion rate in the community. These programs are referenced in greater detail in the Recycling & Waste Reduction section of the City Plan, and include:
Updated Solid Waste and Recycling Enclosure Standards »
Construction and Demolition Debris Recycling Ordinance »
Extended Producer Responsibility Resolution »
High Performance Building Ordinance »
Sustainable Purchasing Policy Resolution »
Special collections and recycling, including carpet, electronics, fluorescent lights, »Christmas trees, and used motor oil
Addition of blue recycling cans to downtown Napa »
The Devlin Road Reuse & Recycle Center in American Canyon (operated by Northern • Recycling Operations & Waste Services) accepts many items including furniture, office equipment, tools, clothes, and housewares and garden items, which are in-turn available to the public at no cost
FUTURE PLANS AND RECOMMENDED ACT IONS
Based on the results of the survey and information that was shared during stakeholder discussions, the following goal was created for Recycling & Waste Reduction in Napa:
Napa is a community that discourages landfill disposal of solid waste and maximizes re-use, recycling, and composting.
Following are initiatives that are either planned for implementation or that the team recommended for consideration to move Napa towards meeting the stated objective. Please see Appendix B for a decision-making framework that lists each initiative and the corresponding responsible parties, requirements for implementation, and three indicators: the relative term (short, medium, long); level of effort (low, medium, high); and funding (low, medium, high) required to achieve the initiative.
CRW1. Continue creating art projects in schools using recyclable and non-recyclable materials A group of community members uses plastic water bottles to create art projects in schools, and is exploring the use of plastic bags to create art. This type of project provides a way to re-use materials (some of which may not be recyclable) and give them a new purpose.
CRW2. Continue raising awareness about plastic bags, and consider a ban, or other use reduction alternatives, on plastic bags and polystyrene containersCanDo has made great strides educating the community about plastic bags and encouraging the use of renewable bags. Various policy solutions are available that can help reduce the number of plastic bags and polystyrene containers disposed of in the community. These policy solutions, including a ban, should be explored and examined for implementation in Napa.
CRW3. Raise awareness of educational opportunities to learn about waste reduction and recyclingThrough the City of Napa and community groups, there are educational opportunities available
42
including field trips, guest speakers, service projects, teacher education, etc.
CRW4. Expand the Special Events recycling program The special events recycling program should be examined for possible expansion to include more signage and bins and possibly a greater physical presence reminding attendees to recycle, potentially using volunteers.
CRW5. Add a food scraps curbside composting program For the community to reach a 75 percent landfill disposal diversion goal, it will be necessary to add service providing for the curbside composting of food scraps. Food waste is heavy, and contributes significantly to the overall tons of waste collected in the community. The City envisions that food scraps collected through the curbside program would be used in the Anaerobic Digester (discussed more in the following action, CRW6.)
CRW6. Build an Anaerobic Digester to convert food scraps into compressed natural gas (CNG) By installing an Anaerobic Digester, the City would have the ability to use the food waste collected from the curbside food composting program and convert it into compressed natural gas (CNG) that could then fuel the hauling trucks that pick up business and residents’ food waste, yard waste, recycling, and trash.
CRW7. Discourage single-use beverage containers and promote reusable containersSingle-use containers like plastic water bottles and paper coffee cups contribute to the overall waste stream. The community would like the City to lead by example and institute policies and practices that discourage single-use containers, and promote refillable containers in City operations. The idea of co-branding a refillable mug with Napa County was also shared.
CRW8. Increase the recycling rate for hard-to-reach customers Rental tenants, apartment buildings, and certain neighborhoods tend to have lower recycling participation rates. These groups should be targeted by the City to increase the recycling rate and provide more awareness of recycling opportunities.
CRW9. Raise community awareness about existing programs and special collections available Many special collections and programs are available including carpet, electronics, fluorescent lights, Christmas trees, and used motor oil. To improve awareness of these programs, the City will develop an enhanced communications plan.
43
CONTEXT
The Napa community has expressed an overwhelming interest in access to quality, locally grown food. A decrease in food production has occurred over the past several decades as the agricultural and economic landscape in Napa Valley has shifted to the production of wine grapes. As a result, Napa’s food production has been largely limited to family gardens. Napa Valley households want better access to local organic and healthy foods, and more local food, year round, with community gardens in each neighborhood.
Responding to these challenges, the Napa County Local Food Advisory Council (LFAC) was formed in 2010, and is the leading authority on local food. The LFAC was formed based on the Napa County General plan policy statement recognizing that “increasing local food production in Napa County and increasing local food purchases by County residents and institutions such as the jail, schools, and hospitals will contribute to greater food security, increase agricultural diversity, and create a reliable market for small scale farmers” (Policy AG/LU-19). Since the LFAC has such a strong leadership presence in Napa and continues to successfully and repeatedly engage the community on local food issues, much of the content of this section will reference LFAC successes and goals to avoid unnecessary duplication.
Also in support of the local food movement, state legislation has been introduced to allow small businesses to legally create entrepreneurial ventures around food production. AB 1616, the “cottage food law,” would exempt producers of low-risk foods like pickles, breads, fruit pies, spice blends, and herb teas from health department oversight unless a complaint is filed.
CITY OF NAPA SUSTAINABIL ITY SURVEY
While the Community Survey did not include a separate section dedicated to local food, specific questions were asked about the issues related to local food, and these questions revealed that 51 percent of respondents always or very often buy local food and goods, and that among local programs and initiatives that survey respondents were asked to rank as important, “access to healthy local food” ranked first, at 79 percent. This initiative also had the highest level of satisfaction, at 39 percent, although it should be noted that the survey was conducted during the summer months, when local farmers markets are open.
In addition to the survey conducted by the City, the Local Food Advisory Council (“LFAC”) also conducted a survey, talking to growers, market owners, restaurants, and community members. Here are some of the survey’s highlights:
GROWERS :
100 percent of growers want a yearly pre-planting meeting•
95 percent of growers want information on food safety regulations•
95 percent of growers want a distribution center in the Napa Valley•
70 percent of growers will only travel 30 miles to deliver product•
44
SECT ION 2 - COMMUNITY SUSTAINAB I L I TY P LAN
LOCAL FOOD
G ROCERS AND MARKETS :
49 percent of Market Managers purchase local product•
95 percent are interested in purchasing more local food•
85 percent of Market managers would purchase from a local distribution center, 10 percent • would purchase directly from farmers or local distribution center
85 percent of managers have packaging guidelines when buying local•
RESTAURANTEURS :
95 percent of restaurateurs purchase locally grown product•
85 percent of restaurateurs consider locally grown to be 50 miles away from Napa Valley; 15 • percent consider local up to 150 miles away
90 percent of restaurateurs have inspection guidelines•
57 percent of restaurateurs purchase organic product•
85 percent of restaurateurs indicated price was primary concern when buying local•
85 percent of restaurateurs feel buying local helps with marketing•
Based on the survey results, growers in the region would not only support but likely gain from a coordinated effort promoting local food. On the retail side, there is support for locally grown product, and it is clear that Napa restaurants have found a niche by using locally grown ingredients.
In response to the food issues facing Napa and the results of their survey, LFAC is moving forward to:
Develop a grower network to train and provide capital support to limited resource farmers•
Create infrastructure to link local farmers to local markets•
Connect for-profit and non-profit food sectors•
Develop local markets, securing local product demand for the grower•
Build community support: ensure affordable, high quality, and healthy foods reach people of • all means
Organize community projects, such as community gardens, urban gardens, student farm • projects, and farmers markets
E X IST ING EFFORTS
There are many organizations in Napa whose work is supportive of a strong local food system. Among the most active are those listed below:
Heifer International works to end hunger by encouraging people to share their animals’ • offspring with others to provide a source of food. Heifer has an active Sonoma-Napa chapter.
45
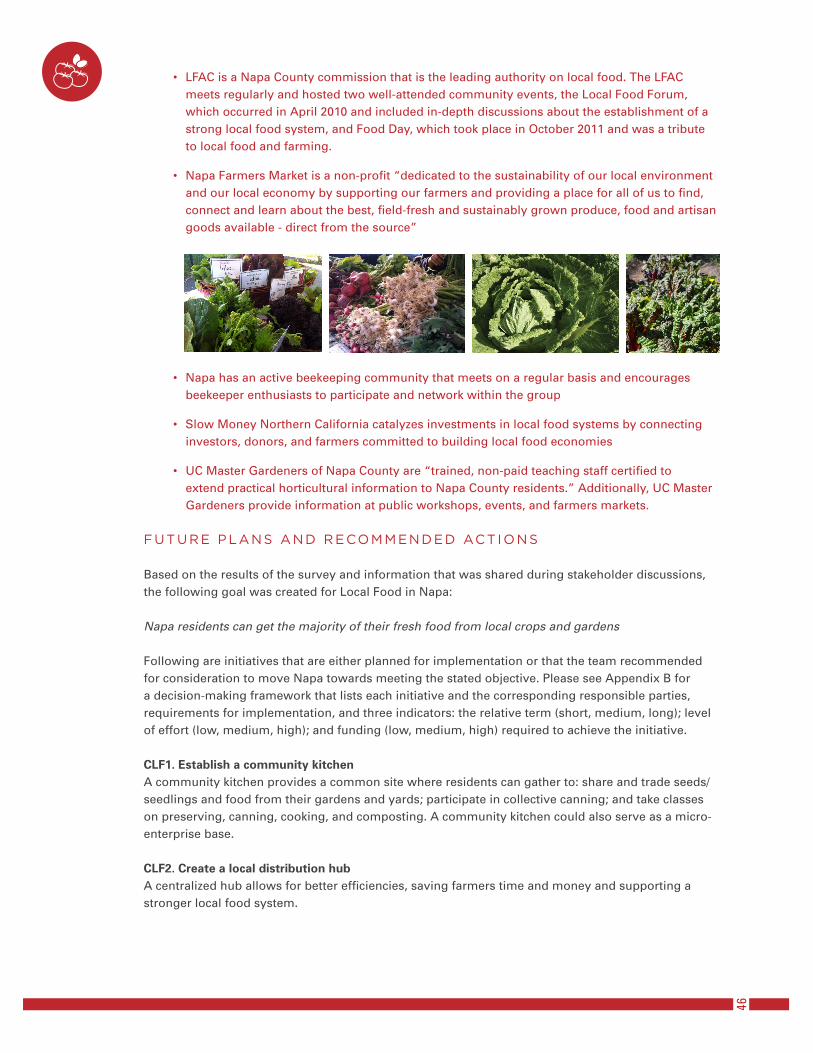
LFAC is a Napa County commission that is the leading authority on local food. The LFAC • meets regularly and hosted two well-attended community events, the Local Food Forum, which occurred in April 2010 and included in-depth discussions about the establishment of a strong local food system, and Food Day, which took place in October 2011 and was a tribute to local food and farming.
Napa Farmers Market is a non-profit “dedicated to the sustainability of our local environment • and our local economy by supporting our farmers and providing a place for all of us to find, connect and learn about the best, field-fresh and sustainably grown produce, food and artisan goods available - direct from the source”
Napa has an active beekeeping community that meets on a regular basis and encourages • beekeeper enthusiasts to participate and network within the group
Slow Money Northern California catalyzes investments in local food systems by connecting • investors, donors, and farmers committed to building local food economies
UC Master Gardeners of Napa County are “trained, non-paid teaching staff certified to • extend practical horticultural information to Napa County residents.” Additionally, UC Master Gardeners provide information at public workshops, events, and farmers markets.
FUTURE PLANS AND RECOMMENDED ACT IONS
Based on the results of the survey and information that was shared during stakeholder discussions, the following goal was created for Local Food in Napa:
Napa residents can get the majority of their fresh food from local crops and gardens
Following are initiatives that are either planned for implementation or that the team recommended for consideration to move Napa towards meeting the stated objective. Please see Appendix B for a decision-making framework that lists each initiative and the corresponding responsible parties, requirements for implementation, and three indicators: the relative term (short, medium, long); level of effort (low, medium, high); and funding (low, medium, high) required to achieve the initiative.
CLF1. Establish a community kitchen A community kitchen provides a common site where residents can gather to: share and trade seeds/seedlings and food from their gardens and yards; participate in collective canning; and take classes on preserving, canning, cooking, and composting. A community kitchen could also serve as a micro-enterprise base.
CLF2. Create a local distribution hubA centralized hub allows for better efficiencies, saving farmers time and money and supporting a stronger local food system.
46
CLF3. Provide venue & support for year-round farmers marketsThe Napa Farmers Market enjoys great community support during its operational months, May through October. There is interest in extending the farmers market so that it is operational 12 months of the year, providing greater access to local food. Having a local distribution hub would make this more feasible.
CLF4. Year-round gardening classes and understanding eating appropriately for the time of yearTo better understand the local climate and what can be grown during the winter months, classes could be taught about how to garden for winter months. Grocery stores and markets could also provide education about which produce is in season during the winter.
CLF5. Initiate a local yard-sharing programYard sharing provides residents without green space an opportunity to garden. It works when a homeowner with a yard is willing to host a garden, and connects with someone who is looking for a place to have a garden.
CLF6. Raise awareness of LFAC’s “Local Food Policies Frequently Asked Questions” documentLFAC’s “Local Food Policies Frequently Asked Questions” document is a great starting point for community members with questions about local food regulations, and a helpful tool for the City to understand what policy barriers may exist. City staff can review this document and make policy recommendations as appropriate to encourage a strong local food system. Particular interest has been expressed regarding streamlining for community gardens in school and neighborhoods, beekeeping, and chickens.
CLF7. Plant a community garden, instead of a lawn, in front of one of the City facilitiesPlanting a community garden in front of a City facility with access to water and adequate sunlight would visibly demonstrate the City’s commitment and support of local food.
ICLF8. Identify unused plots that can be converted to gardensCommunity gardens support the local food system and provide an opportunity for community members to come together for a common purpose. Neighborhood associations and multi-family buildings that don’t have green space could be approached for their interest in participating in a pilot project. City staff could provide support by analyzing policies and providing guidance regarding vacant plots and land owners that may be agreeable to hosting a community garden.
CLF9. Incorporate best practices like composting and drip irrigation into community gardens.The City offers composting classes, and these classes could be cross-promoted with gardening groups and organizations that have community gardens. Drip irrigation and other water-wise best practices could also be taught.
47
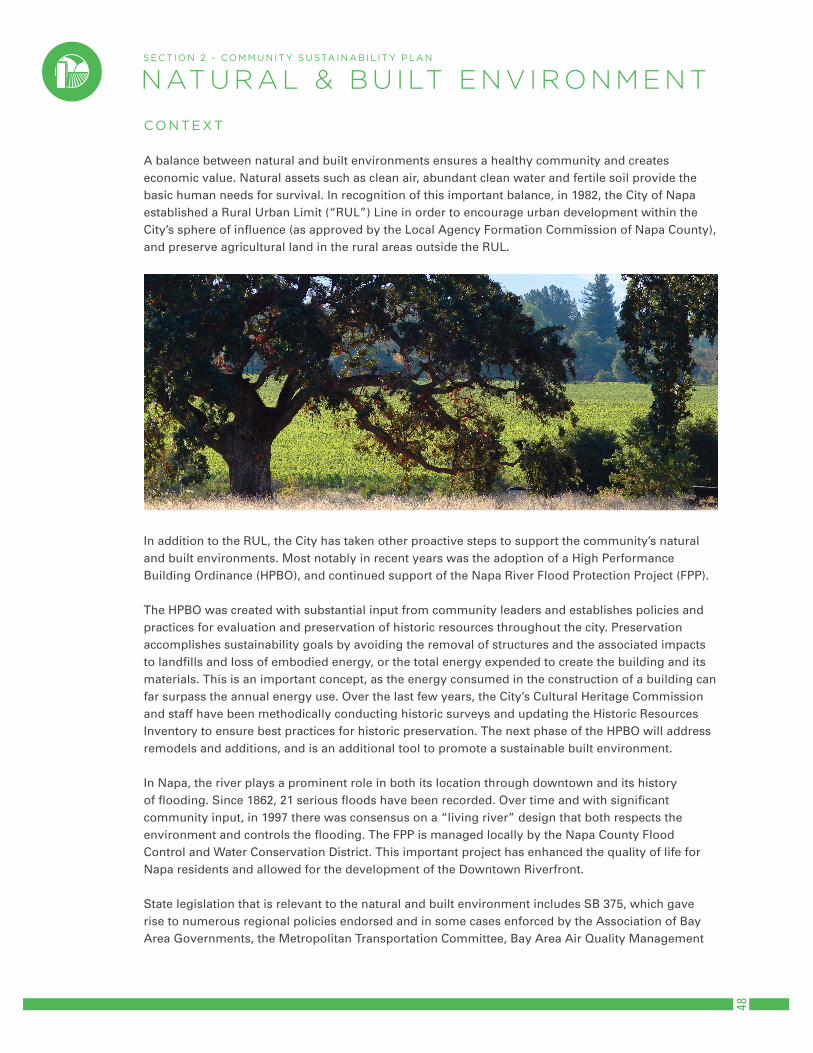
48
CONTEXT
A balance between natural and built environments ensures a healthy community and creates economic value. Natural assets such as clean air, abundant clean water and fertile soil provide the basic human needs for survival. In recognition of this important balance, in 1982, the City of Napa established a Rural Urban Limit (“RUL”) Line in order to encourage urban development within the City’s sphere of influence (as approved by the Local Agency Formation Commission of Napa County), and preserve agricultural land in the rural areas outside the RUL.
In addition to the RUL, the City has taken other proactive steps to support the community’s natural and built environments. Most notably in recent years was the adoption of a High Performance Building Ordinance (HPBO), and continued support of the Napa River Flood Protection Project (FPP).
The HPBO was created with substantial input from community leaders and establishes policies and practices for evaluation and preservation of historic resources throughout the city. Preservation accomplishes sustainability goals by avoiding the removal of structures and the associated impacts to landfills and loss of embodied energy, or the total energy expended to create the building and its materials. This is an important concept, as the energy consumed in the construction of a building can far surpass the annual energy use. Over the last few years, the City’s Cultural Heritage Commission and staff have been methodically conducting historic surveys and updating the Historic Resources Inventory to ensure best practices for historic preservation. The next phase of the HPBO will address remodels and additions, and is an additional tool to promote a sustainable built environment.
In Napa, the river plays a prominent role in both its location through downtown and its history of flooding. Since 1862, 21 serious floods have been recorded. Over time and with significant community input, in 1997 there was consensus on a “living river” design that both respects the environment and controls the flooding. The FPP is managed locally by the Napa County Flood Control and Water Conservation District. This important project has enhanced the quality of life for Napa residents and allowed for the development of the Downtown Riverfront.
State legislation that is relevant to the natural and built environment includes SB 375, which gave rise to numerous regional policies endorsed and in some cases enforced by the Association of Bay Area Governments, the Metropolitan Transportation Committee, Bay Area Air Quality Management
SECT ION 2 - COMMUNITY SUSTAINAB I L I TY P LAN
NATURAL & BU ILT ENV IRONMENT
District and the Bay Conservation and Development Commission. The agencies’ current initiatives are focused growth, climate protection consistent with the California Environmental Qualities Act and AB 32 and development of a sustainable communities strategy.
CITY OF NAPA SUSTAINABIL ITY SURVEY
The survey reflected that there are opportunities for more education about tap water, the relationship between water use and energy use, and resources for water conservation. Among the findings was that 24 percent of survey respondents (which represents less than 1 percent of all city of Napa residents) do not drink the City’s tap water. A host of reasons were cited; most centered on the perception that the water is not safe to drink, is discolored, too chlorinated or tastes bad. While City tap water consistently meets all federal and state health standards, a new ozone treatment system should help address remaining taste and odor concerns.
Another interesting finding was that over half of respondents do not understand the connection between energy use and water conservation. For the City government operations, water pumping, filtration and delivery was the largest user of energy. Education about how water conservation contributes to energy conservation and ultimately lowers GHG emissions will be important as Napa begins adopting emissions reduction strategies.
Lastly, while the City has a number of water conservation devices and programs available to residents (discussed in greater detail in the Water section of the City Plan), only 58 percent of respondents were aware of where to find these local resources that can help them save water. Survey questions also revealed that:
73 percent of respondents regularly enjoy Napa’s outdoor environment • (rivers, parks, gardens)
75 percent of respondents had a positive feeling about high density housing, although of that • number, only 23 percent indicated that they would or do live in multi-family housing
14 percent do not feel that high density housing fits in the community•
E X IST ING EFFORTS
There are many organizations in Napa whose work is supportive of a sustainable natural and built environment. Among the most active are those listed below:
California Native Plant Society (CNPS) Napa Valley Chapter “is a statewide non-profit • organization of amateurs and professionals with a common interest in California’s native plants” that “seeks to increase understanding of California’s native flora and to preserve this rich resource for future generations”
Friends of the Napa River is “the community’s voice for the responsible protection, • restoration, development and celebration of the Napa River and its watershed”
Land Trust of Napa County’s mission is “preserving the character of Napa County by • permanently protecting land”
Napa County Flood Control and Water Conservation District’s mission is “the conservation • and management of flood and storm waters to protect life and property; the maintenance of the County watershed using the highest level of environmentally sound practices; and to provide coordinated planning for water supply needs for the community”
49
The mission of Napa County Landmarks is “to protect and preserve a living record of the past • for the enjoyment and appreciation of future generation”
Napa County Resource Conservation District (RCD) is a legal subdivision of the state of • California that has a mission “to promote responsible watershed management through voluntary community stewardship and technical assistance”
Preservation Napa Valley seeks “to be the most innovative, responsive and effective historic • preservation advocacy group around”
The Napa County Farm Bureau’s mission is “to ensure the proper political, social, and economic • climate for the continuation of a strong, viable, and sustainable agricultural economy”
U.S. Green Building Council (USGBC) Redwood Empire Chapter is active in Napa and has the • mission “to promote the design, construction and operation of buildings in Marin, Sonoma, Napa, Mendocino, Lake, Humboldt and Del Norte Counties that are environmentally responsible, profitable and healthy places to live, work and learn”
FUTURE PLANS AND RECOMMENDED ACT IONS
Based on the results of the survey and information that was shared during stakeholder discussions, the following goal was created for the Natural & Built Environment in Napa:
Napa’s planning and development enhances the functions of natural systems to support a vibrant, healthy community, new economic value, and reduced greenhouse gases
Following are initiatives that are either planned for implementation or that the team recommended for consideration to move Napa towards meeting the stated objective. Please see Appendix B for a decision-making framework that lists each initiative and the corresponding responsible parties, requirements for implementation, and three indicators: the relative term (short, medium, long); level of effort (low, medium, high); and funding (low, medium, high) required to achieve the initiative.
CNB1. Organize a tour of local green homes and businesses Organizing a local green home and business tour can provide an opportunity to teach first-hand about practical steps that can be taken to achieve a greener home or building. The tour could showcase different examples of how best practices can be applied, such as a home that is very energy efficient, a business that practices great water conservation, a business with zero waste, or a school with an established community garden.
CNB2. Support the health of the Napa RiverCoordinate with Friends of the River, Napa County, the Farm Bureau, Napa Valley Grape Growers, and other up-valley entities to implement policies that protect the river. Policies for consideration may include upstream fertilizer reduction, water diversion control, and stream bank erosion mitigation. Other actions could be taken outside of the policy realm, such as encouraging community participation in the Coastal Cleanup sponsored by the Napa Resource Conservation District to pick up trash along the river banks.
CNB3. Educate on the importance of open space ecosystem services Many of the characteristics of open space provide importance ecosystem services, e.g. healthy soil provides water filtration, and trees help with carbon sequestration. By providing education about the importance of these types of relationships, the community will have enhanced awareness about the benefits of open space.
50
CNB4. Hold a design contest inviting high school students and others to share their vision of Napa at its greenest and most thriving futureEncouraging students to participate in a contest invites them into the public dialogue about Napa’s future and to share a perspective that may not otherwise be considered. CNB5. Develop a community tree mapA community tree map is an inventory that lists the location and types of trees found in a community. By developing an online community tree map, the City, community groups, and residents could partner on this initiative, as each group would be able to add trees to the map. Some tree map websites also provide information about the environmental benefits of trees, for example the air quality benefits, and greenhouse gas benefits. Tree map data assists City staff as they plan for the addition of more trees and manage the current tree stock.
CNB6. Transform blight through in-fill development or adaptive re-useDevelop policies that encourage in-fill, restoration, and adaptive re-use in blighted (including environmentally blighted) spaces. As a part of this transformation, invasive species could also be removed and replanted with native plants.
CNB7. Mitigate the urban heat island effectHeat islands occur when built up areas are hotter than nearby rural areas. The impacts of heat islands can include an increased energy demand, and the resulting air pollution and greenhouse gas emissions. The City should examine taking steps that could mitigate the heat island effect, including the use of permeable surfaces, and the addition of native/drought-resistant plants to medians.
CNB8. Investigate more specific open space requirementsTo maintain a balance between density and open space, more specific open space requirements should be examined. For example, the definition of a park could be re-defined as it relates to the General Plan requirement to have a certain number of parks per capita. Under a new definition, the City-owned parks could be shared use, and open space in the evenings. The incorporation of new urbanism and smart growth concepts should be analyzed as a part of this overhaul.
CNB9. Distribute information about water saving practices and technologiesThe City provides education about water conservation practices and has a number of programs (e.g. Cash for Grass, toilet replacement program, etc.) that are discussed in more detail in the Water section of the City Plan. As a part of this education, homeowner education about stormwater runoff should also be included.
CNB10. Provide better access to the Napa RiverImproving the community’s access to the river provides better opportunities for recreational use and a greater appreciation for the river. The City was managing a process to build a boat dock, but this process was sidetracked due to the statewide elimination of redevelopment agencies. The City will continue to explore options to improve access to the Napa River. Also, the Downtown Specific Plan considers three locations for docks, including a boat dock at Fourth Street and two smaller launches at Division Street and in the Oxbow area.
CNB11. Improve communication between the City and the community about tree removal Enhancing communication between the City and the community about tree removal will help alleviate confusion about which City entities determine when trees are removed, under what circumstances the City can stop trees from being removed, and which trees types are recommended for inclusion on the Master Street Tree List.
51
52
CONTEXT
Sustainable economic development for local business is functionally where all of Napa’s sustainability initiatives come together to support the City’s vision of creating a prosperous, thriving community. Sustainable economic development tactics can be adopted that integrate economic, environmental, and social equity goals, and address economic development from a multi-dimensional perspective. Sustainable economic development is a long-term commitment that requires significant planning, explicit community vision, and regional collaboration between public agencies and private enterprise.
Strategies to achieve sustainable economic development include leveraging and supporting existing businesses to provide opportunities for the local workforce, and placing business retention and community needs at the forefront. A secondary consideration, business attraction, is important for harnessing opportunities in the new, less carbon-intensive economy. Napa’s location, weather and amenities make it ideally situated to attract innovative capital-light cleantech businesses that provide information technology solutions for managing resource efficiency challenges.
A significant challenge for California municipalities is the passage of AB 26, which effectively dissolved redevelopment agencies as of February 1, 2012. Terminating redevelopment essentially eliminated tax increment financing, a key source of leveraged revenue funds for economic development and infrastructure projects. The elimination of redevelopment will require the City to be more creative in funding infrastructure projects and business programs, and in structuring public-private partnerships for development.
CITY OF NAPA SUSTAINABIL ITY SURVEY
While the survey did not include many questions focused on local business and economy, 51 percent of respondents reported that they always or very often buy local food and goods.
An additional information source was the document “Napa County’s Emerging Green Economy,” created by the Napa County Workforce Investment Board to provide analysis about the green economy in Napa, described as products and services, and business practices and processes that dramatically reduce the demand for energy and increase the efficient use of resources. Among the findings in this document is that green business represents about 5 percent of the total employment in Napa County, and that of Napa County’s 174 green businesses, 63 percent of these businesses are located in the City of Napa.
EX IST ING EFFORTS
There are many organizations in Napa whose work is supportive of sustainable local business and economic development. Among the most active are those listed below:
The Association of Bay Area Governments (ABAG) coordinates a green business program • that is managed locally by Napa County. To be a certified green business, the business must meet certain regional standards and “prevent pollution, reduce waste, conserve resources, and reduce greenhouse gas emissions.” In the city of Napa, there were 58 certified green businesses as of early 2012.
SECT ION 2 - COMMUNITY SUSTAINAB I L I TY P LAN
LOCAL BUS INESS AND ECONOMY
The mission of the Napa Chamber of Commerce is to “promote our community’s • economic vitality and quality of life through leadership development, advocacy, facilitation and education”
The vision of the Napa County Hispanic Chamber of Commerce is to “promote the economic • advancement of the Napa County Hispanic population and to serve as a bridge between the Hispanic and non-Hispanic community by facilitating business, social, educational and governmental relationships”
The Napa Downtown Association “supports and promotes Downtown Napa as well as its • merchants, businesses, restaurants and tasting rooms” through sponsorship of special events, advertising and promotion
Napa Valley Destination Council’s mission is to “protect and enhance The Napa Valley’s • position as North America’s legendary wine, food, arts and wellness destination” and is complemented by the Tourism Improvement District (TID), which promotes tourism and is funded by a 2 percent assessment on gross short term (less than 30 days) room rentals on lodging businesses
The Napa Small Business Development Center (SBDC) has the mission to “provide business • owners and managers with information, training and expert individual consulting,” and is supported by the U.S. Small Business Administration (SBA), Economic & Workforce Development through the California Community Colleges, Napa County Training and Employment Center, City of Napa, and Napa Valley College
The Napa-Lake Workforce Investment Board (WIB) “oversees local workforce development • activities and establishes programs and services in response to the workforce needs of our area.” The WIB “works in partnership with the Napa County Board of Supervisors to oversee local workforce development activities and to establish programs and services in response to the workforce needs of Napa County.”
FUTURE PLANS AND RECOMMENDED ACT IONS
Based on the results of the survey and information that was shared during stakeholder discussions, the following goal was created for Local Business & Economy:
Napa is a resilient city with a thriving local economy, where businesses are supported and recognized for pursuing sustainability
Following are initiatives that are either planned for implementation or that the team recommended for consideration to move Napa towards meeting the stated objective. Please see Appendix B for a decision-making framework that lists each initiative and the corresponding responsible parties, requirements for implementation, and three indicators: the relative term (short, medium, long); level of effort (low, medium, high); and funding (low, medium, high) required to achieve the initiative.
CLB1. Create green career tracks, apprenticeships, and training to keep local talent working in NapaProviding a way to learn about green industries that is alternative to a four-year degree would provide more professional opportunities for Napa’s emerging workforce. To be successful, classes would need to be determined by the green business sector to fulfill current training and education gaps.
CLB2. Explore micro-loans for cottage businessesExploring micro-loans for burgeoning cottage businesses supports the smallest of local businesses, and provides residents with an opportunity to sustain themselves through entrepreneurial endeavors.
53
By supporting and strengthening local businesses and coupling it with innovative financing, the revitalization of low and moderate-income neighborhoods and communities is supported.
CLB3. Support and leverage senior population in Napa to serve as mentors to start-up businessesNapa has a large senior community, some which are retirees who were successful in business. This community could be tapped for their insight and knowledge to serve as mentors to local start-up businesses.
CLB4. Establish a revolving loan fundA revolving loan is created when savings from an energy efficiency project are placed into a dedicated fund that in turn funds future energy efficiency projects. Establishing a revolving loan fund for energy efficiency and renewable energy projects in business and non-profits would provide an additional financing mechanism to implement new projects.
CLB5. Create a Napa-specific website with information about clean energy technologies, companies, financing, and consumer FAQ Energy efficiency and renewable energy investments can result in significant cost savings that provide a competitive advantage to local businesses. By providing greater ease of access to local clean energy information, a barrier will be removed. Additionally, establishing a centralized location where interested parties can congregate also provides an opportunity to explore aggregated purchasing power, and its associated financial benefits. While Napa’s Energy Upgrade California (EUC) website provides some of this information, it is missing content that would be helpful to local businesses.
CLB6. Encourage the use of local services and the production and purchase of locally-made goodsAs the economy continues to shift, Napa has an opportunity to focus on developing local businesses focused on clean tech or recycled products. Additionally, to support established local businesses, a “carrot-mob” campaign for local certified green businesses could be organized. A carrot mob is the opposite of a boycott, and encourages residents to shop at particular businesses to show their support.
CLB7. Support efforts for Napa hub to accommodate high-value telecommute jobsA centralized workspace is an alternative to long commutes for workers that don’t otherwise have a nearby satellite office. A hub could incorporate shared office space and features could include web conferencing technologies and shared office equipment, which has both money-saving and time-saving benefits.
CLB8. Market the region as a gateway to wellness and healingPromoting Napa as a wellness destination by branding and marketing the region, highlighting business clusters and economic, cultural, and natural advantages may attract businesses to locate and grow in the region.
CLB9. Develop a local carbon reserveCarbon reserves are a voluntary tool that communities can use to locally mitigate GHGs. The fund collects revenue via applicants seeking to mitigate GHGs, and in some communities, local residents, visitors, and events may also voluntarily donate funds to benefit local public projects.
54
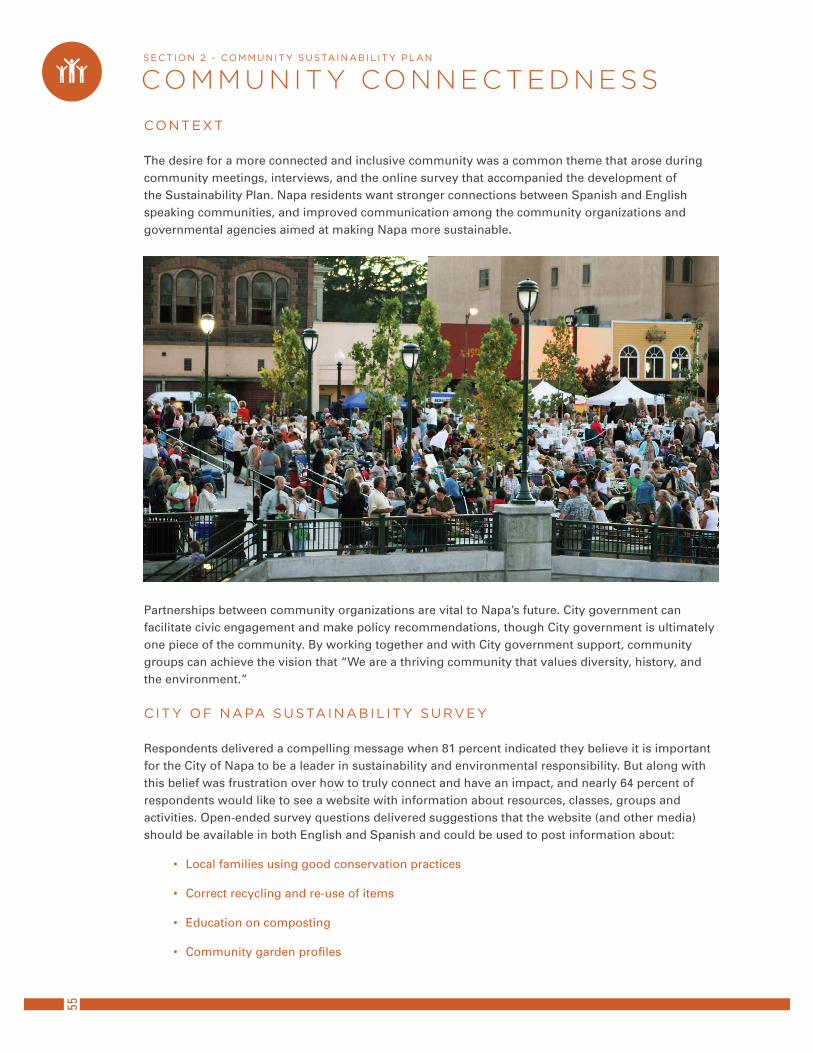
CONTEXT
The desire for a more connected and inclusive community was a common theme that arose during community meetings, interviews, and the online survey that accompanied the development of the Sustainability Plan. Napa residents want stronger connections between Spanish and English speaking communities, and improved communication among the community organizations and governmental agencies aimed at making Napa more sustainable.
Partnerships between community organizations are vital to Napa’s future. City government can facilitate civic engagement and make policy recommendations, though City government is ultimately one piece of the community. By working together and with City government support, community groups can achieve the vision that “We are a thriving community that values diversity, history, and the environment.”
CITY OF NAPA SUSTAINABIL ITY SURVEY
Respondents delivered a compelling message when 81 percent indicated they believe it is important for the City of Napa to be a leader in sustainability and environmental responsibility. But along with this belief was frustration over how to truly connect and have an impact, and nearly 64 percent of respondents would like to see a website with information about resources, classes, groups and activities. Open-ended survey questions delivered suggestions that the website (and other media) should be available in both English and Spanish and could be used to post information about:
Local families using good conservation practices •
Correct recycling and re-use of items•
Education on composting•
Community garden profiles •
55SECT ION 2 - COMMUNITY SUSTAINAB I L I TY P LAN
COMMUNITY CONNECTEDNESS
Bicycle clubs, group rides and commuting support•
Carpool and ride share programs•
Energy conservation projects with do-it-yourself information and resources•
Water conserving landscaping techniques•
Alternative energy financing and resources including success stories in the community•
EX IST ING EFFORTS
There are many organizations working to make Napa a more connected community, and several of these groups have been mentioned in other sections of the Sustainability Plan as their focus may be relevant to a particular topic. Below is a sampling of groups that promote community connectedness:
Association of Napa Neighborhoods (ANN) is an alliance of City of Napa neighborhoods, • the goals of which include: achieving consensus regarding Napa’s future preservation and development; improving communications between local government and the neighborhoods; identifying and giving voice to specific neighborhood needs and aspirations; assisting the City in planning and financing needed public improvements and services; and providing testimony at public hearings.
Leadership Napa Valley (LNV) has a mission “to involve, inform and inspire leaders, to • strengthen our community” and since its inception in 1987, more than 600 people have graduated from the program.
Napa County Hispanic Network (NCHN) was established in 1983 and “is involved in • collaborating with public and private agencies on critical issues affecting the Latino community.” The NCHN mission “includes promoting educational opportunities to local Latino youth by offering scholarships for advanced education.”
Napa County Historical Society is “dedicated to the discovery, preservation and presentation • of the people and history of the Napa County and its place in California history”
Napa County Landmarks organizes events like:•
Architectural Tours –Participants can learn about this history and architecture of »specific neighborhoods from volunteer docents
Porchfest – Occurred for the first time in 2011 and is “A free event where musicians »serve up an afternoon of music from porches in historic Napa neighborhoods”
Napa Downtown Association hosts Chef’s Market, a free, family-oriented, street festival that • occurs weekly in Napa from May through August
Napa Valley CanDo is “a diverse group of Napans inspired to serve and committed to • bettering our community. We seek to expand the pool of local community activists through education about volunteer opportunities and by developing mechanisms to help ease the path from intent to action. Ours is a network that fosters service, advocacy and social connections. It is an issue-oriented organization welcoming all who want to make a difference.”
NextDoor is an online, neighborhood-level private social network that launched in Napa in • 2011 with a mission to “bring back a sense of community to the neighborhood, one of the most important communities in each of our lives”
56
Puertas Abiertas (Open Doors) Community Resource Center “works hand in hand with Latinos • to inspire and achieve healthy living, self-sufficiency, and opportunities for leadership and community engagement”
Somos Napa is a “grassroots group of multicultural, English and Spanish speaking • community members and organizations working together to improve the quality of life in our Napa Valley communities. Our goal is to use technology to increase Communication, Support, Community Building, Empowerment, and Fun.”
Sustainable Napa County seeks to “bring together Napa County business, agriculture, • nonprofit, and government entities as part of a comprehensive, collaborative campaign for long term environmental, economic, and social sustainability”
Thrive Napa Valley seeks to “build resiliency in the region by shining a light on our • communities’ success stories; by connecting social innovators to one another; and by promoting the most effective sustainable practices from around the world.”
FUTURE PLANS AND RECOMMENDED ACT IONS
Based on the results of the survey and information that was shared during stakeholder discussions, the following goal was created for Community Connectedness:
Napa is a thriving, connected network of diverse people and businesses, and sustainable goods and services
Following are initiatives that are either planned for implementation or that the team recommended for consideration to move Napa towards meeting the stated objective. Please see Appendix B for a decision-making framework that lists each initiative and the corresponding responsible parties, requirements for implementation, and three indicators: the relative term (short, medium, long); level of effort (low, medium, high); and funding (low, medium, high) required to achieve the initiative.
CCC1. Install kiosks or bulletin boards that display important information, announcements, and upcoming eventsPhysical kiosks or bulletin boards would provide a low-tech solution for connecting the community and would provide residents with known locations to display information, announcements, and upcoming events. By installing kiosks, passersby would be able to happen upon community events, rather than having to seek them out. It is also another way to reach people that may not have computers or access to the internet.
CCC2. Hold a one-day event to bring the community together and provide educational sessions on identified sustainability topics The event could be a fair, conference, block party, carbon circle, or other format. The topic(s) discussed at the event would be issues the community has expressed interest in learning more about, e.g. energy conservation, bike safety, “reskilling” or acquiring new skills like gardening, recycling grey water, etc.
CCC3. Write a weekly newspaper column to share success stories, available incentives, new technologies, upcoming events and other sustainability informationAn interest was expressed to use a newspaper column to share information about sustainable practices, especially education and tips about energy conservation.
57
CCC4. Hold an event where the focus is on food, art, and/or radical experiences to inspire changeChange comes about through a number of means, and holding an event focused on food, art, and/or radical experiences provides an opportunity for attendees to come together, collaborate, and discuss the larger issues surrounding sustainability. Events could include music, an art show, cooking classes, skateboards, or kayak races.
CCC5. Create an online sustainability map UC Davis created a sustainability map that uses an existing popular mapping platform, and then overlaid it with locations for sustainable services. Locally, these services could include items like: transportation (bike lockers, transit stops, EV charging stations); green buildings; waste reduction and recycling (composting, recycling); green-certified businesses; energy (facilities that are Energy Star rated or use renewable energy); water (stormwater features, recycled water users); and community gardens. CCC6. Invite individuals and groups passionate about sustainability to meet on a regular basisGreat momentum was established during the Sustainability Plan process, and the community should continue to be engaged and brought together for collaboration, information sharing, and implementation of initiatives. The individuals and groups could be assembled by community members, non-profits, or the City.
CCC7. Create a virtual town hall website to encourage civic engagement and collect input Websites with two-way communication capabilities allow residents to participate in civic life on their own schedule. Those who visit the website can vote and comment on ideas submitted by the website moderator (i.e. the City or a non-profit group), or contribute their own ideas for consideration. To encourage participation, the website moderator could pledge to implement at least one of the ideas submitted by the public. This practice has been successful in generating interest and participation in other cities.
CCC8. Establish a community center that is convenient, accessible and livelyA centrally located community center that is accessible and lively creates a common space for residents of all ages to come together. The community center could serve as a common space for sustainability organization where skills and tools could be shared, and classes could be offered.
58
59CONCLUS ION
There are 95 voluntary initiatives recommended for consideration in City of Napa Sustainability Plan. The City will take the lead in implementing certain actions identified in the Community Plan, and all of the actions in the City Government Operations Plan. The initiatives will result in reduced energy and fuel consumption, lower water use, and fewer tons of solid waste. Together these initiatives would demonstrate support for a balanced natural and built environment, a strong mobility and transportation system, a thriving local food and business system, and a connected community.
To achieve GHG emissions reductions and enhanced sustainability in the community and City government, collaboration will be required from City government, businesses, the non-profit community, other agencies, and Napa’s residents. The Sustainability Plan provides a starting point; accomplishing the initiatives will require a combined commitment.
To aid with implementation of Sustainability Plan initiatives, charts are included that list the recommended initiatives and other information specific to the context of the City and Community Plans. For example, Appendix A, “City Plan Calculations,” includes tables that list the responsible City department, cost, available financing mechanisms, annual savings, and payback periods. Correspondingly, Appendix B, “Community Plan Initiatives” lists each initiative and the corresponding responsible parties, requirements for implementation, and three indicators: the relative term (short, medium, long); level of effort (low, medium, high); and funding (low, medium, high) required to achieve the initiative.
It is intended that by providing this type of framework, it will be easier to move forward with implementation both in the community and in City government. Since this plan was developed over the course of 2011 and 2012, and there is great momentum both in the community and City government surrounding sustainability, many initiatives listed in the Sustainability Plan are presently being discussed for implementation.
Monitoring will be important as initiatives are adopted so that success can be measured and targets adjusted as necessary. Measuring tools for the City Plan include future Local Government Operations GHG Inventories, and the indicators that are included as targets in Appendix A, many of which are already tracked by City departments. Benchmarking is an additional tool that will continue to be used to track City facility energy use. For the Community Plan, the 2005 Community GHG Inventory needs to be revised, and a 2010 Community GHG Inventory should be conducted. Once this is accomplished, the Community Plan can be amended to include more data and analysis, and future Community GHG Inventories will serve as measuring tools.
P a g e | A-1
Appendix A – City Plan Calculations Appendix A contains data tables that correspond to each of the five sections of the City Sustainability Plan: Energy, Transportation, Water, Recycling & Waste Reduction, and Land Use & Planning. Metrics for each of the five sections are displayed for the years 2005, 2010, and 2011, and target metrics are calculated for 2015 and 2020. Also listed are the actions proposed for implementation between 2012 and 2015 to stay on-track with meeting the 2020 target. This “Recommended Actions” table includes a Financing Mechanisms column; the legend for this column is as follows: CDBG = Community Development Block Grant CIP = Capital Improvement Plan EF = Enterprise Fund GF = General Fund OBF = On-Bill Financing PC = Performance Contracting PPA = Power Purchase Agreement RL = Revolving Loan SL = Solar Leasing The following metrics are abbreviated in Appendix A: GPCD = gallons per capita per day kWh = kilowatt hours MT CO2e = Metric Tons Carbon Dioxide Equivalent VMT = vehicle miles traveled In general, data are best estimates, and assumptions are included in Appendix E, “City Plan Assumptions and Methodology.”
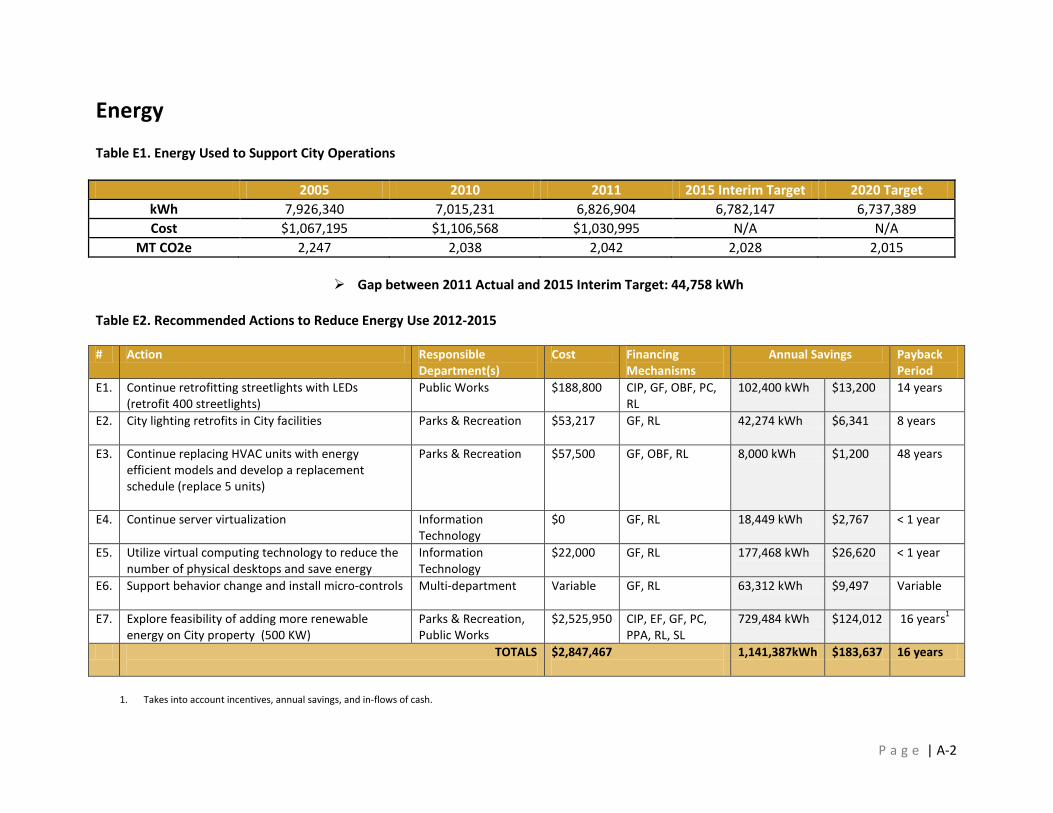
P a g e | A-2
Energy Table E1. Energy Used to Support City Operations
2005 2010 2011 2015 Interim Target 2020 Target kWh 7,926,340 7,015,231 6,826,904 6,782,147 6,737,389 Cost $1,067,195 $1,106,568 $1,030,995 N/A N/A
MT CO2e 2,247 2,038 2,042 2,028 2,015
Gap between 2011 Actual and 2015 Interim Target: 44,758 kWh Table E2. Recommended Actions to Reduce Energy Use 2012-2015 # Action Responsible
Department(s) Cost Financing
Mechanisms Annual Savings Payback
Period E1. Continue retrofitting streetlights with LEDs
(retrofit 400 streetlights) Public Works $188,800 CIP, GF, OBF, PC,
RL 102,400 kWh $13,200 14 years
E2. City lighting retrofits in City facilities
Parks & Recreation $53,217 GF, RL 42,274 kWh $6,341 8 years
E3. Continue replacing HVAC units with energy efficient models and develop a replacement schedule (replace 5 units)
Parks & Recreation $57,500 GF, OBF, RL 8,000 kWh $1,200 48 years
E4. Continue server virtualization Information Technology
$0 GF, RL 18,449 kWh $2,767 < 1 year
E5. Utilize virtual computing technology to reduce the number of physical desktops and save energy
Information Technology
$22,000 GF, RL 177,468 kWh $26,620 < 1 year
E6. Support behavior change and install micro-controls Multi-department Variable
GF, RL 63,312 kWh $9,497 Variable
E7. Explore feasibility of adding more renewable energy on City property (500 KW)
Parks & Recreation, Public Works
$2,525,950 CIP, EF, GF, PC, PPA, RL, SL
729,484 kWh $124,012 16 years1
TOTALS
$2,847,467
1,141,387kWh $183,637 16 years
1. Takes into account incentives, annual savings, and in-flows of cash.
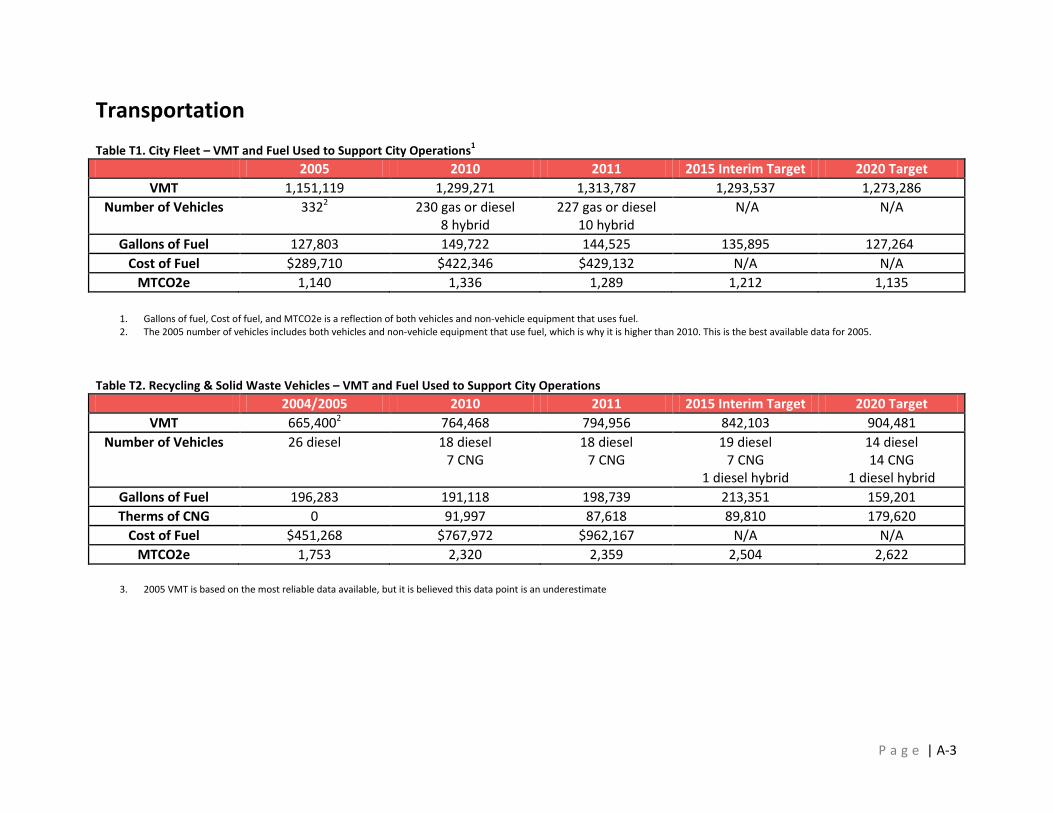
P a g e | A-3
Transportation Table T1. City Fleet – VMT and Fuel Used to Support City Operations1
2005 2010 2011 2015 Interim Target 2020 Target VMT 1,151,119 1,299,271 1,313,787 1,293,537 1,273,286
Number of Vehicles 3322 230 gas or diesel 8 hybrid
227 gas or diesel 10 hybrid
N/A N/A
Gallons of Fuel 127,803 149,722 144,525 135,895 127,264 Cost of Fuel $289,710 $422,346 $429,132 N/A N/A
MTCO2e 1,140 1,336 1,289 1,212 1,135
1. Gallons of fuel, Cost of fuel, and MTCO2e is a reflection of both vehicles and non-vehicle equipment that uses fuel. 2. The 2005 number of vehicles includes both vehicles and non-vehicle equipment that use fuel, which is why it is higher than 2010. This is the best available data for 2005.
Table T2. Recycling & Solid Waste Vehicles – VMT and Fuel Used to Support City Operations
2004/2005 2010 2011 2015 Interim Target 2020 Target VMT 665,4002 764,468 794,956 842,103 904,481
Number of Vehicles 26 diesel
18 diesel 7 CNG
18 diesel 7 CNG
19 diesel 7 CNG
1 diesel hybrid
14 diesel 14 CNG
1 diesel hybrid Gallons of Fuel 196,283 191,118 198,739 213,351 159,201 Therms of CNG 0 91,997 87,618 89,810 179,620
Cost of Fuel $451,268 $767,972 $962,167 N/A N/A MTCO2e 1,753 2,320 2,359 2,504 2,622
3. 2005 VMT is based on the most reliable data available, but it is believed this data point is an underestimate
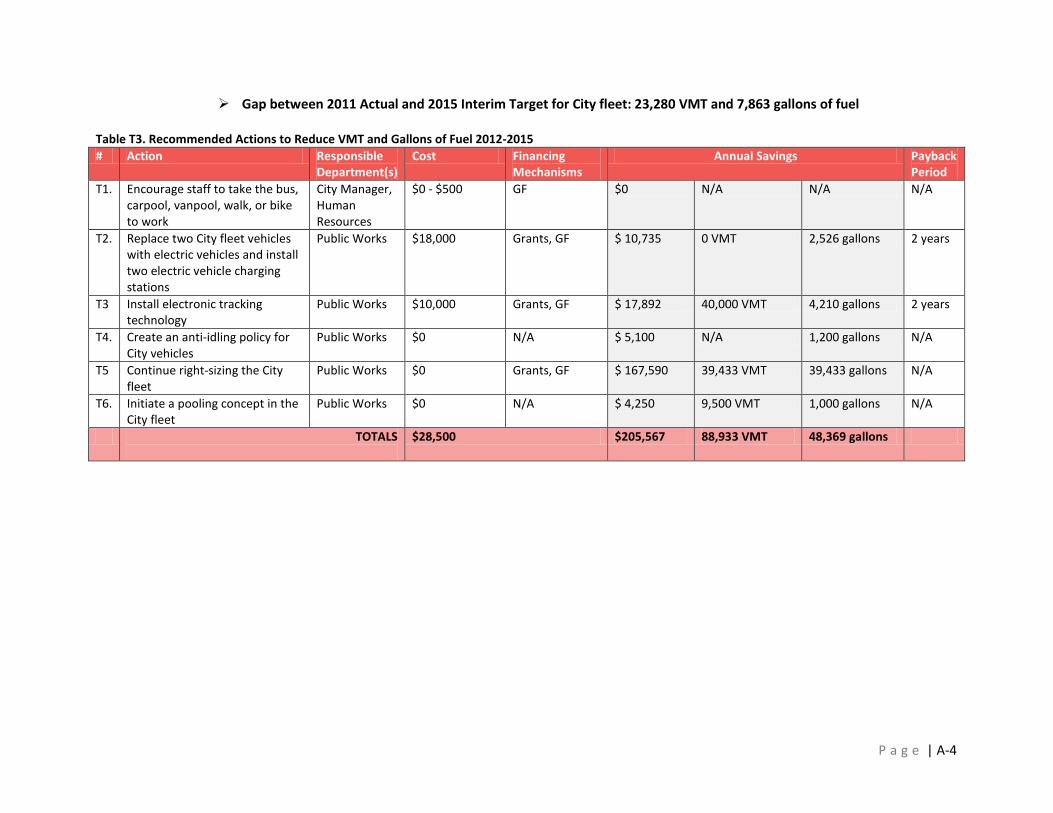
P a g e | A-4
Gap between 2011 Actual and 2015 Interim Target for City fleet: 23,280 VMT and 7,863 gallons of fuel
Table T3. Recommended Actions to Reduce VMT and Gallons of Fuel 2012-2015 # Action Responsible
Department(s) Cost Financing
Mechanisms Annual Savings Payback
Period T1. Encourage staff to take the bus,
carpool, vanpool, walk, or bike to work
City Manager, Human Resources
$0 - $500 GF $0 N/A N/A N/A
T2. Replace two City fleet vehicles with electric vehicles and install two electric vehicle charging stations
Public Works $18,000 Grants, GF $ 10,735 0 VMT 2,526 gallons 2 years
T3 Install electronic tracking technology
Public Works $10,000 Grants, GF $ 17,892 40,000 VMT 4,210 gallons 2 years
T4. Create an anti-idling policy for City vehicles
Public Works $0 N/A $ 5,100 N/A 1,200 gallons N/A
T5 Continue right-sizing the City fleet
Public Works $0 Grants, GF $ 167,590 39,433 VMT 39,433 gallons N/A
T6. Initiate a pooling concept in the City fleet
Public Works $0 N/A $ 4,250 9,500 VMT 1,000 gallons N/A
TOTALS
$28,500 $205,567 88,933 VMT 48,369 gallons
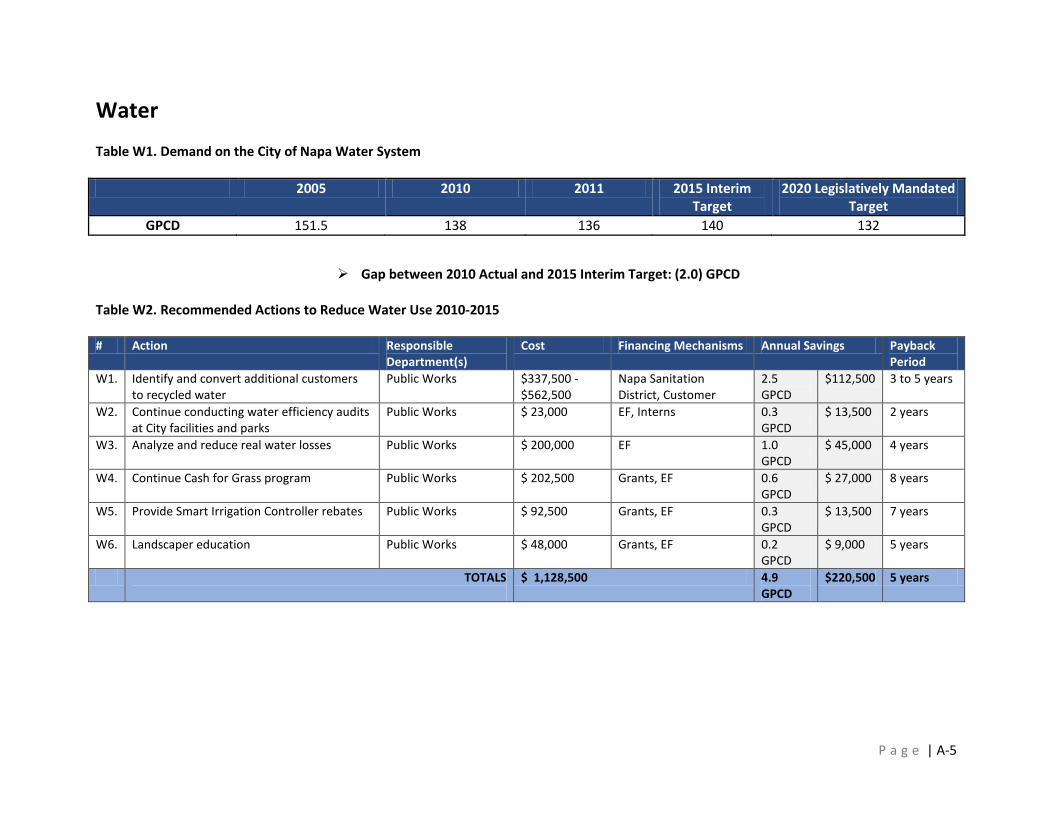
P a g e | A-5
Water Table W1. Demand on the City of Napa Water System
2005 2010 2011 2015 Interim Target
2020 Legislatively Mandated Target
GPCD 151.5 138 136 140 132
Gap between 2010 Actual and 2015 Interim Target: (2.0) GPCD
Table W2. Recommended Actions to Reduce Water Use 2010-2015 # Action Responsible
Department(s) Cost Financing Mechanisms Annual Savings Payback
Period W1. Identify and convert additional customers
to recycled water Public Works $337,500 -
$562,500 Napa Sanitation District, Customer
2.5 GPCD
$112,500 3 to 5 years
W2. Continue conducting water efficiency audits at City facilities and parks
Public Works $ 23,000 EF, Interns 0.3 GPCD
$ 13,500 2 years
W3. Analyze and reduce real water losses Public Works $ 200,000 EF 1.0 GPCD
$ 45,000 4 years
W4. Continue Cash for Grass program Public Works $ 202,500 Grants, EF 0.6 GPCD
$ 27,000 8 years
W5. Provide Smart Irrigation Controller rebates Public Works $ 92,500 Grants, EF 0.3 GPCD
$ 13,500 7 years
W6. Landscaper education Public Works $ 48,000 Grants, EF 0.2 GPCD
$ 9,000 5 years
TOTALS
$ 1,128,500 4.9 GPCD
$220,500 5 years
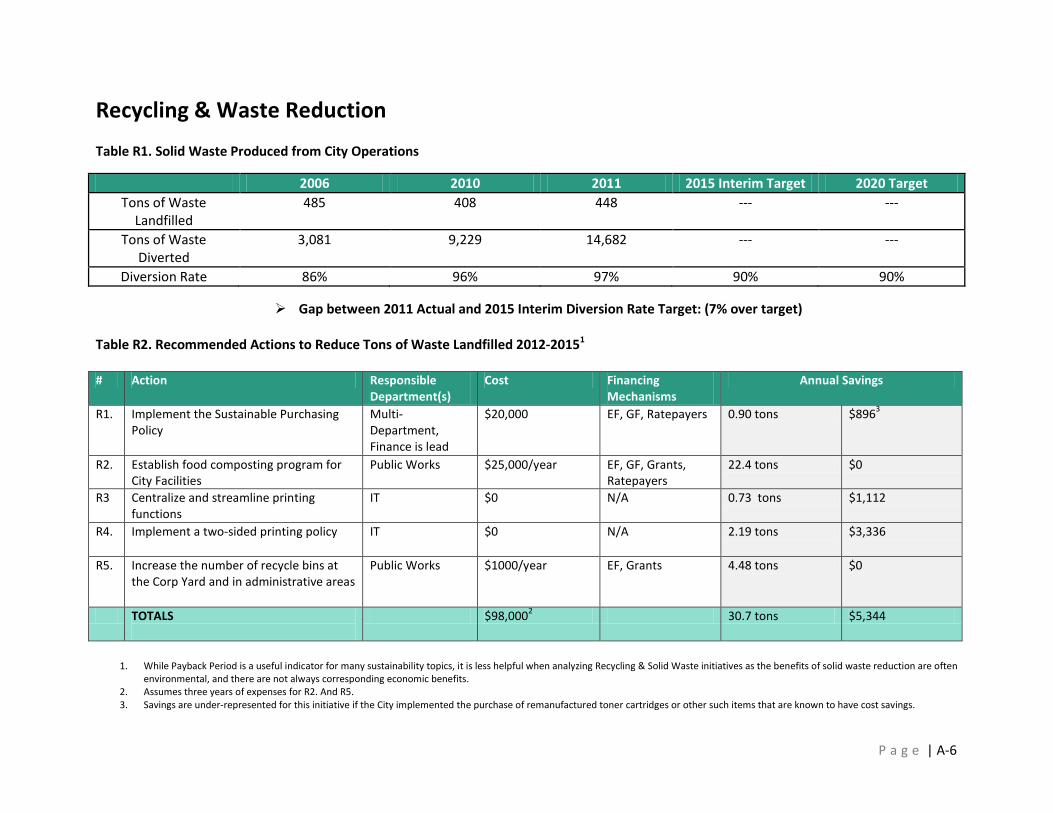
P a g e | A-6
Recycling & Waste Reduction Table R1. Solid Waste Produced from City Operations
2006 2010 2011 2015 Interim Target 2020 Target Tons of Waste
Landfilled 485 408 448 --- ---
Tons of Waste Diverted
3,081
9,229
14,682 --- ---
Diversion Rate 86% 96% 97% 90% 90%
Gap between 2011 Actual and 2015 Interim Diversion Rate Target: (7% over target) Table R2. Recommended Actions to Reduce Tons of Waste Landfilled 2012-20151
# Action Responsible
Department(s) Cost Financing
Mechanisms Annual Savings
R1. Implement the Sustainable Purchasing Policy
Multi-Department, Finance is lead
$20,000 EF, GF, Ratepayers 0.90 tons $8963
R2. Establish food composting program for City Facilities
Public Works $25,000/year EF, GF, Grants, Ratepayers
22.4 tons $0
R3 Centralize and streamline printing functions
IT $0 N/A 0.73 tons $1,112
R4. Implement a two-sided printing policy IT $0 N/A 2.19 tons $3,336
R5. Increase the number of recycle bins at the Corp Yard and in administrative areas
Public Works $1000/year EF, Grants 4.48 tons $0
TOTALS
$98,0002 30.7 tons $5,344
1. While Payback Period is a useful indicator for many sustainability topics, it is less helpful when analyzing Recycling & Solid Waste initiatives as the benefits of solid waste reduction are often
environmental, and there are not always corresponding economic benefits. 2. Assumes three years of expenses for R2. And R5. 3. Savings are under-represented for this initiative if the City implemented the purchase of remanufactured toner cartridges or other such items that are known to have cost savings.
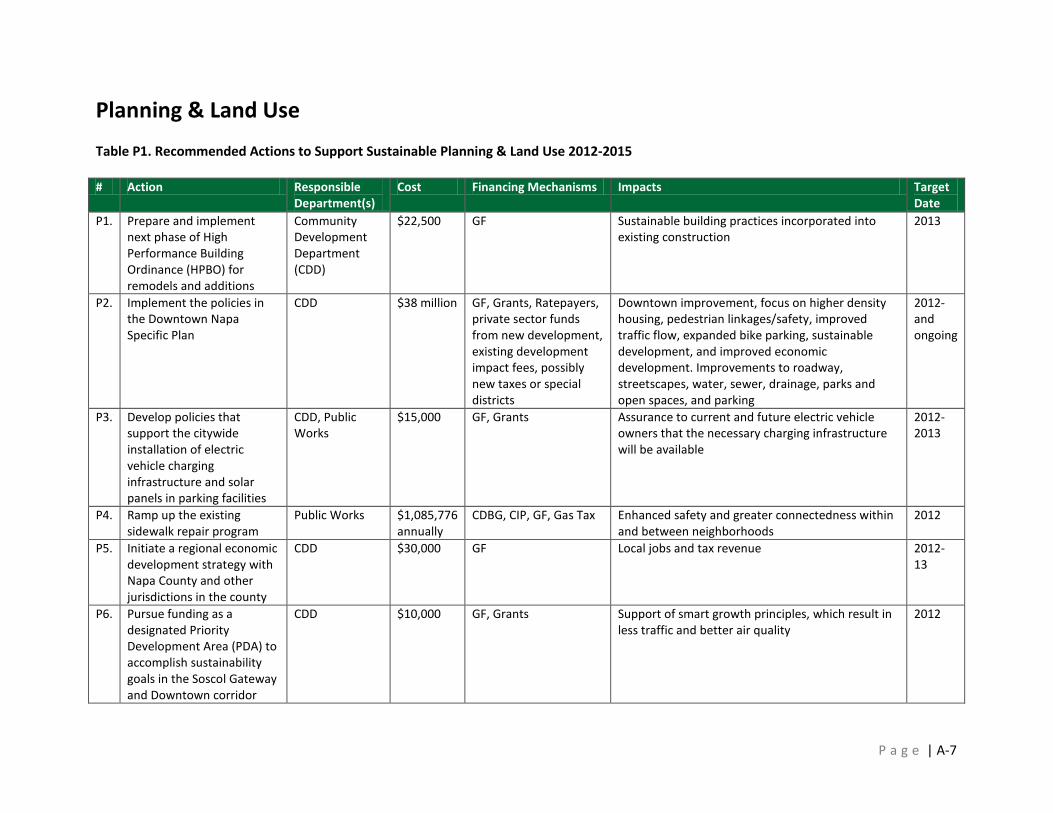
P a g e | A-7
Planning & Land Use Table P1. Recommended Actions to Support Sustainable Planning & Land Use 2012-2015 # Action Responsible
Department(s) Cost Financing Mechanisms Impacts Target
Date P1. Prepare and implement
next phase of High Performance Building Ordinance (HPBO) for remodels and additions
Community Development Department (CDD)
$22,500 GF Sustainable building practices incorporated into existing construction
2013
P2. Implement the policies in the Downtown Napa Specific Plan
CDD $38 million GF, Grants, Ratepayers, private sector funds from new development, existing development impact fees, possibly new taxes or special districts
Downtown improvement, focus on higher density housing, pedestrian linkages/safety, improved traffic flow, expanded bike parking, sustainable development, and improved economic development. Improvements to roadway, streetscapes, water, sewer, drainage, parks and open spaces, and parking
2012- and ongoing
P3. Develop policies that support the citywide installation of electric vehicle charging infrastructure and solar panels in parking facilities
CDD, Public Works
$15,000 GF, Grants Assurance to current and future electric vehicle owners that the necessary charging infrastructure will be available
2012-2013
P4. Ramp up the existing sidewalk repair program
Public Works $1,085,776 annually
CDBG, CIP, GF, Gas Tax Enhanced safety and greater connectedness within and between neighborhoods
2012
P5. Initiate a regional economic development strategy with Napa County and other jurisdictions in the county
CDD $30,000 GF Local jobs and tax revenue 2012-13
P6. Pursue funding as a designated Priority Development Area (PDA) to accomplish sustainability goals in the Soscol Gateway and Downtown corridor
CDD $10,000 GF, Grants Support of smart growth principles, which result in less traffic and better air quality
2012
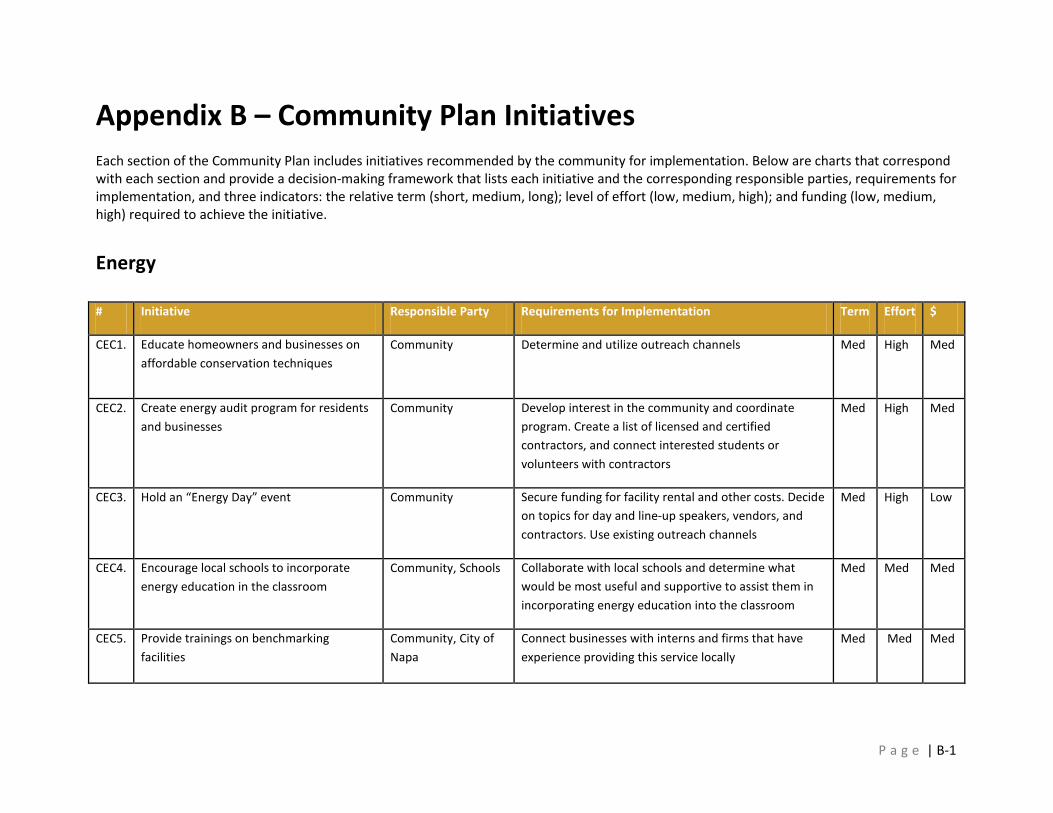
P a g e | B-1
Appendix B – Community Plan Initiatives Each section of the Community Plan includes initiatives recommended by the community for implementation. Below are charts that correspond with each section and provide a decision-making framework that lists each initiative and the corresponding responsible parties, requirements for implementation, and three indicators: the relative term (short, medium, long); level of effort (low, medium, high); and funding (low, medium, high) required to achieve the initiative.
Energy # Initiative Responsible Party Requirements for Implementation Term Effort $
CEC1. Educate homeowners and businesses on affordable conservation techniques
Community Determine and utilize outreach channels Med High Med
CEC2. Create energy audit program for residents and businesses
Community Develop interest in the community and coordinate program. Create a list of licensed and certified contractors, and connect interested students or volunteers with contractors
Med High Med
CEC3. Hold an “Energy Day” event Community Secure funding for facility rental and other costs. Decide on topics for day and line-up speakers, vendors, and contractors. Use existing outreach channels
Med High Low
CEC4. Encourage local schools to incorporate energy education in the classroom
Community, Schools Collaborate with local schools and determine what would be most useful and supportive to assist them in incorporating energy education into the classroom
Med Med Med
CEC5. Provide trainings on benchmarking facilities
Community, City of Napa
Connect businesses with interns and firms that have experience providing this service locally
Med Med Med
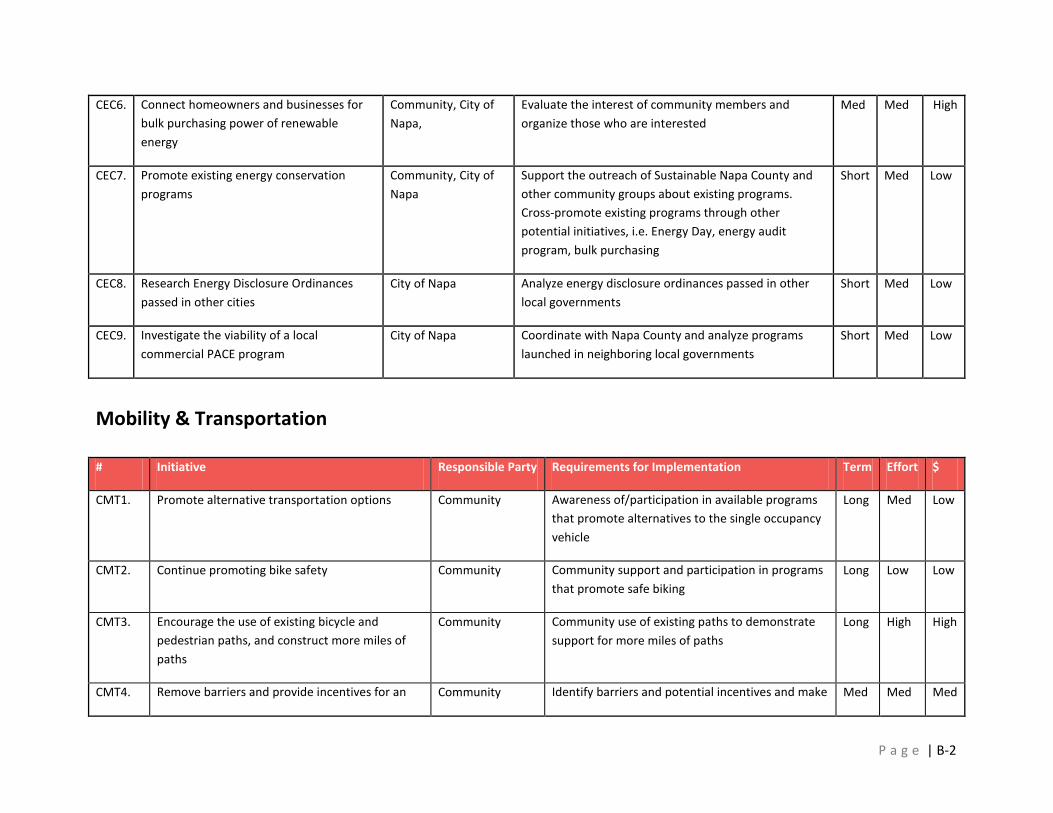
P a g e | B-2
CEC6. Connect homeowners and businesses for bulk purchasing power of renewable energy
Community, City of Napa,
Evaluate the interest of community members and organize those who are interested
Med Med High
CEC7. Promote existing energy conservation programs
Community, City of Napa
Support the outreach of Sustainable Napa County and other community groups about existing programs. Cross-promote existing programs through other potential initiatives, i.e. Energy Day, energy audit program, bulk purchasing
Short Med Low
CEC8. Research Energy Disclosure Ordinances passed in other cities
City of Napa Analyze energy disclosure ordinances passed in other local governments
Short Med Low
CEC9. Investigate the viability of a local commercial PACE program
City of Napa Coordinate with Napa County and analyze programs launched in neighboring local governments
Short Med Low
Mobility & Transportation # Initiative Responsible Party Requirements for Implementation Term Effort $
CMT1. Promote alternative transportation options Community Awareness of/participation in available programs that promote alternatives to the single occupancy vehicle
Long Med Low
CMT2. Continue promoting bike safety Community Community support and participation in programs that promote safe biking
Long Low Low
CMT3. Encourage the use of existing bicycle and pedestrian paths, and construct more miles of paths
Community Community use of existing paths to demonstrate support for more miles of paths
Long High High
CMT4. Remove barriers and provide incentives for an Community Identify barriers and potential incentives and make Med Med Med
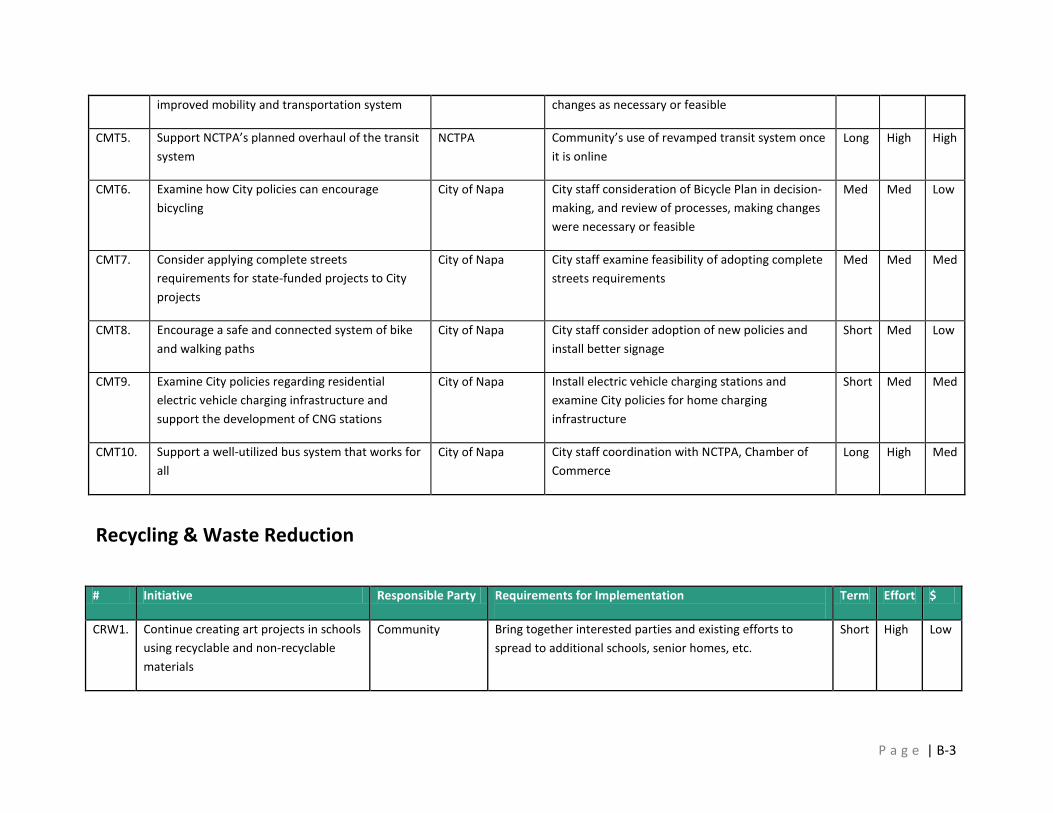
P a g e | B-3
improved mobility and transportation system changes as necessary or feasible
CMT5. Support NCTPA’s planned overhaul of the transit system
NCTPA Community’s use of revamped transit system once it is online
Long High High
CMT6. Examine how City policies can encourage bicycling
City of Napa City staff consideration of Bicycle Plan in decision-making, and review of processes, making changes were necessary or feasible
Med Med Low
CMT7. Consider applying complete streets requirements for state-funded projects to City projects
City of Napa City staff examine feasibility of adopting complete streets requirements
Med Med Med
CMT8. Encourage a safe and connected system of bike and walking paths
City of Napa City staff consider adoption of new policies and install better signage
Short Med Low
CMT9. Examine City policies regarding residential electric vehicle charging infrastructure and support the development of CNG stations
City of Napa Install electric vehicle charging stations and examine City policies for home charging infrastructure
Short Med Med
CMT10. Support a well-utilized bus system that works for all
City of Napa City staff coordination with NCTPA, Chamber of Commerce
Long High Med
Recycling & Waste Reduction
# Initiative Responsible Party Requirements for Implementation
Term Effort $
CRW1. Continue creating art projects in schools using recyclable and non-recyclable materials
Community Bring together interested parties and existing efforts to spread to additional schools, senior homes, etc.
Short High Low
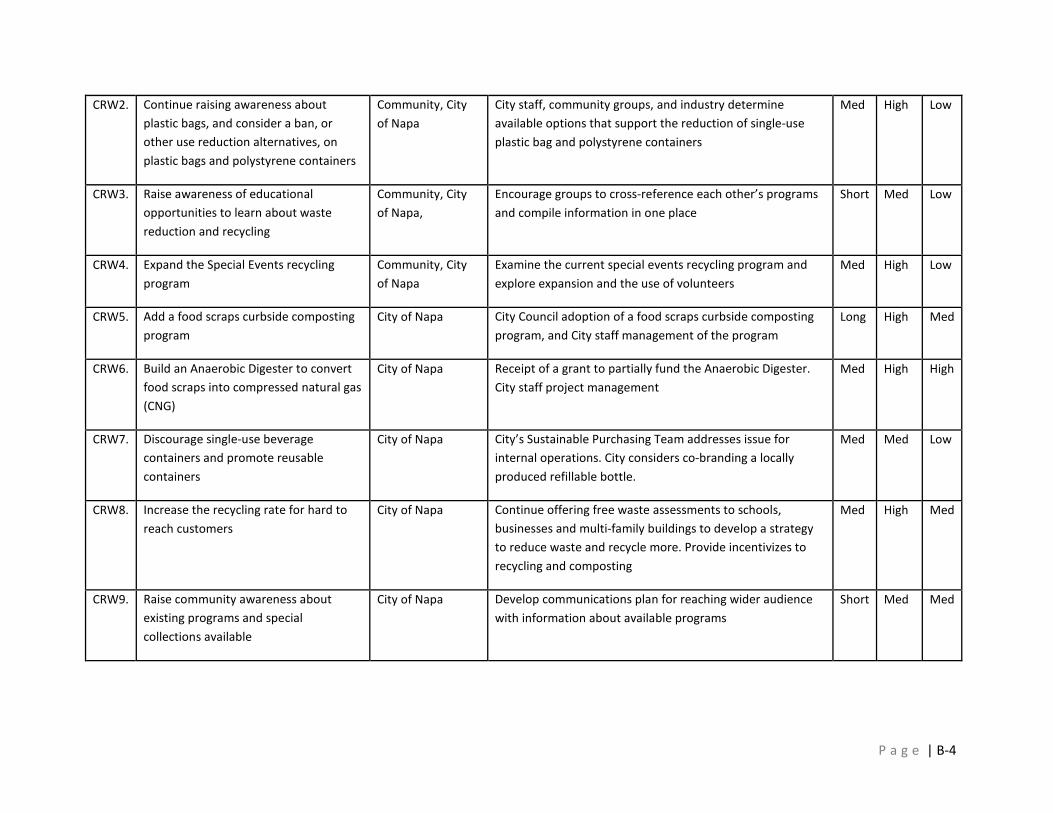
P a g e | B-4
CRW2. Continue raising awareness about plastic bags, and consider a ban, or other use reduction alternatives, on plastic bags and polystyrene containers
Community, City of Napa
City staff, community groups, and industry determine available options that support the reduction of single-use plastic bag and polystyrene containers
Med High Low
CRW3. Raise awareness of educational opportunities to learn about waste reduction and recycling
Community, City of Napa,
Encourage groups to cross-reference each other’s programs and compile information in one place
Short Med Low
CRW4. Expand the Special Events recycling program
Community, City of Napa
Examine the current special events recycling program and explore expansion and the use of volunteers
Med High Low
CRW5. Add a food scraps curbside composting program
City of Napa City Council adoption of a food scraps curbside composting program, and City staff management of the program
Long High Med
CRW6. Build an Anaerobic Digester to convert food scraps into compressed natural gas (CNG)
City of Napa Receipt of a grant to partially fund the Anaerobic Digester. City staff project management
Med High High
CRW7. Discourage single-use beverage containers and promote reusable containers
City of Napa City’s Sustainable Purchasing Team addresses issue for internal operations. City considers co-branding a locally produced refillable bottle.
Med Med Low
CRW8. Increase the recycling rate for hard to reach customers
City of Napa Continue offering free waste assessments to schools, businesses and multi-family buildings to develop a strategy to reduce waste and recycle more. Provide incentivizes to recycling and composting
Med High Med
CRW9. Raise community awareness about existing programs and special collections available
City of Napa Develop communications plan for reaching wider audience with information about available programs
Short Med Med
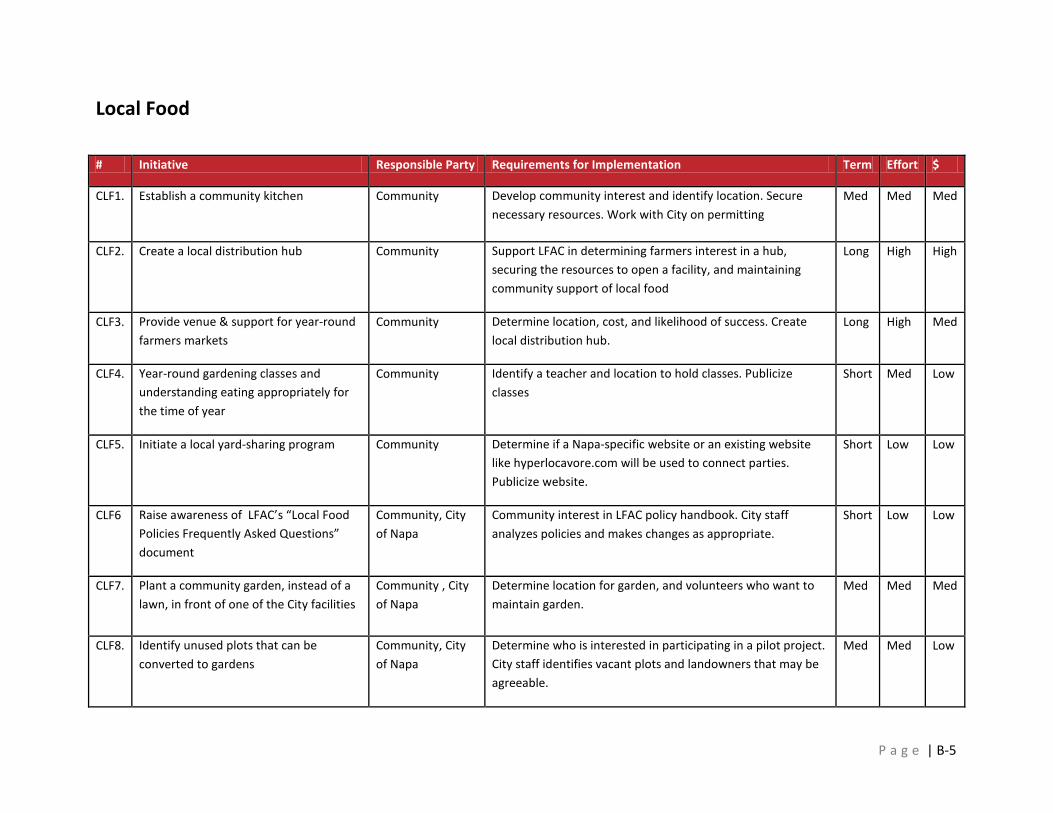
P a g e | B-5
Local Food # Initiative Responsible Party Requirements for Implementation Term Effort $
CLF1. Establish a community kitchen Community Develop community interest and identify location. Secure necessary resources. Work with City on permitting
Med Med Med
CLF2. Create a local distribution hub Community Support LFAC in determining farmers interest in a hub, securing the resources to open a facility, and maintaining community support of local food
Long High High
CLF3. Provide venue & support for year-round farmers markets
Community Determine location, cost, and likelihood of success. Create local distribution hub.
Long High Med
CLF4. Year-round gardening classes and understanding eating appropriately for the time of year
Community Identify a teacher and location to hold classes. Publicize classes
Short Med Low
CLF5. Initiate a local yard-sharing program Community Determine if a Napa-specific website or an existing website like hyperlocavore.com will be used to connect parties. Publicize website.
Short Low Low
CLF6 Raise awareness of LFAC’s “Local Food Policies Frequently Asked Questions” document
Community, City of Napa
Community interest in LFAC policy handbook. City staff analyzes policies and makes changes as appropriate.
Short Low Low
CLF7. Plant a community garden, instead of a lawn, in front of one of the City facilities
Community , City of Napa
Determine location for garden, and volunteers who want to maintain garden.
Med Med Med
CLF8. Identify unused plots that can be converted to gardens
Community, City of Napa
Determine who is interested in participating in a pilot project. City staff identifies vacant plots and landowners that may be agreeable.
Med Med Low
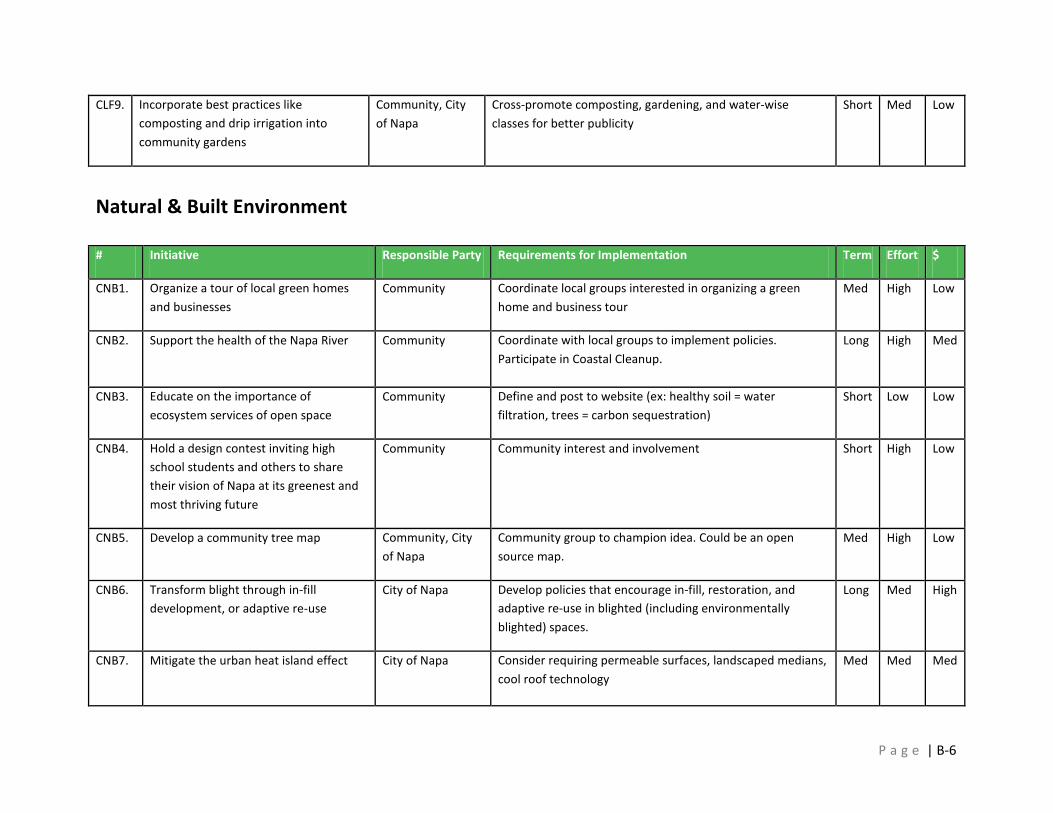
P a g e | B-6
Natural & Built Environment # Initiative Responsible Party Requirements for Implementation Term Effort $
CNB1. Organize a tour of local green homes and businesses
Community Coordinate local groups interested in organizing a green home and business tour
Med High Low
CNB2. Support the health of the Napa River Community Coordinate with local groups to implement policies. Participate in Coastal Cleanup.
Long High Med
CNB3. Educate on the importance of ecosystem services of open space
Community Define and post to website (ex: healthy soil = water filtration, trees = carbon sequestration)
Short Low Low
CNB4. Hold a design contest inviting high school students and others to share their vision of Napa at its greenest and most thriving future
Community Community interest and involvement Short High Low
CNB5. Develop a community tree map Community, City of Napa
Community group to champion idea. Could be an open source map.
Med High Low
CNB6. Transform blight through in-fill development, or adaptive re-use
City of Napa Develop policies that encourage in-fill, restoration, and adaptive re-use in blighted (including environmentally blighted) spaces.
Long Med High
CNB7. Mitigate the urban heat island effect City of Napa Consider requiring permeable surfaces, landscaped medians, cool roof technology
Med Med Med
CLF9. Incorporate best practices like composting and drip irrigation into community gardens
Community, City of Napa
Cross-promote composting, gardening, and water-wise classes for better publicity
Short Med Low
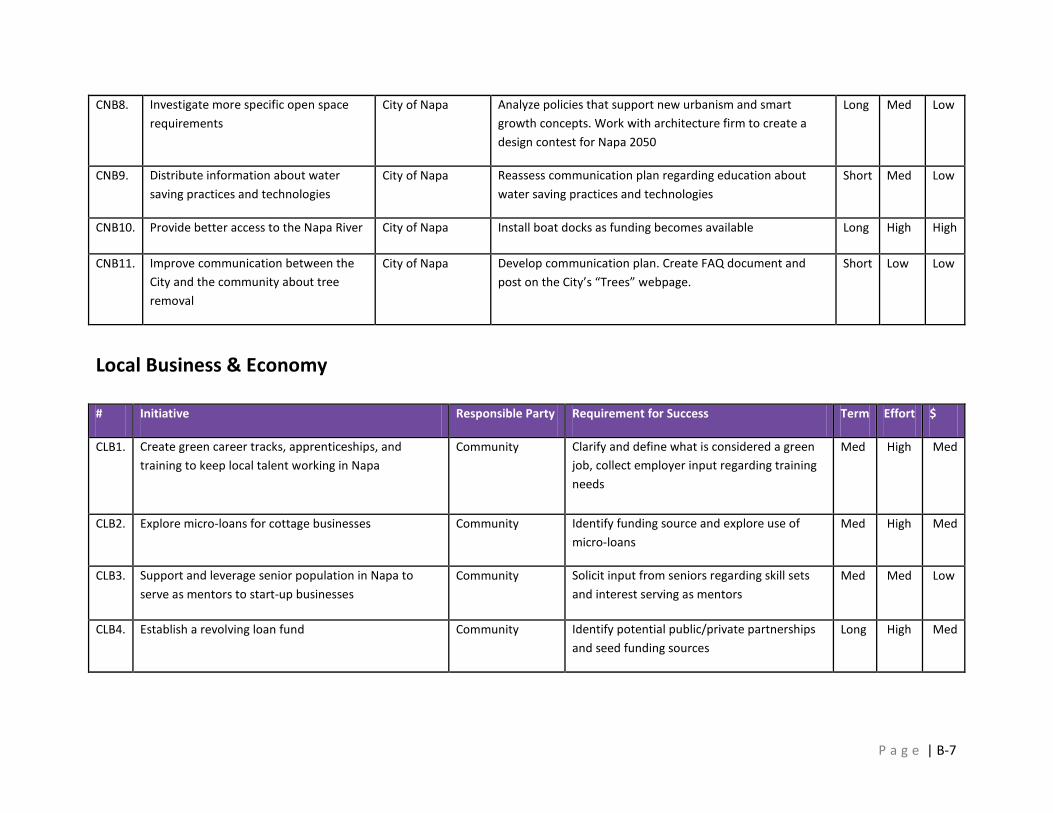
P a g e | B-7
CNB8. Investigate more specific open space requirements
City of Napa Analyze policies that support new urbanism and smart growth concepts. Work with architecture firm to create a design contest for Napa 2050
Long Med Low
CNB9. Distribute information about water saving practices and technologies
City of Napa Reassess communication plan regarding education about water saving practices and technologies
Short Med Low
CNB10. Provide better access to the Napa River City of Napa Install boat docks as funding becomes available Long High High
CNB11. Improve communication between the City and the community about tree removal
City of Napa Develop communication plan. Create FAQ document and post on the City’s “Trees” webpage.
Short Low Low
Local Business & Economy # Initiative Responsible Party Requirement for Success Term Effort $
CLB1. Create green career tracks, apprenticeships, and training to keep local talent working in Napa
Community Clarify and define what is considered a green job, collect employer input regarding training needs
Med High Med
CLB2. Explore micro-loans for cottage businesses Community Identify funding source and explore use of micro-loans
Med High Med
CLB3. Support and leverage senior population in Napa to serve as mentors to start-up businesses
Community Solicit input from seniors regarding skill sets and interest serving as mentors
Med Med Low
CLB4. Establish a revolving loan fund Community Identify potential public/private partnerships and seed funding sources
Long High Med
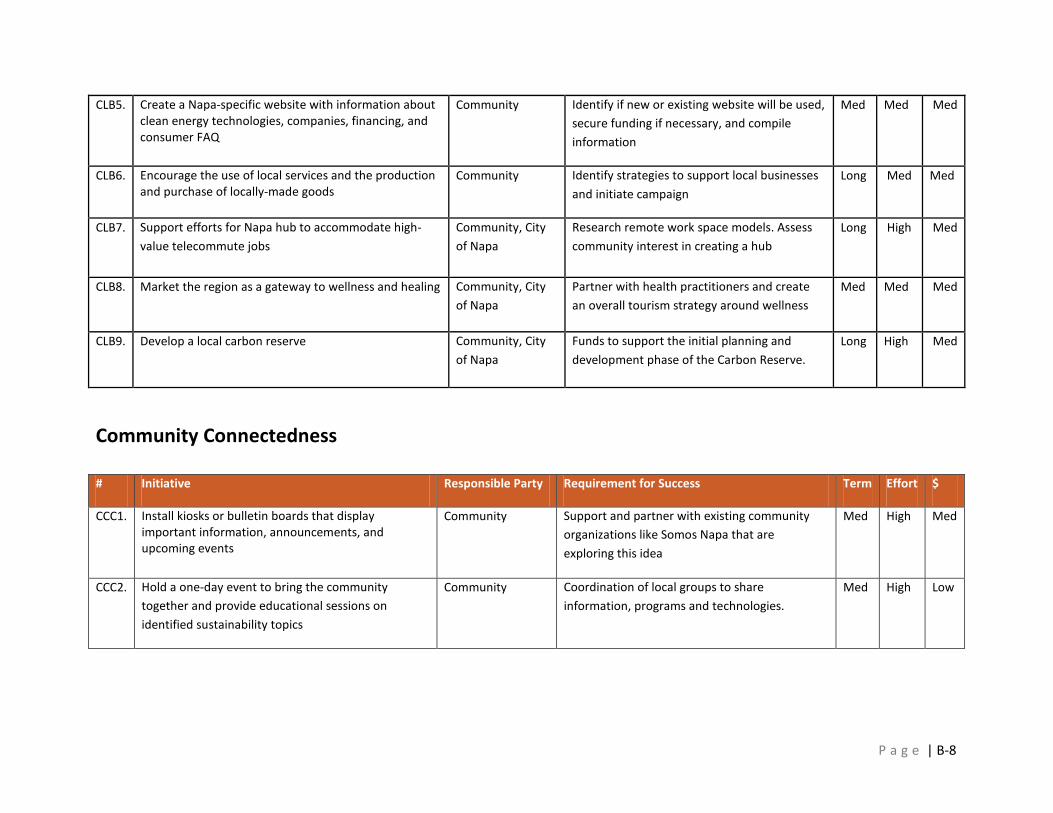
P a g e | B-8
CLB5. Create a Napa-specific website with information about clean energy technologies, companies, financing, and consumer FAQ
Community Identify if new or existing website will be used, secure funding if necessary, and compile information
Med Med Med
CLB6. Encourage the use of local services and the production and purchase of locally-made goods
Community Identify strategies to support local businesses and initiate campaign
Long Med Med
CLB7. Support efforts for Napa hub to accommodate high-value telecommute jobs
Community, City of Napa
Research remote work space models. Assess community interest in creating a hub
Long High Med
CLB8. Market the region as a gateway to wellness and healing Community, City of Napa
Partner with health practitioners and create an overall tourism strategy around wellness
Med Med Med
CLB9. Develop a local carbon reserve Community, City of Napa
Funds to support the initial planning and development phase of the Carbon Reserve.
Long High Med
Community Connectedness # Initiative Responsible Party Requirement for Success Term Effort $
CCC1. Install kiosks or bulletin boards that display important information, announcements, and upcoming events
Community Support and partner with existing community organizations like Somos Napa that are exploring this idea
Med High Med
CCC2. Hold a one-day event to bring the community together and provide educational sessions on identified sustainability topics
Community Coordination of local groups to share information, programs and technologies.
Med High Low
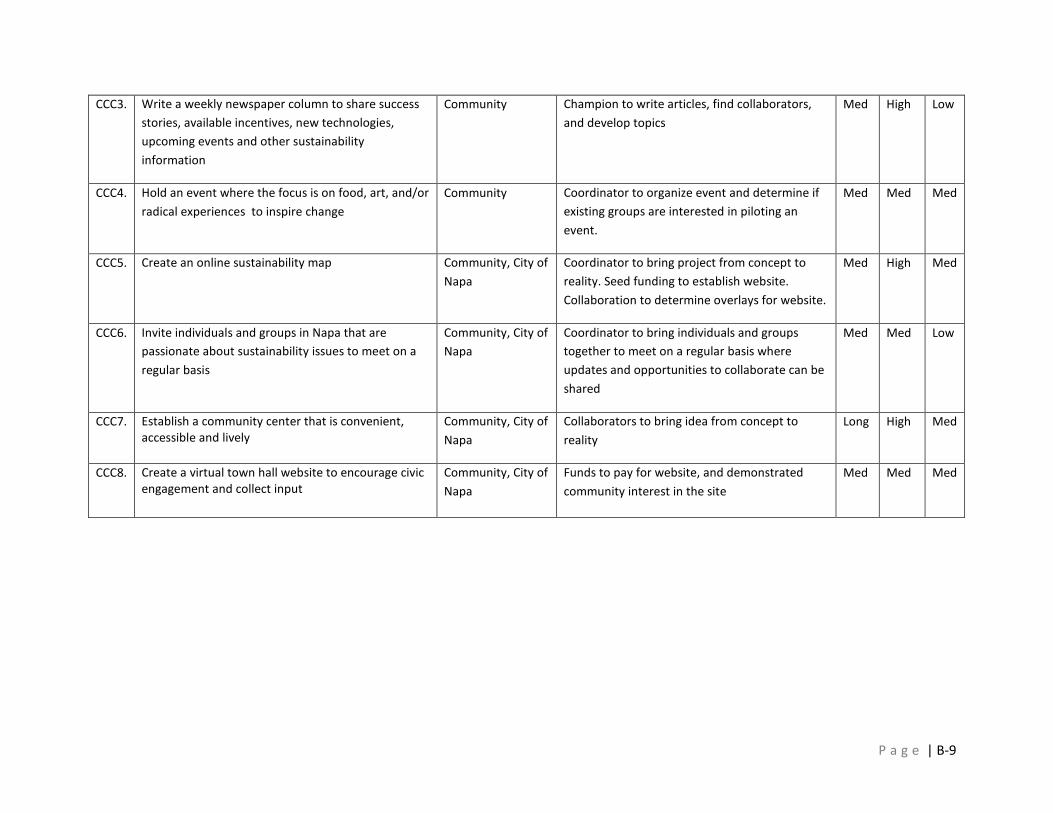
P a g e | B-9
CCC3. Write a weekly newspaper column to share success stories, available incentives, new technologies, upcoming events and other sustainability information
Community Champion to write articles, find collaborators, and develop topics
Med High Low
CCC4. Hold an event where the focus is on food, art, and/or radical experiences to inspire change
Community Coordinator to organize event and determine if existing groups are interested in piloting an event.
Med Med Med
CCC5. Create an online sustainability map
Community, City of Napa
Coordinator to bring project from concept to reality. Seed funding to establish website. Collaboration to determine overlays for website.
Med High Med
CCC6. Invite individuals and groups in Napa that are passionate about sustainability issues to meet on a regular basis
Community, City of Napa
Coordinator to bring individuals and groups together to meet on a regular basis where updates and opportunities to collaborate can be shared
Med Med Low
CCC7. Establish a community center that is convenient, accessible and lively
Community, City of Napa
Collaborators to bring idea from concept to reality
Long High Med
CCC8. Create a virtual town hall website to encourage civic engagement and collect input
Community, City of Napa
Funds to pay for website, and demonstrated community interest in the site
Med Med Med
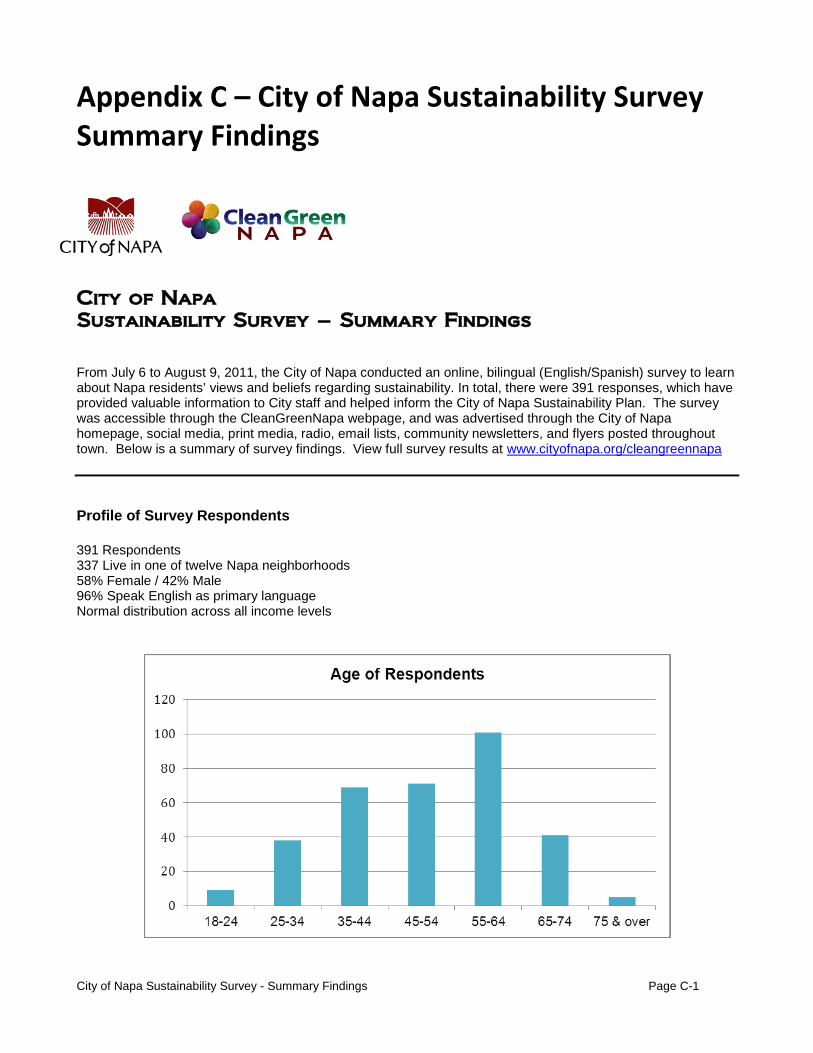
City of Napa Sustainability Survey - Summary Findings Page C-1
Appendix C – City of Napa Sustainability Survey Summary Findings
City of Napa Sustainability Survey – Summary Findings From July 6 to August 9, 2011, the City of Napa conducted an online, bilingual (English/Spanish) survey to learn about Napa residents’ views and beliefs regarding sustainability. In total, there were 391 responses, which have provided valuable information to City staff and helped inform the City of Napa Sustainability Plan. The survey was accessible through the CleanGreenNapa webpage, and was advertised through the City of Napa homepage, social media, print media, radio, email lists, community newsletters, and flyers posted throughout town. Below is a summary of survey findings. View full survey results at www.cityofnapa.org/cleangreennapa Profile of Survey Respondents 391 Respondents 337 Live in one of twelve Napa neighborhoods 58% Female / 42% Male 96% Speak English as primary language Normal distribution across all income levels
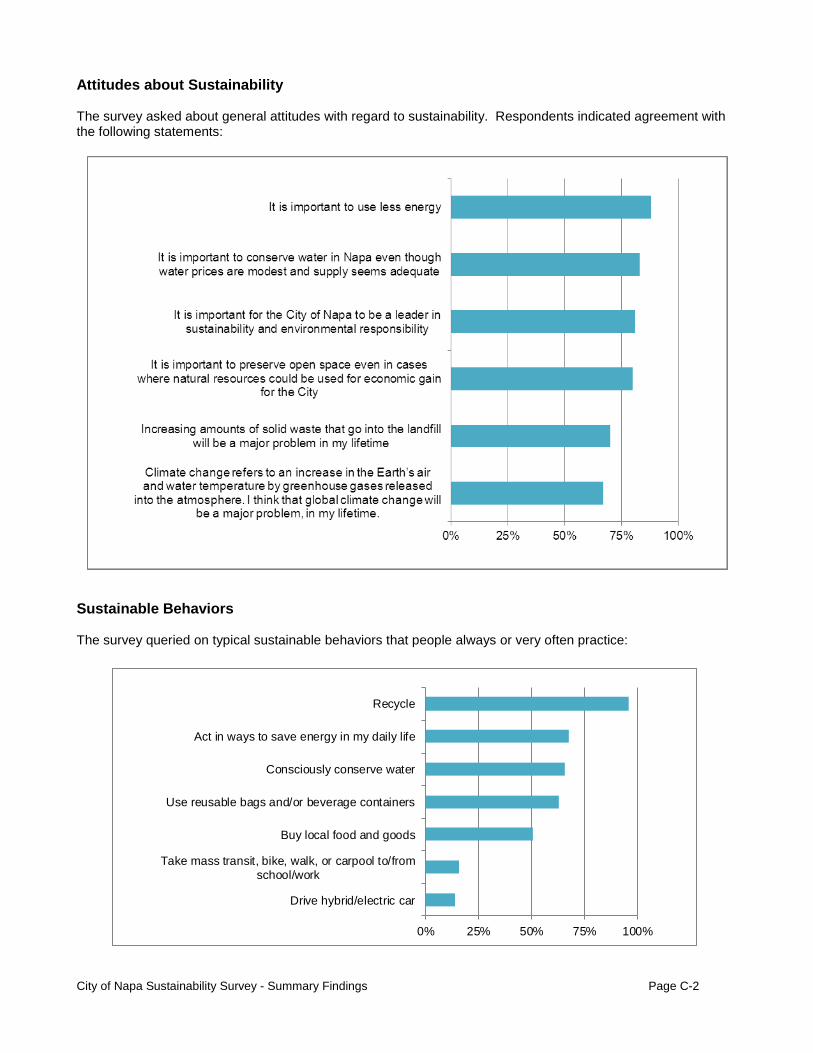
City of Napa Sustainability Survey - Summary Findings Page C-2
0% 25% 50% 75% 100%
Drive hybrid/electric car
Take mass transit, bike, walk, or carpool to/fromschool/work
Buy local food and goods
Use reusable bags and/or beverage containers
Consciously conserve water
Act in ways to save energy in my daily life
Recycle
Attitudes about Sustainability The survey asked about general attitudes with regard to sustainability. Respondents indicated agreement with the following statements:
Sustainable Behaviors The survey queried on typical sustainable behaviors that people always or very often practice:
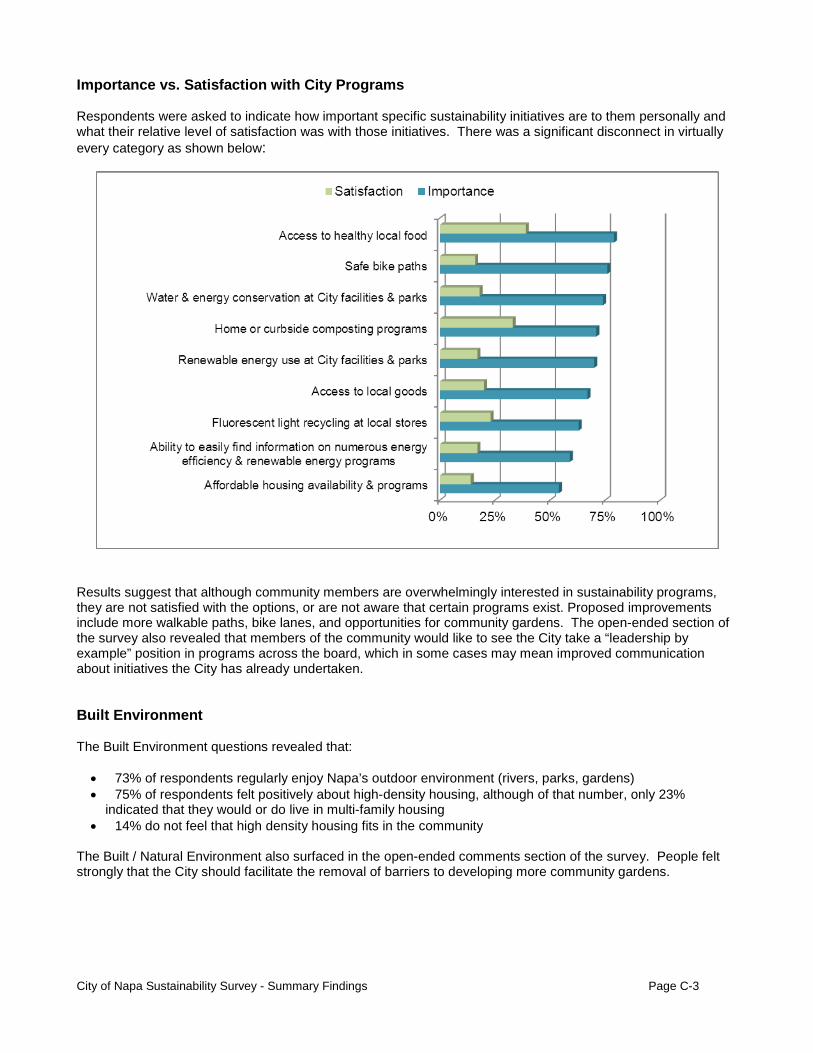
City of Napa Sustainability Survey - Summary Findings Page C-3
Importance vs. Satisfaction with City Programs Respondents were asked to indicate how important specific sustainability initiatives are to them personally and what their relative level of satisfaction was with those initiatives. There was a significant disconnect in virtually every category as shown below:
Results suggest that although community members are overwhelmingly interested in sustainability programs, they are not satisfied with the options, or are not aware that certain programs exist. Proposed improvements include more walkable paths, bike lanes, and opportunities for community gardens. The open-ended section of the survey also revealed that members of the community would like to see the City take a “leadership by example” position in programs across the board, which in some cases may mean improved communication about initiatives the City has already undertaken. Built Environment The Built Environment questions revealed that: • 73% of respondents regularly enjoy Napa’s outdoor environment (rivers, parks, gardens) • 75% of respondents felt positively about high-density housing, although of that number, only 23%
indicated that they would or do live in multi-family housing • 14% do not feel that high density housing fits in the community
The Built / Natural Environment also surfaced in the open-ended comments section of the survey. People felt strongly that the City should facilitate the removal of barriers to developing more community gardens.
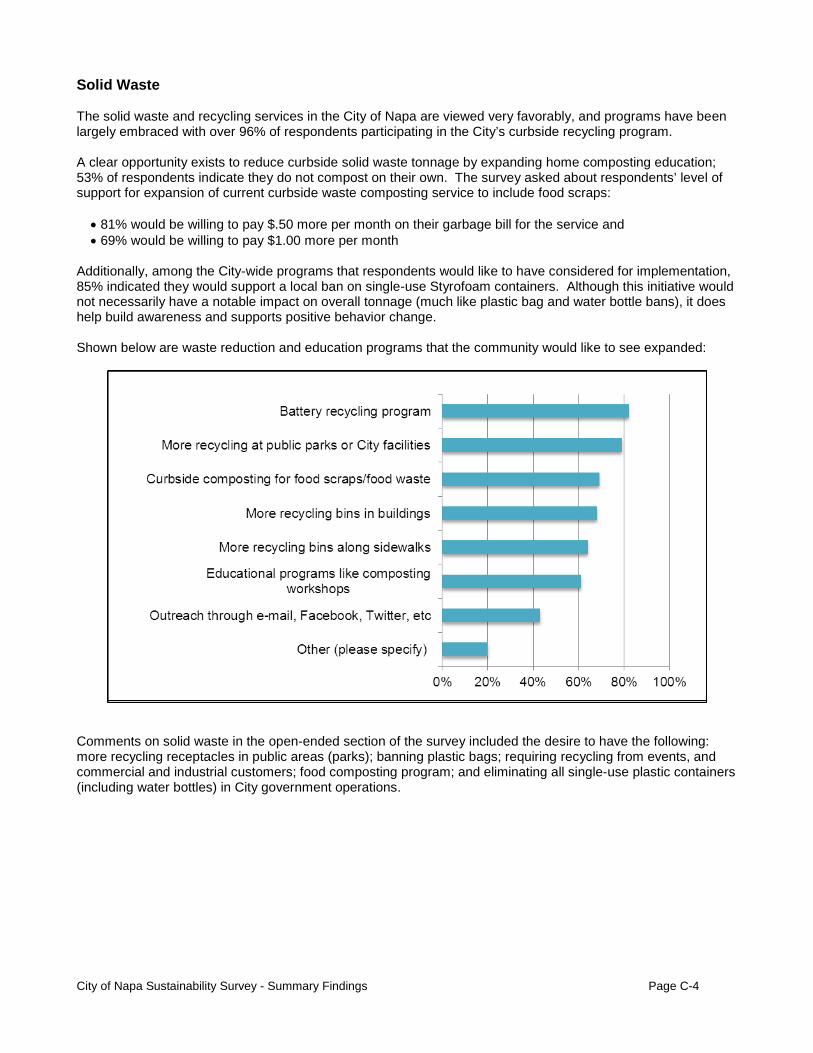
City of Napa Sustainability Survey - Summary Findings Page C-4
Solid Waste The solid waste and recycling services in the City of Napa are viewed very favorably, and programs have been largely embraced with over 96% of respondents participating in the City’s curbside recycling program. A clear opportunity exists to reduce curbside solid waste tonnage by expanding home composting education; 53% of respondents indicate they do not compost on their own. The survey asked about respondents’ level of support for expansion of current curbside waste composting service to include food scraps:
• 81% would be willing to pay $.50 more per month on their garbage bill for the service and • 69% would be willing to pay $1.00 more per month
Additionally, among the City-wide programs that respondents would like to have considered for implementation, 85% indicated they would support a local ban on single-use Styrofoam containers. Although this initiative would not necessarily have a notable impact on overall tonnage (much like plastic bag and water bottle bans), it does help build awareness and supports positive behavior change. Shown below are waste reduction and education programs that the community would like to see expanded:
Comments on solid waste in the open-ended section of the survey included the desire to have the following: more recycling receptacles in public areas (parks); banning plastic bags; requiring recycling from events, and commercial and industrial customers; food composting program; and eliminating all single-use plastic containers (including water bottles) in City government operations.
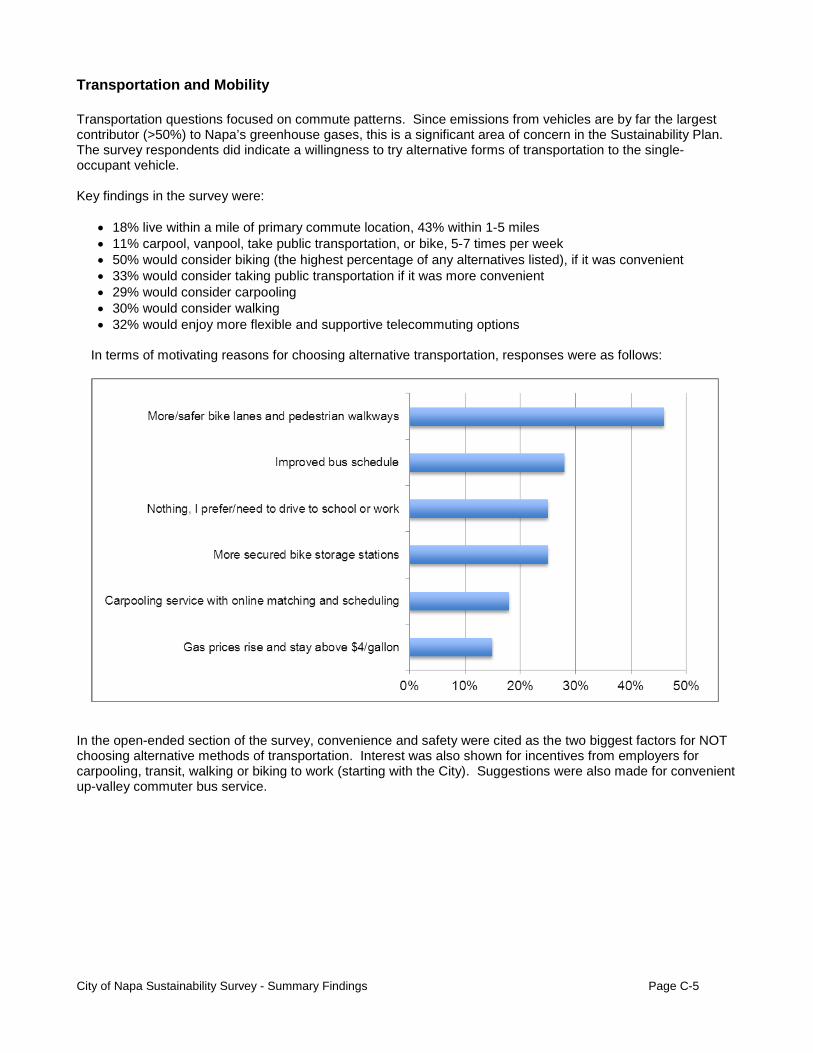
City of Napa Sustainability Survey - Summary Findings Page C-5
Transportation and Mobility Transportation questions focused on commute patterns. Since emissions from vehicles are by far the largest contributor (>50%) to Napa’s greenhouse gases, this is a significant area of concern in the Sustainability Plan. The survey respondents did indicate a willingness to try alternative forms of transportation to the single-occupant vehicle. Key findings in the survey were:
• 18% live within a mile of primary commute location, 43% within 1-5 miles • 11% carpool, vanpool, take public transportation, or bike, 5-7 times per week • 50% would consider biking (the highest percentage of any alternatives listed), if it was convenient • 33% would consider taking public transportation if it was more convenient • 29% would consider carpooling • 30% would consider walking • 32% would enjoy more flexible and supportive telecommuting options
In terms of motivating reasons for choosing alternative transportation, responses were as follows:
In the open-ended section of the survey, convenience and safety were cited as the two biggest factors for NOT choosing alternative methods of transportation. Interest was also shown for incentives from employers for carpooling, transit, walking or biking to work (starting with the City). Suggestions were also made for convenient up-valley commuter bus service.
City of Napa Sustainability Survey - Summary Findings Page C-6
Energy The energy used to light and heat the homes and businesses of Napa is the second largest contributor to greenhouse gas emissions in the community (37%). Energy conservation is by far the easiest and most cost-effective way to impact emissions in the community. Awareness of incentive and rebate programs among the respondents scored a relatively high 69%; however, through the process of developing the Sustainability Plan, it became clear that converting awareness into adoption remains a barrier. The survey also measured willingness of respondents to invest in energy efficiency. A majority of respondents have invested in energy conservation upgrades such as fixtures or appliances for their home or business; only 16% indicated that they had not invested anything. The primary reasons for investing were cited as follows:
• 48% invested to help the environment by using less of a finite resource • 30% invested to save money on PG&E bills
The number one reason for not investing in energy efficient upgrades was that people were renting and felt they had no real incentive. Almost half of the respondents did show interest in education programs and workshops on available incentives, rebates and do-it-yourself low-cost upgrades. Water Water conservation has been a prominent issue in California for decades and for the most part, the survey reflected a high level of awareness around conservation issues. Additionally, with the recent water rate increase, the community has a heightened level of awareness of water issues in the City. One troubling statistic is that of the respondents, 24% do not drink the City’s tap water. A host of reasons were cited, and most centered on the perception that the water is not safe to drink, is discolored, too chlorinated or tastes bad. The water department indicated that while some of these complaints may have been valid in the past due to infrastructure breakdowns, the new ozone system has nullified these concerns. Education about the City’s efforts to deliver safe drinking water should help in this area. Availability of in-home filtration devices should also increase willingness to drink City tap water. Another interesting finding was that over half of respondents do not understand the connection between energy use and water conservation. For City Operations, water pumping, filtration and delivery is the largest user of energy. Education about how water conservation contributes to energy conservation and ultimately lower greenhouse gas emissions will be important as Napa begins implementing its emissions reduction strategy.
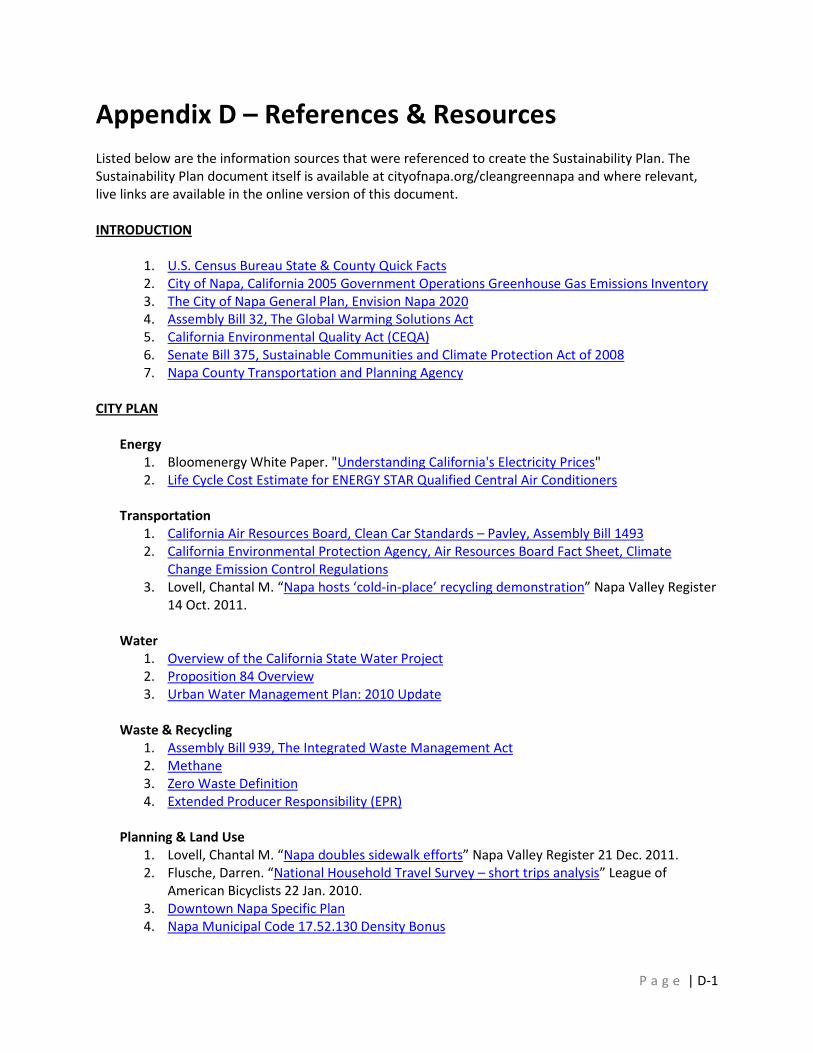
P a g e | D-1
Appendix D – References & Resources Listed below are the information sources that were referenced to create the Sustainability Plan. The Sustainability Plan document itself is available at cityofnapa.org/cleangreennapa and where relevant, live links are available in the online version of this document. INTRODUCTION
1. U.S. Census Bureau State & County Quick Facts 2. City of Napa, California 2005 Government Operations Greenhouse Gas Emissions Inventory 3. The City of Napa General Plan, Envision Napa 2020 4. Assembly Bill 32, The Global Warming Solutions Act 5. California Environmental Quality Act (CEQA) 6. Senate Bill 375, Sustainable Communities and Climate Protection Act of 2008 7. Napa County Transportation and Planning Agency
CITY PLAN
Energy 1. Bloomenergy White Paper. "Understanding California's Electricity Prices" 2. Life Cycle Cost Estimate for ENERGY STAR Qualified Central Air Conditioners
Transportation 1. California Air Resources Board, Clean Car Standards – Pavley, Assembly Bill 1493 2. California Environmental Protection Agency, Air Resources Board Fact Sheet, Climate
Change Emission Control Regulations 3. Lovell, Chantal M. “Napa hosts ‘cold-in-place’ recycling demonstration” Napa Valley Register
14 Oct. 2011. Water
1. Overview of the California State Water Project 2. Proposition 84 Overview 3. Urban Water Management Plan: 2010 Update
Waste & Recycling
1. Assembly Bill 939, The Integrated Waste Management Act 2. Methane 3. Zero Waste Definition 4. Extended Producer Responsibility (EPR)
Planning & Land Use
1. Lovell, Chantal M. “Napa doubles sidewalk efforts” Napa Valley Register 21 Dec. 2011. 2. Flusche, Darren. “National Household Travel Survey – short trips analysis” League of
American Bicyclists 22 Jan. 2010. 3. Downtown Napa Specific Plan 4. Napa Municipal Code 17.52.130 Density Bonus
P a g e | D-2
COMMUNITY PLAN
Introduction 1. NCTPA Napa Countywide Community Climate Action Framework 2. Association of Bay Area Governments, Projections 2009 3. California Department of Finance, Population Projections by Race/Ethnicity for California
and Its Counties 2000-2050
Mobility and Transportation 1. NCTPA Napa Countywide Community Climate Action Framework 2. Lovell, Chantal. “’Kidical Mass’ teaches bike safety” Napa Valley Register 3 Oct. 2011. 3. Napa Valley Vine Trail 4. Solano Napa Commuter Info, Solano Commute Challenge 5. Safe Routes to Schools legislation 6. Around the Capital briefs
Energy
1. NCTPA Napa Countywide Community Climate Action Framework 2. Building Standards Commission, BSC Law 3. Wood, Daniel B. “Renewable energy: will new law help or hurt California economy?” The
Christian Science Monitor 13 Apr. 2011. 4. California Energy Commission, Revised Draft Regulations. “Nonresident Building Energy Use
Disclosure Program.” Aug. 2011. 5. PG&E SmartMeterTM information 6. PG&E Bills Explained 7. Kreycik, Claire. “Delivering Solar: Group Purchasing is Driving Down Costs for Customers”
NREL Renewable Energy Project Finance 9 Dec. 2011. 8. U.S. Department of Energy, Energy Efficiency & Renewable Energy, Solar America
Communities. “The Solarize Guidebook: A Community Guide to Collective Purchasing of Residential PV Systems.”
9. California Energy Efficiency Standards – Title 24 10. Title 24 Energy Calculations Report 11. Order Instituting Rulemaking AB 1103 12. California’s Major Sources of Energy 13. Around the Capital – Electrical Corporations 14. California Department of Community Services and Development, “Low-Income Home
Energy Assistance Program (LIHEAP)”
Waste and Recycling 1. Cal Recycle, Laws Related to Waste Management Regulations 2. Cal Recycle, Local Government Central, Goal Measurement FAQs 3. Cal Recycle, Local Government Central, Per Capita Disposal and Goal Measurement (2007
and Later)
Local Food 1. LFAC survey was designed with local input and conducted by the Napa Valley College Small
Business Development Center and Bianco Ag Services. Businesses and growers from American Canyon, Calistoga, Napa, St. Helena, and Yountville contributed to the survey.
P a g e | D-3
2. Nissenson, Michael. “Food Day Celebrates Napa Valley farming” Napa Valley Register 25 Oct. 2011.
3. Napa County CA Agricultural Commissioner Sealer of Weights and Measures 4. Napa Farmers Market 5. Napa Local Food Forum Facebook page 6. Beekeepers of Napa Valley 7. Slow Money Northern California website 8. Slow Money Northern California Facebook page 9. UC Master Gardeners of Napa County 10. Heifer International 11. Sonoma-Napa Heifer International Chapter 12. San Francisco Urban Forest Map 13. U.S. Environmental Protection Agency, Heat Island Effect 14. Kauffman, Jonathan. “California Cottage Food Bill Could Make It Easier to Start a Small Food
Business.” SF Weekly Blogs 6 Mar. 2012.
Natural & Built Environment 1. Napa County Flood Control and Water Conservation District 2. City of Napa Downtown Riverfront Urban Design Plan Part I 3. USGBC 4. Napa County Farm Bureau 5. Napa County Landmarks 6. Land Trust of Napa County 7. Friends of the Napa River 8. California Native Plant Society Napa Valley Chapter 9. Napa County Resource Conservation District 10. Preservation Napa Valley 11. City of Napa Trees 12. ABAG/BAAQMD/BCDC/MTC Joint Policy Committee
Local Business & Economy
1. Napa County Workforce Investment Board, Napa County’s Emerging Green Economy 2. Bay Area Green Business Program 3. Napa County Environmental Management, Napa County Green Business and Winery
Program 4. Napa Chamber of Commerce 5. Napa County Hispanic Chamber of Commerce 6. Downtown Napa Association/Do Napa Facebook page 7. Napa Valley Destination Council 8. Napa County Housing & Intergovernmental Affairs, Napa Valley Tourism Improvement
District 9. Napa-Lake Workforce Investment Board 10. eLobbyist Bill Text: California ABX126
Community Connectedness
1. Leadership Napa Valley 2. Napa County Historical Society 3. Napa Porchfest
P a g e | D-4
4. Napa County Landmarks 5. Napa Downtown Association. “Napa Chef’s Market Season Began Thursday May 19th In
Napa” 12 May 2011. 6. Thrive Napa Valley 7. Napa Valley CanDo 8. Sustainable Napa County 9. Somos Napa 10. Puertas Abiertas 11. Napa County Hispanic Network 12. Association of Napa Neighborhoods 13. McPherson Neighborhood Initiative 14. Napa County Historical Society
In addition to the sources cited above, Sustainability Plans and Climate Action Plans of several jurisdictions were referenced. Below are the sources that were most influential in the development of the format and content of the City of Napa Sustainability Plan:
1. Napa County Climate Action Plan, Revised October 31, 2011 2. City of San Rafael Climate Change Action Plan, April 2009 3. City of Portland and Multnomah County Climate Action Plan 2009 4. Climate Action Plan for San Francisco September 2004 5. PLANYC April 2007 6. City of Austin Office of Sustainability, Austin Climate Protection Program
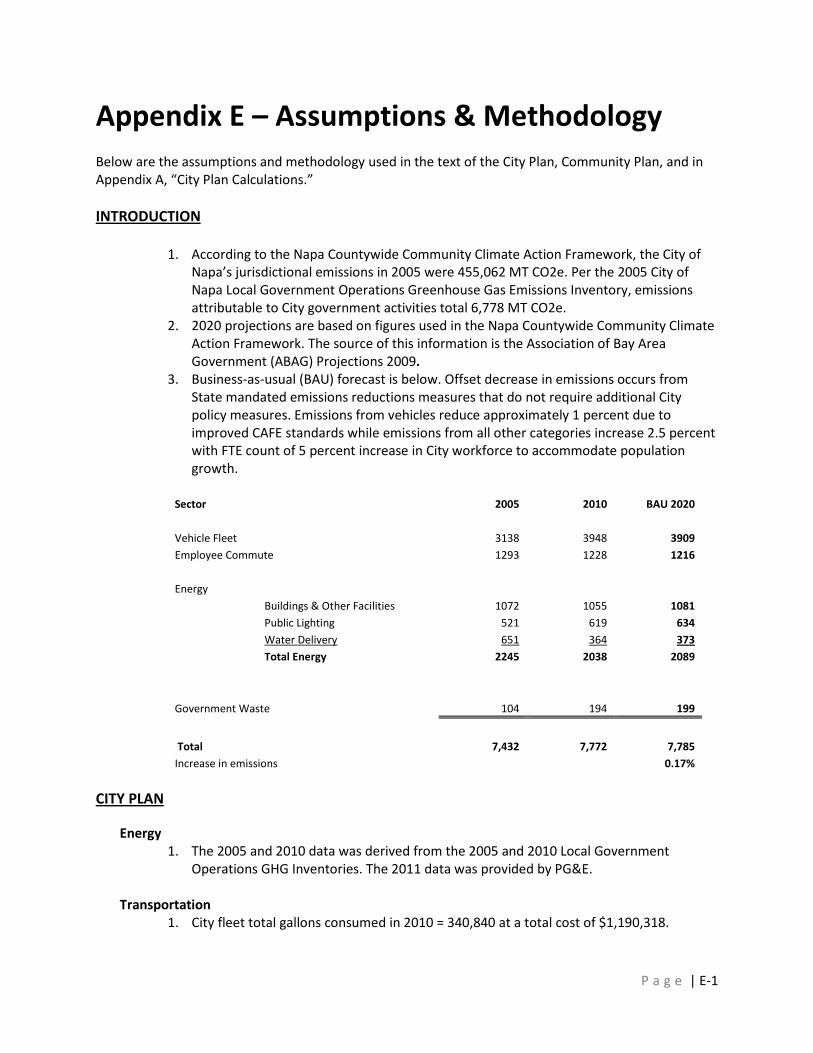
P a g e | E-1
Appendix E – Assumptions & Methodology Below are the assumptions and methodology used in the text of the City Plan, Community Plan, and in Appendix A, “City Plan Calculations.” INTRODUCTION
1. According to the Napa Countywide Community Climate Action Framework, the City of Napa’s jurisdictional emissions in 2005 were 455,062 MT CO2e. Per the 2005 City of Napa Local Government Operations Greenhouse Gas Emissions Inventory, emissions attributable to City government activities total 6,778 MT CO2e.
2. 2020 projections are based on figures used in the Napa Countywide Community Climate Action Framework. The source of this information is the Association of Bay Area Government (ABAG) Projections 2009.
3. Business-as-usual (BAU) forecast is below. Offset decrease in emissions occurs from State mandated emissions reductions measures that do not require additional City policy measures. Emissions from vehicles reduce approximately 1 percent due to improved CAFE standards while emissions from all other categories increase 2.5 percent with FTE count of 5 percent increase in City workforce to accommodate population growth.
Sector
2005 2010 BAU 2020
Vehicle Fleet
3138 3948 3909 Employee Commute 1293 1228 1216
Energy
Buildings & Other Facilities 1072 1055 1081
Public Lighting 521 619 634
Water Delivery 651 364 373
Total Energy 2245 2038 2089
Government Waste 104 194 199
Total
7,432 7,772 7,785 Increase in emissions
0.17%
CITY PLAN
Energy 1. The 2005 and 2010 data was derived from the 2005 and 2010 Local Government
Operations GHG Inventories. The 2011 data was provided by PG&E.
Transportation 1. City fleet total gallons consumed in 2010 = 340,840 at a total cost of $1,190,318.
P a g e | E-2
2. City fleet total gallons consumed in 2011 = 343,264 at a total cost of $1,391,299. The data source was transaction data and data derived from software utilized by the City of Napa Fleet Division.
Water
1. Total electricity use attributable to water treatment and transport according to 2010 GHG Inventory = 1,403,009 kWh
2. Total electricity use attributable to City operations = 6,992,524 kWh 1,404,009 / 6,992,524 = 20%
Recycling & Waste Reduction
1. 2006 data is used instead of 2005 because the City’s recycling contractor changed in 2005 and this is the best data available proximate to 2005
2. Tons of waste landfilled and diverted data provided by NRWS. This data differs from what is reflected in the 2005 and 2010 GHG Inventory, as this is believed to be a more accurate estimate based on improved data collection methodology.
3. Tons of waste landfilled includes waste collected at City facilities, produced by City construction projects, and collected at public parks. 2006 Tons of Waste Landfilled is believed to be a slight underestimate since data is not available for the 2006 waste produced by City construction projects.
4. Tons of waste diverted includes waste that was diverted from the landfill and is recycled, composted, or re-used instead. This includes waste produced by the City as a result of paving that is re-used to make new aggregate, in the following estimated amounts: 2006 – 500 tons, 2010 – 2,000 tons, 2011 – 11,000 tons
COMMUNITY PLAN
Introduction 1. According to the Napa Countywide Community Climate Action Framework, the City of
Napa’s jurisdictional emissions in 2005 were 455,062 MT CO2e. Per the 2005 City of Napa Local Government Operations Greenhouse Gas Emissions Inventory, emissions attributable to City government activities total 6,778 MT CO2e.
2. 2020 projections are based on figures used in the Napa Countywide Community Climate Action Framework. The source of this information is the Association of Bay Area Government (ABAG) Projections 2009.
APPENDIX A - CITY PLAN CALCULATIONS
Energy Table E1
1. The 2005 and 2010 data was derived from the 2005 and 2010 Local Government Operations GHG Inventories. The 2011 data was provided by PG&E. The 2020 target is based on Assembly Bill 32 and the City’s current progress to date.
2. Cost and cost savings are dependent on operational use and PG&E’s kWh rate. Energy rates are expected to raise 5-7 percent each year. In 2010, the City’s rate was $0.15 kWh for facilities and $0.12173 for streetlights.
P a g e | E-3
3. Source of MTCO2e at 0.524 lbs CO2 per kWh is from PG&E's ClimateSmart program, authorized by the California public Utilities Commission ("CPUC") in Decision 06-12-032. The most accurate measure of emissions from power generation is a complex factor based on individual plants with daily and seasonal fluctuations. THE CPUC's reasonable approximation is based on average emissions for PG&E's electric portfolio consistent with the emissions rate independently certified and registered each year with the California Climate Action Registry.
Table E2
1. E1. Continue retrofitting streetlights with LEDs Calculations based on City of Napa Phase III LED Streetlight estimates provided
by PG&E. 4,422 streetlights remain as an opportunity for retrofit. Of these, 3,649 are 70
W and most likely to be retrofitted. Net estimated cost is $2,087,054 / 4,422 = average $472 per streetlight
o $472 x 400 lights = $188,800 Estimated energy savings for retrofits of 70 W lights = 932,684 kWh / 3,649 =
average 256 kWh per streetlight o 256 kWh x 400 lights = 102,400 kWh
Estimated energy cost savings for retrofits of 70 W lights = $118,621.69 / 3,649 = average $33 per streetlight
o $33 x 400 lights = $13,200 2. E2. City lighting retrofits in City facilities
Based on phase III information provided by City lighting retrofit contractor. 3. E3. Continue replacing HVAC units with energy efficient models and develop a
replacement schedule 5 units replaced/year, average 4 tons/unit (most units are 5 or 3 tons) Per unit HVAC cost based on average of $11,500 per unit 9.5 efficiency to 13.0 efficiency Use 10,000 sf office Conservatively estimate 8,000 kWh/year savings Assume $0.15/kWh
4. E4. Continue server virtualization 6 servers will be virtualized 6 x .225 kW x 8,760 hours = 11,826 kWh + cooling savings of 56% = 6,623 kWh Total kWh savings = 18,449 kWh
5. E5. Utilize virtual computing technology to reduce the number of physical desktops and save energy 497 CPUs would no longer be using energy.
o On mode: 497 x 0.09 kW x 4,380 hours = 195, 917 kWh 2 new servers
o $11,000 each o Energy load = 2 x 0.675 kW x 8,760 hours = 11,826 kWh o Cooling load = 2 x 0.675 x 4,906 hours = 6,623 kWh
Net savings – cooling load o 195,917 kWh – 11,826 kWh – 6,623 kWh = 177,468 kWh
6. E6. Support behavior change and install micro-controls
P a g e | E-4
Assume a 2% annual reduction in energy use in public facilities can be achieved between 2010 and 2015. 2010 GHG Inventory used as baseline. Public buildings energy use = 3,165,610 kWh, and 5% = 63,312 kWh
7. E7. Explore feasibility of adding more renewable energy on City property Assumed 500 KW installed systems 2011 energy use was 6,826,905 kWh Used the following websites for assumptions:
o http://mapserve3.nrel.gov/PVWatts_Viewer/index.html o Assumed $0.17/kWh
o http://www.solar-estimate.org/ If the City moves forward installing energy on an accelerated timeline, it is
possible that the systems will not begin producing energy until after 2015, however the process will likely begin before 2015.
Transportation
Table T1. 1. Data is based on the 2005 LGO GHG Inventory, and data provided by the City’s Fleet
Manager. The 2010 and 2011 data source is the transaction data, which reflects actual fuel dispensed and charged to the City.
2. VMT and gallons of fuel reduction targets based on goals to 1) Reduce gallons of fuel by 15 percent below 2010 levels by 2020 and 2) Reduce VMT by 2 percent below 2010 levels by 2020
3. Calculation for metric tons of CO2e in 2015 and 2020 is estimated based on US EPA factor for average heat ad emissions content of gasoline (71.35 kg CO2/mmbtu or 8.92 MTCO2e per gallon) and compressed natural gas (25% reduction from gasoline or 6.69 MTCO2e per gallon) based on US Department of Energy Alternative Fuels and Advanced Vehicles Data.
Table T2. 1. 2005 and 2010 data is based on the 2005 and 2010 LGO GHG Inventories. 2011 data
provided by the City’s recycling contractor, NRWS. 2. 2015 VMT and 2020 VMT determined by taking average of 2010 and 2011 VMT per
collection vehicle, and applying this to the estimated total number of trucks in 2015 and 2020. 764,468 + 794,956 = 1,559,424 miles 18+7 + 18 +7 = 50 vehicles 1,559,424 / 50 = 31,189 miles per vehicle 2015: 31,189 x 27 vehicles = 842,103 2020: 31,189 x 29 vehicles = 904,481
3. Based on 2010 and 2011 fuel data, each truck uses approximately 12,830 therms of CNG or 10,830 gallons of diesel. Diesel hybrids are estimated to be 30% more efficient than diesel vehicles, and therefore use approximately 7,581 gallons of diesel per vehicle. These assumptions were applied to the number of diesel, CNG, and hybrid-diesel trucks anticipated for purchase in 2015 and 2020. 2015
7 x 12,830 = 89,810 therms 19 x 10,830 = 205,770 gallons 1 x 7,581 = 7,581 gallons
P a g e | E-5
2020 14 x 12,830 = 179,620 therms 14 x 10,830 = 151,620 gallons 1 x 7,581 = 7,581 gallons
4. From 2011-2015, number of hauling vehicles is estimated to grow from 25 to 27, and
from 2015 to 2020, from 27 to 29. The estimate of 14 CNG vehicles in 2020 is based on a recent grant application for an Anaerbic Digester. If funded, the digester would supply enough CNG for 14 CNG vehicles.
5. Calculation for metric tons of CO2e in 2015 and 2020 is estimated based on US EPA factor for average heat ad emissions content of gasoline (71.35 kg CO2/mmbtu or 8.92 MTCO2e per gallon) and compressed natural gas (25% reduction from gasoline or 6.69 MTCO2e per gallon) based on US Department of Energy Alternative Fuels and Advanced Vehicles Data.
Table T3. 1. Annual savings calculated on average gas price of $4.25 per gallon 2. T1. Encouraging staff to take alternative transportation will have an impact on
community VMT and GHG, not City 3. T2. Fleet will add two electric cars by 2015 that offset emissions from 12,000 miles /
year in combustion engine. City will install two electric charging stations at a cost of approximately $9,000 each.
4. T3. Electronic tracking technology attributes 2% savings in VMT and fuel per additional installed vehicle via speeding vehicle enforcement action and improved routing.
5. T4. Anti-idling does not decrease VMT, but contributes to fuel efficiency 6. T5. Right sizing of fleet will have no incremental cost beyond planned capital
expenditures. Model assumes Police cruisers are replaced every 3 years to more efficient vehicles at approximately 80% of CAFÉ standard and all other fleet (besides fire trucks) replaced approximately every 8 years – roughly 15% of fleet is replaced in any given year. Average MPG of fleet rises from 9.0 in 2011 to 14.6 in 2015
7. T6. Pooling concept could conceivably increase by 50% to 15 vehicles in 2015 for modest overall savings. Average pool vehicle drove 3,114 miles in 2010 compared to over 5,000 for non-pooled candidates representing potential savings of 36% on 5 vehicles
Water
Table W1. 1. 2011 is estimated because the method used to calculate population, and therefore
GPCD, was not available for 2011 at the time this Plan was written. Since 2010 data is the most accurate, this is the year that will be used to determine the gap that remains, and will serve as the baseline year for Table W2.
2. MTCO2e attributable to water is included in Table E1 and occurs as a result of energy used to treat and pump water.
Table W2. 1. Improved economic conditions, commercial development, and hotter summers are
expected to place a natural upward pressure of 9 GPCD from 2010 to 2015. Conservation actions listed in this table (4.9 GPCD), along with tiered water rates (1.5
P a g e | E-6
GPCD) and HPBO/WELO (1 GPCD), are expected to provide at least 7 GPCD in savings, resulting in a net increase of just 2 GPCD.
2. Annual water savings ($) are based on estimated $450 per acre-foot total water production costs (source water, treatment plant, chemicals).
3. W1. The cost to convert additional customers to recycled water includes the loss of revenue experienced by the City as a result of “losing” a paying customer. Installation costs are covered by customer/NSD, City water revenue loss is made whole through NSD reimbursement over 3 to 5 years
4. W2. Water Efficiency Audits – 20 parks x 2 people x 8 hrs, 10 buildings x 1 person x 4 hrs, plus replacement devices;
5. W3. Water Loss Reduction – assumed potential costs of leak repairs; 6. W4. Cash For Grass – net cost for 750,000 square feet accounting for known Prop 84
grant reimbursement; 7. W5. Smart Irrigation Controllers – net cost for 2,000 single-family and 2,000 commercial
valves accounting for known Prop 84 grant funding; 8. W6. Landscaper Education – net cost of 5 classes with assumed Bay-Friendly Prop 84
grant contribution.
Recycling & Waste Reduction Table R1.
5. 2006 data is used instead of 2005 because the City’s recycling contractor changed in 2005 and this is the best data available proximate to 2005
6. Tons of waste landfilled and diverted data provided by NRWS. This data differs from what is reflected in the 2005 and 2010 GHG Inventory, as this is believed to be a more accurate estimate based on improved data collection methodology.
7. Tons of waste landfilled includes waste collected at City facilities, produced by City construction projects, and collected at public parks. 2006 Tons of Waste Landfilled is believed to be a slight underestimate since data is not available for the 2006 waste produced by City construction projects.
8. Tons of waste diverted includes waste that was diverted from the landfill and is recycled, composted, or re-used instead. This includes waste produced by the City as a result of paving that is re-used to make new aggregate, in the following estimated amounts: 2006 – 500 tons, 2010 – 2,000 tons, 2011 – 11,000 tons
Table R2
1. R1. The City’s Recycling Division has a $20,000 contract for ongoing support related to implementing a Sustainable Purchasing Policy. In Fiscal Year 2010/2011, the City spent an estimated $179,221 on office supplies. Assume the SPP results in ½ % savings each year in 2013, 2014, and 2015. 2007 Sonoma County Waste Management Agency study revealed that approximately 33% of the commercial waste stream is comprised of paper, plastic, and hazardous and e-waste products. Assume that 10% of the City of Napa’s waste stream is office supplies. Assume that the tons of waste attributable to office supplies can be reduced by 2% each year in 2013, 2014, and 2015. 448 tons of waste x 0.10 = 44.8 tons x 0.02 = .896 tons
2. R2. $25,000/year is based on the infrastructure that would be necessary to implement a food composting program at City facilities. 2007 Sonoma County Waste Management Agency study revealed that over 26% of the commercial waste stream is comprised of food waste. Assume that 10% of the City of Napa’s waste stream is food waste, and that
P a g e | E-7
about half of this (5% of the total waste stream) could be diverted from the waste stream. 448 tons of waste x 0.05 = 22.4 tons
3. R3. Centralize and streamline printing functions - City operations accounted for 2,917,500 sheets of 8.5” x 11” paper, at a total cost of $22,243. Assume 5% reduction in amount of paper used. Saves $1,112 and 145,875 sheets of paper. Used EPA Standard Volume-to-Weight Conversation Factors to determine one paper ream = 500 sheets and #20 weighs 5 lbs. = .0025 tons.
145,875 / 500 = 291.75 reams 291.75 reams x .0025 tons = .73 tons
4. R4. Implement a two-sided printing policy - City operations accounted for 2,917,500 sheets of 8.5” x 11” paper, at a total cost of $22,243. Assume 15% savings in quantity of paper used. Saves $3,336 and 437,625 sheets of paper. Used EPA Standard Volume-to-Weight Conversation Factors to determine one paper ream = 500 sheets and #20 weighs 5 lbs. 5 lbs = .0025 tons 437,625 / 500 = 875.25 reams 875.25 reams x .0025 tons = 2.19 tons
5. R5. Increase the number of recycle bins at the Corp yard and in administrative areas is based on the costs for new and replacement equipment. Assumes 1% reduction in total tons of waste collected from City facilities. 448 tons x .01 = 4.48 tons
Planning & Land Use Table P1
1. P1. Phase I HPBO total costs included managing the task force, completing staff review, and drafting the final work product. The estimated total cost was $30,000. Phase II HPBO scope of work would be very similar, and the cost is estimated to be 25% less, taking into account lessons learned from phase I. The Phase II total estimated cost is $22,500.
2. P2. Financing mechanisms include: General Fund transfers, state and federal grants and programs, grants, water/sewer rates, private sector funding from new development, existing development impact fees, possible new taxes and other new funding sources such as special districts.
3. P3. The existing HPBO already contains these policies, as does the Downtown Specific Plan in the parking and circulation design guidelines and the sustainability design guidelines. However, the City would need to broaden this to include city-wide policies; this may contribute to costs, as would staff time to create an updated zoning ordinance.
4. P4. The estimated budget for the Sidewalk Improvement Program including labor, materials, equipment, outside services, and contingency to install 1,200 cubic yards of concrete annually is $1,085,776. Funding sources for the program include $500,000 from General Fund Sidewalk CIP, $435,776 from Gas Tax ($395,500 currently budgeted for concrete work in Street Resurfacing Program) and $150,000 from CDBG program.
5. P5. $30,000 based on estimated costs for a consultant to assist with the creation of a Comprehensive Economic Development Strategy (CEDS).
6. P6. $10,000 is cost estimate to pursue funding and prepare grant applications.
P a g e | F-1
Appendix F – Local Plans, Policies, & Guidelines The City of Napa has adopted many plans, policies, and guidelines that demonstrate a longstanding commitment to a sustainable community and City government. Many of these documents are described below. Best Management Practices Water conservation is an integral part of the City of Napa's long-term water management strategy. As a signatory to the Memorandum of Understanding Regarding Urban Water Conservation in California, the City is committed to implementing the appropriate Best Management Practices (BMPs) to ensure future supply reliability. To comply with the Water Conservation Act of 2009 (SBx7-7), the City must reduce its demand below 132 gallons per capita per day (GPCD) by 2020. Examples of BMPs implemented by the City include public information and school education programs, a conservation rate structure, system water loss control, home and business audits, high-efficiency clothes washer rebates, and a highly successful toilet replacement program. City of Napa Bicycle Plan In 2012, Napa County Transportation & Planning Agency (NCTPA) developed a draft Countywide Bicycle Plan Update. As a part of this update, a bicycle plan was developed for each of the jurisdictions in the county, including the City of Napa. The goal of the plan is to increase the number of persons who bicycle throughout the City and County of Napa, and the plan is accordingly developed with all types of bicyclists in mind. It is intended that the City of Napa adopt the Bicycle Plan as an update to the City’s General Plan in 2012. Construction and Demolition Debris Recycling Ordinance The Construction and Demolition Debris (CD&D) Recycling Ordinance was adopted by City Council in October 2010. The CD&D Ordinance established waste reduction and recycling requirements for designated projects, such as requiring 50 percent of CD&D waste and 80 percent of concrete to be re-used or recycled. Density Bonus City Council first adopted a Density Bonus in 2000, concurrent with the requirements of the State Density Bonus Law (California Government Code Title 7, Division 1, Chapter 4.3, Sections 65915, et seq.) and the City’s Housing Element. The Density Bonus was updated most recently in 2011, and specifies how the City shall provide density bonuses and other incentives, concessions, or waivers for certain housing projects affordable to lower income, very low income, senior citizen housing, moderate income condominium projects, and child care facilities. Developers may build higher density than current district regulations allow by providing affordable housing that is close to services and transportation. Downtown Specific Plan The Downtown Napa Specific Plan (“Specific Plan”) was adopted by City Council in 2012. It is a “guiding framework for realizing the vision of a vibrant, healthy and balanced pedestrian-oriented city center,” and reflects the desires of City Council, Planning Commission, City staff, and many community stakeholders. The purpose of the Specific Plan is to “illustrate and bring to life the community-based
P a g e | F-2
vision; outline guidelines and development standards that support the vision; and create an implementation action plan to systematically achieve its key objectives.” New development applications that comply with the Specific Plan receive a streamlined public approval process since the environmental impacts were already reviewed in the Specific Plan environmental impact report. Electronic Tracking Technology Policy In 2011, the City adopted the “Electronic Tracking Technology Policy” for fleet vehicles. Electronic tracking technology allows the City to monitor vehicle performance, location, elevation, and velocity, and provides indications where certain practices or policies could be adopted related to fuel efficiency, speeding, idling, etc. The policy was adopted to provide guidance to department heads, managers, supervisors, and employees regarding the City’s use of electronic tracking technology in vehicles it owns or leases. Extended Producer Responsibility Resolution City Council adopted an Extended Producer Responsibility (EPR) Resolution in 2009 to demonstrate support that producers should assume the responsibility to manage waste products, rather than passing the costs along to consumers and local government. A local example of EPR is that in California, beverage manufacturers pay a fee to cover the cost between the scrap value of a container and the cost to recycle it. High Performance Building Ordinance City Council adopted a High Performance Building Ordinance (HPBO) in multiple phases beginning in 2008. The most recent iteration of the HPBO was adopted in December 2010, and integrates sustainable building practices into all new construction projects. The HPBO is more stringent than the 2010 California Green Building Standards Code (CALGreen). Several provisions that were voluntary under CALGreen were made mandatory in the HPBO, including the requirement to achieve 30 percent indoor water savings for non-residential buildings. The next phase of the HPBO will address remodels and additions. Historic Preservation Ordinance The City’s Historic Preservation Ordinance establishes policies and practices for evaluation and preservation of historic resources throughout the city. Preservation accomplishes sustainability goals by avoiding the removal of structures and the associated impacts to landfills and loss of embodied energy, or the total energy expended to create the building and its materials. This is an important concept, as the energy consumed in the construction of a building can far surpass the annual energy use. Over the last few years, the City’s Cultural Heritage Commission and staff have been methodically conducting historic surveys and updating the Historic Resources Inventory to ensure best practices for historic preservation. Solar Photovoltaic Permit Fees Reduction In April 2011, the City Council adopted a resolution lowering residential and non-residential solar photovoltaic (PV) permit fees. The cost of a residential solar PV permit fee decreased from a flat fee of $391.00 to $299.55, and the fee structure of non-residential PV permits went from using valuation as the basis of the fee to using a system’s output instead. Prior to the adoption of the updated solar PV permit fees, a non-residential project with a valuation of $792,000 and a size of 131 kW would have had a permit fee of $10,597. Once the new fees were adopted, the permit fee was $1,219.
P a g e | F-3
Sustainable Purchasing Policy Resolution City Council adopted a Sustainable Purchasing Policy in May 2011. The policy was passed to support the purchase of environmentally preferred products, and provide the City with an opportunity to lead by example. Tiered rate structure City Council adopted a water rate structure beginning in October 2011 for single-family residential customers, to provide the funds necessary to operate, maintain and improve infrastructure over multiple years. The water rates include a tiered structure that reflects the incremental additional costs associated with serving increased quantities of water. These tiered water rates tend to encourage water conservation, and it is anticipated that there will be a resulting decrease in discretionary landscape irrigation, potentially saving up to 1.5 GPCD. Updated Solid Waste and Recycling Enclosure Standards After almost three years of development and review of standards of 20 jurisdictions, the City Council approved significantly updated and revised standards for Solid Waste and Recycling enclosures in October 2008. The purpose of these standards is to accommodate ever-increasing diversion goals and mandates and to provide space and access for adequate recycling and food waste collection. The City itself is influenced by these standards for any new construction and/or significant remodel of City facilities. Water Efficient Landscaping Ordinance (WELO) City Council adopted the most recent WELO in 2010. It imposes tighter water budgets and other prescriptive measures on new landscape projects. The WELO is more stringent than the State Model Water Efficient Landscape Ordinance. Collectively, the HPBO and WELO are expected to reduce the water use of new development by 25 percent, saving up to 1 GPCD for the City overall. The City of Napa General Plan, Envision Napa 2020, is a comprehensive planning document required by the State of California that includes goals and policies for future land use and development. It is a “long-term vision for the physical evolution of Napa and outlines policies, standards, and programs to guide day-to-day decisions concerning Napa’s development through the year 2020.” The General Plan touches on many topics relevant to sustainability, and listed below are the General Plan policies most applicable to the Sustainability Plan. City of Napa General Plan
Community Services
Goal CS-9: To ensure adequate, reliable, and safe water supplies to the community, even through drought periods of similar intensity as the 1986-1992 drought.
Policy CS-9.1: The City shall continue to implement water conservation programs that show promise of saving significant amounts of water at a reasonable cost.
P a g e | F-4
Policy CS-9.6: The City shall promote voluntarily conservation efforts to conserve water to a reasonable extent during multi-year droughts to avoid inordinate expenditures for new water supplies. Policy CS-9.7: The City shall work cooperatively with other agencies having similar needs to identify water supply options that could have mutual benefit and consider entering into joint powers agreements to develop and manage a candidate project.
Goal CS-10: To ensure adequate wastewater collection and treatment and the safe disposal of wastes.
Policy CS-10.1: The City shall promote reduced wastewater system demand through efficient water use by:
a. Requiring water-conserving design and equipment in new construction b. Encouraging retrofitting with water-conserving devices
Policy CS-10.2: The City shall support continued efforts by the Napa Sanitation District to promote the use of reclaimed wastewater.
Goal CS-12: To provide for safe and environmentally sound municipal waste reduction and recycling programs that will allow the City to attain the requirements of AB 939.
Policy CS 12.1: The City shall provide ongoing waste reduction and recycling public awareness and education programs Policy CS 12.2: The City shall continue to monitor its Source Reduction and Recycling Element (SRRE) and Household Hazardous Waste Element (HHWE) to ensure that the City is meeting its waste reduction goals.
Economic Development
Goal ED-1: To maximize the use of Napa’s limited non-residential land supply for employment-generating and revenue-generating uses. Goal ED-2: To retain existing businesses, particularly those that contribute to meeting Napa’s strategic economic goals, and to facilitate their expansion as appropriate.
Housing
Goal H-1: We are a balanced, vital and evolving community, with a socially and economically diverse population that has preserved our small town feel and heritage, sense of community, beautiful natural environment, attractive neighborhoods, vital and diverse businesses and adequate services. Goal H-2: We have lots of housing types and choices. There is an integration of income, ethnicity, and culture in our neighborhoods. There are mixed use projects in our Downtown and in mixed use areas and we have housing over stores. There is a housing mix throughout the City of Napa and diversity of housing (single family, apartments, Single-Room Occupancy housing, condominiums,
P a g e | F-5
smaller units, accessory second units) and the proportion of single family compared to other types of housing will go down in the long term.
Land Use
Goal LU-3: To maintain an even rate of development within the RUL over the time frame of the General Plan. Goal LU-5: To encourage attractive, well-located commercial development to serve the needs of Napa residents, workers, and visitors. Goal LU-6: To improve the vitality and character of downtown through planning, design, business-community partnerships, and City programs and projects that encourage a variety of social, entertainment, cultural, retail, administrative, and government uses.
Goal LU-11: Enhance and improve sustainable practices in Napa to minimize long-term effects of development on the local and global environment.
Policy LU-11.1: The City shall create Green Building Initiatives to encourage or require new development and rehabilitation projects to incorporate sustainable practices, green building techniques, energy conservation and recycling measures, alternate and renewable energy producing systems. Policy LU-11.2: The City shall incorporate green building practices into City facilities, and integrate energy efficiency and conservation into City functions.
Natural Resources
Goal NR-4: To protect and enhance surface water and ground water quality.
Policy NR-4.1: The City shall support the maintenance and improvement of surface and ground water quality.
Goal NR-5: To maintain acceptable levels of air quality in Napa.
Policy NR-5.1: The City shall encourage the use of mass transit, bicycle facilities, and pedestrian walkways in order to decrease use of private vehicles and thereby reduce emissions from mobile sources. Policy NR-5.3: The City shall promote energy conservation/energy efficiency improvement programs, which reduce energy demand from power-generating facilities which contribute to background levels of regional air emissions.
Transportation
Goal T-6: To develop and maintain a safe, integrated bicycle route network for residents and visitors, connecting key destinations to neighborhoods, neighborhoods to each other, and the City of Napa to the county.
P a g e | F-6
Goal T-7: To develop and maintain bicycle support facilities in appropriate locations to encourage the use of bicycle travel in Napa.
Policy T-7.2: The city shall provide for bicycle support facilities, as appropriate, in existing and new development.
Goal T-9: To provide an interconnected pedestrian network providing safe access between residential areas, public uses, shopping, and employment centers, with special attention to a high quality downtown pedestrian environment with links to neighborhoods.