Embed Size (px)
Citation preview

i
CONTENTS
ACKNOWLEDGMENTS .............................................................................................................. v
ACRONYMS AND ABBREVIATIONS ...................................................................................... vi
1 BACKGROUND ...................................................................................................................... 1
2 METHOD AND DATA ............................................................................................................ 2
2.1 CO2, CH4, N2O, NOx and SOx Emission Factors............................................................. 2 2.2 CO, VOC, PM10 and PM2.5 Emission Factors ................................................................. 6 2.3 Sulfur Contents and Ash Contents of Various Fuels by State ....................................... 21 2.4 Efficiencies .................................................................................................................... 24 2.5 Probability Distribution Functions of GHG and CAP Emission Factors and
Efficiencies .....................................................................................................................25
3 RESULTS ............................................................................................................................... 27
3.1 Data Quality Evaluation................................................................................................. 27 3.1.1 Detection of Outliers .......................................................................................... 27
3.1.2 Comparison of GHG and CAP Emissions with EPA’s NEI Data ..................... 27
3.1.3 Carbon Intensities by Fuel Type ........................................................................ 29
3.2 National Average GHG and CAP Emission Factors and Efficiencies by Fuel Type and Generation Technology ............................................................................................30
3.3 Regional GHG and CAP Emission Factors and Efficiencies by Fuel Type and Generation Technology.................................................................................................. 34
3.4 GHG and CAP Emission Factors and Efficiencies by Fuel Type and Generation Technology in Each State .............................................................................................. 40
3.5 Electricity Generation Mixes ......................................................................................... 68 3.6 Electricity Transmission and Distribution Loss............................................................. 72 3.7 Probability Distribution Functions of GHG and CAP Emission Factors and Energy
Efficiencies by Fuel Type and Combustion Technology of EGUs ............................... 74 3.8 Projection of generation mix, efficiency, Combustion technology share, and
emission factors ..............................................................................................................80 3.9 Life-cycle Energy Use, GHG and CAP Emissions of Selected Vehicle/Fuel
Systems ...........................................................................................................................80
REFERENCES ............................................................................................................................. 88
APPENDIX ................................................................................................................................... 92
ii
FIGURES 1 NERC region representational map from eGRID 2010 (EPA, 2011a). ............................ 35
2 Differences in energy use, GHG emissions, and CAP emissions per kWh electricity generated found in the present study, relative to those in GREET 1_2011, for electricity generation only and the full fuel cycle of the power plant. .......... 81
3 Life-cycle (a) GHG; (b) VOC; (c) CO; (d) NOx; (e) SOx; (f) PM10; and (g) PM2.5 emissions of selected vehicle/fuel systems with updated characterization of electricity generation module in GREET 1_2011. The red and purple error bars denote the standard deviations of the WTP and PTW emissions based on multiple stochastic simulations. ....................................................................................................... 85
A1 Best-fit CDFs of electricity-generation-weighted GHG and CAP emission factors for coal-fired boilers. ....................................................................................................... 103
A2 Best-fit CDFs of electricity-generation-weighted GHG and CAP emission factors for natural gas-fired boilers. ............................................................................................ 107
A3 Best-fit CDFs of electricity-generation-weighted GHG and CAP emission factors for natural gas-fired combustion turbines. ...................................................................... 111
A4 Best-fit CDFs of electricity-generation-weighted GHG and CAP emission factors for natural gas-fired combined-cycle plants. ................................................................... 115
A5 Best-fit CDFs of electricity-generation-weighted GHG and CAP emission factors for natural gas-fired internal combustion engines. .......................................................... 119
A6 Best-fit CDFs of electricity-generation-weighted GHG and CAP emission factors for oil-fired boilers. ......................................................................................................... 123
A7 Best-fit CDFs of electricity-generation-weighted GHG and CAP emission factors for oil-fired combustion turbines. .................................................................................... 128
A8 Best-fit CDFs of electricity-generation-weighted GHG and CAP emission factors for oil-fired internal combustion engines. ....................................................................... 132
A9 Best-fit CDFs of electricity-generation-weighted GHG and CAP emission factors for biomass-fired boilers. ................................................................................................ 136
A10 Best-fit CDFs of electricity-generation-weighted energy conversion efficiencies for coal-, natural gas-, oil- and biomass-fired boilers, combustion turbines, combined-cycle plants and internal combustion engines. ............................................... 141
iii
TABLES 1 The number and electricity generation share of CHP and non-CHP facilities,
and basic characteristics of EGUs by fuel type ......................................................................5
2 CO emission factors of EGUs by fuel type, combustion technology, boiler bottom and firing type, and emission control technology .................................................................10
3 VOC emission factors of EGUs by fuel type, combustion technology, boiler bottom and firing type, and emission control technology .................................................................11
4 PM10 emission factors of EGUs by fuel type, combustion technology, boiler bottom and firing type, and emission control technology .................................................................12
5 PM2.5 emission factors of EGUs by fuel type, combustion technology, boiler bottom and firing type, and emission control technology .................................................................15
6 Sulfur contents (weight %) of various fuels on an as-received basis in each state in year 2007 ...............................................................................................................................21
7 Ash contents (weight %) of various fuels on an as-received basis in each state in year 2007.......................................................................................................................................22
8 f
f
LHVHHV
ratios, on an as-received basis, of various fuels burned by EGUs ...........................25
9 Number of outliers detected by fuel type and combustion technology ................................27
10 Comparison of total GHG and CAP emissions (thousand tons) calculated in the present study for the electric power sector with EPA’s NEI data for the year 2007 ............28
11 Percentage of CI outliers detected by fuel type and generation technology .........................30
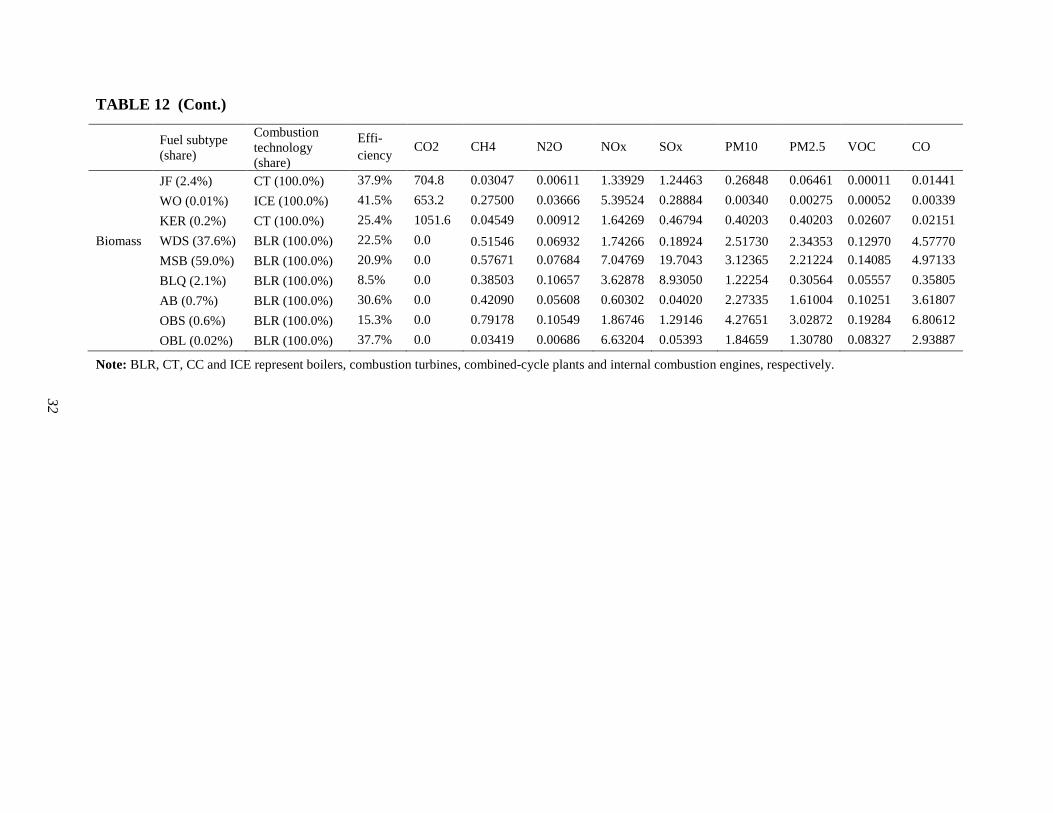
12 GHG and CAP emission factors (g/kWh) by fuel subtype and combustion technology for the electricity power sector in the U.S. ...........................................................................31
13 GHG and CAP emission factors (g/kWh) by fuel type and combustion technology for the electricity power sector in the U.S. ...........................................................................33
14 GHG and CAP emission factors (g/kWh), efficiencies, and combustion technology shares by NERC region .........................................................................................................36
15 GHG and CAP emission factors and efficiencies in each state ............................................41
16 Nationally averaged electricity generation mix (%) .............................................................68
17 Electricity generation mixes (%) by NERC region based on eGRID ...................................69
18 Electricity generation mixes (%) by state based on eGRID .................................................70
19 Electricity T&D gross grid loss factors (%) on a state and national average basis ..............72
20 Probability distribution functions of energy efficiency, GHG and CAP emission factors by fuel type and combustion technology of EGUs ...................................................75

iv
TABLES (CONT.) A1 NOx emission factors of EGUs by fuel type, combustion technology, firing type and
emission control technology ................................................................................................ 93
A2 SOx emission factors of EGUs by fuel type, combustion technology, firing type and emission control technology ................................................................................................ 97

v
ACKNOWLEDGMENTS This study was supported by the Office of Biomass Program, Vehicle Technology Program, Hydrogen and Fuel Cells Program and Geothermal Technologies Program in the U.S. Department of Energy, Office of Energy Efficiency and Renewable Energy, under Contract DE-AC02-06CH11357. We are grateful to Dr. Susy Rothschild of TranSystems for helping to clarify the emissions data in the eGRID database provided by the U.S. Environmental Protection Agency.
vi
ACRONYMS AND ABBREVIATIONS AB agricultural byproduct AEO Annual Energy Outlook ARPD Acid Rain Program Dataset BEV battery-powered electric vehicle BF biased firing BFG blast furnace gas BIT bituminous coal BLQ black liquor BLR boilers BOOS burners-out-of-service CAP criteria air pollutant CI carbon intensity CC combined cycle CH4 methane CHP combined heat and power CO carbon monoxide CO2 carbon dioxide Com.Opt. combustion optimization CPM condensable particulate matter CT combustion turbines DFO distillate fuel oil DG digester gas eGRID Emissions & Generation Resource Integrated Database EGU electric generating unit EIA U.S. Energy Information Administration EPA U.S. Environmental Protection Agency EPA/CAMD EPA’s Clean Air Markets Division ESP electrostatic precipitator FBC fluidized bed combustion FGD flue gas desulfurization FGR flue gas recirculation FPM filterable particulate matter GEO geothermal energy GHG greenhouse gas GREET Greenhouse Gases, Regulated Emissions, and Energy Use in Transportation
Model
vii
HHV higher heating value ICE internal combustion engines IGCC integrated gasification combined cycle JF jet fuel KER kerosene lb pound LEA low excess air LFG landfill gas LHV lower heating value LIG lignite coal LNB low nitrogen burners MSB biomass component of municipal solid waste N2O nitrous oxide NEG net electricity generated NEI National Emission Inventory NERC North American Electric Reliability Council NG natural gas NGCC natural gas combined cycle NOx nitrogen oxides NSPS New Source Performance Standards OBL other biomass liquid OBS other biomass solids OFA overfire air OG other gases OTH other unknown PC pulverized coal PDF probability distribution function PetCoke petroleum coke PHEV plug-in hybrid electric vehicle PM2.5 particulate matter up to 2.5 micrometers in size PM10 particulate matter up to 10 micrometers in size PTW pump-to-wheels PUR purchased steam RFO residual fuel oil SC syncoal Scf one cubic foot of volume at 60°F and 101.325 kPa of pressure SCR selective catalytic reduction SNCR selective noncatalytic reduction
viii
SOx sulfur oxides SUB subbituminous coal SUN solar energy T&D transmission and distribution TDF tire-derived fuel VOC volatile organic compounds WAT hydropower WC waste coal WDL woody biomass liquid WDS woody biomass solid WebFIRE Web version of EPA’s Factor Information Retrieval Data System WH waste heat WI water injection WND wind power WO waste oil WTW well-to-wheels WTP well-to-pump
1
UPDATED GREENHOUSE GAS AND CRITERIA AIR POLLUTANT EMISSION FACTORS AND THEIR PROBABILITY DISTRIBUTION FUNCTIONS FOR
ELECTRIC GENERATING UNITS
1 BACKGROUND Greenhouse gas (CO2, CH4 and N2O, hereinafter GHG) and criteria air pollutant (CO, NOx, VOC, PM10, PM2.5 and SOx, hereinafter CAP) emission factors for various types of power plants burning various fuels with different technologies are important upstream parameters for estimating life-cycle emissions associated with alternative vehicle/fuel systems in the transportation sector, especially electric vehicles. The emission factors are typically expressed in grams of GHG or CAP per kWh of electricity generated by a specific power generation technology. This document describes our approach for updating and expanding GHG and CAP emission factors in the GREET (Greenhouse Gases, Regulated Emissions, and Energy Use in Transportation) model developed at Argonne National Laboratory (see Wang 1999 and the GREET website at http://greet.es.anl.gov/main) for various power generation technologies. These GHG and CAP emissions are used to estimate the impact of electricity use by stationary and transportation applications on their fuel-cycle emissions. The electricity generation mixes and the fuel shares attributable to various combustion technologies at the national, regional and state levels are also updated in this document. The energy conversion efficiencies of electric generating units (EGUs) by fuel type and combustion technology are calculated on the basis of the lower heating values of each fuel, to be consistent with the basis used in GREET for transportation fuels. On the basis of the updated GHG and CAP emission factors and energy efficiencies of EGUs, the probability distribution functions (PDFs), which are functions that describe the relative likelihood for the emission factors and energy efficiencies as random variables to take on a given value by the integral of their own probability distributions, are updated using best-fit statistical curves to characterize the uncertainties associated with GHG and CAP emissions in life-cycle modeling with GREET.
2
2 METHOD AND DATA 2.1 CO2, CH4, N2O, NOx AND SOx EMISSION FACTORS GHG and CAP emission factors by fuel type and combustion technology are required to perform life-cycle analyses using GREET. On the basis of the recent release of the Emissions & Generation Resource Integrated Database, known as eGRID 1 (EPA, 2011a), which contains comprehensive unit-level emission data and plant performance data like the heat input and electricity generation for year 2007, we calculate the CO2, CH4, N2O, NOx and SOx emission factors for each plant in the power generation sector. The version that we used, eGRID2010, provided the best available and most recent (2007) comprehensive data to meet our study objectives when this study began. However, eGRID2012, which incorporates the 2009 dataset, has just been released. Therefore, we are aware that we may have missed some recent trends in the evolution of the combustion technology for each type of power plant, which will eventually result in variations in their GHG and CAP emission factors. This assumption will be validated in a follow-up study using the latest available data from EIA and EPA, in comparison with the 2007 data addressed in this report. The emissions of CO2, CH4, N2O, NOx and SOx in eGRID are based on data from a variety of sources, but its primary source for CO2, SOx, and NOx emissions is the unit-level data from the Clean Air Markets Division (EPA/CAMD) (EPA, 2007a; Pechan, 2010a). If any of the emissions data are not reported, which is the case for 1076 out of 5172 EGUs, the emissions are estimated by eGRID as follows: CO2 emission factors are estimated using fuel consumption data from EIA-923 (EIA, 2007a), fuel carbon intensity, and the fraction of carbon oxidized to CO2 (a uniform oxidation fraction of 1 is used for all fossil fuels); SOx emission factors are estimated using fuel consumption data from EIA-923, EPA-approved uncontrolled-emission factors (Pechan, 2010b) are based on EPA’s AP-42 emission factors (EPA, 2004), sulfur content, and control efficiencies, if available; and NOx emission factors for steam prime movers are estimated using fuel consumption data from EIA-923 and EPA-approved uncontrolled emissions factors for steam prime movers. For combined-cycle plants, turbines and internal combustion engines, NOx emission factors are developed on the basis of the prime mover technology, size, and location, and using data from the EPA Reasonably Available Control Technology/Best Available Control Technology/Lowest Achievable Emission Rate Clearinghouse (EPA, 2010a). The term “prime mover” refers to the machine (e.g., engine, turbine, water wheel) that drives the electric generator in the power plant. In this work, the averaged CO2, CH4, N2O, NOx and SOx emission factors by fuel type and combustion technology are calculated by dividing the annual total emissions by the annual total net electricity generated (NEG) from that technology, as shown in Equation (1). The NEG in this
1 A comprehensive emission inventory of the electric power sector in the U.S.
3
report refers to the generated electricity supplied to the grid, i.e., electricity directly consumed by EGUs is excluded.
, , ,
, ,, ,
p f ct ii
p f ctf ct i
i
EmissionEF
NEG=∑∑
(1)
where
, ,p f ctEF (expressed in g/kWh) is the averaged emission factor of a GHG species or pollutant p (e.g., NOx or SOx) emitted by all power plants burning fuel f using combustion technology ct;
, , ,p f ct iEmission (expressed in grams) is the emissions of a GHG species or pollutant p from power plant i burning fuel f using combustion technology ct; and
, ,f ct iNEG (expressed in kWh) is the net electricity generated by power plant i burning fuel f using combustion technology ct.
To obtain , , ,p f ct iEmission , we first sort the plants in eGRID by fuel type based on the primary fuel type indicated by eGRID. This report explicitly updates the GHG and CAP emission factors for use in GREET on the basis of a total of 3394 combustion-based EGUs fired by four major fuel types: (1) coal, including the subtypes of bituminous coal (BIT), subbituminous coal (SUB), lignite (LIG), syncoal2 (SC), waste coal3 (WC), petroleum coke (PetCoke) and tire-derived fuel (TDF); (2) natural gas (NG), including the subtypes of NG, landfill gas (LFG), blast furnace gas (BFG), digester gas (DG), other gases (OG), and other unknown (OTH); (3) oil, including the subtypes of residual fuel oil (RFO), distillate fuel oil (DFO), jet fuel (JF), kerosene (KER), and waste oil (WO); and (4) biomass, including the subtypes of woody biomass solid (WDS), woody biomass liquid (WDL), black liquor (BLQ), agricultural byproduct (AB), biomass component of municipal solid waste (MSB), other biomass solid (OBS), and other biomass liquid (OBL). These combustion-based EGUs accounted for 75.0% of the total net electricity generated in the U.S., while 60 nuclear-power EGUs and 1718 renewable-power EGUs, including solar energy (SUN), hydropower (WAT), wind (WND), geothermal (GEO) and waste heat (WH), account for another 18.0% and 7.0% of the national generation, respectively. While most power plants employ a single fuel type, a small percentage of power plants burn multiple fuel types. For multiple-fuel-fired plants, the primary fuel type employed by the prime mover with the largest nameplate capacity is recognized as the primary fuel type for that plant. Multiple-fuel-fired plants with the primary fuel types BIT, SUB, NG and DFO represent 6.5%, 4.3%, 5.4% and 4.2%, respectively, of the total. Aggregating the different fuel types under one
2 Syncoal includes briquettes, pellets, or extrusions, which are formed by binding materials or by processes that
recycle materials. Syncoal has reduced sulfur and ash contents and increased heating value. 3 Waste coal includes anthracite culm, bituminous gob, fine coal and lignite waste.
4
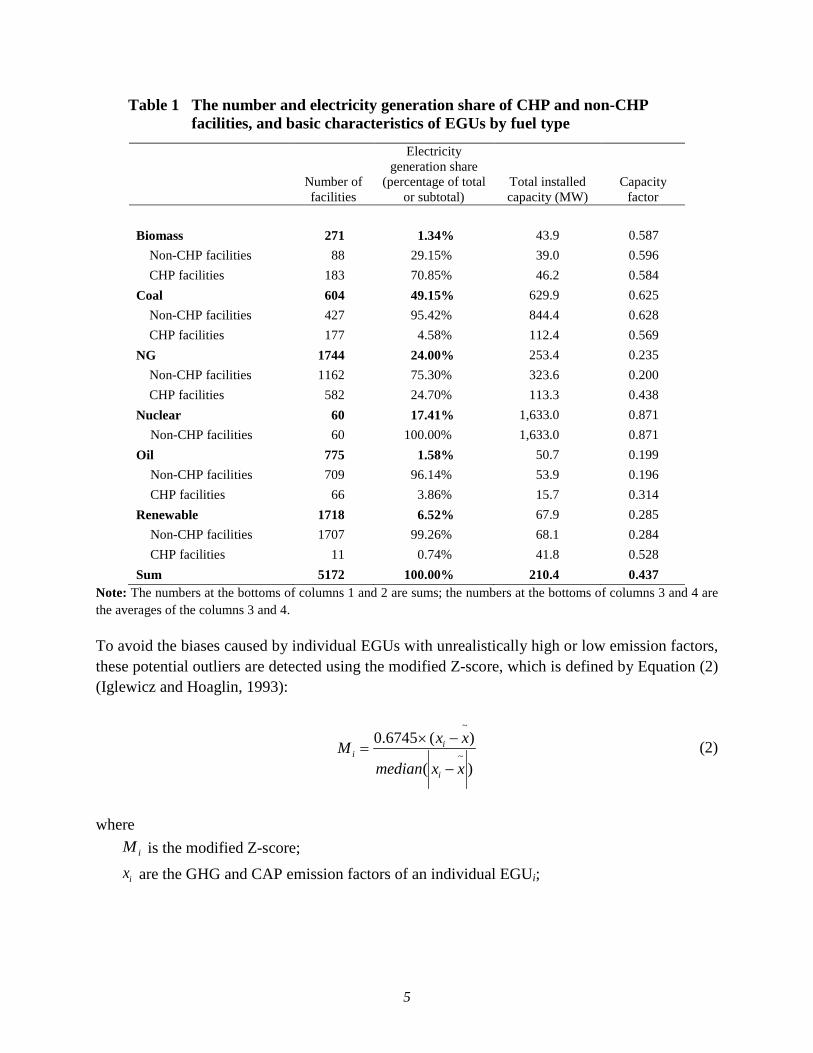
primary fuel type leads to a small error that is due to the difference in fuel properties and their combustion characteristics. We noticed that a few plants in eGRID, i.e., plants with DOE/EIA Office of the Regulatory Information System PLant (ORISPL) codes 30, 1225, 2390, 10437, 50241 and 54406, show inconsistent plant-level and generator-level primary fuel types. We made corrections to these minor discrepancies in eGRID and identified the true primary fuel types of these plants through personal communication with S. Rothschild (2012). Next, we sort plants of the same fuel type by combustion technology, using information on the prime mover type of each generator within each power plant as provided in eGRID. For example, natural gas is used in power plants employing various prime mover technologies such as steam turbines, gas turbines, or both. Since many plants have multiple generators driven by different prime mover types, the prime mover type of the generators whose summed capacities represent the largest fraction of the entire capacity of a power plant is recognized as the prime mover type of that plant. For these plants, the , ,f ct iNEG is determined by the annual electricity generation of power plant i burning fuel type f with the combustion technology ct that defines the prime mover type of that plant. A few combustion-based power plants with zero heat inputs or zero emissions and NEG that is a very small fraction of their nameplate capacities, which account for 0.53% of the national total NEG, are excluded from the calculation of GHG and CAP emission factors, since they are not representative of typical emission characteristics of EGUs. EGUs employing boilers, combustion turbines or engines with efficiency higher than 45%, and combined-cycle plants with efficiency higher than 60%, are regarded as unrealistic for current non-CHP4 efficiency levels (EVA, 2007; Bellman et al., 2007; Ishikawa et al., 2008), and are therefore excluded. Moreover, EGUs that have negative electricity generations in eGRID (possibly because of their operations in spinning reserve mode) are excluded, since no electricity is supplied by such EGUs to meet the downstream demand. Those CHP facilities that usually have higher efficiencies than EGUs producing electricity alone are also excluded, owing to the lack of consensus on how to allocate emissions between the electricity and heat co-products. Table 1 shows the number and electricity generation share of both CHP and non-CHP facilities by fuel type, in addition to the basic characteristics of EGUs by fuel type.
4 Combined heat and power
5
Table 1 The number and electricity generation share of CHP and non-CHP facilities, and basic characteristics of EGUs by fuel type
Number of facilities
Electricity generation share
(percentage of total or subtotal)
Total installed capacity (MW)
Capacity factor
Biomass 271 1.34% 43.9 0.587
Non-CHP facilities 88 29.15% 39.0 0.596 CHP facilities 183 70.85% 46.2 0.584
Coal 604 49.15% 629.9 0.625 Non-CHP facilities 427 95.42% 844.4 0.628 CHP facilities 177 4.58% 112.4 0.569
NG 1744 24.00% 253.4 0.235 Non-CHP facilities 1162 75.30% 323.6 0.200 CHP facilities 582 24.70% 113.3 0.438
Nuclear 60 17.41% 1,633.0 0.871 Non-CHP facilities 60 100.00% 1,633.0 0.871
Oil 775 1.58% 50.7 0.199 Non-CHP facilities 709 96.14% 53.9 0.196 CHP facilities 66 3.86% 15.7 0.314
Renewable 1718 6.52% 67.9 0.285 Non-CHP facilities 1707 99.26% 68.1 0.284 CHP facilities 11 0.74% 41.8 0.528
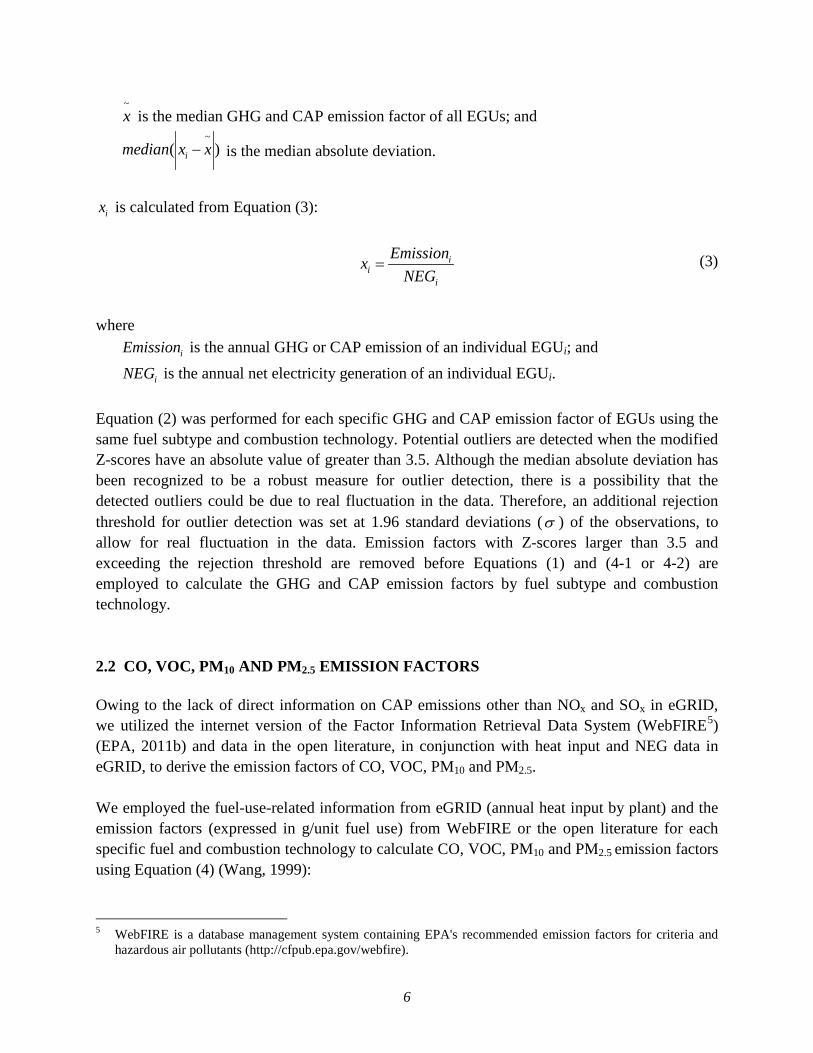
Sum 5172 100.00% 210.4 0.437 Note: The numbers at the bottoms of columns 1 and 2 are sums; the numbers at the bottoms of columns 3 and 4 are the averages of the columns 3 and 4. To avoid the biases caused by individual EGUs with unrealistically high or low emission factors, these potential outliers are detected using the modified Z-score, which is defined by Equation (2) (Iglewicz and Hoaglin, 1993):
~
~
0.6745 ( )
( )
ii
i
x xMmedian x x
× −=
− (2)
where
iM is the modified Z-score;
ix are the GHG and CAP emission factors of an individual EGUi;
6
~x is the median GHG and CAP emission factor of all EGUs; and
~( )imedian x x− is the median absolute deviation.
ix is calculated from Equation (3):
ii
i
EmissionxNEG
= (3)
where
iEmission is the annual GHG or CAP emission of an individual EGUi; and
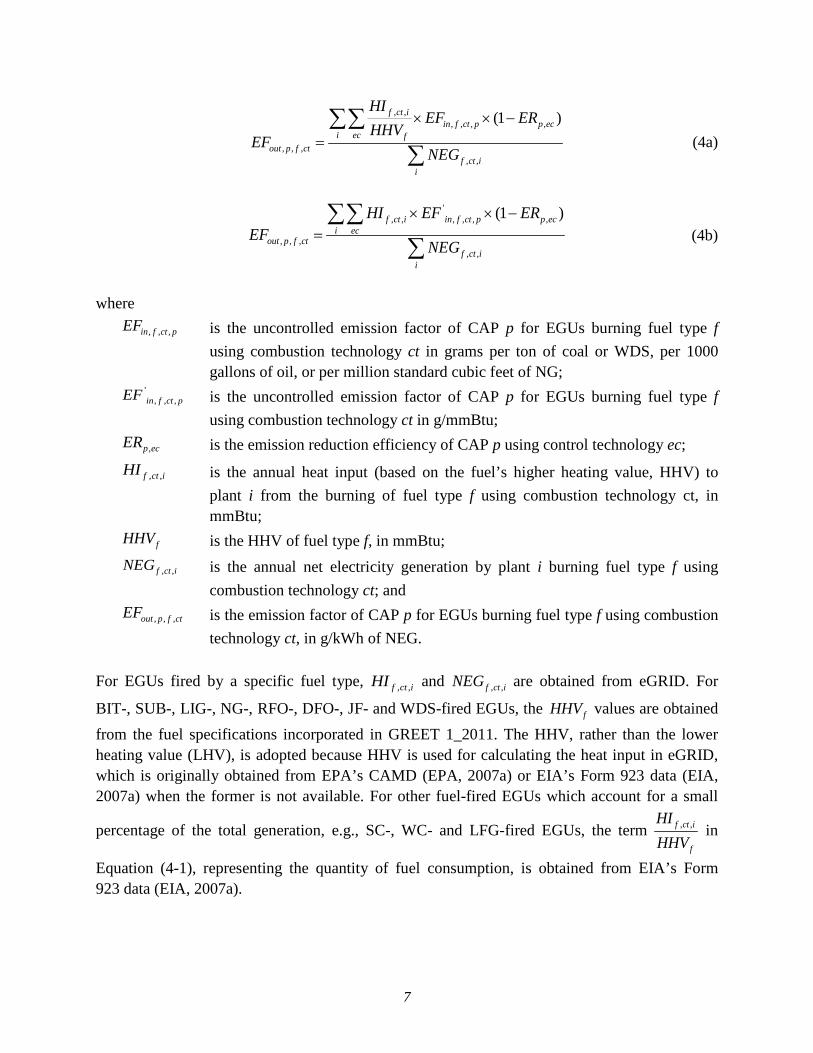
iNEG is the annual net electricity generation of an individual EGUi. Equation (2) was performed for each specific GHG and CAP emission factor of EGUs using the same fuel subtype and combustion technology. Potential outliers are detected when the modified Z-scores have an absolute value of greater than 3.5. Although the median absolute deviation has been recognized to be a robust measure for outlier detection, there is a possibility that the detected outliers could be due to real fluctuation in the data. Therefore, an additional rejection threshold for outlier detection was set at 1.96 standard deviations (σ ) of the observations, to allow for real fluctuation in the data. Emission factors with Z-scores larger than 3.5 and exceeding the rejection threshold are removed before Equations (1) and (4-1 or 4-2) are employed to calculate the GHG and CAP emission factors by fuel subtype and combustion technology. 2.2 CO, VOC, PM10 AND PM2.5 EMISSION FACTORS Owing to the lack of direct information on CAP emissions other than NOx and SOx in eGRID, we utilized the internet version of the Factor Information Retrieval Data System (WebFIRE5) (EPA, 2011b) and data in the open literature, in conjunction with heat input and NEG data in eGRID, to derive the emission factors of CO, VOC, PM10 and PM2.5. We employed the fuel-use-related information from eGRID (annual heat input by plant) and the emission factors (expressed in g/unit fuel use) from WebFIRE or the open literature for each specific fuel and combustion technology to calculate CO, VOC, PM10 and PM2.5 emission factors using Equation (4) (Wang, 1999):
5 WebFIRE is a database management system containing EPA's recommended emission factors for criteria and
hazardous air pollutants (http://cfpub.epa.gov/webfire).
7
, ,, , , ,
, , ,, ,
(1 )f ct iin f ct p p ec
i ec fout p f ct
f ct ii
HIEF ER
HHVEF
NEG
× × −=∑∑
∑
(4a)
', , , , , ,
, , ,, ,
(1 )f ct i in f ct p p eci ec
out p f ctf ct i
i
HI EF EREF
NEG
× × −=∑∑
∑ (4b)
where
, , ,in f ct pEF is the uncontrolled emission factor of CAP p for EGUs burning fuel type f using combustion technology ct in grams per ton of coal or WDS, per 1000 gallons of oil, or per million standard cubic feet of NG;
', , ,in f ct pEF is the uncontrolled emission factor of CAP p for EGUs burning fuel type f
using combustion technology ct in g/mmBtu;
,p ecER is the emission reduction efficiency of CAP p using control technology ec;
, ,f ct iHI is the annual heat input (based on the fuel’s higher heating value, HHV) to plant i from the burning of fuel type f using combustion technology ct, in mmBtu;
fHHV is the HHV of fuel type f, in mmBtu;
, ,f ct iNEG is the annual net electricity generation by plant i burning fuel type f using combustion technology ct; and
, , ,out p f ctEF is the emission factor of CAP p for EGUs burning fuel type f using combustion technology ct, in g/kWh of NEG.
For EGUs fired by a specific fuel type, , ,f ct iHI and , ,f ct iNEG are obtained from eGRID. For
BIT-, SUB-, LIG-, NG-, RFO-, DFO-, JF- and WDS-fired EGUs, the fHHV values are obtained from the fuel specifications incorporated in GREET 1_2011. The HHV, rather than the lower heating value (LHV), is adopted because HHV is used for calculating the heat input in eGRID, which is originally obtained from EPA’s CAMD (EPA, 2007a) or EIA’s Form 923 data (EIA, 2007a) when the former is not available. For other fuel-fired EGUs which account for a small
percentage of the total generation, e.g., SC-, WC- and LFG-fired EGUs, the term , ,f ct i
f
HIHHV
in
Equation (4-1), representing the quantity of fuel consumption, is obtained from EIA’s Form 923 data (EIA, 2007a).
8
As mentioned earlier, , , ,in f ct pEF and ', , ,in f ct pEF are mainly obtained from WebFIRE. WebFIRE
includes information about various industries and their processes, the chemicals emitted, and the associated emission factors. WebFIRE allows easy access to criteria and hazardous air pollutant emission factors obtained from the Compilation of Air Pollutant Emission Factors (AP-42) (EPA, 2011c), the Locating and Estimating documents (EPA, 2010b), and the retired Aerometric Facility Subsystem Emission Factors and Crosswalk/Air Toxics Emission Factors documents. We used a four-step procedure (described below) to determine the emission factors from WebFIRE for each type of EGU burning a specific type of fuel using a certain combustion technology with a particular control technology. For example, the CAP emission factors of a BIT-fired power plant using a cyclone furnace can be obtained by following these four steps:
Step 1: Identify the combustion technology, e.g., external combustion boilers; Step 2: Identify the emission source category, i.e., electricity generation sector; Step 3: Identify the fuel type, e.g., bituminous/subbituminous coal; Step 4: Identify the combustion technology type and emission control technology,
e.g., pulverized coal, cyclone furnace. Usually, the above four-step procedure narrows down the emission factors to one set of CAPs reflecting the effects of the boiler type, the firing type and the specific emission control measures in operation. It is therefore necessary to identify the combustion technology type and the emission control measures in operation at each EGU covered in eGRID in order to obtain the appropriate emission factor from WebFIRE. Here, the boiler type and firing type of individual EGUs are obtained from EPA’s CAMD (2007a). Furthermore, EPA’s CAMD unit-level data, including information on emission control equipment at existing EGUs (EPA, 2007a), are used to identify the different emission control measures adopted by each EGU. PM10 and PM2.5 emission factors are complex functions of boiler bottom and firing configuration, boiler operation, pollution control equipment, and fuel properties. Here, the plant-level-controlled PM emission factors are calculated using Equation (5), which accounts for the emission reduction efficiency of the emission control technology and the prime mover-level heat input as obtained from EPA’s CAMD. The uncontrolled emission factors and some controlled emission factors are obtained from WebFIRE. The emission reduction efficiencies of control technologies are based on AP-42 and open-literature data, and the fuel quality data are from EIA (2007b).
, , , , , ,(1 ) (%)
controlled f ct i uncontrolled f ct iPM PM j jj
EF EF ER HI = × − × ∑ (5)
9
where
, , ,controlled f ct iPMEF and , , ,uncontrolled f ct iPMEF are the controlled and uncontrolled PM emission factors, respectively, for plant i burning fuel type f using combustion technology ct;
jER is the emission reduction efficiency of control technology j, such as electrostatic precipitator or baghouse; and
(%) jHI is the heat input share of generators that are employing
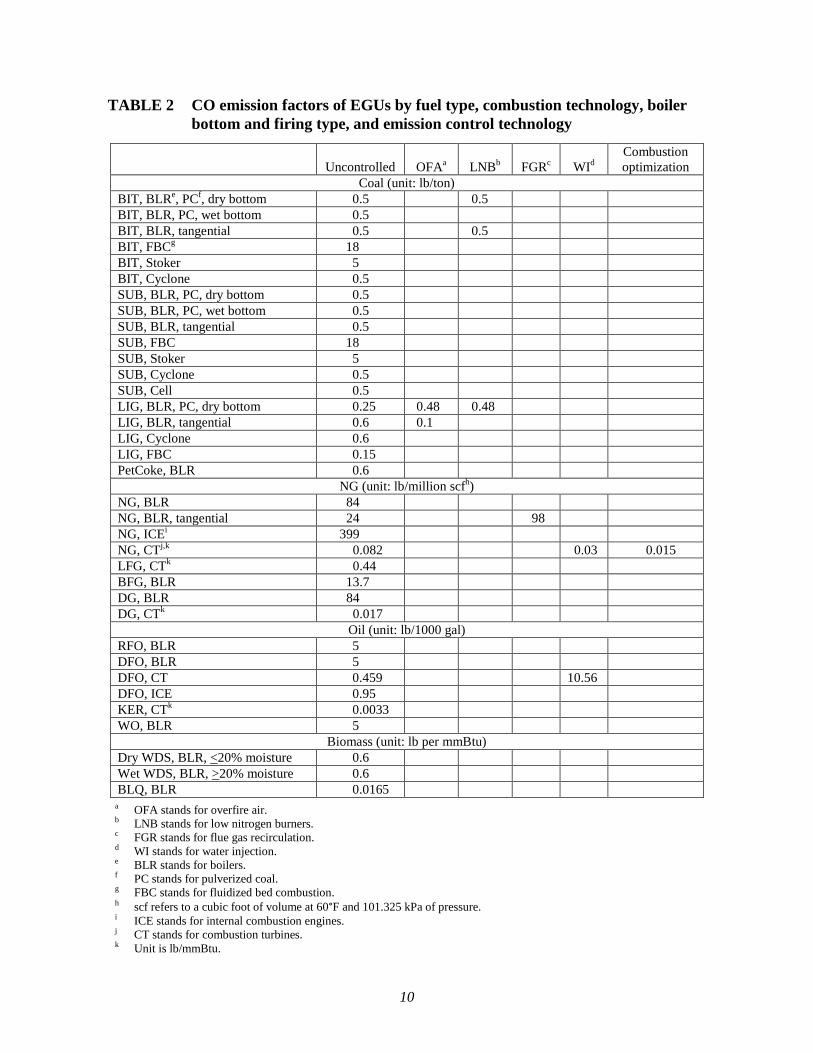
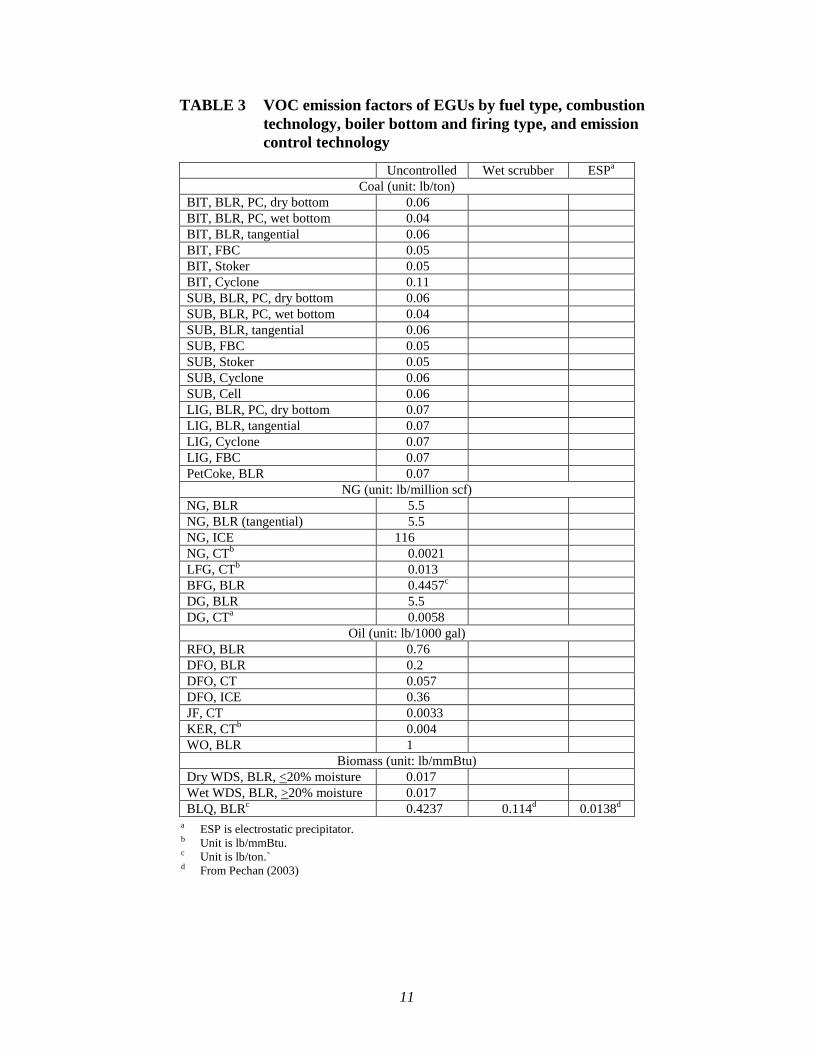
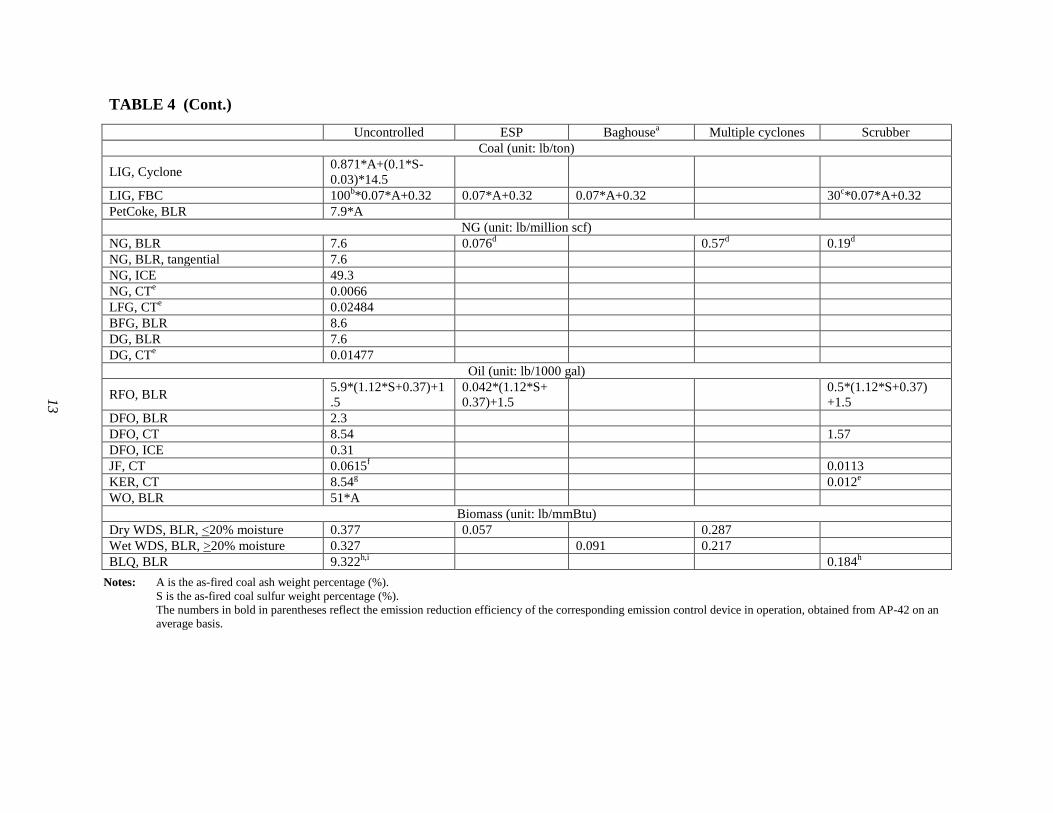
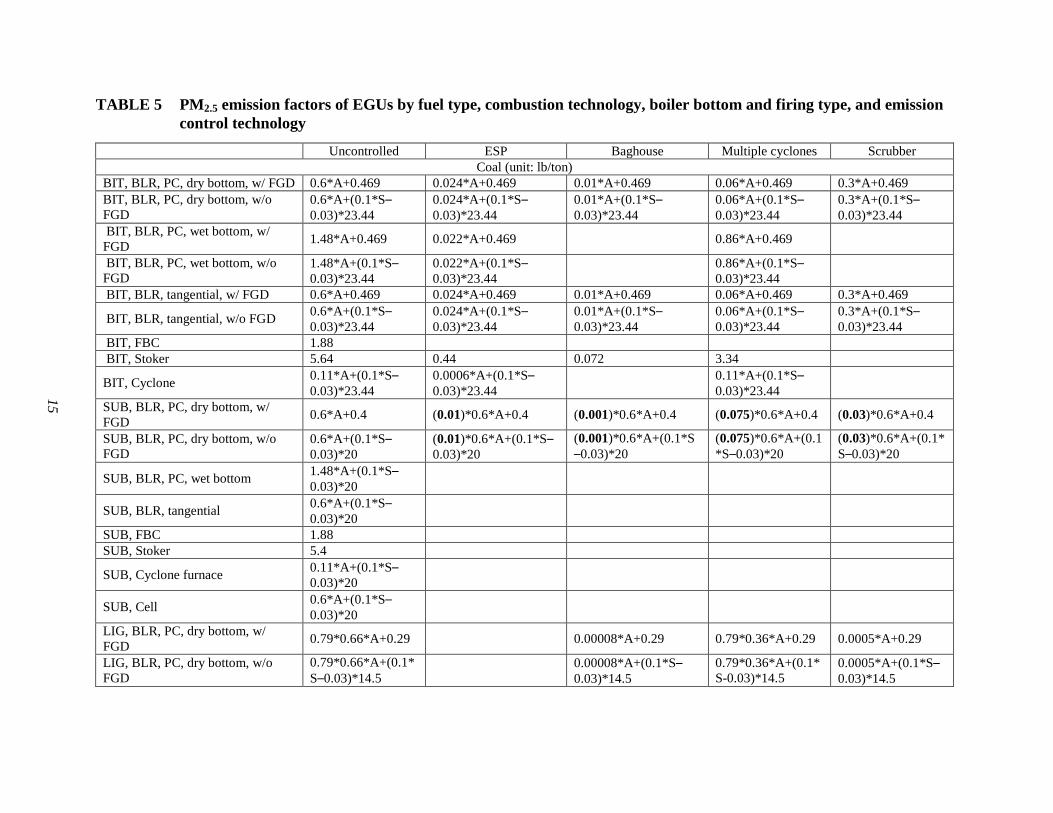
control technologies j within the same plant. When multiple emission factors for a particular CAP are available for the same fuel type and combustion technology using the same emission control technology, the technology with a higher quality grade and the post-NSPS (New Source Performance Standards) boilers are adopted. The CO, VOC, PM10 and PM2.5 emission factors chosen from WebFIRE for power plants are given in Tables 2–5 for various fuel types, combustion technologies, boiler bottom and firing types, and emission control technologies.
10
TABLE 2 CO emission factors of EGUs by fuel type, combustion technology, boiler bottom and firing type, and emission control technology
Uncontrolled OFAa LNBb FGRc WId
Combustion optimization
Coal (unit: lb/ton) BIT, BLRe, PCf, dry bottom 0.5 0.5 BIT, BLR, PC, wet bottom 0.5 BIT, BLR, tangential 0.5 0.5 BIT, FBCg 18 BIT, Stoker 5 BIT, Cyclone 0.5 SUB, BLR, PC, dry bottom 0.5 SUB, BLR, PC, wet bottom 0.5 SUB, BLR, tangential 0.5 SUB, FBC 18 SUB, Stoker 5 SUB, Cyclone 0.5 SUB, Cell 0.5 LIG, BLR, PC, dry bottom 0.25 0.48 0.48 LIG, BLR, tangential 0.6 0.1 LIG, Cyclone 0.6 LIG, FBC 0.15 PetCoke, BLR 0.6 NG (unit: lb/million scfh) NG, BLR 84 NG, BLR, tangential 24 98 NG, ICEi 399 NG, CTj,k 0.082 0.03 0.015 LFG, CTk 0.44 BFG, BLR 13.7 DG, BLR 84 DG, CTk 0.017 Oil (unit: lb/1000 gal) RFO, BLR 5 DFO, BLR 5 DFO, CT 0.459 10.56 DFO, ICE 0.95 KER, CTk 0.0033 WO, BLR 5 Biomass (unit: lb per mmBtu) Dry WDS, BLR, <20% moisture 0.6 Wet WDS, BLR, >20% moisture 0.6 BLQ, BLR 0.0165
a OFA stands for overfire air. b LNB stands for low nitrogen burners. c FGR stands for flue gas recirculation. d WI stands for water injection. e BLR stands for boilers. f PC stands for pulverized coal. g FBC stands for fluidized bed combustion. h scf refers to a cubic foot of volume at 60°F and 101.325 kPa of pressure. i ICE stands for internal combustion engines. j CT stands for combustion turbines. k Unit is lb/mmBtu.
11
TABLE 3 VOC emission factors of EGUs by fuel type, combustion technology, boiler bottom and firing type, and emission control technology
Uncontrolled Wet scrubber ESPa
Coal (unit: lb/ton) BIT, BLR, PC, dry bottom 0.06 BIT, BLR, PC, wet bottom 0.04 BIT, BLR, tangential 0.06 BIT, FBC 0.05 BIT, Stoker 0.05 BIT, Cyclone 0.11 SUB, BLR, PC, dry bottom 0.06 SUB, BLR, PC, wet bottom 0.04 SUB, BLR, tangential 0.06 SUB, FBC 0.05 SUB, Stoker 0.05 SUB, Cyclone 0.06 SUB, Cell 0.06 LIG, BLR, PC, dry bottom 0.07 LIG, BLR, tangential 0.07 LIG, Cyclone 0.07 LIG, FBC 0.07 PetCoke, BLR 0.07 NG (unit: lb/million scf) NG, BLR 5.5 NG, BLR (tangential) 5.5 NG, ICE 116 NG, CTb 0.0021 LFG, CTb 0.013 BFG, BLR 0.4457c DG, BLR 5.5 DG, CTa 0.0058 Oil (unit: lb/1000 gal) RFO, BLR 0.76 DFO, BLR 0.2 DFO, CT 0.057 DFO, ICE 0.36 JF, CT 0.0033 KER, CTb 0.004 WO, BLR 1 Biomass (unit: lb/mmBtu) Dry WDS, BLR, <20% moisture 0.017 Wet WDS, BLR, >20% moisture 0.017 BLQ, BLRc 0.4237 0.114d 0.0138d
a ESP is electrostatic precipitator. b Unit is lb/mmBtu. c Unit is lb/ton.` d From Pechan (2003)
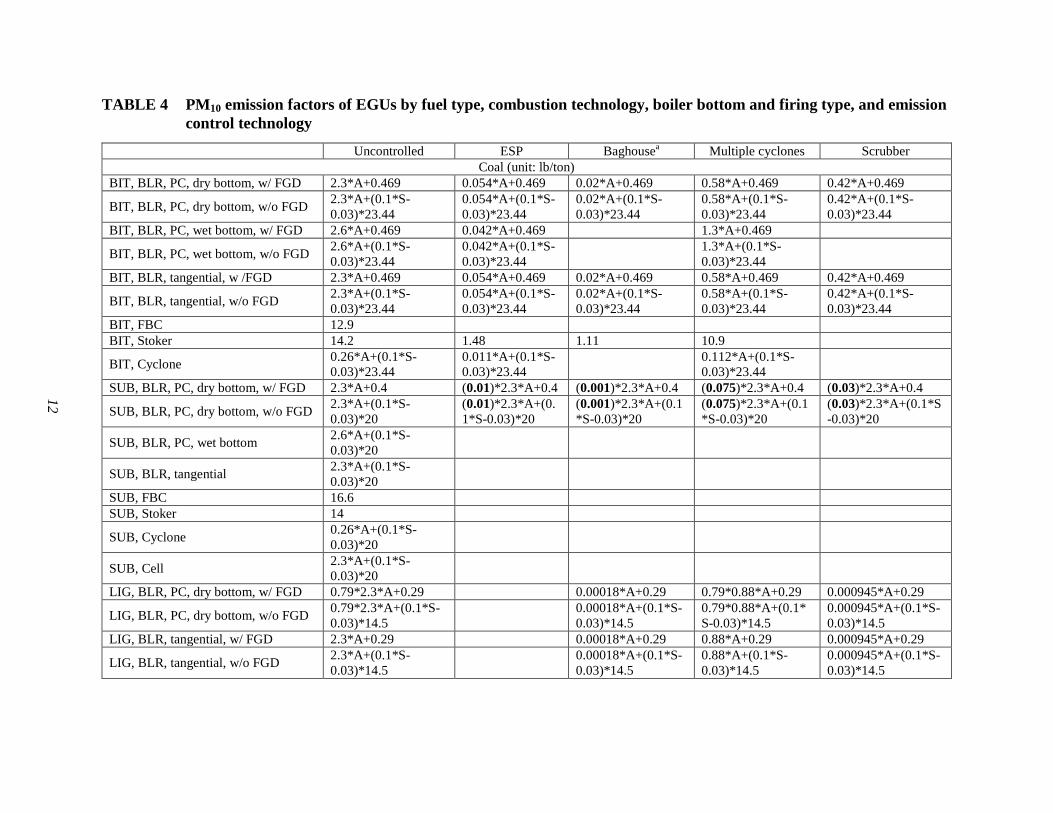
12
TABLE 4 PM10 emission factors of EGUs by fuel type, combustion technology, boiler bottom and firing type, and emission control technology
Uncontrolled ESP Baghousea Multiple cyclones Scrubber
Coal (unit: lb/ton) BIT, BLR, PC, dry bottom, w/ FGD 2.3*A+0.469 0.054*A+0.469 0.02*A+0.469 0.58*A+0.469 0.42*A+0.469
BIT, BLR, PC, dry bottom, w/o FGD 2.3*A+(0.1*S-0.03)*23.44
0.054*A+(0.1*S-0.03)*23.44
0.02*A+(0.1*S-0.03)*23.44
0.58*A+(0.1*S-0.03)*23.44
0.42*A+(0.1*S-0.03)*23.44
BIT, BLR, PC, wet bottom, w/ FGD 2.6*A+0.469 0.042*A+0.469 1.3*A+0.469 BIT, BLR, PC, wet bottom, w/o FGD 2.6*A+(0.1*S-
0.03)*23.44 0.042*A+(0.1*S-0.03)*23.44
1.3*A+(0.1*S-0.03)*23.44
BIT, BLR, tangential, w /FGD 2.3*A+0.469 0.054*A+0.469 0.02*A+0.469 0.58*A+0.469 0.42*A+0.469
BIT, BLR, tangential, w/o FGD 2.3*A+(0.1*S-0.03)*23.44
0.054*A+(0.1*S-0.03)*23.44
0.02*A+(0.1*S-0.03)*23.44
0.58*A+(0.1*S-0.03)*23.44
0.42*A+(0.1*S-0.03)*23.44
BIT, FBC 12.9 BIT, Stoker 14.2 1.48 1.11 10.9 BIT, Cyclone 0.26*A+(0.1*S-
0.03)*23.44 0.011*A+(0.1*S-0.03)*23.44
0.112*A+(0.1*S-0.03)*23.44
SUB, BLR, PC, dry bottom, w/ FGD 2.3*A+0.4 (0.01)*2.3*A+0.4 (0.001)*2.3*A+0.4 (0.075)*2.3*A+0.4 (0.03)*2.3*A+0.4
SUB, BLR, PC, dry bottom, w/o FGD 2.3*A+(0.1*S-0.03)*20
(0.01)*2.3*A+(0.1*S-0.03)*20
(0.001)*2.3*A+(0.1*S-0.03)*20
(0.075)*2.3*A+(0.1*S-0.03)*20
(0.03)*2.3*A+(0.1*S-0.03)*20
SUB, BLR, PC, wet bottom 2.6*A+(0.1*S-0.03)*20
SUB, BLR, tangential 2.3*A+(0.1*S-0.03)*20
SUB, FBC 16.6 SUB, Stoker 14 SUB, Cyclone 0.26*A+(0.1*S-
0.03)*20
SUB, Cell 2.3*A+(0.1*S-0.03)*20
LIG, BLR, PC, dry bottom, w/ FGD 0.79*2.3*A+0.29 0.00018*A+0.29 0.79*0.88*A+0.29 0.000945*A+0.29
LIG, BLR, PC, dry bottom, w/o FGD 0.79*2.3*A+(0.1*S-0.03)*14.5
0.00018*A+(0.1*S-0.03)*14.5
0.79*0.88*A+(0.1*S-0.03)*14.5
0.000945*A+(0.1*S-0.03)*14.5
LIG, BLR, tangential, w/ FGD 2.3*A+0.29 0.00018*A+0.29 0.88*A+0.29 0.000945*A+0.29
LIG, BLR, tangential, w/o FGD 2.3*A+(0.1*S-0.03)*14.5
0.00018*A+(0.1*S-0.03)*14.5
0.88*A+(0.1*S-0.03)*14.5
0.000945*A+(0.1*S-0.03)*14.5
13
TABLE 4 (Cont.)
Uncontrolled ESP Baghousea Multiple cyclones Scrubber
Coal (unit: lb/ton)
LIG, Cyclone 0.871*A+(0.1*S-0.03)*14.5
LIG, FBC 100b*0.07*A+0.32 0.07*A+0.32 0.07*A+0.32 30c*0.07*A+0.32 PetCoke, BLR 7.9*A NG (unit: lb/million scf) NG, BLR 7.6 0.076d 0.57d 0.19d NG, BLR, tangential 7.6 NG, ICE 49.3 NG, CTe 0.0066 LFG, CTe 0.02484 BFG, BLR 8.6 DG, BLR 7.6 DG, CTe 0.01477 Oil (unit: lb/1000 gal)
RFO, BLR 5.9*(1.12*S+0.37)+1.5
0.042*(1.12*S+ 0.37)+1.5
0.5*(1.12*S+0.37) +1.5
DFO, BLR 2.3 DFO, CT 8.54 1.57 DFO, ICE 0.31 JF, CT 0.0615f 0.0113 KER, CT 8.54g 0.012e WO, BLR 51*A Biomass (unit: lb/mmBtu) Dry WDS, BLR, <20% moisture 0.377 0.057 0.287 Wet WDS, BLR, >20% moisture 0.327 0.091 0.217 BLQ, BLR 9.322h,i 0.184h
Notes: A is the as-fired coal ash weight percentage (%). S is the as-fired coal sulfur weight percentage (%). The numbers in bold in parentheses reflect the emission reduction efficiency of the corresponding emission control device in operation, obtained from AP-42 on an
average basis.
14
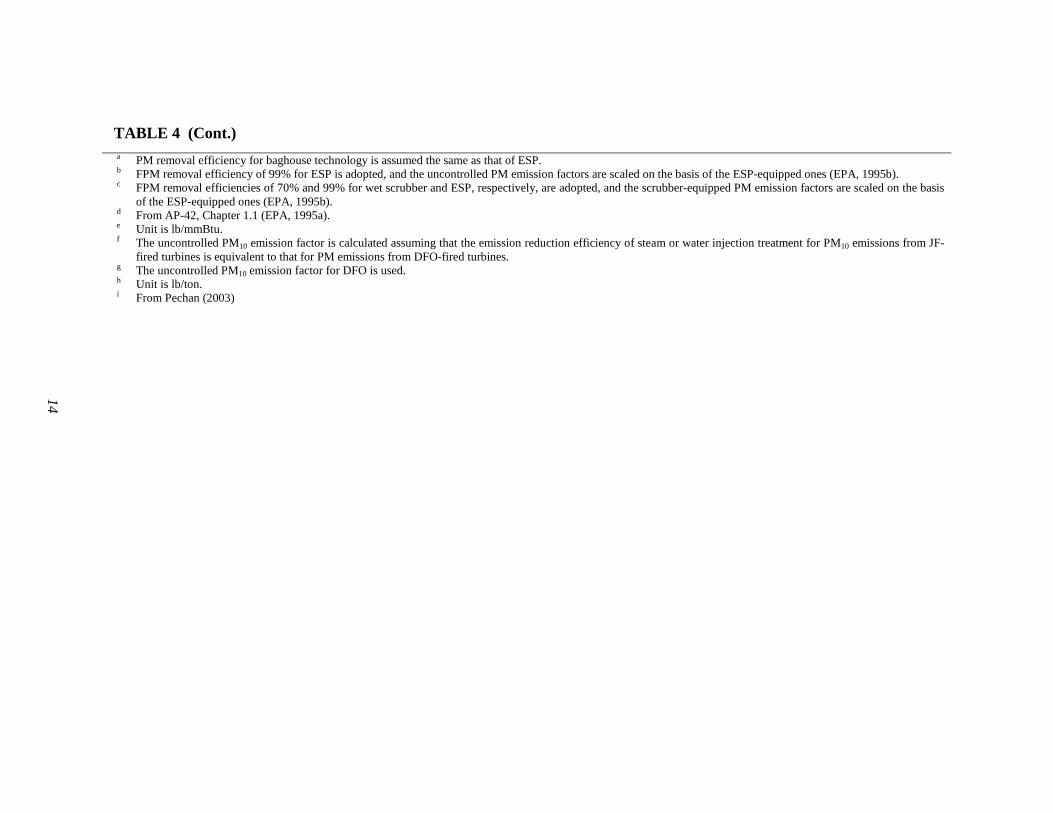
TABLE 4 (Cont.) a PM removal efficiency for baghouse technology is assumed the same as that of ESP. b FPM removal efficiency of 99% for ESP is adopted, and the uncontrolled PM emission factors are scaled on the basis of the ESP-equipped ones (EPA, 1995b). c FPM removal efficiencies of 70% and 99% for wet scrubber and ESP, respectively, are adopted, and the scrubber-equipped PM emission factors are scaled on the basis
of the ESP-equipped ones (EPA, 1995b). d From AP-42, Chapter 1.1 (EPA, 1995a). e Unit is lb/mmBtu. f The uncontrolled PM10 emission factor is calculated assuming that the emission reduction efficiency of steam or water injection treatment for PM10 emissions from JF-
fired turbines is equivalent to that for PM emissions from DFO-fired turbines. g The uncontrolled PM10 emission factor for DFO is used. h Unit is lb/ton. i From Pechan (2003)
15
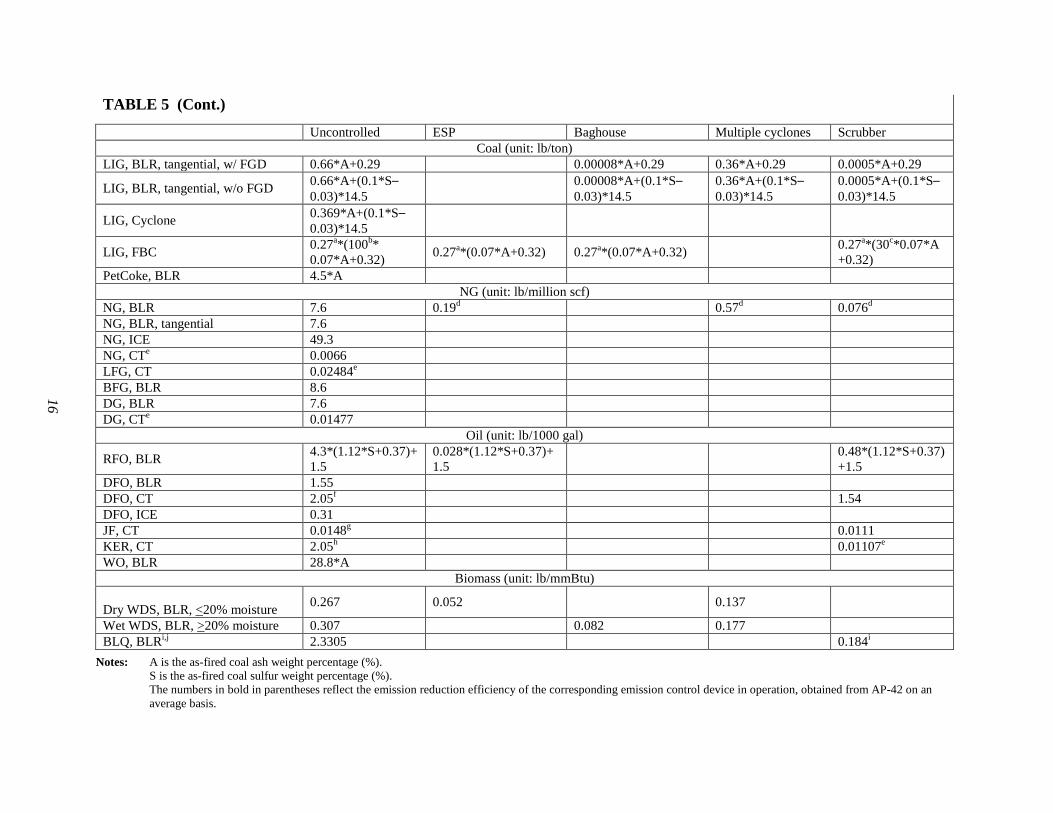
TABLE 5 PM2.5 emission factors of EGUs by fuel type, combustion technology, boiler bottom and firing type, and emission control technology
Uncontrolled ESP Baghouse Multiple cyclones Scrubber
Coal (unit: lb/ton) BIT, BLR, PC, dry bottom, w/ FGD 0.6*A+0.469 0.024*A+0.469 0.01*A+0.469 0.06*A+0.469 0.3*A+0.469 BIT, BLR, PC, dry bottom, w/o FGD
0.6*A+(0.1*S–0.03)*23.44
0.024*A+(0.1*S–0.03)*23.44
0.01*A+(0.1*S–0.03)*23.44
0.06*A+(0.1*S–0.03)*23.44
0.3*A+(0.1*S–0.03)*23.44
BIT, BLR, PC, wet bottom, w/ FGD 1.48*A+0.469 0.022*A+0.469 0.86*A+0.469 BIT, BLR, PC, wet bottom, w/o FGD
1.48*A+(0.1*S–0.03)*23.44
0.022*A+(0.1*S–0.03)*23.44
0.86*A+(0.1*S–0.03)*23.44
BIT, BLR, tangential, w/ FGD 0.6*A+0.469 0.024*A+0.469 0.01*A+0.469 0.06*A+0.469 0.3*A+0.469
BIT, BLR, tangential, w/o FGD 0.6*A+(0.1*S–0.03)*23.44
0.024*A+(0.1*S–0.03)*23.44
0.01*A+(0.1*S–0.03)*23.44
0.06*A+(0.1*S–0.03)*23.44
0.3*A+(0.1*S–0.03)*23.44
BIT, FBC 1.88 BIT, Stoker 5.64 0.44 0.072 3.34 BIT, Cyclone 0.11*A+(0.1*S–
0.03)*23.44 0.0006*A+(0.1*S–0.03)*23.44
0.11*A+(0.1*S–0.03)*23.44
SUB, BLR, PC, dry bottom, w/ FGD 0.6*A+0.4 (0.01)*0.6*A+0.4 (0.001)*0.6*A+0.4 (0.075)*0.6*A+0.4 (0.03)*0.6*A+0.4
SUB, BLR, PC, dry bottom, w/o FGD
0.6*A+(0.1*S–0.03)*20
(0.01)*0.6*A+(0.1*S–0.03)*20
(0.001)*0.6*A+(0.1*S–0.03)*20
(0.075)*0.6*A+(0.1*S–0.03)*20
(0.03)*0.6*A+(0.1*S–0.03)*20
SUB, BLR, PC, wet bottom 1.48*A+(0.1*S–0.03)*20
SUB, BLR, tangential 0.6*A+(0.1*S–0.03)*20
SUB, FBC 1.88 SUB, Stoker 5.4 SUB, Cyclone furnace 0.11*A+(0.1*S–
0.03)*20
SUB, Cell 0.6*A+(0.1*S–0.03)*20
LIG, BLR, PC, dry bottom, w/ FGD 0.79*0.66*A+0.29 0.00008*A+0.29 0.79*0.36*A+0.29 0.0005*A+0.29
LIG, BLR, PC, dry bottom, w/o FGD
0.79*0.66*A+(0.1*S–0.03)*14.5
0.00008*A+(0.1*S–0.03)*14.5
0.79*0.36*A+(0.1*S-0.03)*14.5
0.0005*A+(0.1*S–0.03)*14.5
16
TABLE 5 (Cont.)
Uncontrolled ESP Baghouse Multiple cyclones Scrubber Coal (unit: lb/ton)
LIG, BLR, tangential, w/ FGD 0.66*A+0.29 0.00008*A+0.29 0.36*A+0.29 0.0005*A+0.29
LIG, BLR, tangential, w/o FGD 0.66*A+(0.1*S–0.03)*14.5
0.00008*A+(0.1*S–0.03)*14.5
0.36*A+(0.1*S–0.03)*14.5
0.0005*A+(0.1*S–0.03)*14.5
LIG, Cyclone 0.369*A+(0.1*S–0.03)*14.5
LIG, FBC 0.27a*(100b* 0.07*A+0.32) 0.27a*(0.07*A+0.32) 0.27a*(0.07*A+0.32)
0.27a*(30c*0.07*A+0.32)
PetCoke, BLR 4.5*A NG (unit: lb/million scf) NG, BLR 7.6 0.19d 0.57d 0.076d NG, BLR, tangential 7.6 NG, ICE 49.3 NG, CTe 0.0066 LFG, CT 0.02484e BFG, BLR 8.6 DG, BLR 7.6 DG, CTe 0.01477 Oil (unit: lb/1000 gal)
RFO, BLR 4.3*(1.12*S+0.37)+1.5
0.028*(1.12*S+0.37)+1.5
0.48*(1.12*S+0.37)+1.5
DFO, BLR 1.55 DFO, CT 2.05f 1.54 DFO, ICE 0.31 JF, CT 0.0148g 0.0111 KER, CT 2.05h 0.01107e WO, BLR 28.8*A
Biomass (unit: lb/mmBtu) Dry WDS, BLR, <20% moisture 0.267 0.052 0.137
Wet WDS, BLR, >20% moisture 0.307 0.082 0.177 BLQ, BLRi,j 2.3305 0.184i
Notes: A is the as-fired coal ash weight percentage (%). S is the as-fired coal sulfur weight percentage (%). The numbers in bold in parentheses reflect the emission reduction efficiency of the corresponding emission control device in operation, obtained from AP-42 on an average basis.
17
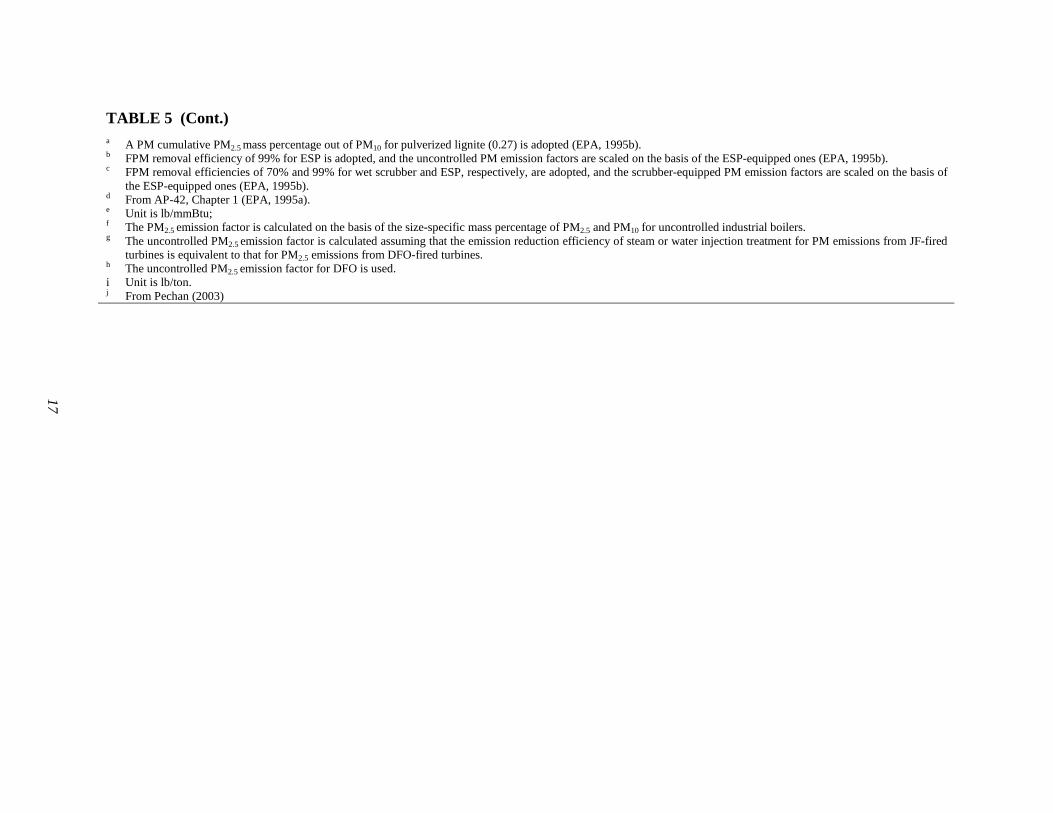
TABLE 5 (Cont.) a A PM cumulative PM2.5 mass percentage out of PM10 for pulverized lignite (0.27) is adopted (EPA, 1995b). b FPM removal efficiency of 99% for ESP is adopted, and the uncontrolled PM emission factors are scaled on the basis of the ESP-equipped ones (EPA, 1995b). c FPM removal efficiencies of 70% and 99% for wet scrubber and ESP, respectively, are adopted, and the scrubber-equipped PM emission factors are scaled on the basis of
the ESP-equipped ones (EPA, 1995b). d From AP-42, Chapter 1 (EPA, 1995a). e Unit is lb/mmBtu; f The PM2.5 emission factor is calculated on the basis of the size-specific mass percentage of PM2.5 and PM10 for uncontrolled industrial boilers. g The uncontrolled PM2.5 emission factor is calculated assuming that the emission reduction efficiency of steam or water injection treatment for PM emissions from JF-fired
turbines is equivalent to that for PM2.5 emissions from DFO-fired turbines. h The uncontrolled PM2.5 emission factor for DFO is used. i Unit is lb/ton. j From Pechan (2003)
18
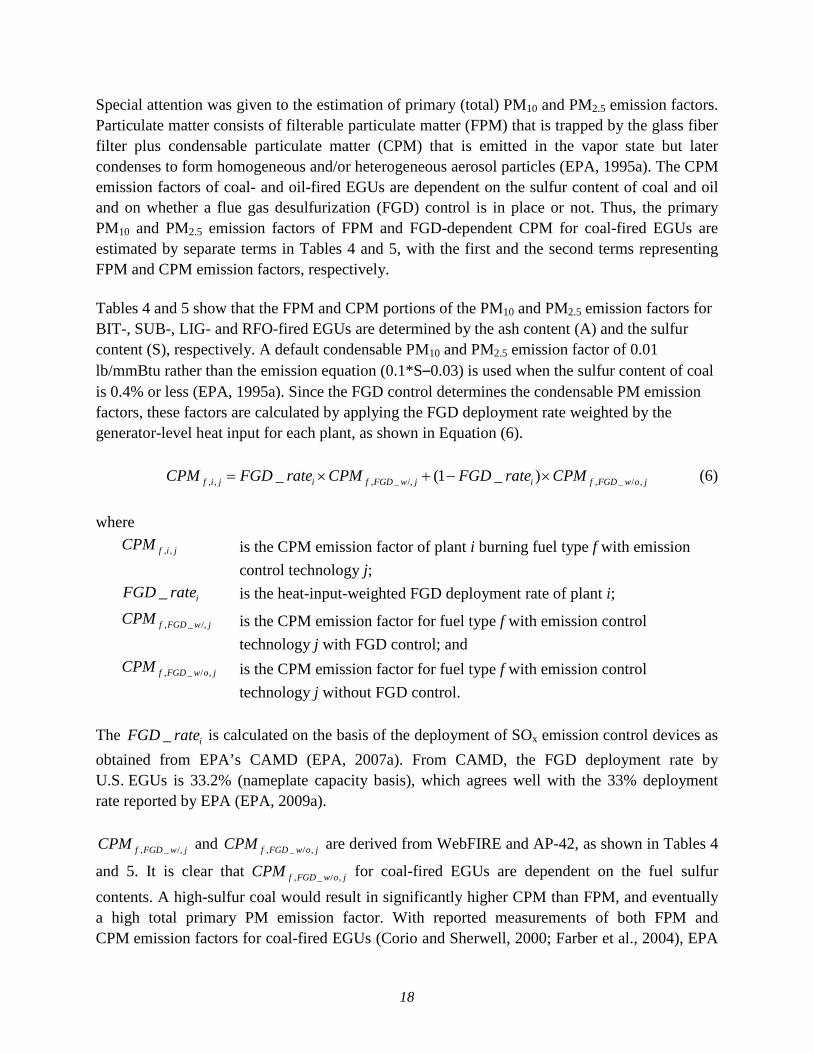
Special attention was given to the estimation of primary (total) PM10 and PM2.5 emission factors. Particulate matter consists of filterable particulate matter (FPM) that is trapped by the glass fiber filter plus condensable particulate matter (CPM) that is emitted in the vapor state but later condenses to form homogeneous and/or heterogeneous aerosol particles (EPA, 1995a). The CPM emission factors of coal- and oil-fired EGUs are dependent on the sulfur content of coal and oil and on whether a flue gas desulfurization (FGD) control is in place or not. Thus, the primary PM10 and PM2.5 emission factors of FPM and FGD-dependent CPM for coal-fired EGUs are estimated by separate terms in Tables 4 and 5, with the first and the second terms representing FPM and CPM emission factors, respectively. Tables 4 and 5 show that the FPM and CPM portions of the PM10 and PM2.5 emission factors for BIT-, SUB-, LIG- and RFO-fired EGUs are determined by the ash content (A) and the sulfur content (S), respectively. A default condensable PM10 and PM2.5 emission factor of 0.01 lb/mmBtu rather than the emission equation (0.1*S–0.03) is used when the sulfur content of coal is 0.4% or less (EPA, 1995a). Since the FGD control determines the condensable PM emission factors, these factors are calculated by applying the FGD deployment rate weighted by the generator-level heat input for each plant, as shown in Equation (6).
, , , _ /, , _ / ,_ (1 _ )f i j i f FGD w j i f FGD w o jCPM FGD rate CPM FGD rate CPM= × + − × (6) where
, ,f i jCPM is the CPM emission factor of plant i burning fuel type f with emission control technology j;
_ iFGD rate is the heat-input-weighted FGD deployment rate of plant i;
, _ /,f FGD w jCPM is the CPM emission factor for fuel type f with emission control technology j with FGD control; and
, _ / ,f FGD w o jCPM is the CPM emission factor for fuel type f with emission control technology j without FGD control.
The _ iFGD rate is calculated on the basis of the deployment of SOx emission control devices as obtained from EPA’s CAMD (EPA, 2007a). From CAMD, the FGD deployment rate by U.S. EGUs is 33.2% (nameplate capacity basis), which agrees well with the 33% deployment rate reported by EPA (EPA, 2009a).
, _ /,f FGD w jCPM and , _ / ,f FGD w o jCPM are derived from WebFIRE and AP-42, as shown in Tables 4
and 5. It is clear that , _ / ,f FGD w o jCPM for coal-fired EGUs are dependent on the fuel sulfur contents. A high-sulfur coal would result in significantly higher CPM than FPM, and eventually a high total primary PM emission factor. With reported measurements of both FPM and CPM emission factors for coal-fired EGUs (Corio and Sherwell, 2000; Farber et al., 2004), EPA
19
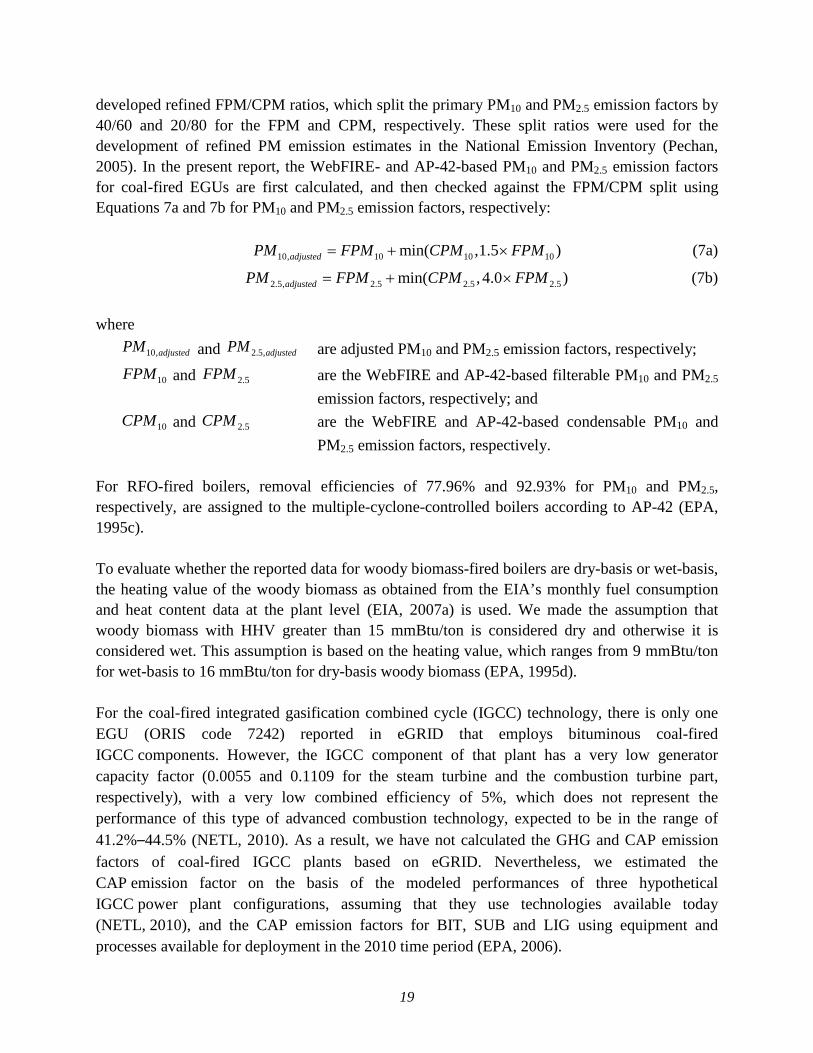
developed refined FPM/CPM ratios, which split the primary PM10 and PM2.5 emission factors by 40/60 and 20/80 for the FPM and CPM, respectively. These split ratios were used for the development of refined PM emission estimates in the National Emission Inventory (Pechan, 2005). In the present report, the WebFIRE- and AP-42-based PM10 and PM2.5 emission factors for coal-fired EGUs are first calculated, and then checked against the FPM/CPM split using Equations 7a and 7b for PM10 and PM2.5 emission factors, respectively:
10, 10 10 10min( ,1.5 )adjustedPM FPM CPM FPM= + × (7a)
2.5, 2.5 2.5 2.5min( , 4.0 )adjustedPM FPM CPM FPM= + × (7b) where
10,adjustedPM and 2.5,adjustedPM are adjusted PM10 and PM2.5 emission factors, respectively;
10FPM and 2.5FPM are the WebFIRE and AP-42-based filterable PM10 and PM2.5 emission factors, respectively; and
10CPM and 2.5CPM are the WebFIRE and AP-42-based condensable PM10 and PM2.5 emission factors, respectively.
For RFO-fired boilers, removal efficiencies of 77.96% and 92.93% for PM10 and PM2.5, respectively, are assigned to the multiple-cyclone-controlled boilers according to AP-42 (EPA, 1995c). To evaluate whether the reported data for woody biomass-fired boilers are dry-basis or wet-basis, the heating value of the woody biomass as obtained from the EIA’s monthly fuel consumption and heat content data at the plant level (EIA, 2007a) is used. We made the assumption that woody biomass with HHV greater than 15 mmBtu/ton is considered dry and otherwise it is considered wet. This assumption is based on the heating value, which ranges from 9 mmBtu/ton for wet-basis to 16 mmBtu/ton for dry-basis woody biomass (EPA, 1995d). For the coal-fired integrated gasification combined cycle (IGCC) technology, there is only one EGU (ORIS code 7242) reported in eGRID that employs bituminous coal-fired IGCC components. However, the IGCC component of that plant has a very low generator capacity factor (0.0055 and 0.1109 for the steam turbine and the combustion turbine part, respectively), with a very low combined efficiency of 5%, which does not represent the performance of this type of advanced combustion technology, expected to be in the range of 41.2%–44.5% (NETL, 2010). As a result, we have not calculated the GHG and CAP emission factors of coal-fired IGCC plants based on eGRID. Nevertheless, we estimated the CAP emission factor on the basis of the modeled performances of three hypothetical IGCC power plant configurations, assuming that they use technologies available today (NETL, 2010), and the CAP emission factors for BIT, SUB and LIG using equipment and processes available for deployment in the 2010 time period (EPA, 2006).
20
For natural gas combined cycle (NGCC) plants, 0.000242 and 0.0004973 lb/mmBtu are adopted as the emission factors of PM and VOC, respectively, on the basis of the in-stack flue gas measurement of one NGCC plant (England et al., 2004). A CO emission factor of 0.02669 g/kWh, which was modeled on an energy balance and mass balance basis from an NGCC plant with an LHV-based efficiency of 54.1% (Spath and Mann, 2000), is used in this work for estimation of the CO emission factors for individual NGCC plants, using Equation (8). As for other types of power plants, the NOx and SOx emission data from eGRID are used to calculate their emission factors for NGCC plants.
, ,NERL
co i co NRELi
EF EF ηη
= × (8)
where
,co iEF and ,co NRELEF are the CO emission factors in g/kWh for NGCC plant i and for the NREL NGCC plant, respectively; and
iη and are the LHV-based efficiencies for NGCC plant i and for the NREL NGCC plant, respectively.
The CAP emissions are approximated for SC-, WC-, TDF-, AB-, MSB-, OBS-, OBL-, WDL-, OG-, OTH- and purchased steam (PUR)-fired EGUs, whose net electricity generation accounts for a small fraction of the total and for which no data are available for the estimation of their CAP emissions. The emission factors of BIT-fired EGUs are applied to SC-fired EGUs after accounting for the difference in fuel properties, e.g., decreased ash and sulfur contents, and increased heating value. For WC-fired EGUs, with a much higher ash content, the CAP emissions are calculated using the emission factors of LIG-fired EGUs and adjusted by the ash and sulfur contents of WC. The BIT-fired emission factors are used to approximate the CAP emissions for TDF-fired EGUs. Emission factors of NG-fired EGUs are used to estimate the CAP emissions of OG-, OTH- and PUR-fired EGUs. The dry-basis WDS emission factors are used to estimate the CAP emissions of AB-, MSB- and OBS-fired EGUs, while the wet-basis WDS emission factors are used to estimate the CAP emissions of OBL- and WDL-fired EGUs. For PC-, BLQ-, BFG-, DG-, KER- and WO-fired EGUs, the CAP emissions are calculated from the CAP emission factors compiled in Tables 2-5, based on WebFIRE. In Tables 2-5, only uncontrolled or LNB emission factors for CO and VOC are available for most EGUs. Also, we noticed that some EGUs, like the BIT-fired EGUs that utilize FBC or stokers, have only uncontrolled PM10 and PM2.5 emission factors, since no particular control technologies are deployed there.
21
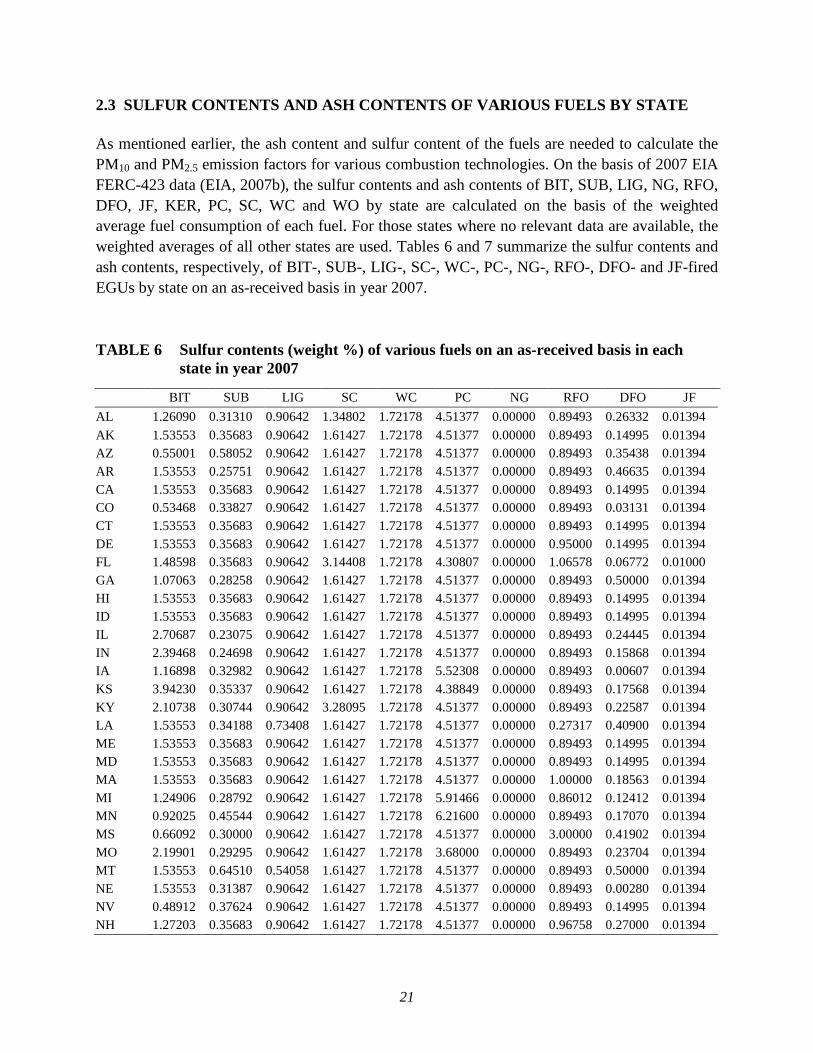
2.3 SULFUR CONTENTS AND ASH CONTENTS OF VARIOUS FUELS BY STATE As mentioned earlier, the ash content and sulfur content of the fuels are needed to calculate the PM10 and PM2.5 emission factors for various combustion technologies. On the basis of 2007 EIA FERC-423 data (EIA, 2007b), the sulfur contents and ash contents of BIT, SUB, LIG, NG, RFO, DFO, JF, KER, PC, SC, WC and WO by state are calculated on the basis of the weighted average fuel consumption of each fuel. For those states where no relevant data are available, the weighted averages of all other states are used. Tables 6 and 7 summarize the sulfur contents and ash contents, respectively, of BIT-, SUB-, LIG-, SC-, WC-, PC-, NG-, RFO-, DFO- and JF-fired EGUs by state on an as-received basis in year 2007. TABLE 6 Sulfur contents (weight %) of various fuels on an as-received basis in each
state in year 2007
BIT SUB LIG SC WC PC NG RFO DFO JF AL 1.26090 0.31310 0.90642 1.34802 1.72178 4.51377 0.00000 0.89493 0.26332 0.01394 AK 1.53553 0.35683 0.90642 1.61427 1.72178 4.51377 0.00000 0.89493 0.14995 0.01394 AZ 0.55001 0.58052 0.90642 1.61427 1.72178 4.51377 0.00000 0.89493 0.35438 0.01394 AR 1.53553 0.25751 0.90642 1.61427 1.72178 4.51377 0.00000 0.89493 0.46635 0.01394 CA 1.53553 0.35683 0.90642 1.61427 1.72178 4.51377 0.00000 0.89493 0.14995 0.01394 CO 0.53468 0.33827 0.90642 1.61427 1.72178 4.51377 0.00000 0.89493 0.03131 0.01394 CT 1.53553 0.35683 0.90642 1.61427 1.72178 4.51377 0.00000 0.89493 0.14995 0.01394 DE 1.53553 0.35683 0.90642 1.61427 1.72178 4.51377 0.00000 0.95000 0.14995 0.01394 FL 1.48598 0.35683 0.90642 3.14408 1.72178 4.30807 0.00000 1.06578 0.06772 0.01000 GA 1.07063 0.28258 0.90642 1.61427 1.72178 4.51377 0.00000 0.89493 0.50000 0.01394 HI 1.53553 0.35683 0.90642 1.61427 1.72178 4.51377 0.00000 0.89493 0.14995 0.01394 ID 1.53553 0.35683 0.90642 1.61427 1.72178 4.51377 0.00000 0.89493 0.14995 0.01394 IL 2.70687 0.23075 0.90642 1.61427 1.72178 4.51377 0.00000 0.89493 0.24445 0.01394 IN 2.39468 0.24698 0.90642 1.61427 1.72178 4.51377 0.00000 0.89493 0.15868 0.01394 IA 1.16898 0.32982 0.90642 1.61427 1.72178 5.52308 0.00000 0.89493 0.00607 0.01394 KS 3.94230 0.35337 0.90642 1.61427 1.72178 4.38849 0.00000 0.89493 0.17568 0.01394 KY 2.10738 0.30744 0.90642 3.28095 1.72178 4.51377 0.00000 0.89493 0.22587 0.01394 LA 1.53553 0.34188 0.73408 1.61427 1.72178 4.51377 0.00000 0.27317 0.40900 0.01394 ME 1.53553 0.35683 0.90642 1.61427 1.72178 4.51377 0.00000 0.89493 0.14995 0.01394 MD 1.53553 0.35683 0.90642 1.61427 1.72178 4.51377 0.00000 0.89493 0.14995 0.01394 MA 1.53553 0.35683 0.90642 1.61427 1.72178 4.51377 0.00000 1.00000 0.18563 0.01394 MI 1.24906 0.28792 0.90642 1.61427 1.72178 5.91466 0.00000 0.86012 0.12412 0.01394 MN 0.92025 0.45544 0.90642 1.61427 1.72178 6.21600 0.00000 0.89493 0.17070 0.01394 MS 0.66092 0.30000 0.90642 1.61427 1.72178 4.51377 0.00000 3.00000 0.41902 0.01394 MO 2.19901 0.29295 0.90642 1.61427 1.72178 3.68000 0.00000 0.89493 0.23704 0.01394 MT 1.53553 0.64510 0.54058 1.61427 1.72178 4.51377 0.00000 0.89493 0.50000 0.01394 NE 1.53553 0.31387 0.90642 1.61427 1.72178 4.51377 0.00000 0.89493 0.00280 0.01394 NV 0.48912 0.37624 0.90642 1.61427 1.72178 4.51377 0.00000 0.89493 0.14995 0.01394 NH 1.27203 0.35683 0.90642 1.61427 1.72178 4.51377 0.00000 0.96758 0.27000 0.01394
22
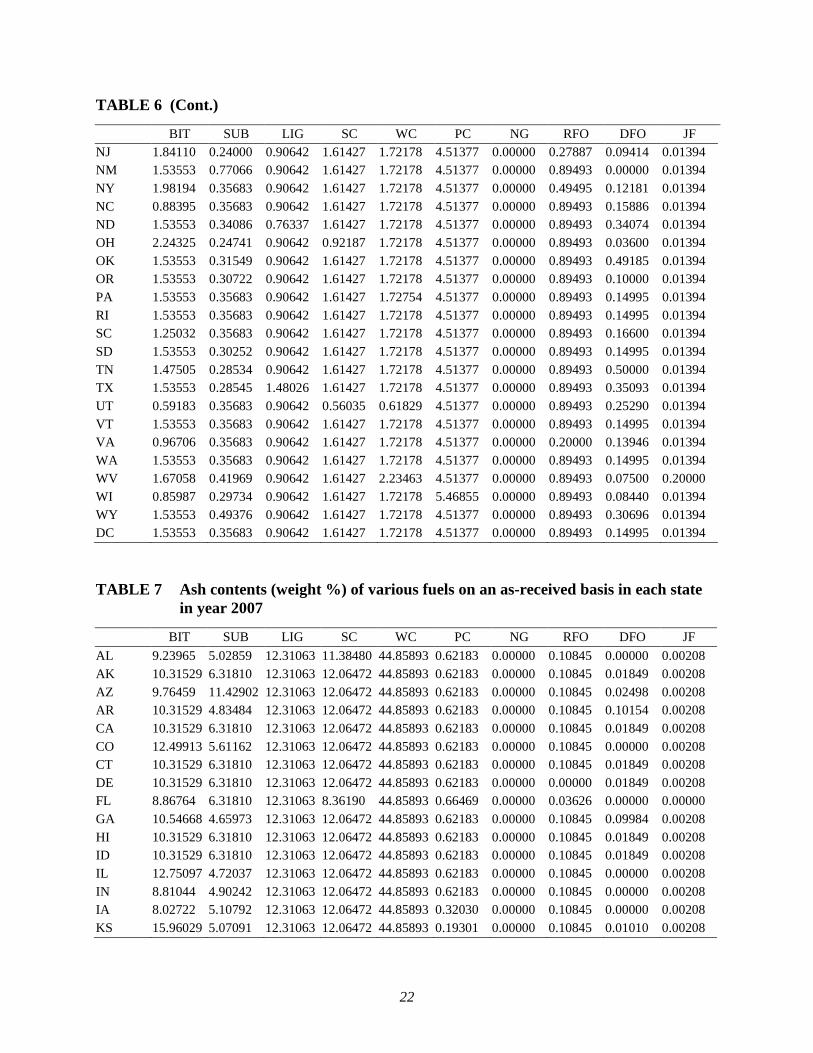
TABLE 6 (Cont.)
BIT SUB LIG SC WC PC NG RFO DFO JF NJ 1.84110 0.24000 0.90642 1.61427 1.72178 4.51377 0.00000 0.27887 0.09414 0.01394 NM 1.53553 0.77066 0.90642 1.61427 1.72178 4.51377 0.00000 0.89493 0.00000 0.01394 NY 1.98194 0.35683 0.90642 1.61427 1.72178 4.51377 0.00000 0.49495 0.12181 0.01394 NC 0.88395 0.35683 0.90642 1.61427 1.72178 4.51377 0.00000 0.89493 0.15886 0.01394 ND 1.53553 0.34086 0.76337 1.61427 1.72178 4.51377 0.00000 0.89493 0.34074 0.01394 OH 2.24325 0.24741 0.90642 0.92187 1.72178 4.51377 0.00000 0.89493 0.03600 0.01394 OK 1.53553 0.31549 0.90642 1.61427 1.72178 4.51377 0.00000 0.89493 0.49185 0.01394 OR 1.53553 0.30722 0.90642 1.61427 1.72178 4.51377 0.00000 0.89493 0.10000 0.01394 PA 1.53553 0.35683 0.90642 1.61427 1.72754 4.51377 0.00000 0.89493 0.14995 0.01394 RI 1.53553 0.35683 0.90642 1.61427 1.72178 4.51377 0.00000 0.89493 0.14995 0.01394 SC 1.25032 0.35683 0.90642 1.61427 1.72178 4.51377 0.00000 0.89493 0.16600 0.01394 SD 1.53553 0.30252 0.90642 1.61427 1.72178 4.51377 0.00000 0.89493 0.14995 0.01394 TN 1.47505 0.28534 0.90642 1.61427 1.72178 4.51377 0.00000 0.89493 0.50000 0.01394 TX 1.53553 0.28545 1.48026 1.61427 1.72178 4.51377 0.00000 0.89493 0.35093 0.01394 UT 0.59183 0.35683 0.90642 0.56035 0.61829 4.51377 0.00000 0.89493 0.25290 0.01394 VT 1.53553 0.35683 0.90642 1.61427 1.72178 4.51377 0.00000 0.89493 0.14995 0.01394 VA 0.96706 0.35683 0.90642 1.61427 1.72178 4.51377 0.00000 0.20000 0.13946 0.01394 WA 1.53553 0.35683 0.90642 1.61427 1.72178 4.51377 0.00000 0.89493 0.14995 0.01394 WV 1.67058 0.41969 0.90642 1.61427 2.23463 4.51377 0.00000 0.89493 0.07500 0.20000 WI 0.85987 0.29734 0.90642 1.61427 1.72178 5.46855 0.00000 0.89493 0.08440 0.01394 WY 1.53553 0.49376 0.90642 1.61427 1.72178 4.51377 0.00000 0.89493 0.30696 0.01394 DC 1.53553 0.35683 0.90642 1.61427 1.72178 4.51377 0.00000 0.89493 0.14995 0.01394 TABLE 7 Ash contents (weight %) of various fuels on an as-received basis in each state
in year 2007
BIT SUB LIG SC WC PC NG RFO DFO JF AL 9.23965 5.02859 12.31063 11.38480 44.85893 0.62183 0.00000 0.10845 0.00000 0.00208 AK 10.31529 6.31810 12.31063 12.06472 44.85893 0.62183 0.00000 0.10845 0.01849 0.00208 AZ 9.76459 11.42902 12.31063 12.06472 44.85893 0.62183 0.00000 0.10845 0.02498 0.00208 AR 10.31529 4.83484 12.31063 12.06472 44.85893 0.62183 0.00000 0.10845 0.10154 0.00208 CA 10.31529 6.31810 12.31063 12.06472 44.85893 0.62183 0.00000 0.10845 0.01849 0.00208 CO 12.49913 5.61162 12.31063 12.06472 44.85893 0.62183 0.00000 0.10845 0.00000 0.00208 CT 10.31529 6.31810 12.31063 12.06472 44.85893 0.62183 0.00000 0.10845 0.01849 0.00208 DE 10.31529 6.31810 12.31063 12.06472 44.85893 0.62183 0.00000 0.00000 0.01849 0.00208 FL 8.86764 6.31810 12.31063 8.36190 44.85893 0.66469 0.00000 0.03626 0.00000 0.00000 GA 10.54668 4.65973 12.31063 12.06472 44.85893 0.62183 0.00000 0.10845 0.09984 0.00208 HI 10.31529 6.31810 12.31063 12.06472 44.85893 0.62183 0.00000 0.10845 0.01849 0.00208 ID 10.31529 6.31810 12.31063 12.06472 44.85893 0.62183 0.00000 0.10845 0.01849 0.00208 IL 12.75097 4.72037 12.31063 12.06472 44.85893 0.62183 0.00000 0.10845 0.00000 0.00208 IN 8.81044 4.90242 12.31063 12.06472 44.85893 0.62183 0.00000 0.10845 0.00000 0.00208 IA 8.02722 5.10792 12.31063 12.06472 44.85893 0.32030 0.00000 0.10845 0.00000 0.00208 KS 15.96029 5.07091 12.31063 12.06472 44.85893 0.19301 0.00000 0.10845 0.01010 0.00208
23
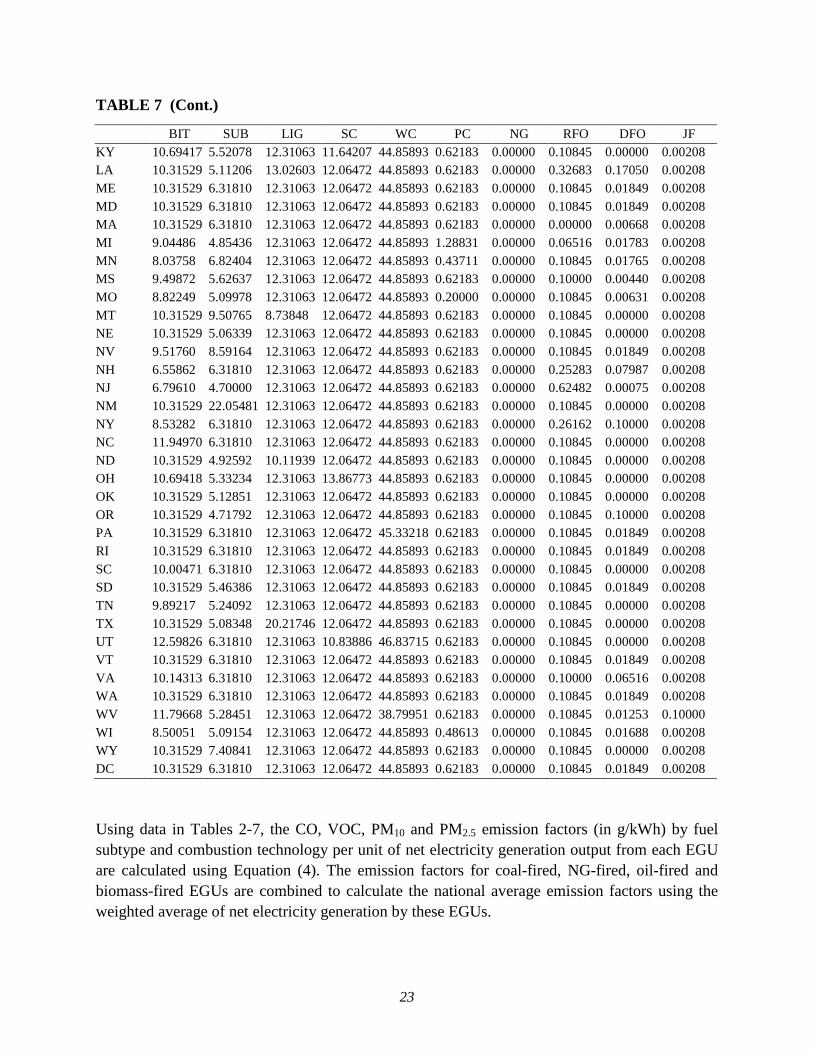
TABLE 7 (Cont.)
BIT SUB LIG SC WC PC NG RFO DFO JF KY 10.69417 5.52078 12.31063 11.64207 44.85893 0.62183 0.00000 0.10845 0.00000 0.00208 LA 10.31529 5.11206 13.02603 12.06472 44.85893 0.62183 0.00000 0.32683 0.17050 0.00208 ME 10.31529 6.31810 12.31063 12.06472 44.85893 0.62183 0.00000 0.10845 0.01849 0.00208 MD 10.31529 6.31810 12.31063 12.06472 44.85893 0.62183 0.00000 0.10845 0.01849 0.00208 MA 10.31529 6.31810 12.31063 12.06472 44.85893 0.62183 0.00000 0.00000 0.00668 0.00208 MI 9.04486 4.85436 12.31063 12.06472 44.85893 1.28831 0.00000 0.06516 0.01783 0.00208 MN 8.03758 6.82404 12.31063 12.06472 44.85893 0.43711 0.00000 0.10845 0.01765 0.00208 MS 9.49872 5.62637 12.31063 12.06472 44.85893 0.62183 0.00000 0.10000 0.00440 0.00208 MO 8.82249 5.09978 12.31063 12.06472 44.85893 0.20000 0.00000 0.10845 0.00631 0.00208 MT 10.31529 9.50765 8.73848 12.06472 44.85893 0.62183 0.00000 0.10845 0.00000 0.00208 NE 10.31529 5.06339 12.31063 12.06472 44.85893 0.62183 0.00000 0.10845 0.00000 0.00208 NV 9.51760 8.59164 12.31063 12.06472 44.85893 0.62183 0.00000 0.10845 0.01849 0.00208 NH 6.55862 6.31810 12.31063 12.06472 44.85893 0.62183 0.00000 0.25283 0.07987 0.00208 NJ 6.79610 4.70000 12.31063 12.06472 44.85893 0.62183 0.00000 0.62482 0.00075 0.00208 NM 10.31529 22.05481 12.31063 12.06472 44.85893 0.62183 0.00000 0.10845 0.00000 0.00208 NY 8.53282 6.31810 12.31063 12.06472 44.85893 0.62183 0.00000 0.26162 0.10000 0.00208 NC 11.94970 6.31810 12.31063 12.06472 44.85893 0.62183 0.00000 0.10845 0.00000 0.00208 ND 10.31529 4.92592 10.11939 12.06472 44.85893 0.62183 0.00000 0.10845 0.00000 0.00208 OH 10.69418 5.33234 12.31063 13.86773 44.85893 0.62183 0.00000 0.10845 0.00000 0.00208 OK 10.31529 5.12851 12.31063 12.06472 44.85893 0.62183 0.00000 0.10845 0.00000 0.00208 OR 10.31529 4.71792 12.31063 12.06472 44.85893 0.62183 0.00000 0.10845 0.10000 0.00208 PA 10.31529 6.31810 12.31063 12.06472 45.33218 0.62183 0.00000 0.10845 0.01849 0.00208 RI 10.31529 6.31810 12.31063 12.06472 44.85893 0.62183 0.00000 0.10845 0.01849 0.00208 SC 10.00471 6.31810 12.31063 12.06472 44.85893 0.62183 0.00000 0.10845 0.00000 0.00208 SD 10.31529 5.46386 12.31063 12.06472 44.85893 0.62183 0.00000 0.10845 0.01849 0.00208 TN 9.89217 5.24092 12.31063 12.06472 44.85893 0.62183 0.00000 0.10845 0.00000 0.00208 TX 10.31529 5.08348 20.21746 12.06472 44.85893 0.62183 0.00000 0.10845 0.00000 0.00208 UT 12.59826 6.31810 12.31063 10.83886 46.83715 0.62183 0.00000 0.10845 0.00000 0.00208 VT 10.31529 6.31810 12.31063 12.06472 44.85893 0.62183 0.00000 0.10845 0.01849 0.00208 VA 10.14313 6.31810 12.31063 12.06472 44.85893 0.62183 0.00000 0.10000 0.06516 0.00208 WA 10.31529 6.31810 12.31063 12.06472 44.85893 0.62183 0.00000 0.10845 0.01849 0.00208 WV 11.79668 5.28451 12.31063 12.06472 38.79951 0.62183 0.00000 0.10845 0.01253 0.10000 WI 8.50051 5.09154 12.31063 12.06472 44.85893 0.48613 0.00000 0.10845 0.01688 0.00208 WY 10.31529 7.40841 12.31063 12.06472 44.85893 0.62183 0.00000 0.10845 0.00000 0.00208 DC 10.31529 6.31810 12.31063 12.06472 44.85893 0.62183 0.00000 0.10845 0.01849 0.00208 Using data in Tables 2-7, the CO, VOC, PM10 and PM2.5 emission factors (in g/kWh) by fuel subtype and combustion technology per unit of net electricity generation output from each EGU are calculated using Equation (4). The emission factors for coal-fired, NG-fired, oil-fired and biomass-fired EGUs are combined to calculate the national average emission factors using the weighted average of net electricity generation by these EGUs.
24
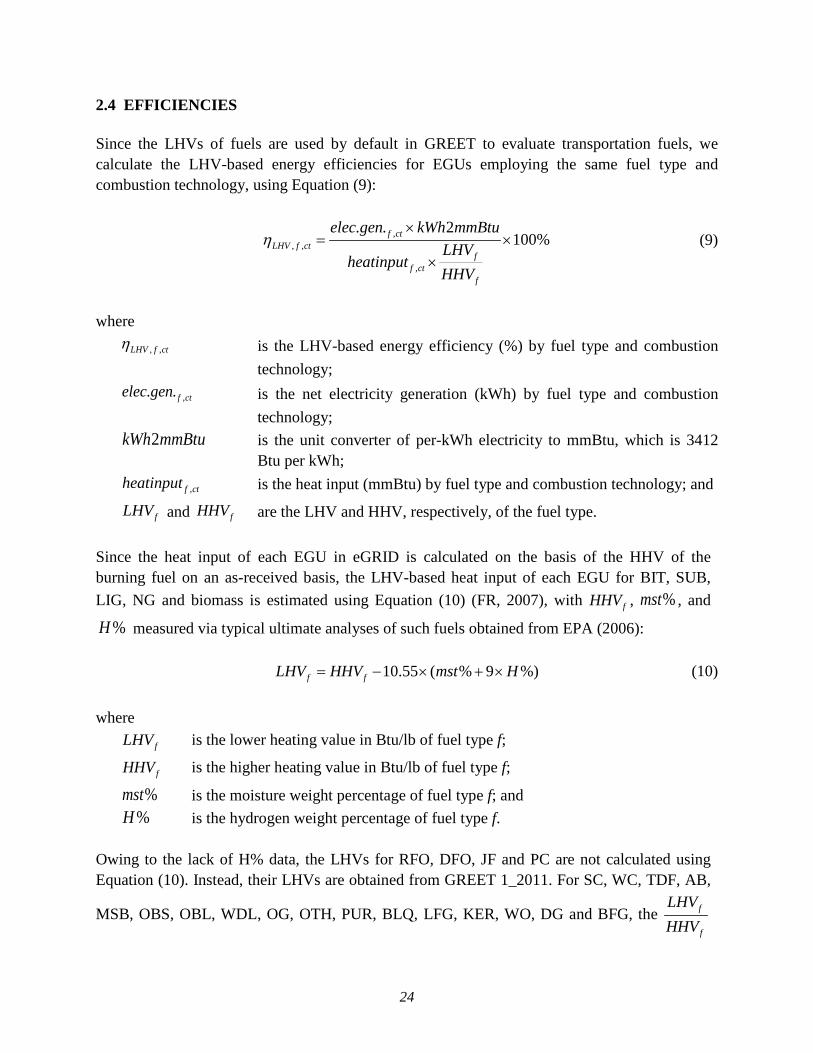
2.4 EFFICIENCIES Since the LHVs of fuels are used by default in GREET to evaluate transportation fuels, we calculate the LHV-based energy efficiencies for EGUs employing the same fuel type and combustion technology, using Equation (9):
,, ,
,
. . 2100%f ct
LHV f ctf
f ctf
elec gen kWh mmBtuLHV
heatinputHHV
η×
= ××
(9)
where
, ,LHV f ctη is the LHV-based energy efficiency (%) by fuel type and combustion technology;
,. . f ctelec gen is the net electricity generation (kWh) by fuel type and combustion technology;
2kWh mmBtu is the unit converter of per-kWh electricity to mmBtu, which is 3412 Btu per kWh;
,f ctheatinput is the heat input (mmBtu) by fuel type and combustion technology; and
fLHV and fHHV are the LHV and HHV, respectively, of the fuel type. Since the heat input of each EGU in eGRID is calculated on the basis of the HHV of the burning fuel on an as-received basis, the LHV-based heat input of each EGU for BIT, SUB, LIG, NG and biomass is estimated using Equation (10) (FR, 2007), with fHHV , %mst , and
%H measured via typical ultimate analyses of such fuels obtained from EPA (2006):
10.55 ( % 9 %)f fLHV HHV mst H= − × + × (10) where
fLHV is the lower heating value in Btu/lb of fuel type f;
fHHV is the higher heating value in Btu/lb of fuel type f;
%mst is the moisture weight percentage of fuel type f; and %H is the hydrogen weight percentage of fuel type f.
Owing to the lack of H% data, the LHVs for RFO, DFO, JF and PC are not calculated using Equation (10). Instead, their LHVs are obtained from GREET 1_2011. For SC, WC, TDF, AB,
MSB, OBS, OBL, WDL, OG, OTH, PUR, BLQ, LFG, KER, WO, DG and BFG, the f
f
LHVHHV
25
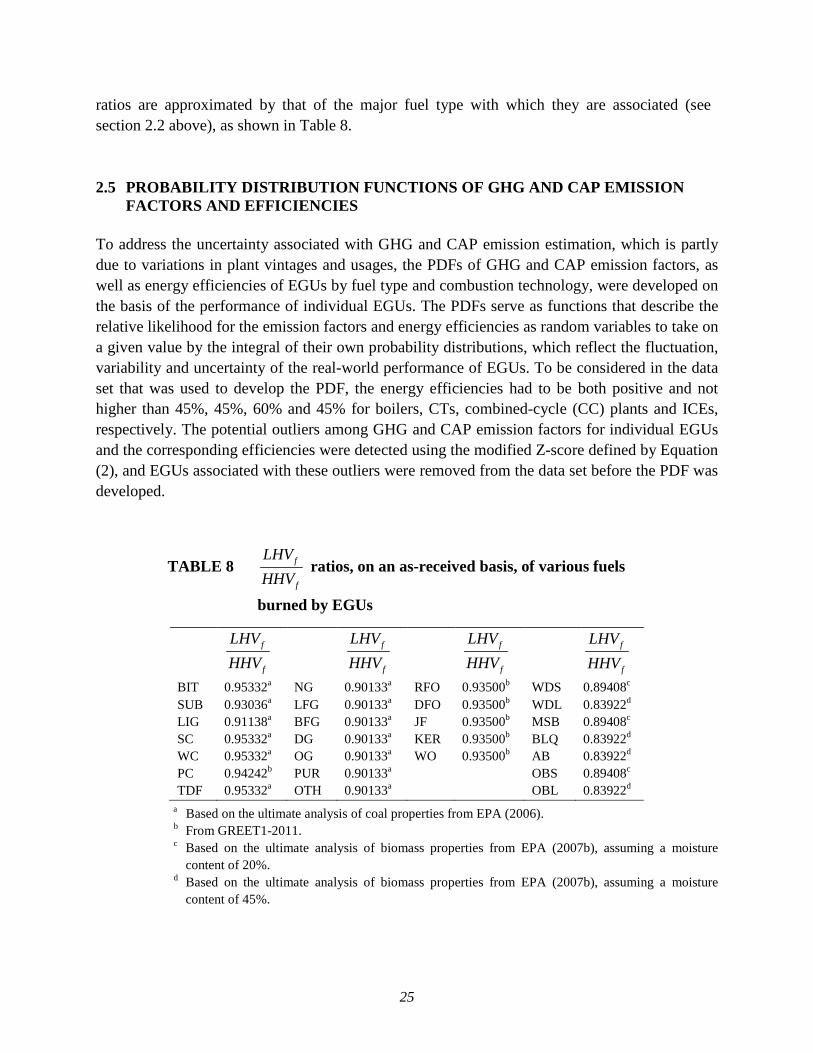
ratios are approximated by that of the major fuel type with which they are associated (see section 2.2 above), as shown in Table 8. 2.5 PROBABILITY DISTRIBUTION FUNCTIONS OF GHG AND CAP EMISSION
FACTORS AND EFFICIENCIES To address the uncertainty associated with GHG and CAP emission estimation, which is partly due to variations in plant vintages and usages, the PDFs of GHG and CAP emission factors, as well as energy efficiencies of EGUs by fuel type and combustion technology, were developed on the basis of the performance of individual EGUs. The PDFs serve as functions that describe the relative likelihood for the emission factors and energy efficiencies as random variables to take on a given value by the integral of their own probability distributions, which reflect the fluctuation, variability and uncertainty of the real-world performance of EGUs. To be considered in the data set that was used to develop the PDF, the energy efficiencies had to be both positive and not higher than 45%, 45%, 60% and 45% for boilers, CTs, combined-cycle (CC) plants and ICEs, respectively. The potential outliers among GHG and CAP emission factors for individual EGUs and the corresponding efficiencies were detected using the modified Z-score defined by Equation (2), and EGUs associated with these outliers were removed from the data set before the PDF was developed.
TABLE 8 f
f
LHVHHV
ratios, on an as-received basis, of various fuels
burned by EGUs
f
f
LHVHHV
f
f
LHVHHV
f
f
LHVHHV
f
f
LHVHHV
BIT 0.95332a NG 0.90133a RFO 0.93500b WDS 0.89408c SUB 0.93036a LFG 0.90133a DFO 0.93500b WDL 0.83922d LIG 0.91138a BFG 0.90133a JF 0.93500b MSB 0.89408c SC 0.95332a DG 0.90133a KER 0.93500b BLQ 0.83922d WC 0.95332a OG 0.90133a WO 0.93500b AB 0.83922d PC 0.94242b PUR 0.90133a OBS 0.89408c TDF 0.95332a OTH 0.90133a OBL 0.83922d
a Based on the ultimate analysis of coal properties from EPA (2006). b From GREET1-2011. c Based on the ultimate analysis of biomass properties from EPA (2007b), assuming a moisture
content of 20%. d Based on the ultimate analysis of biomass properties from EPA (2007b), assuming a moisture
content of 45%.
26
Upon detection and exclusion of outliers, a toolbox called EasyFit Professional (developed by Mathwaves) was used to develop a number of PDFs for each of the GHG and CAP emission factors, as well as efficiencies based on multiple commonly used statistical goodness-of-fit criteria (e.g., Kolmogorov Smirnov and Anderson Darling). We used the calculated emission factors of individual EGUs for each fuel/combustion technology as sample data values and used the net electricity generation of each EGU as the corresponding probability density value. Subsequently, the best-fit PDF based on the goodness-of-fit criteria was selected from a gallery of built-in PDFs in EasyFit and in GREET (Subramanyan and Diwekar, 2005). Once developed, the PDFs were used to quantify the uncertainty associated with each GHG and CAP emission factor and efficiency of EGUs.
27
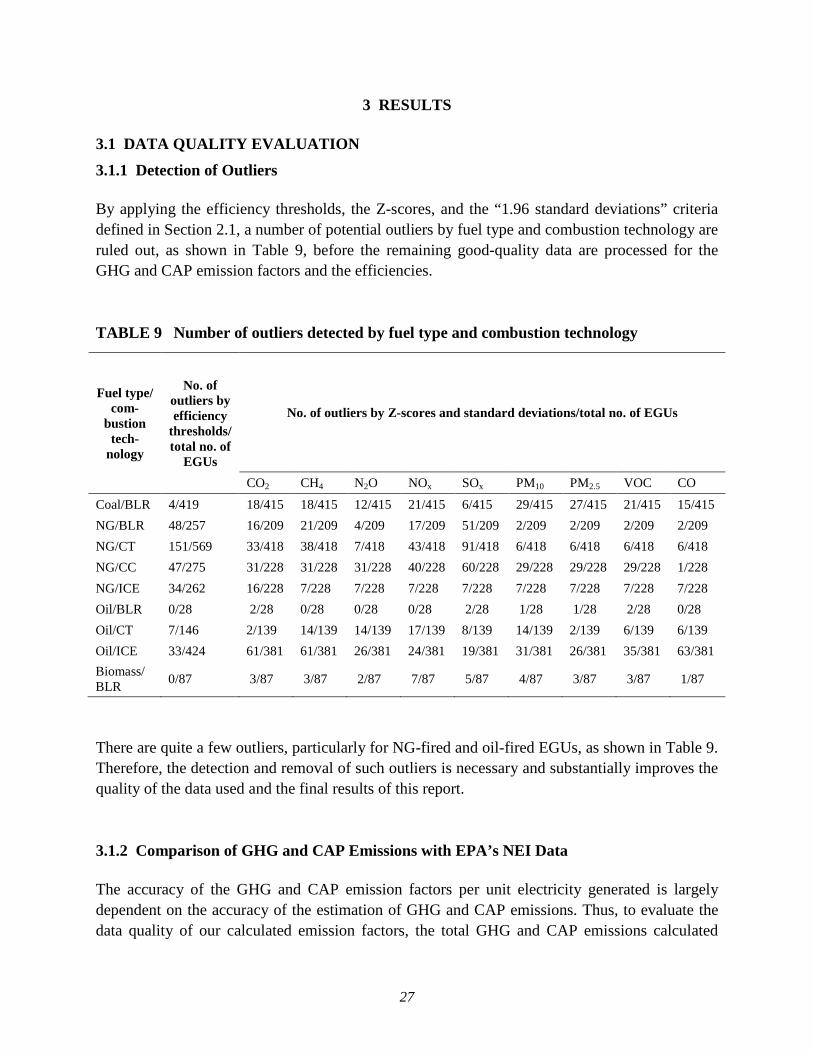
3 RESULTS 3.1 DATA QUALITY EVALUATION 3.1.1 Detection of Outliers By applying the efficiency thresholds, the Z-scores, and the “1.96 standard deviations” criteria defined in Section 2.1, a number of potential outliers by fuel type and combustion technology are ruled out, as shown in Table 9, before the remaining good-quality data are processed for the GHG and CAP emission factors and the efficiencies. TABLE 9 Number of outliers detected by fuel type and combustion technology
Fuel type/ com-
bustion tech-
nology
No. of outliers by efficiency
thresholds/total no. of
EGUs
No. of outliers by Z-scores and standard deviations/total no. of EGUs
CO2 CH4 N2O NOx SOx PM10 PM2.5 VOC CO Coal/BLR 4/419 18/415 18/415 12/415 21/415 6/415 29/415 27/415 21/415 15/415 NG/BLR 48/257 16/209 21/209 4/209 17/209 51/209 2/209 2/209 2/209 2/209 NG/CT 151/569 33/418 38/418 7/418 43/418 91/418 6/418 6/418 6/418 6/418 NG/CC 47/275 31/228 31/228 31/228 40/228 60/228 29/228 29/228 29/228 1/228 NG/ICE 34/262 16/228 7/228 7/228 7/228 7/228 7/228 7/228 7/228 7/228 Oil/BLR 0/28 2/28 0/28 0/28 0/28 2/28 1/28 1/28 2/28 0/28 Oil/CT 7/146 2/139 14/139 14/139 17/139 8/139 14/139 2/139 6/139 6/139 Oil/ICE 33/424 61/381 61/381 26/381 24/381 19/381 31/381 26/381 35/381 63/381 Biomass/ BLR 0/87 3/87 3/87 2/87 7/87 5/87 4/87 3/87 3/87 1/87
There are quite a few outliers, particularly for NG-fired and oil-fired EGUs, as shown in Table 9. Therefore, the detection and removal of such outliers is necessary and substantially improves the quality of the data used and the final results of this report. 3.1.2 Comparison of GHG and CAP Emissions with EPA’s NEI Data The accuracy of the GHG and CAP emission factors per unit electricity generated is largely dependent on the accuracy of the estimation of GHG and CAP emissions. Thus, to evaluate the data quality of our calculated emission factors, the total GHG and CAP emissions calculated
28
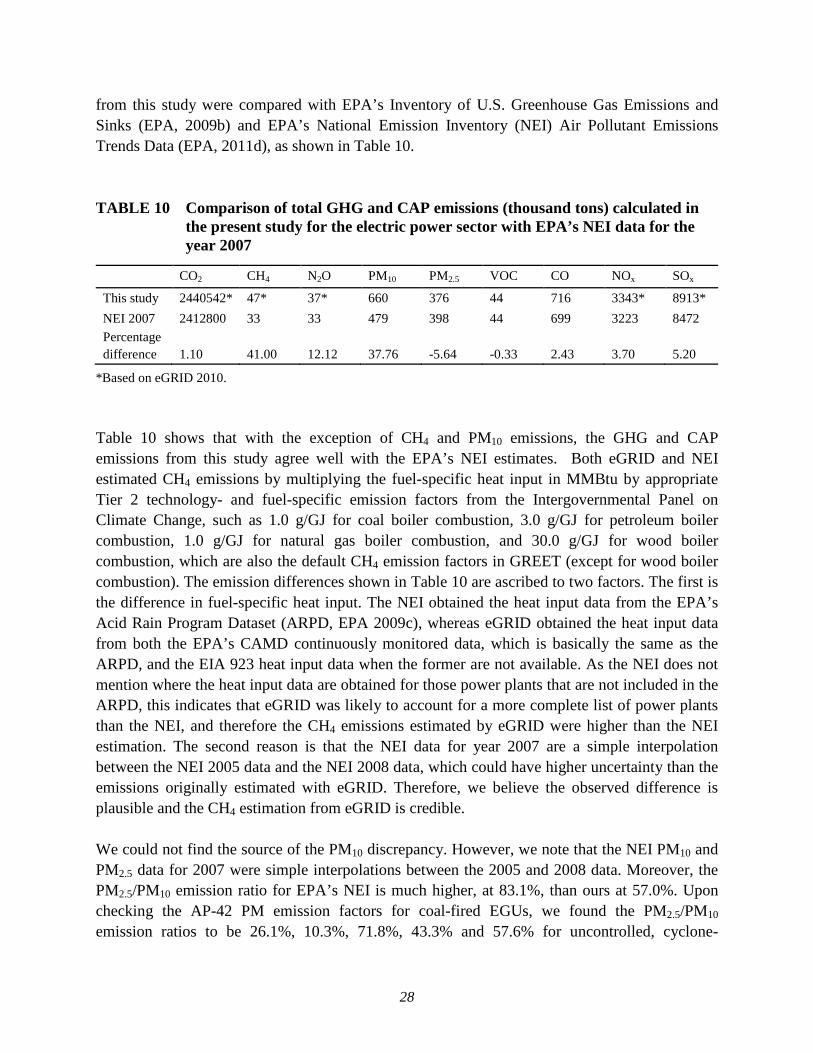
from this study were compared with EPA’s Inventory of U.S. Greenhouse Gas Emissions and Sinks (EPA, 2009b) and EPA’s National Emission Inventory (NEI) Air Pollutant Emissions Trends Data (EPA, 2011d), as shown in Table 10. TABLE 10 Comparison of total GHG and CAP emissions (thousand tons) calculated in
the present study for the electric power sector with EPA’s NEI data for the year 2007
CO2 CH4 N2O PM10 PM2.5 VOC CO NOx SOx
This study 2440542* 47* 37* 660 376 44 716 3343* 8913* NEI 2007 2412800 33 33 479 398 44 699 3223 8472 Percentage difference 1.10 41.00 12.12 37.76 -5.64 -0.33 2.43 3.70 5.20
*Based on eGRID 2010. Table 10 shows that with the exception of CH4 and PM10 emissions, the GHG and CAP emissions from this study agree well with the EPA’s NEI estimates. Both eGRID and NEI estimated CH4 emissions by multiplying the fuel-specific heat input in MMBtu by appropriate Tier 2 technology- and fuel-specific emission factors from the Intergovernmental Panel on Climate Change, such as 1.0 g/GJ for coal boiler combustion, 3.0 g/GJ for petroleum boiler combustion, 1.0 g/GJ for natural gas boiler combustion, and 30.0 g/GJ for wood boiler combustion, which are also the default CH4 emission factors in GREET (except for wood boiler combustion). The emission differences shown in Table 10 are ascribed to two factors. The first is the difference in fuel-specific heat input. The NEI obtained the heat input data from the EPA’s Acid Rain Program Dataset (ARPD, EPA 2009c), whereas eGRID obtained the heat input data from both the EPA’s CAMD continuously monitored data, which is basically the same as the ARPD, and the EIA 923 heat input data when the former are not available. As the NEI does not mention where the heat input data are obtained for those power plants that are not included in the ARPD, this indicates that eGRID was likely to account for a more complete list of power plants than the NEI, and therefore the CH4 emissions estimated by eGRID were higher than the NEI estimation. The second reason is that the NEI data for year 2007 are a simple interpolation between the NEI 2005 data and the NEI 2008 data, which could have higher uncertainty than the emissions originally estimated with eGRID. Therefore, we believe the observed difference is plausible and the CH4 estimation from eGRID is credible. We could not find the source of the PM10 discrepancy. However, we note that the NEI PM10 and PM2.5 data for 2007 were simple interpolations between the 2005 and 2008 data. Moreover, the PM2.5/PM10 emission ratio for EPA’s NEI is much higher, at 83.1%, than ours at 57.0%. Upon checking the AP-42 PM emission factors for coal-fired EGUs, we found the PM2.5/PM10 emission ratios to be 26.1%, 10.3%, 71.8%, 43.3% and 57.6% for uncontrolled, cyclone-
29
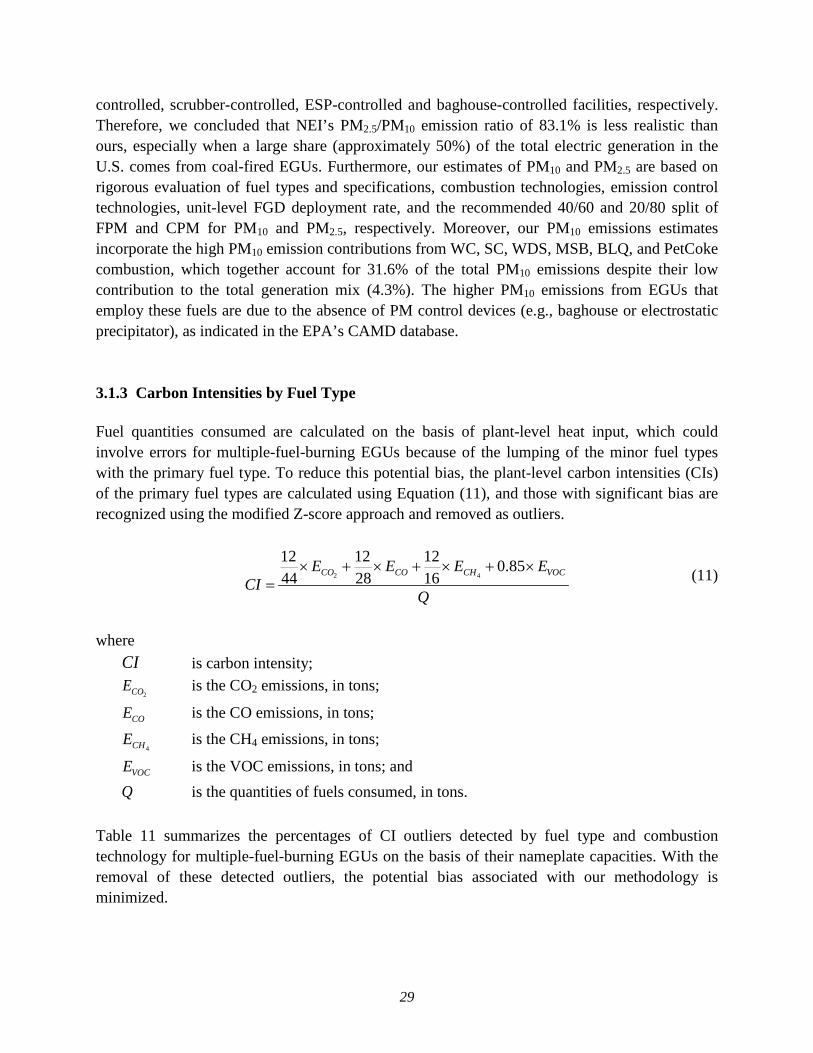
controlled, scrubber-controlled, ESP-controlled and baghouse-controlled facilities, respectively. Therefore, we concluded that NEI’s PM2.5/PM10 emission ratio of 83.1% is less realistic than ours, especially when a large share (approximately 50%) of the total electric generation in the U.S. comes from coal-fired EGUs. Furthermore, our estimates of PM10 and PM2.5 are based on rigorous evaluation of fuel types and specifications, combustion technologies, emission control technologies, unit-level FGD deployment rate, and the recommended 40/60 and 20/80 split of FPM and CPM for PM10 and PM2.5, respectively. Moreover, our PM10 emissions estimates incorporate the high PM10 emission contributions from WC, SC, WDS, MSB, BLQ, and PetCoke combustion, which together account for 31.6% of the total PM10 emissions despite their low contribution to the total generation mix (4.3%). The higher PM10 emissions from EGUs that employ these fuels are due to the absence of PM control devices (e.g., baghouse or electrostatic precipitator), as indicated in the EPA’s CAMD database. 3.1.3 Carbon Intensities by Fuel Type Fuel quantities consumed are calculated on the basis of plant-level heat input, which could involve errors for multiple-fuel-burning EGUs because of the lumping of the minor fuel types with the primary fuel type. To reduce this potential bias, the plant-level carbon intensities (CIs) of the primary fuel types are calculated using Equation (11), and those with significant bias are recognized using the modified Z-score approach and removed as outliers.
2 4
12 12 12 0.8544 28 16CO CO CH VOCE E E E
CIQ
× + × + × + ×=
(11)
where
CI is carbon intensity;
2COE is the CO2 emissions, in tons;
COE is the CO emissions, in tons;
4CHE is the CH4 emissions, in tons;
VOCE is the VOC emissions, in tons; and Q is the quantities of fuels consumed, in tons.
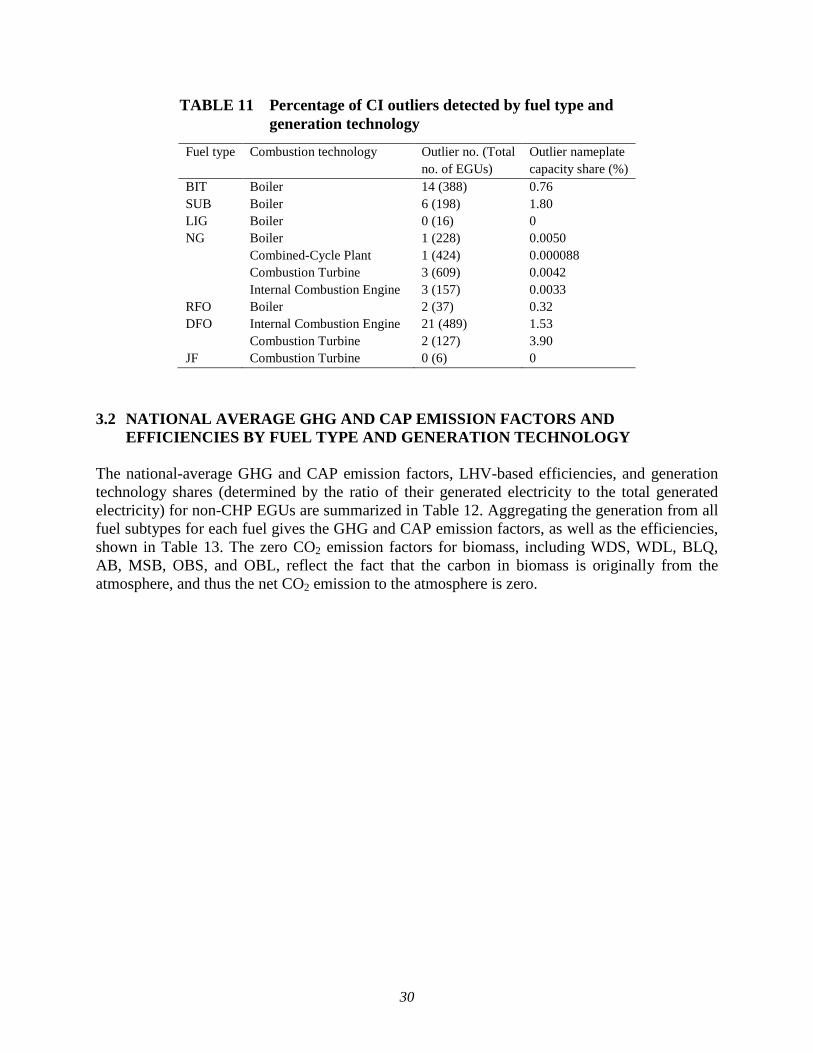
Table 11 summarizes the percentages of CI outliers detected by fuel type and combustion technology for multiple-fuel-burning EGUs on the basis of their nameplate capacities. With the removal of these detected outliers, the potential bias associated with our methodology is minimized.
30
TABLE 11 Percentage of CI outliers detected by fuel type and generation technology
Fuel type Combustion technology Outlier no. (Total no. of EGUs)
Outlier nameplate capacity share (%)
BIT Boiler 14 (388) 0.76 SUB Boiler 6 (198) 1.80 LIG Boiler 0 (16) 0 NG Boiler 1 (228) 0.0050 Combined-Cycle Plant 1 (424) 0.000088 Combustion Turbine 3 (609) 0.0042 Internal Combustion Engine 3 (157) 0.0033 RFO Boiler 2 (37) 0.32 DFO Internal Combustion Engine 21 (489) 1.53 Combustion Turbine 2 (127) 3.90 JF Combustion Turbine 0 (6) 0
3.2 NATIONAL AVERAGE GHG AND CAP EMISSION FACTORS AND
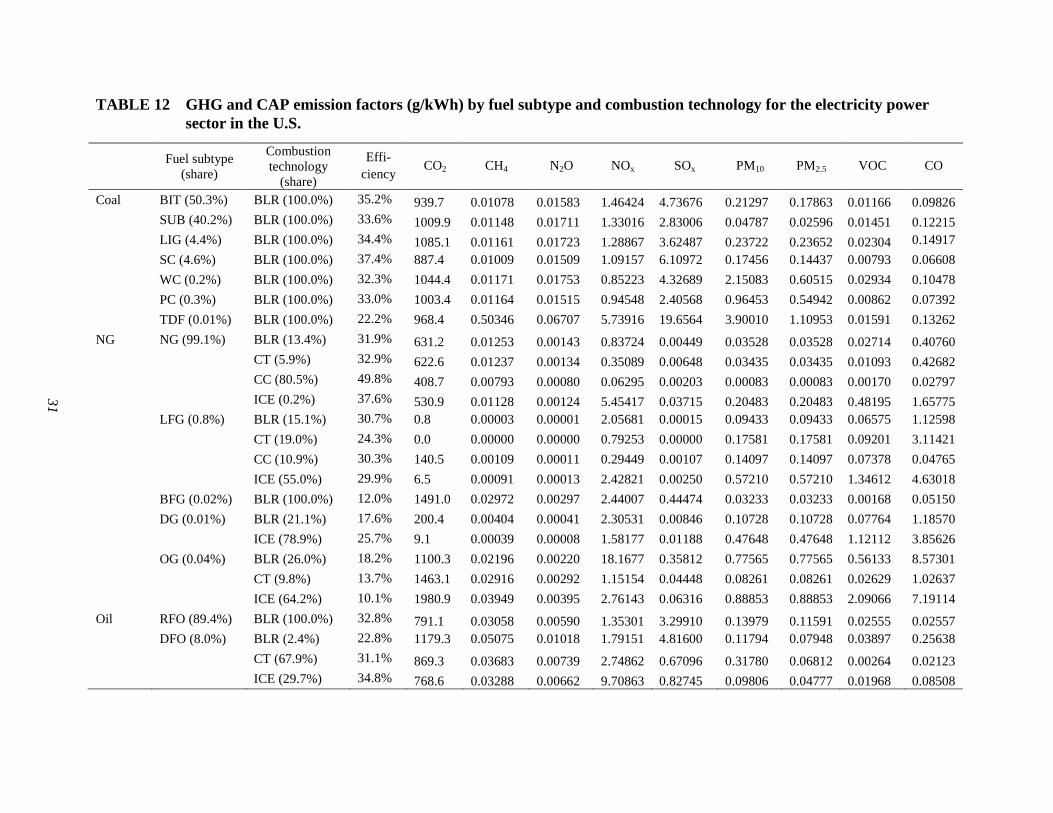
EFFICIENCIES BY FUEL TYPE AND GENERATION TECHNOLOGY The national-average GHG and CAP emission factors, LHV-based efficiencies, and generation technology shares (determined by the ratio of their generated electricity to the total generated electricity) for non-CHP EGUs are summarized in Table 12. Aggregating the generation from all fuel subtypes for each fuel gives the GHG and CAP emission factors, as well as the efficiencies, shown in Table 13. The zero CO2 emission factors for biomass, including WDS, WDL, BLQ, AB, MSB, OBS, and OBL, reflect the fact that the carbon in biomass is originally from the atmosphere, and thus the net CO2 emission to the atmosphere is zero.
31
TABLE 12 GHG and CAP emission factors (g/kWh) by fuel subtype and combustion technology for the electricity power sector in the U.S.
Fuel subtype
(share)
Combustion technology
(share)
Effi-ciency CO2 CH4 N2O NOx SOx PM10 PM2.5 VOC CO
Coal BIT (50.3%) BLR (100.0%) 35.2% 939.7 0.01078 0.01583 1.46424 4.73676 0.21297 0.17863 0.01166 0.09826
SUB (40.2%) BLR (100.0%) 33.6% 1009.9 0.01148 0.01711 1.33016 2.83006 0.04787 0.02596 0.01451 0.12215
LIG (4.4%) BLR (100.0%) 34.4% 1085.1 0.01161 0.01723 1.28867 3.62487 0.23722 0.23652 0.02304 0.14917
SC (4.6%) BLR (100.0%) 37.4% 887.4 0.01009 0.01509 1.09157 6.10972 0.17456 0.14437 0.00793 0.06608
WC (0.2%) BLR (100.0%) 32.3% 1044.4 0.01171 0.01753 0.85223 4.32689 2.15083 0.60515 0.02934 0.10478
PC (0.3%) BLR (100.0%) 33.0% 1003.4 0.01164 0.01515 0.94548 2.40568 0.96453 0.54942 0.00862 0.07392
TDF (0.01%) BLR (100.0%) 22.2% 968.4 0.50346 0.06707 5.73916 19.6564 3.90010 1.10953 0.01591 0.13262 NG NG (99.1%) BLR (13.4%) 31.9% 631.2 0.01253 0.00143 0.83724 0.00449 0.03528 0.03528 0.02714 0.40760
CT (5.9%) 32.9% 622.6 0.01237 0.00134 0.35089 0.00648 0.03435 0.03435 0.01093 0.42682
CC (80.5%) 49.8% 408.7 0.00793 0.00080 0.06295 0.00203 0.00083 0.00083 0.00170 0.02797
ICE (0.2%) 37.6% 530.9 0.01128 0.00124 5.45417 0.03715 0.20483 0.20483 0.48195 1.65775
LFG (0.8%) BLR (15.1%) 30.7% 0.8 0.00003 0.00001 2.05681 0.00015 0.09433 0.09433 0.06575 1.12598
CT (19.0%) 24.3% 0.0 0.00000 0.00000 0.79253 0.00000 0.17581 0.17581 0.09201 3.11421
CC (10.9%) 30.3% 140.5 0.00109 0.00011 0.29449 0.00107 0.14097 0.14097 0.07378 0.04765
ICE (55.0%) 29.9% 6.5 0.00091 0.00013 2.42821 0.00250 0.57210 0.57210 1.34612 4.63018
BFG (0.02%) BLR (100.0%) 12.0% 1491.0 0.02972 0.00297 2.44007 0.44474 0.03233 0.03233 0.00168 0.05150
DG (0.01%) BLR (21.1%) 17.6% 200.4 0.00404 0.00041 2.30531 0.00846 0.10728 0.10728 0.07764 1.18570
ICE (78.9%) 25.7% 9.1 0.00039 0.00008 1.58177 0.01188 0.47648 0.47648 1.12112 3.85626
OG (0.04%) BLR (26.0%) 18.2% 1100.3 0.02196 0.00220 18.1677 0.35812 0.77565 0.77565 0.56133 8.57301
CT (9.8%) 13.7% 1463.1 0.02916 0.00292 1.15154 0.04448 0.08261 0.08261 0.02629 1.02637
ICE (64.2%) 10.1% 1980.9 0.03949 0.00395 2.76143 0.06316 0.88853 0.88853 2.09066 7.19114 Oil RFO (89.4%) BLR (100.0%) 32.8% 791.1 0.03058 0.00590 1.35301 3.29910 0.13979 0.11591 0.02555 0.02557
DFO (8.0%) BLR (2.4%) 22.8% 1179.3 0.05075 0.01018 1.79151 4.81600 0.11794 0.07948 0.03897 0.25638
CT (67.9%) 31.1% 869.3 0.03683 0.00739 2.74862 0.67096 0.31780 0.06812 0.00264 0.02123
ICE (29.7%) 34.8% 768.6 0.03288 0.00662 9.70863 0.82745 0.09806 0.04777 0.01968 0.08508
32
TABLE 12 (Cont.)
Fuel subtype (share)
Combustion technology (share)
Effi-ciency CO2 CH4 N2O NOx SOx PM10 PM2.5 VOC CO
JF (2.4%) CT (100.0%) 37.9% 704.8 0.03047 0.00611 1.33929 1.24463 0.26848 0.06461 0.00011 0.01441
WO (0.01%) ICE (100.0%) 41.5% 653.2 0.27500 0.03666 5.39524 0.28884 0.00340 0.00275 0.00052 0.00339
KER (0.2%) CT (100.0%) 25.4% 1051.6 0.04549 0.00912 1.64269 0.46794 0.40203 0.40203 0.02607 0.02151 Biomass WDS (37.6%) BLR (100.0%) 22.5% 0.0 0.51546 0.06932 1.74266 0.18924 2.51730 2.34353 0.12970 4.57770
MSB (59.0%) BLR (100.0%) 20.9% 0.0 0.57671 0.07684 7.04769 19.7043 3.12365 2.21224 0.14085 4.97133
BLQ (2.1%) BLR (100.0%) 8.5% 0.0 0.38503 0.10657 3.62878 8.93050 1.22254 0.30564 0.05557 0.35805
AB (0.7%) BLR (100.0%) 30.6% 0.0 0.42090 0.05608 0.60302 0.04020 2.27335 1.61004 0.10251 3.61807
OBS (0.6%) BLR (100.0%) 15.3% 0.0 0.79178 0.10549 1.86746 1.29146 4.27651 3.02872 0.19284 6.80612
OBL (0.02%) BLR (100.0%) 37.7% 0.0 0.03419 0.00686 6.63204 0.05393 1.84659 1.30780 0.08327 2.93887
Note: BLR, CT, CC and ICE represent boilers, combustion turbines, combined-cycle plants and internal combustion engines, respectively.
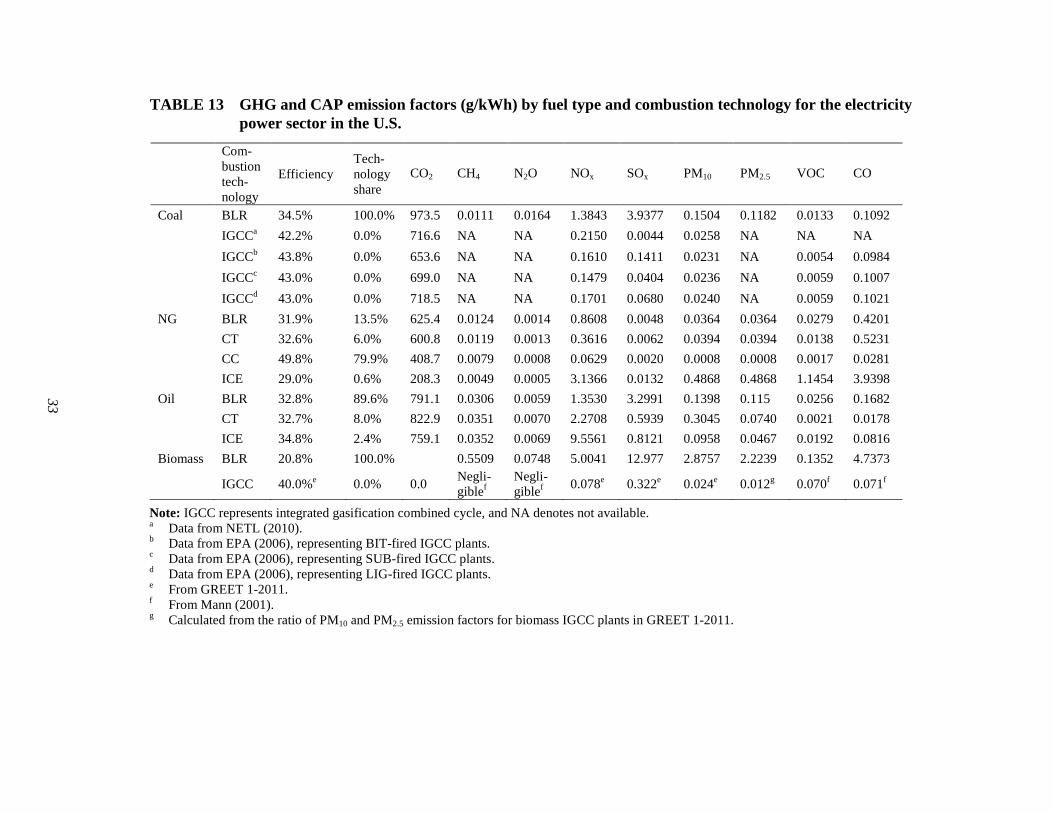
33
TABLE 13 GHG and CAP emission factors (g/kWh) by fuel type and combustion technology for the electricity power sector in the U.S.
Com-bustion tech-nology
Efficiency Tech-nology share
CO2 CH4 N2O NOx SOx PM10 PM2.5 VOC CO
Coal BLR 34.5% 100.0% 973.5 0.0111 0.0164 1.3843 3.9377 0.1504 0.1182 0.0133 0.1092
IGCCa 42.2% 0.0% 716.6 NA NA 0.2150 0.0044 0.0258 NA NA NA
IGCCb 43.8% 0.0% 653.6 NA NA 0.1610 0.1411 0.0231 NA 0.0054 0.0984
IGCCc 43.0% 0.0% 699.0 NA NA 0.1479 0.0404 0.0236 NA 0.0059 0.1007
IGCCd 43.0% 0.0% 718.5 NA NA 0.1701 0.0680 0.0240 NA 0.0059 0.1021 NG BLR 31.9% 13.5% 625.4 0.0124 0.0014 0.8608 0.0048 0.0364 0.0364 0.0279 0.4201
CT 32.6% 6.0% 600.8 0.0119 0.0013 0.3616 0.0062 0.0394 0.0394 0.0138 0.5231
CC 49.8% 79.9% 408.7 0.0079 0.0008 0.0629 0.0020 0.0008 0.0008 0.0017 0.0281
ICE 29.0% 0.6% 208.3 0.0049 0.0005 3.1366 0.0132 0.4868 0.4868 1.1454 3.9398 Oil BLR 32.8% 89.6% 791.1 0.0306 0.0059 1.3530 3.2991 0.1398 0.115 0.0256 0.1682
CT 32.7% 8.0% 822.9 0.0351 0.0070 2.2708 0.5939 0.3045 0.0740 0.0021 0.0178
ICE 34.8% 2.4% 759.1 0.0352 0.0069 9.5561 0.8121 0.0958 0.0467 0.0192 0.0816 Biomass BLR 20.8% 100.0% 0.5509 0.0748 5.0041 12.977 2.8757 2.2239 0.1352 4.7373
IGCC 40.0%e 0.0% 0.0 Negli-giblef
Negli-giblef 0.078e 0.322e 0.024e 0.012g 0.070f 0.071f
Note: IGCC represents integrated gasification combined cycle, and NA denotes not available. a Data from NETL (2010). b Data from EPA (2006), representing BIT-fired IGCC plants. c Data from EPA (2006), representing SUB-fired IGCC plants. d Data from EPA (2006), representing LIG-fired IGCC plants. e From GREET 1-2011. f From Mann (2001). g Calculated from the ratio of PM10 and PM2.5 emission factors for biomass IGCC plants in GREET 1-2011.
34
It needs to be mentioned that the CO2 emission factors calculated from the methodology described in Section 2.1 are not used by GREET, which actually uses an alternative approach based on the carbon content of fuels, assuming a 100% carbon oxidation rate (Wang, 1999). In comparison with the CO2 emission factor (973.5 g/kWh) for coal-fired power plants calculated from eGRID2010, the CO2 emission factor (1084 g/kWh) calculated by the previous version of GREET is about 11.4% higher, which indicates that the previous coal property parameters, particularly the carbon and heat content of various subtypes of coal in GREET, might be inaccurate for recent years. So we also made an effort to update the coal property parameters in this study: we used EIA’s unit-level fuel quality data (EIA-423) to update the HHVs of various subtypes of coal, including BIT, SUB, LIG, SC, WC, PC, and TDF, and we used USGS’s Coal Quality database (USGS, 2006) to update the carbon contents of the three major subtypes of coal (BIT, SUB and LIG) on a state coal production weighted-average basis, taking into account the interstate variation in coal properties, and to convert the EIA-based HHVs to LHVs based on the LHV/HHV ratios by coal subtype, also calculated on the basis of the USGS database. With the updated coal property parameters, GREET calculates a new CO2 emission factor of 989 g/kWh for coal-fired power plants, which is an 8.8% reduction compared to the previous CO2 emission factor. Consequently, this new CO2 emission factor is much more consistent with the flue gas measurement-based number (973.5 g/kWh) from eGRID. 3.3 REGIONAL GHG AND CAP EMISSION FACTORS AND EFFICIENCIES BY
FUEL TYPE AND GENERATION TECHNOLOGY GHG and CAP emission factors, efficiencies, and combustion technology shares in the ten North American Electric Reliability Council (NERC) regions shown in Figure 1 are summarized in Table 14. These estimates facilitate life cycle analysis of the GHG and CAP emissions of various vehicle/fuel systems at the regional level.
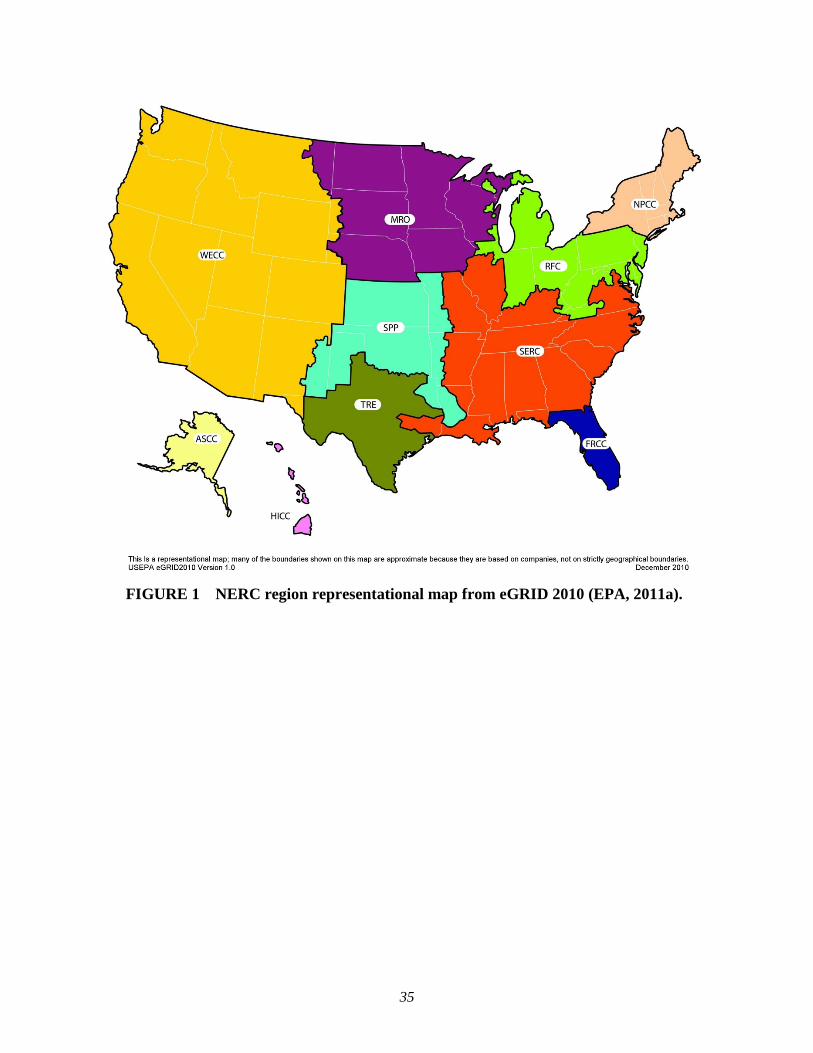
35
FIGURE 1 NERC region representational map from eGRID 2010 (EPA, 2011a).
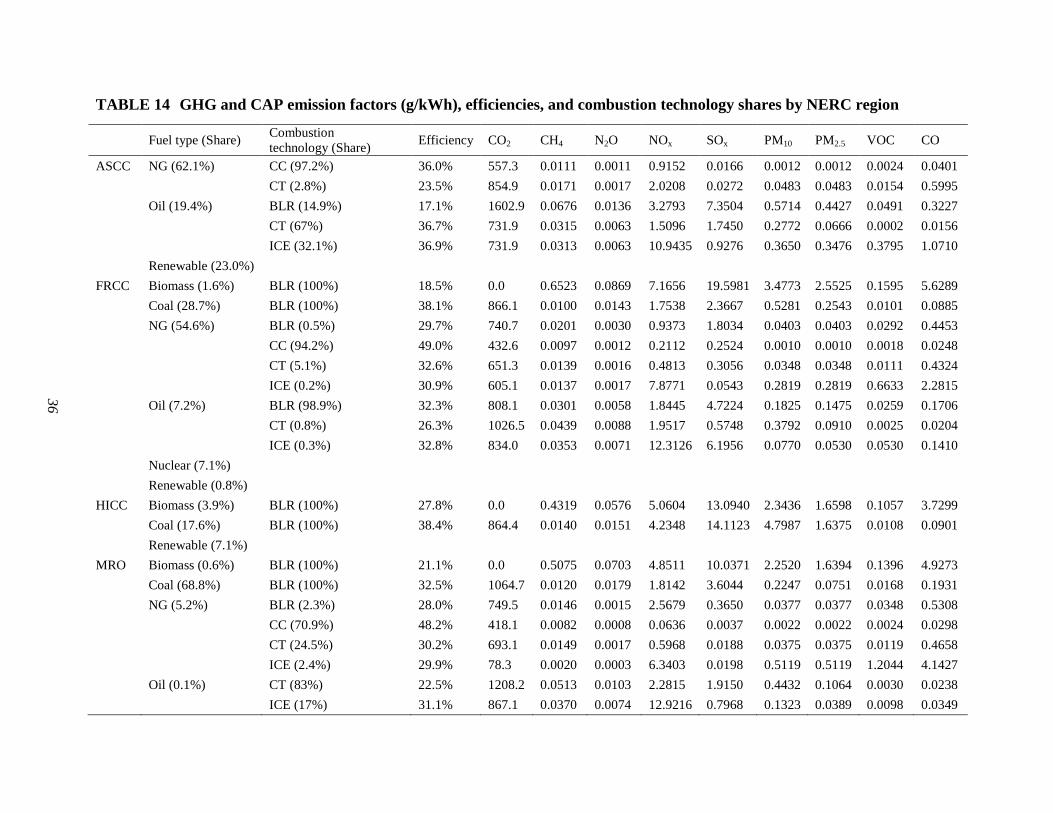
36
TABLE 14 GHG and CAP emission factors (g/kWh), efficiencies, and combustion technology shares by NERC region
Fuel type (Share) Combustion technology (Share) Efficiency CO2 CH4 N2O NOx SOx PM10 PM2.5 VOC CO
ASCC NG (62.1%) CC (97.2%) 36.0% 557.3 0.0111 0.0011 0.9152 0.0166 0.0012 0.0012 0.0024 0.0401
CT (2.8%) 23.5% 854.9 0.0171 0.0017 2.0208 0.0272 0.0483 0.0483 0.0154 0.5995
Oil (19.4%) BLR (14.9%) 17.1% 1602.9 0.0676 0.0136 3.2793 7.3504 0.5714 0.4427 0.0491 0.3227
CT (67%) 36.7% 731.9 0.0315 0.0063 1.5096 1.7450 0.2772 0.0666 0.0002 0.0156
ICE (32.1%) 36.9% 731.9 0.0313 0.0063 10.9435 0.9276 0.3650 0.3476 0.3795 1.0710 Renewable (23.0%) FRCC Biomass (1.6%) BLR (100%) 18.5% 0.0 0.6523 0.0869 7.1656 19.5981 3.4773 2.5525 0.1595 5.6289
Coal (28.7%) BLR (100%) 38.1% 866.1 0.0100 0.0143 1.7538 2.3667 0.5281 0.2543 0.0101 0.0885
NG (54.6%) BLR (0.5%) 29.7% 740.7 0.0201 0.0030 0.9373 1.8034 0.0403 0.0403 0.0292 0.4453
CC (94.2%) 49.0% 432.6 0.0097 0.0012 0.2112 0.2524 0.0010 0.0010 0.0018 0.0248
CT (5.1%) 32.6% 651.3 0.0139 0.0016 0.4813 0.3056 0.0348 0.0348 0.0111 0.4324
ICE (0.2%) 30.9% 605.1 0.0137 0.0017 7.8771 0.0543 0.2819 0.2819 0.6633 2.2815
Oil (7.2%) BLR (98.9%) 32.3% 808.1 0.0301 0.0058 1.8445 4.7224 0.1825 0.1475 0.0259 0.1706
CT (0.8%) 26.3% 1026.5 0.0439 0.0088 1.9517 0.5748 0.3792 0.0910 0.0025 0.0204
ICE (0.3%) 32.8% 834.0 0.0353 0.0071 12.3126 6.1956 0.0770 0.0530 0.0530 0.1410 Nuclear (7.1%) Renewable (0.8%) HICC Biomass (3.9%) BLR (100%) 27.8% 0.0 0.4319 0.0576 5.0604 13.0940 2.3436 1.6598 0.1057 3.7299
Coal (17.6%) BLR (100%) 38.4% 864.4 0.0140 0.0151 4.2348 14.1123 4.7987 1.6375 0.0108 0.0901
Renewable (7.1%) MRO Biomass (0.6%) BLR (100%) 21.1% 0.0 0.5075 0.0703 4.8511 10.0371 2.2520 1.6394 0.1396 4.9273
Coal (68.8%) BLR (100%) 32.5% 1064.7 0.0120 0.0179 1.8142 3.6044 0.2247 0.0751 0.0168 0.1931
NG (5.2%) BLR (2.3%) 28.0% 749.5 0.0146 0.0015 2.5679 0.3650 0.0377 0.0377 0.0348 0.5308
CC (70.9%) 48.2% 418.1 0.0082 0.0008 0.0636 0.0037 0.0022 0.0022 0.0024 0.0298
CT (24.5%) 30.2% 693.1 0.0149 0.0017 0.5968 0.0188 0.0375 0.0375 0.0119 0.4658
ICE (2.4%) 29.9% 78.3 0.0020 0.0003 6.3403 0.0198 0.5119 0.5119 1.2044 4.1427
Oil (0.1%) CT (83%) 22.5% 1208.2 0.0513 0.0103 2.2815 1.9150 0.4432 0.1064 0.0030 0.0238
ICE (17%) 31.1% 867.1 0.0370 0.0074 12.9216 0.7968 0.1323 0.0389 0.0098 0.0349
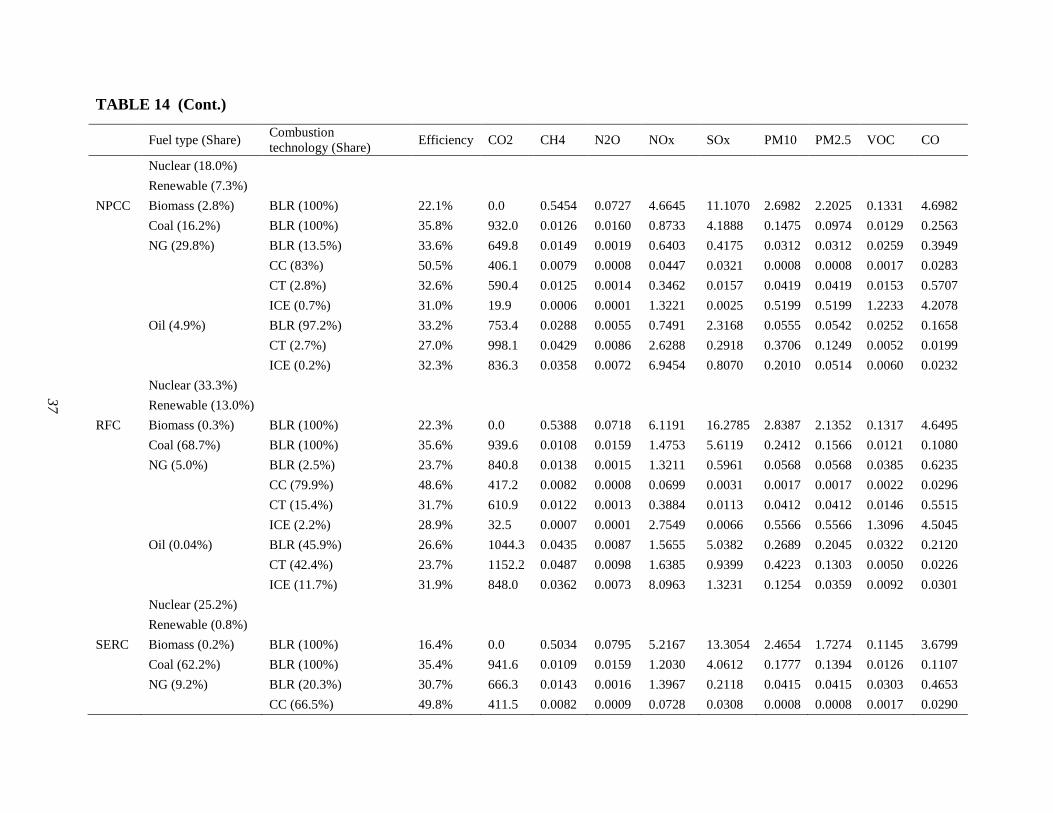
37
TABLE 14 (Cont.)
Fuel type (Share) Combustion technology (Share) Efficiency CO2 CH4 N2O NOx SOx PM10 PM2.5 VOC CO
Nuclear (18.0%) Renewable (7.3%) NPCC Biomass (2.8%) BLR (100%) 22.1% 0.0 0.5454 0.0727 4.6645 11.1070 2.6982 2.2025 0.1331 4.6982
Coal (16.2%) BLR (100%) 35.8% 932.0 0.0126 0.0160 0.8733 4.1888 0.1475 0.0974 0.0129 0.2563
NG (29.8%) BLR (13.5%) 33.6% 649.8 0.0149 0.0019 0.6403 0.4175 0.0312 0.0312 0.0259 0.3949
CC (83%) 50.5% 406.1 0.0079 0.0008 0.0447 0.0321 0.0008 0.0008 0.0017 0.0283
CT (2.8%) 32.6% 590.4 0.0125 0.0014 0.3462 0.0157 0.0419 0.0419 0.0153 0.5707
ICE (0.7%) 31.0% 19.9 0.0006 0.0001 1.3221 0.0025 0.5199 0.5199 1.2233 4.2078
Oil (4.9%) BLR (97.2%) 33.2% 753.4 0.0288 0.0055 0.7491 2.3168 0.0555 0.0542 0.0252 0.1658
CT (2.7%) 27.0% 998.1 0.0429 0.0086 2.6288 0.2918 0.3706 0.1249 0.0052 0.0199
ICE (0.2%) 32.3% 836.3 0.0358 0.0072 6.9454 0.8070 0.2010 0.0514 0.0060 0.0232 Nuclear (33.3%) Renewable (13.0%) RFC Biomass (0.3%) BLR (100%) 22.3% 0.0 0.5388 0.0718 6.1191 16.2785 2.8387 2.1352 0.1317 4.6495
Coal (68.7%) BLR (100%) 35.6% 939.6 0.0108 0.0159 1.4753 5.6119 0.2412 0.1566 0.0121 0.1080
NG (5.0%) BLR (2.5%) 23.7% 840.8 0.0138 0.0015 1.3211 0.5961 0.0568 0.0568 0.0385 0.6235
CC (79.9%) 48.6% 417.2 0.0082 0.0008 0.0699 0.0031 0.0017 0.0017 0.0022 0.0296
CT (15.4%) 31.7% 610.9 0.0122 0.0013 0.3884 0.0113 0.0412 0.0412 0.0146 0.5515
ICE (2.2%) 28.9% 32.5 0.0007 0.0001 2.7549 0.0066 0.5566 0.5566 1.3096 4.5045
Oil (0.04%) BLR (45.9%) 26.6% 1044.3 0.0435 0.0087 1.5655 5.0382 0.2689 0.2045 0.0322 0.2120
CT (42.4%) 23.7% 1152.2 0.0487 0.0098 1.6385 0.9399 0.4223 0.1303 0.0050 0.0226
ICE (11.7%) 31.9% 848.0 0.0362 0.0073 8.0963 1.3231 0.1254 0.0359 0.0092 0.0301 Nuclear (25.2%) Renewable (0.8%) SERC Biomass (0.2%) BLR (100%) 16.4% 0.0 0.5034 0.0795 5.2167 13.3054 2.4654 1.7274 0.1145 3.6799
Coal (62.2%) BLR (100%) 35.4% 941.6 0.0109 0.0159 1.2030 4.0612 0.1777 0.1394 0.0126 0.1107
NG (9.2%) BLR (20.3%) 30.7% 666.3 0.0143 0.0016 1.3967 0.2118 0.0415 0.0415 0.0303 0.4653
CC (66.5%) 49.8% 411.5 0.0082 0.0009 0.0728 0.0308 0.0008 0.0008 0.0017 0.0290
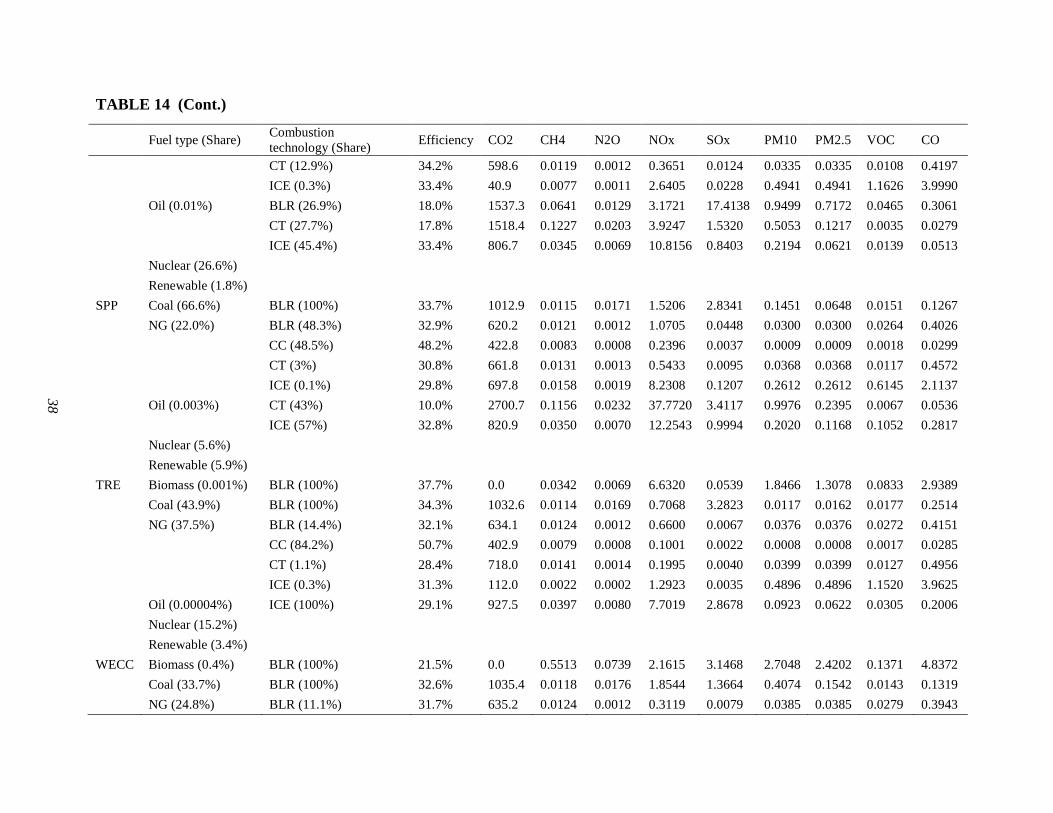
38
TABLE 14 (Cont.)
Fuel type (Share) Combustion technology (Share) Efficiency CO2 CH4 N2O NOx SOx PM10 PM2.5 VOC CO
CT (12.9%) 34.2% 598.6 0.0119 0.0012 0.3651 0.0124 0.0335 0.0335 0.0108 0.4197 ICE (0.3%) 33.4% 40.9 0.0077 0.0011 2.6405 0.0228 0.4941 0.4941 1.1626 3.9990 Oil (0.01%) BLR (26.9%) 18.0% 1537.3 0.0641 0.0129 3.1721 17.4138 0.9499 0.7172 0.0465 0.3061 CT (27.7%) 17.8% 1518.4 0.1227 0.0203 3.9247 1.5320 0.5053 0.1217 0.0035 0.0279 ICE (45.4%) 33.4% 806.7 0.0345 0.0069 10.8156 0.8403 0.2194 0.0621 0.0139 0.0513 Nuclear (26.6%) Renewable (1.8%) SPP Coal (66.6%) BLR (100%) 33.7% 1012.9 0.0115 0.0171 1.5206 2.8341 0.1451 0.0648 0.0151 0.1267 NG (22.0%) BLR (48.3%) 32.9% 620.2 0.0121 0.0012 1.0705 0.0448 0.0300 0.0300 0.0264 0.4026 CC (48.5%) 48.2% 422.8 0.0083 0.0008 0.2396 0.0037 0.0009 0.0009 0.0018 0.0299 CT (3%) 30.8% 661.8 0.0131 0.0013 0.5433 0.0095 0.0368 0.0368 0.0117 0.4572 ICE (0.1%) 29.8% 697.8 0.0158 0.0019 8.2308 0.1207 0.2612 0.2612 0.6145 2.1137 Oil (0.003%) CT (43%) 10.0% 2700.7 0.1156 0.0232 37.7720 3.4117 0.9976 0.2395 0.0067 0.0536 ICE (57%) 32.8% 820.9 0.0350 0.0070 12.2543 0.9994 0.2020 0.1168 0.1052 0.2817 Nuclear (5.6%) Renewable (5.9%) TRE Biomass (0.001%) BLR (100%) 37.7% 0.0 0.0342 0.0069 6.6320 0.0539 1.8466 1.3078 0.0833 2.9389 Coal (43.9%) BLR (100%) 34.3% 1032.6 0.0114 0.0169 0.7068 3.2823 0.0117 0.0162 0.0177 0.2514 NG (37.5%) BLR (14.4%) 32.1% 634.1 0.0124 0.0012 0.6600 0.0067 0.0376 0.0376 0.0272 0.4151 CC (84.2%) 50.7% 402.9 0.0079 0.0008 0.1001 0.0022 0.0008 0.0008 0.0017 0.0285 CT (1.1%) 28.4% 718.0 0.0141 0.0014 0.1995 0.0040 0.0399 0.0399 0.0127 0.4956 ICE (0.3%) 31.3% 112.0 0.0022 0.0002 1.2923 0.0035 0.4896 0.4896 1.1520 3.9625 Oil (0.00004%) ICE (100%) 29.1% 927.5 0.0397 0.0080 7.7019 2.8678 0.0923 0.0622 0.0305 0.2006 Nuclear (15.2%) Renewable (3.4%) WECC Biomass (0.4%) BLR (100%) 21.5% 0.0 0.5513 0.0739 2.1615 3.1468 2.7048 2.4202 0.1371 4.8372 Coal (33.7%) BLR (100%) 32.6% 1035.4 0.0118 0.0176 1.8544 1.3664 0.4074 0.1542 0.0143 0.1319 NG (24.8%) BLR (11.1%) 31.7% 635.2 0.0124 0.0012 0.3119 0.0079 0.0385 0.0385 0.0279 0.3943
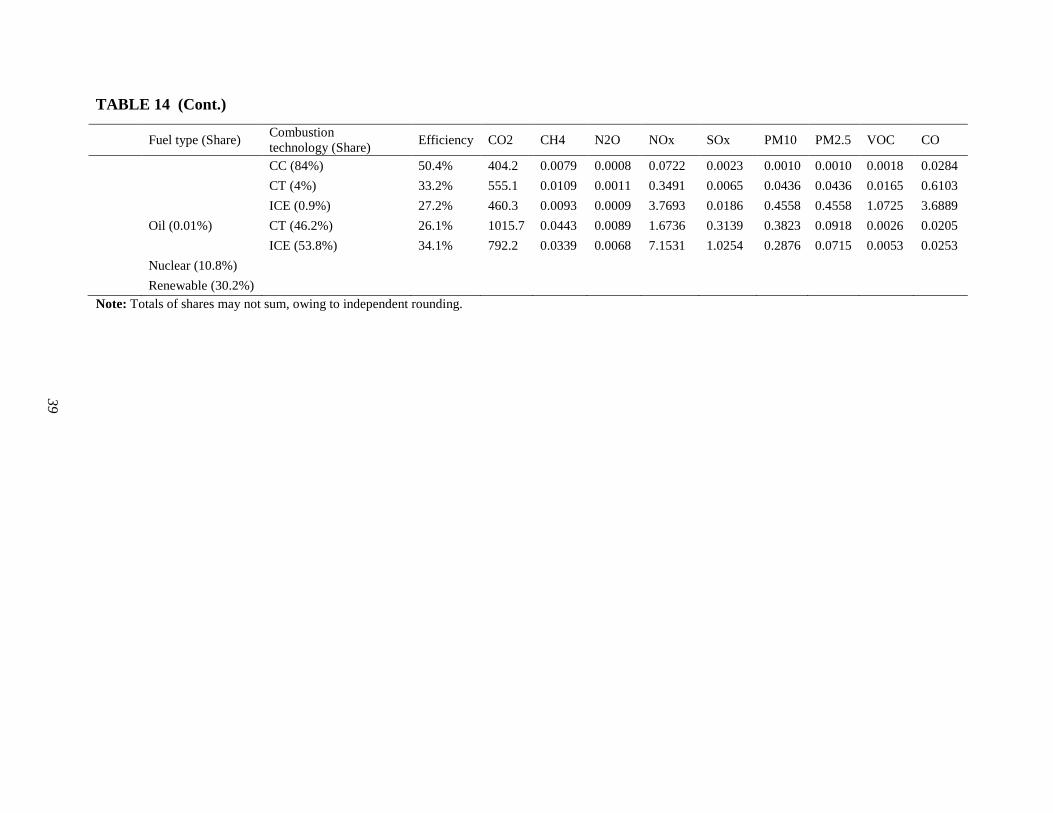
39
TABLE 14 (Cont.)
Fuel type (Share) Combustion technology (Share) Efficiency CO2 CH4 N2O NOx SOx PM10 PM2.5 VOC CO
CC (84%) 50.4% 404.2 0.0079 0.0008 0.0722 0.0023 0.0010 0.0010 0.0018 0.0284 CT (4%) 33.2% 555.1 0.0109 0.0011 0.3491 0.0065 0.0436 0.0436 0.0165 0.6103 ICE (0.9%) 27.2% 460.3 0.0093 0.0009 3.7693 0.0186 0.4558 0.4558 1.0725 3.6889 Oil (0.01%) CT (46.2%) 26.1% 1015.7 0.0443 0.0089 1.6736 0.3139 0.3823 0.0918 0.0026 0.0205 ICE (53.8%) 34.1% 792.2 0.0339 0.0068 7.1531 1.0254 0.2876 0.0715 0.0053 0.0253 Nuclear (10.8%) Renewable (30.2%) Note: Totals of shares may not sum, owing to independent rounding.

40
3.4 GHG AND CAP EMISSION FACTORS AND EFFICIENCIES BY FUEL TYPE AND GENERATION TECHNOLOGY IN EACH STATE
GHG and CAP emission factors and efficiencies for EGUs in the 50 states and the Washington, D.C. area (DC) are summarized in Table 15. Significant variations in GHG and CAP emission factors among states are found, mostly because of differences among states in the efficiencies of EGUs and the fuel quality.
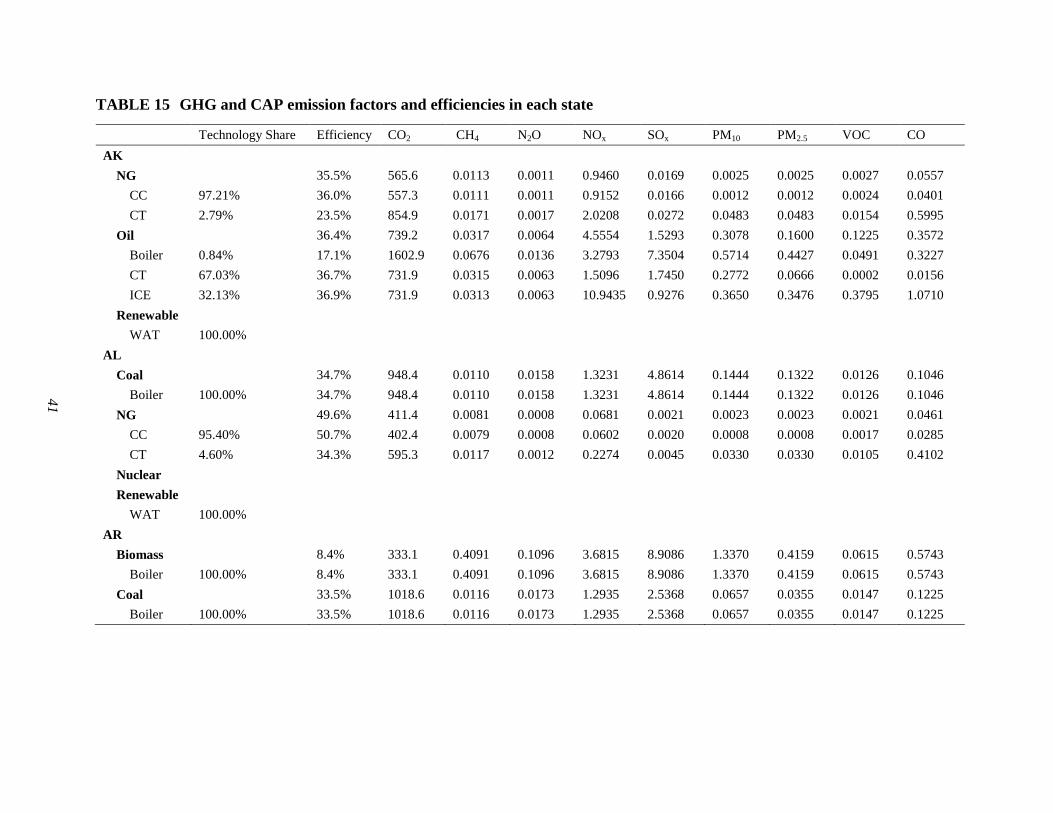
41
TABLE 15 GHG and CAP emission factors and efficiencies in each state
Technology Share Efficiency CO2 CH4 N2O NOx SOx PM10 PM2.5 VOC CO AK
NG 35.5% 565.6 0.0113 0.0011 0.9460 0.0169 0.0025 0.0025 0.0027 0.0557 CC 97.21% 36.0% 557.3 0.0111 0.0011 0.9152 0.0166 0.0012 0.0012 0.0024 0.0401 CT 2.79% 23.5% 854.9 0.0171 0.0017 2.0208 0.0272 0.0483 0.0483 0.0154 0.5995
Oil 36.4% 739.2 0.0317 0.0064 4.5554 1.5293 0.3078 0.1600 0.1225 0.3572 Boiler 0.84% 17.1% 1602.9 0.0676 0.0136 3.2793 7.3504 0.5714 0.4427 0.0491 0.3227 CT 67.03% 36.7% 731.9 0.0315 0.0063 1.5096 1.7450 0.2772 0.0666 0.0002 0.0156 ICE 32.13% 36.9% 731.9 0.0313 0.0063 10.9435 0.9276 0.3650 0.3476 0.3795 1.0710
Renewable WAT 100.00%
AL Coal 34.7% 948.4 0.0110 0.0158 1.3231 4.8614 0.1444 0.1322 0.0126 0.1046
Boiler 100.00% 34.7% 948.4 0.0110 0.0158 1.3231 4.8614 0.1444 0.1322 0.0126 0.1046 NG 49.6% 411.4 0.0081 0.0008 0.0681 0.0021 0.0023 0.0023 0.0021 0.0461
CC 95.40% 50.7% 402.4 0.0079 0.0008 0.0602 0.0020 0.0008 0.0008 0.0017 0.0285 CT 4.60% 34.3% 595.3 0.0117 0.0012 0.2274 0.0045 0.0330 0.0330 0.0105 0.4102
Nuclear Renewable
WAT 100.00% AR
Biomass 8.4% 333.1 0.4091 0.1096 3.6815 8.9086 1.3370 0.4159 0.0615 0.5743 Boiler 100.00% 8.4% 333.1 0.4091 0.1096 3.6815 8.9086 1.3370 0.4159 0.0615 0.5743
Coal 33.5% 1018.6 0.0116 0.0173 1.2935 2.5368 0.0657 0.0355 0.0147 0.1225 Boiler 100.00% 33.5% 1018.6 0.0116 0.0173 1.2935 2.5368 0.0657 0.0355 0.0147 0.1225
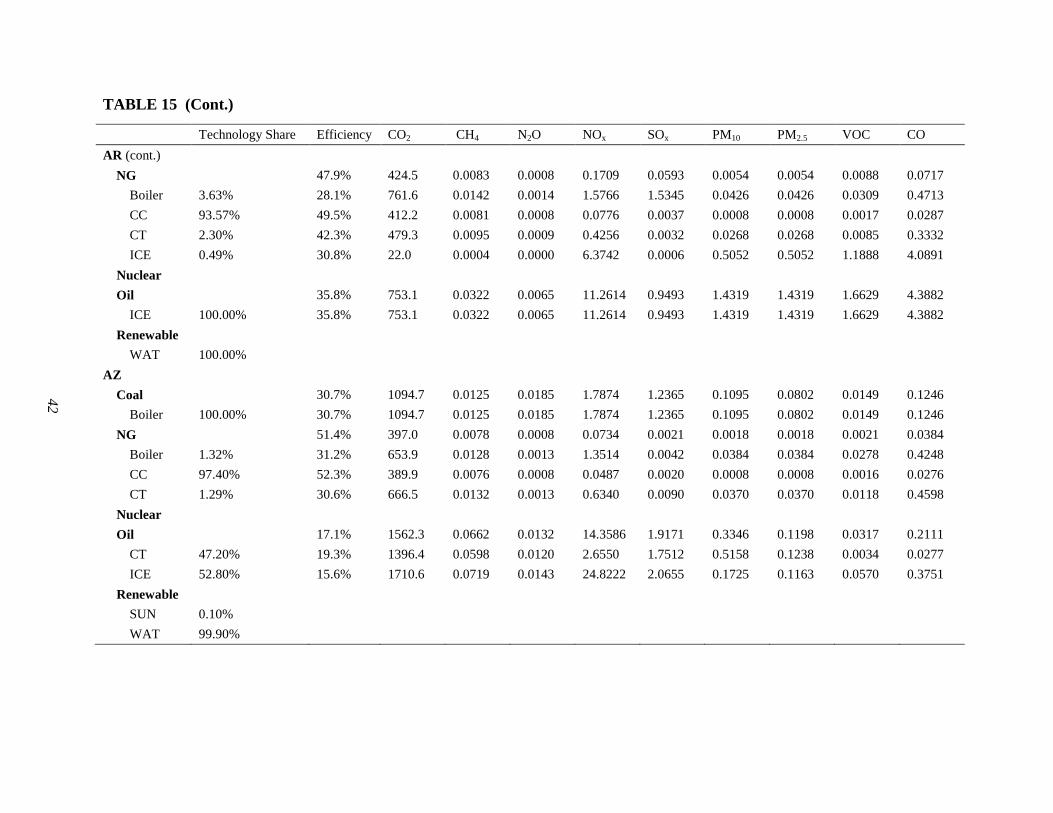
42
TABLE 15 (Cont.)
Technology Share Efficiency CO2 CH4 N2O NOx SOx PM10 PM2.5 VOC CO AR (cont.)
NG 47.9% 424.5 0.0083 0.0008 0.1709 0.0593 0.0054 0.0054 0.0088 0.0717 Boiler 3.63% 28.1% 761.6 0.0142 0.0014 1.5766 1.5345 0.0426 0.0426 0.0309 0.4713 CC 93.57% 49.5% 412.2 0.0081 0.0008 0.0776 0.0037 0.0008 0.0008 0.0017 0.0287 CT 2.30% 42.3% 479.3 0.0095 0.0009 0.4256 0.0032 0.0268 0.0268 0.0085 0.3332 ICE 0.49% 30.8% 22.0 0.0004 0.0000 6.3742 0.0006 0.5052 0.5052 1.1888 4.0891
Nuclear Oil 35.8% 753.1 0.0322 0.0065 11.2614 0.9493 1.4319 1.4319 1.6629 4.3882
ICE 100.00% 35.8% 753.1 0.0322 0.0065 11.2614 0.9493 1.4319 1.4319 1.6629 4.3882 Renewable
WAT 100.00% AZ
Coal 30.7% 1094.7 0.0125 0.0185 1.7874 1.2365 0.1095 0.0802 0.0149 0.1246 Boiler 100.00% 30.7% 1094.7 0.0125 0.0185 1.7874 1.2365 0.1095 0.0802 0.0149 0.1246
NG 51.4% 397.0 0.0078 0.0008 0.0734 0.0021 0.0018 0.0018 0.0021 0.0384 Boiler 1.32% 31.2% 653.9 0.0128 0.0013 1.3514 0.0042 0.0384 0.0384 0.0278 0.4248 CC 97.40% 52.3% 389.9 0.0076 0.0008 0.0487 0.0020 0.0008 0.0008 0.0016 0.0276 CT 1.29% 30.6% 666.5 0.0132 0.0013 0.6340 0.0090 0.0370 0.0370 0.0118 0.4598
Nuclear Oil 17.1% 1562.3 0.0662 0.0132 14.3586 1.9171 0.3346 0.1198 0.0317 0.2111
CT 47.20% 19.3% 1396.4 0.0598 0.0120 2.6550 1.7512 0.5158 0.1238 0.0034 0.0277 ICE 52.80% 15.6% 1710.6 0.0719 0.0143 24.8222 2.0655 0.1725 0.1163 0.0570 0.3751
Renewable SUN 0.10% WAT 99.90%
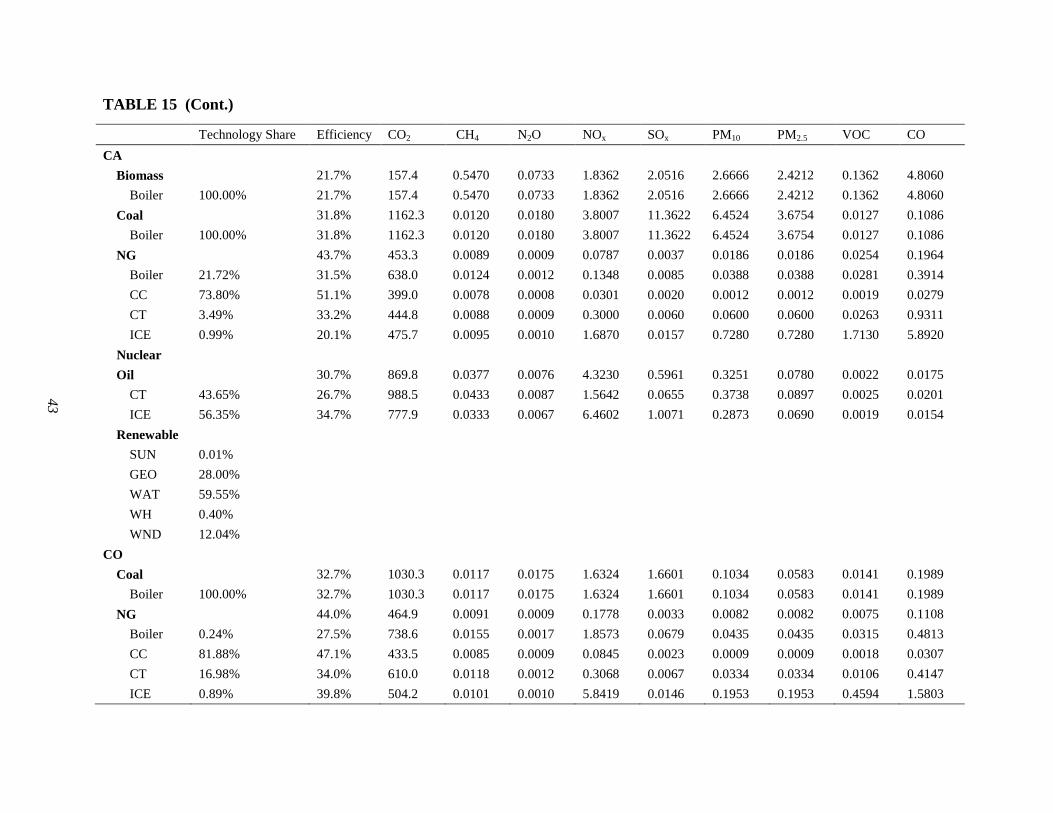
43
TABLE 15 (Cont.)
Technology Share Efficiency CO2 CH4 N2O NOx SOx PM10 PM2.5 VOC CO CA
Biomass 21.7% 157.4 0.5470 0.0733 1.8362 2.0516 2.6666 2.4212 0.1362 4.8060 Boiler 100.00% 21.7% 157.4 0.5470 0.0733 1.8362 2.0516 2.6666 2.4212 0.1362 4.8060
Coal 31.8% 1162.3 0.0120 0.0180 3.8007 11.3622 6.4524 3.6754 0.0127 0.1086 Boiler 100.00% 31.8% 1162.3 0.0120 0.0180 3.8007 11.3622 6.4524 3.6754 0.0127 0.1086
NG 43.7% 453.3 0.0089 0.0009 0.0787 0.0037 0.0186 0.0186 0.0254 0.1964 Boiler 21.72% 31.5% 638.0 0.0124 0.0012 0.1348 0.0085 0.0388 0.0388 0.0281 0.3914 CC 73.80% 51.1% 399.0 0.0078 0.0008 0.0301 0.0020 0.0012 0.0012 0.0019 0.0279 CT 3.49% 33.2% 444.8 0.0088 0.0009 0.3000 0.0060 0.0600 0.0600 0.0263 0.9311 ICE 0.99% 20.1% 475.7 0.0095 0.0010 1.6870 0.0157 0.7280 0.7280 1.7130 5.8920
Nuclear Oil 30.7% 869.8 0.0377 0.0076 4.3230 0.5961 0.3251 0.0780 0.0022 0.0175
CT 43.65% 26.7% 988.5 0.0433 0.0087 1.5642 0.0655 0.3738 0.0897 0.0025 0.0201 ICE 56.35% 34.7% 777.9 0.0333 0.0067 6.4602 1.0071 0.2873 0.0690 0.0019 0.0154
Renewable SUN 0.01% GEO 28.00% WAT 59.55% WH 0.40% WND 12.04%
CO Coal 32.7% 1030.3 0.0117 0.0175 1.6324 1.6601 0.1034 0.0583 0.0141 0.1989
Boiler 100.00% 32.7% 1030.3 0.0117 0.0175 1.6324 1.6601 0.1034 0.0583 0.0141 0.1989 NG 44.0% 464.9 0.0091 0.0009 0.1778 0.0033 0.0082 0.0082 0.0075 0.1108
Boiler 0.24% 27.5% 738.6 0.0155 0.0017 1.8573 0.0679 0.0435 0.0435 0.0315 0.4813 CC 81.88% 47.1% 433.5 0.0085 0.0009 0.0845 0.0023 0.0009 0.0009 0.0018 0.0307 CT 16.98% 34.0% 610.0 0.0118 0.0012 0.3068 0.0067 0.0334 0.0334 0.0106 0.4147 ICE 0.89% 39.8% 504.2 0.0101 0.0010 5.8419 0.0146 0.1953 0.1953 0.4594 1.5803
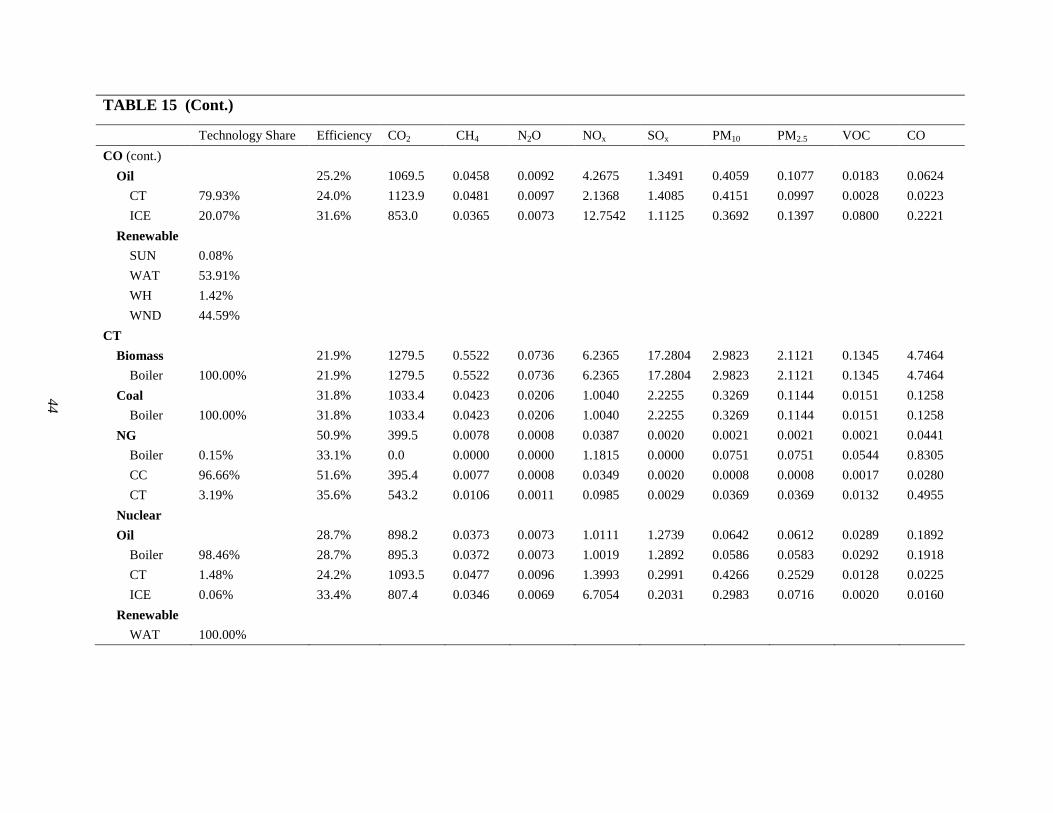
44
TABLE 15 (Cont.)
Technology Share Efficiency CO2 CH4 N2O NOx SOx PM10 PM2.5 VOC CO CO (cont.)
Oil 25.2% 1069.5 0.0458 0.0092 4.2675 1.3491 0.4059 0.1077 0.0183 0.0624 CT 79.93% 24.0% 1123.9 0.0481 0.0097 2.1368 1.4085 0.4151 0.0997 0.0028 0.0223 ICE 20.07% 31.6% 853.0 0.0365 0.0073 12.7542 1.1125 0.3692 0.1397 0.0800 0.2221
Renewable SUN 0.08% WAT 53.91% WH 1.42% WND 44.59%
CT Biomass 21.9% 1279.5 0.5522 0.0736 6.2365 17.2804 2.9823 2.1121 0.1345 4.7464
Boiler 100.00% 21.9% 1279.5 0.5522 0.0736 6.2365 17.2804 2.9823 2.1121 0.1345 4.7464 Coal 31.8% 1033.4 0.0423 0.0206 1.0040 2.2255 0.3269 0.1144 0.0151 0.1258
Boiler 100.00% 31.8% 1033.4 0.0423 0.0206 1.0040 2.2255 0.3269 0.1144 0.0151 0.1258 NG 50.9% 399.5 0.0078 0.0008 0.0387 0.0020 0.0021 0.0021 0.0021 0.0441
Boiler 0.15% 33.1% 0.0 0.0000 0.0000 1.1815 0.0000 0.0751 0.0751 0.0544 0.8305 CC 96.66% 51.6% 395.4 0.0077 0.0008 0.0349 0.0020 0.0008 0.0008 0.0017 0.0280 CT 3.19% 35.6% 543.2 0.0106 0.0011 0.0985 0.0029 0.0369 0.0369 0.0132 0.4955
Nuclear Oil 28.7% 898.2 0.0373 0.0073 1.0111 1.2739 0.0642 0.0612 0.0289 0.1892
Boiler 98.46% 28.7% 895.3 0.0372 0.0073 1.0019 1.2892 0.0586 0.0583 0.0292 0.1918 CT 1.48% 24.2% 1093.5 0.0477 0.0096 1.3993 0.2991 0.4266 0.2529 0.0128 0.0225 ICE 0.06% 33.4% 807.4 0.0346 0.0069 6.7054 0.2031 0.2983 0.0716 0.0020 0.0160
Renewable WAT 100.00%
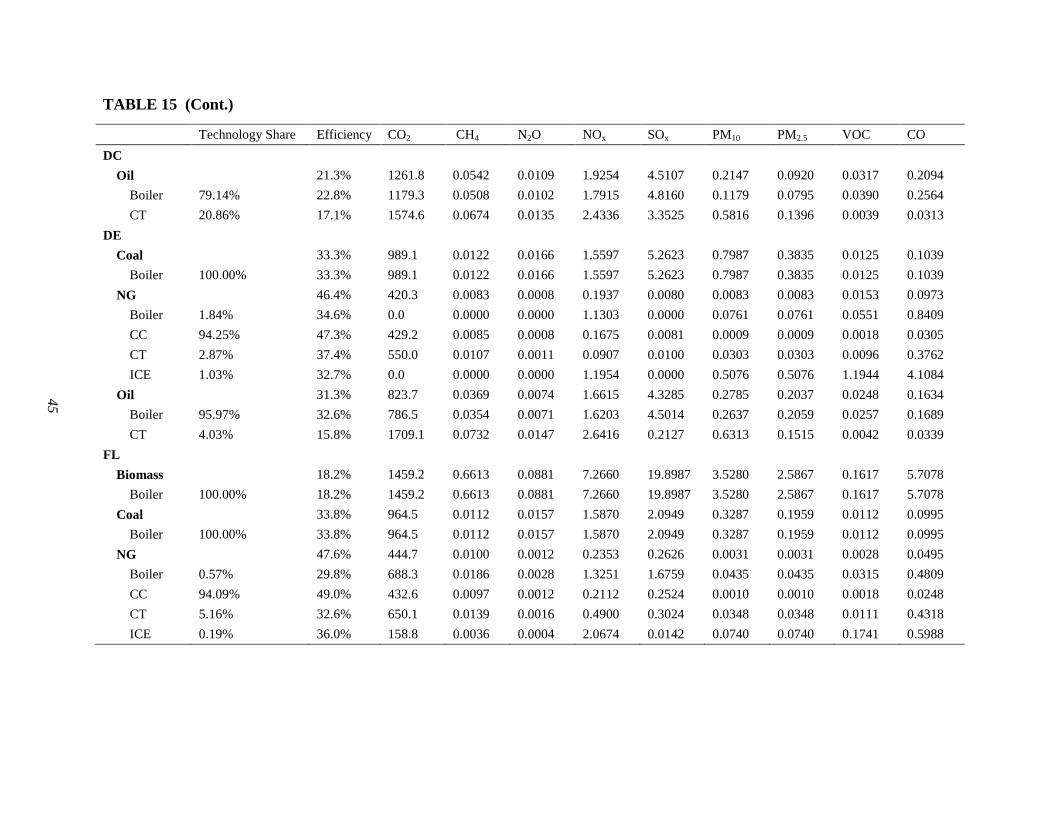
45
TABLE 15 (Cont.)
Technology Share Efficiency CO2 CH4 N2O NOx SOx PM10 PM2.5 VOC CO DC
Oil 21.3% 1261.8 0.0542 0.0109 1.9254 4.5107 0.2147 0.0920 0.0317 0.2094 Boiler 79.14% 22.8% 1179.3 0.0508 0.0102 1.7915 4.8160 0.1179 0.0795 0.0390 0.2564 CT 20.86% 17.1% 1574.6 0.0674 0.0135 2.4336 3.3525 0.5816 0.1396 0.0039 0.0313
DE Coal 33.3% 989.1 0.0122 0.0166 1.5597 5.2623 0.7987 0.3835 0.0125 0.1039
Boiler 100.00% 33.3% 989.1 0.0122 0.0166 1.5597 5.2623 0.7987 0.3835 0.0125 0.1039 NG 46.4% 420.3 0.0083 0.0008 0.1937 0.0080 0.0083 0.0083 0.0153 0.0973
Boiler 1.84% 34.6% 0.0 0.0000 0.0000 1.1303 0.0000 0.0761 0.0761 0.0551 0.8409 CC 94.25% 47.3% 429.2 0.0085 0.0008 0.1675 0.0081 0.0009 0.0009 0.0018 0.0305 CT 2.87% 37.4% 550.0 0.0107 0.0011 0.0907 0.0100 0.0303 0.0303 0.0096 0.3762 ICE 1.03% 32.7% 0.0 0.0000 0.0000 1.1954 0.0000 0.5076 0.5076 1.1944 4.1084
Oil 31.3% 823.7 0.0369 0.0074 1.6615 4.3285 0.2785 0.2037 0.0248 0.1634 Boiler 95.97% 32.6% 786.5 0.0354 0.0071 1.6203 4.5014 0.2637 0.2059 0.0257 0.1689 CT 4.03% 15.8% 1709.1 0.0732 0.0147 2.6416 0.2127 0.6313 0.1515 0.0042 0.0339
FL Biomass 18.2% 1459.2 0.6613 0.0881 7.2660 19.8987 3.5280 2.5867 0.1617 5.7078
Boiler 100.00% 18.2% 1459.2 0.6613 0.0881 7.2660 19.8987 3.5280 2.5867 0.1617 5.7078 Coal 33.8% 964.5 0.0112 0.0157 1.5870 2.0949 0.3287 0.1959 0.0112 0.0995
Boiler 100.00% 33.8% 964.5 0.0112 0.0157 1.5870 2.0949 0.3287 0.1959 0.0112 0.0995 NG 47.6% 444.7 0.0100 0.0012 0.2353 0.2626 0.0031 0.0031 0.0028 0.0495
Boiler 0.57% 29.8% 688.3 0.0186 0.0028 1.3251 1.6759 0.0435 0.0435 0.0315 0.4809 CC 94.09% 49.0% 432.6 0.0097 0.0012 0.2112 0.2524 0.0010 0.0010 0.0018 0.0248 CT 5.16% 32.6% 650.1 0.0139 0.0016 0.4900 0.3024 0.0348 0.0348 0.0111 0.4318 ICE 0.19% 36.0% 158.8 0.0036 0.0004 2.0674 0.0142 0.0740 0.0740 0.1741 0.5988
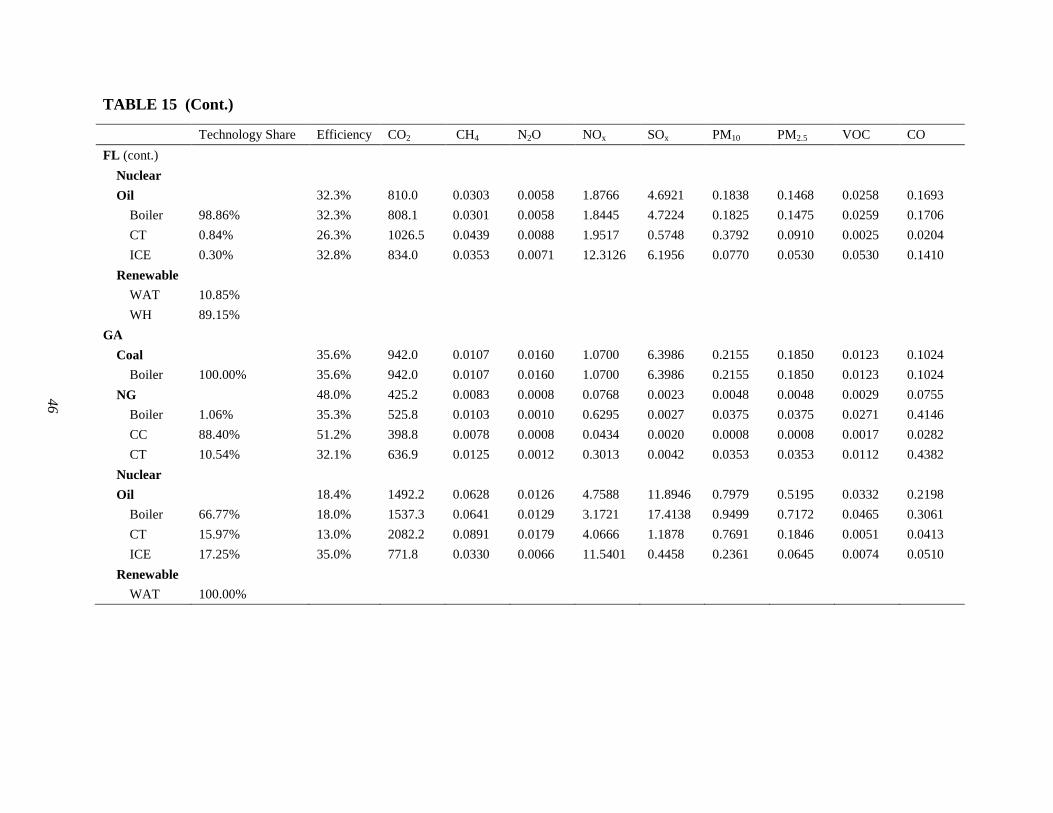
46
TABLE 15 (Cont.)
Technology Share Efficiency CO2 CH4 N2O NOx SOx PM10 PM2.5 VOC CO FL (cont.)
Nuclear Oil 32.3% 810.0 0.0303 0.0058 1.8766 4.6921 0.1838 0.1468 0.0258 0.1693
Boiler 98.86% 32.3% 808.1 0.0301 0.0058 1.8445 4.7224 0.1825 0.1475 0.0259 0.1706 CT 0.84% 26.3% 1026.5 0.0439 0.0088 1.9517 0.5748 0.3792 0.0910 0.0025 0.0204 ICE 0.30% 32.8% 834.0 0.0353 0.0071 12.3126 6.1956 0.0770 0.0530 0.0530 0.1410
Renewable WAT 10.85% WH 89.15%
GA Coal 35.6% 942.0 0.0107 0.0160 1.0700 6.3986 0.2155 0.1850 0.0123 0.1024
Boiler 100.00% 35.6% 942.0 0.0107 0.0160 1.0700 6.3986 0.2155 0.1850 0.0123 0.1024 NG 48.0% 425.2 0.0083 0.0008 0.0768 0.0023 0.0048 0.0048 0.0029 0.0755
Boiler 1.06% 35.3% 525.8 0.0103 0.0010 0.6295 0.0027 0.0375 0.0375 0.0271 0.4146 CC 88.40% 51.2% 398.8 0.0078 0.0008 0.0434 0.0020 0.0008 0.0008 0.0017 0.0282 CT 10.54% 32.1% 636.9 0.0125 0.0012 0.3013 0.0042 0.0353 0.0353 0.0112 0.4382
Nuclear Oil 18.4% 1492.2 0.0628 0.0126 4.7588 11.8946 0.7979 0.5195 0.0332 0.2198
Boiler 66.77% 18.0% 1537.3 0.0641 0.0129 3.1721 17.4138 0.9499 0.7172 0.0465 0.3061 CT 15.97% 13.0% 2082.2 0.0891 0.0179 4.0666 1.1878 0.7691 0.1846 0.0051 0.0413 ICE 17.25% 35.0% 771.8 0.0330 0.0066 11.5401 0.4458 0.2361 0.0645 0.0074 0.0510
Renewable WAT 100.00%
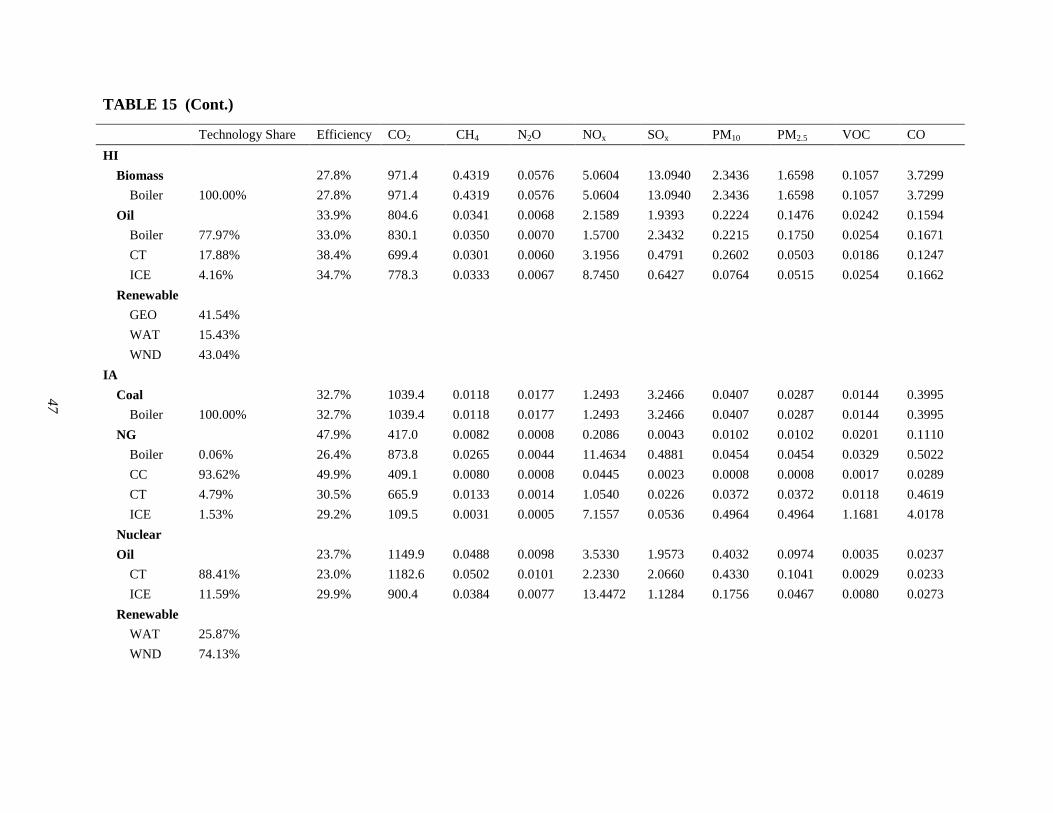
47
TABLE 15 (Cont.)
Technology Share Efficiency CO2 CH4 N2O NOx SOx PM10 PM2.5 VOC CO HI
Biomass 27.8% 971.4 0.4319 0.0576 5.0604 13.0940 2.3436 1.6598 0.1057 3.7299 Boiler 100.00% 27.8% 971.4 0.4319 0.0576 5.0604 13.0940 2.3436 1.6598 0.1057 3.7299
Oil 33.9% 804.6 0.0341 0.0068 2.1589 1.9393 0.2224 0.1476 0.0242 0.1594 Boiler 77.97% 33.0% 830.1 0.0350 0.0070 1.5700 2.3432 0.2215 0.1750 0.0254 0.1671 CT 17.88% 38.4% 699.4 0.0301 0.0060 3.1956 0.4791 0.2602 0.0503 0.0186 0.1247 ICE 4.16% 34.7% 778.3 0.0333 0.0067 8.7450 0.6427 0.0764 0.0515 0.0254 0.1662
Renewable GEO 41.54% WAT 15.43% WND 43.04%
IA Coal 32.7% 1039.4 0.0118 0.0177 1.2493 3.2466 0.0407 0.0287 0.0144 0.3995
Boiler 100.00% 32.7% 1039.4 0.0118 0.0177 1.2493 3.2466 0.0407 0.0287 0.0144 0.3995 NG 47.9% 417.0 0.0082 0.0008 0.2086 0.0043 0.0102 0.0102 0.0201 0.1110
Boiler 0.06% 26.4% 873.8 0.0265 0.0044 11.4634 0.4881 0.0454 0.0454 0.0329 0.5022 CC 93.62% 49.9% 409.1 0.0080 0.0008 0.0445 0.0023 0.0008 0.0008 0.0017 0.0289 CT 4.79% 30.5% 665.9 0.0133 0.0014 1.0540 0.0226 0.0372 0.0372 0.0118 0.4619 ICE 1.53% 29.2% 109.5 0.0031 0.0005 7.1557 0.0536 0.4964 0.4964 1.1681 4.0178
Nuclear Oil 23.7% 1149.9 0.0488 0.0098 3.5330 1.9573 0.4032 0.0974 0.0035 0.0237
CT 88.41% 23.0% 1182.6 0.0502 0.0101 2.2330 2.0660 0.4330 0.1041 0.0029 0.0233 ICE 11.59% 29.9% 900.4 0.0384 0.0077 13.4472 1.1284 0.1756 0.0467 0.0080 0.0273
Renewable WAT 25.87% WND 74.13%
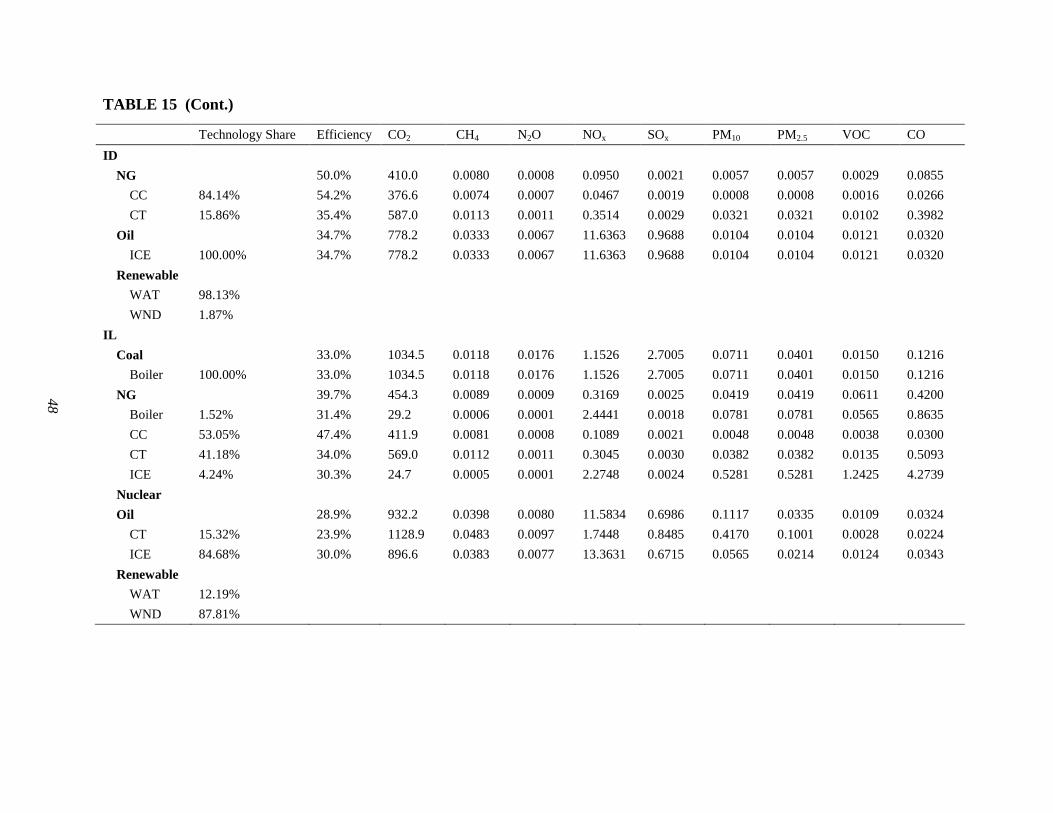
48
TABLE 15 (Cont.)
Technology Share Efficiency CO2 CH4 N2O NOx SOx PM10 PM2.5 VOC CO ID
NG 50.0% 410.0 0.0080 0.0008 0.0950 0.0021 0.0057 0.0057 0.0029 0.0855 CC 84.14% 54.2% 376.6 0.0074 0.0007 0.0467 0.0019 0.0008 0.0008 0.0016 0.0266 CT 15.86% 35.4% 587.0 0.0113 0.0011 0.3514 0.0029 0.0321 0.0321 0.0102 0.3982
Oil 34.7% 778.2 0.0333 0.0067 11.6363 0.9688 0.0104 0.0104 0.0121 0.0320 ICE 100.00% 34.7% 778.2 0.0333 0.0067 11.6363 0.9688 0.0104 0.0104 0.0121 0.0320
Renewable WAT 98.13% WND 1.87%
IL Coal 33.0% 1034.5 0.0118 0.0176 1.1526 2.7005 0.0711 0.0401 0.0150 0.1216
Boiler 100.00% 33.0% 1034.5 0.0118 0.0176 1.1526 2.7005 0.0711 0.0401 0.0150 0.1216 NG 39.7% 454.3 0.0089 0.0009 0.3169 0.0025 0.0419 0.0419 0.0611 0.4200
Boiler 1.52% 31.4% 29.2 0.0006 0.0001 2.4441 0.0018 0.0781 0.0781 0.0565 0.8635 CC 53.05% 47.4% 411.9 0.0081 0.0008 0.1089 0.0021 0.0048 0.0048 0.0038 0.0300 CT 41.18% 34.0% 569.0 0.0112 0.0011 0.3045 0.0030 0.0382 0.0382 0.0135 0.5093 ICE 4.24% 30.3% 24.7 0.0005 0.0001 2.2748 0.0024 0.5281 0.5281 1.2425 4.2739
Nuclear Oil 28.9% 932.2 0.0398 0.0080 11.5834 0.6986 0.1117 0.0335 0.0109 0.0324
CT 15.32% 23.9% 1128.9 0.0483 0.0097 1.7448 0.8485 0.4170 0.1001 0.0028 0.0224 ICE 84.68% 30.0% 896.6 0.0383 0.0077 13.3631 0.6715 0.0565 0.0214 0.0124 0.0343
Renewable WAT 12.19% WND 87.81%
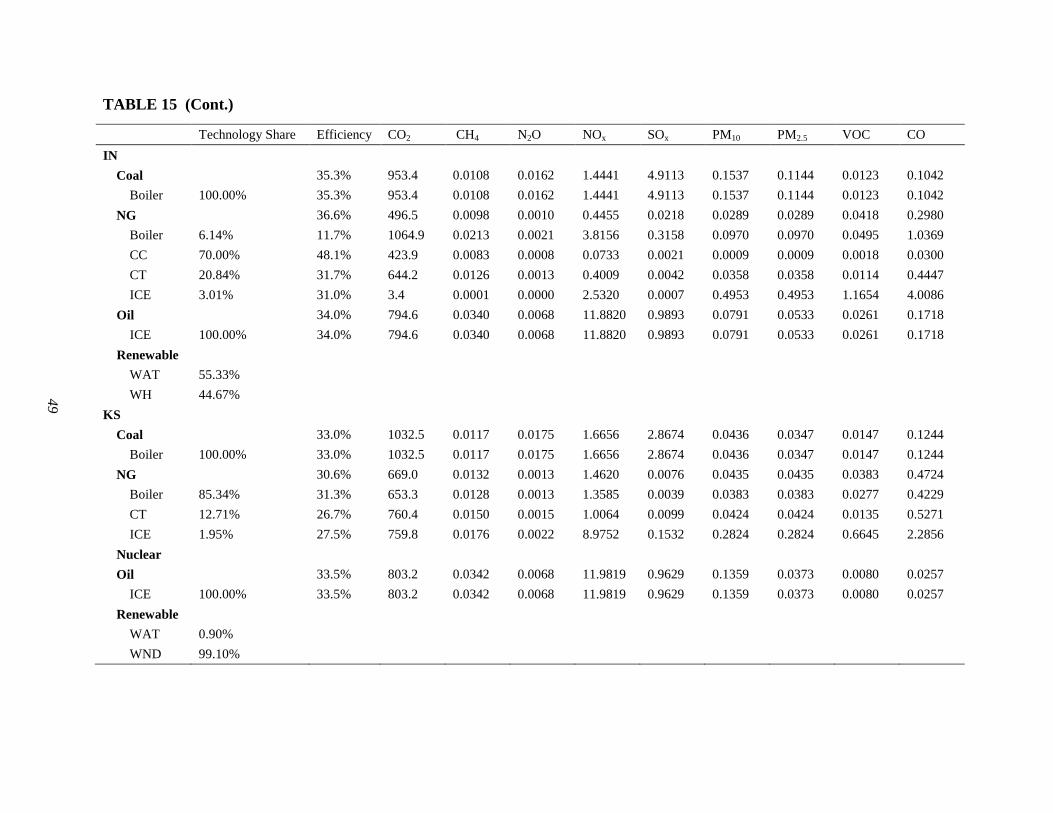
49
TABLE 15 (Cont.)
Technology Share Efficiency CO2 CH4 N2O NOx SOx PM10 PM2.5 VOC CO IN
Coal 35.3% 953.4 0.0108 0.0162 1.4441 4.9113 0.1537 0.1144 0.0123 0.1042 Boiler 100.00% 35.3% 953.4 0.0108 0.0162 1.4441 4.9113 0.1537 0.1144 0.0123 0.1042
NG 36.6% 496.5 0.0098 0.0010 0.4455 0.0218 0.0289 0.0289 0.0418 0.2980 Boiler 6.14% 11.7% 1064.9 0.0213 0.0021 3.8156 0.3158 0.0970 0.0970 0.0495 1.0369 CC 70.00% 48.1% 423.9 0.0083 0.0008 0.0733 0.0021 0.0009 0.0009 0.0018 0.0300 CT 20.84% 31.7% 644.2 0.0126 0.0013 0.4009 0.0042 0.0358 0.0358 0.0114 0.4447 ICE 3.01% 31.0% 3.4 0.0001 0.0000 2.5320 0.0007 0.4953 0.4953 1.1654 4.0086
Oil 34.0% 794.6 0.0340 0.0068 11.8820 0.9893 0.0791 0.0533 0.0261 0.1718 ICE 100.00% 34.0% 794.6 0.0340 0.0068 11.8820 0.9893 0.0791 0.0533 0.0261 0.1718
Renewable WAT 55.33% WH 44.67%
KS Coal 33.0% 1032.5 0.0117 0.0175 1.6656 2.8674 0.0436 0.0347 0.0147 0.1244
Boiler 100.00% 33.0% 1032.5 0.0117 0.0175 1.6656 2.8674 0.0436 0.0347 0.0147 0.1244 NG 30.6% 669.0 0.0132 0.0013 1.4620 0.0076 0.0435 0.0435 0.0383 0.4724
Boiler 85.34% 31.3% 653.3 0.0128 0.0013 1.3585 0.0039 0.0383 0.0383 0.0277 0.4229 CT 12.71% 26.7% 760.4 0.0150 0.0015 1.0064 0.0099 0.0424 0.0424 0.0135 0.5271 ICE 1.95% 27.5% 759.8 0.0176 0.0022 8.9752 0.1532 0.2824 0.2824 0.6645 2.2856
Nuclear Oil 33.5% 803.2 0.0342 0.0068 11.9819 0.9629 0.1359 0.0373 0.0080 0.0257
ICE 100.00% 33.5% 803.2 0.0342 0.0068 11.9819 0.9629 0.1359 0.0373 0.0080 0.0257 Renewable
WAT 0.90% WND 99.10%
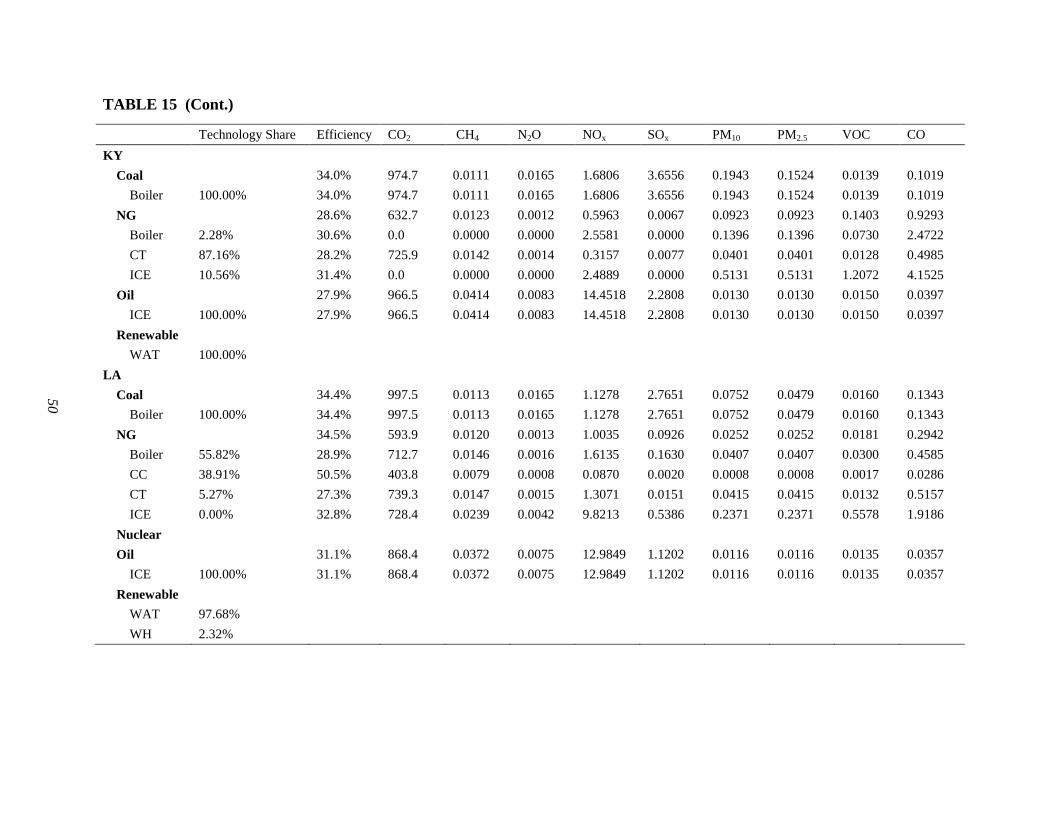
50
TABLE 15 (Cont.)
Technology Share Efficiency CO2 CH4 N2O NOx SOx PM10 PM2.5 VOC CO KY
Coal 34.0% 974.7 0.0111 0.0165 1.6806 3.6556 0.1943 0.1524 0.0139 0.1019 Boiler 100.00% 34.0% 974.7 0.0111 0.0165 1.6806 3.6556 0.1943 0.1524 0.0139 0.1019
NG 28.6% 632.7 0.0123 0.0012 0.5963 0.0067 0.0923 0.0923 0.1403 0.9293 Boiler 2.28% 30.6% 0.0 0.0000 0.0000 2.5581 0.0000 0.1396 0.1396 0.0730 2.4722 CT 87.16% 28.2% 725.9 0.0142 0.0014 0.3157 0.0077 0.0401 0.0401 0.0128 0.4985 ICE 10.56% 31.4% 0.0 0.0000 0.0000 2.4889 0.0000 0.5131 0.5131 1.2072 4.1525
Oil 27.9% 966.5 0.0414 0.0083 14.4518 2.2808 0.0130 0.0130 0.0150 0.0397 ICE 100.00% 27.9% 966.5 0.0414 0.0083 14.4518 2.2808 0.0130 0.0130 0.0150 0.0397
Renewable WAT 100.00%
LA Coal 34.4% 997.5 0.0113 0.0165 1.1278 2.7651 0.0752 0.0479 0.0160 0.1343
Boiler 100.00% 34.4% 997.5 0.0113 0.0165 1.1278 2.7651 0.0752 0.0479 0.0160 0.1343 NG 34.5% 593.9 0.0120 0.0013 1.0035 0.0926 0.0252 0.0252 0.0181 0.2942
Boiler 55.82% 28.9% 712.7 0.0146 0.0016 1.6135 0.1630 0.0407 0.0407 0.0300 0.4585 CC 38.91% 50.5% 403.8 0.0079 0.0008 0.0870 0.0020 0.0008 0.0008 0.0017 0.0286 CT 5.27% 27.3% 739.3 0.0147 0.0015 1.3071 0.0151 0.0415 0.0415 0.0132 0.5157 ICE 0.00% 32.8% 728.4 0.0239 0.0042 9.8213 0.5386 0.2371 0.2371 0.5578 1.9186
Nuclear Oil 31.1% 868.4 0.0372 0.0075 12.9849 1.1202 0.0116 0.0116 0.0135 0.0357
ICE 100.00% 31.1% 868.4 0.0372 0.0075 12.9849 1.1202 0.0116 0.0116 0.0135 0.0357 Renewable
WAT 97.68% WH 2.32%
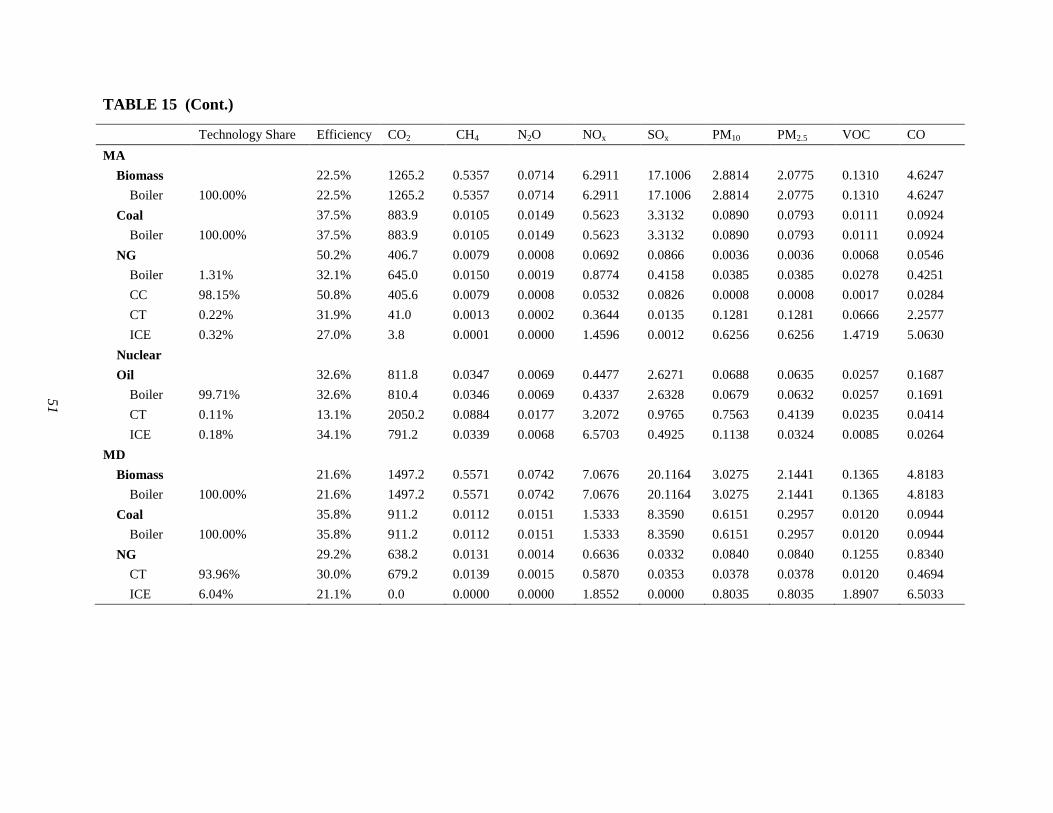
51
TABLE 15 (Cont.)
Technology Share Efficiency CO2 CH4 N2O NOx SOx PM10 PM2.5 VOC CO MA
Biomass 22.5% 1265.2 0.5357 0.0714 6.2911 17.1006 2.8814 2.0775 0.1310 4.6247 Boiler 100.00% 22.5% 1265.2 0.5357 0.0714 6.2911 17.1006 2.8814 2.0775 0.1310 4.6247
Coal 37.5% 883.9 0.0105 0.0149 0.5623 3.3132 0.0890 0.0793 0.0111 0.0924 Boiler 100.00% 37.5% 883.9 0.0105 0.0149 0.5623 3.3132 0.0890 0.0793 0.0111 0.0924
NG 50.2% 406.7 0.0079 0.0008 0.0692 0.0866 0.0036 0.0036 0.0068 0.0546 Boiler 1.31% 32.1% 645.0 0.0150 0.0019 0.8774 0.4158 0.0385 0.0385 0.0278 0.4251 CC 98.15% 50.8% 405.6 0.0079 0.0008 0.0532 0.0826 0.0008 0.0008 0.0017 0.0284 CT 0.22% 31.9% 41.0 0.0013 0.0002 0.3644 0.0135 0.1281 0.1281 0.0666 2.2577 ICE 0.32% 27.0% 3.8 0.0001 0.0000 1.4596 0.0012 0.6256 0.6256 1.4719 5.0630
Nuclear Oil 32.6% 811.8 0.0347 0.0069 0.4477 2.6271 0.0688 0.0635 0.0257 0.1687
Boiler 99.71% 32.6% 810.4 0.0346 0.0069 0.4337 2.6328 0.0679 0.0632 0.0257 0.1691 CT 0.11% 13.1% 2050.2 0.0884 0.0177 3.2072 0.9765 0.7563 0.4139 0.0235 0.0414 ICE 0.18% 34.1% 791.2 0.0339 0.0068 6.5703 0.4925 0.1138 0.0324 0.0085 0.0264
MD Biomass 21.6% 1497.2 0.5571 0.0742 7.0676 20.1164 3.0275 2.1441 0.1365 4.8183
Boiler 100.00% 21.6% 1497.2 0.5571 0.0742 7.0676 20.1164 3.0275 2.1441 0.1365 4.8183 Coal 35.8% 911.2 0.0112 0.0151 1.5333 8.3590 0.6151 0.2957 0.0120 0.0944
Boiler 100.00% 35.8% 911.2 0.0112 0.0151 1.5333 8.3590 0.6151 0.2957 0.0120 0.0944 NG 29.2% 638.2 0.0131 0.0014 0.6636 0.0332 0.0840 0.0840 0.1255 0.8340
CT 93.96% 30.0% 679.2 0.0139 0.0015 0.5870 0.0353 0.0378 0.0378 0.0120 0.4694 ICE 6.04% 21.1% 0.0 0.0000 0.0000 1.8552 0.0000 0.8035 0.8035 1.8907 6.5033
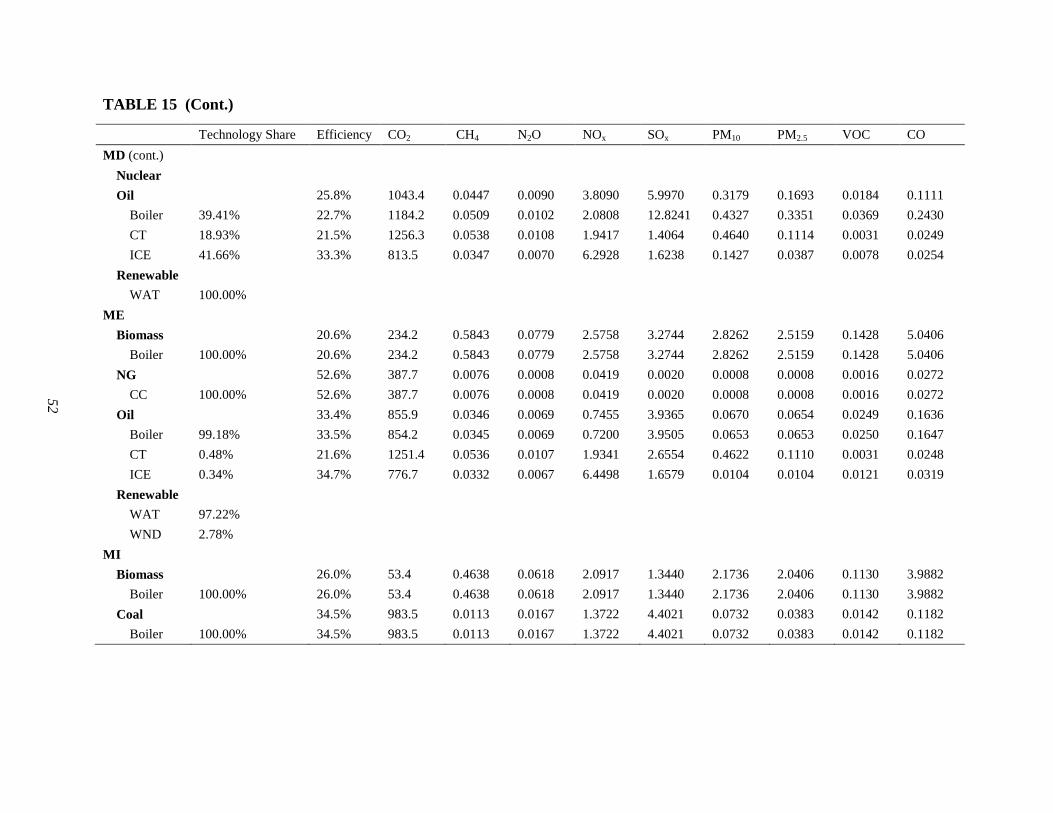
52
TABLE 15 (Cont.)
Technology Share Efficiency CO2 CH4 N2O NOx SOx PM10 PM2.5 VOC CO MD (cont.)
Nuclear Oil 25.8% 1043.4 0.0447 0.0090 3.8090 5.9970 0.3179 0.1693 0.0184 0.1111
Boiler 39.41% 22.7% 1184.2 0.0509 0.0102 2.0808 12.8241 0.4327 0.3351 0.0369 0.2430 CT 18.93% 21.5% 1256.3 0.0538 0.0108 1.9417 1.4064 0.4640 0.1114 0.0031 0.0249 ICE 41.66% 33.3% 813.5 0.0347 0.0070 6.2928 1.6238 0.1427 0.0387 0.0078 0.0254
Renewable WAT 100.00%
ME Biomass 20.6% 234.2 0.5843 0.0779 2.5758 3.2744 2.8262 2.5159 0.1428 5.0406
Boiler 100.00% 20.6% 234.2 0.5843 0.0779 2.5758 3.2744 2.8262 2.5159 0.1428 5.0406 NG 52.6% 387.7 0.0076 0.0008 0.0419 0.0020 0.0008 0.0008 0.0016 0.0272
CC 100.00% 52.6% 387.7 0.0076 0.0008 0.0419 0.0020 0.0008 0.0008 0.0016 0.0272 Oil 33.4% 855.9 0.0346 0.0069 0.7455 3.9365 0.0670 0.0654 0.0249 0.1636
Boiler 99.18% 33.5% 854.2 0.0345 0.0069 0.7200 3.9505 0.0653 0.0653 0.0250 0.1647 CT 0.48% 21.6% 1251.4 0.0536 0.0107 1.9341 2.6554 0.4622 0.1110 0.0031 0.0248 ICE 0.34% 34.7% 776.7 0.0332 0.0067 6.4498 1.6579 0.0104 0.0104 0.0121 0.0319
Renewable WAT 97.22% WND 2.78%
MI Biomass 26.0% 53.4 0.4638 0.0618 2.0917 1.3440 2.1736 2.0406 0.1130 3.9882
Boiler 100.00% 26.0% 53.4 0.4638 0.0618 2.0917 1.3440 2.1736 2.0406 0.1130 3.9882 Coal 34.5% 983.5 0.0113 0.0167 1.3722 4.4021 0.0732 0.0383 0.0142 0.1182
Boiler 100.00% 34.5% 983.5 0.0113 0.0167 1.3722 4.4021 0.0732 0.0383 0.0142 0.1182
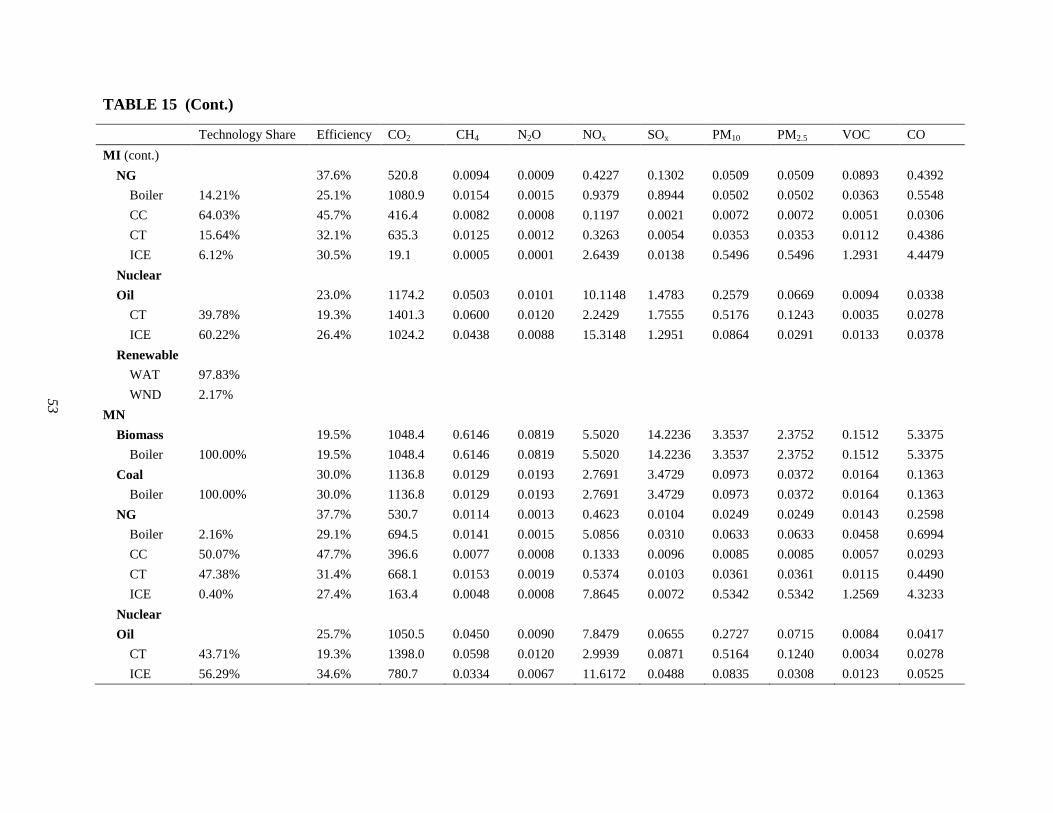
53
TABLE 15 (Cont.)
Technology Share Efficiency CO2 CH4 N2O NOx SOx PM10 PM2.5 VOC CO MI (cont.)
NG 37.6% 520.8 0.0094 0.0009 0.4227 0.1302 0.0509 0.0509 0.0893 0.4392 Boiler 14.21% 25.1% 1080.9 0.0154 0.0015 0.9379 0.8944 0.0502 0.0502 0.0363 0.5548 CC 64.03% 45.7% 416.4 0.0082 0.0008 0.1197 0.0021 0.0072 0.0072 0.0051 0.0306 CT 15.64% 32.1% 635.3 0.0125 0.0012 0.3263 0.0054 0.0353 0.0353 0.0112 0.4386 ICE 6.12% 30.5% 19.1 0.0005 0.0001 2.6439 0.0138 0.5496 0.5496 1.2931 4.4479
Nuclear Oil 23.0% 1174.2 0.0503 0.0101 10.1148 1.4783 0.2579 0.0669 0.0094 0.0338
CT 39.78% 19.3% 1401.3 0.0600 0.0120 2.2429 1.7555 0.5176 0.1243 0.0035 0.0278 ICE 60.22% 26.4% 1024.2 0.0438 0.0088 15.3148 1.2951 0.0864 0.0291 0.0133 0.0378
Renewable WAT 97.83% WND 2.17%
MN Biomass 19.5% 1048.4 0.6146 0.0819 5.5020 14.2236 3.3537 2.3752 0.1512 5.3375
Boiler 100.00% 19.5% 1048.4 0.6146 0.0819 5.5020 14.2236 3.3537 2.3752 0.1512 5.3375 Coal 30.0% 1136.8 0.0129 0.0193 2.7691 3.4729 0.0973 0.0372 0.0164 0.1363
Boiler 100.00% 30.0% 1136.8 0.0129 0.0193 2.7691 3.4729 0.0973 0.0372 0.0164 0.1363 NG 37.7% 530.7 0.0114 0.0013 0.4623 0.0104 0.0249 0.0249 0.0143 0.2598
Boiler 2.16% 29.1% 694.5 0.0141 0.0015 5.0856 0.0310 0.0633 0.0633 0.0458 0.6994 CC 50.07% 47.7% 396.6 0.0077 0.0008 0.1333 0.0096 0.0085 0.0085 0.0057 0.0293 CT 47.38% 31.4% 668.1 0.0153 0.0019 0.5374 0.0103 0.0361 0.0361 0.0115 0.4490 ICE 0.40% 27.4% 163.4 0.0048 0.0008 7.8645 0.0072 0.5342 0.5342 1.2569 4.3233
Nuclear Oil 25.7% 1050.5 0.0450 0.0090 7.8479 0.0655 0.2727 0.0715 0.0084 0.0417
CT 43.71% 19.3% 1398.0 0.0598 0.0120 2.9939 0.0871 0.5164 0.1240 0.0034 0.0278 ICE 56.29% 34.6% 780.7 0.0334 0.0067 11.6172 0.0488 0.0835 0.0308 0.0123 0.0525
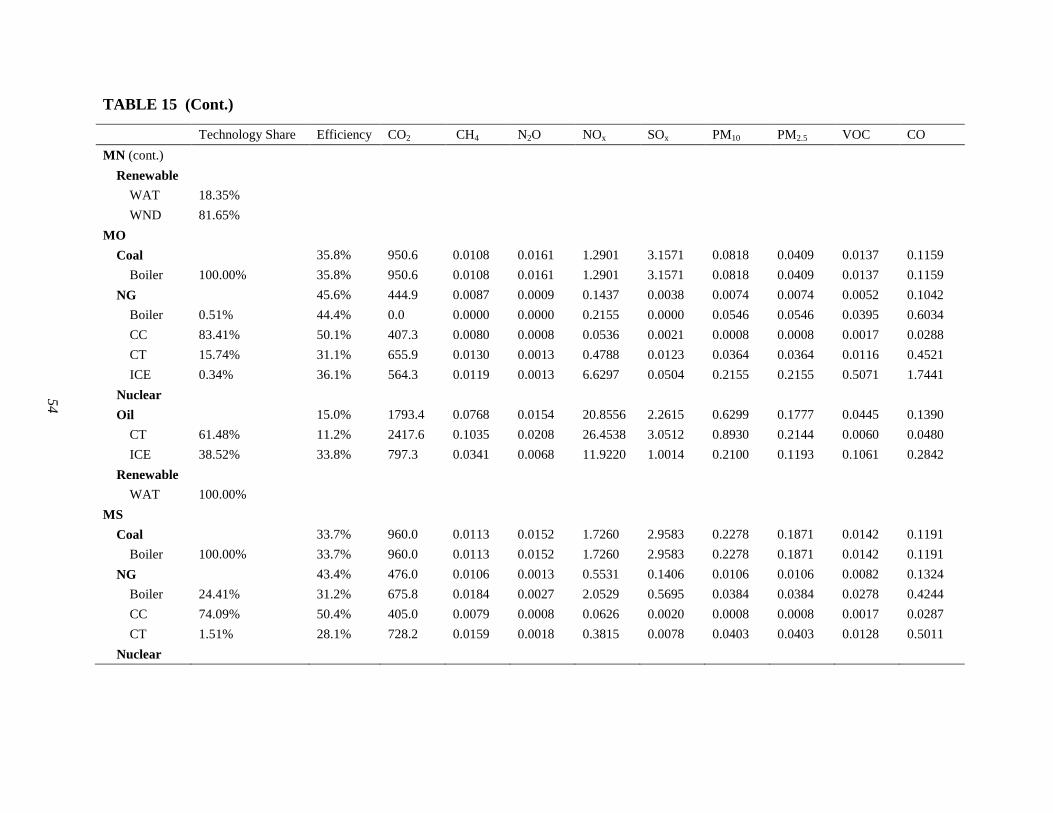
54
TABLE 15 (Cont.)
Technology Share Efficiency CO2 CH4 N2O NOx SOx PM10 PM2.5 VOC CO MN (cont.)
Renewable WAT 18.35% WND 81.65%
MO Coal 35.8% 950.6 0.0108 0.0161 1.2901 3.1571 0.0818 0.0409 0.0137 0.1159
Boiler 100.00% 35.8% 950.6 0.0108 0.0161 1.2901 3.1571 0.0818 0.0409 0.0137 0.1159 NG 45.6% 444.9 0.0087 0.0009 0.1437 0.0038 0.0074 0.0074 0.0052 0.1042
Boiler 0.51% 44.4% 0.0 0.0000 0.0000 0.2155 0.0000 0.0546 0.0546 0.0395 0.6034 CC 83.41% 50.1% 407.3 0.0080 0.0008 0.0536 0.0021 0.0008 0.0008 0.0017 0.0288 CT 15.74% 31.1% 655.9 0.0130 0.0013 0.4788 0.0123 0.0364 0.0364 0.0116 0.4521 ICE 0.34% 36.1% 564.3 0.0119 0.0013 6.6297 0.0504 0.2155 0.2155 0.5071 1.7441
Nuclear Oil 15.0% 1793.4 0.0768 0.0154 20.8556 2.2615 0.6299 0.1777 0.0445 0.1390
CT 61.48% 11.2% 2417.6 0.1035 0.0208 26.4538 3.0512 0.8930 0.2144 0.0060 0.0480 ICE 38.52% 33.8% 797.3 0.0341 0.0068 11.9220 1.0014 0.2100 0.1193 0.1061 0.2842
Renewable WAT 100.00%
MS Coal 33.7% 960.0 0.0113 0.0152 1.7260 2.9583 0.2278 0.1871 0.0142 0.1191
Boiler 100.00% 33.7% 960.0 0.0113 0.0152 1.7260 2.9583 0.2278 0.1871 0.0142 0.1191 NG 43.4% 476.0 0.0106 0.0013 0.5531 0.1406 0.0106 0.0106 0.0082 0.1324
Boiler 24.41% 31.2% 675.8 0.0184 0.0027 2.0529 0.5695 0.0384 0.0384 0.0278 0.4244 CC 74.09% 50.4% 405.0 0.0079 0.0008 0.0626 0.0020 0.0008 0.0008 0.0017 0.0287 CT 1.51% 28.1% 728.2 0.0159 0.0018 0.3815 0.0078 0.0403 0.0403 0.0128 0.5011
Nuclear
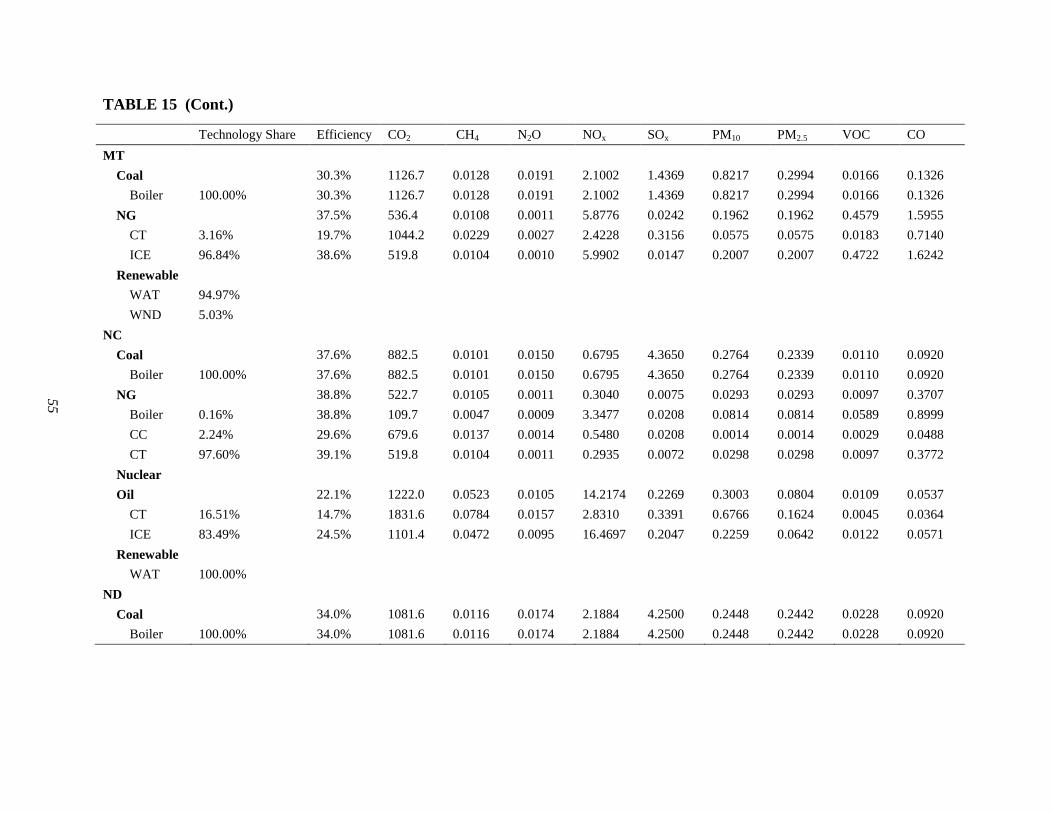
55
TABLE 15 (Cont.)
Technology Share Efficiency CO2 CH4 N2O NOx SOx PM10 PM2.5 VOC CO MT
Coal 30.3% 1126.7 0.0128 0.0191 2.1002 1.4369 0.8217 0.2994 0.0166 0.1326 Boiler 100.00% 30.3% 1126.7 0.0128 0.0191 2.1002 1.4369 0.8217 0.2994 0.0166 0.1326
NG 37.5% 536.4 0.0108 0.0011 5.8776 0.0242 0.1962 0.1962 0.4579 1.5955 CT 3.16% 19.7% 1044.2 0.0229 0.0027 2.4228 0.3156 0.0575 0.0575 0.0183 0.7140 ICE 96.84% 38.6% 519.8 0.0104 0.0010 5.9902 0.0147 0.2007 0.2007 0.4722 1.6242
Renewable WAT 94.97% WND 5.03%
NC Coal 37.6% 882.5 0.0101 0.0150 0.6795 4.3650 0.2764 0.2339 0.0110 0.0920
Boiler 100.00% 37.6% 882.5 0.0101 0.0150 0.6795 4.3650 0.2764 0.2339 0.0110 0.0920 NG 38.8% 522.7 0.0105 0.0011 0.3040 0.0075 0.0293 0.0293 0.0097 0.3707
Boiler 0.16% 38.8% 109.7 0.0047 0.0009 3.3477 0.0208 0.0814 0.0814 0.0589 0.8999 CC 2.24% 29.6% 679.6 0.0137 0.0014 0.5480 0.0208 0.0014 0.0014 0.0029 0.0488 CT 97.60% 39.1% 519.8 0.0104 0.0011 0.2935 0.0072 0.0298 0.0298 0.0097 0.3772
Nuclear Oil 22.1% 1222.0 0.0523 0.0105 14.2174 0.2269 0.3003 0.0804 0.0109 0.0537
CT 16.51% 14.7% 1831.6 0.0784 0.0157 2.8310 0.3391 0.6766 0.1624 0.0045 0.0364 ICE 83.49% 24.5% 1101.4 0.0472 0.0095 16.4697 0.2047 0.2259 0.0642 0.0122 0.0571
Renewable WAT 100.00%
ND Coal 34.0% 1081.6 0.0116 0.0174 2.1884 4.2500 0.2448 0.2442 0.0228 0.0920
Boiler 100.00% 34.0% 1081.6 0.0116 0.0174 2.1884 4.2500 0.2448 0.2442 0.0228 0.0920
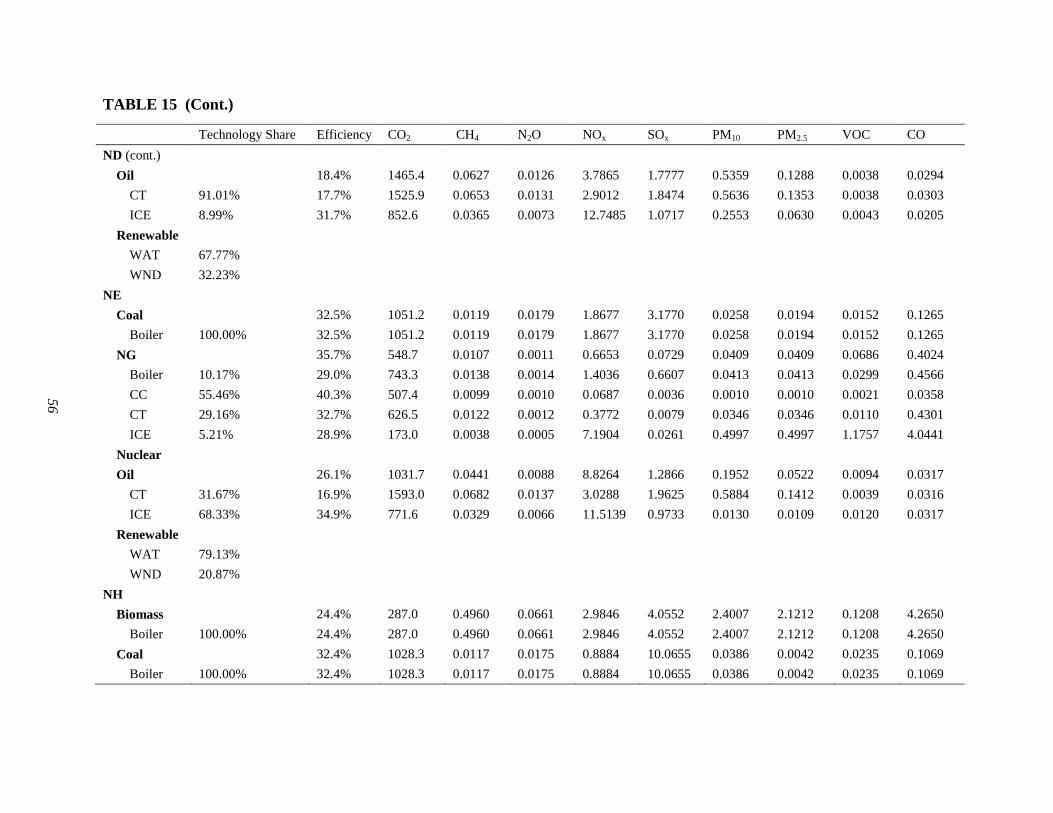
56
TABLE 15 (Cont.)
Technology Share Efficiency CO2 CH4 N2O NOx SOx PM10 PM2.5 VOC CO ND (cont.)
Oil 18.4% 1465.4 0.0627 0.0126 3.7865 1.7777 0.5359 0.1288 0.0038 0.0294 CT 91.01% 17.7% 1525.9 0.0653 0.0131 2.9012 1.8474 0.5636 0.1353 0.0038 0.0303 ICE 8.99% 31.7% 852.6 0.0365 0.0073 12.7485 1.0717 0.2553 0.0630 0.0043 0.0205
Renewable WAT 67.77% WND 32.23%
NE Coal 32.5% 1051.2 0.0119 0.0179 1.8677 3.1770 0.0258 0.0194 0.0152 0.1265
Boiler 100.00% 32.5% 1051.2 0.0119 0.0179 1.8677 3.1770 0.0258 0.0194 0.0152 0.1265 NG 35.7% 548.7 0.0107 0.0011 0.6653 0.0729 0.0409 0.0409 0.0686 0.4024
Boiler 10.17% 29.0% 743.3 0.0138 0.0014 1.4036 0.6607 0.0413 0.0413 0.0299 0.4566 CC 55.46% 40.3% 507.4 0.0099 0.0010 0.0687 0.0036 0.0010 0.0010 0.0021 0.0358 CT 29.16% 32.7% 626.5 0.0122 0.0012 0.3772 0.0079 0.0346 0.0346 0.0110 0.4301 ICE 5.21% 28.9% 173.0 0.0038 0.0005 7.1904 0.0261 0.4997 0.4997 1.1757 4.0441
Nuclear Oil 26.1% 1031.7 0.0441 0.0088 8.8264 1.2866 0.1952 0.0522 0.0094 0.0317
CT 31.67% 16.9% 1593.0 0.0682 0.0137 3.0288 1.9625 0.5884 0.1412 0.0039 0.0316 ICE 68.33% 34.9% 771.6 0.0329 0.0066 11.5139 0.9733 0.0130 0.0109 0.0120 0.0317
Renewable WAT 79.13% WND 20.87%
NH Biomass 24.4% 287.0 0.4960 0.0661 2.9846 4.0552 2.4007 2.1212 0.1208 4.2650
Boiler 100.00% 24.4% 287.0 0.4960 0.0661 2.9846 4.0552 2.4007 2.1212 0.1208 4.2650 Coal 32.4% 1028.3 0.0117 0.0175 0.8884 10.0655 0.0386 0.0042 0.0235 0.1069
Boiler 100.00% 32.4% 1028.3 0.0117 0.0175 0.8884 10.0655 0.0386 0.0042 0.0235 0.1069
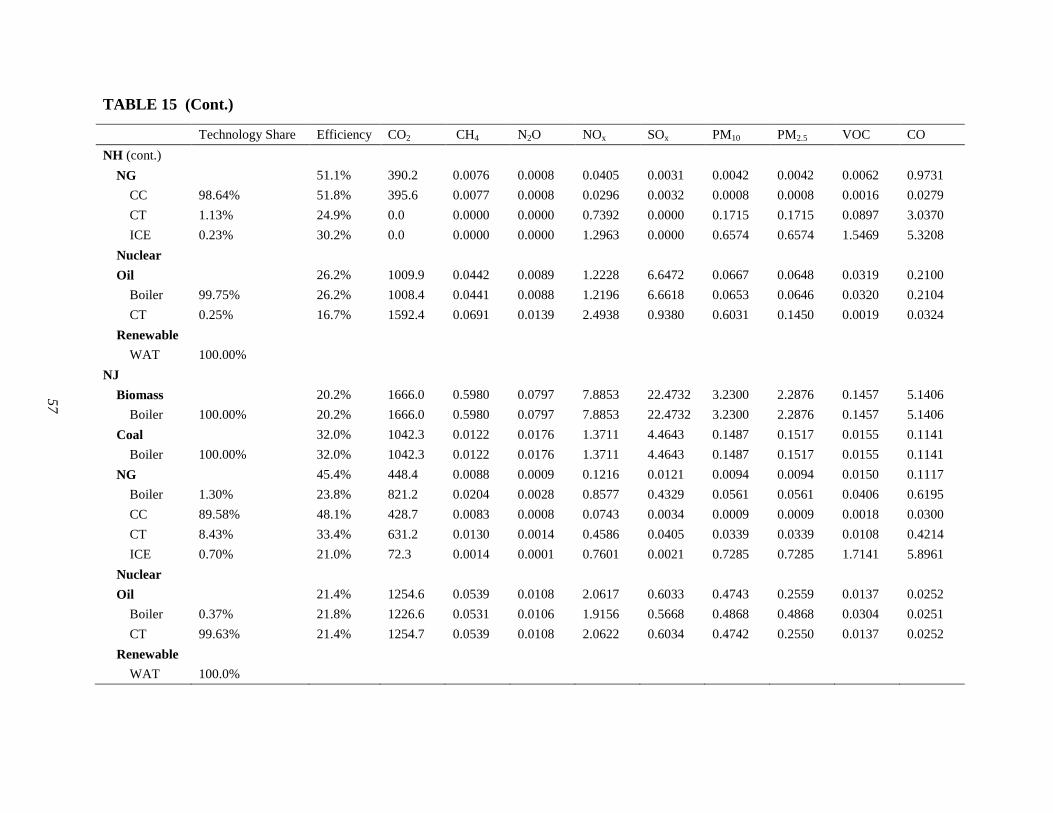
57
TABLE 15 (Cont.)
Technology Share Efficiency CO2 CH4 N2O NOx SOx PM10 PM2.5 VOC CO NH (cont.)
NG 51.1% 390.2 0.0076 0.0008 0.0405 0.0031 0.0042 0.0042 0.0062 0.9731 CC 98.64% 51.8% 395.6 0.0077 0.0008 0.0296 0.0032 0.0008 0.0008 0.0016 0.0279 CT 1.13% 24.9% 0.0 0.0000 0.0000 0.7392 0.0000 0.1715 0.1715 0.0897 3.0370 ICE 0.23% 30.2% 0.0 0.0000 0.0000 1.2963 0.0000 0.6574 0.6574 1.5469 5.3208
Nuclear Oil 26.2% 1009.9 0.0442 0.0089 1.2228 6.6472 0.0667 0.0648 0.0319 0.2100
Boiler 99.75% 26.2% 1008.4 0.0441 0.0088 1.2196 6.6618 0.0653 0.0646 0.0320 0.2104 CT 0.25% 16.7% 1592.4 0.0691 0.0139 2.4938 0.9380 0.6031 0.1450 0.0019 0.0324
Renewable WAT 100.00%
NJ Biomass 20.2% 1666.0 0.5980 0.0797 7.8853 22.4732 3.2300 2.2876 0.1457 5.1406
Boiler 100.00% 20.2% 1666.0 0.5980 0.0797 7.8853 22.4732 3.2300 2.2876 0.1457 5.1406 Coal 32.0% 1042.3 0.0122 0.0176 1.3711 4.4643 0.1487 0.1517 0.0155 0.1141
Boiler 100.00% 32.0% 1042.3 0.0122 0.0176 1.3711 4.4643 0.1487 0.1517 0.0155 0.1141 NG 45.4% 448.4 0.0088 0.0009 0.1216 0.0121 0.0094 0.0094 0.0150 0.1117
Boiler 1.30% 23.8% 821.2 0.0204 0.0028 0.8577 0.4329 0.0561 0.0561 0.0406 0.6195 CC 89.58% 48.1% 428.7 0.0083 0.0008 0.0743 0.0034 0.0009 0.0009 0.0018 0.0300 CT 8.43% 33.4% 631.2 0.0130 0.0014 0.4586 0.0405 0.0339 0.0339 0.0108 0.4214 ICE 0.70% 21.0% 72.3 0.0014 0.0001 0.7601 0.0021 0.7285 0.7285 1.7141 5.8961
Nuclear Oil 21.4% 1254.6 0.0539 0.0108 2.0617 0.6033 0.4743 0.2559 0.0137 0.0252
Boiler 0.37% 21.8% 1226.6 0.0531 0.0106 1.9156 0.5668 0.4868 0.4868 0.0304 0.0251 CT 99.63% 21.4% 1254.7 0.0539 0.0108 2.0622 0.6034 0.4742 0.2550 0.0137 0.0252
Renewable WAT 100.0%
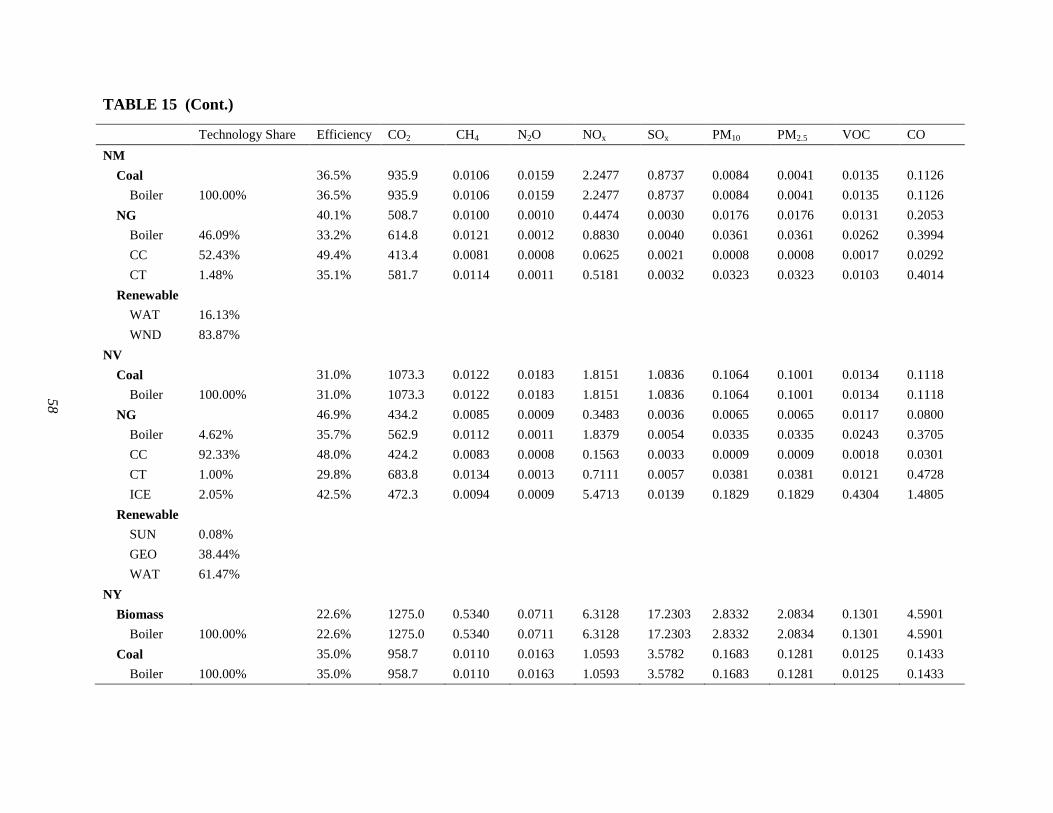
58
TABLE 15 (Cont.)
Technology Share Efficiency CO2 CH4 N2O NOx SOx PM10 PM2.5 VOC CO NM
Coal 36.5% 935.9 0.0106 0.0159 2.2477 0.8737 0.0084 0.0041 0.0135 0.1126 Boiler 100.00% 36.5% 935.9 0.0106 0.0159 2.2477 0.8737 0.0084 0.0041 0.0135 0.1126
NG 40.1% 508.7 0.0100 0.0010 0.4474 0.0030 0.0176 0.0176 0.0131 0.2053 Boiler 46.09% 33.2% 614.8 0.0121 0.0012 0.8830 0.0040 0.0361 0.0361 0.0262 0.3994 CC 52.43% 49.4% 413.4 0.0081 0.0008 0.0625 0.0021 0.0008 0.0008 0.0017 0.0292 CT 1.48% 35.1% 581.7 0.0114 0.0011 0.5181 0.0032 0.0323 0.0323 0.0103 0.4014
Renewable WAT 16.13% WND 83.87%
NV Coal 31.0% 1073.3 0.0122 0.0183 1.8151 1.0836 0.1064 0.1001 0.0134 0.1118
Boiler 100.00% 31.0% 1073.3 0.0122 0.0183 1.8151 1.0836 0.1064 0.1001 0.0134 0.1118 NG 46.9% 434.2 0.0085 0.0009 0.3483 0.0036 0.0065 0.0065 0.0117 0.0800
Boiler 4.62% 35.7% 562.9 0.0112 0.0011 1.8379 0.0054 0.0335 0.0335 0.0243 0.3705 CC 92.33% 48.0% 424.2 0.0083 0.0008 0.1563 0.0033 0.0009 0.0009 0.0018 0.0301 CT 1.00% 29.8% 683.8 0.0134 0.0013 0.7111 0.0057 0.0381 0.0381 0.0121 0.4728 ICE 2.05% 42.5% 472.3 0.0094 0.0009 5.4713 0.0139 0.1829 0.1829 0.4304 1.4805
Renewable SUN 0.08% GEO 38.44% WAT 61.47%
NY Biomass 22.6% 1275.0 0.5340 0.0711 6.3128 17.2303 2.8332 2.0834 0.1301 4.5901
Boiler 100.00% 22.6% 1275.0 0.5340 0.0711 6.3128 17.2303 2.8332 2.0834 0.1301 4.5901 Coal 35.0% 958.7 0.0110 0.0163 1.0593 3.5782 0.1683 0.1281 0.0125 0.1433
Boiler 100.00% 35.0% 958.7 0.0110 0.0163 1.0593 3.5782 0.1683 0.1281 0.0125 0.1433
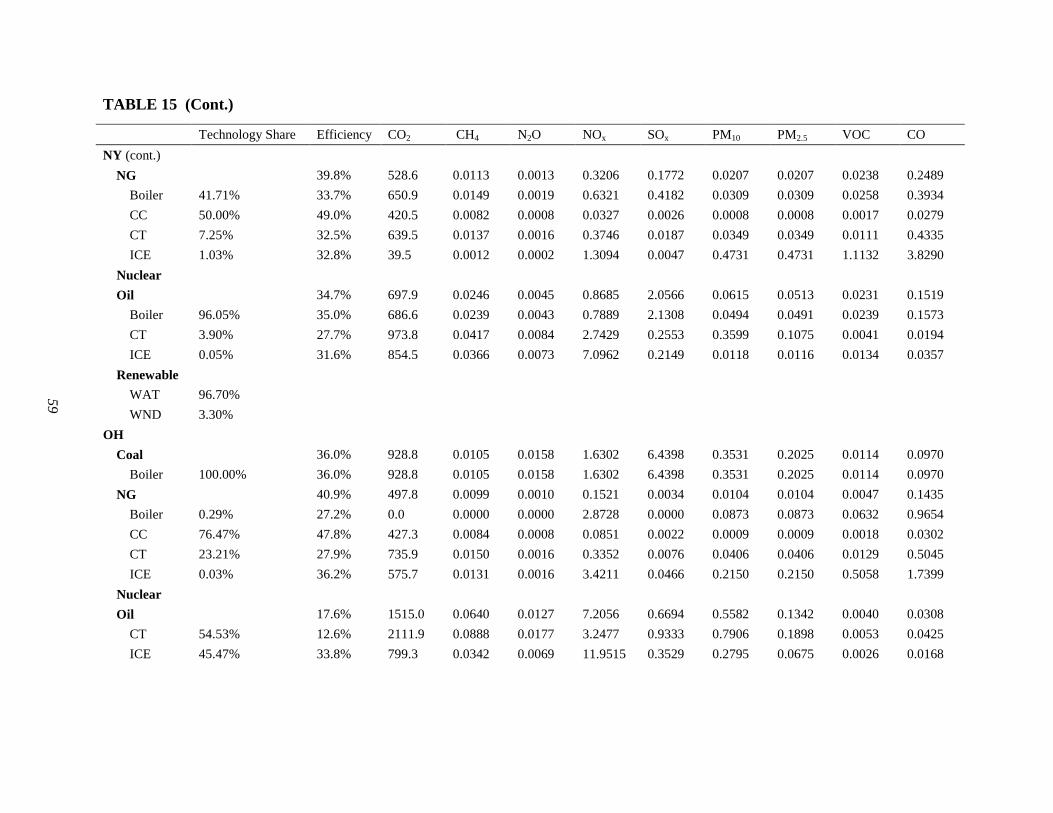
59
TABLE 15 (Cont.)
Technology Share Efficiency CO2 CH4 N2O NOx SOx PM10 PM2.5 VOC CO NY (cont.)
NG 39.8% 528.6 0.0113 0.0013 0.3206 0.1772 0.0207 0.0207 0.0238 0.2489 Boiler 41.71% 33.7% 650.9 0.0149 0.0019 0.6321 0.4182 0.0309 0.0309 0.0258 0.3934 CC 50.00% 49.0% 420.5 0.0082 0.0008 0.0327 0.0026 0.0008 0.0008 0.0017 0.0279 CT 7.25% 32.5% 639.5 0.0137 0.0016 0.3746 0.0187 0.0349 0.0349 0.0111 0.4335 ICE 1.03% 32.8% 39.5 0.0012 0.0002 1.3094 0.0047 0.4731 0.4731 1.1132 3.8290
Nuclear Oil 34.7% 697.9 0.0246 0.0045 0.8685 2.0566 0.0615 0.0513 0.0231 0.1519
Boiler 96.05% 35.0% 686.6 0.0239 0.0043 0.7889 2.1308 0.0494 0.0491 0.0239 0.1573 CT 3.90% 27.7% 973.8 0.0417 0.0084 2.7429 0.2553 0.3599 0.1075 0.0041 0.0194 ICE 0.05% 31.6% 854.5 0.0366 0.0073 7.0962 0.2149 0.0118 0.0116 0.0134 0.0357
Renewable WAT 96.70% WND 3.30%
OH Coal 36.0% 928.8 0.0105 0.0158 1.6302 6.4398 0.3531 0.2025 0.0114 0.0970
Boiler 100.00% 36.0% 928.8 0.0105 0.0158 1.6302 6.4398 0.3531 0.2025 0.0114 0.0970 NG 40.9% 497.8 0.0099 0.0010 0.1521 0.0034 0.0104 0.0104 0.0047 0.1435
Boiler 0.29% 27.2% 0.0 0.0000 0.0000 2.8728 0.0000 0.0873 0.0873 0.0632 0.9654 CC 76.47% 47.8% 427.3 0.0084 0.0008 0.0851 0.0022 0.0009 0.0009 0.0018 0.0302 CT 23.21% 27.9% 735.9 0.0150 0.0016 0.3352 0.0076 0.0406 0.0406 0.0129 0.5045 ICE 0.03% 36.2% 575.7 0.0131 0.0016 3.4211 0.0466 0.2150 0.2150 0.5058 1.7399
Nuclear Oil 17.6% 1515.0 0.0640 0.0127 7.2056 0.6694 0.5582 0.1342 0.0040 0.0308
CT 54.53% 12.6% 2111.9 0.0888 0.0177 3.2477 0.9333 0.7906 0.1898 0.0053 0.0425 ICE 45.47% 33.8% 799.3 0.0342 0.0069 11.9515 0.3529 0.2795 0.0675 0.0026 0.0168
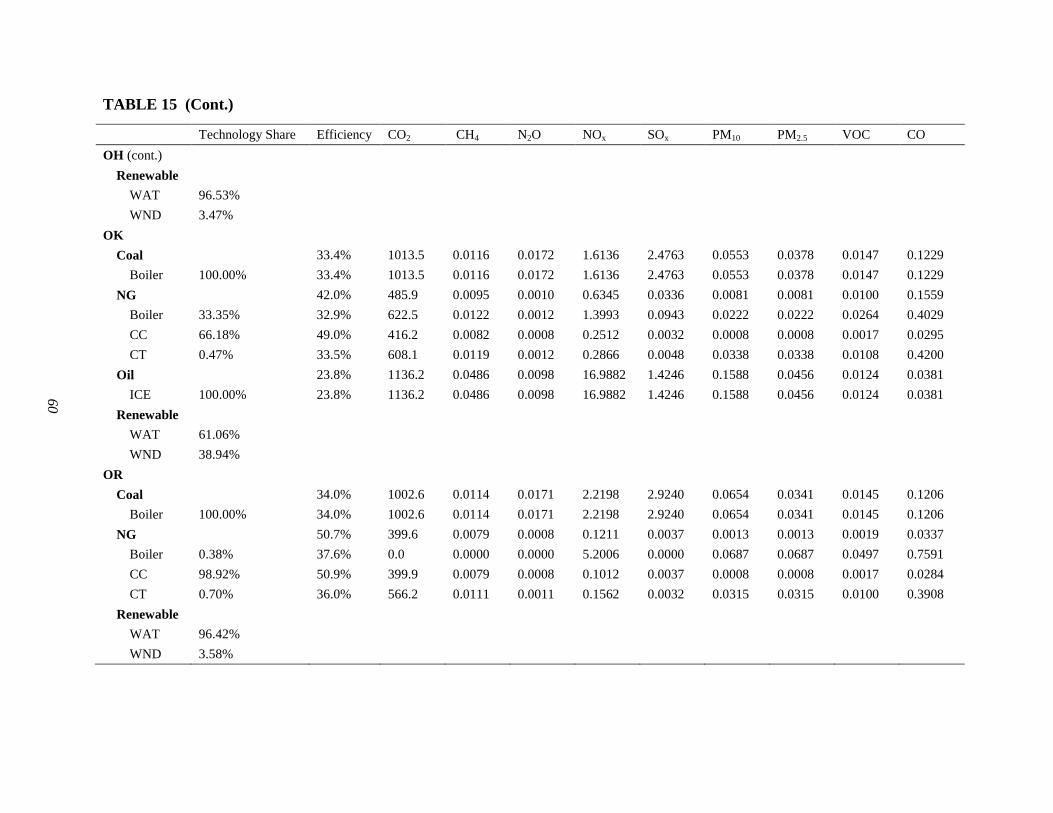
60
TABLE 15 (Cont.)
Technology Share Efficiency CO2 CH4 N2O NOx SOx PM10 PM2.5 VOC CO OH (cont.)
Renewable WAT 96.53% WND 3.47%
OK Coal 33.4% 1013.5 0.0116 0.0172 1.6136 2.4763 0.0553 0.0378 0.0147 0.1229
Boiler 100.00% 33.4% 1013.5 0.0116 0.0172 1.6136 2.4763 0.0553 0.0378 0.0147 0.1229 NG 42.0% 485.9 0.0095 0.0010 0.6345 0.0336 0.0081 0.0081 0.0100 0.1559
Boiler 33.35% 32.9% 622.5 0.0122 0.0012 1.3993 0.0943 0.0222 0.0222 0.0264 0.4029 CC 66.18% 49.0% 416.2 0.0082 0.0008 0.2512 0.0032 0.0008 0.0008 0.0017 0.0295 CT 0.47% 33.5% 608.1 0.0119 0.0012 0.2866 0.0048 0.0338 0.0338 0.0108 0.4200
Oil 23.8% 1136.2 0.0486 0.0098 16.9882 1.4246 0.1588 0.0456 0.0124 0.0381 ICE 100.00% 23.8% 1136.2 0.0486 0.0098 16.9882 1.4246 0.1588 0.0456 0.0124 0.0381
Renewable WAT 61.06% WND 38.94%
OR Coal 34.0% 1002.6 0.0114 0.0171 2.2198 2.9240 0.0654 0.0341 0.0145 0.1206
Boiler 100.00% 34.0% 1002.6 0.0114 0.0171 2.2198 2.9240 0.0654 0.0341 0.0145 0.1206 NG 50.7% 399.6 0.0079 0.0008 0.1211 0.0037 0.0013 0.0013 0.0019 0.0337
Boiler 0.38% 37.6% 0.0 0.0000 0.0000 5.2006 0.0000 0.0687 0.0687 0.0497 0.7591 CC 98.92% 50.9% 399.9 0.0079 0.0008 0.1012 0.0037 0.0008 0.0008 0.0017 0.0284 CT 0.70% 36.0% 566.2 0.0111 0.0011 0.1562 0.0032 0.0315 0.0315 0.0100 0.3908
Renewable WAT 96.42% WND 3.58%
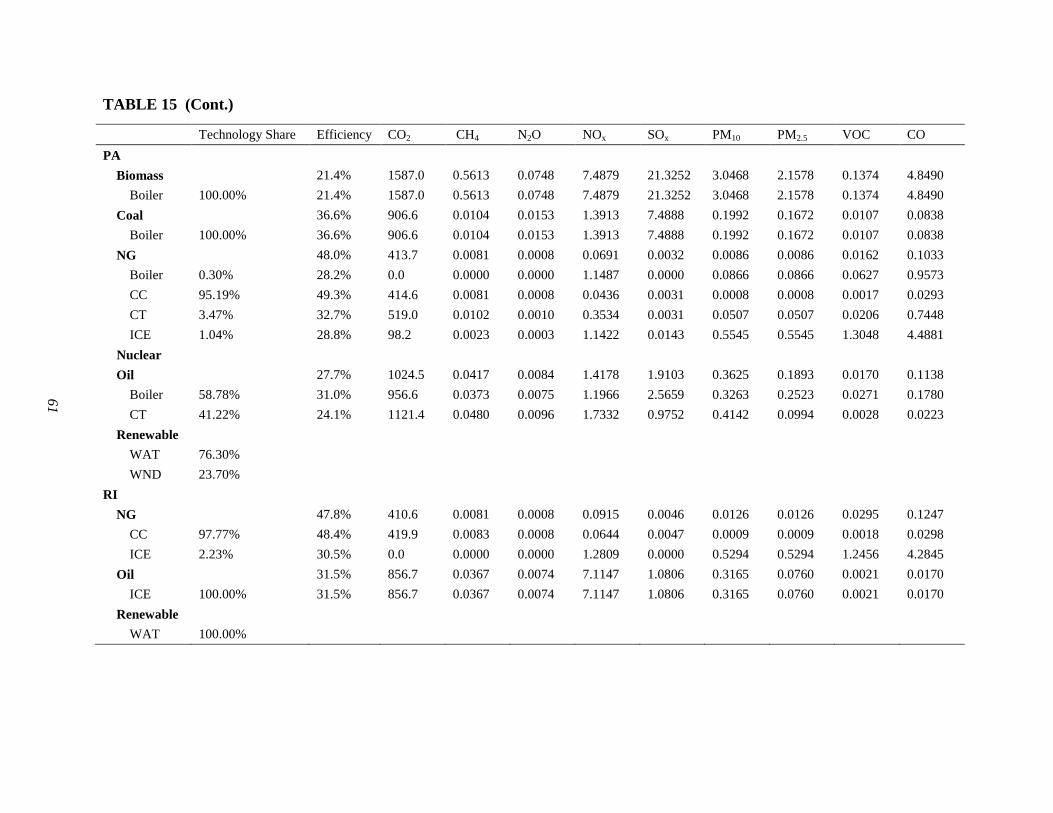
61
TABLE 15 (Cont.)
Technology Share Efficiency CO2 CH4 N2O NOx SOx PM10 PM2.5 VOC CO PA
Biomass 21.4% 1587.0 0.5613 0.0748 7.4879 21.3252 3.0468 2.1578 0.1374 4.8490 Boiler 100.00% 21.4% 1587.0 0.5613 0.0748 7.4879 21.3252 3.0468 2.1578 0.1374 4.8490
Coal 36.6% 906.6 0.0104 0.0153 1.3913 7.4888 0.1992 0.1672 0.0107 0.0838 Boiler 100.00% 36.6% 906.6 0.0104 0.0153 1.3913 7.4888 0.1992 0.1672 0.0107 0.0838
NG 48.0% 413.7 0.0081 0.0008 0.0691 0.0032 0.0086 0.0086 0.0162 0.1033 Boiler 0.30% 28.2% 0.0 0.0000 0.0000 1.1487 0.0000 0.0866 0.0866 0.0627 0.9573 CC 95.19% 49.3% 414.6 0.0081 0.0008 0.0436 0.0031 0.0008 0.0008 0.0017 0.0293 CT 3.47% 32.7% 519.0 0.0102 0.0010 0.3534 0.0031 0.0507 0.0507 0.0206 0.7448 ICE 1.04% 28.8% 98.2 0.0023 0.0003 1.1422 0.0143 0.5545 0.5545 1.3048 4.4881
Nuclear Oil 27.7% 1024.5 0.0417 0.0084 1.4178 1.9103 0.3625 0.1893 0.0170 0.1138
Boiler 58.78% 31.0% 956.6 0.0373 0.0075 1.1966 2.5659 0.3263 0.2523 0.0271 0.1780 CT 41.22% 24.1% 1121.4 0.0480 0.0096 1.7332 0.9752 0.4142 0.0994 0.0028 0.0223
Renewable WAT 76.30% WND 23.70%
RI NG 47.8% 410.6 0.0081 0.0008 0.0915 0.0046 0.0126 0.0126 0.0295 0.1247
CC 97.77% 48.4% 419.9 0.0083 0.0008 0.0644 0.0047 0.0009 0.0009 0.0018 0.0298 ICE 2.23% 30.5% 0.0 0.0000 0.0000 1.2809 0.0000 0.5294 0.5294 1.2456 4.2845
Oil 31.5% 856.7 0.0367 0.0074 7.1147 1.0806 0.3165 0.0760 0.0021 0.0170 ICE 100.00% 31.5% 856.7 0.0367 0.0074 7.1147 1.0806 0.3165 0.0760 0.0021 0.0170
Renewable WAT 100.00%
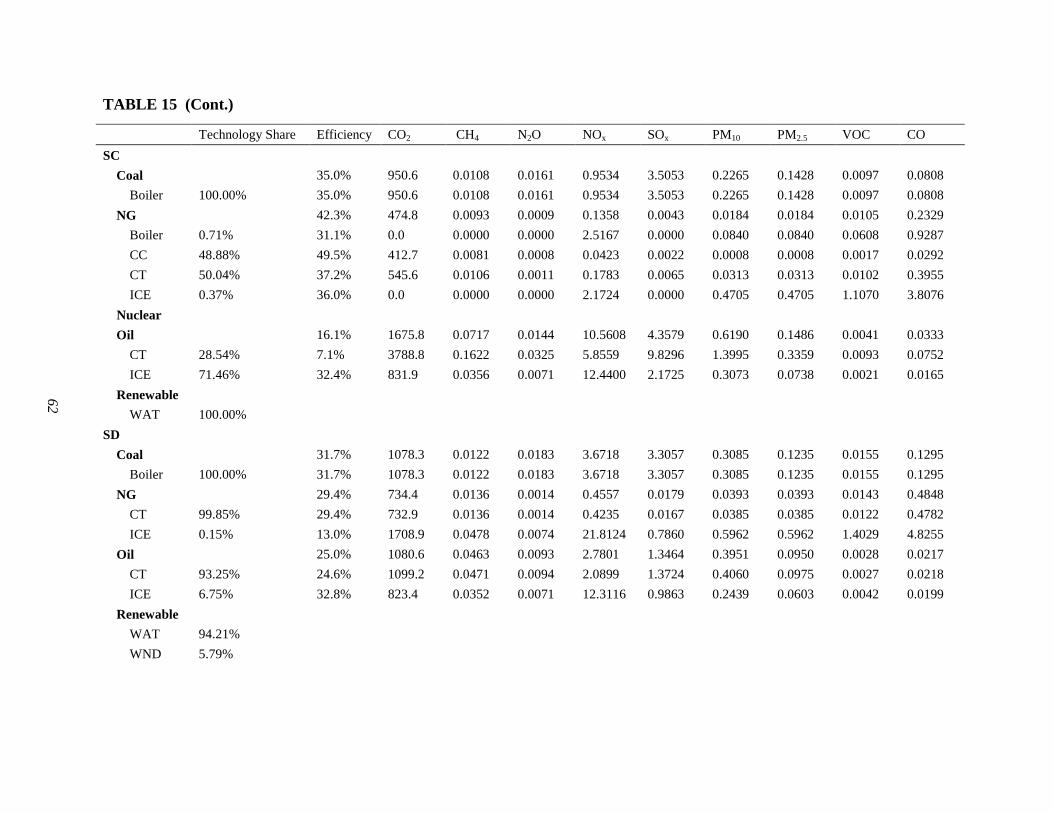
62
TABLE 15 (Cont.)
Technology Share Efficiency CO2 CH4 N2O NOx SOx PM10 PM2.5 VOC CO SC
Coal 35.0% 950.6 0.0108 0.0161 0.9534 3.5053 0.2265 0.1428 0.0097 0.0808 Boiler 100.00% 35.0% 950.6 0.0108 0.0161 0.9534 3.5053 0.2265 0.1428 0.0097 0.0808
NG 42.3% 474.8 0.0093 0.0009 0.1358 0.0043 0.0184 0.0184 0.0105 0.2329 Boiler 0.71% 31.1% 0.0 0.0000 0.0000 2.5167 0.0000 0.0840 0.0840 0.0608 0.9287 CC 48.88% 49.5% 412.7 0.0081 0.0008 0.0423 0.0022 0.0008 0.0008 0.0017 0.0292 CT 50.04% 37.2% 545.6 0.0106 0.0011 0.1783 0.0065 0.0313 0.0313 0.0102 0.3955 ICE 0.37% 36.0% 0.0 0.0000 0.0000 2.1724 0.0000 0.4705 0.4705 1.1070 3.8076
Nuclear Oil 16.1% 1675.8 0.0717 0.0144 10.5608 4.3579 0.6190 0.1486 0.0041 0.0333
CT 28.54% 7.1% 3788.8 0.1622 0.0325 5.8559 9.8296 1.3995 0.3359 0.0093 0.0752 ICE 71.46% 32.4% 831.9 0.0356 0.0071 12.4400 2.1725 0.3073 0.0738 0.0021 0.0165
Renewable WAT 100.00%
SD Coal 31.7% 1078.3 0.0122 0.0183 3.6718 3.3057 0.3085 0.1235 0.0155 0.1295
Boiler 100.00% 31.7% 1078.3 0.0122 0.0183 3.6718 3.3057 0.3085 0.1235 0.0155 0.1295 NG 29.4% 734.4 0.0136 0.0014 0.4557 0.0179 0.0393 0.0393 0.0143 0.4848
CT 99.85% 29.4% 732.9 0.0136 0.0014 0.4235 0.0167 0.0385 0.0385 0.0122 0.4782 ICE 0.15% 13.0% 1708.9 0.0478 0.0074 21.8124 0.7860 0.5962 0.5962 1.4029 4.8255
Oil 25.0% 1080.6 0.0463 0.0093 2.7801 1.3464 0.3951 0.0950 0.0028 0.0217 CT 93.25% 24.6% 1099.2 0.0471 0.0094 2.0899 1.3724 0.4060 0.0975 0.0027 0.0218 ICE 6.75% 32.8% 823.4 0.0352 0.0071 12.3116 0.9863 0.2439 0.0603 0.0042 0.0199
Renewable WAT 94.21% WND 5.79%
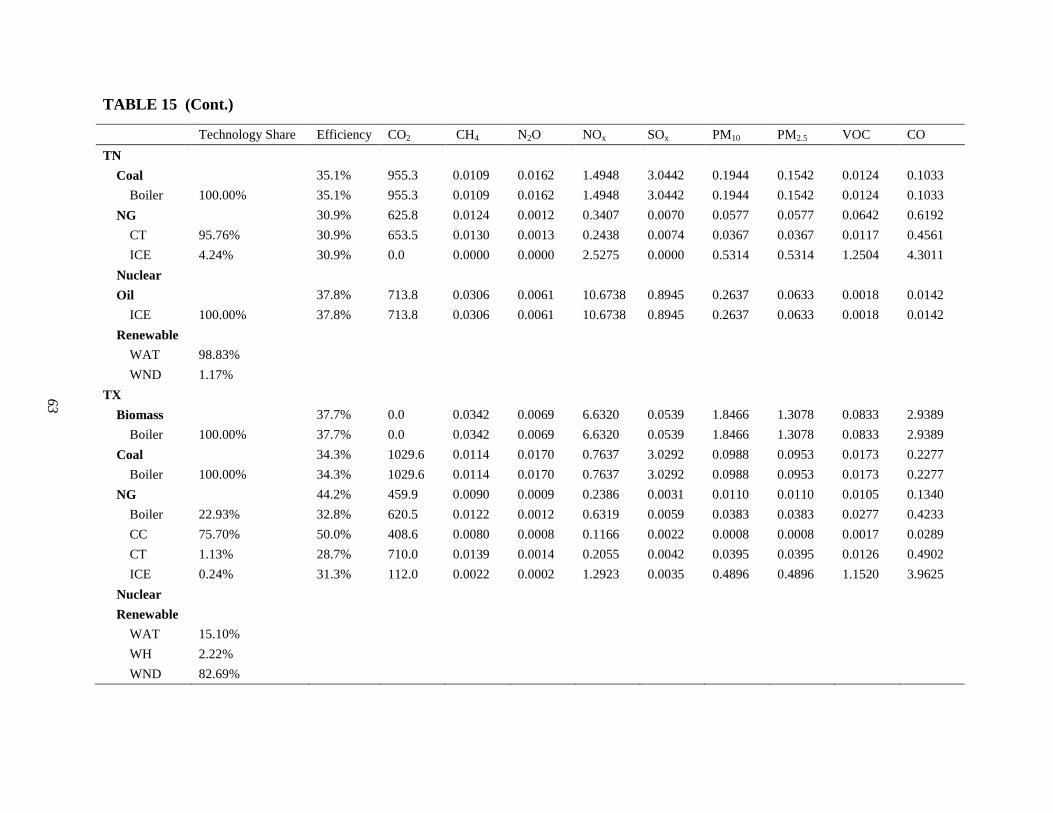
63
TABLE 15 (Cont.)
Technology Share Efficiency CO2 CH4 N2O NOx SOx PM10 PM2.5 VOC CO TN
Coal 35.1% 955.3 0.0109 0.0162 1.4948 3.0442 0.1944 0.1542 0.0124 0.1033 Boiler 100.00% 35.1% 955.3 0.0109 0.0162 1.4948 3.0442 0.1944 0.1542 0.0124 0.1033
NG 30.9% 625.8 0.0124 0.0012 0.3407 0.0070 0.0577 0.0577 0.0642 0.6192 CT 95.76% 30.9% 653.5 0.0130 0.0013 0.2438 0.0074 0.0367 0.0367 0.0117 0.4561 ICE 4.24% 30.9% 0.0 0.0000 0.0000 2.5275 0.0000 0.5314 0.5314 1.2504 4.3011
Nuclear Oil 37.8% 713.8 0.0306 0.0061 10.6738 0.8945 0.2637 0.0633 0.0018 0.0142
ICE 100.00% 37.8% 713.8 0.0306 0.0061 10.6738 0.8945 0.2637 0.0633 0.0018 0.0142 Renewable
WAT 98.83% WND 1.17%
TX Biomass 37.7% 0.0 0.0342 0.0069 6.6320 0.0539 1.8466 1.3078 0.0833 2.9389
Boiler 100.00% 37.7% 0.0 0.0342 0.0069 6.6320 0.0539 1.8466 1.3078 0.0833 2.9389 Coal 34.3% 1029.6 0.0114 0.0170 0.7637 3.0292 0.0988 0.0953 0.0173 0.2277
Boiler 100.00% 34.3% 1029.6 0.0114 0.0170 0.7637 3.0292 0.0988 0.0953 0.0173 0.2277 NG 44.2% 459.9 0.0090 0.0009 0.2386 0.0031 0.0110 0.0110 0.0105 0.1340
Boiler 22.93% 32.8% 620.5 0.0122 0.0012 0.6319 0.0059 0.0383 0.0383 0.0277 0.4233 CC 75.70% 50.0% 408.6 0.0080 0.0008 0.1166 0.0022 0.0008 0.0008 0.0017 0.0289 CT 1.13% 28.7% 710.0 0.0139 0.0014 0.2055 0.0042 0.0395 0.0395 0.0126 0.4902 ICE 0.24% 31.3% 112.0 0.0022 0.0002 1.2923 0.0035 0.4896 0.4896 1.1520 3.9625
Nuclear Renewable
WAT 15.10% WH 2.22% WND 82.69%
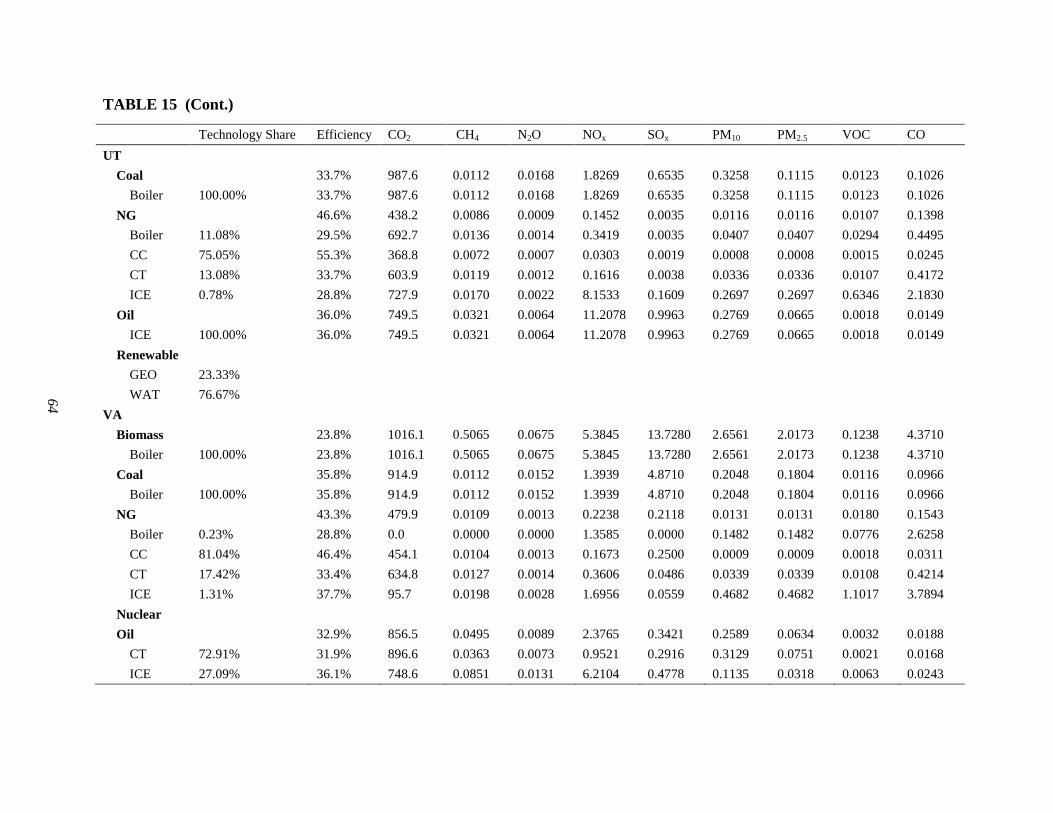
64
TABLE 15 (Cont.)
Technology Share Efficiency CO2 CH4 N2O NOx SOx PM10 PM2.5 VOC CO UT
Coal 33.7% 987.6 0.0112 0.0168 1.8269 0.6535 0.3258 0.1115 0.0123 0.1026 Boiler 100.00% 33.7% 987.6 0.0112 0.0168 1.8269 0.6535 0.3258 0.1115 0.0123 0.1026
NG 46.6% 438.2 0.0086 0.0009 0.1452 0.0035 0.0116 0.0116 0.0107 0.1398 Boiler 11.08% 29.5% 692.7 0.0136 0.0014 0.3419 0.0035 0.0407 0.0407 0.0294 0.4495 CC 75.05% 55.3% 368.8 0.0072 0.0007 0.0303 0.0019 0.0008 0.0008 0.0015 0.0245 CT 13.08% 33.7% 603.9 0.0119 0.0012 0.1616 0.0038 0.0336 0.0336 0.0107 0.4172 ICE 0.78% 28.8% 727.9 0.0170 0.0022 8.1533 0.1609 0.2697 0.2697 0.6346 2.1830
Oil 36.0% 749.5 0.0321 0.0064 11.2078 0.9963 0.2769 0.0665 0.0018 0.0149 ICE 100.00% 36.0% 749.5 0.0321 0.0064 11.2078 0.9963 0.2769 0.0665 0.0018 0.0149
Renewable GEO 23.33% WAT 76.67%
VA Biomass 23.8% 1016.1 0.5065 0.0675 5.3845 13.7280 2.6561 2.0173 0.1238 4.3710
Boiler 100.00% 23.8% 1016.1 0.5065 0.0675 5.3845 13.7280 2.6561 2.0173 0.1238 4.3710 Coal 35.8% 914.9 0.0112 0.0152 1.3939 4.8710 0.2048 0.1804 0.0116 0.0966
Boiler 100.00% 35.8% 914.9 0.0112 0.0152 1.3939 4.8710 0.2048 0.1804 0.0116 0.0966 NG 43.3% 479.9 0.0109 0.0013 0.2238 0.2118 0.0131 0.0131 0.0180 0.1543
Boiler 0.23% 28.8% 0.0 0.0000 0.0000 1.3585 0.0000 0.1482 0.1482 0.0776 2.6258 CC 81.04% 46.4% 454.1 0.0104 0.0013 0.1673 0.2500 0.0009 0.0009 0.0018 0.0311 CT 17.42% 33.4% 634.8 0.0127 0.0014 0.3606 0.0486 0.0339 0.0339 0.0108 0.4214 ICE 1.31% 37.7% 95.7 0.0198 0.0028 1.6956 0.0559 0.4682 0.4682 1.1017 3.7894
Nuclear Oil 32.9% 856.5 0.0495 0.0089 2.3765 0.3421 0.2589 0.0634 0.0032 0.0188
CT 72.91% 31.9% 896.6 0.0363 0.0073 0.9521 0.2916 0.3129 0.0751 0.0021 0.0168 ICE 27.09% 36.1% 748.6 0.0851 0.0131 6.2104 0.4778 0.1135 0.0318 0.0063 0.0243
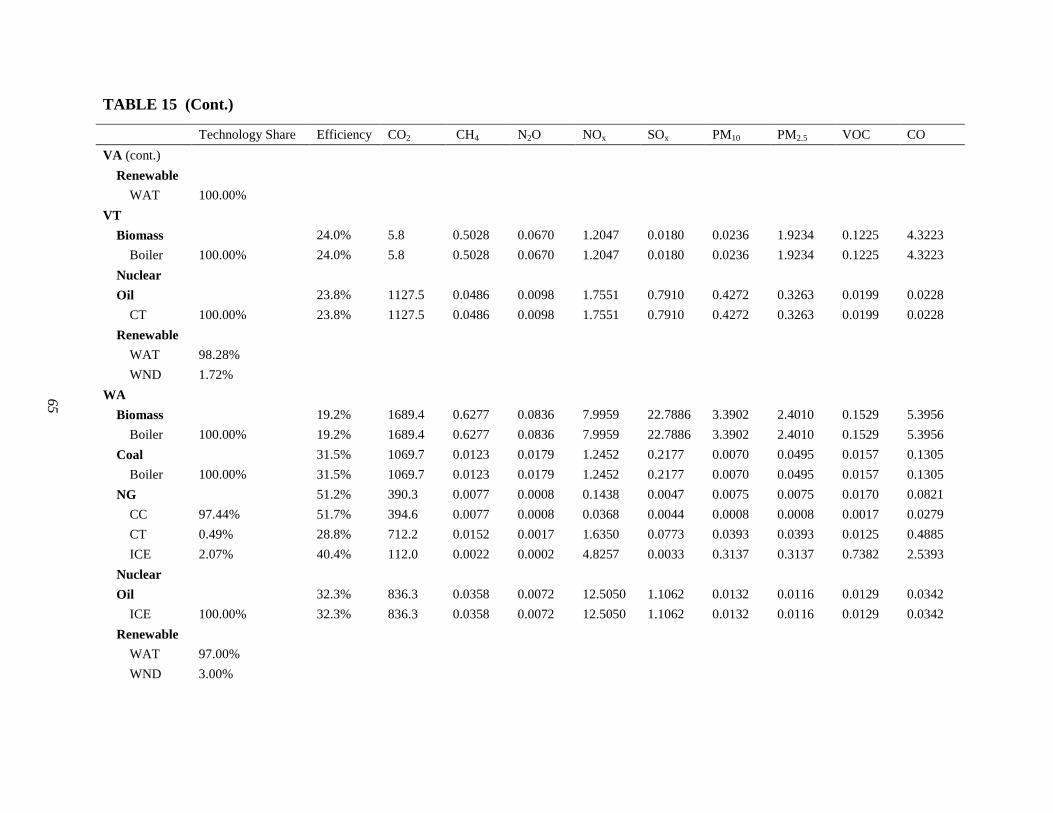
65
TABLE 15 (Cont.)
Technology Share Efficiency CO2 CH4 N2O NOx SOx PM10 PM2.5 VOC CO VA (cont.)
Renewable WAT 100.00%
VT Biomass 24.0% 5.8 0.5028 0.0670 1.2047 0.0180 0.0236 1.9234 0.1225 4.3223
Boiler 100.00% 24.0% 5.8 0.5028 0.0670 1.2047 0.0180 0.0236 1.9234 0.1225 4.3223 Nuclear Oil 23.8% 1127.5 0.0486 0.0098 1.7551 0.7910 0.4272 0.3263 0.0199 0.0228
CT 100.00% 23.8% 1127.5 0.0486 0.0098 1.7551 0.7910 0.4272 0.3263 0.0199 0.0228 Renewable
WAT 98.28% WND 1.72%
WA Biomass 19.2% 1689.4 0.6277 0.0836 7.9959 22.7886 3.3902 2.4010 0.1529 5.3956
Boiler 100.00% 19.2% 1689.4 0.6277 0.0836 7.9959 22.7886 3.3902 2.4010 0.1529 5.3956 Coal 31.5% 1069.7 0.0123 0.0179 1.2452 0.2177 0.0070 0.0495 0.0157 0.1305
Boiler 100.00% 31.5% 1069.7 0.0123 0.0179 1.2452 0.2177 0.0070 0.0495 0.0157 0.1305 NG 51.2% 390.3 0.0077 0.0008 0.1438 0.0047 0.0075 0.0075 0.0170 0.0821
CC 97.44% 51.7% 394.6 0.0077 0.0008 0.0368 0.0044 0.0008 0.0008 0.0017 0.0279 CT 0.49% 28.8% 712.2 0.0152 0.0017 1.6350 0.0773 0.0393 0.0393 0.0125 0.4885 ICE 2.07% 40.4% 112.0 0.0022 0.0002 4.8257 0.0033 0.3137 0.3137 0.7382 2.5393
Nuclear Oil 32.3% 836.3 0.0358 0.0072 12.5050 1.1062 0.0132 0.0116 0.0129 0.0342
ICE 100.00% 32.3% 836.3 0.0358 0.0072 12.5050 1.1062 0.0132 0.0116 0.0129 0.0342 Renewable
WAT 97.00% WND 3.00%
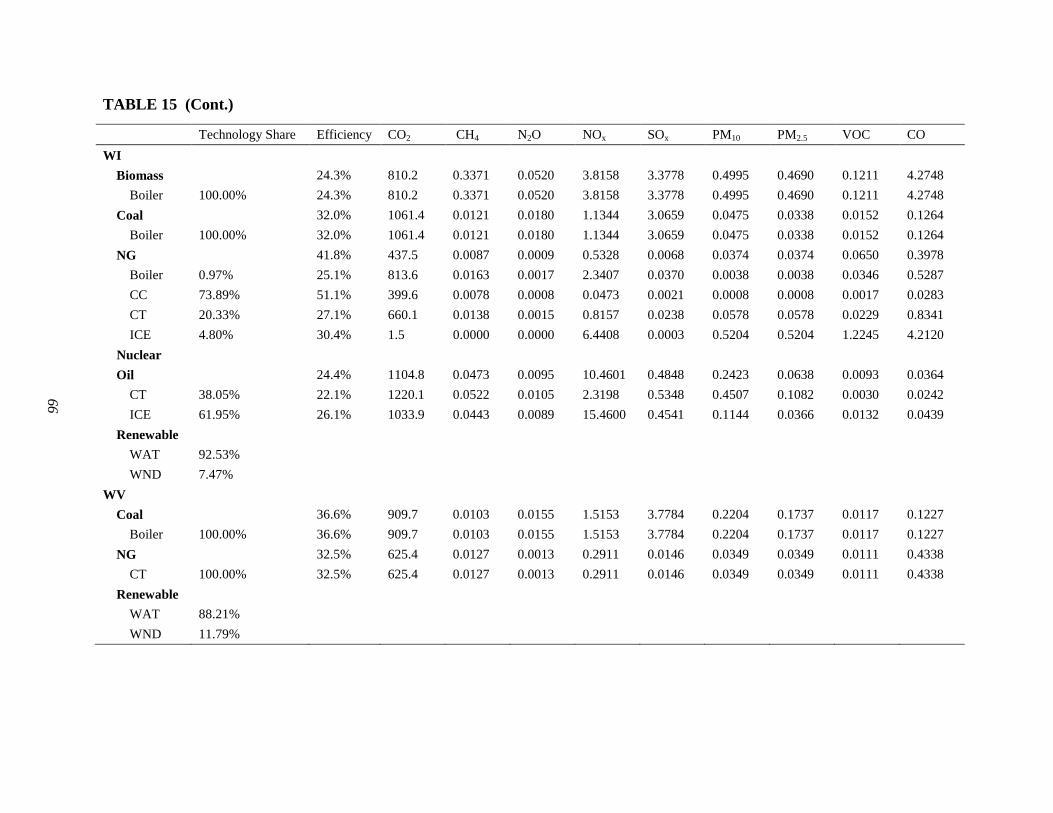
66
TABLE 15 (Cont.)
Technology Share Efficiency CO2 CH4 N2O NOx SOx PM10 PM2.5 VOC CO WI
Biomass 24.3% 810.2 0.3371 0.0520 3.8158 3.3778 0.4995 0.4690 0.1211 4.2748 Boiler 100.00% 24.3% 810.2 0.3371 0.0520 3.8158 3.3778 0.4995 0.4690 0.1211 4.2748
Coal 32.0% 1061.4 0.0121 0.0180 1.1344 3.0659 0.0475 0.0338 0.0152 0.1264 Boiler 100.00% 32.0% 1061.4 0.0121 0.0180 1.1344 3.0659 0.0475 0.0338 0.0152 0.1264
NG 41.8% 437.5 0.0087 0.0009 0.5328 0.0068 0.0374 0.0374 0.0650 0.3978 Boiler 0.97% 25.1% 813.6 0.0163 0.0017 2.3407 0.0370 0.0038 0.0038 0.0346 0.5287 CC 73.89% 51.1% 399.6 0.0078 0.0008 0.0473 0.0021 0.0008 0.0008 0.0017 0.0283 CT 20.33% 27.1% 660.1 0.0138 0.0015 0.8157 0.0238 0.0578 0.0578 0.0229 0.8341 ICE 4.80% 30.4% 1.5 0.0000 0.0000 6.4408 0.0003 0.5204 0.5204 1.2245 4.2120
Nuclear Oil 24.4% 1104.8 0.0473 0.0095 10.4601 0.4848 0.2423 0.0638 0.0093 0.0364
CT 38.05% 22.1% 1220.1 0.0522 0.0105 2.3198 0.5348 0.4507 0.1082 0.0030 0.0242 ICE 61.95% 26.1% 1033.9 0.0443 0.0089 15.4600 0.4541 0.1144 0.0366 0.0132 0.0439
Renewable WAT 92.53% WND 7.47%
WV Coal 36.6% 909.7 0.0103 0.0155 1.5153 3.7784 0.2204 0.1737 0.0117 0.1227
Boiler 100.00% 36.6% 909.7 0.0103 0.0155 1.5153 3.7784 0.2204 0.1737 0.0117 0.1227 NG 32.5% 625.4 0.0127 0.0013 0.2911 0.0146 0.0349 0.0349 0.0111 0.4338
CT 100.00% 32.5% 625.4 0.0127 0.0013 0.2911 0.0146 0.0349 0.0349 0.0111 0.4338 Renewable
WAT 88.21% WND 11.79%
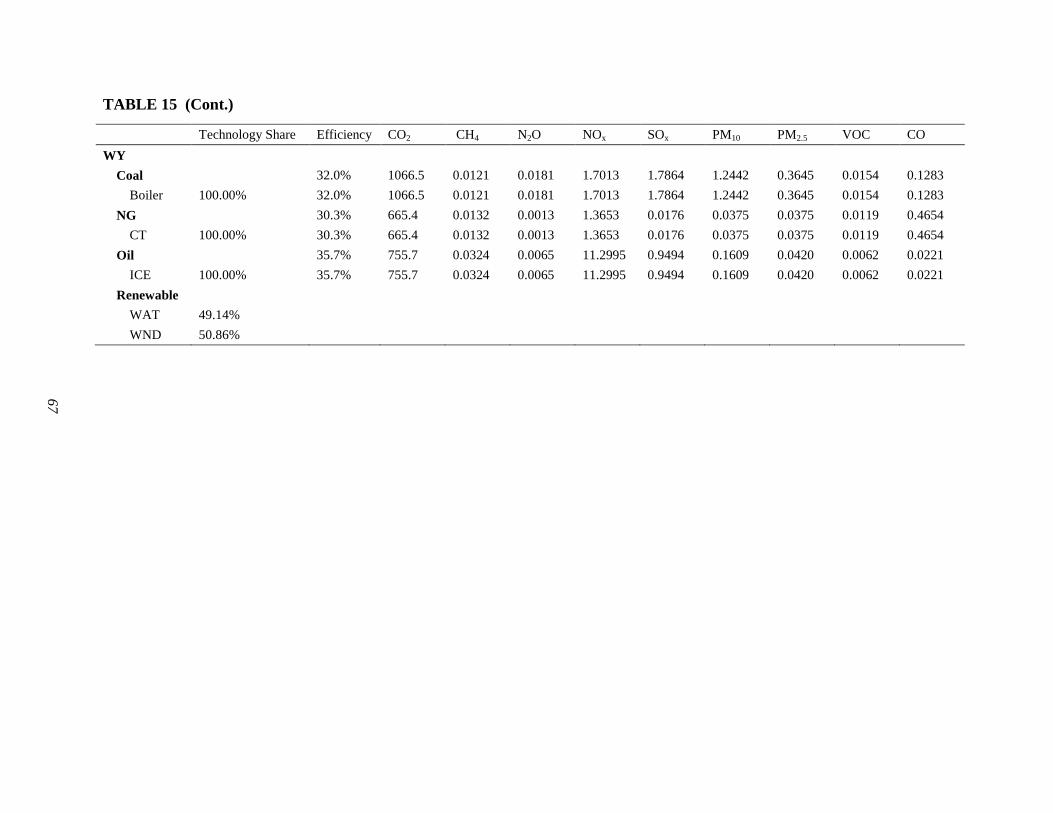
67
TABLE 15 (Cont.)
Technology Share Efficiency CO2 CH4 N2O NOx SOx PM10 PM2.5 VOC CO WY
Coal 32.0% 1066.5 0.0121 0.0181 1.7013 1.7864 1.2442 0.3645 0.0154 0.1283 Boiler 100.00% 32.0% 1066.5 0.0121 0.0181 1.7013 1.7864 1.2442 0.3645 0.0154 0.1283
NG 30.3% 665.4 0.0132 0.0013 1.3653 0.0176 0.0375 0.0375 0.0119 0.4654 CT 100.00% 30.3% 665.4 0.0132 0.0013 1.3653 0.0176 0.0375 0.0375 0.0119 0.4654
Oil 35.7% 755.7 0.0324 0.0065 11.2995 0.9494 0.1609 0.0420 0.0062 0.0221 ICE 100.00% 35.7% 755.7 0.0324 0.0065 11.2995 0.9494 0.1609 0.0420 0.0062 0.0221
Renewable WAT 49.14% WND 50.86%
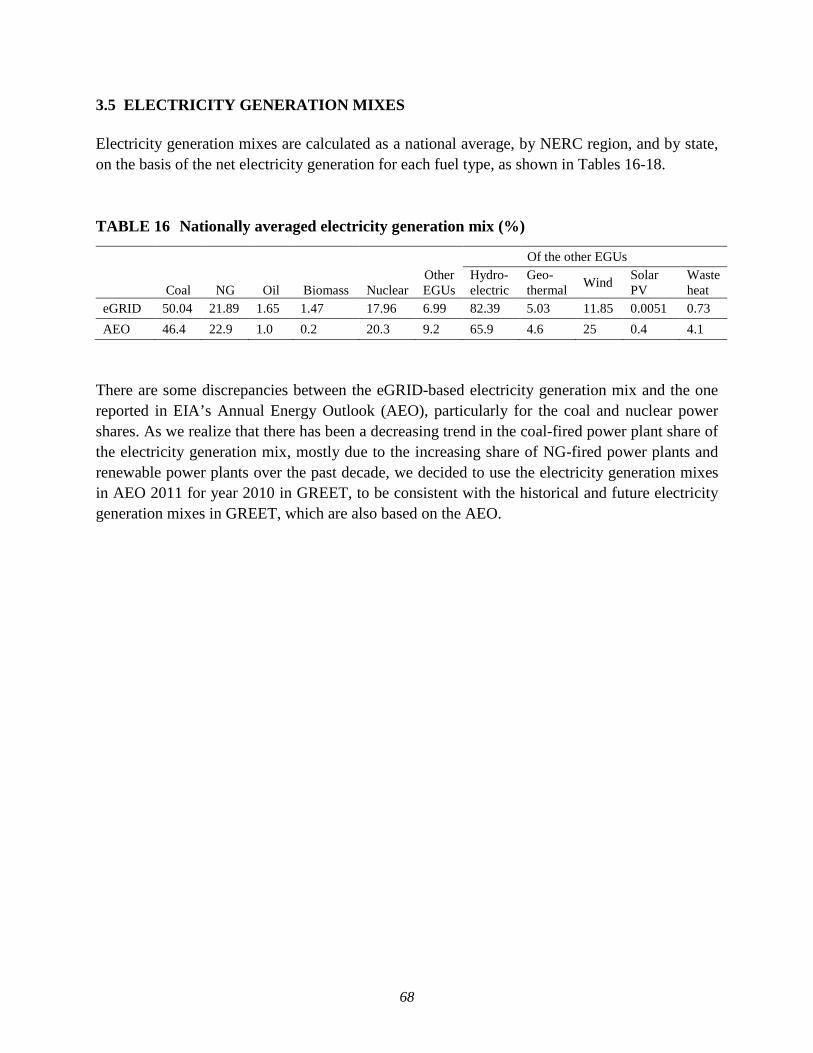
68
3.5 ELECTRICITY GENERATION MIXES Electricity generation mixes are calculated as a national average, by NERC region, and by state, on the basis of the net electricity generation for each fuel type, as shown in Tables 16-18. TABLE 16 Nationally averaged electricity generation mix (%)
Coal NG Oil Biomass Nuclear Other EGUs
Of the other EGUs
Hydro-electric
Geo-thermal Wind Solar
PV Waste heat
eGRID 50.04 21.89 1.65 1.47 17.96 6.99 82.39 5.03 11.85 0.0051 0.73 AEO 46.4 22.9 1.0 0.2 20.3 9.2 65.9 4.6 25 0.4 4.1
There are some discrepancies between the eGRID-based electricity generation mix and the one reported in EIA’s Annual Energy Outlook (AEO), particularly for the coal and nuclear power shares. As we realize that there has been a decreasing trend in the coal-fired power plant share of the electricity generation mix, mostly due to the increasing share of NG-fired power plants and renewable power plants over the past decade, we decided to use the electricity generation mixes in AEO 2011 for year 2010 in GREET, to be consistent with the historical and future electricity generation mixes in GREET, which are also based on the AEO.
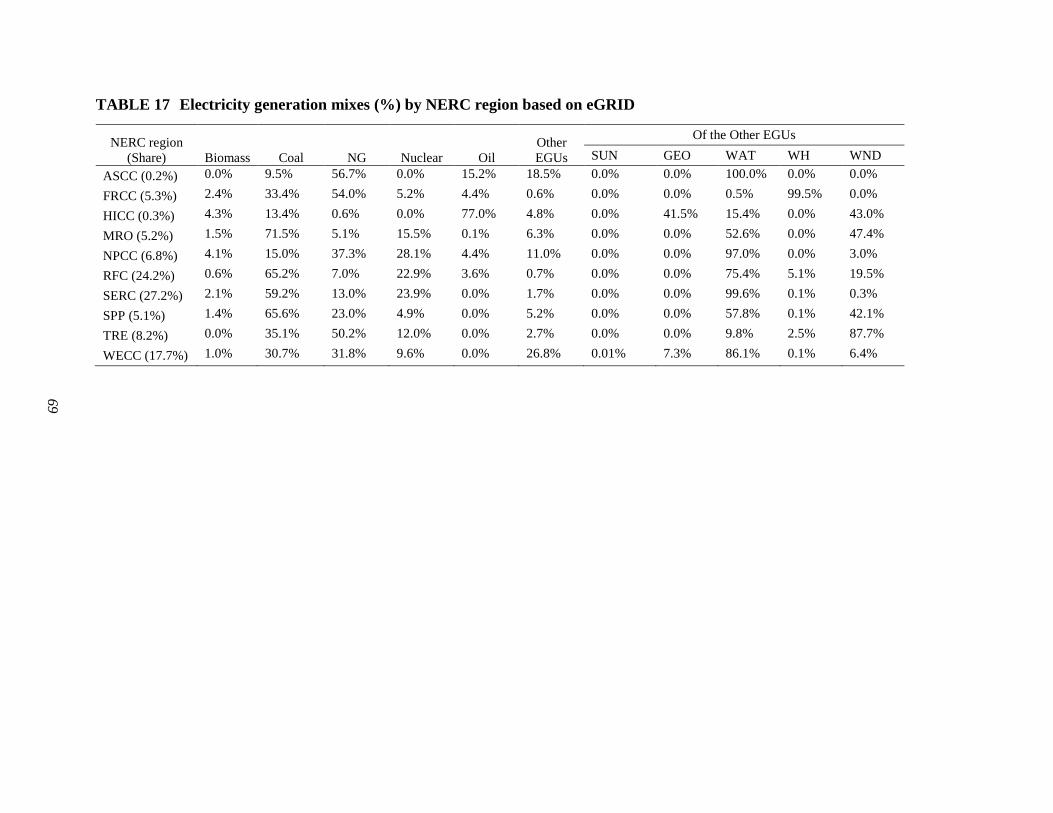
69
TABLE 17 Electricity generation mixes (%) by NERC region based on eGRID
NERC region (Share) Biomass Coal NG Nuclear Oil
Other EGUs
Of the Other EGUs SUN GEO WAT WH WND
ASCC (0.2%) 0.0% 9.5% 56.7% 0.0% 15.2% 18.5% 0.0% 0.0% 100.0% 0.0% 0.0%
FRCC (5.3%) 2.4% 33.4% 54.0% 5.2% 4.4% 0.6% 0.0% 0.0% 0.5% 99.5% 0.0%
HICC (0.3%) 4.3% 13.4% 0.6% 0.0% 77.0% 4.8% 0.0% 41.5% 15.4% 0.0% 43.0%
MRO (5.2%) 1.5% 71.5% 5.1% 15.5% 0.1% 6.3% 0.0% 0.0% 52.6% 0.0% 47.4%
NPCC (6.8%) 4.1% 15.0% 37.3% 28.1% 4.4% 11.0% 0.0% 0.0% 97.0% 0.0% 3.0%
RFC (24.2%) 0.6% 65.2% 7.0% 22.9% 3.6% 0.7% 0.0% 0.0% 75.4% 5.1% 19.5%
SERC (27.2%) 2.1% 59.2% 13.0% 23.9% 0.0% 1.7% 0.0% 0.0% 99.6% 0.1% 0.3%
SPP (5.1%) 1.4% 65.6% 23.0% 4.9% 0.0% 5.2% 0.0% 0.0% 57.8% 0.1% 42.1%
TRE (8.2%) 0.0% 35.1% 50.2% 12.0% 0.0% 2.7% 0.0% 0.0% 9.8% 2.5% 87.7%
WECC (17.7%) 1.0% 30.7% 31.8% 9.6% 0.0% 26.8% 0.01% 7.3% 86.1% 0.1% 6.4%
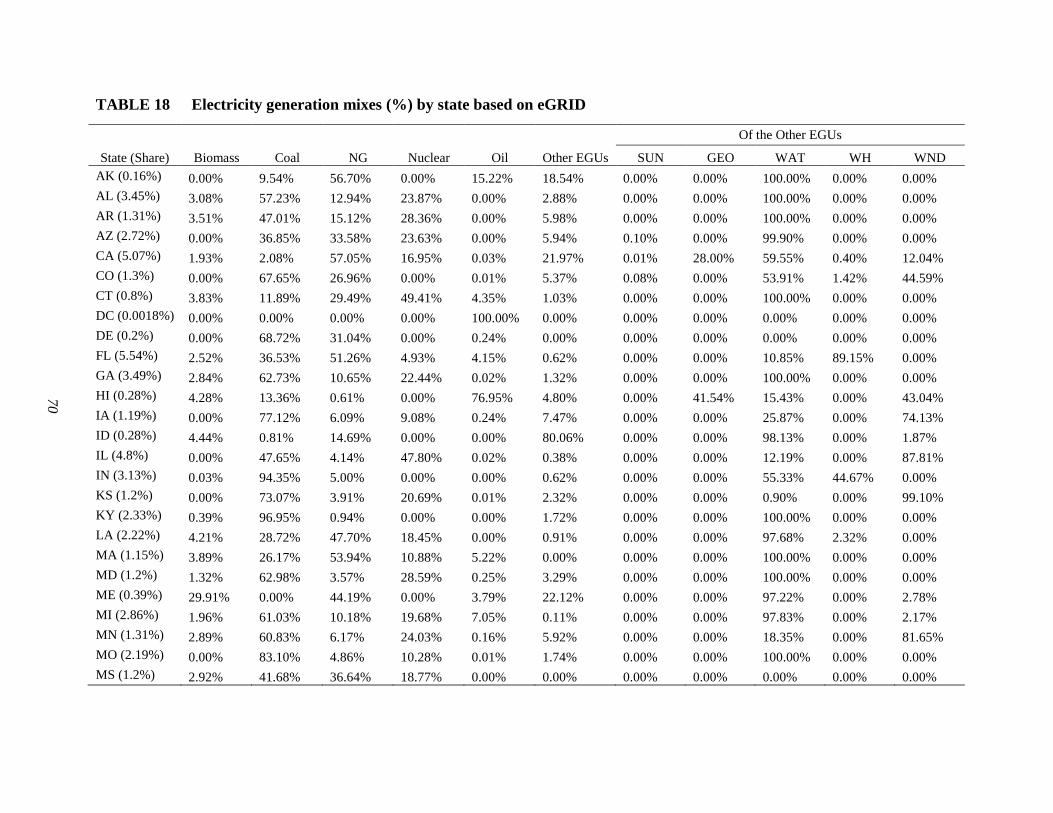
70
TABLE 18 Electricity generation mixes (%) by state based on eGRID
State (Share) Biomass Coal NG Nuclear Oil Other EGUs
Of the Other EGUs
SUN GEO WAT WH WND AK (0.16%) 0.00% 9.54% 56.70% 0.00% 15.22% 18.54% 0.00% 0.00% 100.00% 0.00% 0.00% AL (3.45%) 3.08% 57.23% 12.94% 23.87% 0.00% 2.88% 0.00% 0.00% 100.00% 0.00% 0.00% AR (1.31%) 3.51% 47.01% 15.12% 28.36% 0.00% 5.98% 0.00% 0.00% 100.00% 0.00% 0.00% AZ (2.72%) 0.00% 36.85% 33.58% 23.63% 0.00% 5.94% 0.10% 0.00% 99.90% 0.00% 0.00% CA (5.07%) 1.93% 2.08% 57.05% 16.95% 0.03% 21.97% 0.01% 28.00% 59.55% 0.40% 12.04% CO (1.3%) 0.00% 67.65% 26.96% 0.00% 0.01% 5.37% 0.08% 0.00% 53.91% 1.42% 44.59% CT (0.8%) 3.83% 11.89% 29.49% 49.41% 4.35% 1.03% 0.00% 0.00% 100.00% 0.00% 0.00% DC (0.0018%) 0.00% 0.00% 0.00% 0.00% 100.00% 0.00% 0.00% 0.00% 0.00% 0.00% 0.00% DE (0.2%) 0.00% 68.72% 31.04% 0.00% 0.24% 0.00% 0.00% 0.00% 0.00% 0.00% 0.00% FL (5.54%) 2.52% 36.53% 51.26% 4.93% 4.15% 0.62% 0.00% 0.00% 10.85% 89.15% 0.00% GA (3.49%) 2.84% 62.73% 10.65% 22.44% 0.02% 1.32% 0.00% 0.00% 100.00% 0.00% 0.00% HI (0.28%) 4.28% 13.36% 0.61% 0.00% 76.95% 4.80% 0.00% 41.54% 15.43% 0.00% 43.04% IA (1.19%) 0.00% 77.12% 6.09% 9.08% 0.24% 7.47% 0.00% 0.00% 25.87% 0.00% 74.13% ID (0.28%) 4.44% 0.81% 14.69% 0.00% 0.00% 80.06% 0.00% 0.00% 98.13% 0.00% 1.87% IL (4.8%) 0.00% 47.65% 4.14% 47.80% 0.02% 0.38% 0.00% 0.00% 12.19% 0.00% 87.81% IN (3.13%) 0.03% 94.35% 5.00% 0.00% 0.00% 0.62% 0.00% 0.00% 55.33% 44.67% 0.00% KS (1.2%) 0.00% 73.07% 3.91% 20.69% 0.01% 2.32% 0.00% 0.00% 0.90% 0.00% 99.10% KY (2.33%) 0.39% 96.95% 0.94% 0.00% 0.00% 1.72% 0.00% 0.00% 100.00% 0.00% 0.00% LA (2.22%) 4.21% 28.72% 47.70% 18.45% 0.00% 0.91% 0.00% 0.00% 97.68% 2.32% 0.00% MA (1.15%) 3.89% 26.17% 53.94% 10.88% 5.22% 0.00% 0.00% 0.00% 100.00% 0.00% 0.00% MD (1.2%) 1.32% 62.98% 3.57% 28.59% 0.25% 3.29% 0.00% 0.00% 100.00% 0.00% 0.00% ME (0.39%) 29.91% 0.00% 44.19% 0.00% 3.79% 22.12% 0.00% 0.00% 97.22% 0.00% 2.78% MI (2.86%) 1.96% 61.03% 10.18% 19.68% 7.05% 0.11% 0.00% 0.00% 97.83% 0.00% 2.17% MN (1.31%) 2.89% 60.83% 6.17% 24.03% 0.16% 5.92% 0.00% 0.00% 18.35% 0.00% 81.65% MO (2.19%) 0.00% 83.10% 4.86% 10.28% 0.01% 1.74% 0.00% 0.00% 100.00% 0.00% 0.00% MS (1.2%) 2.92% 41.68% 36.64% 18.77% 0.00% 0.00% 0.00% 0.00% 0.00% 0.00% 0.00%
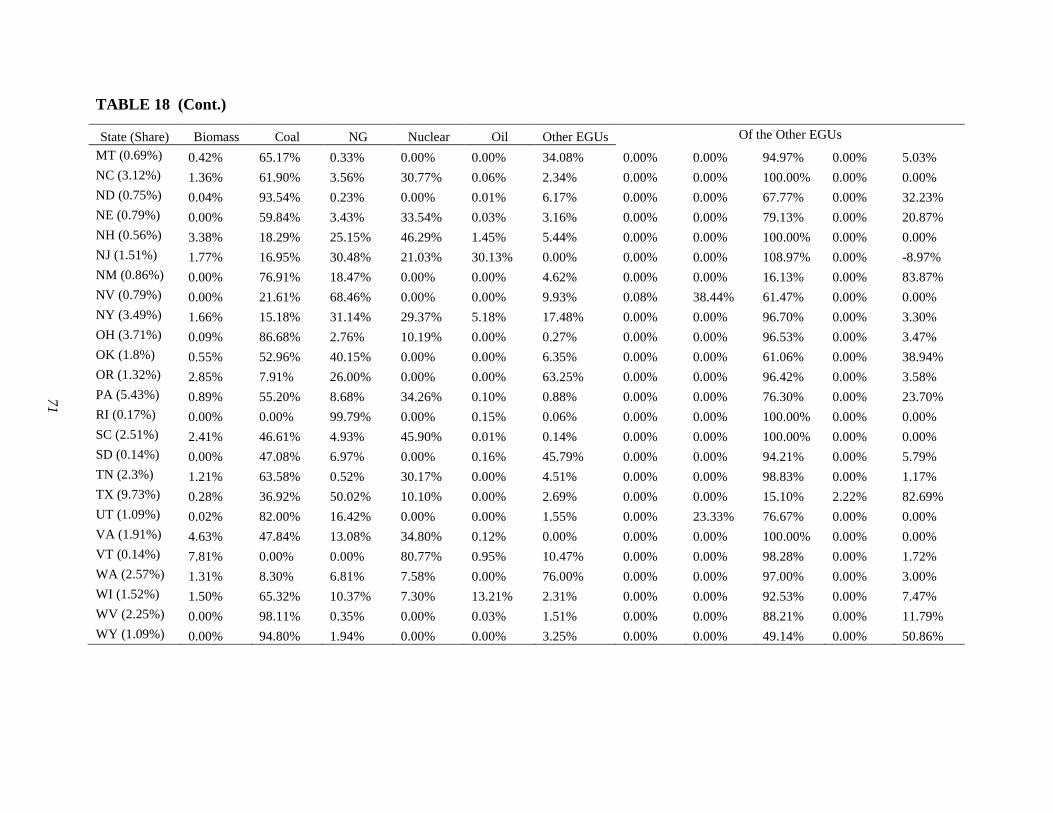
71
TABLE 18 (Cont.)
State (Share) Biomass Coal NG Nuclear Oil Other EGUs Of the Other EGUs MT (0.69%) 0.42% 65.17% 0.33% 0.00% 0.00% 34.08% 0.00% 0.00% 94.97% 0.00% 5.03% NC (3.12%) 1.36% 61.90% 3.56% 30.77% 0.06% 2.34% 0.00% 0.00% 100.00% 0.00% 0.00% ND (0.75%) 0.04% 93.54% 0.23% 0.00% 0.01% 6.17% 0.00% 0.00% 67.77% 0.00% 32.23% NE (0.79%) 0.00% 59.84% 3.43% 33.54% 0.03% 3.16% 0.00% 0.00% 79.13% 0.00% 20.87% NH (0.56%) 3.38% 18.29% 25.15% 46.29% 1.45% 5.44% 0.00% 0.00% 100.00% 0.00% 0.00% NJ (1.51%) 1.77% 16.95% 30.48% 21.03% 30.13% 0.00% 0.00% 0.00% 108.97% 0.00% -8.97% NM (0.86%) 0.00% 76.91% 18.47% 0.00% 0.00% 4.62% 0.00% 0.00% 16.13% 0.00% 83.87% NV (0.79%) 0.00% 21.61% 68.46% 0.00% 0.00% 9.93% 0.08% 38.44% 61.47% 0.00% 0.00% NY (3.49%) 1.66% 15.18% 31.14% 29.37% 5.18% 17.48% 0.00% 0.00% 96.70% 0.00% 3.30% OH (3.71%) 0.09% 86.68% 2.76% 10.19% 0.00% 0.27% 0.00% 0.00% 96.53% 0.00% 3.47% OK (1.8%) 0.55% 52.96% 40.15% 0.00% 0.00% 6.35% 0.00% 0.00% 61.06% 0.00% 38.94% OR (1.32%) 2.85% 7.91% 26.00% 0.00% 0.00% 63.25% 0.00% 0.00% 96.42% 0.00% 3.58% PA (5.43%) 0.89% 55.20% 8.68% 34.26% 0.10% 0.88% 0.00% 0.00% 76.30% 0.00% 23.70% RI (0.17%) 0.00% 0.00% 99.79% 0.00% 0.15% 0.06% 0.00% 0.00% 100.00% 0.00% 0.00% SC (2.51%) 2.41% 46.61% 4.93% 45.90% 0.01% 0.14% 0.00% 0.00% 100.00% 0.00% 0.00% SD (0.14%) 0.00% 47.08% 6.97% 0.00% 0.16% 45.79% 0.00% 0.00% 94.21% 0.00% 5.79% TN (2.3%) 1.21% 63.58% 0.52% 30.17% 0.00% 4.51% 0.00% 0.00% 98.83% 0.00% 1.17% TX (9.73%) 0.28% 36.92% 50.02% 10.10% 0.00% 2.69% 0.00% 0.00% 15.10% 2.22% 82.69% UT (1.09%) 0.02% 82.00% 16.42% 0.00% 0.00% 1.55% 0.00% 23.33% 76.67% 0.00% 0.00% VA (1.91%) 4.63% 47.84% 13.08% 34.80% 0.12% 0.00% 0.00% 0.00% 100.00% 0.00% 0.00% VT (0.14%) 7.81% 0.00% 0.00% 80.77% 0.95% 10.47% 0.00% 0.00% 98.28% 0.00% 1.72% WA (2.57%) 1.31% 8.30% 6.81% 7.58% 0.00% 76.00% 0.00% 0.00% 97.00% 0.00% 3.00% WI (1.52%) 1.50% 65.32% 10.37% 7.30% 13.21% 2.31% 0.00% 0.00% 92.53% 0.00% 7.47% WV (2.25%) 0.00% 98.11% 0.35% 0.00% 0.03% 1.51% 0.00% 0.00% 88.21% 0.00% 11.79% WY (1.09%) 0.00% 94.80% 1.94% 0.00% 0.00% 3.25% 0.00% 0.00% 49.14% 0.00% 50.86%
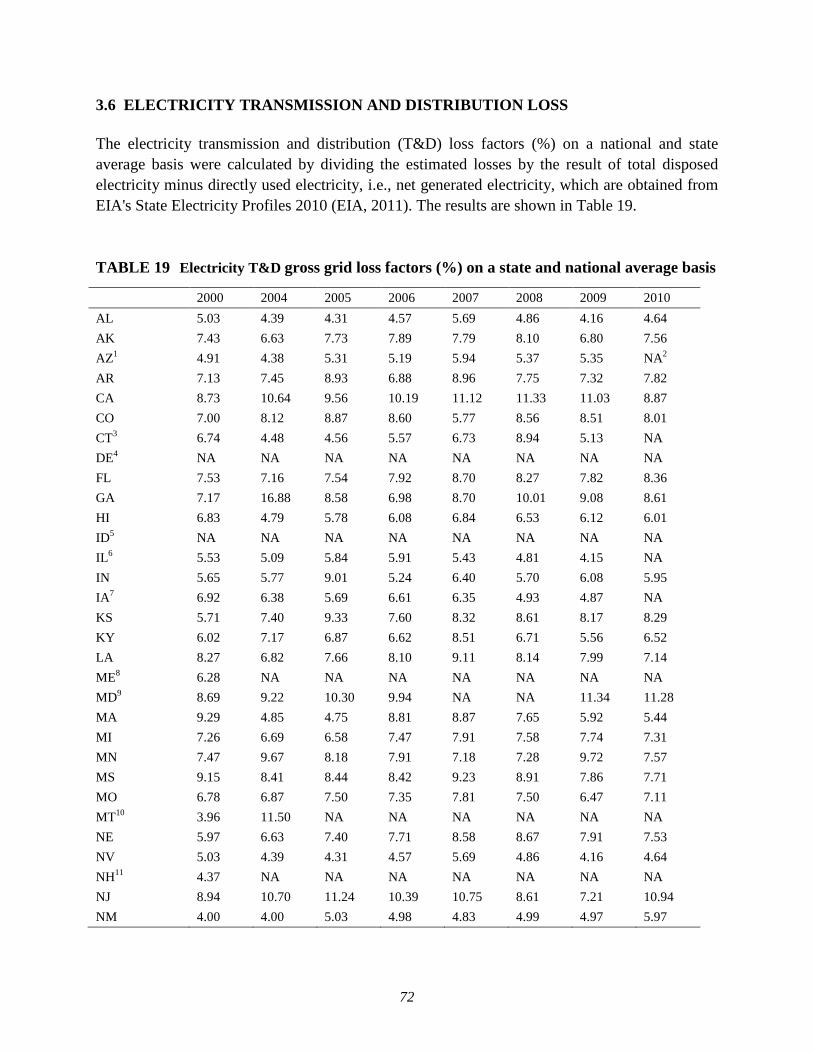
72
3.6 ELECTRICITY TRANSMISSION AND DISTRIBUTION LOSS The electricity transmission and distribution (T&D) loss factors (%) on a national and state average basis were calculated by dividing the estimated losses by the result of total disposed electricity minus directly used electricity, i.e., net generated electricity, which are obtained from EIA's State Electricity Profiles 2010 (EIA, 2011). The results are shown in Table 19. TABLE 19 Electricity T&D gross grid loss factors (%) on a state and national average basis
2000 2004 2005 2006 2007 2008 2009 2010 AL 5.03 4.39 4.31 4.57 5.69 4.86 4.16 4.64 AK 7.43 6.63 7.73 7.89 7.79 8.10 6.80 7.56 AZ1 4.91 4.38 5.31 5.19 5.94 5.37 5.35 NA2 AR 7.13 7.45 8.93 6.88 8.96 7.75 7.32 7.82 CA 8.73 10.64 9.56 10.19 11.12 11.33 11.03 8.87 CO 7.00 8.12 8.87 8.60 5.77 8.56 8.51 8.01 CT3 6.74 4.48 4.56 5.57 6.73 8.94 5.13 NA DE4 NA NA NA NA NA NA NA NA FL 7.53 7.16 7.54 7.92 8.70 8.27 7.82 8.36 GA 7.17 16.88 8.58 6.98 8.70 10.01 9.08 8.61 HI 6.83 4.79 5.78 6.08 6.84 6.53 6.12 6.01 ID5 NA NA NA NA NA NA NA NA IL6 5.53 5.09 5.84 5.91 5.43 4.81 4.15 NA IN 5.65 5.77 9.01 5.24 6.40 5.70 6.08 5.95 IA7 6.92 6.38 5.69 6.61 6.35 4.93 4.87 NA KS 5.71 7.40 9.33 7.60 8.32 8.61 8.17 8.29 KY 6.02 7.17 6.87 6.62 8.51 6.71 5.56 6.52 LA 8.27 6.82 7.66 8.10 9.11 8.14 7.99 7.14 ME8 6.28 NA NA NA NA NA NA NA MD9 8.69 9.22 10.30 9.94 NA NA 11.34 11.28 MA 9.29 4.85 4.75 8.81 8.87 7.65 5.92 5.44 MI 7.26 6.69 6.58 7.47 7.91 7.58 7.74 7.31 MN 7.47 9.67 8.18 7.91 7.18 7.28 9.72 7.57 MS 9.15 8.41 8.44 8.42 9.23 8.91 7.86 7.71 MO 6.78 6.87 7.50 7.35 7.81 7.50 6.47 7.11 MT10 3.96 11.50 NA NA NA NA NA NA NE 5.97 6.63 7.40 7.71 8.58 8.67 7.91 7.53 NV 5.03 4.39 4.31 4.57 5.69 4.86 4.16 4.64 NH11 4.37 NA NA NA NA NA NA NA NJ 8.94 10.70 11.24 10.39 10.75 8.61 7.21 10.94 NM 4.00 4.00 5.03 4.98 4.83 4.99 4.97 5.97
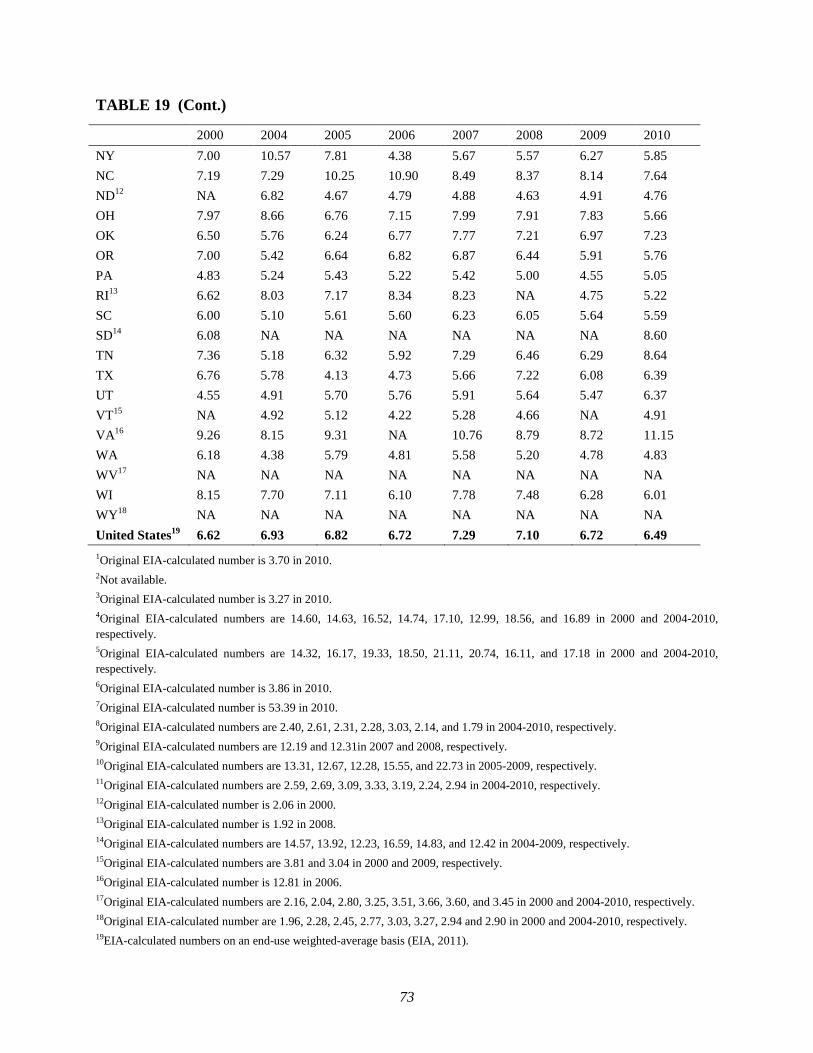
73
TABLE 19 (Cont.)
2000 2004 2005 2006 2007 2008 2009 2010 NY 7.00 10.57 7.81 4.38 5.67 5.57 6.27 5.85 NC 7.19 7.29 10.25 10.90 8.49 8.37 8.14 7.64 ND12 NA 6.82 4.67 4.79 4.88 4.63 4.91 4.76 OH 7.97 8.66 6.76 7.15 7.99 7.91 7.83 5.66 OK 6.50 5.76 6.24 6.77 7.77 7.21 6.97 7.23 OR 7.00 5.42 6.64 6.82 6.87 6.44 5.91 5.76 PA 4.83 5.24 5.43 5.22 5.42 5.00 4.55 5.05 RI13 6.62 8.03 7.17 8.34 8.23 NA 4.75 5.22 SC 6.00 5.10 5.61 5.60 6.23 6.05 5.64 5.59 SD14 6.08 NA NA NA NA NA NA 8.60 TN 7.36 5.18 6.32 5.92 7.29 6.46 6.29 8.64 TX 6.76 5.78 4.13 4.73 5.66 7.22 6.08 6.39 UT 4.55 4.91 5.70 5.76 5.91 5.64 5.47 6.37 VT15 NA 4.92 5.12 4.22 5.28 4.66 NA 4.91 VA16 9.26 8.15 9.31 NA 10.76 8.79 8.72 11.15 WA 6.18 4.38 5.79 4.81 5.58 5.20 4.78 4.83 WV17 NA NA NA NA NA NA NA NA WI 8.15 7.70 7.11 6.10 7.78 7.48 6.28 6.01 WY18 NA NA NA NA NA NA NA NA United States19 6.62 6.93 6.82 6.72 7.29 7.10 6.72 6.49 1Original EIA-calculated number is 3.70 in 2010. 2Not available. 3Original EIA-calculated number is 3.27 in 2010. 4Original EIA-calculated numbers are 14.60, 14.63, 16.52, 14.74, 17.10, 12.99, 18.56, and 16.89 in 2000 and 2004-2010, respectively. 5Original EIA-calculated numbers are 14.32, 16.17, 19.33, 18.50, 21.11, 20.74, 16.11, and 17.18 in 2000 and 2004-2010, respectively. 6Original EIA-calculated number is 3.86 in 2010. 7Original EIA-calculated number is 53.39 in 2010. 8Original EIA-calculated numbers are 2.40, 2.61, 2.31, 2.28, 3.03, 2.14, and 1.79 in 2004-2010, respectively. 9Original EIA-calculated numbers are 12.19 and 12.31in 2007 and 2008, respectively. 10Original EIA-calculated numbers are 13.31, 12.67, 12.28, 15.55, and 22.73 in 2005-2009, respectively. 11Original EIA-calculated numbers are 2.59, 2.69, 3.09, 3.33, 3.19, 2.24, 2.94 in 2004-2010, respectively. 12Original EIA-calculated number is 2.06 in 2000. 13Original EIA-calculated number is 1.92 in 2008. 14Original EIA-calculated numbers are 14.57, 13.92, 12.23, 16.59, 14.83, and 12.42 in 2004-2009, respectively. 15Original EIA-calculated numbers are 3.81 and 3.04 in 2000 and 2009, respectively. 16Original EIA-calculated number is 12.81 in 2006. 17Original EIA-calculated numbers are 2.16, 2.04, 2.80, 3.25, 3.51, 3.66, 3.60, and 3.45 in 2000 and 2004-2010, respectively. 18Original EIA-calculated number are 1.96, 2.28, 2.45, 2.77, 3.03, 3.27, 2.94 and 2.90 in 2000 and 2004-2010, respectively. 19EIA-calculated numbers on an end-use weighted-average basis (EIA, 2011).
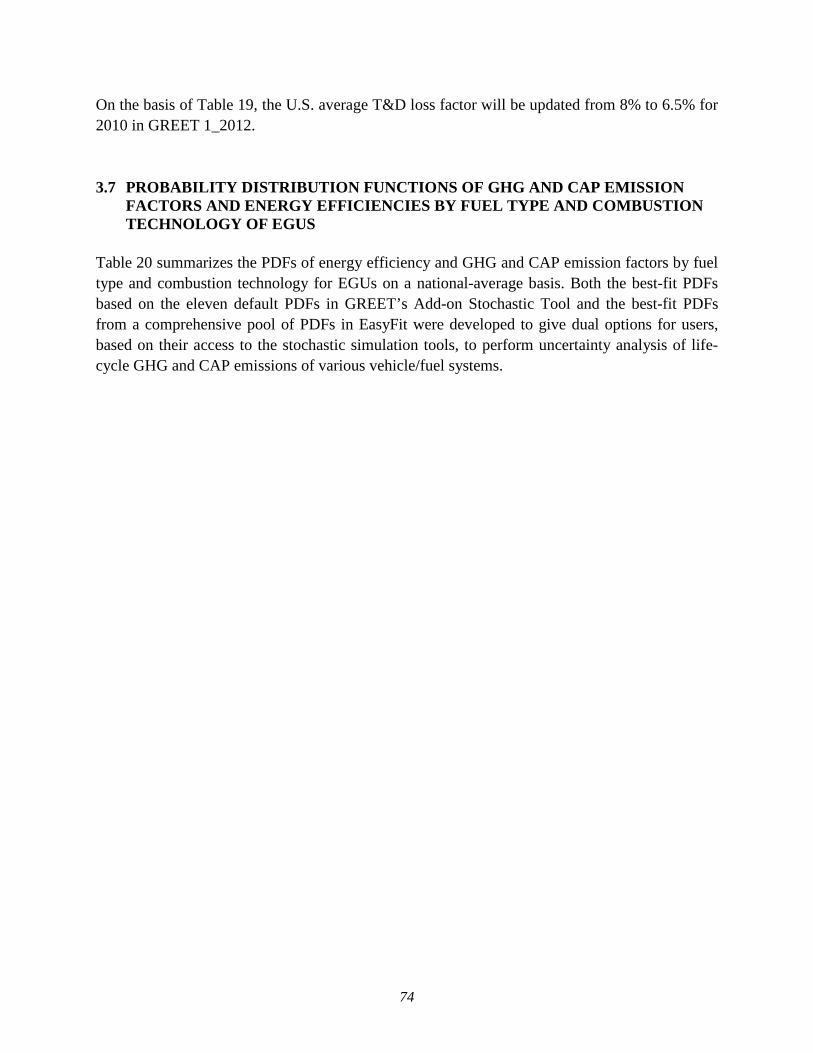
74
On the basis of Table 19, the U.S. average T&D loss factor will be updated from 8% to 6.5% for 2010 in GREET 1_2012. 3.7 PROBABILITY DISTRIBUTION FUNCTIONS OF GHG AND CAP EMISSION
FACTORS AND ENERGY EFFICIENCIES BY FUEL TYPE AND COMBUSTION TECHNOLOGY OF EGUS
Table 20 summarizes the PDFs of energy efficiency and GHG and CAP emission factors by fuel type and combustion technology for EGUs on a national-average basis. Both the best-fit PDFs based on the eleven default PDFs in GREET’s Add-on Stochastic Tool and the best-fit PDFs from a comprehensive pool of PDFs in EasyFit were developed to give dual options for users, based on their access to the stochastic simulation tools, to perform uncertainty analysis of life-cycle GHG and CAP emissions of various vehicle/fuel systems.
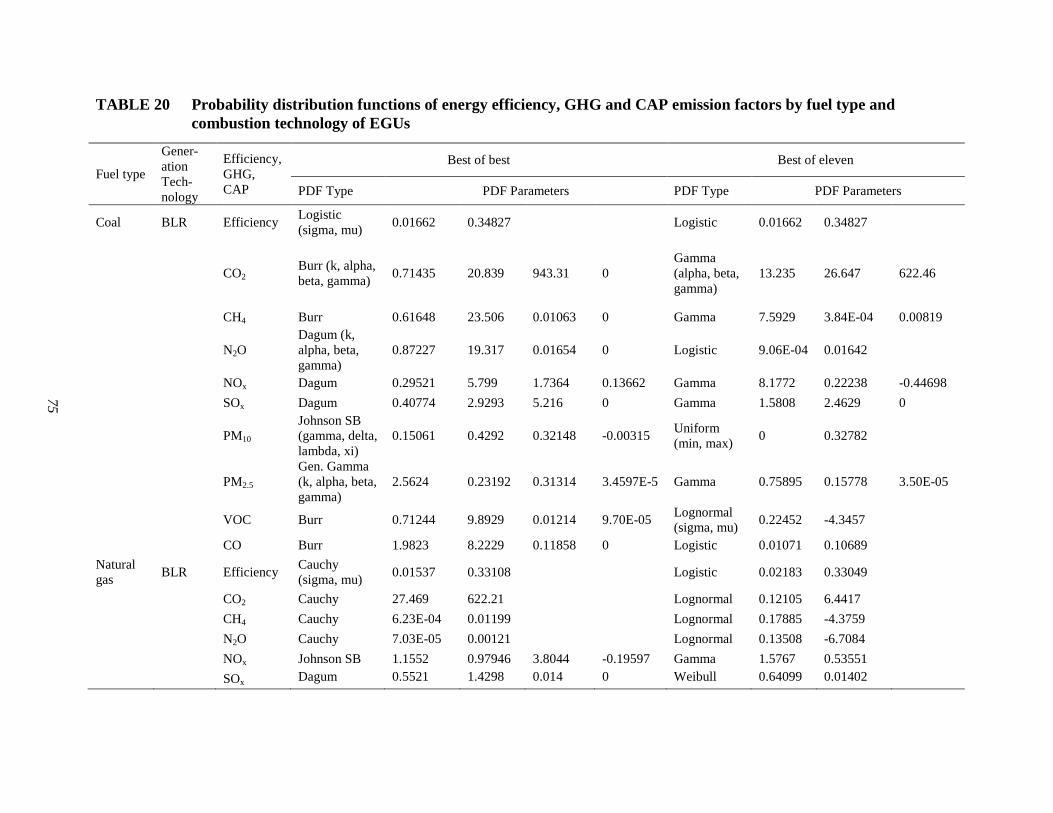
75
TABLE 20 Probability distribution functions of energy efficiency, GHG and CAP emission factors by fuel type and combustion technology of EGUs
Fuel type
Gener-ation Tech-nology
Efficiency, GHG, CAP
Best of best Best of eleven
PDF Type PDF Parameters PDF Type PDF Parameters
Coal BLR Efficiency Logistic (sigma, mu) 0.01662 0.34827 Logistic 0.01662 0.34827
CO2 Burr (k, alpha, beta, gamma) 0.71435 20.839 943.31 0
Gamma (alpha, beta, gamma)
13.235 26.647 622.46
CH4 Burr 0.61648 23.506 0.01063 0 Gamma 7.5929 3.84E-04 0.00819
N2O Dagum (k, alpha, beta, gamma)
0.87227 19.317 0.01654 0 Logistic 9.06E-04 0.01642
NOx Dagum 0.29521 5.799 1.7364 0.13662 Gamma 8.1772 0.22238 -0.44698
SOx Dagum 0.40774 2.9293 5.216 0 Gamma 1.5808 2.4629 0
PM10 Johnson SB (gamma, delta, lambda, xi)
0.15061 0.4292 0.32148 -0.00315 Uniform (min, max) 0 0.32782
PM2.5 Gen. Gamma (k, alpha, beta, gamma)
2.5624 0.23192 0.31314 3.4597E-5 Gamma 0.75895 0.15778 3.50E-05
VOC Burr 0.71244 9.8929 0.01214 9.70E-05 Lognormal (sigma, mu) 0.22452 -4.3457
CO Burr 1.9823 8.2229 0.11858 0 Logistic 0.01071 0.10689 Natural gas BLR Efficiency Cauchy
(sigma, mu) 0.01537 0.33108 Logistic 0.02183 0.33049
CO2 Cauchy 27.469 622.21 Lognormal 0.12105 6.4417 CH4 Cauchy 6.23E-04 0.01199 Lognormal 0.17885 -4.3759 N2O Cauchy 7.03E-05 0.00121 Lognormal 0.13508 -6.7084 NOx Johnson SB 1.1552 0.97946 3.8044 -0.19597 Gamma 1.5767 0.53551 SOx Dagum 0.5521 1.4298 0.014 0 Weibull 0.64099 0.01402
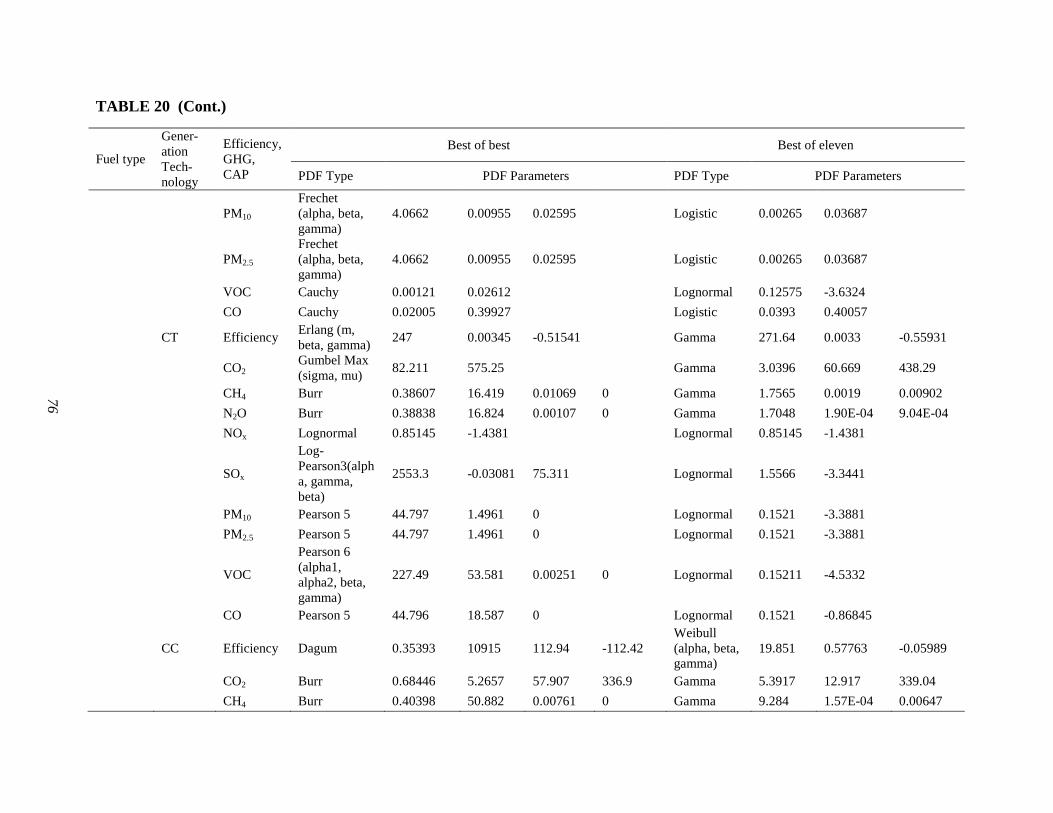
76
TABLE 20 (Cont.)
Fuel type
Gener-ation Tech-nology
Efficiency, GHG, CAP
Best of best Best of eleven
PDF Type PDF Parameters PDF Type PDF Parameters
PM10 Frechet (alpha, beta, gamma)
4.0662 0.00955 0.02595 Logistic 0.00265 0.03687
PM2.5 Frechet (alpha, beta, gamma)
4.0662 0.00955 0.02595 Logistic 0.00265 0.03687
VOC Cauchy 0.00121 0.02612 Lognormal 0.12575 -3.6324 CO Cauchy 0.02005 0.39927 Logistic 0.0393 0.40057
CT Efficiency Erlang (m, beta, gamma) 247 0.00345 -0.51541 Gamma 271.64 0.0033 -0.55931
CO2 Gumbel Max (sigma, mu) 82.211 575.25 Gamma 3.0396 60.669 438.29
CH4 Burr 0.38607 16.419 0.01069 0 Gamma 1.7565 0.0019 0.00902
N2O Burr 0.38838 16.824 0.00107 0 Gamma 1.7048 1.90E-04 9.04E-04
NOx Lognormal 0.85145 -1.4381 Lognormal 0.85145 -1.4381
SOx
Log-Pearson3(alpha, gamma, beta)
2553.3 -0.03081 75.311 Lognormal 1.5566 -3.3441
PM10 Pearson 5 44.797 1.4961 0 Lognormal 0.1521 -3.3881 PM2.5 Pearson 5 44.797 1.4961 0 Lognormal 0.1521 -3.3881
VOC
Pearson 6 (alpha1, alpha2, beta, gamma)
227.49 53.581 0.00251 0 Lognormal 0.15211 -4.5332
CO Pearson 5 44.796 18.587 0 Lognormal 0.1521 -0.86845
CC Efficiency Dagum 0.35393 10915 112.94 -112.42 Weibull (alpha, beta, gamma)
19.851 0.57763 -0.05989
CO2 Burr 0.68446 5.2657 57.907 336.9 Gamma 5.3917 12.917 339.04
CH4 Burr 0.40398 50.882 0.00761 0 Gamma 9.284 1.57E-04 0.00647
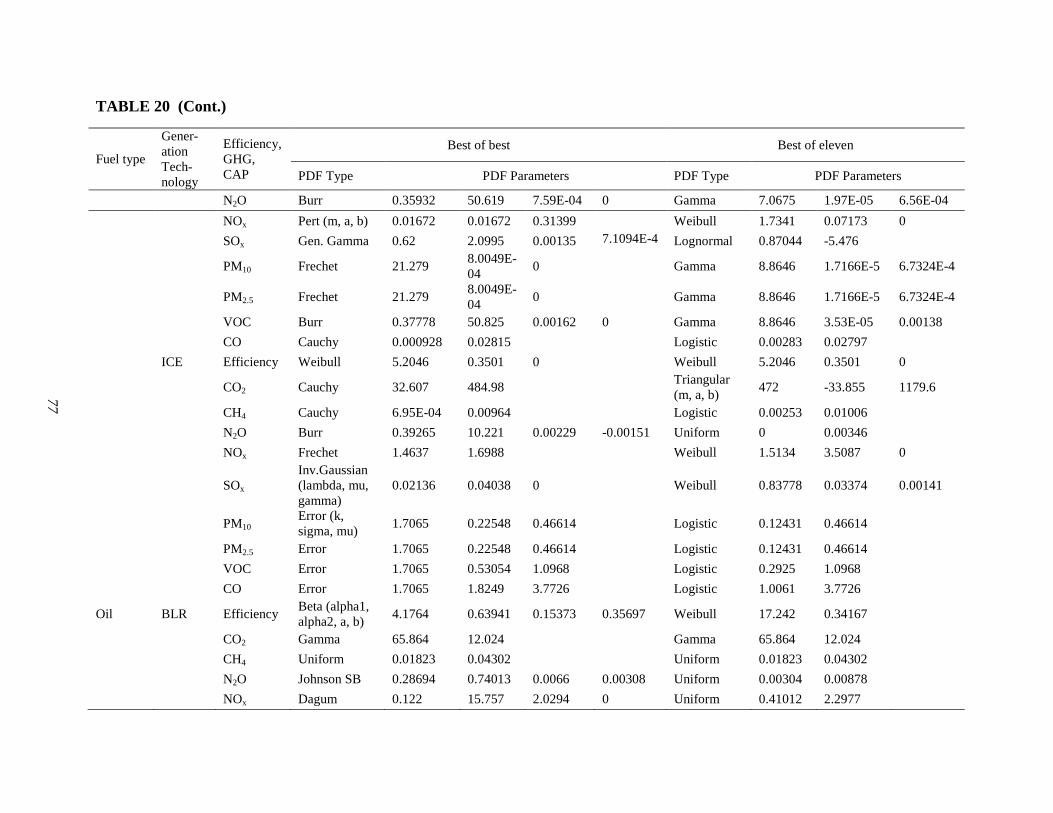
77
TABLE 20 (Cont.)
Fuel type
Gener-ation Tech-nology
Efficiency, GHG, CAP
Best of best Best of eleven
PDF Type PDF Parameters PDF Type PDF Parameters
N2O Burr 0.35932 50.619 7.59E-04 0 Gamma 7.0675 1.97E-05 6.56E-04
NOx Pert (m, a, b) 0.01672 0.01672 0.31399 Weibull 1.7341 0.07173 0
SOx Gen. Gamma 0.62 2.0995 0.00135 7.1094E-4 Lognormal 0.87044 -5.476
PM10 Frechet 21.279 8.0049E-04 0 Gamma 8.8646 1.7166E-5 6.7324E-4
PM2.5 Frechet 21.279 8.0049E-04 0 Gamma 8.8646 1.7166E-5 6.7324E-4
VOC Burr 0.37778 50.825 0.00162 0 Gamma 8.8646 3.53E-05 0.00138
CO Cauchy 0.000928 0.02815 Logistic 0.00283 0.02797
ICE Efficiency Weibull 5.2046 0.3501 0 Weibull 5.2046 0.3501 0
CO2 Cauchy 32.607 484.98 Triangular (m, a, b) 472 -33.855 1179.6
CH4 Cauchy 6.95E-04 0.00964 Logistic 0.00253 0.01006 N2O Burr 0.39265 10.221 0.00229 -0.00151 Uniform 0 0.00346 NOx Frechet 1.4637 1.6988 Weibull 1.5134 3.5087 0
SOx Inv.Gaussian (lambda, mu, gamma)
0.02136 0.04038 0 Weibull 0.83778 0.03374 0.00141
PM10 Error (k, sigma, mu) 1.7065 0.22548 0.46614 Logistic 0.12431 0.46614
PM2.5 Error 1.7065 0.22548 0.46614 Logistic 0.12431 0.46614 VOC Error 1.7065 0.53054 1.0968 Logistic 0.2925 1.0968 CO Error 1.7065 1.8249 3.7726 Logistic 1.0061 3.7726 Oil BLR Efficiency Beta (alpha1,
alpha2, a, b) 4.1764 0.63941 0.15373 0.35697 Weibull 17.242 0.34167
CO2 Gamma 65.864 12.024 Gamma 65.864 12.024 CH4 Uniform 0.01823 0.04302 Uniform 0.01823 0.04302 N2O Johnson SB 0.28694 0.74013 0.0066 0.00308 Uniform 0.00304 0.00878 NOx Dagum 0.122 15.757 2.0294 0 Uniform 0.41012 2.2977
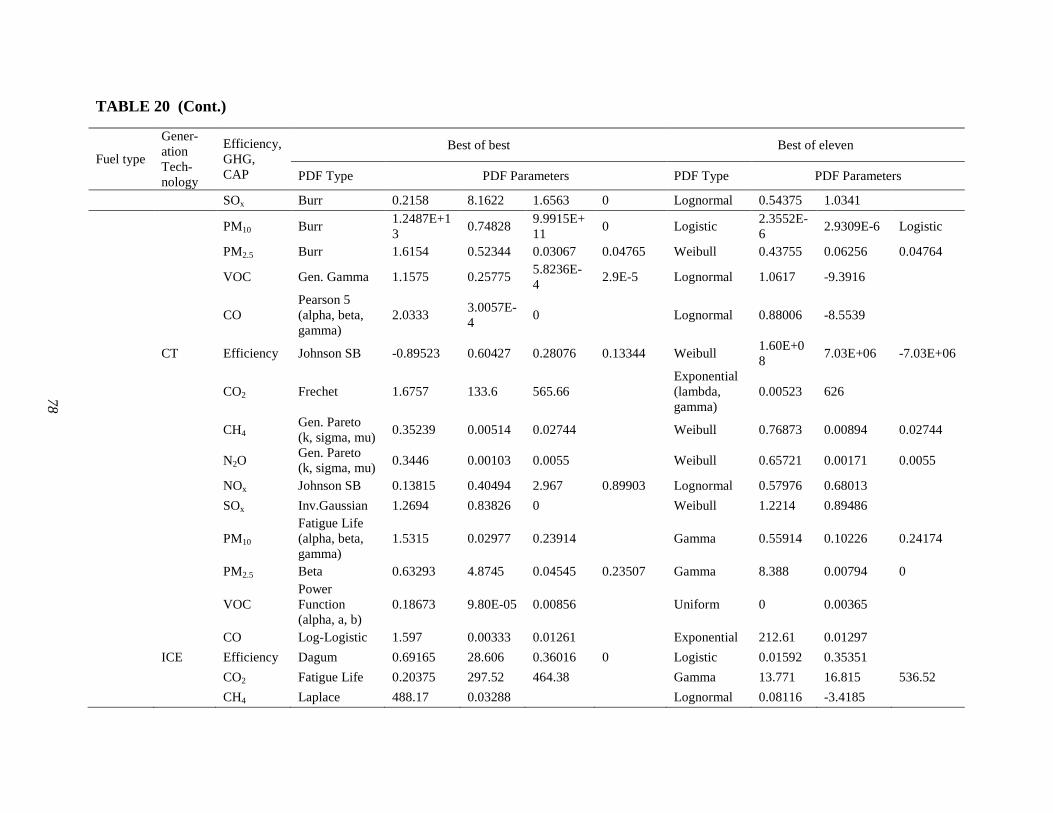
78
TABLE 20 (Cont.)
Fuel type
Gener-ation Tech-nology
Efficiency, GHG, CAP
Best of best Best of eleven
PDF Type PDF Parameters PDF Type PDF Parameters
SOx Burr 0.2158 8.1622 1.6563 0 Lognormal 0.54375 1.0341
PM10 Burr 1.2487E+13 0.74828 9.9915E+
11 0 Logistic 2.3552E-6 2.9309E-6 Logistic
PM2.5 Burr 1.6154 0.52344 0.03067 0.04765 Weibull 0.43755 0.06256 0.04764
VOC Gen. Gamma 1.1575 0.25775 5.8236E-4 2.9E-5 Lognormal 1.0617 -9.3916
CO Pearson 5 (alpha, beta, gamma)
2.0333 3.0057E-4 0 Lognormal 0.88006 -8.5539
CT Efficiency Johnson SB -0.89523 0.60427 0.28076 0.13344 Weibull 1.60E+08 7.03E+06 -7.03E+06
CO2 Frechet 1.6757 133.6 565.66
Exponential (lambda, gamma)
0.00523 626
CH4 Gen. Pareto (k, sigma, mu) 0.35239 0.00514 0.02744 Weibull 0.76873 0.00894 0.02744
N2O Gen. Pareto (k, sigma, mu) 0.3446 0.00103 0.0055 Weibull 0.65721 0.00171 0.0055
NOx Johnson SB 0.13815 0.40494 2.967 0.89903 Lognormal 0.57976 0.68013 SOx Inv.Gaussian 1.2694 0.83826 0 Weibull 1.2214 0.89486
PM10 Fatigue Life (alpha, beta, gamma)
1.5315 0.02977 0.23914 Gamma 0.55914 0.10226 0.24174
PM2.5 Beta 0.63293 4.8745 0.04545 0.23507 Gamma 8.388 0.00794 0
VOC Power Function (alpha, a, b)
0.18673 9.80E-05 0.00856 Uniform 0 0.00365
CO Log-Logistic 1.597 0.00333 0.01261 Exponential 212.61 0.01297 ICE Efficiency Dagum 0.69165 28.606 0.36016 0 Logistic 0.01592 0.35351 CO2 Fatigue Life 0.20375 297.52 464.38 Gamma 13.771 16.815 536.52
CH4 Laplace 488.17 0.03288 Lognormal 0.08116 -3.4185
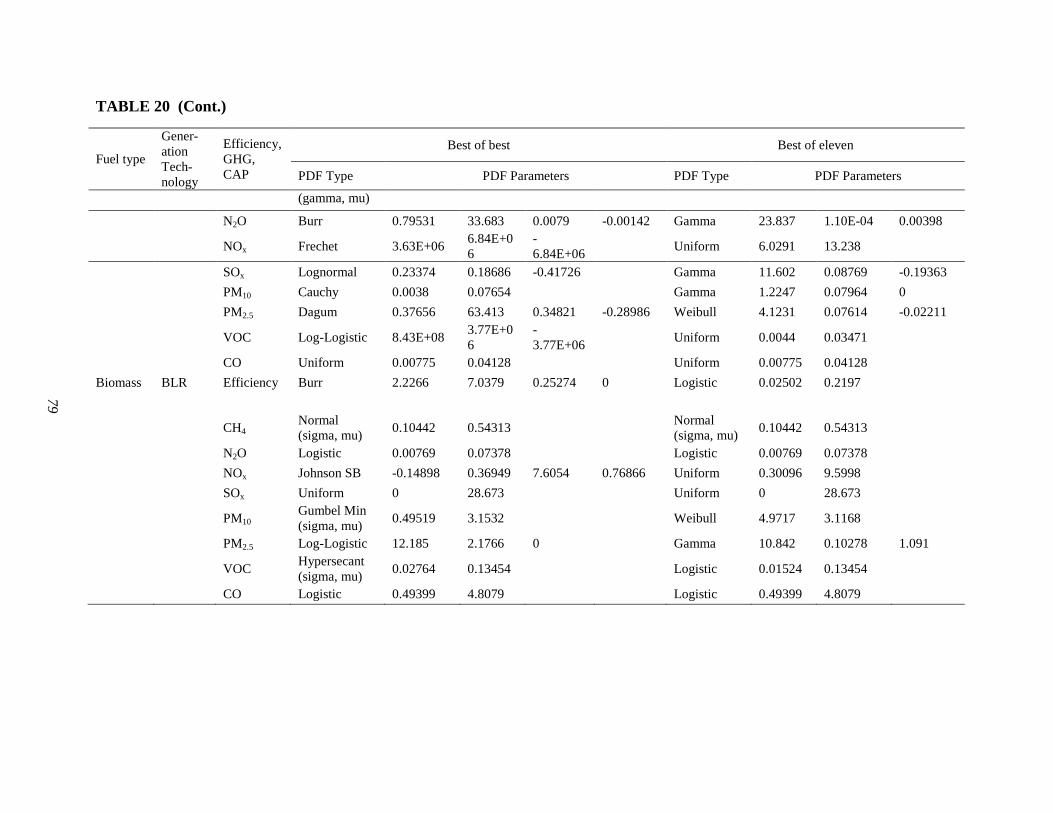
79
TABLE 20 (Cont.)
Fuel type
Gener-ation Tech-nology
Efficiency, GHG, CAP
Best of best Best of eleven
PDF Type PDF Parameters PDF Type PDF Parameters
(gamma, mu)
N2O Burr 0.79531 33.683 0.0079 -0.00142 Gamma 23.837 1.10E-04 0.00398
NOx Frechet 3.63E+06 6.84E+06
-6.84E+06 Uniform 6.0291 13.238
SOx Lognormal 0.23374 0.18686 -0.41726 Gamma 11.602 0.08769 -0.19363
PM10 Cauchy 0.0038 0.07654 Gamma 1.2247 0.07964 0
PM2.5 Dagum 0.37656 63.413 0.34821 -0.28986 Weibull 4.1231 0.07614 -0.02211
VOC Log-Logistic 8.43E+08 3.77E+06
-3.77E+06 Uniform 0.0044 0.03471
CO Uniform 0.00775 0.04128 Uniform 0.00775 0.04128 Biomass BLR Efficiency Burr 2.2266 7.0379 0.25274 0 Logistic 0.02502 0.2197
CH4 Normal (sigma, mu) 0.10442 0.54313
Normal (sigma, mu) 0.10442 0.54313
N2O Logistic 0.00769 0.07378 Logistic 0.00769 0.07378 NOx Johnson SB -0.14898 0.36949 7.6054 0.76866 Uniform 0.30096 9.5998 SOx Uniform 0 28.673 Uniform 0 28.673
PM10 Gumbel Min (sigma, mu) 0.49519 3.1532 Weibull 4.9717 3.1168
PM2.5 Log-Logistic 12.185 2.1766 0 Gamma 10.842 0.10278 1.091
VOC Hypersecant (sigma, mu) 0.02764 0.13454 Logistic 0.01524 0.13454
CO Logistic 0.49399 4.8079 Logistic 0.49399 4.8079
80
3.8 PROJECTION OF GENERATION MIX, EFFICIENCY, COMBUSTION TECHNOLOGY SHARE, AND EMISSION FACTORS
We use the GHG and CAP emission factors, the efficiencies, and the generation technology share of the EGUs by fuel type that are developed in this work, and the AEO 2011 electricity generation mix, as the baseline update for year 2010 in GREET. For 2015 and 2020, we use AEO 2012’s projection of the electricity generation mix to update the generation mix, and we assume incremental improvements in the combustion technology mix based on the relative change rate of our baseline update compared to previous GREET numbers. As a result, an NGCC share of 84.2% and 87.8%, an NG CT share of 6.1% and 6.2%, and an IGCC share of 1.0% and 3.0% for both coal-fired and biomass-fired EGUs are estimated for 2015 and 2020, respectively, in GREET. An incremental improvement, assumed on the basis of the same rationale, is applied to the efficiencies for years 2015 and 2020, while an incremental decrease in CAP emission factors is assumed for EGUs of various fuel types and generation technologies, except for NGCCs, which are assumed to have constantly low-level CAP emission factors. In addition, for CAP emission factors in the future, the low side of the present PDFs could serve as a much better predictor of future emission performance than the high side or even the average, because the worst performers will be preferentially retired or turned down, mainly as a result of the NSPS mandates and low NG prices. 3.9 LIFE-CYCLE ENERGY USE, GHG AND CAP EMISSIONS OF SELECTED
VEHICLE/FUEL SYSTEMS The relative changes in energy use, GHG and CAP emissions per kWh electricity generated for both electricity generation only and the full fuel cycle of the power plant, which are calculated on the basis of the updated GHG and CAP emission factors and energy conversion efficiencies from the present study, are depicted in Figure 2 in comparison with those based on the default parameters of GREET 1_2011.
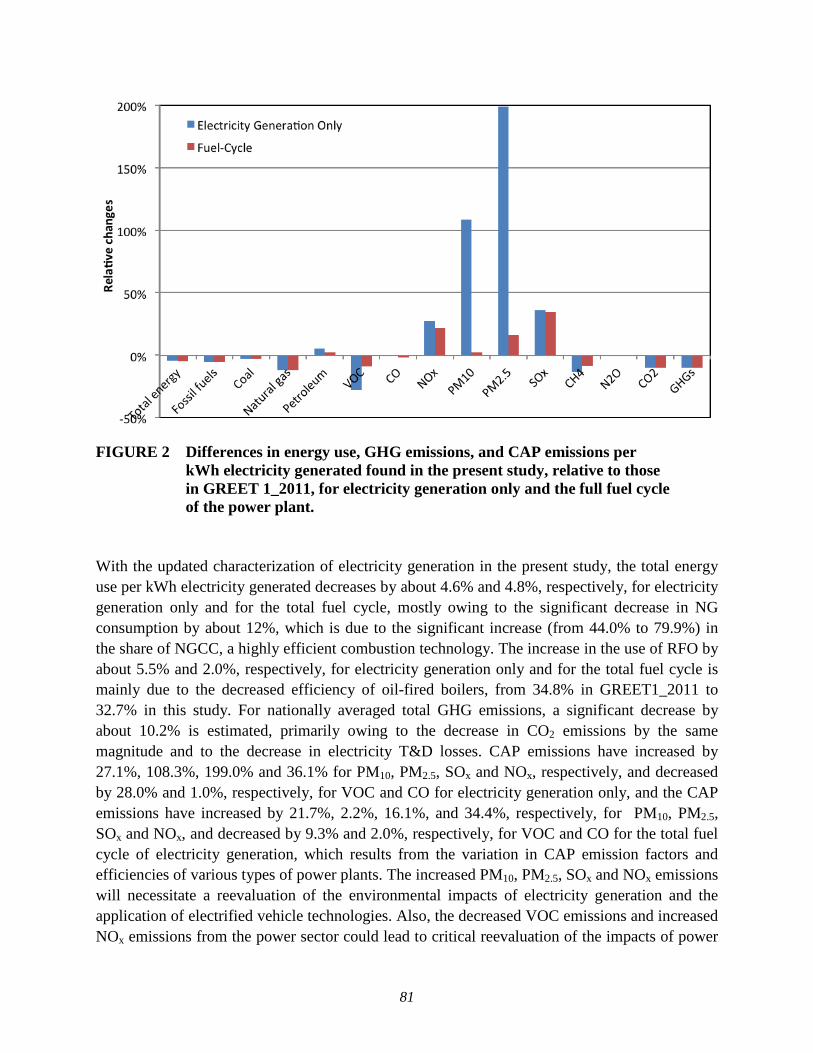
81
FIGURE 2 Differences in energy use, GHG emissions, and CAP emissions per
kWh electricity generated found in the present study, relative to those in GREET 1_2011, for electricity generation only and the full fuel cycle of the power plant.
With the updated characterization of electricity generation in the present study, the total energy use per kWh electricity generated decreases by about 4.6% and 4.8%, respectively, for electricity generation only and for the total fuel cycle, mostly owing to the significant decrease in NG consumption by about 12%, which is due to the significant increase (from 44.0% to 79.9%) in the share of NGCC, a highly efficient combustion technology. The increase in the use of RFO by about 5.5% and 2.0%, respectively, for electricity generation only and for the total fuel cycle is mainly due to the decreased efficiency of oil-fired boilers, from 34.8% in GREET1_2011 to 32.7% in this study. For nationally averaged total GHG emissions, a significant decrease by about 10.2% is estimated, primarily owing to the decrease in CO2 emissions by the same magnitude and to the decrease in electricity T&D losses. CAP emissions have increased by 27.1%, 108.3%, 199.0% and 36.1% for PM10, PM2.5, SOx and NOx, respectively, and decreased by 28.0% and 1.0%, respectively, for VOC and CO for electricity generation only, and the CAP emissions have increased by 21.7%, 2.2%, 16.1%, and 34.4%, respectively, for PM10, PM2.5, SOx and NOx, and decreased by 9.3% and 2.0%, respectively, for VOC and CO for the total fuel cycle of electricity generation, which results from the variation in CAP emission factors and efficiencies of various types of power plants. The increased PM10, PM2.5, SOx and NOx emissions will necessitate a reevaluation of the environmental impacts of electricity generation and the application of electrified vehicle technologies. Also, the decreased VOC emissions and increased NOx emissions from the power sector could lead to critical reevaluation of the impacts of power
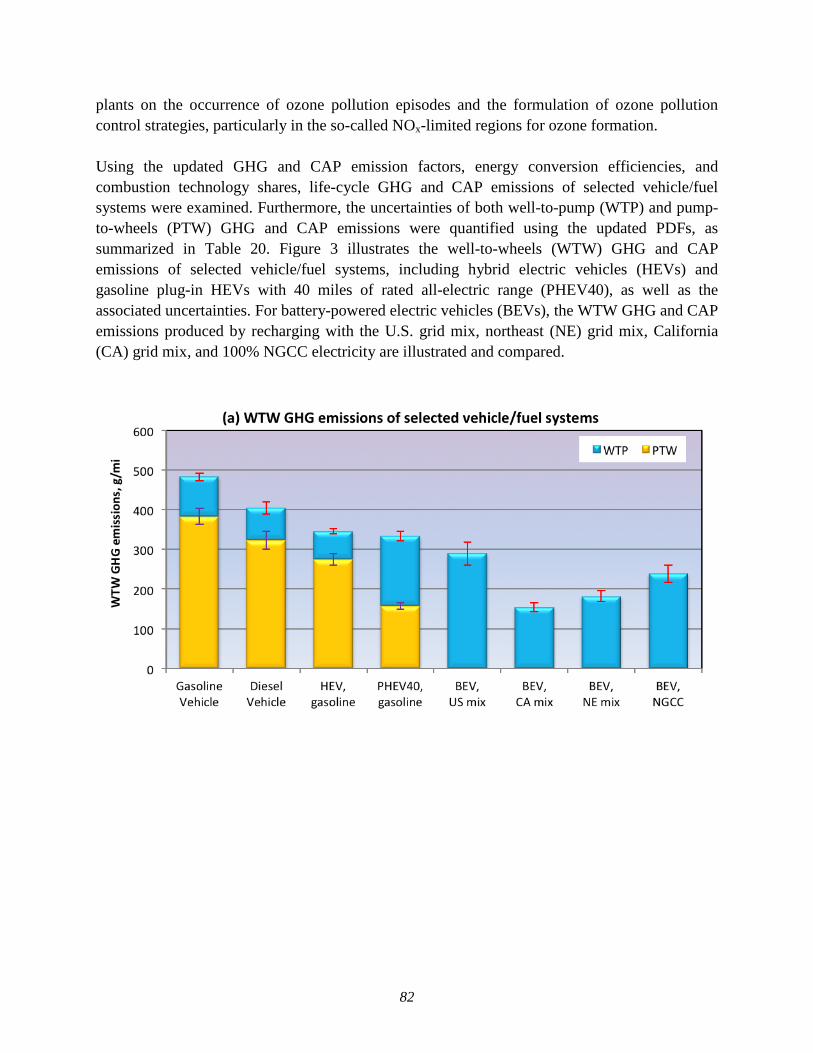
82
plants on the occurrence of ozone pollution episodes and the formulation of ozone pollution control strategies, particularly in the so-called NOx-limited regions for ozone formation. Using the updated GHG and CAP emission factors, energy conversion efficiencies, and combustion technology shares, life-cycle GHG and CAP emissions of selected vehicle/fuel systems were examined. Furthermore, the uncertainties of both well-to-pump (WTP) and pump-to-wheels (PTW) GHG and CAP emissions were quantified using the updated PDFs, as summarized in Table 20. Figure 3 illustrates the well-to-wheels (WTW) GHG and CAP emissions of selected vehicle/fuel systems, including hybrid electric vehicles (HEVs) and gasoline plug-in HEVs with 40 miles of rated all-electric range (PHEV40), as well as the associated uncertainties. For battery-powered electric vehicles (BEVs), the WTW GHG and CAP emissions produced by recharging with the U.S. grid mix, northeast (NE) grid mix, California (CA) grid mix, and 100% NGCC electricity are illustrated and compared.
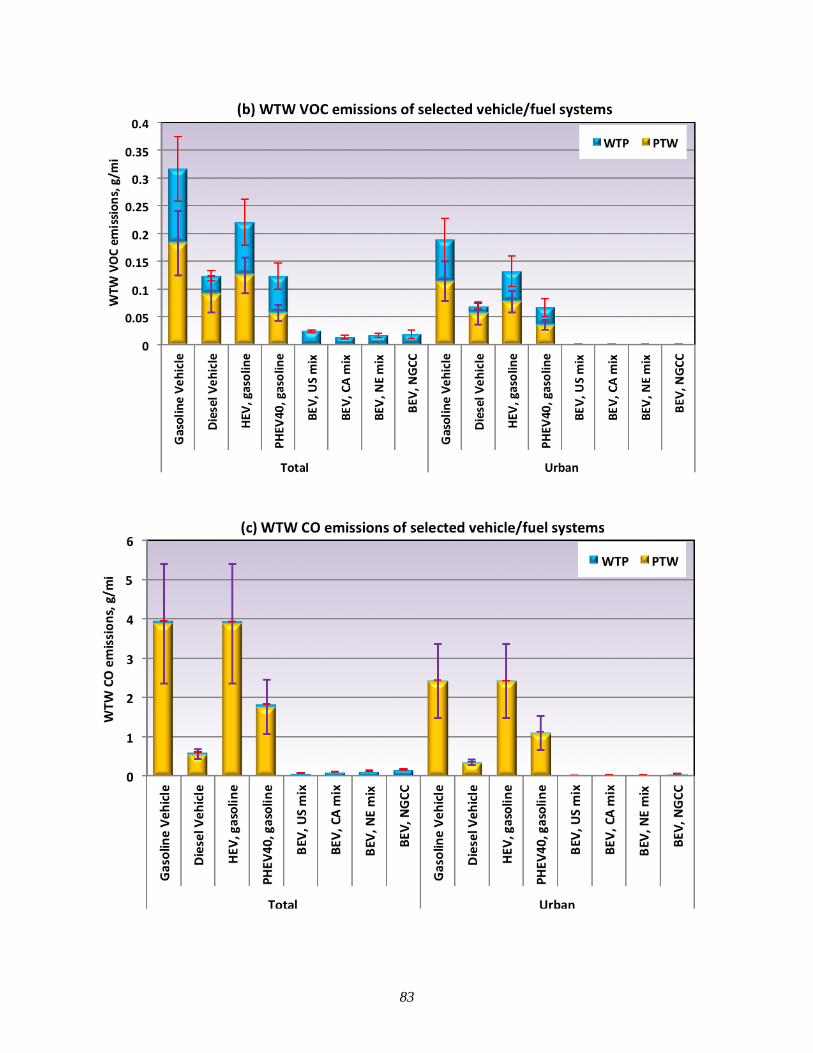
83
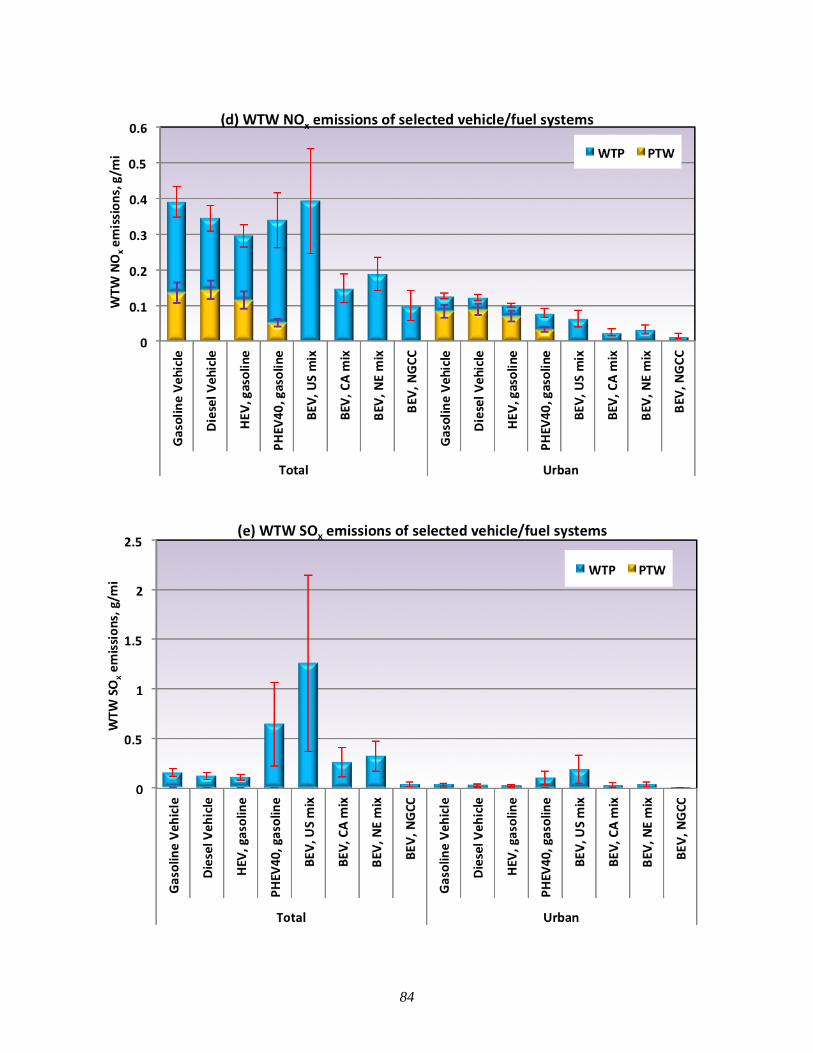
84
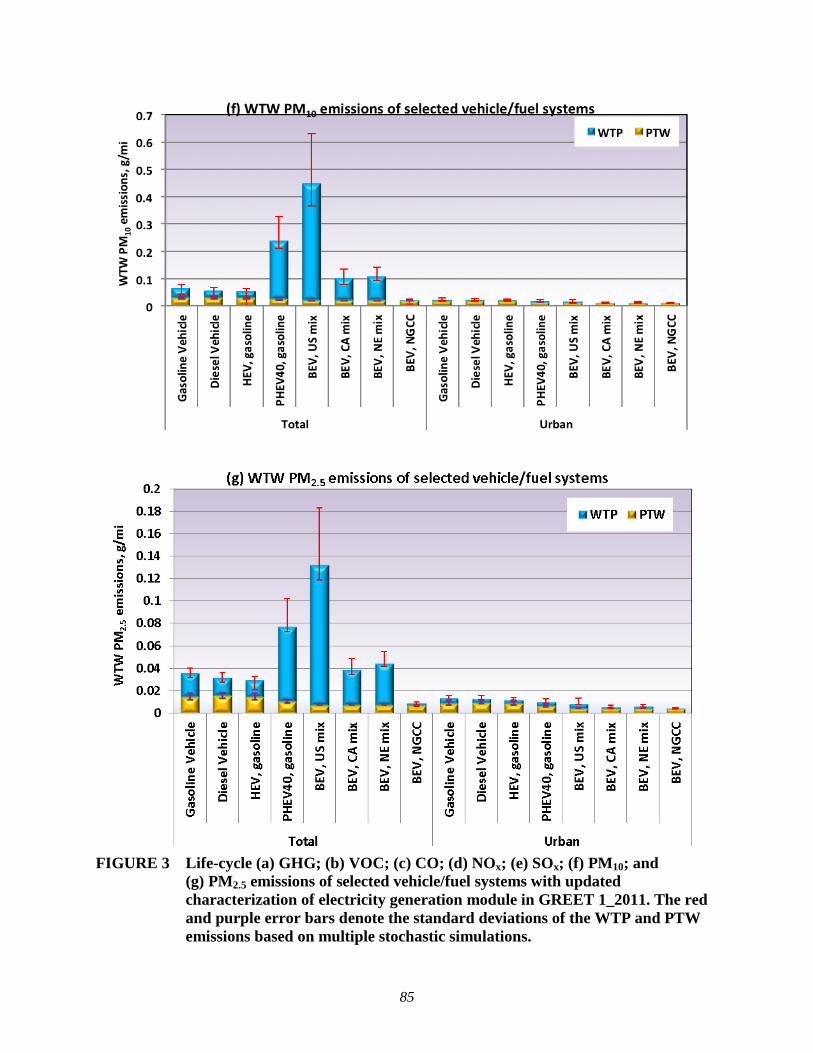
85
FIGURE 3 Life-cycle (a) GHG; (b) VOC; (c) CO; (d) NOx; (e) SOx; (f) PM10; and
(g) PM2.5 emissions of selected vehicle/fuel systems with updated characterization of electricity generation module in GREET 1_2011. The red and purple error bars denote the standard deviations of the WTP and PTW emissions based on multiple stochastic simulations.
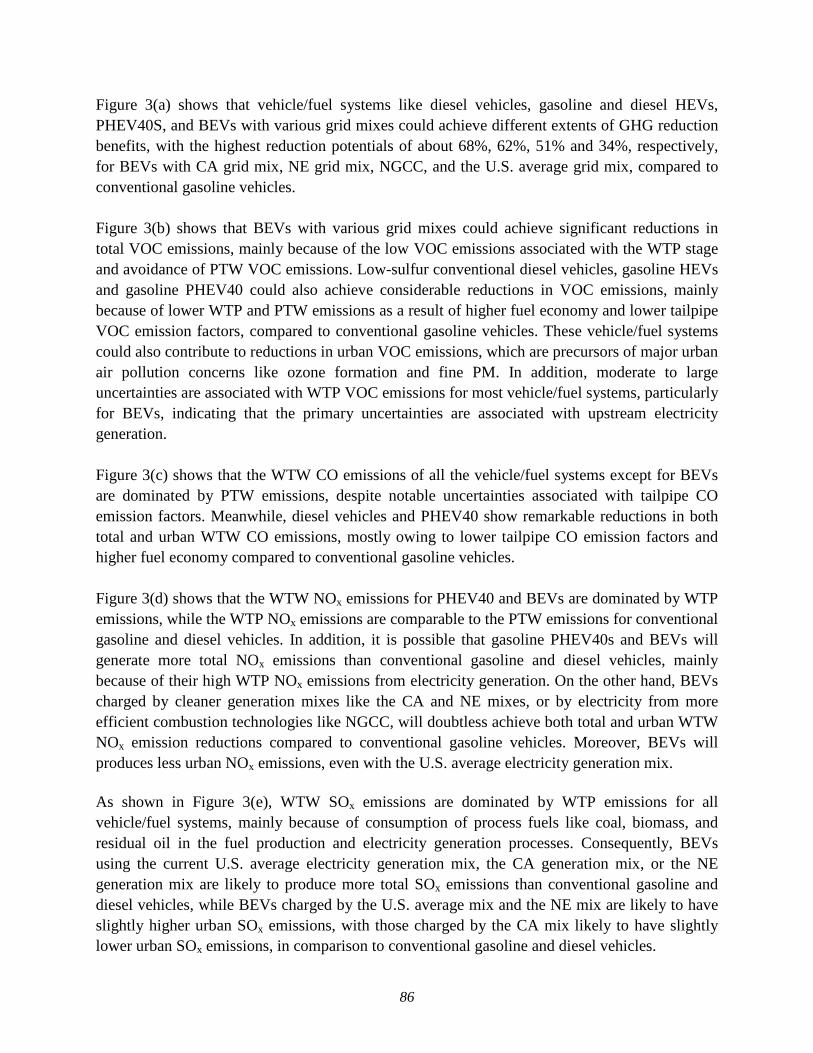
86
Figure 3(a) shows that vehicle/fuel systems like diesel vehicles, gasoline and diesel HEVs, PHEV40S, and BEVs with various grid mixes could achieve different extents of GHG reduction benefits, with the highest reduction potentials of about 68%, 62%, 51% and 34%, respectively, for BEVs with CA grid mix, NE grid mix, NGCC, and the U.S. average grid mix, compared to conventional gasoline vehicles. Figure 3(b) shows that BEVs with various grid mixes could achieve significant reductions in total VOC emissions, mainly because of the low VOC emissions associated with the WTP stage and avoidance of PTW VOC emissions. Low-sulfur conventional diesel vehicles, gasoline HEVs and gasoline PHEV40 could also achieve considerable reductions in VOC emissions, mainly because of lower WTP and PTW emissions as a result of higher fuel economy and lower tailpipe VOC emission factors, compared to conventional gasoline vehicles. These vehicle/fuel systems could also contribute to reductions in urban VOC emissions, which are precursors of major urban air pollution concerns like ozone formation and fine PM. In addition, moderate to large uncertainties are associated with WTP VOC emissions for most vehicle/fuel systems, particularly for BEVs, indicating that the primary uncertainties are associated with upstream electricity generation. Figure 3(c) shows that the WTW CO emissions of all the vehicle/fuel systems except for BEVs are dominated by PTW emissions, despite notable uncertainties associated with tailpipe CO emission factors. Meanwhile, diesel vehicles and PHEV40 show remarkable reductions in both total and urban WTW CO emissions, mostly owing to lower tailpipe CO emission factors and higher fuel economy compared to conventional gasoline vehicles. Figure 3(d) shows that the WTW NOx emissions for PHEV40 and BEVs are dominated by WTP emissions, while the WTP NOx emissions are comparable to the PTW emissions for conventional gasoline and diesel vehicles. In addition, it is possible that gasoline PHEV40s and BEVs will generate more total NOx emissions than conventional gasoline and diesel vehicles, mainly because of their high WTP NOx emissions from electricity generation. On the other hand, BEVs charged by cleaner generation mixes like the CA and NE mixes, or by electricity from more efficient combustion technologies like NGCC, will doubtless achieve both total and urban WTW NOx emission reductions compared to conventional gasoline vehicles. Moreover, BEVs will produces less urban NOx emissions, even with the U.S. average electricity generation mix. As shown in Figure 3(e), WTW SOx emissions are dominated by WTP emissions for all vehicle/fuel systems, mainly because of consumption of process fuels like coal, biomass, and residual oil in the fuel production and electricity generation processes. Consequently, BEVs using the current U.S. average electricity generation mix, the CA generation mix, or the NE generation mix are likely to produce more total SOx emissions than conventional gasoline and diesel vehicles, while BEVs charged by the U.S. average mix and the NE mix are likely to have slightly higher urban SOx emissions, with those charged by the CA mix likely to have slightly lower urban SOx emissions, in comparison to conventional gasoline and diesel vehicles.
87
Figures 3(f) and 3(g) show that WTP PM10 and PM2.5 emissions are comparable to PTW emissions for conventional gasoline and diesel vehicles and HEVs, while the WTW PM10 and PM2.5 emissions for gasoline PHEV40s and BEVs are dominated by WTP emissions. WTP emissions are also comparable to PTW emissions for conventional gasoline, diesel vehicles, and HEVs, although — particularly for BEVs and PHEV40s —, large uncertainties are associated with the WTP PM10 emissions, which are mainly due to the wide range of PM10 and PM2.5 emission factors for EGUs burning coals with diverse ash and sulfur contents and with different deployment rates of PM and sulfur emission control devices. Consequently, gasoline PHEV40s and BEVs charged by the U.S. average electricity generation mix or regional mixes like the CA mix and NE mix are likely to generate more total PM10 emissions than conventional gasoline and diesel vehicles, while BEVs charged by electricity from highly efficient NGCC plants are very likely to produce less total and urban PM10 emissions than conventional gasoline and diesel vehicles.
88
REFERENCES Bellman, D.K., Blankenship, B.D., Imhoff, C.H., DiPietro, J.P., Rederstorff, B., and Zheng, X.J., 2007. Power Plant Efficiency Outlook. Working Document of the NPC Global Oil & Gas Study. Corio, L.A., and Sherwell, J., 2000. In-stack Condensable Particulate Matter Measurement and Permitting Issues for Maryland Power Plants. Journal of Air and Waste Management Association, 50:207-218. EIA (U.S. Energy Information Administration), 2007a. Form EIA-906, EIA-920, and EIA-923 Data. EIA, 2007b. Form FERC-423 Data, Monthly Cost and Quality of Fuels for Electric Plants Data. EIA, 2011. State Electricity Profiles 2010, http://www.eia.gov/electricity/state/. Accessed January 2012. EVA (Energy Ventures Analysis), 2007. 2007 Operating Performance, Electric Light & Power Report, http://downloads.pennnet.com/pnet/surveys/elp/elpbinder.pdf. Accessed January 2012. England, G.C., Wien, S., McGrath, T.P., and Hernandez, D., 2004. Development of Fine Particulate Emission Factors and Speciation Profiles for Oil and Gas-fired Combustion Systems, Topical Report: Test Results for a Combined Cycle Power Plant with Oxidation Catalyst and SCR at Site Echo. Available at http://www.nyserda. ny.gov/en/Publications/Research-and-Development/Environmental/EMEP-Publications/~/ media/Files/Publications/Research/Environmental/EMEP/05_Echo_R1-V2.ashx. Accessed June 2012. EPA, 1995a. Emissions Factors & AP-42, Chapter 1.1, Bituminous and Subbituminous Coal Combustion, in Compilation of Air Pollutant Emission Factors, Fifth Edition. EPA, 1995b. Emissions Factors & AP-42, Chapter 1.7, Lignite Combustion, in Compilation of Air Pollutant Emission Factors, Fifth Edition. EPA, 1995c. Emissions Factors & AP-42, Chapter 1.3, Fuel Oil Combustion, in Compilation of Air Pollutant Emission Factors, Fifth Edition. EPA, 1995d. Emissions Factors & AP-42, Chapter 1.6, Wood Residue Combustion in Boilers, in Compilation of Air Pollutant Emission Factors, Fifth Edition.
89
EPA, 2004. Compilation of Air Pollutant Emission Factors, AP-42—Update 2001 to September 2004. EPA, 2006. Environmental Footprints and Costs of Coal-Based Integrated Gasification Combined Cycle and Pulverized Coal Technologies, EPA-430/R-06/006, http://www.epa. gov/air/caaac/coaltech/2007_01_epaigcc.pdf. Accessed February 2012. EPA, 2007a. 2007 Annual, All Programs, Unit-Level Emission Database, http://camddataand maps.epa.gov/gdm/index.cfm?fuseaction=emissions.wizard. Accessed February 2012. EPA, 2007b. Methodology for Thermal Efficiency and Energy Input Calculations and Analysis of Biomass Cogeneration Unit Characteristics. EPA-HQ-OAR-2007-0012, http://www.epa.gov/ ttn/atw/utility/fnl_biomass_cogen_TSD_04_19_07.pdf. Accessed February 2012. EPA, 2009a. Steam Electric Power Generating Point Source Category: Final Detailed Study Report, EPA 821-R-09-008, http://water.epa.gov/lawsregs/guidance/cwa/304m/archive/upload/ 2009_10_26_guide_steam_finalreport.pdf. Accessed March 2012. EPA, 2009b. Inventory of U.S. Greenhouse Gas Emissions and Sinks: 1990-2007, http://www.epa.gov/climatechange/emissions/downloads09/GHG2007entire_report-508.pdf. Accessed March 2012. EPA, 2009c. Inventory of U.S. Greenhouse Gas Emissions and Sinks: 1990-2007, All Annexes. http://www.epa.gov/climatechange/Downloads/ghgemissions/US_GHG_Inv_Annexes_1990-2007.pdf. Accessed May 2012. EPA, 2010a. RACT/BACT/LAER Clearinghouse, Washington, DC, http://cfpub1.epa.gov/ RBLC. Accessed March 2012. EPA, 2010b. Locating & Estimating (L&E) Documents, http://www.epa.gov/ttn/chief/le. Accessed March 2012. EPA, 2011a. The Emissions & Generation Resource Integrated Database (eGRID 2010 Version 1.1), http://www.epa.gov/cleanenergy/energy-resources/egrid. Accessed March 2012. EPA, 2011b. The Internet Version of the Factor Information Retrieval Data System, http://cfpub.epa.gov/webfire/index.cfm?action=fire.main. Accessed March 2012. EPA, 2011c. Emissions Factors & AP 42, Compilation of Air Pollutant Emission Factors. Fifth Edition. http://www.epa.gov/ttn/chief/ap42. Accessed September 2011.
90
EPA, 2011d. National Emissions Inventory (NEI) Air Pollutant Emissions Trends Data, 1970–2011: Average Annual Emissions, All Criteria Pollutants in MS Excel, www.epa.gov/ttn/ chief/trends/trends06/nationaltier1upto2011basedon2008v1_5.xls. Accessed March 2012. Farber, P.S., Marmer, D.L., and DePriest, W., 2004. Condensable Particulate Matter: Sources and Control in Coal-Fired Power Plants. Paper Number 17, presented at the 2004 Air &Waste Management Association Combined Power Plant Control Mega Symposium. FR (Federal Register), 2007. Revisions to Definition of Cogeneration Unit in Clean Air Interstate Rule (CAIR), CAIR Federal Implementation Plans, Clean Air Mercury Rule (CAMR); and Technical Corrections to CAIR, CAIR FIPs, CAMR, and Acid Rain Program Rules. 59190, Vol 72, No. 202 / Friday, October 19, 2007, http://www.gpo.gov/fdsys/pkg/FR-2007-10-19/pdf/E7-20447.pdf. Accessed December 2011. Iglewicz, B., and Hoaglin, D., 1993. Volume 16: How to Detect and Handle Outliers, in The ASQC Basic References in Quality Control: Statistical Techniques, E.F. Mykytka, Editor, ASQC Quality Press, Milwaukee, WI. Ishikawa M., Terauchi, M., Komori, T., and Yasuraoka, J., 2008. Development of High Efficiency Gas Turbine Combined Cycle Power Plant. Mitsubishi Heavy Industries, Ltd., Technical Review Vol. 45 No. 1, http://www.me.metu.edu.tr/courses/me476/downloads/ 476s08ProjectPt4GtTemp.pdf. Accessed November 2011. Mann, M.K., 2001. A Comparison of the Environmental Consequences of Power from Biomass, Coal, and Natural Gas, http://www.nrel.gov/analysis/forum/pdfs/m_mann.pdf. Accessed September 2011. NETL (National Energy Technology Laboratory), 2010. Cost and Performance Baseline for Fossil Energy Plants, Volume 1 - Bituminous Coal and Natural Gas to Electricity, DOE/NETL-2010/1397, p. 323. Pechan, E.H., 2003. Documentation for The 2001 Electric Generating Unit (EGU) Trends Procedures Report, Section 4.2, Pechan & Associates, Inc., http://www.epa.gov/cair/pdfs/ 2001_EGU_Documentation.pdf, Accessed January 2012. Pechan, E.H., 2005. Evaluation of Potential PM2.5 Reductions by Improving Performance of Control Devices: PM2.5 Emission Estimates, Final Report, Pechan & Associates, Inc., http://www.epa.gov/pm/measures/pm25_emission_estimates_2007.pdf. Accessed January 2012.
91
Pechan, E.H., 2010a. The Emission & Generation Resource Integrated Database for 2010 (eGRID2010), Technical Support Document. Pechan Report No. 11.02.001/A319108104, Pechan & Associates, Inc. Pechan, E.H., 2010b. Detailed Plan to Develop 2008 EGU Emissions, prepared under Contract No. EP-D-07-097 Work Assignment No. 3-09 for the U.S. Environmental Protection Agency, Research Triangle Park, NC. Pechan & Associates, Inc. Rothschild, S., 2012. Personal communication. Spath, P.L., and Mann, M.K., 2000. Life Cycle Assessment of a Natural Gas Combined-cycle Power Generation System. Report No. NREL/TP-570-27715, National Renewable Energy Laboratory. Subramanyan, K., and Diwekar, U., 2005. User Manual for Stochastic Simulations. GREET Model Reports. Center for Transportation Research, Energy Systems Division, Argonne National Laboratory, http://www.transportation.anl.gov/pdfs/TA/357.pdf. Accessed January 2012. U.S. Geological Survey (USGS), 2006. US Coal Quality Database (Version 2.0), National Coal Resources Data System, http://energy.er.usgs.gov/products/databases/CoalQual/index.htm. Accessed April 2012. Wang, M., 1999. GREET 1.5—Transportation Fuel-Cycle Model, Vol. 1: Methodology, Use, and Results, Report No. ANL/ESD-39, Argonne National Laboratory. World Bank Group, 1998. Nitrogen Oxides: Pollution Prevention and Control, Pollution Prevention and Abatement Handbook, http://www.ifc.org/ifcext/enviro.nsf/Attachments ByTitle/p_ppah_pguiNitrogenOxidesPollutionControl/$FILE/HandbookNitrogenOxidesPollutionPreventionAndControl.pdf. Accessed December 2011.
92
APPENDIX Table and Figure list: Table A1. NOx emission factors of EGUs by fuel type, combustion technology, firing type and emission control technology Table A2. SOx emission factors of EGUs by fuel type, combustion technology, firing type and emission control technology Figure A1. Best-fit cumulative probability distribution functions (CDFs) of electricity-generation-weighted CDFs of GHG and CAP emission factors for coal-fired boilers. Figure A2. Best-fit cumulative probability distribution functions (CDFs) of electricity-generation-weighted CDFs of GHG and CAP emission factors for natural gas-fired boilers. Figure A3. Best-fit cumulative probability distribution functions (CDFs) of electricity-generation-weighted CDFs of energy conversion efficiency and GHG and CAP emission factors for natural gas-fired combustion turbines. Figure A4. Best-fit cumulative probability distribution functions (CDFs) of electricity-generation-weighted CDFs of GHG and CAP emission factors for natural gas-fired combined-cycle plants. Figure A5. Best-fit cumulative probability distribution functions (CDFs) of electricity-generation-weighted CDFs of GHG and CAP emission factors for natural gas-fired internal combustion engines. Figure A6. Best-fit cumulative probability distribution functions (CDFs) of electricity-generation-weighted CDFs of GHG and CAP emission factors for oil-fired boilers. Figure A7. Best-fit cumulative probability distribution functions (CDFs) of electricity-generation-weighted CDFs of GHG and CAP emission factors for oil-fired combustion turbines. Figure A8. Best-fit cumulative probability distribution functions (CDFs) of electricity-generation-weighted CDFs of GHG and CAP emission factors for oil-fired internal combustion engines. Figure A9. Best-fit cumulative probability distribution functions (CDFs) of electricity-generation-weighted CDFs of GHG and CAP emission factors for biomass-fired boilers. Figure A10. Best-fit cumulative probability distribution functions (CDFs) of electricity-generation-weighted CDFs of energy conversion efficiencies for coal-, natural gas-, oil- and biomass-fired boilers, combustion turbines, combined-cycle plants and internal combustion engines.
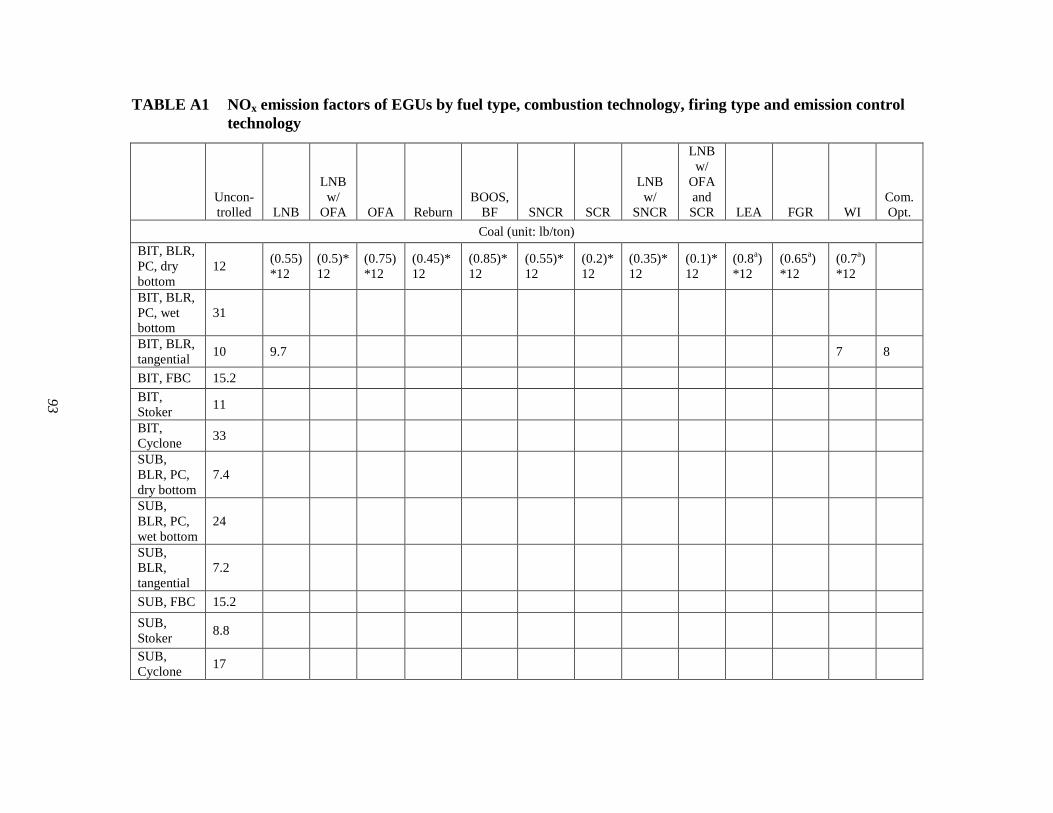
93
TABLE A1 NOx emission factors of EGUs by fuel type, combustion technology, firing type and emission control technology
Uncon-trolled LNB
LNB w/
OFA OFA Reburn BOOS,
BF SNCR SCR
LNB w/
SNCR
LNB w/
OFA and SCR LEA FGR WI
Com.Opt.
Coal (unit: lb/ton) BIT, BLR, PC, dry bottom
12 (0.55)*12
(0.5)*12
(0.75)*12
(0.45)*12
(0.85)*12
(0.55)*12
(0.2)*12
(0.35)*12
(0.1)*12
(0.8a)*12
(0.65a)*12
(0.7a)*12
BIT, BLR, PC, wet bottom
31
BIT, BLR, tangential 10 9.7 7 8
BIT, FBC 15.2 BIT, Stoker 11
BIT, Cyclone 33 SUB, BLR, PC, dry bottom
7.4
SUB, BLR, PC, wet bottom
24
SUB, BLR, tangential
7.2
SUB, FBC 15.2 SUB, Stoker 8.8 SUB, Cyclone 17
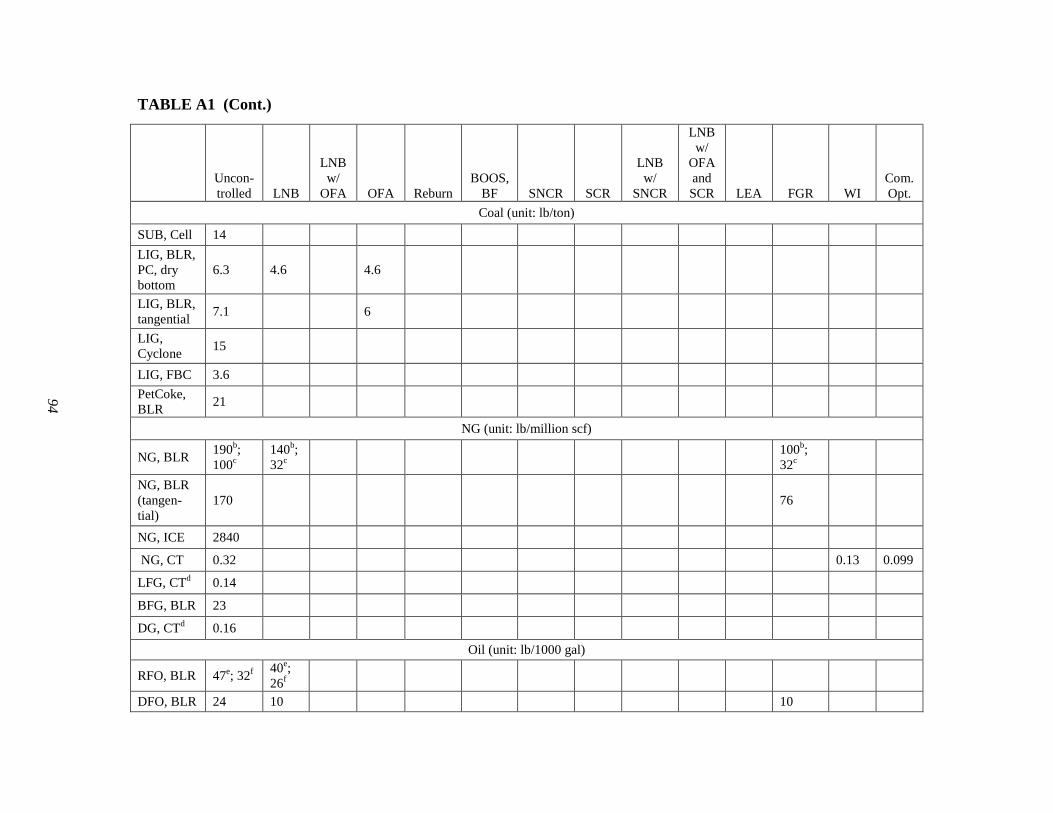
94
TABLE A1 (Cont.)
Uncon-trolled LNB
LNB w/
OFA OFA Reburn BOOS,
BF SNCR SCR
LNB w/
SNCR
LNB w/
OFA and SCR LEA FGR WI
Com.Opt.
Coal (unit: lb/ton)
SUB, Cell 14 LIG, BLR, PC, dry bottom
6.3 4.6 4.6
LIG, BLR, tangential 7.1 6 LIG, Cyclone 15 LIG, FBC 3.6 PetCoke, BLR 21
NG (unit: lb/million scf)
NG, BLR 190b; 100c
140b; 32c
100b; 32c
NG, BLR (tangen-tial)
170 76
NG, ICE 2840 NG, CT 0.32 0.13 0.099
LFG, CTd 0.14 BFG, BLR 23 DG, CTd 0.16
Oil (unit: lb/1000 gal)
RFO, BLR 47e; 32f 40e; 26f
DFO, BLR 24 10 10
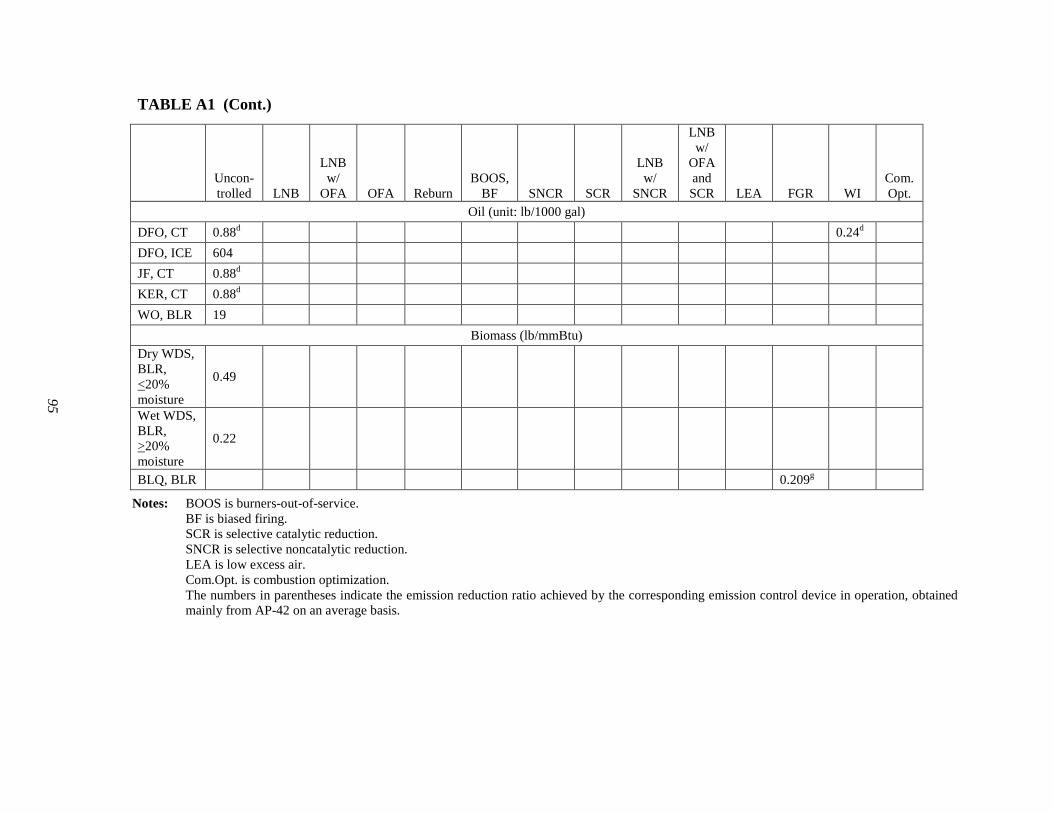
95
TABLE A1 (Cont.)
Uncon-trolled LNB
LNB w/
OFA OFA Reburn BOOS,
BF SNCR SCR
LNB w/
SNCR
LNB w/
OFA and SCR LEA FGR WI
Com.Opt.
Oil (unit: lb/1000 gal) DFO, CT 0.88d 0.24d DFO, ICE 604 JF, CT 0.88d KER, CT 0.88d WO, BLR 19
Biomass (lb/mmBtu) Dry WDS, BLR, <20% moisture
0.49
Wet WDS, BLR, >20% moisture
0.22
BLQ, BLR 0.209g Notes: BOOS is burners-out-of-service. BF is biased firing. SCR is selective catalytic reduction. SNCR is selective noncatalytic reduction. LEA is low excess air. Com.Opt. is combustion optimization. The numbers in parentheses indicate the emission reduction ratio achieved by the corresponding emission control device in operation, obtained
mainly from AP-42 on an average basis.
96
TABLE A1 (Cont.) a Source: World Bank Group, 1998. b For boilers >100 million Btu/hr. c For boilers <100 million Btu/hr. d Unit is lb/mmBtu. e Normal firing boilers. f Tangential firing boilers. g Unit is lb/ton.
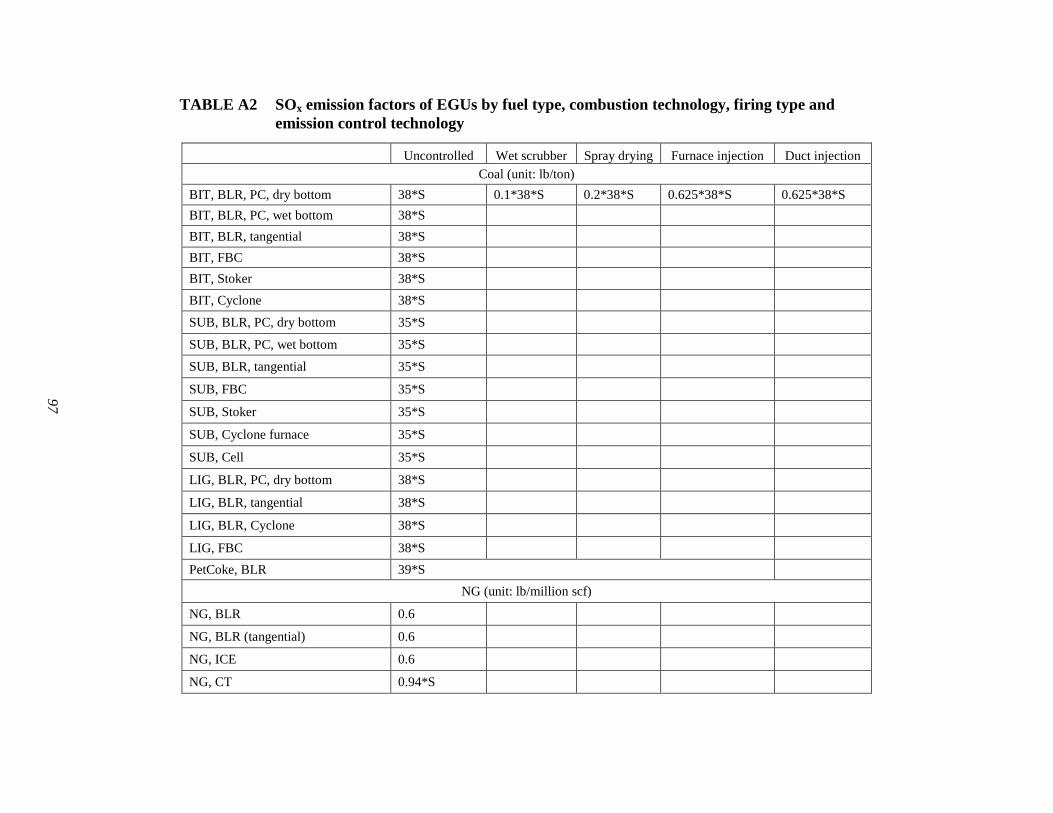
97
TABLE A2 SOx emission factors of EGUs by fuel type, combustion technology, firing type and emission control technology
Uncontrolled Wet scrubber Spray drying Furnace injection Duct injection
Coal (unit: lb/ton) BIT, BLR, PC, dry bottom 38*S 0.1*38*S 0.2*38*S 0.625*38*S 0.625*38*S BIT, BLR, PC, wet bottom 38*S BIT, BLR, tangential 38*S BIT, FBC 38*S BIT, Stoker 38*S BIT, Cyclone 38*S SUB, BLR, PC, dry bottom 35*S SUB, BLR, PC, wet bottom 35*S SUB, BLR, tangential 35*S SUB, FBC 35*S SUB, Stoker 35*S SUB, Cyclone furnace 35*S SUB, Cell 35*S LIG, BLR, PC, dry bottom 38*S LIG, BLR, tangential 38*S LIG, BLR, Cyclone 38*S LIG, FBC 38*S PetCoke, BLR 39*S
NG (unit: lb/million scf)
NG, BLR 0.6 NG, BLR (tangential) 0.6 NG, ICE 0.6 NG, CT 0.94*S
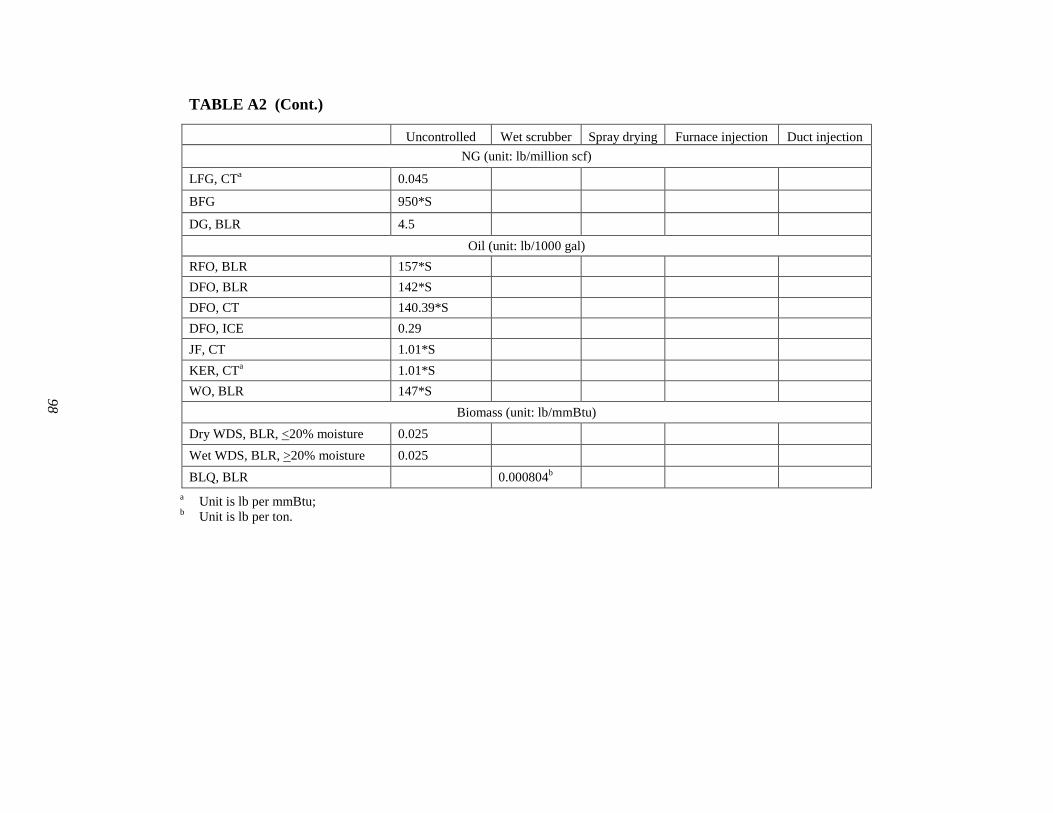
98
TABLE A2 (Cont.)
Uncontrolled Wet scrubber Spray drying Furnace injection Duct injection
NG (unit: lb/million scf)
LFG, CTa 0.045 BFG 950*S
DG, BLR 4.5 Oil (unit: lb/1000 gal)
RFO, BLR 157*S DFO, BLR 142*S DFO, CT 140.39*S DFO, ICE 0.29 JF, CT 1.01*S KER, CTa 1.01*S WO, BLR 147*S
Biomass (unit: lb/mmBtu) Dry WDS, BLR, <20% moisture 0.025 Wet WDS, BLR, >20% moisture 0.025 BLQ, BLR 0.000804b
a Unit is lb per mmBtu; b Unit is lb per ton.
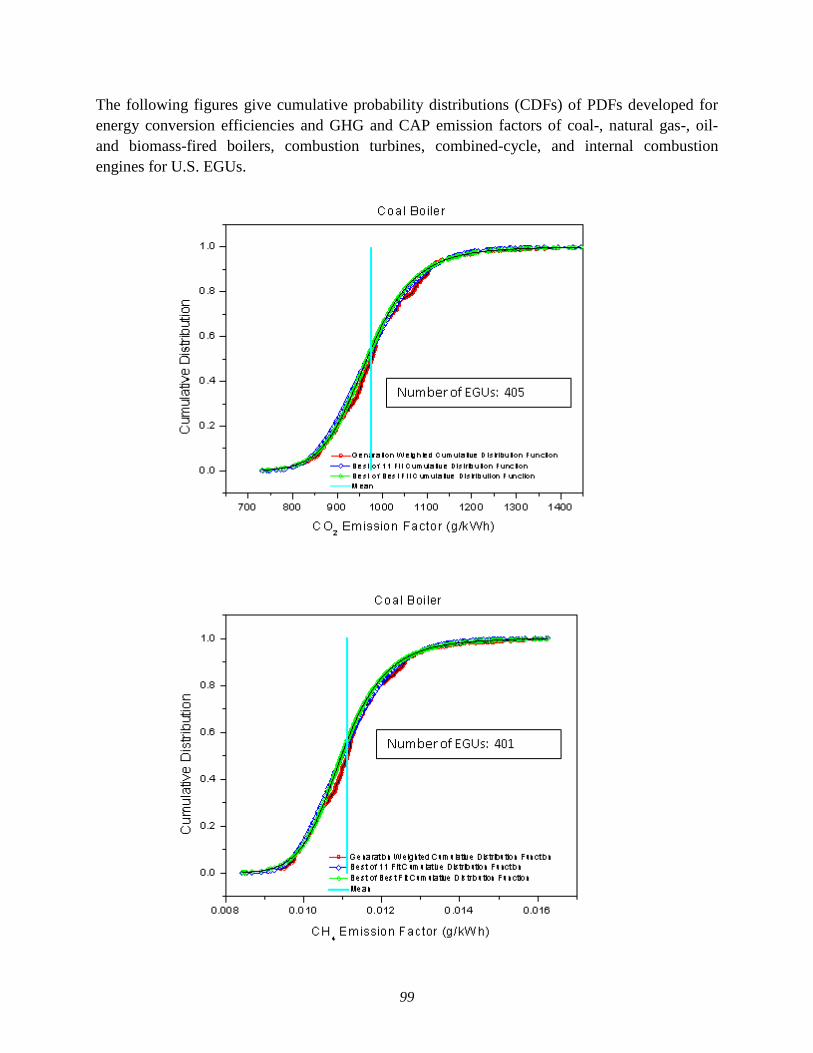
99
The following figures give cumulative probability distributions (CDFs) of PDFs developed for energy conversion efficiencies and GHG and CAP emission factors of coal-, natural gas-, oil- and biomass-fired boilers, combustion turbines, combined-cycle, and internal combustion engines for U.S. EGUs.
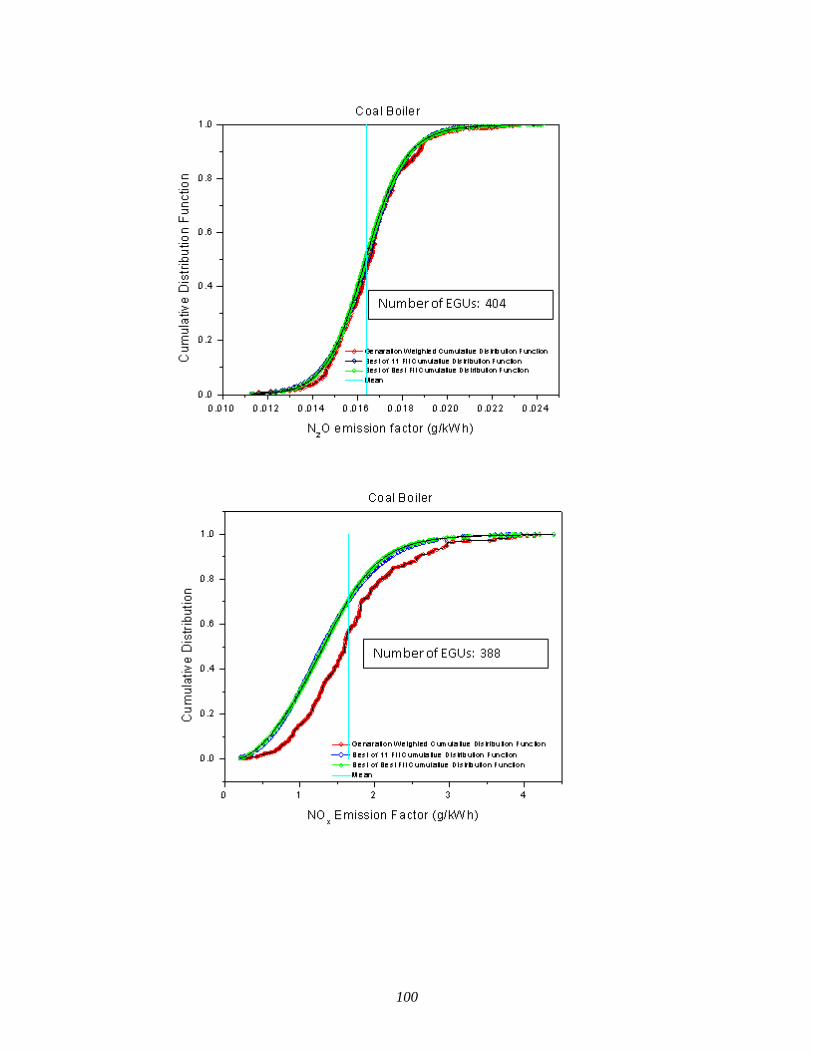
100
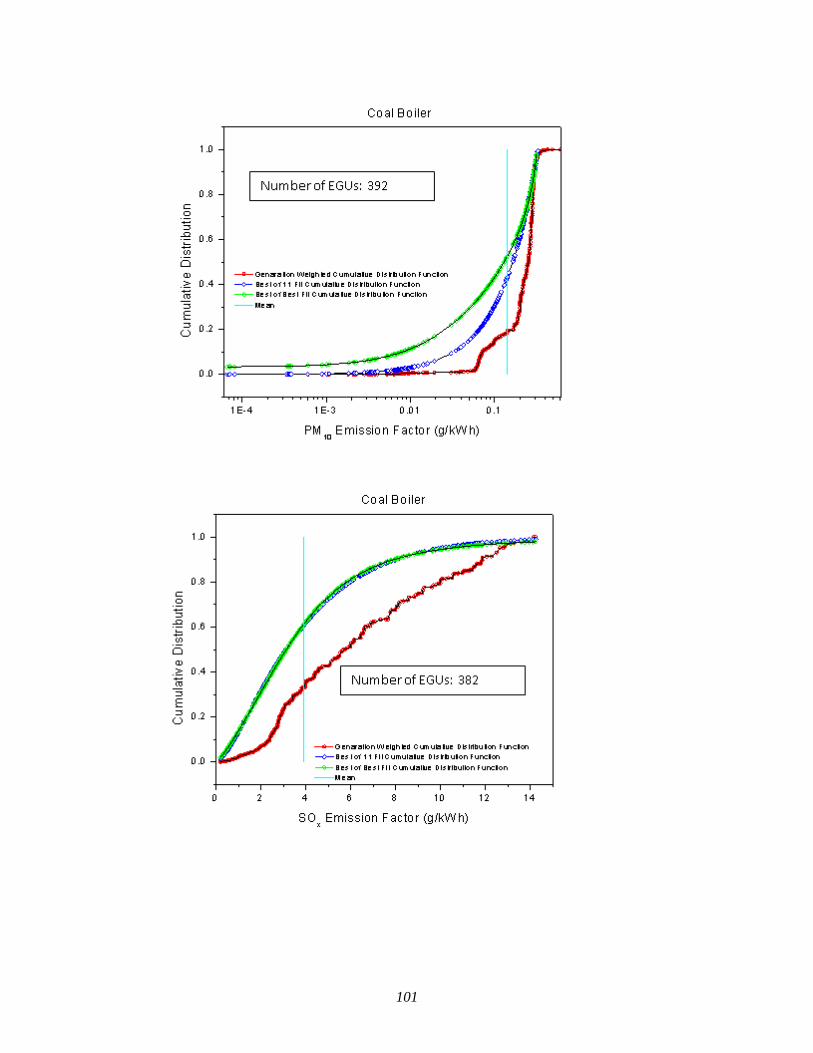
101
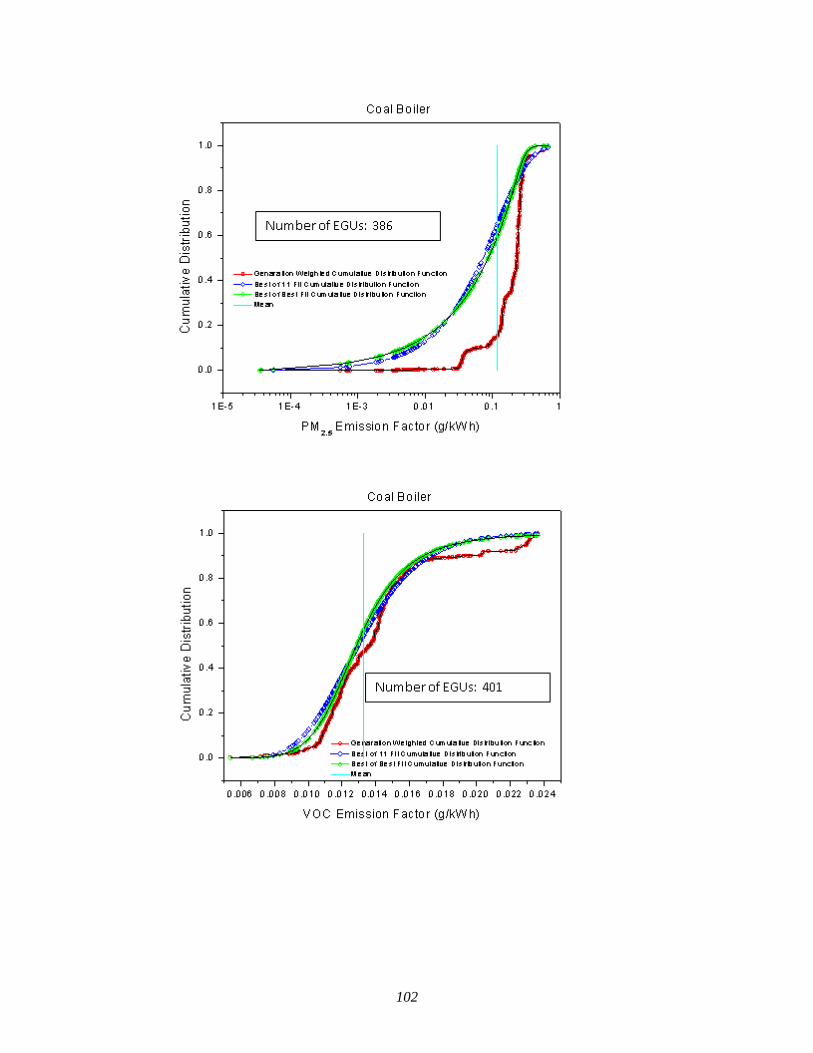
102
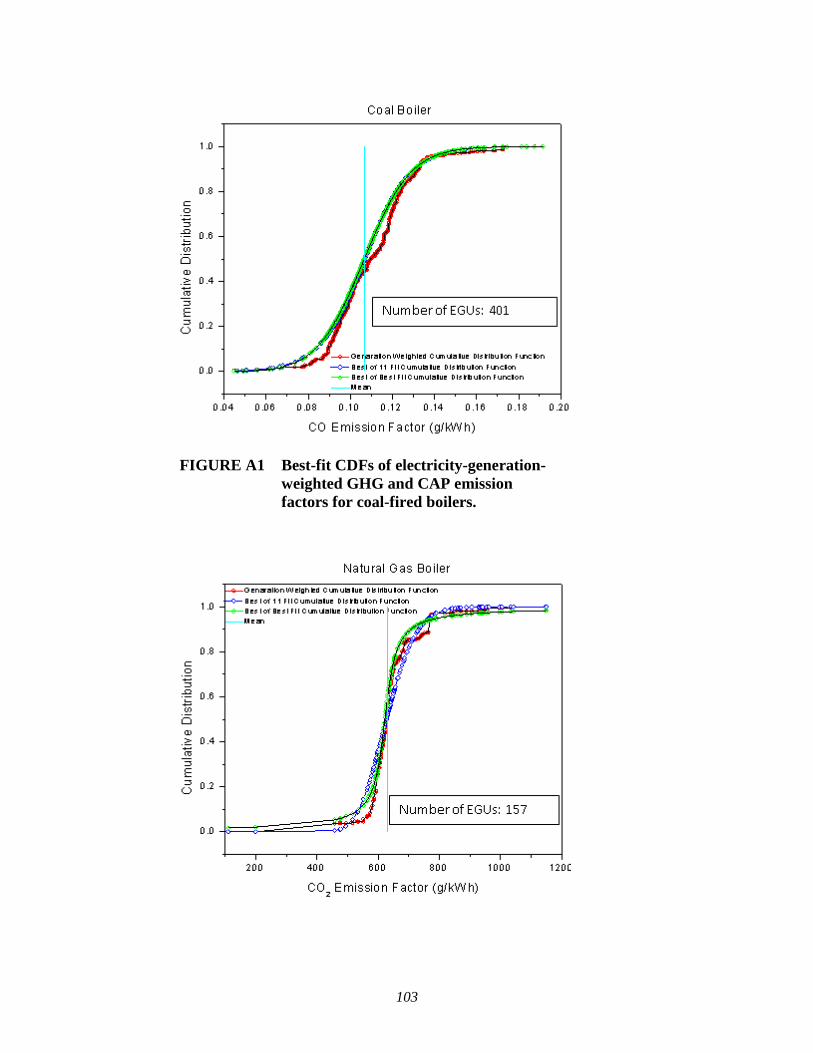
103
FIGURE A1 Best-fit CDFs of electricity-generation-
weighted GHG and CAP emission factors for coal-fired boilers.
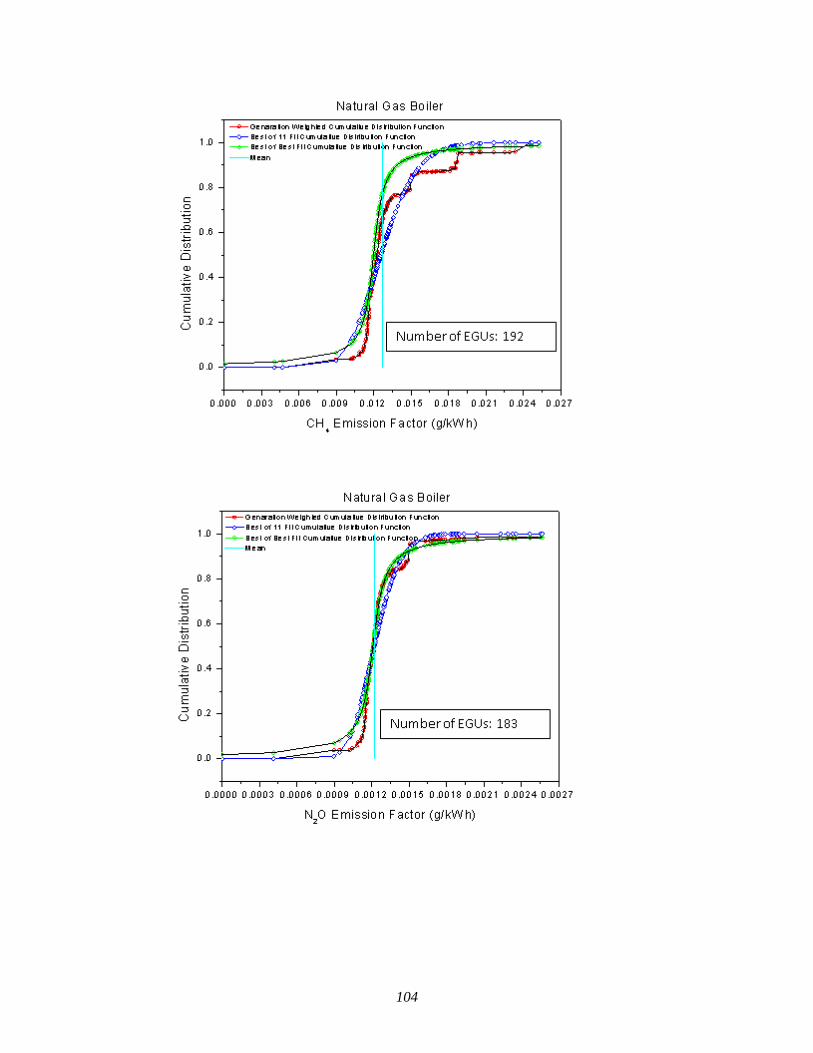
104
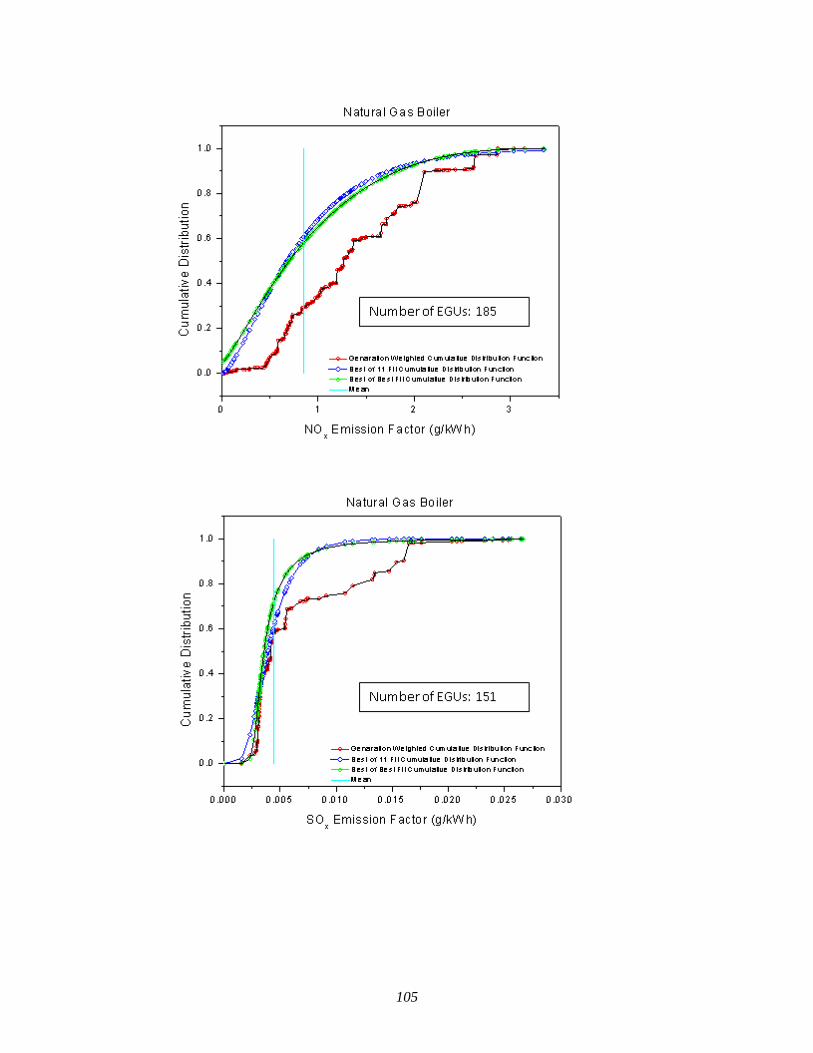
105
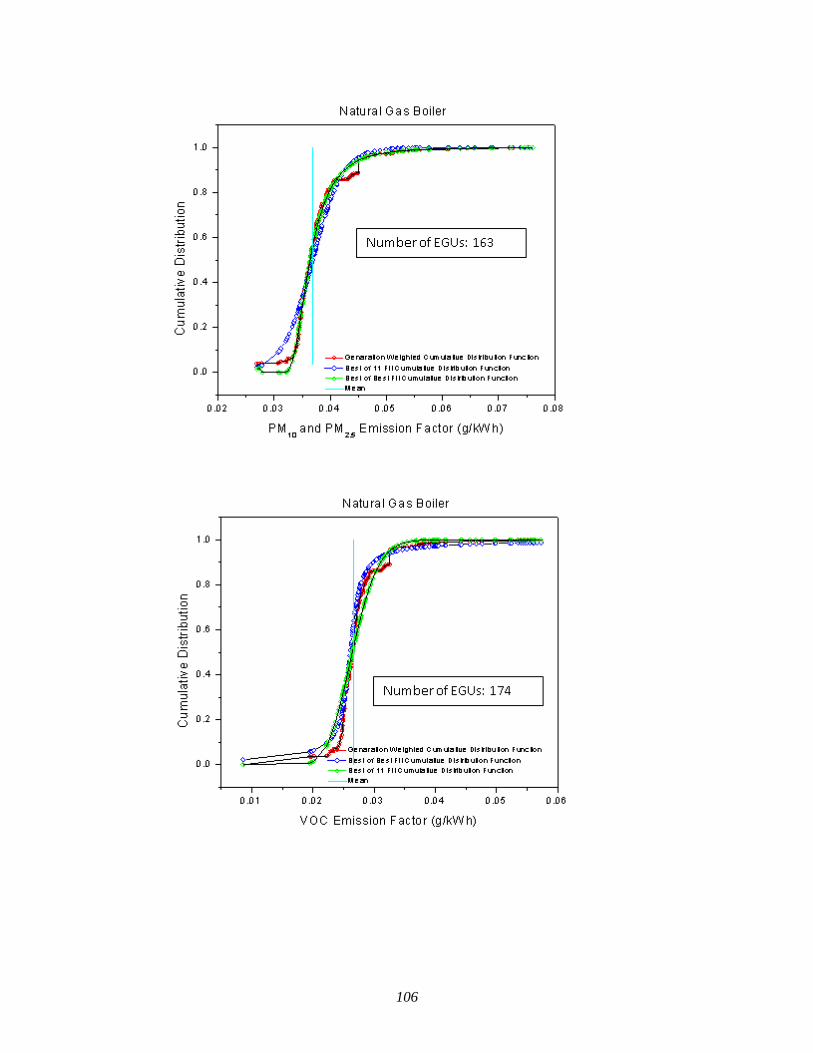
106
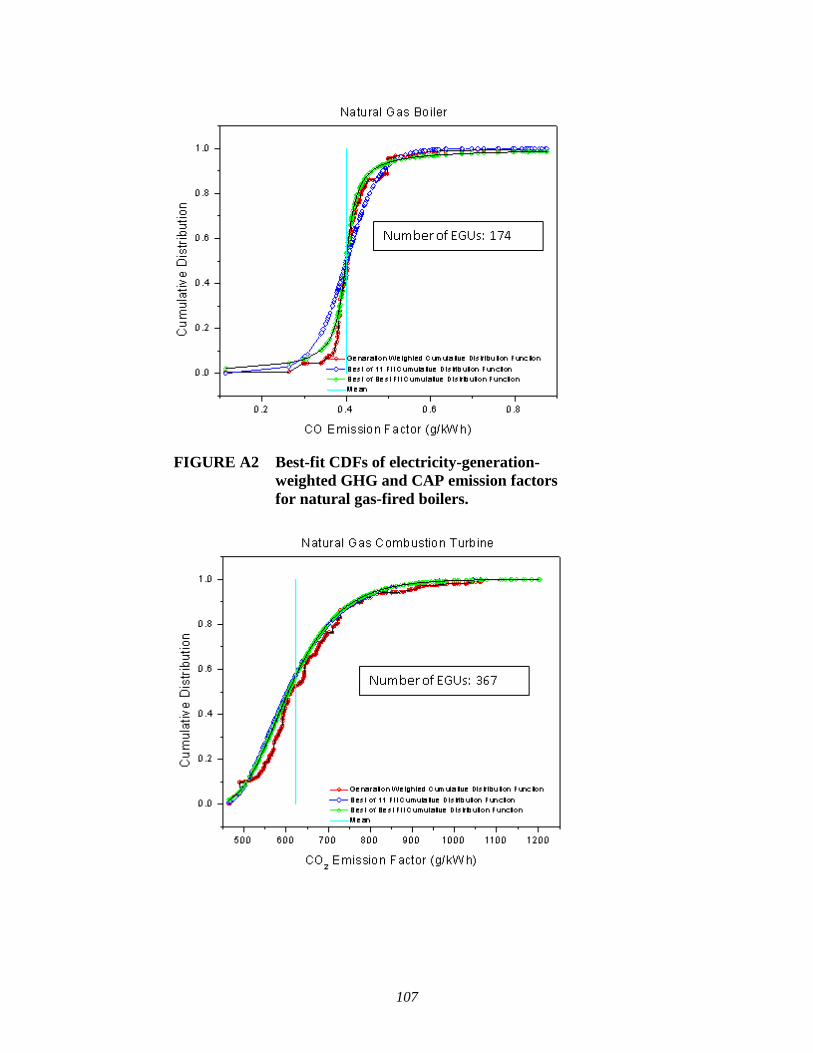
107
FIGURE A2 Best-fit CDFs of electricity-generation-
weighted GHG and CAP emission factors for natural gas-fired boilers.
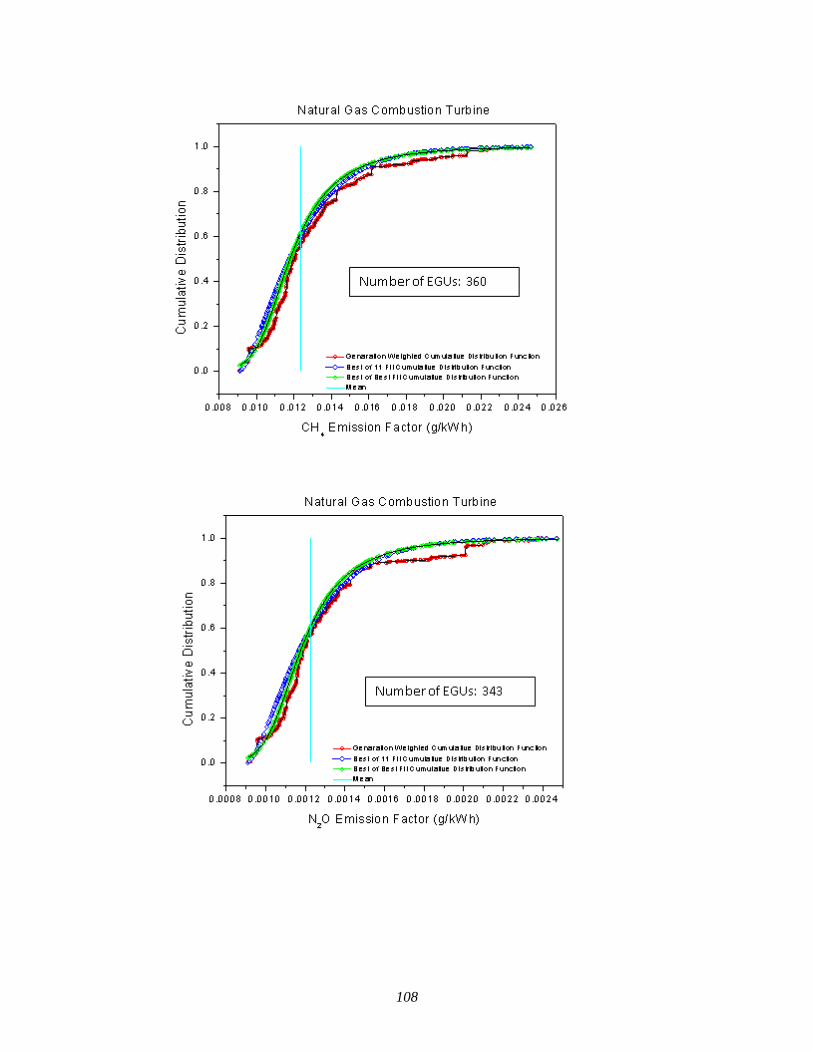
108
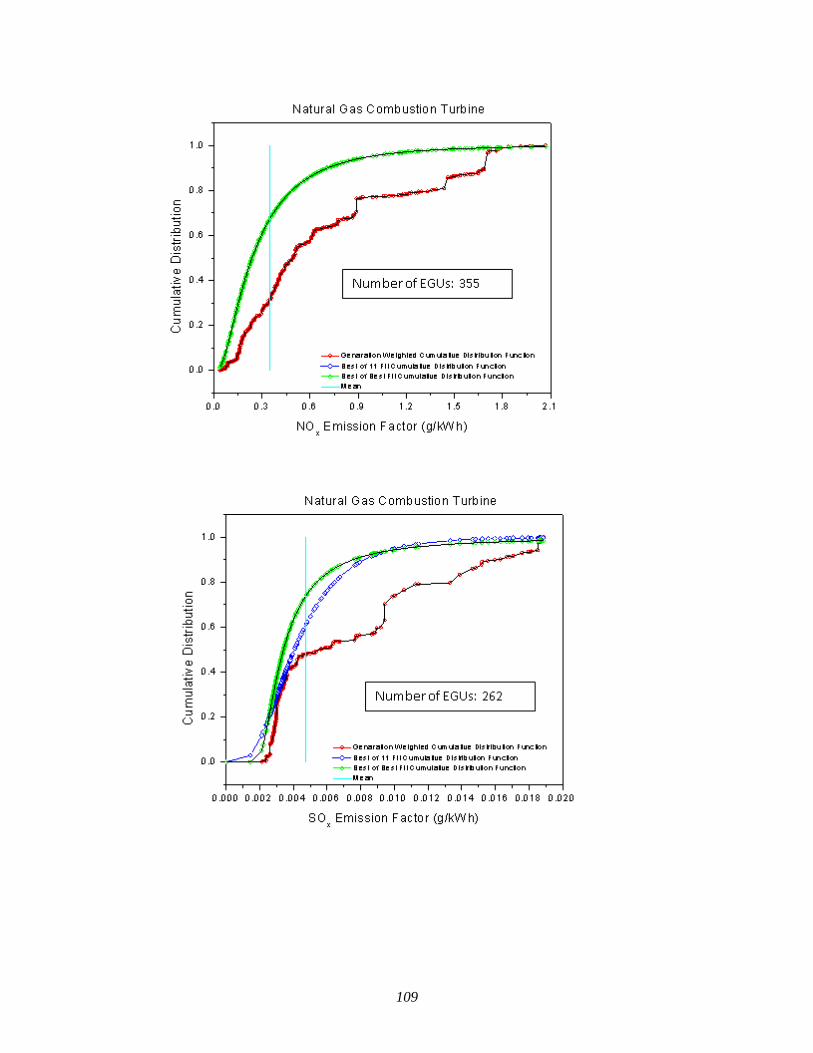
109
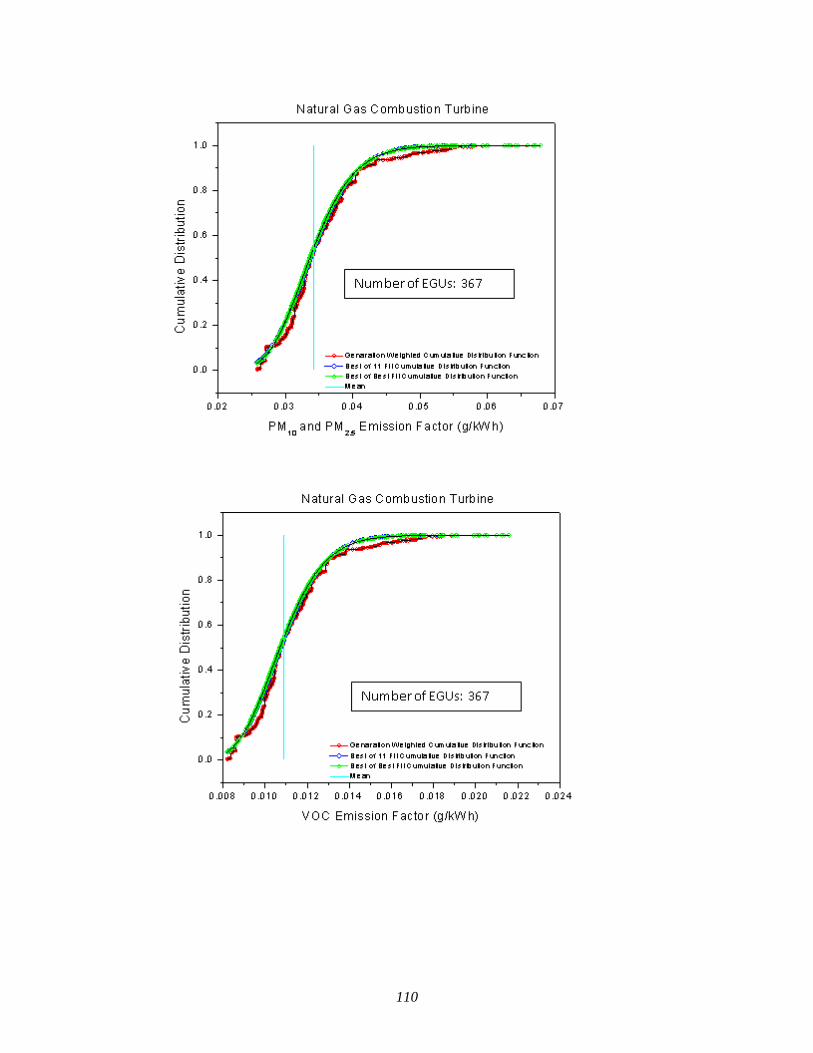
110
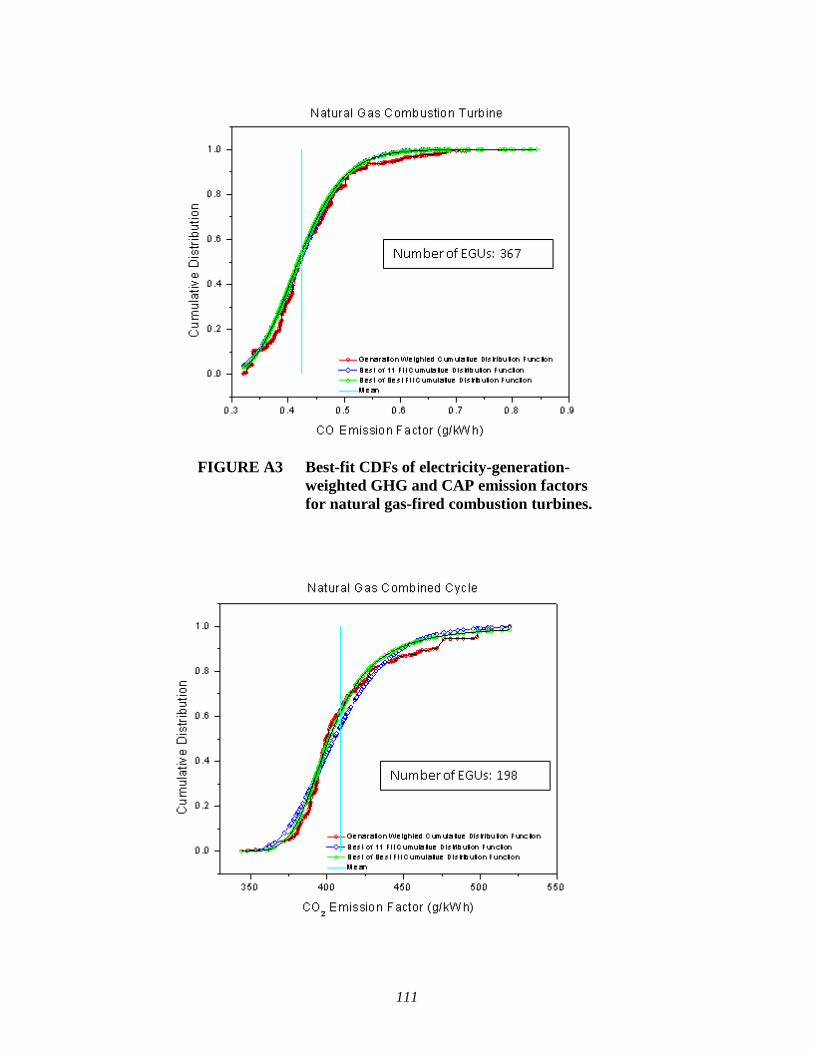
111
FIGURE A3 Best-fit CDFs of electricity-generation-
weighted GHG and CAP emission factors for natural gas-fired combustion turbines.
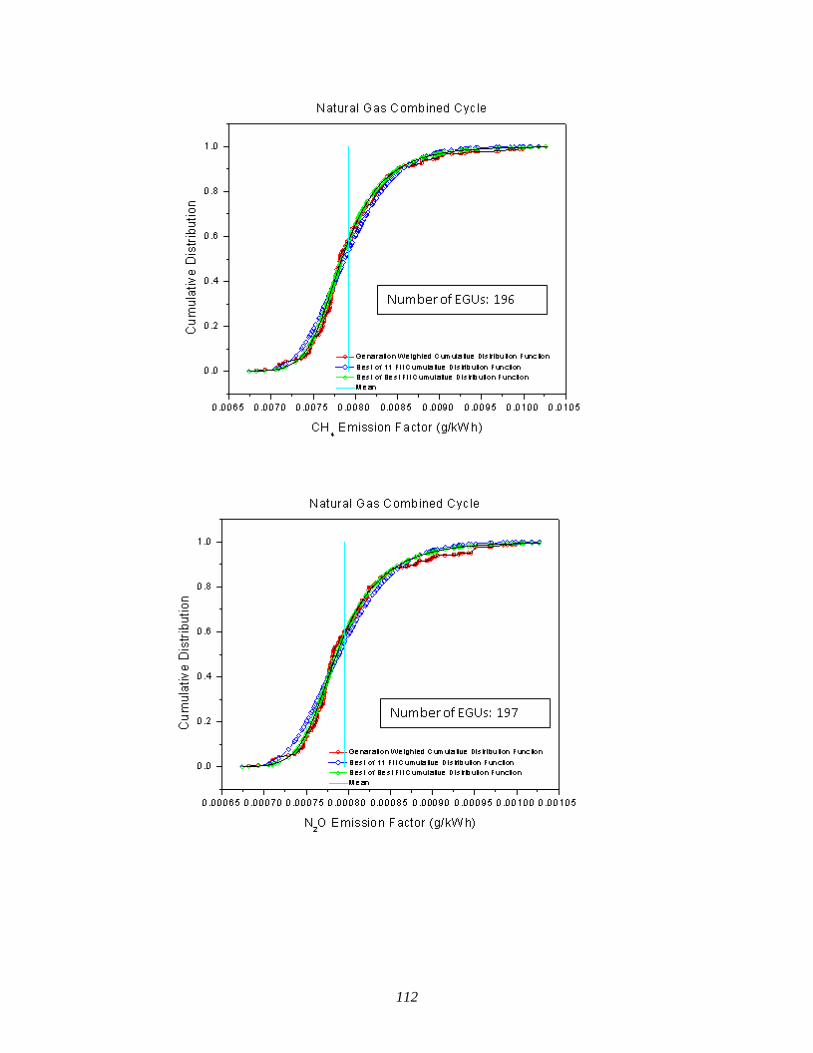
112
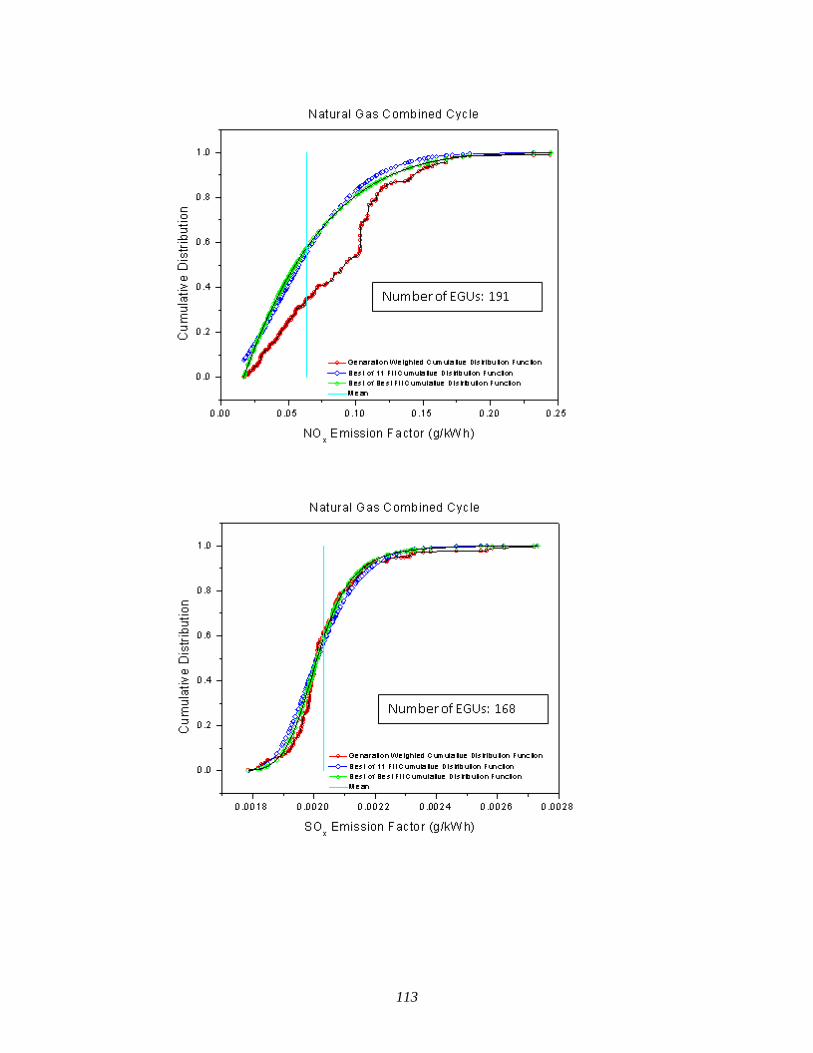
113
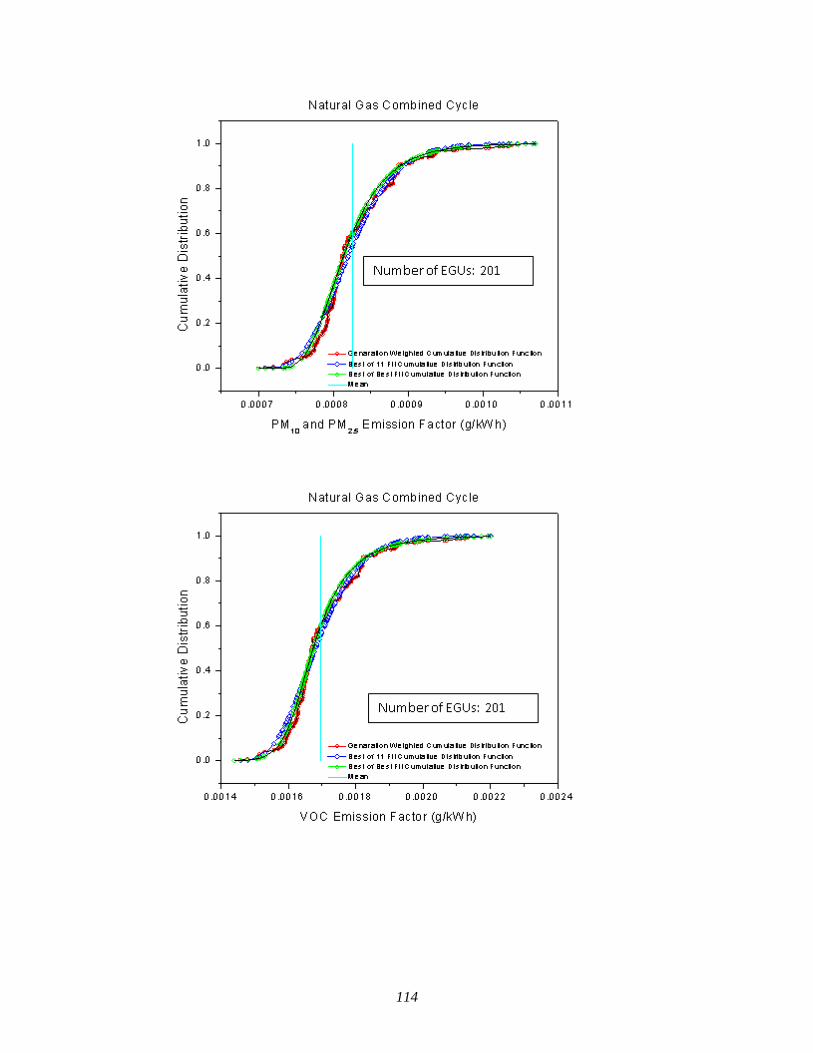
114
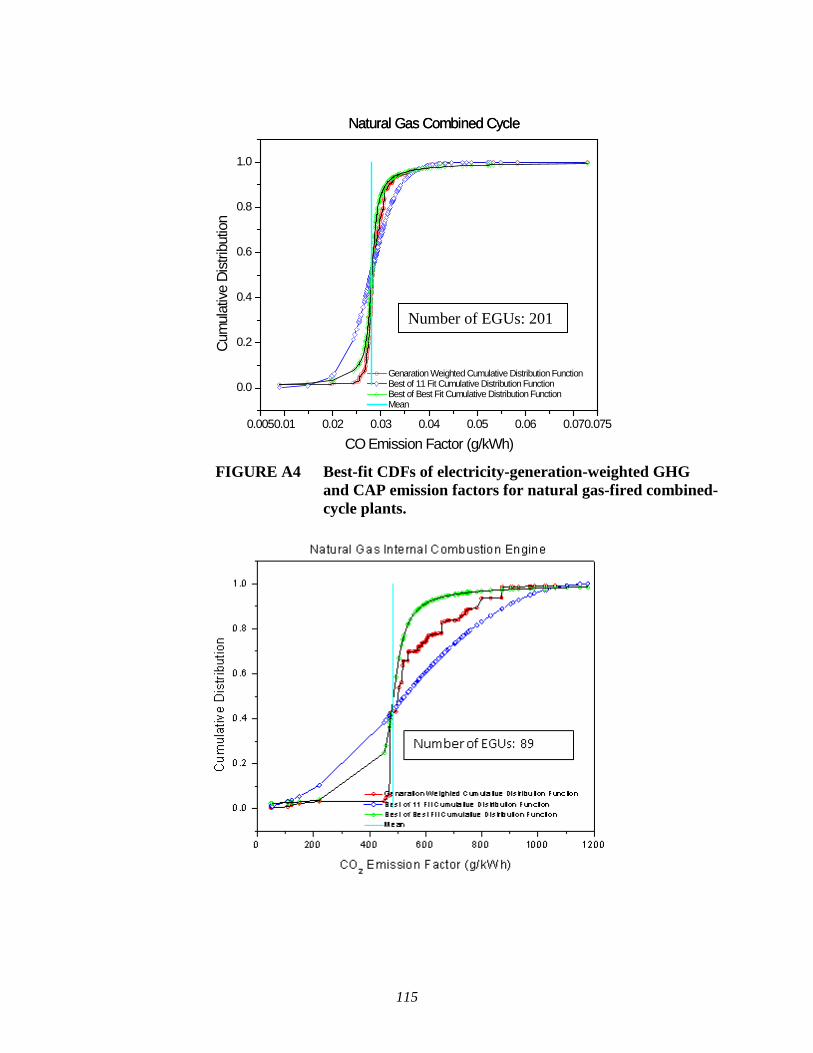
115
FIGURE A4 Best-fit CDFs of electricity-generation-weighted GHG and CAP emission factors for natural gas-fired combined-cycle plants.
Number of EGUs: 201
Genaration Weighted Cumulative Distribution Function Best of 11 Fit Cumulative Distribution Function Best of Best Fit Cumulative Distribution Function Mean
0.0050.01 0.02 0.03 0.04 0.05 0.06 0.070.075
0.0
0.2
0.4
0.6
0.8
1.0
Natural Gas Combined CycleNatural Gas Combined Cycle
Cum
ulat
ive D
istrib
utio
n
CO Emission Factor (g/kWh)
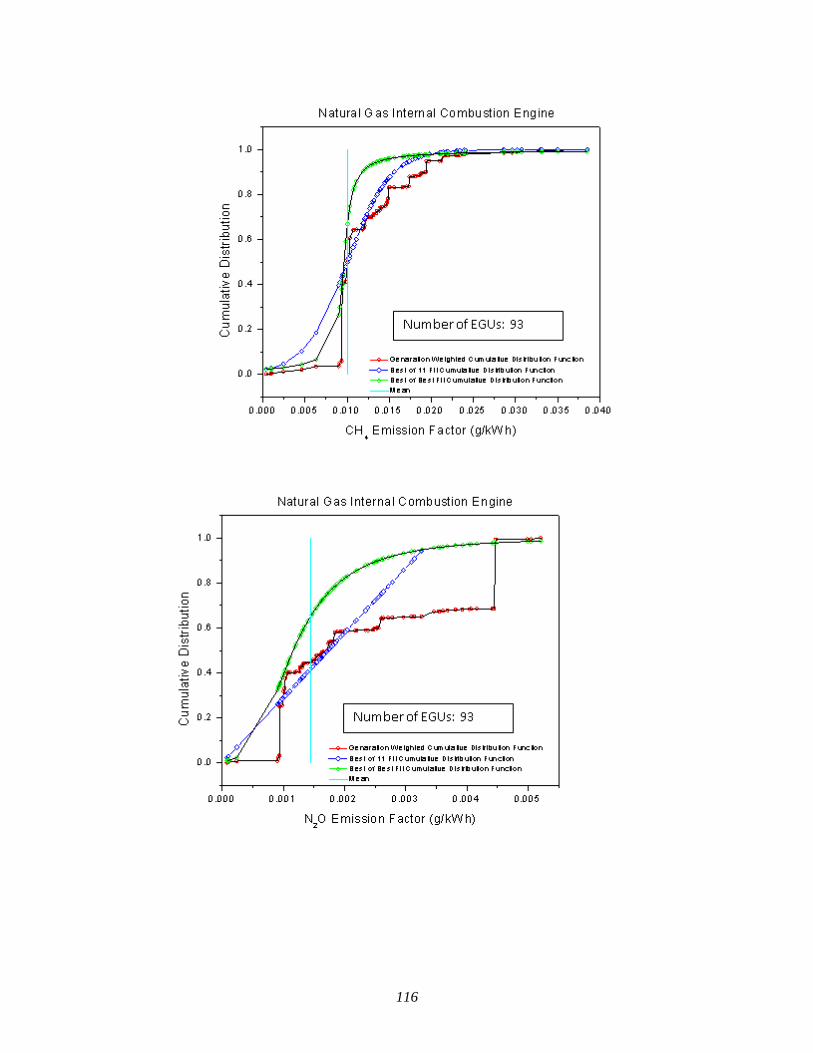
116
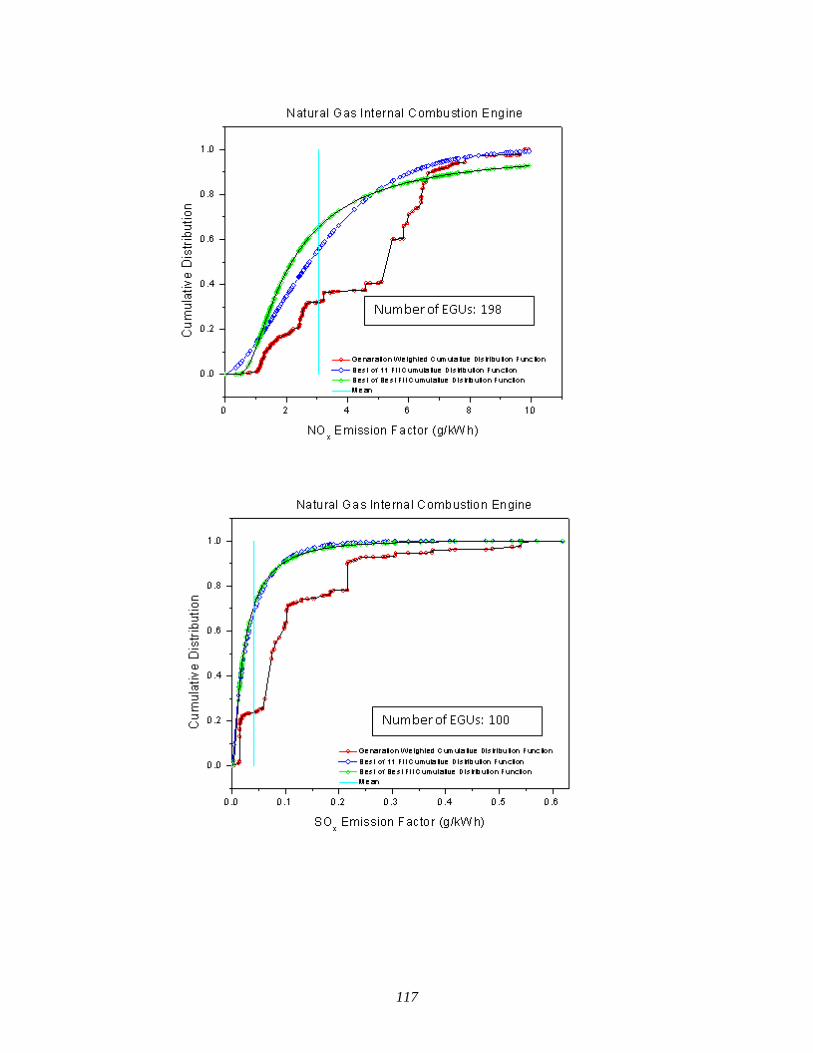
117
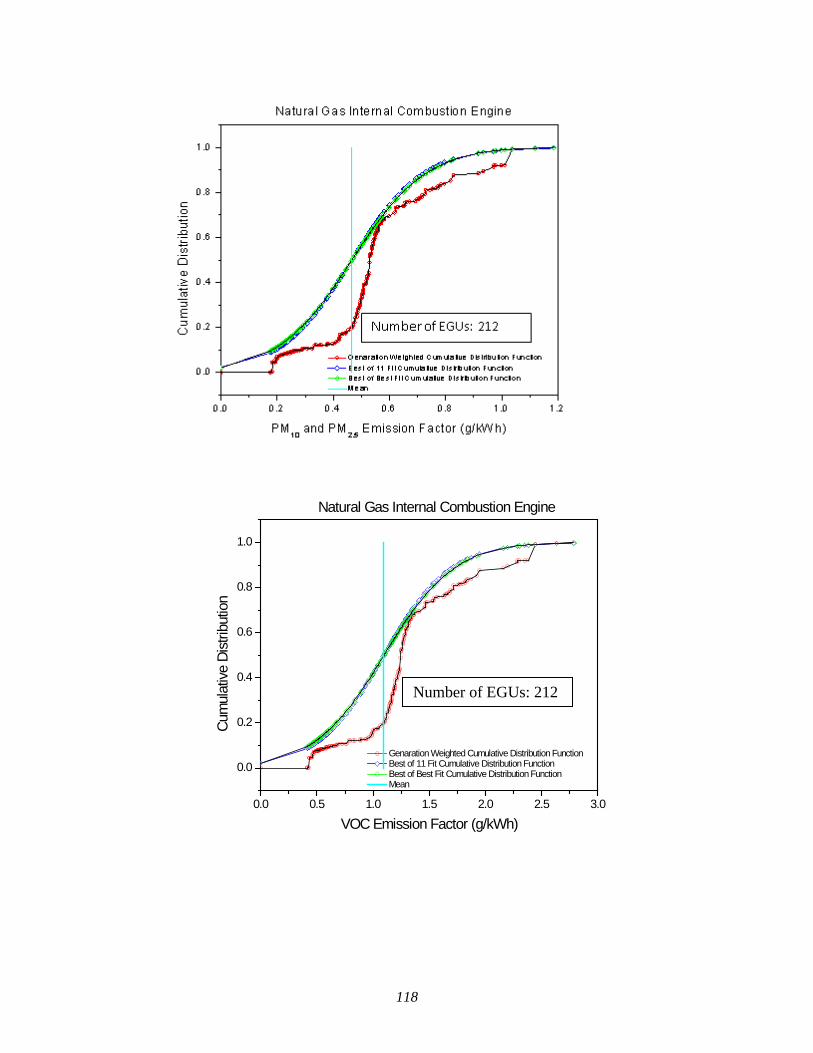
118
Genaration Weighted Cumulative Distribution Function Best of 11 Fit Cumulative Distribution Function Best of Best Fit Cumulative Distribution Function Mean
0.0 0.5 1.0 1.5 2.0 2.5 3.0
0.0
0.2
0.4
0.6
0.8
1.0
Natural Gas Internal Combustion Engine
Cum
ulat
ive D
istrib
utio
n
VOC Emission Factor (g/kWh)
Number of EGUs: 212
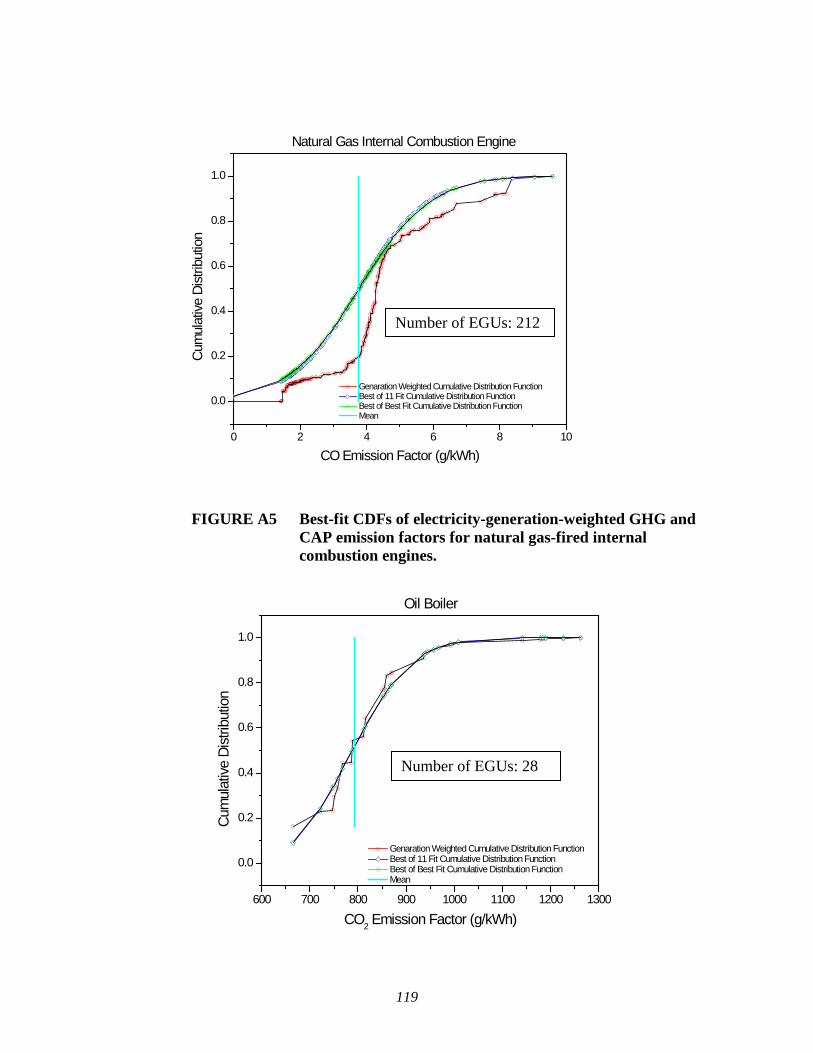
119
FIGURE A5 Best-fit CDFs of electricity-generation-weighted GHG and CAP emission factors for natural gas-fired internal combustion engines.
Genaration Weighted Cumulative Distribution Function Best of 11 Fit Cumulative Distribution Function Best of Best Fit Cumulative Distribution Function Mean
0 2 4 6 8 10
0.0
0.2
0.4
0.6
0.8
1.0
Natural Gas Internal Combustion Engine
Cum
ulat
ive D
istrib
utio
n
CO Emission Factor (g/kWh)
Genaration Weighted Cumulative Distribution Function Best of 11 Fit Cumulative Distribution Function Best of Best Fit Cumulative Distribution Function Mean
600 700 800 900 1000 1100 1200 1300
0.0
0.2
0.4
0.6
0.8
1.0
Oil Boiler
Cum
ulat
ive D
istrib
utio
n
CO2 Emission Factor (g/kWh)
Number of EGUs: 28
Number of EGUs: 212
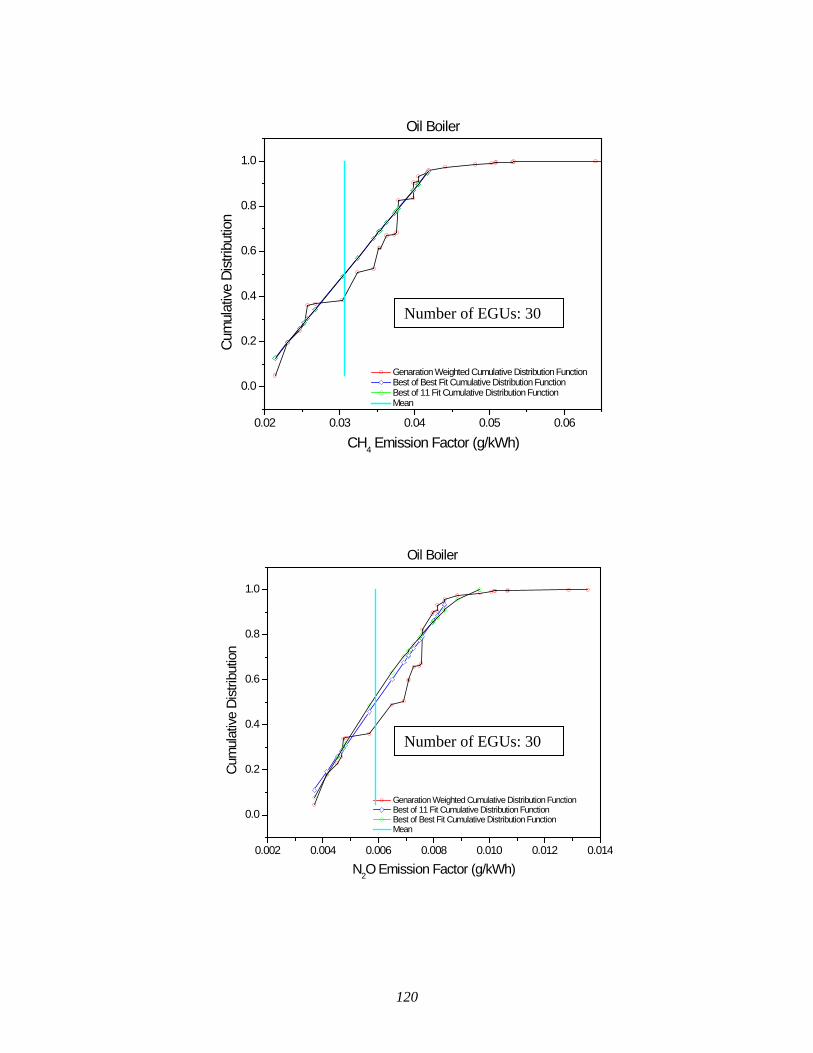
120
Genaration Weighted Cumulative Distribution Function Best of Best Fit Cumulative Distribution Function Best of 11 Fit Cumulative Distribution Function Mean
0.02 0.03 0.04 0.05 0.06
0.0
0.2
0.4
0.6
0.8
1.0
Oil Boiler
Cum
ulat
ive D
istrib
utio
n
CH4 Emission Factor (g/kWh)
Number of EGUs: 30
Number of EGUs: 30
Genaration Weighted Cumulative Distribution Function Best of 11 Fit Cumulative Distribution Function Best of Best Fit Cumulative Distribution Function Mean
0.002 0.004 0.006 0.008 0.010 0.012 0.014
0.0
0.2
0.4
0.6
0.8
1.0
Oil Boiler
Cum
ulat
ive D
istrib
utio
n
N2O Emission Factor (g/kWh)
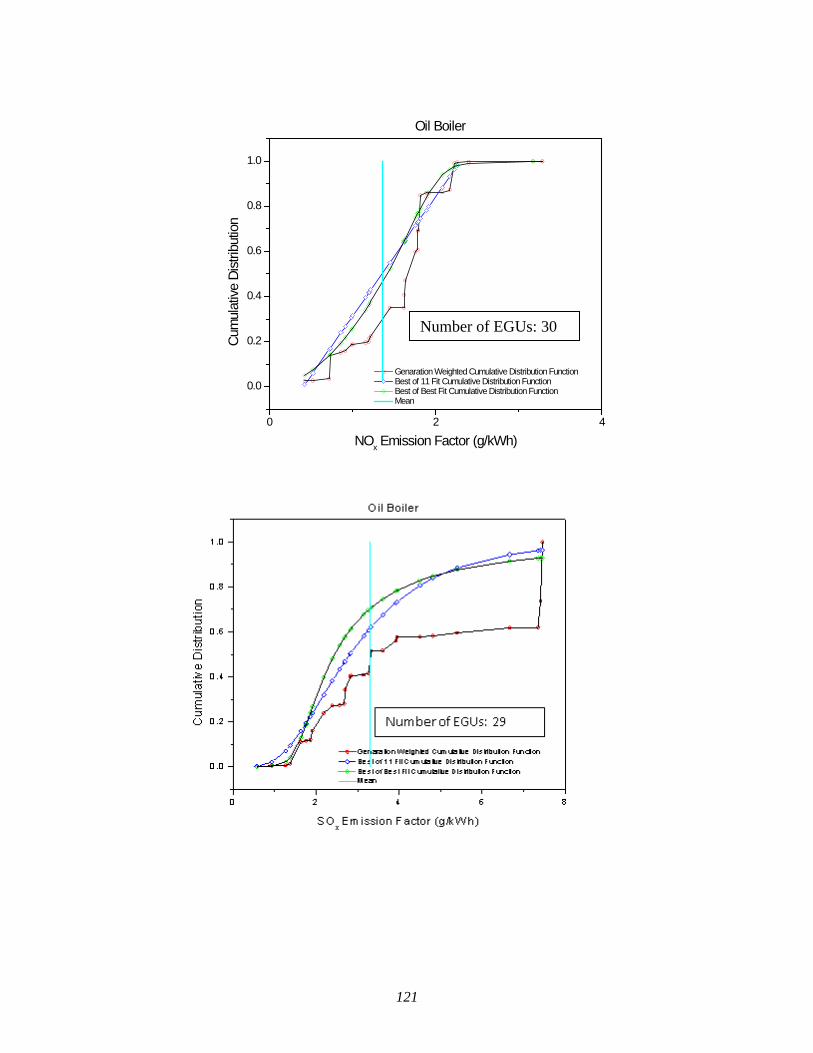
121
Genaration Weighted Cumulative Distribution Function Best of 11 Fit Cumulative Distribution Function Best of Best Fit Cumulative Distribution Function Mean
0 2 4
0.0
0.2
0.4
0.6
0.8
1.0
Oil Boiler
Cum
ulat
ive D
istrib
utio
n
NOx Emission Factor (g/kWh)
Number of EGUs: 30
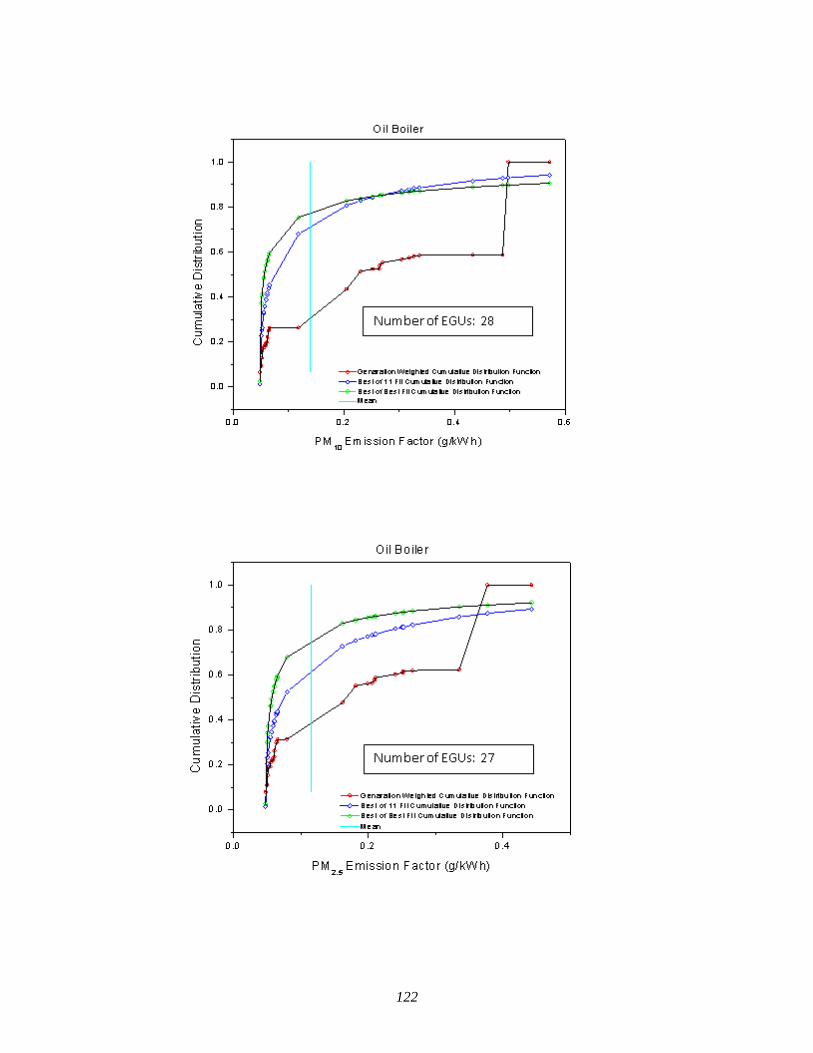
122
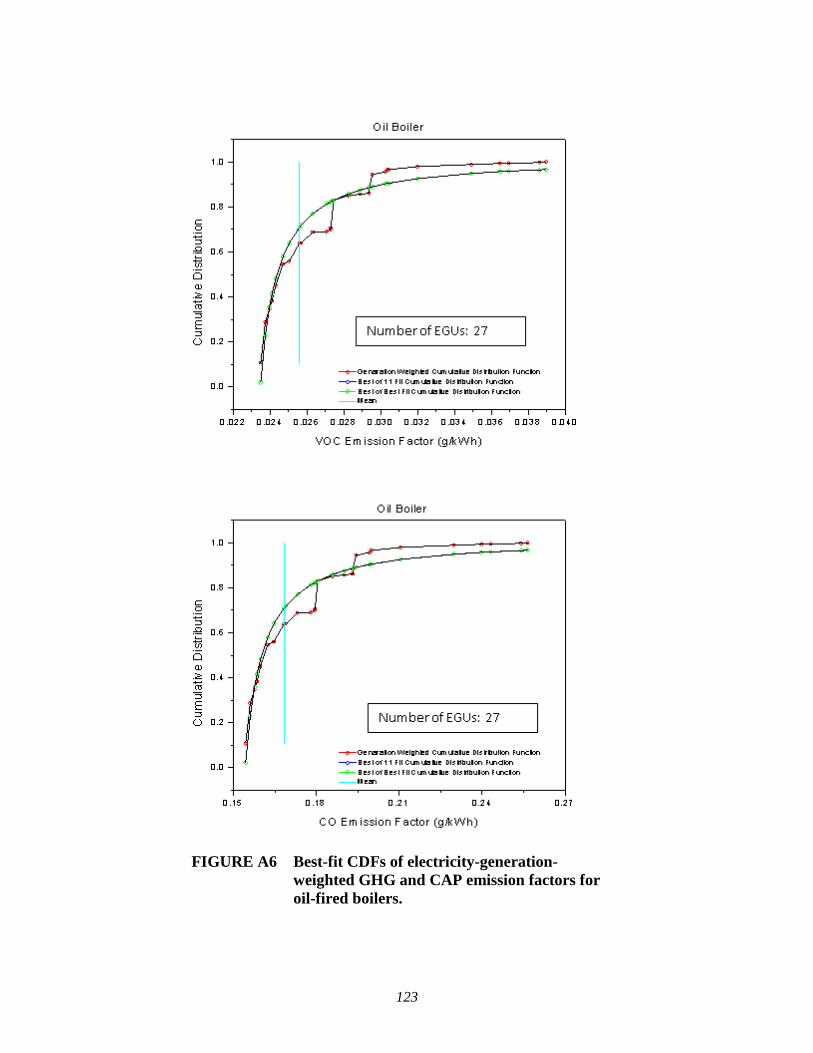
123
FIGURE A6 Best-fit CDFs of electricity-generation-
weighted GHG and CAP emission factors for oil-fired boilers.
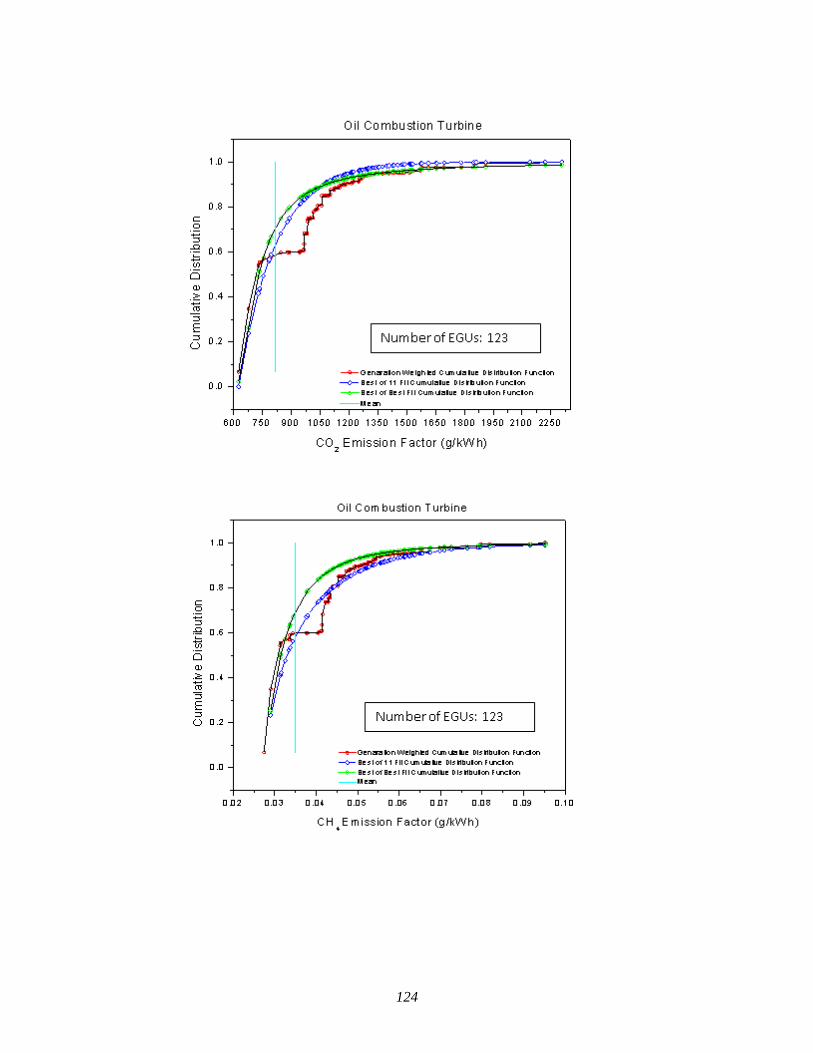
124
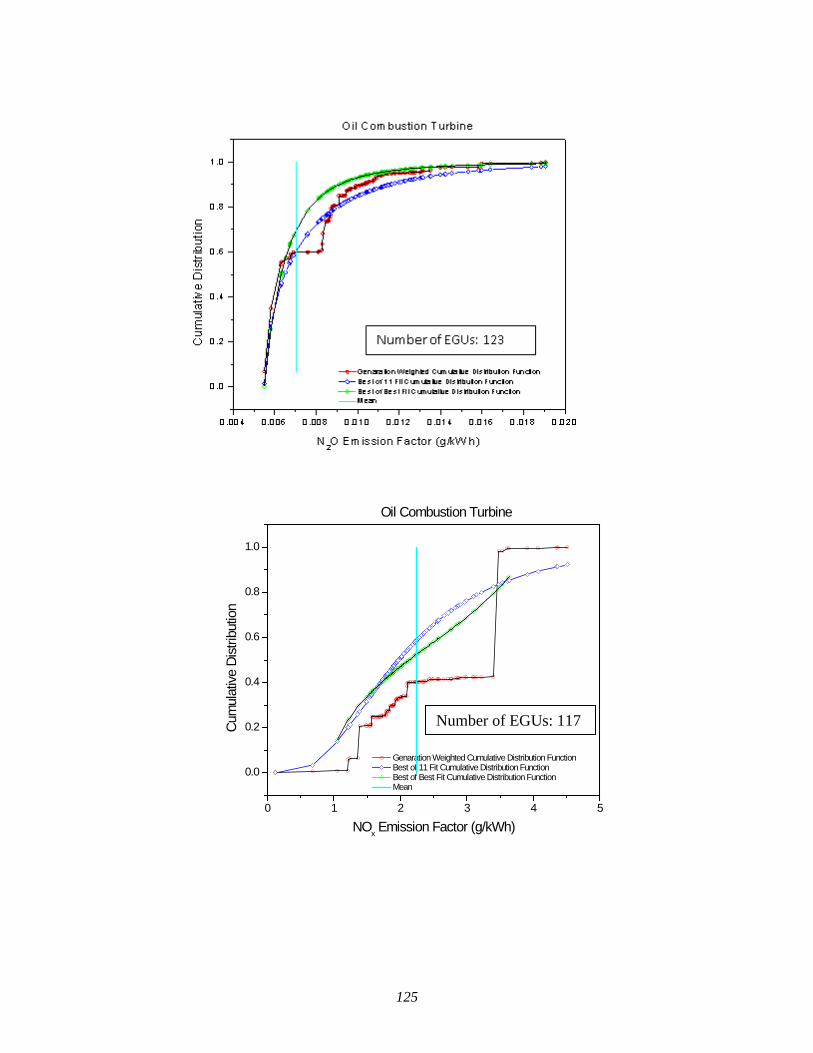
125
Genaration Weighted Cumulative Distribution Function Best of 11 Fit Cumulative Distribution Function Best of Best Fit Cumulative Distribution Function Mean
0 1 2 3 4 5
0.0
0.2
0.4
0.6
0.8
1.0
Oil Combustion Turbine
Cum
ulat
ive D
istrib
utio
n
NOx Emission Factor (g/kWh)
Number of EGUs: 117
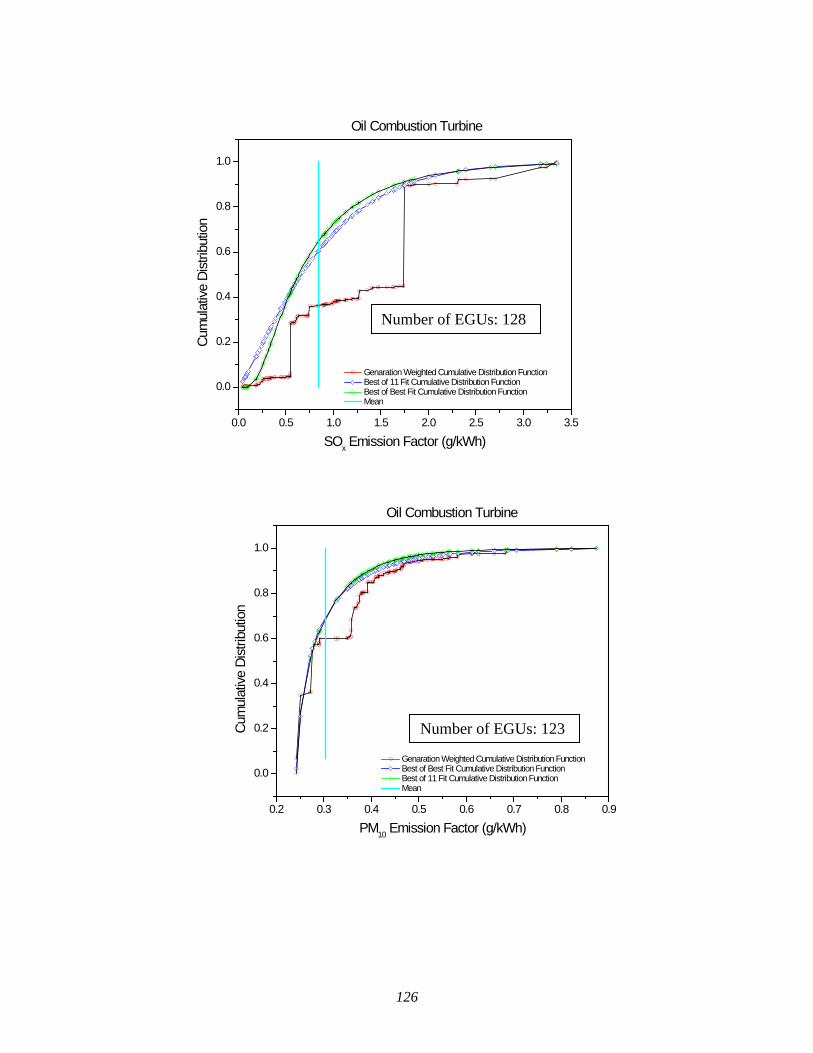
126
Genaration Weighted Cumulative Distribution Function Best of 11 Fit Cumulative Distribution Function Best of Best Fit Cumulative Distribution Function Mean
0.0 0.5 1.0 1.5 2.0 2.5 3.0 3.5
0.0
0.2
0.4
0.6
0.8
1.0
Oil Combustion Turbine
Cum
ulat
ive D
istrib
utio
n
SOx Emission Factor (g/kWh)
Number of EGUs: 128
Genaration Weighted Cumulative Distribution Function Best of Best Fit Cumulative Distribution Function Best of 11 Fit Cumulative Distribution Function Mean
0.2 0.3 0.4 0.5 0.6 0.7 0.8 0.9
0.0
0.2
0.4
0.6
0.8
1.0
Oil Combustion Turbine
Cum
ulat
ive D
istrib
utio
n
PM10 Emission Factor (g/kWh)
Number of EGUs: 123
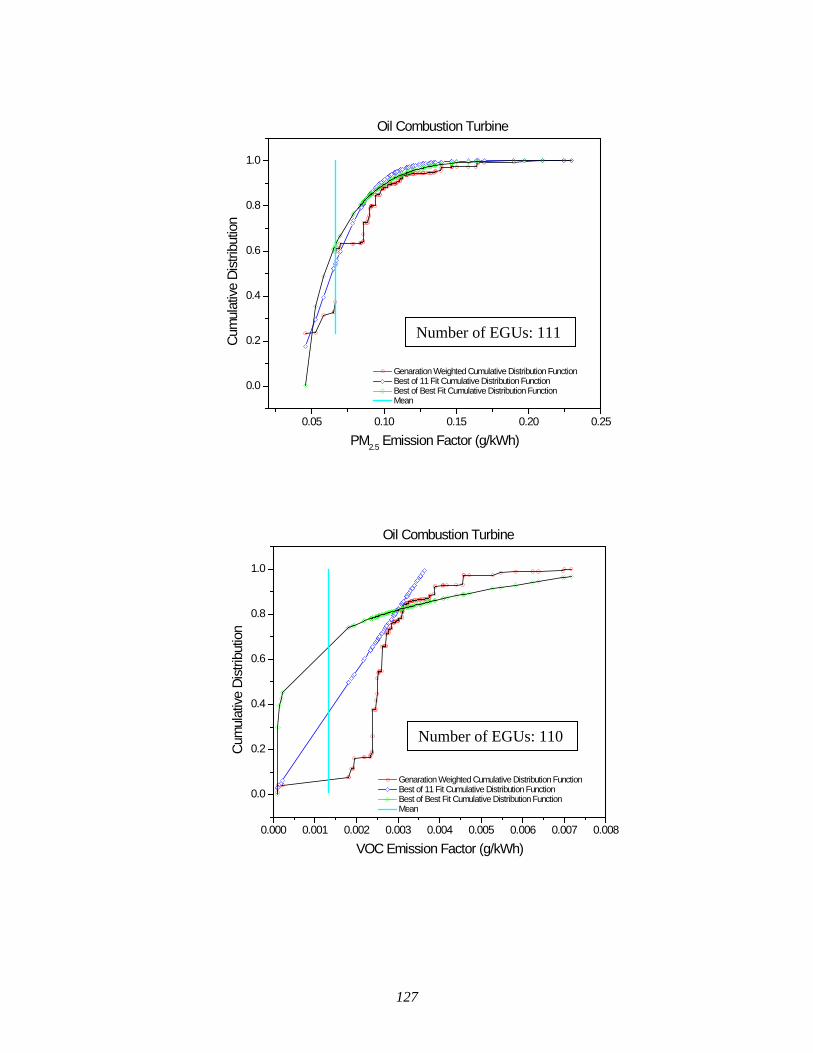
127
Genaration Weighted Cumulative Distribution Function Best of 11 Fit Cumulative Distribution Function Best of Best Fit Cumulative Distribution Function Mean
0.05 0.10 0.15 0.20 0.25
0.0
0.2
0.4
0.6
0.8
1.0
Oil Combustion Turbine
Cum
ulat
ive D
istrib
utio
n
PM2.5 Emission Factor (g/kWh)
Genaration Weighted Cumulative Distribution Function Best of 11 Fit Cumulative Distribution Function Best of Best Fit Cumulative Distribution Function Mean
0.000 0.001 0.002 0.003 0.004 0.005 0.006 0.007 0.008
0.0
0.2
0.4
0.6
0.8
1.0
Oil Combustion Turbine
Cum
ulat
ive D
istrib
utio
n
VOC Emission Factor (g/kWh)
Number of EGUs: 110
Number of EGUs: 111
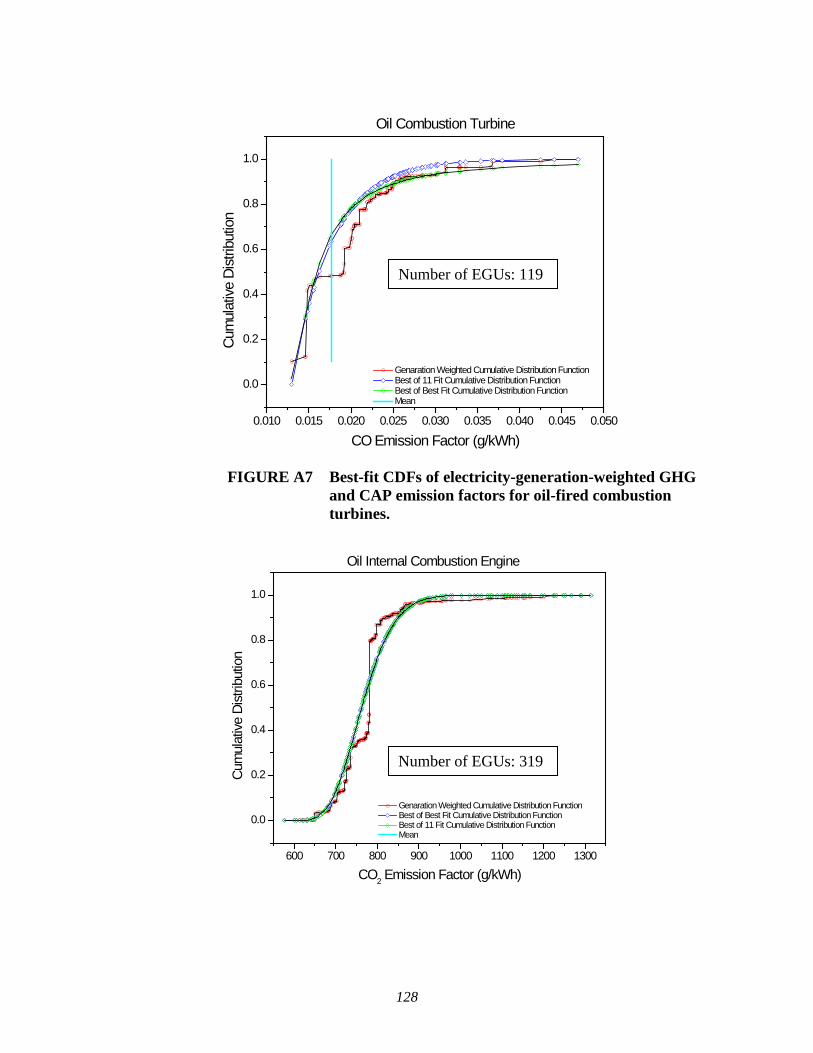
128
FIGURE A7 Best-fit CDFs of electricity-generation-weighted GHG
and CAP emission factors for oil-fired combustion turbines.
Genaration Weighted Cumulative Distribution Function Best of 11 Fit Cumulative Distribution Function Best of Best Fit Cumulative Distribution Function Mean
0.010 0.015 0.020 0.025 0.030 0.035 0.040 0.045 0.050
0.0
0.2
0.4
0.6
0.8
1.0
Oil Combustion Turbine
Cum
ulat
ive D
istrib
utio
n
CO Emission Factor (g/kWh)
Genaration Weighted Cumulative Distribution Function Best of Best Fit Cumulative Distribution Function Best of 11 Fit Cumulative Distribution Function Mean
600 700 800 900 1000 1100 1200 1300
0.0
0.2
0.4
0.6
0.8
1.0
Oil Internal Combustion Engine
Cum
ulat
ive D
istrib
utio
n
CO2 Emission Factor (g/kWh)
Number of EGUs: 319
Number of EGUs: 119
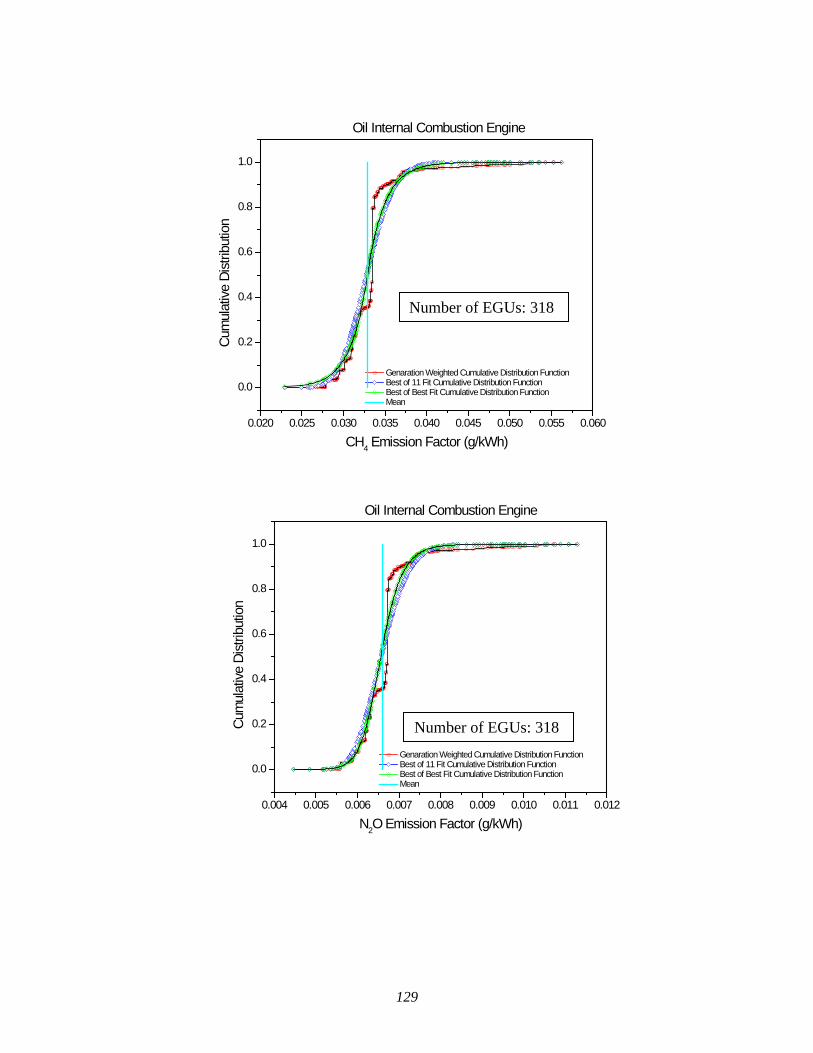
129
Genaration Weighted Cumulative Distribution Function Best of 11 Fit Cumulative Distribution Function Best of Best Fit Cumulative Distribution Function Mean
0.020 0.025 0.030 0.035 0.040 0.045 0.050 0.055 0.060
0.0
0.2
0.4
0.6
0.8
1.0
Oil Internal Combustion Engine
Cum
ulat
ive D
istrib
utio
n
CH4 Emission Factor (g/kWh)
Genaration Weighted Cumulative Distribution Function Best of 11 Fit Cumulative Distribution Function Best of Best Fit Cumulative Distribution Function Mean
0.004 0.005 0.006 0.007 0.008 0.009 0.010 0.011 0.012
0.0
0.2
0.4
0.6
0.8
1.0
Oil Internal Combustion Engine
Cum
ulat
ive D
istrib
utio
n
N2O Emission Factor (g/kWh)
Number of EGUs: 318
Number of EGUs: 318
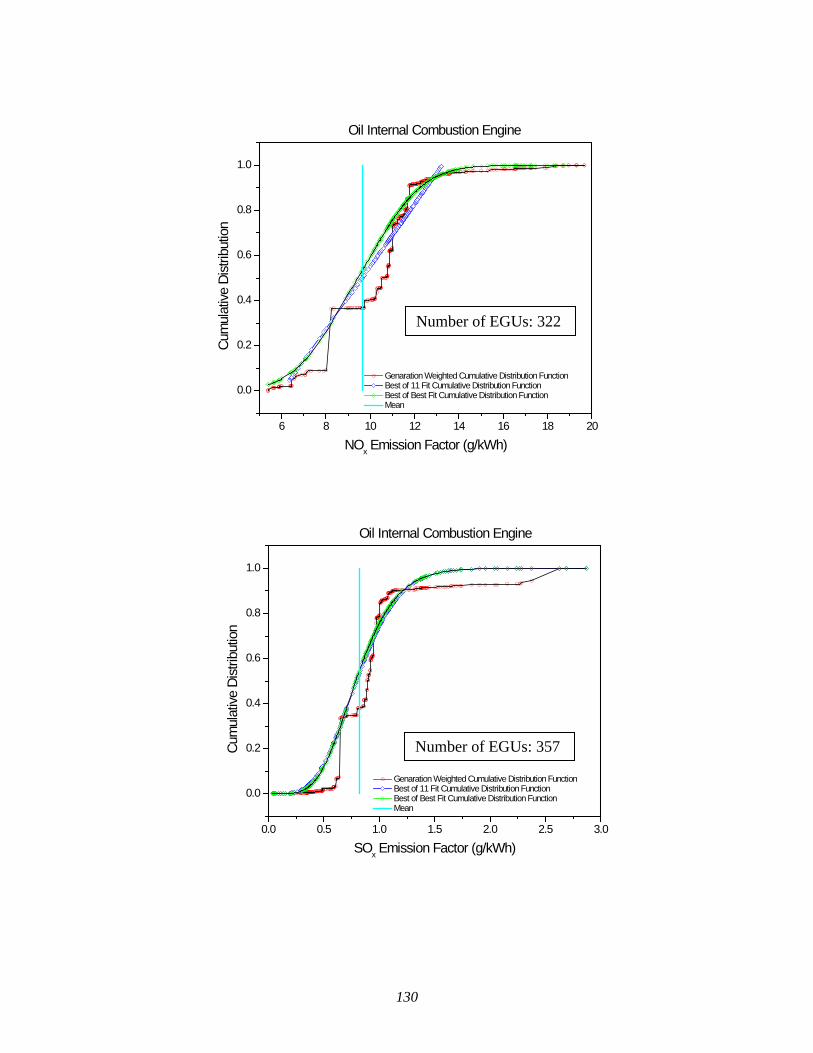
130
Genaration Weighted Cumulative Distribution Function Best of 11 Fit Cumulative Distribution Function Best of Best Fit Cumulative Distribution Function Mean
6 8 10 12 14 16 18 20
0.0
0.2
0.4
0.6
0.8
1.0
Oil Internal Combustion Engine
Cum
ulat
ive D
istrib
utio
n
NOx Emission Factor (g/kWh)
Number of EGUs: 322
Genaration Weighted Cumulative Distribution Function Best of 11 Fit Cumulative Distribution Function Best of Best Fit Cumulative Distribution Function Mean
0.0 0.5 1.0 1.5 2.0 2.5 3.0
0.0
0.2
0.4
0.6
0.8
1.0
Oil Internal Combustion Engine
Cum
ulat
ive D
istrib
utio
n
SOx Emission Factor (g/kWh)
Number of EGUs: 357
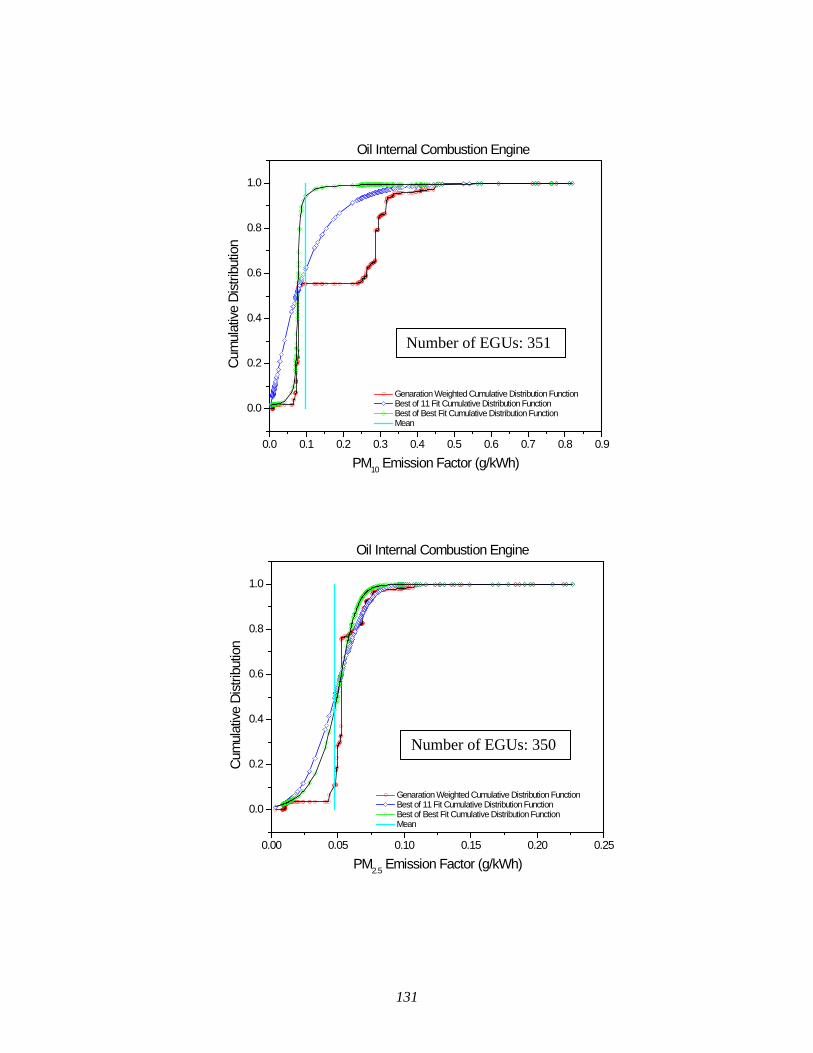
131
Genaration Weighted Cumulative Distribution Function Best of 11 Fit Cumulative Distribution Function Best of Best Fit Cumulative Distribution Function Mean
0.0 0.1 0.2 0.3 0.4 0.5 0.6 0.7 0.8 0.9
0.0
0.2
0.4
0.6
0.8
1.0
Oil Internal Combustion Engine
Cum
ulat
ive D
istrib
utio
n
PM10 Emission Factor (g/kWh)
Genaration Weighted Cumulative Distribution Function Best of 11 Fit Cumulative Distribution Function Best of Best Fit Cumulative Distribution Function Mean
0.00 0.05 0.10 0.15 0.20 0.25
0.0
0.2
0.4
0.6
0.8
1.0
Oil Internal Combustion Engine
Cum
ulat
ive D
istrib
utio
n
PM2.5 Emission Factor (g/kWh)
Number of EGUs: 350
Number of EGUs: 351
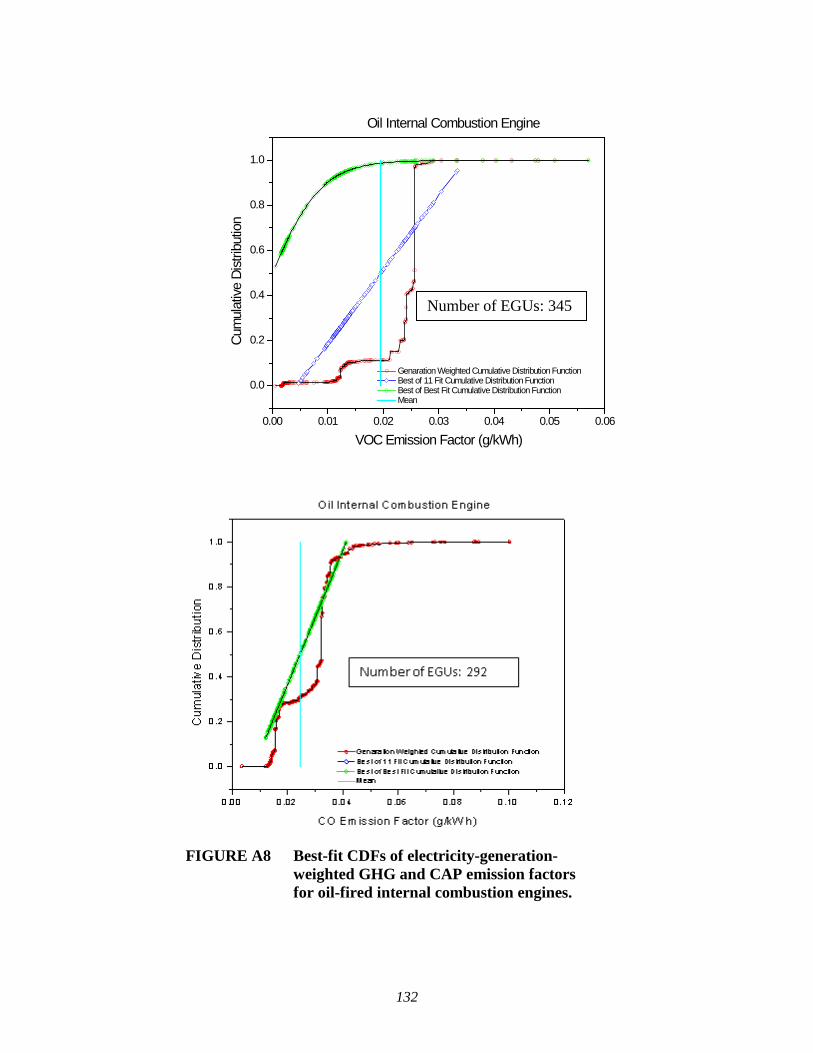
132
FIGURE A8 Best-fit CDFs of electricity-generation-
weighted GHG and CAP emission factors for oil-fired internal combustion engines.
Genaration Weighted Cumulative Distribution Function Best of 11 Fit Cumulative Distribution Function Best of Best Fit Cumulative Distribution Function Mean
0.00 0.01 0.02 0.03 0.04 0.05 0.06
0.0
0.2
0.4
0.6
0.8
1.0
Oil Internal Combustion Engine
Cum
ulat
ive D
istrib
utio
n
VOC Emission Factor (g/kWh)
Number of EGUs: 345
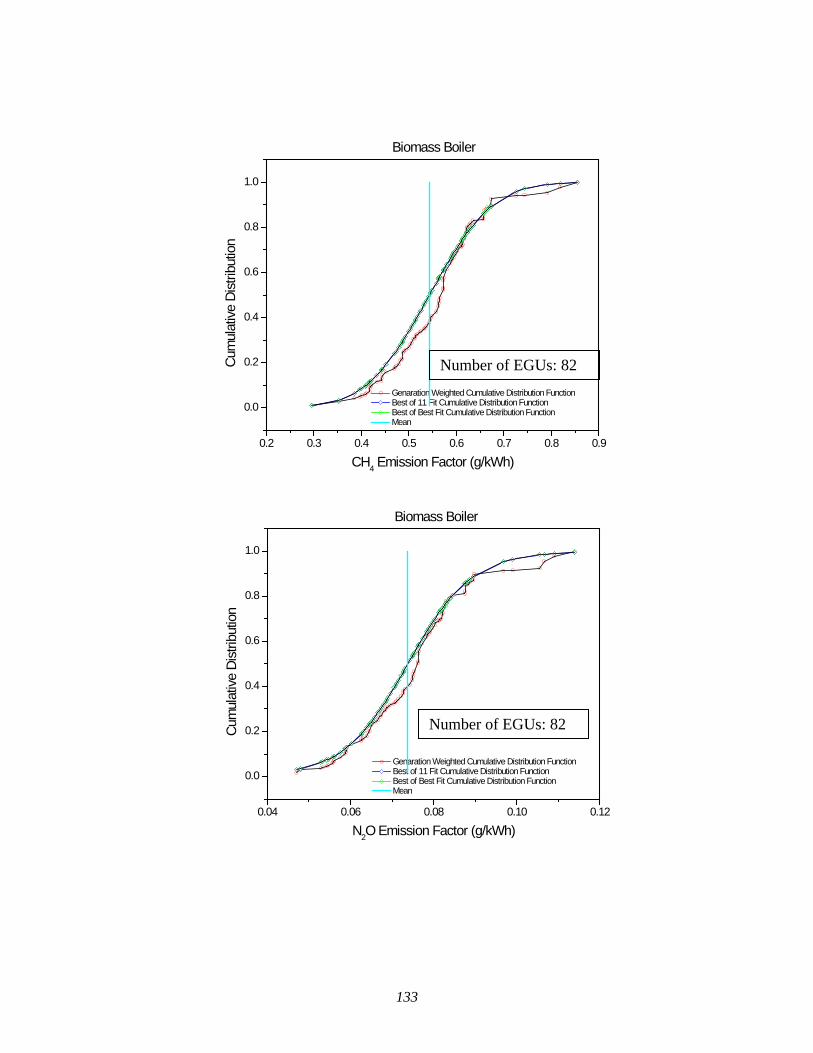
133
Genaration Weighted Cumulative Distribution Function Best of 11 Fit Cumulative Distribution Function Best of Best Fit Cumulative Distribution Function Mean
0.2 0.3 0.4 0.5 0.6 0.7 0.8 0.9
0.0
0.2
0.4
0.6
0.8
1.0
Biomass Boiler
Cum
ulat
ive D
istrib
utio
n
CH4 Emission Factor (g/kWh)
Genaration Weighted Cumulative Distribution Function Best of 11 Fit Cumulative Distribution Function Best of Best Fit Cumulative Distribution Function Mean
0.04 0.06 0.08 0.10 0.12
0.0
0.2
0.4
0.6
0.8
1.0
Biomass Boiler
Cum
ulat
ive D
istrib
utio
n
N2O Emission Factor (g/kWh)
Number of EGUs: 82
Number of EGUs: 82
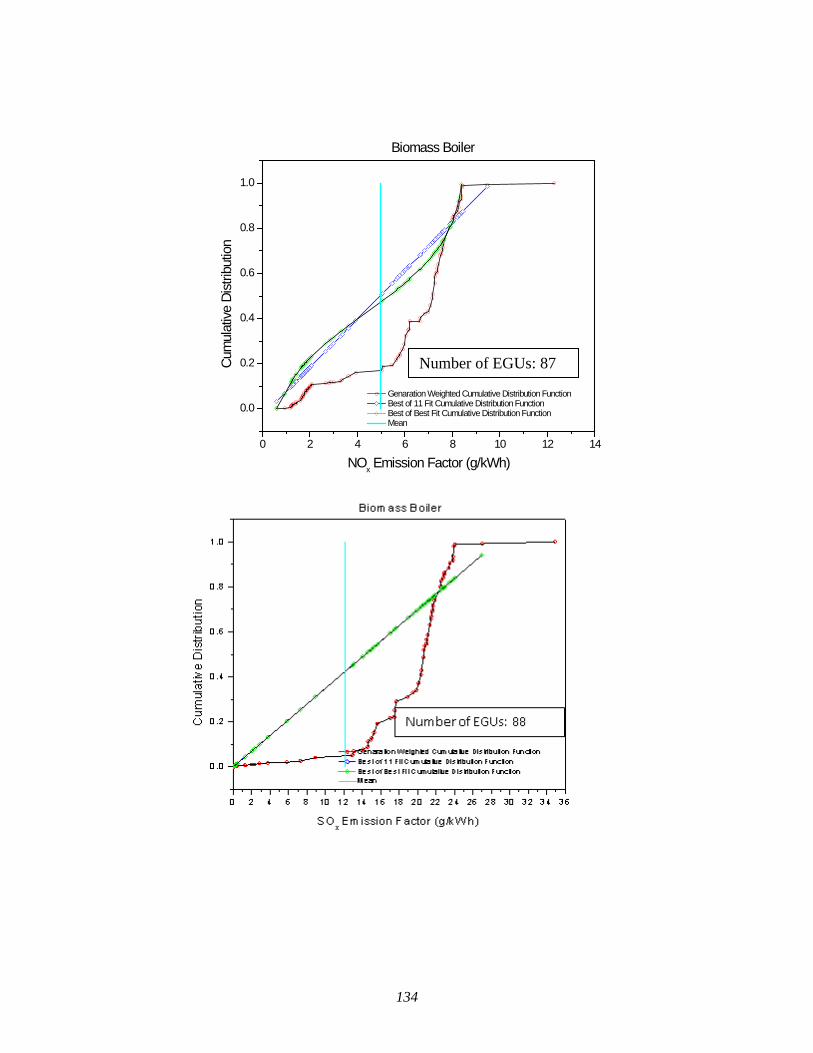
134
Genaration Weighted Cumulative Distribution Function Best of 11 Fit Cumulative Distribution Function Best of Best Fit Cumulative Distribution Function Mean
0 2 4 6 8 10 12 14
0.0
0.2
0.4
0.6
0.8
1.0
Biomass Boiler
Cum
ulat
ive D
istrib
utio
n
NOx Emission Factor (g/kWh)
Number of EGUs: 87
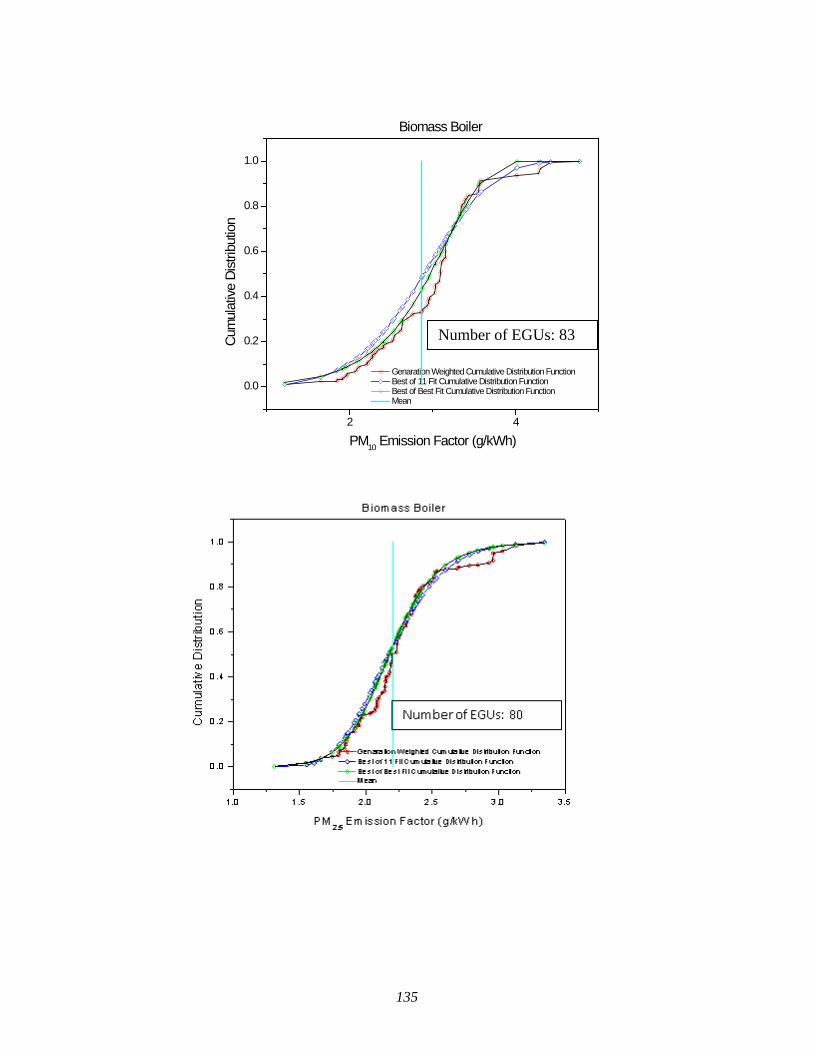
135
Genaration Weighted Cumulative Distribution Function Best of 11 Fit Cumulative Distribution Function Best of Best Fit Cumulative Distribution Function Mean
2 4
0.0
0.2
0.4
0.6
0.8
1.0
Biomass Boiler
Cum
ulat
ive D
istrib
utio
n
PM10 Emission Factor (g/kWh)
Number of EGUs: 83
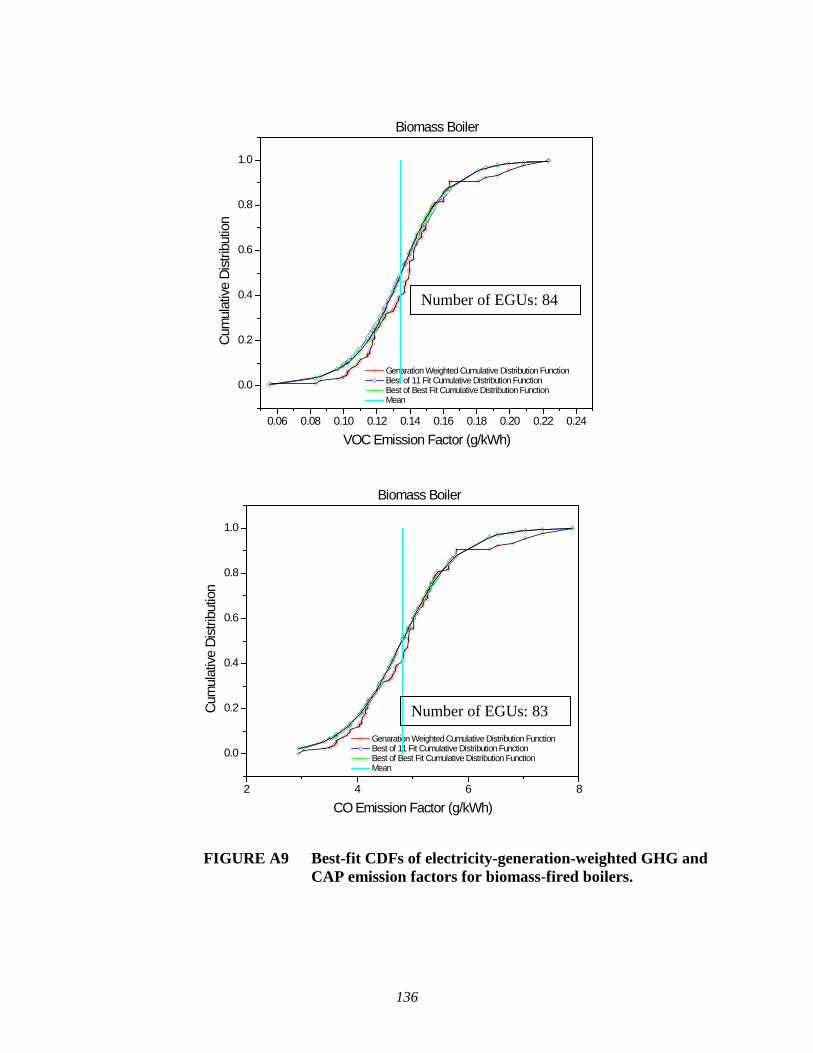
136
FIGURE A9 Best-fit CDFs of electricity-generation-weighted GHG and CAP emission factors for biomass-fired boilers.
Genaration Weighted Cumulative Distribution Function Best of 11 Fit Cumulative Distribution Function Best of Best Fit Cumulative Distribution Function Mean
0.06 0.08 0.10 0.12 0.14 0.16 0.18 0.20 0.22 0.24
0.0
0.2
0.4
0.6
0.8
1.0
Biomass Boiler
Cum
ulat
ive D
istrib
utio
n
VOC Emission Factor (g/kWh)
Genaration Weighted Cumulative Distribution Function Best of 11 Fit Cumulative Distribution Function Best of Best Fit Cumulative Distribution Function Mean
2 4 6 8
0.0
0.2
0.4
0.6
0.8
1.0
Biomass Boiler
Cum
ulat
ive D
istrib
utio
n
CO Emission Factor (g/kWh)
Number of EGUs: 83
Number of EGUs: 84
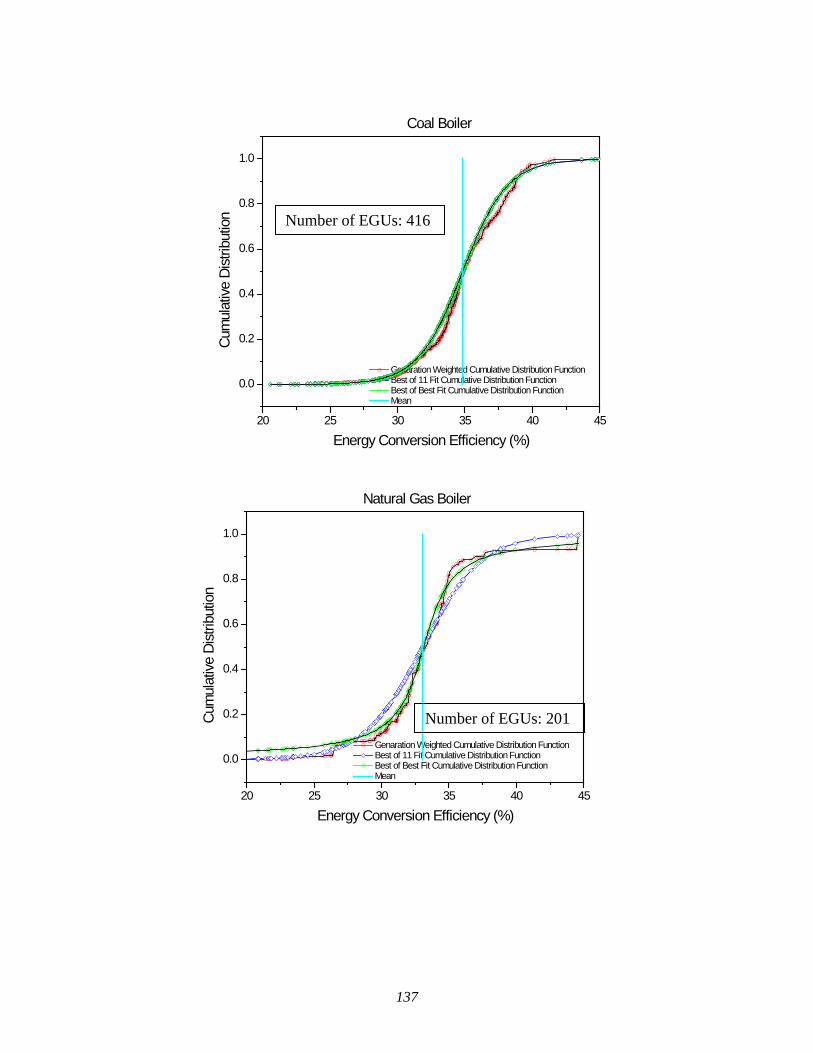
137
Genaration Weighted Cumulative Distribution Function Best of 11 Fit Cumulative Distribution Function Best of Best Fit Cumulative Distribution Function Mean
20 25 30 35 40 45
0.0
0.2
0.4
0.6
0.8
1.0
Coal Boiler
Cum
ulat
ive D
istrib
utio
n
Energy Conversion Efficiency (%)
Genaration Weighted Cumulative Distribution Function Best of 11 Fit Cumulative Distribution Function Best of Best Fit Cumulative Distribution Function Mean
20 25 30 35 40 45
0.0
0.2
0.4
0.6
0.8
1.0
Natural Gas Boiler
Cum
ulat
ive D
istrib
utio
n
Energy Conversion Efficiency (%)
Number of EGUs: 201
Number of EGUs: 416
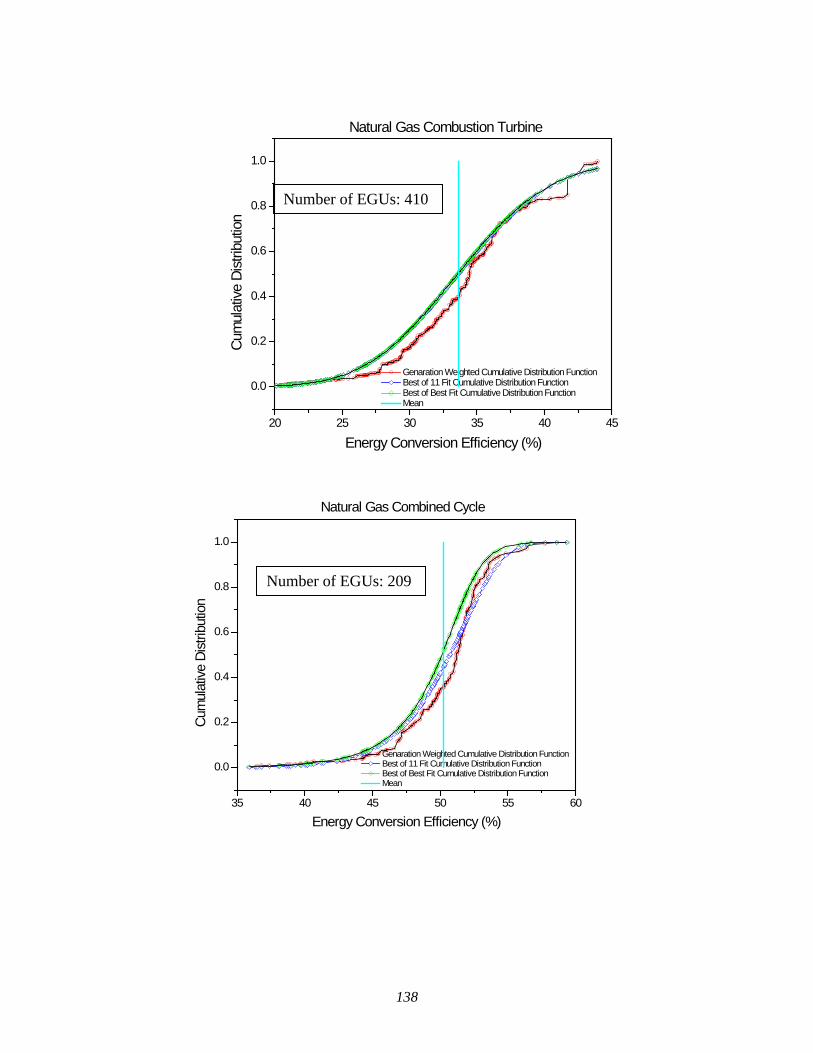
138
Genaration Weighted Cumulative Distribution Function Best of 11 Fit Cumulative Distribution Function Best of Best Fit Cumulative Distribution Function Mean
20 25 30 35 40 45
0.0
0.2
0.4
0.6
0.8
1.0
Natural Gas Combustion Turbine
Cum
ulat
ive D
istrib
utio
n
Energy Conversion Efficiency (%)
Genaration Weighted Cumulative Distribution Function Best of 11 Fit Cumulative Distribution Function Best of Best Fit Cumulative Distribution Function Mean
35 40 45 50 55 60
0.0
0.2
0.4
0.6
0.8
1.0
Natural Gas Combined Cycle
Cum
ulat
ive D
istrib
utio
n
Energy Conversion Efficiency (%)
Number of EGUs: 410
Number of EGUs: 209
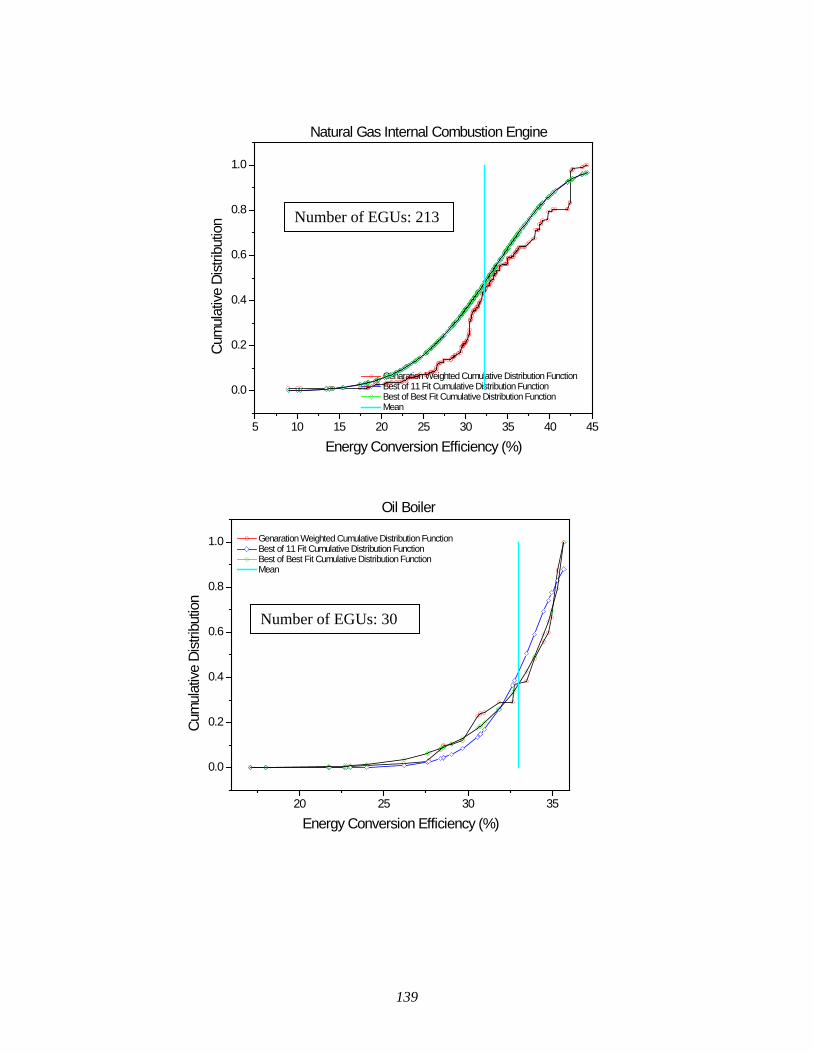
139
Genaration Weighted Cumulative Distribution Function Best of 11 Fit Cumulative Distribution Function Best of Best Fit Cumulative Distribution Function Mean
5 10 15 20 25 30 35 40 45
0.0
0.2
0.4
0.6
0.8
1.0
Natural Gas Internal Combustion Engine
Cum
ulat
ive D
istrib
utio
n
Energy Conversion Efficiency (%)
Genaration Weighted Cumulative Distribution Function Best of 11 Fit Cumulative Distribution Function Best of Best Fit Cumulative Distribution Function Mean
20 25 30 35
0.0
0.2
0.4
0.6
0.8
1.0
Oil Boiler
Cum
ulat
ive D
istrib
utio
n
Energy Conversion Efficiency (%)
Number of EGUs: 213
Number of EGUs: 30
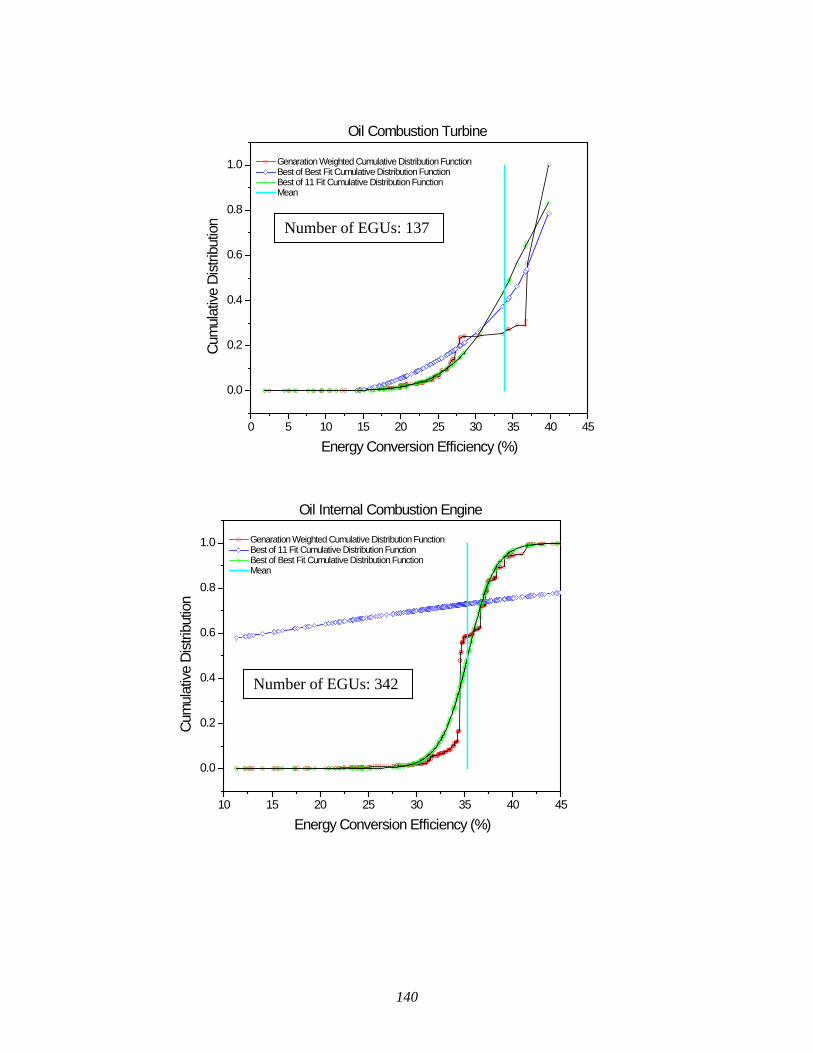
140
Genaration Weighted Cumulative Distribution Function Best of Best Fit Cumulative Distribution Function Best of 11 Fit Cumulative Distribution Function Mean
0 5 10 15 20 25 30 35 40 45
0.0
0.2
0.4
0.6
0.8
1.0
Oil Combustion Turbine
Cum
ulat
ive D
istrib
utio
n
Energy Conversion Efficiency (%)
Genaration Weighted Cumulative Distribution Function Best of 11 Fit Cumulative Distribution Function Best of Best Fit Cumulative Distribution Function Mean
10 15 20 25 30 35 40 45
0.0
0.2
0.4
0.6
0.8
1.0
Oil Internal Combustion Engine
Cum
ulat
ive D
istrib
utio
n
Energy Conversion Efficiency (%)
Number of EGUs: 342
Number of EGUs: 137
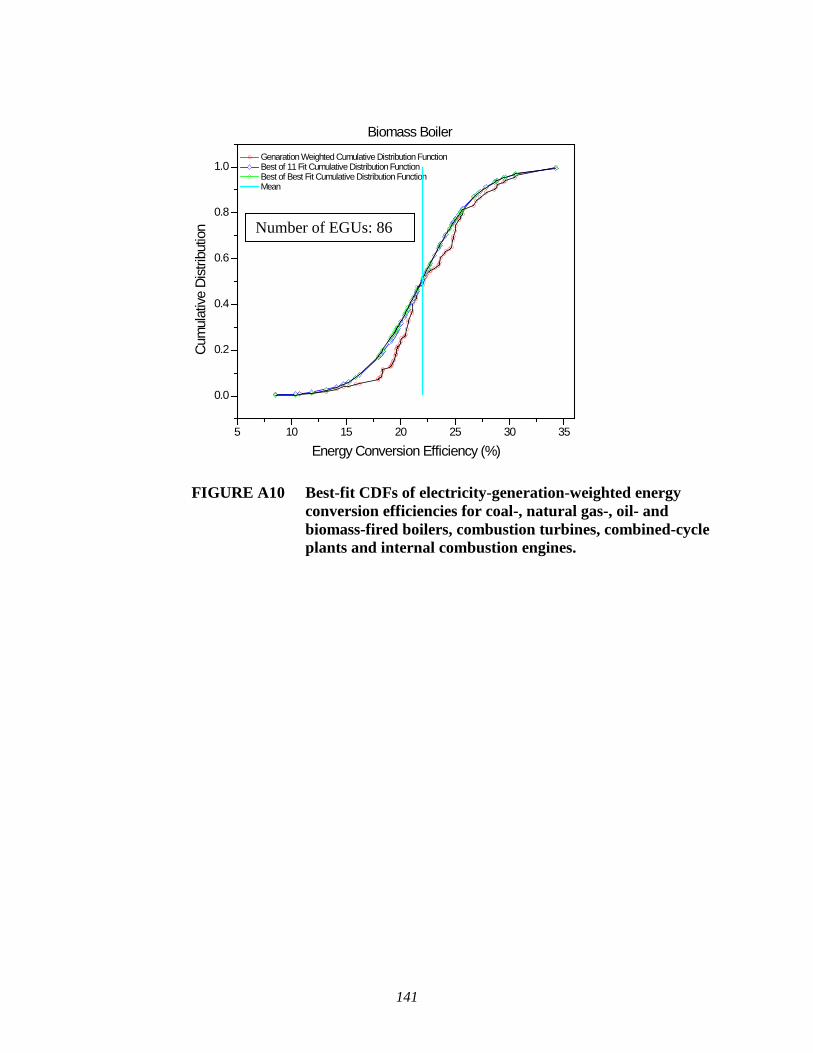
141
FIGURE A10 Best-fit CDFs of electricity-generation-weighted energy conversion efficiencies for coal-, natural gas-, oil- and biomass-fired boilers, combustion turbines, combined-cycle plants and internal combustion engines.
Genaration Weighted Cumulative Distribution Function Best of 11 Fit Cumulative Distribution Function Best of Best Fit Cumulative Distribution Function Mean
5 10 15 20 25 30 35
0.0
0.2
0.4
0.6
0.8
1.0
Biomass Boiler
Cum
ulat
ive D
istrib
utio
n
Energy Conversion Efficiency (%)
Number of EGUs: 86

142