Embed Size (px)
Citation preview

Report No: ACS20919
Islamic Republic of MauritaniaMAURITANIA PERSurfing the wave: public spending during the commodity super-cycle and beyond
.October 2016
.GGO13
AFRICA
.
i

Standard Disclaimer:
This volume is a product of the staff of the International Bank for Reconstruction and Development/ The World Bank. The findings, interpretations, and conclusions expressed in this paper do not necessarily reflect the views of the Executive Directors of The World Bank or the governments they represent. The World Bank does not guarantee the accuracy of the data included in this work. The boundaries, colors, denominations, and other information shown on any map in this work do not imply any judgment on the part of The World Bank concerning the legal status of any territory or the endorsement or acceptance of such boundaries.
Copyright Statement:
The material in this publication is copyrighted. Copying and/or transmitting portions or all of this work without permission may be a violation of applicable law. The International Bank for Reconstruction and Development/ The World Bank encourages dissemination of its work and will normally grant permission to reproduce portions of the work promptly.
For permission to photocopy or reprint any part of this work, please send a request with complete information to the Copyright Clearance Center, Inc., 222 Rosewood Drive, Danvers, MA 01923, USA, telephone 978-750-8400, fax 978-750-4470, http://www.copyright.com/.
All other queries on rights and licenses, including subsidiary rights, should be addressed to the Office of the Publisher, The World Bank, 1818 H Street NW, Washington, DC 20433, USA, fax 202-522-2422, e-mail [email protected].
Regional Vice President: Makhtar Diop Country Director: Louise Cord
Senior Global Practice Director: Deborah L. WetzelPractice Manager: Renaud Seligmann
ii
Task Team Leader: Kjetil Hansen
Acknowledgements
This report was prepared by a World Bank team led by Kjetil Hansen (GGODR, TTL) which included El Hadramy Oubeid, Moustapha Ould El Bechir (GGODR), Wael Mansour, Gianluca Mele (MFM). Sylke Von Thadden (consultant) provided excellent overall technical and analytical support on Chapters 3-6. Linda English kindly reviewed early versions of the health and education chapters. Jason Hayman (consultant) prepared the model to assess the impact of the Public Investment Program. Fall Oumar prepared the expenditure review of the agriculture sector on which Chapter 5 was based. Mr. Ahmedou Ould Dahah prepared the education review and Mohamed Oud Didi prepared the health review. Sally Hinchcliffe (consultant) edited the report. Batouly Dieng provided excellent administrative support.
The team benefitted from the valuable collaboration of many colleagues. Yemdaogo Tougma assisted in preparing the BOOST dataset used in this report, while the sectoral analysis chapters benefited from important contributions by Bassem Abou Nehme, Eric Magnus Fernstrom, Manuel Berlengiero (Energy), Mohamed Tolba, Irajen Appasamy (Education), Ana Francisca Ramirez Copelos, Irina Schuman, Brahim Sall .Agrictulture), Moulay Driss Zine Eddine, Mohamed Vadel (Health), Serdar Yilmaz (PIM). On the government side, the team would like to gratefully acknowledge the close involvement and valuable insights provided by staff at various Ministries, in particular Mr. Khayar Fall, Director of Budget in the Ministry of Finance as well as Mr. Ould Ahmed Aicha Yacoub, Director of Investment Project and Programs, MAED and Mr Mahmoud Khatry (Ministry of Health).
Excellent comments were received from its peer reviewers, Ali Zafar and Carolina Renteria (MFM), Netsanet Walelign Workie (GNH01). Valuable comments were also provided by Paolo Zacchia and Raja Bentaouet Kattan (Program Leaders for Mauritania). Philip English (former Program Leader for Mauritania) provided guidance and advice during the early stages of its development. Overall guidance was provided by Renaud Seligmann (Practice Manager, GMFDR), Gaston Sorgho (Country Manager, Mauritania), and Louise Cord (World Bank Country Director for Mauritania).
iii
Table of ContentsAcknowledgements.................................................................................................................................... iiiAcronyms and Abbreviations...................................................................................................................... ixExecutive Summary.....................................................................................................................................1Chapter 1: Macro Economic and Fiscal Trends............................................................................................7
Recent Growth has Largely Been Driven by High Commodity Prices…....................................................7... Leaving Budgets Vulnerable to External and Domestic Shocks............................................................8Tax Reforms Have Brought Results, But Not Enough to Offset the Effect of Falling Commodity Prices. .9Capital Expenditure has Tripled and Public Spending Increased Steadily Overall..................................13A Large Parastatal Sector Poses Fiscal Risks..........................................................................................14Overall Execution Rates Disguise High Volatility Within Spending Categories.......................................19…While a Large Proportion of Government Expenditure Remains Opaque and Discretionary............20Debt is rising but is highly concessional…..............................................................................................22Going Forward, Even if Commodity Prices Recover, Structural Reform Will be Needed to Avoid Unsustainable Deficits...........................................................................................................................23The Government Needs to Strengthen its Public Financial Management Systems in Order to Improve the Impact of Public Spending...............................................................................................................26Key Areas for Reform.............................................................................................................................29
Chapter 2: Increasing the Economic and Social Impact of Public Investments..........................................30In Mauritania, Public Investment Spending Analysis is Complicated by Fragmented and Incomplete Data.......................................................................................................................................................30While Large Infrastructure Projects Receive the Bulk of Investment, Other Areas have Seen Significant Increases................................................................................................................................................33Operating expenses have increased and transfers to public enterprises are high................................36Little Progress Has Been Made With Public Investment Management..................................................38Procurement Reforms Begun in 2010 Have Not Brought About the Desired Results............................46Despite Increased Public Investments, their Quality and Economic Impact Remain Uncertain............52Estimating the Macroeconomic Impact of the PIP Under Different Scenarios......................................56Key Areas for Reform.............................................................................................................................59
Chapter 3: Use of Resources in the Education Sector................................................................................61Despite Some Progress, Mauritania is Not on Track to Meet its Educational Goals..............................61Although Spending has Risen it is Still Low, Except for Primary Education............................................63Children from the Poorest Households Receive the Least Benefit from Education Spending...............65Redistributing education spending could help to raise quality and effectiveness.................................67...As Could Improving its Targeting and Efficiency.................................................................................68Key Areas for Reform.............................................................................................................................70
Chapter 4: Use of Resources in the Health Sector.....................................................................................72Despite Some Effective Public Health Interventions, Overall Progress has been Mixed........................72Health Spending has Risen from a Low Base, but Does not Fully Reflect Mauritania’s Policy Goals.....73Unequal Distribution of Health Expenditure is Likely to Exacerbate Health Inequalities.......................75
iv
Private Spending and Health Insurance are Becoming Increasingly Significant as Donor Funding Declines.................................................................................................................................................76More Devolution and Prioritization Could Make Better Use of Existing Resources...............................78Key Areas for Reform.............................................................................................................................79
Chapter 5: Use of Resources in the Agriculture Sector..............................................................................81Structural changes in Mauritania’s rural areas have led to increased productivity and a reduction in poverty..................................................................................................................................................81Despite Agriculture’s Impact on for Poverty Reduction, Mauritania May Struggle to Mobilize the Investment the Sector Needs to Reach its Full Potential.......................................................................82Continuing Food Subsidies May Not be the Best Way to Address Chronic Poverty...............................84Weak Administrative Capacity and Insufficient Research and Investment Need to be Addressed........85Ineffective and Costly Subsidies are Absorbing Too Much of the Government’s Resources for Agriculture.............................................................................................................................................87Key Areas for Reform.............................................................................................................................89
Chapter 6: Use of Resources in the Energy Sector.....................................................................................92Progress on Increasing Supply of Energy, but the Sector Remains Highly Vulnerable to Rising and Volatile Oil Prices...................................................................................................................................92Subsidies are Driving Up the Energy Budget While Investment in Renewables Lags Behind…..............94...And Have Proved Highly Regressive Particularly for the Rural Poor...................................................95The Government Has Become Dependent on External Assistance........................................................96The Financial Situation of SOMELEC has Improved, but Exposure to Fuel Oil Makes it Vulnerable to Price Increases.......................................................................................................................................99Key Areas for Reform...........................................................................................................................100
Concluding observations........................................................................................................................102Bibliography.............................................................................................................................................103Annex A1: Summary of PEFA Scores 2008 and 2014...................................................................................0Annex A2: List of Financial Management Information Systems in Mauritania............................................1Annex A3: Methodology for Public Investment Impact Assessment...........................................................5Annex A4: Summary of Procurement Assessment, Scores, Findings and Action Plan...............................10Annex A5: Table of Recommendations and Fiscal Implications.................................................................21
Box 1.1: Budget Data and Governance......................................................................................................12Box 1.2: Key findings of Mauritania’s Public Expenditure and Financial Accountability Assessment (2014)..................................................................................................................................................................28Box 2.1: Common Features of PIM in Donor-Dependent Countries..........................................................46Box 2.2: Recent Corruption Cases in Mauritania.......................................................................................52Box 5.1: Principles for Smart Subsidies......................................................................................................90Box A1: Constructing GDP by Demand Component.....................................................................................6Box A2: Output Assumptions Sheet.............................................................................................................8
Figure 1.1: Real GDP Growth (percent).......................................................................................................7Figure 1.2: Revenues in Comparator Countries (percentage of GDP)........................................................10
v
Figure 1.3: Comparison of Net Official Development Assistance, 2009–13 (US$ average per capita........11Figure 1.15: Average Actual Expenditure by Source of Financing, 2010–13..............................................21Figure 1.16: Average expenditure outturn in percent (expenditures vs revised budget 2010–15)...........22Figure 1.17: Evolution of average PEFA scores by category between 2008 and 2014...............................27Figure 2.1: Investment Budget, 2004–14 (MRO billion and percentage of GDP).......................................31Figure 2.2: Investment—Share of Total Budget, 2010–14 (percent).........................................................32Figure 2.3: Investment Budget by Source of Financing, 2010–14 (MRO billion)........................................32Figure 2.4: Sectoral Distribution of the Consolidated Investment Budget, 2010–14 (MRO billion)...........33Figure 2.5: Investment Budget Categories, 2010-14 (authorized payments, MRO billion)........................36Figure 2.6: Maintenance spending MRO Bn and % of Capital Budget and % Total spending....................36Figure 2.7: Development Aid, Signed and Disbursed 2010–14 (US$)........................................................37Figure 2.8: Sectoral and Geographical Distribution of Donor Aid, 2010–14 (USD Mn)..............................38Figure 2.9: Public Investment Management Efficiency Index: International Comparisons, 2011..............38Figure 2.10: Essential Characteristics of an Effective PIM system.............................................................39Figure 2.11: Mauritania Corruption Ratings in WGI and Global Competitiveness Index...........................51Figure 2.12: Infrastructure Quality Index...................................................................................................53Figure 2.13: Comparison of the PIP and the Baseline Scenario Across Key Macroeconomic Variables.....55Figure 2.14: Impact of the PIP on Public Debt...........................................................................................56Figure 3.1: Gross and Net Enrollment, Primary and Secondary (percent).................................................61Figure 3.3: International Comparison of Primary Net Enrollment Rates, 2013..........................................62Figure 3.4: International Comparison of Lower Secondary Completion Rates, 2012................................62Figure 3.5: Budget allocations to education and spending per student, 2010–14.....................................63Figure 3.6: International Comparison of Public Education Expenditure, 2012..........................................64Figure 3.7: International Comparison of Government Expenditure per Primary Student (US$) and primary completion rates, 2012..............................................................................................................................64Figure 3.8: Distribution of Education Spending by Level of Education, 2010–14.......................................65Figure 3.9: Access and Completion by Economic Quintile (Least Poor, Poorest) by Primary and Secondary Education Level, 2010 (percent)................................................................................................................66Figure 3.10: Patterns of Coverage and Spending per Student by Educational Level, 2013........................66Figure 3.11: Budget per Student, Pupil/Teacher Ratio, and the Poverty Rate by Region, 2015................67Figure 3.12: Composition of the budget by economic category, 2010–14 (MRO billion)..........................68Figure 3.13: Investment spending by level of education, 2010–14 (MRO billion).....................................68Figure 4.1: Maternal Mortality Rate and Measles Immunization Coverage, 1990, 2000 and 2013...........72Figure 4.2: Regional Comparison of Immunization Coverage for Measles, 2013 (percent).......................72Figure 4.3: Distribution of Health Workers by Region, 2014.....................................................................73Figure 4.4: Mauritania’s Public Health Spending, 2010–13.......................................................................74Figure 4.5: Central Government Allocations on Health Compared to Funding Needed by the PNDS, 2012–20...............................................................................................................................................................74Figure 4.6: Regional Comparison of Health Spending and Infant Mortality Rates, 2013...........................74Figure 4.7: Distribution of Spending Across Health Sub-Sectors, 2010–13................................................75Figure 4.8: Comparing Health Spending Per Capita and Poverty Rate by Region, 2013............................76Figure 4.9: Distribution of Medical Staff in Hospitals and Regions, 2014..................................................76
vi
Figure 4.10: Total Sector Health Spending by Item (Economic Classification) 2010–2013........................77Figure 4.11: Growth in Medical Staff, 2011–13.........................................................................................77Figure 4.12: Physicians and Nurses/Midwifery Personnel, 2015 (per 10,000 population)........................77Figure 4.13: Sources of Funds for Mauritania’s Public Health Sector, 2010–2013....................................77Figure 5.1: Rice Yields, 2001–13................................................................................................................82Figure 5.2: Comparison of Rice Yields with Selected African Countries, 2013...........................................82Figure 5.3: Agriculture Value Added per Worker—Comparison with Selected African Countries, 2013...82Figure 5.4: Agriculture Value Added, 2001–13..........................................................................................82Figure 5.5: Government Allocation to Agriculture and Share of the National Budget, 2010–14...............83Figure 5.6: Comparision of Government Allocations on Agriculture and Costing of the NADP 2015–25. .83Figure 5.7: International Comparison of Public Agriculture Expenditure, 2013.........................................84Figure 5.8: Agriculture Budget Allocations by Function Excluding Donor Aid, 2010–13............................86Figure 5.9: Composition of the Agriculture Budget by Economic Category, 2010–13...............................86Figure 6.1: Number of Power Outages per Month and Delays in Obtaining an Electrical Connection (days), 2014...............................................................................................................................................93Figure 6.2: Electrification Rate (percent of households), 2008 and 2014..................................................93Figure 6.3: Government Allocations to Energy, 2010–15..........................................................................95Figure 6.4: Composition of Energy Sector by Subsector (in MRO Billions) 2010–15..................................95Figure 6.5: Share of Electricity and Gas Subsidies Received by the Poorest and Richest Quintiles, 2011..96Figure 6.6: Composition of the Energy Budget by Economic Category, 2010–15......................................97Figure 6.7: Composition of Subsidies, 2011–15.........................................................................................97Figure 6.8: Composition of the Investment Budget by Sources of Funding, 2010–15...............................98Figure 6.9: Composition of the Energy Budget by Sources of Funding, 2010–15......................................98
Table 1.1: Budget Balance, 2009–15 (percentage of GDP)..........................................................................9Table 1.2: Decomposition of Budget Revenues by Selected Categories 2009–15 (percentage of GDP)….10 Table 1.3: Decomposition of Public Expenditure by Selected Categories, 2009–15 (Percent of GDP)......14Table 1.4: Expenditure Outturn—Budgeted versus Actual, 2010–15 (percent).........................................19Table 1.5: Public Spending by Sector, 2010–13 (percentage of non-oil GDP)............................................20Table 1.6: Average Social Sector Spending in African Comparator Countries, 2009–13............................22Table 1.7: Fiscal Outlook, 2016–18............................................................................................................24Table 1.8: Recommendations....................................................................................................................29Table 2.1: Consolidated Investment Budget—Programmed and Executed by Source of Funding, 2010–14 (MRO billion).............................................................................................................................................32Table 2.2: Consolidated Investment Budget, 2010–14 (Percent of GDP)..................................................35Figure 2.3: Development Aid, Signed and Disbursed 2010–14 (US$)........................................................37Table 2.4: Assessment of Mauritania’s Procurement System Based on OECD/DAC Baseline Indicators...47Table 2.5: Assessment of Procurement Agencies’ Performance...............................................................49Table 4.1: Ministry of Health Execution Rates by Economic Category, 2010–13.......................................79Table 6.1: SOMELEC’s Key Performance Indicators...................................................................................99Table 6.2: SOMELEC’s Revenues, Expenditures, and Net Operational Results, 2010–15 (MRO Millions)100Table A1: PEFA Scores, 2008 and 2014........................................................................................................0
vii
Table A2: Procurement Assessment..........................................................................................................10Table A3: Scores on OECD/DAC MAPS Indicators......................................................................................14Table A4: Procurement Reform Action Plan and Budget...........................................................................16
viii

Acronyms and Abbreviations
AFD Agence Française de DéveloppementAFESD Arab Fund for Economic and Social DevelopmentAQIM Al-Qaeda in the Islamic MaghrebARMP Procurement Regulatory Authority (Autorité de Régulation des Marchés Publics)AS Annual StatisticsBCI Annual Investment BudgetBCM Central Bank of Mauritania (Banque Centrale de Mauritanie)CDD Fund for Deposits and Development (Caisse de Dépôts et de Développement)CEP Primary School Certificate (Certificat d'Etudes Primaire)CGE Computable General Equilibrium ModelCIB Consolidated Investment BudgetCNCMP Commission Nationale de Contrôle des Marchés PubliquesCSM Sectoral Procurement CommissionsDAC OECD Development Assistance CommitteeDAD Development Assistance DatabaseDGD General Customs Directorate DGI General Tax Directorate (Direction Générale des Impôts)DGPPI Directorate of Investment Projects and Programs (Direction Générale des Projets et
Programmes d’Investissement)DSA Debt Sustainability AnalysisDTF General Directorate for Financial Oversight (Direction de la Tutelle Financiere)EIMS Education Information Management SystemEIRR Economic Internal Rate of ReturnENER National Agency for Roads Maintenance (Etablissement National pour l’Entretien
Routier)ESDP Education Sector Development ProgramEU European UnionEWRR Economy Wide Rate of ReturnFDI Foreign Direct InvestmentFIRR Financial Internal Rate of ReturnFSD Saudi Fund for Development (Fonds Saoudien pour le Développement)GDP Gross Domestic ProductGER Gross Enrollment RateGFMIS Government Financial Management Information SystemsGIE Economic Interest Groups (Groupement d’Intérêt Economique)GIZ German Agency for International Cooperation (Deutsche Gesellschaft für Internationale
Zusammenarbeit)HFO Heavy Fuel OilHRM Human Resource ManagementHRMIS Human Resource Management Information SystemICOR Incremental Capital to Output RatioICS Investment Climate SurveyICT Information and Communication TechnologiesIFAD International Fund for Agricultural DevelopmentIFC International Finance Corporation
ix

IFPRI International Food Policy Research InstituteIGE General State Inspectorate (Inspection Générale d’Etat)IGF General Financial Inspectorate (Inspection Générale des Finances)IMF International Monetary FundIRDP Integrated Rural Development ProgramIT Information TechnologyJIBAYA Tax Administration SystemLIC Low-Income CountryLOA Loi d’Orientation AgropastoraleMAED Ministry of Economic Affairs and DevelopmentMAPS Methodology for Assessing Procurement SystemsMDG Millennium Development GoalMEF Ministry of Economy and Finance (Ministère de l’Economie et des Finances)MICO Mutual Investment and Credit OasisMICS Multiple Indicator Cluster SurveyMOE Ministry of EducationMPEM Ministry of Petroleum, Energy and MiningMTEF Medium-Term Expenditure FrameworkNADP National Agriculture Development PlanNPDES National Program for the Development of the Education SectorNRDS National Rural Development StrategyNIF Tax ID Number (Numéro d’Identifiant Fiscal)O&M Operations and ManagementOECD Organisation for Economic Co-operation and DevelopmentONS National Statistics OfficePCU Project Coordination UnitPEFA Public Expenditure and Financial AccountabilityPER Public Expenditure ReviewPFM Public Financial ManagementPIM Project Investment ManagementPIP Public Investment ProgramPIU Project Implementation UnitPNDS National Health Development PlanPPP Public Private PartnershipPRECASP Public Sector Capacity Building Project (Projet de Renforcement des Capacités du
Secteur Public)PRISM Mining Sector Capacity Building Project (Projet de Renforcement Institutionnel du
Secteur Minier)PRSP Poverty Reduction Strategy PaperR&D Research and DevelopmentRACHAD Electronic Expenditure Chain System (Réseau Automatisé de Chaîne de la Dépense)RATEB Réseau Automatisé du Traitement et Salaires des Employés Payés sur BullSARA Service Availability and Readiness AssessmentSAVS Village Level Food Security StocksSIGADE Système Intégré de Gestion Automatisée de la Dette ExterneSIGPE Système Informatique de Gestion du Personnel de l’EtatSITP Système d'Information Trésor PublicSME Small and Medium-Sized Enterprise
x
SNIM National Industrial and Mining Society (Société Nationale Industrielle et Minière)SOE State-Owned EnterpriseSOMELEC State Electricity Company (Société Mauritanienne d’Electricité)SONIMEX Mauritanian Company of Import and Export (Société Nationale d’Importation et
d'Exportation)SSA Sub-Saharan AfricaTFP Total Factor ProductivityTOFE Table of State Financial Operations (Tableau des Opérations Financières de l’État) TSA Treasury Single AccountUNCTAD United Nations Conference on Trade and DevelopmentVAT Value-Added TaxVET Vocational Education and TrainingWAAPP West Africa Agricultural Production ProgramWAEMU West African Economic and Monetary UnionWHO World Health Organization
xi
Executive Summary
1. Mauritania’s economic growth has been largely driven by high commodity prices, leaving the country vulnerable to shocks. From 2009 to 2015, real gross domestic product (GDP) grew by an average of 4.2 percent a year, primarily driven by rising commodity prices. The value of its exports more than doubled between 2009 and 2013. The mining boom and extensive foreign investment in the sector have boosted growth in the construction, utilities, transport, and communications sectors while agriculture and fisheries have fallen behind. Growth has been dominated by capital formation, with total public and private investment averaging 28 percent of GDP over the period 2000–14. The end of the commodity “super-cycle” in the second half of 2014 and the collapse in iron ore prices have slowed growth. In addition, Mauritania has also suffered a series of domestic and external shocks shaping its budgetary outcomes, notably a political crisis in 2008/09, a drought in 2011, a refugee crisis in 2012, and increasing threats from Islamic terrorism.
2. Despite this, Mauritania has seen a remarkable reduction in poverty between 2008 and 2014 from 44.5 percent to 33.0 percent. This decline is much larger than in previous periods and it’s also higher than comparator countries. In addition, the Gini Index decreased from 35.2 in 2008 to 31.9 in 2014, suggesting a decrease in inequality as well. The decline in poverty is driven by developments in rural areas, notably increased productivity, prices and incomes in the irrigated agriculture and livestock sectors. Urban areas have seen less of a reduction in poverty, with Nouakchott actually experiencing an increase. The very poor have done particularly well over the period – extreme poverty was essentially halved, from 10.8 to 5.6 percent. Progress has also been achieved on non-monetary measures of wellbeing such as literacy rates, school enrollment, child mortality nutrition and overall living standards including access to electricity and increase in asset ownership such as home ownership, car, telephone, television, fridge, etc. In addition, subjective perceptions of poverty have improved: while 79 percent considered themselves poor in 2008, only 61.2 percent felt the same way in 2014. The 2016 World Bank Poverty Assessment finds that recent growth has been pro-poor - Mauritania had the fourth highest poverty elasticity to GDP growth in Africa, after South Africa, Madagascar and Botswana.
3. Public Financial Management reforms have brought some results in recent years. Notably, budget execution has been improved; tax reforms led to significant increased revenues; a new procurement law and institutions have increased controls; undocumented salary payments were eliminated; land titles for Nouakchott were scanned and verified; and most public financial information systems are now in place. However, many of the reforms will need to be fully implemented in order to bring about the desired impact. Budget execution needs to be accompanied by greater budget credibility and the reduction of discretionary expenditure; second stage tax reforms should focus on broadening the tax base; the land registry is still dysfunctional and complex, and most poor people are unable to obtain land titles; finally, the various Government Financial Management Information Systems are not fully integrated, leading to incomplete administrative or financial data which again limits its use in effectively monitoring budget implementation.
4. Tax reforms have not been enough to offset the effect of falling commodity prices. Domestic revenues have been volatile in the last five years, raising concerns over the government’s ability to use fiscal policy to cushion the impact of shocks and ensure macro stability. Tax is the largest source of revenue in Mauritania, and tax reforms since 2011 have boosted government revenues from just over 12 percent of GDP to 17.4 percent on average in 2012-15. However, they have not been enough to stave off the severe decline in domestic revenues that began with the end of the super-cycle. Official
1
development assistance is high in per capita terms, but this can also be a volatile source of finance. The national oil fund was created to help insulate expenditure against volatile commodity prices, but weak governance could limit its effectiveness.
5. Public spending has increased steadily between 2009 and 2015. Domestic financing is the primary source of social spending, while most foreign assistance is directed towards infrastructure. Although the government has strengthened its human resource management systems in recent years, the official wage bill represents almost half of Mauritania’s tax receipts—the actual share would be even higher as the payroll excludes temporary workers. The large parastatal sector imposes a significant burden on the national budget, with transfers and subsidies rising from US$17.2 million in 2005 to over US$240 million in 2013 and dividend payments decreasing to 3.4 percent of revenues in 2015 and estimated 2.3 percent in 2016 from a high of 16.5 percent of revenues in 2012. Government guarantees for SOEs debt reached 9 percent of GDP. The government lacks the capacity to monitor the financial and technical performance of these SOEs and Agencies and to push for corporate governance reforms where necessary.
6. Budget execution has improved as actual spending has started to match budgeted amounts more closely in recent years. However, the overall figures disguise much greater discrepancies in individual line items, with significant variance even in relatively straightforward areas such as debt servicing. Public spending on social sectors remains below regional levels, health and social affairs grew, while the share of justice and sector ministries declined. However, a large share of expenditure remains discretionary and unidentified: 30 percent of total expenditures are reported as “unspecified expenses” and are not classified by economic category, which greatly complicates public expenditure monitoring and proper expenditure recording. Mauritania should enhance the transparency and quality of its fiscal data by: (i) auditing the national oil fund, (ii) increase budget credibility and discipline by minimizing “unspecified expenses” and by properly recording all expenditures (iii) reviewing public-sector staffing (iv) keeping its public financial database (BOOST) up to date to reflect its original and revised budgets, and (v) strengthening financial oversight of SOEs through regular performance monitoring and publication of annual financial audits.
7. Even if commodity prices recover, structural reform will be needed to avoid unsustainable deficits. Without reforms to widen the tax base, losses due to declining commodity prices and lower growth will lead to unsustainable deficits. Even if prices improve somewhat, the deficit is likely to remain above the debt stabilization threshold of 4.1 percent of GDP. The government will need to rein in spending, especially the wage bill and transfers, and expand the tax base by (i) reviewing its current tax, expenditure, and fiscal incentive regime; and (ii) developing a program to increase existing revenue sources and find new sources that are less volatile and dependent on extractives.
8. With the total public and publicly guaranteed debt-to-GDP ratio projected to reach 91 percent of GDP by end-2016, Mauritania is at high risk of debt distress. Mauritania’s debt sustainability path is highly sensitive to GDP growth and changes in the external environment. However, the concessional nature of the debt stock1, with low debt service obligations and long maturities, mitigates these risks. Also, public investment has been critical in stimulating growth and reducing poverty, especially through infrastructure in rural areas. However, its high level remains a major concern for macro instability and no major cuts are foreseen. Implementation of the government's fiscal consolidation program will be vital to ensure medium-term debt sustainability, but institutional weaknesses could prevent successful implementation. The recent merger of the ministries of economy and finance, and the installation of the debt information opens the door for promising programmatic reforms in the area of debt management. 1 The net present value of the public debt stock is estimated at 56.8 percent of GDP due to the concessional nature of the debt.
2
9. Mauritania’s investment budget has increased significantly between 2010 and 2015 from 5.4 to 14.2 percent of GDP. High mineral prices have allowed the country to more than double domestic funding for investment, and it is now on par with investments from external resources. The execution rate of the investment budget has also improved considerably from 62 to 85 percent over the period, driven by the high execution rate of the domestically financed portion. While roads, ports, and water continue to receive the bulk of investment, there have also been significant increases in other areas such as industrial development which almost quadrupled and rural development which doubled. Investment in human development (health, education, justice, and culture) has also increased but it continues to be underfunded relative to the country’s needs. Almost half of externally funded investment goes on basic infrastructure (electricity, housing, roads and water). However, investment budget expenditures are not easily categorized. As with current expenditures, the largest share of the investment budget expenditures (26 percent) is not categorized at all.
10. Less progress has been made with public investment management (PIM). Like in the previous PIM assessment carried out in 2010 there are still few formal project appraisals unless carried out by development partners, no independent reviews of project appraisals, and no clear criteria for including projects in the national budget. Government strategies only inform the investment budget in a limited manner. Indeed, project selection seems to work in reverse: the government first seeks funding for a project, and then adjusts its Public Investment Program and Budget (PIP/BCI) to include it once the funding is secured. There is little coordination with recurrent budget planning to ensure there is enough money to run the facilities after completion. Poor coordination amongst institutions involved in investment budget preparation and implementation has led to a lack of data and analysis, and weak oversight and monitoring of public investment projects, which could lower their returns. The 2016 merger of the Ministries of Economic Affairs and Development (MAED) and the Ministry of Economy and Finance (MEF) provides an opportunity to bring greater coherence to investment budget preparation and monitoring as well as to public investment management.
11. Despite rapidly growing public investment expenditures, their impact on Mauritania’s economic growth has been lower than expected. The overall quality of its infrastructure is low, which can act as a drag on productivity growth, therefore getting a higher return on its public investments will be increasingly important as Mauritania’s fiscal space shrinks. An analysis of the macroeconomic impact of the PIP for 2014-16—estimated to cost MRO 615 billion (US$ 2 billion 2), or 11-14 percent of GDP per annum—finds its impact on economic growth to be around 3.2 percent of GDP, while the initial impact on prices and imports is modest. The PIP is financially and economically viable, as long as financing continues to be obtained largely on concessionary terms, and the financial internal rate of return is expected to be around 6 percent while the economy-wide rate of return is 14 percent. However, poor project management, cost overruns, delays and other forms of wastage (including corruption) could reduce returns to zero, limiting its impact and leaving it financially unviable.
12. Public investment could be made more efficient by clearly prioritizing public expenditures, and improving monitoring and evaluation. Areas for reform include (i) improving investment budget and project data, (ii) developing a clear strategy for public investments based on an understanding of the economic and social impacts and financial viability, (iii) improving investment project preparation and preliminary appraisal, (vi) clarifying roles and considering introducing an independent review of investment decisions, and (vi) monitoring and supporting project implementation. The Bank’s first development policy operation is supporting the authorities’ ongoing reforms to the PIM system, notably by creating the institutional framework for evaluating, selecting and executing public investment
2 The exchange rate used for the purposes of calculating USD equivalent is 300 Ouguiya to one dollar, which is the average for the World Bank reference rate over the period 2011-15. The market rate is around 340 as of end March 2016.
3
projects and through the preparation of a first integrated public investment budget with combined domestic and foreign financed projects.
13. Recent public procurement reforms have only brought about limited results. In 2010 Mauritania modernized its procurement system to make the system more transparent, efficient, and accountable in accordance with international standards. It set up several new public agencies to separate procurement, control and regulation, and a recent assessment found that the legislative framework of the procurement system was relatively strong, but that the system had room for improvement in other areas. The new agencies lack leadership and coordination, their procedures are not always well designed, efficiency is hampered by a lack of capacity among staff, and there are weaknesses in both internal and external audit. The risk of fraud and corruption in procurement is high. The procurement process should be improved by (i) consolidating the public procurement code and adopting a comprehensive set of regulations, (ii) increasing the efficiency and transparency of the independent procurement bodies, (iii) developing the capacity of public and private stakeholders, and (iv) putting in place effective oversight mechanisms.
14. Participation in primary and secondary education have increased—with 90 percent of both boys and girls now attending primary education. Achievement continues to be low, suggesting inefficiencies in the system and adult literacy rates have barely improved. Mauritania suffers from a shortage of qualified teachers and frequent changes in curriculum and education policies. Although spending has risen to 3.2 percent of GDP, it is still low for the region except at primary level, which receives about half of all education funding, and investment is concentrated in the tertiary sector. The poorest children receive the least benefit from education spending, with only 2 percent of those from the poorest quintile completing secondary education. Spending per student is also biased towards the wealthier regions.
15. Redistributing education spending could help to raise quality and effectiveness . Over 80 percent of recurrent spending goes to salaries, rising to 96 percent at primary level, and half of all investment has been concentrated on tertiary education. Key areas for reform include: (i) improving school quantity and quality to meet the priority goal of universal primary education, including spending more on maintenance and teacher training, and enforcing teachers’ attendance in the classroom; (ii) addressing equity issues to ensure students of all socio-economic backgrounds at least pass the primary certificate; (iii) strengthening the vocational education and training sector, including increasing resources for basic vocational and literacy programs for those who dropped out of education; (iv) reviewing the current scholarship program to target low-income students and tertiary courses with high employment potential; and (v) investing in the education information management system to make it functional.
16. Mauritania’s progress on meeting its health goals has been solid but unequal access remains an issue. Vaccination coverage has improved, malnutrition fallen to below the 2015 Millennium Development Goal (MDG) target, and child and maternal mortality rates have improved, although more than half of all babies in rural areas are still delivered without skilled care. However, government health priorities are not entirely reflected in spending allocations. Health spending, including on primary care, has risen from a low base in recent years but remains below average and unequal distribution of spending and health care staff is likely to exacerbate health inequalities. The poor and rural households have the least access to health care facilities. Private spending and health insurance are becoming increasingly significant while donor funding—which has largely funded preventative health programs—declines.
4
17. As budget constraints take hold, devolution and prioritization of health spending will be critical. Key areas of reform for the government will be to: (i) prepare a universal health coverage policy focusing on protecting people from financial risks, improving the quality of health services, and addressing external health risk factors such as smoking; (ii) improving health care staffing levels by recruiting and retaining skilled health workers through an attractive incentive scheme; (iii) reinforcing the most cost-effective interventions, putting more emphasis on outcomes rather than inputs, and concentrating on those healthcare interventions with the greatest possible benefits, such as maternal care and preventable diseases; (iv) strengthening budget management; and (v) reviewing its accountability mechanisms.
18. The irrigated and mechanized agriculture and livestock sectors have seen increased productivity, prices and incomes in recent years. This is in fact one of the principal drivers of the dramatic reduction in rural poverty since 2008. However, the impact of public programs in agriculture could be improved. Although the government has produced an agriculture strategy, it faces challenges in mobilizing the investment it needs to implement it and spending is increasingly dependent on donor funding. Public investment has increased to make up three-quarters of the sector budget, but it remains below estimated needs to further increase agricultural productivity. Subsidies introduced in the wake of a severe drought in 2011 averted a potential humanitarian crisis but some elements of the program—including the Boutiques Emel, selling subsidized food—have continued after the emergency has passed. Weak capacity and a top-heavy centralized administration have affected the quality of service delivery to farmers.
19. Better targeting of subsidies and more cost-effective administration could free up resources for productive investments. The government has recently adopted a decree eliminating rice subsidies. This provides an opportunity to implement a new approach to agriculture including: (i) developing a transition strategy from a publicly controlled market system to a market-oriented one; (ii) assessing the impact on the poor of eliminating rice subsidies and designing measures to mitigate it; (iii) reviewing options for time-bound smart subsidies, targeted as effectively as possible at resource-poor farmers; (iv) gradually closing the Boutiques Emel and reprioritizing safety-net interventions aimed at the poorest populations; (v) increasing sustainable investments in the agriculture sector with the resources freed up from winding down subsidies; (vi) encouraging private-sector investment through public-private partnerships; (vii) fully deconcentrating farmers’ extension and advisory services; and (viii) effectively monitoring and evaluating all public expenditures and programs.
20. Mauritania has made significant progress in increasing and diversifying the supply of energy but access for rural populations remain a challenge. Mauritania has gone from chronic electricity shortages in 2008 to generating an exportable surplus in 2014, with renewables making up 16 percent of total capacity. Although access to energy has improved it remains below the Sub-Saharan Africa average, with only 4 percent of the rural access. Subsidized electricity and free butane gas were intended to give low-income households access to clean energy, but have instead largely benefited higher income segments. With high fuel cost, the electricity tariff sells energy below cost, subsidizing consumers who could pay more and creating a drain on the sector, contributing to substantial financial losses of the national electricity company, SOMELEC, which also suffers from weak management and corporate governance.
21. The government has become dependent on external assistance for investment, creating problems of planning, coordination and insufficient consideration of ongoing maintenance costs . A very small proportion of the investment has benefited rural electrification. Reforms of the sector should concentrate on (i) urgently reducing SOMELEC technical and commercial losses, (ii) reducing reliance on imported fuel oil by investing in alternative energy sources and pushing ahead with the Banda gas to
5
power project, (iii) revising SOMELEC’s tariff structure, (iv) targeting subsidies to mitigate the impact of revised tariffs on the poor, (v) promoting rural electrification, (vi) developing electricity networks particularly in the Senegal River Valley, (vii) improving SOMELEC’s governance and management, and (viii) encouraging public-private partnerships for investments in new infrastructure.
22. The exact costs of implementing the recommendations outlined in this report are difficult to estimate. Some recommendations could imply very significant costs, such as improving school quantity and quality, addressing equity issue in education, or increasing funding for vocational training. Mitigation measures to protect the poor for an eventual electricity tariff revision could also be costly. But the exact costs would depend on the scale of implementation. In reality, the authorities would need to conduct further work to determine the realistic levels of expanding certain programs or services and given their own fiscal constraints. Yet again, many recommendations that could have a significant impact would imply little or no costs, and many are already financed by the authorities or donors. Others, such as the phasing out of the boutiques Emel would imply significant savings of around 1-2 percent of GDP. This is also the case for a review and adjustment of the scholarship program for higher education, which would generate savings that could be used to expand vocational training for example. Many of recommendations require reallocations within sectors and might not imply overall increases to the sectoral budget allocation. A list of all 42 recommendations, as well as their costs/fiscal implications are included as an annex (Annex A5) to this report.
6
Chapter 1: Macro Economic and Fiscal Trends
Recent Growth Has Largely Been Driven by High Commodity Prices…
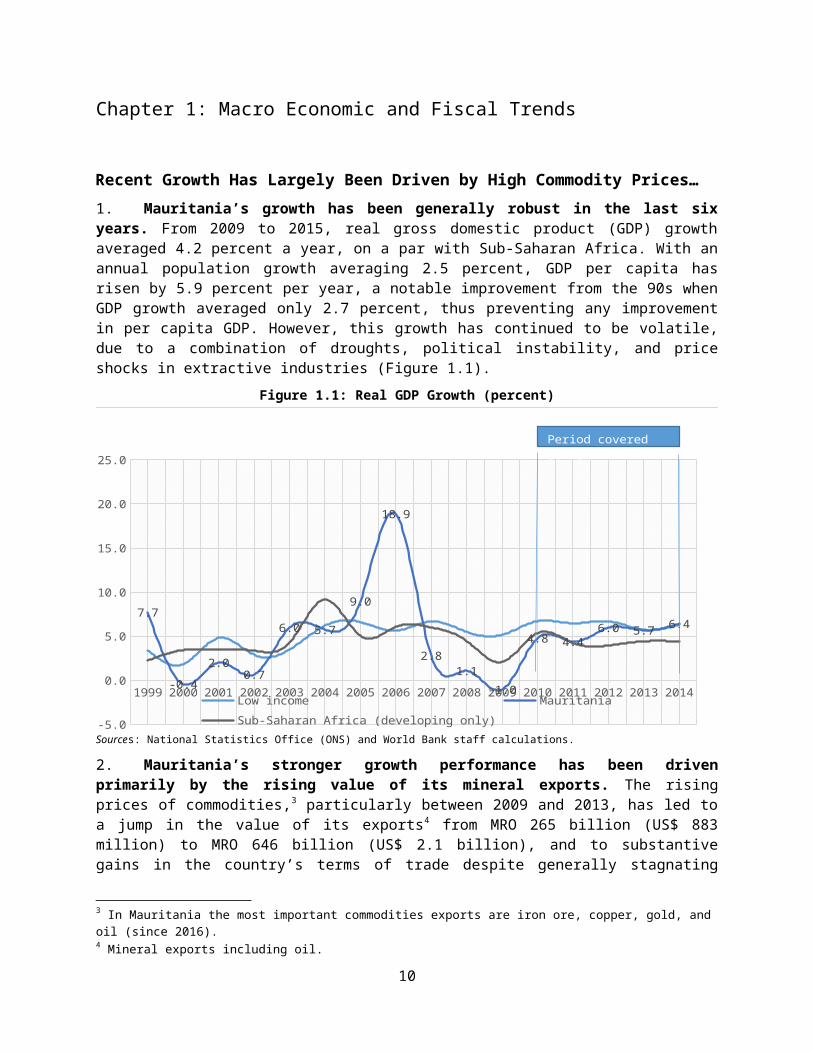
1. Mauritania’s growth has been generally robust in the last six years. From 2009 to 2015, real gross domestic product (GDP) growth averaged 4.2 percent a year, on a par with Sub-Saharan Africa. With an annual population growth averaging 2.5 percent, GDP per capita has risen by 5.9 percent per year, a notable improvement from the 90s when GDP growth averaged only 2.7 percent, thus preventing any improvement in per capita GDP. However, this growth has continued to be volatile, due to a combination of droughts, political instability, and price shocks in extractive industries (Figure 1.1).
Figure 1.1: Real GDP Growth (percent)
1999 2000 2001 2002 2003 2004 2005 2006 2007 2008 2009 2010 2011 2012 2013 2014
-5.0
0.0
5.0
10.0
15.0
20.0
25.0
7.7
-0.4
2.00.7
6.0 5.7
9.0
18.9
2.81.1
-1.0
4.8 4.46.0 5.7 6.4
Low income MauritaniaSub-Saharan Africa (developing only)
Period covered by PER
Sources: National Statistics Office (ONS) and World Bank staff calculations.
2. Mauritania’s stronger growth performance has been driven primarily by the rising value of its mineral exports. The rising prices of commodities,3 particularly between 2009 and 2013, has led to a jump in the value of its exports4 from MRO 265 billion (US$ 883 million) to MRO 646 billion (US$ 2.1 billion), and to substantive gains in the country’s terms of trade despite generally stagnating production5. Driven by the mining boom, non-tradable domestic sectors, such as construction, utilities, transport, and communications have been the fastest-growing sectors of the economy. Taken together, these sectors have grown at an annual rate of almost 6.2 percent since 2009. 6 Meanwhile, agriculture and fisheries have made the largest contribution to GDP growth due to their overall size, despite having grown more slowly than the economy as a whole. Their share of GDP has fallen steadily from 31.8
3 In Mauritania the most important commodities exports are iron ore, copper, gold, and oil (since 2016).4 Mineral exports including oil.5 Data sources in this chapter are the World Bank Commodity Outlook for Commodity Prices; the National Statistics Office annual reports, the Conjuncture quarterly reports, and the Treasury for fiscal information; and National Statistics Office Annual Report for trade.6 All numbers in this section are in real prices with 2004 being the base year.
7
percent in 2009 to 29.9 percent in 2014.7 The small manufacturing sector (7.2 percent of GDP) maintained its share of the economy during that period.
3. Extensive foreign investment in mining and the expansion of the construction sector mean Mauritania’s GDP growth has been dominated by capital formation, which has increased almost three times as fast as consumption. The ratio of investment to GDP has grown significantly from less than 43.6 percent in 2009 to over 61 percent in 2014.8 It averaged 28 percent of GDP over the period 2000–14, well above the averages for Sub-Saharan Africa (19 percent) and North Africa (22 percent). Private investment, driven by foreign inflows, has increased even faster than public investment. Mauritania broadly reflects trends in Sub-Saharan Africa, which displays a greater dependence on capital than any other region in the world. With the end of the commodity super-cycle9 in the second half of 2014 and the collapse of iron ore prices,10 pressures on growth have started to appear in Mauritania. In 2015, economic activity slowed down and GDP growth is now estimated at a mere 3 percent. If not addressed, this combination of slower growth, an undiversified economy and external shocks from low international commodity prices is expected to have a detrimental effect on macro and fiscal stability.
... Leaving Budgets Vulnerable to External and Domestic Shocks
4. Mauritania’s budgetary outcome has been largely shaped by a series of domestic and external shocks. Between 2009 and 2015, the budget deficit fluctuated between -4.9 percent of GDP and -0.1 percent (Table 1.1). Many domestic shocks have led to this outcome. These include the violent political crisis in 2008/09 that saw a withdrawal of donor support, and the drought in 2011 that reduced harvests by more than 50 percent causing an acute food crisis and pushing the government to launch the National Solidarity and Emel Programs. Together these initiatives ended up costing 150 billionn MRO during 2011-15 (US$500 million), equivalent to 7 percent of expenditures over the period. Regional instability compounded these challenges. The Malian refugee crisis in 2012 and the rise of the terrorist network, Al-Qaeda in the Islamic Maghreb (AQIM), in the remote desert areas11 has added further budget pressure on both security and emergency relief spending. External shocks have also dominated the economy. The end of the commodity super-cycle and the sharp drop in the international prices of iron, copper, and oil have had a severe impact on domestic revenues. This has led to a worsening deficit, notably in 2014 and 2015, which is threatening the macroeconomic stability of the country. Even the budget surplus of 3.5 percent of GDP in 2013 was largely due to a one-time receipt of large fishing royalties (4.0 percent of GDP) and of donor grants (1.6 percent of GDP) to support the humanitarian needs of Malian refugees.
7 Latest available data.8 Latest available data. The share of GDP reached 71 percent in 2012 and 65.6 in 2013.9 Referred to as the end of the super-cycle from here on.10 An increase in production by some of the world’s largest iron ore suppliers, coupled with a slowdown in Chinese demand, generated a glut on the market, such that international iron ore prices plunged 66.7 percent between 2011 (the peak price during the analysis period) and 2015.11 Bordering on Mali and Algeria.
8

Table 1.1: Budget Balance, 2009–15 (percentage of GDP)
2009 2010 2011 2012 2013 2014 2015ePrimary balance excluding grants (deficit -) -1.6 -0.1 0.4 -4.5 3.1 -1.4 -4.2Primary balance including grants (deficit -) -1.3 0.7 0.9 -4.0 4.6 -0.6 -2.5
Overall balance excluding grants (deficit -) -3.3 -1.4 -0.6 -5.4 2.0 -2.5 -5.4Overall balance including grants (deficit -) -3.0 -0.6 -0.1 -4.9 3.5 -1.6 -3.6
Sources: National Statistics Office (ONS), Treasury and World Bank staff calculations.
5. The volatile fiscal position raises concerns over the ability of Mauritanian fiscal policy to reduce the impact of shocks and ensure macro stability. With a high concentration of domestic revenues coming from the mining and oil sectors, and intermittent pressures on public spending to cope with security and emergency situations, fiscal policy has so far been reactive and failed to build much-needed fiscal buffers. Given the likelihood of a reduced fiscal envelope in the future, the emphasis must be on mobilizing revenue and improving the quality of spending so as to ensure a sustainable growth and achieve Mauritania’s development objectives. In the sections that follow, this chapter examines revenue and expenditure trends, and identifies rigidities in the Mauritanian fiscal policy. It then looks at the medium-term fiscal outlook in a post super-cycle environment and highlights the need for a more proactive fiscal policy to ensure macro stability. Box 1.1 briefly covers issues of data and governance.
Tax Reforms Have Brought Results, But Not Enough to Offset the Effect of Falling Commodity Prices
6. Domestic revenues have been volatile in the past five years. Between 2009 and 2015, domestic revenues fluctuated between 20.4 and 31.2 percent of GDP, rising sharply in 2012 as exports prices spiked and improvements in tax administration boosted collection rates (Table 1.2). Tax is the largest source of revenue in Mauritania. It consists primarily of taxes on goods and services (50.3 percent) and income taxes (32.5 percent).12 Taxes on goods and services are linked to the development in the extractives sector as they encompass both a unique tax and a value-added tax (VAT) on the imports of the National Mining Company (Société Nationale Industrielle et Minière de Mauritanie; SNIM), and a tax related to petroleum products.13 Non-tax revenues averaged 8.4 percent of GDP, including receipts from the fisheries and mining sectors14 along with dividends from public enterprises such as SNIM and the telecom company, Mauritel. Finally, revenues from the petroleum industry average 1.4 percent of GDP and include both direct taxes on oil companies and all types of royalties and fees.
Table 1.2: Decomposition of Budget Revenues by Selected Categories, 2009–15
Revenue categories 2009 2010 2011 2012 2013 2014 2015 AverageRevenue excluding grants 20.4 21.1 22.1 25.6 31.2 27.5 26.2 24.9
Tax revenue 11.1 13.0 12.8 17.3 16.7 18.3 16.8 15.1Taxes on income and profits 3.6 3.6 3.8 5.6 5.6 6.4 5.9 4.9Taxes on goods and services 5.6 6.6 7.0 9.3 8.4 9.0 7.5 7.6Taxes on international trade 1.5 1.5 1.6 2.0 2.0 2.1 2.4 1.9Other tax revenues 0.4 1.3 0.5 0.3 0.7 0.8 1.1 0.7
Non-tax revenues 7.9 6.9 7.6 6.9 13.2 7.6 8.4 8.4Fishing licenses 4.3 3.5 2.6 0.6 4.0 2.1 1.4 2.6
12 On average for the period 2009–15.13 Although the tax on petroleum products is mostly linked to gasoline at the pump as opposed to taxes on Mauritania’s oil sector.14 Including royalties, fees, and other receipts.
9

Dividends from SOEs 1.9 1.1 2.3 4.3 3.3 3.6 1.0 2.5Petrolium Revenues 1.4 1.1 1.6 1.5 1.3 1.6 1.1 1.4
Grants 0.2 0.8 0.5 0.5 1.6 0.8 1.8 0.9Total Revenue 20.7 21.9 22.6 26.2 32.8 28.4 28.0 25.8Sources: National Statistics Office (ONS), Treasury and World Bank staff calculations.
7. Mauritania has embarked on a series of tax reforms since 2011 that have boosted government revenues at the end of the commodity super-cycle. Major reforms included15 (i) the elimination of corporate income tax exemptions and the cancellation of the minimum tax16 in 2012, (ii) the elimination of the global income tax in 2012 and the introduction of a withholding tax of 15 percent on any payment to nonresidents in 2013 that limits profit shifting to foreign companies, and (iii) reforms in the VAT reimbursements regime in 2011 that supported formalizing the economy and collecting more taxes. 17 As a result, tax revenues increased rapidly from slightly over 12 percent of GDP on average over the period 2000–11 to 17.4 percent of GDP on average in 2012–15. By 2012 domestic revenues were significantly larger than in comparable countries and substantially exceeded the Sub-Saharan Africa average (Figure 1.2).
Figure 1.2: Revenues in Comparator Countries (percentage of GDP)
Mali Ghana Senegal Sub-Saharan Africa
Mauritania Morocco0
5
10
15
20
25
30
35
40
16.6
19.4 20.221.6
25.6
34.8
15.6 14.9
19.2
13.7
17.3
23.9
Revenue, excluding grants Tax revenue
Source: World Development Indicators (database), World Bank, Washington, DC, http://data.worldbank.org/data-catalog/world-development-indicators.
8. However, these reforms have not been enough to stave off a severe decline in domestic revenues that started in 2014 with the end of the super-cycle. Revenues in Mauritania remain highly dependent on developments in the extractives sector. Iron ore, copper, and oil prices have fallen by 59, 25, and 51 percent respectively in the past two years. As a result, domestic revenues dropped by an accumulated 5 percent of GDP, driven primarily by heavy falls in dividend receipts from SNIM and revenues from the oil sector. Those losses demonstrate the volatility of these revenue resources and the negative effect it can have on attempts to build fiscal buffers for future spending on physical and human capital. This highlights the need to have a more stable and wider revenue base.
9. The national oil fund could provide a good buffer for counter-cyclical fiscal policies, but poor governance hinders this role. The national oil fund was established in 2006. Although recent production volumes were well below expectations, the fund gradually but consistently increased through 2014, 15 Review IMF (2015) for more details.16 The minimum tax revenue was 2.5 percent on turnover.17 Firms in the formal sector, especially exporters, have an incentive to make purchases from formal suppliers that provide proper VAT invoices so that they can claim VAT credit. This is particularly the case for mining companies, which are mostly exporters and taxed at zero rate.
10
supported by rising international oil prices. The fund is an important step forward as, in theory, it constitutes a good mechanism for fiscal stabilization under a proper set of fiscal rules. 18 Indeed, the fund provides a tool to conduct counter-cyclical fiscal policy and help smooth external shocks by insulating key expenditures, such as investment in physical and human capital, against volatile commodity prices. However, several governance issues hinder its proper functioning. This includes the absence of any audit, the opaque selection process of projects to be funded, and the excessive drawdown of the funds during periods of economic growth.
10. The legal structure, updated in 200819 defines the nature of the revenues that replenishes the fund and the mechanisms organizing its linkage with the state budget. In effect, the legislation requires that any transfers be recorded in the budget and that a financial viability study accompany each withdrawal. The law also tasks the minister in charge of finance with the primary responsibility to manage the Fund, with the Governor of Central bank playing a deputy manager role and having the final decision in terms of FX transaction. A consultative investment committee for the fund has been set-up to assist the minister and provide him with all the technical inputs regarding investment decisions and management of the assets. Finally, quarterly and yearly reporting on the financial and performance situation of the oil fund are mandated. These are regularly published on the MEF Treasury website. The requirement of yearly auditing by the Courts of Account and independent auditors are also specified in the text. It is unclear though whether these requirements are being fulfilled on timely basis. However, it should be noted that as the revenues from oil have failed to materialize based on the earlier expectations, the fund has been severely draw-down (used to finance the growing PIP) and is now rather irrelevant. Its structure though remains important and can be replicated for broader extractives receipts.
11. Grants have contributed significantly to Mauritania’s fiscal envelope. On average, the country received around 1 percent of GDP in grants each year for the period 2009–15. This is a significant amount for a country of its population. Official development assistance per capita exceeds that of most comparator countries and is almost twice the average for developing countries in Sub-Saharan Africa (Figure 1.3). However, it is another volatile source of revenue (Table 1.2 above) and depends on external shocks that hit the country. Indeed, in 2012/13 the country received strong international support to shore up food security and manage the inflow of Malian refugees. As a result, grants should be treated with caution for fiscal policy planning purposes and are not a substitute for domestic revenue mobilization.
Figure 1.3: Comparison of Net Official Development Assistance, 2009–13 (US$ average per capita)
Cameroon Morocco Sub-Saharan Africa
Ghana Mali Senegal Mauritania0
10
20
30
40
50
60
70
80
90
10099.6
Source: World Development Indicators (database), World Bank, Washington, DC, http://data.worldbank.org/data-catalog/world-development-indicators.
18 Cf. Dessus and Varoudakis (2013).19 Under the Ordonance number 2008-020
11
Box 1.1: Budget Data and Governance
Until early 2016 the Ministry of Finance (MEF) and the Ministry of Economic Affairs and Development (MAED) shared responsibility for budget management, and their overlapping mandates compromised the quality of data collection and analysis. Investment projects were recorded in two different information systems operated by the MEF and MAED. These two systems used different classifications for the same projects, and there was no official method for reconciling these differences, which greatly complicated fiscal management and introduced substantial uncertainty into budgetary analyses.
As in many developing countries, foreign-financed projects are not properly accounted for in budget documents. If an externally financed project is co-financed domestically, the national budget only records the domestic contribution, both during the planning and execution phases. Projects that are entirely foreign financed are excluded from the budget altogether. While MAED does record some data on external financing, it does not use the same classifications as the national budget. Donor records are also inconsistent with national accounting systems, and many development partners do not provide timely financial information on execution. Absent, partial, or incompatible data on external financing jeopardize the comprehensiveness of the budget and compromise the ability of analysts, both within and outside the government, to identify spending patterns and evaluate their impact on Mauritania’s development objectives.
In this context, information technology (IT) systems provide a valuable opportunity to enhance the comprehensiveness, quality, and reliability of budget data. The Treasury Department currently posts a range of public financial information on its website, including the Table of State Financial Operations (Tableau des Opérations Financières de l’État; TOFE), as well as monthly Treasury statements, oil profit reports, and updates on the Budget Law and its execution. However, this information is not consolidated, much of it is highly aggregated, and is presented in a format that does not facilitate access or analysis by non-specialists. Nevertheless, this PER relied on the TOFE and the statistical bulletins of the National Statistics Agency to examine broad expenditure trends, as the best available source of long-term data.
The implementation of the BOOST database and the Electronic Expenditure Chain System (Réseau Automatisé de la Chaîne des Dépenses; RACHAD) represent two major steps forward in information management. BOOST is designed to improve access to public financial data and enhance the quality of expenditure analysis. It compiles disaggregated data from multiple sources and organizes them into three categories: institutional data, functional data, and economic data. This PER uses BOOST as its main source for data on approved budgets, investment spending, and (to the extent possible) foreign-financed development expenditures. Within the government, RACHAD complements BOOST by consolidating the financial information reported by multiple agencies into a single system. Annex A2 provides further details on BOOST and RACHAD.
Despite notable improvements in recent years, the quality of expenditure data continues to suffer from serious weaknesses. Expenditure data are sourced from both the original and revised Budget Laws, and information on commitments and obligations is readily available. However, data on executed expenditures are often subject to long delays. Data on actual executions (payments) have not yet been incorporated into BOOST, as they appear not to be fully consolidated at the national level. This analysis therefore considers the closest phase of the budget cycle to the actual payment: the payment order at the Treasury. This information gap likely reflects the overlapping reporting responsibilities of the different departments, including the MAED and the MOF, involved in the budget process.
Expenditure Planning
Mauritania’s experience with medium-term expenditure frameworks (MTEFs) has been mixed due to weaknesses in planning capacity and interagency coordination. MTEFs are meant to improve budget management by strengthening links between the policy, planning, and budgeting processes. This is especially critical in environments with limited fiscal space, where scarce resources need to be used as efficiently and effectively as possible. In Mauritania, the MAED produces an annual “global MTEF” in close collaboration with the MOF. Sectoral MTEFs have not been produced since the early 2000s, mostly due to a lack of capacity in the sector ministries. In principle the MTEF should align short-term macroeconomic stabilization and service delivery objectives with the government’s long-term strategy for investment and growth. This requires: (i) an
12
accurate appraisal of the fiscal resources that will be available during the MTEF’s implementation period, (ii) an understanding of both the initial and future costs of investment projects and recurrent spending programs, and (iii) a systematic decision-making process that reconciles point (ii) with point (i). In practice, however, Mauritanian authorities are often unable to effectively estimate the long-term costs of public spending plans or select and prioritize projects to match the available resources.
Although it continues to be regularly produced, the global MTEF does not serve its primary functions of informing the annual Budget Law and aligning it with the government’s broader development strategy. Ideally, the preparation of each global MTEF should begin no later than March of each year and be completed by August, when work on the following year’s Budget Law begins. In reality, however, the Budget Law and the global MTEF are almost always prepared at the same time, both beginning in August. Moreover, investment planning is not in line with the budgetary calendar, and investments are planned during the budget year instead of at the beginning of each annual cycle.
Capital Expenditure Has Tripled and Public Spending Increased Steadily Overall
12. While public spending increased steadily between 2010 and 2015, patterns of current and capital expenditure differed significantly. Table 1.3 shows the composition of central government expenditures by economic classification, including wages, operations and maintenance, subsidies and transfers, capital expenditure, and special accounts. Current expenditure fluctuated from between 16.6 and 20.4 percent of GDP, due in part to the temporary spending demands of recent crises. The wage bill typically accounted for the largest share of current expenditure, averaging 7.0 percent of GDP between 2009 and 2015, followed by goods and services procurement at 4.1 percent of GDP, subsidies and transfers at 4.1 percent, and debt-service payments at 1.2 percent. This section explores the trends for some of the major spending items, and briefly outlines some of the key constraints to consolidation in each category.
13. The wage bill in Mauritania is underreported and accounting issues complicate its analysis. The TOFE reveals that the wage bill averaged 39.7 percent of recurrent spending between 2009 and 2015. While this figure is broadly in line with Sub-Saharan African countries, 20 it does represent 48.2 percent of tax receipts. This is a relatively high proportion especially when compared to the convergence criteria set for West African Economic and Monetary Union (WAEMU) countries at 35 percent. The actual wage bill may be significantly higher than the budgeted figure. In addition to Mauritania’s 38,000 full-time civil servants, approximately 8,500 “non-permanent staff” are employed by the public sector. These temporary workers are not tracked in the human resources management system, and their compensation is not included in the wage bill.21 Instead, it falls under “goods and services procurement.” Moreover, many temporary staff are recruited without any formal vetting or verification process, raising important transparency concerns.22 Despite the government’s notable progress in strengthening human resource management in recent years,23 proper wage-bill accounting continues to present a significant challenge.
20 According to the World Development Indicators, the average for the continent was 36.7 percent.21 These temporary workers are often hired at lower wages than civil servants. The Ministry of Finance estimates their remuneration costs at around MRO 1 billion – US$ 3.3 million.22 The figures above do not reflect also the number of staff recruited by state-owned enterprises or public agencies.23 In 2015 the government started implementing a control system that eliminates duplications in the wage bill. The government is now in the process of finalizing a biometric census for all civil servants in order to issue a single identification number.
13
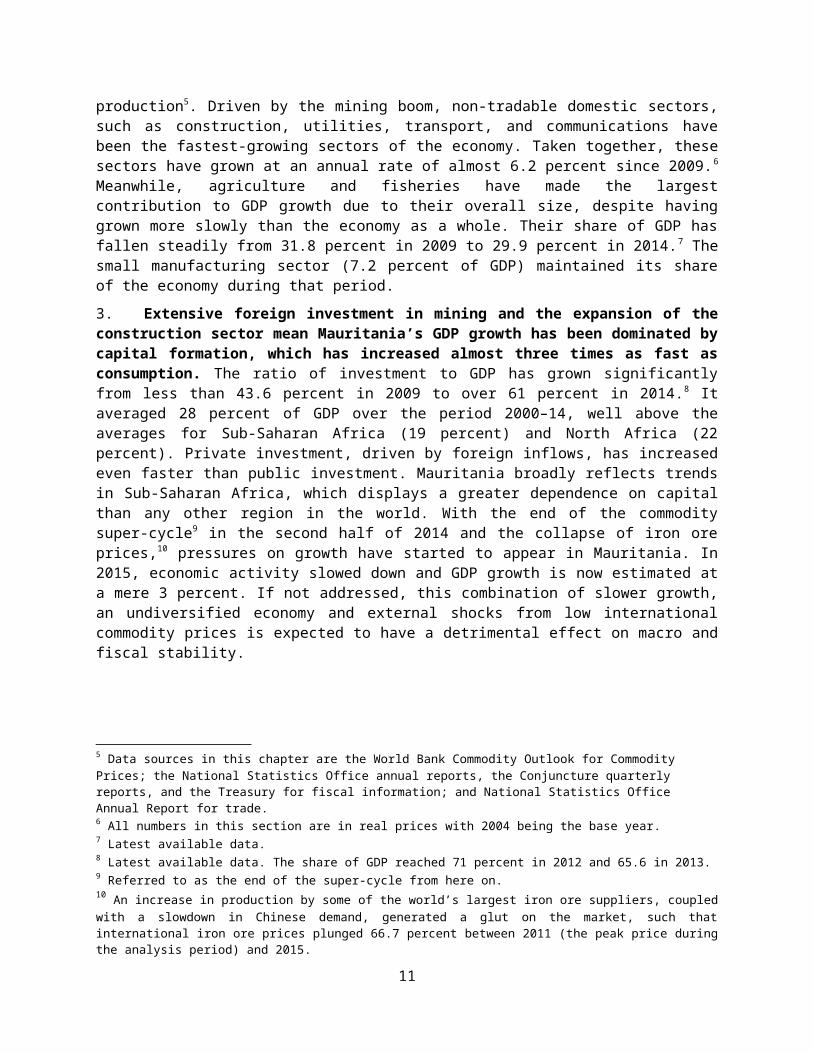
Table 1.3: Decomposition of Public Expenditure by Selected Categories, 2009–15 (Percent of non-oil GDP)
Expenditure Categories 2009 2010 2011 2012 2013 2014 2015e AverageCurrent Expenditure 17.2 16.8 16.6 20.4 17.9 18.6 17.4 17.8
Salaries 8.0 7.0 6.2 6.6 6.8 7.0 7.8 7.0Goods and services 5.4 3.9 3.6 3.8 4.0 4.3 3.8 4.1Current transfers 2.1 1.5 4.2 7.4 4.6 4.7 3.9 4.1Public debt service 1.7 1.3 1.0 0.9 1.1 1.0 1.2 1.2
External 0.5 0.6 0.6 0.7 0.7 0.7 0.8 0.7Internal 1.2 0.6 0.4 0.2 0.4 0.3 0.3 0.5
Other current expenditures -0.5 1.2 0.9 1.1 0.8 0.8 0.7 0.7Special accounts 0.5 1.9 0.8 0.7 0.5 0.8 0.1 0.7
Investment Expenditure 6.0 5.4 5.9 9.5 11.3 11.4 14.2 9.1Externally financed 0.0 1.1 2.1 3.5 4.1 3.6 5.0 2.8Domestically financed 0.0 4.3 3.8 6.0 7.2 7.8 9.2 5.5
Restructuring and net lending 0.5 0.3 0.0 0.8 0.0 0.0 0.0 0.2Common reserves 1.7 1.1 0.7 0.8 0.8 0.8 0.8 1.0Reserves for emergency
expenditures 0.0 0.0 0.2 0.3 0.0 0.0 0.0 0.1Total expenditure 25.4 23.6 23.4 31.8 30.0 30.8 32.5 28.2
Sources: National Statistics Office (ONS), Treasury, IMF and World Bank staff calculations.Note: e: Estimates based on 11 months of data.
A Large Parastatal Sector Poses Fiscal Risks
14. The Parastatal sector is large and imposes a substantial burden on the national budget. The SOE sector has grown in recent years to approximately 150 institutions—50 state-owned enterprises (SOEs) and 100 autonomous government agencies. The combined revenue of non-extractives SOEs in 2014 was 15.8% percent of non-extractives GDP and they held assets worth 56% of non-extractive GDP. The largest mining SOE (SNIM) alone has had an average turnover of over 17 percent of GDP in recent years, which puts the size of the commercial SOEs at close to a third of GDP on average. This changed in 2015 with the dramatic reduction in SNIM revenues to 95 billion MRO (318 million USD) from 212 billion MRO (706 million USD) in 2014 and a high of 421 billion MRO (1.4 billion USD) in 2011. As of 2015 the 15 largest SOEs made up 94 percent of total SOE turnover, which stood at 292 billion MRO (974 million USD) or 17 percent of GDP (see figure 1.10).
Figure 1.4: Largest commercial SOEs by revenues 2015 (MRO Bn)
PA
ND
P
CA
MEC
SO
NIM
EX
SO
MA
GA
Z
SM
H
CN
SS
SN
AT
PA
NP
A
SN
DE
MA
IL
CN
AM
EN
ER
SO
MELEC
MA
UR
I TEL
SN
IM
3 5 5 5 6 6 6 7 7
12
12 14
41
51
96
15. The state depends on some of the largest SOEs for a significant part of its revenue but have seen a dramatic reduction in dividend payments in 2015. Dividend payments have varied between 0.5 to 16.5 percent of total revenue between 2000 and 2015, averaging 6 percent. SNIM has been by far the largest contributor followed by Mauritel, BCM and the Ports of Nouakchott and Nouadhibou. In
14
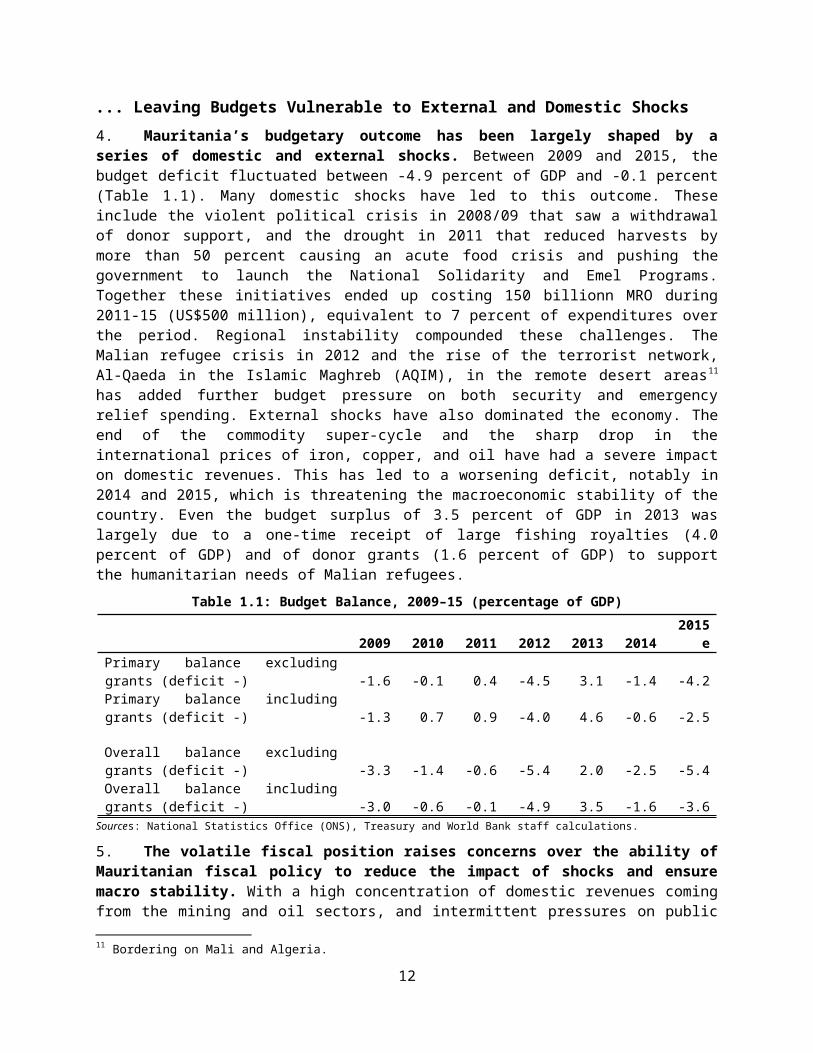
addition to dividend payments, SNIM has also paid between 40-30 billion MRO per year in a special tax and VAT payments (8-10 percent of revenues). However, a lack of dividend payments by SNIM in 2015 has dramatically reduced their contribution to the national budget from a high of 16.5 percent of revenues in 2012 to just 3.4 percent of revenues in 2015 and a projected 2.3 percent in 2016. Figure 1.5: Dividend payments (MRO Bn and % of Revenue Figure 1.6: SOE Dividend payments by company 2010-16 (MRO Bn)
2000 2001 2002 2003 2004 2005 2006 2007 2008 2009 2010 2011 2012 2013 2014 2015 20160.0
10.0
20.0
30.0
40.0
50.0
60.0
70.0
0.0%
2.0%
4.0%
6.0%
8.0%
10.0%
12.0%
14.0%
16.0%
18.0%
Dividends MRO Bn Dividends as % of Income
2010 2011 2012 2013 2014 2015 20160
10
20
30
40
50
60
70
SNIM BCM Mauritel Panpa+NDB
Source: TOFE
16. On the other hand, subsidies and other transfers to Parastatals are high and weigh on a shrinking budget. Budget transfers to EPAs are on average 8.8 percent of non-oil revenues, having decreased from a high of 14 percent in 2009 to 4.1 percent in 2014 and 9.4 percent in 2015. While EPAs are essentially extensions of the public sector, they enjoy great financial autonomy, receiving block grant transfers from the state, with very little accountability for results and very weak financial reporting on the use of these funds. Explicit subsidies to commercial SOEs were on average 3.7 percent of revenues in 2010-14, with a strong surge in 2011 and 2012, up from just under 6 billion MRO to 18 billion MRO (2.2 to 4.8 percent of revenues). In addition to the explicit subsidies, around 26.8 billion MRO was spent on capital injections to state owned enterprises through share purchases (19 billion MRO) or as loans or advances (7.8 billion MRO) in 2011-13. Subtracting the subsidies received from the dividends and taxes paid by SOEs to the state, the net fiscal impact of SOEs was negative in 2015 (15 MRO billion or 3.5% of revenues), mainly due to the lower dividend payments.
15
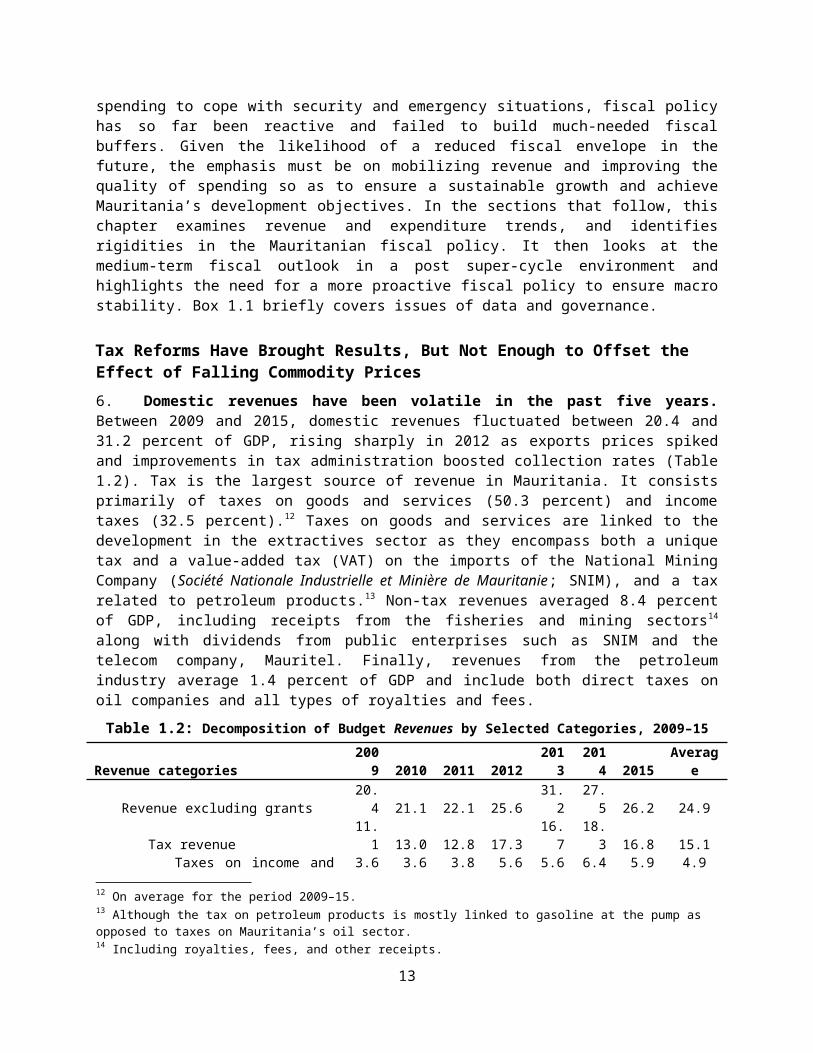
Figure 1.7: Transfers to EPAs (MRO Bn and % of Revenues Figure 1.8: Subsidies to SOEs (MRO Bn and % of Revenues)
Source: Ministry of Finance
17. The performance of commercial SOEs vary greatly, but overall the sector has seen net positive results in 2013 and 2014 (Figure 1.9). While data
for 2015 is incomplete, there are indications of very significant losses, led by SNIM which alone lost a reported 58 Bn MRO (3.6 percent of GDP). However, even the positive 2014 result masks very large differences between companies. Of the 50 companies, 22 lost a combined 20 Bn MRO, while 24 companies made a combined 29 Bn MRO in 2014. The largest profits were made by Mauritel, the national social insurance fund (CNAM) and the port of Nouakchott, while the largest losses were seen in the electricity and water utilities (SOMELEC and SNDE) and the oil company (SMH), in addition to SNIM. SOEs have increased their capital investments significantly in recent years. Fixed assets doubled between 2010 and 2014 to 414 Bn MRO (1.3 Bn USD) and construction in progress increased by 150% to nearly 400 million USD (Figure 1.5). Total assets doubled, reaching 710 Bn MRO (2.36 Bn USD), over 55% of non-extractive GDP. Another notable growth area for SOEs was the increase of groups and associates, which went from 2 to 36 Bn MRO over the period (7 to 123 million USD). Depreciation and impairments averaged 37 percent of total assets over the period. Salary expenses in SOEs increased in nominal terms by 50% from 2010, reaching 31.8 Bn MRO in 2014 (106 Million USD).
Figure 1.9 SOE: Revenues, Liabilities, Net margin, (MRO Bn and % of GDP) Figure 1.10: SOE Assets 2010-14 (MRO Bn and Percent GDP)
16
2009 2010 2011 2012 2013 2014 20150
5
10
15
20
25
30
35
40
0.0%
2.0%
4.0%
6.0%
8.0%
10.0%
12.0%
14.0%
16.0%
Expenditures MRO Bn% of Total Revenues and Grants % of Non oil Revenues, excl grants
2010 2011 2012 2013 20140
2
4
6
8
10
12
14
16
18
20
0%
1%
2%
3%
4%
5%
6%
MRO % of Revenues
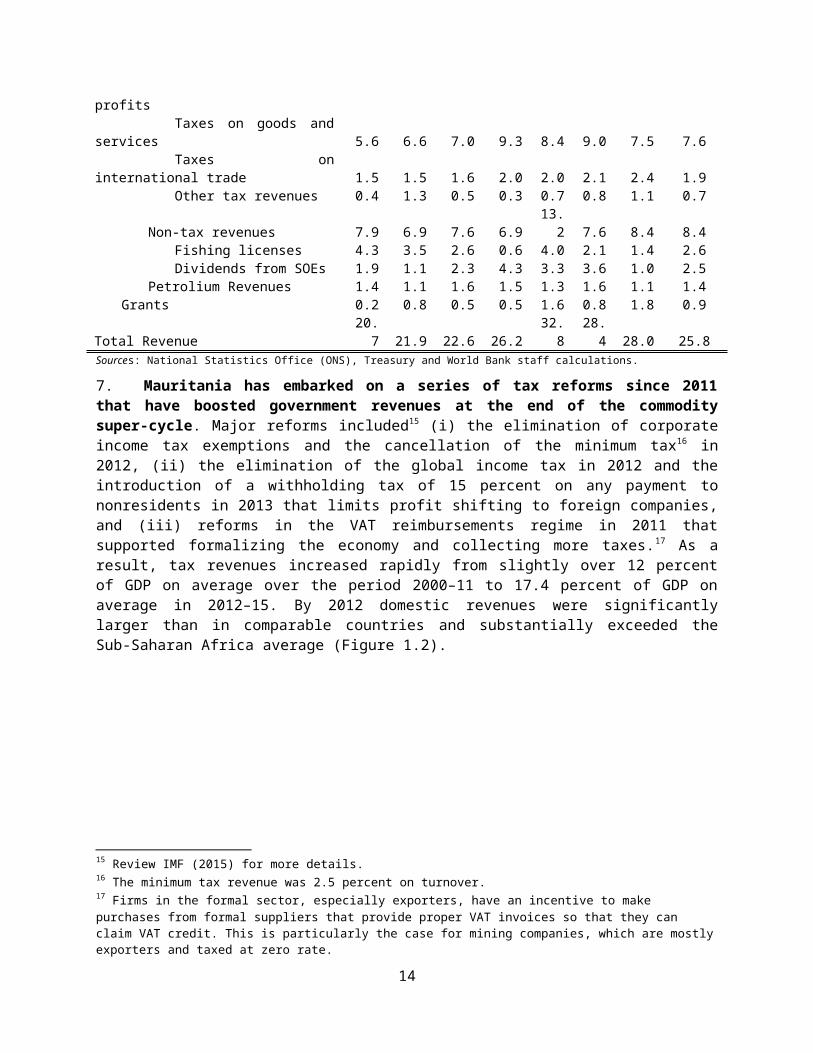
Figure 1.11: Largest losses 2015 or 14 (MRO Mn) Figure 1.12: Most profitable SOEs 2015 or 14 (MRO Mn)
Source: Ministry of Finance
18. Contingent liabilities in the form of SOE debt with government guarantees reached 9.2 percent of GDP in 2015 (excluding SNIM). Total debt and liabilities reached 711 billion MRO (56 percent of GDP), with 132 billion being in the form of medium to
long term debt (10% of GDP). Of this, 129 MRO billion is guaranteed by the state (9.2 percent of GDP). The seven largest beneficiaries of state guaranteed debts made up 75% of this amount. These are the telephone company (Mauritel), electricity utility (SOMELEC), oil company (SMH), the basic social services agency (APAUS), Housing
(ISKAN), a second telecom SOE (IMT) and the import-export company (SONIMEX). Overall the aggregate financial indicators suggests a relatively healthy parastatal sector in 2014. Liquidity is good (118% as of 2014) as are other basic measures. Overall, SOEs have increased their equity share of financing from just over half in 2010 to equal debt financing by 2014. Increased government transfers since 2011 have undoubtedly played a role in both the improved financial results and in their increased financing capacity. Figure 1.13: SOE held debt with state guarantees (MRO Bn) Figure 1.14: SOE equity and debt financing (MRO)
Source: Ministry of Finance
17
2010 2011 2012 2013 20140
100
200
300
400
500
600
700
800
-6.0%
-4.0%
-2.0%
0.0%
2.0%
4.0%
6.0%
Revenues Debt and Liabilities Net Profit Margin
2010 2011 2012 2013 2014
-400
-200
0
200
400
600
800
1000
1200
237 278409 470 53356 59
5660
80
-146 -159 -161 -219 -245
160163
198221
243
42% 43%
52%50%
56%
Fixed assets Current Investments Accounts receivable Group and associates Depreciation and Impairment
Other assets % of GDP
SMCP SOMAGAZ IMT SONIMEX CNSS PANDP ENER PANPA CNAM MAURITEL0
2,000
4,000
6,000
8,000
10,000
12,000
14,000
16,000
18,000 2010 2011 2012 2013 20140
100,000,000,000
200,000,000,000
300,000,000,000
400,000,000,000
500,000,000,000
600,000,000,000
700,000,000,000
800,000,000,000
Equity Debt
SOMELEC SNDE SMH MAIL TVM IN STP SNDP SANADER RADIO
-10,000
-9,000
-8,000
-7,000
-6,000
-5,000
-4,000
-3,000
-2,000
-1,000
0

19. Until recently very little information was available regarding SOE performance, both in terms of service delivery and operational efficiency. Fortunately, this is beginning to change, with the preparation of the first complete SOE report underway. The government has made some effort to improve oversight of parastatals, but progress has thus far been limited. Sector ministries are expected to monitor the performance of parastatals in their respective areas, but they typically lack the administrative capacity to do so effectively. Moreover, the designated oversight offices at the sector ministries tend to focus on financial accountability, and largely ignore technical performance. Although the
government’s legal framework includes performance-based agreements with parastatals, in practice few agreements have been prepared and no information exists on enforcement. Processes for selecting the leadership of SOEs are often unclear, and the competence of leaders is rarely assessed. The authorities are aware of these issues and have recently established a general SOE directorate which is receiving capacity building support from the World Bank with a view to strengthen oversight and monitoring and to rationalize the sector.
20. Capital spending increased strongly in the past five years as revenues from extractives and tax reforms increased. In a context of high export prices and important reforms in tax and customs administration, the authorities focused on increasing public investment. The ratio of capital to current spending has increased continuously since 2010, and this trend accelerated over time. Between 2009 and 2015, capital expenditures more than doubled in nominal terms and as a share of GPD, rising from 6 to 14.2 percent of GDP. Domestically financed spending dominated this rise, reflecting the government’s decision to allocate further resources towards sustaining its development agenda. The future sustainability of such spending will be tested as international commodity prices fall and revenues from the extractives sector slow down. The efficiency and value for money of the executed projects are also in question. The average incremental capital to output ratio (ICOR),24 a metric of physical capital productivity which assess the marginal amount of investment capital required for a country to generate growth, has been evaluated at 10.4, well over the benchmark ratio of 3 which is the average for sub-Saharan Africa, indicating a highly inefficient deployment of capital.25
Overall Execution Rates Disguise High Volatility Within Spending Categories...
21. Actual spending has matched budget expectations more closely in recent years. On aggregate, budget execution rates have improved over time from 86 percent in 2009 to 99 percent in 2015. 26 This reflects a number of reforms in public financial management, such as the implementation of the development assistance database and reforms in the areas of budget preparation, cash management, and payment systems although there is great variance within categories. Subsequent chapters of the PER will examine these reforms more closely.
24 The ICOR is computed as growth in capital stock or public investment divided by the growth in real GDP. This average is for 2010–14 and is computed using National Accounts data. The year 2009 was dropped as it represents an outlier due to the political shock that year. National accounts figures for 2015 are only projections so were also not included.25 A higher ICOR value indicates that the country’s deployment of public investment (or capital) is inefficient.26 No data were available for 2015.
18
SONIMEX; 6.5
IMT; 6.8
ISKAN; 7.9
APAUS; 7.9
SMH; 7.9
SOMELEC; 27.4
MAURITEL; 31.5
22. Nevertheless, notable discrepancies appear once spending is considered at a more detailed level. Table 1.4 reveals that public spending on items such as loans, advances, subsidies and transfers, and interest payments have been volatile. The category of Loans, advances and equity investments was overspent by 211 percent in 2012 and 227 percent in 2015, while underspending 31 and 21 percent in 2011 and 2014 respectively. Subsidies and transfers was overspent by 266 percent in 2011 and 62 percent the following year.27 These are signs of continuing gaps in the budget preparation process and coordination failures between budget actors. A stark example is the underspending on debt amortization and interest payments, which is are relatively a straightforward budget items to estimate since the debt profile and maturities are generally known and documented.28 In many instances the underspending has not translated into a decline in the deficit but large reallocations within budget items towards public investment29 especially in the years following the last coup d’état between 2010 and 2013.
23. Capital investment spending has increased while falling short of budgeted amounts. Capital investment spending shows a strong under-execution of 34 percent in 2010, improving to a 3 percent over-execution in 2011 before falling to 14 and 13 percent under-execution in 2012 and 2013 and 29 percent under-execution in 2015 averaging a 15 percent under-execution between 2010 and 2015 for the domestic funding of capital investment projects. The significant variance in outturn rates is again a sign of poor investment planning. The budget revision which takes place in the third quarter of the year reduces these variances significantly, but expenditure outturn variance is still above 5% on average for the categories of interest payments (-13 percent), acquisition of fixed and intangible assets and loans (-11 percent), and advances and equity payments (-8 percent) for the period. Total capital expenditure nearly tripled from 32 billion MRO (US$ 106 million) in 2010 to a high of 90.3 billion MRO (US$ 300 million) in 2014.
Table 1.4: Expenditure Outturn—Initial Budget versus Actual, 2010–15 (percent)
Expenditure category 2010 2011 2012 2013 2014 2015 average1. Salaries and wages 8% -1% 0% 0% 0% 2% 2%2. Goods and services -20% 7% -3% -5% 5% -7% -4%3. Interest payments -23% -20% -26% -4% -1% 0% -12%4. Subsidies and transfers -7% 266% 62% 0% -2% -3% 52%6. Acquisition of fixed and intangible assets -34% 3% -2% -14% -13% -29% -15%8. Debt amortization 0% -17% -3% 26% 1% 0% 1%9. Loans, advances and equity investments 211% -31% -17% 27% -21% 227% 66%Total 2% 12% 10% 1% -1% 0% 4%
Sources: National Statistics Office (ONS), Treasury and World Bank staff calculations.
…While a Large Proportion of Government Expenditure Remains Opaque and Discretionary
24. Sectoral allocations have remained relatively consistent over time, although nominal spending has increased erratically. Between 2011 and 2015, public spending increased on average by 11 percent30 a year, but with large jumps in 2011 (17.6 percent) and 2012 (26.7 percent). This is partly due to
27 As a rule of thumb, outturns below 5 percent are generally considered acceptable.28 This raises concerns over the area of debt management in Mauritania.29 Labeled as acquisition of fixed and intangible assets.30 Nominal values.
19
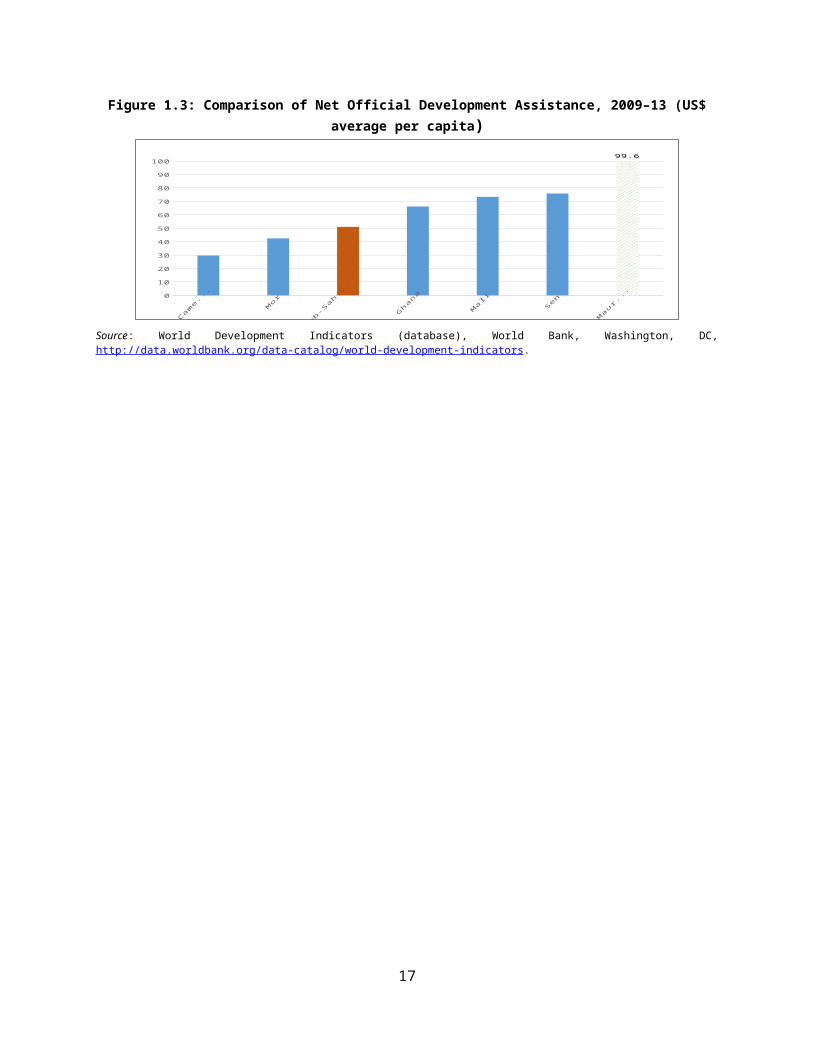
emergency spending after the 2011 drought, which saw soaring growth especially in 2011–13.31 Emergency programs and food security expenditures averaged 8 percent of expenditures over the period from 2011. Health and social affairs witnessed an increase from 4.1 to 5.5 percent of expenditures and Infrastructure from 5.9 to 8.7 percent. High Constitutional Offices such as the Presidency, Prime Minister’s office and Parliament also saw an increase from 3.5 to 6.7 percent of expenditures. Meanwhile, the justice sector and the economic and sector ministries have seen their shares decline. Funding for Decentralization and regional development remained significant with an average of 12 percent of spending, as did Defense with over 11 percent. While erratic changes in nominal spending do not appear to have adversely affected service quality, expanding the use of fiscal rules32 could mitigate volatility and ensure that the evolution of sector budgets clearly and consistently reflects the government’s development priorities.
25. But the largest share of expenditure remains discretionary and difficult to classify. Data on the functional classification of spending33 (Table 1.5) indicate that between 2010 and 2015 about 24.7 percent of total resources were allocated to the social sectors, including education, public health and emergency programs, while a combined 19 percent went to infrastructure and decentralization and regional development, and a relatively high 11 percent to national defense. The single largest category is “other expenses” which makes up a remarkable 27.4 percent of total expenditures. In reality this category supports a number of economic and sector categories and various special accounts and funds. For example, around 4.7 billion MRO (US$ 15.6 million) was provided as budget support to the fisheries sector in the 2011-13 period. Other expenditure items include that of the special assistance and intervention fund for development (Fond d’Assistance et d’Intervention pour le Developpement – FAID) which spent 14.9 billion MRO (US$ 49 million) between 2011 and 2013. The fund was established in 2010 for the purpose of financing basic infrastructures and services for the poor, and it has several financing sources, including donor funding, grants from the state and the private sector, as well as special taxes on telecommunications and petroleum products. The fund provides no information on any of its activities. Finally, around 26.8 billion MRO (US$ 89 million) was spent on capital injections to state owned enterprises through share purchases (19 billion MRO – US$ 63 million) or as loans or advances (7.8 billion MRO – US$ 26 million) in 2011-13. In sum, a quarter of government spending is highly discretionary and is not properly categorized, which greatly complicates budget preparation and expenditure tracking.
Table 1.5: Public Spending by Sector, 2010–13 (percentage of non-oil GDP)
2010 2011 2012 2013 2014 2015 Avg
High constitutional offices 0.9% 0.9% 0.8% 0.9% 1.4% 1.8% 1.1%
Central public sector 0.7% 0.7% 0.6% 0.6% 0.8% 0.8% 0.7%Decentralisation and regional development 3.1% 3.3% 3.5% 3.5% 3.5% 2.3% 3.2%
Defense 3.4% 3.2% 3.0% 2.9% 2.9% 2.7% 3.0%
Economic and sector ministries 1.7% 1.2% 2.0% 1.4% 1.6% 0.9% 1.5%
Education 3.5% 3.8% 3.3% 3.4% 2.6% 2.7% 3.2%
Emergency programs and food security 0.1% 1.4% 2.4% 2.8% 2.2% 2.2% 1.9%
Foreign affairs 0.7% 0.6% 0.5% 0.5% 0.5% 0.5% 0.6%
Health and social affairs 1.1% 1.2% 1.1% 1.4% 1.5% 1.4% 1.3%
31 In 2011, 2012, and 2013 emergency programs and food security expenditures reached 5.3, 8.8 and 10.5 percent of GPD respectively. 32 For example by extending the existing oil fund to the mining sector.33 Data are only available for 2012, 2011 and 2013.
20
Infrastructure 1.6% 1.6% 1.7% 2.0% 2.1% 2.3% 1.9%
Justice and islamic affairs 0.7% 0.6% 0.5% 0.6% 0.6% 0.5% 0.6%
Other public agencies 0.4% 0.2% 0.3% 0.7% 0.3% 0.2% 0.3%
Youth, culture and employment 0.5% 0.2% 0.1% 0.2% 0.5% 0.4% 0.3%
Other expenses 8.0% 7.6% 7.6% 6.1% 7.3% 7.5% 7.3%
Total 26.4% 26.3% 27.4% 26.8% 27.6% 26.2% 26.8%
Sources: BOOST data and World Bank staff calculations.Note: Economic and sector ministries include Fisheries, Mining, and Trade.
26. Domestic financing is the primary source for social sectors, while most of the foreign financing is directed towards infrastructure. Foreign financing reflects the programs and projects financed by multilateral institutions34 and bilateral development partners.35 In Mauritania, these have overwhelmingly focused so far on infrastructure, which accounted for around 74 percent of total foreign financing (Figure 1.15). Education, on the other hand, only received 4 percent of external financing while health and social affairs accounted for a mere 1.4 percent. This reflects the government’s policy of channeling development aid and concessionary financing towards physical capital.
Figure 1.15: Average Actual Expenditure by Source of Financing, 2010–13
Sources: BOOST data and World Bank staff calculation.
27. Spending on social sectors remains below Mauritania’s regional peers. Education is one of the largest expenditure categories in Mauritania, accounting for about 12.5 percent of domestic spending. Nevertheless, spending is low relative to comparable countries and the Sub-Saharan Africa average (Table 1.6). The picture for public spending on healthcare is similar: while the health sector accounts for 6.5 percent of total spending, it remains far from the Sub-Saharan Africa average of 12.5 percent.36 Low investment in human capital is expected to have enduring effects on long-term growth and will not serve Mauritania in improving its human development conditions and achieving the MDG targets.37
34 Such as the World Bank, the Arab Fund, the African Development Bank, the Islamic Development Bank and the International Fund for Agricultural Development (IFAD).35 Notably Kuwait, China, and EU countries.36 Results are similar when comparing share of GDP.37 Currently Mauritania ranks 161 out of 187 countries on the Human Development Index (2014) and has achieved only two of the MDG indicators.
21
0.7%
18.3%
4.0%
1.4%
73.7%
1.9%
External Financing
High Institutional Offices
Defense
External Affairs
Justice
Economic and Sector Ministries
Education and Culture
Health and Social Affairs
Infrastructure
Other public agencies
Unspecified expenses
2.4%
11.8%2.2%
1.3%
9.0%
14.8%
10.0%11.2%
8.5%
28.8%
Domestic Financing
Table 1.6: Average Social Sector Spending in African Comparator Countries, 2009–13
Social Sector Expenditures Mauritania Cameroon Ghana Mali Morocco Senegal SSAEducation (% of government expenditure) 12.5 17.1 24.9 18.5 17.6 20.8 17.3Education (% of GDP) 3.1 3.2 6.3 4.2 5.9 5.6 4.4Health (% of government expenditure) 6.5 8.3 13.3 12.3 6.2 8.2 12.5Health expenditure, public (% of GDP) 1.5 1.6 3.6 2.8 2.1 2.3 2.6
Note: SSA = Sub-Saharan Africa (all developing).Sources: BOOST data; World Development Indicators (database), World Bank, Washington, DC, http://data.worldbank.org/data-catalog/world-development-indicators;
28. Budget execution has been robust across sectors. Expenditure outturn rates vary across sectors, but most fall within a relatively narrow range of between 95 and 99 percent when compared with revised budget38 figures (Figure 1.16). Overall expenditure outturn is -2 percent. The sectors of youth, culture and labour, justice and Islamic affairs, and health and social affairs are exceptions, having consistently exceeded their budgets over the period 2010-15. However, overall budget execution rates are high by the standards of comparable countries. It should be noted that the “unspecified expenses” category is the only one that was significantly underspent. Those unidentified and discretionary funds are hence reallocated during the fiscal year and used for arbitrage between various expenditure items in a way that not only reduces transparency, but also increases spending volatility. The recurrence of such practices could have negative effects on macro stability.
Figure 1.16: Average expenditure outturn in percent (expenditures vs revised budget 2010–15)
Sources: BOOST data
Debt is Rising but is Highly Concessional…
29. The current composition of Mauritania debt is foreign but on concessional basis. Mauritania has no access to international capital markets. Its foreign debt represents 95% of total PPG debt and is largely concessional39. Its domestic debt (5% of total) is in its entirety is short term, namely Treasury
Bonds (TBs) of less than 6 months. Two types of TBs exist: banking TBs held by commercial banks, and Non-banking TBs held by non-bank agents mostly SNIM the public mining company (1 month TBs). This latter type of debt has been rising steadily over the past years and grew from 22% of domestic debt (1.7% of GDP) to 76% (3.2% of GDP). By end 2015, public debt had reached 95.8% GDP, up from 95.6% in 2014.
38 Budget revision generally takes place very late in the year, usually in the third quarter.39 51% comes from official multilateral and 49% percent from bilateral, with those in the Paris Club constituting only 4%.
22
Oth
er exp
ense
s
Educati
on
Tota
l
Defe
nse
Exte
rnal a
ffai
rs
Oth
er public a
gencie
s
Econom
ic a
nd secto
r m
inis
trie
s
infr
astru
cture
and tra
nsp
ort
Emerg
ency p
rogra
ms an
d fo
od secu
rity
Decen
trali
sation a
nd regi
onal d
evelopm
ent
Centr
al public s
ector
Hig
h c
onsti
tutional o
ffices
Healt
h a
nd socia
l affair
s
Justi
ce and is
lam
ic a
ffair
s
Youth
, cult
ure
and e
mplo
ymen
t
-8.0%
-6.0%
-4.0%
-2.0%
0.0%
2.0%
4.0%
6.0%
8.0%
10.0%
12.0%
Total = -2%
30. The high level of public investment has been one of the major causes for the rapid rise in public debt. Public investment has been critical in stimulating growth and reducing poverty, especially through infrastructure in rural areas. However, its level remains a major cause of macro instability. In effect, the ambitious PIP, with a 35.6% component that is externally financed, puts significant pressure on the primary deficit and consequently on debt levels40. The absence of fiscal buffers and the recurrence to further bilateral and less-concessional financing have worsened debt sustainability41.
31. The most recent DSA analysis in 2016 shows a worsening of the outlook compared to 2014. Mauritania faces significant debt vulnerabilities as the global outlook and significant downward revisions in metal prices persist. No major deceleration in debt accumulation is envisaged42 and current policies do not provide a counterforce to the terms of trade deterioration. This situation was also exacerbated by depreciation in the exchange rate vis-à-vis the US$ and the debt became more expensive. In the 2014 DSA, only the baseline PV to debt-to GDP ratio breached its threshold. In the most recent DSA (2016), the breaches for baseline projections are large and sustained over the long run. As a result, Mauritania’s risk of debt distress remains high.
32. Debt policy is also constrained by governance problems related to debt management. The functions of debt management are fragmented across several departments43. Such sub-optimal structure prevents a holistic view of debt issues. The recent merger of the ministries of economy and finance, and the installation of the debt information system DEMFAS 6.0 in August 2015 44 open the door for promising programmatic reforms in the area of debt management. Reforms that have a potential to reduce costs and risks associated with a growing stock of debt.
Going Forward, Even if Commodity Prices Recover, Structural Reform Will be Needed to Avoid Unsustainable Deficits
33. The end of the commodities super-cycle and more subdued economic growth have worsened the outlook for Mauritania. International iron ore and copper prices, Mauritania’s largest commodity exports,45 have already declined by 42 and 20 percent year-on-year respectively in 2015.46 They are projected to continue their decline in 2016-1847 (Table 1.7). The same trend is expected for oil where the average price is set to decline from US$51 per barrel (US$/bbl) in 2015 to 37 US$/bbl in 2016 before gradually recovering by 2018. These prices remain very far from the 100 US$/bbl mark set between 2011 and early 2014. Low international prices coupled with a weaker domestic demand will lead to more subdued economic activity. Growth is therefore not expected to exceed 4.5 percent in the medium term. This is much lower than the government’s own projections.48
34. In this unfavorable external and domestic context, public revenues are expected to take a large hit. Revenues in Mauritania are largely linked to economic growth, and iron and oil prices. A
40 Notwithstanding pressures on current account as the twin deficits are maintained.41 Refer to the DSA analysis of March 2016.42 Except if the government agrees to revise it public investment program and adopt further fiscal consolidation and tax mobilization measures.43 The Department for Resources Mobilization and External Aid (part of the former ministry of economy and development) contracts and manages foreign debt with little cooperation and information sharing with the Department of External Debt (part of the ministry of finance). The latter is tasked with only the recording function. Treasury on the hand fully manages the domestic debt with support from the Central Bank.44 Which is now fully operational.45 Accounting for around 52 percent of total exports combined (average 2009–15).46 Although the decline started earlier, at the end of 2011. Between 2011 and 2015 prices have dropped by 66.7 percent for iron ore and 37.6 percent for copper.47 Projections for international commodity prices are derived from the 2015 World Bank Commodity Price Outlook (database) http://databank.worldbank.org/data/databases/commodity-price-data and its related Pink Sheet. 48 Growth in 2015 is estimated at a mere 3 percent. Government growth projections exceed 5.5 percent.
23

slowdown in growth directly affects income and consumption taxes,49 and also to a certain extent receipts from the fisheries sector. A drop in iron prices reduces royalties and fees from the extractives industry and cuts dividends shared by the SNIM. All these sources are classified under non-tax revenues.50 It also affects taxes on goods and services because of losses incurred on VAT linked with extractive companies’ imports51 and the unique tax on SNIM. The impact of oil prices is similar. However, it is laid out more explicitly in the MTEF. As a result, it is projected that Mauritania could lose up to 3.4 percent of GDP in domestic revenues52 cumulatively by 2018, with the bulk of the hit (3.0 percent of GDP) to come in 2016 (Table 1.7). The decline is primarily linked to losses in non-tax revenues (2 percent of GDP), losses in tax on goods and services (0.6 percent of GDP) and revenues from petroleum (0.1 percent of GDP).53
Table 1.7: Fiscal Outlook, 2016–18
Outlook 2014 2015 2016 2017 2018 Change 15-16
Change 15-18
Macro AssumptionsReal GDP Growth (%) 6.4 3.0 4.2 4.5 3.3 +1.2 +0.3GDP current prices (mld. LCU) 1534 1587 1667 1758 1864Public Debt 92.2 90.1 92.3 95.6 95.8 +2.2 +5.7
Inflation (%) 3.5 0.5 3.7 4.9 5.4 +3.2 +4.9Iron ore index (2000=100) 337 194 146 153 160 -24.7% -17.5%Copper index (2000=100) 378 304 276 286 297 -9.2% -2.3%Oil price ($/bbl) 96 51 37 48 51 -27.5% 0
Fiscal Indicators (% of GDP)Revenue excluding grants 27.5 26.2 23.3 23.3 22.9 -3.0 -3.4
Tax revenues 18.3 16.8 15.9 15.7 15.4 -1.0 -1.4Taxes income and profits 6.4 5.9 5.7 5.6 5.5 -0.1 -0.3Taxes on goods and services 9.0 7.5 7.1 7.0 6.9 -0.4 -0.6Taxes on trade 2.1 2.4 2.4 2.3 2.3 0.0 -0.1Autres recettes fiscales 0.8 1.1 0.7 0.7 0.7 -0.4 -0.4
Non tax revenue 7.6 8.4 6.7 6.6 6.5 -1.7 -1.8Fishing licenses revenues 2.1 1.4 1.4 1.4 1.4 0.0 -0.1Dividends from public enterprises 3.6 1.0 0.7 0.7 0.7 -0.2 -0.2
Petrolium revenue 1.6 1.1 0.7 0.9 0.9 -0.3 -0.1Grants 0.8 1.8 0.8 0.4 0.4 -1.0 -1.4
Total Revenue 28.4 28.0 24.1 23.6 23.2 -3.9 -5.1
Current expenditures 18.6 17.4 16.9 16.9 16.8 -0.5 -0.6Salaries and benefits 7.0 7.8 7.3 7.4 7.5 -0.5 -0.3Goods and services 4.3 3.8 3.7 3.7 3.7 -0.1 -0.2Current transfers 4.7 3.9 3.7 3.4 3.3 -0.2 -0.6Interest on public debt 1.0 1.2 1.1 1.3 1.4 0.0 0.2
External 0.7 0.8 0.9 1.1 1.2 0.1 0.3Internal 0.3 0.3 0.2 0.2 0.2 -0.1 -0.2
Other recurrent expenditures 0.8 0.7 0.6 0.6 0.5 -0.1 -0.2
49 Consumption taxes are labeled in our framework as taxes on goods and services.50These include items such as “recettes cadstrales”, “recettes d’exploitation”, and “redevances” from SOEs.51 Most notably that of the SNIM.52 Excluding grants. These are accumulated losses over the three years 2016, 2017 and 2018.53 Revenues from petroleum are expected to stabilize and slightly increase as international oil prices recuperate. The largest drop was actually observed in 2014 and 2015.
24
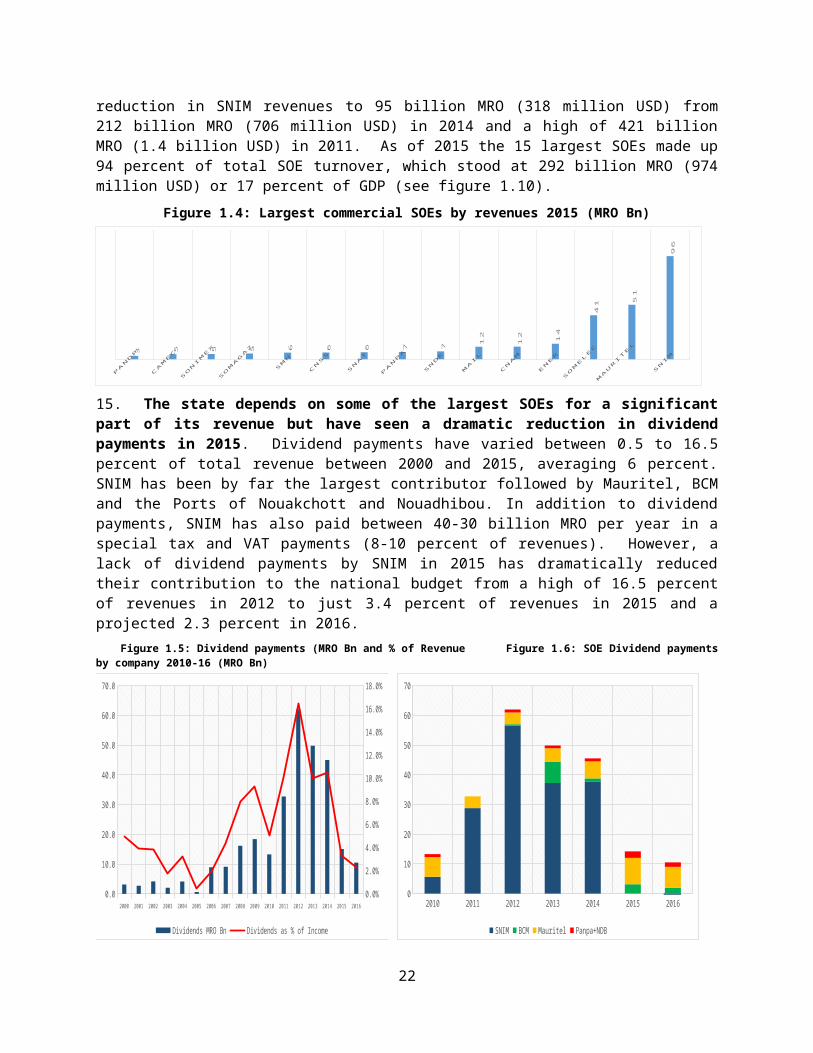
Special accounts 0.8 0.1 0.5 0.5 0.5 0.4 0.4Investments 11.4 14.2 11.0 11.2 11.3 -3.3 -3.0
financed by external resources 3.6 5.0 3.5 5.3 6.2 -1.5 1.2Financed by internal resources 7.8 9.2 7.4 5.9 5.1 -1.8 -4.1
Common reserves and loans 0.8 0.8 0.8 0.8 0.8 -0.1 -0.1Total Expenditure 30.8 32.5 28.7 28.9 28.9 -3.8 -3.6
Primary balance excl grants (deficit -) -1.4 -4.2 -4.8 -4.8 -5.2 -0.5 -1.0Primary balance incl grants (deficit -) -0.6 -2.5 -4.0 -4.5 -4.8 -1.5 -2.4Overall balance excl grants (deficit -) -2.5 -5.4 -5.9 -6.1 -6.6 -0.5 -1.1Overall balance incl grants (deficit -) -1.6 -3.6 -5.1 -5.7 -6.2 -1.5 -2.6
Primary Deficit of Stabilization 0.2 -2.0 -3.3 -3.7 -4.1 -1.2 -2.1
Sources: National Statistics Office (ONS), Treasury and World Bank staff calculations.
35. Without reforms to widen the tax base and improve revenue mobilization, such losses will lead to unsustainable deficits. If the government wants to maintain its current level of public investment (over 11 percent of GDP)—even assuming it undertakes some measures of fiscal consolidation, such as stabilizing the wage bill and slightly reining in recurrent spending—the overall budget deficit will exceed 5 percent of GDP (Table 1.7).54 Such a deficit level is unsustainable and will lead to a sharp rise in public debt ratios. Indeed, for Mauritania to stabilize the current debt-to-GDP ratio we calculate that it will have to record a primary deficit of no more than 3.3 percent of GDP in 2016. Currently, the country is a long way from this target. The situation will worsen further if foreign grants do not materialize, as the current outlook suggests.55
36. While the fiscal outcome could change if the external environment improves, simulations show that structural reforms remain necessary to ensure fiscal sustainability. We conducted a sensitivity analysis to estimate the fiscal impact of changes in both international iron ore and oil prices. 56 Results indicate that, keeping other parameters constant, a 10 percent annual increase in international iron ore prices over the outlook period (2016–18)57 could bring in up to 1.5 percent of GDP in accumulated revenue savings by 2018. This reduces the expected primary deficit to 4.3 percent of GDP. However, that figure remains above the debt stabilization threshold of 4.1 percent of GDP—the simulations suggest that the government would need a yearly increase in iron ore prices of around 13 percent to achieve that target. The story for oil prices is similar: a 10 percent yearly increase would lead to an accumulated gain of only 0.3 percent of GDP in budgetary revenues. These findings indicate that structural reforms are indispensable in order to reduce dependence on commodity prices and the budget volatility that price fluctuations bring. These reforms include fiscal consolidation policies that rein in recurrent spending, especially those related to the wage bill and to transfers, and reforms to expand the tax base and boost revenue mobilization.
54 In 2018, the budget deficit is projected to reach 6.2 percent if no reform measures have been taken (Table 1.7).55 The decline in foreign grants is estimated at 0.8 percent of GDP in 2016 and 0.4 percent thereafter. The nominal figures for 2016 are taken from the 2016 Budget Law.56 The analysis is based primarily on elasticities between changes in each commodity price and the tax or non-tax revenue item it affects. This relationship is weighted so as to account for the effect of growth. For example: 80 percent of dividends are linked to extractives, and hence iron ore prices, while the remaining 20 percent is linked to growth. Also 15 percent of consumption taxes are linked directly to iron ore while the rest is determined by oil prices, growth and inflation. Weights are based on historical average. 57 A 5 percent increase on top of the current baseline.
25

The Government Needs to Strengthen its Public Financial Management Systems in Order to Improve the Impact of Public Spending
37. The Government of Mauritania has undertaken a number of reforms of their Public Financial Management systems in recent years and some results have been achieved; budget execution has been improved through a reduction in the time it takes to execute payment orders, aided by an electronic expenditure chain system (RACHAD); tax revenues increased by 160% in 2013 from 2011 resulting from a fiscal census and improved tax collection measures; a new procurement law and institutions has increased controls; a staffing census helped eliminate undocumented salary payments; an electronic land registry for Nouakchott was set up and land titles were scanned and verified, with a number of double and false titles detected and eliminated. Finally, various electronic financial management (GFMIS) systems are now largely up and running, with most ministries and modules in place.
38. However, many of the reforms have not been fully implemented with the result that real changes in practices and outcomes are limited. There has been a gradual improvement in the Country Policy and Institutional Assessment (CPIA) rating over the past three years, and Mauritania now scores above the average for both Sub-Saharan Africa and IDA borrowers. But the 2014 Public Expenditure and Financial Accountability (PEFA) analysis shows very little progress on PFM reforms since 2008 and even a deterioration in some areas. Notably, the budget suffers from low credibility and few links with stated policy policies. The scores on external control and audits was also weaker in 2014. The PEFA program scores are summarized in Figure 1.5 below and a detailed comparison is included in Annex A1.
39. In Mauritania, budget preparation is largely a bureaucratic exercise, which essentially just repeats prior years’ allocations without real consideration of policies and strategic government programs, and without using many of the tools at the government’s disposal such as the MTEF, the mining sector fiscal model, or sectoral strategies for projections and planning. Budget preparation is also not guided by a clear and pre-determined budget formulation calendar. Instead, the budgeting process begins late in the year (around August) and the approval of the budget by the legislature regularly happens after the start of the fiscal year for which the budget has been approved. The triannual rolling Public Investment Program (PIP) is elaborated by MAED and is used as the basis for the annual investment budget (BCI), but the articulation between planned investments and related operational costs is poor. The budget memos (circulaires budgétaires) outline the general priorities for the budget and makes reference to strategic documents, but do not include budgetary ceilings for functional areas or administrative units. The 2014 PEFA scores show low budget credibility and a weak link between policies and the budget as measured by PEFA indicators. The total PEFA score on PI-1 (aggregate expenditure outturn compared to original approved budget) remained the same between the 2008 and 2014 assessment (C), while the PI-2 (composition of expenditure outturn compared to the original approved budget) and PI-3 (aggregate revenue outturn) indicators fell from B to D+ and from A to D respectively in the 2014 evaluation compared to 2008. The indicators related to policy based budgeting PI-11 and PI-12 dropped from A to D+ and B to C+ respectively. Only indicator PI-4 increased from B+ to A as a result of reduced payment arrears. A new public finance framework law (Loi Organique relative aux Lois de Finances) under elaboration is expected to introduce program-based budgeting and a detailed process and calendar for budget preparation. However, past experience has shown that introducing policy based budgeting in a low capacity environment can pose its own challenges and will not necessarily improve budget practices.
26
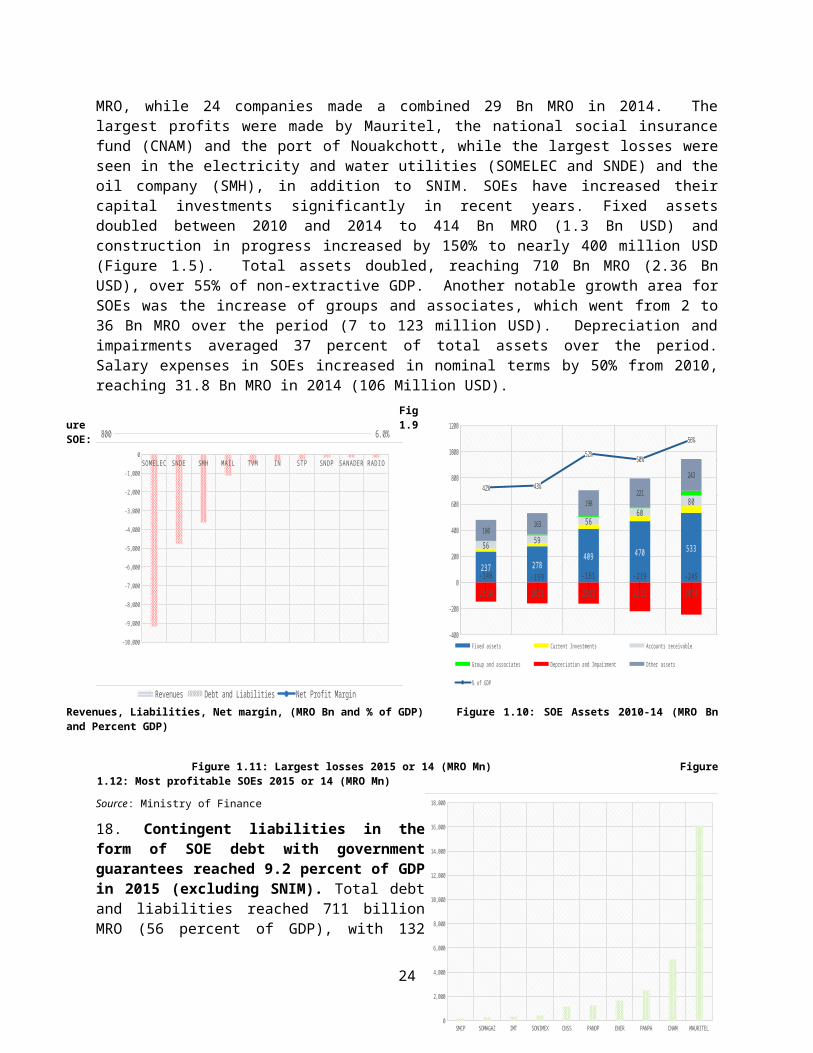
Figure 1.17: Evolution of average PEFA scores by category between 2008 and 2014
A. PFM-OUT-TURNS: Credibility of the budget
B. KEY CROSS-CUTTING ISSUES: Comprehensiveness and Transparency
C. BUDGET CYCLE
C(i) Policy-Based Budgeting
C(ii) Predictability and Control in Budget Execution
C(iii) Accounting, Recording and Reporting
C(iv) External Scrutiny and Audit
D. DONOR PRACTICES
0
2
4
2008 2014
Sources: PEFA Reports 2008, 2014.Note: Ratings have been converted to numerical values in the following manner to permit the calculation of averages: A=4, B=3, C=2, D-1.
40. Budget execution is characterized by weak internal and external controls and irregular oversight and monitoring of public spending. One reason for the downward trend on the PI-2 indicator, from B in 2008 to D+ in 2014 is the weak enforcement of internal and external controls and poor monitoring and oversight by senior managers. There are significant differences between budgeted and actual expenditures. Almost one-third of expenditures are entirely opaque, with little information available on which sectors receive the funds or what kind of expenditures they finance. The PEFA notes a slight improvement on indicator PI-20 related to internal expenditure controls (D+ to C+), but this progress is due to the development of a clearer legal and institutional framework for controls, while the implementation is still entirely missing.
41. The various external and internal oversight institutions of the state are understaffed and poorly financed, and a lack of coordination between them prevents effective controls . The low performance of the internal auditor, general state inspector and the supreme audit institution are reflected in PEFA scores PI-18, 21, 25, 26, 27 which are all rated D. Internal audit can provide important corrective action during budget execution, and should focus on systemic institutional and performance issues in addition to pure compliance aspects. This is the intention and mandate of the General Financial Inspectorate (Inspection Générale des Finances; IGF) but it is currently unable to fulfill this role. There is a general state inspector (Inspection Générale d’Etat; IGE) reporting to the Prime Minister, as well as Commissaires aux Comptes, which are internal controllers based in each spending/budget unit and reporting to the Ministry of Economy and Finance. The supreme audit institution ( Cour des Comptes) carries out about 20 audits per year. Its independence is questionable and it is hampered by low capacity and limited resources and is experiencing significant delays, having recently finalized the 2005–06 audits and is currently working on the 2007 report of the state budget. The last published report was the 2006 Annual Report.
27
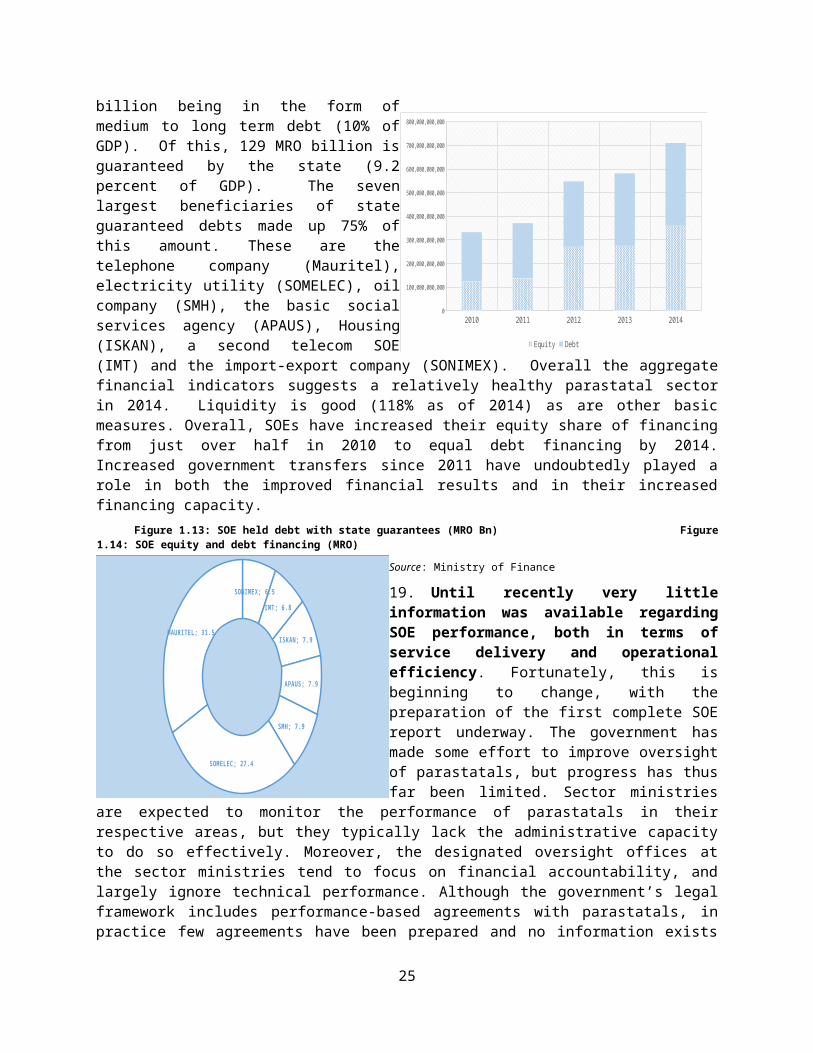
28
Box 1.2: Key findings of Mauritania’s Public Expenditure and Financial Accountability Assessment (2014)
Budget credibility. Budget credibility was affected adversely by non-compliance of budgetary allocations to line ministries, non-compliance with budget ceilings and weaknesses in revenue forecasting. Between 2011 and 2012, a significant difference was observed between the originally approved budget and the actual outturns (RACHAD), though this deviation improved in 2013. Other improvements were observed in the elimination of old arrears and the non-accumulation of new domestic arrears which contributes to budget credibility.
Comprehensiveness and transparency. The budget is fairly comprehensive, using a classification based on international standards. Improvements are needed with respect to the coverage of autonomous public institutions and local authorities. Public access to some key fiscal documents is hampered or not provided in a timely manner, which impacts Parliament’s and civil society’s accountability work.
Policy-based budgeting. Some progress has been made in multi-year planning owing to the preparation of macroeconomic and budgetary frameworks as well as some sector expenditure plans but these tools need to be further improved by reinforcing statistical capacities and forecasting models. Overall, policy-based budgeting practice remains largely deficient. Links between the MTEF, sector plans/strategies, and the annual budget are weak as plans do not respect any fiscal space and information on donor aid is limited, affecting the strategic allocation of resources. Mauritania’s dual budget process and lack of a budget calendar further undermines the effectiveness of the budget-preparation process.
Predictability and control in budget execution. The fiscal and custom administrations’ legal framework is generally comprehensive and progress with taxpayer registration has improved revenue collection. However, Mauritania needs to further enhance the registration system and capacities and install interconnected software. Weaknesses in cash planning for expenditure commitment is one of the reasons for the frequent budget adjustments during the fiscal year. The government’s management of debt by three agencies (MAED, MEF, and the BCM) is not in accordance with international practice. The installation of a debt management system connected into the budget execution cycle and the treasury would substantially improve the efficiency of debt management. The performance of the payroll system is generally satisfactory but cumbersome administrative procedures lead to long delays in processing changes in the personnel database. Expenditure control was strengthened through the establishment of the information system RACHAD and the reduction of informal expenditure procedures but it is affected by the lack of a central financial control service and its respective tools. The performance of the internal and external audit function is weak due to insufficient staffing, insufficient information exchange between both audit services, and the lack of a mechanism for ensuring follow-up of its recommendations.
Accounting, recording, and reporting. Considerable improvements have been made in budget reporting and accounting by implementing the computerized information systems (RACHAD and Beite El Male; see Annex A2). Treasury records are regularly reconciled with bank account data. However, suspense accounts and advances are not subject to systematic reconciliation and clearance during and at the end of the fiscal year. Much also remains to be done to improve the frequency of in-year budget reports, public access to execution reports, the accessibility of front-line delivery units to information about resources allocated to them, tracking the effective use of sub-national resources, and delays in preparing the government’s consolidated financial statements.
External scrutiny and audit. The Supreme Audit Institution is coping with capacity challenges which have led to a backlog of audit work and is responsible for delays in issuing the external audit reports. The legislative scrutiny is undermined by the lack of time to review the budget and insufficient budget documentation that does not cover all needed information. The effectiveness of parliamentary scrutiny of the final audits is also diminished by the backlog in the examination of the financial statements and its insufficient capacity to adhere to procedures.
Donor practices. External funding consists mainly of project-related aid. Disbursement procedures are specific to each donor and disbursement forecasts of new projects are not all available at the time of budget preparation. Documentation attached to the budget law only takes into account projects for which funding is acquired, reducing the predictability of planned aid.
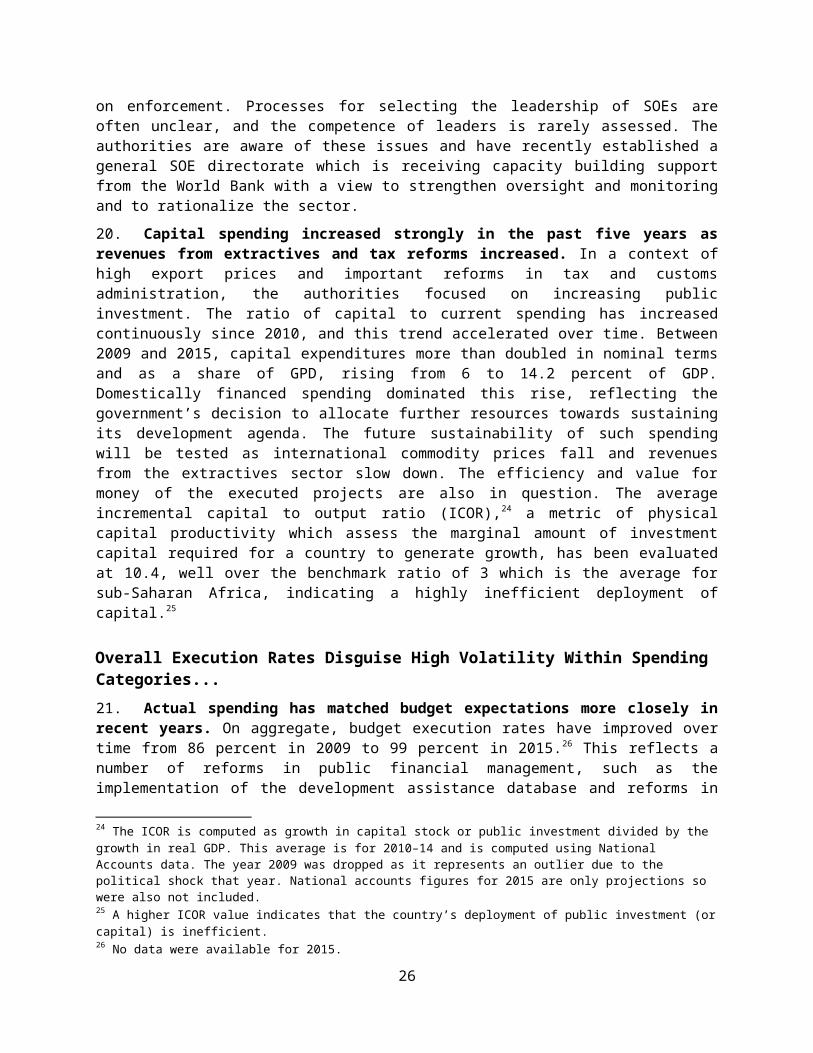
Key Areas for Reform
42. Revenues and expenditure trends have revealed major weaknesses in Mauritania’s fiscal policy. These include volatile domestic revenues, dependence on mineral- and oil-sector receipts, high non-transparent discretionary spending, inelastic recurrent spending items such as the wage bill and transfers, and weak investment in human capital. These have led to a very volatile fiscal position which have affected the macro-stability of the country. With widened budget deficits and increasing debt ratios, Mauritania lacks the fiscal buffers it needs to weather both external and domestic shocks to the economy. As a result, the outlook for Mauritania looks unfavorable in the post super-cycle era, “the new normal”.
43. Mauritania will need to undertake a number of key structural reforms if it is to improve its fiscal outlook and achieve its development objectives. In an environment of low commodity prices, structural reforms become imperative to widen the tax base and increase revenue mobilization on one side, and boost economic growth through diversifying the economy and investing in human capital in the other. These measures should build some fiscal space to enable the country to maintain in part its ambitious public investment program and shield it from external shocks and fluctuating business cycles. This would also entail reviewing budget governance structures, particularly public investment management, to ensure the highest economic and social returns on selected projects.
44. In this respect, we propose a combination of quick wins and medium-term fiscal reforms. This chapter has examined a number of constraints limiting the effectiveness of fiscal policy in Mauritania. Table 1.8 presents a set of non-comprehensive recommendations for strengthening the institutions and processes that largely determine the impact of public spending on the country’s development goals. A more comprehensive set of reforms are discussed in the remainder chapters of the report.
Table 1.8: RecommendationsIssue Recommendation
Enhancing transparency and improving data quality will foster greater accountability in the use of public resources.
1) Audit the national oil fund.2) Conduct a thorough review of public sector staff, wage and benefit policies, and career structures.3) Ensure that BOOST is updated at least twice a year to reflect the original and revised budgets.4) Strengthen financial oversight of SOEs by enforcing quarterly financial reporting to the SOE unit and the preparation of a complete annual report on the parastatal sector.
Further strengthening domestic revenue mobilization and widening the tax base will ensure adequate funding for public investment without destabilizing debt dynamics.
1) In collaboration with development partners, review the current tax expenditure and fiscal incentive regime.2) Develop a reform program to boost public revenues and create new sources of revenues that are less volatile and less dependent on the extractives sector.
Clearly prioritizing public expenditures, improving monitoring and evaluation mechanisms, and establishing results-based management approaches would enhance the overall efficiency of public investment.
1) Develop a national MTEF based on BOOST and other data sources, ensuring that its goals are aligned with the public investment plan and that its spending projections are consistent with macroeconomic stability. The MTEF should also be produced in a timely fashion, in order to enable it to inform the annual Budget Law. 2) Develop sectoral MTEFs, to strengthen the spending projections of the national global MTEF prepared by the MAED.3) Formulate a strategy to shift from the current system of resource-based budgeting to a performance-based budget system with the objective of boosting human capital-related programs and ensuring value for money in selected investment projects.
29

Chapter 2: Increasing the Economic and Social Impact of Public Investments
In Mauritania, Public Investment Spending Analysis is Complicated by Fragmented and Incomplete Data
45. The analysis in this chapter is complicated by incomplete and fragmented data on public investments. The existence of a multitude of investment planning/budgeting and monitoring instruments prepared and managed by different institutions, for different purposes and without any coordination, has resulted in a lack of reliable data and the existence of several partial datasets. Despite efforts to improve the monitoring of donor-funded projects through the installation of a new database, the situation remains very similar to the previous PER which was finalized in 2011.
46. The authorities are unable to produce a timely, complete and reliable overview of the implementation of their entire investment budget. There is no central instrument to monitor how investment projects perform against planned budget envelopes and execution calendars. This clearly complicates any analysis on investment budget execution, and prevents any meaningful monitoring from the center. Individual investment project units have this kind of information, but central authorities also need to have access to it for budget planning and monitoring purposes. The inability of existing systems to capture this information in a timely manner can lead to unrealistic budgeting, causing delays due to under-budgeting for some projects or locking up scarce capital through over-budgeting for others.
47. Mauritania’s investment program is outlined and reported on through four different instruments:
The Public Investment Program (PIP), a three year rolling investment program, is a strategic investment document which includes projects for which funding is secured as well as projects where funding has not yet been obtained but where government is seeking funding. It is supposed to be updated on an annual basis.
The Consolidated Investment Budget (BCI), which is annexed to the budget law every year, and includes all domestic funding, projects funded by external partners, as well as investments through state-owned enterprises.
The annual national budget law, which includes only the investments financed by domestic funding, including the share of foreign finance investment projects which is covered by counterpart funding (from 15 percent of total project value and up).
The Table of State Financial Operations (Tableau des Opérations Financières de l’État: TOFE), which is the monthly report on the execution of the national budget. It provides information on internal or external funds administered by the central government through the national electronic payment system (Réseau Automatisé de la Chaîne des Dépenses: RACHAD).
48. Two additional instruments have been introduced since the last PER:
The BOOST database is a World Bank spreadsheet-based budget analysis tool which provides basic information on budget trends, including amounts for the approved budget, revised budget, and expenditures broken down by Administrative Unit, Economic Classification and Source of Funding. Its purpose is to facilitate budget analysis. It was introduced in Mauritania in 2013. It draws on several national electronic public financial management (PFM) systems (Rachad, Beit El Mal, DAD) and so is constrained by the availability of data in these systems.
30
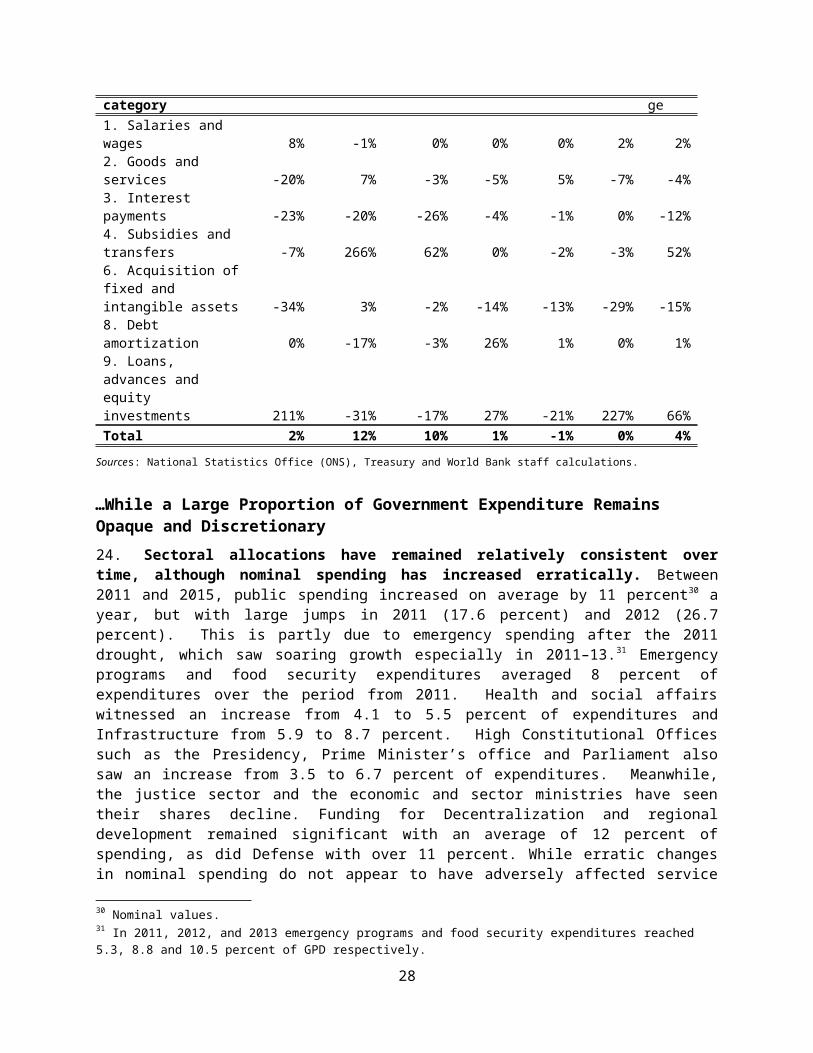
The Development Assistance Database (DAD) introduced in 2013 is a web-based platform and database which provides information on externally financed projects including their stage of implementation, and sectoral and geographic concentration. It uses off-the-shelf commercial software and its database is managed by a US-based company. It is informative to the public, but is still of limited use to the authorities for monitoring purposes. The authorities are planning to add another module for public investment monitoring which should allow for closer monitoring of targets and broader analysis across the donor-financed portfolio.
The Investment Budget has Increased Significantly in Recent Years.
49. Significant windfalls from high mineral prices have allowed Mauritania to increase its public investment budget significantly between 2010 and 2015. In nominal terms, the investment budget increased from MRO 173 billion (US$ 576 million) in 2010 to a high of MRO 255 billion (US$ 850 million) in 2015, an increase of 47% between 2010 and 2014. Actual spending went from 65 Bn MRO (US$ 216 million) in 2010 (5.4 percent of GDP) to 228 Bn MRO (US$ 760 million) in 2015 (14 percent of GDP) (see Figure 2.1).
Figure 2.1: Investment Budget, 2004–14 (MRO billion and percentage of GDP)
2004 2005 2006 2007 2008 2009 2010 2011 2012 2013 2014 2015 -
50.00
100.00
150.00
200.00
250.00
300.00
0.0%
2.0%
4.0%
6.0%
8.0%
10.0%
12.0%
14.0%
16.0%
Executed (MRO Bn) Budgeted (MRO Bn) Investment Spending % of GDP
Source: Authors’ calculations based on World Bank and IMF data.
50. The proportion of investment to recurrent expenditures in the national budget has also changed significantly, increasing from 36 percent to 53 percent in 2014. Importantly, the volume of domestic funding for investment has more than doubled from MRO 54 billion (US$ 180 million) in 2010 to MRO 120 billion in 2014 (US$ 400 million) (Figure 2.2), and is now at par with investments from external resources. However, not all of this growing amount of budgeted investment is converted into additional public investment – i.e. spending that contributes directly to general government gross fixed capital formation. Many development budget expenditures are essentially recurrent (i.e. consumable) in nature but are included in the consolidated investment budget because they are associated with specific
31
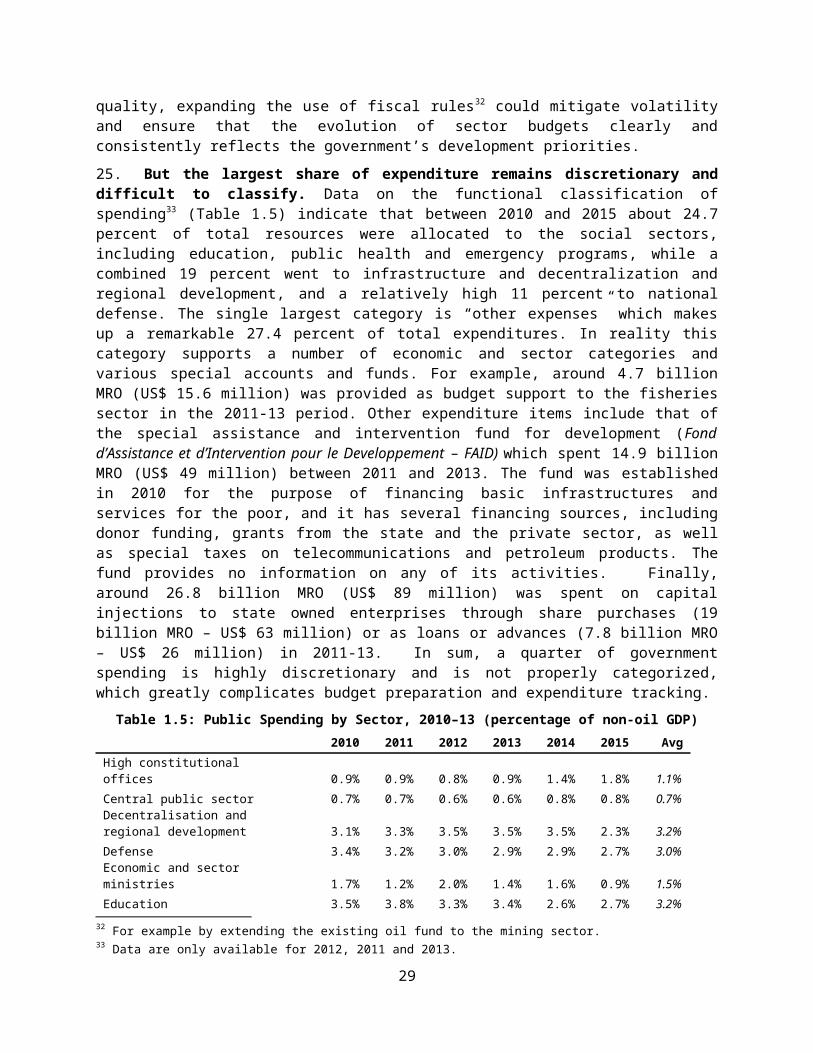
projects – for example all donor projects are categorized under the development budget, irrespective of whether they are financing recurrent or capital expenditures. Total public investment (government gross fixed capital formation) is therefore likely to be considerably lower than total investment spending in a given year.58
Figure 2.2: Investment—Share of Total Budget, 2010–14 (percent)
2010
2011
2012
2013
2014
0 10 20 30 40 50 60
36
29
32
49
53
Figure 2.3: Investment Budget by Source of Financing, 2010–14 (MRO billion)
2010 2011 2012 2013 20140
50000
100000
150000
200000
250000
300000
Domestic Resources Grant Loans w grant element Loans
Source: BOOST-Mauritanie.: http://wbi.worldbank.org/boost/country/mauritania
51. The execution rate of the investment budget has improved considerably since the last PER. Table 2.1 shows the consolidated investment budget by the nature of funding and the rate of implementation (all sources of funding between 2010 and 2014). The investment budget execution rate increased from just under 40 percent in 2010 to 76 percent in 2014. This is mainly due to the high execution rate of the share of the domestically financed investment budget, which averages almost 100 percent, while the execution rate of externally financed projects over the period 2010–14 was around 40 percent59. This large difference in execution rates merits closer examination but unfortunately no analysis has been done by the authorities to look at the reasons behind these. The authorities cite the complexities in managing multiple donor requirements for project management and limited use of country systems, combined with a slow response time on the part of partners. On the other hand, the greater flexibility seen in domestic financed projects could also imply less rigor in project management and expenditure controls, which could be a reason for concern.
Table 2.1: Consolidated Investment Budget—Programmed and Executed by Source of Funding, 2010–14 (Percent of GDP and Execution Rate)
2010 2011 2012 2013 2014 2015Budget external financing 9.1% 7.9% 8.3% 8.3% 8.5% 6.7%
Executed external financing 1.1% 2.1% 3.5% 3.2% 3.8% 4.8%
58 For domestically funded investment expenditures, the sub-category of “fixed investments” was on average 62 percent of investment budget spending, followed by debt amortization at 17 percent, transfers and subsidies at 16 percent, goods and services at 5.3 percent and salaries at under one percent. For externally funded expenditures, approximately 70 percent is spent on infrastructure and construction, with the remainder going to capacity building. 59 The execution rate of externally financed investments is estimated using data from the consolidated investment budget (for the original budget), TOFE and BOOST (for execution). Given significant gaps in the data, the estimates may be subject to errors.
32
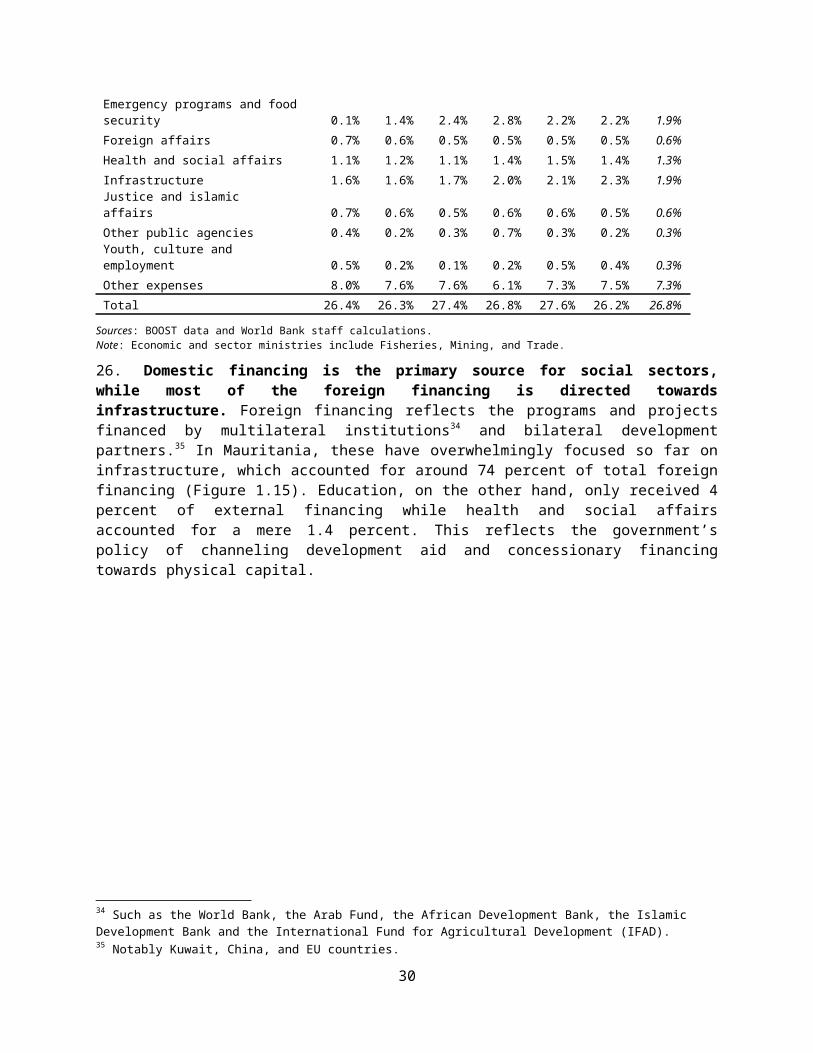
Execution rate external financing 12.2 26.8 42.3 38.5 44.5 71.8
Budget domestic financing 5.3% 3.8% 4.9% 7.2% 7.8% 7.5%
Executed domestic financing 4.3% 3.8% 6.0% 7.9% 8.7% 8.7%
Execution rate domestic financing 81% 99% 123% 110% 111% 116%
Total investment budget all sources 14.4% 11.7% 13.2% 15.5% 16.3% 15.7%
Total expenditures 5.4% 5.9% 9.5% 11.2% 12.5% 13.5%
Total execution rate 37% 50% 72% 72% 76% 86%
Sources: Ministry of Economy and Finance, Ministry of Economic Affairs and Economic Development, staff calculations based on TOFE.
Figure 2.4: Sectoral Distribution of the Consolidated Investment Budget, 2010–14 (MRO billion)
Source: Ministry of Economy and Finance.
While Large Infrastructure Projects Receive the Bulk of Investment, Other Areas Have Seen Significant Increases
52.The
budget category of Territorial Development and Land Planning, which includes major infrastructure projects (roads, ports, and airports), continues to receive the bulk of state resources at more than 50 percent of the total investment budget for the period 2010–14 and up from 44.1 percent over the period 2004–09. Roads received half of these funds, followed by Ports, Urban Water, and Urban Infrastructure. Some large investment projects such as the free trade zone in Nouadhibou or the new national airport are not included in this envelope since these are financed through PPPs with minimal public funding. Very little information is available on the terms of these PPP arrangements and total the costs and benefits to the state and the private sector companies involved. The Regional Development Fund transfers resources to local governments for locally determined investments to sustain the decentralization process and to correct regional imbalances and has benefited from substantial budgetary allocations. Its funding makes up nearly 30 percent of Housing, Urban, and Transport allocations, at MRO 3.5 billion for 2014 (US$ 11.6 million). In this context, 2014 saw the effective start of the activities of the National Integrated Support Program for Decentralization, Local Development and
33
2010 2011 2012 2013 2014 20150.00
50.00
100.00
150.00
200.00
250.00
300.00
12.93 12.29 13.06 25.83 29.46 34.3613.11 11.44 8.57
33.5343.26 42.42
112.4093.50 109.22
96.01102.17 101.56
8.2114.25
20.00
25.9422.88 26.02
7.066.54
8.92
12.3311.85 10.36
15.0223.09
19.60
36.7735.44 35.41
5.32 7.2810.30
5.555.00 4.85
1 Rural Development 2 Industrial Development 3 Territorial Development4 Human Resources 5 Institutional Development 6 Multi-Sector Projects7 SNIM
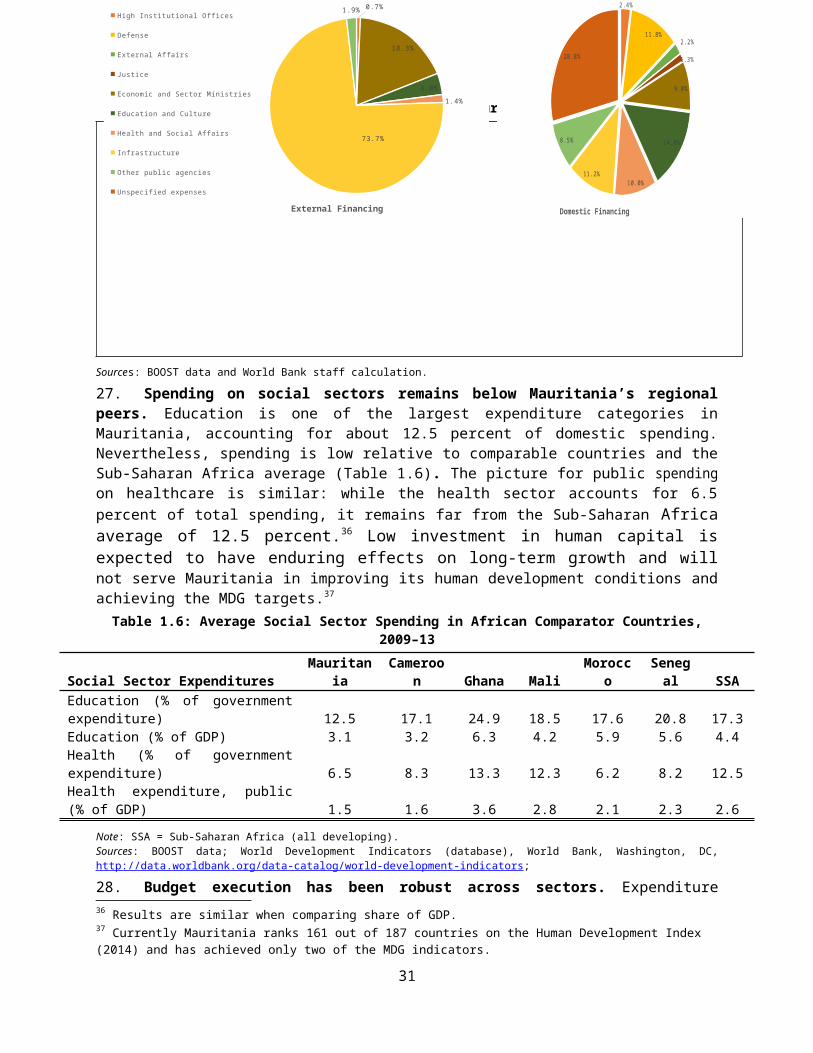
Employment which was allocated MRO 30 billion (US$ 99 million) over the period 2014–19. The program focuses on financing basic urban infrastructure but it has been very slow to start up.
53. The industrial development sector almost quadrupled its budget from MRO 13 billion (US$ 43 million) in 2010 to MRO 43 billion (US$ 143 million) in 2014. It absorbed MRO 109 billion (US$ 363 million) during the period 2010–14, which is almost 11 percent of the total capital budget. These funds have focused on sectors of strategic importance for Mauritania (such as fishing, industry, tourism, and energy), with most of the funding devoted to the energy sector (nearly MRO 90 billion – US$ 300 million), resulting in a 250 percent increase in energy production capacity, and rates of access to energy rising from 21 to 32 percent.
54. The rural development sector has seen a significant increase in resources in 2013 and 2014. This is partly explained by the adoption of the Integrated Rural Development Program (IRDP) which provides the integrated framework for all interventions in the sector. Since 2012 the government has also invested in the irrigation development programs in the river valley in Trarza. Since 2004, allocations to the sector had moderately fluctuated around MRO 12-13 billion (US$ 40-43 million), but in 2013 it received MRO 25.8 billion (US$ 86 million) and in 2014 MRO 29.4 billion (US$ 98 million), which was 8 percent of the investment budget. The objective is to increase agricultural productivity, strengthen the strategic role of livestock in the economy, improve the supply of drinking water in rural areas, and preserve the environment.
55. The government continues to underfund the human development sector (health, education, justice and culture) in relation to its needs and importance for poverty reduction and development . Overall, the human development category allocation went from 4.2 percent of the investment budget in 2010 to 11 percent in 2013 and 9 percent in 2014, but this increase was largely driven by employment and support for university-level education which averaged nearly 3 percent and 2 percent of the BCI respectively. Pre-school and primary education, for example, received only 0.01 percent of budgeted resources in 2014, the lowest of any sub-category and down from 0.25 percent in 2010. Health and social affairs fared a bit better, increasing its envelope from 1.2 percent to 2.6 percent over the period.
56. The Multi-sectoral Projects category received approximately 14 percent of the total investment budget allocation in 2014, and double what it received in 2010. This category includes 33 projects that span multiple sectors. The largest single budget line under this category in the 2015 investment budget is the Anti-Slavery Program (MRO 7.3 billion – US$ 24 million), followed by General Reserves (MRO 6.2 billion – US$ 20.6 million), Emergency Operation (MRO 5 billion – US$ 16.6 million), and the Rural Oasis Development Program (MRO 4.8 billion – US$ 16 million). The Institutional Development category is intended primarily to strengthen the technical, institutional and organizational aspects of public administration, and support to reforms in economic governance and the improving the business climate. It finances general training and capacity building support to public-sector institutions and NGOs, including the development of sector strategies, technical support, and studies.
57. On-lending and grants to the national mining company SNIM averaged 3.4 percent of the investment budget for the period 2010–14. There is little information available on the use of these resources and there has recently been some debate and controversy around the lack of transparency in SNIM investments. Despite continued access to cheap credit for investment, neither production nor financial results have improved during the period. At the same time the SNIM Foundation has co-funded some large-scale and visible investments such as the second Nouadhibou Regional Hospital (MRO 3 billion – US$ 10 million), the Institute for Hepatitis (MRO 1.6 billion – US$ 5.1 million), and a gateway to the east (MRO 400 million – US$ 1.3 million).
34
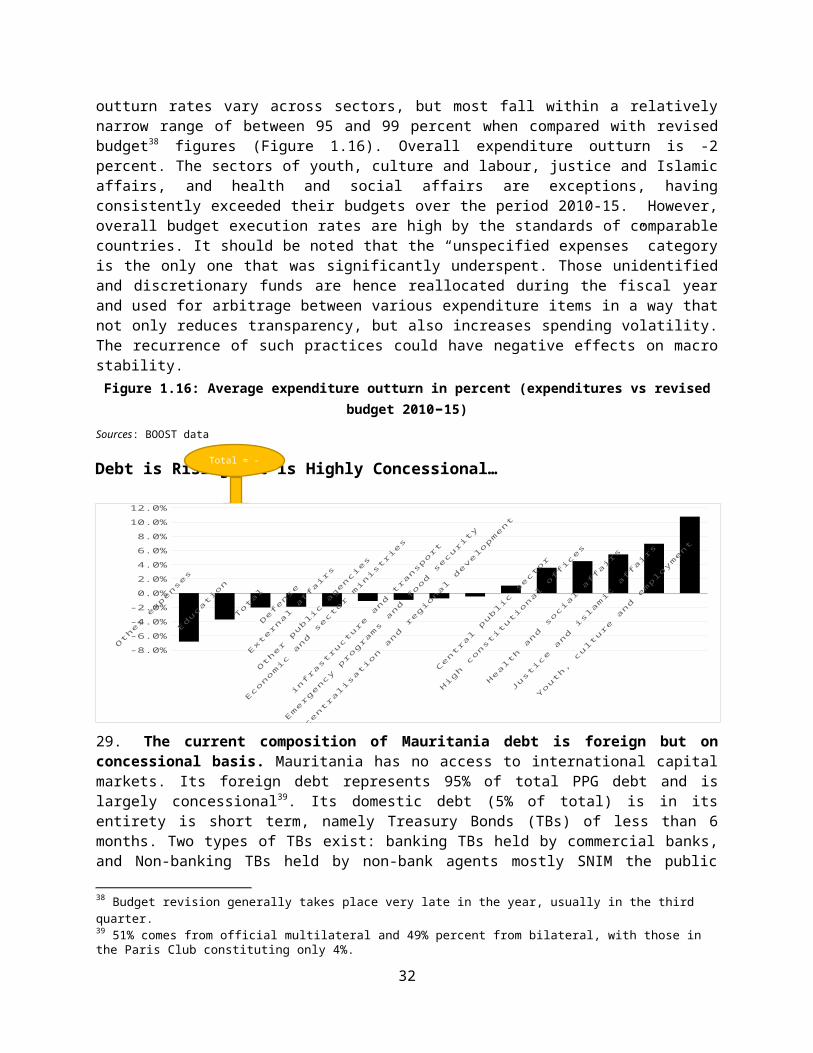
Table 2.2: Consolidated Investment Budget, 2010–14 (Percent of GDP)
2010 2011 2012 2013 2014 2015 Avg
1 Rural Development 1.08% 0.85% 0.91% 1.70% 1.92% 2.12% 1.43%1.1
Agriculture0.46% 0.20% 0.38% 0.94% 1.01% 0.90% 0.65%
1.2
Natural Resources0.07% 0.15% 0.15% 0.07% 0.08% 0.06% 0.10%
1.3
Rural water0.19% 0.33% 0.35% 0.47% 0.69% 0.90% 0.49%
1.4
Livestock0.00% 0.00% 0.00% 0.16% 0.09% 0.15% 0.07%
1.5
Environment0.35% 0.17% 0.04% 0.05% 0.04% 0.10% 0.13%
1.6
Research and training0.01% 0.00% 0.00% 0.00% 0.02% 0.00% 0.00%
2 Industrial Development 1.10% 0.79% 0.60% 2.20% 2.82% 2.61% 1.69%2.1
Fisheries0.79% 0.02% 0.04% 0.20% 0.27% 0.20% 0.25%
2.2
Mining (excluding SNIM)0.05% 0.03% 0.03% 0.01% 0.02% 0.01% 0.03%
2.3
Industry0.00% 0.00% 0.00% 0.00% 0.00% 0.12% 0.02%
2.4
Commerce0.01% 0.00% 0.01% 0.01% 0.01% 0.01% 0.01%
2.5
Energy 0.24% 0.73% 0.51% 1.98% 2.52% 2.26% 1.38%
2.6
Arts/craft0.00% 0.00% 0.00% 0.00% 0.00% 0.00% 0.00%
2.7
Tourism0.00% 0.00% 0.00% 0.00% 0.00% 0.00% 0.00%
3 Territorial Development 9.39% 6.49% 7.60% 6.31% 6.66% 6.25% 7.12%3.1
Housing,Urban,Transport1.44% 1.14% 1.10% 0.95% 0.74% 0.76% 1.02%
3.2
Urban Water2.17% 0.34% 0.64% 1.50% 0.92% 1.36% 1.16%
3.3
Roads3.15% 2.58% 3.90% 3.51% 4.43% 3.39% 3.49%
3.4
Ports2.41% 2.40% 1.79% 0.00% 0.10% 0.10% 1.13%
3.5
Airports0.14% 0.00% 0.06% 0.15% 0.12% 0.39% 0.15%
3.6
Information Systems0.07% 0.04% 0.03% 0.10% 0.06% 0.05% 0.06%
3.7
Telecommunications0.00% 0.00% 0.06% 0.09% 0.28% 0.18% 0.10%
4 Human Resources 0.69% 0.99% 1.39% 1.71% 1.49% 1.60% 1.31%
4. Culture 0.00% 0.01% 0.01% 0.01% 0.04% 0.04% 0.02%
35
14.2
Justice 0.14% 0.03% 0.01% 0.01% 0.03% 0.01% 0.04%
4.3
Education0.20% 0.45% 0.50% 0.65% 0.25% 0.38% 0.40%
Pre-school and Primary 0.04% 0.00% 0.00% 0.00% 0.00% 0.00% 0.01%Secondary 0.04% 0.00% 0.01% 0.01% 0.00% 0.01% 0.01%Secondary Technical 0.01% 0.02% 0.00% 0.11% 0.05% 0.14% 0.06%University 0.03% 0.33% 0.39% 0.39% 0.03% 0.03% 0.20%General Administration 0.04% 0.00% 0.03% 0.03% 0.06% 0.06% 0.04%Other 0.04% 0.11% 0.06% 0.11% 0.09% 0.13% 0.09%
4.4
Health and Social Affairs0.17% 0.14% 0.37% 0.46% 0.45% 0.50% 0.35%
Primary Care 0.16% 0.05% 0.18% 0.26% 0.19% 0.18% 0.17%Secondary Care 0.01% 0.00% 0.02% 0.00% 0.03% 0.03% 0.01%Tertiary 0.00% 0.08% 0.17% 0.16% 0.20% 0.28% 0.15%Administration 0.00% 0.00% 0.00% 0.00% 0.00% 0.01% 0.00%Social Affairs 0.00% 0.00% 0.00% 0.01% 0.01% 0.01% 0.01%
4.5
Literacy0.00% 0.00% 0.02% 0.02% 0.01% 0.00% 0.01%
4.6
Employment0.16% 0.34% 0.50% 0.55% 0.71% 0.65% 0.49%
4.7
Youth and Sports0.01% 0.01% 0.01% 0.04% 0.02% 0.02% 0.02%
5 Institutional Development 0.59% 0.45% 0.62% 0.81% 0.77% 0.64% 0.65%5.1
Support to Administration0.54% 0.41% 0.58% 0.77% 0.70% 0.60% 0.60%
5.2
Private Sector 0.05% 0.05% 0.04% 0.04% 0.08% 0.04% 0.05%
6 Multi-Sector Projects 1.26% 1.60% 1.36% 2.42% 2.31% 2.18% 1.86%
7 SNIM 0.44% 0.51% 0.72% 0.36% 0.33% 0.30% 0.44%
Grand total 14.54% 11.69% 13.20% 15.52% 16.31% 15.70% 14.49%
Operating expenses have increased and transfers to public enterprises are high
58. A breakdown of the categories used to record investment spending in the national budget execution reports produced by BOOST show that the share allocated to operating expenses has increased as a share of investment budget spending from 11.8 to 19.5 percent between 2010 and 2014. Debt amortization also increased from 13.8 percent to 16.8 percent of investment spending over the same period (see Figure 2.5), reflecting Mauritania’s relatively high debt levels (over 90 percent of GDP) and the increased burden of servicing it. Transfers to public enterprises constituted on average 9 percent of the investment budget. Maintenance spending on physical infrastructure comes out of the recurrent expenditure budget, averaging 7 percent of domestic investment spending (around 3 percent of total investment spending) and 1 percent of total domestic spending between 2009 and 2014.
36
Figure 2.5: Investment Budget Categories, 2010-14 (authorized payments, MRO billion)
Figure 2.6: Maintenance spending MRO Bn and % of Capital Budget and % Total spending
2010 2011 2012 2013 2014 20150.0
20.0
40.0
60.0
80.0
100.0
120.0
140.0
160.0
1 Staffing and personnel 2 Purchase of goods and services 4 Grants, subsidies and transfers 6 Acquisition of fixed assets 8 Loans, advances and equity investments
2009 2010 2011 2012 2013 20140
1
2
3
4
5
6
0%
2%
4%
6%
8%
10%
12%
Grand Total ORD As % of capital budget spendingAs % of Total Spending
59. The country has also witnessed a significant resurgence of external resources from development partners following the freeze after the 2008 coup. A review of the commitments made at the Round Table for Mauritania in Brussels (June 2010) shows that development partners have signed agreements for over US$3 billion against initial pledges of US$3.233 billion, the equivalent of MRO 921.4 billion. But the absorption of these funds over the same period only reached US$1.099 billion, which represents an implementation rate of less than 34 percent (Figure 2.3).60 The World Bank and the European Union are among the major multilateral development partners after the Arab Fund for Economic and Social Development (AFESD) and the Islamic Development Bank; the largest bilateral development partners are China, France, and Saudi Arabia through the FSD.
Figure 2.7: Development Aid, Signed and Disbursed 2010–14 (US$)
60. As of 31 December 2014 the total amount of signed agreements with all development partners (Brussels round table development partners and others) reached MRO 1,010,952 billion (US$ 3.3 billion), a rate of 109.7 percent of the initial commitments. The sectoral distribution of externally funded investments (Figure 2.6) shows that infrastructure and construction —electricity, housing, roads, and water—has benefited from over two thirds (70 percent) of the funds, with nearly a third (30 percent) going to capacity building and institutional development. In terms of geographical distribution, over 59.8 percent of funding is at national level and in the capital, Nouakchott. Regions like Aftout Oriental and Hodh Chargui are new destinations for funding. The south and southeast of the country attracts the bulk of official development assistance.
Little Progress Has Been Made with Public Investment Management
60 The expenditure data is taken from DAD. It differs from the TOFE regarding the expenditure rate for externally financed projects due to delays in donor reporting on expenditures in the DAD.
37
Total commitments: 3.3 Bn
Disbursed: 1.1 bn
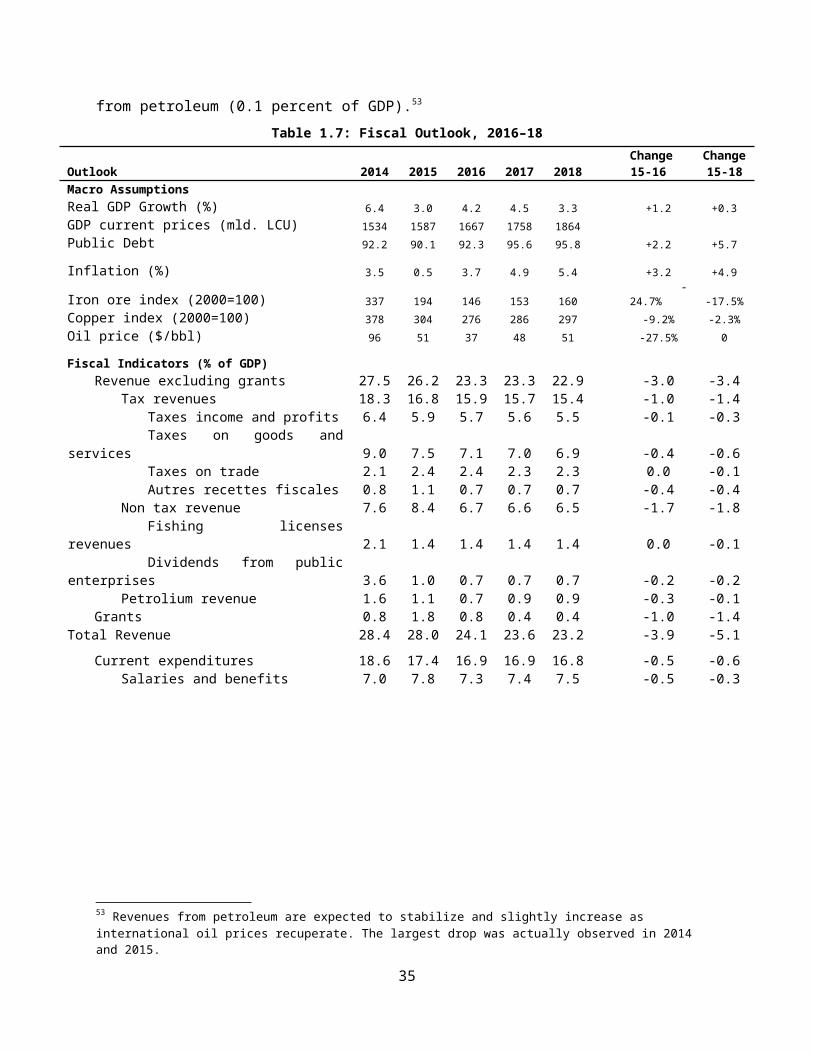
61.
The
following section is a summary diagnosis of the Mauritanian public investment management (PIM) system based on the analytical framework developed by Rajaram et al. (2010). The same framework was used in the latest Public Expenditure Report 2004–09. It found that the Mauritanian PIM system lacks basic systems for project appraisal, selection, and monitoring and evaluation. These findings were confirmed by Mauritania’s scores on the 2011 Public Investment Management Efficiency Index (Figure 2.7). Like the Rajaram framework, the index captures the institutional environment for the PIM, including (i) strategic guidance and appraisal, (ii) project selection, (iii) project implementation, and (iv) evaluation and audit. Mauritania scores an overall value of 1.72, above Cameroon and Mozambique, but below Ghana, Mali and Burkina Faso. The sub-indices show particular weaknesses in categories (i) and (iii).
Figure 2.8: Sectoral and Geographical Distribution of Donor Aid, 2010–14 (USD Mn)
38
USA
United Arab Emirates
FIDA
AfDB
Libya
India
FMA
Kuwait Development Fund
United Nations Programs and Agencies
World Bank
European Union
Arab Fund for Economic and Social Development
0 100000000 200000000 300000000 400000000 500000000
Disbursed Programmed
PetroleumDemining
AgricultureYouth, Culture and Sports
AirportsSocial Development
FisheriesAnimal Husbandry
DecentralizationEmployment and Tech Training
Private Sector Development, SMEs, and MicrofinanceHousing and Urban Development
EnvironmentHealth
EducationAgriculture
Food SecurityCommunication Technologies
Governance and Institutional DevelopmentPorts
RoadsWater and Sanitation
Electricity
-100.0 100.0 300.0 500.0 700.0 900.0 1,100.0 1,300.0 1,500.0013202532
5560
78101102
121124130
199224234
278284
305336
632876
1,310
Tiris Zemmour
Inchiri
Guidimagha
Tagant
Adrar
Hodh el Gharbi
Brakna
Dakhlett Nouadhibou
Trarza
Gorgol
Assaba
Hodh el Chargui
Nouakchott
National
0 200 400 600 800 1,000 1,200 1,400 1,600 1,800 2,000
7
38
60
82
84
122
147
192
194
238
296
368
1,666
1,839
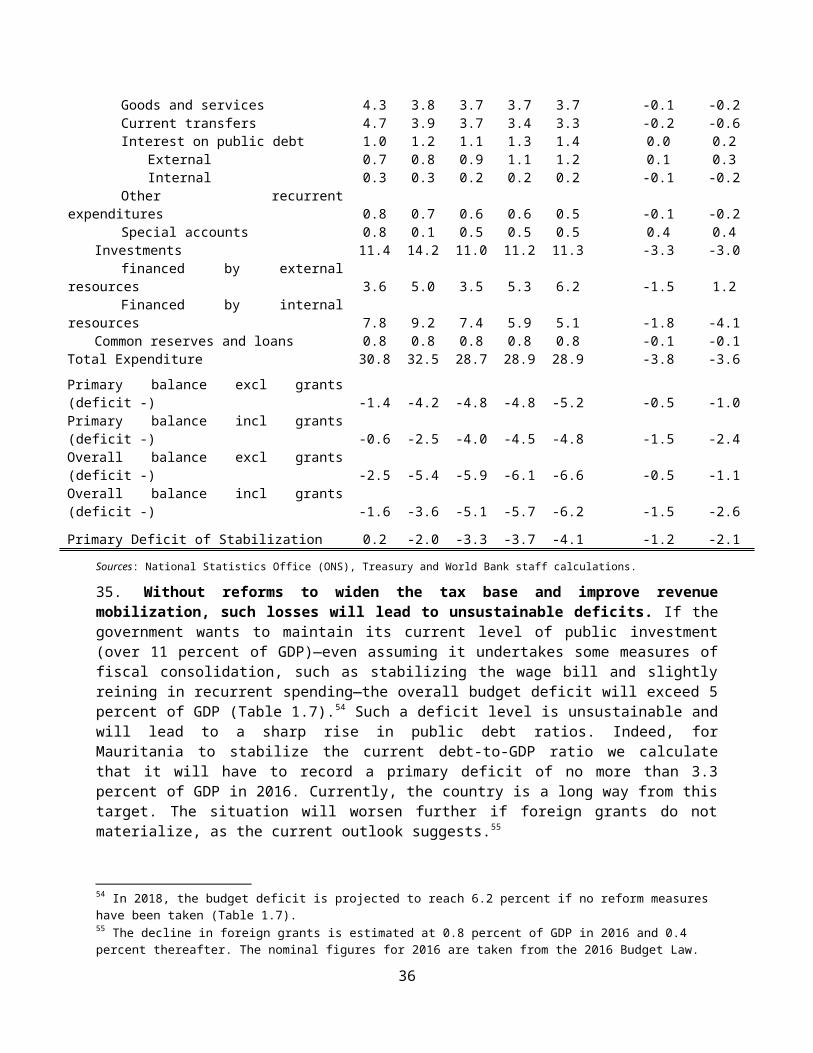
Figure 2.9: Public Investment Management Efficiency Index: International Comparisons, 2011
Source: IMF 2010
62. The following analysis focuses on the essential characteristics of an efficient public investment as defined in the Anand framework (Figure 2.8). This approach presents the basic procedures and controls that are likely to give the greatest assurance of efficiency of public investment decisions and investment management. It focuses on identifying key institutional features and processes that are likely to enhance the efficiency of public investment, notably (i) investment guidance, project development and preliminary screening; (ii) formal project appraisal; (iii) independent review; (iv) project selection and budgeting; (v) project implementation; (vi) facility operation; and (vii) project completion review and evaluation.
Figure 2.10: Essential Characteristics of an Effective PIM system
Source: Rajaram et. al. (2010).
Strategic guidance:
63. Broad strategic guidance for public investment is an important way to anchor government decisions and to guide sector-level decision makers toward national priorities. Guidance may be derived from a national plan or other medium to long-term strategic document that establishes economy wide development priorities at the highest decision-making levels. The national plan may be supplemented by a sector-level or even subsector-level strategy that provides more detailed translation of the overarching priorities. Beyond the strategic vision or plan, governments also need a formal process for project development. Line ministries and spending agencies initiating projects for public
39
investment should prepare a project profile with basic project information, including the relevant strategic priority and program or subprogram, the specific problem to be addressed, the project objective, the main activities, the expected results, and the estimated budget. The quality of those plans, programs and projects, and how well resources are used, are critical factors for success. To improve the chances of success, attention needs to be placed on some of the common areas of weakness in guidance. The following questions are examined in the context of guidance:
Is there well-publicized strategic guidance for public investment decisions at the central, ministerial, and provincial levels?
Is there an established process for screening of project proposals for basic consistency with government policy and strategic guidance? Is this process effective?
What proportion of projects so screened is rejected?
64. Assessment: there is still a near absence of a legal framework for PIM. Decree 86-78 from 1986 outlines the basic steps for the preparation of the investment budget, but no guidelines, methodologies or instruments exist for investment project preparation, including technical and economic analyses. 61 As in many aid-dependent countries, the authorities expect development partners to handle all aspects of project preparation, even as the national investment budget has grown to match externally funded projects.
65. In addition to the Poverty Reduction Strategy Paper (PRSP), which provided general priority areas for investment, an overall MTEF has been elaborated as well as three sectoral MTEFs and some sectoral development strategies. However, only the education sector strategy (2011–2020 National Program for the Development of the Education Sector; NPDES), health (National Health Development Plan 2012–2020), and employment (National Employment Strategy and Action Plan 2009–2013) strategies have specific expenditure forecasts. Of the three sectoral strategies, only the NPDES appears to be articulated with a sector MTEF and the annual budget forecast. However, the strategic documents only inform the investment budget in a very limited manner, as indicated by the very significant budget discrepancies between the various instruments as noted in the Public Expenditure and Financial Accountability (PEFA) assessment from 2014. For example, the PRSP notes the need to rehabilitate schools and build new ones, yet the investment budget allocated to the primary education sector is one of the lowest in the entire investment budget (0.1 percent of the budget). Other PRSP priority areas are more clearly identifiable in the investment budget profile. Development partners generally align their projects with the main strategic instruments, although the categories are too broad to be useful for the screening or selection of projects. Investment projects are not always developed on the basis of need and an analysis of alternative solutions. In fact, filtering and project selection seems to work in reverse; the government first seeks funding and then adjusts the budget, PIP and PRSP to include it. The main criteria for project selection seems to be the availability of financing and not strategic importance, in-depth analysis of alternative solutions to a challenge, or even a review of project proposals.
Project appraisal and review:
66. Project Appraisal serves to determine whether to go ahead with an investment project proposal or not. Several steps are usually involved including pre-feasibility and feasibility studies determining technical, social, environmental and economic viability of the project, including of different design alternatives. For project appraisal to be effective, technical guidance and capacity, funding and a relatively clear process and allocation of responsibilities for the appraisal should be in place. The project selection process needs to ensure that projects proposed for financing have been evaluated for their
61 A recently approved African Development Bank project aims to support the development guidelines and methodologies for project development and selection.
40
social and economic value. To do so effectively, governments should have formal and well-publicized guidance on the technical aspects of project appraisal appropriate to the technical capacity of ministries and departments. The guidance should describe techniques of economic evaluation that are appropriate to the scale and scope of the project—with larger projects requiring more rigorous tests of financial and economic feasibility and sustainability. The project appraisal process should consider project proposals of different scales and take into account the key macro, sectoral, and project-specific uncertainties such as inflation, cost overrun, change in output, and key input prices over the project life. The following diagnostic questions are used as a reference for assessing practices relative to project appraisal and independent review:
Is there a formal pre-feasibility study process before the formal appraisal process of feasibility study?
Is there a formal cost-benefit appraisal process for more detailed evaluation (whether at the line ministry or the central finance agency level) of public investment project proposals?
If yes, is appraisal mandatory for all projects or only for projects above a certain monetary value? Is project appraisal undertaken only for specific sectors and, if so, which sectors? What proportion of public investment projects is formally appraised for costs and benefits?
Is there a formal manual or guidelines for cost-benefit appraisal? What are they? What is the quality of such appraisal manual or guidelines?
Are project appraisals formally undertaken by the sponsoring department or by an external agency? What is the quality of such appraisals?
What proportion of such appraisals is rejected or sent back for amendment?
67. Assessment: project appraisals are generally carried out for donor-funded projects and by development partners themselves, although practices vary widely. Formal appraisals do not take place for projects financed by domestic resources. As a result, some investment projects included in the budget are of poor quality, with issues such as underestimating needs or costs, omissions, and over-ambitious timeframes. Although the government has made efforts to filter projects there is still no evaluation that would allow more transparency and efficiency in the selection of major public investment projects. Some development partners, such as the World Bank and the EU explicitly require an analysis of costs and benefits (economic, financial, social) of investment projects, but this is not the case for all development partners and also does not apply to investment projects financed domestically. The strategic role of the MAED in the investment budget process is unclear and is often seen as being limited to facilitating contact between sectors and development partners to mobilize resources rather than functioning as an arbiter, standard setter, and quality controller for investment projects.
68. No independent reviews of project appraisals take place and there is no institution charged with such reviews. The internal auditor of Mauritania has a broad mandate to carry out functional reviews of all public institutions, including audits of investment projects, yet it lacks the capacity or technical skills to review investment projects. Although it does carry out some audits of public works, its intervention is usually at the final/completion stage of investment projects and usually focuses on compliance audits. The need for independent project reviews and improved accountability in public investment was highlighted in the recent controversy regarding the investment in the fish freezing and processing plant of a Chinese company, where some felt that the public benefit it provided was doubtful.
Project selection and budgeting:
69. The overall criteria for a functioning public investment selection and budgeting system follows from the general functionalities of good budgeting, i.e. allocative efficiency, operational effectiveness and fiscal discipline. Ideally a fiscal framework and the annual budget circular would establish the
41
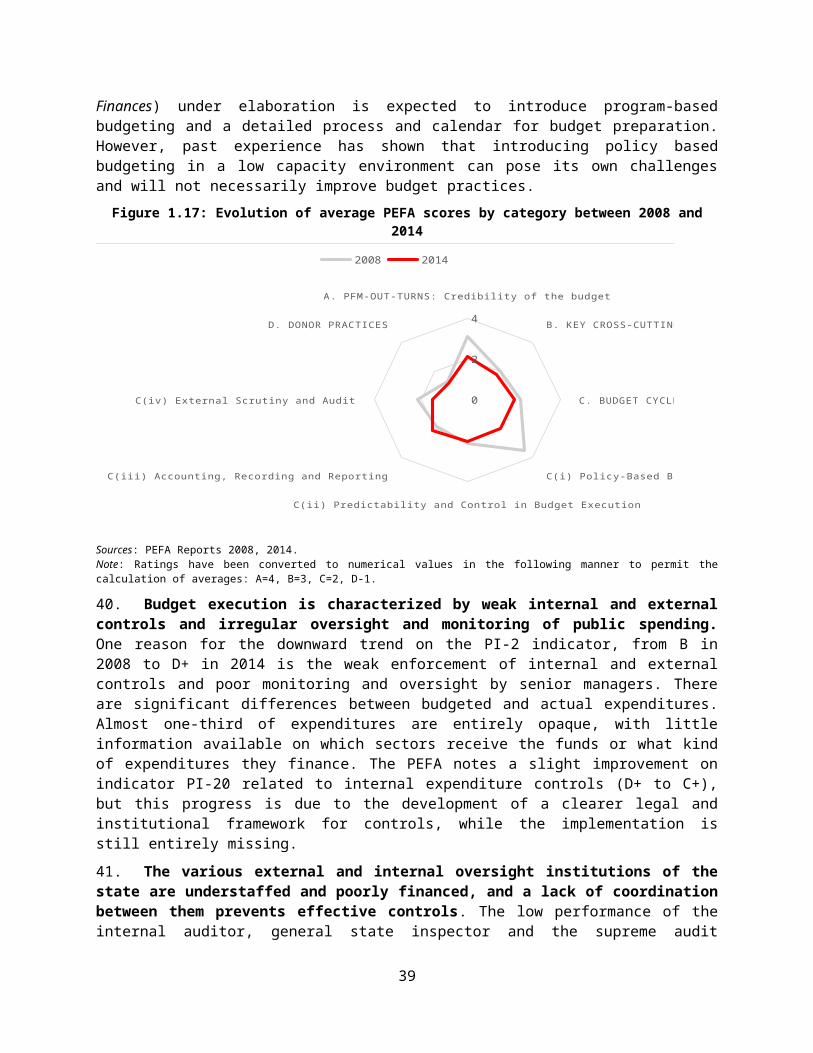
overall and sectoral envelope for public investments and would ensure that adequate funding is allocated to maintenance of completed projects/assets. The pressures to include any given project in the budget – independent of the results of any appraisal – can be significant. Stakeholders who stand to benefit from a proposal will mobilize to ensure that funding is provided. This makes the existence of a “gate keeper function” important to ensuring that only viable projects are included in the budget and that the overall envelope is fiscally responsible.
70. The following key questions are examined in the context of selection and budgeting: Is there an effective process to control the gates to the budgeted PIP? Is there an established
but limited process for including projects for emergency or politically imperative reasons? Is final project selection undertaken as part of the budget process or prior to the budget
process? Does the government maintain an inventory of appraised projects for budgetary consideration? Are public investment projects selected and funded through extra-budgetary channels?
What is the role of the legislature, including special legislative committees, in the selection of public investment projects? Does the legislature’s involvement cover both budgetary and extra-budgetary channels?
What proportion of the public investment program (PIP, the collection of projects that are formally approved for budget allocation and implementation) is donor-financed? Are donor-financed projects subject to the same or different rules for appraisal and inclusion in the budget as government financed projects? If the rules are different, describe the difference.
What is the average value of new projects relative to the ongoing public investment projects and projects completed?
71. Assessment: during the period 2004–09 covered by the last PER most investments were financed by donor funding and government financing of the investment program was limited mostly to contributing counterpart funds. Currently, however, about half of the public investment program—nearly US$400 million—is government financed. Development partners generally follow their own rules and procedures for project selection, development, and appraisal. The rules and criteria for including projects in the national budget are not clearly defined, except for general alignment with broad priorities outlined in the PRSP and other strategic documents, a principle which development partners generally respect although the categories are broad enough to accommodate almost any investment project idea. Basically, if external funding is available, is it included in the budget? The government is closely involved in project development, design, and budgeting and government institutions generally express quite clearly their priorities and needs during the preparatory process. However, poor coordination amongst institutions, an unwillingness to collaborate, and frequent turnover of key technical staff complicate the project preparation process, and donor-funded projects often need to be restructured in order to avoid overlaps and double funding. The practices for the preparation of domestically financed projects are not clear, but public-sector staff say that political lobbying, rather than technical aspects, is the main requirement for getting any project into the national budget.
Project implementation and adjustment:
72. Problems in implementation can at times be related to poor project selection and budgeting. Clear responsibilities for implementation, institutional capacity to manage and monitor project implementation, timelines, total project cost management system, multi-year budgeting and effective procurement are important elements of a well-functioning public investment management system. Managing the total cost of projects over their life requires a multi-year budgeting process and an accounting system that captures and reports all project costs rather than accounting by separate contracts or stages and tracking against annual appropriations. Project proposals, especially for a large
42
infrastructure project, should also present organizational arrangements for running the project once the construction is finished. Although, implementation problems can at times be related to poor project selection and budgeting they are often due to procurement challenges. Procurement is thus a special area of focus as the mechanisms for selection and contracting of contractors influence price, quality and facilitate or mitigate fraud and corruption risks. A recent review of about 500 projects funded by the World Bank across all regions concluded that unsatisfactory procurement performance significantly affected the development outcomes of projects, with those outcomes being three to five times more likely to be negative in cases with poor procurement performance.62 Another important aspect of implementation is the ability to handle project adjustments. Costs of materials might fluctuate, the cost of funding might change, physical and social conditions on the ground might not be as predicted, providers might not perform as expected and political demands might evolve as the project is implemented leading to design adjustments. The following diagnostic questions guides the assessment:
What is the completion rate of the PIP (annual average over the past five years), defined as the annual public investment budget divided by the estimated cost to complete the current PIP? How does this completion rate differ across key sectors—education, health, water supply and sanitation, roads, and power, for example?
Are project-implementing agencies required to prepare periodic progress reports on projects? Do these reports include updated cost-benefit analyses?
Are the sponsoring departments accountable for changes recorded in either costs or benefits and for the delivery of net benefits? What mechanisms exist to ensure that this occurs? Does the government have a decision process to close down projects which have shown significant cost overruns or time delays which render them uneconomic? For a representative subset of the PIP, what is the average percentage cost overrun (in inflation-adjusted terms) on major projects in key sectors?
Has the government rationalized its PIP in the recent past? Did it result in the cancellation or closure of ongoing projects—and if so, what percentage of the PIP was cancelled or closed? Indicate whether projects were merely “deferred” rather than cancelled.
73. Assessment: the authorities are unable to provide up to date information on the completion rate of the PIP and the consolidated investment budget by project. Expenditures are recorded by economic and/or institutional categories only. At the time of the last PIP update in 2014, a general overview of planned expenditures and actual expenditures by project was carried out. However, the review seems incomplete and full of significant data gaps. For example, it shows an overall execution rate of just over 5.7 percent, but with significant variations amongst projects. At least two thirds of the listed projects show a 0 percent execution rate. Other projects range from just over 1 percent to over 200 percent execution rates. Also, the information in the PIP differs significantly from that of the consolidated investment budget (BCI). For example, there are only 131 projects listed in the PIP, valued at 165 MRO Bn (US$ 550 million), whereas the BCI includes 323 projects, budgeted at 236 MRO Bn (US$ 786 million). Neither the MAED nor any sector ministries have an updated database or any other systems to monitor the financial and physical execution of projects. The DAD is updated on an irregular basis and information is incomplete. Monitoring happens at project level, and for large infrastructure projects there are sometimes independent third-party monitors for technical aspects, but no systematic analysis is carried out during project implementation to examine progress across a larger set of the portfolio at either sector or geographical area. There has been no effort to assess the completion rate of the investment program, including trends on time and cost compliance, contract revisions, and any overruns. The procurement control commission is supposed to monitor contract implementation but 62 World Bank. (2014). The World Bank and Public Procurement—An Independent Evaluation. Report of the World Bank Independent Evaluation Group (IEG), World Bank, Washington, DC.
43
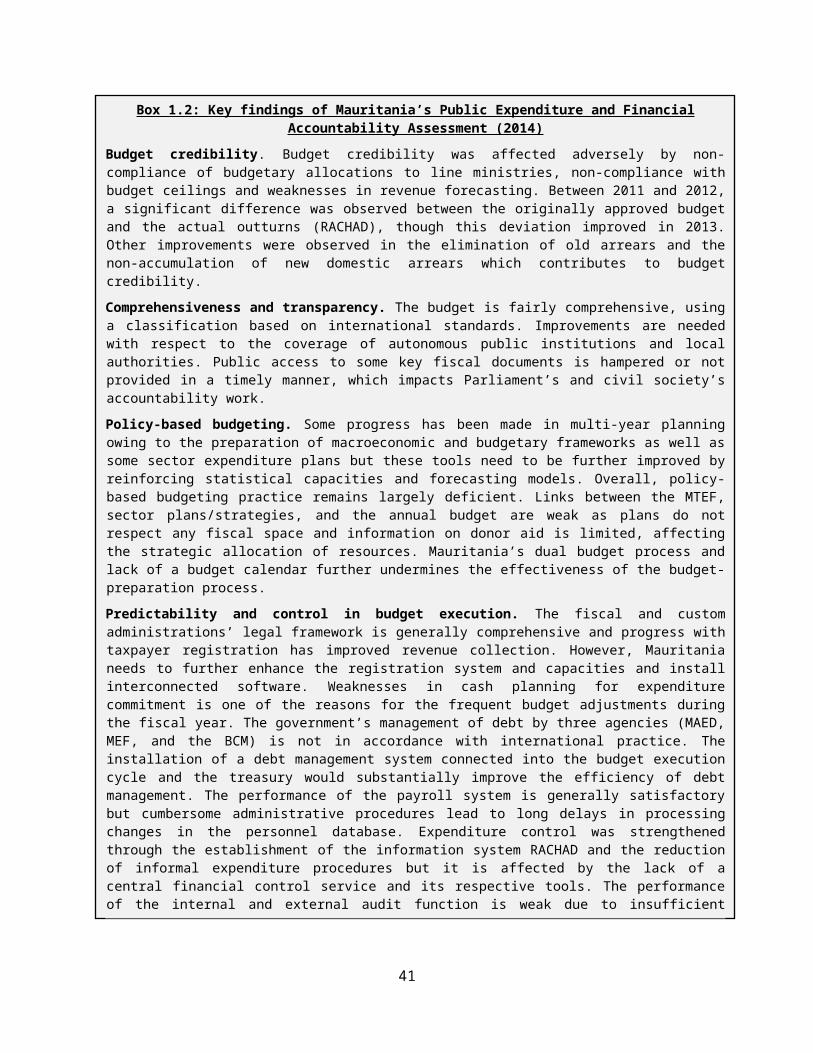
have never prepared any reports. Line ministries do not submit periodic and regular reports on the progress of projects to ensure that funds are spent as intended (on time, for the purposes intended, within the planned budget). The audits carried out by the procurement control commission provides a physical visit to a sample of investment projects,63 and these reports include basic statistics on the procurement methods used by each sectoral procurement commission and a summary opinion on each contract, but the level of detail and analysis is very limited. There is no information on contract execution for example.
74. Most donor-funded projects are managed by project implementation units (PIUs) which operate outside of the public administration and following donor-specific fiduciary arrangements . This complicates the monitoring and follow up of investment projects by the authorities. In recent years, the authorities have made efforts to ensure greater integration of donor-funded projects. As a result, most procurement is now subject to review by the national procurement commissions. (See the following section for a review of the public procurement system). In 2014, the number of PIUs was estimated at around 26, with 14 of these managing World Bank-funded projects. While PIUs may facilitate project execution and improve financial control, they create parallel administrative structures that undertake work which the public sector should be doing. PIUs will also often attract the best staff due to offering higher salaries than in the public sector. In addition, PIUs rarely increase the technical and managerial capacity of the public administration because their lifespan is limited. Nevertheless, given the significant weaknesses in the Mauritanian public sector many development partners opt for the continued use of PIUs.
75. In 2009, the government established an agency for investment planning, monitoring, and evaluation (ANESP). The agency is attached directly to the Presidency and its objective is to improve PIM in Mauritania through technical and strategic support for the entire project cycle. The agency focuses on a limited number of high-profile projects, but remains largely absent from the broader public investment process, which is controlled by the Ministry of Economic Affairs and Development (MAED) and the Ministry of Economy and Finance (MEF), with inputs from sector ministries. In February 2016 the government decided to merge the MEF and the MAED. This provides an opportunity for the authorities to bring much-needed coherence to the entire budgeting process, including preparing the investment budget and monitoring investment projects.
76. Project adjustment: there is no evidence that a rationalization of the public investment program has ever been undertaken in Mauritania. A review of the latest updated PIP for the period 2013–15 shows no reduction or cancellation of non-performing projects for example. Adjustments to the PIP are mainly related to funding availability. Adjustments to individual projects do take place, mostly relating to project duration (usually extension), revision of the contract value, additional work specifications, and so on. In fact, anecdotal evidence suggests that contract value adjustments are a regular occurrence and that there are few controls in place to prevent bidders from winning contracts on the basis of unrealistically low cost estimates which are then adjusted upwards once the contracts are signed. Fines are sometimes levied on contractors who fail to meet contractual agreements but this is not done in a systematic manner. Given the lack of analytical work on the existing investment portfolio, the authorities are unable to produce information on core PIM metrics such as the average percentage cost or time overrun for any part of the investment portfolio. Development partners regularly carry out adjustments/revisions to their projects during implementation, often triggered by the need to avoid double funding the same activity. Given poor coordination and the practice of submitting multiple similar funding requests, it is often necessary to make adjustments to similar projects affecting the same beneficiaries.
63 The 2014 report includes a sample of 15 contracts in four ministries, valued at MRO 1 billion.
44
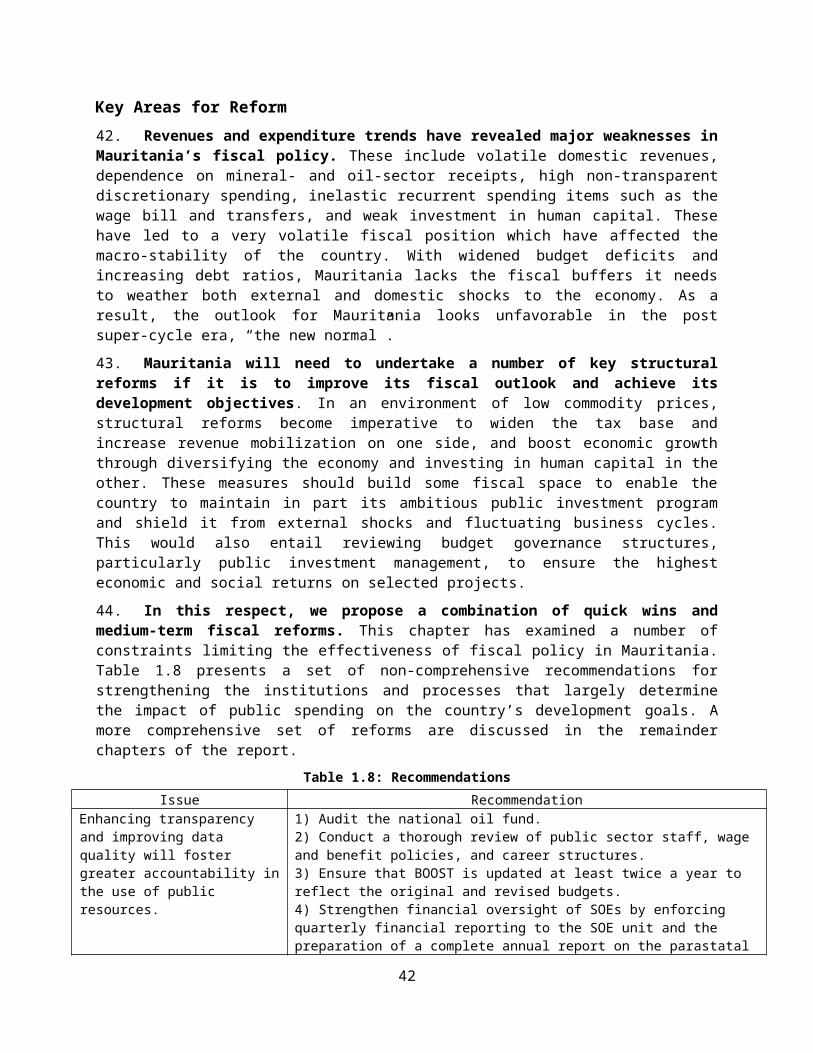
Facility Operation
77. Following project completion, it is important to have a process ensuring that the facility is ready for operation and that services can be delivered. This process should include an effective mechanism to hand over the management responsibility for future operation and maintenance of the investment, and ensure that there is adequate budget funding of service delivery agencies to operate and maintain these assets. In addition to the above, completed investment projects should be included in an asset registry and its value accounted for. The following diagnostic questions are examined the context of guidance:
Are there long delays in completed projects becoming operational? Is this a general problem, or is it limited to some sectors or projects?
Is there a process for handover of management responsibility for future operation and maintenance of the created assets to service delivery agencies?
Do service delivery agencies have adequate budget funding to operate and maintain these assets? Is service delivery associated with facility operation tracked through time? Are agencies held accountable for the delivery of services? Do facilities charge for access, and are such fees earmarked for facility operation and maintenance?
Does the government maintain an asset register or inventory of public sector property such as equipment and vehicles? Is legal title to assets maintained?
Are assets valued according to sound accounting principles, such that the accounting definition of an asset is met, depreciation is deducted from the asset value, and, where feasible, asset values are updated to reflect changed prices?
78. Assessment: a lack of coordination between the preparation of the recurrent and investment budgets has contributed to insufficient planning and budgeting for facility operations. Sector ministries report that they are not receiving sufficient funds to operate and maintain facilities which have recently been completed and this frequently leads to delays in making investments operational. There is no overall instrument to calculate or estimate operational costs for investment projects and the institutions responsible for operating and maintaining investments are left to make the case for such funding. Where mechanisms have been designed to ensure sufficient operations and maintenance for large infrastructure projects, the high degree of informality and a weak compliance culture has prevented these from working sufficiently. For an example from the roads sector is illustrative: the roads agency ENER was set up in 1994 to ensure the proper operation and maintenance of the roads network in Mauritania. However, since 2010 it has focused largely on road construction, paying less attention to its maintenance responsibilities.
79. Completion reviews and evaluations do not take place in a systematic manner. Some development partners carry out their own completion reviews and these are shared with the authorities. The MAED itself has not produced any evaluation reports on the PIP between 2010 and 2014 and no information is available regarding any closing visits or reviews. Audit reports from the General State Inspectorate (Inspection Générale d’Etat; IGE) may cover some elements of project completion, but these are not shared with anyone beyond the Prime Minister’s office and the reviewed institution. The authorities do not maintain an asset register or inventory of public-sector property and other assets.
80. In sum, the Mauritanian PIM system exhibits all the regular features of public investment in aid-dependent countries, as summarized in Box 2.1 below.
45
Box 2.1: Common Features of PIM in Donor-Dependent Countries
PIM systems in donor-dependent settings tend to exhibit the following distinctive features:
Investment guidance, project development and preliminary screening: government strategy documents, such as public investment programs, MTEFs and PRSPs, tend to be directed towards development partners, rather than covering both external and domestic investment in an integrated and coherent manner. They are at a level of generality that limits the extent to which they can provide a basis for preliminary screening of projects, and are often not supported by effective
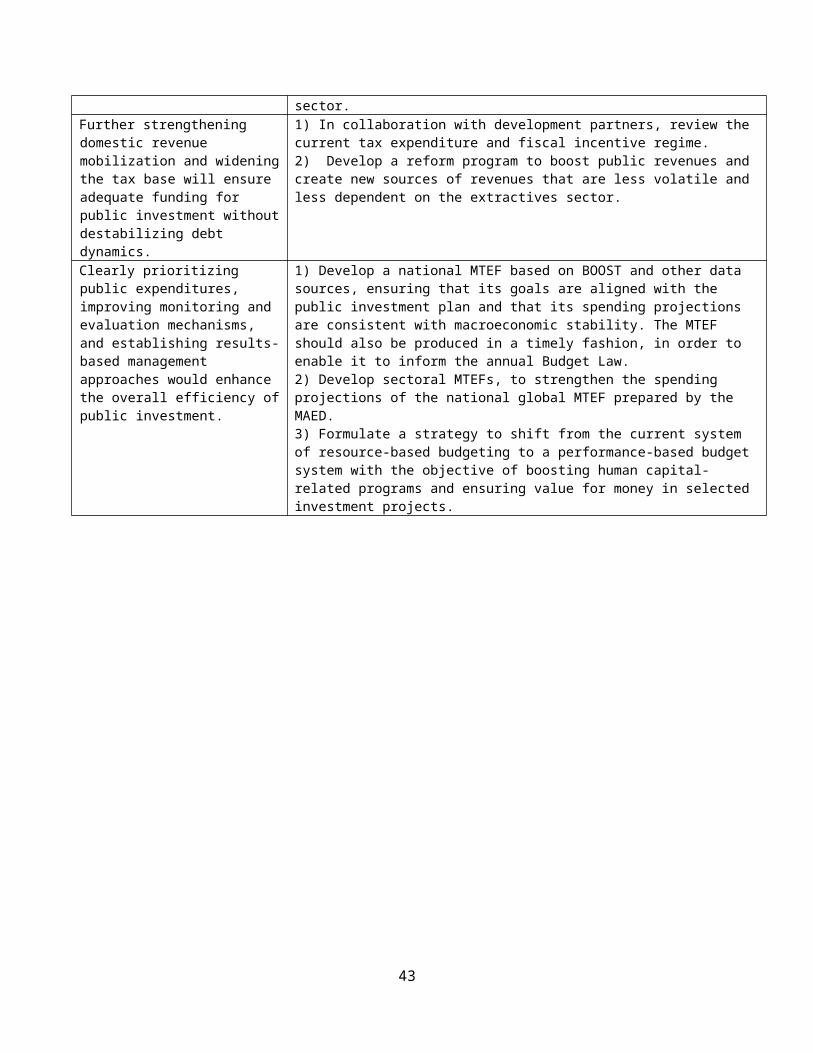
Source: World Bank 2015.
Procurement Reforms Begun in 2010 Have Not Brought About the Desired Results
81. Mauritania’s modernized procurement system aims to make the system more transparent, efficient and accountable in accordance with international standards. In the face of budget constraints and the need to fight corruption, the Mauritanian government embarked on reforming the procurement law and strengthening its institutional foundations to better manage and controlling procurement. The new Law on Procurement (2010) requires all public procurement to be conducted in accordance with the principles of separating procurement, control, and regulation. The law led to the establishment of several public bodies for contract awards, control, and regulation, set out procedural rules (whose provisions include the advertising and public display of bid opportunities, and notices of best evaluated bidder and contract award) and lays out procedures for complaints. Since its adoption, the Procurement Regulatory Authority (ARMP), a control commission (Commission Nationale de Contrôle des Marchés Publics; CNCMP) and sectoral procurement commissions (CSMs) were set up, staffed, and are operational. Several directives, instructions, and tools (CAD-type Procedures Manual, single web portal, etc.) were adopted to reflect the new principles of procurement and procurement tools. According to the Public Expenditure and Financial Accountability (PEFA) methodology and the OECD/Development Assistance Committee (OECD/DAC) Methodology for Assessing Procurement Systems (MAPS), both carried out in 2014,64 the new procurement system is consistent with international standards with regard to publication requirements, the comprehensiveness and transparency of the legal framework, and the functioning of the complaint system. Nevertheless, both assessments also point to a number of remaining crucial challenges in effectively reforming the system.
82. Based on the OECD/DAC MAPS baseline indicators, the assessment found areas of strengths but also weaknesses in compliance and performance. The assessment examined the legal and regulatory framework, the institutional arrangements, the operational practices, and the competitiveness of the procurement system as well as its integrity and transparency (see Table 2.4). Overall, it assessed Mauritania’s public procurement system as strong on the legislative and regulatory framework (Pillar I), but with still much room for improvement in the three other areas (Pillars II–IV). A more detailed assessment based on the 12 baseline indicators shows the degree of access to information (Indicator 11), the efficiency of appeals mechanism (Indicator 10), and the public procurement legislative and regulatory framework (Indicator 1) were among the strongest features of Mauritania’s procurement system. In contrast, the most significant weaknesses were found in institutional development capacity (Indicator 5), the control and audit system (Indicator 9), and the efficiency of the country’s procurement operations and practices (Indicator 6).
Table 2.4: Assessment of Mauritania’s Procurement System Based on OECD/DAC Baseline Indicators(See Annex A4 for more details on findings and ratings)
PILLAR BASELINE INDICATORRESULTS PER
INDICATORRESULTS PER
PILLARPillar I: Legislative and regulatory framework
1: Public procurement legislative & regulatory framework achieves standards and complies with applicable obligations
92%
86%2: Existence of implementing regulation and documentation
81%
Pillar II: Existence of 3: Public procurement system mainstreamed and 82% 67%
64 The PEFA methodology was modified in 2011 by adding a fourth dimension and completely reformulating the other three to reflect and provide linkages to the OECD/DAC methodology for assessing procurement systems.
46
Box 2.1: Common Features of PIM in Donor-Dependent Countries
PIM systems in donor-dependent settings tend to exhibit the following distinctive features:
Investment guidance, project development and preliminary screening: government strategy documents, such as public investment programs, MTEFs and PRSPs, tend to be directed towards development partners, rather than covering both external and domestic investment in an integrated and coherent manner. They are at a level of generality that limits the extent to which they can provide a basis for preliminary screening of projects, and are often not supported by effective
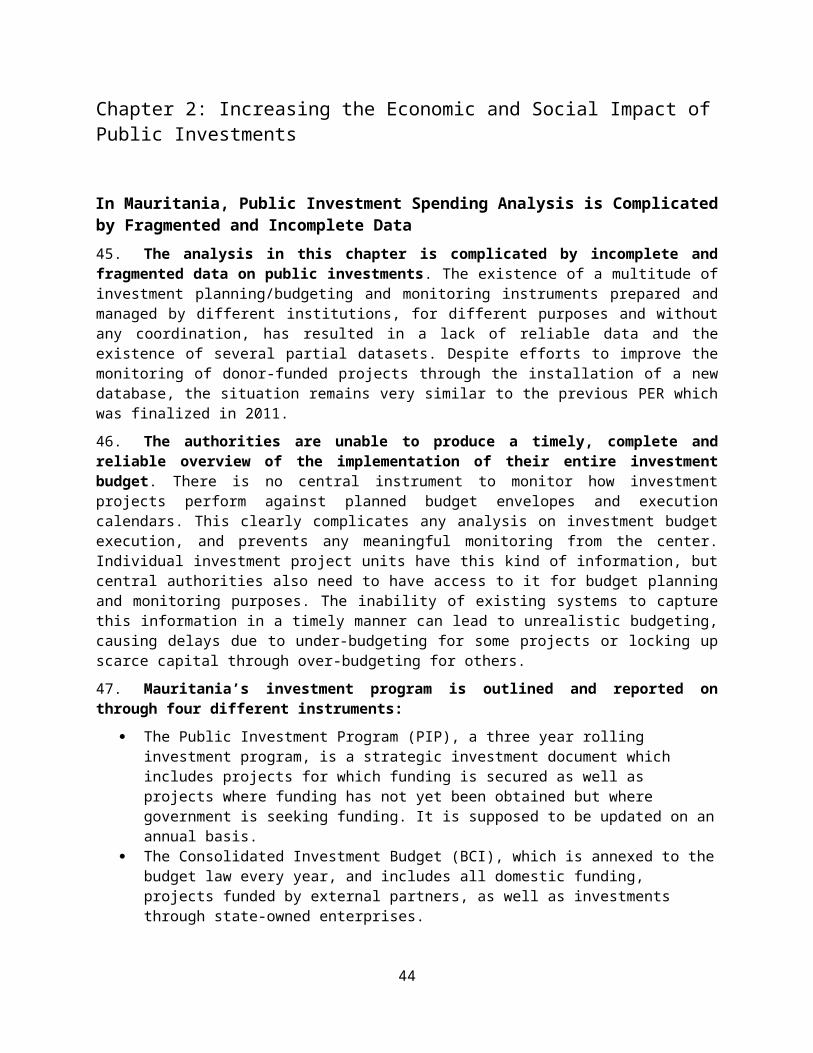
implementing regulations and documentation
well integrated into public sector governance system4: Functional normative/regulatory body 82%5: Institutional development capacity 37%
Pillar III: Procurement operations and market practices
6: Efficient procurement operation and practices 47%
55%7: Functionality of public procurement market 56%Ind. 8: Existence of contract administration and dispute resolution provisions
62%
Pillar IV. Integrity and transparency in the public procurement system
9: Effective control & audit system 45%
74%10: Efficiency of appeals mechanism 87%11: Degree of access to information 100%12: Ethics and anticorruption measures in place 57%
Source: Mauritania, PEFA, 2014
83. Pillar I assesses the legal and regulatory framework from the highest level down to the more detailed operational procedures, guidelines, model tender documents, and standard conditions of contract. With the enactment of its new procurement law, Mauritania has in place a sound and comprehensive legal framework for public procurement with clear hierarchical distinctions (laws, decrees, regulations, procedures). The law covers the procurement of goods, works, and services. It establishes open competitive tendering as the default procurement method, and defines the situations in which other, less competitive, methods can be used. However, the legislative and regulatory framework lacks operational regulations (i.e. related to bidding thresholds, the delegation of services, the determination of illegal fractions). Model tender documents still need to be made mandatory and appropriate standards have not yet been specified in tender documents consistent with national requirements and, when applicable, international requirements. 84. Pillar II assesses how the procurement system is operating through the institutions and management systems and practices forming part of the overall public sector governance. In accordance with the new act, the creation of the ARMP, the CNCMP, and the CMS seek to ensure the regular function of the system. The ARMP’s responsibilities are in conformity with international best practice and it is well funded. The agency is also not responsible for undertaking procurement operations directly in order to prevent conflict of interest for procurement officials. The nomination of staff by the Prime Minister or the President (for the Head of the AMRP) and staff recruitment on a competitive basis ensures the independence it requires. Nevertheless, the effectiveness of the procurement systems’ regular functioning is severely constrained by a number of factors: (i) the agencies are largely staffed with temporary workers (“contractuals”), adversely affecting their authority, responsibilities, and performance; (ii) the agencies lack leadership and coordination, notably between the ARMP and the CNCMP; (iii) agencies’ functions are not always clear and overlap with other responsibilities; (iv) control functions are lacking for a substantial portion of procurement related to services and supplies, with thresholds at MRO 100 million (US$ 333 million); (v) there are no established procedures to ensure that the budget law and budget management support timely procurement; (vi) no statistical data collection system is in place—a task of the CNCMP; (vii) despite initiating a capacity-building strategy, there is still no in-house training structure; and (viii) the institutional setting lacks procurement units established at the level of Finance Departments and implementing agencies (Table 2.5).
47
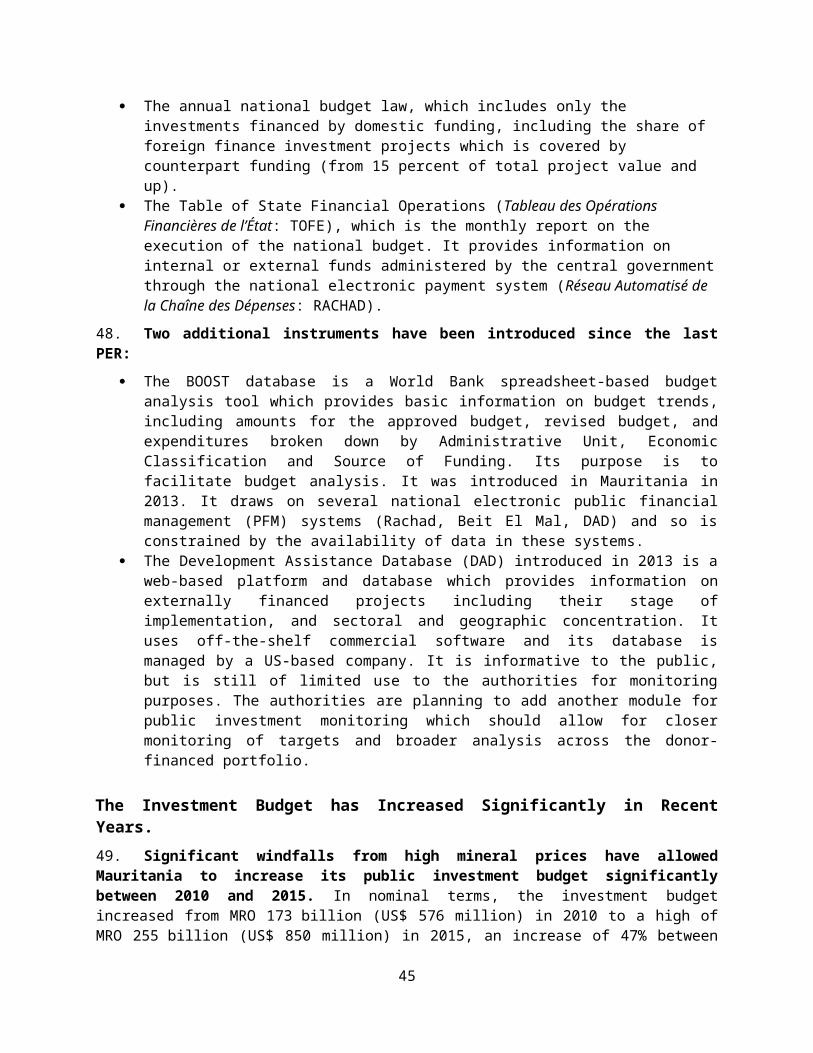
Table 2.5: Assessment of Procurement Agencies’ PerformancePROCUREMENT REGULATORY
AUTHORITY (ARMP)CONTROL COMMISSION (CNCMP) SECTOR TENDER BOARDS
(CSM)
Lack of attachment to a structure (such as the Prime Minister or the President of the Republic) can render the agency’s sustainability and authority uncertain in the medium/ long term. Weak coordination and interaction with the government when introducing regulatory functions—this would have required regular and formal exchange with various government institutions. Lack of minimum qualification standards for the members of the council. Lack of procurement expertise within the authority and the board. Slow and cumbersome ex-ante controls, leading to significant delays in procurement processes. Overlapping and double controls for donor-funded projects.
Slow and heavy ex-ante controls, leading to significant delays in procurement processes. Overlapping and duplicative controls for donor-funded projects.
Unclear institutional linkages and accountabilities, with procurement commissions reporting to several ministries, leading to weak supervision and oversight. CSMs often represent several contracting agencies (ACs); this is forbidden under the procurement code, which specifies that if several ACs use the same commission, the commission chairmanship needs to rotate among them. Recruitment of permanent staff without consulting contracting entities, leading to a lack of engagement and ownership of the contracting agency and a very costly institutional structure; according to the law, the composition of each commission consists of one permanent staff member from the contracting agency and temporary technical specialists contracted or mobilized from the public sector. Urgent need to reduce the number of staff in CSMs and/or reorganize these (standard cost per CSM is currently around US$170,000 per year although this varies greatly, while the workload varies between 150 procurement contracts for the busiest commission and just 30 for others).
Source: Country Procurement Assessment Review (World Bank 2014)
85. Pillar III looks at the operational effectiveness and efficiency of the procurement system at the level of the implementing entity responsible for issuing individual procurement actions. The implementing agencies’ efficiency in administering procurement in accordance with regulations is severely undermined by a lack of procurement knowledge, mostly attributable to the implementing agencies’ loss of procurement staff to the newly created procurement agencies and the lack of procurement capacity development (see also Pillar II). There is still no system for safekeeping of records and documents, which affects the government’s ability to look at implementation performance and the functioning of the control system. In addition, if a procurement system is to function well, it needs a well-operating and competitive private sector. Despite the existence of a Chamber of Commerce under the Ministry of Commerce, Mauritania does not have a well-established mechanism for public-private partnerships. Access to the procurement market is hampered because of poor procurement knowledge among private bidders, a weakness further exacerbated by the absence of initiatives to build procurement capacity. Another major constraint for private-sector participation in competition for public contracts are the oligopolistic or monopolistic features in important segments of the market, such as large-scale building contracts given to public companies outside the public procurement process. Lastly, while disputes during contract implementation are common and contribute to delays, Mauritania does not have a resolution process defined in its contracts and procedures to enforce the outcome of the dispute resolution process.
48
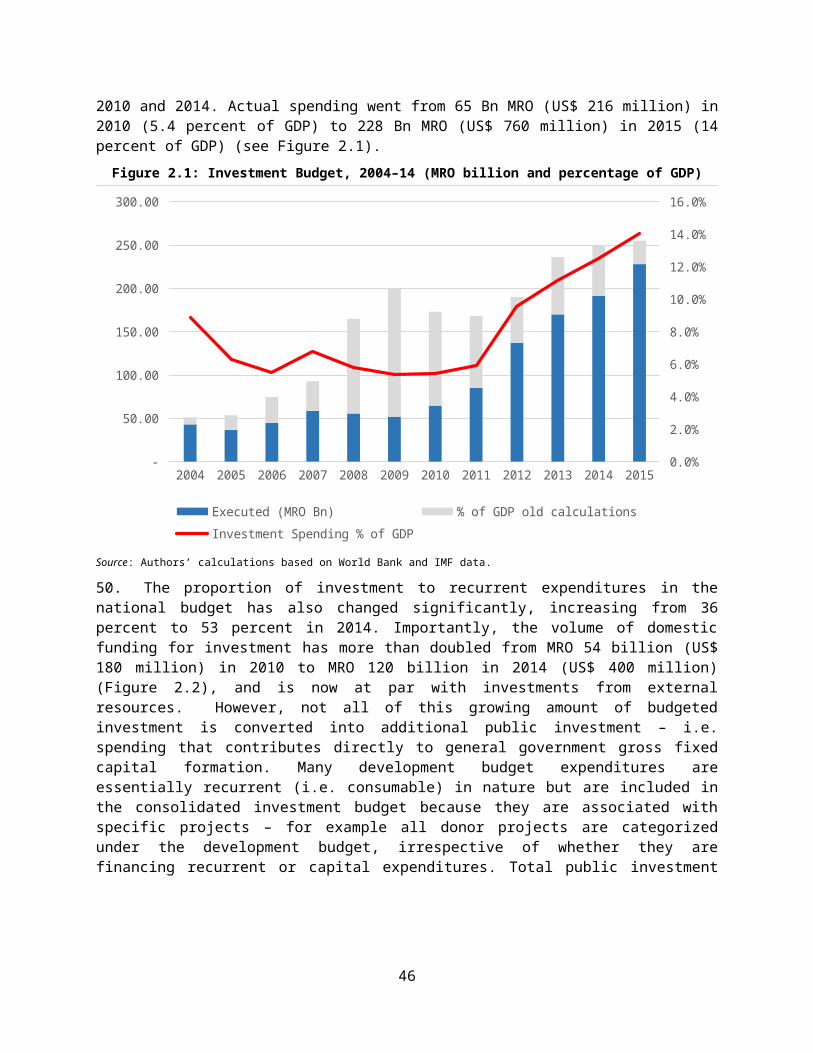
86. Pillar IV examines the adequacy of control systems (including an effective control and audit system, an efficient appeals mechanism and a comprehensive information sharing system) and measures to address the potential for corruption in the system. An independent and well-functioning internal and external audit function are important to ensure compliance and to detect fraud and corruption. Mauritania’s audit structure suffers from a lack of legal provisions for internal audits and poor follow up on external audit recommendations. Even though the ARMP is adequately resourced to conduct annual procurement audits, it is severely constrained by the absence of an integrated information system and the lack of reporting on procurement operations below a certain threshold level. External control is partly ineffective as evidenced by the absence of a mechanism for reporting fraud and corruption or for civil society’s participation in monitoring procurement processes. In contrast, a well-functioning and independent complaint and appeal mechanism was established and the system is accessible to the public. The establishment of the new procurement agencies substantially improved the dissemination of information on government procurement with each agency having its own website and posting timely information on procurement notices and awards. Information (invitations to tender, notices of interim and final awards, etc.) are also published in the national press.87. Public procurement is a high risk area for fraud and corruption due to the allocation of large and potentially lucrative contracts for companies that win them. Despite these risks, the systems for detecting, uncovering and prosecuting corrupt practices are weak or absent in Mauritania. Despite a few isolated cases and some noise in the media there isn’t much information available on how the authorities are combating corruption. Mauritania’s accountability institutions do not actively report on the findings of their audit and control work and they do not have in place mechanisms for working with the public to uncover fraud and corruption. The Procurement Control Commission does not report on fraud and corruption in procurement, and neither do the external or internal auditors. Despite being foreseen by the current legislation, there is no system in place for debarment of firms found guilty of procurement fraud. 88. Mauritania is currently ranked 112 out of 168 countries (29th percentile) on Transparency International’s Corruption Perceptions index. Mauritania’s score on the control of corruption indicator of the Worldwide Governance Indicators (WGI) set dropped from 45 th to 18th percentile between 2004 and 2014, which is a considerable deterioration from 2004 when Mauritania scored above lower middle income countries and the SSA average whereas today it is below both. The 2016 Global Competitiveness Index identifies Corruption as the third most problematic factor for doing business in Mauritania, after access to financing and poor infrastructure.
49
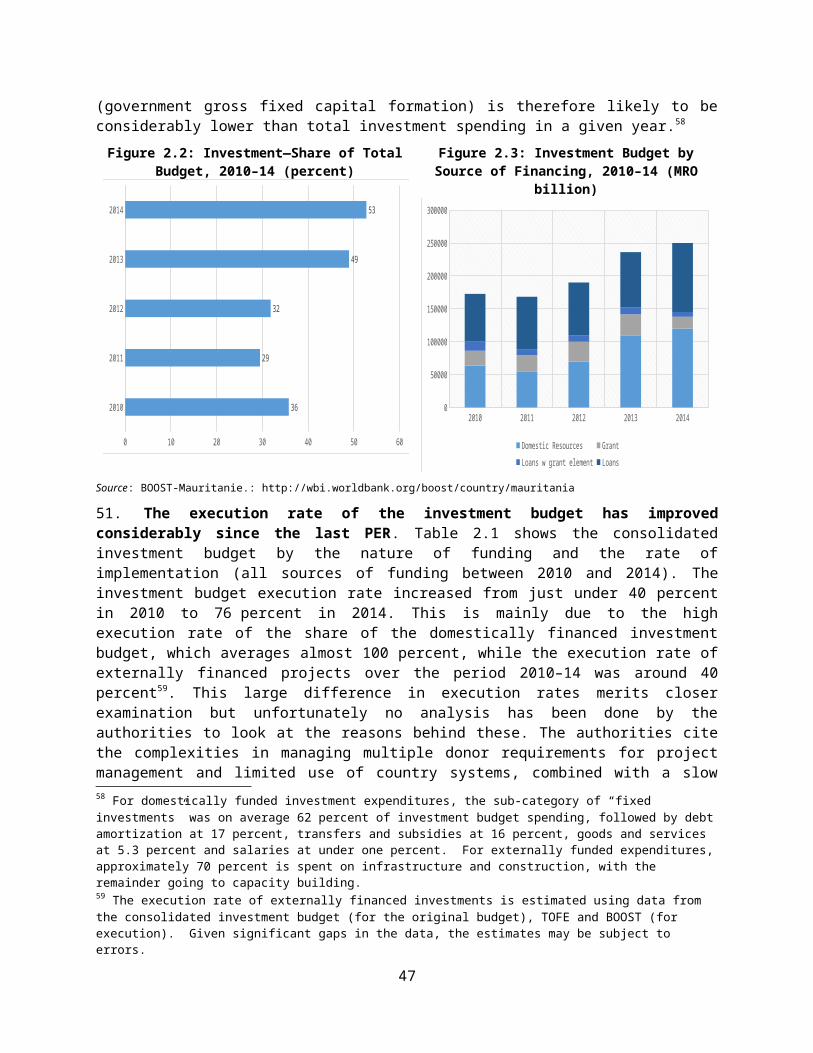
Figure 2.11: Mauritania Corruption Ratings in WGI and Global Competitiveness Index
Sources: World Bank (2016), Global Economic Forum (2016)
89. The authorities have recently passed a new Anti-Corruption Law in Parliament (February 2016) and it is currently awaiting promulgation. The new law aims to; (i) put in place measures to criminalize and penalize corruption in all its forms (ii) facilitate and support international cooperation and technical assistance for the fight against corruption, and (iii) facilitate the recovery of ill-gotten assets. While no single legislation was in place prior to this law, the legal basis for an effective fight against corruption was already in place through other pieces of legislation (Procurement Code, Penal Code) and Mauritanian’s ratification of international legal instruments (Africa Union Convention Against Corruption, UN Conventions Against Corruption). In addition, the Fisheries Transparency Initiative (FITI), an international initiative launched by the Mauritanian government and Transparency International aims to bring greater transparency to fisheries licenses. But the new law and other transparency standards will only have an impact on corruption if they are effectively implemented, and this is the major area of weakness in Mauritania.
50
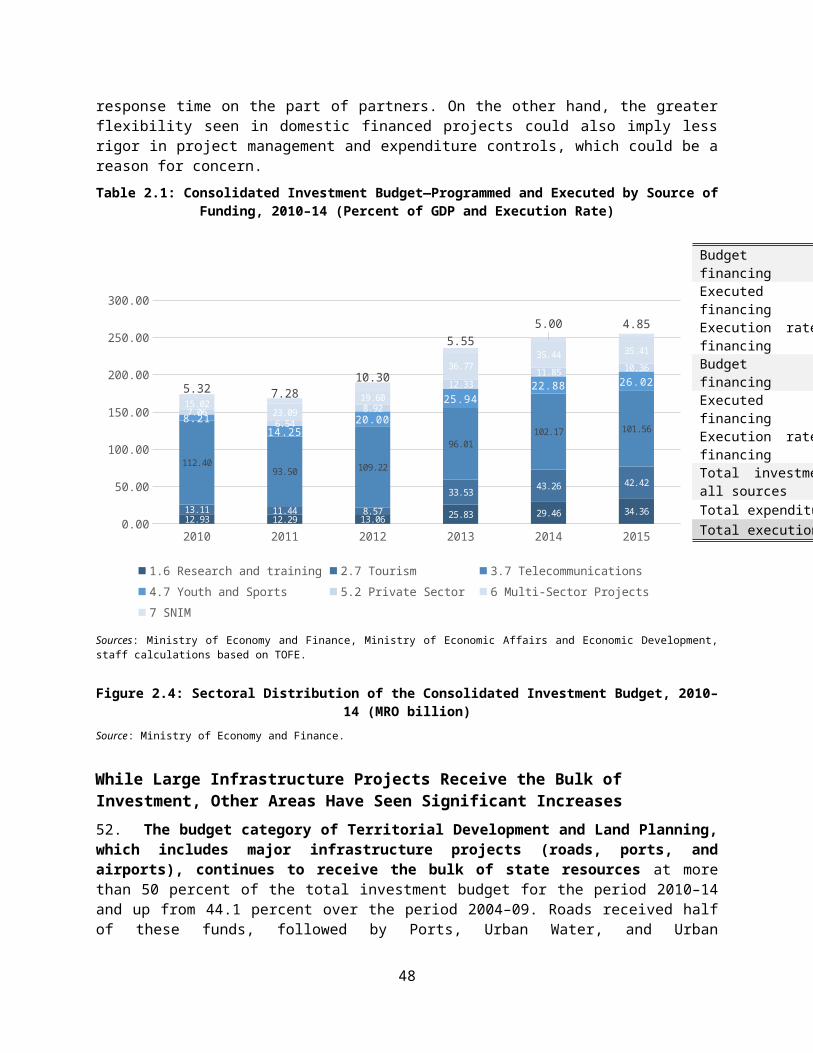
90. A genuine effort to combat corruption will require a willingness of the judicial authorities to proactively seek to uncover and aggressively handle cases of corruption and fraud and for the authorities to improve their communication with the citizens and the media. The general lack of transparency in public affairs contributes to speculation around the motives of certain government decisions. Promoting a culture of openness and transparency can be a dissuasive factor for public sector personnel who would otherwise be tempted to engage in corrupt practices and it can also help prevent unwarranted suspicions around government actions.
Despite Increased Public Investments, their Quality and Economic Impact Remain Uncertain
91. Investment in infrastructure can have a positive effect on a country’s economy. Evidence shows that insufficient physical infrastructure is a drag on productivity growth for LICs. This is especially important for the agriculture, manufacturing, and education sectors, in order to ensure economic diversification and a reduced reliance on extractives-driven growth as well as for social returns in the form of poverty reduction. But there are downside risks if public investments do not yield the expected economic returns. Mauritania’s fiscal expansion is based on an assumption that expanded public investment will boost economic activity and thereby deliver increased revenues needed to meet future loan repayments. However, this requires investment in viable projects with good returns and an efficient system to manage the investments during and after construction. There is some evidence that public
51
Box 2.2: Recent Corruption Cases in Mauritania
The two most recent corruption cases in Mauritania have both been initiated by foreign governments:
The Canadian mining giant Kinross’ Mauritania operation is currently under investigation by the US authorities in relation to a 50 USD million transport and logistics contract awarded to a French company in partnership with a Mauritanian company owned by a former high ranking government official. Internal documents showed that the determining factor for the winning bid seems to have been “political advantages” rather than price, and that it was the “stated preference of the authorities” (Globe and Mail 2016). The investigation was prompted by a whistleblower.
In a case prosecuted by the UKs Serious Fraud Office (SFO) a UK company (Smith and Ouzman) was convicted of bribing an official in the ministry of the interior in connection with a contract for the purchase of printed elections material (Corruption Watch 2016). Mauritanian authorities were slow in collaborating with the UK authorities and the official remained in service long after the case was concluded in the UK (December 2014). In March 2016 the authorities finally took action and charged the official with bribery, misappropriation of state property and breach of trust. The official is currently awaiting sentencing. In the UK, the company senior management were given jail sentences and the company was ordered to pay 2.2 Mn pounds (3.1 Million) in fines and damages. A small part of these funds will be transferred back to Mauritania..
There have been several other allegations circulating in the local Mauritanian media related to possible public sector fraud and corruption, such as the award of a 25 year fishing license to the Chinese company Poly Hongdong with several exceptions to national legislation, and to the transfer of large tracts of arable land in Dar el Barka to a Saudi Arabian company in exchange for unknown services to GoM, amongst others, but very few such allegations are followed up on and investigated and prosecuted by the relevant authorities. A notable exception is the 2014 case of theft or around 4 bn MRO (US$ 13 million) for which five accountants in the regional Treasury offices were jailed. The internal audit function of the treasury was subsequently strengthened.
investment’s contribution to economic growth has been low in recent years in spite of the increase in investment spending. 92. Despite rapidly growing public investment expenditures in recent years, which are high by regional standards, economic growth has been in line with the Sub-Saharan Africa average and progress on social indicators has been limited. This calls into question the efficiency of public investments in Mauritania. The incremental capital to output ratio (ICOR) for Mauritania is 10.4, indicating low productivity of capital,65 and therefore a low level of efficiency of public investments. Total factor productivity (TFP) has contributed negatively to growth in the 2000s at -1.8 percent, compared to a positive impact of +1.7 percent on average for LICs (IMF 2015). The quality of Mauritanian infrastructure is low. It scores above its peers on electricity supply, but below other low-income countries (LICs) on roads, ports and air transport infrastructure (Figure 2.9). The quality of other infrastructure, such as rural/agricultural and social infrastructure is unknown.
Figure 2.12: Infrastructure Quality Index
Overall infrastructure
Roads
PortsAir Transport
Electricity
0
2
4
Mauritania Sub-Saharan AfricaLow income Lower middle income
Source: Fraser Institute 2015.
93. Getting a higher return on its public investments will become increasingly important for Mauritania in the medium term given the shrinking fiscal space brought about by lower commodity prices—combined with a high and growing debt to GDP ratio. This, again, will require major improvements to its public investment management systems, whose significant weaknesses have been outlined above. Weak PIM systems can reduce the economic and social impact of public investment. The IMF estimates that weak PIM systems reduces the value of public investments by 30 percent on average, and that strengthening PIM systems can help close two thirds of that efficiency gap. 94. In addition to strengthening its PIM system, the authorities also need to consider its broader investment strategy, since it can also determine the social and economic impacts of its public investments. Unfortunately, the analysis tools at the government’s disposal to weigh up the costs and benefits of different investment strategies are either too general or specific. While debt sustainability analyses (DSAs)66 are frequently useful in estimating overall resource limits, they are unable to provide a picture of the overall impact on the economy. Similar tools are only able to provide broad assumptions
65 A higher number indicates lower productivity of capital. The Africa regional average is 3.
52

about future GDP growth rates, inflation, exports, and fiscal revenues. On the other hand, computable general equilibrium (CGE) models provide a more systematic approach. They can be used to assess the impacts of large public investment projects on increased demand for services—agriculture, construction, services, transport, manufacturing—and the supply-side effects of increased productivity in sectors that benefit from the completed project. However, there are a number of problems with CGE models. Producing a model requires considerable resources and can be very complicated. Such models are often too general to be of use in estimating the impact of specific projects or programs. Moreover, their complex nature often prevents others from being able to successfully apply them to key issues. 95. The following paragraphs summarize the results of a study commissioned by the government of Mauritania to estimate the impact of its PIP on key macroeconomic variables, such as exports, imports, GDP, fiscal balance, debt, and net domestic assets. The model used assesses the increase in demand that occurs as a result of public investment program and the boost to supply generated by its completion. It also estimates the impact on real prices, revealing any potential “Dutch disease” effects caused by additional demand that cannot be fully met by a corresponding supply response. Over the past five years, the PIP has significantly grown in value, buoyed by increased tax revenues, donor flows, non-tax revenues (particularly iron ore) and fishing proceeds. By 2014 the PIP constituted around 14 percent of GDP. However, analysis on its impact on the economy has been limited. 96. The model draws on IMF data to derive Mauritania’s monetary, national, fiscal and balance of payments accounts. A number of steps were applied to construct the model. The first step was to project the accounts forward to 2050 using conservative assumptions and reflecting historical long-term trends where possible.67 Second, baseline accounts were derived after removing the PIP and its expected impact from the macroeconomic accounts for 2014–50. Third, assumptions were made on the likely flows of PIP funds and their impact on the economy (demand effects), and the expected benefits accruing (see Annex A3 for a detailed description of the methodology and assumptions).
Baseline scenario:
97. The total cost of the PIP is estimated at around MRO 615 billion (US$ 2.1 billion) over 2014-16, which is around 11-14 percent of GDP per annum. Implementation of the PIP will increase aggregate demand during 2014–16, particularly for the key sectors of transportation, construction, services, manufacturing, and agriculture.68 However, domestic demand effects are expected to be significantly reduced, because a significant proportion of PIP resources are assumed to be spent on imports of labor and capital. Moreover, price effects are expected to be significant, while supply effects will be small due to the limited time period. After the PIP implementation period it is expected to generate a 6 percent return in terms of increased GDP. This will result in increased exports, investment, taxes, and consumption.98. The PIP will have a modest effect on the GDP deflator, due to a reasonable proportion of the PIP being spent on imports. Nevertheless, it will have significant price effects in key sectors. Figure 2.10 below shows that the impact of the PIP is particularly pronounced for the construction sector, which witnesses as sharp increase in the GDP deflator in 2014, before gradually returning to trend after 2016. This is in part due to the completed program’s impact on economic productivity, and the increase in supply prompted by additional demand during its construction. As Figure 2.10 illustrates, the model estimates that the impact of implementing the PIP will slightly raise GDP between 2014 and 2016. During this phase, the most significant increases in supply are projected to occur in the construction and
66 A DSA typically assesses the impact of different economic policies on key macroeconomic variables, such as the debt-to-GDP ratio or the debt-service-to-exports ratio over a given time horizon to ascertain the sustainability of debt.67 For example, some line items are assumed to have stagnant growth. For example, projections for donor financing are based on existing trends, with the assumption of no new investment.68 Note, for simplicity other sectors were assumed to not be affected by the PIP.
53
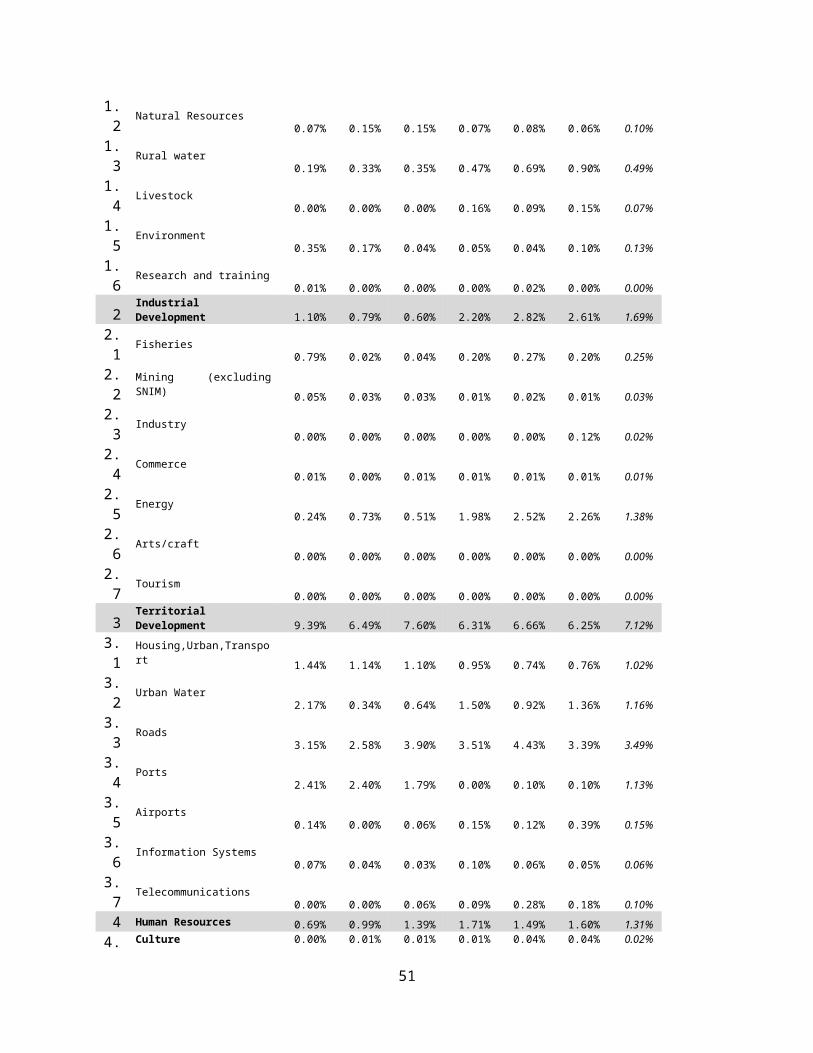
agricultural sectors. Once the PIP has been implemented, it is estimated it will raise the level of real GDP by 3.2 percent in 2019, causing an upward shift in the trend path of real GDP. It should be noted that the model does not consider multiplier effects resulting from the benefits accruing from the PIP, which would likely increase the PIP’s estimated rate of return and lessen its impact on debt sustainability. 99. The PIP will have a short-term impact on imports and a longer-term impact on exports . As Figure 2.10 shows, imports are estimated to rise by around 12 percent during the program’s construction phase. The PIP is expected to permanently increase exports by around 2.4 percent in 2019.
Figure 2.13: Comparison of the PIP and the Baseline Scenario Across Key Macroeconomic Variables
500
600
700
800
900
1000
2014 2015 2016 2017 2018 2019 2020 2021 2022 2023
Effect on exports (UM Bn)
Exports without program Exports with program
160
180
200
220
240
260
280
300
2014 2015 2016 2017 2018 2019 2020 2021 2022 2023
Effect on GDP deflator
GDP deflator without program GDP deflator with programConst. sector without program Const. sector with program
800
1000
1200
1400
1600
2014 2015 2016 2017 2018 2019 2020 2021 2022 2023
Effect on GDP (UM Bn)
Real GDP without program Real GDP with program
400
600
800
1000
1200
2014 2015 2016 2017 2018 2019 2020 2021 2022 2023
Effect on imports (UM Bn)
Imports without program Imports with program
100. Finally, the impact of the PIP on the fiscal situation is considerable. The implementation of the PIP entails considerable fiscal costs, and while some of these are covered by revenues and grants, a sizeable proportion are covered by borrowing. The PIP is estimated to change a fiscal surplus of 13 percent of GDP under the baseline scenario to a fiscal deficit of 1.1 percent with the PIP. 69 The cost of servicing the loans used to finance the PIP means the higher costs will continue after the program is completed, but given the largely concessional nature of the debt, this is more than offset by additional tax revenues generated by increased production. The debt profile is outlined in Figure 2.11. The initial impact of the PIP in 2014–16 is to keep debt levels roughly constant. Under the baseline scenario the resultant fiscal surplus from not implementing the PIP means the government becomes a net creditor, peaking at around 5 percent of GDP. However, there is a resultant linear increase in debt under this scenario over the period with debt reaching parity with the debt profile under the PIP.
69 Please note, while the baseline assumption that the money not spent on the PIP is saved may seem unrealistic, this for the purposes of the counterfactual. Further assumptions such as assuming a commensurate fall in tax revenues to offset the fall in public expenditure would lead to further effects on the economy.
54

Figure 2.14: Impact of the PIP on Public Debt
-15-10
-505
1015202530
2014 2019 2024 2029 2034 2039 2044 2049
Effect on debt (in percent of GDP)
Public debt with program domestic debt with program foreign debt with program
Public debt without program domestic debt without program foreign debt without program
Calculating the Internal Rate of Return
101. To ascertain whether the impact of the program represents a worthwhile financial return for the government and the economy, the model estimates three internal rates of return (Table 2.6; see Annex A3 for further details).70
First, the financial internal rate of return (FIRR) calculates the interest rate from the flow of costs from the PIP (including debt flows) minus the revenues it will generate. The model estimates the PIP to have an FIRR of around 6 percent. This is a strong effect, but reflects the largely concessional nature of the debt, and the impact on tax revenues.
Second, the model calculates the economic internal rate of return (EIRR) by comparing the project costs in the year they are incurred and the stream of interest costs with estimated GDP effects. The estimated return of 15 percent is in line with what one should expect from a commercial program.
Third, the economy-wide internal rate of return (EWRR) also includes private investment costs (suppliers’ investment costs during the implementation of the PIP) as well as project costs and benefits. This shows a return of around 12 percent, which in light of additional private investment costs is in line with expectations. In conclusion, given the assumption of reasonable financing of the PIP through concessional loans, combined with a modest positive impact of the PIP on fiscal revenues, the PIP represents a strong FIRR. Similarly, the EWRR of 14 percent demonstrates that there are strong economic benefits to implementing the PIP.
Estimating the Macroeconomic Impact of the PIP Under Different Scenarios
102. The model estimates the macroeconomic impact of the PIP under six different scenarios, outlined in the following paragraphs and summarized in table 2.6 below. See Annex 3 for a more complete description of the methodology, assumptions and results.
Table 2.6: Key assumptions and selected results of PIP implementation (in percent of GDP unless otherwise indicated)
70 To work out internal rates of return, costs and benefits are forecasted forward and the interest rate is calculated for the net present value to be zero.
55
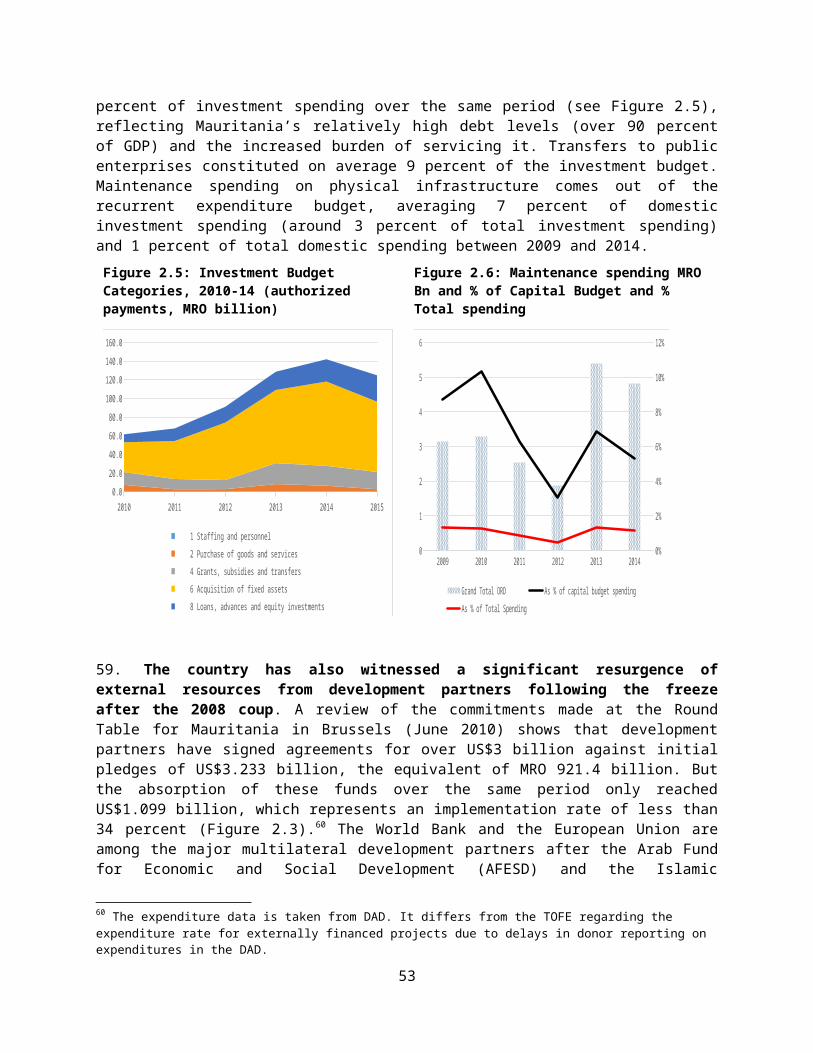
Scenario Description Assumptions ResultsReturn on PIP Allocation of PIP Loans finance PIP Invest. Additional
Internal rate of return
Intl.Domestic Concess.
Commerc.
Effectiveness GDP Financial
Economic
Baseline 6.00 45.00 55.00 80.00 20.00 100.00 3.20 6.00 14.00
Scenario 1PIP domestic allocation 6.00 20.00 80.00 80.00 20.00 100.00 3.70 7.00 17.00
Scenario 2 Expensive financing 6.00 45.00 55.00 8.00 92.00 100.00 3.20 5.00 11.00
Scenario 3 Lower return 2.00 45.00 55.00 80.00 20.00 100.00 1.10 0 4.00
Scenario 4 High imports 6.00 90.00 10.00 80.00 20.00 100.00 3.20 5.00 12.00
Scenario 5aSlightly expanded PIP 6.00 45.00 55.00 80.00 20.00 100.00 3.20 6.00 14.00
Scenario 5bSlightly expanded PIP 2.00 45.00 55.00 80.00 20.00 100.00 1.10 0 4.00
Scenario 6 Inefficient PIP 6.00 45.00 55.00 80.00 20.00 80.00 2.50 9.00 11.00
Source: Ministry of Economy and Finance
Scenario 1: Larger Proportion of the PIP is Implemented by Domestic Labor
103. Scenario 1 assumes a large proportion of the PIP is implemented by domestic labor. This is likely to be the case in relatively non-capital intensive infrastructure programs, such as road building or where there is a large increase in public-sector costs due to higher wages and/or increased hiring of public-sector workers. The result of substituting domestic labor and capital for imported capital increases the marginal propensity to consume, increasing domestic demand for goods and services during implementation, resulting in significant price increases rather than supply increases. Therefore, the impact of the PIP during its implementation period is modest. The impact on the GDP deflator and construction sector GDP deflator is now greater. Moreover, there is a noticeable impact on imports, which shrink compared to the original scenario. Finally, rising demand only leads to minor effects by increasing tax revenue during implementation. As a result, this does not affect the IRRs or the debt dynamics.
Scenario 2: Financing Terms Closer to Market Rates
104. The second scenario explores the impact of the PIP on macroeconomic variables if its financing terms were to become less advantageous, which is likely to happen as Mauritania becomes wealthier and the financing mix becomes more reliant on financing at market prices. Even under adverse loan terms the effect on debt financing is not severe enough to prompt the government to increase taxes or reduce spending (in the short to medium term), and as a result its impact on most macroeconomic variables would be negligible. However, the more expensive debt would push up debt servicing significantly at the start but would reach lower levels by the end of 2050. The IRRs are estimated to be significantly affected. In particular, the significant increase in financing costs results in the FIRR becoming negative (-5). Public programs which rely on significant commercial financing require a significant revenue-raising component or the imposition of user fees if they are to be financially viable for governments. Social returns may still justify the investment.
Scenario 3: A Smaller Return to the PIP (2 percent)
105. The original scenario assumes a return of around 6 percent in terms of the benefits of additional GDP accruing to the PIP. However, it is possible that a number of key projects may not achieve desired returns due to poor planning, management, implementation and maintenance. In such a scenario,
56
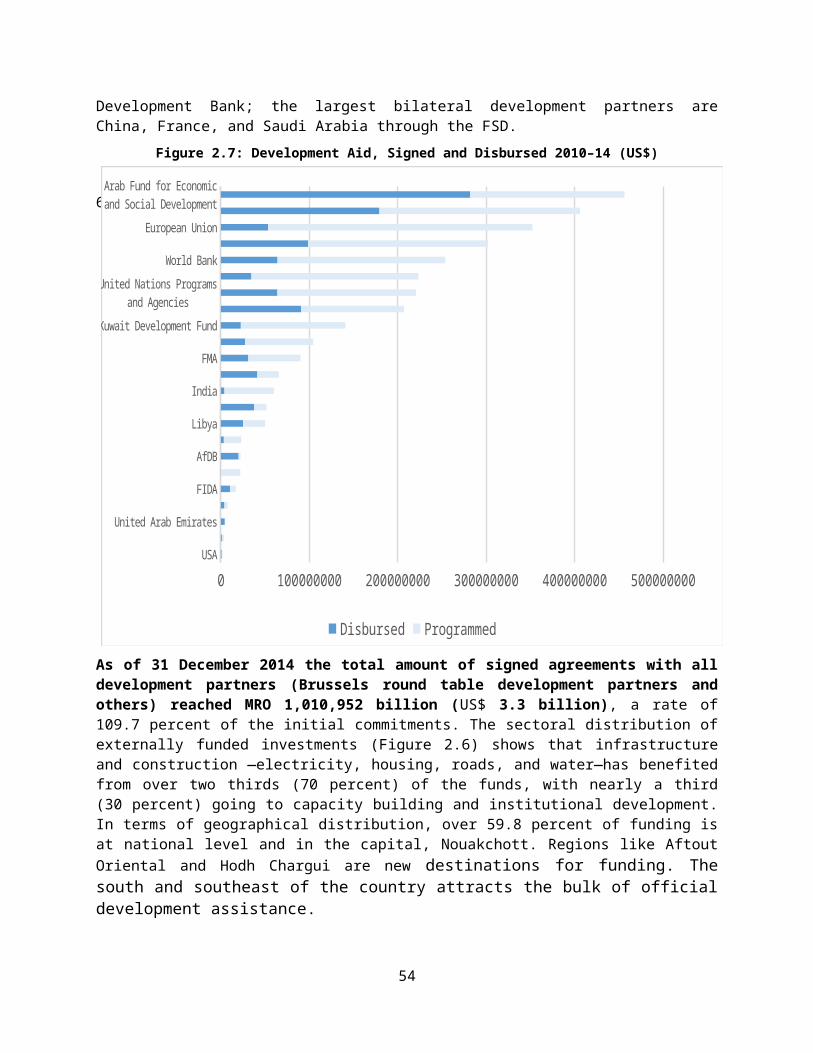
where there is systematic underperformance of the PIP the return is likely to be small. Scenario 3 looks at the impact of a 2 percent return on the PIP on the macroeconomic variables. This has a significant impact on exports and GDP. The impact of the PIP is negligible, registering only a miniscule effect. The impact of a lower return to the PIP is to reduce tax revenues thereby increasing financing requirements. Finally, the IRRs are substantially affected by the assumed lower return to the PIP. The FIRR registers a negative interest rate principally due to lower tax revenues. Meanwhile, the EWRR and EIRR are substantially reduced (both 4 percent). Nevertheless, even in this scenario the returns to the economic internal rate of return suggest there is a modest case for financing the PIP, particularly if there is a significant social dimension that will accrue benefits over a long period or that are difficult to quantify.
Scenario 4: High imports
106. Under some circumstances highly sophisticated, technical infrastructure programs may require significant imports of international labor and capital71. In such examples, the resource flows to the domestic economy are significantly smaller. By lowering demand effects, the GDP deflator would be less pronounced over the implementation period of the PIP. Moreover, the effect on additional GDP over the period is negligible. Conversely, the impact on imports is significant. In this type of scenario therefore implementation of the PIP imposes balance of payments as well as fiscal pressures. Lastly, the impact on the IRRs is significant. While the impact on the FIRR is small, the significant impact on GDP during the implementation period lowers the EWRR and EIRR. This issue reinforces the view that investment programs that do not rely on domestic labor and capital significantly reduce the benefits to countries. Indeed, many countries have imposed regulations, provided financial incentives or provided support programs to encourage investment to maximize the use of local resources, particularly, Japan, South Korea, Malaysia. Conversely, research on SSA has noted that where investment is not integrated within the economy it will have limited impact on the development of the economy.
Scenario 5a: Slightly expanded PIP with a normal return
107. Scenario 5a assumes a slight expansion of the PIP in 2016 from around UM 187 billion to nearly UM 196 billion. As figure 8 demonstrates, the impact on the macroeconomic variables is minor and not noticeable. Nevertheless, there is a long-run impact due to the slightly elevated resources from the PIP, which more than offsets the costs of financing assumed to be largely concessional. In fact, the EWRR increases from 12 to 13 percent.
Scenario 5b: Slightly expanded PIP in 2016 with a low return
108. Scenario 5b similarly assumes a slight expansion of the PIP in 2016, but a fall in the PIP’s return to around 2 percent. As table 9 demonstrates there is very little difference with the impact on the macroeconomic variables compared to scenario 3. Similarly, the internal rates of return are identical to those depicted in scenario 3.
Scenario 6: Inefficient Implementation of the PIP
109. Finally, we consider a scenario where planning and management of the PIP is sub-optimal. Inefficiencies could be due to delays in implementation, costs overruns, and wastage due to corruption. These inefficiencies are assumed to lower the effectiveness of the investment by around 20 percent. As the table illustrates, if investments are inefficient then the PIP ceases to be financially viable, with a return of -9 percent. All other things being equal, this would adversely affect the fiscal accounts. Similarly, the EWRR and EIRR are noticeably affected. The impact on GDP and exports are slightly reduced.
71 Examples include the planned railway infrastructure program in Laos and the new port in the Maldives.
57
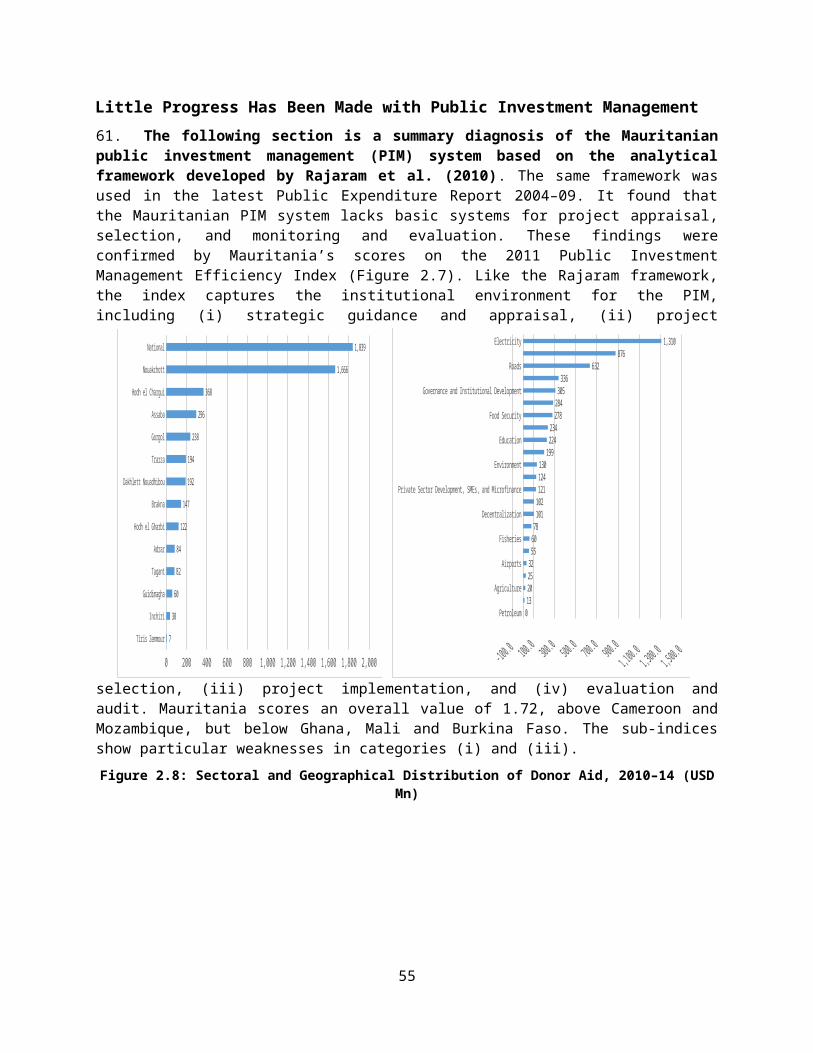
110. Applying the model to Mauritania and assessing the macroeconomic effects of public investments highlights the importance of having a clear public investment strategy and ensuring efficient PIM. First, the immediate effects of a public investment program will vary depending on the investment strategy but are generally very positive. Not only do they increase GDP during implementation, but they also enable linkages to be developed with international labor and capital, allowing the diffusion of skills and knowledge. Moreover, the impact of the GDP deflator was manageable despite assuming most of the demand would initially result in higher prices. Second, the financially viability of the PIP is dependent on assuming only a small proportion of financing is on market terms. If in future a significant proportion had to be financed on market terms, perhaps due to a reduction in donor financing, then elements of the program would need to focus on revenue generation or user fees if the program as a whole were to be financially sustainable. Costly short-term financing mechanisms may significantly increase debt service payments during the implementation of a program even if it is expected to generate significant long-term benefits. Third, the analysis is dependent on assumptions of a modest return to the PIP (6 percent). Given the under-investment in the country this remains a conservative, robust assumption. However, as shown in Scenario 4, poor project management leading to time and cost overruns or non-viable investments could reduce potential returns to zero, making it financially non-viable. The fiscal accounts and debt sustainability would also be adversely affected.
Key Areas for Reform
Improve investment budget and project data. In order to permit the assessment of the allocative and execution efficiency of the public investment program, the availability of investment budget data must be urgently improved. The first priority should be to make it possible to track the execution of investment projects outlined in the CIB. Currently, the national systems and tools (RACHAD, TOFE) only track budget execution by institution or by economic categories, and by funding source. This could be complemented by introducing a project category as well. It is also important to ensure timely and complete information on the physical and operational progress of investment projects. The authorities could consider a database which tracks the entire cycle of each significant investment project
Develop a clear strategy for public investment based on a better understanding of the economic and social impacts and its financial viability in the longer term. Also, ensure that investments are better aligned with its strategic priorities. Update and refine sectoral strategies and MTEFs and ensure coherence between these, the PIP, and annual investment budget proposals.
Improve investment project preparation and preliminary appraisal. First, develop clear guidelines (i.e. handbooks) and criteria for project development and disseminate these to budget units, along with training on the use of these methodologies for personnel involved in investment project preparation. Second, align project preparation and screening with the budget process. Only include investment projects that have been screened and which satisfy minimum established criteria. Finally, evaluate operational and maintenance expenses and include these in MTEFs and in the national recurrent budget
Clarify roles and consider independent reviews. Create inter-ministerial committees to examine and evaluate proposals at the preliminary and screening stages, and consider the establishment of an independent mechanism to review proposals before inclusion into the CIB.
Monitor and support project implementation. Formalize the reporting requirements of execution agencies to the Ministry of Economy and Finance for all projects and produce regular reports on physical and financial execution (quarterly or bi-annually). Introduce a risk
58
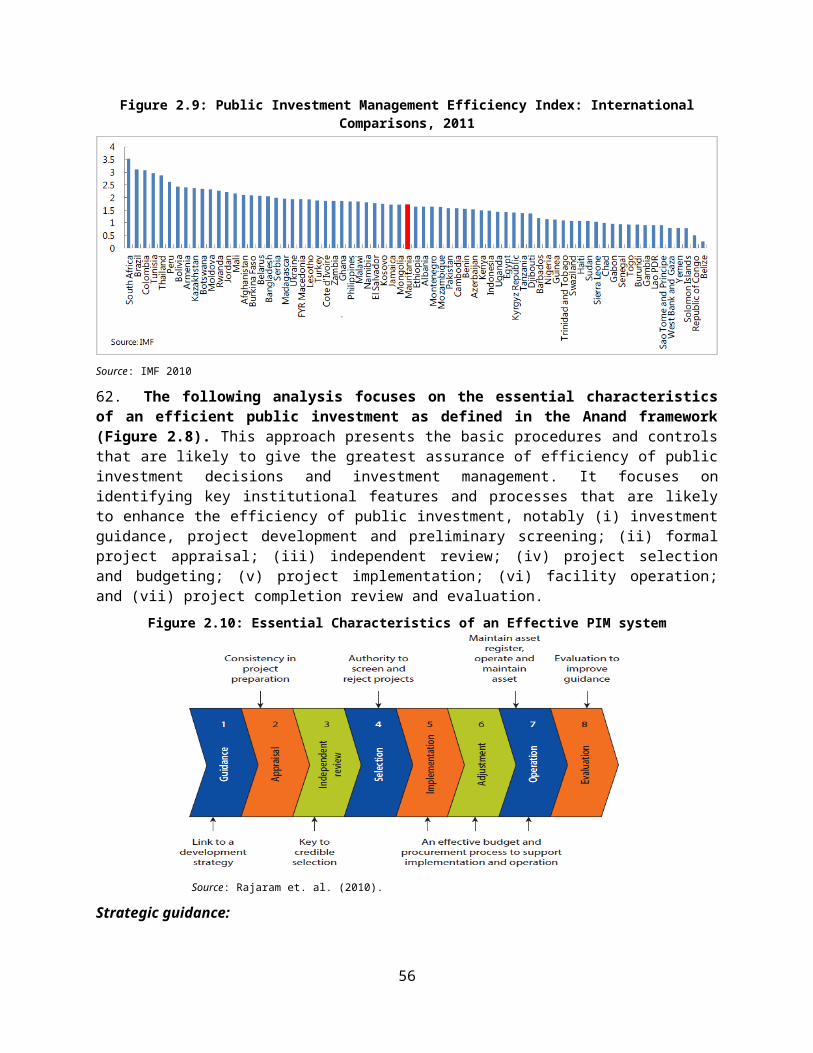
management system to identify time and cost overruns, etc. Establish a multi-sectoral committee to review investment progress reports and propose actions, including project revision where necessary. Adopt a system to account for public assets (physical tracking and values, including depreciation).
Improve the procurement process. The focus now needs to be on (i) consolidating the public procurement code and adopting a comprehensive set of implementing regulations and standard documents, (ii) increasing the efficiency and transparency of new independent procurement bodies, (iii) developing the capacity of public and private stakeholders at the operational level, and (iv) installing control and surveillance mechanisms to measure quality and ensure system integrity.
59
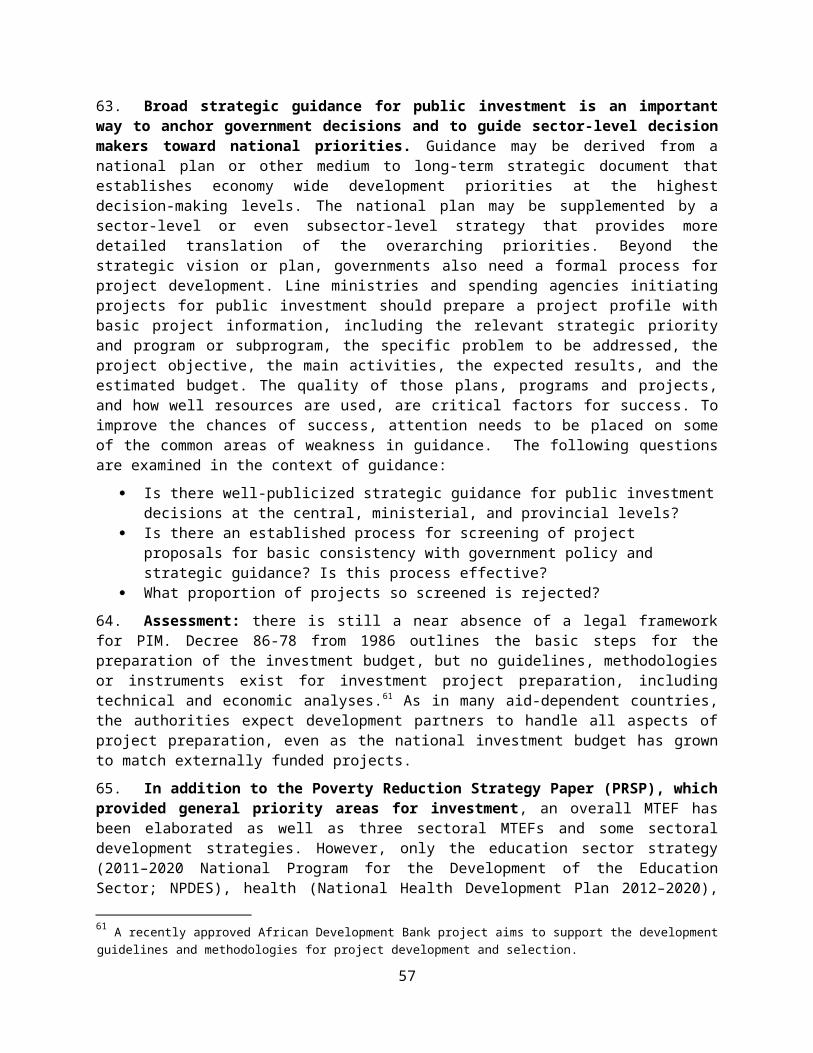
Chapter 3: Use of Resources in the Education Sector72
Despite Some Progress, Mauritania is Not on Track to Meet its Educational Goals
111. Mauritania has made good progress on education since 2010. The government’s updated Education Sector Development Program (ESDP II 2010–2020) focuses on (i) achieving the education-related Millennium Development Goals (MDGs), (ii) pursuing education system reforms, and (iii) improving the relevance and quality of post-primary education. The education sector has seen some progress over the past years, particularly in making advances in reaching the MDG goal on gender equality. Net enrollment rates have also improved for all age groups between 2008 and 2014 with no exceptions. Another achievement is the improved enrollment at the pre-primary level. Pre-school attendance increased from 5 percent in 2008 to 12 percent in 2014. 73 Although this is still low by regional standards (the Sub-Saharan Africa average is 20 percent), it still contributes to greater educational attainment. The primary completion improved significantly between 2008 and 2014 from 59 to 72 percent (Figure 3.2), above the average for Sub-Saharan Africa but below the government’s target of 78 percent (Figure 3.4).
Figure 3.1: Gross and Net Enrollment, Primary and Secondary (percent)
Figure 3.2: Primary Completion Rate, 2009–14 (percent)
Gross (girls) Gross(boys) Net (girls) Net (boys) Gross (girls) Gross(boys) Net (girls) Net (boys)Primary Seconary
0
10
20
30
40
50
60
70
80
90
2008 2009/10 2010/11 2011/12 2012/13 2013/14 2012 (SSA) 2015 (MTEF target)
0
10
20
30
40
50
60
70
80
90
59
7266.8
78
Source: Republic of Mauritania 2014; MoE 2011 Source: Republic of Mauritania 2015.
72 The school system in Mauritania includes six years of primary school, followed by four years of lower secondary education and three years of upper secondary education. 73 The figures would be even higher if they included the Islamic schools, mahadras. In Mauritania, mahadras provide religious education with the objective of teaching young students and adults the basic concepts of Islam and religious beliefs, in Arabic. Mahadras constitute a separate informal education system catering for children aged 4 to 18 as well as adults. They constitute an important social safety net by taking in students that have dropped out or left the public education system due to its poor performance. In 2010, a study showed that out of 6,489 religious schools, 585 are mahadras and 3,219 are Quranic schools while the remaining 2,684 did not fulfill the criteria of either a mahadra or Quranic school. The majority of the mahadras (66 percent) are in urban areas but more than half do not have a location, and only one-third have access to energy, toilet facilities and domestic taps. Most of the 68 classrooms for literacy schooling are in two regions, Nouakchott and Trarza. About 21,707 students attended mahadras in 2010 of which almost half (47 percent) have attended both the public and the religious school system. (Ministere des Affaires Islamiques et de l’Enseignement Originel 2010).
60
112. Despite this progress the Mauritanian education system faces challenges related to quality and inclusion. The EPCV survey shows that literacy in age 10-20 y.o. has actually declined from 83.9 percent to 83.2 percent for males while it increased from 77.6 to 79.9 percent for females between 2008 and 2014. Almost two-thirds of children aged six to 11 years old from the poorest 20 percent of the population were not in school. These students either attend the Islamic schools, mahadras, which are not regulated and lack a basic school curriculum, or are absent altogether. Parents cite financial constraints or the low quality of education as reasons for keeping children out of school.113. Challenges related to low quality and efficiency in education remain that may weigh negatively on performance in the years ahead. Mauritania’s educational performance is lagging behind other Sub-Saharan Africa countries in some key areas. Both the net enrollment rate and the lower secondary completion rate are below average for the region, suggesting internal inefficiencies in the education system (Figures 3.3 and 3.4). Only 40 percent of children of the relevant age are enrolled in school and 40 percent of students drop out of school before completing five years. For every 100 students entering primary education, only 34 enter lower secondary and only 12 enter upper secondary. School quality at primary and secondary level suffers from overcrowding, in particular in urban areas, and a shortage of qualified teachers. Learning outcomes across all educational levels are low, although primary education is particularly affected, owing to students dropping out early and inadequate learning conditions (UNICEF 2014). Standardized tests in math, French, and Arabic in primary schools have shown that students’ learning achievements are not only low but have also deteriorated over the past 15 years—with the exception of some improvements in Arabic since 2011 (MAED 2015; IPN 2014).
Figure 3.3: International Comparison of Primary Net Enrollment Rates, 2013
Figure 3.4: International Comparison of Lower Secondary Completion Rates, 2012
MaliNiger
Burkina FasoMauritania
SSA
Tanzania ChadGhana
RwandaMorocco Tunisia
0
20
40
60
80
100
120
As a %
NigerChad
Malawi
Burkina Faso
Mauritania
Rwanda
Madagascar
Cote D'Ivoire Senegal SSA
TanzaniaCongo
Sierra Leone
MoroccoGhana
Algeria
0
20
40
60
80
100
120
% of
releva
nt ag
e grou
p
Source: World Development Indicators 2012 (database), World Bank, Washington, DC, http://data.worldbank.org/data-catalog/world-development-indicators.
Source: World Development Indicators 2012 (database), World Bank, Washington, DC, http://data.worldbank.org/data-catalog/world-development-indicators.
114. Lower levels of educational attainment lead to a less skilled and less productive workforce. There are several underlying causes for Mauritania’s low educational attainment. First, there is a shortage of qualified teachers due to a mix of deficiencies on demand and supply side: a limited pool of adequate candidates with good levels of French, the focus on language skills rather than relevant teaching skills by national training institutes, and training institutes’ limited management capacity and resources hindering improvements to the training curriculum. Second, there have been frequent and
61

unplanned changes between French-based and Arabic-based curricula and educational policies. Third, the government’s lack of a functional information management system (on the distribution of teachers across the school system, enrollment of students, educational attainment data, etc.), has hindered its ability to effectively manage the sector. The low quality of education has led to a skills mismatch and to low worker productivity. The 2014 Investment Climate Survey (ICS) reported that low worker skills resulting from poor education quality were a major constraint for 6 percent of Mauritania’s firms, twice the Sub-Saharan Africa average (World Bank 2014a). Many workers have limited or no education while very few firms provide formal training for their employees (World Bank 2014b).
Although Spending Has Risen it is Still Low, Except for Primary Education
115. Budgetary allocations increased gradually between 2010 and 2014, but remain below both the sector’s needs and international commitments. The government’s review and preparation of a second ESDP (2011–2020) provided an opportunity to tackle the challenges in the sector and fund the areas most in need. A review of the government’s budget allocation to education over the period 2010–14 shows an upward trend in real terms on average by 10 percent, representing 14 percent of the total budget (or US$188 million) in 2014 (Figure 3.7). This increase has also translated into an increase in spending per student, though in 2011 and 2014 per-student spending fell, suggesting education spending has not always kept pace with the growth in the school-age population. Education spending fell slightly as a share of the government budget, from 15 percent in 2010 to 14 percent in 2014. As such, Mauritania did not reach the target of 20 percent set in the 2011–2015 Medium Term Expenditure Framework (MTEF), which constituted an indicative benchmark of the Fast Track Initiative.74 Examining the sector’s public investment program (PIP) for 2012 and 2014, only one-fifth of the interventions to meet the needs identified in the ESDP have been funded.
Figure 3.5: Budget allocations to education and spending per student, 2010–14 Source: Ministry of Education.
116. Mauritania’s total spending on education is low by regional standards while at the primary level it is high but less effective. As Figure 3.8 shows, as a share of GDP, Mauritania spends less than many low-income countries such as Burundi, Togo and Niger. However, its spending per primary student is among the highest of the low or lower-middle-income countries. Despite this, other countries which
74 Note the MTEF target is based on 20 percent of central government recurrent expenditures (not including debt) allocated to education, in 2014, the government devoted 18 percent of its budget to education, just slightly below the target.
62
2010 2011 2012 2013 2014 2012-2014 PIP
2012-2014 (ESDP II Action
plan/PIP)
0
10
20
30
40
50
60
70
42,000
44,000
46,000
48,000
50,000
52,000
54,000
Budgetary allocations to education Per pupil spending (right axis)
in M
RO
bill
ions
in M
RO
(in
con
stan
t pr
ices
)

spend the same or less (Madagascar, Guinea, Burundi, and Sierra Leone) achieve better educational outcomes. This suggests that Mauritania could further improve its outcomes by using its resources more efficiently.
Figure 3.6: International Comparison of Public Education Expenditure, 2012
Figure 3.7: International Comparison of Government Expenditure per Primary Student (US$) and primary
completion rates, 2012
MadagasSie
rra L
Uganda
Cameroon Mali
Burkina F
Mauritania
GambiaNige
r
Rwanda
BeninTogo
SenegalTunisia
Mozamb.
Burundi
Morocco Ghana
Sao Tome
0
1
2
3
4
5
6
7
8
9
10
% of
GDP
Madagascar
BurundiGuinea
Sierra
Leone Nige
rMali Togo
Gambia
Mozambique
Benin
Burkina F
asoRwanda
Mauritania
Cameroon
Cote d"Iv
oireSen
egal
Ghana
0
100
200
300
400
500
600
700
800
900
0
20
40
60
80
100
120
Government expenditure per primary student Primary completion rates (right axis)
in U
S$
relev
ant a
ge gr
oup
Source: World Development Indicators (database), World Bank, Washington, DC, http://data.worldbank.org/data-catalog/world-development-indicators.Note: Low income: Benin, Burkina Faso, Burundi, Gambia, Sierra Leone, Madagascar, Mali, Mozambique, Niger, Rwanda, Togo, Uganda.Lower-middle income: Cameroon, Ghana, Mauritania, Morocco, Sao Tome, Senegal.Upper middle income: Tunisia.
Sources: UNESCO UIS; World Development Indicators (database), World Bank, Washington, DC, http://data.worldbank.org/data-catalog/world-development-indicators.Note: Low income: Benin, Burkina Faso, Burundi, Gambia, Guinea, Madagascar, Mali, Mozambique, Niger, Rwanda, Togo Lower-middle income: Cameroon, Cote d’Ivoire, Ghana, Mauritania, Senegal.
117. The distribution of resources reflects the country’s prioritization of universal primary education but leaves scope for improvements in other educational levels:
Pre-school education has been shown to improve children’s cognitive skills and educational attainments but Mauritania has not made pre-school education a policy priority.
Around half of education spending is in favor of primary education, underpinning the government’s efforts to reach universal primary education (see Figure 3.10). Spending on primary education has increased in real terms by 10 percent but declined as a share of total education spending from a peak of 54 percent in 2011 to 49 percent in 2014. However, Mauritania’s level of spending on primary education remains high compared to the average for Sub-Saharan Africa (44 percent) and East African countries (49 percent).
Spending on secondary and vocational education and training (VET) also increased in real terms between 2010 and 2014 (accounting for 23 percent and 4 percent respectively of total education spending). Skills acquisition is vital for an economy to compete and grow. Skills gaps are widespread in Mauritania but have been neglected by policy makers in the past.
Spending on tertiary education also showed an upward trend and accounted on average for one-fifth of total education spending between 2010 and 2014. Even though it contributes substantially to Mauritania’s effort to develop highly skilled workforce, the quality and relevance of higher education remains a challenge. While tracer studies of university graduates are done only occasionally, job insertion rates are known to be quite low. Education policy has not adequately addressed the shortage of skills in critical areas such as education, health, and government. In addition, the government’s scholarship program, accounting on average 17 percent of total tertiary spending, exacerbates inequity in access to tertiary education as it has
63
no strings attached in terms of academic performance and that it tends to favor students from well-off families.
118. Overall, the government might have more choices and more room for maneuver to reallocate resources across the levels of education than it would appear (see below).
Figure 3.8: Distribution of Education Spending by Level of Education, 2010–14
2010 2011 2012 2013 20140%
10%
20%
30%
40%
50%
60%
70%
80%
90%
100%
49.8 54.0 52.8 51.5 49.2
24.422.2 23.4 23.2 23.5
20.1 20.0 19.6 21.0 21.2
0.4 0.3 0.4 0.4 0.3
Primary Secondary Universities Vocat. Educ & Traing.Preschool Religious education Literarcy
Source: Ministry of Education.
119. Islamic religious education constitutes an important educational social safety net in the country but receives little public funding, is unregulated, and shows some risk of religious radicalization. A very small share of the education budget (on average less than 1 percent) is spent on religious education (the mahadras). These resources are managed by a separate ministry, the Ministry of Islamic Affairs and Religious Education. There is a slight upward trend: for every MRO 100 spent on the public school system in 2014, MRO 9 were spent on the mahadras, compared to MRO 6 in 2011. Even though the budget has remained small over the past years, the separate funding of a parallel education structure that caters to children left behind by a failing public education system raises some questions. These include: (i) the use of public funds to support a separate unregulated education structure whose underfunding has led to similarly poor quality education as the public school system; (ii) the role of the mahadras as a social safety net taking in more and more students that are poor, school drop outs, or generally disappointed by the public system; and (iii) the risk of infiltration by radical teachers, promoting violent extremism, although the majority of mahadras do not propagate violent ideologies (Boukhars 2012).
Children from the Poorest Households Receive the Least Benefit from Education Spending
120. Income exerts a strong influence on the poor’s access to primary and secondary schooling. Almost one-third of the poorest quintile of school-age children are not in school compared with only 2 percent of the richest (see Figure 3.11). A student from the richest quintile is almost four times more likely to complete primary education than one from the lowest quintile. At secondary education level, only 2 percent of the poorest quintile complete secondary school compared with 34 percent of the richest quintile. As a result, children from the poorest households have almost no chance of accessing higher education. In addition, level of education appears to be related to the risk of religious extremism
64
—the lower the level of educational attainment the higher the risk that the student will turn to violent extremism.75
Figure 3.9: Access and Completion by Economic Quintile (Least Poor, Poorest) by Primary and
Secondary Education Level, 2010 (percent)
Figure 3.10: Patterns of Coverage and Spending per Student by Educational Level, 2013
Access Completion Access Completion Access CompletionPrimary Lower Secondary Upper Secondary
0
20
40
60
80
100
Poorest Least poor
Primary Secondary Tertiary0
200
400
600
800
1000
1200
0102030405060708090
Per-pupil spending Coverage (right axis)in
$
in %
of ag
e grou
p
Source: Author calculation RESEN (MICS 2010). Source: World Development Indicators 2013 (database), World Bank, Washington, DC, http://data.worldbank.org/data-catalog/world-development-indicators.
121. A regressive distribution of public resources negatively affects the poor. As shown in Figure 3.12, educational coverage declines with increasing levels of education, while per-student spending increases. A cohort analysis showed that the almost one-fifth of students who never enrolled in school receive no benefit from the public spending on education. The 66 percent of students who completed primary and lower secondary benefited from 51 percent of public resources, while the 17 percent of students who completed upper secondary benefited from 49 percent of education expenditures. As students from the lowest quintile make up a decreasing share of students as the level of education rises (Figure 3.11), public expenditure benefits the higher income groups more than the poorer ones.122. The resources allocated to the regional offices are also regressive. The recurrent budgets of the regional national education offices (Directions Régionales de l’Education Nationale; DREN), excluding salaries, accounted for only 1 percent of total recurrent allocations for primary and secondary education in 2015. Although the bulk of the recurrent education budget is devoted to salaries, the funding of local offices seems too low to meet the needs of the front-line services. The few funds at the local level are divided between the DREN office, inspection unit, and the schools in the region, leaving almost no funds to meet the schools’ needs for furniture and basic educational material such as pencils, schoolbooks, and boards. The regional distribution of these resources by DREN shows the budget per student varies significantly among the regions and is biased towards wealthier regions. Poor and rural regions such as Guidimagha, Brakna, Gorgol, and Assaba, show a per-student expenditure considerably below the national average (MRO 810 – 3 USD). At the same time, the number of students per teacher is high in these regions, between 45 and 64 (Figure 3.13). These data underline several critical regional distributional issues: (i) resources are not distributed based on need, as determined by the number of students, the conditions of the schools, and the poverty rate; (ii) the government struggles to hire and retain teachers in remote areas; and (iii) learning opportunities are more limited for poor students in
75 The Mauritanians who have been arrested for terrorism offenses are young (aged 16 to 24), poor, speak only Arabic and have a low level of education—most of them have failed secondary education. In contrast, leading figures in terrorist organizations have been typically well educated, holding higher educational degrees. (Boukhars 2012).
65
remote areas due to lower spending on school inputs (school kits, teaching material) and fewer teachers in the classroom.
Figure 3.11: Budget per Student, Pupil/Teacher Ratio, and the Poverty Rate by Region, 2015
Guidimagha
Hodh Chargui
Brakn
a
Gorgol
Assaba
Hodh Gharb
i
Nouadhibou
Nouakcho
tt
Trarz
a
Tagant
Adrar
Tiris Z
emm
our0
500
1,000
1,500
2,000
2,500
0
10
20
30
40
50
60
70
Spending per pupil Pupil/teacher ratio Poverty rate 2014
Source: Ministry of Education 2015, World Bank 2015.
Redistributing education spending could help to raise quality and effectiveness...
123. The disparity in education coverage and quality suggests that there are similar disparities in the government’s efforts to adequately fund the different educational functions. Recurrent expenditure constitutes the largest spending item, on average 89 percent of total education spending. As a share of total education spending, recurrent expenditure decreased from 95 percent in 2008 to 85 percent in 2014 as spending on investment rose from 2 billion MRO (US$ 6 .6 million) to 9 billion MRO (US$ 30 million) between 2010 and 2014. The increase in investment spending is mostly attributable to increases in donor aid spending by 80 percent over the same period. On average, 70 percent of the education investment budget depends on external aid. 124. A closer look at the composition of spending in the sector (see Figures 3.14 and 3.15) raises issues in view of the urgent need to address education coverage, quality and equity:
Salaries. The lion’s share of recurrent spending is absorbed by salaries, on average 83 percent—just above the MTEF target of 78 percent. Spending on salaries has grown steadily, by 7 percent over the period 2010–14. At primary level, salaries account for on average 96 percent of total education spending, above the average for East Africa (75 percent) and Sub-Saharan Africa (76 percent). Trends in salaries are determined by both teachers’ pay levels and the number of teachers. The number of students per teacher for primary and secondary education fell between 2008 and 2014, reaching 36 and 20 respectively in 2014, which is below the Sub-Saharan Africa average. However, these ratios are questionable as reports have drawn attention to the absence of teachers (often taking better paid assignments in private schools), their low level of qualifications, and overcrowded classrooms, notably in primary and secondary schools. These
66
deficiencies are considered one of the main factors contributing to the low quality of education in the schools.76
Goods and services account for 4 percent of total education spending. This may be too low since they include critical educational inputs such as textbooks, practice guides and basic student furniture, teacher training and curriculum development, and school construction and maintenance. Several of these services and materials are currently funded by development partners, even though they are part of the government’s regular budget.
Investment spending has been concentrated on tertiary (on average 50 percent) and primary education (on average 36 percent) between 2010 and 2014. In contrast, investments in secondary education and VET have been low (only 7 and 6 percent respectively). While it is more cost effective to invest in primary education, post-basic education is important for skills development and formal sector employment. In contrast, Mauritania’s considerable investment in tertiary education raises questions about equity and cost efficiency given its budget constraints and a poorly performing basic and post-primary educational system.
Figure 3.12: Composition of the budget by economic category, 2010–14 (MRO billion)
Figure 3.13: Investment spending by level of education, 2010–14 (MRO billion)
2010 2011 2012 2013 20140.0
10.0
20.0
30.0
40.0
50.0
60.0
70.0
Salaries Subsidies & transfers Goods & servicesExternal investment Internal investment
2010 2011 2012 2013 20140.0
1.0
2.0
3.0
4.0
5.0
6.0
7.0
8.0
9.0
10.0
0.0
1.0
2.0
3.0
4.0
5.0
6.0
7.0
8.0
Universities Primary Vocat. Educat SecondLiteracy Relig. educ Preschool External aid
Source: Ministry of Education. Source: Ministry of Education.
...As Could Improving its Targeting and Efficiency
125. There are inefficiencies in the way education resources are managed, particularly in primary education. Mauritania spends more per student on primary education than many similar countries, but despite significant government spending, the educational outcomes at primary level are low. Assessing the impact of students dropping out and repeating grades as educational “wastage”77 illustrates the cost
76 Whereas the pupil/teacher ratio implies a calculation based on the number of teachers on the payroll, for Mauritania it would be more accurate to use the number of teachers effectively in the classroom. However, these data are not available. 77 The term “wastage” in respect to education refers to human and material resources spent on pupils who have to repeat a grade or who drop out of school before completing a cycle. It denotes the inefficiency of a school system and refers also to the wasted opportunities for these children to develop the knowledge, skills attitudes, and values they need to live productive lives and to continue learning (UNESCO 1998).
67
of internal inefficiencies at primary level. Since most of those who drop out lapse into illiteracy, one-third of public spending is essentially wasted. If considering learning acquisition in primary schools (measured by the certificate of primary studies administered at the end of the last year), the educational wastage of resources is even higher since only 30 percent of participants pass the test. Fewer resources are wasted further up the educational ladder, as the impact of students dropping out and repeating grades is less significant. Hence, concentrating on addressing low learning outcomes in primary education would result in a more effective use of public resources.126. The management of the budget shows some operational inefficiencies, notably related to the management of donor aid. According to the data available, Mauritania’s education budget has been almost fully implemented, with an average budget execution rate of 97 percent between 2010 and 2014. This can be mainly attributed to the large share of the ministry’s budget taken up by salaries. Nonetheless, a separate review of the externally funded investment budget points to some inefficiency in the management of donor aid. Only about half of the donor-funded projects were effectively implemented due to shortcomings in procurement, donor procedures, and project management.78 This is concerning given that donor aid funds a large part of the education investment budget. 127. Private schools perform better than public schools and have seen faster increases in enrollment rates. Although on average 80 percent of the student population attend public schools, enrollment in private schools has increased considerably: on average 11 percent between 2009/10 and 2013/14, against 3 percent in public schools. The share of private enrollment at the primary level increased from 11 to 15 percent though these averages mask much higher prevalence of private schooling in some regions. In Nouakchott and Nouadhibou, for example, enrollment in private schools reached 50 percent. A recent ESDP II review in 2015 suggests that private schools achieve better learning outcomes than public schools, in particular in final exams at the end of the school cycle (Ministry of Education 2015). For instance, in 2014/15 the success rate in the Basic Education Certificate was considerably higher in private schools (49 percent) than in public schools (33 percent). While more work is needed to better understand these differences in performance, these facts are particularly disturbing from a poverty-reduction standpoint, as they suggest wealthier students have better access to well performing schools than poorer ones.128. The school feeding program is a cost-effective way to achieve benefits in many areas (education, nutrition and health, poverty reduction) but underfunding and poor targeting undermine its effectiveness. Mauritania’s school feeding program is targeted on schools that face poor attendance and enrollment and on students who are food insecure and living in areas with a high incidence of poverty. The program has had a flat budget of approximately MRO 1.2 billion or US$4 million a year since 2009. It covers 50 percent of primary schools with 50 to 300 students. However, a number of implementation problems have eroded its effectiveness. First, it is underfunded, limiting its scope—even though the program supports the same number of schools, it has had to reduce the number of meals (and the number of days) due to a combination of price increases and the flat budget (World Bank 2014b). As a result, the program has not been able to achieve its objective of providing two meals a day to 150,000 pupils. Second, the program’s design, targeting schools of an average size (50 to 300 students), can favor children in urban areas or larger villages, and penalize smaller schools, which are more prevalent in remote and poor areas. The World Food Program has provided food inputs and logistics, but this support will end in 2016. The government is developing a national strategy for school feeding that provides an opportunity to improve the program’s funding and effectiveness by better targeting disadvantaged families and communities that lack the resources to adequately provide for their school-age children, or those that need to be motivated to enroll their children in school.78 Donor aid is not reported in the national budget and information is only available about the financing agreement in the TOFE (Charts of the Financial Operations State). Some of the external aid is captured by the information system DAD (Development Assistance Data), managed by the Ministry of Economic Affairs and Development, but this is still operating on a pilot basis.
68
129. Decentralized public provision of education is associated with improved service provision, allowing for increased efficiency of teacher management and better resource mobilization at the local level. However, in Mauritania, effective decentralization is constrained by fiscal and institutional limitations. While education (together with health) is the most advanced in terms of deconcentrating resources to the services compared to the other sectors, the decentralization of education is limited to selected investments for primary school buildings available under a performance grants for department capitals and LGs. The grant is part of Government’s National Integrated Program for Decentralization, Local Development and Employment (PNIDDLE) and aims to build capacity and strengthen national and regional oversight in areas that are particularly poor and underdeveloped. However, implementation delays of the program suggest its impact for the education sector remains very limited.
Key Areas for Reform
130. There are some important reforms that the sector can undertake to improve its performance.
Focus on improving school quantity and quality. To achieve universal primary education, Mauritania should prioritize increasing access to schools, increasing spending on inputs that yield a high marginal return in terms of student learning, and prioritizing spending on the areas of greatest need. Proper maintenance of classrooms and availability of basic school supplies will require an increase of spending on goods and services. In addition, enforcing teachers’ presence in the classroom, complemented by frequent in-service teacher training and curriculum development, will be key to improving learning conditions and outcomes. Alongside this, the government needs to improve teachers’ qualifications and motivation by attracting a better cohort of educated candidates and improve teachers’ pay, preferably through a performance-based incentive system that links teachers’ salaries to student learning achievement.
Address equity issues. Even though gender equity has been reached, increasing access to schooling for the poor is the main hurdle to achieving universal primary education. Mentoring and tutoring programs should be made available to ensure that students across socio-economic income groups at least pass the primary certificate (Certificat d'études primaires; CEP). In addition, basic skills and literacy programs will be critical for students who have dropped out of primary school to increase their job readiness while providing a second chance to those who seek to re-enter school later.
Enhance accountability and increase the funding of vocational education and training institutions while improving connections with the general education system. The Mauritanian VET system needs to become more responsive to changes in needs for skills and to improve access to training and skills development. Institutionalizing annual audits of the public institutions managing vocational training and universities could encourage a better and more transparent use of public resources. Conducting routine tracer studies of graduates is important to assess the integration of the students in the job market and feed lessons back into the development of training programs. There is also a need to increase public resources for basic vocational and literacy programs to cater better for the significant share of the population aged 15–24 who are currently unemployed and illiterate. Expanding the VET education subsector has the potential to raise productivity in rural agriculture and increase incomes from urban informal low-paid economic activities
Review the current scholarship program and enhance accountability. The current scholarship program needs to be significantly reviewed to target low-income students and those university programs with high employment potential. Government-funded scholarships to foreign
69

universities should be terminated. Development partners could fund specialist training in the areas of the most need, for which the country lacks capacity.
Render the education information management system functional. To improve the availability of accurate and consistent data for informed decision-making, the government should invest in the education information management system. This would allow improving timeliness and quality of data quality as well as ability to link with other sources of information in the sector.
Tracking and monitoring of resources and performance. Improved tracking and monitoring of allocation and spending would enhance transparency and contribute to ensuring that education expenditures reach the intended beneficiaries. To this end, institutionalizing annual reviews of public expenditures and conducting periodic public expenditure tracking surveys and school-level surveys would be worthwhile initiatives, providing information on actual inflows to schools and identifying leakages. These initiatives could be coupled with social accountability mechanisms (i.e. using parent’s feedback via SMS to monitor teacher absenteeism) to improve administrative record keeping and teachers’ incentives to attend schools.
70
Chapter 4: Use of Resources in the Health Sector
Despite Some Effective Public Health Interventions79, Overall Progress has been Mixed
131. Progress on health outcomes has been mixed in Mauritania. In line with the Millennium Development Goals, Mauritania’s National Health Development Plan (PNDS) 2012–2020 seeks to (i) reduce infant/child mortality, (ii) improve maternal health, and (iii) fight against HIV/AIDS, malaria and other diseases. Mauritania has made good progress on indicators such as child vaccination due to more funding and improved program management—coverage of measles immunization reached 80 percent in 2013 against an average of 74 percent for Africa. It seems to have achieved the MDG for malnutrition, reducing it to 20 percent in 2014 (against a target of 23.5 percent) (Republic of Mauritania 2014). Child and maternal mortality indicators have shown some improvement between 1990 and 2013, but are still far from reaching the MDG targets. In 2013, infant mortality was still at 67 for every 1,000 live births against the MDG target of 45, and maternal mortality was 320 per 100,000 live births against an MDG target of 232.80 HIV/AIDS prevalence remains low (below 1 percent in 2014) but the prevalence of major diseases (such as malaria and tuberculosis) has not fallen. The rate of assisted deliveries improved substantially, reaching 70 percent in 2014, up from 61 percent in 2007, although this improvement masks geographic disparities. More than half of all births in rural areas were delivered without skilled care, which can affect the health outcomes of the mother due to insufficient postnatal care (UNICEF 2008, 2014).
Figure 4.1: Maternal Mortality Rate and Measles Immunization Coverage, 1990, 2000 and 2013
Figure 4.2: Regional Comparison of Immunization Coverage for Measles, 2013 (percent)
1990 2000 20130
100
200
300
400
500
600
700
0
10
20
30
40
50
60
70
80
90
Maternal mortality Measles
Mater
nal mo
rtality
ratio (p
er 100
000 li
ve bir
ths)
Immu
nciatio
n cove
rage a
mong
1-year
olds (%
)
ChadGuinea Beni
nNiger Mali
Togo
Cote d'Ivoire SSA
Mauritan
ia
Burkina Fa
soSen
egalMalaw
iGhan
aTunisi
aAlge
ria
Morocco
0
20
40
60
80
100
120
Source: WHO 2015. Source: WHO 2015.
132. Mauritania has made some effective public interventions (particularly on immunization and nutrition), but the country’s healthcare system suffers from a number of shortcomings (Republic of
79 The following analysis is based on information available to the team as of January 2016. Notably, the results from the MICS survey and health sector expenditure analysis (comptes santé) work which was underway at the time were not available to the team. Hence, health sector data is more outdated than that of the other chapters of this review 80 Note for some health indicators the PER uses the World Health Statistics for international comparison purposes. However, the data deviate from the results of Mauritania’s 2011 Multiple Indicator Cluster Survey (MICS), which shows lower outcomes for infant and maternal mortality, with an infant mortality rate of 75 for every 1,000 live births and a maternal mortality rate of 626 per 100,000 live births (UNICEF 2014).
71
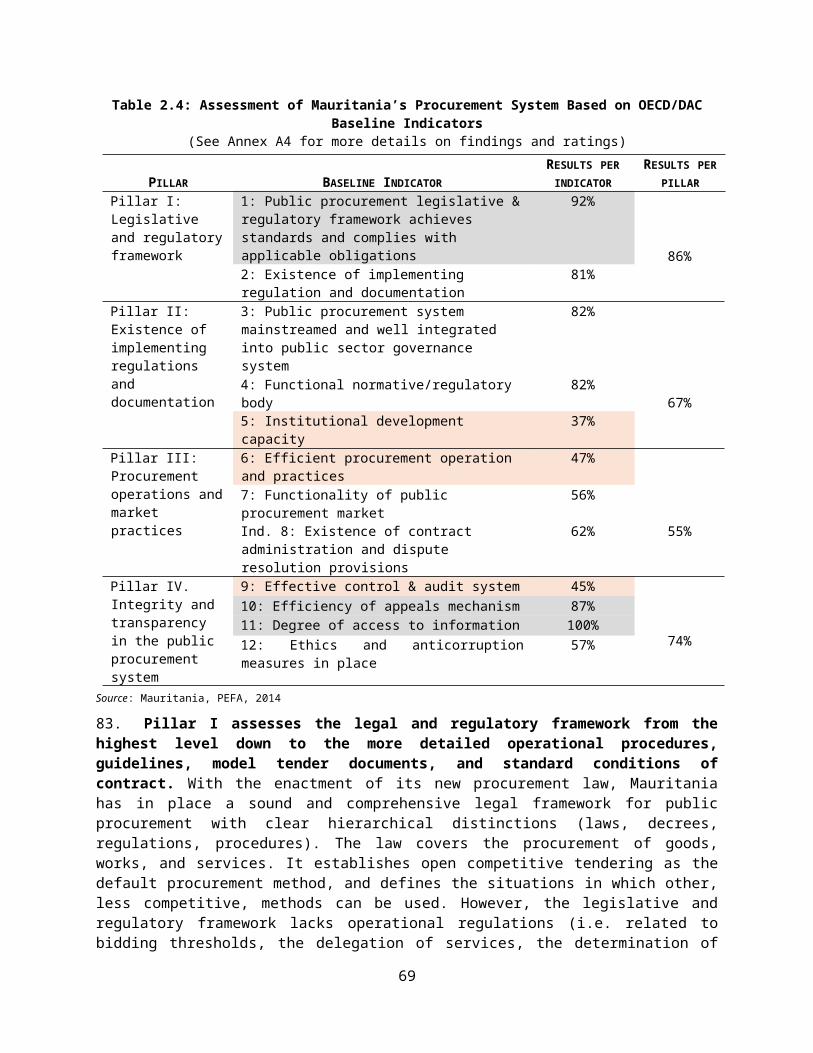
Mauritania 2014). The government considers reaching the health MDGs a priority and has set up a national entity to allow a follow up of health indicators. Despite these efforts, the sector continues to be plagued by a number of problems. Mauritania is still far from the World Health Organization’s (WHO) standard of 25 professionals per 10,000 inhabitants: the country has on average 10.3 doctors and nurses per 10,000 inhabitants (Ministry of Health 2014a). The performance of health workers is also affected by a decline in the quality of training, a lack of motivation, and an uneven geographical distribution, with 45 percent of health workers being concentrated in Nouakchott. Insufficient numbers of staff at health care facilities remains a major barrier to improving services, as are the poor condition of the health facilities. According to the 2013 Service Availability and Readiness Assessment (SARA) survey, only one-third of health facilities are adequately equipped and operational. Almost none have the medical equipment to conduct standard diagnostic tests (WHO 2013). According to a user satisfaction survey, long waiting times and the high cost of services are the main causes of dissatisfaction with health services among the population (Republic of Mauritania 2014).
Figure 4.3: Distribution of Health Workers by Region, 2014
Inchiri1% Tag.
2%Tiris Z.
2%Adrar
3%Guidi.
3%Gorgol
4% Hodh Gharbi5%
Nouadhibou5%
Brakna6%
Trarza7%
Assaba8%
Hodh Chargui9%
Nouakchott44%
Source: Ministry of Health.
Health Spending Has Risen from a Low Base, but Does Not Fully Reflect Mauritania’s Policy Goals81
133. Total health spending in Mauritania stagnated between 2010 and 2012, but the start of the PNDS implementation in 2013 saw a marked increase. After several years of small fluctuations, total health spending (public and private) increased sharply by 27 percent in 2013, to US$120 million or 2.4 percent of GDP. Part of that spending increase is attributed to a significant increase in central government spending, which coincided with the implementation of the PNDS. Despite government commitment to the health sector, the amount of central government spending in 2013 remained below the funding needed to finance the interventions identified in the PNDS (2012–30). The bulk of public health resources are managed by the Ministry of Health, accounting 4.1 percent on average of the total government budget, which is far below the Abuja Declaration (2001) target of allocating at least 15 percent of the budget to the health sector.
81 This assessment is based on the National Health Account 2011, 2012 and 2013 and captures all sector health expenditures, including government expenditure (from the ministries of Health, National Defense, Interior, Work, Education, and Social Affairs), donor aid, insurance, household and community spending (Ministry of Health 2015).
72
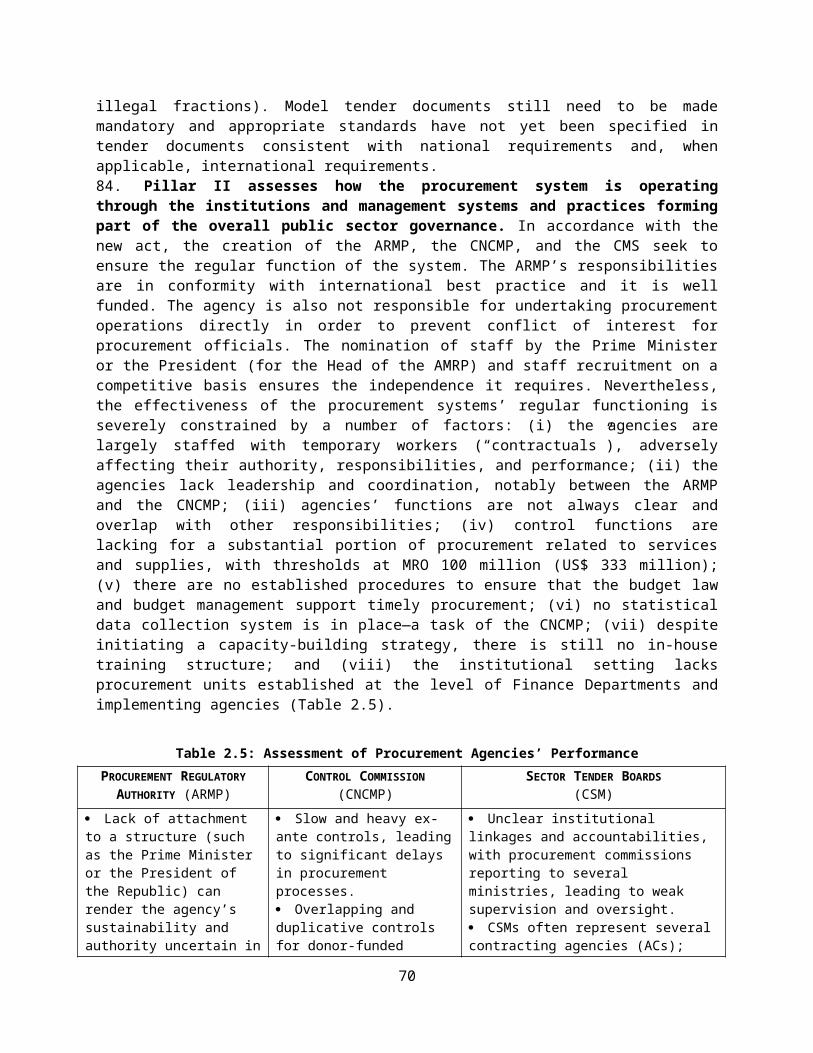
Figure 4.4: Mauritania’s Public Health Spending, 2010–13
Figure 4.5: Central Government Allocations on Health Compared to Funding Needed by the PNDS, 2012–20
2010 2011 2012 20130.0
5.0
10.0
15.0
20.0
25.0
30.0
0.0%
1.0%
2.0%
3.0%
4.0%
5.0%
6.0%
7.0%
8.0%
MRO billions % of Spending % of GDP
2010 2011 2012 2013 2014 2015 2016 2017 2018 2019 20200.0
10.0
20.0
30.0
40.0
50.0
60.0
70.0
Budgetary allocations PNDS (2012-2020)
in MR
O bil
lions
Source: Ministry of Health. Source: Ministry of Health.
134. Mauritania’s health spending is relatively low compared to other countries in Sub-Saharan Africa. Mauritania spends about US$48 per capita on health, in contrast to an average of US$95 for selected Sub-Saharan African countries. As a share of GDP, Mauritania’s spending is around the regional average of 2 percent. A comparison with health outcomes in other countries shows that Mauritania has some scope to use its resources more efficiently. Other countries which spend the same or less than Mauritania, have better outcomes related to infant mortality, for example.
Figure 4.6: Regional Comparison of Health Spending and Infant Mortality Rates, 2013
Gunie
a
Mala
wi
Nig
er
Chad
Benin
Burkin
a Fa
so
Seneg
al
Mau
rita
nia
Mali
Togo
Cote d
'Ivoir
e
Ghana
SSA
Moro
cco
Tunis
ia
Alger
ia0
50
100
150
200
250
300
350
0
10
20
30
40
50
60
70
80
90
100
48
67
Health spending per capita (US$) Mortality rate, infant (per 1,000 live births) Source: World Development Indicators 2013 (database), World Bank, Washington, DC, http://data.worldbank.org/data-catalog/world-development-indicators.
135. Resource distribution within the health sector is not fully in line with government priorities, particularly achieving the health-related MDGs. In an effort to address the flaws in Mauritania’s health care system, the government has devoted more resources to primary health care—expenditures increased in real terms by 26 percent between 2011–13, climbing to one-third of total health spending in 2013 (Figure 4.7). However, more than half of resources are spent at the tertiary level (hospital and ambulatory care) and central administration. In part, this can be attributed to the higher cost of
73
providing tertiary services. Nevertheless, taking into account the faltering progress towards several MDG goals, more support seems to be required for primary health care, which is essential to addressing child and maternal health, managing communicable and chronic diseases, and offering preventive services. From an equity perspective, the primary front-line services offer health care to three-quarters of the population but receive only one-third of public health resources.
Figure 4.7: Distribution of Spending Across Health Sub-Sectors, 2010–13
2010 2011 2012 20130%
20%
40%
60%
80%
100%
TertiarySecondaryPrimaryOtherLocal adminCentral admin
Source: Ministry of Health.
Unequal Distribution of Health Expenditure is Likely to Exacerbate Health Inequalities
136. Health expenditures are unequally distributed across regions, negatively affecting the poorer segments of the population. For instance, Tiris Zemmour, a region with a poverty rate of less than 30 percent, received 12 times more health spending per capita than Brakna, with a poverty rate of 67.4 percent. These regional disparities in funding contribute to the obstacles the poor face accessing health services. Use of primary health care is strongly linked to physical proximity to services. However, nearly two-thirds of households in rural areas are more than 60 minutes from a health facility, against 16 percent of urban households.82 Given the predominantly rural nature of poverty (53.2 percent), the poor have less access to health services. More than half of the poor (58 percent) travel more than 5 kilometers to a health center. The inequity in the allocation of health resources also has a major bearing on the distribution of qualified health personnel and hence the availability and quality of health care received by the poor. While more than half of poor households consult basic health centers, almost all specialist doctors (94 percent), half of all general practitioners (47 percent) and more than three-quarters (76 percent) of technical specialists are in hospitals which are located in Nouakchott and in regional health care centers.
82 The World Health Organization recommends a distance of 5 km or 30 minutes to a basic health center (Republic of Mauritania 2014).
74

Figure 4.8: Comparing Health Spending Per Capita and Poverty Rate by Region, 2013
Figure 4.9: Distribution of Medical Staff in Hospitals and Regions, 2014
- 5.0 10.0 15.0 20.0 25.0 30.0 35.0 40.0 -
10.0
20.0
30.0
40.0
50.0
60.0
70.0
80.0 Brakna
Tagant
Guidi.
Nouad.
Nouak. Tiris Z.
Health spending per capita (in MRO)
Pove
rty ra
te (in
%)
Special. Doc. Tech. Speciai. General Pract. Nurses Midwives0%
20%
40%
60%
80%
100%
Hospitals Regions Nouakchott
Source: Republic of Mauritania 2014. Source: Ministry of Health.
137. Inequity in the allocation of resources can contribute to inequity in the use of resources. Significant discrepancies in the use of health services between different income categories remain. According to the 2014 Mauritania Poverty Profile, health spending by households increased between 2008 and 2014 (from 3.8 to 4.8 percent of total household spending), however individuals in the top quintile spent a larger share of their income on health-related expenditures than those in the bottom quintile. The poor tend to seek less medical help when ill compared to the non-poor and are more likely to consult a basic health facility rather than the central and regional hospitals. This is consistent with the observation that the poor undergo fewer treatments than the rich due to income limitations. Furthermore, although the use of clinic services for prenatal care has improved nationwide since 2008, poor women still receive fewer prenatal consultations than the non-poor. In fact, the percentage of poor women obtaining medically trained assistance during childbirth is alarmingly low—only 36 percent of women from the poorest households (first quintile) are assisted in childbirth by doctors or midwives whereas this rate is 59 percent for women in the richest households (fifth quintile). Nevertheless, a user satisfaction survey showed that 80 percent of the users living in rural areas are satisfied with health services (Republic of Mauritania 2014).
Private Spending and Health Insurance Are Becoming Increasingly Significant as Donor Funding Declines83
138. More than two-thirds of total health sector spending is absorbed by salaries and goods and services. Salaries constitute the bulk of health system funding (on average 43 percent), followed by goods and services (on average 37 percent), while one fifth of the total health spending is in favor of investment (see Figure 4.10). After a stagnation in total health spending for three years (2010–12), it rose by 27 percent in 2013, boosting the non-salary recurrent budgets of the regions and basic health centers by 150 percent.84 Recruitment of medical staff shows a steady upward trend between 2011–13
83 The assessment of the health system financing is based on the sources of funding, covering government (including all Ministries managing health expenditures, notably Ministry of Health, Habitat and Defense), donors, insurance and private sector (mainly households’ out of pocket spending).
84 Other additional spending was directed towards the creation of hospital centers (the hospital Attar, Aleg, Seilibaby and Tidjekja became hospital centers in 2012 (with management autonomy), benefiting from government subsidies since 2013) and
75
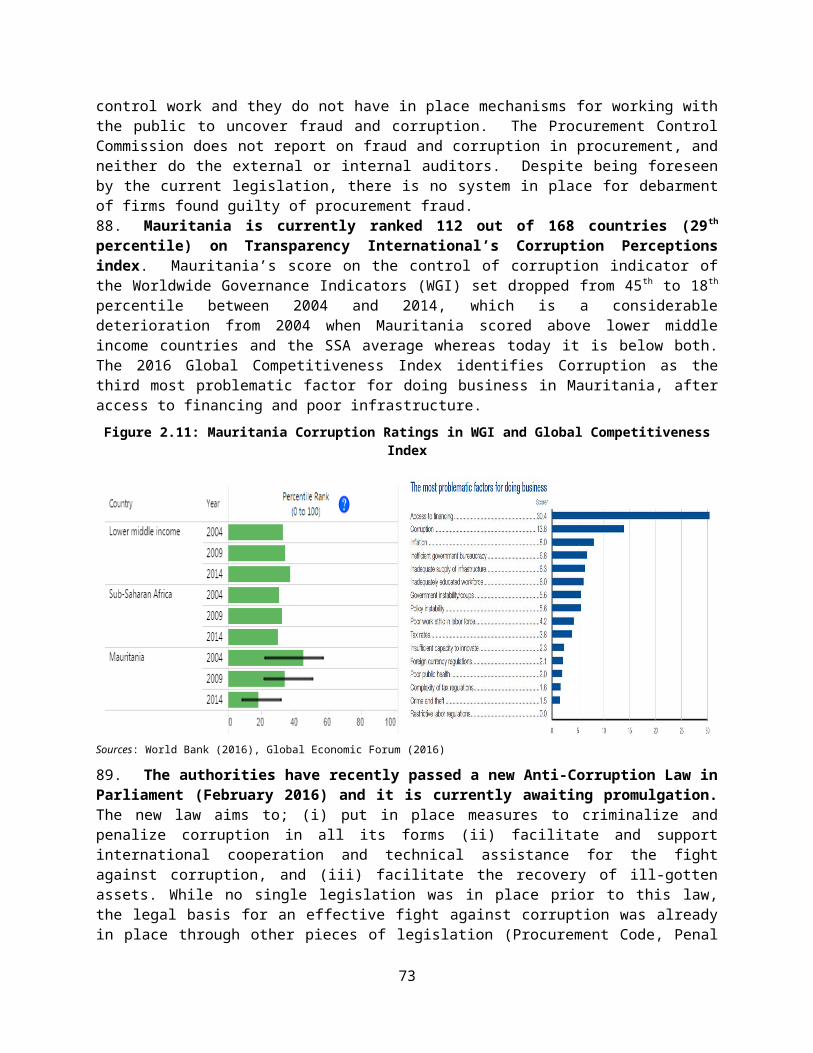
(Figure 4.11). Nevertheless, the uneven regional distribution of medical workers, particular in rural areas, as well as the overall shortage of medical workers continues to hamper access to skilled care at birth, in emergencies, and for specialized services. Out of a total of 5,393 health workers, the basic health centers and posts employ 1,402 medical staff, but need an estimated 3,530 (Ministry of Health 2014b). Mauritania’s ratio of health workers to population is not the worst in Africa, but remains below the African average (Ministry of Health 2014b; see Figure 4.12). It is also noteworthy health spending on drugs (8.2 percent) is considered very low, as evidenced by the limited availability of drugs in the health facilities. For instance, only 1 percent of health facilities consistently have 14 tracer drugs available (WHO, 2013).
Figure 4.10: Total Sector Health Spending by Item (Economic Classification) 2010–2013
Figure 4.11: Growth in Medical Staff, 2011–13
2010 2011 2012 20130.0
5.0
10.0
15.0
20.0
25.0
30.0
35.0
40.0
Salaries Goods and services Investment
in MR
O bil
lions
2011 2012 20133,800
4,000
4,200
4,400
4,600
4,800
5,000
5,200
4,230
4,796
5,064
Source: Ministry of Health 2015. Source: Ministry of Health.
Figure 4.12: Physicians and Nurses/Midwifery Personnel, 2015 (per 10,000 population)
Figure 4.13: Sources of Funds for Mauritania’s Public Health Sector, 2010–2013
Niger TogoMalawi
Senegal Mali
Cote d'Ivoire
Burkina Faso
Mauritania Benin
Ghana
Morocco
Africa re
gionAlge
riaTunisia
05
101520253035404550
Physicians Nurses/midwives
2010 2011 2012 20130.0
5.0
10.0
15.0
20.0
25.0
30.0
35.0
40.0
Public funds Private CNAM Donor Communities Other
in MR
O bil
lions
Source: WHO 2015. Source: Ministry of Health 2015.
139. In Mauritania, government domestic spending accounts for half of all health system funding, followed by spending on National Health Insurance Fund (CNAM) and donor programs. Both
the creation of the Directorate for Public Hygiene.
76
domestically funded expenditures and spending on the government’s health insurance, CNAM, rose as a share of total health spending between 2010 and 2013, accounting for 5.3 percent and 18 percent respectively in 2013 (Figure 4.13)85. Private health expenditures in the form of out-of-pocket spending by households has also shown an increase, representing 13 percent of spending in 2013. In contrast, although numerous development partners provide support to the health system, donor assistance has declined on average by 14 percent per year over the same period, and formed 12 percent of total health spending in 2013. The downward trend can be partially explained by the completion of the Friendship Hospital in Nouakchott, supported by Chinese cooperation. A slight increase in 2013 was not sufficient to return to the spending level of 2010. The mix of the sources of financing has implications for the sector, particularly in terms of access, equity, and financial sustainability:
The government insurance scheme represents one-fifth of total health sector spending, although coverage is limited to a small share of formal workers. Created in 2007, the CNAM is a publicly funded insurance system that mobilizes funds from employees and employers to finance health care services for its members. At present, it covers 13 percent of formal sector workers. This insurance scheme has had little impact on access to health services and financial protection as it targets only a small fraction of the population while excluding those most in need.
The decline in development assistance over the reviewed period raises critical concerns for future sustainability of high-impact health interventions, particularly preventive programs. Donor assistance has largely funded preventive programs related to maternal mortality, communicable and infectious diseases (tuberculosis, malaria), and the implementation of vaccination programs (where the government has purchased the drugs). HIV/AIDS is one of the few programs funded and implemented solely out of the government’s own resources. The predominance of donor aid for certain key programs raises concerns about their sustainability in an environment where government funding is constrained. In addition, these activities are vulnerable to the frequently erratic nature of donor funding commitments and low level of actual disbursements.
Given the limited ability of the poor to pay, and their absence from the CNAM, the increase in out-of-pocket spending is another indicator of potential inequities in the health system. The main source of private health spending is households’ out-of-pocket spending. While out-of-pocket spending remains low compared to other spending sources, it shows an upward trend in real terms, almost doubling between 2010 and 2013.
More Devolution and Prioritization Could Make Better Use of Existing Resources
140. Efficient utilization of public resources in the health sector will be critical given the government’s budget constraints. The performance of domestically financed health spending is characterized by budget overruns for some categories and projects and underspending in others. The overspending of the domestically funded appropriations (on average 112 percent between 2011 and 2013) can be mostly attributed to higher spending on salaries as the budget law had not taken into account the recruitment of health workers during the fiscal year. Some expenditure overruns also occurred for subsidies and transfers in 2013 due to in-year requests for the purchases of drugs and other medical supplies. These additional needs are funded through the use of ministerial decrees during the 85 As noted earlier, apart from the Ministry of Health a few other Ministries also manage health expenditures (such as the Ministry of Habitat and Defense), however the spending level of these ministries is low, contributing on average 10 percent to total Ministries health expenditures (excluding donor aid) or 5 percent to total health spending (including government and private expenditures).
77
fiscal year. In contrast, spending on goods and services has been below budget appropriations, with the exception of a budget overrun in 2011. Overall, the management of the health budget points to weaknesses in budget planning but also a lack of fiscal discipline.
Table 4.1: Ministry of Health Execution Rates (percentage) by Economic Category, 2010–13
2010 2011 2012 2013Avg.
2010–13Salaries 104 117 111 114 112Goods & services 81 152 90 88 103Subsidies & transfers 100 103 100 143 111Investment 94 107 99 100 100TOTAL 96 125 103 109 108
Source: Ministry of Economy and Finance.
141. Devolution of key functions generally improves the efficiency and quality of services in the health sector. Mauritania still has scope to better resource front-line services and to make use of local networks. Although the health sector has deconcentrated its administrative functions to regions and health districts, 10 percent of the ministry’s budget is managed by the central administration compared with only 2 percent for the deconcentrated services. This raises questions about the transparency and cost effectiveness of health resources as well as the effective targeting of services according to the needs of the different communities. Social mechanisms—such as community participation and local empowerment to give communities responsibility for decision making about adequate services and improving the quality of care—remain embryonic in Mauritania, even though community participation is considered an essential part of good local governance and promotes effective health care at a lower cost. Similar to the education sector, the decentralization of health services is limited to a few investments provided to 100 LGs under the performance-based grant for community health centers and small-scale hospitals. Given the delays in implementing the PNIDDLE, the effective impact of these investments on local health service delivery suggests being small and remain unknown. 142. Ensuring that the resources available are directed towards those interventions that have the greatest impact on health outcomes at the lowest cost (better allocative efficiency) remains a key challenge. The current distribution of resources prioritizes curative services, often underfunding largely cost-effective and high impact interventions, such as communicable and infectious disease control, reproductive and maternal health, and health education. These account for only 4 percent of total health spending, and are mainly funded by donor assistance.
Key Areas for Reform
143. There are a number of key areas of reform in the health sector.
Prepare a universal health coverage policy. Universal health coverage lowers financial barriers to health care and reduces the impoverishing impact of health payments. The government has begun to embrace the concept of universal coverage by preparing a financing strategy to explore different financing mechanisms. To complement this, it needs to prepare a policy focusing on (i) financial risk protection to address catastrophic health expenditure, where households have to forego the consumption of other necessary goods due to high out-of-pocket payments and impoverishment, closely coordinated with the national social protection policy; (ii) improving the quality of effective services; and (iii) addressing social determinants of health such as addictions (tobacco, drugs, alcohol and other addictions), traffic injuries, pollution, and the lack of clean water and sanitation networks.
Improve human resource management. The ability of a country to meet its health goals
78

depends largely on the skills, motivation, and deployment of the health workers responsible for delivering services. Given the shortcomings of Mauritania’s human resources in the health sector, it is critical to (i) recruit skilled health workers to ensure that primary health care facilities meet their nationally recommended staffing norms, and (ii) implement an effective incentive scheme to attract and retain essential health workers. The 2013 budget included measures such as the provision of extra pay and benefits for health workers taking a post in rural areas and the piloting of a results-based financing strategy. These are important steps towards providing incentives for health workers to improve motivation and retention.
Address equity issues. Equity plays a constitutive role alongside growth in reducing absolute poverty. A well-designed resource allocation formula that considers equity aspects can reduce government spending disparities across regions. Additional resources should benefit currently marginalized and very poor regions such as Brakna, Gorgol, Tagant, and Guidimagha.
Reinforce cost-effective interventions. The quality of care is key to improving health outcomes, efficiency, and user satisfaction. Effectively targeting resources on the areas of greatest need is critical to improving the quality and use of health services. To achieve this, Mauritania needs to strengthen those health interventions that have the greatest possible benefits (for example maternal and infant programs, and preventable diseases), expand CNAM’s coverage to informal workers and the poor, and implement the results-based financing program which the Health Steering Committee approved in September 2015 to put more emphasis on outcomes instead of inputs.
Strengthen budget management. Effective management of the budget encourages better decision-making, the efficient use of resources and results in better health outcomes. This requires the strengthening of tools for budgeting, accounting and execution, improving management capacities of all departments, notably at the regional offices, and implementing a computerized management system that includes all resources (including external funds) and is connected to MF and treasury’s information system.
Review and explore different models of social accountability. Social accountability interventions have proven to be critical to enabling meaningful participation of all citizens, proper accounting of health resources and addressing information asymmetries. It encompasses a range of practices (such as participatory public policy-making, participatory budgeting, public expenditure tracking, and citizen monitoring and evaluation of public services) that should be reviewed and explored for the Mauritanian context.
Strengthen decentralization of health functions to improve human resource management. Many arguments have been made that decentralization of health care may bring benefits of ( i) improved technical efficiency as local governments are more cost conscious and have more freedom in contracting with providers; (ii) better allocative efficiency through greater alignment of services to the needs of the different communities; (iii) improved equity as local authorities know communities better and can successfully target resources to the more vulnerable groups. While decentralization reforms in Mauritania constitute a slow process, efforts could focus on improving the management of health staff by making staff positions regional (to reduce the concentration of health workers in Nouakchott) and strengthening the local oversight of the regions to guide the promotion and sanctioning of health workers, and therefore encourage better performance.
79
Chapter 5: Use of Resources in the Agriculture Sector
Structural changes in Mauritania’s rural areas have led to increased productivity and a reduction in poverty
144. Although Mauritania consists largely of desert (only 0.5 percent of the land is considered arable), the agriculture sector is important. It contributed 17 percent of GDP in 2014, and is the second-largest employer, providing 26 percent of total employment in 2014. Mauritania is largely a livestock-producing country (accounting for about 70 percent of agricultural GDP) and has a strong potential for irrigated agriculture along the Senegal River. About 60 percent of the rural population depends on agriculture for a living. At present, Mauritania imports more than 70 percent of its cereal. Nonetheless, it has the potential to satisfy its needs for rice, vegetables, and other crops through irrigated agriculture (only 10-20 percent of its irrigation potential is currently exploited) and for cereal and milk for the domestic markets (both are currently largely imported). Tapping into this potential could contribute to poverty reduction given that over half of the poor population lives in rural areas.145. Developments in the agricultural and livestock sectors have had a significant impact on poverty in Mauritania. Increased production, prices and incomes for rural workers in the irrigated and mechanized agriculture sector and in the livestock sector have resulted in very significant reduction in poverty rates in rural areas, and has driven the large reduction in poverty at national level (from 44.5 percent in 2008 to 33 percent in 2014). The driving factors of this change can be found in irrigated agriculture, which has witnessed large increased in productive land (146 percent) and in tons produced (150 percent) and in the livestock sector, where ownership for the poorest quintile has increased significantly (86.6 percent). These improvements could be the result of improved investments in the livestock sector, improved savings by farmers or both. 146. Despite these very encouraging results the sector continues to underperform. Rice production has increased in the past ten years, positioning Mauritania as a regional leader. Mauritania’s agricultural value added per worker is also above the average for Sub-Saharan African countries (Figure 5.3). Nevertheless, agriculture’s share of GDP has declined over the past ten years, mostly due to repeated drought, severely affecting products other than rice and livestock that depend heavily on rainfall. The sector’s vulnerability to climatic shocks has discouraged farmers and the private sector from increasing investments in the sector. The rate of adoption of agricultural technology has been low in Mauritania, contributing to low yields. Agricultural growth has also been hampered by weak support services (credit and extension), weak capacity among producer organizations such as village cooperatives and economic interest groups (groupements d’intérêt économique; GIE), and a challenging business environment.
80
Figure 5.1: Rice Yields, 2001–13 Figure 5.2: Comparison of Rice Yields with Selected African Countries, 2013
2001 2002 2003 2004 2005 2006 2007 2008 2009 2010 2011 2012 20130.0
1.0
2.0
3.0
4.0
5.0
6.0
7.0
8.0
Yield
(t/Ha
) Rice
padd
y
Congo
Camero
on
Mozambique Chad
NigeriaGuinea
Sierra L
eoneBurundi
Malawi
Mauritius
Burkina Faso Togo
Ghana
Madagasca
r BeninNiger Mali
Senegal
Côte d'Ivoire
Mauritania
Rwanda
Morocco
0.0
1.0
2.0
3.0
4.0
5.0
6.0
7.0
8.0
Yield
(t/Ha
) Rice
padd
y
Source: FAO 2013. Source: FAO 2013.
Figure 5.3: Agriculture Value Added per Worker—Comparison with Selected African Countries,
2013
Figure 5.4: Agriculture Value Added, 2001–13
Burundi
Burkina Fa
so MalawiSen
egal Togo SSA
Congo Rep Mali
Mauritania
Cameroon Benin
MoroccoNigeria
0
500
1,000
1,500
2,000
2,500
3,000
3,500
4,000
4,500
5,000
Agric
ulture
value
adde
d per
worke
r (con
stant
2005
US$)
2001 2002 2003 2004 2005 2006 2007 2008 2009 2010 2010 2011 2012 20130.0
5.0
10.0
15.0
20.0
25.0
30.0
35.0
40.0
Agric
ultu
re, v
alue a
dded
(%of
GDP
)
Source: FAO 2013. Source: World Development Indicators 2013 (database), World Bank, Washington, DC, http://data.worldbank.org/data-catalog/world-development-indicators.
Despite Agriculture’s Impact on for Poverty Reduction, Mauritania May Struggle to Mobilize the Investment the Sector Needs to Reach its Full Potential
147. Government allocations to the agriculture sector have increased overall between 2010 and 2014, but mobilizing funding to implement the NADP will be a challenge over the coming years. After a temporary drop in 2011, budget appropriations increased on average by 54 percent in subsequent years, amounting to 6 percent of the national budget, or 1.7 percent of GDP, in 2014. The increases can
81
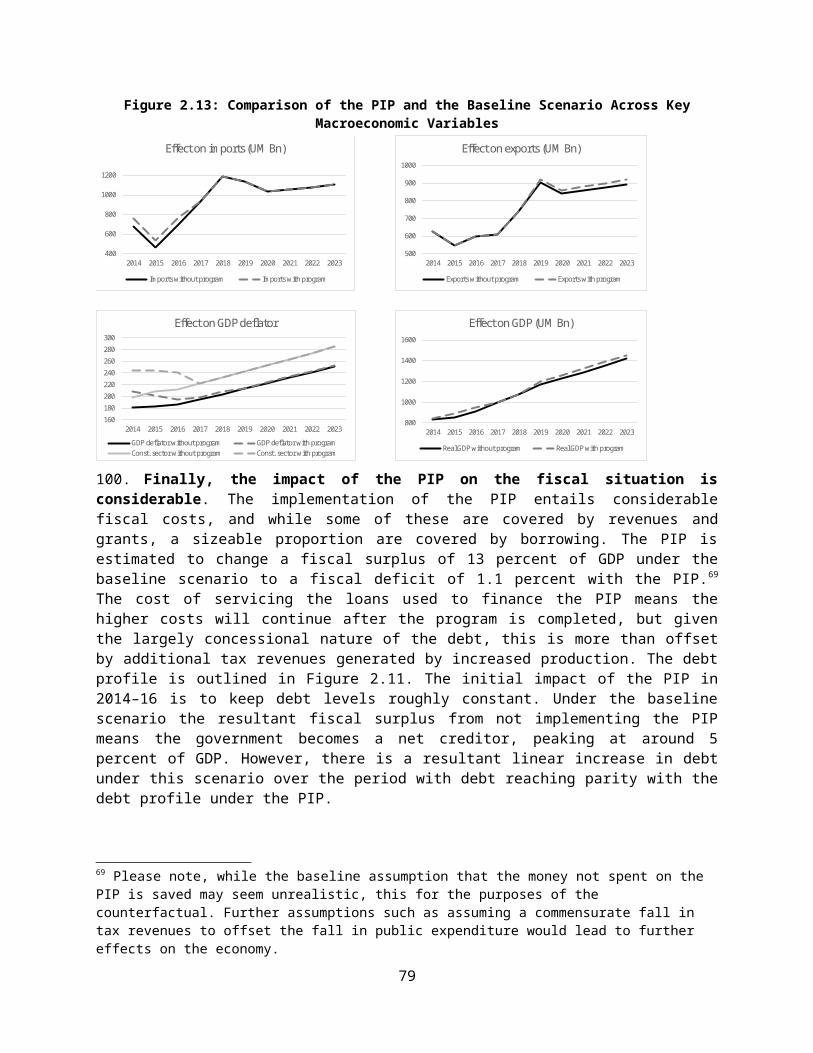
be mainly explained by the government launching a large-scale pro-poor irrigation program in the Senegal River Valley and introducing input subsidies, notably to support rice production. Despite these increases, budget appropriations remain below the 10 percent goal set by the 2003 Maputo Agreement. The NADP (horizon 2025) estimates the sector’s funding needs at MRO 350 billion (US$1.1 billion) with the bulk of the funding (MRO 275 billion) to be mobilized from development partners and the private sector (Ministry of Agriculture 2015).86 While it is promising for the NADP implementation that current central government appropriations are above the estimate of resources needed from the government, key challenges remain in securing external and private funding for the forthcoming years.
Figure 5.5: Government Allocation to Agriculture and Share of the National Budget, 2010–14
Figure 5.6: Comparision of Government Allocations on Agriculture and Costing of the NADP 2015–25
2010 2011 2012 2013 20140.0
5.0
10.0
15.0
20.0
25.0
30.0
0.0
1.0
2.0
3.0
4.0
5.0
6.0
7.0
Agriculture allocations Share of the National Budget (right axis)
in MRO in
%
2010 2011 2012 2013 2014 2015 2016 2017 2018 2019 2020 2021 2022 2023 2024 20250.0
5.0
10.0
15.0
20.0
25.0
30.0
35.0
40.0
45.0
External funding Central government allocations
NADP (2015-2025) donor & private NADP (2015-2025) government
NADP (2015-2025) beneficary
in MRO
billions
Source: Ministry of Economy and Finance. Source: Ministry of Economy and Finance; Development Assistance Database (DAD); Ministry of Agriculture 2015.
148. Compared to its peers, Mauritania has spent relatively little on agriculture, but yields are high for its main commodity, rice. Comparisons of spending on agriculture have to be made with caution, as Mauritania was not included in the International Food Policy Research Institute (IFPRI) dataset on agricultural spending from 147 countries. However, Figure 5.7 suggests that government spending on agriculture in Mauritania, both as a proportion of GDP and a share of total expenditure) is very low compared to Sub Saharan African countries. Despite this, yields for one of its main commodities, rice, are very high (Figures 5.1 and 5.2, above). The explanation might be a combination of factors such as the development of large-scale mechanized private farming, the purchase of rice at a subsidized price by the
86 Note with the creation of a Ministry of Livestock in 2015, a separate PNDA was also prepared for the livestock sector – the estimated funding needs are to the Agriculture investment plan.
82

government, and the latest technologies (such as seeds, varieties developed in the region, and quality of soil) that have contributed to the high agricultural productivity for rice.
Figure 5.7: International Comparison of Public Agriculture Expenditure, 2013
Source: International Food Policy Research Institute SPEED database; World Bank authors’ calculation.
Continuing Food Subsidies May Not be the Best Way to Address Chronic Poverty
149. Some food subsidy programs aimed at mitigating the impact on vulnerable populations of a severe drought in 2011 are still in place. In late 2011, a severe drought led to a fall in agricultural production by 75 percent, which affected agricultural communities, resulting in loss of cattle and increased vulnerability among pastoral communities. In December 2011, about one-quarter of rural households were food insecure, half of them severely so. Government intervention under the emergency Emel Program, managed by the Food Security Commission, focused on food-based programs and targeted poor farmers and communities.87 Funding for the Emel Program peaked in 2012 at MRO 28 billion (US$ 93.3 millon) or 9 percent of the national budget. In 2013, spending fell to MRO 14 billion (US$ 46.6 million) due to favorable rains and the closing of two of the Emel Program components, the Village Level Food Security Stocks (SAVS) and the emergency food distribution program. Despite being initially designed as a short-term response, however, Emel’s subsidized food shops (Boutiques Emel) remain in place. They aim to distribute subsidized food to the poor, generate employment, and hold down food prices.150. The Emel Program shows the government’s capacity to manage large-scale programs, but also raises questions about its contribution to reducing extreme poverty and its fiscal impact . The Emel Program was successful in averting a potential humanitarian crisis but its targeting mechanism showed some limitations. An evaluation conducted by the World Bank (2014) indicated those most in need, the extreme poor, did not have either the means to buy subsidized products at the Boutiques Emel or their own herds to participate in the livestock support component, and were thus excluded from the program’s main components. Reviewing the sustainability of the Emel Program, the evaluation also
87 The Emel Program included a national network of subsidized food shops (the Boutiques Emel), restocking of cereal banks (the Village Level Food Security Stocks (SAVS)) and an emergency food distribution program. It also included a large-scale livestock support program designed to protect the country’s livestock herds from depletion, and the rural economy, which is greatly dependent on pastoral activities. (World Bank 2014b)
83
Nigeria
Moza
mbique
Maurit
aniaSSA
Mali
Tunisia
RwandaTogo
Niger
Senegal
Mala
wi0.0
0.5
1.0
1.5
2.0
2.5
3.0
3.5
4.0
0
2
4
6
8
10
12
14
16
18
%GDP % Expend (Right axis)
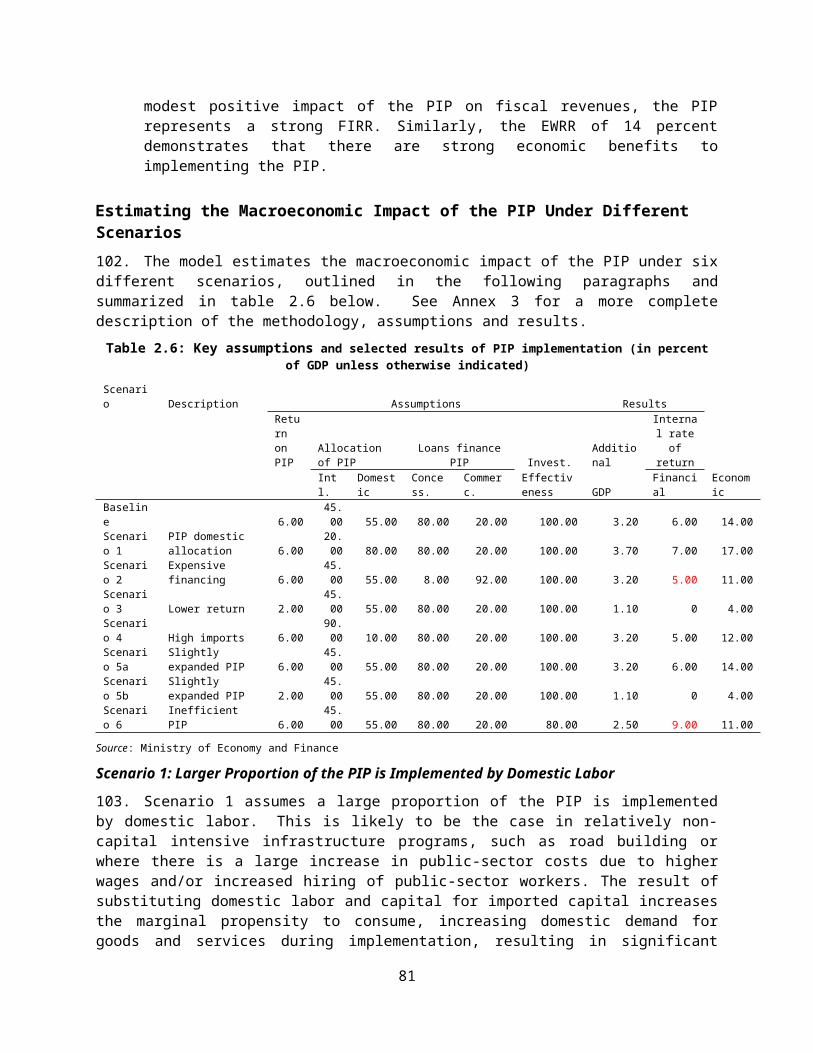
found that the government’s decision to distribute food on a large scale via the Boutiques Emel was appropriate in the context of the immediate emergency and more cost-efficient than using the private sector. However, beyond the crisis response, the costs of setting up and maintaining the shops are not sustainable and are higher in logistical terms compared to other programs (i.e. cash or voucher programs) and associated with a high risk of loss (spoiled food, losses, or theft). The government therefore needs to complement its emergency food-based program with investments in long-term interventions that address chronic poverty and build resilience against shocks (i.e. health and education services or cash transfers) (World Bank 2014b).151. Mauritania has also initiated investments in the Senegal River Valley and the southeast explicitly targeting poverty. Spurred by the need to mitigate the 2011 food crisis, the government supported six pro-poor interventions in irrigated agriculture along the Senegal River Valley as well as gardening initiatives in wetlands (Kankossa, Tamourt En Naaj, and Mahmouda) in the south east of the country. Local unemployed farmers received government support in the form of free land plots, fertilizer, equipment, and assistance via extension services over the course of three years. The program succeeded in generating and diversifying income for more than 6,000 famers located along the Senegal River. Several factors contributed to the initial success of the program: (i) the interventions were conducted in a very short time on land for which social and technical feasibility studies had already been conducted, typically taking three years, hence allowing immediate cultivation of the land plots; (ii) about 3,000 hectares of arable land were distributed for free to local farmers in the Senegal Upper Valley; and (iii) a flexible credit scheme was introduced for input subsidies (depending on income level, repayment rates varied between 30, 40, and 50 percent), accompanied by the cancellation of old inherited loans. Input support was gradually reduced over the three-year intervention period to enhance sustainable local irrigation management. Despite the initial success in the first years, the land plots were not further cultivated after government support ceased.152. Some lessons can be derived from this pioneering experience for potential wider application: (i) given the small size of land plots (around 1 hectare per household), the government needs to provide continuous support in the form of land maintenance services; (ii) the importance of addressing the issue of land tenure in the Senegal River Valley; and (iii) the need to provide resource-conserving technology (such as solar- or hydro-powered pumps) to sustain the investments and livelihoods.
Weak Administrative Capacity and Insufficient Research and Investment Need to be Addressed
153. Funding by development partners has overtaken the government’s own resources as the main source of agriculture funding, and the private sector has been crowded out by the public sector. While domestic resources have increased on average by 25 percent since 2011, donor aid increased by 91 percent. As a result, donor aid increased from 33 percent of total appropriations for the sector in 2011 to 58 percent in 2014. Private investment has been sluggish in the sector, with one explanation possibly being the government’s policy of promoting win-win partnerships, notably for irrigated farming. In an effort to leverage private resources, most private investors benefit from an attractive and comprehensive package of services, including the free granting of land rights in the Senegal River basin and the provision of agricultural and seasonal credits for plot development. This incentive scheme, however, has been prone to rent-seeking behavior and has had an adverse impact on private investment. 154. The largest share of the sector’s domestically funded resources is devoted to administration, while several core functions and priorities are being underfunded or not funded at all. In Mauritania, the Ministry of Rural Development is primarily responsible for the agriculture sector. More than two-thirds of the ministry’s budget is allocated to administration (central and regional) with the bulk of
84
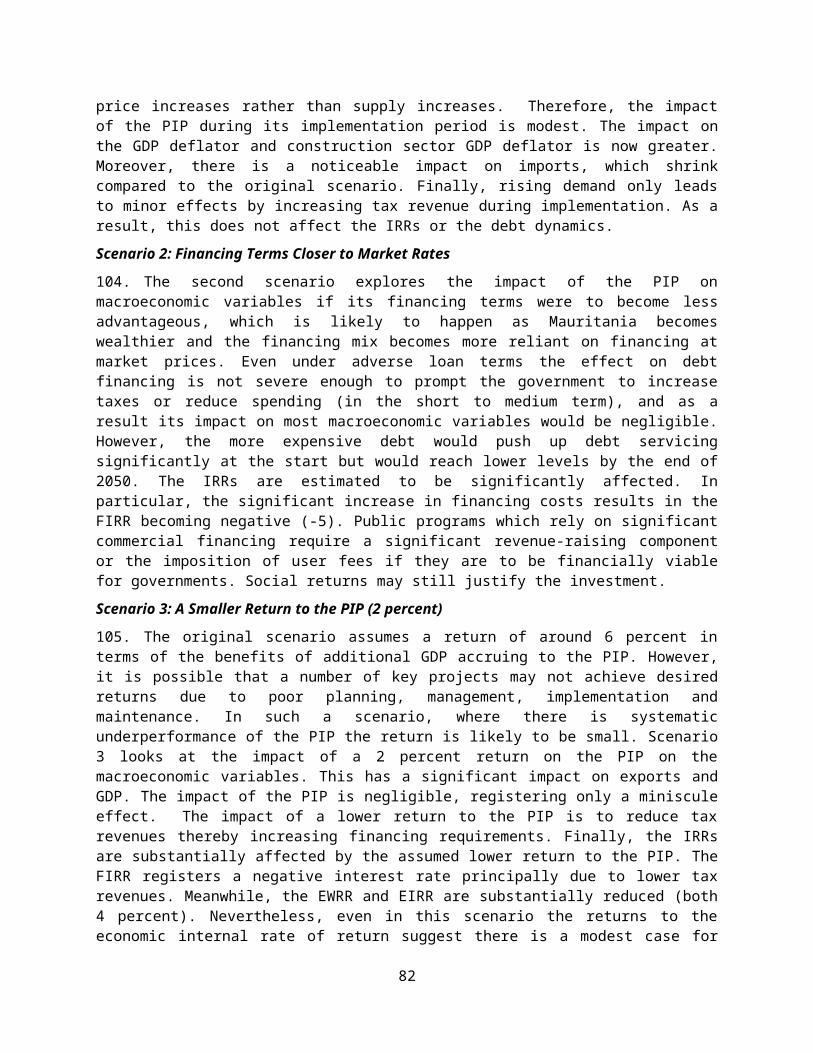
resources being managed by the Minister’s office (Figure 5.8). One-fifth of its budget is attributed to agriculture while less than 5 percent is directed to research, training and extension, livestock, and the fight against the locusts that have caused severe damage to crops. Even though the potential return on investments into generating and disseminating agricultural technology are considered high in West Africa (46 percent), core functions such as agricultural research and development (R&D) are highly underinvested in Mauritania, resulting in low crop variety, declining soil fertility, and insufficient crop and pest management.88
155. High administrative costs raise questions about the adequate distribution of responsibilities, programs, and staffing. For example, the Minister’s office has been carrying out some of the supervision tasks of the Department of Agriculture and the extension services. This not only raises concerns about the effectiveness and cost efficiency of these missions, but it also exacerbates the problems of the already underfunded and low-performing extension services. Only 2 percent of the total ministry budget is allotted to the locally based services. The civil servants in local offices are often unqualified, lack experience, and have been recruited through non-standard procedures.
Figure 5.8: Agriculture Budget Allocations by Function Excluding Donor Aid, 2010–13
Figure 5.9: Composition of the Agriculture Budget by Economic Category, 2010–13
2010 2011 2012 20130.0
2.0
4.0
6.0
8.0
10.0
12.0
Admin Agriculture Research/traing/exten. Livestock Locust fight
in M
RO b
illio
ns
2010 2011 2012 20130.0
5.0
10.0
15.0
20.0
25.0
30.0
Investment Subsidies & transfers SalariesGoods & services Unallocated credits
in MRO
billions
Source: Ministry of Economy and Finance. Source: Ministry of Economy and Finance.
156. The composition of the agriculture budget has reflected a policy bias towards traditional commodities in recent years. This is particularly the case for rice production; around one-fifth of Mauritania’s total agriculture allocations have been directed to subsidies and transfers in support of rice production and irrigation since 2011. Since 2010, subsidies and transfers have increased substantially, from MRO 0.2 billion (US$ 666,000) in 2010 to MRO 4.1 billion (US$ 13.6 million) in 2013. The marked spikes in spending in 2011 and 2012 can be attributed partly to input subsidies (seeds, fertilizers, and herbicides) distributed by the government under the agriculture irrigation program at the Senegal River Valley and partly to transfers supporting the Emel Program and the agricultural campaign.89 These
88 IFPRI, 2008 89 In response to years of droughts in the past, the government introduced the agricultural campaign seeking to provide support to farmers and promoting agriculture development. The support provided under the campaign has increased substantially since the 1960s and has become a regular program of the Ministry of Agriculture. The campaign provides a range of support grouped under the term of crop support assisting farmers accessing land, credits, agriculture inputs, markets, and
85
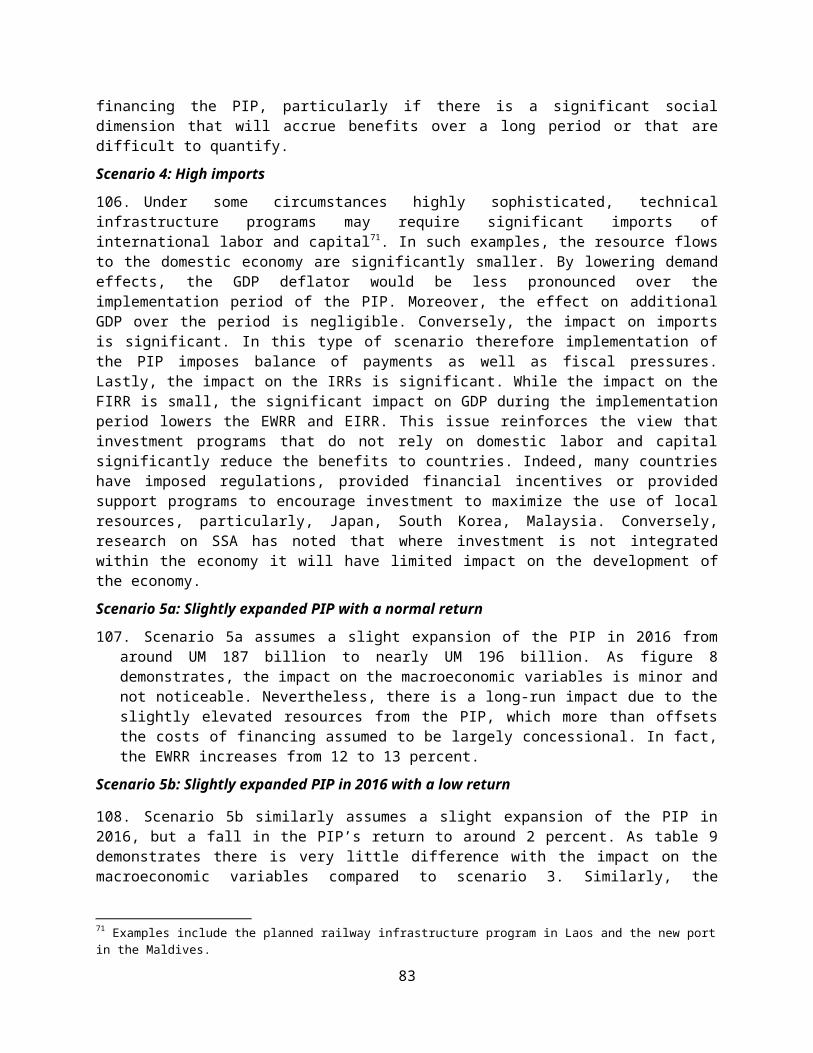
subsidies have played an important role in stimulating agricultural production, particularly of irrigated rice and recently wheat, but risk undermining efforts to promote efficiency and more sustainable agriculture. They have also raised equity concerns as a large share of subsidies have been biased in favor of input providers and larger producers. 157. Weak management capacities and a shortage of skilled staff pose significant challenges to the implementation of agricultural programs. Spending on salaries (15 percent of total agriculture spending) shows the lowest growth in real terms (4 percent) compared to all other spending items. Several recent staff assessments highlighted a number of shortcomings in the management of the agriculture staff: (i) a top-heavy administration, as evidenced by 142 staff in category A (management level) against 98 staff in category B and D (operational level); (ii) more than half of the salary spending is absorbed by the Minister’s office (48 percent of the staff are appointed to the cabinet of the Minister of Agriculture but they earn 62 percent of the ministry salaries); 90 (iii) lack of skilled staff to manage investment programs, and provide advisory and technical support; (iv) 137 non-categorized posts; and (v) insufficient separation of technical and policy/managerial functions, resulting in inefficiencies and affecting the quality of service delivery.158. The ministry benefited briefly from special unallocated credits but this practice has been eliminated since 2012. During 2010 and 2011, the Ministry of Rural Affairs obtained fungible credits from the state budget (accounting for 20 percent of total agriculture spending) to correct imbalances in its recurrent budget. These funds were used primarily to fund the Emel Program and the agricultural campaign. However, such practices distort fiscal discipline and undermine accountability over the use of public resources. The 2012 budget law reflects these concerns by adopting provisions to report these resources by source and destination.159. Public investments in the sector more than doubled in real terms between 2010 and 2013, representing almost three-quarters of the sector’s total budget. Public investment in the sector show an upward trend from MRO 7 billion (US$ 23.3 million) in 2010 to MRO 19 billion (US$ 63.3 million) in 2013. The scaled-up investments were aimed at increasing the amount of arable land (notably extending irrigated land at the Senegal River Valley and Aftout Saheli) and promoting job creation. Findings from the recent World Bank poverty assessment indicates that these objectives were achieved. The surface of cultivated land and agricultural output has increased significantly between 2008 and 2014. Small producers also increased their output and benefitted from increased prices, thereby increasing their incomes. The government has also attracted foreign direct investment (FDI) to develop large-scale agriculture projects but faces resistance from the local population who prefer the expansion of large-scale publicly developed perimeters.
Ineffective and Costly Subsidies Are Absorbing Too Much of the Government’s Resources for Agriculture
160. The domestically funded budget has suffered from overruns and underspending across all categories over the observed period. The management of subsidies and transfers is deficient as public spending has either exceeded budgetary allocations (148 percent in 2010 and 118 in 2013) or has been underspent (50 percent in 2011). This is particularly concerning given the size of the budget item. In 2011, the investment budget and unallocated credits were overspent to cover additional in-year needs for the various emergency programs (such as the Solidarity Program (2011) and the Emel Program (2012–15). In contrast, spending on salaries has been below budget appropriations (on average 89 percent) over the period under review; such underspending also occurred for goods and services (79
reinforcing capacities. 90 Note civil servants are under the cabinet’s budget while others (mostly non-permanent workers) are managed under the budget of the directorates and projects.
86
percent) and investment (74 percent) in 2010. This can be mainly attributed to weak budget planning for the part of the salaries and cumbersome procurement procedures and insufficient capacities for the latter two categories, resulting in low implementation of the respective budget items. There is an urgent need to improve internal systems for tracking, recording, and disseminating information about public spending in the agriculture sector. Information on disbursement of donor aid is often not timely available, which in turn impacts strategic planning and management of the externally funded programs for the sector. 161. Deconcentration and decentralization of specific functions of the agriculture sector could improve efficiency in the administration and service delivery. In practice, the ministry’s effectiveness on the ground is weak as the deconcentration of resources proceeding slowly. Only a small share of the budget (less than 1 percent of the total recurrent budget allocated to goods and services) has been deconcentrated to the local units, while expenditures subject to procurement continue to be approved by the central administration of the ministry. The centralization of the budget has been justified in part by the relatively weak capacity and demotivation of the staff posted in peripheral locations. However, as a result the front-line operations have almost no decision-making authority and are less able to provide services to farmers, such as educational services on the adoption and utilization of new scientific farming practices, guidance on the application of fertilizers, or crop management sequencing. 162. Recourse to subsidies can be an attractive option in times of crisis as it is relatively simple to implement, quite effective, and produces visible results in the short term . Under the pressure of the food crisis in 2011, the government introduced a range of new subsidies to stimulate agricultural production, particularly rice production, make inputs affordable to farmers who could not buy them, and support poor households in rural areas that were most affected by the crisis. The subsidies aimed to support food price stabilization and job creation through discounts on input use and tax breaks. In 2011, the government set up a purchase and sale mechanism with controlled prices for locally produced rice, independent of market forces.91 The government also increased transfers to banks to support agriculture activities and financing systems (such as credits, insurance, and guarantees).92 The information available shows the level of funding is considerable, amounting to MRO 61 billion (US$ 203 million) or 15 percent of the national budget in 2013 (Didi 2015). The bulk of the resources (67 percent) was allocated to the Emel Program (the Boutiques Emel). The subsidies were successful in providing essential support to destitute communities and mitigating the food security crisis but their continuation in the aftermath of the crisis has raised concerns. 163. Subsidies may have crowded out private investment and there are risks that vested interests will prevent the government from reprioritizing spending to other areas. Given that the government has consistently increased spending on subsidies, there is a concern that this spending displaces long-term investments in capacity building, technology, and rural infrastructure. Another concern is that as the costs of subsidies rise, they displace government spending in other areas (such as market development, the development of harvesting and agricultural technology, research in soil conservation, and crop varieties). Subsidies may also be inefficient, as there is some evidence that they have not fully benefited small farmers but have increased profits of the wealthier groups (huskers, transporters, input providers, and rice suppliers). Despite their relatively weak progress in raising incomes and increasing agricultural productivity, the subsidy programs are politically popular, increasing the risk the government will have difficulty in rolling them back.
91 For instance, through these mechanisms the government pays a subsidy of MRO 92 per kg that covers almost 70 percent of the sale price.92 These include National Union of Agricultural Cooperatives and Saving of Mauritania ( UNCACEM), Fund for Deposits and Development (CDD), National Union of Cooperative Savings and Credit for Livestock (UNCECEL) and Mutual Investment and Credit Oasis (MICO).
87
164. The design and efficiency of Mauritania’s agriculture subsidy system also show shortcomings. Mauritania’s agriculture subsidy system is costly due to the large gap between the price at which the public or private dealers buy seeds and farm equipment in the market and the price at which they sell them to the government, which in turn distributes them to the farmers. The system also has other inefficiencies:
There are large differences between the amount of fertilizer distributed, according to administrative documents, and the amount effectively used by the farmers based on the acreage declared to the Fund for Deposits and Development (Caisse de Dépôts et de Développement; CDD) by farmers to obtain fertilizer based on a preferential loan (currently 300kg/ha). Farmers may use less than they have declared and sell the excess at market price to agribusinesses.
Low-quality fertilizer and rice seeds are being sold at high prices to the farmers—imported fertilizer is being purchased abroad at a low price and low quality and sold at a fixed high price to the farmers. The current urea content is 46 percent instead of 22 percent, resulting in an increase of use from 300 kilograms of urea per hectare to 700 kg/ha.
The availability of inputs is delayed, resulting in delayed planning—delays can take up to 5–6 months due to a chain of approvals and transfers of resources from the government to the CDD, to the Mauritanian Company of Import and Export (Société Nationale d'Importation et d'Exportation; SONIMEX) and finally to the farmers. Likewise farmers face similar delays for payment; they have to sell their rice at a fixed cost to the milling plant but are only paid several months later.
It encourages the production of poor-quality seeds—subsidies can have the perverse effect of discouraging the production of higher-quality seeds as there is only one fixed price for all categories of rice.
Key Areas for Reform
165. Looking ahead there are a number of key areas for reform in the sector. Despite the attractive nature of subsidies for some interest groups, the system of subsidizing inputs and administering prices carries significant inefficiencies and inequities. In an effort to address this, the government recently adopted a new decree that eliminates all rice subsidies. As the decree has not yet become effective, it provides an opportunity for the government to implement it in the context of a new approach or reform strategy that may include the following reforms:
Ensure that funding, distribution of responsibilities, and staffing corresponds to core functions and sector priorities. With the recent creation of a separate Ministry of Agriculture, it would be important to review the Ministry’s 2015 budget in view of improved funding of core functions (such as R&D, extension services...) in comparison of the Ministry’s administrative functions. Responsibilities and staffing should also be reviewed to ensure it supports the sector’s efficient operation (i.e. the supervision missions to be conducted by the responsible executing agency) and front line units.
Develop a transition strategy. The change from a publicly controlled market system to a market-oriented one may need to be implemented gradually over several years. Such a transition period would allow farmers and private operators to adjust to changes in prices and services. The preparation of a transition strategy constitutes a priority to allow a transparent and predictable implementation of the reforms. This transition seems to have started after the government declared in December 2015 that it was not willing to set a price for nor buy locally produced rice. This cold turkey strategy is much more effective than a gradual one, but may be
88
more difficult to implement politically. A transition strategy carries some risk as it could allow those who are benefiting from the current situation (most of whom are in control of the current system) to prolong the transition or even block it altogether.
Assess the impact of eliminating rice subsidies on the poor. Experience from other countries that have successfully eliminated crop price support show the importance of (i) compensating farmers for potential income loss, (ii) educating them about new support programs, and (iii) providing technical assistance. The government’s recent cut off of rice subsidies might have a significant impact on the poor. To identify appropriate mitigation measures it should assess the impact of the elimination of rice support subsidies on the lowest income groups and identify appropriate compensations mechanisms, such as direct cash transfer to farmers.
Review options for smart subsidies. Production support for rice (from input subsidies to marketing assistance and price setting) is fiscally expensive and inefficient. Assessing the use of “smart subsidies” could help establish a more efficient system of production incentives (Box 5.1).
Gradually close the Boutiques Emel.
safety net interventions, invest in social services, and strengthen measures addressing market imperfections. The gradual closing of the Boutiques Emel could be carried out alongside the introduction and reinforcement of existing programs. In the first phase, the government could (i) orient the Emel Program toward rural areas by strengthening shops in those areas, (ii) reprioritize safety net interventions that target the poorest populations (for example scaling up the country’s cash transfer program, developing a mechanism for vouchers and reinforcing the cereal banks SAVS), and (iii) assessing the effectiveness of the market for basic food items. In the second phase, it needs to gradually close the Boutiques Emel, starting in areas where the cash transfer program is established and the private market is well functioning (World Bank 2014b).
Build on the experience of the investments in the Senegal River Valley and further upscale this program. Drawing on the successful experience of the initial pro-poor investments in the Senegal River, the program should be further expanded in the Valley as well as to other areas suitable for such an intervention. The program should ensure support in the form of land maintenance services is provided, land tenure issues are addressed and resource-conserving technology are provided to sustain the investments and livelihoods.
Increase sustainable investments in the agriculture sector. A gradual winding down of subsidies would free substantial public funds to be allocated to other priority investments in the sector. To promote productivity growth, priority should be given to investing in market infrastructure, agricultural technologies and institutions. The reallocation of public funds to R&D, technology promotion and adoption, and education could also significantly help increases yields and
89
Box 5.1: Principles for Smart Subsidies
Subsidies should be (i) targeted as effectively as possible at resource-poor farmers, (ii) work with the market (for example by giving vouchers to farmers rather than have the state distribute subsidized fertilizer), and (iii) time bound, with a clear schedule for phasing out when they have achieved their purpose. Indexation is a possible way of avoiding an indefinite government commitment.
An example of such subsidies are “market-smart” fertilizer subsidies that promote fertilizer as part of an integrated package of improved crop-production technologies, coupled with measures focusing on the demand for fertilizer.
Source: World Bank, Practitioner’s Toolkit for Agriculture Public Expenditure
production efficiency. The recent preparation of Mauritania’s participation in the West Africa Agricultural Productivity Program (WAAPP) provides an important opportunity for the country to benefit from the assistance provided under this program in capacity building and adopting improved technologies.
Encouraging private sector investment through public-private partnerships (PPPs). The establishment of effective PPPs, supported by an improved business environment, can support the agricultural commercialization process, provide greater certainty on employment, and improve risk-adjusted returns to investments in agriculture. The government, with the support of the World Bank is currently funding a study to assess the use of PPPs in the livestock sector (notably for red meat). For the agriculture sector, it is recommended that Mauritania should assess opportunities for the use of PPPs in the red meat, milk production, and rice value chain which would contribute significantly to the sustainable development of the sector.
Fully deconcentrate extension and advisory services for agriculture. Fully deconcentrating certain agricultural activities, notably extension and advisory services, could offer benefits including: (i) the timely provision of services (i.e. in case of a disease), (ii) a closer identification of farmers’ needs and increased specialization by an extension service, and (iii) the creation of incentive structures to reward the extension service for responding effectively to local needs (World Bank 2014b). To fully reap the benefits of deconcentrated services and authorities, Mauritania will need to simultaneously build capacity in the local units while gradually devolving and delegating resources and staff to front-line services. The central administration might be also need to accompany these efforts with cultural changes among centrally based bureaucrats towards the policy choice of pursuing deconcentration.
90
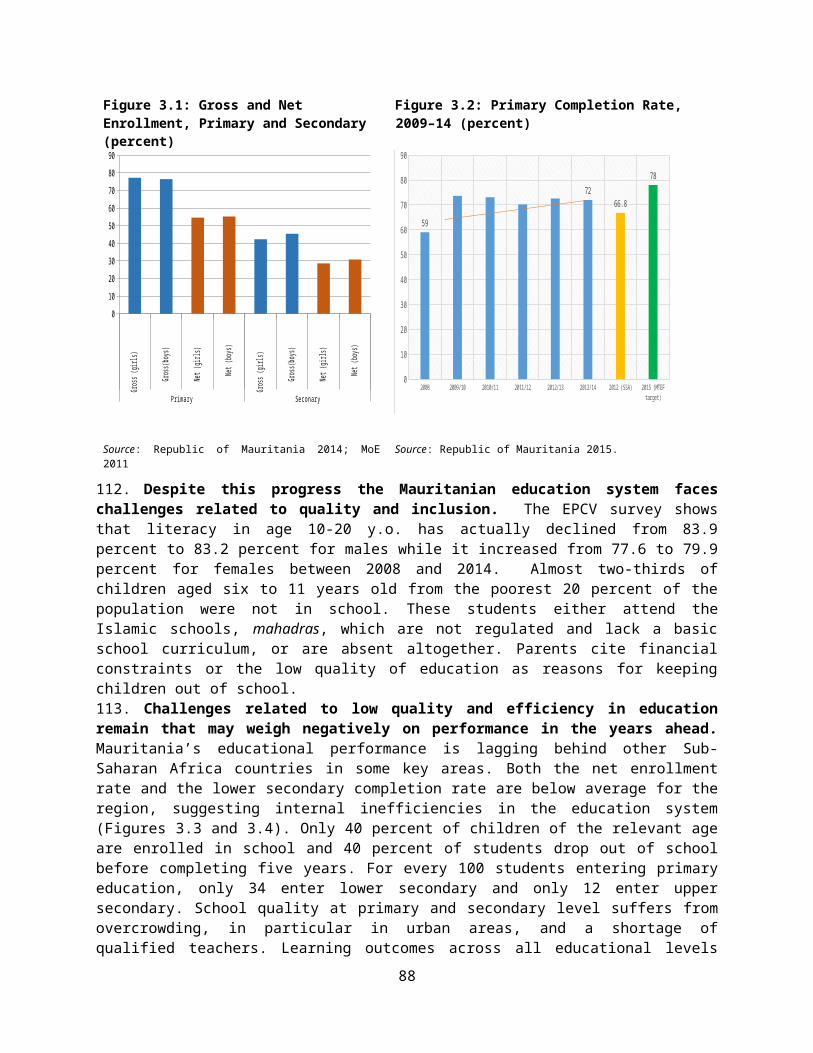
Chapter 6: Use of Resources in the Energy Sector
Progress on Increasing Supply of Energy, but the Sector Remains Highly Vulnerable to Rising and Volatile Oil Prices.
166. Mauritania has made significant progress towards the achievements of its objectives in the energy sector over the last years. The policy priorities of the energy sector included in the 2001–15 Poverty Reduction Strategy Paper seek to: (i) improve the supply of electricity and access; (ii) promote rural electrification and renewable energy; (iii) implement a policy based on a mix of more efficient energy choices; (iv) ensure regularity of liquid hydrocarbon supplies in the context of healthy competition and the safety of people, property, and the environment; (v) increase the supply of butane gas to reduce demand for forest fuels; and (vi) strengthen the capacity of the sector. Over the past years, the government has implemented an ambitious investment program that emphasizes reducing energy costs by enhancing less-polluting and renewable energy sources. As a result, Mauritania went from a chronic electricity shortage in 2008 to a surplus in 2014 that can be exported.93 The increases in installed capacity by 250 percent can be in part attributed to continuous investments in thermal energy but also in part to renewable energy (solar, wind, and hydroelectricity).94 According to the 2014 International Finance Corporation (IFC) enterprise survey, several of Mauritania’s sector indicators (such as the number of power outages or shortages per month and delays in obtaining a connection to electricity) are above average for Sub-Saharan Africa and lower middle-income countries (IFC 2014; Figure 6.1). Access to energy has improved substantially in recent years with one-third of Mauritanians having access to electricity in 2014 (Figure 6.2). Nevertheless, a comparison with other countries suggests Mauritania still remains below the Sub-Saharan Africa average (35 percent).95
93 The total installed capacity (national park production – excluding production for mining sector use) increased from 88 MW to 310 MW between 2008 and 2014. In addition, the current power capacity from the available interconnected network (Nouakchott, Rosso, and Kaedi Boghé) totals 205 MW while the total peak demand of cities connected to the interconnected system is 101.5 MW, resulting in a surplus of 103.5 MW.94 The government commissioned the Sheikh Zayed 15 MW solar plant in Nouakchott, and constructed a 30 MW wind power plant. In addition, the government commissioned in October 2015 a 180 MW dual fuel power plant (Centrale du Nord) that is currently running on heavy fuel oil and can run on natural gas once gas from Banda reservoir is made available. Rehabilitation and better management of OMVS hydroelectric plants in Manantali and Felou are also contributing to the increased capacity.95 Data for international comparisons are taken from the World Development Indicator database but are only available for 2012.
91
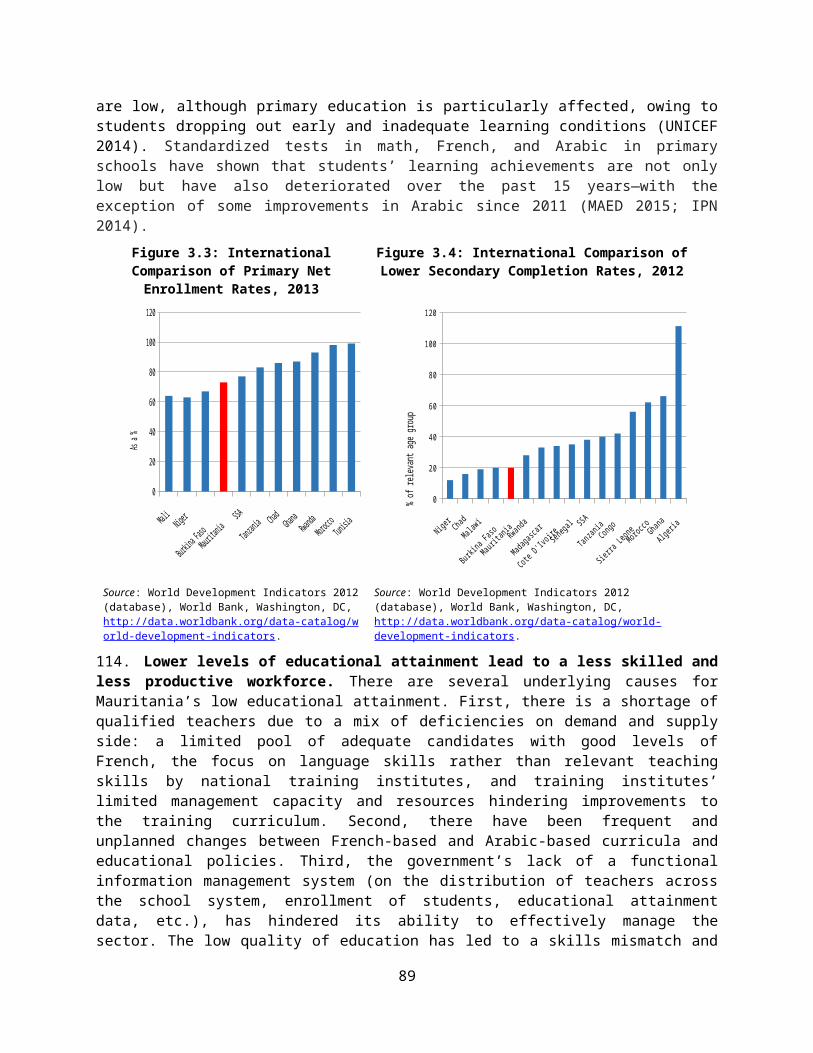
Figure 6.1: Number of Power Outages per Month and Delays in Obtaining an Electrical Connection (days),
2014
Figure 6.2: Electrification Rate (percent of households), 2008 and 2014
Source: IFC 2014. Source: MPEM (2014).
167. Mauritania has an opportunity to scale up its renewable and clean energy sources, reducing costs and generating growth. Recent efforts to jumpstart renewable energy generation means it now makes up 16 percent of Mauritania’s total capacity, although heavy fuel oil (HFO) remained the main source of energy, at 84 percent in 2014. Electricity demand (excluding mining) is forecast to grow by 9 percent per year until 2020 (World Bank 2014c). To cover the energy demand, the government plans to further enhance the energy mix. The country has significant renewable resources that could, if scaled up, can account for 35 percent of Mauritania’s capacity by 2035.96 Renewable energy sources can reduce the cost of electricity by providing services for off-grid populations and enable energy exports. 168. While considerable progress has been made in access and production in recent years, the energy sector still faces considerable challenges on the policy, infrastructure, and investment front. Despite recent improvement in electricity coverage, rural electrification remains very low: only 4 percent of the rural population have access to electricity. Low population density in a mostly desert country makes interconnection difficult and affects electricity production cost. Alongside this, old transmission and distribution systems impede private-sector development and improvements in the population’s living standards.169. Mauritania’s challenges are not only physical in nature, they are also economic, financial, legal, regulatory, and institutional. Given the dominance of oil-based electricity generation, the sector remains highly vulnerable to rising and volatile oil prices. It lacks sound energy strategies and policies, and its legislative and regulatory framework are insufficient. Its electricity tariff structure fails to accurately reflect the costs of generation and its national utility company, SOMELEC, 97 is financially
96 The country has significant potential in solar energy (its estimated solar photovoltaic potential is 2,000–2,300 kWh/m2/year, with the lowest radiation measurements being on par with the highest solar resources in Southern Europe), wind (the values are similarly high but are more localised around coastal areas), small hydropower (through the Senegal River (OMVS), and biomass (IRENA 2015) 97 SOMELEC has been struggling with heavy debt repayments and a widening deficit due to high generation costs dependent on oil-based thermal generation capacity and low electricity tariffs, resulting in reliance on government subsidies. The more electricity SOMELEC sells, the larger the debt it incurs. The scattering of production and distribution facilities over a vast
92
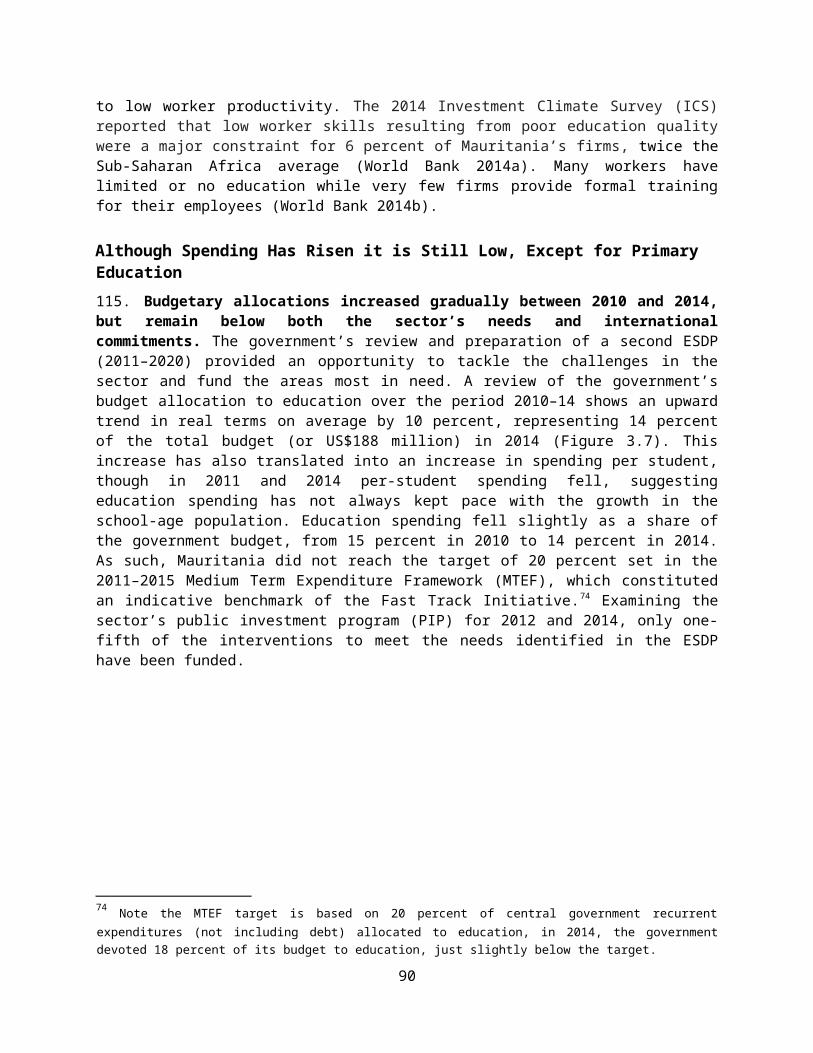
insolvent, with limited capacity to implement infrastructure projects due to poor financial management. Private-sector participation in energy is lacking due to the absence of a legal and regulatory framework, inadequate administrative capacities, and weak public governance that has dampened enthusiasm for public-private partnerships (PPPs). These factors all hamper the investment the electricity system needs and the enhancement of Mauritania’s energy mix—the latter is critical for reducing cost and the country’s fiscal risk. To address some of these flaws, the government has put in place a sector recovery plan to improve the power companies’ financial performance with some tangible results. 170. The development of the Banda Gas-to-Power Project was projected to substantially reorient Mauritania’s energy mix away from imported oil and towards domestically produced gas in 2016/17. The project, supported by World Bank guarantees, consisted of the following components: (i) the Banda offshore gas field production, transmission, and processing infrastructure; (ii) a 300 MW gas-to-power plant located in the north of Nouakchott; and (iii) existing and new power transmission lines to distribute power. Out of the 300 MW of power generated, Mauritania would be able to sell 125 MW to mining customers and the public utility, and export 125 MW to Senegal and 50 MW to Mali. Unfortunately, the project suffered a setback after the departure of the main private investor, Tullow Oil, in late 2014 against the backdrop of declining oil prices. As a result, Banda gas has not yet been developed; out of the 300 MW planned, 180 MW were commissioned late 2015 and are now running on HFO. A review of the project’s fiscal and regulatory requirements was conducted by the Bank and a technical and financial advisor, suggesting the development of the Banda gas field through a PPP structure. The government has recruited strategic and legal advisors to support it in restructuring the project and the recruitment of a new gas operator.
Subsidies are Driving Up the Energy Budget While Investment in Renewables Lags Behind…
171. Budgetary allocations to the energy sector have more than quadrupled in real terms between 2010 and 2014 with a slight drop in 2015.98 Between 2010 and 2014, total budget appropriations to the energy sector have increased substantially in real terms (by 44 percent) and as a share of the national budget (from 5 percent in 2010 to 14 percent in 2014, see Figure 6.3). The increase in the sector’s budget is partly attributable to the government’s fuel subsidy program, launched in response to spikes in the international fuel prices in 2008 and 2011. It is also partly due to the scaling up of investments in electricity, driven notably by a rise in development assistance. The upward trend reverses slightly in 2015 as shown by an 18 percent decline in real terms from the previous year. On the whole, budgetary allocations to the sector totaled 2.5 percent of GDP or US$150 million in 2015. A Master Plan for the Production and Transport of Electricity was adopted in 2012 focusing on energy supply using a combination of natural gas and HFO as the fuel of choice. This was complemented by a recently prepared three-year rolling Energy Action Plan 2015–17, to better plan investments. The sector’s investment needs for the five years between 2013 and 2017 were estimated at US$468 million (US$265 million for production, US$158 million for transport, and US$47 million for distribution) (SNC LAVALIN 2013). However, the sector’s investment planning is weak (lacking least cost expenditure planning, indicators, and so on), hampering the effective strategic management of the sector as well as fiscal and physical sustainability.
territory have affected production management. Low levels of bill payment from private and public-sector consumers, and technical and commercial losses have further adversely impacted the agency’s financial and operational performance.98 The Ministry of Petroleum, Energy and Mining is responsible for the management of the energy sector.
93
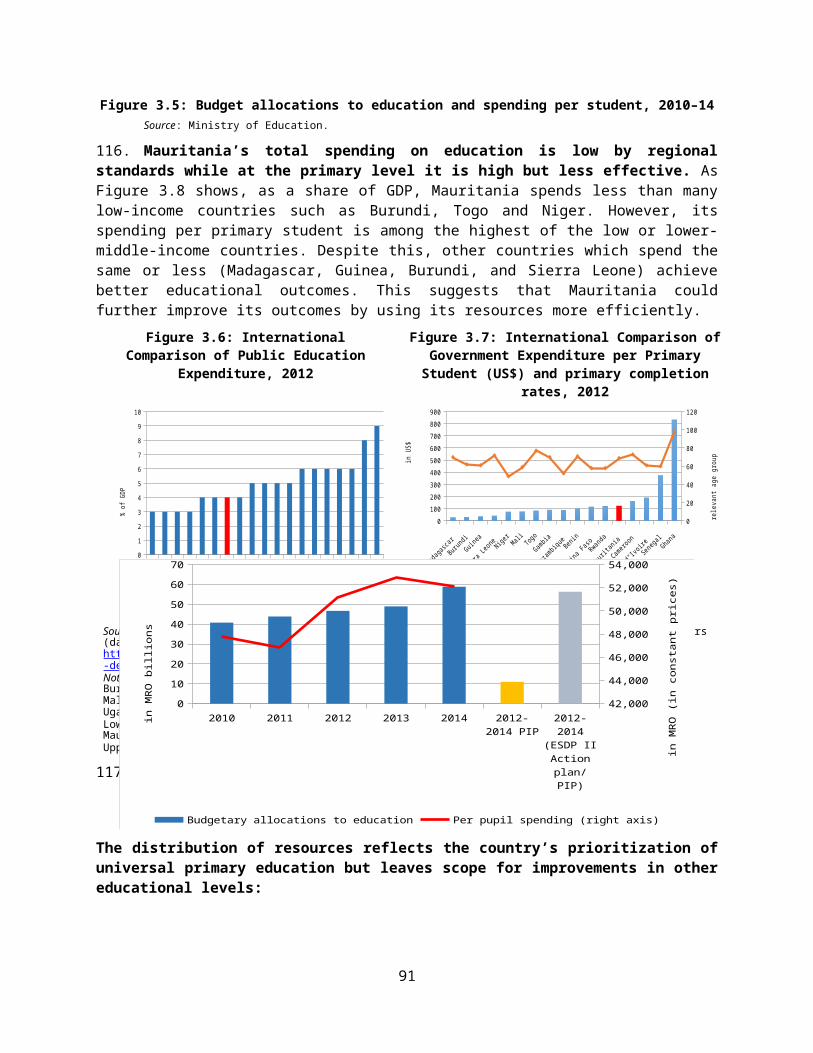
Figure 6.3: Government Allocations to Energy, 2010–15 Figure 6.4: Composition of Energy Sector by Subsector (in MRO Billions) 2010–15
2010 2011 2012 2013 2014 2015 2013-2017
(Master Plan)
0.020.040.060.080.0
100.0120.0140.0160.0
0.02.04.06.08.010.012.014.016.0
Budgetary allocations Master planShare of National Budget (right axis)
in MRO
billion
s
in %2010 2011 2012 2013 2014 2015
0.0
10.0
20.0
30.0
40.0
50.0
60.0
70.0
Electricity Gaz Renewable energy Commun expenses
in MRO
billions
Source: Ministry of Economy and Finance. Source: Ministry of Economy and Finance.
172. The distribution of public resources reflects the government’s priority of expanding access to electricity, though recent investment in less polluting and renewable energy sources show a promising upward trend. On average, three-quarters of the total energy budget goes to support the electricity sector, reflecting the government’s gains in providing access to electricity over the past years. Public resources in favor of clean energy have mainly focused on butane gas subsidies while investments in natural gas exploitation have been mainly carried out by a mix of public and private investors, together with development partners. Recent years show a substantial increase in government spending on renewable energy (notably wind and solar power), rising from 1 percent of total energy investment appropriations in 2010 to 22 percent in 2015. Even though this funding level is still far from the level needed to initiate the country’s transition to large-scale use of renewable resources, it is already considered a leader in the sub-region in the installation of renewable energy projects (IRENA 2015).
...And Have Proved Highly Regressive Particularly for the Rural Poor
173. Energy access initiatives have successfully increased access to electricity services among the urban poor, but the rural poor remain at a disadvantage. Access to electricity significantly improves households’ conditions and promotes the economic activities of the most vulnerable populations. Extensive evidence suggests that rural electrification has substantial benefits, promoting production and better health and education for households (Torero 2014). A report by the World Bank’s Independent Evaluation Group (IEG 2008) showed that the rates of return on rural electrification projects justify the investment. Nonetheless, similar to other Sub-Saharan African countries, the high cost of providing electricity services in lightly populated, remote places with difficult terrain, low affordability, and greater electricity loss due to long distances, have hampered investments in rural electrification. Even though the government’s commitment to rural electrification is documented in its development plans, only a small share of the investment in the sector went towards rural electrification, implying political
94
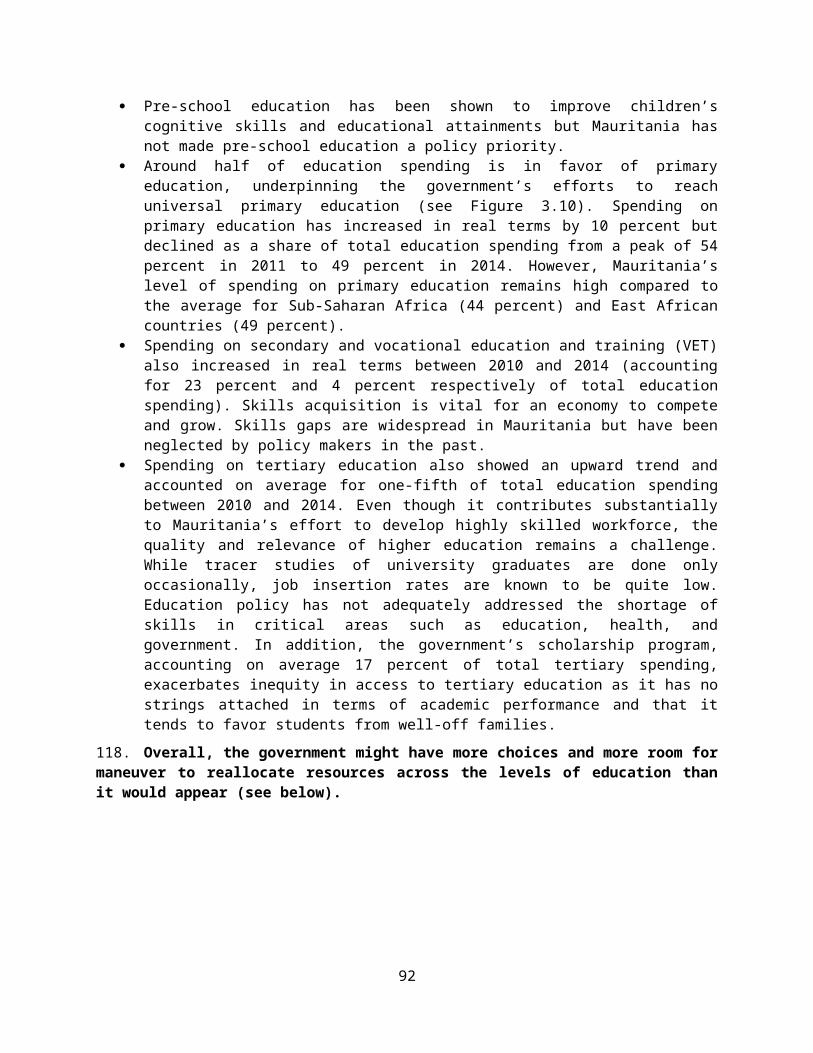
reluctance to invest in energy services in rural areas. Nonetheless, the government’s investment in urban electrification targeting populations on the outskirts of the cities has successfully enabled access for urban poor communities, improving their quality of life and socioeconomic status. 174. Traditional biomass energy is the main source of energy for most of the rural population, but this is associated with significant negative impacts on health and the environment. The main use of energy in households is for cooking, followed by heating and lighting (IEA 2006). Given the low levels of electrification in rural areas in Mauritania, most of the population depend on non-commercial energy resources for their needs. Traditional biomass, such as fuelwood, charcoal, agricultural waste, and animal dung, provides 64 percent of primary energy consumption. However, when biomass is used as the primary fuel for cooking, it is usually burned inefficiently, resulting in substantial emissions of air pollutants that affect human mortality and morbidity rates, especially for children (Yeh 2004). Reliance on biomass for energy can also adversely impact education, income, and the environment (IEA 2006). 175. Mauritania’s energy subsidy program, introduced in 2011 in response to increases in oil prices, is intended to protect the consumption level of the entire population but has proved highly regressive. In response to fiscal pressures due to high oil prices and an increased wage bill, Mauritania’s fiscal adjustment strategy included energy subsidies to support much needed social spending while allowing for budget cuts in other areas. The purpose of the energy subsidy program was twofold: (i) to give low-income households in forest communities access to free butane bottles for cooking, generating positive externalities with respect to income, health, and the environment; and (ii) to enhance access to affordable energy for poor families by subsidizing electricity costs. Despite the intention to achieve some type of redistribution to the poor, the government has recognized that—similar to the experience of other countries—the program strongly favored the rich at the expense of the poor. According to the IMF, only 13 percent of the electricity and butane gas subsidies were captured by the poorest 40 percent of households, thus contributing to income inequality rather than reducing it (Figure 6.5).
Figure 6.5: Share of Electricity and Gas Subsidies Received by the Poorest and Richest Quintiles, 2011
Source: IMF 2013.
The Government Has Become Dependent on External Assistance
176. Mauritania’s funding policy for the sector has put an emphasis on energy subsidies since 2011; though the Government was able to capitalize on the recent low oil prices and reformed its subsidies in 2015. Between 2010 and 2014 subsidies and transfers accounted on average to more than one-third of total sector appropriations, largely financing subsidies for butane gas and electricity. At their peak in 2012, energy subsidies amounted to 4 percent of the national budget and 1 percent of GDP. Despite a modest drop in 2013, appropriations for both subsidies remained high, at MRO 14 Billion (US$ 46.6
95
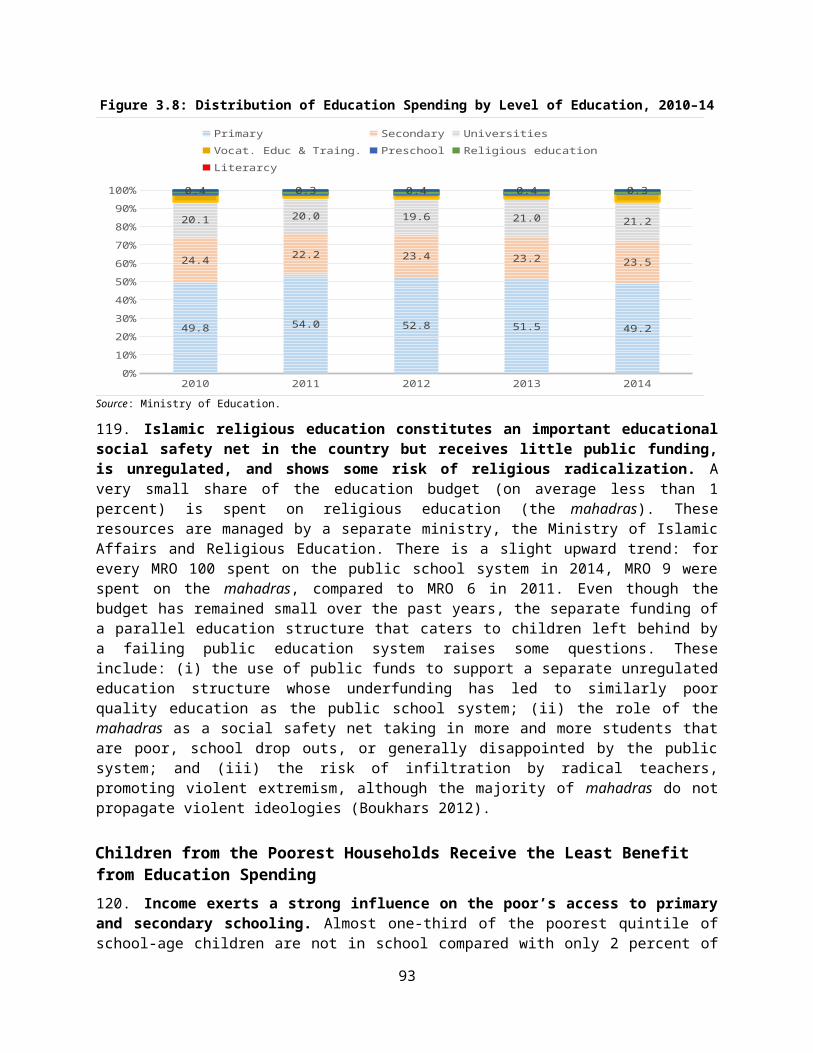
million) (Figure 6.6). These subsidies have not only been a drain on the budget but in some ways have undermined, rather than advanced, sustainable energy by diverting public resources away from investing in alternative energy sources or pro-poor programs in the sector. The recent decline in international oil prices has given the government an opportunity to revise Mauritania’s subsidy policy with limited social and economic backlash. In 2015 the government removed the electricity subsidies and cut subsidies for butane gas to MRO 7 Billion (US$ 23.3 million), freeing up resources for other much needed social and infrastructure spending.99 177. Spending on salaries and goods and services has been low, adversely affecting the performance of operations and services.100 Appropriations for salaries have seen a modest increase but remain below 2 percent of total budget appropriations. Likewise, goods and services have accounted, on average, for less than 2 percent of the ministry’s total budget between 2010 and 2014, despite tripling in 2014. The investment budget increased more than threefold between 2010 and 2015 (from MRO 10 billion - US$ 33.3 million to MRO 40 billion – US$ 133 million), and despite a drop in real terms in 2015, its share of the total sector budget still amounted to 83 percent in the same year. Given these substantial investment flows in the sector over the past year, the low funding level of goods and services suggests insufficient attention is being paid to the incremental recurrent costs attributable to the increase in capital spending. These in turn can affect the operation and maintenance (O&M) expenditures needed to ensure the sustainability of an investment.
Figure 6.6: Composition of the Energy Budget by Economic Category, 2010–15
Figure 6.7: Composition of Subsidies, 2011–15
2010 2011 2012 2013 2014 20150.0
10.0
20.0
30.0
40.0
50.0
60.0
70.0
Investment Subsidies & transfers Salaries Goods & services
in MRO
billions
2011 2012 2013 2014 20150.0
1.0
2.0
3.0
4.0
5.0
6.0
7.0
8.0
9.0
10.0
Electricity Butane gas
in MRO
billions
Source: Ministry of Economy and Finance. Source: Ministry of Economy and Finance.
178. Most of the sector’s growth in investment has been driven by development assistance, challenging budget credibility and contributing to a dual budget system. Domestically funded investments in the energy sector have been less of a priority for the government over the past years; despite some fluctuations, budget allocations for investments show a downward trend, declining by 72 percent in real terms between 2010 and 2015 (from MRO 10 billion to MRO 3 billion respectively – US$
99 IMF, The Islamic Republic of Mauritania – 2016 Article IV Consultation, January 2016100 Note energy subsidies have been managed in the past through special accounts but were included in the Ministry of Petroleum, Energy and Mining’s (MPEM) budget since 2010 to enhance budget transparency.
96
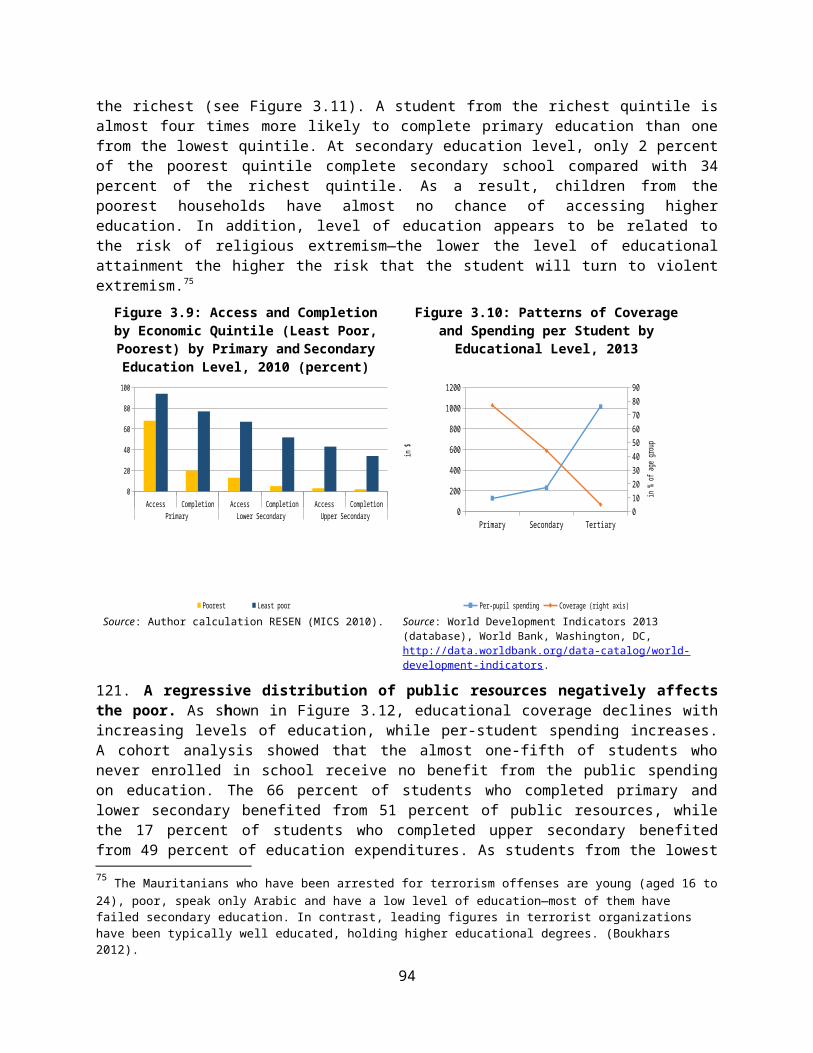
33.3 to US$ 10 million). Most of the government’s investments were to support the electricity expansion in the two largest cities, Nouakchott and Nouadhibou, as well as a few new rural electrification locations. As in other countries in the region, the government’s limited resource envelope means much of the financing for energy sector investments in Mauritania comes from international development partners, rising from 21 percent of total sector funding in 2010 to 66 percent in 2014.101 179. A review of donor projects over the period 2010–14 found the bulk of assistance concentrated on electricity projects in Nouakchott and Nouadhibou, while only a few benefited rural electrification.102 However, development assistance has played a critical role in supporting renewable energy, especially in the last three years. The off-budget nature of donor aid is also further exacerbating the problem of a separate recurrent and investment budget. As it is less likely that sufficient funding for O&M will be secured for externally funded investments in the domestic budget, this could further affect the financial sustainability of these investments.
Figure 6.8: Composition of the Investment Budget by Sources of Funding, 2010–15
Figure 6.9: Composition of the Energy Budget by Sources of Funding, 2010–15
2010 2011 2012 2013 2014 20150.0
5.0
10.0
15.0
20.0
25.0
30.0
35.0
40.0
45.0
Externally funded invest Domestically funded invest
in MRO
billion
s
2010 2011 2012 2013 2014 20150.0
10.0
20.0
30.0
40.0
50.0
60.0
70.0
External allocations Domestic allocations
in MRO
billion
s
Source: Ministry of Economy and Finance. Source: Ministry of Economy and Finance.
180. Public investments in the energy sector, particularly externally funded ones, suffer from a low budget execution rate. Several domestically funded investments included in the 2013 budget were cut due to absorption constraints of the Ministry of Petroleum, Energy and Mining (MPEM). These included priority projects supporting rural electrification (MRO 0.6 billion – US$ 2 million), renewable energy (MRO 1.2 billion – US$ 4 million), and SOMELEC (MRO 2 billion – US$ 6.6 million). Difficulties prioritizing, planning, and managing investment projects are further exacerbated by large parts of the investment budget being financed and executed off budget by development partners. A review of selected externally funded investments also shows challenges in absorbing externally funded public resources—execution rates range from 2 percent to 80 percent across the projects. This weak implementation
101 Many development partners are active in Mauritania’s energy sector. Several development partners (including Islamic Development Bank, European Union, Arab Fund for Economic and Social Development, French Development Agency, France, United Nations Development Program and Spain) have supported 20 projects with a focus on power generation facilities in rural areas, wind power plants, hybrid solar-thermal power station the modernization of the national electricity generation and transport system. (IRENA 2015).102 Note that AFD provided budget support to the sector; this is accounted in the total of donor aid but its use and destination cannot be assessed in detail.
97

performance is caused by a number of factors such as slow procurement process, weak technical capacity in budgeting and planning, and complex donor procedures. Nevertheless, the higher execution rates of domestically funded projects is partly a sign of weaker controls which increases the risk of procurement fraud and corruption.
The Financial Situation of SOMELEC has Improved, but Exposure to Fuel Oil Makes It Vulnerable to Price Increases181. The government has put in place a sector recovery plan to improve SOMELEC’s financial situation, but poor management and governance weaknesses remain a critical challenge. The sector recovery plan has five medium term components for SOMELEC: (i) reinforce sector oversight by the line ministry, including through an updated performance agreement between the government and SOMELEC; (ii) recapitalize the company through financial restructuring; (iii) urgently invest and rehabilitate generation and distribution infrastructure; (iv) improve commercial performance, including through introduction of pre-payment meters; and (v) restructure human resources and increase training. The recovery plan is being implemented with support from the Agence Française de Développement (AFD), and has included a consolidation of cross debts between the government and SOMELEC, and a recapitalization of the latter. Other recent measures include a performance contract between SOMELEC and the government but it lacks performance specifications (cahier de charge) and implementation decrees. 182. While efforts have been made to rein in technical and non-technical losses between 2010 and 2013, these efforts were not sustained in the last two years. SOMELEC has been able to reduce technical and commercial losses from 29 percent of 2010 to 23 percent in 2013 while improving substantially collection rate from 62 percent in 2010 to 82 percent in 2013. Unfortunately, global grid efficiency has fallen again, down to 70.7 percent in 2015, below the 2010 level (Table 6.1). Thus, the positive financial result posted in 2015 is mostly the result of the dramatic fall in oil price, over which SOMELEC has no control.
Table 6.1: SOMELEC’s Key Performance Indicators
2010 2011 2012 2013 2014 2015 Recent Trend
Number of Customers 124,153 144,090 161,091 178,258Net Generation (MWh) 516,489 524,688 586,249 641,560Billed Energy(MWh) 368,044 389,431 447,096 494,352 687,000Global Efficiency (Billed Energy/Net Generation)
71.3% 74.2% 76.3% 77.1% 75.45% 70.7%
Average Collection Rate 61.5% 63.0% 77.2% 81.7% From Government Agencies 8.7% 23.7% 45.7% 82.76% From Private Clients 88.1% 88.58% 89.16% 81.45%Average Sales Price (UMA/kWh) 70.9 70.9 73.0 70.3
Source: SOMELEC annual reports
183. SOMELEC remains financially insolvent and requires an urgent recapitalization. Between 2010 and 2014, SOMELEC’s income deficit has declined from MRO 12.1 billion (US$42 million) to about MRO 2.3 billion (US$7.8 million) in 2014 and this deficit turned into a surplus in 2015. 103 Also notable is the fact that SOMELEC did not receive any operating subsidy in 2015. Nevertheless, the consecutive years of negative earnings have taken their toll on SOMELEC’s balance sheet: its equity portion is negative in 2015 with paid-in capital of MRO 42.3 billion (US$141 million) versus a negative MRO 48 billion (US$160
103 SOMELEC, Budgets 2016 et 2015
98

million) of retained earnings. The company is currently operating on short, medium and long-term debt; it is technically insolvent. This testifies to the urgency of its need for a capital injection.
Table 6.2: SOMELEC’s Revenues, Expenditures, and Net Operational Results, 2010–15 (MRO Millions)2010 2011 2012 2013 2014 2015 Recent
TrendSales 23,693 25,149 28,981 31,508 35,145 40,257Other Revenues 150 1,026 1,059 1,238 1,544 1,200Operational Subsidies104 0 8,700 7,000 6,000 6,000 unknown Total revenues 23,843 34,875 37,040 38,746 42,688 41,547Fuel and Energy charges 21,907 26,426 28,882 29,361 31,230 26,774Other charges (SG&A, D&A, interest expenses, taxes…)
14,008 13,638 12,876 13,115 13,799 14,490
Total expenses 35,915 40,064 41,758 42,476 45,029 41,264Operating Income (12,072) (5,189) (4,718) (3,731) (2,341) 193
Source: SOMELEC Audited Financial Statements
Key Areas for Reform
184. There are some important reforms that the sector can undertake to enhance access and efficiency
● It is absolutely imperative to reduce grid losses by at least one-third. Without network and billing improvements, the electricity tariff, which is already high in absolute terms (20 USc/kWh), will need to be increased to bridge the gap between revenues and costs. SOMELEC has demonstrated that it has the capacity to reduce these losses between 2010 and 2013.
● Reduce reliance on imported fuel oil by pushing ahead with the Banda gas to power project. Currently the sector is heavily reliant on fuel oil for power generation, which happens to be competitive in the depressed oil price environment. However, the government is recommended to pursue the Banda Gas to Power project as the key strategy for diversifying its energy mix. The World Bank remains committed to the development of this project for the benefit of Mauritania, Senegal, and Mali, which all share a strong reliance on liquid fuels.
● Hedge itself against oil price variations for the short and medium term. Given the exceptionally low oil price environment, SOMELEC should pursue hedging instruments to lock in the low price in order to reduce the impact of future oil price increases on its financial results.
● Revise the electricity tariff structure. The structure of the tariff needs to be revised to allow SOMELEC to properly invest in maintenance and system improvements and improve equity. Designing a better tariff structure should start with a clear methodology to set tariffs that reflect costs, implemented through a phased approach to help to mitigate the impact on household energy expenditure and accompanied by a far-reaching communication strategy to ensure public support.
● Well-targeted measures to mitigate the impact on the poor. Keeping the social electricity tariff that protects the most vulnerable customers would be a good option until better social assistance mechanisms could be developed or scaled up (for example, the cash transfer program). The effectiveness of the LPG program could be refined to be better targeted on the poor, for example through the subsidy of small gas canisters (“bonbonnes”) but not those used by large-scale consumers. The freed-up budget resources could then be also used to expand
104 In addition to operational subsidies, SOMELEC also receives ‘investment subsidies’ which were approximately 2.5 Bn MRO per year
99

programs with quick tangible results (for instance, school meals, public works, or reductions in education and health user fees).
● Promote rural electrification. Well-planned, carefully targeted, and effectively implemented rural electrification programs provide enormous benefits to rural people. A rigorous rural electrification policy and a clear programmatic vision, together with the mobilization of resources, are key elements to create rural electrification programs on a national scale.
● Develop electricity networks, in particular in the Senegal River Valley. Priority should be given in the next few years to the development of electricity networks to enable border areas to use electric existing transmission lines to take advantage of surplus energy available in the country. In particular, the installation of low and medium voltage electrical systems in farming areas of the Senegal River valley could accelerate the industrialization of the country, especially in the food industry, directly improving the living conditions of the population.
● Better governance and improved management. SOMELEC needs better governance and internal controls to improve accountability, transparency, and data reliability. A first critical step to achieving this would be to improve implementation of the current performance contract.
● Encourage PPPs. The sector needs urgent and substantial investments in new generation, transmission, and distribution infrastructure. Given the shortage of public funds, the government could benefit from partnering with the private sector through a PPP arrangement to enhance the quality of projects in transmission and distribution. A key prerequisite would be a sound investment climate and legal framework to define public-sector responsibilities.
● Increase investments in renewable energy. In a country like Mauritania, the decentralized nature of renewable energy can have enormous benefits, particularly for poorer rural areas. Renewable energy can offer a secure and reliable energy alternative that is able to increase the standard of living of rural and less developed communities. Further, local authorities can invest in local renewable energy infrastructure and services, allowing for significant local added value creation in terms of job creation and boosting local economic growth.
● Improve coordination and aid management. The creation of a platform for consultation and exchange between actors in the electricity sector would allow resources to be optimized and improve the implementation of projects, especially with regards to the programming, and monitoring and evaluation of investments at a national level. Alongside this, the establishment of a reliable information system on donor aid may contribute to improved traceability, accountability, and transparency in the management of aid.
100
Concluding observations
185. This report has looked at trends in public budgeting and spending between 2010 and 2015 with a focus on the poverty impact of public expenditures in Mauritania. 186. Mauritania has enjoyed an extraordinarily positive macroeconomic environment over the period under review, driven by high commodities prices and resulting in large windfalls for the state. A large number of investments were financed during the period, but its impact on growth has been curtailed by poor investment selection practices and value for money. Now that the commodities super-cycle has come to an end and the medium term outlook remains subdued, the GOM will have to manage with tighter budgets in the years ahead. This will require more efficient use of scarce resources. A conscious effort will be needed to broaden the tax base and reduce the reliance on volatile extractives revenues. Political will is going to be essential to strengthen public financial management and public investment management practices. 187. Mauritania has achieved a remarkable reduction in poverty between 2008 and 2014, but the exact contribution of public programs to this result is unclear. This report finds that public spending overall has not been well targeted or efficient and as such has probably not had the full impact that it could. It also found that public spending is largely regressive in social sectors like education, health, and agriculture where the funds are spent on central administration, university education and scholarships, urban hospitals, etc. – and as a consequence the rural poor are severely disadvantaged and underserved. When accessed, the services provided to the poor are often of low quality: problems of efficiency abound, such as health centers lacking essential medicines and teachers that are absent from public schools. Emergency social safety nets programs and agricultural subsidies have benefited from greater financing, but the programs remain fragmented and ill-targeted. As a result, the poorest are unable to access basic services and their opportunities to take part in Mauritanian society as active and productive citizens are limited. In the longer term, such exclusion can build resentment and become a source of social instability.188. In particular, stronger controls are needed to safeguard public funds from fraud, corruption and wastage. GDP growth has been driven by capital formation, but the future financial and social returns on public investment projects remain uncertain given the weakness of systems to ensure good project evaluation, selection, programming, execution, and control. As a first step, the priority should be put on implementing basic elements of formal project selection and appraisal, execution and controls such as (i) allowing investment projects to advance only if they are mature enough and closely monitor them (iii) using resources effectively by getting value for money in public procurement and carefully manage contracts to avoid cost and time overruns (iv) ensure investment projects are audited and evaluated ex-post as required.189. Finally, tighter financing constraints make it even more urgent to collect timely data to track public spending appropriately and to deliver results. Differences in budget classifications and a fragmentation of fiscal data make it impossible for the authorities to prepare timely and complete reports on its entire budget execution and thus prevents a comprehensive monitoring of public spending, from budget appropriation to payment. Incomplete and fragmented data and weak monitoring also increase the risks of waste, fraud and corruption in public spending, which Mauritania cannot afford in years ahead.
101
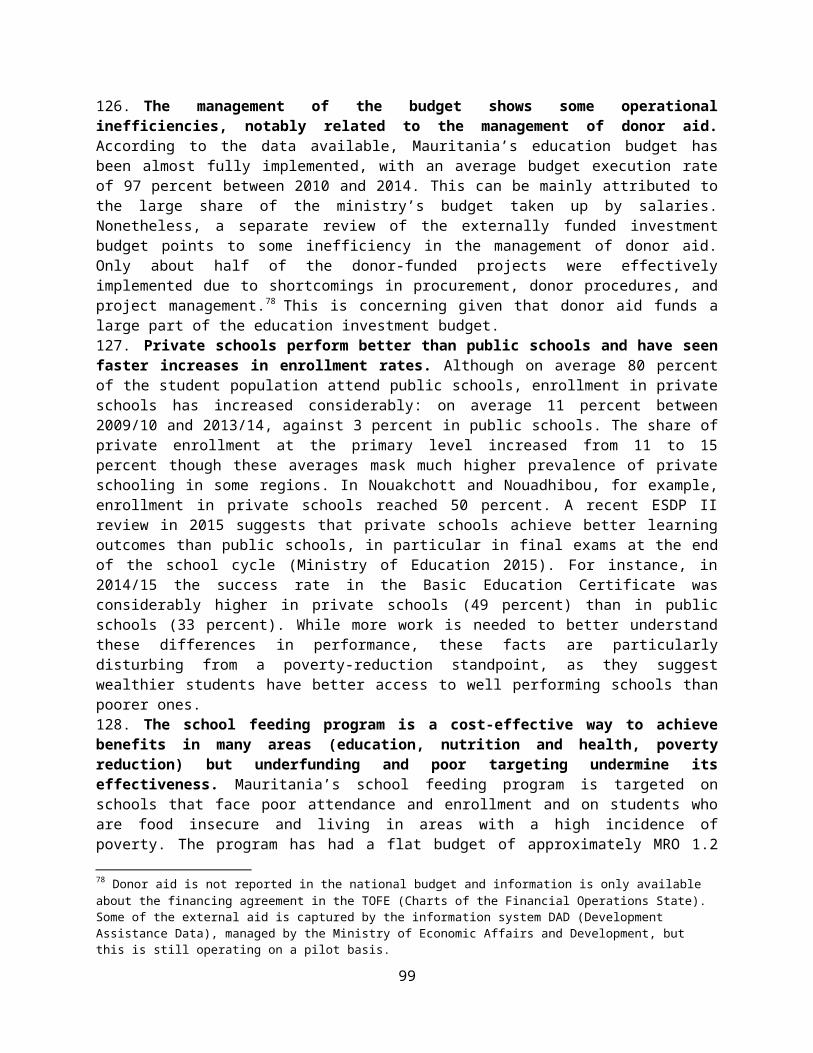
Bibliography
ADE (Analysis for Economic Decisions). 2014. “Evaluation PEFA et rapport d’analyse des performances du Système de GFP en Mauritanie.” Lettre de Marché N°2014/344228, ADE. www.finances.gov.mr/documents/MINISTERE_DES_FINANCES/rapport_final_PEFA.pdf.
Boukhars, Anouar. 2012. “The Drivers of Insecurity in Mauritania”. Paper, Carnegie Endowment for International Peace, Washington, DC.
Dessus, Sébastien and Aristomene Varoudakis. 2013. “Protecting Public Investment against Shocks in the West African Economic and Monetary Union”, Policy Research Working Paper, World Bank, Washington, DC. http://dx.doi.org/10.1596/1813-9450-6562.
Didi, Mohamed. 2015. “Système de subventionnement en Mauritanie.” (Draft).
FAO (Food and Agriculture Organization of the United Nations). 2013. FAO Statistical Year Book 2013: World Food and Agriculture. Rome: FAO.
Fraser Institute. 2015. Economic Freedom of the World: 2015 Annual Report. Fraser Institute. https://www.fraserinstitute.org/sites/default/files/economic-freedom-of-the-world-2015.pdf.
IEA (International Energy Agency). 2006. “Energy for Cooking in Developing Countries.” In IEA, World Energy Outlook 2006. Paris: OECD Publishing. http://dx.doi.org/10.1787/weo-2006-16-en.
IFC (International Finance Corporation). 2014. Mauritania: Country Profile 2014. Enterprise Surveys. Washington, DC: IFC.
IMF (International Monetary Fund). 2011. “Investing in Public Investment: An Index of Public Investment Efficiency”, IMF Working Paper WP/11/37, Washington, DC.
———. 2013. Case Studies on Energy Subsidy Reform: Lessons and Implications. Washington, DC: IMF.
———. 2015. “The Islamic Republic of Mauritania Article IV Consultation.” IMF Country Report No. 15/35. IMF, Washington, DC.
IRENA (International Renewable Energy Agency). 2015. Mauritania: Renewables Readiness Assessment. IRENA.
MAED (Ministry of Economic Affairs and Development). 2015. Rapport d'état sur le systeme éducatif national en Mauritanie (RESEN). MAED, Republic of Mauritania.
Ministry of Agriculture. 2015. Plan National de Développement Agricole (PNDA) 2015-2025. Ministry of Agriculture, Republic of Mauritania.
Ministère des Affaires Islamiques et de l’Enseignement Originel. 2010. Les Mahadras et les Mosquées en Mauritanie. Ministère des Affaires Islamiques et de l’Enseignement Originel, Republic of Mauritania.
Ministry of Education. 2015. “Situation 2015 des indicateurs du PNDSE.” (Draft). Ministry of Education, Republic of Mauritania.
Ministry of Health. 2014a. Bilan 2014 et plan d’action opérationnel 2015. Ministry of Health, Republic of Mauritania. http://www.sante.gov.mr/?wpfb_dl=105.
———. 2014b. Audit Institutionnel du Secteur de la Santé en Mauritanie. Report. Ministry of Health, Republic of Mauritania. http://www.sante.gov.mr/?wpfb_dl=114.
———. 2015. Rapport des comptes de la santé – Années : 2011-2012 et 2013. Ministry of Health,
102
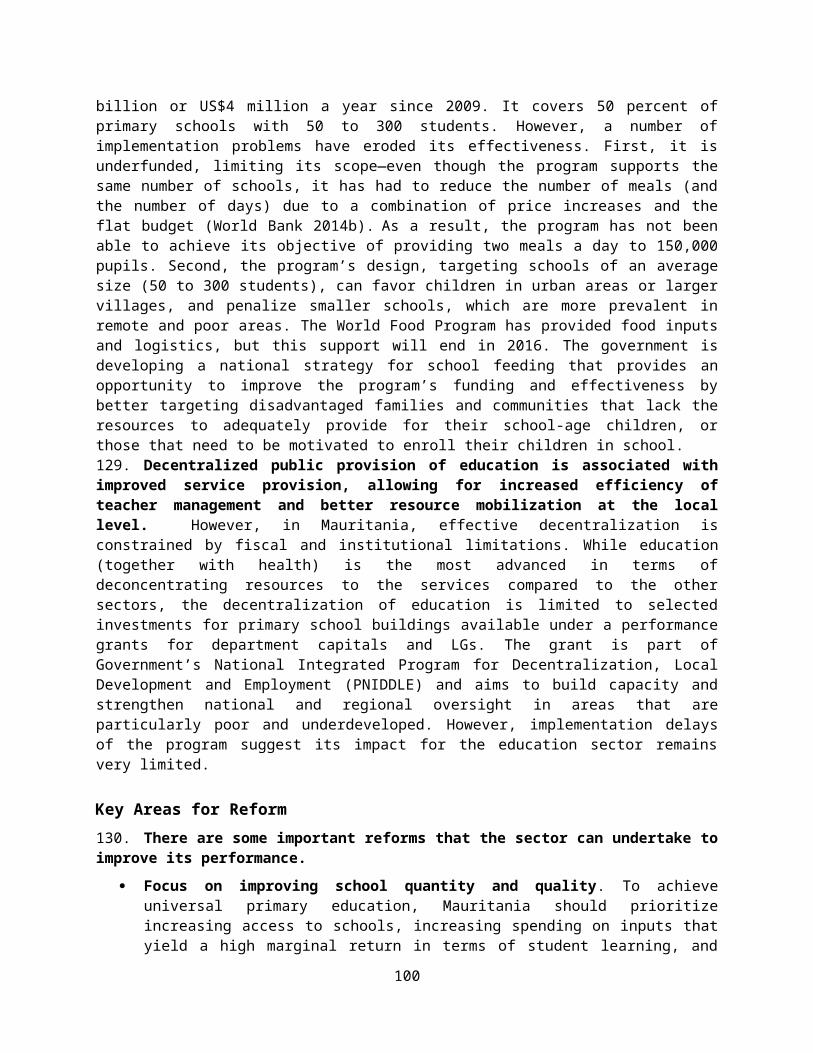
Republic of Mauritania. http://www.sante.gov.mr/?wpfb_dl=101.
Rajaram, Anand, Tuan Minh Le, Nataliya Biletska, and Jim Brumby. 2010. “A Diagnostic Framework for Assessing Public Investment Efficiency.” Policy Research Working Paper 5397, World Bank, Washington DC. http://dx.doi.org/10.1596/1813-9450-5397.
Republic of Mauritania. 2015. Profil de la Pauvreté en Mauritanie. Republic of Mauritania.
SNC LAVALIN. 2013. “Etude tarifaire de la SOMELEC.” Final Report 510110-4SRP-0300-02. SNC LAVALIN.
Torero, Maximo. 2014. “The Impact of Rural Electrification.” Paper prepared for the 11th Conference AFD PROPARCO/EUDN: Energy for Development, November 2014.
UNESCO (United Nations Education, Scientific and Cultural Organization). 1998. Wasted Opportunities: When Schools Fail. Education for All Status and Trends 1998. UNESCO. http://unesdoc.unesco.org/images/0011/001139/113958e.pdf.
UNICEF (United Nations Children’s Fund). 2008. Mauritanie Enquête par Grappes a Indicateurs Multiples – MICS3 – 2007: Suivi de la situation des femmes et des Enfants. Final Report. UNICEF.
———. 2014. Mauritanie : Enquête par Grappes a Indicateurs Multiples – MICS4 – 2011: Suivi de la situation des femmes et des Enfants. Final Report. UNICEF.
WHO (World Health Organization). 2011, The Abuja Declaration: Ten Years On. WHO. http://www.who.int/healthsystems/publications/abuja_report_aug_2011.pdf.
———. 2013. Indice de disponibilité et de capacité opérationnelle des services (SARA) : Mauritanie, 2013. WHO. http://www.who.int/healthinfo/systems/sara_reports/en/.
———. 2015. World Health Statistics: 2015. Luxembourg: World Health Organization.
World Bank. 2008. World Development Report – Agriculture for Development. Washington, DC: World Bank.
World Bank 2016. Islamic Republic of Mauritania: Poverty Dynamics and Social Mobility 2008-2014. Washington, DC: World Bank
———. 2011. Practitioner’s Toolkit for Agriculture Public Expenditure Analysis. Washington, DC: World Bank.
———. 2013. Gouvernance du Secteur Parapublic en République Islamique de Mauritanie. Report No. 78013-MR, Washington, DC: World Bank.
———. 2014a. Investment Climate Assessment 2014: Policy Uncertainty in the Midst of a Natural Resources Boom. Main Report. Washington, DC: World Bank.
———. 2014b. Building on Crisis Response to Promote Long-Term Development: A Review of Social Safety Net Programs in the Islamic Republic of Mauritania 2008–2013. Report No. 87232-MR. Washington, DC: World Bank.
———. 2014c. Mauritania, Senegal, Mali – Banda Gas to Power Project. Report No. 83025-MR. Washington DC: World Bank.
———. 2015. Haiti – Towards Greater Fiscal Sustainability and Equity: A Discussion of Public Finance. Public Expenditure Review (PER), Washington, DC: World Bank.
———. 2016. “Banda Gas to Power Project – Project Update.” World Bank, Washington, DC.
Yeh, Ethan. 2004. “Indoor Air Pollution in Developing Countries: Household Use of Traditional Biomass
103

Fuels and the Impact on Mortality.” University of California, Berkely.
104

Annex A1: Summary of PEFA Scores 2008 and 2014Table A1: PEFA Scores, 2008 and 2014
2008 2014 TrendA. PFM-OUT-TURNS: Credibility of the budget PI-1 Aggregate expenditure out-turn compared to original approved budget C C =PI-2 Composition of expenditure out-turn compared to original approved budget B D+ -
PI-3 Aggregate revenue out-turn compared to original approved budget A D -PI-4 Stock and monitoring of expenditure payment arrears B+ A +B. KEY CROSS-CUTTING ISSUES: Comprehensiveness and transparency PI-5 Classification of the budget C C =PI-6 Comprehensiveness of information included in budget documentation C D -PI-7 Extent of unreported government operations C D -PI-8 Transparency of inter-governmental fiscal relations D+ B +PI-9 Oversight of aggregate fiscal risk from other public sector entities. D+ D+ =PI-10 Public access to key fiscal information B C -C. BUDGET CYCLE C(i) Policy-Based Budgeting PI-11 Orderliness and participation in the annual budget process A D+ -PI-12 Multi-year perspective in fiscal planning, expenditure policy and budgeting B C+ -C(ii) Predictability and Control in Budget Execution PI-13 Transparency of taxpayer obligations and liabilities B B =PI-14 Effectiveness of measures for taxpayer registration and tax assessment C+ C =PI-15 Effectiveness in collection of tax payments D+ D+ =PI-16 Predictability in the availability of funds for commitment of expenditures C+ D+ -PI-17 Recording and management of cash balances, debt and guarantees B C -PI-18 Effectiveness of payroll controls D+ D+ =PI-19 Competition, value for money and controls in procurement B PI-20 Effectiveness of internal controls for non-salary expenditure D+ C+ +PI-21 Effectiveness of internal audit D+ D+ =C(iii) Accounting, Recording and Reporting PI-22 Timeliness and regularity of accounts reconciliation C+ C+ =PI-23 Availability of information on resources received by service delivery units D D =PI-24 Quality and timeliness of in-year budget reports C+ B+ +PI-25 Quality and timeliness of annual financial statements D+ D+ =C(iv) External Scrutiny and Audit PI-26 Scope, nature and follow-up of external audit D+ D+ =PI-27 Legislative scrutiny of the annual budget law C+ D+ -PI-28 Legislative scrutiny of external audit reports C+ NN D. DONOR PRACTICES D-1 Predictability of direct budget support NN D D-2 Financial information provided by development partners for budgeting and reporting on project and program aid D+ D+ =
0
D-3 Proportion of aid that is managed by use of national procedures D D =Annex A2: List of Financial Management Information Systems in Mauritania
1. RACHAD (Réseau Automatisé de Chaîne de la Dépense): RACHAD software has been in use since 2006 by the Budget Directorate to manage the allocation of budget resources and commitments, and the preparation of payment orders. RACHAD is a commercial package developed by ST2I, Tunisia, using the Oracle database platform.105 Initial deployment of the RACHAD was funded by the Public Sector Capacity Building Project (Projet de Renforcement des Capacités du Secteur Public; PRECASP) to about US$146,000. This web-based system can be used by 250 concurrent users to manage current and capital budget expenditures. The interface between RACHAD and the Central Bank (BCM) has been developed through another contract in 2011(US$99,000). Although the new interface has improved the speed of processing payments (check or cash), the total duration of payment processing is around 3–5 days. This is expected to be improved during the implementation of new project with the introduction of electronic payment systems and treasury single account (TSA) operations. The system is also linked to Beite El Male for processing of payment orders.
2. Beite El Male Treasury Accounting System: the Beite El Male software was developed by a local consultant/firm in 2002, to automate central government accounting and reporting functions. The Treasury directorate is using this system to record all budget transactions by combining revenue/expenditure data received from tax/customs and other entities. The software has been developed using a commercial platform (WinDev) and is based on an MS SQL database. The team was informed that the dispute between the Ministry of Economy and Finance and the software developer regarding the ownership of the source code has been resolved, and the development of interfaces with other systems is in progress (SITP, JIBAYA, SYDONIA, NOVA, TEHLIL, etc.).
3. SITP (Système d’Information Trésor Public): the SITP system was developed by a local firm in 2005 to support the monitoring of public expenditures with dynamic (daily) updates on the Treasury website. It also supports the electronic filing of transaction documents (about 450,000) in the Treasury archive (as PDF files). Interfaces with other PFM systems are expected to be developed in Q4 2014. Other PFM entities will have read-only access to SITP records once these interfaces are completed. SITP is a web-based locally developed software platform based on open source solutions (Java and MySQL). Reports on budget revenues (including extractive industries) and expenditures are being published on the Treasury website regularly.106
4. JIBAYA (Tax Administration System) + Numéro d’Identifiant Fiscal (NIF): the General Tax Directorate (Direction Générale des Impôts, DGI) signed a contract with Arab Soft, Tunisia107 in April 2011 for US$648,000, for the development of web-based tax system (JIBAYA) application (locally developed software based on Java, Oracle and Web Logic). Three additional contracts were signed in May 2013 for Oracle licenses, workstations, hardware, and network equipment (US$590,000 in total). The development of system requirements, testing and acceptance phases have been completed in three years, and the system has been fully operationally since 2014 (with a total cost of about US$1.238 million). The team was informed that the longer-than-expected implementation of JIBAYA was due to extensive customization needs of the DGI to comply with new legislation and regulations, as well as the introduction of new Tax ID Number (Numéro d’Identifiant Fiscal; NIF). The system includes a number of key modules to support tax assessment, filing, collections, case management, vehicle taxes, and more. 105 Website: http://www.st2i.com.tn/. 106 See the Treasury website at http://www.tresor.mr/. 107 Website: http://www.arabsoft.com.tn/.
1
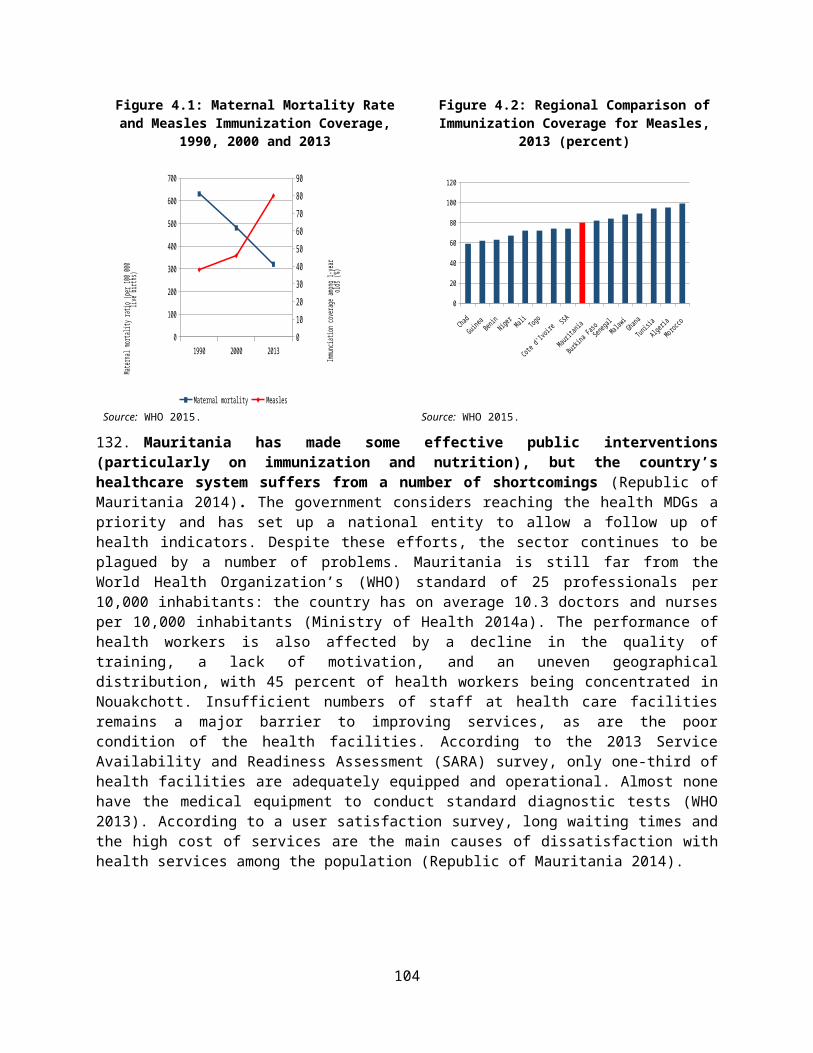
Remaining challenges include the activation of the e-Filing module, and the development of interfaces with Treasury and other PFM systems. JIBAYA is hosted in a server room located in DGI building (no disaster recovery solution yet) and maintained by the IT team trained by Arab Soft. The new government main data center can be used as the future hosting platform of JIBAYA to minimize the cost of system maintenance and support.
5. SYDONIA++ (Automated System for Customs Data/Système Douanier Automatisé): The General Customs Directorate (DGD) has used the SYDONIA/ASYCUDA system since 1999 as a customs management solution in 14 locations (customs offices/ports) countrywide. In 2012, the system was upgraded to SYDONIA++ running on Oracle. Servers are located in the DGD data center (no disaster recovery solution yet). The system was originally developed by the United Nations Conference on Trade and Development (UNCTAD) and is currently used in more than 80 countries. 108 The customs administration initiated the migration to the latest web-based version, SYDONIA World in 2014, which was expected to be completed by May 2015, with support from UNCTAD experts. The DGD can benefit from the countrywide fiber optic backbone being established through WARCIP to improve network connectivity, and the shared MDC and DRC platforms for daily data exchange and backup needs.
6. SIGADE (Debt Management and Financial Analysis System/Système Intégré de Gestion Automatisée de la Dette Externe): the MEF has been using the SIGADE/DMFAS software developed by UNCTAD as their external debt management software since 1985.109 The system is running on Oracle and hosted in the DDE server room. Similar to other PFM systems, there seems to be an opportunity to use MDC and DRC as shared platforms and minimize maintenance and support costs. The latest version of SIGADE could be used to benefit from new capabilities and expand the scope of the system to support domestic debt management as well. Development of an interface with the treasury system could also help in automating the debt payments and reconciliation of debt data during the implementation of new project.
7. BUDGET (Budget Preparation System): The budget formulation and preparation is not automated through a database application yet. The MEF Budget Directorate is currently working with the GIZ for the development of budget preparation system requirements. In order to avoid the development of an incompatible system or overlapping functionality, this activity needs to be well coordinated with the new project activities supporting the PFM systems.
8. SYBSIM (Public Investment Budget Monitoring System). The MEF has developed another locally developed software platform (most probably based on Oracle) with support from local consultants for programming and monitoring the consolidated public investment budget, and the system is being used since 2010. It would be useful if the MEF Budget Department can communicate with the MAED officials who are already using the DAD software and may be implementing the public investment management module of the same platform to perform similar tasks. There is a need to collaborate and coordinate closely during the preparation of new project to optimize the design of new components and avoid duplicate investments.
9. DAD (Development Assistance Database). The Development Assistance Database (DAD) software is being used by the MAED for monitoring the donor funded project activities and disbursements since 2013. DAD is commercial off-the-shelf software developed by Synergy International Systems with support from the UN, and the DAD Mauritania is currently hosted in the Synergy cloud platforms in the United States.110 As of Aug 2014, the DAD platform presents the details of 312 donor funded projects in Mauritania, with a total commitment of US$4.358 billion. Various graphical analysis
108 See the ASYCUDA website for more information http://unctad.org/en/Pages/DTL/TTL/ASYCUDA-Programme.aspx. 109 See the DMFAS website for more information http://unctad.org/divs/gds/dmfas/Pages/default.aspx.
2
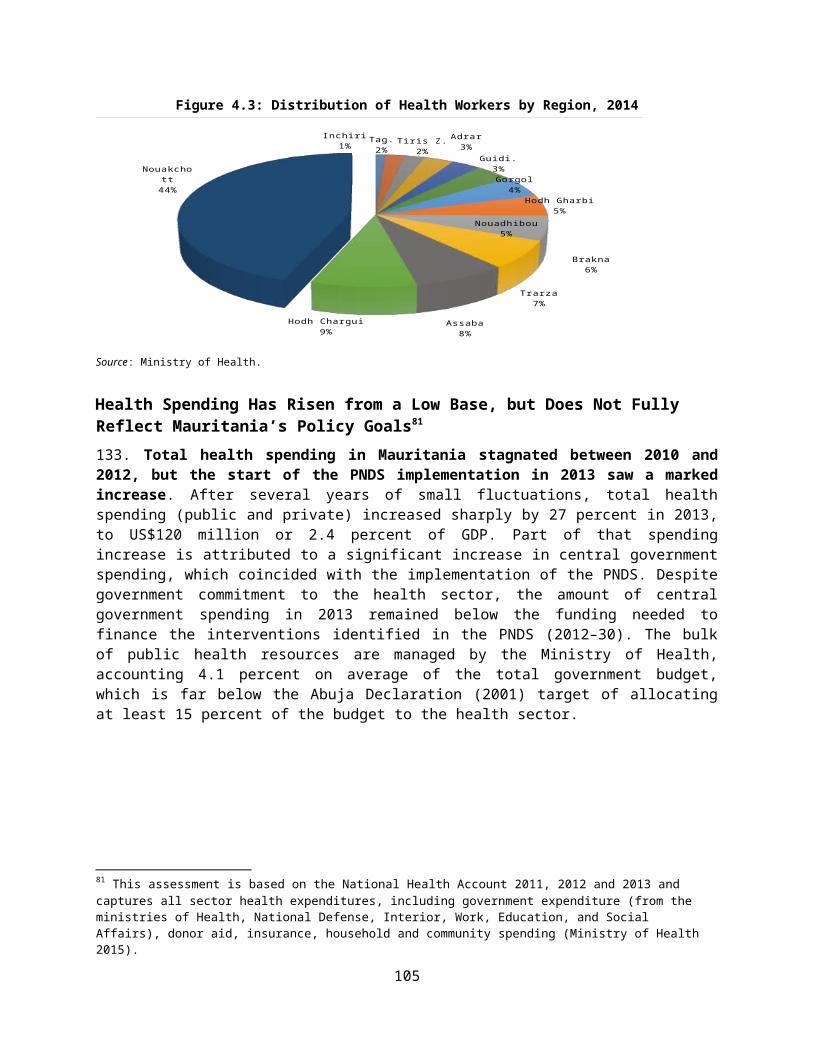
tools, geographical information system modules, and reporting options are available to create detailed outputs on all these projects. The DAD also has a public investment management modules supporting the full cycle of investment planning. Such a module can be used to extend the capabilities and link this platform with other PFM systems.
10. SIGPE (Système Informatique de Gestion du Personnel de l’Etat): SIGPE is the current human resource management (HRM) system of the government managed by the MoCS to support various functions for all civil employees since 1992. It was originally developed by the Tunisian Public administration and later on adapted to the needs in Mauritania. SIGPE is locally developed based on Oracle, and will be replaced by NOVA in January 2015.
11. RATEB (Réseau Automatisée du Traitement et Salaires des Employés Payés sur Bull): RATEB was developed by the MOF as a civil service registry and payroll calculation system in 2010. RATEB is locally developed software based on open source platforms (Java on NetBeans IDE) and using MS SQL database. The system is currently used by 20 MOF users to update records and manage payments (max 150 concurrent users) of about 37,000 employees. The system is expected to be replaced by NOVA in January 2015.
12. EL MAACH (Pension Management System): EL MAACH is locally developed software (based on Oracle) used by the MOF to pay pensions since 2011. The system includes the records of 22,000 pensioners (9,500 civil + 12,500 non-civil). EL MAACH is linked with RATEB and Beite El Male to exchange data on pensioners and payment details. The system is expected to be replaced by NOVA in January 2015.
13. NOVA (HRMIS and Payroll/Pension System): the MEF and MoCS will be using the new NOVA Portal starting from January 2015 for HRM information systems (HRMIS), payroll, and pension payments, replacing existing solutions with an integrated platform. NOVA is based on a commercial package (using Oracle DB) developed by NOVATIVE, Switzerland.111 The specifications of the system have been prepared in three years (2008–11) and the selection process began in 2011 (the team was informed that this was the fourth attempt to develop an integrated HRMIS/payroll since 1993). Initial contracts for the development of HRMIS application software were signed in Jan/Feb 2012 (US$598,000 + US$232,000). The system development, testing, and acceptance activities were completed in early 2014. In the meantime, three additional contracts have been signed for licenses, workstations and servers (US$572,000 in total). Based on the information available, the total cost of NOVA implementation has been around US$1.4 million) since 2012. The system is designed for 1,000 concurrent users and there is a three-year warranty period (until 2017). NOVA supports a large number of HRM functions, and most of these are not actively used yet. The team noted that the NOVA database is designed to capture National ID numbers of employees. However, there is no link between this platform and National ID system to verify these numbers or exchange data. A number of interfaces are expected to be developed to link NOVA with other PFM systems in 2014.
14. TEHLIL (Land Title Registration System): the authorities have developed a new platform for managing land titles. The ministry’s team of experts and local consultants have developed a web based platform using open source solutions (Java, MySQL) in a relatively short time and with modest investments (PRECASP funding for land titling system was US$158,000 in 2013). The system is hosted in a server room located in the DGDPE (Domaines) building. Approximately 23,000 titles have been scanned and included in the database since the introduction of the system in early 2014 (before this
110 See the Synergy International Systems website http://www.synisys.com/ for more details. The DAD Mauritania can be accessed at http://dad.synisys.com/dadmauritanie/. 111 Website: http://www.novative.com/.
3
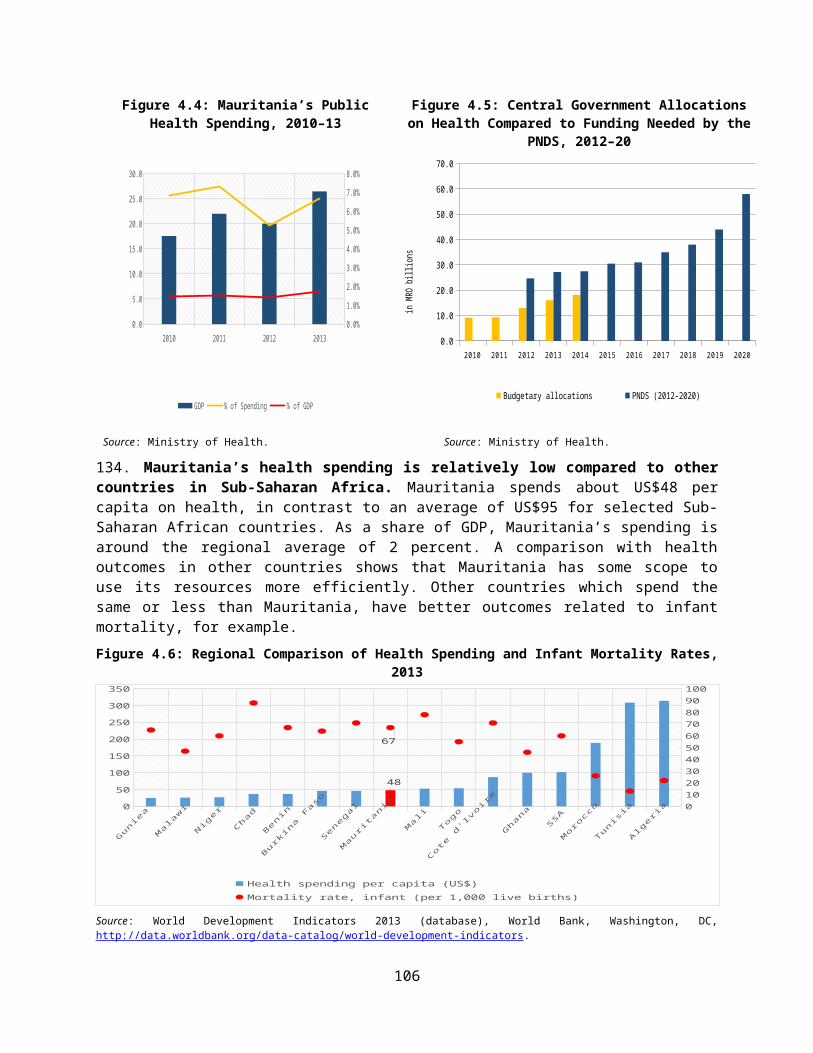
new system, only about 7,000 titles were registered from 2010 to 2014). It is expected that additional 26,000 titles can be registered through new system once it is fully deployed to cover all regions. The TEHLIL system has six modules, including the registration of titles, receipts, and permit authorization. The DGDPE management is in contact with the Association of Banks, the DGI and other government entities to establish linkages with relevant systems and expand the capabilities of the system. They are also very much interested in using shared platforms and integration of their platform with other PFM systems, to maximize the benefits.
15. i-World (audit and risk management software): i-World is the audit and risk management system selected by the IGE to automate their core practices. The system has been selected during recently completed GIZ funded activities, and the IGE is in the process of establishing proper information and communications technology (ICT) infrastructure and learning more about the capabilities of i-World to be able to use the system. i-World is a commercial application software developed by S-Consult AG, Switzerland and is currently using MS SQL.112 The system is expected to be operational in 2015, once the IGE ICT infrastructure and staff training are completed.
16. MIS (Management Information System): the MEF Budget IT Unit has installed an open source management information system in 2013, to support online analytical processing of budget results. The Jasper Soft platform is being used as a business intelligence solution to analyze the results of budget execution by extracting data from RACHAD and Beite El Male databases.
17. National ID (National Identification System): The ANRPTS (Agence Nationale du Registre des Populations et des Titres Sécurisés)113 is the key agency issuing National ID cards for citizens. The Ministry of the Interior and Decentralization issued a call for bids for the development of National ID in Dec 2009. The contract to develop an integrated system was awarded to Morpho/SAFRAN, France114 in June 2010, and eventually signed in July 2011. System implementation was completed in 2012 and digital National ID cards have been issued to most of the 3.7 million citizens since then. The team noted that the biometric and smart card features are included, but have not been effectively utilized. The National ID card has a huge potential for use in a number of e-Government services and the government can develop an action plan to expand its utilization in several key sectors (education, health, finance, social protection, etc.) within the scope of ongoing activities and e-Government program.
18. e-Government Program: the Ministry of Employment and Vocational Training and New Technologies is coordinating the e-Government activities and assisting the government entities to improve their ICT infrastructure, staff skills, and basic services.115 There seems to be a chance to benefit from the opportunities provided through ongoing e-Government program activities while designing and implementing shared platforms for an integrated GFMIS solution through the proposed project.
19. El Khazin (Local government accounting system): the MEF developed the El Khazin software for local governments to provide support for the automation of accounting and reporting processes. The team was unable to meet with relevant officials to learn more about this platform during this visit. However, this platform can be analyzed in more detail during the development of integrated GFMIS model for possible integration of existing capabilities.
112 Website: www.sconsult.ch.113 Website: http://www.anrpts.mr/. 114 Website: http://www.morpho.com/. 115 See http://www.modernisation.gov.mr/setn/ for more details.
4

Annex A3: Methodology for Public Investment Impact Assessment
The model draws on IMF data to derive Mauritania’s monetary, national, fiscal and balance of payments accounts. A number of steps were applied to construct the model. The first step was to project the accounts forward to 2050 using conservative assumptions and reflecting historical long-term trends were possible.116 Second, baseline accounts were derived after removing the PIP and its expected impact from the macroeconomic accounts for 2014-2050. Third, assumptions were made on the likely flows of PIP funds and their impact on the economy (demand effects), and their expected benefits accruing:
Step 1: producing the baseline accounts
First, projections were developed for the macroeconomic accounts.
The GDP deflator was disaggregated on a sectoral basis and projected from 2016 to 2050 on the basis of historical trends.
Real GDP was projected from 2014 to 2032 by sector based on simple assumptions. The sectors were totaled to provide us with real GDP. Real GDP by sector was then multiplied by their respective GDP deflators to obtain nominal GDP.
After growth forecasts had been obtained, projections were made for the demand components of GDP: imports, exports, investment, consumption, and savings. These projections were later refined following more detailed projections of imports, exports in the balance of payments, and government consumption and investment in the fiscal accounts.
Projections were made for the balance of payments based on assumptions, such as historical trends or shares. Minor increases were assumed for the capital and financial account due to small increases in other public investment.117
Similarly forecasts of revenues and grants were based on conservative projections with the assumption that deficit is covered by domestic borrowing.
Finally, reserve money growth is calculated assuming a precise relationship with the balance of payments and fiscal accounts.
Second, an important aspect of this analysis was to estimate the impact of the PIP compared to the counterfactual, i.e. what would have happened if the PIP had not taken place. Therefore, baseline accounts had to be constructed to remove the likely impact of the PIP from all the main accounts.
Estimates were made on the likely impact of the PIP and these effects were removed from the macroeconomic accounts.
The likely impact of the PIP was estimated from the output accounts – see step 2.
116 For example, some line items are assumed to have stagnant growth. For example, projections for donor financing are based on existing trends, with the assumption of no new, additional investment.117 It is assumed that the balance of payments (deficit or surplus) are exclusively financed by NFA.
5
Box A1: Constructing GDP by Demand Component i. Consumption Private consumption was projected on the basis of a simple growth rate. Public consumption was derived from current expenditure in the fiscal accounts.
ii. Investment Public investment is derived from capital expenditure in the fiscal accounts. Private investment was calculated by subtracting gross domestic investment and the
current account balance from gross national savings.
iii. Imports and exports Imports and exports of goods and services are taken from the balance of payments
(BOP) plus respective service credits and service debits.
iv. Gross national disposable income (GNDI) GNDI is estimated by adding GDP to transfers and income in the BOP. This estimation
was revised, once the balance of payments projection had been finalized.

Step 2: Producing the output sheets
The output sheets attempt to capture the impact attributable to the PIP. By making a series of conservative assumptions on the flows and their impact on different factor groups and economic sectors. As a result, it is able to ascertain the additional impact on the macroeconomic accounts: balance of payments, monetary, fiscal, national accounts, use of resources.
More specifically, the output sheets makes assumptions:
On the likely financing of the PIP and its financing terms to model debt flows. To assess the likely impact of the PIP on factor groups and economic sectors. More specifically,
assumptions are made on the composition of spending of resource types across savings, investment, consumption, and taxes.
In addition, the impact of the PIP was ascertained on prices and supply across five selected economic sectors—construction and public works, transport, manufacturing, agriculture, and services. A number of assumptions are made:
The demand effects are assumed to be constant throughout the period. It is assumed that suppliers are rational and will increase their supply based on average PIP flows over the financing period 2014-6.
The supply response in year 1 occurs when implementation of the program commences. It is assumed that upon commencement of the demand effect, suppliers will start
investing, and the supply response in subsequent years will improve. It should be noted, that since this analysis looks solely at the impact of the PIP from
2014-6, it is assumed the supply response disappears in 2017 upon the finalization of this current PIP.118
Step 3: Producing the macroeconomic accounts
The output sheets form the basis for the calculation of the macroeconomic accounts, which can then be compared to the baseline accounts, enabling us to compare the PIP’s impact on key macroeconomic variables. In addition, it enables us to generate costs and benefits and conduct IRR analysis to estimate the:
The financial internal rate of return (FIRR); The fiscal economic internal rate of return (EIRR); The fiscal economy-wide internal rate of return (EWIRR);
A number of key assumptions were made to estimate the impact of the PIP on the macroeconomic accounts from 2014 -2050:
It was assumed that the benefits of the PIP would accrue from 2019 onwards. The return on the PIP in terms of increased GDP would be around 5 percent. The increased GDP would be in the form of higher exports, investment, consumption and taxes
(see table 1 below).
118 The price effects are a proportion of the demand effects. For simplicity, the price effects and supply effects equal 100%. For instance, in year 1 (or 2014 in this model), price effects are 90% for the construction sector, while supply effects are 10%. In subsequent years, the price effects are expected to fall, while supply effects rise. It is assumed the price effect persists due to inefficiencies described earlier.
6
Box A1: Constructing GDP by Demand Component i. Consumption Private consumption was projected on the basis of a simple growth rate. Public consumption was derived from current expenditure in the fiscal accounts.
ii. Investment Public investment is derived from capital expenditure in the fiscal accounts. Private investment was calculated by subtracting gross domestic investment and the
current account balance from gross national savings.
iii. Imports and exports Imports and exports of goods and services are taken from the balance of payments
(BOP) plus respective service credits and service debits.
iv. Gross national disposable income (GNDI) GNDI is estimated by adding GDP to transfers and income in the BOP. This estimation
was revised, once the balance of payments projection had been finalized.
Exports Private Cons. import TotalIncome Sales Trade Invest. substit.
50.00 3.00 4.00 3.00 10 50 - 100
Tax revenueMacroeconomic variable
Table 1. Effect of increase in GDP due to PIP on macroeconomic variables (in percent) allocation
Estimating the internal rate of return
The internal rate of return (IRR) for the program can be estimated for:
7
Box A2: Output Assumptions Sheet A series of assumptions were used to assess the additional impact of the PIP on the macroeconomic accounts. These assumptions, were chosen on the basis of accuracy, simplicity and proportionality. The assumptions sheet uses data in the inputs and benefits sheet to the output sheets.
A number of key assumptions were constructed to determine the: Allocation of public resources to resource groups Resource group’s domestic consumption, imports, investments, savings and tax revenues Firms’ supply and price response in relation to increased demand, which vary by sector Reallocation of GDP due to demand increase after program implementation has been
finalized The allocation of real GDP (due to program benefits) to the components of GDP
(see table below.)
Coeff. Value Source/ justification
Resource share: inter. Labor 15 Based on program costs.Local labor 19 Based on program costs.Inter. capital 30 Based on program costs.Local capital 36 Based on program costs.
MPC: inter labor 30Local labor 80Inter. capital 0Local capital 70
MPI 10
MRT 0.02 Assume low taxes due to tax evasion.MPM (in percent of total res.) 45MPS 6
Average int. rate 2.5 Program is primarily financed by concessional foreign loans. Elasticity of supply
Const.: short-run 10 Supply response constrained by fixed capital and lack of substitution with labor.long-run 90
Agriculture: short-run 15 Supply is fixed in the short-run. Assumption of 15% stocks.long-run 90
Transport: short-run 30 Significant spare capacity in the short-run.long-run 90
Manufacturing: short-run 40 Moderate spare capacity to increase output.long-run 90
Services: short-run 75 Labor constitute large proportion of output.long-run 95
other assumptions (in percent)
Based on estimates of accomodation, living expenses, savings, and taxes as a proportion of incomes.
in percent of resource types
in percent of total resources
Selected assumptions for the model

The financial internal rate of return (FIRR); The economic internal rate of return (EIRR); The economy-wide internal rate of return (EWIRR); and,
The FIRR provides us with the IRR for the government, as it calculates the public costs of the project minus the revenues it will generate. To obtain the FIRR project financing is split into loans and grants: Gt
¿d=Gt¿ d( χ1 t+ χ2 t)
where χ1 t and χ2 t represent the relative share of project spending financed by loans and grants, respectively. Defining the total loans required for the investment project as lt=Gt
¿d χ1 t , and GRt=Gt
¿d χ1 t enables us to calculate the program’s FIRR as:
FIRR=∑t
N
lt ( r t+at )+¿¿¿¿
where, r t and a t denote the interest rate and amortization costs of all project loans, while RCt represents the project’s recurrent costs and U t indicates user fees levied by the government to cover a share of the project’s recurrent costs.
The EIRR is estimated by subtracting additional public investment spending Gt¿d and recurrent costs RCt
from the project-related increase in GDP determined above.
EIRR=∑t
N GDPt¿−[Gt
¿ d+RCt ](1+ IRR)
Similarly, the economy-wide IRR is estimated by deducting private investment costsPI t and additional public investment and recurrent costs from the project-related increase in GDP. This indicator measures of the impact of the program on the broader national economy.
EWIRR=∑t
N GDP t¿−[Gt
¿d+PI t+RCt ](1+ IRR)
8
Annex A4: Summary of Procurement Assessment, Scores, Findings and Action Plan
Table A2: Procurement Assessment# Problèmes Actions Indicateurs Acteurs BénéficesI Cadre Légal et Règlementaire
1.1 Textes d’application mis en place trop rapidement, et en contradiction avec la Loi.
Préparer et adopter un décret d’application conforme aux principes de la Loi portant Code des marchés publics.
Textes d’application harmonisés et conformes à la Loi sont en place et connus par tous les acteurs.
PM. MAED et ARMP
Alignement des textes d’application avec la Loi facilite l’application de la règlementation, et évite les interprétations et confusions.
1.2 Documents d’appel d’offres et modèle standards prêts, mais non adoptés ni rendus obligatoires.
Adopter les documents standards préparés depuis janvier 2014, en y apportant les quelques suggestions contenues en Annexe #5 du rapport.
Documents standards sont adoptés, obligatoires et accessibles sur site Internet de l’ARMP.
PM. MAED et ARMP
Facilite la préparation des DAO et réduit les temps et coûts de transaction.
1.3 Vide juridique 119 concernant la délégation de services publics et de Partenariat Public Privé (PPP).
Préparer et adopter une Loi et textes d’application sur la délégation de services publics et de partenariat Public Privé (PPP).
Loi et textes d’application correspondant aux standards internationaux sont validés par les Partenaires et adoptés.
PM, MAED et Parlement
Comble le vide juridique actuel et permet d’encadrer les conventions de délégation de services publics en protégeant les intérêts de l’Etat.
II Cadre Institutionnel et Capacités de Gestion2.1 Manque de
leadership et de coordination des organes comme l’ARMP et les CPMP.Absence de passerelles formelles entre organes de passation des marchés et l’Administration.
Ancrage ARMP et CPMP à la Primature ou au MAED.
Textes d’application de la Loi précisent d’une manière adéquate les ancrages.
PM, MAED et ARMP
La vision et leadership permet d’aboutir aux résultats escomptés par la réforme.
2.2 Faiblesses des capacités et absence de structures durables de formation initiale et continue dans
Adoption d’une stratégie de développement des capacités et jumelage de l’ENA avec une institution spécialisée pour installer des
Un jumelage est en place avec une organisation spécialisée et une filière est en place à l’ENA avec des modules dans les écoles d’ingénieurs, de
PM, ARMP, ENA
Des programmes de formation initiale et continue sont offerts d’une manière durable.
119 This legal vacuum was intentional when the Public Procurement Act was being drafted. It was considered preferable to treat the delegation of public services and PPPs in separate legislation and regulations..
9
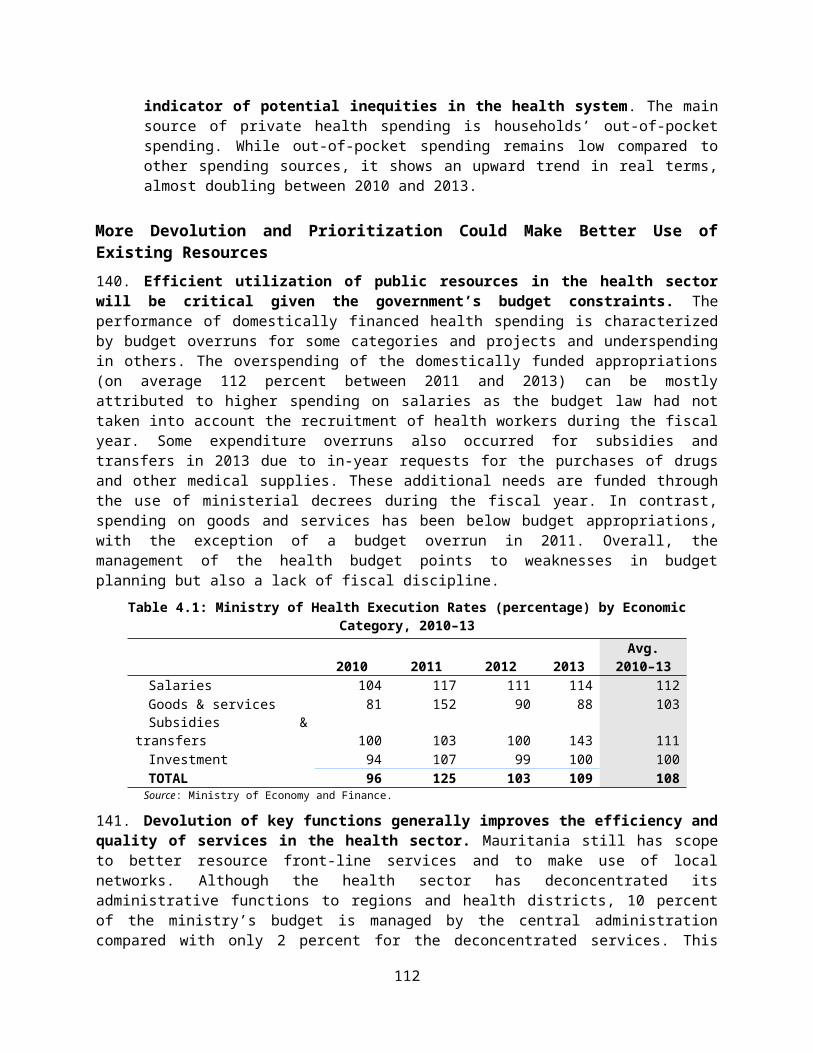
# Problèmes Actions Indicateurs Acteurs Bénéficesle domaine de la commande publique.
filières sur les marchés publics dans les cycles de formation initiale et continue – écoles d’ingénieurs, juristes, commerce et administration.
commerce, d’administration et de droit.La filière de formation de l’ENA a reçu l’accréditation par l’organisation spécialisée à l’issue de la première année.
2.3 Absence d’un corps de professionnels et absence de pérennité des ressources humaines actuelles du fait de leur statut de contractuels.
Création d’un corps de professionnel de la logistique de la commande publique.
Offre d’intégration d’un contingent annuel dans la fonction publique aux membres des CPMP et CS.
Il existe au niveau de la Fonction Publique un corps de professionnels de la commande publique.Un pourcentage non négligeable des contractuels a intégré la fonction publique à des postes de spécialistes de la commande publique.
Fonction Publique, PM, MAED
Un profil de carrière peut être géré, et permet de maintenir les agents formés dans le corps de professionnels.
2.4 L’organisation actuelle des commissions ne correspond pas au schéma de la Loi, et la répartition des charges de travail est inégale allant de 30 à 167 marchés par an par commission pour un budget analogue alloué à chaque commission.
Réorganiser les commissions pour améliorer l’efficacité et la transparence. Deux options :1. Créer des
commissions thématiques par catégories de dépenses -- travaux, fourniture et prestations intellectuelles ; ou
2. Commissions présidées par la personne responsable des marchés de l’autorité contractante, avec secrétariat permanent assumé par la commission.
Constat et évaluation de la nouvelle organisation par expert indépendant.
PM, MAED, ARMP
Efficacité et économie au niveau des transactions.
III Niveau Opérationnel secteurs public et privé3.1 Les activités
prévues sur le budget ont du mal à s’exécuter au cours de l’exercice fiscal.
Intégration des marchés publics dans la préparation des budgets – annuels et trisannuels.
La préparation du budget comporte des projets dont la maturité est suffisante pour une bonne exécution du budget.
MAED et PM La maturité des projets est prise en compte dans la préparation des budgets.
10

# Problèmes Actions Indicateurs Acteurs Bénéfices3.2 L’absence de
commandes groupées réduit l’efficacité et les économies d’échelle.
Lancer une initiative de centrale d’achat pour une catégorie de dépense, avec marchés de clientèle.
Rapport de l’ARMP sur la première année de mise en place de l’approche centrale d’achat ou du moins une plus large utilisation des marchés de clientèle pour les acquisitions standards communes aux différentes administrations.
PM, MAED et ARMP
Efficacité et rapidité des acquisitions standards communes aux différentes administrations.
3.3 Les prix unitaires reflètent les risques commerciaux liés à l’incertitude des délais effectifs de paiement.
Paiement obligatoire des intérêts moratoires.
Suivi du montant des intérêts moratoires dans chaque secteur.
PM, MAED, MINFI
Réduction des risques commerciaux pour les soumissionnaires entrainant la réduction des prix unitaires.
3.4 Les marchés inférieurs aux seuils de compétence des commissions et des marchés passés avec les sociétés d’Etat échappent à toutes formes de contrôles et procédures.
Encadrement des marchés inférieurs aux seuils de compétence des commissions et des marchés passés avec les sociétés d’Etat.
Toute la commande publique est conforme aux procédures et répertoriée.
PM, MAED, MNCMP
Transparence des marchés d’un montant inférieur aux seuils de compétence des commissions.
3.5 Absence de système et difficultés -- ou impossibilité -- d’accès aux documents.
Mise en place d’un système d’archivage moderne et efficace.
Financement en place dans une première étape.
Inauguration d’archives nationales.
PM Conservation de la documentation selon un mode efficace et moderne, avec dématérialisation de documents.
3.6 Le recrutement d’un nombre important (150) de spécialistes de la commande publique n’a pas permis de garantir un niveau égal de connaissances et d’expérience – tout en dépouillant les maîtres d’ouvrage.
Renforcement des capacités, accompagné d’une gestion des ressources humaines.
Rapport d’évaluation des spécialistes en place effectué en juillet 2015 par l’institution spécialisée jumelée avec l’ENA.
ARMP et CNCMP + institution spécialisée jumelée avec l’ENA.
Les spécialistes en place sont évalués et leur niveau se rapproche des profils attendus.
11
# Problèmes Actions Indicateurs Acteurs Bénéfices3.7 Les commissions
ne sont pas le meilleur instrument pour donner un avis complet sur les DAO et projets de marchés dans des délais raisonnables.
Revisiter le processus d’examen des DAO et projets de marchés par les commissions, en les confiant à des spécialistes accrédités tenus de fournir leurs avis dans un délai n’excédant pas trois (3) jours.
Les commissions émettent, à travers leurs spécialistes, des avis ou non objection sur les DAO et/ou projets de marchés dans un délai n’excédant pas trois (3) jours.
ARMP, CNCMP
Réduction des temps d’examen par les commissions permet d’accroître la capacité d’absorption des budgets.
IV Contrôles, transparence, intégrité4.1 Manque de
précision des textes relatifs à l’audit interne.
Intégrer dans un nouveau décret les prescriptions relatives aux audits internes.
Les nouveaux textes d’application traitent les prescriptions relatives aux audits internes.
PM, ARMP, IGE
Les administrations disposent de contrôles internes répondant aux mêmes critères.
4.2 Absence de précisions sur l’obligation de suivi des recommandations formulées dans les rapports d’audit.
Intégrer dans un nouveau décret les prescriptions relatives au suivi des recommandations des audits des marchés publics.
Rapport de l’ARMP en juillet 2015 reflète le suivi des recommandations des audits des marchés publics.
PM, ARMP, IGE
Les audits servent à mettre des mesures préventives en place, plutôt que faire les mêmes constats de rapports en rapports.
4.3 Faiblesse du système de collecte et gestion des informations sur les marchés publics.
Informatiser et connecter en réseau la saisie des données relatives aux marchés publics.
MINFI, MAED, ARMP, CNCMP, CPMP sont interconnectés et les données dématérialisées sur les marchés publics sont disponibles aux différentes étapes.
ARMP, CNCMP avec GIZ
Les statistiques sur les marchés sont accessibles en temps réel.
4.4 Absence d’un système anonyme de dénonciation des malversations, et d’un panel d’investigation.
Installer un système anonyme de dénonciation des malversations, et constituer un panel d’investigation.
Audit externe confirme la bonne marche des travaux du panel d’investigations donnant des avis professionnels, indépendants, dans des délais raisonnables.
PM, MAED, ARMP et CNCMP
Lutte contre les auteurs de malversations.
Effet dissuasif sur les fraudeurs éventuels.
4.5 La Société Civile n’exerce pas un contrôle social des marchés publics.
Mener des actions pour sensibiliser la Société Civile
Il existe une publication de la Société Civile relatant son plan à moyen terme pour contribuer au contrôle des marchés publics.
PM, ARMP, Chambre de Commerce, Représentants de la Société Civile.
La Société Civile contribue au contrôle des marchés publics.
12
Table A3: Scores on OECD/DAC MAPS Indicators0 1 2 3
Pilier I : Cadre législatif et réglementaireIndicateur 1– le cadre législatif et réglementaire est conforme aux normes de référence et exigences
1a Champ d’application1b Méthode de passation de marchés1c Règles de publicité et délais1d Règles sur la participation1e Documents d’appels d’offres et spécifications techniques1f Evaluation et critères d’attributions1g Soumission et ouverture des offres1h Procédures de recours
Indicateur 2 – Existence de la documentation et des textes d’application2a Existence et disponibilité des textes d’application de la réglementation2b Existence et disponibilité des dossiers d’appel d’offres 2c Procédures pour la pré-qualification2d Existence et disponibilité des dossiers de consultation pour prestations de services 2e Existence et disponibilité d’un manuel de procédures pour entités contractantes2f Conditions générales pour marchés de fournitures, travaux et services.
Pilier II – Cadre institutionnel et capacité de gestionIndicateur 3 – Intégralité des marchés dans la chaîne de la Dépense Publique
3a Planification des marchés intégrée à la programmation budgétaire3b Loi de Finances supportant à temps la passation et les paiements des marchés3c Pas d’initiation de marchés sans existence de budgets appropriés3d Exécution des marchés assujettie aux contrôles budgétaires
Indicateur 4 – Existence d’une entité de régulation opérationnelle4a Statuts et conditions de fonctionnement de l’entité de régulation 4b Responsabilité de l’autorité de régulation définies et complètes
4c Régulation ayant une organisation, des moyens et du personnel qui lui assure son indépendance et son fonctionnement
4d Responsabilités de la régulation permettant d’éviter des conflits d’intérêts avec les décisions d’attribution des marchés
Indicateur 5 – Existence d’une capacité institutionnelle de développement5a Système de collecte et de diffusion de l’information sur les marchés publics
5b Système fiable de collecte et suivi des statistiques nationales sur la passation des marchés
5c Système de développement des capacités en matière de marchés publics5d Standards et méthode d’évaluation de la performance du personnel
Pilier III – Niveau opérationnel et les pratiques sont efficacesIndicateur 6 – Le niveau opérationnel et les pratiques sont efficaces :
6a Niveau de compétence des structures de passation des marchés
6b Programmes de formation et information pour les entités du gouvernement et du secteur privé en ligne avec la demande et les besoins
6c Existence d’un système d’archivage des informations pour permettre les contrôles externes
6d Existence de mécanismes d’accès aux informations pour permettre les contrôles internes.
6e Niveau de salaires des structures de passation de marchés en ligne avec la structure
13

0 1 2 3générale des salaires
Indicateur 7 – Réponse du secteur privé à la demande publique7a Existence de partenariat avec la société civile et le secteur privé7b Secteur privé organisé pour optimiser l’accès à la commande publique
7c Inexistence de contraintes majeures pour le secteur privé d’avoir accès à la Commande Publique
7d Existence de règles claires pour décider la compétition au niveau internationalIndicateur 8 – Existence de disposition pour la gestion des marchés et résolution des conflits
8a Procédures clairement définies pour la gestion des marchés, y compris le contrôle et la réception des prestations
8b Contrats contenant les clauses de résolution de litiges et d’arbitrage8c Procédures existant pour l’application du processus de résolution des litiges.
Pilier IV – Intégrité et transparence du système de Marchés PublicsIndicateur 9 – Le pays a un système de contrôle et audit
9a Cadre législatif prévoyant l’organisation et les procédures pour les contrôles externes et internes
9b Application des conclusions des audits pour assurer la conformité
9c Système des contrôles internes fournit à temps les informations pour assurer la conformité des procédures
9d Système de contrôle interne suffisamment définis pour permettre des contrôles internes de conformité et performance
9e Auditeurs suffisamment informés des procédures et méthodes de contrôle pour conduire des audits de performance et de conformité
Indicateur 10 – Efficacité des mécanismes de traitement des recours
10a Existence d’un mécanisme de traitement des recours qui donne l’accès au secteur privé de faire examiner leurs plaintes
10b Décisions prises en fonction des informations et système ayant la capacité à faire appliquer les décisions
10c Système opérant d’une manière transparente pour assurer l’application des décisions justifiées sur les informations recueillies
10d Système rendant des décisions publiées et mises à la disposition des parties et du public
Indicateur 11 – Degré d’accès à l’information11a Publication et diffusion de l’information
Indicateur 12 – Existence de mesures d’éthique de lutte contre la corruption
12a Cadre législatif et documents d’appels d’offres comprenant des dispositions de lutte contre la fraude et la corruption, ainsi que les conflits d’intérêt
12b Cadre légal précisant les responsabilités et sanctions pour les individus et les firmes engagés des pratiques de fraude et corruption
12c Evidence de l’application des dispositions de répression de la fraude et de la corruption
12d Existence de mesures spéciales pour prévenir et lutter contre la corruption
12e Secteur privé et la société civile contribuent à la lutte contre la fraude et la corruption.
12f Mécanisme pour dénonciation des comportements frauduleux, de corruption ou contraires à l’éthique
12g Code de conduite/Code d’éthique pour les intervenants et dispositions de divulgation
14
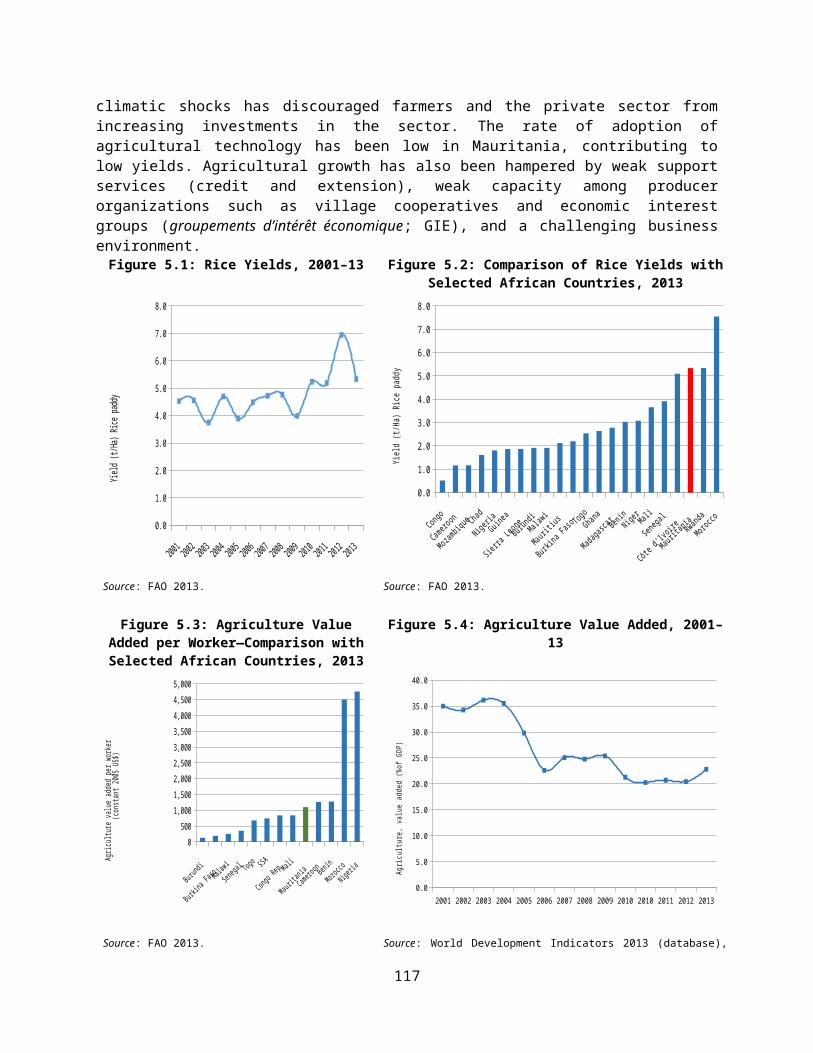
Table A4: Procurement Reform Action Plan and Budget
# Actions à mettre en œuvre Résultats attendus Type d’actions et Intervenants
Coût estimé enUS$ ’000
PILIER I : AFFINER LE CADRE LEGISLATIF ET REGLEMENTAIRE ET LE RENDRE OPERATIONNEL
Mesures à courts termes1.1 Adopter les documents standards
préparés depuis janvier 2014, en y apportant les quelques suggestions contenues en Annexe #5 du rapport.
Documents standards sont adoptés, obligatoires et accessibles sur site Internet de l’ARMP.
Décrets
MAED, ARMP, CNCMP
Consultantpour nettoyage juridique
100
Mesures à moyens termes1.2 Préparer et adopter un décret
d’application conforme aux principes de la Loi portant Code des marchés publics.
Textes d’application harmonisés et conformes à la Loi sont en place et connus par tous les acteurs.
Décrets
MAED, ARMP, CNCMP
Consultantpour nettoyage juridique
50
1.2 bis
Intégrer dans les textes une obligation de : (i) maturité des programmes à inscrire sur le BIP ; et (ii) établir des rapports d’achèvement technique et financier d’exécution des marchés -- y compris pour les sociétés et établissements publics.
Les projets inscrits au budget d’une année sont exécutés au cours de ce même exercice budgétaire -- ou s’exécutent selon le calendrier pluriannuel.
Les Autorités Contractantes rendent compte sur : (i) le degré de maturité des projets avant adoption du BIP ; et (ii) l’exécution budgétaire et l’atteinte des objectifs des marchés prévus sur le budget programme d’investissement.
Décrets
MAED, ARMP, CNCMP
Consultantpour nettoyage juridique
Compris dans 1.1 ci-dessus
1.3 Préparer et adopter une Loi et textes d’application sur la délégation de services publics et de partenariat Public Privé (PPP).
Loi et textes d’application correspondant aux standards internationaux sont validés par les Partenaires et adoptés.
LoiMAED, ARMP, CNCMP
Consultant
Compris dans 1.1 ci-dessus
PILIER II : RENFORCEMENT INSTITUTIONNEL ET CAPACITES DE GESTION
Mesures à courts termes2.1. Ancrage ARMP et CPMP à la
Primature ou au MAED.Textes d’application de la Loi précisent d’une manière adéquate les ancrages.
MAED, ARMP, CNCMP 0
2.2 Adoption d’une stratégie de développement des capacités et jumelage de l’ENA avec une institution spécialisée pour installer des filières sur les
Un jumelage est en place avec une organisation spécialisée et une filière est en place à l’ENA avec des modules dans les écoles
MAED, ARMP, CNCMP, ENA
Consultant
25
15

# Actions à mettre en œuvre Résultats attendus Type d’actions et Intervenants
Coût estimé enUS$ ’000
marchés publics dans les cycles de formation initiale et continue – écoles d’ingénieurs, juristes, commerce et administration.
d’ingénieurs, de commerce, d’administration et de droit.La filière de formation de l’ENA a reçu l’accréditation par l’organisation spécialisée à l’issue de la première année.
Mesures à moyens termes2.3 Création d’un corps de
professionnel de la logistique de la commande publique.
Offre d’intégration d’un contingent annuel dans la fonction publique aux membres des CPMP et CS.
Il existe au niveau de la Fonction Publique un corps de professionnels de la commande publique.
Un pourcentage non négligeable des contractuels ont intégré la fonction publique à des postes de spécialistes de la commande publique.
ARMP, CNCMP
Consultant
50
2.4 Réorganiser les commissions pour améliorer l’efficacité et la transparence. Deux options :1. Créer des commissions
thématiques par catégories de dépenses -- travaux, fourniture et prestations intellectuelles ; ou
2. Commissions présidées par la personne responsable des marchés de l’autorité contractante, avec secrétariat permanent assumé par la commission.
Constat et évaluation de la nouvelle organisation par expert indépendant.
ARMP, CNCMP
Consultant
0
2.5 Installer une capacité permanente de livraison de programmes de formation, initiale, continue et de perfectionnement professionnel – y compris le lancement d’une phase pilote, avec suivi et évaluation de la performance de la formation.
Il existe en Mauritanie au moins une institution accréditée pour livrer des formations dans le domaine des marchés publics – par exemple l’ENA, avec des modules ou « unités de valeur » dans les Ecoles d’Ingénieurs, d’Administration et de Commerce.
MAED, ARMP, CNCMP
Contrat A.T.
250
2.6 Mettre sur pied une structure permanente de maturation des projets pour assister les administrations centrales et déconcentrées à préparer les
Les projets ainsi que les appels d’offres des grands programmes d’investissement -- notamment les
MAED, ARMP, CNCMP
Contrat cadre de financement provenant d’un pool de partenaires
100
16
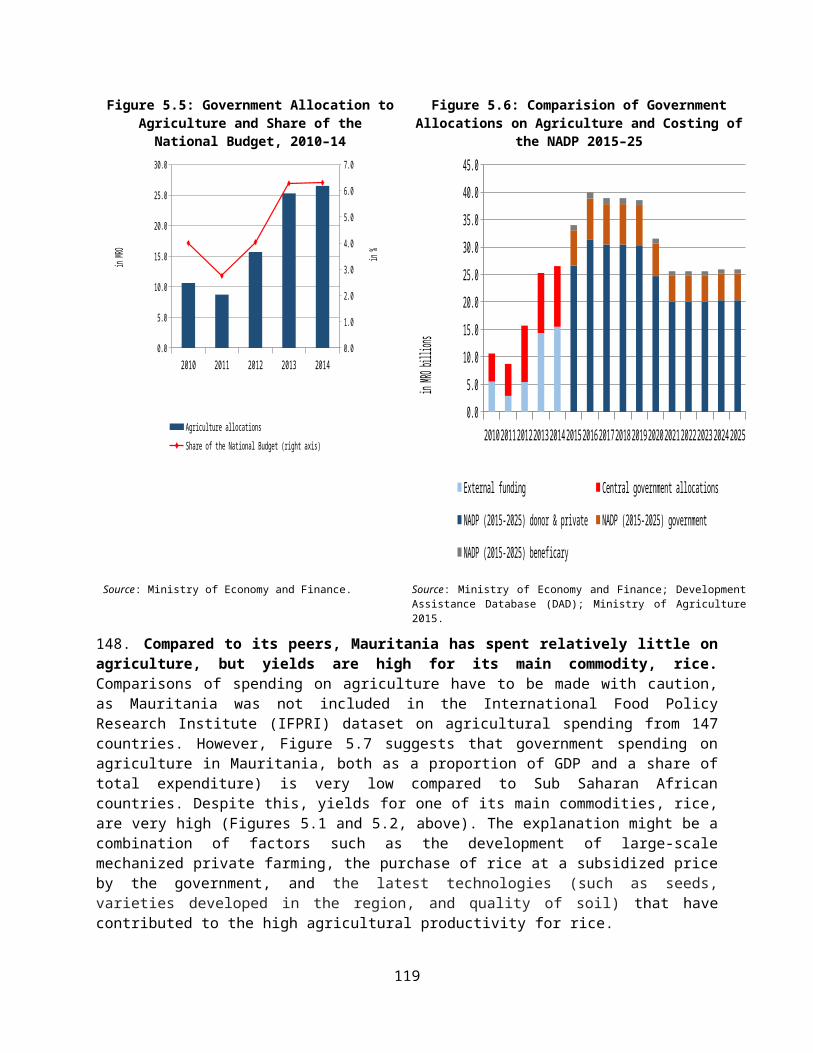
# Actions à mettre en œuvre Résultats attendus Type d’actions et Intervenants
Coût estimé enUS$ ’000
projets ainsi que les appels d’offres des grands programmes d’investissement, notamment les programmes pluriannuels.
programmes pluriannuels – reçoivent des appuis techniques et financiers d’une agence de maturation de projets.
PILIER III : RENFORCEMENT DES CAPACITES OPERATIONNELLES
Mesures à courts termes3.1 Intégration des marchés publics
dans la préparation des budgets – annuels et trisannuels.
La préparation du budget comporte des projets dont la maturité est suffisante pour une bonne exécution du budget.
MAED, ARMP, CNCMP
Contrat cadre de financement provenant d’un pool de partenaires
Compris dans 2.6 ci-dessus
3.3 Paiement obligatoire des intérêts moratoires.
Suivi du montant des intérêts moratoires dans chaque secteur.
Compris dans décret
MAED, ARMP, CNCMP
0
Mesures à moyens termes3.2 Lancer une initiative de centrale
d’achat pour une catégorie de dépense, avec marchés de clientèle.
Rapport de l’ARMP sur la première année de mise en place de l’approche centrale d’achat ou du moins une plus large utilisation des marchés de clientèle pour les acquisitions standards communes aux différentes administrations.
MAED, ARMP, CNCMP
Contrat cadre de financement provenant d’un pool de partenaires
150
3.4 Implantation d’un système informatisé pour appuyer la préparation des DAO et la gestion des marchés ;
Amélioration de l’efficacité et de la qualité ;
MAED, ARMP, CNCMP
Consultant
250
3.4 Encadrement des marchés inférieurs aux seuils de compétence des commissions et des marchés passés avec les sociétés d’Etat.
Toute la commande publique est conforme aux procédures et répertoriée.
Compris dans Décret
MAED, ARMP, CNCMP
Consultant
Compris dans 1.1 ci-dessus
3.5 Mise en place d’un système d’archivage moderne et efficace.
Financement en place dans une première étape.
Inauguration d’archives nationales.
MAED, ARMP, CNCMP
Consultant
150
3.6 Renforcement des capacités, accompagné d’une gestion des ressources humaines.
Rapport d’évaluation des spécialistes en place effectué en juillet 2015 par l’institution spécialisée jumelée avec l’ENA.
MAED, ARMP, CNCMP
Consultant
50
3.7 Revisiter le processus d’examen des DAO et projets de marchés par les commissions, en les confiant à des spécialistes accrédités tenus de fournir leurs
Les commissions émettent, à travers leurs spécialistes, des avis ou non objection sur les DAO et/ou projets de marchés dans un délai
Décret
MAED, ARMP, CNCMP
Compris dans 1.1 ci-dessus
17
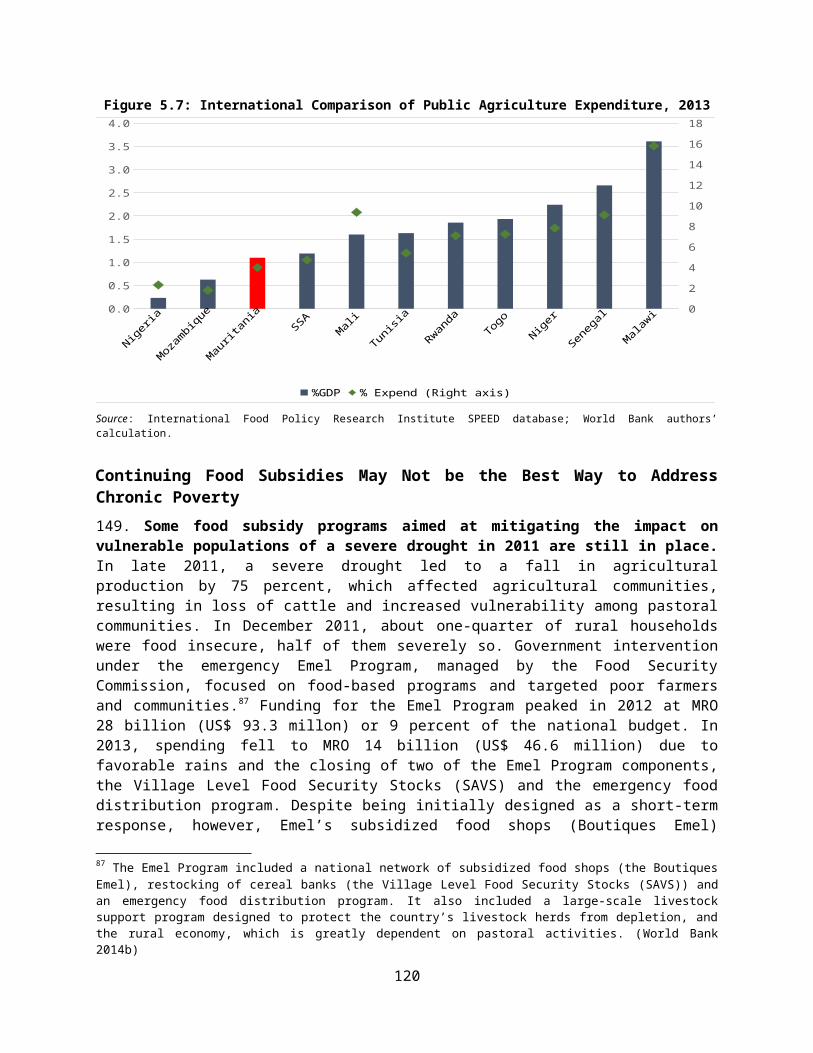
# Actions à mettre en œuvre Résultats attendus Type d’actions et Intervenants
Coût estimé enUS$ ’000
avis dans un délai n’excédant pas trois (3) jours.
n’excédant pas trois (3) jours.
3.8 Evaluation à mi-parcours de la mise en œuvre de la réforme avec les Partenaires
Faire le point des acquis, et éventuellement procéder à des ajustements du plan d’actions
Revue conjointe basée sur rapport ARMP +
consultant
25
PILIER IV : INTEGRITE ET TRANSPARENCE DU SYSTEME DE PASSATION DES MARCHES
Mesures à courts termes4.1 Intégrer dans un nouveau décret
les prescriptions relatives aux audits internes.
Les nouveaux textes d’application traitent les prescriptions relatives aux audits internes.
Décret
MAED, ARMP, CNCMP
Compris dans 1.1 ci-dessus
4.2 Intégrer dans un nouveau décret les prescriptions relatives au suivi des recommandations des audits des marchés publics.
Rapport de l’ARMP en juillet 2015 reflète le suivi des recommandations des audits des marchés publics.
Décret
MAED, ARMP, CNCMP
Compris dans 1.1 ci-dessus
Mesures à Moyen Terme4.3 Informatiser et connecter en
réseau la saisie des données relatives aux marchés publics.
MINFI, MAED, ARMP, CNCMP, CPMP sont interconnectés et les données dématérialisées sur les marchés publics sont disponibles aux différentes étapes.
MAED, ARMP, CNCMP
Consultant
250
4.4 Accompagner la politique de dénonciations anonymes des contrevenants, en installant une véritable capacité de conduite des investigations des allégations.
La lutte contre la fraude et la corruption révèle une tolérance « 0 », et les cas dénoncés font l’objet de prises de sanctions justifiées.
Création Cellule d’Investigation
MAED, ARMP, CNCMP
Consultant
40
4.5 Mener des actions pour sensibiliser la Société Civile.
Il existe une publication de la Société Civile relatant son plan à moyen terme pour contribuer au contrôle des marchés publics.
MAED, ARMP, CNCMP
Consultant
50
4.6 Audit fonctionnel sur la performance du traitement de recours et litiges.
Assurer que les recours et litiges soient traités conformément à la Loi.
MAED, ARMP, CNCMP
Consultant
15
4.7 Audit fonctionnel sur la performance du suivi des recommandations des auditeurs.
Assurer que les audits des marchés soient effectués et exploités conformément à la Loi.
MAED, ARMP, CNCMP
Consultant
15
4.8 Conduire une évaluation de l’impact des organes de lutte contre la corruption, et sur l’impact du Code de la Charte d’Ethique.
Une stratégie de lutte contre la corruption en matière de marchés publics est clairement définie, et reconnue opérationnelle.
MAED, ARMP, CNCMP
Consultant
15
TOTAL « A » DES ACTIONS ET MESURES EN US$ US$ ’000 : 1.585
18
# Actions à mettre en œuvre Résultats attendus Type d’actions et Intervenants
Coût estimé enUS$ ’000
TOTAL « B » POUR HONORAIRES POUR EXPERTS NATIONAUX ET INTERNATIONAUX POUR ASSISTER LE GOUVERNEMENT DANS LA MISE EN ŒUVRE DE LA RÉFFORME EN US$
US$ ’000 : 350
TOTAL « C » POUR FRAIS DE FONCTIONNEMENT DE L’UNITE DE MISE EN ŒUVRE DE LA REFORME EN US$
US$ ’000 : 450
TOTAL « B + C » POUR GESTION DE LA REFORME EN US$ US$ ’000 : 800
TOTAL GENERAL A + B + C en US$ US$ ’000 : 2.385
19
Annex A5: Table of Recommendations and Fiscal Implications
RECOMMENDATION Fiscal implicationsChapter 1: Macro Economic and Fiscal Trends
1 Enhancing transparency and improving data quality and foster greater accountability in the use of public resources through the following activities: (i) Audit the national oil fund (ii) Conduct a thorough review of public sector staff, wage and benefit policies, and career structures and (iii) ensure that BOOST is updated at least twice a year to reflect the original and revised budgets (iv) Strengthen financial oversight of SOEs by mandating the publication of annual financial reports
Budget neutral. Funding is already in place to carry out these activities
2 Further strengthening domestic revenue mobilization and widening the tax base to ensure adequate funding for public investment without destabilizing debt dynamics. This involves (i) In collaboration with development partners, review the current tax expenditure and fiscal incentive regime. (ii) Develop a reform program to boost public revenues and create new sources of revenues that are less volatile and less dependent on the extractives sector.
Savings. Fiscal impact is likely to be positive. Past tax reforms led to increased revenues of over 6% of GDP
3 Clearly prioritizing public expenditures, improving monitoring and evaluation mechanisms, and establishing results-based management approaches would enhance the overall efficiency of public investment. In particular, (i) Develop a national MTEF based on BOOST and other data sources, ensuring that its goals are aligned with the public investment plan and that its spending projections are consistent with macroeconomic stability. The MTEF should also be produced in a timely fashion, in order to enable it to inform the annual Budget Law (ii) Develop sectoral MTEFs, to strengthen the spending projections of the national global MTEF prepared by the MAED (iii) Formulate a strategy to shift from the current system of resource-based budgeting to a performance-based budget system with the objective of boosting human capital-related programs and ensuring value for money in selected investment projects.
Limited additional costs. While MTEF preparations are already budgeted for, a move to a performance based budget system would require additional up-front costs for training that would likely be offset by increased value for money in public investments.
Chapter 2: Increasing the Economic and Social Impact of Public Investments
4 Improve investment budget and project data. In order to permit the assessment of the allocative and execution efficiency of the public investment program, the availability of investment budget data must be urgently improved. The first priority should be to make it possible to track the execution of investment projects outlined in the CIB. Currently, the national systems and tools (RACHAD, TOFE) only track budget execution by institution or by economic categories, and by funding source. This could be complemented by introducing a project category as well. It is also important to ensure timely and complete information on the physical and operational progress of investment projects. The authorities could consider a database which tracks the entire cycle of each significant investment project
Limited additional costs. Funds are already programmed in the World Bank PGSP project for this purpose.
5 Develop a clear strategy for public investment based on a better understanding of the economic and social impacts and its financial
Budget neutral. These activities are already financed
20

viability in the longer term. Also, ensure that investments are better aligned with its strategic priorities. Update and refine sectoral strategies and MTEFs and ensure coherence between these, the PIP, and annual investment budget proposals.
and the relevant institutions are in place.
6 Improve investment project preparation and preliminary appraisal. First, develop clear guidelines (i.e. handbooks) and criteria for project development and disseminate these to budget units, along with training on the use of these methodologies for personnel involved in investment project preparation. Second, align project preparation and screening with the budget process. Only include investment projects that have been screened and which satisfy minimum established criteria. Finally, evaluate operational and maintenance expenses and include these in MTEFs and in the national recurrent budget
Some additional costs. AfDB PIM project already approved (20 Million USD)
7 Clarify roles and consider independent reviews. Create inter-ministerial committees to examine and evaluate proposals at the preliminary and screening stages, and consider the establishment of an independent mechanism to review proposals before inclusion into the CIB.
Some additional costs, covered by AFDB project (see above)
8 Monitor and support project implementation. Formalize the reporting requirements of execution agencies to the Ministry of Economy and Finance for all projects and produce regular reports on physical and financial execution (quarterly or bi-annually). Introduce a risk management system to identify time and cost overruns, etc. Establish a multi-sectoral committee to review investment progress reports and propose actions, including project revision where necessary. Adopt a system to account for public assets (physical tracking and values, including depreciation).
Some additional costs, covered by AFDB project (see above)
9 Improve the procurement process. The focus now needs to be on (i) consolidating the public procurement code and adopting a comprehensive set of implementing regulations and standard documents, (ii) increasing the efficiency and transparency of new independent procurement bodies, (iii) developing the capacity of public and private stakeholders at the operational level, and (iv) installing control and surveillance mechanisms to measure quality and ensure system integrity.
Some additional costs. World Bank PGSP project is financing procurement reform (570,000 USD)
Chapter 3: Use of Resources in the Education Sector120
10
Focus on improving school quantity and quality. To meet the MDG goal of universal primary education, Mauritania should prioritize increasing access to schools, increasing spending on inputs that yield a high marginal return in terms of student learning, and prioritizing spending on the areas of greatest need. Proper maintenance of classrooms and availability of basic school supplies will require an increase of spending on goods and services. In addition, enforcing teachers’ presence in the classroom, complemented by frequent in-service teacher training and curriculum development, will be key to improving learning conditions and outcomes. Alongside this, the government needs to improve
Additional costs. For the availability of basic school supply, the government could procure as the current GPE-funded Basic Education kits with as low as 5 US dollars.Other measures such as pay raise for teachers and provision of funds for school
120 The school system in Mauritania includes six years of primary school, followed by four years of lower secondary education and three years of upper secondary education.
21
teachers’ qualifications and motivation by attracting a better cohort of educated candidates and improve teachers’ pay, preferably through a performance-based incentive system that links teachers’ salaries to student learning achievement.
maintenance could be done with no significant cost if budgets are channeled directly to schools through performance-based budgeting.
11
Address equity issues. Even though gender equity has been reached, increasing access to schooling for the poor is the main hurdle to achieving universal primary education. Mentoring and tutoring programs should be made available to ensure that students across socio-economic income groups at least pass the primary certificate (Certificat d'études primaire; CEP). In addition, basic skills and literacy programs will be critical for students who have dropped out of primary school to increase their job readiness while providing a second chance to those who seek to re-enter school later.
Additional costs. With probably no cost if current overtime pay budget are channeled directly to the classrooms.
12
Enhance accountability and increase the funding of vocational education and training institutions while improving connections with the general education system. The Mauritanian VET system needs to become more responsive to changes in needs for skills and to improve access to training and skills development. Institutionalizing annual audits of the public institutions managing vocational training and universities could encourage a better and more transparent use of public resources. Conducting routine tracer studies of graduates is important to assess the integration of the students in the job market and feed lessons back into the development of training programs. There is also a need to increase public resources for basic vocational and literacy programs to cater better for the significant share of the population aged 15–24 who are currently unemployed and illiterate. Expanding the VET education subsector has the potential to raise productivity in rural agriculture and increase incomes from urban informal low-paid economic activities
Additional costs. As a first towards accountability, the government could continue funding through the general budget the current pilot phase funded by the Skills Development project with a cost around a 1 million US dollars a year. The amount could be even less if wages become part of the equation with the ability of TVET schools to hire and pay their own staffs.
13
Review the current scholarship program and enhance accountability. The current scholarship program needs to be significantly reviewed to target low-income students and those university programs with high employment potential. Government-funded scholarships to foreign universities should be terminated. Development partners could fund specialist training in the areas of the most need, for which the country lacks capacity.
Savings. The scholarship program absorbs around 5% of the education budget.
14
Render the education information management system functional. To improve the availability of accurate and consistent data for informed decision-making, the government should invest in the education information management system. This would allow improving timeliness and quality of data quality as well as ability to link with other sources of information in the sector.
No additional costsAn integrated education management information system is current developed within the Ministry of Education with the support of the Basic Education project
15
Tracking and monitoring of resources and performance. Improved tracking and monitoring of allocation and spending would enhance transparency and contribute to ensuring that education expenditures reach the intended beneficiaries., To this end, institutionalizing annual reviews of public expenditures and conducting periodic public expenditure tracking surveys and school-level surveys would be
Some additional costs. This could be done without additional cost if a form of basic school accountability is established with adequate M&E system.
22
worthwhile initiatives, providing information on actual inflows to schools and identifying leakages. These initiatives could be coupled with social accountability mechanisms (i.e. using parent’s feedback via SMS to monitor teacher absenteeism) to improve administrative record keeping and teachers’ incentives to attend schools.
Chapter 4: Use of Resources in the Health Sector
16
Prepare a universal health coverage policy. Universal health coverage lowers financial barriers to health care and reduces the impoverishing impact of health payments. The government has begun to embrace the concept of universal coverage by preparing a financing strategy to explore different financing mechanisms. To complement this, it needs to prepare a policy focusing on (i) financial risk protection to address catastrophic health expenditure, where households have to forego the consumption of other necessary goods due to high out-of-pocket payments and impoverishment, closely coordinated with the national social protection policy; (ii) improving the quality of effective services; and (iii) addressing social determinants of health such as addictions (tobacco, drugs, alcohol and other addictions), traffic injuries, pollution, and the lack of clean water and sanitation networks.
Limited Additional costs (less than 1 million USD). WHO and other development partners have funding in place for the preparation of a policy. Costs for implementing the policy are unknown.
17
Improve human resource management. The ability of a country to meet its health goals depends largely on the skills, motivation, and deployment of the health workers responsible for delivering services. Given the shortcomings of Mauritania’s human resources in the health sector, it is critical to (i) recruit skilled health workers to ensure that primary health care facilities meet their nationally recommended staffing norms, and (ii) implement an effective incentive scheme to attract and retain essential health workers. The 2013 budget included measures such as the provision of extra pay and benefits for health workers taking a post in rural areas and the piloting of a results-based financing strategy. These are important steps towards providing incentives for health workers to improve motivation and retention.
Additional costs. Estimates require significant technical work.
18
Address equity issues. Equity plays a constitutive role alongside growth in reducing absolute poverty. A well-designed resource allocation formula that considers equity aspects can reduce government spending disparities across regions. Additional resources should benefit currently marginalized and very poor regions such as Brakna, Gorgol, Tagant, and Guidimagha.
Budget neutral. Reallocation of existing resources.
19
Reinforce cost-effective interventions. The quality of care is key to improving health outcomes, efficiency, and user satisfaction. Effectively targeting resources on the areas of greatest need is critical to improving the quality and use of health services. To achieve this, Mauritania needs to strengthen those health interventions that have the greatest possible benefits (for example maternal and infant programs, and preventable diseases), expand CNAM’s coverage to informal workers and the poor, and implement the results-based financing program which the Health
Additional costs. The World Bank is preparing a results based financing program to support this effort (17 Mn USD)
23
Steering Committee approved in September 2015 to put more emphasis on outcomes instead of inputs.
20
Strengthen budget management. Effective management of the budget encourages better decision-making, the efficient use of resources and results in better health outcomes. This requires the strengthening of tools for budgeting, accounting and execution, improving management capacities of all departments, notably at the regional offices, and implementing a computerized management system that includes all resources (including external funds) and is connected to MF and treasury’s information system.
Budget neutral
21
Review and explore different models of social accountability. Social accountability interventions have proven to be critical to enabling meaningful participation of all citizens, proper accounting of health resources and addressing information asymmetries. It encompasses a range of practices (such as participatory public policy-making, participatory budgeting, public expenditure tracking, and citizen monitoring and evaluation of public services) that should be reviewed and explored for the Mauritanian context.
Budget neutral
22
Strengthen decentralization of health functions to improve human resource management. Many arguments have been made that decentralization of health care may bring benefits of (i) improved technical efficiency as local governments are more cost conscious and have more freedom in contracting with providers; (ii) better allocative efficiency through greater alignment of services to the needs of the different communities; (iii) improved equity as local authorities know communities better and can successfully target resources to the more vulnerable groups. While decentralization reforms in Mauritania constitute a slow process, efforts could focus on improving the management of health staff by making staff positions regional (to reduce the concentration of health workers in Nouakchott) and strengthening the local oversight of the regions to guide the promotion and sanctioning of health workers, and therefore encourage better performance.
Budget neutral
Chapter 5: Use of Resources in the Agriculture Sector
23
Ensure that funding, distribution of responsibilities, and staffing corresponds to core functions and sector priorities. With the recent creation of a separate Ministry of Agriculture, it would be important to review the Ministry’s 2015 budget in view of improved funding of core functions (such as R&D, extension services,.) in comparison of the Ministry’s administrative functions. Responsibilities and staffing should also be reviewed to ensure it supports the sector’s efficient operation (i.e. the supervision missions to be conducted by the responsible executing agency) and front line units.
Budget neutral
24
Develop a transition strategy. The change from a publicly controlled market system to a market-oriented one may need to be implemented
Limited additional costs (approx. 70,000 USD).
24
gradually over several years. Such a transition period would allow farmers and private operators to adjust to changes in prices and services. The preparation of a transition strategy constitutes a priority to allow a transparent and predictable implementation of the reforms. This transition seems to have started after the government declared in December 2015 that it was not willing to set a price for nor buy locally produced rice. This cold turkey strategy is much more effective than a gradual one, but may be more difficult to implement politically. A transition strategy carries some risk as it could allow those who are benefiting from the current situation (most of whom are in control of the current system) to prolong the transition or even block it altogether.
Government has requested World Bank support to conduct a strategic study on the rice sector, including the impact of current subsidies on the poor
25
Assess the impact of eliminating rice subsidies on the poor. Experience from other countries that have successfully eliminated crop price support show the importance of (i) compensating farmers for potential income loss, (ii) educating them about new support programs, and (iii) providing technical assistance. The government’s recent cut off of rice subsidies might have a significant impact on the poor. To identify appropriate mitigation measures it should assess the impact of the elimination of rice support subsidies on the lowest income groups and identify appropriate compensations mechanisms, such as direct cash transfer to farmers.
This could be included in the study in point 24 above
26
Review options for smart subsidies. Production support for rice (from input subsidies to marketing assistance and price setting) is fiscally expensive and inefficient. Assessing the use of “smart subsidies” could help establish a more efficient system of production incentives (Box 5.1).
This could be included in the study in point 24 above
27
Gradually close the Boutiques Emel. The gradual closing of the Boutiques Emel could be carried out alongside the introduction and reinforcement of existing programs. In the first phase, the government could (i) orient the Emel Program toward rural areas by strengthening shops in those areas, (ii) reprioritize safety net interventions that target the poorest populations (for example scaling up the country’s cash transfer program, developing a mechanism for vouchers and reinforcing the cereal banks SAVS), and (iii) assessing the effectiveness of the market for basic food items. In the second phase, it needs to gradually close the Boutiques Emel, starting in areas where the cash transfer program is established and the private market is well functioning (World Bank 2014b).
Savings of approximately 1-2% of GDP
28
Build on the experience of the investments in the Senegal River Valley and further upscale this program. Drawing on the successful experience of the initial pro-poor investments in the Senegal River, the program should be further expanded in the Valley as well as to other areas suitable for such an intervention. The program should ensure support in the form of land maintenance services is provided, land tenure issues are addressed and resource-conserving technology are provided to sustain the investments and livelihoods.
Additional costs (25 Million USD). Expansion of this successful initiative is planned under the Sahel Irrigation Initiative under preparation
25

29
Increase sustainable investments in the agriculture sector. To promote productivity growth, priority should be given to investing in market infrastructure, agricultural technologies and institutions. The reallocation of public funds to R&D, technology promotion and adoption, and education could also significantly help increases yields and production efficiency. The recent preparation of Mauritania’s participation in the West Africa Agricultural Production Program (WAAPP) provides an important opportunity for the country to benefit from the assistance provided under this program in capacity building and adopting improved technologies.
Additional costs (15 million USD). Mauritania has formally requested to be part of WAAPP and have allocated 300K for project preparation. Total costs are estimated at 15 million USD
30
Encouraging private sector investment through public-private partnerships (PPPs). The establishment of effective PPPs, supported by an improved business environment, can support the agricultural commercialization process, provide greater certainty on employment, and improve risk-adjusted returns to investments in agriculture. The government, with the support of the World Bank is currently funding a study to assess the use of PPPs in the livestock sector (notably for red meat). For the agriculture sector, it is recommended that Mauritania should assess opportunities for the use of PPPs in the red meat, milk production, and rice value chain which would contribute significantly to the sustainable development of the sector.
Some additional costs, mainly for technical studies A study by AAAID on the red meat sector is being finalized (Cost: 300,000 USD). IFC is looking at the sector for potential investments.
31
Fully deconcentrate extension and advisory services for agriculture. Fully deconcentrating certain agricultural activities, notably extension and advisory services, could offer benefits including: (i) the timely provision of services (i.e. in case of a disease), (ii) a closer identification of farmers’ needs and increased specialization by an extension service, and (iii) the creation of incentive structures to reward the extension service for responding effectively to local needs (World Bank 2014b). To fully reap the benefits of deconcentrated services and authorities, Mauritania will need to simultaneously build capacity in the local units while gradually devolving and delegating resources and staff to front-line services. The central administration might be also need to accompany these efforts with cultural changes among centrally based bureaucrats towards the policy choice of pursuing deconcentration.
Limited additional costs. It is difficult to estimate the potential costs associated with a deconcentration of extension and advisory services. No technical work has been carried out.
Chapter 6: Use of Resources in the Energy Sector
32
It is absolutely imperative to reduce grid losses by at least one-third. Without network and billing improvements, the electricity tariff, which is already high in absolute terms (20 USc/kWh), will need to be increased to bridge the gap between revenues and costs. SOMELEC has demonstrated that it has the capacity to reduce these losses between 2010 and 2013.
Budget neutral
33
Reduce reliance on imported fuel oil by pushing ahead with the Banda project. Currently the sector is heavily reliant on fuel oil for power generation, which happens to be competitive in the depressed oil price environment. However, the government is recommended to pursue the Banda Gas to Power project as the key strategy for diversifying its energy mix. The World Bank remains committed to the development of this
Additional costs but also benefits (from the sale of electricity).
Public funding estimated at US$ 400 million (of which US$
26
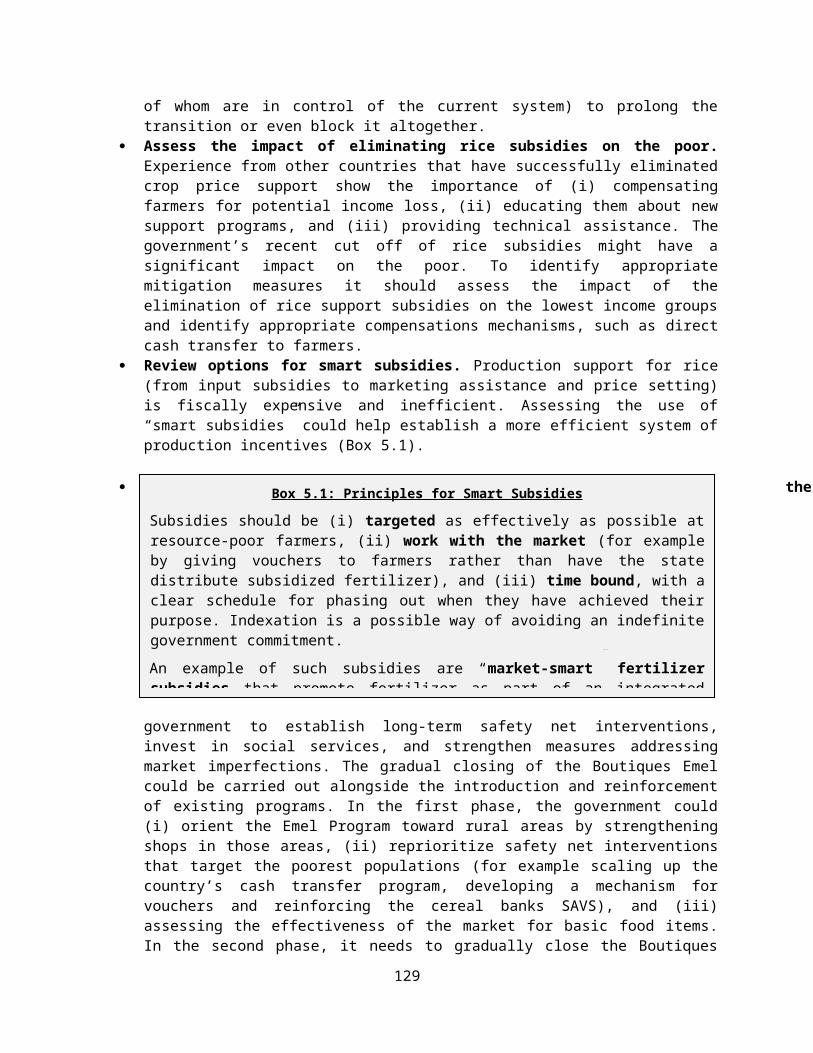
project for the benefit of Mauritania, Senegal, and Mali, which all share a strong reliance on liquid fuels.
280 million is Mauritania part)
34
Hedge against oil price variations for the short and medium term. Given the exceptionally low oil price environment, SOMELEC should pursue hedging instruments to lock in the low price in order to reduce the impact of future oil price increases on its financial results.
Some costs, but difficult to estimate without more technical work
35
Revise the electricity tariff. The structure of the tariff needs to be revised to allow SOMELEC to properly invest in maintenance and system improvements and improve equity. Designing a better tariff structure should start with a clear methodology to set tariffs that reflect costs, implemented through a phased approach to help to mitigate the impact on household energy expenditure and accompanied by a far-reaching communication strategy to ensure public support.
Savings
36
Well-targeted measures to mitigate the impact on the poor. Keeping the social electricity tariff that protects the most vulnerable customers would be a good option until better social assistance mechanisms could be developed or scaled up (for example, the cash transfer program). The effectiveness of the LPG program could be refined to be better targeted on the poor, for example through the subsidy of small gas canisters (“bonbonnes”) but not those used by large-scale consumers. The freed-up budget resources could then be also used to expand programs with quick tangible results (for instance, school meals, public works, or reductions in education and health user fees).
Additional costs. Source of funding could be savings from revised electricity tariff.
37
Promote rural electrification. Well-planned, carefully targeted, and effectively implemented rural electrification programs provide enormous benefits to rural people. A rigorous rural electrification policy and a clear programmatic vision, together with the mobilization of resources, are key elements to create rural electrification programs on a national scale.
Additional costs. Costs will depend on scope and scale of rural electrification program.
38
Develop electricity networks, in particular in the Senegal River Valley. Priority should be given in the next few years to the development of electricity networks to enable border areas to use electric existing transmission lines to take advantage of surplus energy available in the country. In particular, the installation of low and medium voltage electrical systems in farming areas of the Senegal River valley could accelerate the industrialization of the country, especially in the food industry, directly improving the living conditions of the population.
Additional costs. Costs will depend on scope and scale of program.
39
Better governance and improved management. SOMELEC needs better governance and internal controls to improve accountability, transparency, and data reliability. A first critical step to achieving this would be to improve implementation of the current performance contract.
Additional costs. Could be savings from improved efficiency.
4 Encourage PPPs. The sector needs urgent and substantial investments in Additional costs. Could be
27
0 new generation, transmission, and distribution infrastructure. Given the shortage of public funds, the government could benefit from partnering with the private sector through a PPP arrangement to enhance the quality of projects in transmission and distribution. A key prerequisite would be a sound investment climate and legal framework to define public-sector responsibilities.
savings from improved efficiency brought by PPP.
41
Increase investments in renewable energy. In a country like Mauritania, the decentralized nature of renewable energy can have enormous benefits, particularly for poorer rural areas. Renewable energy can offer a secure and reliable energy alternative that is able to increase the standard of living of rural and less developed communities. Further, local authorities can invest in local renewable energy infrastructure and services, allowing for significant local added value creation in terms of job creation and boosting local economic growth.
Additional costs. Could be savings from improved efficiency brought by PPP
42
Improve coordination and aid management. The creation of a platform for consultation and exchange between actors in the electricity sector would allow resources to be optimized and improve the implementation of projects, especially with regards to the programming, and monitoring and evaluation of investments at a national level. Alongside this, the establishment of a reliable information system on donor aid may contribute to improved traceability, accountability, and transparency in the management of aid.
Budget neutral
28