Embed Size (px)
Citation preview

The map on the cover of this publication shows those parts of the four ecological zones to be included
in the AFRENA Programme
semi-arid lowlands
humid lowlands
unimodal (rainfall) plateau
bimodal (rainfall) highlands
La carte sur la couverture de cette publication montre une partie des quatre zones 6cologiques devant relever du programme AFRENA
Zone semi-aride de basse altitude
Zone humide de basse altitude
Zone de plateau 6 r6gimepluviom6trique unimodal Zone de hautes terres Aregimepluviom~trique bimodal
KENYA FORESTRY RESEARCH INSTITUTE INTERNATIONAL COUNCIL FOR KENYA AGRICULTURAL RESEARCH RESEARCH IN AGROFORESTRY
INSTITUTE
AFRENA PROJECT MASENO KENYA PROGRESS REPORT FOR THE PERIOD
JANUARY 1988 TO JANUARY 1990
No27
Arne M Heineman Edward K Mengich Absalom D Olang Harry JO Otieno
Collaborative programme between ICRAF and the Government of Kenya sponsored by the United States Agency for International Development (USAID)
July 1990
Acknowledgements
This technical report which covers the on-station agroforestry research activities inMaseno Kenya between January 1988 and January 1990 is based on the collective effortof a great number of people who are involved in agroforestry research design planningand implementation in Kenya
We would like to thank the directors of KEFRI KARI and ICRAF Dr Odera DrNderitu and DrLundgren and Mr RB Scott (COLLPRO Divisional Director ICRAF)for their overall guidance and support to AFRENA in general and the research project in Maseno in particular
Dr GB Singh AFRENA East and Central Africa Zonal Coordinator in 1988 laid thefoundation for the work and results that are presented here His successor Mr DHoekstra and Dr D Nyamai (KEFRIs National Coordinator for Agroforestry) have beenof great help in keeping us on-track ever since offering many valuable suggestions on technical and managerial matters
Special assistance from KEFRI was received in the fields of entomology by Miss Gichoraand soil science by Miss Yopterick which is gratefully acknowledged The staff of theKenya Forestry Seed Centre are thanked for arranging most of the seed supplies
The following ICRAF staff members contributed substantially by backstopping the onshystation research in Maseno Mr R Thijssen Dr MR Rao and Dr J Roger Mr DWambuguh Mr P Oduol and Mr P Kiepe We thank them all We are also grateful toProf F Owino and the staff of our sister project entitled MPTS Germplasm Evaluationand Improvement for the good working relationships and the opportunity to share the research facilities in Maseno
The assistance of M Odongo H Wandabwa M Ngethe and R Cheruiyot in carrying out the field activities is acknowledged with thanks
Dr M Onim and the staff of the SR-CRSP project in Maseno deserve our thanks for two years of excellent cooperation whereby we realize that we have often been on the receiving end
Special thanks goes to Mr S Mwangi and his staff from the Forest Department NurseryMaseno (MENR) for their generous assistance especially at the early stages of settingup the project We also would like to acknowledge the kind assistance from Mr WOchieng farm manager of the Maseno Veterinary Farm who has been most accommodating in many ways
Furthermore we would like to thank the Principal of Siriba College and especially theSiriba College farm manager Mr Ouma for their kind cooperation whenever we came toborrow their land preparation equipment or ask advice about farm management practices
The staff of the National Sugar Research Station at Kibos has been very helpful with the
preparation of plant samples for which we are most grateful
We would also like to thank Miss Claire Muniafu for word processing the final document
Finally we would like to thank the United States Agency for International Development(USAID) for funding the project and DrI Monrison and Mr D Gibson for their continued support
TABLE OF CONTENTS
1 INTRODUCTION 1
2 BACKGROUND TO THE STUDY ZONE THE AFRENA PROJECT AND THE MASENO AREA 3
21 Landuse analysis in the AFRENA study zone 3 22 Identified landuse constraints in the study zone 3 23 Potential agroforestry solutions for the stud) zone 4 24 Agroforestry research at the AFRENA Project in Maseno 4 25 Climatic features of the study zone with relevance to Maseno 4 26 M aseno location and altitude 5 27 Landuse classification 5 28 Growing seasons 6 29 Rainfall 6 210 Temperature and potential evaporation 6 211 Natural vegetation 8 212 Soil classification 8 213 Population structure and farm size 9
3 GENERAL MULTIPURPOSE TREE AND SHRUB SPECIES SCREENING TRIALS 10
31 Justification 10 32 Objectives 10 33 Experimental design and methodology 1) 34 Site descriptions 11 35 Results and discussion 12
4 SOIL FERTILITY MAINTENANCE AND IMPROVEMENT TRIALS 21
41 Justification 21 42 MPTS species screening trial for alley cropping 21 421 Objectives 21 422 Experimental design and methodology 22 423 Site description 23 424 Results and discussion 23 4241 Trees 23 4242 Crops 26
43 The effect of Leucaenn eucocephala mulch and DAPCAN fertilizer applications on the productivity of maize and maizebean systems 27
431 O bjectives 27 432 Experimental design and methodology 27 433 Site description 28 434 Results and discussion 29 4341 Trees 29 4342 Crops 31
Cshy
44 The effect of varying the density of Leucaena diversifolia in hedgerows and proximity of the food crop to the hedge on hedge biomass productivity and maize yield 36
441 Objectives 36442 Experimental design and methodology 36 443 Site description 37 444 Results and discussion 38 4441 Trees 38 4442 Crops 42
5 FODDER PRODUCTION TRIALS 44
51 Justification 44 52 Combination of grasses and tree hedges on field bunds for fodder
production 44 521 Objectives 44 522 Experimental design and methodology 44 523 Site description 45 524 Results and discussion 46 5241 Trees and grass 46 5242 Crops 47
53 Effect of cutting height of Leucaena hedgerows on biomass productivity and food crop yields in alley cropping 50
531 Objectives 50 532 Experimental design and methodology 50 533 Site description 51 534 Results and discussion 51 5341 Trees 51 5342 Crops 51
6 NON EXPERIMENTAL ACTIVITIES 55
REFERENCES 56
4
LIST OF TABLES MAPS AND FIGURES
Table 1 Monthly rainfall at Maseno Veterinary Farm and MENR Forest Department Nursery in i988 1989 and the long term average for M aseno (mm) 7
Table 2 Average monthly maximum and minimum air temperature at Maseno in 1987 - 1989 (C) 8
Table 3 Experiment No 6 (Mixed overstorey screening trial) Height and root collai diameter increments over a period of 14 months O ct 88-Dec 89 13
Table 4 Experiment 7 (Leucaena and Gliricidia spp) Height and root collar diameter increment over a period of 14 months (Oct 88 - Dec 89) 14
Table 5 Experiment 8 (Calliandra Sesbania and Cassia spp) Height and root collar diameter increment over a period of 14 months (Oct 88 -Dec 89) 15
Table 7 Experiment 6 Total fresh biomass yield (kgtree) at first (65-12 months) and second (14 months) thinning 17
Table 8 Experiment 7 (Leucaena and Gliricidia spp) Total fresh biomass yield (kgtree) at first (7 months) and second (12 months) thinning 18
Table 9 Experiment 8 (CalliandraSesbaniaand Cassiaspp) Total fresh biomass yield (kgtree) at first (7 months) and second (12 months) thinning 19
Table 10 Experiment 9 (Mixed species screening trial) Total fresh biomass yield (kgtree) at first thinning after 9 months 20
Table 11 Tree height and root collar diameter increment (cm) between time of planting (April 1988) and time of first cutback to hedge height as indicated (in months) 24
Table 12 Fresh leafy biomass yield (tha) during the initial formation stage of the hedgerows (September 1988 - February 1989) and during productivity at the standard height of 05 m (April - December 1989) 25
Table 13 Dry maize grain yield (tha) for the first (long rainy) and second (short rainy) season of 1989 26
Ttble 14 Average fresh Leucaena yield (tha) from alley cropping plots plantedin April 1988 and regularly harvested between March and December 1989 31
Table 15 Maize yields (tha) grown in an annual system and in alley cropping with Leucaena at three fertility levels first rains (March-July) of 1989 32
Table 16 Bean yields (tha) intercropped with maize in an annual system and in alley cropping at three fertility levels first rains (March-July) of 1989 33
Table 17 Maize yields (tha) grown in an annual system and in alley cropping with Leucaena at three fertility levels second rains (September -November) of 1989 34
Table 18 Bean yields (kgha) intercropped with maize in an annual system and in alley cropping at three fertility levels second rains (Septembei -November) of 1989 35
Table 19 Biomass yield of Leucaena diversifolia in eight different hedge designs associated with food crops planted close to the hedge (first line at 375 cm) and away from the hedge (first line at 75 cm) 39
Table 20 Cumulative biomass yield (Feb-Dec 1989) for different hedge designs of Leucaena diversifolia hedges in an alley cropping experiment (kgm) 41
Table 21 Maize grain yield (13 mc) first (long) and second (short) rainy season of 1989 associated with sixteen different hedge designs of Leucaena diversifolia 43
Table 22 Tree height and root collar diameter increment (cm) between planting and first cutting for Leucaena leucocephalaSesbaniasesban and Calliandracalothyrsus planted on field bunds in pure lines and in mixture with Pennisetunpurpureum 47
Table 23 Fresh leafy biomass yield (kgm) during the initial formation stage of field bunds (august 1988-January 1989) and during the productivity of standard cutting (April-December 1989) 48
Table 24 Fresh biomass yield in 1988 (initial) and 1989 (uniform cuttings) of Leucaena leucocephala hedges managed at five different cutting heights in an alley cropping system 53
Table 25 Maize grain yield (mc = 13) cropped alleys of Leucaena leucocephala hedges managed at five different cutting heights in an alley cropping system 54
Figure 1 Height and root collar diameter growth of Leucaenaleucocephala (Hengchun China) planted in hedgerows between planting time (April 1988) and time of first harvest (February 1989 30
Annex 1 Staff List AFRENA on-station project (Maseno) 57
Annex 2 Experiment 10 Species 1t treatment allocation and seed supplyinstitution for Leucaena and Calliandra speciesprovenances general screening trial 5 8
Annex 3 The mean height and root collar diameter growth (cm) of different provenances of Leucaena leucocephala at 14 months after planting 59
Annex 4 The mean height and root collar diameter growth (cm) of different provenances of G1iricvi2 sepium at 14 months after planting 59
Annex 5 The mean height and root collar diameter growth (cm) of different provenances of Calliandracalothyrsusat 14 months after planting 60
Annex 6 The mean height and root collar diameter growth (cm) of different provenances of Sesbaniasesban at 14 months after planting 60
Annex 7 The mean height and root collar diameter growth kcm) of two provenances of Cassiasiamea and one provenance of Cassiaspectabilis at 14 months after planting 61
1 INTRODUCTION
This is the first technical report of the KEFRI-KARI-ICRAF Collaborative AgroforestryResearch Project covering the period from January 1988 to January i990 and including theresults of the first four cropping seasons Subsequent reports will be published on anannual basis covering two cropping seasons The project is located in Maseno in NyanzaProvince in West Kenya The project is part of the AFRENA (Agroforestry ResearchNetworks- for Africa) programme of ICRAF which covers among other regions the bimodal highlands of East and Central Africa
The mandate of AFRENA is to develop appropriate agroforestry technologies for selectedlanduse systems and to develop the regional and national capability to plan formulate andimplement agroforestry research in the participating countries and regions
In Kenya the project is implemented in collaboration with two national research institutesviz the Kcnya Forestry Research Institute (KEFRI) and Kenya Agricultural ResearchInstitute (KARl) and is funded by the United States Agency for International Development(USAID)
The rep6rt summarizes the activities undertaken and the preliminary research resultsobtained during the reporting period It is to be noted that during the first year of projectimplementation (November 1987-October 1988) the emphasis was on the development ofresearch facilities the formation cf the research team and the establishment of a numberof on-station agroforestry experiments Results from the research undertaken have startedto emerge from the second year (1989) onwards and they are included in this reportHowever the technical results and conclusions presented should be read with the ususalcaution since data collection and analysis continues and preliminary conclusions maychange or have to be amended in the light of future findings
The Maseno agroforestry research centre also houses the multi-purpose tree germplasmevaluation and development project implemented by ICRAF and funded by GTZBMZfrom The Federal Republic of Germany The Germplasm project is mainly involved intesting evaluation and improvement of multi-purpose tree and shrub germplasm and it isdesigned to support and strengthen the ongoing AFRENA activities Plans for theimplementation of an on-farm agroforestry research project funded by the RockefellerFoundation are under way This project will take some of the agroforestry technologiesdeveloped at the Maseno station and test them under farmers conditions in various partsof West Kenya Besides pure technology testing the on-farm project is involved instudying the socio-economic framework in which the agroforestry interventions (have to)function
The physical implementation of the on-station activities started in November 1987 with theestablishment of the AFRENA (Maseno) nursery by ICRAF scientist Mr D Wambuguhassisted by Mr AM Heineman and Forest Department Maseno Tree Nursery staff SinceNovember 1987 Mr Heineman has worked full-time on the development of the projectin Maseno In early 1988 KEFRI seconded Mr J1-1O Otieno to the project FromSeptember 1988 until October 1989 was in theMr Otieno UK (Wales) for furtherstudies In July 1988 Dr AD Olang (agronomist) joined the project the KARlshyas
seconded scientist Dr Olang was project team leader from August 1988 until October1989 In September 1988 KEFRI seconded Mr EK Mengich as its resident scientist tothe project In November 1989 Mr Otieno returned to the project and was appointedDirector of the Maseno Agroforestry Research Centre and team leader of the on-stationproject Since the second quarter of 1988 KEFRI has steadily provided a number ofadditional support staff members to the project A complete list of project staff as of January 1990 is given in Annex 1
2
2 BACKGROUND TO THE STUDY ZONE THE AFRENA PROJECT AND THE
MASENO AREA
21 Landuse analysis in the AFRENA study zone
Based on a zonal comparison of landuse systems in the East and AfricanCentral Highlands and their current problems as well as an inventory of already ongoingagroforestry research in each of the participating countries a regional research programme was developed to generate agroforestry technologies aimed at solving the diagnosedlanduse problems and developing its potentials
To determine what role agroforestry can play on small farms in the bimodal highland areasof Kenya a multi-disciplinary team studied these landuse systems and evaluated theirlimitations and potentials Possible agroforestry solutions to specifically identified problems were formulated (Minae and Akyeampong (ed) 1988)
The importance of the Kenya Highlands is exemplified by the fact that it covers only 15 of the countrys land area but it supports 50 of the total population Six major landuse systems were identified during the landuse analysis (Diagnosis amp Design) exercise eachwith its unique set of activities and agroforestry potentials Each landuse system is named after the major food or cash crop grown within that system The six major landuse systems are based on coffee tea maize potatoes sugar and (subsistence) food crops
In the food crops based system primarily found in the Highlands west of the Rift Valley a variety of crops such as maize beans cassava bananas sweet potatoes sorghum and millet are cultivated Cowpeas upland rice and groundnuts are also found and various cash crops such as cotton coffee and sugar are sometimes grown on a small scale
22 Identified landuse constraints in the study zone
Practically all highland farming systems in Kenya are characterized by high populationdensities resulting in relatively small farms where continuous cultivation is the practicerather than the exception Because the use of organic and inorganic fertilizers is usuallyinsufficient farmers experience a gradual decline in soil fertility especially in their food crop plots Apart from losses in soil fertility physical soil loss and gully formation is often experienced on steep slopes
Another problem commonly seen in the highland farming systems is the shortage of goodquality fodder for livestock especially during the dry season In the Central Highlandswhere small scale commercial dairy production is advanced the supply of protein rich fodder is presently inadequate to meet the demand Similar problems are experienced inother parts of the highlands where farmers maintain livestock mostly for home consumption of the products
Both the commercial and domestic demand fo wood products such as timber poles andfuelwood as well as the production of fruits were also identified as having a potential for improving the cash income of the farmers and alleviating wood scarcity around the farm
3
23 Potential agroforestry solutions for the study zone
Central to the philosophy of agroforestry is the environmentally sound-and economicallyviable integration of multi-purpose trees and shrubs (MPTS) in existing agricultural land use systems
While agroforestry cannot possibly solve all farming problems it is fair to say that it doesoffer in some instances low cost alternatives to non-agroforestry solutions
In this context the use of alley cropping to reduce soil erosion and to supply greenmanuremulch to the soil as an alternative to physical erosion control structures andinorganic fertilizers is a promising solution The use of fodder trees and hedges plantedon bunds in combination with grasses is perhaps a viable alternative for the current fodderproduction practices Establishment of boundary plantings with MPTS and fast growingwoodlots are other promising agroforestry technologies that warrant further attention
24 Agroforestry research at the AFRENA Project in Maseno
At the East and Central Africa AFRENA research site in Maseno in West Kenya a multishydisciplinary research team is working on the development of a number of priorityagroforestry technologies These include the development of alley cropping systems forthe production of green manure mulch and fodder and the production of feed resourcesfor livestock especially from MPTS and grasses grown on field bunds MPTS are alsoevaluated in screening trials for a variety of on-farm uses The experiments found inMaseno can be classified as follows
- General MPTS species screening trials
- Soil fertility maintenance and improvement trials
- Livestock fodder production trials
Before providing a full description and the preliminary results of each groupexperiments in the next chapters some environmental background information of
on theAFRENA study zone and the Maseno research station area in particular is provided in thesection below
25 Climatic features of the study zone with relevance to Maseno
The East and Central African AFRENA Highlands are situated on the Equator between4 degrees north and 4 degrees south The study zone is therefore largely influenced by theIntertropical Convergency Zone (ITCZ) which follows the relative movements of the sunand passes the Equator twice a year (loekstra 1988) The ITCZ moves from theSouthern Hemisphere to the Northern Hemisphere in MarchApril and in the oppositedirection in SeptemberOctober These two movements are followed by periods of
4
precipitation or so called rainy seasons and this explains the in principle bimodalcharacter of the rainfall regime in the region
The ITCZ can and often does undergo serious modifications from passing over the vastlandmass of the highlands and since barometric pressure differences are often small theeffects attributed to localised topography and the presence of the large lakes in the regioncan influence the local climatic patterns considerably
In the Maseno area the predominant wind direction is in principle from east to southeastduring the first (long) rainy season from June to September and from north to northeastfrom October to May during the second (short) rainy season and the following dry periodSince Maseno is situated only 30 km north of Lake Victoria this large body of fresh inlandwater has a profound influence on localized precipitation wind direction and wind speed
26 Maseno location and altitude
The township of Maseno is located on the Equator 30 km north-west from Kisumu inNyanza Province at 34 35 East and 0 North at an altitude of between 1500 and 1600 m above sea level
27 Landuse classification
Various classifications have been developed to describe the East African Highlands interms 9f climate and landuse systems Widely accepted are the classifications by Koppenand J-ietzold amp Kutch (1982) Inthe K6ppen classification Maseno region (WesternKenya Highlands) falls in class Afor climate ie Tropical Rain Climates because themean temperature for the coldest month is above 18C (below this value the climate classis C ie Temperate Rain Climates) K6ppen further allows a sub-classification withw for winter dry and fYfor no distinct dry season In the AFRENA study zone theterm winter refers to the cooler period of the year from June to September Finally thenumbers 1 or 2 indicate the existence or absence of bimodality of the experienced rainfallpattern Considering the above the Maseno region is classified as Aw2 - area
Jaetzold and Kutch developed an agro-ecological zonation methodology for the tropicsbased on temperature water supply for plant development and length of the growingperiods which was especially adapted for Kenya (Jaetzold and Schmidt 1982) Eight mainzones are based on water availability ranging from perhumid to perarid and these mainzones are subdivided into six altitudinal or temperature belts from the lowlands to thetropical alpine zone Using this zonation methodology most of the landuse systems in theAFRENA study zone can be classified in the humid and sub-humid main zones and basedon altitude they fit into the range from lower midlands to upper highlands Consideringthe above Maseno falls in the lower midland zones (LM1 and LM2)
5
28 Growing seasons
An analysis of the length of the growing seasons in the study zone which includes humid (rainfallpotential evaporation gt075) and sub-humid (RE - Ratio = 04 to 075) areasindicates that many areas have despite bimodal rainfall distribution only one growingperiod with a length between 190 and 365 days In the larger part of the zone there are two sub-humid periods between the fully humid rainy season periods but moisture availability is-always sufficient for plant growth The situation in Maseno and the south western highlands of Kenya in general is that there is a distinct and agriculturally relevant bimodality of growing seasons with a first (long) rainy season from MarchApril until JuneJuly and a second (short) rainy season from September until November Consequently food crops are sown twice a year in April and September and although success of harvest varies from season to season most farmers expect to harvest twice a year with the major share of the annual food crop produced during the first rains
29 Rainfall
The mean annual rainfall is about 1750 mm but fairly large deviations from the long term annual mean can occur For instance around 2360 mm was recorded at the nearest twoweather stations in 1988 and approximately 1900 mm was recorded in 1989 The actual total anount of rainfall received at the Maseno Veterinary Farm in 1988 and 1989 was 2377 mm and 1934 mm respectively The MENR - Forest Department Nursery inMaseno received 2350 mm and 1861 mm in the last two years In Table 1 the monthlytotal rainfall received in 1988 and 1989 at the two recording sites is summarized At SiribaTeachers College 1929 mm was recorded in 1988 emphasizing that even minor topographical and locational differences of the rainfall recording point within Maseno mayhave a significant effect on the total amount of precipitation received in any given yea-It is further noted that during the rainy seasons sudden increases in wind speed mark thearrival of torrential rains whereby up to 50 mm precipitation can fall in less than onehour The combined erosive force of such high winds and heavy rain is considerable
210 Temperature and potential evaporation
The mean annual day temperatare is 20C with the average maximum daily temperaturesnot exceeding 31C and the average minimum night temperatures not dropping below 150C The recorded average monthly maximum and minimum temperatures for 1987 shy1989 are shown in Table 2 The largest difference between average daily maximum and minimum temperature was 150C measured in October 1989
In Maseno the average potential evaporation is estimated at 1738 mm per year
6
Table 1 Monthly rainfall at Maseno Veterinary Farm and MENR Forest DepartmentNursery in 1988 1989 and the long term average for Maseno (num)
YEAR 1988 1989 LONG TERM MEAN
LOCATION VET MENR VET MENR MASENO FARM NURSERY FARM NURSERY TOWN
MONTH
January - 90 180 45 68 66 February - 126 131 195 157 92 March - 207 125 239 206 151 April - 413 516 194 188 273 May - 247 342 240 222 217 June - 120 90 69 88 114 July - 95 81 90 51 88 August - 62 198 178 170 138 September - 318 192 265 290 151 October - 210 155 123 143 165 November - 374 281 112 113 156 December - 115 62 185 162 125
TOTAL - 23502377 1934 1861 176
Sources SR-CRSP project Maseno (1988 - 1989) AFRENA project Maseno (1989) MENR Forest Dept Maseno (1988)
7
Table 2 Average monthly maximum and minimum air temperature at Maseno in 1987 - 1989 (-C)
YEAR
1987 1988 1989
TEMPERATJJRE MAX MIN MAX MIN MAX MIN
MONTH
January February March April May June July August September October November December
-
-
-
31 30 29 27 30 30 30 31 30 31
21 20 20 18 18 18 19 19 19 19
30 31 30 31 30 29 29 30 30 31 30 31
18 20 19 18 19 17 19 18 18 18 18 19
29 27 26 28 28 28 29 30 30 30
-
-
16 15 15 17 15 15 15 15 16 17
Sources Siriba Teachers College Maseno (1987-1988) AFRENA project Maseno nursery site (1989)
211 Natural vegetation
In many places of Maseno area the natural vegetation has been replaced by cultivation and settlement and what exists today are isolated indigenous trees on farmlands The original vegetation of this area consisted ofAlbizia spp Bridelia spp Vernonia spp Croton spp Acanthus spp and Chlorophora excelsa
Currently the landscape is dominated by small scale farming activities with a dispersed cover of small medium and tall sized indigenous and exotic tree species Predominant species found along roads and in and around farms are Markhamia spp Sesbania sppCassia spp Acrocarpus spp Cupressus spp Eucalyptus spp Pinus spp and to a lesser extent Casuarinaspp The fields where AFRENA experiments are located were cleared from either pasture vegetation or a mixture of low shrubs and bushes including Psidium guajava(guava) and Digitariasacalarum (couch grass)
212 Soil classification
The predominant soil types in the food crop based landuse system around Maseno and West Kenya in general depend on the location of the agricultural fields in the landscape
8
Recognised are uplands and ridges well drained lands in the centre of the catenas and valley bottoms The soil types of major importance in the uplands are cambisols with secondary importance attributed to lixisols (tropical luvisols) ferralsols and acrisols In the valley bottoms which are often imperfectly drained vertisols gleysols and fluvisols are found The Maseno area consists of xanthic and orthic ferralsols plinthic acrisols and isolated areas consisting of lithosols and regosols (stony phase) The soils around the research centre are all based on Nyanzan basalt granite and phonolitic lavas as the main parent material The major soil types found at the project location in Maseno are ferralsols acrisols and lixisols
A more detailed description of the soils at individual experimental sites in Maseno is provided in the next chapters It is sufficient to say here that the texture of most soils in the experiments is light to medium and that their depth is mostly 12 m or more The slopes of the hills around Maseno can be fairly steep but they are generally less than 20 All on-station experiments are situated at almost flat land (slopes of less than 3) The soils in the Maseno area are fairly to strongly acidic (pH in water 45 to 65) and highly deficient in P and N
213 Population structure and farm size
The population density in Kisumu district ranges from below 150 to as high as 550 persons per square kilometre depending on the fertility of the soils and consequently the cropproduction potential However in the areas around Maseno especially in the verysouthern tip of Kakamega District in South and East Bunyore Locations populationdensities of over 700 people per square kilometre in certain pockets are found Consequently farm sizes are ranging from over 10 hectar to less than half a hectare of arable land often supporting families of 6 to 10 members In general the population pressure is so high that cultivation is found everywhere both in upland areas on the ridgesof slopes the slopes themselves and in the lower lying valley bottoms
9
3 GENERAL MULTI-PURPOSE TREE AND SHRUB SPECIES SCREENING TRIALS
31 Justification
Research at the AFRENA Maseno site started in 1988 with alley cropping experimentsusing well known MPTS ie LeucaenaleucocephalaCalliandracalothyrsus and Sesbaniasesban In order to be able to select from a wider selection of species and provenancesfor a variety of uses in agroforestry general screening of more MPTS species and provenances was considered a priority Different species and provenances of bothindigenous and exotic MPTS were planted in experiments 6 7 8 9 and 10 and they werestudied for their site adaptability and potential uses under the conditions of the Maseno area Species and provenances with good initial performance will be selected for testingunder different agroforestry technologies in order to determine their suitability for a rangeof applications
32 Objectives
The objectives of the general species screening trials are twofold
- to observe the early growth patterns of MPTS and
- to screen MPTS on the basis of early growth for their suitability with respect to a range of agroforestry technologies
33 Experimental design and methodology
Experimental design
All general MPTS screening trials were designed as randomised complete blocks In allexperiments each treatment was replicated three times In experiments 6 7 8 and 10fifteen trees were established in rows of 1125 m long with an initial in-row spacing of 075 m In experiment 9 eleven trees were established in rows of 825 m long with the sameinitial spacing between trees Plot width was 3 m with the row of trees placed in themiddle of the plot All tree rows are established in east to west direction therebyminimizing the effect of shade between plots Plots were separated from each other byeither grass strips (experiment 6) or small earth bunds (experiments 7-10) No crops were grown in the plots All trees were established from seedlings which were 5 to 6 monthsold The only exception were four Leucaena provenances planted in Octuber 1988 which were 11 months old at the time of transplanting A starter dose of 25 g DAP was usedequivalent to 45 g of N and 115 g of P20 5 per tree This is equal to 20 kgha of N and 51 kgha of P20 5
10
Management of the trees
Of the fifteen originally established trees in each plot all odd numbered tree- werethinned out once the crowns of neighbouring trees started to touch each other The initialspacing between trees was thereby increased from 075 m to 15 m (usually after 6 lio 8months) Of the remaining trees all even numbered trees were again removed once the crowns of neighbouring trees started to touch each other (usually after another 6 to 8months)- Thus after two thinnings practically within the first fifteen months four trees per plot spaced at 3 m were left for monitoring of essential growth characteristics Thefirst height and root collar diameter measurements were done 6 to 10 days after the dayof planting and then continued on a monthly basis during the first year after plantingSince October 1989 the frequency of height and root collar diameter measurements hasbeen reduced and now coincides with the start and finish of each rainy season
To obtain additional information from these general screening trials the thinned out trees were not actually uprooted but cut at the following heights ground level (0 cm) 25 cm50 cm and 75 cm This was done in order to quantify the potential of each species tocoppice related to these initial cutting heights
The most recently planted general species screening trial (experiment no10) wasestablished in October 1989 The trial contains nine provenances of Leucaena spp and one known Calliandracalothyrsus provenance as a control species The experimentaldesign is similar to that of the other general species screening trials with fifteen trees perplot and replicated three times Since this report covers the period up to January 1990only few data have been collected which does not justify a full presentation and discussionof experiment 10 at this stage However the species list for this experiment is included as Annex 2
34 Site descriptions
Experimznt 6
Experiment 6 is located on a sloping site in the forestry department land The sitegenerally gives the appearance of cleared bushland with some tall trees (mostly Eucalyptusspp) scattered around Prior to the experiment the land had not been used and had avegetation of bushes (Psidium guajava) and couch grass (Digitariasacalarum) Soils arechanging colour from reddish brown on the upper parts where experiment 6 is located to more greyish brown in the lower lying parts When the site was surveyed in 1988 the soilwas classified as a luvisol The predominant soil texture at different depths at the site wasclay to clay loam well drained with a crummy structure and with a high gravel content inthe third (lower) replicate The experiment is sited on the most inclining section of thestation and has a slope of approximately 5 The site is strongly acidic with a pH (inwater) around 50 The soil depth varies with location in the experiment in the upperparts (replicates 1 and 2) it exceeds 12 in In the lower parts (replicate 3) it becomes gravelly from 075 m onwards
I1
Experiment 7 8 and 9
Experiments 7 8 and 9 are located next to each other at the veterinary farm in maseno The experiments were established on land which had been used for a number of years as pasture for livestock The site is flat with a slope of less than 2 There is little dangerof serious soil erosion However after heavy rainstorms sorne sheet erosion can be seenCouch grass (Digitariasacalarum) is the predominant weed species The soil type wasclassified as luvisol in 1988 In soil samples taken in experiment 7 no distinct boundaries between horizons were seen A gradual change in colour from dark reddish brown toreddish brown in the deeper parts of the profile was observed The soil depth exceeded 12 m Soil texture is clayey to clay loam Soils were fairly acidic at the onset of theexperiments with pH (in water) ranging from 50 to 60 These soils are lacking in N and P
Experiment 10 is located at the veterinary farm adjacent to experiments 3 and 5 along the same slope In the absence of any details on soil analysis for this site it is reasonable to assume that the initial soil physical and chemical characteristics are similar to those described for experiment 3
35 Results and discussion
Tree survival
The majority of species established well Poor survival rates were recorded for Sesbaniagrandiflora (100 mortality) Croton macrostachyus ErythInina abyssinicaErythrina caffraandAlnus nepalensis Dead seedlings were being replaceci tp to two months after plantingthe trials
Pests and diseases
Pest attacks were observed on ErythrinaabyssinicaErythrinacaffra Casuarinajunghuniana(unidentified) Sesbaniasesban (attacked by the beetle Mesoplatys ochroptera)Calliandracalothyrsus (termites) Gliricidia sepiurn (aphids) and Tipuana tipu (aphids) Where necessary insecticides were used in the first half year after establishment as a check to prevent further damage Ambush (Lambdacyhalothrin 975 gl)) was sprayed at the rateof 015 1per 100 1of water during the first half year to control Mesoplatys and aphidsAldrex 48 (Aldrin 480 gl)) 111 1100 1 of water was used against termites Fungaldiseases were noted on Acacia spp Sapium sebiferum and Cassia siamea Hail damage to young trees was particularly severe with Gliricidia sepium Cassiaspectabilisand Erythrina caffra
12
Height and root collar diameter development
Tables 3 4 5 and 6 summarize the height and root collar diameter growth increments overthe reporting period for each experiment Incremental growth is here defined as the difference between the first value measured and the measurement done 9 or 14 months later
Table 3 Experiment No 6 (Mixed overstorey screening trial) Height and root cottar diameter increments over a period of 14 months Oct 88-Dec 89 at planting time
Treatment Species Seed Origin Increment Provenance Height (m) RCD (cm)
Ti Acrocarpus fraxinifotius Muringato Kenya 369 656
T2 Markhamia lutea Kakamega Kenya 223 456
T3 Markhamia Lutea Osorongai Kenya 199 431
T4 Harkhamia Lutea Rusenyi Rwanda 145 37
T5 Croton macrostachys Kieni Forest Kenya 070 276
76 - Croton megalocarpus Kikuyu Kenya 179 453
T7 GrevilLea robusta Namanjatala Kenya 288 699
78 Erythrina abyssinica Nandi Kenya Diseased replanted unreliable data
T9 Tipuana tipu Nairobi Kenya 391 406
TIO Tamarindus indica Embu Kenya 036 068
TIl Cordia abyssinica Kedowa Kenya 139 517
T12 Casuarina junghuniana KARI Arboretum Kenya 346 568
Experiment 6 consists of different trees of both exotic and indigenous origin and thespecies planted expectedly showed great variations in initial growth performance Total amount of rainfall received between October 1988 and December 1989 was 2359 mmThe results in Table 3 show that the development of the root collar diameter closelyfollowed height growth development in most species The exceptions were Grevillearobusta Tipuanatipu and Cordiaabyssinica Grevillea scored highest (7 cm) on root collar diameter growth increment but was not one of the fastest growing trees in terms of heightincrement (288 in) Tipuanatipu was the fastest growing tree in terms of height increment (391 in) but not so for root collar diameter increment (41 cm) Cordia abyssinica was slow in height growth (139 m) and appeared increasingly unhealthy but it was fast in rootcollar diameter growth (52 cm) Fast growing species with a total height increment after 14 months of more than 25 m were Tipuana tipu Acrocarpus fraxinifolius Casuarina junghunianaand Grevillearobusta Medium growth between 14 and 25 m increment wasshown by the Marldnamiaspp and Crotonmegalocarpus Slow growing species with a heightincrement of less than 14 m or less than 10 cmmonth were Croton macrostachyusTamarindus indica and Cordia abyssinica Erythrina abyssinica was diseased and its potential could not be assessed from the specimens planted
13
Table 4 Experiment 7 (Leucaena and GLiricidia spp) Height and root collar diameter increment over a periodof 14 months (Oct 188 - Dec 89)
Treatment Species Seed Origin Increment Provenance Height (m) RMD (cm)
T1 Leucaena Leucocephata Kibwezi Kenya 284 675
T2 Leucaena Leucocephata Hawaii 313 775
T3 Leucaena teucocephala Melinda Belize 292 647
T4 Leucaena teucocephala Hengchun China 319 711
T5 Leucaena leucocephata Yimbo Siaya Kenya 301 61
T6 Leucaena diversifotia Kibwezi Kenya 148 351
T7 GLiricidia sepium Guatemala 249 653
T8 Gtiricidia sepium Playa Tamarindo Santa Cruz Costa Rica 208 605
T9 Gtiricidia sepium Pontezueta Cartagena Columbia 257 759
TIO Gtiricidia sepium Honterrica Taxisco GuatemaLa 228 818
T11 Gtiricidia sepium Vado Hondo Chiquimala GuatemaLa 259 689
T12 Gliricidia sepium Playa de Samara Guyatenago GuatemaLa 295 759
An indication of general performance of all species in experiment 7 is given in Table 4T he detailed results of statistical analysis of each group of species are summarized in Annexes 3 and 4
The four Leucaena leucocephala provenances (T1 - T4) in experiment 7 showed a remarkable uniformity in height growth increment ranging fiom 284 m to 319 m duringthe first 14 months after planting Leucaena leucocephala from Hengchun China performed slightly better than the other provenances The local Leucaenaleucocephalaseed source from Yimbc in Siaya District attained a satisfactory height increment of 301 m Root collar diameter increment ranged from 60 cm (Yimbo Siaya) to almost 75 cm (Hawaii USA) over the same period Height growth differences were significant(p lt 005) between the two best performing provenances and the slowest growing entry from Yimbo Siaya Root collar diameter increment differences were also significant (plt001)The more bushy Leucaena diversifolia from Kibwezi Kenya did not display impressiveheight growth compared to the five Leucaena leucocephala species This species showed a multi-stemmed rather crooked growth form from the base early flowering and generallylow leafy biomass productivity It does not seem promising for the Maseno area
The six Gliricidia sepium provenances also showed a reasonable degree of uniformity in height growth performance on this site The Gliricidiasepium provenance from Santa Cruz Costa Rica was clearly growing slower than the other five provenances Heightincrement during the measurement period ranged from 208 m to 295 m Significant
14
differences in height growth were observed (p lt005) Root collar increment ranged from 66 to 84 cm with a mean of 77 cm over the growing period Significant differences between provenances were found (p lt001)
Table 5 Experiment 8 (Cailiandra Sesbania and Cassia spp) Height and root collar diameter increment over a period of 14 months (Oct 88 - Dec 89)
Treatment - Species Seed origin Increment Provenance Height m) RCD (cm)
TI Caltiandra catothyrsus GuatemaLa 419 87
72 Catliandra catothyrsus Kibuye Rwanda 394 78
T3 Cattiandra catothyrsus Arboretum de Ruhande Rwanda 413 85
4 Sesbania sesban Kakamega Kenya 450 81
T5 Sesbania sesban Mukururiati Kenya 448 89
T6 Sesbania sesban Kiambu Kenya 308 49
T7 Sesbania grandiftora Kitul Kenya Dead at 14 months -
T8 Cassia spectabilis Bugarama Rwanda 410 88
T9 Cassia siamea Bugarama Rwanda 271 62
TIO Cassia sia-ea Kuate Kenya 245 56
An indication of general performance of all species in experiment 8 is given in Table 5 The detailed results of statistical analysis of each group of species are summarized in Annexes 5 6 and 7
The three Calliandracalothyrsusprovenances showed a high degree of uniformity in heightincrement ranging from 394 m to 419 m Calliandracalothyrsus from Guatemala was slightly better than the two provenances from Rwanda However differences in heightgrowth were not significant (p gt0W) Root collar diameter increment ranged from 78 to 87 cm and the differences were not statistically significant either
The three Sesbaniasesban provenances showed significant differences in height growthperformance (p lt001) Sesbaniasesban from Kakamega Kenya and Sesbaniasesban from Mukururiati Kenya both reached a top height of around 50 m after 14 months equivalent to a height increment of 45 m Sesbaniasesban from Kiambu Kenya grew much slower and reached a top height of 34 m during the same period Its height increment was only308 m The best performing two provenances showed root collar diameter increments of 81 and 89 cm respectively but Sesbaniasesban from Kiambu was a much more slender species with a root collar diameter of 49 cm after 14 months The differences in root collar increment between the faster and the slower growing provenances was significant(p lt005)
The two Cassiasiamea provenances showed a high degree of uniformity in height growthincrement (271 m and 245 m respectively) Cassiaspectabilisfrom Bugarama Rwanda showed very promising height growth increment of 410 m over the same period
15
Differences in root collar diameter increment followed a similar trend as for heightincrement and were equally significant between Cassia spectabilis and the two Cassia siamea provenances (p lt001)
Table 6 Experiment 9 (Mixed species screening trial) Height and root collar diameter increment over aperiod of 9 months (April - Dec 189)
Treatment Species Seed Origin Increment Provenance Height Wr) RCD (cm)
T1 Atbizia Lebbeck India 059 10
T2 Atbizia fatcataria Malaysia 153 27
T3 Acacia auricut formis India 134 24
T4 Alnus acuminata Guatemala 162 31
T5 Atnus acuminata Mexico 164 27
T6 Arnus nepatensis Nepal 105 14
T7 Erythrina caffra India 132 17
T8 -Grevitlea robusta India 198 33
T9 Jacaranda mimosifotia India 241 50
T10 Sapium sebiferum India 091 19
Experiment 9 is half a year younger than experiments 6 7 and 8 and the results presentedhere cover the first 9 months after planting Jacaranda mimosifolia and Grevillearobusta were the best performing in both height and root collar diameter development Albizia lebbeck was poor in root collar diameter increment and was generally slower growing than Albizia falcataria The height growth figures for Erythrinacaffra were the lowest and also somewhat unreliable since there was dieback of apical growth tips following hailstorm damage The two Alnus acuminataprovenances showed better growth performance than Alnus nepalensis Acacia auriculiformis has the growth form of a shrub with a delnse arrangement of waxy leaves Sapium sebiferum has not shown convincing growth and looks rather unhealthy
Biomass production from first thinning and coppice regrowth
Tables 7 to 10 summarise the average fresh biomass yield per tree from the first thinningsubsequent coppice regrowth cuttings and second (final) thinning in each experiment The first thinning was based on cutting back a total of eight trees in pairs of two at different cutting heights (0 25 50 75 cm) The second thinning was based on uniformly cuttingback three remaining (non-experimental) trees to ground level
16
Table 7 Experiment Total6 fresh biomass yield (kgtree) at first (65-12 months) and second (14 months) thinni
Treatment Species Seed Origin First ThinninpProvenance SecondthinniBiomass (kg) Biomass (k Initial Regrowth Total
TI Acrocarpus fraxinifolius Muringato Kenya 18 31 49 12 T2 Markhamia lutea Kakamega Kenya 12 07 19 3 73 Markhamia lutea Osorongai Kenya 13 07 20 2 T4 Markhamia lutea Rusenyi Rwanda 10 12 22 21
Croton macrostachysT5 Kieni Forest Kenya 14 03 17 Not yet cu-T6 Croton megalocarpus Kikuyu Kenya 24 05 29 7 T7 GreviLea robusta Namanjatala Kenya 17 04 21 6( TB Erythrina abyssinica Nandi District Kenya Dead 19 Tipuana tipu Nairobi Kenya 22 Not yet harvested 31 T10 Tamarindus indica Embu Kenya SLow grower not yet harvested T1l Cordia abyssinica Kedowa Kenya 22 05 27 31 T12 Casuarina junghuniana KARLArboretun Kenya 40 12 52 10
MEAN 16 10 28 51
In experiment 6 with its mixture of overstorey trees all trees subjected to cutting haveshown the ability to coppice although growth differed considerably between the speciesThe first thinning was do- after a period ranging from 65 months to 12 monthsdepending on species growtli tmes and the rate at which their canopies closed The firstthinning has not been done for Tamarindus indica the slowest growing species andErythrina abyssinica which was attacked by yet unidentified pest and had earlier beenreplaced It is interesting to note that the predominantly single stemmed speciesAcrocarpusfraxinifoliusgave the highest average coppice regrowth after the first thinning(31 kgtree fresh weight) Another significant observation was that the total biomassproduction harvested from the trees thinned after one year in most cases by far exceededthe sum of initial biomas- plus coppice regrowth of trees thinned after 6 and 8 monthsThough Markiamialutea (kusenyi Rwanda) gave the least biomass in the first thinningit was together with Casuarinajunghuniana only second to Acrocarpus fraxinifolius incoppice regrowth production (12 kgtree fresh weight) Acrocarpus also gave the highestbiomass yields in the second thinning (122 kgtree) but is was closely followed byCasuarinajunghuniana(105 kgtree)
The differences in potential use of coppice material from different species will need to besupported by foliar analysis and studies on decomposition rates The potential of somespecies to form barrier hedges for soil conservation and possibly selection for alleycropping looks promising and is currently further investigated
17
Table 8Experiment 7 (Leucaena and Gliricidia spp) Total fresh biomass yield (kgtree) at first (7 months) andsecond (12 months) thinning
Seed Origin First Thinning Second thinningTreatment Species Provenance Biomass (kg) Biomass (kg)
Ti Leucaeng Leucocephala
T2 Leucaena teucocephaLa
13 Leucaena leucocephala
74 Leucaena eucocephata
15 Leucaena eucocephale
T6 Leucaena diversifotia
T7 Gliricidia sepiun
T8 Gliricidia sepium
T9 Gtiricidia sepium
T10 Gliricidia sepium
111 Gtiricidia sepium
T12 Gtiricidia sepium
Kibwezi Kenya
Hawaii
Metnda Belize
Hengchun China
Yimbo Siaya Kenya
Kibljezi Kenya
Guatemala
Playa Tamarindo Santa Cruz Costa Rica
Pantezueta CartagenaColumbia
Monterrico Taxisco Guatemala
Vado Kondo Chiquimala Guatemala
Playa de Samala Guyatenago Guatemaia
MEAN
Initial Regrowth Total
39 24 63 160
38 15 53 141
31 21 52 157
30 18 48 197
18 14 3 124
09 13 22 37
11 11 22 62
11 09 20 58
14 14 28 82
14 11 25 84
18 14 32 105
21 13 34 141
21 15 36 112
Despite its superior height growth performance Leucaena leucocephala from HengchunChina was not the highest biomass producer in the first thinning (30 kgtree) and thesubsequent regrowth cutting (18 kgtree) However it improved considerably in thesecond thinning (197 kgtree) further supporting its potential for use in the Masenoregion In the first thinning Leucaena leucocephala from Kibwezi Kenya produced the largest quantity of biomass 39 kgtree and it came second after Leucaena leucocephalafrom Hengchun China in the second cutting (16 kgtree) Local provenance Leucaenaleucocephala from Yimbo Siaya was least productive in both cuttings with 18 and 124kgtree respectively Leucaenadiversifolia (Kibwezi Kenya) with its creeping habit andslower growth produced relatively little biomass 09 and 37 kgtree in the first and second cutting respectively
Gliricidiasepium from Playa de Samala Guyatenago Guatemala was the best biomassproducer among the Gliricidia species in both first (21 kgtree) and second thinnings (141kgtree respectively Gliricidiasepium from Playa Tamarindo Santa Cruz Costa Ricaproduced in both cuttings the least biomass 11 and 58 kgtree respectively
All the species in this trial coppiced well with Leucaenaleucocephalafrom Kibwezi Kenyagiving the largest quantity of coppice regrowth (24 kgtree) and Gliricidiasepium SantaCruz Costa Rica giving the least (09 kgtrce) It was generally evident that Leucaena
18
species had a higher biomass production potential and coppicing ability than Gliricidia species
Table 9 Experiment 8 (Catllandra Sesbania and Cassia s ) Total fresh blomass yield (kgtree) at first(7 months) and second (12 months) thinning
ScdOrigin First Thinning SecondthinniTreatment Species Provenance Biomass (kg) Biomass Ck
T1 Cattiandra calothyrsus
T2 Caltiandra catothyrsus
T3 Calliandra catothyrsus
T4 Sesbania sesban
T5 Sesbania sesban
T6 Sesbania sesban
T7 Sesbania grandifLora
T8 Cassia spectabitis
T9 Cassia siamea
TIO Cassia siamea
GuatemaLa
Kibuye Ruanda
Arboretum de Ruhande Ruanda
Kakamega Kenya
Mukururiati Kenya
Kiambu Kenya
Kitui Kenya
Bugarama Ruanda
Bugarama Rwanda
Kwate Kenya
MEAN
biomass production The third provenance (Kiambu Kenya) showed a relatively lesserperformance Yields from these Sesbania spp were 95 76 and 30 kgtree respectivelyIn all three cases the coppice regrowth was very low (lt05 kgtree) indicating the poorability to coppice of Sesbaniasesban when cut below 10 m after it has passed its juvenilenon-woody stage The biomass yield at the second cutting for the three Sesbania provenances was 197 158 and 44 kgtree respectively Sesbaniagrandifloradied in the course of the first year its biomass yield was very low and the wood did not seem to beattractive for any use The species is unsuitable for the Maseno area The threeCalliandra provenances were at first cutting less productive than the Sesbania spp andproduced 42 (Guatemala) 49 (Kibuye Rwanda) and 37 kgtree (Ruhande Rwanda)respectively However at the second thinning after one year Calliandracalothyrsus from Guatemala and Calliandracalothyrsus from Kibuye Rwanda produced good single treeyields of 156 and 158 kg respectively A slightly lower yield was achieved by Calliandra calothyrsus from Arboretum de Ruhande Rwanda 138 kgtree The initial productivityof the Cassiaspp after six months was modest Cassiaspectabilisyielded 26 kgtree andthe two Cassia siamea provenances yielded 20 (Bugarama Rwanda) and 19 kgtree(Kwale Kenya) However reasonable to good productivity was achieved after one yearwhen Cassiaspectabilisyielded 141 kgtree and Cassiasiamea from Bugarama Rwanda yielded 84 kgtree Cassia siamea from Kwale Kenya remained low in yield with 44 kgtree
19
During the first and second thinning operations two provenances from Kenya (Kakamega and Mukururiati)
Initial Regrowth Total
42 21 63 151
49 21 70 15
37 16 53 13
95 03 98 19
76 04 80 15
30 02 32 41
11 07 18 01
26 15 41 141
20 06 26 8t
19 05 24 41
41 10 51 11
of the three Sesbania sesbmi displayed exceptionally good
75
All Calliandracalothyrsusand Cassiaspectabilisprovenances have displayed a strong abilityto coppice SesbaniasesbanSesbaniagrandifloraand Cassiasiameaprovenances coppicedpoorly
Table 10 Experiment 9 (Mixed species screening trial) Total fresh biomass yield (kgtree) at first thinning after 9 months
- First ThinningTreatment Species Seed Origin Bicmass (kg)
Provenance Initial
TI Albizia lebbeck India 05
T2 Albizia fatcataria Malaysia 23
T3 Acacia auricuLiformis India 22
T4 Atnus acuminata Guatemala 20
Atnus acuminata Mexico 14
T6 Alnus nepatensis Nepal 06
T7 Erythrina caffra India Diseased
T8 Grevitiea robusta India 22
T9 Jacaranda mimosifotia India 42
T10 Sapium sebiferum India Not yet thinned
MEAN 19
Except Erythrina caffra and Sapium sebiferum which were either diseased or too small to justify any thinning at the time of management all other species and provenances in experiment 9 have only been thinned once and coppice regrowth has not yet been harvested Comparison of biomass yields between species and within species across provenances is possible although the biomass yield from first thinning was generally verylow clear yield differences were difficult to detect visually at this stage
Jacarandamimosifolia gave the highest biomass yields (42 kgtree) while Grevillearobusta Albiziafalcatariaand Acaciaauriculifonnis produced fairly good yields in the range of 20shy23 kgtree Alnuc nepalensis was lower in biomass production than the Alnus acuminata provenances The lowest biomass yield was produced by Albizia lebbeck (05 kgtree)
Some observations on coppice production based on all four general screening trials are that i) on average the abundance of leafy and woody coppice regrowth after first thinning was positively influenced by placing the initial cutting height higher than ground level ie at 05 m or even 075 m This could have important implications for the adoption of management regimes when the species are used for certain agroforestry technologies ie alley cropping or pollarding for fuelwood and stake production and ii) experience at Maseno has revealed that early thinning management may produce a limited amount of early biomass but the abundance of the subsequent coppice harvest is lower than when the first thinning operation is delayed until the tree has gained more height and girth and until it has develond a more abundant and leafy canopy
20
4 SOIL FERTILITY MAINTENANCE AND IMPROVEMENT TRIALS
41 Justification
Decline of soil fertility and increased soil erosion have been diagnosed as major problemsinthe food crop based landuse systems in the densely populated parts of Western Kenyaas well as other parts of the East and Central African Highlands Alley cropping atechnoogy whereby hedges of nitrogen fixing coppiceable trees are grown on contours andmanaged to produce green manure and mulch for the crops grown in the alleys is seen asan agroforestry technoiogy that could possibly contribute to solving some of these problems(Kang Wilson and Sipkens 1981 Minae and Akyeampong (ed) 1988) The principal variables that affect the biological productivity of hedgerows of woodyperennials in alley cropping systems are i) hedgerow species ii) within-row spacing ofhedge plants iii) number of individual hedge lines within a hedge iv) cutting height of thehedgerows and v) proximity of the first and subsequent lines of annual food crop(s) fromthe hedge These variables may also interact with the variables on the alley crop such asfood crop species genotype tillage regime fertilizer application and food crop populationdensity There is a need to define the interactions and possible contributions of eachvariable fo the productivity of the entire alley cropping system Considering that all thesevariables cannot be studied in one experiment three separate on-station experiments werestarted in Maseno to evaluate some of the components of alley cropping They comprisethe selection of suitable MPTS species for alley cropping the study of the relativecontribution of Leucaena leucocephala mulch and fertilizer to food crop yields in maizeand maize plus bean systems and the testing of various hedge designs and plantingarrangements in an alley cropping system with Leucaena diversifolia and maize
42 MPTS species screening trial for alley cropping
21 Objectives
- to select promising MPTS for alley cropping
- to quantify biomass production potentials of MPTS under alley cropping management
- to asses the effect of MPTS on companion crops
21
422 jpejimenaldesign and methodology
The experimental treatments are shown below
Treatment Species OriginProvenance
TI Leucaena leucocephala Hengchun ChinaT2 Leucaena leucocephala Melinda Belize T3 Calliandra calothyrsus Guatemala T4 Gliricidia sepium Guatemala T5 No hedgeT6 Sesbania sesban Kakamega KenyaT7 Cassia siamea Siaya KenyaT8 Erythrina caffra Siaya Kenya
The experiment was laid out in a randomised complete block design and each treatmentwas replicated four times Plots measured 56 x 50 m and in each plot (except control)two hedges were planted at 28 m apart The in-row spacing of trees was 025 m Maize was grown in each plot at a spacing of 07 x 03 m resulting in three rows of experimentalmaize in each plot between the two hedges and two border rows each of maize on theouter sides of the plot (47620 plantsha) Therefore the experimental plot consists of onehedge and three rows of maize The control plot consists of four rows of experimentalmaize and two rows of border maize on either side of the experimental plot Theexperimental plot size was 5 x 28 = 14 M2
All trees were established in April 1988 from seedlings except Erythrinacaffra for whichvegetative propagation by cuttings was used A starter dose of 25 g DAP fertilizer wasused per tree which is equivalent to 64 kgha of N and 164 kgha of P205 at the hedgepopulation of 14286 treesha
Hedges were cut back to 50 cm from ground level during the course of 1988 and early1989 depending on the initial growth performance Subsequent pruning took place at thestart of each season and during the cropping season depending on regrowth rates
The experiment has gone through 4 cropping seasons since April 1988 starting with beansat the time of tree hedge establishment (first rainy season 1988) followed by another cropof beans during the second rainy season of 1988 During 1989 beans and maize (hybrid512) were grown together (first season) followed by a locally developed maize composite(cv Hamisi Double Cobber) in the second season Beans in 1988 and 1989 (first season)were planted with 100 kgha of DAP Maize in the first season of 1989 was planted with130 kgha of DAP and top dressed with 142 kgha of CAN equivalent to 6060 kgha ofN and P205 Maize in the second season of 1989 (cv HDC) did not receive any fertilizer
22
423 Site description
The experiment is located on land which was planted in the early 1980s with widely spacedCupreusus lusitanica The sie had also a thick cover of couch grass (Digitariasacalarum)Soils vary considerably in texture from sandy loam to sandy clay on the surface to sandyclay loam to clay loam at 1 m below ground level The soils are inherently infertile andhighly deficient in phosphorus and nitrogen Organic matter content is also low Soildepth varies from about 120 cm to 150 cm However hydromorphic properties become apparent at depths of about 100 cm The pH (in water) is 51 and the slope is slightlyundulating The area is occasionally wet during the period of heavy rains and sheeterosion is observed especially when crops are young and therefore incapable of providingadequate ground cover Surrounding the experimental area is a bushy vegetation consistingof couch grass Psidium guajava Eucalyptus spp Cupressus lusitanica and isolated Acrocarpusfraxinifolius and Ficus spp
At the start of the experiment in April 1988 soil samples were taken and analyzed for the following chemical components
Average soil pH (in CaCI2 125 ratio)Organic Carbon ()
46 07
Total available Nitrogen (N) () Phosphorus (P) (Bray no2a) (ppm) Sodium (Na) (me100 g) Potassium (K) (me100 g)
011 (not yet available) 216 211
424 Results and dismion
4241 Trees
Survival
Erythrinacaffra cuttings established poorly with a survival percentage of 53 at the endof 1989 Mortality of Sesbania sesban gradually increased with continued pruning from13 in February 1989 to 88 by September 1989 and 100 by December 1989 Cassia siamea achieved 75 survival one month after establishment with some seedlings showingstunted growth Leucaena leucocephala Calliandra calothyrsus and Gliricidia sepiumestablished well Survival rates for all these species were nearly 100ltx
Pests and diseases
Sesbaniasesbanwas attacked by a beetle (Mesoplatys ochroptera)which was controlled by spraying with a pesticide Gliricidiasepium had a mild aphid attack
23
Initial height and root collar diameter increment
Table 11 gives initial height and root collar diameter increments at the time of initial cutshyback which ranges from five to ten months for various species The figures in Table 11clearly illustrate that the fastest growth was displayed by Sesbania sesban in five monthsand the lowest growth rates were recorded for Gfiricidiasepium in ten months
Table 11 Tree height and root collar diameter increment (cm) between time of planting(April 1988) and time of first cutback to hedge height as indicated (in months)
Treatment Species Growth Growth increment period Height Root collar
TI Leucaena leucocephala 8 266 23T2 Leucaena leucocephala 8 232 23T3 Calliandra calothyrsus 6 268 23T4 Gliricidia sepium 10 136 27T6 Sesbania sesban 5 343 34T7 Cassia siamea 10 235 31T8 Erythrina caffra 10 191 31
Biomass production
The tree biomass harvested from the hedges is summarised in Table 12 Two distinctperiods in the development of the hedges are recognized During the first period fromSeptember 1988 to February 1989 all tree species were cut back from their initial heightto the standard hedge height of 05 m Sesbaniasesban received its first cutting after fiveand a half months some other slower growing species were first cut after ten and a halfmonths All the biomass produced by each species between September 1988 and February1989 is regarded as initial yield associated with trimming the hedges to experimental sizeBecause of the different initial cutting dates and the different tree products obtained at theuniform cutting in February 1989 the biomass yields up to February 1989 have not beenanalyzed statistically However there are clear differences in initial leaf yield betweenspecies Sesbania sesban gave an initial leaf yield of 203 tha Calliandracalothyrsusyielded 173 tha the two Leucaena leucocephalaprovenances yielded 114 tha (China)and 109 tha (Belize) respectively Lower initial leaf yields were achieved by CassiasiameaErythrinacaffra and Gliricidiasepium 83 tha 75 tha and 42 tha respectively
Starting with the yield of April 1989 the leafy biomass production is fully comparablebetween species because all hedges were cut back to the same cutting eight in February1989 Leafy biomass productivity between species was compared for the April JuneSeptember and December 1989 harvest Significant differences in leaf yield were foundin all four cuttings In April 1989 significant differences were detected (p lt005) In all
24
subsequent cuttings the differences were highly significant at p lt 0001 Between April andDecember 1989 the best performing species was Calliandra calothyrs with 367 tha The two Leucaena leucocephala provenances were practically equal in yield with 243 thaGlircidiasepium andErythrinacaffra yielded 183 tha and 171 tha respectively Lower leaf yields were achieved by Sesbaniasesban and Cassiasiameawith 108 tha and 89 tha respectively
Woody biomass harvested from different species between September 1988 and February1989 during initial cutback varied considerably Sesbaniasesban gave 126 tha of woodand 182 tha of twigs Calliandracalothyrsusgave 91 tha of wood and 13 Lha of twigsThe two Leucaena leucocephalaprovenances gave 45 tha (China) and 38 tha (Belize)of wood and 38 tha (China) and 31 tha (Belize) of twig respectively Gliricidiasepiumand Cassiasiamea did not yield any wood at first cutback but they yielded 4 tha and 86tha of twigs respectively Erythrinacaffra yielded 91 tha of twigs and 44 tha of wood
The actual precipitation received at this site was 2396 mm from April 1988-March 1989 and 1455 mm from April-December 1989
Table 12 Fresh leafy biomass yield Ctha) during the initial formation stage of the hedgerows (September 1988 -February 1989) and during productivity at the standard height of 05 m (April - December 1989)
Treat- SpeciesProvenance utoI ment JTotal Total1 2 4 6 8j 5 7 Yield Yield
D A T E S Sept 88 April 89 - to toSept 88 Oct 80 Dec88 Feb89 Apr89 Jun89 Sept89 Dec89 Feb 89 Dec 89
TI Leucaena leucocephala(China) 84 30 63 55 45 79 114 242
T2 Leucaena leucocephala(Belize) - 74 35 57 54 47 86 109 244
T3 Cattiandra calothyrsus(Guatemala) 84 - 89 50 88 95 134 173 367
T4 Gtiricidia sepium(Guatemala) 42 54 50 18 61 42 183
T6 Sesbania sesban (Kakamega) 128 75 55 53 dead dead 203 108
T7 Cassia siamea (Siaya) - 83 42 15 15 17 83 89
T8 Erythrina caffra (Siaya) 75 63 29 56 23 74 171
MEAN 79 61 55 49 46 67 114 201
SED 119 054 054 032 057
CV 275 139 155 99 121
25
4242 Crops
Crop 3deids
Beans planted duing the first and second seasons of 1988 failed due to heavy rains Theresults are therefore not included in this report The hybrid maize planted together withbeans in the Orst season of 1989 performed well while the intercropped beans failed Thecomposite maize crop in the second rainy season of 1989 gave similar yields as the firstharvest in 1989 However it should be noted that the second crop of 1989 did not receive any external inputs in the form of fertilizer The maize yields for two seasons are shown in Table 13
Table 13 Dry maize grain yield (tha) for the first (long rainy) and second (short rainy) season of 1989
Treatment Species First season Second season of 1989 of 1989
T1 Leucaena leucocepha 407 435T2 Leucaena leucocephala 318 362T3 Calliandra calothyrsus 256 380T4 Gliricidia sepium 346 349T5 No hedge 253 305T6 Sesbania sesban 468 429 T7 Cassia siamea 484 336T8 Erythrina caffra 429 421
Mean 370 377SED 094 051CV 245 193
During the first (long rainy) season of 1989 no significant differences (p lt005) werefound in maize yield between alley cropping treatments except Calliandracalothyrsuswhich gave a low yield which was comparable to the control The yield of the controlplot with pure maize gave the lowest yield of 253 tha which was significantly lower thanmost alley cropping treatments The highest yields were achieved in the alley croppingplots with Cassiasiamea and Sesbania sesban
The local unfertilized maize composite planted in the second (short rainy) season of 1989was harvested in January 1990 and the yields in some alley cropping plots were againsignificantly higher than in the control plot (p lt 005) The control plot gave 305 tha andthe best yield (435 tha) was achieved in the Leucaena leucocephala (China) alleycropping plot closely followed by the Sesbania sesban plot with 429 tha
26
The preliminary conclusion is that during these first two cropping seasons a clear positivecorrelation between the amount of leafy tree biomass applied to the food crop plot andmaize crop yield was not observed However alley cropping treatments consistentlyperformed better than the control maize only treatment
43 The effect of Leucaena leucocephalamulch and DAPCAN fertilizer applications on
the productivity of maize and maizebean systems
431 Objectives
- to study the effect of Leucaena mulch on the yield of maize and maize + beans systems
- to study the effect of different levels of fertilizers alone and in combination withmulch on the yield of maize and maize + beans systems
432 Experimentaldesign andmethodology
The study evaluated four different cropping systems and three different levels of fertilizerin a split-plot design and was replicated four times The main plot and sub-plot treatments are as follows
Main plot Sub-plot
(Cropping Systems) (Fertilizer Levels)
S1 - Pure maize Fo - No fertilizer S2 -Maize + beans F1 - 30 kg N + 30 kg P20haS3 - Maize + Leucaena F2 - 60 kg N + 60 kg P20 5haS4 - Maize + beans + Leucaena
Each main plot measures 15 by 75 m and was made up of three subplots of 50 by 75 mIn plots with the Leucaena two parallel hedges of trees were planted 375 m apart within-row plant spacing of 025 m Tree density in Leucaena plots was therefore 10667treesha All sub-plots were separated by small earth bunds in order to minimise thesurface flow of fertilizer and Leucaena mulch from one plot to the next
Before the experiment was established in April 1988 the area was mainly covered by couch grass (Digitariasacalarum)mixed with pasture grasses The site was ploughed twice usinga disc plough and thereafter harrowed twice Subsequently couch grass was removedmanually and Leucaena leucocephala hedgerows planted in April 1988 The trees wereestablished with 1 tablespoon of di-ammoniumphosphate equivalent to 45 g N and 115 g P2 0 per tree This is equivalent to 267 kgha of DAP
27
The Leucaena trees were first cut back to the standard hedge height of 05 m in February 1989 when most of the trees had attained a height between 2 and 25 m and a root collar diameter between 25 cm and 30 cm Although the height criterium was not fully met by all trees in March 1989 they were all cut back at that point in order to be able to incorporate tree leaves before the start of the long rainy season of 1989 Subsequently hedges have been pruned every 2 to 4 months Hedge biomass harvested during the first cutting of each season was incorporated in the soil during subsequent cuttings it has been mulched on the plot between the lines of maize and beans
The alley between hedges was planted with 4 rows of maize and half alleys on either side of the plot with two rows of maize In plots without Leucaena hedges 10 rows of maize were planted at 075 m between rows and 025 m in the row giving a plant population of 53000 plantsha In alley cropping plots the maize plant population is 42400 plantsha Bean plant population is the same in Leucaena plots and pure maizebean plots Beans are spaced at 075 by 020 m (66666 plantsha)
A cover crop of beans was planted in April 1988 but it failed due to heavy rains During the short rainy season of 1988 beans were again planted as cover crop with a uniform DAP dose of 100 kgha Commencing with the long rainy season of 1989 the 12 experimentar treatments comprising four different cropping systems times three fertilizer levels were implemented Maize Hybrid 512 and beans Roscoco GLP-2 have been used in this experiment in both growing season in 1989
In March 1989 the first experimental crop of maize and beans was sown At maize planting fertilizer was applied as per treatments DAP at planting time and CAN top dressed when plants had reached knee height where used as sources of N and 1P205 All P205 was applied at planting time via DAP 39 of N was applied at planting time via DAP and 61 was applied at top dressing via CAN Beans were planted with DAP at the rate of 100 kgha Maize stalk borer the most common maize pest was controlled by application of Fenitrothion 3 dust into the plant funnel (whorl) at the rate of 11 kgha per application
During the establishment phase of the trial (April 1988 - February 1989) the measurement of standard tree growth parameters such as height and root collar diameter increment were carried out From the time of first cutting the leafy biomass production of the Leucaena hedges was monitored per cutting season and year Starting with the long rainy season of 1989 data were gathered on a seasonal basis about maize and bean yields in the alley cropping and control plots
433 Site description
The site was used as pasture before the experiment was established Couch grass (Digitaria sacalarum) is the predominant weed species at the site The soil (loam to clay loam) is classified as lixisols (tropical luvisols) From the soil surface towards the deeper soil layers the colour changes gradually from dull reddish brown towards more orangeyellow reddish brown The profile is uniform with no abrupt changes in texture Tile slope of tile experimental site is less than 2 in north to south direction At the onset of the
28
experiment the soil was strongly acidic with an estimated pH in water of 51 The soil depth exceeded 120 cm At the start of the experiment in April 1988 soil samples were taken and analyzed for the following chemical components
Average soil pH (in CaCI2 125 ratio) 46 Organic Carbon () 161 Total available Nitrogen () 013 Phosphorus (P) (Bray no2a) (ppm) (not yet available) Sodium (Na) (me100 g) 052 Potassium (K) (me100 g) 112
434 Resulis and discussion
4341 Trees
Survival
The Leucaena provenance from the Hengchun Tropical Botanical Gardens in China (PRC) has proven to be well adapted to the Maseno climate There has been hardly anymortality due to establishment failure during the initial stage of the experiment
Pest and diseases
The trees were first cut down for hedge formation on 9-3-1989 105 months after their establishment During the first two months of hedge establishment there were isolated attacks of white ants especially of trees witha root collar diameters of less than 5 cmwhich caused death Beating up was done in all such cases and chemical control was taken up to avoid further damage The compound used was Aldrex (48) at the rate of 1100 ml100 Iof water Due to the fast growth of the trees during 1988 combined with several heavy hailstone storms there were signs of bark cracking which caused concern by late 1988 because the trees became brittle and side branches could be broken off easilyHowever at the time of harvesting the problem was no longer serious and most bark cracking had appeared on side branches above the hedge cutting height of 05 m Two years after establishment of the experiment the Leucaena hedges are healthy disease and pest free and steadily producing abundant amounts of leafy biomass suitable for mulching
Height and root collar diameter increment
Height growth increment of Leucaena was measured on a monthly basis from two months after planting up to the time of first cutting The mean monthly height increment between April 1988 and February 1989 was 20 cm However height growth was not linear duringthe first 105 months of growth (see Figure 1) At establishment the trees had an averageheight of 21 cm Between April and July 1988 the trees established their roots and grew on averagc 15 cmmonth Increased height increment of more than 32 cmmonth was achieved )etween July and December 1988 Thereafter height growth slowed down
29
considerably and had virtually come to a standstill by February 1989 This significantreduction in height increment coincided with the onset of flowering and the production of seed between December 1988 and February 1989 By late 1988 the trees had switchedfrom vegetative towards reproductive growth This change in growth strategy coincided with the onset of the dry season between December 1988 and February 1989 Figure 1 also shows the root collar development between April 1988 and February 1989 The growth curve indicates that the root collar diameter developed at a fairly constant rate of approximately 05 cm per month throughout the growing period except for the first month after planting when the trees were establishing themselves more slowly
Figure 1 Height and root collar diameter growth of Leucaena leucocephala (HengchunChina) planted in hedgerows between planting time (April 1988) and time of first harvest (February 1989)
lleight (m) Root collar (cm)25 4
2
3
15
05
0 I I 0 0 50 100 150 200 250 300
Days after planting
- Height - Root collar diameter
jLiomass yield
When the hedges were first cut in March 1989 to a uniform height of 05 m the biomass was harvested by product type comprising leaves twigs pods and stem wood At harvest time most trees had developed into healthy multi-stemmed shrubs with an abundance of leaves and seed pods The harvested fresh biomass yield amounted to 811 tha of stem wood and twigs 712 tha of leaves and 587 tha of seed pods Therefore only 34 of the total fresh biomass harvested during this first cutting was incorporated in the plots as leafy biomass In Table 14 the amount of fresh leafy biomass harvested at each cutting
30
is summarized as well as the total biomass production between April 1988 and December 1989
Table 14 Average fresh Leucaena yield (tha) from alley cropping plots planted in April1988 and regularly harvested between March and December 1989
DATE 7389 13689 29989 301189 TOTAL 1989
Leaves 712 489531 389 2121
Stem wood 811 - - - 811
Podsseeds 587 - - 587-
TOTAL 2110 531 489 389 3519
4342 Crops
Crop yields
The bean crop of the first rains of 1988 was planted too late in the season and coincided with an exceptionally wet year (1988) No meaningful yield data were collected The second bean crop was successful and a comparison was made between bean yields in alleycropping plots and control plots Dry bean grain yields were significantly lower in alleycropping plots than in control plot and measured 987 kgha and 1307 kgha respectively(p lt0001) The most plausible reason for the reduced bean yield in alley cropping plots was that the beans were growing under an increasingly heavy cover of shade created byLeucaena before it was cut back to hedge height No significant differences were found for bean yield within control plots and within alley cropping plots when their yields were compared within comparable cropping systems
In 1989 two cropping seasons with maize and beans were realised and the first results were obtained about the performance of the four different cropping systems while they were subjected to different levels of fertilizer and leucaena leaf mulch
31
Table 15 Maize yields (tha) grown in an annual system and in alley cropping with
Leucaena at three fertility levels first rains (March-July) of 1989
FERTILITY LEVELS (NP 205 kgha)
CROPPING SYSTEM 0-0 30-30 60-60 MEAN
ANNUAL SYSTEMS
Sole maize 718 865 867 817
Maizebean intercrop 851 905 906 888
ALLEY CROPPING
Sole maize 67 828 799 766
Maizebean intercrop 823 839 856 839
MEAN 766 859 858
SED 024(a) CV 83
SED 0189(b) CV 46
a = SED for comparing maize yield across fertility treatments within the same cropping system
b = SED for comparing maize yield across cropping systems within the same fertility treatments
The following observations are made on the first season results Maize yields were extremely high and ranged from 67 - 91 tha These levels are explained by the fact that the experiment was laid out on fertile pasture land Secondly two cover crops of beans were sown in the preceding seasons of 1988 with 100 kgha of DAP Thirdly appreciable amounts of nitrogen-rich green manure was incorporated in the alley cropping plots shortly before the first maize crop was sown (712 tha fresh leaves equal to 178 tha dry matter equal to approximately 60 kgha of nitrogen) Finally the bean intercrop ia the long rainy season of 1989 received 100 kgha of DAP separate from the fertilizer gift to maize as pretreatment It should be noted that the additional fertilization of beans (100 kgha of DAP) in the maize + bean and maize + bean + Leucaena treatments largely explains the
32
higher absolute yields obtained in these treatments when they are compared with nonshybean treatments
Probably because of this rather high initial fertility status of the soil the alley cropping system did not show any impact during the first experimental season In fact on the whole lower yields were obtained in the alley cropping system as compared to the annual systemsTh latter is probably due to the fact that the plant population in the alley ciopping plots was lower than in the annual plots Also response to fertilizer was limited particularly at the 60 kg level This could in part be attributed to the high fertility status of the soil but also to inappropriate fertilizer application at the 60 kg level
Table 16 Bean yields (tha) intercropped with maize in an annual system and in alleycropping at three fertility levels first rains (March-July) of 1989
FERTILITY LEVELS (NP 205 kgha)
CROPPING SYSTEM 0-0 30-30 60-60 MEAN
ANNUAL SYSTEMS 021 021 023 022
ALLEY CROPPING 010 019 021 017
MEANS 016 020 022
SED 0014 (between cropping systems) SED 0024 (between fertilizer levels) SED 0031 (cropping system x fertilizer level) except when
comparing mean(s) with the same level of Leuceana
SED 0034 CV (treatment level) 251
33
The following conclusions are drawn based on the bean yield data from the first (longrainy season) harvest of 1989 (Table 16) The difference in mean bean yield between cropping systems (main plots) with and without Leucaena hedges is significant (p lt005)Mean yield in the maize bean intercrop is 220 kgha and in the Leucaena alley cropping system it is 170 kgha However when mean bean yields are compared between treatments with varying fertilizer levels (sub-plots) then differences in yield were (just) not significant (p = 0053) The mean bean yield of no-fertilizer 3030 and 6060 plots was 156 202 and 222 kgha respectively Finally the bean yields at cropping system x fertilizer level were not found to be significantly different and averaged 194 kgha Although the bean yield from plots with maize and beans and plots with maize beans and Leucaena were rather poor (102 to 233 kgha) they should not be discarded since they represent a nutritional bonus to the farmer who practices intercropping with beans and the beans are established and maintained at very little extra cash cost and labour input
Table 17 Maize yields (tha) grown in an annual system and in alley cropping with Leucaena at three fertility levels second rains (September - November) of 1989
FERTILITY LEVELS (NP 205 kgha)
CROPPING SYSTEM 0-0 30-30 60-60 MEAN
ANNUAL SYSTEMS
Sole maize 207 213 214 211 Maizebean intercrop 234 203 214 217
ALLEY CROPPING
Sole maize 304 343 328 325 Maizebean intercrop 304 363 280 316
MEAN 262 281 259
SED 0172(a)CV 183
SED 0252(b) CV 188
a = SED for comparing maize yield across fertility treatments within the same cropping system
b = SED for comparing maize yield across cropping systems within the same fertility treatments
34
The following conclusions are based on the maize yield data from the second (short rainyseason) harvest of 1989 (Table 17) While comparing cropping (main plot) systems it isobserved that i) mean maize yields in alley cropping treatments are significantly higher(p lt001) than in annual system treatments ii) maize yields in bean treatments aresignificantly higher or lower than in plots without beans
not While comparing maize yields
at fertilizer (sub-plot) treatment level it is observed that i) maize yields in plots withmedium levels of fertilizer are in three out of four cases higher than in plots without fertilizer However the difference in yield is not significant at p = 005 ii) additionalfertilization from the medium level (30-30) to the higher level of fertilizer (60-60) does notgive any extra maize yield In fact in some cases maize yield is slightly lower at highfertilizer rates The overall conclusion about maize yields during the second rainy season of 1989 is that i) maize yields in absolute terms were lower than in the first rainy seasonof 1989 ii) maize yields were significantly higher in alley cropping plots than in annual crop plots These promising yield increases in alley cropping plots were achieved with only80 of the maize plant population found in the annual (intercrop) plots During thesecond (siort rainy) season of 1989 the benefits of the alley cropping plots may havebegun to show However the apparent lack of positive response of maize yield to the fertilizer treatments is unexplained
Table 18 Bean yields (kgha) intercropped with maize in an annual system and in alleycropping at three fertility levels second rains (September - November) of 1989
FERTILITY LEVELS (NP05 kgha)
CROPPING SYSTEM 0-0 30-30 60-60 MEAN
ANNUAL SYSTEMS 420 433480 444
ALLEY CROPPING 213 287 307 269
MEAN 317 384 370
SED 255 (between cropping systems)SED 370 (between fertilizer levels)SED 497 (cropping system x fertilizer) except when
comparing mean(s) with the same level of Leucaena)
SED 523 CV (treatment level) 207
35
The following conclusions are drawn based on the bean yield data from the second (short)rainy season of 1989 (Table 18) The difference in mean bean yield between croppingsystems (main plots) with and without Leucaena hedges is highly significant (p lt001)Mean 6ld in the maize bean intercrop is 444 kgha and in the Leucaena alley croppingsystem it is 269 kgha Mean bean yields between treatments with varying fertilizer levels(sub-plots) were not significant The mean bean yield of no-fertilizer 3030 and 6060plots was 317 384 and 370 kgha respectively The bean yields at cropping system xfertilizer level were not found to be significantly different and averaged 357 kgha which was already a significant yield improvement compared to the average yield of the first rainy season of 1989 (194kgha)
44 The effect of varying the density of Leucaenadiversifolia in hedgerows and proximity
of the food crop to the hedge on hedge biomass productivity and maize yield
441 Objectives
- to study the effect of varying the within-row and between-row spacing and thenumber of tree rows in a hedge on the production of tree biomass and the yield of the associated food crop
- to study the effect of varying the distance of the first crop row from the hedge on tree biomass production and the yield of the associated crop
442 Experimentaldesign and methodology
The study evaluated eight different hedge designs for Leucaena diversifolia (OriginArboretum de Ruhande Butare Rwanda) combined with two distances at which the first row of maize was planted from the hedges This results in 16 different treatments as listed below
Hedge plant density within- and between-rows (D)
D1 - single row hedge plants at 25 cm D2 - single row hedge plants at 50 cm D3 - two rows hedge at 25 cm and plants within-row at 50 cm D4 - two rows hedge at 50 cm and plants within-row at 25 cmD5 - two rows hedge at 50 cm and plants within-row at 50 cmD6 - three rows hedge at 25 cm and plants within-row at 50 cm D7 - three rows hedge at 50 cm and plants within-row at 25 cm D8 - three rows hedge at 50 cm and plants within-row at 50 cm
Distance between the hedge and the first crop row (S) Si - 75 cm
S2 - 375 cm
36
The study was laid out in a randomized complete block with 3 replications on a practicallylevel piece of land at the Veterinary Farm in Maseno Each plot consisted of the hedge according to the treatment and four rows of maize on either side so the net experimentalsize varied from treatment to treatment However the maize cropping area is the same for each treatment (30 m2 ) Therefore the smallest plots consist of a single hedge (withvarying in-row spacing of individual trees) combined with the first maize row planted at 375 cm away from the hedge resulting in a net plot size of 50 m x 60 m (DIS2 and D2S2) The largest plots consist of a triple row of three hedges spaced at 05 m and the first crop row planted at 075 m away from the two peripheral hedges (50 m x 775 m)(D7S1 and D8S1) There are other 12 treatment combinations resulting in intermediate net plot sizes Each of the 16 treatment combinations is indicated above
Leucaena diversifolia was planted in October 1988 and each seedling was given one tablespoon of di-ammoniumphosphate (DAP) at planting equivalent to 45 g of N and 15 g of P205 per plant Due to the different hedge designs and tree and crop planting densities it is not possible to express the fertilizer application in terms of one standard figure in tha but all trees received the same starter dose of DAP The hedges were left to grow freely without competition from food crops in 1988 But beginning with the first (long) rainy season of 1989 maize (hybrid 512) was planted at the recommended spacing of 03 m in the row and 075 m between-rows (44444 plantsha) This first experimental maize crop received 130 kgha of DAP (60 kgha P205 and 23 kgha N) and was later top dressed with 142 kgha of CAN (37 kgha of N) Therefore the total amount of fertilizer given to maize was equivalent to 6060 kgha of N and P205 In the short rains of 1989 maize was again planted (locally selected cv Hamisi Double Cobber) but it was not fertilized
Hedges were cut to a standard height of 05 m in March 1989 five months after they were planted Subsequent cuttings were carried out at 2 to 3 months interval and synchronized with the needs of the food crop component to reduce competition for light and moisture at the critical growth periods At each cutting the entire 5 m hedgerows were harvested During the first harvest the cut material was separated into leaves and stem wood All material was then weighed and the leafy biomass incorporated in the plots In subsequent harvests the cut material which consisted primarily of leaves on young coppice shoots was weighed as one product It was placed between the four rows of experimental maize on either side of the hedge
443 Site description
This experiment is situated directly south and east of experiment 3 within the same enclosure that was previously used as pasture for several years The site characteristics for both experiments are similar Although no soil samples were taken at the start of experiment 5 in October 1988 it is reasonable to assume that the same soil conditions prevail in general in both experiments The initial chemical soil analytical data from experiment 3 may therefore serve as a reference for experiment 5 when it was started in October 1988
37
444 Resuas and discussion
4441 Trees
Survival pests and diseases
The Leucaenadiversifoliagrew well in this climate establishment was near 100 and there were no noticeable problems of stand mortality or pests and diseases during the first one and a half years after planting
Initial height and root collar diameter increment
At harvest in February 1989 the trees measured on average 17 m and the root collar diameter was 21 cm This provenance of Leucaena diversifolia grew on average 32 cmmonth despite the fact that it was planted late in the second (short) rainy season of1988 It is important to note that the trees received more than 1000 mm of rainfall between planting and harvest compared to 937 mm which fell during the first (usuallycalled long) rainy season of 1988 (April to August) The trees were already harvested 45 months after planting because it was felt necessary to start the experiment with hedges and food crops during the first rains of 1989 This very early harvest apparently did not influence the subsequent hedge productivity negatively although the average root collar diameter of the hedges was initially smaller (see data experiments 1 amp 3) than in other alley cropping exptriments in Maseno
Biomass productivity
In Table 19 the cumulative fresh leafy biomass yield per meter of hedge is given for different treatments It is observed that the marginal biomass increase diminished withincrease in population andor rows within the hedge pointing towards increasing withinand between hedgerow competition when the hedge design becomes more complicated
The results of biomass productivity data from 1989 permit to make interesting comparisonsbetween the various hedge designs The different hedge designs can be grouped into densely populated (D1 D4 D7) versus sparsely planted (D2 D3 D5 D6 D8) hedgerows
For hedges with wide spacing a further comparison can be made between hedges with closely spaced hedge lines (D3 D6) against those with widely planted hedge lines (D5D8) (D2 does not fit in this latter comparison because it consists of only one hedge line)
Based on the individual hedge biomass yields from five cuttings in 1989 significantdifferences in biomass productivity were found between treatments at each cutting (P lt001)
Analyzing the total hedge biomass yield or 1989 (last column) the following is observed For hedges with an in-row plant spacing of 025 m and hedge lines 05 m apart (D1 D4D7) adding another hedge line (two line hedge vs single line hedge) led to a yield
38
increase of 54 (D4S1) to 65 (D4S2) Adding another line of hedgu_ (three line hedg( vs two line hedge) gave an additional yield increase of 23 (D7S1) and 30 (D7S2) Th(overall yield increase from D1 to D7 was 90 in treatments where the first maize waplanted at 07 m from the hedge (Si) and 114 in treatments where the first maize wa planted at 0375 m from the hedge It should be realized that these three line hedg(treatments (D7) have three times the number of plants of D1 treatments but yield increast was only of the order of 100
Table 19 Biomass yield of Leucaenadiversifolia in eight different hedge designs associatec with food crops planted close to the hedge (first line at 375 cm) and away frorr the hedge (first line at 75 cm)
Fresh Biomass Yield (kgm hedge)Hedge Date Total Design Feb89 Apr89 Jun89 Oct89 Dec89 1989
DIS1 142 036 261 179 129 747 D1S2 138 036 201 156 100 631 D2S1 117 040 182 129 101 569D2S2 113 040 177 125 089 544 D3S1 142 036 260 167 145 750 D3S2 182 036 212 148 118 696 D4S1 272 058 339 274 208 1151 D4S2 258 058 289 241 192 1038 D5S1 182 036 319 228 101 866 D5S2 188 036 274 219 163 880 D6S1 196 059 319 323 169 982 D6S2 196 059 317 209 159 940 D7S1 235 053 529 368 233 1418 D7S2 265 453053 339 239 1349 D8S1 226 059 421 268 201 1175 D8S2 254 059 409 297 188 1207
MEAN 194 047 310 224 158 934 SED 024 005 030039 018 CV() 151 118 154 163 133
For hedges with an in-row spacing of 05 m and hedge lines spaces i 025 m apart (D2D3 D6) adding one extra hedge line increases productivity with 32 (D3S1) and 28(D3S2) respectively Adding another line to D3 treatments gives an additional yield of 31 (D6S1) and 35 (D6S2) respectively The productivity increased by 73 from D2 to D6 This is achieved by a three times the plant population of D2 The conclusion earlier drawn regarding diminishing marginal biomass returns on adding hedge lines in comparable designs is again valid
39
Another comparison can be made between D2 D5 and D8 whereby one and two hedgelines are added respectively but with 05 m between the hedge lines Except for different in-row spacings this comparison is similar to the comparisons made for DI D4 and D7 treatments The increase in biomass when one line is added is 52 (D5S1) and 62 (D5S2) respectively Adding a third line to the hedge gives 36 (D8S1) and 37 (D8S2) extra yield compared to the D6 treatments The average total yield increase from D2 toD8 is 107 (D8SI) and 122 (D8S2) respectively The conclusion that within similar hedge designs a 100 yield increase can be achieved by establishing three times the number of plants is again confirmed
It is also worth comparing D5 with D3 and D6 with D8 in order to estimate the competition effects and resultant yield losses when hedges are placed close together at 025 m between row spacing rather than further apart at 05 m Comparing D3 with D5 it is found that placing the hedges closer together (D3S1 and D3S2) leads to a 15 loss in biomass yield A similar comparison for the triple hedges gave 16 (D6S1) and 22 (D6S2) yield losses compared to double hedges of equal design (D8)
In Table 20 the cumulative biomass yield for different hedge designs are compared with the basic hedge design of a single line with individual plants spaced at 05 m (D2S2) Itis observed that a maximum yield increase of 161 (or 26 x the basic yield) was achieved in a design which had six times the number of plants of the basic hedge design
It is further noted that the cumulative (1989) biomass productivity of hedges with the first maize row planted close to the hedge was on average 5 lower than the productivity of the hedges where the first row of maize was planted at 075 m The difference in biomass productivity ranged from -155 in D1S2 compared to D1S1 to +27 in D8S2 versus D8S1
40
Table 20 Cumulative biomass yield (Feb-Dec 1989) for different hedge designs of Leucaena diversifolia hedges in an alley cropping experiment (kgm)
Hedge P1m Fresh Yield Incr Yield Land allocation Type Yield over D2S2 Ranking in each treatmej
(highlow) Crop Hedge
D2S1 2 569 + 5 15 89 11 D2S2 2 544 --- 16 100 0 D1S1 4 747 + 37 12 89 11 D1S2 4 631 + 16 14 100 0 D3S1 4 750 + 38 11 86 14 D3S2 4 696 + 28 13 96 4 D5S1 4 866 + 59 10 83 17 D5S2 4 880 + 62 9 92 8 D6S1 5 982 + 81 7 83 17 D6S2 5 940 + 73 8 92 8 D8S1 5 1175 +116 4 77 23 D8S2 5 1207 +122 3 86 14 D4S1 8 1151 +112 5 83 17 D4S2 8 1038 + 91 6 92 8 D7S1 12 1418 +161 1 77 23 D7S2 12 1349 + 148 2 86 bull 14
Although the conclusions presented are preliminary because they are only based on 1989 data the indications about proper hedge design from this experiment are rather clear and can be summarized as follows
- Doubling the in-row plant population does not lead to proportional increases in biomass production For example in Dl-designs the increase in productivity compared to D2-designs is only 20
- Adding one or two additional hedge lines to an existing design leads in most designs to significant biomass yield increase(s) However the relationship is not linear due to increased between-row competition in the multi-line hedges
- From data obtained on food crop yields it is evident that the land loss resulting from establishing more complicated and wider hedge designs are so far not compensated for by proportional food crop yield increases associated with the higher amounts of Leucaena mulch applied in these plots
41
4442 Crops
Crop yields
The maize yield data for the first (long) rainy season of 1989 were gathered in such a waythat a comparison could be made between the mean grain yield of the first pair of rows on either side of the hedge against the mean grain yield of the three subsequent maize row pairs lying further away from the hedge In Table 21 the average dry grain yield (kgplot)and maize yields converted to tha taking into account the differences in plot sizes between treatments are summarized The yields obtained during the first rainy season of 1989 (1000 mm) were high and ranged from 568 - 790 tha These generally high yieldsin the first experimental cropping season are explained by three factors Approximatelysix months before cropping started the experimental site was ploughed out of relativelyfertile pasture land Secondly the maize crop was fertilized uniformly with 6060 kghaof N and P0 5 Thirdly appreciable amounts of Nitrogen-rich green manure from the hedges were applied to the plots shortly before the food crop was sown (Avg 284 thafresh leafy mulch equal to 071 tha dry matter equal to 25 kgha N) In none of the 16 treatments could a significant difference be detected between maize grain yield between the first line next to the hedge and the average of the three subsequent lines on both sides of the hedge
When differences in maize grain yield are expressed on a tha basis they take into account the differences in land occupied by the hedge The land loss ranges from 0 - 23 It is observed that hedge designs (DIS2 and D2S2) that did not take up any of the landnormally used by the crop yielded more maize than treatments where the hedge took up a substantial portion of the land (D7S1 and D8S1) The relationship between land lossdue to hedge type and maize yield loss was found to be as follows A land loss of 4 gave a yield loss of 24 Subsequent land loss yield loss ratios were 8 - 27 11 shy130 14 - 163 17 - 92 and 23 - 200
Therefore the higher amounts of mulch applied from multiple line andor high densityhedges did not have any significant positive effect on grain yield so far In fact the reverse happened grain yield was almost uniform throughout the experiment leading to decreased yields on tha basis in treatments with wide hedges
The results obtained during the second (short) rainy season of 1989 indicate the substantial decline in maize yield in the experiment as a whole when a local maize cultivar (HDC) was used without addition of any artificial fertilizers combined with a lower level of rainfall (Sept-Dec 1989 685 mm) Maize yield dropped to the level of 25 to 36 thaThe differences in yield between individual lines of maize planted closer or further awayfrom the tree hedges were not significant To appreciate the data presented it is important to note that the quality of the food crop was generally poor and it is reasonable to assume that treatment differences were masked to a large extend by external factorssuch as the maize seed source lack of any external inputs (fertilizer) and a lower amount of rainfall than usual
42
-- --
Table 21 Maize grain yield (13 mc) first (long) and second (short) rainy season of1989 associated with sixteen different hedge designs of Leucaena diversifolia
First rains 1989 Second rains 1989
Hedge P1m Land allocation Mean grain yield Typ e ratio ---------------------------------------------------------------
Crop Hedge (kgline) (tha) (kgline) (tha)
D1S1 4 89 11 257 609 118 281 D1S2 4 100 0 278 741 136 363 D2S1 2 89 11 293 695 130 308D2S2 2 100 bull 0 286 763 127 338 D3S1 4 86 14 276 631 131 300D3S2 4 96 4 288 737 137 350 D4S1 8 83 17 332 733 147 324 D4S2 8 92 8 296 729 126 311 D5S1 4 83 17 286 631 127 280 D5S2 4 92 8 275 677 136 335 D6S1 5 83 17 307 678 138 305 D6S2 5 92 8 321 790 127 314 D7S1 12 77 23 309 638 123 255 D7S2 12 86 14 251 574 128 293 D8S1 5 77 23 275 568 128 264 D8S2 5 86 14 300 686 156 357
MEAN 289 680 132 311 SED 035 -- 019 --CV (maize rows) 110 201
43
5 FODDER PRODUCTION TRIALS
51 Justification
The natural fodder supply in many highland landuse systems is usually inadequate in quantity and quality particularly during the dry seasons Farmers interested in improvingtheir fodder supply have addressed the problem by planting grasses such as Pennisetun purpureunt (Napier grass) either as a fodder bank or on terrace bunds Although this has improved the fodder situation protein shortages in livestock diets are still experiencedsince most grasses drop in nutritional value during the dry season The introduction of a woody perennial to provide supplementary protein rich fodder is therefore beingexamined Two experiments have been established to address these fodder production and quality related problems In the first experiment the reative productivity of different treegrass combinations planted on contour bunds is studied In the second experimentthe productivity of Leucaena hedges when managed at different cutting heights for fodder production in an alley cropping system is studied In both experiments the effect of the tree andor grass component on the productivity of the companion food crops is also monitored
52 Combination of grasses and tree hedges on field bunds for fodder production
521 Objectives
- to determine the fodder yields of Pennisetumpurpureum Leucaena leucocephalaSesbania sesban and Calliandra calothyrsus planted on terrace bunds in pure arrangements and in tree-grass mixtures
- to determine the effect of the different treatment combinations on the performance of the companion food crops
522 Experimental design and methodology
The following treatments were included in the experiment
TREATMENT TREEGRASS SPECIES ORIGINPROVENANCE
TI Leucaena leucocephala Melinda Belize T2 T3
Sesbania sesban Calliandra calothyrsus
Kakamega Kenya Guatemala
T4 T5
Pennisetum purpureum Leucaena + Pennisetum
Vet Farm Maseno ---
T6 Sesbania + Pennisetum ---T7 Calliandra + Pennisetum --shy
44
The experiment was laid out as a complete randomized block design with four replicatesEach treatment consisted of a 4 m long and 1 m wide section of the bund and a food cropterrace below and above the bund Within each half food crop plot a minimum of two rows of experimental maize next to the bund were studied The total experimental plotsize therefore consisted of a field bund of 1 x 4 m and two food crop terraces of 15 x 4 m each The total net plot size is 16 M2 of which 25 is bund area and 75 is croppingarea Each bund section had two parallel lines of trees andor grass The two lines were05 m apart and the within-row spacing for trees was 025 m Frees andor grasses wereplanted in staggered lines in order to increase the effectiveness of the planted combination on the bund against soil erosion Trees received 25 g of DAP at planting time equivalentto 45 g of N and 115 g of P2O5 The pure tree treatments (T1-T3) and the grass in the pure grass (T4) treatment were established in April 1988 together with the tree componentin the mixed treatments (T5-T7) The grass in the mixed treatments was establishedbetween August and November 1988 Trees were managed as hedges and cut back to 05 m Cutting frequency and timing of cutting between treatments initially (between August1988 and January 1989) varied depending on the coppice growth With effect from April1989 all treatments were cut at the same date and this was carried out at least twice everygrowing season at the time of sowing the food crop and around two months later Four crops were grown since the start of the trial ie beans in the first and second seasons of1988 maize (hybrid 512) and beans intercropped in the first season of 1989 and a locallyselected composite maize (cv HDC) in the second season of 1989 Fertilizer was appliedto the bean crops in 1988 at a rate of 100 kgha of DAP The intercrop during the firstrainy season of 1989 was fertilized with 130 kgha of DAP at planting time and top dressedwith 142 kgha of CAN equivalent to 6060 kgha of N and P20 The maize in the short rainy season of 1989 (cv HDC) was not fertilized
523 Site description
The experimental site was initially covered with small bushes and couch grass Contourbunds of 30 cm high and 1 m wide were physically constructed simulating the existingfarmers practice locally known as fanya juu The dug out soil from ditches was used tolevel the terraces between the bunds The minimum terrace width between bunds was 4 m Soils vary from clay loam to sandy clay with a depth exceeding 15 m The colour isreddish brown The slope was about 5 and it is tilted both in north-south and west-eastdirection The soil is strongly acid with pH (in water) of 49
At the start of the experiment in April 1988 soil samples were taken and analyzed for the following chemical components
Average soil pH (in CaCI2 125 ratio) 442 Organic Carbon () 093 Total available Nitingen (N) () 011 Phosphorus (P) (by Bray no2 method) (not yet available)Sodium (Na) (me100 g) 067 Potassium (K) (me100 g) 071
45
524 Resuls and discussion
5241 Trees andgrass
Tree survival
Leucaena leucocephalashowed less than 2 mortality after receiving six cuttings between December 1988 and January 1990 Both in the mixed and pure treatments Sesbania sesban showed 100 mortality after receiving seven cuttings between September 1988 and January 1990 Stand mortality of Calliandracalothyrsusreached about 10 after 7 cuttingsbetween October 1988 and January 1990
Pests and diseases
Sesbania sesban was defoliated by the larvae of the Mesoplatys ochroptera beetle especiallyduring hot dry spells There was a slight termite attack on Calliandracalothyrsus mostlyin the form of root collar girdling and subsequent wilting of the young seedlings
Initial tree height and root collar increments
Table 22 indicates that Sesbania sesban displayed the fastest height and root collar diameter growth from planting until first cutting followed by Calliandra calothyrsus and Leucaena leucocephala It is interesting to note that five months after planting the pure(two line) treatments (T1-T3) which experienced between-line competition from the planting day onwards were on average between 7 (Calliandracalothyrsus) and 25 (Leucaena leucocephala) lower in height than the single tree line treatments which grewfree of any competition from their adjacent grass line during the same 5 months period(rom April to August 1988 The height of Sesbania sesban in double line planting was reduced by 13 When Leucaena leucocephala was cut after eight months and the mixed treatment had grown together with grass for three months the difference in final heightbetween pure and mixed treatments was marginal These findings indicate that there is a considerable amount of between row competition during the establishment phase of double hedgerows of trees on bunds However some hedge species (Calliandra) appear to cope better with initial between row competition than others (Leucaena)
46
Table 22 Tree height and root collar diameter increment (cm) between planting and first cutting for Leucaena leucocephalaSesbania sesban and Calliandracalothyrsusplanted on field bunds in pure lines and in mixture with Pennisetumpurpureum
Assessment date at Treatment 5 months 6 months 8 months
Ht RCD Ht RCD Ht RCD
Leucaena leucocephala 84 12 100 14 151 20 Sesbania sesban 231 26 - - shy -Calliandra calothyrsus 161 15 189 19 - -Leucaena + Pennisetum 112 15 122 18 155 23 Sesbania + Pennisetum 263 33 - - shy-Calliandra + Pennisetum 172 17 196 22 - -
MEAN 171 20 152 18 153 22
5242 Crops
Biomass from fodder on bunds
The biomass produced by different tree species planted in double lines grass double linesand the different treegrass combinations is summarized in Table 23
In order to be able to make a fair comparison between the different alternatives the biomass productivity is expressed in kgm for the upper and lower line on each bund section separately
The biomass production is divided into two distinct periods the initial formation stage of the different components on the bunds and the uniform production stage in 1989 The first period runs from August 1988 up to January 1989 and the second stage started in April 1989 and is still ongoing
The highest production in the initial stage was achieved by the pure Napier grasstreatment The average productivity per line was 175 kgm The upper bund section was somewhat more productive than the lower section (+- 11 from the mean)
An interesting finding during the same initial period was that the total biomass productionfrom double lines of Leucaena and Sesbania were equal to the single line of the same species which had grown largely free of competition from the companion Napier grassduring most of the initial establishment period Napier in combination treatments was planted only in August-October 1989 allowing a head start for the trees in the mixed treatments The single line production of Calliandra (in mixture with Napier) was 27 lower than the double line production of Calliandra in the pure treatment
47
Table 23 Fresh Leafy biomass yield (kgm) during the initial formation stage of field bunds (august 1988-January 1989) and during the productivity of staAdard cutting (ApriL-December 1989)
Cutting No Sum Cutting No Sun Relative productivity1 2 3 4 5 6 Aug 88 7 8 9Treat Species combination 10 April- mixed treatments vsJan 89
23888 12988 Dec89 pure treatments171088 271088 81288 16189 5489 16689 20989 151189 by Line by treat
T1 Leucaena - upslope 14 14 20 11 10 06 47 1I Leucaena - downslope 13 13 20 11 10 06 47 100 100 T2 Sesbania - upsLope 17 - 14 31 22 15 03 03 43 1Sesbania - downsLope 17 - 13 27 22 17 03 03 45 100) 100 T3 CaLLiandra - upstope 10 15 25- 17 13 14 11 58 1I CatLiandra - downstope 10 shy 14 24 17 15 15 14 61 10) 100 T4 Napier - upslope 44 - 68 83 195 88 119 86 64 357 100)Napier - downslope 32 48 - 74 154 88 106 75 64 333 100) 100 T5 Napier - uptsope shy - - 53 126 99 92 370 + 4 -46Leucaena - downsLope 28 28 42 12 17 09 80 +70 -15 T6 Napier - upslope -58 117 102 98 375 + 5 -46Sesbania - downstope 33 23 56 31 18 03 02 54 +20T7 Napier - upsLope
-39 - - 37 77 62 65 241 -33 -65
CaLtiandra - downstope 18 18 36 25 15 16 09 1 5 + 7 -45 MEAN Tree component 28 24 14 10 07 56 MEAN Grass component 17 5 65 109 85 77 335
48
These early findings clearly indicate that there is considerable competition between hedgelines of MPTs in the initial stages of hedge formation Similar tendencies were observedfor hedge lines in the experiment described in section 44 The average production of oneline of trees (all species combined) over the period of August 1988 to January 1989 wasonly 28 kgm or 16 of the initial grass production (175 kgm)
Since Aplril 1989 all treatments received uniform cutting management and were cut on a2 to 3 month cycle up to the end of 1989 The data presented in Table 23 for the periodApril-December 1989 can be analyzed at two levels ie the total combined (double line)productivity of each treatment over a standard bund length of 1 m and the comparativeproductivity of separate single line components on the bund
It was found that
The highest fresh biomass productivity was achieved again in the pure double line grasstreatment with 69 kgm of bund or on average 345 kglinem This level of productionwas significantly higher than any other combination of trees and grasses produced onbunds (P_ lt001) The upper line of grass was somewhat more productive than the lower line (+7)
The combined tree and grass biomass productivity of Leucaena-Napier and Sesbania-Napier were lower than the pure grass treatment at 45 and 429 kgm of bund These twodifferent combinations were not significantly different in productivity (P = 005)
Evidently less productive was the combination of Calliandra with Napier yielding only306 kg of fodder per metre of bund over the same period which was significantly les thanany of the other combination treatments discussed above (P lt005) It is interestingtonote that especially Napier grass seemed to suffer from the combination with CalliandraIt was 33 less productive than the mean grass productivity in the pure and combined treatments discussed above
The pure tree treatments were much less productive than the tree-grass treatments andyielded 94 88 and 119 kgm of bund for Leucaena Sesbania and Calliandra respectivelyThe differences in productivity of pure hedge treatments were not significant (P = 005)It is further noticed that single lines of a tree species combined with Napier grass didproduce more than the expected 50 of the double tree line production in the pure treetreatments One line of Leucaena produced only 15 less than two lines of the speciesplanted together and single lines of Sesbania produced 39 less than double lines Singlelines of Calliandra produced 45 less biomass than the two lines in pure treatments Thesingle line production of Leucaena and Calliandra in combination with grass wassignificantly higher than the corresponding single line production in the pure tree treatments (P lt005)
1lhese preliminary findings indicate that a hedgerow is better combined with a row ofPennisetum than with another hedgerow of the same species The same is true for thegrass with the exception of Calliandra To determine best combination requires further
49
analysis of the nutritive content of each of these combinations Such nutritive values should then be checked against the farmers requirements especially during the dry seasons
Two points are important in the interpretation of the results First of all tree-grasscombinations did very well as far as the trees were concerned because they received aninitial4-5 months head start and were strong and tall by the time the grass was established in the companion line In fact it was initially difficult to establish the grass under the (uncut) tree cover
Sesbania sesban died in the second half of 1989 because it does not withstand the repeatedcutting back that is practised in this fodder production system Therefore it is not a viable fodder production proposition if the system is to function for more than 1 years Thisleaves the Leucaena-Napier combination as most promising in terms of overall combined biomass productivity
Cropelds
It has been-very difficult to obtain crop yield data from this experiment reflectingdifferences in treatment factors First of all some crops failed due to a combination of soil and rainfall conditions and secondly maize crop yields harvested in 1989 were found to be strongly influenced by site variability within the blocks
53 Effect of cutting height of Leucaena hedgerows on biomass productivity and food crop
yields in alley cropping
31 Objectives
- to study the effect of different cutting heights on the biomass production of hedgerows of Leucaena leucocephala
to study the effect of hedge height on the yield of the main food crop (Zea mays) grown in the alleys
532 ampaperimental design and methodology
The study evaluated five cutting heights (01 03 05 07 and 09 m) of hedges of Leucaena leucocephala (Origin Melinda Forest StationMelinda Belize) a promising species foralley cropping at 1500 m altitude on acid leached soils in the bimodal highlands of EastAfrica The statistical design of the study was a randomized complete block with five replications The plot size was 35 x 50 m with one row of Leucaena in the centre of theplot and two rows of maize on either side of the hedge at a between-row spacing of 075 m and in-row spacing of 03 m (44444 maize plantsha) Leucaena was planted in eastshywest direction across the slope (lt3) in april 1988 at 025 m in the row and 35 mbetween the rows (14430 treesha) A starter dose of 25 g of DAP per tree was appliedequivalent to 65 kgha of N and 166 kgha of P205 The annual food crop in the first two
50
rainy seasons (1988) was beans (GLP-2 Roscoco) It was maize (hybrid 512) intercroppedwith beans (GPL-2) in the first (long rainy) season of 1989 and it was maize (local cvHDC) in the second (short rainy) season of 1989 Beans were fertilized with 100 kghaof DAP at the time of planting Only maize in the long rains of 1989 was fertilized with130 kgha of DAP and top dressed with 142 kgha of CAN giving a total of 60 kgha ofP205 a d N The local maize cultivar grown in the second rainy season of 1989 was not fertilized
The Leucaena hedges were first cut back in November 1988 to the different managementheights about 75 months after planting when Leucaena was 25 to 30 m tall and the rootcollar diameter was 25 to 30 cm thick Subsequent cuttings were carried out at 2 to 3months interval and synchronized to reduce light and moisture competition to theassociated food crop Thus the hedges were cut shortly before sowing the food crop andagain eight weeks later At each cutting the entire row was harvested and the sidebranches were trimmed to keep hedge width to about 05 m During the initial and secondharvest the material was divided into leaves twigs and stem wood (only at the firstcutting) All material was then weighed fresh and removed from the plot
533 Sitj description
The experiment is located wihin the same area as experiment 1 (MPTs species screeningfor alley cropping) and the site description given previously applies also to the currentlydiscussed experiment The site was a relatively flat (lt2 slope) sandy area with impededdrainage and poor soil fertility especially in respect of phosphorus The soil pH (in water)was 50 - 52 in early 1988 At the start of the experiment in April 1988 soil samples weretaken and analyzed for the following chemical components
Average soil pH (in CaCI2 125 ratio) 457 Organic Carbon ()068Total available Nitrogen ()010Phosphorus (P)(Bray no21)(ppm) (not yet available)
534 Results and discussion
5341 Trees
Leucaenamp e-tablished well and grew vigorously in this climate There have been nonoticeable probiems of stand mortality or pests and diseases so far At first harvesthighest wood yield (26 kgm of hedge) was realized when the hedges were cut back toground level Cutting at 09 m above ground level yielded 14 kgm of stem wood (Table25) These initial fresh yields are equal to 74 tha and 40 tha of firewood or stakesrespectively if hedges are planted 35 m apart Leaf and small twig biomass yields werenot significantly different between treatments for the initial harvest in November 1988The coppice regrowth during the first dry period from November 1988 to February 1989did not show significant differences between treatments although the trend was towardsthe higher yields with increase in cutting heights It seems that during the first three
51
months after initial cutting the difference in production potential could not yet come outconvincingly perhaps due to drought stress As of the first (long rainy) season of 1989significant differences in leafy biomass production were detected (P lt 0001) in three outof four cuttings (Table 25) The preliminary conclusion is therefore that hedges cut athigher cutting heights produce significantly more leafy biomass then hedges cut at lowercutting heights if moisture is not a growth limiting factor
52
- - - -
Table 24 Fresh biomass yield in 1988 (initial) and 1989 (uniform cuttings) of Leucaena leucocephalahedges managed at five different cutting heights in an alleycropping system
Fresh Biomass Yield (kgm of hedge)Cut Ht Nov88 Feb Apr Jun Sept Nov Total
8889
01-If 31 19 13 05 06 08 82 -tw 11 13 - - - - 24 -wd 26 13 shy - - - 39
03-If 30 24 15 07 09 12 97 -tw 11 17 27-wd 21 21
05-If 31 25 17 07 09 13 102 -tw 12 16 28-wd 17 17
07-If 28 24 17 08 10 15 102 -tw 09 16 - - - - 25 -wd 13 13
09-If 35 2130 10 13 17 126 -tw 13 19 32 -wd 14 14
MEAN -leaves 31 1724 07 09 13 102 -twigs 11 16 27 -wood 18 21
SED -leaves 042 037 012 007 017 008 shy-twigs 020 025 - - shy- --wood 042 - -
CV -leaves 211 238 119 145 279 101 shy-twigs 274 244 - - shy- --wood 370 - - - shy - -
note If = leaves tw = twigs wd = stem wood
53
5342 Crops
The effect of hedge cutting height on the companion food crop(s) is equally important in choosing a particular hedge height for an alley cropping system The bean crop plantedin both seasons in 1988 and as intercrop under maize in the first rainy season of 1989 failed due to high rainfall early in the season and poor site drainage It should be noted that hedge biomass was removed as fodder for livestock and manure was not returned to the plots As-a result rapid nutrient depletion and loss of soil structure is expected which might have affected food crop yields
Maize yields averaged 27 tha in the first (long) rains of 1989 and 31 tha in the second (short) rains (Table 26) Treatment differences were not significant indicating that cuttingheights between 01 and 09 m did not have any influence on the associated maize cropHowever low initial soil fertility status rapid site fertility depletion and consequent low maize yields may have masked treatment differences The coefficient of variation (CV) was exceptionally high in both seasons 55 and 38 respectively
Table 25 Maize grain yield (13 mc) cropped in alley of Leucaena leucocephalahedges managed at five different cutting heights (m)
Maize yield (tha) long rains short rains
1989 1989
Cutting Height (m) 01 307 297 03 198 290 05 270 304 07 309 321 09 267 340
MEAN 27 31 SED 0942 0746 CV () 551 380
54
6 NON EXPERIMENTAL ACTIVITIES
The AFRENA project in Maseno is involved in many non experimental activities The staff members at the research station have developed close links with the local communityand officials Many farmers teachers and their students government officers and scientists from the region as well as from elsewhere have visited the station Such visits serve as good occasions of interaction with potential users of the agroforestry technologiesdevelopel on the station The comments received from farmers scientists and other visitors have been taken particularly seriously because they form the input to new research ideas and may lead to amendments in the on-going work The Agroforestry Research Centre activities are valued by the community because of their contribution to solvingpressing land-use problems in the region the demonstration function of the trials and the employment opportunities they have created for many people in the area As such the Centre and the project have had an impact on the local understanding of land-use issues and the potential of agroforestry
55
REFERENCES
Hoekstra DA Summary of zonal agroforestry potentials and research across land-use systems in the highlands of Eastern and Central Africa AFRENA Report no15 ICRAF 1988
Minae S and Akyeampong E (Eds) Agroforestry potentials for the land-use systems inthe bimodal highlands of Eastern Africa Kenya AFRENA Report no3 pp153ICRAF 1988
Kang BT Wilson GF and Sipkens L (1981) Alley cropping maize (Zea ys L) andLeucaena (Leucaena leucocephala Lam) in southern Nigeria Plant Soil 63 165-179
Jaetzold R Schmidt H Farm management handbook of Kenya Vol IIa 1982 Ministryof Agriculture Kenya in cooperation with GAT and GTZ
Jaetzold R Kutch H Agro-ecological zones of the tropics with a sample from KenyaDer Tropenlandwirt 83 Jahrgang April 1982 pp 15-34
56
Annex 1 Staff List AFRENA on-station project (Maseno)
Staff
Scientific staff Mr JHO Otieno BScMSc Forestry
Mr EK Mengich BSc Forestry
Dr AD Olang PhD Agronomy
Mr AM Heineman BA social Science MBA Management Science MSc Forestry
Administrative SecretaryMr S Juma
Field Technicians Mr M Odongo Mr H Wandabwa Mr M Ngethe Mr R Cheruiyot
Nursery foreman Mr J Owalo
Storekeeper Mr 1 Ogutu
Driver Mr J Ngala
TypistReceptionistMr CO Apondi
Tea ladyCleaner Ms J Kisanya Mrs H Mohamed
Office messengercleaner Mr T Odhiambo
Other staff Mr W Ochieng Mr G Ouma
InstitutePosition Joined
KEFRI - scientists Feb-Aug 1988 KEFRI-KARI-ICRAF Agroforestry Research Centre Director and Nov 1989 on-station project team leader
KEFRI - scientist Sept 1989
KARI - scientists July 1988 (on-station project team leader July 1988-Oct 1989)
ICRAF - associate scientist Nov 1987 (Dutch Government funded)
KEFRI Oct 1989
KEFRI April 1988 KEFRI Aug 1988 KEFRI May 1989 KEFRI June 1989
KEFRI Nov 1988
KEFRI Nov 1988
KEFRI April 1988
KEFRI June 1989
KEFRI June 1989 KEFRI June 1989
KEFRI June 1989
KEFRI June 1989 KEFRI June 1989
12
Annex 2 Experiment 10 Species list treatment allocation and seed supply institution for
Leucaena and Calliandra speciesprovenances general screening trial
Treatment MPTS Species and seed source
TI Leucaena leucocephala (Hengchun China)
Leucaena leucocephala (K8) Baobab Farm Mombasa Gen Coll
T3 LeLcaena leucocephala (K28) (as T2)
T4 Leucaena leucocephala (K636)
(Coahuila Mexico)
T5 TLeucaena leucocephala (14198)
T6 Leucaena diversifolia (K156) (Vera Cruz Mexico)
T7 Leucaena diversifolia (14193)
T8 Leucaena revoluta (14201)
I9 Leucaena paniculata (14203)
I0 Calliandra calothyrsus (CC-094-002-88) Patullil Guatemala
Seed supplying institution
Seed harvested in Exp3 in 1989
KEFRIKFSC
KEFRIKFSC
KEFRIKFSC
ILCAEthiopia
KEFRIKFSC
ILCAEthiopia
ILCAEthiopia
ILCAEthiopia
KEFRIKFSC
58
Annex 3 The mean height and root collar diameter growth (cm) of different provenances
of Leucaena leucocephalaat 14 months after planting
Treatment Provenance Mean height Mean RCD
Leucaena leucocephala Kibwezi Kenya 3418 737 Leucaena leucocephala Hawaii 3844 823 Leucaena leucocephala Melinda Belize 3471 730 Leucaena leucocephala Hengchun China 3650 782 Leucaena leucocephala Yimbo Siaya Kenya 3263 648
Grand Mean 3529 744 SED 1317 0268 CV (plot) 46 44
(tree) 101 113
Annex 4 The mean height and root collar diameter growth (cm) of different provenances of Gliricidiasepium at 14 months after planting
Treatment Provenance Mean height Mean RC
Gliricidia sepium Guatemala 2662 759 Gliricidia sepium Santa Cruz Costa Rica 2180 659 Gliricidia sepium Columbia 2666 816 Gliricidia sepium Monterrico Taxisco Guatemala 2390 843 Gliricidia sepium Chiquimala Guatemala 2733 648 Gliricidia sepium Guyatenago Guatemala 3080 812
Grand Mean 2619 771 SED 2139 0375 CV (plot) 100 60
(tree) 176 138
59
Annex 5 The mean height and root collar diameter growth (cm) of different provenances
of Calliandra calothyrsus at 14 months after planting
Treatment Provenance Mean height Mean RCD
Calliandra calothyrsus Guatemala 4418 908
Calliandra calothyrsus Kibuye Rwanda 4068 815
Calliandra calothyrsus Arboretum de Ruhande Rwanda 4272 880
Grand Mean SED CV (plots)
(trees)
4253 1767 51
123
868 1062
150 175
Annex 6 The mean height and root collar diameter growth (cm) of different provenances of Sesbaniasesban at 14 months after planting
Treatment Provenance Mean height Mean RCD
Sesbania sesban Kakamega Kenya 4978 862
Sesbania sesban Mukururiati Kenya 5001 951
Sesbania sesban Kiambu Kenya 3393 534
Grand Mean 4458 782SED 2724 0891CV (plot) 75 140
(tree) 125 211
60
Annu 7 The mean height and root collar diameter growth (cm) of two provenancesof Cassiasiamea and one provenance of Cassiaspectabilis at 14 months after planting
4eatment Provenance Mean height Mean RCD
Cassia spectabilis Bugarama Rwanda 4189 903
Cassia siamea Bugarama Rwanda 2846 658
Cassia siamea Kwale Kenya 2534 585
Grand Mean 3190 716 SED 251 042 CV (plot) 96 72
(tree) 125 100
61

Initial height and root collar diameter increment
Table 11 gives initial height and root collar diameter increments at the time of initial cutshyback which ranges from five to ten months for various species The figures in Table 11clearly illustrate that the fastest growth was displayed by Sesbania sesban in five monthsand the lowest growth rates were recorded for Gfiricidiasepium in ten months
Table 11 Tree height and root collar diameter increment (cm) between time of planting(April 1988) and time of first cutback to hedge height as indicated (in months)
Treatment Species Growth Growth increment period Height Root collar
TI Leucaena leucocephala 8 266 23T2 Leucaena leucocephala 8 232 23T3 Calliandra calothyrsus 6 268 23T4 Gliricidia sepium 10 136 27T6 Sesbania sesban 5 343 34T7 Cassia siamea 10 235 31T8 Erythrina caffra 10 191 31
Biomass production
The tree biomass harvested from the hedges is summarised in Table 12 Two distinctperiods in the development of the hedges are recognized During the first period fromSeptember 1988 to February 1989 all tree species were cut back from their initial heightto the standard hedge height of 05 m Sesbaniasesban received its first cutting after fiveand a half months some other slower growing species were first cut after ten and a halfmonths All the biomass produced by each species between September 1988 and February1989 is regarded as initial yield associated with trimming the hedges to experimental sizeBecause of the different initial cutting dates and the different tree products obtained at theuniform cutting in February 1989 the biomass yields up to February 1989 have not beenanalyzed statistically However there are clear differences in initial leaf yield betweenspecies Sesbania sesban gave an initial leaf yield of 203 tha Calliandracalothyrsusyielded 173 tha the two Leucaena leucocephalaprovenances yielded 114 tha (China)and 109 tha (Belize) respectively Lower initial leaf yields were achieved by CassiasiameaErythrinacaffra and Gliricidiasepium 83 tha 75 tha and 42 tha respectively
Starting with the yield of April 1989 the leafy biomass production is fully comparablebetween species because all hedges were cut back to the same cutting eight in February1989 Leafy biomass productivity between species was compared for the April JuneSeptember and December 1989 harvest Significant differences in leaf yield were foundin all four cuttings In April 1989 significant differences were detected (p lt005) In all
24
subsequent cuttings the differences were highly significant at p lt 0001 Between April andDecember 1989 the best performing species was Calliandra calothyrs with 367 tha The two Leucaena leucocephala provenances were practically equal in yield with 243 thaGlircidiasepium andErythrinacaffra yielded 183 tha and 171 tha respectively Lower leaf yields were achieved by Sesbaniasesban and Cassiasiameawith 108 tha and 89 tha respectively
Woody biomass harvested from different species between September 1988 and February1989 during initial cutback varied considerably Sesbaniasesban gave 126 tha of woodand 182 tha of twigs Calliandracalothyrsusgave 91 tha of wood and 13 Lha of twigsThe two Leucaena leucocephalaprovenances gave 45 tha (China) and 38 tha (Belize)of wood and 38 tha (China) and 31 tha (Belize) of twig respectively Gliricidiasepiumand Cassiasiamea did not yield any wood at first cutback but they yielded 4 tha and 86tha of twigs respectively Erythrinacaffra yielded 91 tha of twigs and 44 tha of wood
The actual precipitation received at this site was 2396 mm from April 1988-March 1989 and 1455 mm from April-December 1989
Table 12 Fresh leafy biomass yield Ctha) during the initial formation stage of the hedgerows (September 1988 -February 1989) and during productivity at the standard height of 05 m (April - December 1989)
Treat- SpeciesProvenance utoI ment JTotal Total1 2 4 6 8j 5 7 Yield Yield
D A T E S Sept 88 April 89 - to toSept 88 Oct 80 Dec88 Feb89 Apr89 Jun89 Sept89 Dec89 Feb 89 Dec 89
TI Leucaena leucocephala(China) 84 30 63 55 45 79 114 242
T2 Leucaena leucocephala(Belize) - 74 35 57 54 47 86 109 244
T3 Cattiandra calothyrsus(Guatemala) 84 - 89 50 88 95 134 173 367
T4 Gtiricidia sepium(Guatemala) 42 54 50 18 61 42 183
T6 Sesbania sesban (Kakamega) 128 75 55 53 dead dead 203 108
T7 Cassia siamea (Siaya) - 83 42 15 15 17 83 89
T8 Erythrina caffra (Siaya) 75 63 29 56 23 74 171
MEAN 79 61 55 49 46 67 114 201
SED 119 054 054 032 057
CV 275 139 155 99 121
25
4242 Crops
Crop 3deids
Beans planted duing the first and second seasons of 1988 failed due to heavy rains Theresults are therefore not included in this report The hybrid maize planted together withbeans in the Orst season of 1989 performed well while the intercropped beans failed Thecomposite maize crop in the second rainy season of 1989 gave similar yields as the firstharvest in 1989 However it should be noted that the second crop of 1989 did not receive any external inputs in the form of fertilizer The maize yields for two seasons are shown in Table 13
Table 13 Dry maize grain yield (tha) for the first (long rainy) and second (short rainy) season of 1989
Treatment Species First season Second season of 1989 of 1989
T1 Leucaena leucocepha 407 435T2 Leucaena leucocephala 318 362T3 Calliandra calothyrsus 256 380T4 Gliricidia sepium 346 349T5 No hedge 253 305T6 Sesbania sesban 468 429 T7 Cassia siamea 484 336T8 Erythrina caffra 429 421
Mean 370 377SED 094 051CV 245 193
During the first (long rainy) season of 1989 no significant differences (p lt005) werefound in maize yield between alley cropping treatments except Calliandracalothyrsuswhich gave a low yield which was comparable to the control The yield of the controlplot with pure maize gave the lowest yield of 253 tha which was significantly lower thanmost alley cropping treatments The highest yields were achieved in the alley croppingplots with Cassiasiamea and Sesbania sesban
The local unfertilized maize composite planted in the second (short rainy) season of 1989was harvested in January 1990 and the yields in some alley cropping plots were againsignificantly higher than in the control plot (p lt 005) The control plot gave 305 tha andthe best yield (435 tha) was achieved in the Leucaena leucocephala (China) alleycropping plot closely followed by the Sesbania sesban plot with 429 tha
26
The preliminary conclusion is that during these first two cropping seasons a clear positivecorrelation between the amount of leafy tree biomass applied to the food crop plot andmaize crop yield was not observed However alley cropping treatments consistentlyperformed better than the control maize only treatment
43 The effect of Leucaena leucocephalamulch and DAPCAN fertilizer applications on
the productivity of maize and maizebean systems
431 Objectives
- to study the effect of Leucaena mulch on the yield of maize and maize + beans systems
- to study the effect of different levels of fertilizers alone and in combination withmulch on the yield of maize and maize + beans systems
432 Experimentaldesign andmethodology
The study evaluated four different cropping systems and three different levels of fertilizerin a split-plot design and was replicated four times The main plot and sub-plot treatments are as follows
Main plot Sub-plot
(Cropping Systems) (Fertilizer Levels)
S1 - Pure maize Fo - No fertilizer S2 -Maize + beans F1 - 30 kg N + 30 kg P20haS3 - Maize + Leucaena F2 - 60 kg N + 60 kg P20 5haS4 - Maize + beans + Leucaena
Each main plot measures 15 by 75 m and was made up of three subplots of 50 by 75 mIn plots with the Leucaena two parallel hedges of trees were planted 375 m apart within-row plant spacing of 025 m Tree density in Leucaena plots was therefore 10667treesha All sub-plots were separated by small earth bunds in order to minimise thesurface flow of fertilizer and Leucaena mulch from one plot to the next
Before the experiment was established in April 1988 the area was mainly covered by couch grass (Digitariasacalarum)mixed with pasture grasses The site was ploughed twice usinga disc plough and thereafter harrowed twice Subsequently couch grass was removedmanually and Leucaena leucocephala hedgerows planted in April 1988 The trees wereestablished with 1 tablespoon of di-ammoniumphosphate equivalent to 45 g N and 115 g P2 0 per tree This is equivalent to 267 kgha of DAP
27
The Leucaena trees were first cut back to the standard hedge height of 05 m in February 1989 when most of the trees had attained a height between 2 and 25 m and a root collar diameter between 25 cm and 30 cm Although the height criterium was not fully met by all trees in March 1989 they were all cut back at that point in order to be able to incorporate tree leaves before the start of the long rainy season of 1989 Subsequently hedges have been pruned every 2 to 4 months Hedge biomass harvested during the first cutting of each season was incorporated in the soil during subsequent cuttings it has been mulched on the plot between the lines of maize and beans
The alley between hedges was planted with 4 rows of maize and half alleys on either side of the plot with two rows of maize In plots without Leucaena hedges 10 rows of maize were planted at 075 m between rows and 025 m in the row giving a plant population of 53000 plantsha In alley cropping plots the maize plant population is 42400 plantsha Bean plant population is the same in Leucaena plots and pure maizebean plots Beans are spaced at 075 by 020 m (66666 plantsha)
A cover crop of beans was planted in April 1988 but it failed due to heavy rains During the short rainy season of 1988 beans were again planted as cover crop with a uniform DAP dose of 100 kgha Commencing with the long rainy season of 1989 the 12 experimentar treatments comprising four different cropping systems times three fertilizer levels were implemented Maize Hybrid 512 and beans Roscoco GLP-2 have been used in this experiment in both growing season in 1989
In March 1989 the first experimental crop of maize and beans was sown At maize planting fertilizer was applied as per treatments DAP at planting time and CAN top dressed when plants had reached knee height where used as sources of N and 1P205 All P205 was applied at planting time via DAP 39 of N was applied at planting time via DAP and 61 was applied at top dressing via CAN Beans were planted with DAP at the rate of 100 kgha Maize stalk borer the most common maize pest was controlled by application of Fenitrothion 3 dust into the plant funnel (whorl) at the rate of 11 kgha per application
During the establishment phase of the trial (April 1988 - February 1989) the measurement of standard tree growth parameters such as height and root collar diameter increment were carried out From the time of first cutting the leafy biomass production of the Leucaena hedges was monitored per cutting season and year Starting with the long rainy season of 1989 data were gathered on a seasonal basis about maize and bean yields in the alley cropping and control plots
433 Site description
The site was used as pasture before the experiment was established Couch grass (Digitaria sacalarum) is the predominant weed species at the site The soil (loam to clay loam) is classified as lixisols (tropical luvisols) From the soil surface towards the deeper soil layers the colour changes gradually from dull reddish brown towards more orangeyellow reddish brown The profile is uniform with no abrupt changes in texture Tile slope of tile experimental site is less than 2 in north to south direction At the onset of the
28
experiment the soil was strongly acidic with an estimated pH in water of 51 The soil depth exceeded 120 cm At the start of the experiment in April 1988 soil samples were taken and analyzed for the following chemical components
Average soil pH (in CaCI2 125 ratio) 46 Organic Carbon () 161 Total available Nitrogen () 013 Phosphorus (P) (Bray no2a) (ppm) (not yet available) Sodium (Na) (me100 g) 052 Potassium (K) (me100 g) 112
434 Resulis and discussion
4341 Trees
Survival
The Leucaena provenance from the Hengchun Tropical Botanical Gardens in China (PRC) has proven to be well adapted to the Maseno climate There has been hardly anymortality due to establishment failure during the initial stage of the experiment
Pest and diseases
The trees were first cut down for hedge formation on 9-3-1989 105 months after their establishment During the first two months of hedge establishment there were isolated attacks of white ants especially of trees witha root collar diameters of less than 5 cmwhich caused death Beating up was done in all such cases and chemical control was taken up to avoid further damage The compound used was Aldrex (48) at the rate of 1100 ml100 Iof water Due to the fast growth of the trees during 1988 combined with several heavy hailstone storms there were signs of bark cracking which caused concern by late 1988 because the trees became brittle and side branches could be broken off easilyHowever at the time of harvesting the problem was no longer serious and most bark cracking had appeared on side branches above the hedge cutting height of 05 m Two years after establishment of the experiment the Leucaena hedges are healthy disease and pest free and steadily producing abundant amounts of leafy biomass suitable for mulching
Height and root collar diameter increment
Height growth increment of Leucaena was measured on a monthly basis from two months after planting up to the time of first cutting The mean monthly height increment between April 1988 and February 1989 was 20 cm However height growth was not linear duringthe first 105 months of growth (see Figure 1) At establishment the trees had an averageheight of 21 cm Between April and July 1988 the trees established their roots and grew on averagc 15 cmmonth Increased height increment of more than 32 cmmonth was achieved )etween July and December 1988 Thereafter height growth slowed down
29
considerably and had virtually come to a standstill by February 1989 This significantreduction in height increment coincided with the onset of flowering and the production of seed between December 1988 and February 1989 By late 1988 the trees had switchedfrom vegetative towards reproductive growth This change in growth strategy coincided with the onset of the dry season between December 1988 and February 1989 Figure 1 also shows the root collar development between April 1988 and February 1989 The growth curve indicates that the root collar diameter developed at a fairly constant rate of approximately 05 cm per month throughout the growing period except for the first month after planting when the trees were establishing themselves more slowly
Figure 1 Height and root collar diameter growth of Leucaena leucocephala (HengchunChina) planted in hedgerows between planting time (April 1988) and time of first harvest (February 1989)
lleight (m) Root collar (cm)25 4
2
3
15
05
0 I I 0 0 50 100 150 200 250 300
Days after planting
- Height - Root collar diameter
jLiomass yield
When the hedges were first cut in March 1989 to a uniform height of 05 m the biomass was harvested by product type comprising leaves twigs pods and stem wood At harvest time most trees had developed into healthy multi-stemmed shrubs with an abundance of leaves and seed pods The harvested fresh biomass yield amounted to 811 tha of stem wood and twigs 712 tha of leaves and 587 tha of seed pods Therefore only 34 of the total fresh biomass harvested during this first cutting was incorporated in the plots as leafy biomass In Table 14 the amount of fresh leafy biomass harvested at each cutting
30
is summarized as well as the total biomass production between April 1988 and December 1989
Table 14 Average fresh Leucaena yield (tha) from alley cropping plots planted in April1988 and regularly harvested between March and December 1989
DATE 7389 13689 29989 301189 TOTAL 1989
Leaves 712 489531 389 2121
Stem wood 811 - - - 811
Podsseeds 587 - - 587-
TOTAL 2110 531 489 389 3519
4342 Crops
Crop yields
The bean crop of the first rains of 1988 was planted too late in the season and coincided with an exceptionally wet year (1988) No meaningful yield data were collected The second bean crop was successful and a comparison was made between bean yields in alleycropping plots and control plots Dry bean grain yields were significantly lower in alleycropping plots than in control plot and measured 987 kgha and 1307 kgha respectively(p lt0001) The most plausible reason for the reduced bean yield in alley cropping plots was that the beans were growing under an increasingly heavy cover of shade created byLeucaena before it was cut back to hedge height No significant differences were found for bean yield within control plots and within alley cropping plots when their yields were compared within comparable cropping systems
In 1989 two cropping seasons with maize and beans were realised and the first results were obtained about the performance of the four different cropping systems while they were subjected to different levels of fertilizer and leucaena leaf mulch
31
Table 15 Maize yields (tha) grown in an annual system and in alley cropping with
Leucaena at three fertility levels first rains (March-July) of 1989
FERTILITY LEVELS (NP 205 kgha)
CROPPING SYSTEM 0-0 30-30 60-60 MEAN
ANNUAL SYSTEMS
Sole maize 718 865 867 817
Maizebean intercrop 851 905 906 888
ALLEY CROPPING
Sole maize 67 828 799 766
Maizebean intercrop 823 839 856 839
MEAN 766 859 858
SED 024(a) CV 83
SED 0189(b) CV 46
a = SED for comparing maize yield across fertility treatments within the same cropping system
b = SED for comparing maize yield across cropping systems within the same fertility treatments
The following observations are made on the first season results Maize yields were extremely high and ranged from 67 - 91 tha These levels are explained by the fact that the experiment was laid out on fertile pasture land Secondly two cover crops of beans were sown in the preceding seasons of 1988 with 100 kgha of DAP Thirdly appreciable amounts of nitrogen-rich green manure was incorporated in the alley cropping plots shortly before the first maize crop was sown (712 tha fresh leaves equal to 178 tha dry matter equal to approximately 60 kgha of nitrogen) Finally the bean intercrop ia the long rainy season of 1989 received 100 kgha of DAP separate from the fertilizer gift to maize as pretreatment It should be noted that the additional fertilization of beans (100 kgha of DAP) in the maize + bean and maize + bean + Leucaena treatments largely explains the
32
higher absolute yields obtained in these treatments when they are compared with nonshybean treatments
Probably because of this rather high initial fertility status of the soil the alley cropping system did not show any impact during the first experimental season In fact on the whole lower yields were obtained in the alley cropping system as compared to the annual systemsTh latter is probably due to the fact that the plant population in the alley ciopping plots was lower than in the annual plots Also response to fertilizer was limited particularly at the 60 kg level This could in part be attributed to the high fertility status of the soil but also to inappropriate fertilizer application at the 60 kg level
Table 16 Bean yields (tha) intercropped with maize in an annual system and in alleycropping at three fertility levels first rains (March-July) of 1989
FERTILITY LEVELS (NP 205 kgha)
CROPPING SYSTEM 0-0 30-30 60-60 MEAN
ANNUAL SYSTEMS 021 021 023 022
ALLEY CROPPING 010 019 021 017
MEANS 016 020 022
SED 0014 (between cropping systems) SED 0024 (between fertilizer levels) SED 0031 (cropping system x fertilizer level) except when
comparing mean(s) with the same level of Leuceana
SED 0034 CV (treatment level) 251
33
The following conclusions are drawn based on the bean yield data from the first (longrainy season) harvest of 1989 (Table 16) The difference in mean bean yield between cropping systems (main plots) with and without Leucaena hedges is significant (p lt005)Mean yield in the maize bean intercrop is 220 kgha and in the Leucaena alley cropping system it is 170 kgha However when mean bean yields are compared between treatments with varying fertilizer levels (sub-plots) then differences in yield were (just) not significant (p = 0053) The mean bean yield of no-fertilizer 3030 and 6060 plots was 156 202 and 222 kgha respectively Finally the bean yields at cropping system x fertilizer level were not found to be significantly different and averaged 194 kgha Although the bean yield from plots with maize and beans and plots with maize beans and Leucaena were rather poor (102 to 233 kgha) they should not be discarded since they represent a nutritional bonus to the farmer who practices intercropping with beans and the beans are established and maintained at very little extra cash cost and labour input
Table 17 Maize yields (tha) grown in an annual system and in alley cropping with Leucaena at three fertility levels second rains (September - November) of 1989
FERTILITY LEVELS (NP 205 kgha)
CROPPING SYSTEM 0-0 30-30 60-60 MEAN
ANNUAL SYSTEMS
Sole maize 207 213 214 211 Maizebean intercrop 234 203 214 217
ALLEY CROPPING
Sole maize 304 343 328 325 Maizebean intercrop 304 363 280 316
MEAN 262 281 259
SED 0172(a)CV 183
SED 0252(b) CV 188
a = SED for comparing maize yield across fertility treatments within the same cropping system
b = SED for comparing maize yield across cropping systems within the same fertility treatments
34
The following conclusions are based on the maize yield data from the second (short rainyseason) harvest of 1989 (Table 17) While comparing cropping (main plot) systems it isobserved that i) mean maize yields in alley cropping treatments are significantly higher(p lt001) than in annual system treatments ii) maize yields in bean treatments aresignificantly higher or lower than in plots without beans
not While comparing maize yields
at fertilizer (sub-plot) treatment level it is observed that i) maize yields in plots withmedium levels of fertilizer are in three out of four cases higher than in plots without fertilizer However the difference in yield is not significant at p = 005 ii) additionalfertilization from the medium level (30-30) to the higher level of fertilizer (60-60) does notgive any extra maize yield In fact in some cases maize yield is slightly lower at highfertilizer rates The overall conclusion about maize yields during the second rainy season of 1989 is that i) maize yields in absolute terms were lower than in the first rainy seasonof 1989 ii) maize yields were significantly higher in alley cropping plots than in annual crop plots These promising yield increases in alley cropping plots were achieved with only80 of the maize plant population found in the annual (intercrop) plots During thesecond (siort rainy) season of 1989 the benefits of the alley cropping plots may havebegun to show However the apparent lack of positive response of maize yield to the fertilizer treatments is unexplained
Table 18 Bean yields (kgha) intercropped with maize in an annual system and in alleycropping at three fertility levels second rains (September - November) of 1989
FERTILITY LEVELS (NP05 kgha)
CROPPING SYSTEM 0-0 30-30 60-60 MEAN
ANNUAL SYSTEMS 420 433480 444
ALLEY CROPPING 213 287 307 269
MEAN 317 384 370
SED 255 (between cropping systems)SED 370 (between fertilizer levels)SED 497 (cropping system x fertilizer) except when
comparing mean(s) with the same level of Leucaena)
SED 523 CV (treatment level) 207
35
The following conclusions are drawn based on the bean yield data from the second (short)rainy season of 1989 (Table 18) The difference in mean bean yield between croppingsystems (main plots) with and without Leucaena hedges is highly significant (p lt001)Mean 6ld in the maize bean intercrop is 444 kgha and in the Leucaena alley croppingsystem it is 269 kgha Mean bean yields between treatments with varying fertilizer levels(sub-plots) were not significant The mean bean yield of no-fertilizer 3030 and 6060plots was 317 384 and 370 kgha respectively The bean yields at cropping system xfertilizer level were not found to be significantly different and averaged 357 kgha which was already a significant yield improvement compared to the average yield of the first rainy season of 1989 (194kgha)
44 The effect of varying the density of Leucaenadiversifolia in hedgerows and proximity
of the food crop to the hedge on hedge biomass productivity and maize yield
441 Objectives
- to study the effect of varying the within-row and between-row spacing and thenumber of tree rows in a hedge on the production of tree biomass and the yield of the associated food crop
- to study the effect of varying the distance of the first crop row from the hedge on tree biomass production and the yield of the associated crop
442 Experimentaldesign and methodology
The study evaluated eight different hedge designs for Leucaena diversifolia (OriginArboretum de Ruhande Butare Rwanda) combined with two distances at which the first row of maize was planted from the hedges This results in 16 different treatments as listed below
Hedge plant density within- and between-rows (D)
D1 - single row hedge plants at 25 cm D2 - single row hedge plants at 50 cm D3 - two rows hedge at 25 cm and plants within-row at 50 cm D4 - two rows hedge at 50 cm and plants within-row at 25 cmD5 - two rows hedge at 50 cm and plants within-row at 50 cmD6 - three rows hedge at 25 cm and plants within-row at 50 cm D7 - three rows hedge at 50 cm and plants within-row at 25 cm D8 - three rows hedge at 50 cm and plants within-row at 50 cm
Distance between the hedge and the first crop row (S) Si - 75 cm
S2 - 375 cm
36
The study was laid out in a randomized complete block with 3 replications on a practicallylevel piece of land at the Veterinary Farm in Maseno Each plot consisted of the hedge according to the treatment and four rows of maize on either side so the net experimentalsize varied from treatment to treatment However the maize cropping area is the same for each treatment (30 m2 ) Therefore the smallest plots consist of a single hedge (withvarying in-row spacing of individual trees) combined with the first maize row planted at 375 cm away from the hedge resulting in a net plot size of 50 m x 60 m (DIS2 and D2S2) The largest plots consist of a triple row of three hedges spaced at 05 m and the first crop row planted at 075 m away from the two peripheral hedges (50 m x 775 m)(D7S1 and D8S1) There are other 12 treatment combinations resulting in intermediate net plot sizes Each of the 16 treatment combinations is indicated above
Leucaena diversifolia was planted in October 1988 and each seedling was given one tablespoon of di-ammoniumphosphate (DAP) at planting equivalent to 45 g of N and 15 g of P205 per plant Due to the different hedge designs and tree and crop planting densities it is not possible to express the fertilizer application in terms of one standard figure in tha but all trees received the same starter dose of DAP The hedges were left to grow freely without competition from food crops in 1988 But beginning with the first (long) rainy season of 1989 maize (hybrid 512) was planted at the recommended spacing of 03 m in the row and 075 m between-rows (44444 plantsha) This first experimental maize crop received 130 kgha of DAP (60 kgha P205 and 23 kgha N) and was later top dressed with 142 kgha of CAN (37 kgha of N) Therefore the total amount of fertilizer given to maize was equivalent to 6060 kgha of N and P205 In the short rains of 1989 maize was again planted (locally selected cv Hamisi Double Cobber) but it was not fertilized
Hedges were cut to a standard height of 05 m in March 1989 five months after they were planted Subsequent cuttings were carried out at 2 to 3 months interval and synchronized with the needs of the food crop component to reduce competition for light and moisture at the critical growth periods At each cutting the entire 5 m hedgerows were harvested During the first harvest the cut material was separated into leaves and stem wood All material was then weighed and the leafy biomass incorporated in the plots In subsequent harvests the cut material which consisted primarily of leaves on young coppice shoots was weighed as one product It was placed between the four rows of experimental maize on either side of the hedge
443 Site description
This experiment is situated directly south and east of experiment 3 within the same enclosure that was previously used as pasture for several years The site characteristics for both experiments are similar Although no soil samples were taken at the start of experiment 5 in October 1988 it is reasonable to assume that the same soil conditions prevail in general in both experiments The initial chemical soil analytical data from experiment 3 may therefore serve as a reference for experiment 5 when it was started in October 1988
37
444 Resuas and discussion
4441 Trees
Survival pests and diseases
The Leucaenadiversifoliagrew well in this climate establishment was near 100 and there were no noticeable problems of stand mortality or pests and diseases during the first one and a half years after planting
Initial height and root collar diameter increment
At harvest in February 1989 the trees measured on average 17 m and the root collar diameter was 21 cm This provenance of Leucaena diversifolia grew on average 32 cmmonth despite the fact that it was planted late in the second (short) rainy season of1988 It is important to note that the trees received more than 1000 mm of rainfall between planting and harvest compared to 937 mm which fell during the first (usuallycalled long) rainy season of 1988 (April to August) The trees were already harvested 45 months after planting because it was felt necessary to start the experiment with hedges and food crops during the first rains of 1989 This very early harvest apparently did not influence the subsequent hedge productivity negatively although the average root collar diameter of the hedges was initially smaller (see data experiments 1 amp 3) than in other alley cropping exptriments in Maseno
Biomass productivity
In Table 19 the cumulative fresh leafy biomass yield per meter of hedge is given for different treatments It is observed that the marginal biomass increase diminished withincrease in population andor rows within the hedge pointing towards increasing withinand between hedgerow competition when the hedge design becomes more complicated
The results of biomass productivity data from 1989 permit to make interesting comparisonsbetween the various hedge designs The different hedge designs can be grouped into densely populated (D1 D4 D7) versus sparsely planted (D2 D3 D5 D6 D8) hedgerows
For hedges with wide spacing a further comparison can be made between hedges with closely spaced hedge lines (D3 D6) against those with widely planted hedge lines (D5D8) (D2 does not fit in this latter comparison because it consists of only one hedge line)
Based on the individual hedge biomass yields from five cuttings in 1989 significantdifferences in biomass productivity were found between treatments at each cutting (P lt001)
Analyzing the total hedge biomass yield or 1989 (last column) the following is observed For hedges with an in-row plant spacing of 025 m and hedge lines 05 m apart (D1 D4D7) adding another hedge line (two line hedge vs single line hedge) led to a yield
38
increase of 54 (D4S1) to 65 (D4S2) Adding another line of hedgu_ (three line hedg( vs two line hedge) gave an additional yield increase of 23 (D7S1) and 30 (D7S2) Th(overall yield increase from D1 to D7 was 90 in treatments where the first maize waplanted at 07 m from the hedge (Si) and 114 in treatments where the first maize wa planted at 0375 m from the hedge It should be realized that these three line hedg(treatments (D7) have three times the number of plants of D1 treatments but yield increast was only of the order of 100
Table 19 Biomass yield of Leucaenadiversifolia in eight different hedge designs associatec with food crops planted close to the hedge (first line at 375 cm) and away frorr the hedge (first line at 75 cm)
Fresh Biomass Yield (kgm hedge)Hedge Date Total Design Feb89 Apr89 Jun89 Oct89 Dec89 1989
DIS1 142 036 261 179 129 747 D1S2 138 036 201 156 100 631 D2S1 117 040 182 129 101 569D2S2 113 040 177 125 089 544 D3S1 142 036 260 167 145 750 D3S2 182 036 212 148 118 696 D4S1 272 058 339 274 208 1151 D4S2 258 058 289 241 192 1038 D5S1 182 036 319 228 101 866 D5S2 188 036 274 219 163 880 D6S1 196 059 319 323 169 982 D6S2 196 059 317 209 159 940 D7S1 235 053 529 368 233 1418 D7S2 265 453053 339 239 1349 D8S1 226 059 421 268 201 1175 D8S2 254 059 409 297 188 1207
MEAN 194 047 310 224 158 934 SED 024 005 030039 018 CV() 151 118 154 163 133
For hedges with an in-row spacing of 05 m and hedge lines spaces i 025 m apart (D2D3 D6) adding one extra hedge line increases productivity with 32 (D3S1) and 28(D3S2) respectively Adding another line to D3 treatments gives an additional yield of 31 (D6S1) and 35 (D6S2) respectively The productivity increased by 73 from D2 to D6 This is achieved by a three times the plant population of D2 The conclusion earlier drawn regarding diminishing marginal biomass returns on adding hedge lines in comparable designs is again valid
39
Another comparison can be made between D2 D5 and D8 whereby one and two hedgelines are added respectively but with 05 m between the hedge lines Except for different in-row spacings this comparison is similar to the comparisons made for DI D4 and D7 treatments The increase in biomass when one line is added is 52 (D5S1) and 62 (D5S2) respectively Adding a third line to the hedge gives 36 (D8S1) and 37 (D8S2) extra yield compared to the D6 treatments The average total yield increase from D2 toD8 is 107 (D8SI) and 122 (D8S2) respectively The conclusion that within similar hedge designs a 100 yield increase can be achieved by establishing three times the number of plants is again confirmed
It is also worth comparing D5 with D3 and D6 with D8 in order to estimate the competition effects and resultant yield losses when hedges are placed close together at 025 m between row spacing rather than further apart at 05 m Comparing D3 with D5 it is found that placing the hedges closer together (D3S1 and D3S2) leads to a 15 loss in biomass yield A similar comparison for the triple hedges gave 16 (D6S1) and 22 (D6S2) yield losses compared to double hedges of equal design (D8)
In Table 20 the cumulative biomass yield for different hedge designs are compared with the basic hedge design of a single line with individual plants spaced at 05 m (D2S2) Itis observed that a maximum yield increase of 161 (or 26 x the basic yield) was achieved in a design which had six times the number of plants of the basic hedge design
It is further noted that the cumulative (1989) biomass productivity of hedges with the first maize row planted close to the hedge was on average 5 lower than the productivity of the hedges where the first row of maize was planted at 075 m The difference in biomass productivity ranged from -155 in D1S2 compared to D1S1 to +27 in D8S2 versus D8S1
40
Table 20 Cumulative biomass yield (Feb-Dec 1989) for different hedge designs of Leucaena diversifolia hedges in an alley cropping experiment (kgm)
Hedge P1m Fresh Yield Incr Yield Land allocation Type Yield over D2S2 Ranking in each treatmej
(highlow) Crop Hedge
D2S1 2 569 + 5 15 89 11 D2S2 2 544 --- 16 100 0 D1S1 4 747 + 37 12 89 11 D1S2 4 631 + 16 14 100 0 D3S1 4 750 + 38 11 86 14 D3S2 4 696 + 28 13 96 4 D5S1 4 866 + 59 10 83 17 D5S2 4 880 + 62 9 92 8 D6S1 5 982 + 81 7 83 17 D6S2 5 940 + 73 8 92 8 D8S1 5 1175 +116 4 77 23 D8S2 5 1207 +122 3 86 14 D4S1 8 1151 +112 5 83 17 D4S2 8 1038 + 91 6 92 8 D7S1 12 1418 +161 1 77 23 D7S2 12 1349 + 148 2 86 bull 14
Although the conclusions presented are preliminary because they are only based on 1989 data the indications about proper hedge design from this experiment are rather clear and can be summarized as follows
- Doubling the in-row plant population does not lead to proportional increases in biomass production For example in Dl-designs the increase in productivity compared to D2-designs is only 20
- Adding one or two additional hedge lines to an existing design leads in most designs to significant biomass yield increase(s) However the relationship is not linear due to increased between-row competition in the multi-line hedges
- From data obtained on food crop yields it is evident that the land loss resulting from establishing more complicated and wider hedge designs are so far not compensated for by proportional food crop yield increases associated with the higher amounts of Leucaena mulch applied in these plots
41
4442 Crops
Crop yields
The maize yield data for the first (long) rainy season of 1989 were gathered in such a waythat a comparison could be made between the mean grain yield of the first pair of rows on either side of the hedge against the mean grain yield of the three subsequent maize row pairs lying further away from the hedge In Table 21 the average dry grain yield (kgplot)and maize yields converted to tha taking into account the differences in plot sizes between treatments are summarized The yields obtained during the first rainy season of 1989 (1000 mm) were high and ranged from 568 - 790 tha These generally high yieldsin the first experimental cropping season are explained by three factors Approximatelysix months before cropping started the experimental site was ploughed out of relativelyfertile pasture land Secondly the maize crop was fertilized uniformly with 6060 kghaof N and P0 5 Thirdly appreciable amounts of Nitrogen-rich green manure from the hedges were applied to the plots shortly before the food crop was sown (Avg 284 thafresh leafy mulch equal to 071 tha dry matter equal to 25 kgha N) In none of the 16 treatments could a significant difference be detected between maize grain yield between the first line next to the hedge and the average of the three subsequent lines on both sides of the hedge
When differences in maize grain yield are expressed on a tha basis they take into account the differences in land occupied by the hedge The land loss ranges from 0 - 23 It is observed that hedge designs (DIS2 and D2S2) that did not take up any of the landnormally used by the crop yielded more maize than treatments where the hedge took up a substantial portion of the land (D7S1 and D8S1) The relationship between land lossdue to hedge type and maize yield loss was found to be as follows A land loss of 4 gave a yield loss of 24 Subsequent land loss yield loss ratios were 8 - 27 11 shy130 14 - 163 17 - 92 and 23 - 200
Therefore the higher amounts of mulch applied from multiple line andor high densityhedges did not have any significant positive effect on grain yield so far In fact the reverse happened grain yield was almost uniform throughout the experiment leading to decreased yields on tha basis in treatments with wide hedges
The results obtained during the second (short) rainy season of 1989 indicate the substantial decline in maize yield in the experiment as a whole when a local maize cultivar (HDC) was used without addition of any artificial fertilizers combined with a lower level of rainfall (Sept-Dec 1989 685 mm) Maize yield dropped to the level of 25 to 36 thaThe differences in yield between individual lines of maize planted closer or further awayfrom the tree hedges were not significant To appreciate the data presented it is important to note that the quality of the food crop was generally poor and it is reasonable to assume that treatment differences were masked to a large extend by external factorssuch as the maize seed source lack of any external inputs (fertilizer) and a lower amount of rainfall than usual
42
-- --
Table 21 Maize grain yield (13 mc) first (long) and second (short) rainy season of1989 associated with sixteen different hedge designs of Leucaena diversifolia
First rains 1989 Second rains 1989
Hedge P1m Land allocation Mean grain yield Typ e ratio ---------------------------------------------------------------
Crop Hedge (kgline) (tha) (kgline) (tha)
D1S1 4 89 11 257 609 118 281 D1S2 4 100 0 278 741 136 363 D2S1 2 89 11 293 695 130 308D2S2 2 100 bull 0 286 763 127 338 D3S1 4 86 14 276 631 131 300D3S2 4 96 4 288 737 137 350 D4S1 8 83 17 332 733 147 324 D4S2 8 92 8 296 729 126 311 D5S1 4 83 17 286 631 127 280 D5S2 4 92 8 275 677 136 335 D6S1 5 83 17 307 678 138 305 D6S2 5 92 8 321 790 127 314 D7S1 12 77 23 309 638 123 255 D7S2 12 86 14 251 574 128 293 D8S1 5 77 23 275 568 128 264 D8S2 5 86 14 300 686 156 357
MEAN 289 680 132 311 SED 035 -- 019 --CV (maize rows) 110 201
43
5 FODDER PRODUCTION TRIALS
51 Justification
The natural fodder supply in many highland landuse systems is usually inadequate in quantity and quality particularly during the dry seasons Farmers interested in improvingtheir fodder supply have addressed the problem by planting grasses such as Pennisetun purpureunt (Napier grass) either as a fodder bank or on terrace bunds Although this has improved the fodder situation protein shortages in livestock diets are still experiencedsince most grasses drop in nutritional value during the dry season The introduction of a woody perennial to provide supplementary protein rich fodder is therefore beingexamined Two experiments have been established to address these fodder production and quality related problems In the first experiment the reative productivity of different treegrass combinations planted on contour bunds is studied In the second experimentthe productivity of Leucaena hedges when managed at different cutting heights for fodder production in an alley cropping system is studied In both experiments the effect of the tree andor grass component on the productivity of the companion food crops is also monitored
52 Combination of grasses and tree hedges on field bunds for fodder production
521 Objectives
- to determine the fodder yields of Pennisetumpurpureum Leucaena leucocephalaSesbania sesban and Calliandra calothyrsus planted on terrace bunds in pure arrangements and in tree-grass mixtures
- to determine the effect of the different treatment combinations on the performance of the companion food crops
522 Experimental design and methodology
The following treatments were included in the experiment
TREATMENT TREEGRASS SPECIES ORIGINPROVENANCE
TI Leucaena leucocephala Melinda Belize T2 T3
Sesbania sesban Calliandra calothyrsus
Kakamega Kenya Guatemala
T4 T5
Pennisetum purpureum Leucaena + Pennisetum
Vet Farm Maseno ---
T6 Sesbania + Pennisetum ---T7 Calliandra + Pennisetum --shy
44
The experiment was laid out as a complete randomized block design with four replicatesEach treatment consisted of a 4 m long and 1 m wide section of the bund and a food cropterrace below and above the bund Within each half food crop plot a minimum of two rows of experimental maize next to the bund were studied The total experimental plotsize therefore consisted of a field bund of 1 x 4 m and two food crop terraces of 15 x 4 m each The total net plot size is 16 M2 of which 25 is bund area and 75 is croppingarea Each bund section had two parallel lines of trees andor grass The two lines were05 m apart and the within-row spacing for trees was 025 m Frees andor grasses wereplanted in staggered lines in order to increase the effectiveness of the planted combination on the bund against soil erosion Trees received 25 g of DAP at planting time equivalentto 45 g of N and 115 g of P2O5 The pure tree treatments (T1-T3) and the grass in the pure grass (T4) treatment were established in April 1988 together with the tree componentin the mixed treatments (T5-T7) The grass in the mixed treatments was establishedbetween August and November 1988 Trees were managed as hedges and cut back to 05 m Cutting frequency and timing of cutting between treatments initially (between August1988 and January 1989) varied depending on the coppice growth With effect from April1989 all treatments were cut at the same date and this was carried out at least twice everygrowing season at the time of sowing the food crop and around two months later Four crops were grown since the start of the trial ie beans in the first and second seasons of1988 maize (hybrid 512) and beans intercropped in the first season of 1989 and a locallyselected composite maize (cv HDC) in the second season of 1989 Fertilizer was appliedto the bean crops in 1988 at a rate of 100 kgha of DAP The intercrop during the firstrainy season of 1989 was fertilized with 130 kgha of DAP at planting time and top dressedwith 142 kgha of CAN equivalent to 6060 kgha of N and P20 The maize in the short rainy season of 1989 (cv HDC) was not fertilized
523 Site description
The experimental site was initially covered with small bushes and couch grass Contourbunds of 30 cm high and 1 m wide were physically constructed simulating the existingfarmers practice locally known as fanya juu The dug out soil from ditches was used tolevel the terraces between the bunds The minimum terrace width between bunds was 4 m Soils vary from clay loam to sandy clay with a depth exceeding 15 m The colour isreddish brown The slope was about 5 and it is tilted both in north-south and west-eastdirection The soil is strongly acid with pH (in water) of 49
At the start of the experiment in April 1988 soil samples were taken and analyzed for the following chemical components
Average soil pH (in CaCI2 125 ratio) 442 Organic Carbon () 093 Total available Nitingen (N) () 011 Phosphorus (P) (by Bray no2 method) (not yet available)Sodium (Na) (me100 g) 067 Potassium (K) (me100 g) 071
45
524 Resuls and discussion
5241 Trees andgrass
Tree survival
Leucaena leucocephalashowed less than 2 mortality after receiving six cuttings between December 1988 and January 1990 Both in the mixed and pure treatments Sesbania sesban showed 100 mortality after receiving seven cuttings between September 1988 and January 1990 Stand mortality of Calliandracalothyrsusreached about 10 after 7 cuttingsbetween October 1988 and January 1990
Pests and diseases
Sesbania sesban was defoliated by the larvae of the Mesoplatys ochroptera beetle especiallyduring hot dry spells There was a slight termite attack on Calliandracalothyrsus mostlyin the form of root collar girdling and subsequent wilting of the young seedlings
Initial tree height and root collar increments
Table 22 indicates that Sesbania sesban displayed the fastest height and root collar diameter growth from planting until first cutting followed by Calliandra calothyrsus and Leucaena leucocephala It is interesting to note that five months after planting the pure(two line) treatments (T1-T3) which experienced between-line competition from the planting day onwards were on average between 7 (Calliandracalothyrsus) and 25 (Leucaena leucocephala) lower in height than the single tree line treatments which grewfree of any competition from their adjacent grass line during the same 5 months period(rom April to August 1988 The height of Sesbania sesban in double line planting was reduced by 13 When Leucaena leucocephala was cut after eight months and the mixed treatment had grown together with grass for three months the difference in final heightbetween pure and mixed treatments was marginal These findings indicate that there is a considerable amount of between row competition during the establishment phase of double hedgerows of trees on bunds However some hedge species (Calliandra) appear to cope better with initial between row competition than others (Leucaena)
46
Table 22 Tree height and root collar diameter increment (cm) between planting and first cutting for Leucaena leucocephalaSesbania sesban and Calliandracalothyrsusplanted on field bunds in pure lines and in mixture with Pennisetumpurpureum
Assessment date at Treatment 5 months 6 months 8 months
Ht RCD Ht RCD Ht RCD
Leucaena leucocephala 84 12 100 14 151 20 Sesbania sesban 231 26 - - shy -Calliandra calothyrsus 161 15 189 19 - -Leucaena + Pennisetum 112 15 122 18 155 23 Sesbania + Pennisetum 263 33 - - shy-Calliandra + Pennisetum 172 17 196 22 - -
MEAN 171 20 152 18 153 22
5242 Crops
Biomass from fodder on bunds
The biomass produced by different tree species planted in double lines grass double linesand the different treegrass combinations is summarized in Table 23
In order to be able to make a fair comparison between the different alternatives the biomass productivity is expressed in kgm for the upper and lower line on each bund section separately
The biomass production is divided into two distinct periods the initial formation stage of the different components on the bunds and the uniform production stage in 1989 The first period runs from August 1988 up to January 1989 and the second stage started in April 1989 and is still ongoing
The highest production in the initial stage was achieved by the pure Napier grasstreatment The average productivity per line was 175 kgm The upper bund section was somewhat more productive than the lower section (+- 11 from the mean)
An interesting finding during the same initial period was that the total biomass productionfrom double lines of Leucaena and Sesbania were equal to the single line of the same species which had grown largely free of competition from the companion Napier grassduring most of the initial establishment period Napier in combination treatments was planted only in August-October 1989 allowing a head start for the trees in the mixed treatments The single line production of Calliandra (in mixture with Napier) was 27 lower than the double line production of Calliandra in the pure treatment
47
Table 23 Fresh Leafy biomass yield (kgm) during the initial formation stage of field bunds (august 1988-January 1989) and during the productivity of staAdard cutting (ApriL-December 1989)
Cutting No Sum Cutting No Sun Relative productivity1 2 3 4 5 6 Aug 88 7 8 9Treat Species combination 10 April- mixed treatments vsJan 89
23888 12988 Dec89 pure treatments171088 271088 81288 16189 5489 16689 20989 151189 by Line by treat
T1 Leucaena - upslope 14 14 20 11 10 06 47 1I Leucaena - downslope 13 13 20 11 10 06 47 100 100 T2 Sesbania - upsLope 17 - 14 31 22 15 03 03 43 1Sesbania - downsLope 17 - 13 27 22 17 03 03 45 100) 100 T3 CaLLiandra - upstope 10 15 25- 17 13 14 11 58 1I CatLiandra - downstope 10 shy 14 24 17 15 15 14 61 10) 100 T4 Napier - upslope 44 - 68 83 195 88 119 86 64 357 100)Napier - downslope 32 48 - 74 154 88 106 75 64 333 100) 100 T5 Napier - uptsope shy - - 53 126 99 92 370 + 4 -46Leucaena - downsLope 28 28 42 12 17 09 80 +70 -15 T6 Napier - upslope -58 117 102 98 375 + 5 -46Sesbania - downstope 33 23 56 31 18 03 02 54 +20T7 Napier - upsLope
-39 - - 37 77 62 65 241 -33 -65
CaLtiandra - downstope 18 18 36 25 15 16 09 1 5 + 7 -45 MEAN Tree component 28 24 14 10 07 56 MEAN Grass component 17 5 65 109 85 77 335
48
These early findings clearly indicate that there is considerable competition between hedgelines of MPTs in the initial stages of hedge formation Similar tendencies were observedfor hedge lines in the experiment described in section 44 The average production of oneline of trees (all species combined) over the period of August 1988 to January 1989 wasonly 28 kgm or 16 of the initial grass production (175 kgm)
Since Aplril 1989 all treatments received uniform cutting management and were cut on a2 to 3 month cycle up to the end of 1989 The data presented in Table 23 for the periodApril-December 1989 can be analyzed at two levels ie the total combined (double line)productivity of each treatment over a standard bund length of 1 m and the comparativeproductivity of separate single line components on the bund
It was found that
The highest fresh biomass productivity was achieved again in the pure double line grasstreatment with 69 kgm of bund or on average 345 kglinem This level of productionwas significantly higher than any other combination of trees and grasses produced onbunds (P_ lt001) The upper line of grass was somewhat more productive than the lower line (+7)
The combined tree and grass biomass productivity of Leucaena-Napier and Sesbania-Napier were lower than the pure grass treatment at 45 and 429 kgm of bund These twodifferent combinations were not significantly different in productivity (P = 005)
Evidently less productive was the combination of Calliandra with Napier yielding only306 kg of fodder per metre of bund over the same period which was significantly les thanany of the other combination treatments discussed above (P lt005) It is interestingtonote that especially Napier grass seemed to suffer from the combination with CalliandraIt was 33 less productive than the mean grass productivity in the pure and combined treatments discussed above
The pure tree treatments were much less productive than the tree-grass treatments andyielded 94 88 and 119 kgm of bund for Leucaena Sesbania and Calliandra respectivelyThe differences in productivity of pure hedge treatments were not significant (P = 005)It is further noticed that single lines of a tree species combined with Napier grass didproduce more than the expected 50 of the double tree line production in the pure treetreatments One line of Leucaena produced only 15 less than two lines of the speciesplanted together and single lines of Sesbania produced 39 less than double lines Singlelines of Calliandra produced 45 less biomass than the two lines in pure treatments Thesingle line production of Leucaena and Calliandra in combination with grass wassignificantly higher than the corresponding single line production in the pure tree treatments (P lt005)
1lhese preliminary findings indicate that a hedgerow is better combined with a row ofPennisetum than with another hedgerow of the same species The same is true for thegrass with the exception of Calliandra To determine best combination requires further
49
analysis of the nutritive content of each of these combinations Such nutritive values should then be checked against the farmers requirements especially during the dry seasons
Two points are important in the interpretation of the results First of all tree-grasscombinations did very well as far as the trees were concerned because they received aninitial4-5 months head start and were strong and tall by the time the grass was established in the companion line In fact it was initially difficult to establish the grass under the (uncut) tree cover
Sesbania sesban died in the second half of 1989 because it does not withstand the repeatedcutting back that is practised in this fodder production system Therefore it is not a viable fodder production proposition if the system is to function for more than 1 years Thisleaves the Leucaena-Napier combination as most promising in terms of overall combined biomass productivity
Cropelds
It has been-very difficult to obtain crop yield data from this experiment reflectingdifferences in treatment factors First of all some crops failed due to a combination of soil and rainfall conditions and secondly maize crop yields harvested in 1989 were found to be strongly influenced by site variability within the blocks
53 Effect of cutting height of Leucaena hedgerows on biomass productivity and food crop
yields in alley cropping
31 Objectives
- to study the effect of different cutting heights on the biomass production of hedgerows of Leucaena leucocephala
to study the effect of hedge height on the yield of the main food crop (Zea mays) grown in the alleys
532 ampaperimental design and methodology
The study evaluated five cutting heights (01 03 05 07 and 09 m) of hedges of Leucaena leucocephala (Origin Melinda Forest StationMelinda Belize) a promising species foralley cropping at 1500 m altitude on acid leached soils in the bimodal highlands of EastAfrica The statistical design of the study was a randomized complete block with five replications The plot size was 35 x 50 m with one row of Leucaena in the centre of theplot and two rows of maize on either side of the hedge at a between-row spacing of 075 m and in-row spacing of 03 m (44444 maize plantsha) Leucaena was planted in eastshywest direction across the slope (lt3) in april 1988 at 025 m in the row and 35 mbetween the rows (14430 treesha) A starter dose of 25 g of DAP per tree was appliedequivalent to 65 kgha of N and 166 kgha of P205 The annual food crop in the first two
50
rainy seasons (1988) was beans (GLP-2 Roscoco) It was maize (hybrid 512) intercroppedwith beans (GPL-2) in the first (long rainy) season of 1989 and it was maize (local cvHDC) in the second (short rainy) season of 1989 Beans were fertilized with 100 kghaof DAP at the time of planting Only maize in the long rains of 1989 was fertilized with130 kgha of DAP and top dressed with 142 kgha of CAN giving a total of 60 kgha ofP205 a d N The local maize cultivar grown in the second rainy season of 1989 was not fertilized
The Leucaena hedges were first cut back in November 1988 to the different managementheights about 75 months after planting when Leucaena was 25 to 30 m tall and the rootcollar diameter was 25 to 30 cm thick Subsequent cuttings were carried out at 2 to 3months interval and synchronized to reduce light and moisture competition to theassociated food crop Thus the hedges were cut shortly before sowing the food crop andagain eight weeks later At each cutting the entire row was harvested and the sidebranches were trimmed to keep hedge width to about 05 m During the initial and secondharvest the material was divided into leaves twigs and stem wood (only at the firstcutting) All material was then weighed fresh and removed from the plot
533 Sitj description
The experiment is located wihin the same area as experiment 1 (MPTs species screeningfor alley cropping) and the site description given previously applies also to the currentlydiscussed experiment The site was a relatively flat (lt2 slope) sandy area with impededdrainage and poor soil fertility especially in respect of phosphorus The soil pH (in water)was 50 - 52 in early 1988 At the start of the experiment in April 1988 soil samples weretaken and analyzed for the following chemical components
Average soil pH (in CaCI2 125 ratio) 457 Organic Carbon ()068Total available Nitrogen ()010Phosphorus (P)(Bray no21)(ppm) (not yet available)
534 Results and discussion
5341 Trees
Leucaenamp e-tablished well and grew vigorously in this climate There have been nonoticeable probiems of stand mortality or pests and diseases so far At first harvesthighest wood yield (26 kgm of hedge) was realized when the hedges were cut back toground level Cutting at 09 m above ground level yielded 14 kgm of stem wood (Table25) These initial fresh yields are equal to 74 tha and 40 tha of firewood or stakesrespectively if hedges are planted 35 m apart Leaf and small twig biomass yields werenot significantly different between treatments for the initial harvest in November 1988The coppice regrowth during the first dry period from November 1988 to February 1989did not show significant differences between treatments although the trend was towardsthe higher yields with increase in cutting heights It seems that during the first three
51
months after initial cutting the difference in production potential could not yet come outconvincingly perhaps due to drought stress As of the first (long rainy) season of 1989significant differences in leafy biomass production were detected (P lt 0001) in three outof four cuttings (Table 25) The preliminary conclusion is therefore that hedges cut athigher cutting heights produce significantly more leafy biomass then hedges cut at lowercutting heights if moisture is not a growth limiting factor
52
- - - -
Table 24 Fresh biomass yield in 1988 (initial) and 1989 (uniform cuttings) of Leucaena leucocephalahedges managed at five different cutting heights in an alleycropping system
Fresh Biomass Yield (kgm of hedge)Cut Ht Nov88 Feb Apr Jun Sept Nov Total
8889
01-If 31 19 13 05 06 08 82 -tw 11 13 - - - - 24 -wd 26 13 shy - - - 39
03-If 30 24 15 07 09 12 97 -tw 11 17 27-wd 21 21
05-If 31 25 17 07 09 13 102 -tw 12 16 28-wd 17 17
07-If 28 24 17 08 10 15 102 -tw 09 16 - - - - 25 -wd 13 13
09-If 35 2130 10 13 17 126 -tw 13 19 32 -wd 14 14
MEAN -leaves 31 1724 07 09 13 102 -twigs 11 16 27 -wood 18 21
SED -leaves 042 037 012 007 017 008 shy-twigs 020 025 - - shy- --wood 042 - -
CV -leaves 211 238 119 145 279 101 shy-twigs 274 244 - - shy- --wood 370 - - - shy - -
note If = leaves tw = twigs wd = stem wood
53
5342 Crops
The effect of hedge cutting height on the companion food crop(s) is equally important in choosing a particular hedge height for an alley cropping system The bean crop plantedin both seasons in 1988 and as intercrop under maize in the first rainy season of 1989 failed due to high rainfall early in the season and poor site drainage It should be noted that hedge biomass was removed as fodder for livestock and manure was not returned to the plots As-a result rapid nutrient depletion and loss of soil structure is expected which might have affected food crop yields
Maize yields averaged 27 tha in the first (long) rains of 1989 and 31 tha in the second (short) rains (Table 26) Treatment differences were not significant indicating that cuttingheights between 01 and 09 m did not have any influence on the associated maize cropHowever low initial soil fertility status rapid site fertility depletion and consequent low maize yields may have masked treatment differences The coefficient of variation (CV) was exceptionally high in both seasons 55 and 38 respectively
Table 25 Maize grain yield (13 mc) cropped in alley of Leucaena leucocephalahedges managed at five different cutting heights (m)
Maize yield (tha) long rains short rains
1989 1989
Cutting Height (m) 01 307 297 03 198 290 05 270 304 07 309 321 09 267 340
MEAN 27 31 SED 0942 0746 CV () 551 380
54
6 NON EXPERIMENTAL ACTIVITIES
The AFRENA project in Maseno is involved in many non experimental activities The staff members at the research station have developed close links with the local communityand officials Many farmers teachers and their students government officers and scientists from the region as well as from elsewhere have visited the station Such visits serve as good occasions of interaction with potential users of the agroforestry technologiesdevelopel on the station The comments received from farmers scientists and other visitors have been taken particularly seriously because they form the input to new research ideas and may lead to amendments in the on-going work The Agroforestry Research Centre activities are valued by the community because of their contribution to solvingpressing land-use problems in the region the demonstration function of the trials and the employment opportunities they have created for many people in the area As such the Centre and the project have had an impact on the local understanding of land-use issues and the potential of agroforestry
55
REFERENCES
Hoekstra DA Summary of zonal agroforestry potentials and research across land-use systems in the highlands of Eastern and Central Africa AFRENA Report no15 ICRAF 1988
Minae S and Akyeampong E (Eds) Agroforestry potentials for the land-use systems inthe bimodal highlands of Eastern Africa Kenya AFRENA Report no3 pp153ICRAF 1988
Kang BT Wilson GF and Sipkens L (1981) Alley cropping maize (Zea ys L) andLeucaena (Leucaena leucocephala Lam) in southern Nigeria Plant Soil 63 165-179
Jaetzold R Schmidt H Farm management handbook of Kenya Vol IIa 1982 Ministryof Agriculture Kenya in cooperation with GAT and GTZ
Jaetzold R Kutch H Agro-ecological zones of the tropics with a sample from KenyaDer Tropenlandwirt 83 Jahrgang April 1982 pp 15-34
56
Annex 1 Staff List AFRENA on-station project (Maseno)
Staff
Scientific staff Mr JHO Otieno BScMSc Forestry
Mr EK Mengich BSc Forestry
Dr AD Olang PhD Agronomy
Mr AM Heineman BA social Science MBA Management Science MSc Forestry
Administrative SecretaryMr S Juma
Field Technicians Mr M Odongo Mr H Wandabwa Mr M Ngethe Mr R Cheruiyot
Nursery foreman Mr J Owalo
Storekeeper Mr 1 Ogutu
Driver Mr J Ngala
TypistReceptionistMr CO Apondi
Tea ladyCleaner Ms J Kisanya Mrs H Mohamed
Office messengercleaner Mr T Odhiambo
Other staff Mr W Ochieng Mr G Ouma
InstitutePosition Joined
KEFRI - scientists Feb-Aug 1988 KEFRI-KARI-ICRAF Agroforestry Research Centre Director and Nov 1989 on-station project team leader
KEFRI - scientist Sept 1989
KARI - scientists July 1988 (on-station project team leader July 1988-Oct 1989)
ICRAF - associate scientist Nov 1987 (Dutch Government funded)
KEFRI Oct 1989
KEFRI April 1988 KEFRI Aug 1988 KEFRI May 1989 KEFRI June 1989
KEFRI Nov 1988
KEFRI Nov 1988
KEFRI April 1988
KEFRI June 1989
KEFRI June 1989 KEFRI June 1989
KEFRI June 1989
KEFRI June 1989 KEFRI June 1989
12
Annex 2 Experiment 10 Species list treatment allocation and seed supply institution for
Leucaena and Calliandra speciesprovenances general screening trial
Treatment MPTS Species and seed source
TI Leucaena leucocephala (Hengchun China)
Leucaena leucocephala (K8) Baobab Farm Mombasa Gen Coll
T3 LeLcaena leucocephala (K28) (as T2)
T4 Leucaena leucocephala (K636)
(Coahuila Mexico)
T5 TLeucaena leucocephala (14198)
T6 Leucaena diversifolia (K156) (Vera Cruz Mexico)
T7 Leucaena diversifolia (14193)
T8 Leucaena revoluta (14201)
I9 Leucaena paniculata (14203)
I0 Calliandra calothyrsus (CC-094-002-88) Patullil Guatemala
Seed supplying institution
Seed harvested in Exp3 in 1989
KEFRIKFSC
KEFRIKFSC
KEFRIKFSC
ILCAEthiopia
KEFRIKFSC
ILCAEthiopia
ILCAEthiopia
ILCAEthiopia
KEFRIKFSC
58
Annex 3 The mean height and root collar diameter growth (cm) of different provenances
of Leucaena leucocephalaat 14 months after planting
Treatment Provenance Mean height Mean RCD
Leucaena leucocephala Kibwezi Kenya 3418 737 Leucaena leucocephala Hawaii 3844 823 Leucaena leucocephala Melinda Belize 3471 730 Leucaena leucocephala Hengchun China 3650 782 Leucaena leucocephala Yimbo Siaya Kenya 3263 648
Grand Mean 3529 744 SED 1317 0268 CV (plot) 46 44
(tree) 101 113
Annex 4 The mean height and root collar diameter growth (cm) of different provenances of Gliricidiasepium at 14 months after planting
Treatment Provenance Mean height Mean RC
Gliricidia sepium Guatemala 2662 759 Gliricidia sepium Santa Cruz Costa Rica 2180 659 Gliricidia sepium Columbia 2666 816 Gliricidia sepium Monterrico Taxisco Guatemala 2390 843 Gliricidia sepium Chiquimala Guatemala 2733 648 Gliricidia sepium Guyatenago Guatemala 3080 812
Grand Mean 2619 771 SED 2139 0375 CV (plot) 100 60
(tree) 176 138
59
Annex 5 The mean height and root collar diameter growth (cm) of different provenances
of Calliandra calothyrsus at 14 months after planting
Treatment Provenance Mean height Mean RCD
Calliandra calothyrsus Guatemala 4418 908
Calliandra calothyrsus Kibuye Rwanda 4068 815
Calliandra calothyrsus Arboretum de Ruhande Rwanda 4272 880
Grand Mean SED CV (plots)
(trees)
4253 1767 51
123
868 1062
150 175
Annex 6 The mean height and root collar diameter growth (cm) of different provenances of Sesbaniasesban at 14 months after planting
Treatment Provenance Mean height Mean RCD
Sesbania sesban Kakamega Kenya 4978 862
Sesbania sesban Mukururiati Kenya 5001 951
Sesbania sesban Kiambu Kenya 3393 534
Grand Mean 4458 782SED 2724 0891CV (plot) 75 140
(tree) 125 211
60
Annu 7 The mean height and root collar diameter growth (cm) of two provenancesof Cassiasiamea and one provenance of Cassiaspectabilis at 14 months after planting
4eatment Provenance Mean height Mean RCD
Cassia spectabilis Bugarama Rwanda 4189 903
Cassia siamea Bugarama Rwanda 2846 658
Cassia siamea Kwale Kenya 2534 585
Grand Mean 3190 716 SED 251 042 CV (plot) 96 72
(tree) 125 100
61
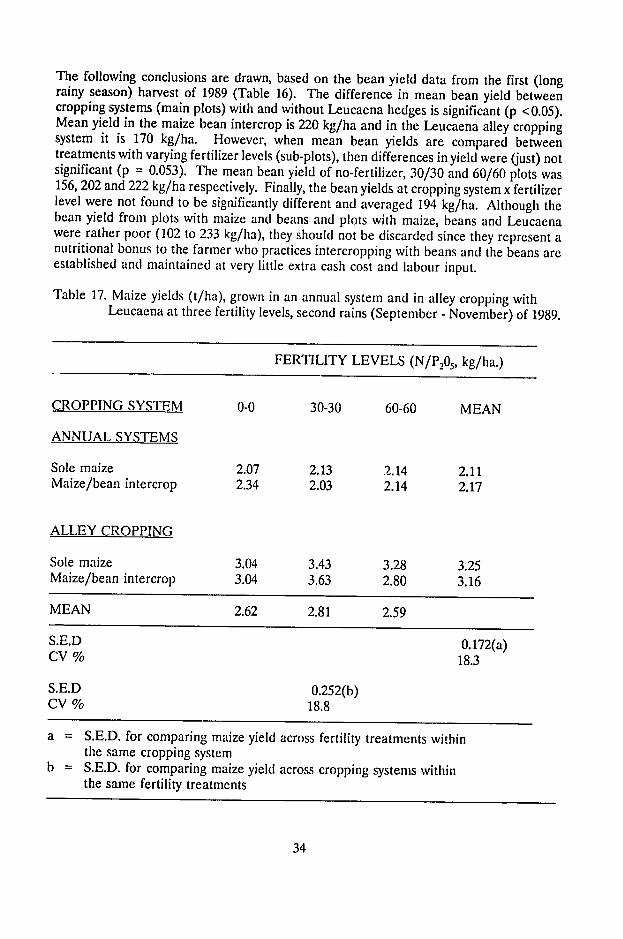