Embed Size (px)
Citation preview

1
Acknowledgements
Firstly, we would like to thank Jacqui Mackay and the Banana Link team for their support
and advice during all stages of the project.
We are very grateful to the Fako Agricultural Workers Union (FAWU) for their daily
support as well their kindness and hospitality. Special thanks go to Charles Mbide for
helping to organise this programme, as well as Samuel Arrey, who coordinated closely
with Cameroon Development Corporation (CDC) and who accompanied us to the
plantations.
We would also like to thank the CDC for granting us admission to their plantations and
for allowing us to conduct our research freely.
Finally we would very much like to thank the workers that we interviewed, without whom
this report would not have been possible. We hope that continued cooperation between
CDC and FAWU will result in tangible improvements in the working conditions of all
employees in the banana plantations in the years to come.

2
EXECUTIVE SUMMARY
This research has been enabled by the close partnership that Banana Link has with the
Fako Agricultural Workers Union (FAWU) which represents workers in agro-industry,
including banana production, in the Fako region of South West Cameroon. The research
was conducted in September 2015 and is representative of the working conditions of
employees at 11 banana plantations owned and operated by the Cameroon Development
Corporation (CDC). CDC is the largest private employer in the country and has significant
influence on the economy of the Fako region where they employ 7500 workers, many in
the banana sector, Cameroon’s fifth largest export. By working closely with FAWU,
Banana Link aims for this project to ensure that the greater competition that Cameroon
faces from Central and South America in the banana export market does not lead to a
race-to-the-bottom in working conditions for banana workers in Cameroon.
Since the project’s inception, both partners have been determined to improve working
conditions from the baseline measure to a higher target measure. The key indicators to
measure the working conditions faced by banana workers are; wages and expenditure,
working hours, personal protective equipment (PPE), health, illness and injuries and union
participation.
RESEARCH FINDINGS
The majority of the 208 workers interviewed were male (57.2%). The average age was
36 and the majority (37%) were married and lived in rented accommodation (88%) with
four other people in the household, including two children. The majority (52.9%) had
completed primary level education and had worked at a CDC banana plantation for 8
years.

3
Income
46.4% of interviewees could not understand all of their payslip, the means by which
workers are informed of their monthly income. The complex wage system used by CDC
and a lack of financial education for workers have both combined to reduce the capacity
of workers to plan their expenditure around their monthly income and increase the
likelihood of financial mismanagement.
Upon being asked to estimate their monthly income, only 25% of plantation workers
earnt enough in peak season to cover expenditure on basic needs without borrowing.
However, only 3.4% of workers believed that their income was sufficient to pay for their
basic needs. The average level of expenditure exceeds that of the average value of the
highest level of income - 80,264 CFA and 62,297 CFA, respectively. 74.5% said that the
quantity of food that they were able to purchase or produce every month was insufficient
to adequately feed their family and 78.2% of the 179 interviewees who had children in
education were unable to pay the school fees or were unable to do so without financial
support or borrowing, even when fees were paid in monthly instalments.
The low wages relative to the costs of ‘basic needs’, defined as food, rent, utilities,
childcare and school fees have resulted in high levels of indebtedness. 73.6% of
interviewees were in debt in September 2015 and the financial pressures imposed by the
costs of education are a significant reason for the substantial amounts that workers have
borrowed. 62.4% said that school fees were the principle cost that they were failing to
cover.
Supervisors can deduct wages on a pro-rata basis for poor time management or low
productivity, however, workers are often unaware of the reasons for such deductions.
50% of workers reported receiving at least one pro-rata reduction in the last month, an
increase of 19% from the previous year and the average number of reductions received
in a month was 3.

4
Working hours
The workers interviewed worked six days a week, on average. However, workers were
often unable to maintain this level of attendance throughout the month due to work
related illnesses, injuries, severe body pains and fatigue. The maximum number of
working hours for a week is 48, excluding overtime, in certain cases and there is an
absolute legal ban on working more than 60 hours a week.
However, 49.5% of workers claimed to work for more than 48 hours a week. The average
number of hours worked a week in low season was 55, and the average in peak season
was 66. 21.2% of workers had worked overtime in the last year, all of whom were paid
by the hour. Workers complained of the disruption caused by the long waiting times for
CDC transport which 91% of workers rely on to travel to and from the plantations every
day.
Provision of appropriate Personal Protective Equipment (PPE)
Adequate PPE is essential to ensure that instances of work related accidents such as
equipment and chemical injuries are kept to a minimum. Without adequate protection,
such as sleeve-length gloves, safety glasses, rain boots, aprons and full body suits,
workers are at risk of sustaining a severe injury due to the demanding and potentially
hazardous work that they do. Although all of the 208 interviewees said that they need
PPE for their job, 26% had never received PPE while working at CDC and a further 43.3%
had not received PPE within the last twelve months. Only 2.9% confirmed that they had
received PPE every six months. Furthermore, the PPE that the workers receive is often of
the wrong size and poor quality which means that it is insufficiently durable for the tasks
that it is required for.
Work related accidents and illnesses
43 of the 208 workers interviewed were absent in August 2015, the month before the
research programme, due to an illness or injury. The most common causes of absences
were severe body pains, fatigue and stress which many workers have come to expect as

5
an unavoidable aspect of their occupation. One would expect the likelihood of sustaining
an illness or injury to increase with the number of hours worked in a week. Therefore,
greater adherence to the legislation could potentially reduce the number of workers that
have body pains at least once a week which currently stands at 82.7%. In addition aerial
spraying is perceived by workers to be a cause of chemical related injuries such as nail
fungi and eye infections, which become recurrent issues for workers if not treated
correctly or regularly.
Union participation
In order to improve workers’ awareness about their basic labour rights, FAWU have been
holding regular meetings and discussions at CDC banana plantations to educate workers
on issues such as financial management, health and safety and union participation. 64%
of interviewees were FAWU members, 65.3% of whom were able to name at least one
right that they had as a worker. 95.2% of interviewees knew that regular exposure to
chemicals is damaging and detrimental to their health and 95.7% said that they visit the
company medical centre when they have an illness or injury. Attendance, or awareness
of attendance of meetings remains low and more should be done to encourage workers
to attend.
In the previous years of this project, research into the banana sector in South West
Cameroon has revealed some of the significant challenges faced by banana workers on a
daily basis. The majority of workers are underpaid, overworked and at risk of serious
illness and injury as a result of very low standards in health and safety that are indicative
of a lack of concern for the welfare of workers. Unfortunately, despite the best efforts of
both parties, these trends have continued with the exception of tangible improvements
in certain areas. The researchers were encouraged by the determination of the
interviewees to improve their standard of living and to be paid in a way that their hard-
work merits and to be treated with the respect that they deserve.

6
Contents
INTRODUCTION ...................................................................................................................................... 7
PROJECT OBJECTIVES .......................................................................................................................... 8
METHODOLOGY ..................................................................................................................................... 10
RESEARCH FINDINGS ......................................................................................................................... 12
Profile of workers ............................................................................................................................. 12
Payslips and the recent National Collective Agreement .................................................... 15
Income ................................................................................................................................................. 15
Monthly expenditure ....................................................................................................................... 18
Debt and savings .............................................................................................................................. 18
Working hours ................................................................................................................................... 20
Overtime .......................................................................................................................................... 21
Transport ............................................................................................................................................. 21
Absenteeism and pro rata deductions ...................................................................................... 22
Personal Protective Equipment ................................................................................................... 22
Chemicals ............................................................................................................................................ 23
Health ................................................................................................................................................... 24
Union membership and awareness of rights ......................................................................... 25
FOCUS GROUP WITH PHP WORKERS ........................................................................................... 27
CONCLUSION ......................................................................................................................................... 30
APPENDIX 1: QUESTIONNAIRE ...................................................................................................... 34

7
INTRODUCTION
This is the third and final report of an initial three-year-long Banana Link and Fako
Agricultural Workers Union (FAWU) partnership project which aims to improve the living
and working conditions for workers on banana plantations in the Fako District in the South
West of Cameroon. The data and research findings published in this report relate solely
to the conditions found in Cameroon during the one month research programme carried
out on behalf of Banana Link. The data that follows is representative of structured
questionnaires which were completed by workers over a period of three and a half weeks
at eleven different plantations in the Fako region, in the South West of Cameroon.
As in the previous years of the project, the research findings relate solely to the working
and living conditions of employees of the Cameroon Development Corporation (CDC) at
banana plantations in the Fako region. CDC is the country’s largest agro-industrial
company and is also the largest private employer in Cameroon. Furthermore, CDC’s
banana plantations represent only one element of their operations and therefore power
is devolved to section heads and plantation managers.
Plantations-Haut-Penja (PHP), a Cameroonian subsidiary of Companie Fruitiere, a French
company, have been contacted on several occasions by Banana Link and FAWU to take
part in our research programme but they were unwilling to participate or allow us access
to their plantation. Therefore, with the exception of a summary of a focus group held in
Tiko, (page 19) the data is only representative of workers at CDC banana plantations.

8
PROJECT OBJECTIVES
The key proposed outcomes of this project in regard to banana workers in Cameroon are
as follows.
Outcome One: Educated and empowered workers and unions negotiating living wages
and improved conditions.
1. Percentage of households whose income meet basic needs to increase from a baseline
of 23% to a target of 50%.
2. Percentage of workers that are not working more than the legal maximum weekly
hours of 48 (unless they are paid overtime) to increase from a baseline of 51% to a
target of 80%.
3. Increase in number of workers given appropriate personal protective equipment (PPE)
from a baseline of 35% to a target of 75%.
4. Decrease in the number of work related accidents/illnesses reported by workers from
4.7 to 2.
5. Percentage of workers who are aware of their basic labour rights to increase from a
baseline of 25% to a target of 80%.
Outcome Two: Capacity of union built to engage in dialogue with national and
international supply chain actors.
1. Staff representatives effectively trained to undertake responsibilities including
collective bargaining.
2. Gender issues addressed in social dialogue and collective bargaining as illustrated by
gender clauses in Collective Bargaining Agreements.
3. Local partners engaged in effective dialogue with national and international fora,
notably the World Banana Forum.
Although the data presented and discussed in this report only covers the progress made
in achieving the objectives included within Outcome One and not Outcome Two, it is

9
useful to understand how the new approaches that are being adopted by FAWU to
improve their practices can positively impact on the target indicators outlined in Outcome
One.

10
METHODOLOGY
In order to obtain the optimum amount of accurate and representative quantitative data
as possible, a seven-page questionnaire comprised predominantly of closed questions,
was developed from previous years of this programme. All responses were hand-written
directly onto the questionnaires and were subsequently coded prior to data entry and
analysis. Interviews took place in the field-entrance to the pack house which enabled us
to be as close as possible to the workers without distracting them from their activities.
Workers were selected based on their availability and due to the time of year and location
in which the formal interviews were able to take place, different positions held by workers
are represented more than others. Although random sampling was used as much as
possible, as anticipated, women were oversampled to more accurately highlight any
potential gender differences in working conditions.
Furthermore, due to time restraints, questionnaires were carried out on week days
between 09:30 and 13:00. Upon arriving at the plantation, we were introduced to the
farm manager, then to the relevant overseer who would assist with the selection of
interviewees. Workers would then be invited to answer the questionnaire and were
informed that the information they gave would be anonymous. The interviews took
between 10-15 minutes to complete and when required, members of the FAWU team
assisted with translating both questions and responses. Several of the plantations were
located in close proximity to each other and were connected by one central road or mud
track. This arrangement meant that some workers worked on more than one plantation
and moved from one to another based on where their labour was needed the most. We
have tried to avoid duplicating responses and neither the researchers nor our FAWU
colleagues were aware of interviewing any workers more than once.
In total, 208 workers from 11 different CDC farms were interviewed during the research
programme. 94.7% of the interviewees were category 2 workers, of different echelons
and 5.3% of workers were category 3 workers. 83% of CDC’s work force of approximately
7,500 people in the Fako region are category 2 employees.
11
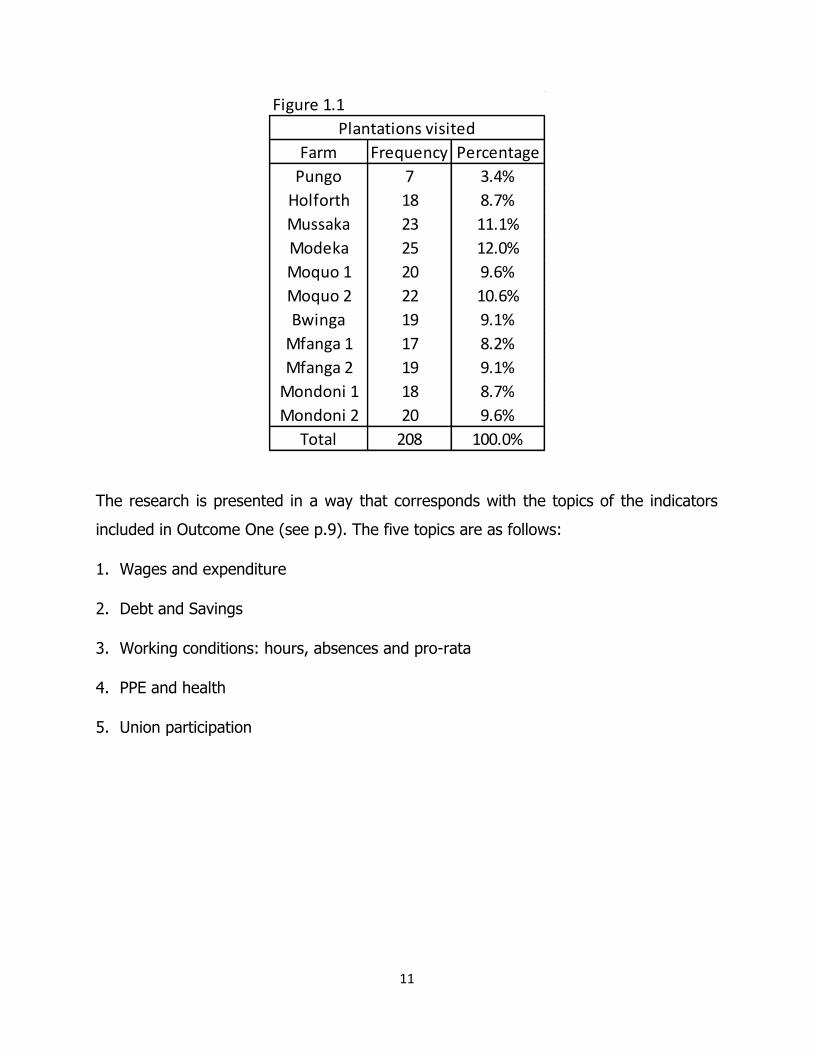
The research is presented in a way that corresponds with the topics of the indicators
included in Outcome One (see p.9). The five topics are as follows:
1. Wages and expenditure
2. Debt and Savings
3. Working conditions: hours, absences and pro-rata
4. PPE and health
5. Union participation
Farm Frequency Percentage
Pungo 7 3.4%
Holforth 18 8.7%
Mussaka 23 11.1%
Modeka 25 12.0%
Moquo 1 20 9.6%
Moquo 2 22 10.6%
Bwinga 19 9.1%
Mfanga 1 17 8.2%
Mfanga 2 19 9.1%
Mondoni 1 18 8.7%
Mondoni 2 20 9.6%
Total 208 100.0%
Plantations visited
Figure 1.1

12
RESEARCH FINDINGS
Profile of workers
Of the 208 workers interviewed, 119 (57.2%) were male and 89 (42.8%) were female.
As mentioned in the methodology, female workers were oversampled in order to gain a
greater understanding of any potential differences in working and living conditions
between the two gender groups. The average age for the workers interviewed was 36
years. The youngest interviewee was 18 years old and the eldest was 55 years old. 37%
of interviewees were married, 27.9% were single parents and 16.3% were single but
were not necessarily the sole member of a household.
88.5 percent of those interviewed lived in rented accommodation, 6.3 % lived in a site
camp, which are properties that are owned by CDC and are rented to workers free of
charge. 45.3% of workers lived in their own home or free of charge. Although 11.5% of
workers had no or irregular expenditure on rent, 96.6% of those interviewed were in
receipt of a monthly housing allowance. The average value of the housing allowance was
10,652 CFA and the largest amount was 17,000 CFA per month which was reported by a
category 3 worker. The housing allowance is supposed to equal 25% of an employee’s
monthly salary but different figures, both below and above that proportion were reported
by workers.
The average household size was 5 and the largest reported household size was 11. The
average number of minors (16 years of age or less) was 2 and the largest reported was
8 in one household. Furthermore, 85.1% of those interviewed had children, some of
whom were no longer minors. The average number of financial dependents per household
was 3.4 and the largest number of dependents supported by the income of one banana
worker was 9.
The data may indicate potential inconsistencies in the accuracy of reporting in regards to
household size and the number of dependents because despite the use of interpreters
when required, on occasion, the workers misunderstood household size as meaning
family size (including those who did not reside at the same address) and dependents in

13
the household as number of dependents, both inside and outside of the household.
Although each questionnaire was completed as diligently as possible, some misreporting
may have occurred for the reasons mentioned above.
90.9 percent of workers had received an education, of which 52.9 percent had been to
primary school, 30.3% to secondary school and 7.7 % had received an advanced or
tertiary level education. When asked as to their level of schooling, most interviewees first
replied with the highest grade that they had reached, rather than the level of education
they had attended, furthermore, many had started but not completed a level of education.
The average length of time that an interviewee had worked for CDC was 8.8 years and
the longest serving employee had been employed there for 33 years. 24.2 % of
participants had worked for 3 years or less and 49.8 % had worked for their current
employers for 6 years or less.
05
1015202530354045505560
% none % primary % secondary % advanced
Figure 2.1: Education by gender
female male

14
44
10
0
4 3 3 4 3
12
4 4 2
25
FREQ
UEN
CY
JOB TITLE
FIGURE 2.3: JOB TITLE OF INTERVIEWEES
0.5
1
20.2
24.5
7.7
7.2
33.7
5.3
100
0 10 20 30 40 50 60 70 80 90 100
2a
2b
2c
2d
2e
2f
2g
Cat 3
Total
Figure 2.2: Category and echelon
Percentage
Category

15
Payslips and the recent National Collective Agreement
Before the current situation regarding income and expenditure is examined one should
first be away of the context in which the research took place. The National Collective
Agreement on Agriculture and Related Activities (National Collective Agreement) came
into force in 2014 and increased the basic wages of agricultural workers by up to 20%.
Furthermore, the workers’ levels of financial literacy will indicate the extent to which they
are fully aware of the value of their income and expenditure.
53.4 percent of those interviewed claimed that they understood all of their payslip 30.3
percent understood some and 11.1 percent understood either very little or none of their
payslip. Only 51 percent of workers were aware that their wage had increased due to the
NCA. Furthermore, many of those who were aware of the NCA complained that they had
not received the full pay increase for their specific echelon and category. However, one
must question the accuracy of this view due to the fact that 46.6 percent of respondents
did not wholly understand their payslip. When asked, the majority were unable to state
the percentage by which their pay should have or had increased by. This finding has
implications on the levels of expenditure and informed financial management which will
be detailed in the following pages.
Income
90.9% of workers interviewed were the only income earners in the household and
therefore were solely responsible for providing the financial means with which to support
their family. 50% had a household size of between 1 and 3. 22.6% of households
consisted of 4 people which made it the most common size. 16.8% of workers either had
no children or did not live with them in their house. A small number of interviewees also
said that they had additional financial dependents that lived outside of the household,
who were therefore excluded from the statistics on the number of dependents per
household.
Workers were asked what their lowest and highest monthly income had been in the last
year, in order to provide the researchers with understanding about the potential

16
fluctuations in their income due to multiple reasons such as absences, pro-rata deductions
and the implications that these changes in income can have on financial planning.
Figure 3.1 and 3.2 are connected in that the way in which workers are rewarded for their
productivity can be an indicator of the level of income that they can receive. The majority
of the 39% of interviewees who are paid on an incentive basis are field workers, such as
harvesters and pruners who earn more than non-field workers, such as those who work
in the pack house, who are paid on an hourly basis.
Net income is the level of income after debt and savings payments have been deducted.
Although this would appear to be a more accurate measure of the finances that workers
have to fund their monthly expenditure, the uncertainty surrounding the real monthly
outgoings on savings and debt, means that this figure can potentially be more misleading
that of monthly income. Figure 3.3 presents the minimum, maximum and average values
of monthly income, monthly net income and total monthly expenditure.
53%39%
8%
Figure 3.1: Pay scheme
hourly
incentive
varies with operation

17
05,000
10,00015,00020,00025,00030,00035,00040,00045,00050,00055,00060,00065,00070,00075,00080,000
Figure 3.2: difference in monthly income by job title
Mean monthly income low Mean monthly income high
Figure 3.3: Statistics on income and average total monthly expenditure
Indicator Minimum Maximum Mean (CFA)Lowest monthly
income13,000 85,000 43,508.65
Highest monthly
income25,000 120,000 62,296.63
Net income low 21,000 115,000 30,171.49
Net income high 33,000 154,000 47,251.20
total monthly
expenditure23,000 209,500 80,264.49

18
Monthly expenditure
96.6% of workers said that their monthly salary was insufficient to cover their monthly
costs. However, after comparing their monthly expenditure with their monthly income,
75% spent more than they earnt every calendar month. The interviewees were asked to
approximate their average monthly expenditure on the following items or categories;
food, water, housing, utilities, non-food items, child care and education. Therefore, the
aforementioned statistics only provide an estimate of the income and expenditure of the
workers that participated in this study. Furthermore, one can infer from these figures that
the interviewees perceive the difference in their income and their expenditure to be
greater than the reality. On the other hand, the difference in the two figures could be
explained by the view that their current expenditure is insufficient to meet their basic
needs.
62.4% said that school fees were the principle cost that they were failing to cover while
15.3% of workers said that food was the main cost that they were failing to meet. 74.5%
said that the quantity of food that they were able to purchase or produce every month
was insufficient to adequately feed their family. Most of the respondents whose main
financial concern was sufficient food expenditure, did not have children attending nursery,
school, or higher education. 78.2% of the 179 interviewees who had children in
education, were unable to pay the school fees or were unable to do so without financial
support or borrowing. The majority of those interviewed had multiple costs or items of
expenditure that they were unable to meet. 9.4% of the 201 workers who were in receipt
of a monthly housing allowance said that their income was not enough to pay for monthly
rent.
Debt and savings
The reasons for the very high levels of indebtedness – primarily, insufficient income to
cover expenditure on basic needs and essential items - are made evident in the above
sections on monthly income and expenditure. The following paragraph will detail the
levels of indebtedness and the sources of borrowing which suggest the acceptance of
debt as an essential part of their life. A frequently heard reply to the question, ‘do you

19
have any debt’ was, “of course” and many laughed at the fact that we had deemed it
necessary to ask them. Although 73.6 percent of workers interviewed said that they were
currently in debt, which is still a very high proportion, many workers were unsure as the
size of their debt, the amount of money that they had borrowed in the last twelve months,
or indeed, the level of interest which they needed to repay.
The primary provider of loans was the Credit Union, an organisation from which workers
both saved and borrowed which tends to lead to confusion as to whether their monthly
payments are paying of interest withstanding on loans or going into their savings. The
average interest rate charged by credit unions was 10 percent, however, some individuals
reported both higher and lower interest rates. 43.4 percent of workers who borrowed did
so from the credit union. The remaining 54.6 percent borrowed from alternative sources,
including: colleagues, neighbours, friends and families, tribal meetings and money
lenders. The interest rates demanded by these groups varied from 5% to 50%. Only
3.3% of the workers who borrowed did so from loan agents or money lenders who
charged rates at the higher end of the range. Despite the range in interest rates charged,
47.3% of those who were in debt had loans with an interest rate of 10% which is due to
0
20,000
40,000
60,000
80,000
100,000
120,000
140,000
160,000
mean median
VA
LUE
OF
DEB
T (C
FA)
GENDER
Figure 4.1 : Average value of debt by gender
Female Male
20
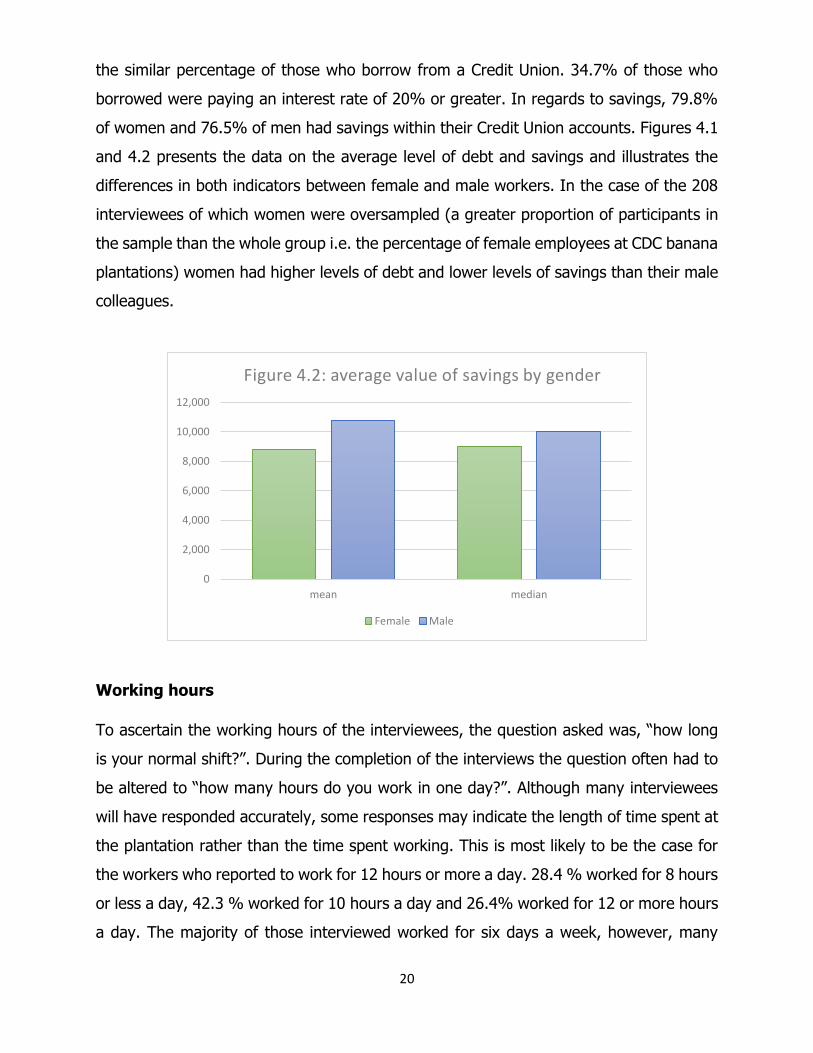
the similar percentage of those who borrow from a Credit Union. 34.7% of those who
borrowed were paying an interest rate of 20% or greater. In regards to savings, 79.8%
of women and 76.5% of men had savings within their Credit Union accounts. Figures 4.1
and 4.2 presents the data on the average level of debt and savings and illustrates the
differences in both indicators between female and male workers. In the case of the 208
interviewees of which women were oversampled (a greater proportion of participants in
the sample than the whole group i.e. the percentage of female employees at CDC banana
plantations) women had higher levels of debt and lower levels of savings than their male
colleagues.
Working hours
To ascertain the working hours of the interviewees, the question asked was, “how long
is your normal shift?”. During the completion of the interviews the question often had to
be altered to “how many hours do you work in one day?”. Although many interviewees
will have responded accurately, some responses may indicate the length of time spent at
the plantation rather than the time spent working. This is most likely to be the case for
the workers who reported to work for 12 hours or more a day. 28.4 % worked for 8 hours
or less a day, 42.3 % worked for 10 hours a day and 26.4% worked for 12 or more hours
a day. The majority of those interviewed worked for six days a week, however, many
0
2,000
4,000
6,000
8,000
10,000
12,000
mean median
Figure 4.2: average value of savings by gender
Female Male

21
worked for five days a week due to fatigue or illness related absences. The number of
hours worked a week can vary between the low season and the peak season, although,
one must bear in mind that the latter comprises the majority of the working year and
therefore is a more accurate measure of the average number of hours worked in a week.
In the low season - when bananas are not harvested – the average number of hours
worked a week was 55, 11 hours less than the peak season average of 66. Only 49.5%
of interviewees worked for 48 hours or less a week in low season.
Overtime
21.2% had worked overtime in the last year. This percentage remains relatively low due
to the fact that only workers who are paid by the hour are paid an overtime rate for every
hour over and above their daily 8 hour shift. Therefore, workers who are paid on an
incentive scheme which rewards workers based on their perceived productivity rather
than hours worked, are not paid for overtime because they do not have a set shift length.
For general labourers, whose activities and pay scheme often varies by operation, they
may work overtime when they are on an operation that pays hourly, most commonly
when working in the pack house. Of those who worked overtime, 59.1% said that it was
compulsory for them to do so and 54.5% said that they worked overtime in order to meet
their production quota. 22.8% of workers reported that they have previously not been
paid for overtime within the last year. The responses to the questionnaire indicate that
there is a disparity in the number of working hours that are expected of workers and the
level of pay that workers are entitled to when they exceed the number of hours indicated
in their contract.
Transport
91% of workers interviewed used CDC transport (moto) to get to and from the plantation
every day. The 18 workers who used alternative means of transportation to get to work
such as private transport, their own transport or walked for a significant part of their
journey. 78% of those who used company transport had to wait for over an hour for
transport after completing their working day. The average daily wait for transport was an
hour and a half. Those who worked shorter shifts and who finished comparatively earlier
22
than their co-workers had to wait at the plantation until the transport was full before they
could leave the plantation. The only alternative for workers who were unwilling or unable
to wait was to find their own transport and to pay for it out of their wages. One of the
most frequent complaints from the workers was the infrequency of transport as well as
the poor quality and lack of sufficient seating on the trucks. As a result of this, six workers
said that they had a sprain, fractured or broken bone due to a transport related accident,
caused by overcrowding both outside and inside of the transport. In addition, 21.3% of
those who reported bruising said that it had been caused by a vehicle accident.
Absenteeism and pro rata deductions
73% (152) of workers reported at least one absence in the last month. Furthermore, for
the 112 workers whose wage was reduced due to absence, on average, their wage was
reduced by 6,777 CFA a month. Half of those were absent for two days or less and 39%
were absent for between 3 and 5 days in the previous month for multiple reasons. 42%
were absent due to fatigue and 28% were absent due to illness. Half of those who were
absent due to illness stated that they had malaria. Therefore, monthly absences could be
reduced by 14% alone if effective steps to prevent and quickly treat malaria are taken.
Furthermore, 40% of those who had been absent due to fatigue or illness had not
regained full health by the time that they had returned to work, meaning that they would
not be working at their highest levels of productivity. The most common non-work related
cause of absence was bereavement following the death of a relative or friend. 7.3% were
absent due to a lack of adequate childcare. The other reasons for absence were,
transportation issues, attending another job as an additional source of income and
personal reasons. 50% of workers had pro rata deductions, imposed by their supervisor
or overseer in the last month and on average they received 3 pro rata reductions a month.
Personal Protective Equipment
Personal Protective Equipment (PPE) is essential to ensure the protection and safety of
plantation workers in all roles and stages within the production process and comprises of
items such as aprons, long-sleeved gloves, rain boots and eye protectors or goggles. All
of the 208 workers interviewed in this study, without exception replied, “yes”, often

23
emphatically, when asked, ‘do you need PPE for your job?’. This response illustrates both
the health and safety challenges faced by workers as well as the workers’ awareness of
their right to be given PPE and the responsibility of their employers to provide all of the
items required.
Despite the need for all workers to be provided with PPE on a regular basis, 26% had
never received PPE while working at CDC and a further 43.3% had not received PPE
within the last twelve months. Only 2.9% confirmed that they had received PPE every six
months which is the system deemed by both CDC and FAWU as best practice and the
degree of regularity that many workers believe that they are entitled to. Of the 154
workers who had received PPE, 37% said that it was not the correct size for them, thereby
affecting which items of PPE they wore and how often they wore them. Furthermore, a
majority of 54.5% said that they had not received all of the PPE necessary to protect
them for the tasks that they were employed to carry out.
Even though many workers reported to have severe financial constraints, 94.2% of
interviewees said that they had had to buy their own PPE in the last twelve months
because they had either, not received any PPE, or that they had to replace PPE which
was damaged or of the incorrect size. 69.4% of those who bought PPE spent between
5,000 and 10,000 CFA per annum on PPE. Fewer, but still a substantial number of
workers, 82.4%, had to repair their own PPE in order to reduce their expenditure on PPE
which is the responsibility of their employers to provide.
Chemicals
The importance of PPE in ensuring the safety and good health of banana workers is
evident when one is aware of the regular use of potentially harmful chemicals that are
involved in producing agricultural products intensively and on an industrial scale. 58.2%
of workers said that they had used chemicals in their job, however, this statistic suggests
that workers misunderstood the question to mean ‘direct’ use because chemicals or their
residues were present in most sections of the pack house as well as being administered
on the crops in the fields. Of those who were aware that they were working with
chemicals, 70.3% were able to name at least one of the chemicals and a minority were

24
able to name several. Furthermore, those who worked with chemicals in their job were
more likely to receive PPE, 73.6%, while those who were not aware of using chemicals
was 34.5%. Although one can infer the likely direction of causation, that management
prioritise the distribution of PPE to those who have what is perceived to be a greater
need, there is no further corresponding data to confirm the nature of correlation. In
addition, although more women, 64%, compared to 54% of men, worked with chemicals,
a greater percentage of men received PPE.
A greater number of workers, 77.4% stated that they had been working while aerial
spraying was taking place, 22.4% of whom reported that it occurred less than once a
month and 59% said that it occurred at least once a week. Field workers tend to be at
the greatest risk of breathing in or coming into to contact through aerially administered
chemicals. However, depending on the wind speed and direction, pack house workers
can also be affected. Although there appeared to be inconsistencies in the reporting of
the frequency of aerial spraying among field workers on the same plantation, CDC planes
were seen by the researchers on three out of the first six days at the plantations.
Furthermore, some workers complained at the lack of warning prior to aerial spraying
which meant that they had insufficient time to move to covered areas while spraying took
place. The timing of the interviews, during the peak rain season might have meant that
normal practice had to be adjusted in order to cope with the changeable weather
conditions. Despite this consideration, workers complained that the absence of warnings
and lack of information occurred all year round.
Health
82.7% had body pains at least once a week and 16.8% had daily body pains. 99% said
that the body pains were caused by overstraining and continuously overworking. 17.8%
are absent between once and three times a month, while 13.2% are absent at least once
a week. 85.1 reported to have felt fatigue or physical and mental tiredness at least once
a day and 17.8% said that they felt fatigued every day. 99.5% of these cases were caused
by physically overstraining or continuously overworking. Although stress may be viewed
as a minor personal issue rather than a health issue such as an injury or illness, it was
described by workers as being a very common and regular hindrance to their working

25
lives. 74.1% felt stressed at least once a week and 16.8% were stressed daily. 79.8%
said that their stress was caused by the amount of hours they were required to work as
well as the working conditions. 16.2 felt stress due to financial concerns. Although 79.8%
of workers reported to being regularly stressed, the majority of those individuals, 55.2%
had never been absent due to stress.
33.3% of those who reported a health issue had nail fungi and a further 27% reported a
skin problem. Thirdly, 11.9% had an eye injury that they believed had been caused by a
lack of PPE. The majority believed that these health issues had been caused by aerial
spraying.
60.1% of interviewees said that they have had health issues due to the absence or poor
quality of PPE.
Union membership and awareness of rights
One of the key areas of interest for this report is how rates of union participation have
changed which can directly impact on the working conditions of their members by
increasing their awareness of their rights and responsibilities as employees. There are
two unions that represent workers in the plantations that were visited during the research
programme, FAWU and DISAWUFA. 75.5% percent – 157 workers – were union
members, 84.9% of which belonged to FAWU and the remaining 24 workers belonged to
DISAWUFA.
Injury or ilness Frequency Most common causeSprain/fracture 52 Fall or trip: 57.7%
Burn 49 Chemicals: 87.8%
Cut 92 Equipment accident: 90.2%
Bruise 47 Fall or trip: 53.2%
Nail Fungi 64 Absence of PPE: 40.6%
Skin problem 59 Chemicals: 84.7%
Eye infection 87 Chemicals: 85.1%
Respiratory problem 42 Chemicals: 73.8%
Nose bleed 14 Chemicals: 46.7%
Figure 5.1: Cases of injury and illness

26
95.2% of interviewees knew that regular exposure to chemicals is damaging and
detrimental to their health.
95.7% said that they go to the company medical centre when they have an illness or
injury.
77.9% knew that there is a Health and Safety Committee at their plantation.
The remainder of this section are statistics gathered from the responses of FAWU
members in order to evaluate the changes and improvements made by FAWU in the last
year.
75.9% of FAWU members were able to name their current staff representative.
65.3% named at least one right that they had as a worker.
72.5% had spoken to a staff representative or FAWU employee about health and
safety in the past year.
58.5% of FAWU members had filed a complaint with their staff representative.
41.9% said that their grievance had not been resolved.
63% of the resolved grievances had been completed in less than a month.
37 out of the 134 FAWU members were able to name at least one topic of a meeting
that they had attended.
Workers who had obtained the highest level of education and had advanced level or
higher education were the most likely to have discussed health and safety issues with a
staff representative, 81.3%. However, they were the also the group determined by
education that had the lowest level of union membership, 43.8%.

27
Figure 6.1: Union membership by level of
education
Level Fraction Percentage
None 15/19 78.9%
Primary 86/110 78.2%
Secondary 49/63 77.8%
Advanced 7/16 43.8%
FOCUS GROUP WITH PHP WORKERS
A Focus group was held on the 20th September 2015 with 20 Plantations-Haut-Penja
(PHP) workers who had been invited by their staff representative. This comprised pack
house as well as field workers. The respondents sampled were all FAWU members and
had previously participated in union activities and two of the respondents were FAWU
staff representatives at the PHP plantation in Tiko. The questions asked covered
wages/financial management, Personal Protective Equipment (PPE), transportation, work
related injuries, health care and union participation. However, due to the small sample
size one cannot closely compare the differences in conditions experienced by employees
at CDC plantations.
16 out of the 20 respondents admitted to having knowledge of the NCA. This agreement
was implemented to increase wages of workers, at different scales for different categories
of workers. In the case of category 2 workers, their salary was due to have increased by
20%. Despite the new legislation, workers said that they have witnessed no significant
change in their salaries. Furthermore, following a review by PHP management, wages
were increased. This change occurred prior to the implementation of the NCA, and had
increased wages to a level above the minimum requirements of the NCA. All workers
present for the discussion were in debt at the time of the meeting. They argued that
salaries were too low to satisfy most of their needs and they therefore had to resort to

28
borrowing to finance their expenditure. School fees were the most common reason for
borrowing because salaries were not sufficient to pay school fees as well as cater for
domestic needs. Loans were sourced from credit unions, banks, money lenders and social
group “meetings”, colleagues and friends. The participants complained that they were
exploited and sometimes charged interest rates above the level that had previously been
agreed by financial institutions and money lenders, due to the high illiteracy rate among
banana workers. Other needs that necessitate borrowing are housing and food. Workers
claimed that the value of their housing allowance was less than the amount that landlords
charged for rooms. A category 2 worker is paid 8000 CFA while a category 4 and 5 worker
is paid 10,000 CFA as housing allowance a month. However, the minimum amount
charged for a single room is 10,000 CFA. Furthermore, workers state that the agreement
that they had signed with PHP on the issue of housing guaranteed a payment of 25% of
salary as housing allowance but that it was never adhered to.
Workers were asked about their use and knowledge of PPE. All respondents had some
knowledge of PPE and its importance. The interviewees said that the PPE was not
provided regularly enough nor was it of the correct size or all of the necessary items. PHP
management had agreed to provide boots three times a year for field workers involved
in chemical weeding but the field workers told us that this had not been the case so far
in 2015. Workers were concerned by the regularity of aerial spraying and the effects that
it was perceived to be having on them. Although they said that they had previously been
informed when aerial spraying was due to take place, this was no longer the case. The
interviewees that had come into contact with the chemicals applied by aerial spraying
reported skin and eye irritations. Those involved in chemical application argued that PHP’s
management were breaching their contract in regard to the application of chemicals by
forcing the relevant workers to apply chemicals for 6 hours (often with inadequate
protection) rather than the 4 hours that had been agreed.
Injuries reported by respondents are: cuts, eye infection, body pains, sprains and
fractures. Pack house workers were the group who reported to suffer from cuts regularly,
due to the use of knives at their work station. Eye infections were reportedly caused by
chemicals and aerial spraying in particular. Body pains are common among workers due

29
to the vigorous nature of the work and the number of hours spent at work. Sprains and
fractures are recorded but are not very common. Respondents also raised concern about
the lack of sufficient drugs at the PHP health centre and spoke of the need for more days
of excused duty as they mostly do not have enough time to recover fully before they
have to report back to work.
From the focus group discussion it became clear that PHP workers did not have similar
difficulties with transportation compared to CDC workers. Vehicles were deployed to
transport workers to and from work and they were always on time. However, most of the
respondents said that they lived far from the approved bus stops and had to pay for
transportation to reach the bus stops. Furthermore, vehicles operate in the mornings and
evenings so workers who finish in the afternoon have to pay for their own transport home
or wait for several hours.
Respondents recommended payment of a transport allowance and encouraged their
management to adhere to the initial agreement reached on housing allowances.
Respondents also entreated management to further increase salaries because they
viewed the increase resulting from the NCA as insignificant. Respondents also asked that
PHP management increase the provision of complete and high-quality PPE and expected
to receive continued support from FAWU on this issue.

30
CONCLUSION
In order to conclude the findings of the report where possible, we will compare the
indicators from 2015 with the baseline and target figures for the key indicators in
Outcome One: Educated and empowered workers and unions negotiating living wages
and improved conditions.
1. Percentage of households whose income meet basic needs to increase from a baseline
of 23% to a target of 50%.
2015: Monthly income was sufficient to cover monthly expenditure without borrowing for
25% of interviewees.
However, only 3.4% of workers said that their income was sufficient to cover their basic
costs which implies that their current level of expenditure is not sufficient to meet their
basic needs.
The average level of expenditure exceeds that of the average value of the highest level
of income. 80,264 CFA and 62,297 CFA, respectively.
Education and food are the two key areas of expenditure which workers are unable to
pay for which has resulted in high levels of debt and dependence on borrowing to cover
basic costs when their income is insufficient to do so. 62.4% said that school fees were
the principle cost that they were failing to cover while 15.3% of workers said that food
was the main cost that they were failing to meet. 74.5% said that the quantity of food
that they were able to purchase or produce every month was insufficient to adequately
feed their family. 78.2% of the 179 interviewees who had children in education, were
unable to pay the school fees or were unable to do so without financial support or
borrowing. Furthermore, 73.6% of interviewees were in debt at the time of this research
programme.
2. Percentage of workers that are not working more than the legal maximum weekly
hours of 48 (unless they are paid overtime) to increase from a baseline of 51% to a
target of 80%.

31
2015: 49.5% were working less than the legal maximum of 48 hours. This figure takes
into account the interviewees who have not worked overtime regularly or have not always
been paid for doing so.
As a result of the research, it became evident that there was not sufficient dialogue
between CDC management and employees about the working hours or overtime
obligations that workers had. Furthermore, due to the irregularity and low frequency of
transport to and from the plantations, workers were having to spend significant amounts
of time waiting at the plantation after they had finished work, before they were able to
leave. Workers commented that as a result of overworking and transport-related delays,
their productivity and rate of attendance had reduced due to fatigue and stress related
illnesses.
3. Increase in number of workers given appropriate personal protective equipment (PPE)
from a baseline of 35% to a target of 75%.
2015: 74% had received appropriate PPE. However, only 30.7% had received appropriate
PPE in the last twelve months.
Only 2.9% confirmed that they had received PPE every six months which is the system
deemed by both CDC and FAWU as best practice and the degree of regularity that many
workers believe that they are entitled to. It is important for the safety and morale of the
workers that they are provided with the PPE that is appropriate and of a high enough
quality for the tasks that they have been contracted to do. Workers were both concerned
and angered by CDC’s use of aerial spraying and they asked that more should be done
to coordinate the aerial spraying schedule with the hours that workers are in the field. It
seems that the aerial spraying schedule is dictated by the variable weather conditions
rather than the health and welfare of workers.
4. Decrease in the number of work related accidents/illnesses reported by workers from
4.7 to 2.
2015: N/A
32
(50.5% of workers were absent in the month prior to the interview – August - due to an
illness, injury or severe fatigue.)
The illnesses and injuries that workers reported were varied and of differing levels of
severity. General fatigue, body pains and stress were the most common causes of
absence and pro-rata deductions. Although workers complained at the lack of sufficient
paid leave from work, the majority were pleased with the medical treatment that that
they had received. In addition, 95.7% said that they go to the CDC medical centre when
they have an illness or injury which will enable CDC to maintain records of illnesses and
injuries to work closely with FAWU to reduce the number of work related illnesses and
accidents.
5. Percentage of workers who are aware of their basic labour rights to increase from a
baseline of 25% to a target of 80%.
2015: 65.3% of interviewees were aware of at least one of their basic labour rights.
One concern that the researchers have is the low attendance of FAWU meetings and
similarly low levels of information retention following meetings on topics such as; income
and financial management; health and safety; gender issues; union participation. This is
also demonstrated by the fact that 34.7% of inteviewees were unable to name at least
one right that they had as a worker. Those who were not members of FAWU at the time
of the interviewee were encouraged to talk to their staff representative about the role of
the union and the ways in which greater worker representation can improve their working
conditions.
In the previous years of this project, research into the banana sector in South West
Cameroon has revealed some of the significant challenges faced by banana workers on a
daily basis. The majority of workers are underpaid, overworked and at risk of serious
illness and injury as a result of very low standards in health and safety that are indicative
of a lack of concern for the welfare of workers. Unfortunately, despite the best efforts of

33
both parties, these trends have continued with the exception of tangible improvements
in certain areas. The researchers were encouraged by the determination of the
interviewees to improve their standard of living and to be paid in a way that their hard-
work merits and to be treated with the respect that they deserve.

34
APPENDIX 1: QUESTIONNAIRE
Plantation: ▢ CDC ▢ PHP ▢ BOH RESPONDENT’S CHARESTERISTICS 1. Gender ▢ Female ▢ Male 2. Age _ 3. Marital status ▢ Single ▢ Single parent ▢ Domestic Partnership ▢ Married ▢ Divorced ▢ Widow ▢ Other 4. Household Size 5. Number of minors (16 years of age or younger) in HH _ 6. Education level ▢ None ▢ Primary ▢ Secondary ▢ Advanced ▢ Other 7. Where do you live? ▢ Site Camp ▢ In your own house ▢ In a rented house WORK 8. Number of years worked 9. Category and echelon (Number and letter)___________ 10. Type of work ▢ Harvesting ▢ Deflowering ▢ Bagging ▢ Deleafing ▢ Chemical application ▢ Irrigation ▢ Pruning ▢ Planting ▢ General labour ▢ Packhouse (specify) ▢ Other (specify) WAGE 1. How are you paid? ▢ Hourly ▢ Incentive ▢ Varies with operation Income
Average Lowest Highest Comment
2. Monthly Income total
3. Hourly wage
4. Incentive
5. Overtime

35
6. Bonus
7. Housing allowance
8. Other (Income)
9. Net income (taken home)
10. Savings (credit union)
11. Other (loan or debt repayments)
12. Pro-rata in the last year? ▢ Yes ▢ No 12.b) Total number of days pro-rata in the last year? 13. Average number of days of pro-rata in a month? ________ 14. Were you absent from work last month? ▢ Yes, how many days _________ ▢ No 15.a) If yes, Why? ▢ Illness ▢ Fatigue ▢ Lack of childcare ▢ Attended another job ▢ Other
15.b) If illness, was it malaria? ▢ Yes ▢ No
15.c Had you regained full health when you returned to work from an absence? ▢ Yes
▢ No 16. If absent, by how much did it reduce your banana plantation wage? ____________ 17. How much of your monthly pay slip do you understand?
▢ all ▢ most ▢ some ▢ little ▢ very little ▢ none 18. Are you aware that your wage has increased due to the National Collective Agreement on Agriculture?
▢ Yes ▢ No 19. Income earners in family
Relation in family
Age (1)Type of work
Income (2)Type of work
Income
a)
b)
c)
d)
e)

36
Total for whole HH
20. Number of adults not working in HH? ___________ 21. Number of dependents in the household? ___________ 22. Living cost (total HH)
Cost Comment
a) Food
b) Housing
c) Water
d) Energy inc. electricity, gas, charcoal,cable
e) Non-food utlilities inc. church, celebrations, cloths etc NOT jangee or credit union
f) Babysitting
g) Education inc. uniform and books(record year)
h) Saving
i) Total
23. Are you able to pay school fees? 24. Do you think your wage is enough to cover basic costs? ▢ Yes ▢ No 25.a) If no, what are the costs you are failing to cover? ________________________ 25.b) If no, are you able to adequately feed your family every day? ▢ Yes ▢ No Comments : DEBT 1. Do you have any debt? ▢ Yes ▢ No (if no, go to Wage and Working hours) 2. How much have you borrowed in the last year? __________ 3. How much debt do you have? ____________ 4. Who are you borrowing from? ____________

37
5. What is the interest rate? _____% Comments: WAGE AND WORKING HOURS 1. How long is your normal shift? __________________________ 2. In the last year, on average how many hours did you work per week during LOW season___________ PEAK season.________ 3. Have you worked overtime in the last year? 4. If yes why? ▢ In order to meet production quota? ▢ Supervisor requested/ordered it? ▢ To increase income? ▢ To make up for absenteeism? ▢ Other (specify)__________________________ 5. Were you paid for this overtime? ▢ Yes ▢ No ▢ Sometimes In case yes, how much________________ 6. Was overtime optional or compulsory? ▢ Optional ▢ Compulsory 7. What time do you leave home in the morning? _________________ 8.a) What time do you reach work and why? 8. b) if yes, how long and why? _______________________ 9. How long do you have to wait for transport home in the evening? ____________________ 10. When do you arrive at home in evening? ____________________ CHILD CARE 1. Do you have children? ▢ Yes ▢ No 2. If yes, how many and what age are they? __________ 3. Who takes care of your children when you are at work? ▢ Family members ▢ Childcare ▢ Other_________
38
4. Would you like your employer to offer childcare? ▢ Yes ▢ No 5. If yes, what arrangement would be best for you? ▢ Childcare at the plantation ▢ Allowance to pay childcare PERSONAL PROTECTIVE EQUIPMENT 1. Do you need personal protective equipment in the job you do? ▢ Yes ▢ No 2. Do you receive it? ▢ Yes ▢ No
3. If yes, how often? ▢ always ▢ often ▢ sometimes ▢ rarely 4. Is the PPE the correct size for you? ▢ Yes ▢ No 5. Is the PPE given the right type for your job? ▢ Yes ▢ No 6. Does the PPE last until it is replaced? ▢ Yes ▢ No 7. In the last year have you had to repair the PPE that you have received? ▢ Yes ▢ No 8. In the last year have you purchased your own PPE(If no go to Q 10)? ▢ Yes ▢ No 9. In the last year, can you estimate how much you have spent on PPE? __________
10.a) Do you work with chemicals in your job? ▢ Yes ▢ No
10.b) If yes, what chemical(s) have you used? _________________
11.a) Have you been to aerial spraying in the last year? ▢ Yes ▢ No 11.b) If yes, how often? _________________ 12. In the last year, have you had any health issues caused by insufficient or absent PPE? ▢ Yes ▢ No 13. If yes, what? _________________ HEALTH

39
1. In the last year, have you suffered any of the following (work related) accidents or illnesses?
Frequency Cause 1= Trip, 2= Fall, 3= Impact, 4= Equipment accident, 5= Vehicle accident, 6= Chemicals, 7= Physically overstraining, 8= Continuously overworking, 9= Environmental hazard, 10= Absence of PPE, 11= Other (specify), 12= Multiple causes
No. of days absent from work
No. of days paid absence
Injury Breakage/sprain
Burn
Cut/bleeding
Bruise
Other
Illness Frequency Cause
1= Trip, 2= Fall, 3= Impact, 4= Equipment accident, 5= Vehicle accident, 6= Chemicals, 7= Physically overstraining, 8= Continuously overworking, 9= Environmental hazard, 10= Absence of PPE, 11= Other (specify), 12= Multiple causes
No. of days absent from work
No. of days paid absence
Nail fungi
Skin problem
Eye infection
Respiratory problems
Nose bleeding
Joint or muscle pain
Fatigue
Stress
Other
2. In the last year, have you been affected by chemicals that are used in the plantations? [If No, go to question 4] ▢ Yes ▢ No 3. If Yes, have chemicals caused an injury, illness or health problem? ▢ Yes ▢ No 4. If Yes, what chemical(s) caused the injury, illness or health problem?

40
5. In the last year, have you discussed health and safety standards at work with a FAWU representative?
▢ Yes ▢ No 6. Do you know that regular exposure to chemicals can be damaging to your health?
▢ Yes ▢ No 7. When an injury has occurred, do you seek medical treatment? ▢ Yes ▢ No 8. Are you aware of the health and safety committee at your workplace?
▢Yes ▢No UNION PARTICIPATION 1. Are you a member of a union? ▢ Yes ▢ No ▢ Staff representative (End questionnaire) 2. Which union ? ▢ FAWU ▢ DISAWUFA 3. Who is your staff representative? ____________________________ 4. Do you know what rights you have as a worker? ▢ Yes ▢ No NAME A RIGHT 5. Have you filed a GRIEVANCE with your staff representative? ▢ Yes ▢ No 5.b) If yes, how long did it take before THE GRIEVANCE got dealt with? ____________(months) 5.c) If yes, did this help resolve the problem? ▢ Yes ▢ No 6. Have you ever been to a workshop or meeting run by FAWU? ▢ Yes ▢ No 6.a) If yes, which of the following workshops did you attend?
Workshop category Attended?
Financial management/debt
Personal Protective Equipment and Health and Safety
Wages
Union Participation