Embed Size (px)
Citation preview

ii
ACKNOWLEDGEMENTS
First of all thank you to Allah the Almighty God for the blessing, generosity,
courage and strength to complete this manuscript.
Secondly, thank you to all those involved in helping me make this dissertation a
success.
I would like to thank my supervisors, Dr Nik Munirah bt. Nik Mahdi, Dr Mohd
Shafie b. Abdullah, Lecturers and Consultants Radiologist of Department of Radiology,
Universiti Sains Malaysia, Dr Mohd Ariff b. Abas, Head of Radiology Department,
Hospital Raja Perempuan Zainab II as well as my co-supervisor Dr Mahamarowi b. Omar,
Consultant Intensivist Department of Anaesthesiology and Intensive Care together with Dr
Kamarul Imran b. Musa, Department of Community Medicine Universiti Sains Malaysia
for their valuable guidance and continuous supervision in the conduct of this study.
My sincere appreciation also goes to all lecturers in the Department of Radiology
Universiti Sains Malaysia and all staffs of the Department of Radiology, Hospital
Universiti Sains Malaysia for their assistance rendered for the smooth running of this study.
My parents Ahmad Maulana b. Abdul Ghani, Halijah b. Din, my parents in law
Zakaria b.Md. Nor and Nahariah Shaadan, for their endless encouragement and support
throughout my life. My dearest husband who is also the co-researcher for this study, Dr
Muhammad Habibullah and my lovely daughters Anis Maisarah and Farah Najihah, for
their continuous support, patience and sacrifice, especially during the preparation of this
manuscript.

iii
TABLE OF CONTENTS
TITLE PAGE NO.
Acknowledgement ii
Table of contents iii
List of tables viii
List of figures ix
Abbreviations x
Abstrak xi
Abstract xiv
CHAPTER 1 : INTRODUCTION 1
CHAPTER 2 : LITERATURE REVIEW 4
2.1 Bedside Chest Radiograph 4
2.1.1 Image quality in computed radiography 4
versus conventional radiography
2.1.2 Role of daily chest radiographs in pulmonary oedema 6
2.2 Vascular Pedicle Width (VPW) 7
2.2.1 Introduction 7
2.2.2 Anatomy of vascular pedicle 7

iv
2.2.3 Measuring the Vascular Pedicle 9
2.2.4 Variation of VPW in pulmonary oedema 11
2.2.5 Potential Modifying Factors in Determining VPW 13
2.2.5.1 Physiological factors affecting VPW 13
2.2.5.1(a) Respiration 13
2.2.5.1(b) Gravity 14
2.2.5.2 Technical factors affecting VPW 14
2.2.5.2 (a) PA versus AP position 14
2.2.5.2 (b) Tube to film distance 15
2.2.5.2 (c) Kilovoltage 15
2.2.5.2 (d) Rotation 15
2.3.4 Usefulness of Serial Measurements of VPW 17
2.3 Cardiothoracic Ratio (CTR) 19
2.3.1 Definition 19
2.3.2 Usefulness of Cardiothoracic Ratio in pulmonary oedema 22
2.4 Pulmonary oedema 23
2.4.1 Introduction 23
2.4.2 Type of Pulmonary Oedema 23
2.4.3 Radiological Detection and Differentiation of Oedema 24
2.4.4 Radiological Factors to Determine Type of Oedema 25

v
2.4.4.1 Distribution of Pulmonary Blood Flow 25
2.4.4.2 Distribution of Pulmonary Oedema 27
2.4.4.3 Lung Volumes 28
2.4.4.4 Septal lines, Peribronchial Cuffing, 29
Air Bronchograms, and Pleural Effusions
2.4.4.5 Heart size 29
2.4.5 Value of Pulmonary Artery Catheterization in 30
pulmonary oedema and VPW
2.4.6 Treatment of Pulmonary Oedema 31
2.4.6.1 Medical treatment 32
2.4.6.1 (a) Frusemide 32
2.4.6.1 (b) Morphine 32
2.4.6.1 (c) Nitrates 33
2.4.6.1 (d) Other drugs for pulmonary oedema 34
2.4.6.2 Noninvasive ventilation 34
CHAPTER 3 : OBJECTIVES 35
3.1 General Objective 35
3.2 Specific Objectives 35
3.3 Research Hypothesis 36
CHAPTER 4 : METHODOLOGY 37
4.1 Study Design 37
4.2 Sample size calculation 37

vi
4.3 Study technique 38
4.3.1 Inclusion criteria 38
4.3.2 Exclusion criteria 38
4.4 Validation Study 40
4.5 Chest radiograph 41
4.6 VPW and CTR measurement 42
4.7 Net fluid balance 44
4.8 Treatment 44
4.9 Statistics 45
CHAPTER 5 : RESULTS 46
5.1 Socio-Demographic Characteristics of Participants 46
5.2 Participants treatment 46
5.3 Analysis Correlation VPW, CTR and Net Fluid Balance 51
5.4 Analysis Mean Changes of VPW, CTR and Net Fluid Balance 53
CHAPTER 6 : DISCUSSION 59
6.1 Overview and Demographic characteristics 59
6.2 Correlation between VPW, CTR and Net Fluid Balance 61
6.3 Mean Changes of VPW and Net Fluid Balance between 66
Day 1 to Day 2 and Day 2 to Day 3
6.4 Limitation of Study 67
6.5 Recommendation 69
vii
CHAPTER 7 : CONCLUSION 71
REFERENCES 72
APPENDICES 78
Appendix A: Data collection sheet
Appendix B: Borang maklumat dan keizinan pesakit

viii
LIST OF TABLES
TABLE TITLE PAGE NO.
Table 5.1
Table 5.2
Table 5.3
Table 5.4
Demographic Characteristics Pearson Correlation Analysis of Vascular Pedicle
Width (VPW) and Independent Variables (CTR and
Net Fluid Balance) in 51 patients.
Mean VPW, CTR, and Net Fluid Balance in day 1,
day2 and day 3.
Paired t- test analysis mean change of VPW,
CTR, and net fluid balanced on between day 1 to day
2 and between day 2 to day 3
47
52
54
55

ix
LIST OF FIGURES FIGURE TITLE PAGE NO.
Figure 2.1
Diagram of vascular pedicle
8
Figure 2.2 Measuring of Vascular pedicle width 10
Figure 2.3 Variation of vascular pedicle width in lung oedema 12
Figure 2.4 Measurement of cardiothoracic ratio 21
Figure 2.5 Distribution of pulmonary blood flow 26
Figure 2.6 Regional distribution of lung oedema.
27Figure 2.7 Pulmonary blood volume 28
Figure 4.1 Measurements of VPW and CTR 43
Figure 5.1 Pie chart shows gender distribution of patients involved 48
in this study
Figure 5.2 Pie chart shows race distributions of patients involved 49
in this study
Figure 5.3 Bar chart shows type of treatment given to patient in the study 50
Figure 5.4 Error bar shows significant reduction of net fluid balance in 56
pulmonary oedema patient in consecutive days with treatment.
Figure 5.5 Error bar shows significant reduction of mean VPW in pulmonary 57
oedema patient in consecutive days with treatment
Figure 5.6 Error bar shows no significant changes of mean CTR in pulmonary 58
oedema patient in consecutive days with treatment.
and combination treatment (IV frusemide and dialysis) from
day 1 to day 3.

x
ABBREVIATIONS VPW Vascular pedicle width
CTR Cardiothoracic ratio
ICU Intensive Care Unit
CXR Chest radiograph CPAP Continuous positive pressure ventilation BIPAP Bi level positive pressure ventilation PA Posterioanterior ARDS Acute Respiratory Distress Syndrome PAOP Pulmonary artery occlusion pressure ALI Acute Lung Injury PAC Pulmonary artery catheter ISDN Isosorbide dinitrate SD Standard division

xi
KAJIAN PROSPEKTIF BERKENAAN HUBUNGKAIT DI ANTARA ‘VASCULAR
PEDICLE WIDTH’ DAN NISBAH KARDIOTORASIK DI KALANGAN PESAKIT
DEWASA YANG MENGHIDAP PARU-PARU BERAIR (PULMONARY EDEMA)
YANG MENERIMA RAWATAN DI UNIT RAWATAN RAPI
Dr Siti Aishah Ahmad Maulana
Sarjana Perubatan Radiologi
Jabatan Radiologi
Pusat Sains Perubatan, Universiti Sains Malaysia
Kampus Sihat, 16150 Kelantan, Malaysia
Pengenalan: Mengenali status aras kandungan cecair di dalam badan di kalangan
pesakit-pesakit kritikal adalah amat penting. Mengikut tradisi, penggunaan pemonitoran
tekanan hemodinamik yang invasif seperti ‘pulmonary artery catheter’ telah digunakan
untuk menilai status aras kandungan cecair di dalam badan di kalangan kumpulan pesakit
kritikal ini. Namun maklumat yang boleh diperolehi daripada ‘vascular pedicle width’
(VPW) pada radiografi dada yang diambil dalam posisi baring di unit rawatan rapi adalah
sangat menjimatkan dan kurang invasif untuk mengenal pasti status kandungan cecair di
dalam badan pesakit-pesakit yang kritikal. Penggunaan VPW dalam menunjukkan
kandungan cecair di dalam badan dilihat dalam beberapa kajian VPW daripada radiografi
dada terutamanya dalam memantau pesakit yang menghadapi kelebihan kandungan cecair
di dalam badan dan menerima rawatan.

xii
Objektive: Untuk menentukan hubungkait di antara ‘vascular pedicle width’(
VPW), nisbah kardiotorasik dan jumlah baki kandungan cecair badan dengan menggunakan
radiografi dada bersiri di kalangan pesakit-pesakit dewasa yang disahkan menghidap paru-
paru berair yang menerima rawatan di unit rawatan rapi di Hospital Universiti Sains
Malaysia.
Metodologi: Kajian ini adalah kajian prospektif yang dilaksanakan daripada Jun
2008 sehingga Jun 2009. Ia melibatkan 51 orang pesakit yang disahkan menghidap
penyakit paru-paru berair (pulmonary oedema) di unit rawatan rapi Hospital Universiti
Sains Malaysia. Radiografi dada bersiri dalam posisi menelentang diambil dari hari
pertama bermulanya penyakit paru-paru berair di unit rawatan rapi sehingga hari ketiga.
Radiografi dada yang pertama diambil sebelum rawatan diberi. Radiografi dada yang
berikutnya diambil setiap 24 jam sehingga hari ketiga. Data 24 jam baki kandungan cecair
badan untuk tiga hari berturut-turut bagi setiap pesakit diambil daripada carta pemonitoran
pesakit mengikut hari radiografi dada diambil. VPW dan nisbah kardiotorasik dikira oleh
penyelidik pada waktu berbeza tanpa makluman tentang data klinikal pesakit yang
berkaitan.
Keputusan: Lima puluh satu pesakit terlibat di dalam kajian ini. Di mana nilai
purata umur adalah 54.43. Seramai 39 pesakit (76.5%) menerima rawatan intravena
Frusemide sahaja, manakala 12 pesakit (23.5%) menerima gabungan rawatan intravena
Frusemide dengan dialisis sebagai rawatan paru-paru berair. Didapati terdapat hubungkait
yang lemah tetapi tidak signifikan di antara VPW dan nisbah kardiotorasik pada hari
pertama (r1 =0.10, p=0.34), hari kedua (r2 =-0.01, p=0.92) dan hari ketiga (r3=0.02,

xiii
p=0.91). Keputusan yang sama dilihat di antara VPW dan jumlah baki cecair badan iaitu
hubungan yang lemah tetapi tidak signifikan pada hari pertama (r1=0.10, p=0.47), hari
kedua (r2= -0.05, p= 0.73) dan hari ketiga (r3= -0.05, p= 0.74). Namun dengan
menggunakan ujian t-berpasangan (paired t-test) menunjukkan perubahan yang signifikan
terhadap purata perubahan VPW di antara hari pertama dengan hari kedua dan di antara
hari kedua dengan hari ketiga (p< 0.001). Perubahan yang signifikan juga dilihat pada
purata perubahan jumlah baki cecair badan di antara hari pertama dengan hari kedua dan di
antara hari kedua dengan hari ketiga (p< 0.001). Tetapi tiada hubungan yang signifikan
dilihat pada purata perubahan nisbah kardiotorasik di antara hari pertama dengan hari kedua
dan di antara hari kedua dengan hari ketiga (p=0.58). Tambahan pula, terdapat penurunan
setiap hari purata VPW dan purata jumlah baki cecair badan dalam tempoh 3 hari dengan
intravena Frusemide dan juga rawatan kombinasi.
Kesimpulan: Purata perubahan yang signifikan dilihat pada VPW dan jumlah baki
cecair badan di antara hari pertama ke hari kedua dan di antara hari kedua ke hari ketiga
sebaliknya tiada purata perubahan yang signifikan dilihat pada nisbah kardiotorasik di
antara hari pertama ke hari kedua dan di antara hari kedua ke hari ketiga.
Dr Nik Munirah Nik Mahdi: Supervisor
Dr Mohd Shafie Abdullah: Supervisor
Dr Mohd Ariff Abas: Co-Supervisor
Dr Mahamarowi Omar: Co-Supervisor

xiv
A PROSPECTIVE STUDY OF RELATIONSHIP OF VASCULAR PEDICLE
WIDTH AND CARDIOTHORACIC RATIO IN ADULT PULMONARY OEDEMA
PATIENTS DURING TREATMENT IN ICU
Dr Siti Aishah Ahmad Maulana
MMed Radiology
Department of Radiology
School of Medical Sciences, Universiti Sains Malaysia
Health Campus, 16150 Kelantan, Malaysia
Introduction: Determination of intravascular volume status in critically ill patient
is very important. Traditionally, invasive haemodynamic pressure measurements have been
used to assess the volume status in this group of patients. However, the information
available from vascular pedicle width (VPW) in portable supine chest radiographs are least
costly and least invasive of determining volume status in critically ill patient. The true
utility of VPW reflecting intravascular volume status seen in few studies from portable
supine chest radiographs especially in monitoring patients who have volume overload and
are receiving treatment.
Objectives: To determine the relationship of vascular pedicle width (VPW),
cardiothoracic ratio (CTR) and net fluid balance by using serial portable supine chest

xv
radiograph in adult pulmonary oedema patients during treatment in ICU in Hospital
Universiti Sains Malaysia.
Patients and Methods: A prospective study was done from Jun 2008 until Jun
2009 involving 51 patients who had been diagnosed to have pulmonary oedema in
Intensive Care Unit (ICU) and Neuroscience ICU, Hospital Universiti Sains Malaysia.
Serial supine portable chest radiographs were taken from day 1 of the onset of pulmonary
oedema in ICU until day 3 consecutively. First chest radiograph was taken before starting
treatment. Subsequent chest radiographs were taken about 24 hours apart. Three
consecutive 24 hours net fluid balance data were taken from ICU monitoring chart
according to the day of CXRs. Computed chest radiograph is used for evaluation of the
VPW and CTR. The VPW and CTR were measured by researcher in separated occasion
without clinical data related to patient available.
Results: Fifty one patient involved in this study with the mean age of 54.43. Total
of 39 patients (76.5%) received intravenous (IV) Frusemide and 12 patients (23.5%)
received IV Frusemide in combination with dialysis as treatment of pulmonary oedema.
There was a weak but not significant correlation between VPW and CTR in each day from
day 1 (r1=0.10, p=0.34), day 2 (r2=-0.01, p=0.92) and day 3 (r3=0.02, p=0.91). Similar
findings of a weak but not significant correlation was also seen between VPW and net fluid
balance on day 1 (r1 =0.10, p=0.47), on day 2 (r2 = -0.05, p= 0.73) and on day 3 (r3 = -
0.05, p= 0.74). However by using paired t-test significant mean changes of VPW between
day 1 to day 2 and between day 2 to day 3 (p<0.001). Significant mean changes of net fluid
balance were also seen between day 1 to day 2 and between day 2 to day 3(p<0.001). No
significant mean changes of CTR seen between day 1 to day 2 and between day 2 to day3
xvi
(p=0.58). In addition, there were daily reduction of the mean of VPW and net fluid balance
in 3 days duration with IV Frusemide and combination treatment. However, no significant
difference between both treatments with the mean of VPW (p=0.099) and net fluid balance
(p=0.162) in 3 days period.
Conclusion: This study showed that there was strong significant mean changes of
VPW and net fluid balance between day 1 to day 2 as well as day 2 to day 3. However, no
significant mean changes of CTR between day 1 to day 2 and day 2 to day 3.
Dr Nik Munirah Nik Mahdi: Supervisor
Dr Mohd Shafie Abdullah: Supervisor
Dr Mohd Ariff Abas: Co-Supervisor
Dr Mahamarowi Omar: Co-Supervisor

1
CHAPTER 1 : INTRODUCTION
.A Assessment the intravascular volume status of clinically ill patients can be
difficult, yet efforts to manipulate fluid balance occur daily in the intensive care unit
(ICU). Patients often require invasive hemodynamic monitoring such as Swan-Ganz
catheter or central venous catheter, which predisposed to misinterpretation and potential
to produce harm. Therefore the ability to discriminate changes in fluid balance
noninvasively would be of the highest clinical utility to the practicing intensivist.
Portable, supine chest radiographs (CXRs) remains one of the simplest
examinations used at the bedside to evaluate the cardiopulmonary status of patients in
the intensive care unit. It has been employed for more than a century and the most
commonly used noninvasive tool for identifying and quantifying the severity of
pulmonary oedema. It is not only because of the least risk and costs reduction, but also
because they can be utilized in areas outside the ICU.
Vascular pedicle width (VPW) is a measurement of mediastinal
silhouette of the great vessels from upright chest radiograph was first described by
Milne and colleagues in 1984. Other previous studies did prove that VPW measurement
is important and reliable in assessing the intravascular volume status especially in
critically ill patients. Hiponik et al, 1986 reported a significant correlation between
vascular pedicle widths of more than 68mm and the presence of hydrostatic pulmonary
oedema. In our study, the concern is to find the relationship in serial measurement of
VPW with cardiothoracic ratio and net fluid balance. Net fluid balance has been chosen
because of it is intensively charted by the ICU nurses for 24 hours in which it reflects 24

2
hours fluid balance in a patient during treatment. A study by Pistolesi et al in 1984 of
upright non mechanically ventilated patients undergoing cardiac catheterization
demonstrated that VPW and total blood volume were significantly correlated. Another
study by Haponik et al in 1986 in burn patients who received intravascular volume
expension, presence of widening of VPW on serial films preceded development of
pulmonary oedema. However previous study by Martin et al in 2002 on serial
measurement of VPW and CTR in 5 days duration showed that no correlation between
these two variables.
The ability of VPW to distinguish various form of pulmonary oedema among
supine critically ill patient had also been suggested by Thomason et al in 1998. They
found the role of portable, supine, anteroposterior chest radiographs in differentiating
acute respiratory distress syndrome (ARDS) from pulmonary oedema due to volume
overload can improve by over 15%-30% by incorporating VPW and cardiothoracic ratio
(CTR) into standard practice (Thomason et al, 1998). However, our study interest is
among pulmonary oedema patients with volume overload state such as cardiac and renal
failure patients rather than pulmonary oedema due to permeability oedema such as
trauma or ARDS. A study by Milne et al in 1985 in 216 upright posteroanterior films ,
they concluded a widening of VPW (>53mm) was predictive of volume-overload states
such as cardiac or renal failure whereas the VPW below 43mm was the most predictive
of patients with an injury pattern of oedema,
Frusemide was chosen as main treatment in our study because it is a major and
important treatment in pulmonary oedema patients in ICU setting and even in wards and
Emergency Unit. This is preferred treatment for pulmonary oedema due to massive

3
diuresis (which able to assess from input/output fluid from the nurses sheet). Cotter et
al in 2001 commented that intravenous loop diuretics have formed the mainstay of
treatment for acute cardiogenic oedema since 1960s. Besides, a study by Martin et al in
2002 showed that significant reduction of VPW in treated patient with Frusemide but
no significant changes of CTR from baseline during 5 days treatment period.
We hope that our study is a pioneer for the implementation of serial
measurement of VPW in clinical setting which assessable from chest radiographs. A
study by Ely et al in 2001 stated that the accuracy of radiologists impressions for
differentiating pulmonary artery occlusion pressure (PAOP) ≥ 18mmHg from PAOP <
18mmHg could be increased to 70% by using Receiver Operating Characteristic (ROC)
curve with cut offs of 70mm for VPW and 0.55 for CTR were derived.
We believed that appraisal of VPW and other radiographic signs should be
incorporated into newly implemented, comparative studies of ICU costlier and /or more
invasive technologies.
We did agree that if the intravascular volume status remains unclear after
radiographic assessment using VPW, other invasive studies such as pulmonary catheter
placement, echocardiogram with or without esophageal Doppler monitoring according
to the patient’s clinical status and risk or benefit considerations must be pursued.

4
CHAPTER 2: LITERATURE REVIEW
2.1 BEDSIDE CHEST RADIOGRAPH
Bedside chest radiograph plays a major role in patient care. Studies show that
most request (76 - 94%) for bedside chest radiographs are valid (Wandtke JC, 1994).
Daily chest radiograph (CXR) are obtained in most ICU patients. In many hospital up
to one third of all inpatient chest radiographs taken in ICU particularly in patients
undergoing mechanical ventilation and patient who are hemodynamically unstable or
who have had invasive procedures (Henschke et al, 1997). CXRs are the most
commonly used non invasive studies to identify the presence, severity or change in
pulmonary oedema in the ICU (Ely et al, 2001). Moreover Milne et al in 1985 had
previously elucidated the relationship of VPW and CTR to the etiology of pulmonary
oedema by using upright, posteroanterior CXR, but CXR obtained in critically ill
patients usually taken in the supine and anteroposterior position like in ICU.
2.1.1 IMAGE QUALITY IN COMPUTED RADIOGRAPHY VERSUS
CONVENTIONAL RADIOGRAPHY
Computed radiography (CR) systems are the common radiographic systems
nowadays in medical application because of their reliability and flexibility to address a
variety of clinical application and lower costs. It often requires fewer retakes due to
inadequate exposure and the image acquisition is also faster. Besides ability to adjust
image brightness and contrast in wide range of thickness in one exposure, unlike

5
conventional radiography which may require a different exposure and multiple films
speeds in one exposure to cover wide thickness range in a component so it causes
impairment in diagnostic accuracy. Furthermore, CR images can be enhanced digitally
to aid in interpretation. CR system is also use to transfer the images to workstation by
using picture archiving and communications systems (PACS).
The ability of CR to adjust the contrast with adequate resolution is very helpful
in measuring vascular pedicle width which involved major vascular structures in the
mediastinal region. Ishigaki et al in 1996 noted the improvement of contrast in CR help
to visualize low contrast region including the mediastinum. In our study, portable CR of
the chest was used and every radiograph was displayed for interpretation on workstation
with computerized caliper used to achieve acceptable radiographic measurement of
VPW and CTR.
.

6
2.1.2. ROLE OF DAILY CHEST RADIOGRAPHS IN PULMONARY OEDEMA
There are some arguments for daily chest radiograph in critically ill patients
especially in ICU. Miller et al in 2006 suggested daily chest radiographs are warranted
in patients with unknown or presumably changing intravascular volume. Besides, these
patients whose intravascular volume status is in question would potentially benefit with
minimal risk (Miller et al, 2006). Over 60% of chest radiographs will result in an
institution of diuretic therapy in pulmonary oedema patients (Marik et al,1997).
Hydrostatic pulmonary oedema is associated with a larger CTR and increased in VPW
as described by Thomason et al in 1997 that hydrostatic pulmonary oedema was found
to correlate best using a VPW >63mm coupled to CTR >0.52. A study by Martin et al
in 2002 showed significant reduction of VPW (p=0.04) but no reduction in CTR in 5
days period. Thus, in our study concern was to monitor the measurement of VPW and
CTR in pulmonary oedema patients serially for 3 consecutive days. In addition, Miller
et al in 2006 concluded the utility of serial measurement of VPW depends upon
standardized performance of routine, serial chest radiographs.

7
2.2 VASCULAR PEDICLE WIDTH (VPW)
2.2.1 INTRODUCTION
The technique of analysis of cardiac and pulmonary circulatory abnormalities on
the chest radiograph has been described extensively. The fact that systemic vessels are
readily seen on chest radiograph make the physician able to correlate changes in these
vessels with alteration in the systemic circulation. Previous study by Milne et al in 1984
about the relationship between the size of the azygos vein, right atrial pressure and
circulating blood volume showed that increased in circulating blood volume caused an
increase in width of the azygos vein and the vascular pedicle.
2.2.2 ANATOMY OF VASCULAR PEDICLE
On the frontal chest radiograph, the vascular pedicle extends from the thoracic
inlet to the top of the heart. Its right-hand boundary is formed by the right
brachiocephalic vein above and by the superior vena cava below. The left-hand border
of the pedicle is formed by the left subclavian artery above the aorta. The right-hand
border of the pedicle is entirely venous and lies quite far anteriorly. Whereas the left-
hand border of the pedicle is usually arterial and lies quite posteriorly (Figure 2.1). The
difference in level of the left and right boundaries is of considerable significance in
determining how extravascular fluid collection within the pedicle will be presented
radiologically (Milne et al,1984).
8
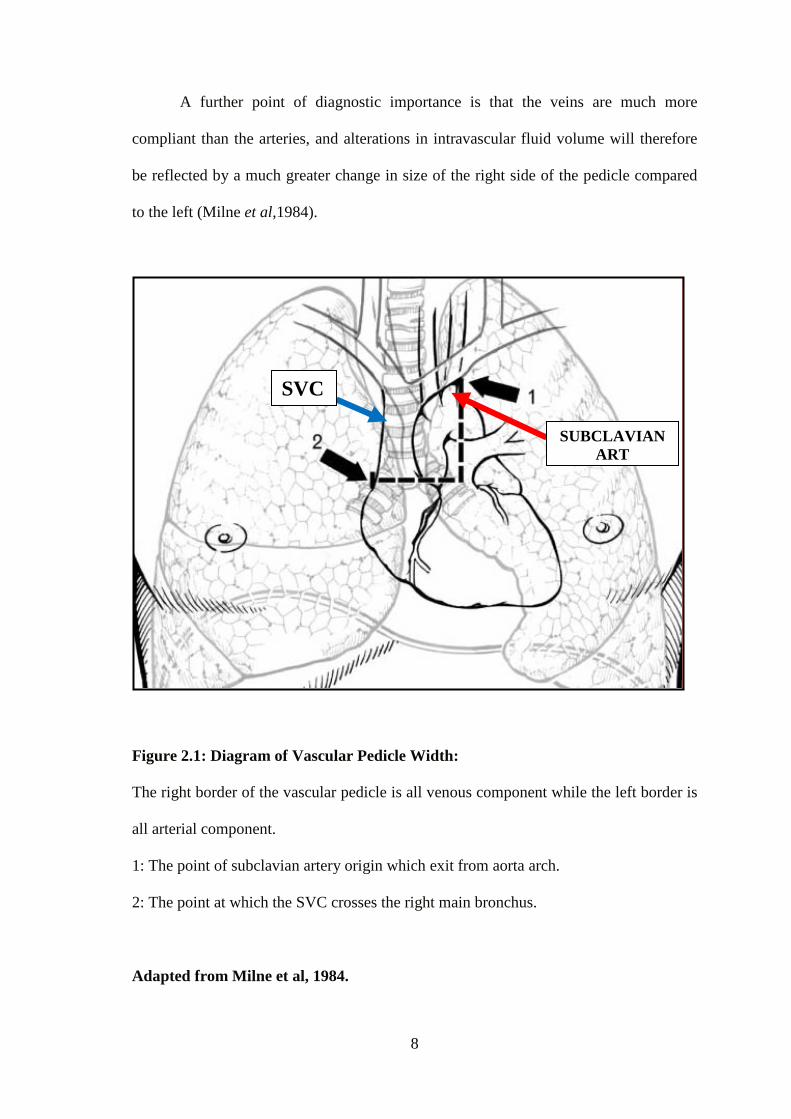
A further point of diagnostic importance is that the veins are much more
compliant than the arteries, and alterations in intravascular fluid volume will therefore
be reflected by a much greater change in size of the right side of the pedicle compared
to the left (Milne et al,1984).
Figure 2.1: Diagram of Vascular Pedicle Width:
The right border of the vascular pedicle is all venous component while the left border is
all arterial component.
1: The point of subclavian artery origin which exit from aorta arch.
2: The point at which the SVC crosses the right main bronchus.
Adapted from Milne et al, 1984.
SVC
SUBCLAVIAN ART

9
2.2.3 MEASURING THE VASCULAR PEDICLE
According to Milne et al in 1984 and 1985, as well as in recent publications by
Ely et al, 2001, VPW is measured by dropping a perpendicular line from the point at
which the left subclavian artery exits the aortic arch and measuring across to the point at
which the superior vena cava crosses the right main stem bronchus (Figure 2.1). When
the right border of the pedicle is indistinct, the vertical lateral border of the superior
vena cava or right brachiocephalic vein have been used in measuring VPW (Ely et al,
2001).
Milne et al in 1984 reported that on the upright PA films, the normal VPW to be
48± 5 mm, however in supine anteroposterior positioning VPW would increased to 58-
64 mm or would increased by approximately 20%. A study by Thomason et al in 1998,
the optimum cut off for VPW in distinguishing between permeability and hydrostatic
pulmonary oedema was found to be 68 mm whereas a study by Salahuddin et al in
2007, prospectively measured the VPW among 50 adult patients in a tertiary center.
VPW measurement correlated closely with positive fluid balance, r= +0.88, P= 0.000. A
Receiver Operating Characteristic curve demonstrated that a VPW of 86.5 mm had
100% sensitivity and 80% specificity for predicting fluid overload equal to greater than
1200ml. Another study by Ely et al, 2001, the best VPW cut-off for differentiating a
high versus normal to low intravascular volume status on the supine, portable CXR was
70 mm regardless of the presence or absent of pulmonary oedema.
10
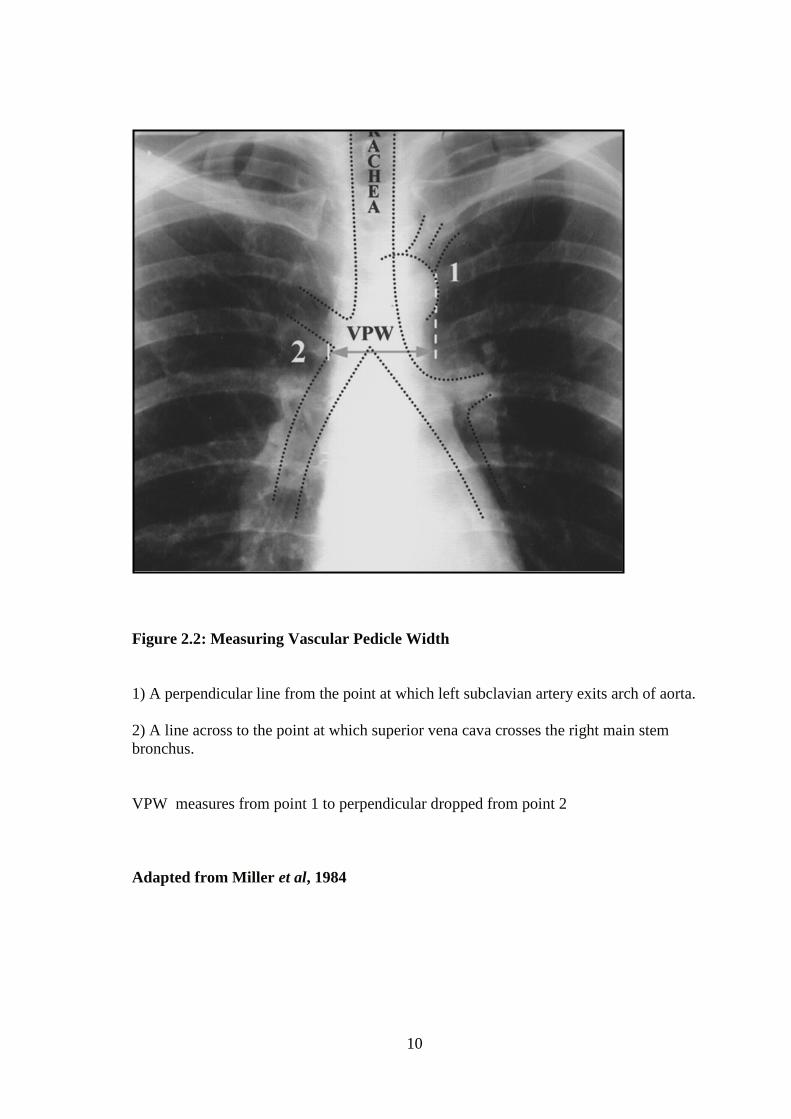
Figure 2.2: Measuring Vascular Pedicle Width
1) A perpendicular line from the point at which left subclavian artery exits arch of aorta. 2) A line across to the point at which superior vena cava crosses the right main stem bronchus.
VPW measures from point 1 to perpendicular dropped from point 2
Adapted from Miller et al, 1984

11
2.2.4 VARIATION OF VPW IN PULMONARY OEDEMA
A study by Milne et al in 1985, there are three variation of VPW in pulmonary
oedema which diminished, normal and increased (for an erect 70 kg patient). Normal is
defined as 43-53 mm commonest occurs commonly in capillary permeability and acute
cardiac failure. Diminished or narrowed is less than 43mm, which occurs in capillary
permeability oedema. Increased or widened is more than 53mm, this always seen in
over hydration, renal failure and chronic cardiac failure. Another study by Figueras et al
in 1978, VPW was greater than 53mm in 60% of cardiac failure patients, however 40%
were in the normal range, this was due to acute cardiac failure or mitral valve disease
cases had not involve in the increment of circulating blood volume, eventhough 60% of
the patients were film in supine position, which increases VPW with an average of 20%.
This correlate well with the changes of intravascular fluid volume in fluid overload
condition such as in chronic cardiac failure and renal failure. There is blood congestion
which reflect the greater change in the right side of pedicle compare to the left side
(Milne et al,1984).
A study by Milne et al in 1980 showed 85% of widened vascular pedicles were
in renal failure or overhydration patients. In their study also found that in capillary
permeability oedema 35% of patients had a normal pedicle while 35% had a narrowed
vascular pedicle. Moreover, the ability of VPW to distinguish various forms of
pulmonary oedema among supine critically ill patients has been suggested by few
groups. In 1998 Thomason et al, assessed the role of portable, supine, anteroposterior
CXRs in differentiating acute respiratory distress syndrome (ARDS) from pulmonary
12
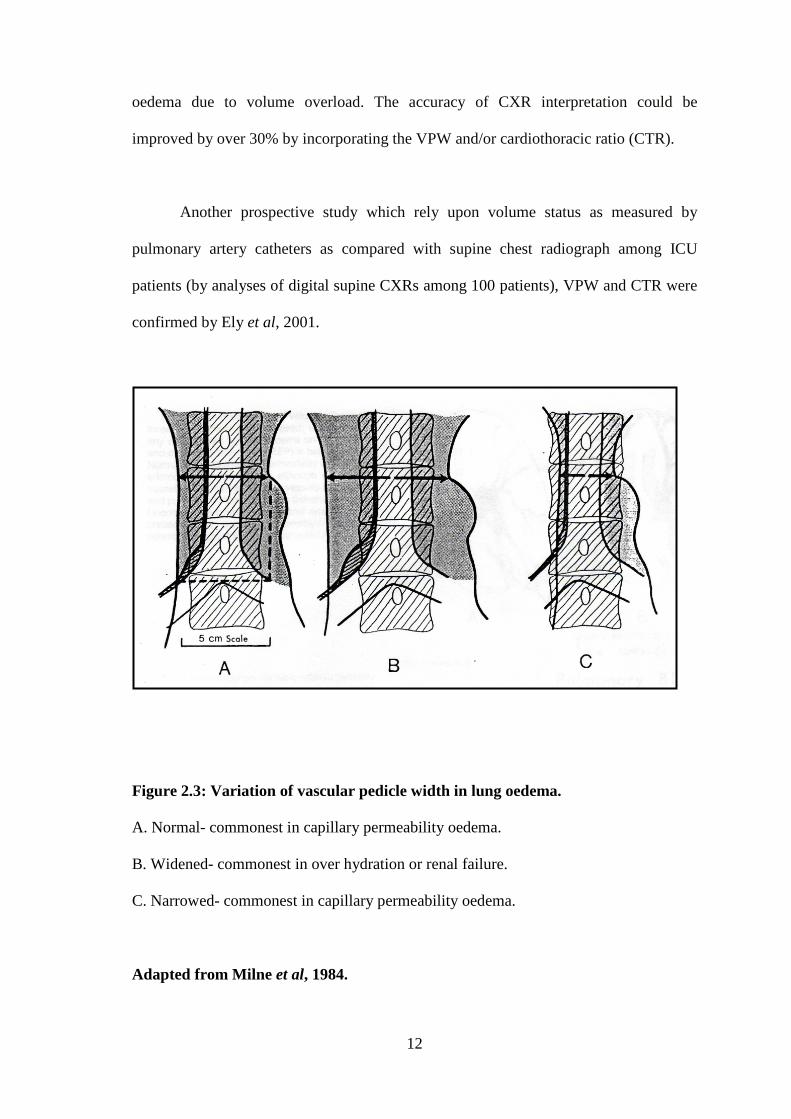
oedema due to volume overload. The accuracy of CXR interpretation could be
improved by over 30% by incorporating the VPW and/or cardiothoracic ratio (CTR).
Another prospective study which rely upon volume status as measured by
pulmonary artery catheters as compared with supine chest radiograph among ICU
patients (by analyses of digital supine CXRs among 100 patients), VPW and CTR were
confirmed by Ely et al, 2001.
Figure 2.3: Variation of vascular pedicle width in lung oedema.
A. Normal- commonest in capillary permeability oedema.
B. Widened- commonest in over hydration or renal failure.
C. Narrowed- commonest in capillary permeability oedema.
Adapted from Milne et al, 1984.

13
2.2.5 POTENTIAL MODIFYING FACTORS IN DETERMINING VPW
The vascular pedicle width is affected by various factors. They are divided to
anatomical and physiological factors. In anatomical aspect VPW correlates well with
body weight and surface area, but poorly correlates with height (Milne et al, 1984). The
patient’s build must be taken in into account by radiologist in considering the width of
vascular pedicle. A study by Milne et al, 1984, a 70kg subject of average build may
have same VPW as a tall thin man or small fat one.
Another recent study was done by Azura et al in 2009 found that the mean
weight of 140 ventilated ICU patients was 62.6 kg(± 18.1) with the mean of VPW of
64.4 mm (± 10.6) which was smaller than other previous studies. They concluded that
the possible cause was due to small body habitus of Asian population compared to
Caucasian population. Moreover, there was statistically significant correlation was seen
between the weight and VPW in their study (p<0.001) (Azura et al, 2009).
2.2.5.1 Physiological factors affecting VPW
Physiological factors affecting VPW are listed below, they include respiration
and gravity.
2.2.5.1(a) Respiration
There is variation between inspiration and expiration. On inspiration the
intrathoracic pressure becomes more negative, blood is pumped into the thorax and the

14
vascular pedicle become larger. On expiration, the intrathoracic pressure becomes more
positive and blood is no longer pumped in, however VPW does not usually diminish
because the diaphragm moves up, compacting the mediastenum and tending to widen
the pedicle. The result of the two opposing factors is that the pedicle usually stay the
same or change by only a few millimeters (Milne et al, 1984).
2.2.5.1(b) Gravity
Gravity plays a major effect in changing the width of VPW. Study by Milne et
al in 1984 in 10 volunteers show VPW increased from 7 to 40% in supine position.
While another study using 32 cardiac patients examined in erect position, VPW
increased to 21± 7.3%.
2.2.5.2 Technical factors affecting VPW
Few technical factors affecting VPW which are position, tube to film distance,
kilo voltage and rotation. Assessment for the change of VPW size in serial radiographs
can be a considerable clinical value (Pistolesi et al,1984).
2.2.5.2(a) PA versus AP position
There is little appreciable change in width of the pedicle between the two
positions whether PA or AP projection since one border of the pedicle lies anteriorly
and other posteriorly (due to one or the other vascular border is alwaysclose to film.

15
Changing from the PA to AP position will cause a small geometric enlargement in
VPW. (Milne et al, 1984).
2.2.5.2(b) Tube to film distance
On radiographs obtained at 40 inches; as opposed to the conventional 72 inches
VPW would geometrically increase by approximately 5% (Milne et al, 1984). In other
words, the closer the tube to the film, the larger the width of VPW.
2.2.5.2(c) Kilovoltage
The margin of vascular pedicle can usually be seen whether a radiograph is over
penetrated or underpenetrated, however it is difficult to visualize the vein (specifically
azygos vein) on an underpenetrated radiograph (Milne et al, 1984).
2.2.5.2(d) Rotation
The great vessels tend to be arranged partially around the circumference of a
circle surrounding the trachea, rotation has a smaller effect on the apparent width of the
pedicle. If the patient is turned to the left, the apparent VPW diminishes and if he is
turned to his right the apparent VPW increases. On average turning the patient 15
degree to the left, decreases VPW by 6% and turning the same amount to the right
increases VPW by 6% (Milne et al, 1984).

16
In addition to patient positioning and technical factors, some have raised
concern that disease process or respiratory effort might affect the assessment of VPW.
Indeed, when components of the silhouette have been altered by mediastinal disease,
vascular engorgement, or the effects of prior trauma, radiation or thoracic surgery, the
utility of VPW may be compromised (Miller et al, 2006).
Increased VPW may also occur in patients with extravascular bleeding. On the
other hand, while elevated intravascular volume predominantly causes widening to the
right of the midline, aortic injury causes widening predominantly to the left of midline,
together with vanishing of the right paratracheal stripe and azygos vein.

17
2.2.6 USEFULNESS OF SERIAL MEASUREMENTS OF VPW
Serial measurement of VPW from portable CXRs has significant assessment of
intravascular volume status. In a study by Pistolesi et al, 1984, of upright, non
mechanically ventilated patients undergoing cardiac catherization, the VPW and total
blood volume were rightly correlated. A change in volume status correlated with the
change in VPW ( r = 0.93, p<0.001). Furthermore, an increase in 1 L in total blood
volume resulted in an increase of VPW by 5 mm when CXRs were serially obtained in
upright position (Pistolesi et al, 1984).
A study by Pistolesi et al in1984 among 42 patients with cutaneous burn, the
patients preceeded development of pulmonary oedema following fluid resuscitation as
evidence of widening of vascular pedicle on serial films. They highlighted that
development of pulmonary oedema occurred during first 3.3 days after injury was
associated with widening of vascular pedicle by 69mm (Pistolesi et al, 1984) during
initial 24 hours of fluid resuscitation. Patients who later developed pulmonary oedema
had received more intravenous fluid (16.0L compared with 8.9L) during this period.
Furthermore 12 of 13 patients who at least increased VPW by 1 cm later end up with
pulmonary oedema.
A study by Martin et al in 2002, prospectively measuring changes in net fluid
intake and in patient’s weight and comparing these with serial VPW measurements.
Among 133 portable supine chest radiographs in 36 mechanical ventilated patients with
acute lung injury, they found that clinically detectable and significant reduction of VPW

18
over a 5 day period (p= 0.02) was associated with a mean net diuresis of 3.3L and
weight loss of 10kg.
Clinical application of these radiographic signs requires an awareness of
potential confounding factors as mentioned before such as patient posture, radiographic
technique and ventilator- patient interactions. Thus limitations imposed by these and
other factors should encourage standardisation of interpreting portable chest radiograph
(Meade et al, 2000). By this standardisation we can optimize pertinent, available
information on our patients’ films.

19
2.3 CARDIOTHORACIC RATIO (CTR)
2.3.1 DEFINITION
The cardiothoracic ratio was calculated as the ratio of the maximal transverse
diameter of the cardiac silhouette (‘heart diameter’) to the distance between the
internal margins of the ribs at the level of the right hemidiaphragm ‘transverse thoracic
diameter’ (Figure 2.4) (Martin et al, 2002).
The upper limit of normal CTR is generally held to be around 50%. The bigger
ratio may occur in some population such as among Africans and Asians which can be
up to 55% (Grainger, Allison, 2002).
The most commonly used radiographic definition of cardiomegaly on the
standard, upright, posteroanterior chest radiograph is a CTR over 0.5 (Badgett et al,
1997). Milne et al in 1998 determined the portable anteroposterior chest radiographs
with focal film distance of 40 inches, a correct factor of 12.5% for CTR can be used to
approximate whether or not cardiomegaly exists.
CTR is increased by nonstandard radiographic techniques such as poor
inspiration, radiographs exposed supine, prone, anteroposterior or with a short focus-
film distance. It is also influenced by age and build of the patient (Grainger, Allison,
2002).

20
A recent meta-analysis of 29 studies determined that cardiomegaly on the CXR
was the best correlation for predicting a reduced ejection fraction, with a sensitivity and
specificity of 51% and 79%, respectively (Badgett et al,1996). It is important to
recognize confounding factors that can lead to false-positive interpretations of
cardiomegaly, such as an apical fat pad, a transversely positioned heart, an expiratory
film, or a decrease in the thoracic width (Badgett et al,1996). Portable films which are
taken in the anteroposterior and supine position enlarge the appearance of the cardiac
silhouette.

21
Figure 2.4: Measurement of cardiothoracic ratio:
Percentage of the heart size with its internal thoracic diameter. It is derived from
dividing the widest transverse diameter of the cardiac silhouette by the widest
transverse diameter of the internal thoracic above the diaphragm
Adapted from Martin et al, 2002

22
2.3.2 USEFULNESS OF CARDIOTHORACIC RATIO IN PULMONARY
OEDEMA
A prospective study by Thomason et al in 1998 obtained and evaluated chest
radiograph in 33 supine, mechanically ventilated patients with pulmonary artery
catheters. They used portable, anteroposterior supine chest radiograph in distinguishing
hydrostatic pulmonary oedema from permeability pulmonary oedema. Their study
showed hydrostatic pulmonary oedema associated with larger CTR, subjective
impression of cardiomegaly and increased VPW. Hydrostatic pulmonary oedema was
found to correlate best using a VPW of more than 63mm with CTR of more than 0.52.
With this approach, the radiologists may have been able to improve their diagnostic
accuracy to 73%. A recent study was done by Azura et al in 2009 showed that
significant strong correlation of VPW and CTR in non serial chest radiographs in 140
ventilated ICU patients.
Another prospective study by Ely et al in 2001 by using portable, digital chest
radiographs to determine the intravascular volume status. The result proved that VPW
and CTR were the most important individual radiographic predictor of volume status
(analysis used logistic regression and receiver operating curve).
23
2.4 PULMONARY OEDEMA
2.4.1 INTRODUCTION
Increased extravascular lung water is a common and sometimes life threatening
clinical problem particularly in critical-care unit patients. There are four principle
mechanisms of oedema formation which are increased hydrostatic pressure gradient
across the capillary wall, diminished osmotic pressure gradient across the wall,
increased capillary permeability (damage to the endothelial cell junction, which permits
both fluid and large molecules to leak out of the vessels) and ability of the lymphatics to
remove excess extravascular lung water (Milne et al, 1984). Pulmonary oedema cannot
be detected at an early stage or quantitated accurately by physical examination alone
(Ingram et al, 1980). Several non invasive techniques have therefore been developed,
which attempt to detect oedema by assessment by its effects on the physical properties
of the lungs (Gray et al, 1979).
2.4.2 TYPES OF PULMONARY OEDEMA
There are two general different types of pulmonary oedema which are
cardiogenic pulmonary oedema which is the most common type (also termed
hydrostatic oedema commonly resulting from myocardial or valvular heart disease) and
noncardiogenic pulmonary oedema (this is due to increased permeability pulmonary
oedema) which can be caused by a wide variety of pathologic, trauma and infective
condition resulting in injury to the pulmonary microvasculature (Milne et al,1984). Non

24
cardiogenic pulmonary oedema also includes over hydration usually caused by an
excess of saline effusion or renal failure.
2.4.3 RADIOLOGICAL DETECTION AND DIFFERENTIATION OF OEDEMA
The ability of the radiologist to quantitate oedema from the chest radiograph was
first demonstrated objectively by Milne et al, (1985). Chest radiograph is the only
practical method of detecting pulmonary oedema at an early stage and following its
evolution accurately. The validity of the radiographic method is now widely accepted
by clinicians and physiologist (Staub NC, 1983). A recent regional study by Azura et al
in 2009 in 140 ventilated patients in ICU found that a patient will have 1.2 time risk of
having pulmonary oedema when there is an increment of VPW measurement by
0.17mm.
The distinct mechanisms of cardiogenic and noncardiogenic pulmonary oedema
result in some moderate distinguishing findings on a posteroanterior or portable
anteroposterior chest radiograph. A measurement of the width of vascular pedicle may
improve the diagnostic accuracy of the chest radiograph, but its utility in distinguishing
cardiogenic from noncardiogenic oedema needs further evaluation (Ely et al, 2002).
There are several explanations for the limited diagnostic accuracy of the chest
radiograph. Oedema may not be visible until the amount of lung water increases by 30
percent (Pistolesi et al,1978). Any radiolucent material that fills the airway spaces (such
as alveolar haemorrhage, pus, bronchoalveolar carcinoma) will produce radiographic
image similar to that of pulmonary oedema. In many instances, clinical history,
symptoms and signs and clinical course of the patient’s disease will be sufficient to