Embed Size (px)
Citation preview

7/27/2019 ACIL Tasman April 2009
http://slidepdf.com/reader/full/acil-tasman-april-2009 1/104
Final Report
Fuel resource, new entry and
generation costs in the NEM
Prepared for the Inter-Regional Planning Committee
April 2009

7/27/2019 ACIL Tasman April 2009
http://slidepdf.com/reader/full/acil-tasman-april-2009 2/104
Reliance and Disclaimer
The professional analysis and advice in this report has been prepared by ACIL Tasman for the exclusive use of the party or
parties to whom it is addressed (the addressee) and for the purposes specified in it. This report is supplied in good faith and
reflects the knowledge, expertise and experience of the consultants involved. The report must not be published, quoted or
disseminated to any other party without ACIL Tasman‟s prior written consent. ACIL Tasman accepts no responsibility
whatsoever for any loss occasioned by any person acting or refraining from action as a result of reliance on the report, other
than the addressee.
In conducting the analysis in this report ACIL Tasman has endeavoured to use what it considers is the best information
available at the date of publication, including information supplied by the addressee. Unless stated otherwise, ACIL Tasman
does not warrant the accuracy of any forecast or prediction in the report. Although ACIL Tasman exercises reasonable care
when making forecasts or predictions, factors in the process, such as future market behaviour, are inherently uncertain andcannot be forecast or predicted reliably.
ACIL Tasman shall not be liable in respect of any claim arising out of the failure of a client investment to perform to the
advantage of the client or to the advantage of the client to the degree suggested or assumed in any advice or forecast given
by ACIL Tasman.
ACIL Tasman Pty Ltd
ABN 68 102 652 148Internet www.aciltasman.com.au
Melbourne (Head Office)Level 6, 224-236 Queen StreetMelbourne VIC 3000
Telephone (+61 3) 9600 3144Facsimile (+61 3) 9600 3155Email [email protected]
DarwinSuite G1, Paspalis Centrepoint48-50 Smith StreetDarwin NT 0800GPO Box 908Darwin NT 0801
Telephone (+61 8) 8943 0643
Facsimile (+61 8) 8941 0848Email [email protected]
BrisbaneLevel 15, 127 Creek StreetBrisbane QLD 4000GPO Box 32Brisbane QLD 4001
Telephone (+61 7) 3009 8700Facsimile (+61 7) 3009 8799Email [email protected]
PerthCenta Building C2, 118 Railway Street West Perth WA 6005
Telephone (+61 8) 9449 9600
Facsimile (+61 8) 9322 3955Email [email protected]
CanberraLevel 1, 33 Ainslie PlaceCanberra City ACT 2600GPO Box 1322Canberra ACT 2601
Telephone (+61 2) 6103 8200Facsimile (+61 2) 6103 8233Email [email protected]
SydneyPO Box 1554Double Bay NSW 1360
Telephone (+61 2) 9389 7842
Facsimile (+61 2) 8080 8142Email [email protected]
For information on this report
Please contact:
Owen Kelp Telephone: (07) 3009 8700Email: [email protected]

7/27/2019 ACIL Tasman April 2009
http://slidepdf.com/reader/full/acil-tasman-april-2009 3/104
Fuel resource, new entry and generation costs in the NEM
iii
Contents
Glossary 1
1 Introduction 1
2 Definitions and methodology 3
2.1 Short-run marginal cost (SRMC) 3
2.2 Long-run marginal cost (LRMC) 5
2.2.1 New entrant model 5
2.2.2 Discount rate 52.2.3 Conversion to annual equivalent cost 8
2.3 Methodology 8
2.3.1 Fuel costs 8
2.3.2 Thermal efficiencies 13
2.3.3 Operation and maintenance costs 14
2.3.4 Auxiliaries 15
2.3.5 Emission factors 15
2.3.6 Retirement criteria 16
2.3.7 New entrant cost estimates 19
2.4 Key assumptions 20
2.4.1 Exchange rates 21
2.4.2 WACC for new entrants 21
2.4.3 Emission permit price 22
3 Existing, committed and advanced proposals 24
3.1 Plant type and capacities 24
3.2 Thermal efficiency, auxiliaries and O&M costs 27
3.3 Emission factors 30
3.4 Fuel supply for existing generators 32
3.4.1 Coal 33
3.4.2 Natural gas 42
3.4.3 Liquid fuel 45
3.5 Government schemes 45
3.6 SRMC 46
4 New entrant technologies 52
4.1 Emission factors 61
4.2 Fuel supply for new entrants 63
4.2.1 Natural gas 634.2.2 Coal 72
7/27/2019 ACIL Tasman April 2009
http://slidepdf.com/reader/full/acil-tasman-april-2009 4/104
Fuel resource, new entry and generation costs in the NEM
iv
4.2.3 Nuclear 75
4.3 SRMC for new entrant technologies 75
4.4 LRMC for new entrant technologies 81
4.5 Annualised costs 88
4.6 Brownfield expansions 91
A Scope of work A-1
Figures and tables
Figure 1 16 NEM zones 2 Figure 2 Historic spot prices for thermal coal export 35 Figure 3 Forecast of average annual export thermal coal prices (A$/tonne
FOB) 37 Figure 4 Implied cost of capture, transport and storage of CO2 81
Table 1 Summary of fuel cost treatment and data sources 12 Table 2 Estimated compensation entitlements under ESAS 18 Table 3 Key assumptions used within the analysis 21 Table 4 WACC parameters 22 Table 5 Assumed emission permit prices 23 Table 6 Type and capacity of existing and committed plant in NSW 24
Table 7 Type and capacity of existing and committed plant in QLD 25 Table 8 Type and capacity of existing and committed plant in SA 25 Table 9 Type and capacity of existing and committed plant in TAS 26 Table 10 Type and capacity of existing and committed plant in VIC 26 Table 11 Type and capacity of advanced proposals 26 Table 12 Estimated thermal efficiency, auxiliaries and O&M costs for NSW
stations 27 Table 13 Estimated thermal efficiency, auxiliaries and O&M costs for QLD
stations 28 Table 14 Estimated thermal efficiency, auxiliaries and O&M costs for SA
stations 28 Table 15 Estimated thermal efficiency, auxiliaries and O&M costs for TAS
stations 29 Table 16 Estimated thermal efficiency, auxiliaries and O&M costs for VIC
stations 29 Table 17 Estimated thermal efficiency, auxiliaries and O&M costs for
advanced proposals 29 Table 18 Emission factors and intensity for existing and committed NSW
stations 30 Table 19 Emission factors and intensity for existing and committed QLD
stations 31 Table 20 Emission factors and intensity for existing and committed SA
stations 31 Table 21 Emission factors and intensity for existing and committed TAS
stations 32

7/27/2019 ACIL Tasman April 2009
http://slidepdf.com/reader/full/acil-tasman-april-2009 5/104
Fuel resource, new entry and generation costs in the NEM
v
Table 22 Emission factors and intensity for existing and committed VICstations 32
Table 23 Emission factors and intensity for advanced proposals 32 Table 24 Method of projecting coal prices in the NEM 34 Table 25 Projected marginal coal prices into NSW stations ($/GJ) 38 Table 26 Estimated coal costs for Victorian generators in 2009-10 39 Table 27 Projection of marginal cost of coal into VIC and SA power stations
($/GJ) 40 Table 28 Projection of marginal cost of coal into QLD power stations ($/GJ) 42 Table 29 Estimated delivered gas costs to existing, committed and
advanced proposals (Real $/GJ) 44 Table 30 SRMC of existing, committed and advanced proposals excluding
carbon costs ($/MWh generated) 47 Table 31 SRMC of existing, committed and advanced proposals including
carbon costs ($/MWh generated) 49 Table 32 New entrant technologies: capacity, auxiliaries, thermal efficiency
and O&M costs 55 Table 33 New entrant technologies: economic life, lead times and
construction profiles 56 Table 34 New entrant technology availability by NEM zone 57 Table 35 Capital cost projection by technology (Real 2009-10 $/kW) 58 Table 36 Thermal efficiency projection for new entrant technologies (sent-
out HHV) 59 Table 37 Thermal efficiency projection for new entrant technologies
(generated HHV) 60 Table 38 Combustion emission factors for new entrant technologies (kg
CO2-e per GJ of fuel) 61 Table 39 Fugitive emission factors for new entrant technologies (kg CO2-e
per GJ of fuel) 62 Table 40 Total emission factors for new entrant technologies (kg CO2-e per
GJ of fuel) 62 Table 41 Emission intensity for new entrant technologies (tonnes CO2-e per
MWh sent-out) 63 Table 42 Overview of Queensland LNG export proposals 66 Table 43 NEM zones and gas price points 67 Table 44 Estimated delivered gas costs for new entrant CCGT and OCGT
by NEM zone (Real $/GJ) 69
Table 45 Current gas reserves by NEM region (PJ) 70 Table 46 Gas price index as a function of gas demand 71 Table 47 NEM zones where coal fired generation is an option 72 Table 48 Projection of coal costs for new entrant stations ($/GJ) 73 Table 49 Summary of potential black coal deposits suitable for large scale
base load generation 74 Table 50 Projected SRMC for new entrant technologies excluding carbon
costs (Real 2009-10 $/MWh as generated) 76 Table 51 Projected SRMC for new entrant technologies including carbon
costs (Real 2009-10 $/MWh as generated) 78 Table 52 LRMC for new entrant technologies by NEM zone excluding
carbon costs (Real 2009-10 $/MWh as generated) 82
Table 53 LRMC for new entrant technologies by NEM zone includingcarbon costs (Real 2009-10 $/MWh as generated) 85

7/27/2019 ACIL Tasman April 2009
http://slidepdf.com/reader/full/acil-tasman-april-2009 6/104
Fuel resource, new entry and generation costs in the NEM
vi
Table 54 Annualised capital, fixed O&M and tax costs for new entranttechnologies (Real 2009-10 $/kW/year) 89
Table 55 Annualised tax costs for new entrant technologies (Real 2009-10$/kW/year) 90
Table 56 Potential brownfield conversions/upgrades 91 Table 57 Capital cost projection for brownfield upgrades/conversions (Real
2009-10 $/kW) 92 Table 58 Annualised capital, fixed O&M and tax costs for brownfield
upgrades/conversions (Real 2009-10 $/kW/year) 92 Table 59 Annualised tax costs for brownfield upgrades/conversions (Real
2009-10 $/kW/year) 92

7/27/2019 ACIL Tasman April 2009
http://slidepdf.com/reader/full/acil-tasman-april-2009 7/104
Fuel resource, new entry and generation costs in the NEM
Introduction 1
GlossaryCCGT Combined cycle gas turbine
CPRS Carbon Pollution Reduction Scheme
Cogen Abbreviation for cogeneration (the joint production of electricaland heat energy)
CSG Coal seam gas – hydrocarbon gas (principally methane) that iscontained within coal seams and able to be produced by drillingfrom the ground surface or within mine workings
ESAS Electricity Sector Adjustment Scheme
GJ Gigajoule, 109 (or one billion) joules, a measure of energy
GT Gas turbine (power station)
GWh Gigawatt hours, 109 (or one billion) watt hours, a unit of electricalenergy
MDQ Maximum Daily Quantity: the maximum quantity of gas (usuallyexpressed in TJ/day) that a shipper is contractually entitled to
transport through a pipeline
MJ Megajoule, 106 (or one million) joules, a measure of energy
MW Megawatts, 106 (or one million) watts, a unit of electrical power
MWh Megawatt hour, 106 (or one million) watt hours, a unit of electrical energy
NEM National Electricity Market
NEMMCO National Electricity Market Management CompanyO&M Operations and maintenance (costs)
PJ Petajoule, 1015 (or one million billion) joules, a measure of energy
TJ Terajoule, 1012 (or one thousand billion) joules, a measure of energy
VOM Variable operating and maintenance costs (costs which aredirectly related to power station output)
ROM Run of mine, raw coal produced from a coal mine
FOM Fixed operating and maintenance costs (those costs which donot vary with power station output)
FOB Free on board, a price that includes all delivery and costs
involved in loading commodities on board a ship
Line pack The gas contained within a transmission pipeline from time totime in order to maintain operating pressure
MDQ Maximum Daily Quantity: the maximum quantity of gas (usuallyexpressed in TJ/day) that a shipper is contractually entitled totransport through a pipeline

7/27/2019 ACIL Tasman April 2009
http://slidepdf.com/reader/full/acil-tasman-april-2009 8/104
Fuel resource, new entry and generation costs in the NEM
Introduction 1
1 Introduction This report has been prepared by ACIL Tasman for the Inter-regional
Planning Committee (IRPC) as part of the 2008-09 generator cost project. The
consultancy is aimed at providing the data required to model bidding
behaviour of the NEM‟s existing generation assets and the costs of investment
in new generation assets.
This data is to be used by NEMMCO to conduct market simulation studies as
part of the upcoming transmission assessment (formerly called the Annual
National Transmission Statement or ANTS). The intent of this study is to
identify the requirement for additional transmission infrastructure in the NEM,given the projected generation expansion scenarios.
The transmission assessment requires cost data for existing and potential new
entrant generation plant in the NEM for each of the 16 identified NEM zones
as shown in Figure 1. Cost data is required for all scheduled existing and
committed generators as well as for advanced proposals and various new
entrant technologies. A complete list of the data elements requested under this
project is outlined within the scope of work which is attached as Appendix A.
This report represents the output of ACIL Tasman‟s analysis. The report is
accompanied by an excel spreadsheet which provides more detail in relation to
the cost data than is able to be provided within the written document.
This report is structured as follows:
• Chapter 2 provides the working definitions of SRMC and LRMC as used within the analysis and also discusses the methodology used in thecollection and treatment of the data elements
• Chapter 3 provides information and data on the existing, committed NEM-scheduled generators and those projects deemed to be advanced proposals.
This includes type and capacity, thermal efficiencies, auxiliaries, O&M
costs, emission factors, fuel costs and SRMC.
• Chapter 4 examines the attributes and costs for a range of new entranttechnologies including both short-run and long-run cost elements. Costsfor new entrants are also provided on an annualised basis in $/kW.
• Appendix A details the scope of work for this project.

7/27/2019 ACIL Tasman April 2009
http://slidepdf.com/reader/full/acil-tasman-april-2009 9/104
Fuel resource, new entry and generation costs in the NEM
Introduction 2
Figure 116 NEM zones
Map source: NEMMCO

7/27/2019 ACIL Tasman April 2009
http://slidepdf.com/reader/full/acil-tasman-april-2009 10/104
Fuel resource, new entry and generation costs in the NEM
Definitions and methodology 3
2 Definitions and methodology This chapter provides the working definitions that have be used for the Short-
run Marginal Cost (SRMC) and Long-run Marginal Cost (SRMC) for power
stations as part of this project.
2.1 Short-run marginal cost (SRMC)
The short-run is defined as a period of time where at least one input variable
remains fixed. In the case of power generation, the short-run is typically
defined as being a period where generation capacity remains fixed. Therefore
the SRMC is the incremental cost incurred from an increment of output (ie
1 MWh) from the existing generation fleet. SRMC will vary from station to
station.
Using this definition, the SRMC for each station will vary over the short-run as
the incremental cost for an increment of output depends on whether the plant
is operating and the level of output at which it is operating. For example, a
plant that needs to be started incurs additional costs in terms of fuel and other
inputs. Similarly, a plant operating at 60% output will have a different
incremental cost for an increment of output than if it was operating at 80%
because of different thermal efficiencies at different levels of output.
For the purpose of this project we have defined the „short-run‟ to mean a
period of 1 year. Therefore the SRMC is defined as being the additional cost
incurred of producing an additional MWh on average over the course of the
year.
With this definition in mind, the relevant inputs that form the SRMC are:
• The average marginal thermal efficiency for a station over the year
• The average marginal fuel cost incurred over the year
• The average marginal variable O&M costs incurred over the year• The average marginal emission factors over the year.
One could argue that the above definition is better described as the Short-run
Average Cost (SRAC), rather than the SRMC. In the majority of circumstances
this may be true in that SRMC would equal SRAC. However there are
significant differences for some plant. For example, the SRMC for Victorian
brown coal generators would not include overheads and capital items that
relate to operation of the mine, whereas these would be included in the SRAC.
In general we would expect differences between SRMC and SRAC in situations
where a generator owns and operates its own fuel supply.

7/27/2019 ACIL Tasman April 2009
http://slidepdf.com/reader/full/acil-tasman-april-2009 11/104
Fuel resource, new entry and generation costs in the NEM
Definitions and methodology 4
We have provided the components to estimate the SRMC in gross (or „as
generated‟) and sent-out terms. It should be noted however that the sent-outSRMC is the value that we expect that generators actually use when
constructing their offer curves since the generator is paid for the sent-out
energy and not the „as generated‟ energy. Using the „as generated‟ SRMC in
formulating the offer curve would in effect result in the generator not fully
recovering their avoidable costs where their SRMC offer set the market price
for a given trading interval.
The estimated SRMC for each station is calculated using the following
formulae:
= × + + × + 1000
× −− = × 1 −
Where:
• SRMCSO is the short-run marginal cost on a sent-out basis (in $/MWh)
• SRMCG is the short-run marginal cost on a generated basis (in $/MWh)
• TESO is the thermal efficiency on a sent-out basis (in GJ/MWh)
• FC is the fuel cost (in $/GJ)
• VOM is the variable operating and maintenance cost on a sent-out basis (in$/MWh)
• CEF is the combustion emission factor (in kg CO2-e/GJ)
• FEF is the fugitive emission factor (in kg CO2-e/GJ)
• EPP is the emission permit price (in $/tonne CO2-e/MWh)
• NGAC is any benefit derived from the production of certificates under theNSW Greenhouse Gas Abatement Scheme (in $/MWh)
• GEC is any benefit derived from the production of certificates under theQueensland gas scheme (in $/MWh)
• Aux is the station‟s auxiliaries (as a ratio of auxiliaries to total energy generated).
The above definition differs slightly from the 2007 cost report in that fugitive
emissions (emissions resulting from the production and transport of fuel) are
included. This is valid where the fuel costs used do not already include costs
associated with emissions on production and transport of the fuel (ie no
double counting). The benefit of including the fugitive emission factors directly
within the SRMC formula as opposed to the fuel prices is that different carbon
price scenarios can be tested without the need to adjust fuel costs.

7/27/2019 ACIL Tasman April 2009
http://slidepdf.com/reader/full/acil-tasman-april-2009 12/104
Fuel resource, new entry and generation costs in the NEM
Definitions and methodology 5
With the anticipated introduction of the Carbon Pollution Reduction Scheme
(CPRS) in July 2010, ACIL Tasman expects both the NSW Greenhouse Gas Abatement Scheme and the Queensland GEC scheme to cease operation. As a
result, the impact of NGACs and GECs upon generator‟s SRMC is only
expected to occur for the first year of the projection (2009-10).
2.2 Long-run marginal cost (LRMC)
The long-run is usually defined as a period of time in which all inputs can be
varied. In the case of the generation sector the key difference in inputs that can
be varied is the capacity of the generation fleet. Therefore, the LRMC is
defined as the cost of an incremental unit of generation capacity, spread across
each unit of electricity produced over the life of the station.
When calculating LRMC for new generation, the costs considered include all
costs relevant to the investment decision. These costs are:
• The capital cost (including connection and other infrastructure)
• Other costs including legal and project management costs
• Fixed operating and maintenance costs
• Variable costs over the life of the station
• Tax costs (if using a post-tax discount rate).
ACIL Tasman estimates LRMC for plant based on a Discounted Cash Flow
(DCF) new entrant model which is discussed in the following section.
2.2.1 New entrant model
The new entrant model utilised by ACIL Tasman is a simplified DCF model
for a greenfield generation project. It is significantly simpler than a DCF model
which would be utilised to evaluate an actual investment decision for a specific
project due to the fact that it is by definition generic and designed to be
suitable for a range of projects and proponents.
Cash flows within the model are evaluated on an un-geared post-tax basis and
include the effect of depreciation. A geared project post tax WACC is used as
the project discount rate in effect incorporating gearing upstream. However,
the cash flows do not directly include the effects of the interest tax shield and
dividend imputation credits.
2.2.2 Discount rate
ACIL Tasman uses a calculated WACC as a conservative proxy for an
investment decision hurdle rate for electricity market modelling. This is
appropriate for a number of reasons:
7/27/2019 ACIL Tasman April 2009
http://slidepdf.com/reader/full/acil-tasman-april-2009 13/104
Fuel resource, new entry and generation costs in the NEM
Definitions and methodology 6
• Most work in relation to market modelling relates to pool price projections.In the medium-to-long term prices will trend toward new entry levels andhaving conservative projections is desirable in due diligence and advisory
work.
• In our experience, generation proponents who actually proceed withdevelopment tend to do so earlier than so called rational models wouldpredict. This implies that either:
− proponents that proceed are necessarily aggressive and use settings within their evaluation models which unduly favour their project
− proponents overestimate the revenues and/or underestimate the costsof their investments
− they are looking to capture other strategic benefits from market entry (early-mover or synergistic advantages) which are not apparent toexternal observers.
The discount rate used by ACIL Tasman within its new entrant model is a
calculated post-tax real WACC. A post-tax WACC is used because of the
importance of depreciation for capital intensive plant such as power stations. A
pre-tax WACC makes simplifications on the effects of depreciation and is in
ACIL Tasman‟s vie w, an inferior method for estimating the LRMC of
generation.
When using a DCF a number of WACC derivations and cash flow models canbe used. Choices need to be made as to whether the analysis is performed on a
real or nominal, pre or post-tax basis. Once this has been decided, the model
can either incorporate items such as the tax shield (recognition of the
deductibility of interest payments for tax purposes) and imputation credits
explicitly within the cash flows, or alternatively via adjustment to the WACC
itself.
There are a number different expressions for post-tax WACC, the most
common ones include:1
• Vanilla• Monkhouse
• Officer.
The Officer formula is the most complex of these owing to the fact that it
incorporates all tax effects in the WACC calculation itself and is applied to
simple post-tax cash flows. The Officer WACC is the most widely cited as the
1 It should be noted that each of these formulas are equivalent if the analysis is performed on apre-tax basis.

7/27/2019 ACIL Tasman April 2009
http://slidepdf.com/reader/full/acil-tasman-april-2009 14/104
Fuel resource, new entry and generation costs in the NEM
Definitions and methodology 7
target post-tax WACC because this definition of WACC is commonly used for
asset valuation and project evaluation. As the Officer WACC formula includes the interest tax shield and imputation
credits there is potential for inaccuracies to exist as it is essentially a
simplification. This is particularly so in the case of finite projects which have
different amounts of depreciation and tax payable throughout the project life.
A more accurate means of accounting for these elements can be achieved by
incorporating them explicitly into the cash flows and using a Vanilla WACC.
However, one must then make assumptions regarding the type, structure and
tenure of debt finance for the project which does not lend itself to the generic
analysis that we undertake with the LRMC model.
ACIL Tasman utilises a post-tax real Officer WACC within its new entrant
model and applies it to un-geared cash flows that do not include the effects of
the interest tax shield or dividend imputation credits.
The post-tax nominal Officer WACC as used by ACIL Tasman is expressed as:
(− ) = × (1 − )
1− 1 − + × (1 − )
Where:
• E is the total market value of equity
• D is the total market value of debt
• V is the total enterprise value (value of debt plus equity)
• R e is the nominal post-tax cost of equity
• R d is the nominal post-tax cost of debt
• TE is the effective corporate tax rate
• G (Gamma), which is the value of imputation tax credits as a proportion of the tax credits paid.
The nominal post-tax WACC is adjusted into real terms using the Fischerequation as follows:
(− ) = 1 + (− )(1 + ) − 1
Where:
• F is the relevant inflation rate.

7/27/2019 ACIL Tasman April 2009
http://slidepdf.com/reader/full/acil-tasman-april-2009 15/104
Fuel resource, new entry and generation costs in the NEM
Definitions and methodology 8
The Officer WACC is applied to cash flows that do not include the effects of
the interest tax shield and dividend imputation credits. That is, cash flows areun-geared and defined simply as:
ℎ ( ) = × (1 − ) Where:
• X is the project cash flow
• T is the statutory corporate tax rate.
2.2.3 Conversion to annual equivalent cost
The LRMC derived from the new entrant model is expressed in $/MWh terms,assuming a given capacity factor and other variable cost components. It is
useful to convert the LRMC into an annual equivalent fixed cost by stripping
out these variable components.
In converting LRMC (in $/MWh) to an annual equivalent fixed cost (in
$/kW/year) the following process is used:
= − × 8.76 ∗∗ 1 −
Where: • LRMC is the long-run marginal cost in $/MWh as discussed above
• SRMC is the short-run marginal costs (fuel, variable O&M and emissioncosts) in $/MWh
• CF is the assumed capacity factor (%) used to derive the LRMC
• Aux is the station‟s auxiliary requirements (%).
This provides a measure of fixed costs in $/kW/year that is suitable for use by
NEMMCO in evaluating suitable timing for new entry.
2.3 Methodology
This section outlines the methodology used in the estimation of cost data for
existing and new entrant plant. Each component of SRMC is discussed briefly,
outlining ACIL Tasman‟s approach in gathering the necessary data.
2.3.1 Fuel costs
The marginal fuel cost is dependent on a number of factors including:
• Contractual arrangements including pricing, indexation, tenure and take orpay provisions
• Mine/gas field and power station ownership arrangements

7/27/2019 ACIL Tasman April 2009
http://slidepdf.com/reader/full/acil-tasman-april-2009 16/104
Fuel resource, new entry and generation costs in the NEM
Definitions and methodology 9
• The availability of fuel through spot purchases or valuation on anopportunity cost basis
• Projected prices for new long-term contracts.
Each of these factors is taken into account in evaluating the fuel cost
component of SRMC as discussed below.
Contractual arrangements
Where the power station is dependent on a third party to supply fuel under
contract then the cost of incremental fuel is deemed to be the estimated
average contract price on a delivered basis.
As prices under contractual arrangements are almost never publicly available,
contract prices will be estimated based on a weighted-average of known
contract volumes and estimated prices.
We understand that there are instances in the NEM where the price paid for
fuel has been wholly or partially linked in some way to the regional reference
price (RRP) for electricity. This potentially results in the incremental fuel price
varying over time in line with the prevailing wholesale spot price. In these
instances we have assumed that the marginal cost of fuel is the average cost.
Vertically integrated fuel supply
Stations which are fully vertically integrated with their fuel supply have lower
fuel costs as a small increment in fuel use is unlikely to require additional
capital and maintenance and hence this incremental fuel does not include these
costs. Most brown coal stations in Victoria fall into this category.
More recently, there have been a number of proposed power stations in
Queensland involving an integrated coal seam gas development. These stations
would have similar incremental fuel cost advantages as the field development
costs are usually capitalised as part of the project.
For station owners who also own the associated coal mine and deposit but use
contract miners, the marginal fuel cost will be dependent on the contractual
arrangements with the contract miner and may not reflect the marginal cost
that would apply if mining activities were carried out in-house. For stations
such as these, the estimated mining contractor costs are used as the marginal
cost of fuel.
Spot market for fuel
There is currently no liquid spot market for either coal or gas in Australia. Therefore, basing fuel costs on an opportunity cost basis (i.e. the current

7/27/2019 ACIL Tasman April 2009
http://slidepdf.com/reader/full/acil-tasman-april-2009 17/104
Fuel resource, new entry and generation costs in the NEM
Definitions and methodology 10
market price as distinct from actual contracted cost) is rarely appropriate. This
approach would be more relevant for market such as the United States whichhas transparent and actively traded spot fuel markets operating.
ACIL Tasman maintains an approach which relies upon the use of estimated
actual contracted costs for fuels, with rollover onto market based rates upon
expiry.
Projecting prices for new long-term contracts
The following section outlines the approach used in projecting fuel prices for
new long-term contracts. Coal, natural gas and liquid fuels are discussed
separately.
Coal
New long-term coal prices depend upon whether the coal can be exported and
whether the power station is located as a mine mouth or remote from the mine
from which it is supplied.
Our analysis of coal prices relies principally upon estimates of costs of
production and transport (if relevant) to the station in question. This analysis is
undertaken on a deposit-by-deposit basis and takes into consideration the coal
resources available.
Where coal is exportable, the netback price available for the coal producer
becomes a factor in considering prices that may be made available for power
generation. However, given the stability offered from domestic contracts,
which offer long-terms at fixed prices, we assume that domestic coal receives a
20% discount over the export parity value of the Run-of-Mine (ROM) coal.
Hence the projected coal prices for new contracts for each NEM zone will be
determined by one of three factors:
• 80% of the export parity value of the ROM coal where it is greater than theROM coal mining cost. This generally applies to deposits which are higherquality coal and/or are generally closer to the export terminals.
• ROM coal mining costs where 80% of the export parity value of the ROMcoal is less than the mining costs and the coal is delivered to a mine-mouthpower station. This usually applies to deposits which are relatively inferiorin quality and/or some distance from export terminals while being relatively close to major transmission links (Felton, New Acland, Ulan etc).
• ROM coal mining costs plus transport costs to a power station site remotefrom the mine but closer to transmission infrastructure and where 80%export parity value of the ROM coal is again less than the mining costs but
where the deposit is greater than 100 km from the transmission system(Wandoan, Alpha, Pentland).

7/27/2019 ACIL Tasman April 2009
http://slidepdf.com/reader/full/acil-tasman-april-2009 18/104
Fuel resource, new entry and generation costs in the NEM
Definitions and methodology 11
The delivered prices can switch from one basis to another as export prices and
ROM coal mining costs are projected to vary. This is particularly the case asexport prices are projected to fall in real terms while mining costs are projected
to remain relatively constant in real terms (at a level somewhat below the
elevated costs seen in 2007 and into 2008 when fuel, tyre and equipment costs
were all affected by strong worldwide demand).
Natural gas
Long-term price projections for gas have been provided as output from our
proprietary gas market model – GasMark. GasMark incorporates a complete
input database containing data and assumptions for every gas producing field,
transmission pipeline and major load/demand centre in Australia. It is used by ACIL Tasman internally, and is also licensed to a number of external gas
market participants.
GasMark provides price projections for each defined node on the Eastern
Australian gas grid, which are mapped to each of the 16 NEM zones.
The availability of gas to support generation in each NEM zone is determined
by a number of factors, namely:
• The reserves and production capability of various fields (locally and in an
aggregate sense throughout Eastern Australia)• Existing transmission capacity into the zone (if the zone does not have
indigenous gas resources)
• The potential for new or additional transmission capacity.2
Other fuels
The price for liquid fuels (distillates and oils) is based on the global oil price,
converted to Australian dollars per GJ. As transportation costs for liquid fuels
are a relatively small proportion of the total cost, these have been ignored and
a single price for liquid fuel has been provided for all NEM zones. See section2.4 for details on the oil price assumption used for this project.
Summary of approach in estimating fuel costs
Table 1 summarises the proposed approach in relation to each fuel and
possible supply arrangements.
2 The planning and development of additional pipeline capacity is generally shorter than thestation itself and therefore does not impact upon the lead-time for gas plant development.

7/27/2019 ACIL Tasman April 2009
http://slidepdf.com/reader/full/acil-tasman-april-2009 19/104
12
Fue
lresource,newentryandgenerationcostsintheNEM
Definitionsandmethodology
Table 1 Summary of fuel cost treatment and data sources
Fuel Supply arrangements Treatment Data source Examples
Coal Third-party supplyEstimated weighted-average coal price under existing contracts, supplemented with projected newcontract prices as existing contracts expire
Coal company reporting,estimated mining and transportcosts
Bayswater, Mt Piper,Gladstone, Loy Yang B
CoalVertically integrated mine/power station utilising contract miners
Estimated average contractor costs, supplementedwith projected new contract prices if existing minereserves are exhausted
Power station owner reporting,estimated mining costs
Kogan Creek,Millmerran
CoalVertically integrated mine/power station
Estimated marginal mining costs (fuel, electricityand other consumables)
Estimated mining costsLoy Yang A, Yallourn,Hazelwood
Natural gas Third-party supplyEstimated weighted-average coal price under existing contracts, supplemented with projected newcontract prices as existing contracts expire
Gas company reporting,estimated production andtransport costs
Swanbank E, PelicanPoint, Tallawarra
Natural gasVertically integrated gasfield/power station
Estimated marginal production costs (gas used incompression, field operating costs, in-fill drilling)
Estimated marginal productioncosts
Condamine
Liquid fuels Third-party supply Estimated average spot priceProjected price based on oil priceforecast
Mt Stuart, Hunter Valley

7/27/2019 ACIL Tasman April 2009
http://slidepdf.com/reader/full/acil-tasman-april-2009 20/104
Fuel resource, new entry and generation costs in the NEM
Definitions and methodology 13
2.3.2 Thermal efficiencies
The thermal efficiency/heat rate for each existing station and new plant type
has been estimated in both net and gross terms. These values are presented as
a percentage (amount of energy converted from the fuel into electricity) and
also in GJ/MWh.
Thermal efficiency is presented on Higher Heating Value (HHV) basis which
includes the energy required to vaporize water produced as a result of the
combustion of the fuel. Efficiencies presented on a HHV basis (as opposed to
Lower Heating Value or LHV) are the appropriate measures to calculate fuel
use and the marginal costs of generation.3
Thermal efficiency for a given turbine can degrade over time. The extent of the
degradation depends on the nature of the maintenance program and the way in
which the plant is operated. An estimate of the current heat rate for existing
stations is based on typical historically observed capacity factors. For simplicity
these are assumed to remain constant over the remaining life of each station.
It is expected that with the introduction of the CPRS, capacity factors of
existing stations are likely to change considerably and this may have some
effect on estimated thermal efficiencies. For CCGT plant running at capacity
factors higher than observed historically we would expect thermal efficienciesto improve slightly. Conversely, emission intensive coal-fired plant may
experience lower capacity factors going forward and this could result in lower
thermal efficiencies. While the impact upon CCGT plant is reasonably clear,
lower capacity factors for coal plant may not necessarily result in lower thermal
efficiencies. Operators are likely to decommit individual units rather than run
an entire station at low output levels. As a result, the impact upon thermal
efficiencies for coal plant is likely to be small or negligible. Recognising the
difficulties involved in estimating thermal efficiencies for different capacity
factors, ACIL Tasman has provided a single value based on historical
operation.
Thermal efficiency for new entrants is expected to improve over time through
technology and design advancements and a projection of this improvement in
efficiency for new entrant plant has been estimated. The starting thermal
efficiency for new entrants is also assumed to remain constant over the life of
the station (i.e. no heat rate decay).
3 LHV values are often used by turbine manufacturers for comparison as these values areindependent of the type of fuel used. Efficiencies in LHV terms are higher when quoted asa percentage (more efficient) than efficiencies in HHV terms.
7/27/2019 ACIL Tasman April 2009
http://slidepdf.com/reader/full/acil-tasman-april-2009 21/104
Fuel resource, new entry and generation costs in the NEM
Definitions and methodology 14
As mentioned in the definition of SRMC (section 2.1), the thermal efficiency
that will be provided will represent an estimate of the average marginalefficiency over the course of a typical year. It is not practical to estimate
instantaneous heat rate curves.
2.3.3 Operation and maintenance costs
Operating and maintenance (O&M) costs comprise of both fixed and variable
components. Variable O&M (or VOM), is required for the estimation of
SRMC, while Fixed O&M (FOM) costs are required for new entrant costs and
decisions relating to retirements of incumbent plant.
Variable O&M
The additional operating and maintenance costs for an increment of electrical
output depends on a number of factors, including the size of the increment in
generation, the way in which wear and tear on the generation units is accrued
between scheduled maintenance (hours running or a specific number of start-
stop cycles) and whether operation is as a base load or peaking facility.
Generally, VOM is a relatively small portion of overall SRMC.
For coal, VOM includes additional consumables such as water, chemicals and
energy used in auxiliaries and incremental running costs such as ash handling.
For gas, in addition to consumables and additional operating costs, an
allowance is also included for major maintenance. The reason for including an
allowance for major maintenance in the VOM for gas turbines is because this
maintenance is not periodic, as it is for coal plant, but rather is generally
determined by hours of operation and specific events such as starts, stops, trips
etc.
It is these additional starts that mean that an OCGT peaking plant has a higher
VOM per MWh than either a CCGT base or intermediate load plant.
The VOM value is usually expressed in sent-out terms to account for internal
usage by the station (see below) rather than in „as generated‟ terms.
Fixed O&M
FOM represents costs which are fixed and do not vary with station output,
such as major periodic maintenance, wages, insurances and overheads. For
stations that are vertically integrated with their fuel supply, fixed O&M costs
can also include fixed costs associated with the coal mine/gas field. These
costs are presented on a $/MW installed/year basis.

7/27/2019 ACIL Tasman April 2009
http://slidepdf.com/reader/full/acil-tasman-april-2009 22/104
Fuel resource, new entry and generation costs in the NEM
Definitions and methodology 15
As major maintenance expenditure may not occur every year – major
maintenance may only occur every second, third or fourth year – the estimatedFOM values represent an annualised average for each station. Estimating FOM
costs for existing stations is difficult as reporting of financial information is
relatively scarce in the NEM. Costs for existing stations have been estimated
with reference to new entrant FOM costs, with adjustments made for the
plants age and size. It should be noted that FOM costs do not affect the
bidding behaviour of existing plants as the FOM does not vary with the output
of the station. However if the station operation was to cease, FOM would be
avoided by the station owner. Hence it is included when evaluating when
existing plants may cease operation. This is particularly relevant for emission
intensive coal-fired stations in response to the introduction of the CPRS.
2.3.4 Auxiliaries
Auxiliary load is an electricity load used within a power station as part of the
electricity generation process – that is, it is an electricity load used in the
making of electricity (also called a parasitic load). The usual way of expressing
the station auxiliaries is in percentage form and when applied to the gross
capacity of the station provides a measure of the net capacity or sent-out
capacity of the station.
Station auxiliaries also impact the sent-out or net thermal efficiency of thestation, and therefore the station‟s SRMC.
To convert SRMC from gross to sent-out basis the following formula is used:
= × 1 − Where:
• SRMCSO is the short-run marginal cost on a sent-out basis (in $/MWh)
• SRMCG is the short-run marginal cost on a generated basis (in $/MWh)
• Aux is the station‟s auxiliaries (in percent).
ACIL Tasman has provided estimated auxiliary factors for all existing and new
entrant technologies. Auxiliary factors are assumed to remain constant over
time.
2.3.5 Emission factors
An estimate of the combustion emissions factors (in kg CO2-e/GJ of fuel) are
provided for each existing station as well as for new stations by plant type. In
addition, the fugitive emission factor – that is, emissions relating to the
production and transport of fuel – are also provided (in kg CO2-e/GJ of fuel). The majority of these emission factors have been sourced from the 2008

7/27/2019 ACIL Tasman April 2009
http://slidepdf.com/reader/full/acil-tasman-april-2009 23/104
Fuel resource, new entry and generation costs in the NEM
Definitions and methodology 16
National Greenhouse Accounts NGA Factors workbook 4, however figures for
coal-fired stations have also been derived from other data sources, such ascompany environmental reporting.
Fugitive emission factors have been explicitly accounted for within the SRMC
formula. This is due to the fuel price series being provided exclusive of
emission costs relating to production and transport. The benefit of this
approach is that alternate carbon price scenarios can be run without requiring
different fuel cost series for coal and natural gas. However, it does imply that
producers will be able to fully pass on any emission costs through provisions
within fuel supply agreements. It is anticipated that this will be the case in the
vast majority of contracts.
Combustion and fugitive emission factors do not vary with capacity factor as
they are expressed in kg CO2-e/GJ of fuel. They may however vary over time
due to changes in fuel composition (particularly the case for coal). This report
provides a single point estimate only.
ACIL Tasman has also provided emission intensity figures for each plant
(expressed in tonnes CO2-e/MWh) both on a generated and sent-out basis.
2.3.6 Retirement criteria
In the modelling to be undertaken by NEMMCO on behalf of the IRPC a key consideration is the potential for the early retirement of incumbent generators
in response to the CPRS.
ACIL Tasman‟s approach to this modelling issue is to retire plants that exhibit
negative earnings before interest, tax, depreciation and amortisation (EBITDA)
on an ongoing basis. That is, plant which have „net revenues‟ that turn negative
and are unlikely to turn positive over the foreseeable future.5
In this context „net revenue‟ is defined as:
•
Pool revenues (dispatch-weighted spot price multiplied by sent-outdispatch adjusted for MLF), minus
• Operating costs (fuel, total operating & maintenance and emission costs).6
4 Department of Climate Change, National Greenhouse Accounts (NGA) Factors , January 2008
5 The potential for retro-fitted carbon capture and storage technology to become available alsoneeds to be considered. For example, it may be possible to temporarily mothball a stationuntil retro-fit CCS technology is available.
6 Note also that there may be differences between marginal costs (as used to determinegenerator bidding behaviour) and average costs – particularly for elements such as fuel forintegrated fuel-generation projects.

7/27/2019 ACIL Tasman April 2009
http://slidepdf.com/reader/full/acil-tasman-april-2009 24/104
Fuel resource, new entry and generation costs in the NEM
Definitions and methodology 17
ACIL Tasman recommends NEMMCO also use this criterion when evaluating
the potential retirements of incumbent generators. Where average costs differfrom marginal costs ACIL Tasman has included the differential within the
FOM values for calculating EBITDA.
Impact of compensation under CPRS
A number of coal-fired generators are expected to receive a free allocation of
emission permits under the CPRS Electricity Sector Adjustment Scheme
(ESAS) as outlined within the Government‟s CPRS White Paper.
The purpose of the assistance package presented in the white paper is designed
to partially offset the most extreme losses in asset value, rather than attempting to precisely offset all modelled losses in value. Assistance is to be provided via
an administrative allocation of a fixed quantity of permits (130.7 million in
aggregate) over a 5 year period, estimated to be worth around $3.5 billion in
2008-09 dollars. Assistance is calculated based on eligible generators emission
intensity relative to a set benchmark of 0.86 tonnes CO2-e/MWh as generated.
Assistance will be provided conditional upon a windfall gains provision which
will be determined via a review by the Schemes regulator in 2012-13.
Assistance is conditional upon the recipient generator remaining registered
with NEMMCO (and therefore obligated to follow NEMMCO market
directions) at the same actual or planned capacity as at 3 June 2007 unless there
is adequate reserve plant margin to allow a reduction in capacity without
breaching reliability standards.
Table 2 details the estimated compensation entitlements under the ESAS based
on the emission intensity factors within this report. Permits are to be allocated
to the eligible party for each generator in equal quantities across the five year
period. The value of these permits is determined by the assumed carbon prices
as set out within Table 5.

7/27/2019 ACIL Tasman April 2009
http://slidepdf.com/reader/full/acil-tasman-april-2009 25/104
Fuel resource, new entry and generation costs in the NEM
Definitions and methodology 18
Table 2 Estimated compensation entitlements under ESAS
Station
Total value of compensation(Nominal $m)
Permits allocated2010-11 to 2014-15
(million)
Proportion of totalcompensation
package
Angelsea 53.7 1.8 1.4%
Callide B 2.4 0.1 0.1%
Collinsville 20.8 0.7 0.5%
Energy Brix 83.0 2.8 2.1%
Gladstone 54.1 1.8 1.4%
Hazelwood 1,108.6 37.4 28.6%
Liddell 158.2 5.3 4.1%
Loy Yang A 782.8 26.4 20.2%
Loy Yang B 446.7 15.1 11.5%
Muja C 17.7 0.6 0.5%
Muja D 7.8 0.3 0.2%Munmorah 33.6 1.1 0.9%
Northern 25.5 0.9 0.7%
Playford B 56.5 1.9 1.5%
Redbank 32.4 1.1 0.8%
Swanbank B 51.2 1.7 1.3%
Vales Point B 13.6 0.5 0.4%
Wallerawang C 21.7 0.7 0.6%
Yallourn W 908.3 30.6 23.4%
3,878.7 130.7 100.0%
Note: Assumes no windfall gains are deemed to have occurred by the Schemes regulator
Data source: ACIL Tasman analysis
As the allocated permits are effectively a separate asset and have an explicitopportunity cost, they are not expected to have any impact upon generator
bidding behaviour. The condition that generators remain registered with the
market operator in order to receive compensation is also unlikely to result in
any material market impact. This is because large-scale retirements are generally
not expected to occur within the first 5 years of the scheme (unless carbon
prices are significantly higher than anticipated) and it is expected that gas-fired
generation proponents to be quite aggressive in entering the market to displace
coal-fired capacity, such that there is unlikely to be large reserve margin
deficits.
Even if it did transpire that a coal-fired station wanted to retire but did not
want to lose its remaining compensation payments due to lack of reserve
margin, the station could effectively mothball, but remain registered as a
backup unit. While this strategy would entail costs to keep the station
operational if required by NEMMCO, these costs may be less than the
remaining compensation payments.
Based on the above discussion ACIL Tasman does not see compensation
through the ESAS as having a major impact upon the timing of coal-fired
retirements.

7/27/2019 ACIL Tasman April 2009
http://slidepdf.com/reader/full/acil-tasman-april-2009 26/104
Fuel resource, new entry and generation costs in the NEM
Definitions and methodology 19
Most market modelling exercises consider reserve plant margins as one of the
constraints upon new entrant plant decisions (ie reserve margins must bemaintained). If NEMMCO uses this approach then the ESAS will have no
impact whatsoever. If however, NEMMCO‟s new entrant decisions are based
purely upon commercial new entry (which at times can result in reserve
margins being violated), the impact of the ESAS should be considered when
evaluating coal-fired retirements within the first 5 years of the scheme.7
2.3.7 New entrant cost estimates
Estimates of LRMCs (and SRMCs) have been provided for the following new
entrant technologies:
• Combined Cycle Gas Turbine (CCGT)
• Open Cycle Gas Turbine (OCGT)
• Supercritical black coal
• Supercritical brown coal
• Ultra-supercritical coal (USC)
• Nuclear
• Integrated gasification combined cycle (IGCC)
• Carbon capture and storage variants (CCS).
Capital costs
The market has experienced a marked increase in capital costs for new build
plant over the past 24 months. Increased prices for inputs such as steel and
labour and full manufacturer order books have contributed to the rise in costs.
More recently, the global financial crisis has led to a significant drop in
commodity prices and in expected electricity demand growth which may result
in some easing of EPC costs. For Australian proponents this has been offset to
some degree by the devaluation of the Australian dollar relative to the US
dollar.
In arriving at the estimates of project capital costs ACIL Tasman has reflected
upon the sharp increases in prices witnessed through 2007 and 2008, but also
the more recent fall as a result of the economic downturn. We recognise that
some proponents would have been exposed to prices significantly higher than
those quoted herein in recent times, however we do not feel that these price
levels are sustainable in the longer-term. Price levels during this period
reflected an overheated global economy, with economic activity pushing the
7Note that this does not necessarily mean that retirements will not still occur within this period,if the lost compensation is relatively small compared with avoided operating costs.

7/27/2019 ACIL Tasman April 2009
http://slidepdf.com/reader/full/acil-tasman-april-2009 27/104
Fuel resource, new entry and generation costs in the NEM
Definitions and methodology 20
limits of capital and labour constraints in developed and developing countries
alike. Conversely, depending upon the severity and length of the globaleconomic downturn, capital costs may fall below historical levels for a period
of time as demand for turbines falls and slots are re-traded or surrendered.
ACIL Tasman‟s estimates of project capital costs reflect a long-run equilibrium
level around which shorter-term perturbations (such as those described above)
may occur.
The capital cost estimates include the following cost elements:
• engineering, procurement and construction (EPC)
• planning and approval
• professional services
• land acquisition
• infrastructure costs (incl. water)
• spares and workshop etc
• connection to the electricity network
• fuel connection, handling and storage.
Costs are expressed in A$/kW for each technology and where appropriate
have been differentiated based on the method of cooling. The capital cost
estimates exclude interest during construction (IDC) and costs relating to IDCare implicitly included within ACIL Tasman‟s new entrant model.
An international database of published capital costs for new entrant power
plant has also be used to provide an informed view of capital costs for new
plant in the NEM.
For the emerging technologies published research reports, which include
estimates of capital costs as well as projections in the capital costs to account
for the learning curve effect, have been relied upon.
Power station capital cost estimates also take into account recent work withpotential new entrant power stations (within confidentiality bounds).
2.4 Key assumptions
Table 3 details a selection of key assumptions that were used for this exercise.

7/27/2019 ACIL Tasman April 2009
http://slidepdf.com/reader/full/acil-tasman-april-2009 28/104
Fuel resource, new entry and generation costs in the NEM
Definitions and methodology 21
2.4.1 Exchange rates
For this exercise the assumed exchange rate is US$0.75/AUD as shown in
Table 3. This figure has been factored into to all estimates of capital costs.
A change to the assumed exchange rate would require new estimates for capital
costs to be derived based on the proportion of imported content for each
technology. Technologies which have a large portion of cost denominated in
US dollars (such as OCGT) will be more sensitive to any changes.
2.4.2 WACC for new entrants
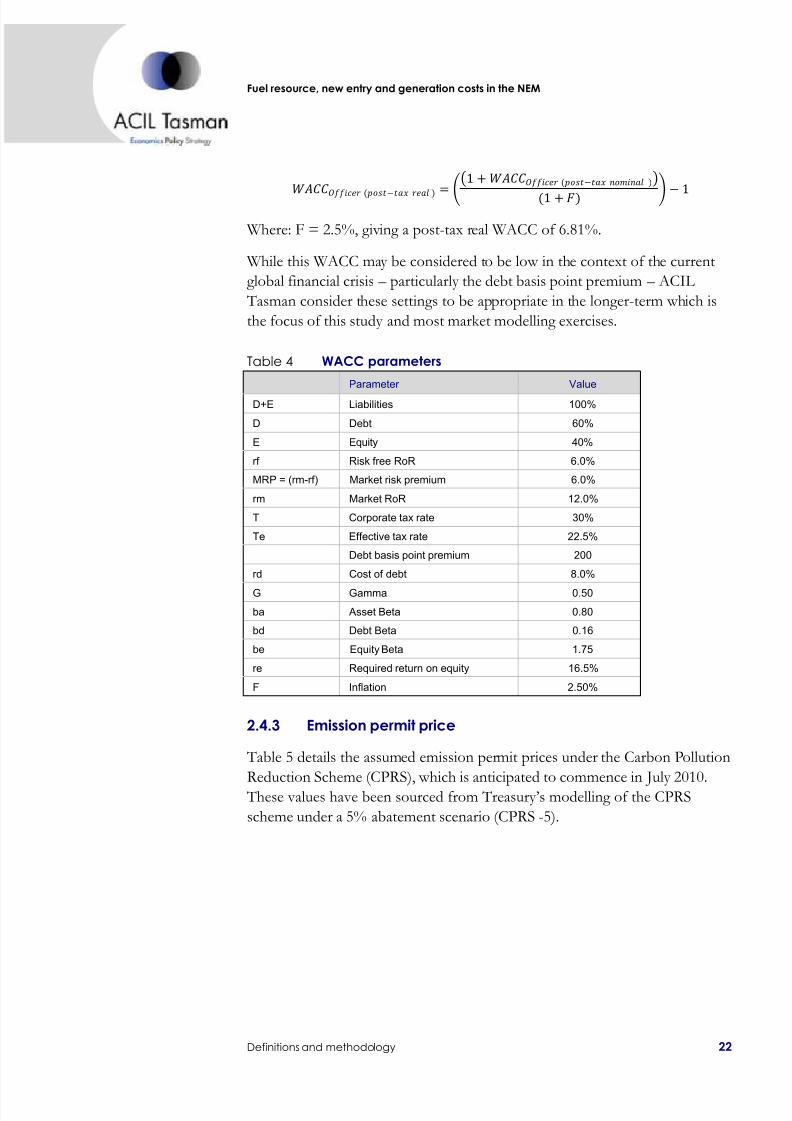
Table 4 detail the parameters to be used in the calculation of the WACC of
6.81% (post-tax real) as set out in Table 3.
The WACC is calculated as follows:
(− ) = × (1 − )
1 − 1 − + × (1 − )
Where: E = 0.4; D=0.6; V=1; T=22.5%; G=0.5; Re=16.2%; Rd=8%
This gives a post-tax nominal result of 9.48%.
This is converted into real terms using the Fischer equation:
Table 3Key assumptions used within the analysis
Assumption Value Comments
Inflation (CPI) 2.50%
Long-term inflation rate at the mid-point of the RBA targeted inflationband. While near-term forecasts exist for CPI (Treasury, RBA etc) asingle long-term value is preferable. 2.5% is in-line with Treasury'slatest Mid-year Economic and Fiscal Outlook report for years 2010-11and 2011-12 (p6)
Exchange rate (USD/AUD) 0.75 Long-term assumption
International oil price (US$/bbl) $80 ACIL Tasman assumption which aligns with EIA International EnergyOutlook 2008 forecast on average over the period to 2020 (real 2008dollars)
Internationally traded thermal coalprice (A$/tonne)
$80 ACIL Tasman projection (in nominal dollars) for FOB Newcastle.Implies FOB price declining in real terms
Permit prices under the CarbonPollution Reduction Scheme
~$23/tonne, rising to~$37/tonne by 2020 in
real terms
Scheme assumed to commence July 2010. Carbon prices broadly in-line with those projected within Treasury modelling for the CPRS5scenario (real 2009-10 dollars)
LNG export facilities developed inQueensland
Total of 8 Mtpa capacity Assumed two proposals reach FID: 4 Mtpa operational by 2014;further 4 Mtpa by 2018
Upstream gas developments ACIL Tasman base case
assumptionsBase case assumptions relating to level of CSG development andconventional exploration success
Discount rate for new entrants 6.81% Post-tax real WACC
7/27/2019 ACIL Tasman April 2009
http://slidepdf.com/reader/full/acil-tasman-april-2009 29/104
Fuel resource, new entry and generation costs in the NEM
Definitions and methodology 22
(− )=
1 + (− )
(1 + ) −1
Where: F = 2.5%, giving a post-tax real WACC of 6.81%.
While this WACC may be considered to be low in the context of the current
global financial crisis – particularly the debt basis point premium – ACIL
Tasman consider these settings to be appropriate in the longer-term which is
the focus of this study and most market modelling exercises.
Table 4 WACC parameters
Parameter Value
D+E Liabilities 100%
D Debt 60%
E Equity 40%
rf Risk free RoR 6.0%
MRP = (rm-rf) Market risk premium 6.0%
rm Market RoR 12.0%
T Corporate tax rate 30%
Te Effective tax rate 22.5%
Debt basis point premium 200
rd Cost of debt 8.0%
G Gamma 0.50
ba Asset Beta 0.80
bd Debt Beta 0.16
be Equity Beta 1.75
re Required return on equity 16.5%
F Inflation 2.50%
2.4.3 Emission permit price
Table 5 details the assumed emission permit prices under the Carbon Pollution
Reduction Scheme (CPRS), which is anticipated to commence in July 2010. These values have been sourced from Treasury‟s modelling of the CPRS
scheme under a 5% abatement scenario (CPRS -5).

7/27/2019 ACIL Tasman April 2009
http://slidepdf.com/reader/full/acil-tasman-april-2009 30/104
Fuel resource, new entry and generation costs in the NEM
Definitions and methodology 23
Table 5 Assumed emission permit prices
Emission permit price($/tonne CO2-e)
2009-10 0.00
2010-11 23.39
2011-12 24.19
2012-13 26.14
2013-14 28.09
2014-15 30.04
2015-16 31.99
2016-17 33.82
2017-18 35.43
2018-19 37.03
2019-20 38.75
2020-21 40.36
2021-22 42.19
2022-23 43.91
2023-24 45.75
2024-25 47.58
2025-26 49.07
2026-27 51.14
2027-28 53.09
2028-29 55.26
Note: Real 2009-10 dollars.
Data source: ACIL Tasman based on Treasury figures

7/27/2019 ACIL Tasman April 2009
http://slidepdf.com/reader/full/acil-tasman-april-2009 31/104
Fuel resource, new entry and generation costs in the NEM
Existing, committed and advanced proposals 24
3 Existing, committed and advancedproposals
This chapter presents the relevant data on capacity, thermal efficiency, O&M
costs and emission factors for existing, committed and advanced proposals for
scheduled thermal plant in the NEM.
3.1 Plant type and capacities
Table 6 through to Table 11 provides an overview of the existing and
committed thermal plant in each region of the NEM. The tables provideinformation on generator type, primary fuel, plant configuration and capacity.
Table 6 Type and capacity of existing and committed plant in NSW
Station Type Fuel ConfigurationSize(MW)
Registeredcapacity
(MW)
Bayswater Steam turbine Black coal Steam turbine (4x660 MW) 2,640 2,640
Colongra OCGT Natural gas OCGT (4x166 MW) 664 664
Eraring Steam turbine Black coal Steam turbine (4x660 MW) 2,640 2,640
Hunter Valley GT OCGT Fuel oil OCGT (2x25 MW) 50 50
Liddell Steam turbine Black coal Steam turbine (4x500 MW) 2,000 2,000
Mt Piper Steam turbine Black coal Steam turbine (2x660 MW) 1,320 1,320
Munmorah Steam turbine Black coal Steam turbine (2x300 MW) 600 600
Redbank Steam turbine Black coal Steam turbine (1x150 MW) 150 150
Smithfield CCGT/Cogen Natural gas OCGT (3x38 MW), Steam turbine (1x62 MW) 176 160
Tallawarra CCGT Natural gas OCGT (1x260 MW), Steam turbine (1x160 MW) 435 435
Uranquinty OCGT Natural gas OCGT (4 x 166 MW) 664 664
Vales Point B Steam turbine Black coal Steam turbine (2 x 660 MW) 1,320 1,320
Wallerawang C Steam turbine Black coal Steam turbine (2 x 500 MW) 1,000 1,000
13,659 13,643
Data source: ACIL Tasman, NEMMCO Registration list

7/27/2019 ACIL Tasman April 2009
http://slidepdf.com/reader/full/acil-tasman-april-2009 32/104
Fuel resource, new entry and generation costs in the NEM
Existing, committed and advanced proposals 25
Table 7Type and capacity of existing and committed plant in QLD
Station Type Fuel ConfigurationSize(MW)
Registeredcapacity
(MW)
Barcaldine CCGT Natural gas OCGT (1x37 MW), Steam turbine (1x18 MW) 57 55
Braemar OCGT Natural gas OCGT (3x168 MW) 504 504
Braemar 2 OCGT Natural gas OCGT (3x168 MW) 504 504
Callide B Steam turbine Black coal Steam turbine (2x350 MW) 700 700
Callide C Steam turbine Black coal Steam turbine (2x420 MW) 840 840
Collinsville Steam turbine Black coal Steam turbine (4x32 MW; 1x66 MW) 195 195
Condamine A CCGT Natural gas OCGT (2x45 MW), Steam turbine (1x45 MW) 135 135
Darling Downs CCGT Natural gas OCGT (3x120 MW), Steam turbine (1x270 MW) 630 630
Gladstone Steam turbine Black coal Steam turbine (6x280 MW) 1,680 1,680
Kogan Creek Steam turbine Black coal Steam turbine (1x781.2MW) 781 750Mackay GT OCGT Fuel oil OCGT (1x30 MW) 30 30
Millmerran Steam turbine Black coal Steam turbine (2x426 MW) 852 852
Mt Stuart GT OCGT Kerosene OCGT (2x146 MW; 1x126 MW) 418 418
Oakey OCGT Natural gas OCGT (2x141 MW) 282 282
Roma GT OCGT Natural gas OCGT (2x40 MW) 80 80
Stanwell Steam turbine Black coal Steam turbine (4x350 MW) 1,400 1,400
Swanbank B Steam turbine Black coal Steam turbine (4x125 MW) 500 500
Swanbank E CCGT Natural gas CCGT (1x385 MW) 385 385
Tarong Steam turbine Black coal Steam turbine (4x350 MW) 1,400 1,400
Tarong North Steam turbine Black coal Steam turbine (1x450 MW) 450 443
Townsville CCGT Natural gas OCGT (1x165 MW), Steam turbine (1x82 MW) 247 242
Yarwun Cogen Natural gas OCGT (configuration as yet unknown) 160 160
12,230 12,185
Data source: ACIL Tasman, NEMMCO Registration list
Table 8 Type and capacity of existing and committed plant in SA
Station Type Fuel ConfigurationSize(MW)
Registeredcapacity
(MW)
Angaston Engines Diesel Reciprocating engines (30 x 1.66 MW) 50 50
Dry Creek GT OCGT Natural gas OCGT (3x52 MW) 156 156
Hallett OCGT Distillate OCGT (8x16.8 MW; 2x25.2 MW; 2x17.9 MW) 221 180Ladbroke Grove OCGT Natural gas OCGT (2x40 MW) 80 80
Mintaro GT OCGT Natural gas OCGT (1x90 MW) 90 90
Northern Steam turbine Brown coal Steam turbine (2x265 MW) 530 530
Osborne Cogen/CCGT Natural gas OCGT (1x118 MW), Steam turbine (1x62 MW) 180 180
Pelican Point CCGT Natural gas OCGT (2x160 MW), Steam turbine (1x158 MW) 478 478
Playford B Steam turbine Brown coal Steam turbine (4x60 MW) 240 240
Port Lincoln GT OCGT Distillate OCGT (2x25 MW) 50 50
Quarantine OCGT Natural gas OCGT (4x24 MW; 1x120 MW) 216 216
Snuggery OCGT Distillate OCGT (3x21 MW) 63 63
Torrens Island A Steam turbine Natural gas Steam turbine (4x120 MW) 480 480
Torrens Island B Steam turbine Natural gas Steam turbine (4x200 MW) 800 800
3,633 3,593
Data source: ACIL Tasman, NEMMCO Registration list

7/27/2019 ACIL Tasman April 2009
http://slidepdf.com/reader/full/acil-tasman-april-2009 33/104
Fuel resource, new entry and generation costs in the NEM
Existing, committed and advanced proposals 26
Table 9 Type and capacity of existing and committed plant in TAS
Station Type Fuel ConfigurationSize(MW)
Registeredcapacity
(MW)
Bell Bay Steam turbine Natural gas Steam turbine (2x120 MW) 240 240
Bell Bay Three OCGT Natural gas OCGT (3x35 MW) 105 105
Tamar Valley OCGT OCGT Natural gas OCGT (1x75 MW) 75 75
Tamar Valley CCGT Natural gas OCGT (3x40 MW), Steam turbine (1x80 MW) 200 200
620 620
Data source: ACIL Tasman, NEMMCO Registration list
Table 10 Type and capacity of existing and committed plant in VIC
Station Type Fuel ConfigurationSize(MW)
Registeredcapacity
(MW)
Anglesea Steam turbine Brown coal Steam turbine (1x150 MW) 150 150
Bairnsdale OCGT Natural gas OCGT (2x47 MW) 94 94
Energy Brix Steam turbine Brown coal Steam turbine (1x90 MW; 1x30 MW; 1x75 MW) 195 195
Hazelwood Steam turbine Brown coal Steam turbine (8x200 MW) 1,600 1,600
Jeeralang A OCGT Natural gas OCGT (4x51 MW) 204 204
Jeeralang B OCGT Natural gas OCGT (3x76 MW) 228 228
Laverton North OCGT Natural gas OCGT (2x156 MW) 312 312Loy Yang A Steam turbine Brown coal Steam turbine (2x500 MW; 2x560 MW) 2,120 2,120
Loy Yang B Steam turbine Brown coal Steam turbine (2x500 MW) 1,000 1,000
Mortlake OCGT Natural gas OCGT (2x275 MW) 550 550
Newport Steam turbine Natural gas Steam turbine (1x500 MW) 500 500
Somerton OCGT Natural gas OCGT (4x40 MW) 160 160
Valley Power OCGT Natural gas OCGT (6x50 MW) 300 300
Yallourn Steam turbine Brown coal Steam turbine (2x360 MW; 2x380 MW) 1,480 1,480
8,893 8,893
Data source: ACIL Tasman, NEMMCO Registration list
Table 11 Type and capacity of advanced proposals
Station Type Fuel ConfigurationSize(MW)
Registeredcapacity
(MW)
Mortlake 2 CCGT Natural gas Unknown 400 n/a
Spring Gully CCGT Natural gas Unknown 1000 n/a
1400 n/a
Data source: ACIL Tasman, NEMMCO Registration list

7/27/2019 ACIL Tasman April 2009
http://slidepdf.com/reader/full/acil-tasman-april-2009 34/104
Fuel resource, new entry and generation costs in the NEM
Existing, committed and advanced proposals 27
3.2 Thermal efficiency, auxiliaries and O&M costs
Table 12 through to Table 17 present estimates of the thermal efficiencies,
auxiliary usage and operating and maintenance (O&M) costs for the existing
scheduled thermal stations in the NEM. A separate table is provided for
stations within each NEM region and for advanced proposals.
For information on the definitions and estimation of these elements refer to
sections 2.3.2, 2.3.3 and 2.3.4 for thermal efficiency, O&M costs and auxiliaries
respectively.
Table 12 Estimated thermal efficiency, auxiliaries and O&M costs for NSW stations
Generator
ThermalefficiencyHHV (%)sent-out
Thermalefficiency HHV(GJ/MWh) sent-
out Auxiliaries
(%)
Thermalefficiency HHV
(%) asgenerated
Thermalefficiency
HHV(GJ/MWh) as
generated
FOM($/MW/year)for 2009-10
VOM($/MWh
sent-out) for 2009-10
Bayswater 35.9% 10.03 6.0% 38.2% 9.43 49,000 1.19
Colongra 32.0% 11.25 3.0% 33.0% 10.91 13,000 10.10
Eraring 35.4% 10.17 6.5% 37.9% 9.51 49,000 1.19
Hunter Valley GT 28.0% 12.86 3.0% 28.9% 12.47 13,000 9.61
Liddell 33.8% 10.65 5.0% 35.6% 10.12 52,000 1.19
Mt Piper 37.0% 9.73 5.0% 38.9% 9.24 49,000 1.32
Munmorah 30.8% 11.69 7.3% 33.2% 10.84 55,000 1.19
Redbank 29.3% 12.29 8.0% 31.8% 11.30 49,500 1.19
Smithfield 41.0% 8.78 5.0% 43.2% 8.34 25,000 2.40
Tallawarra 50.0% 7.20 3.0% 51.5% 6.98 31,000 1.05Uranquinty 32.0% 11.25 3.0% 33.0% 10.91 13,000 10.10
Vales Point B 35.4% 10.17 4.6% 37.1% 9.70 49,000 1.19
Wallerawang C 33.1% 10.88 7.3% 35.7% 10.08 52,000 1.32
Note: FOM and VOM costs are assumed to escalate at 2.5% per annum (i.e. 100% of the CPI assumption)
Data source: ACIL Tasman, various sources

7/27/2019 ACIL Tasman April 2009
http://slidepdf.com/reader/full/acil-tasman-april-2009 35/104
Fuel resource, new entry and generation costs in the NEM
Existing, committed and advanced proposals 28
Table 13Estimated thermal efficiency, auxiliaries and O&M costs for QLD stations
Generator
ThermalefficiencyHHV (%)sent-out
Thermalefficiency HHV(GJ/MWh) sent-
out Auxiliaries
(%)
Thermalefficiency HHV
(%) asgenerated
Thermalefficiency
HHV(GJ/MWh) as
generated
FOM($/MW/year)for 2009-10
VOM($/MWh
sent-out) for 2009-10
Barcaldine 40.0% 9.00 3.0% 41.2% 8.73 25,000 2.40
Braemar 30.0% 12.00 2.5% 30.8% 11.70 13,000 7.93
Braemar 2 30.0% 12.00 2.5% 30.8% 11.70 13,000 7.93
Callide B 36.1% 9.97 7.0% 38.8% 9.27 49,500 1.20
Callide C 38.0% 9.47 4.8% 39.9% 9.02 49,500 1.20
Collinsville 27.7% 13.00 8.0% 30.1% 11.96 65,000 1.32
Condamine 48.0% 7.50 3.0% 49.5% 7.28 31,000 1.05
Darling Downs 46.0% 7.83 6.0% 48.9% 7.36 31,000 1.05
Gladstone 35.2% 10.23 5.0% 37.1% 9.72 52,000 1.19Kogan Creek 37.5% 9.60 8.0% 40.8% 8.83 48,000 1.25
Mackay GT 28.0% 12.86 3.0% 28.9% 12.47 13,000 9.05
Millmerran 37.5% 9.60 4.5% 39.3% 9.17 48,000 1.19
Mt Stuart GT 30.0% 12.00 3.0% 30.9% 11.64 13,000 9.05
Oakey 32.6% 11.04 3.0% 33.6% 10.71 13,000 9.61
Roma GT 30.0% 12.00 3.0% 30.9% 11.64 13,000 9.61
Stanwell 36.4% 9.89 7.0% 39.1% 9.20 49,000 1.19
Swanbank B 30.5% 11.80 8.0% 33.2% 10.86 55,000 1.19
Swanbank E 47.0% 7.66 3.0% 48.5% 7.43 31,000 1.05
Tarong 36.2% 9.94 8.0% 39.3% 9.15 49,500 1.43
Tarong North 39.2% 9.18 5.0% 41.3% 8.72 48,000 1.43
Townsville 46.0% 7.83 3.0% 47.4% 7.59 31,000 5.09
Yarwun 34.0% 10.59 2.0% 34.7% 10.38 25,000 0.00Note: FOM and VOM costs are assumed to escalate at 2.5% per annum (i.e. 100% of the CPI assumption)
Data source: ACIL Tasman, various sources
Table 14 Estimated thermal efficiency, auxiliaries and O&M costs for SA stations
Generator
ThermalefficiencyHHV (%)sent-out
Thermalefficiency HHV(GJ/MWh) sent-
out Auxiliaries
(%)
Thermalefficiency HHV
(%) asgenerated
Thermalefficiency
HHV(GJ/MWh) as
generated
FOM($/MW/year)for 2009-10
VOM($/MWh
sent-out) for 2009-10
Angaston 26.0% 13.85 2.5% 26.7% 13.50 13,000 9.61
Dry Creek GT 26.0% 13.85 3.0% 26.8% 13.43 13,000 9.61Hallett 24.0% 15.00 2.5% 24.6% 14.63 13,000 9.61
Ladbroke Grove 30.0% 12.00 3.0% 30.9% 11.64 13,000 3.60
Mintaro GT 28.0% 12.86 3.0% 28.9% 12.47 13,000 9.61
Northern 34.9% 10.32 5.0% 36.7% 9.80 55,000 1.19
Osborne 42.0% 8.57 5.0% 44.2% 8.14 25,000 5.09
Pelican Point 48.0% 7.50 2.0% 49.0% 7.35 31,000 1.05
Playford B 21.9% 16.44 8.0% 23.8% 15.12 70,000 3.00
Port Lincoln GT 26.0% 13.85 8.0% 28.3% 12.74 13,000 9.61
Quarantine 32.0% 11.25 5.0% 33.7% 10.69 13,000 9.61
Snuggery 26.0% 13.85 3.0% 26.8% 13.43 13,000 9.61
Torrens Island A 27.6% 13.04 5.0% 29.1% 12.39 40,000 2.26
Torrens Island B 30.0% 12.00 5.0% 31.6% 11.40 40,000 2.26
Note: FOM and VOM costs are assumed to escalate at 2.5% per annum (i.e. 100% of the CPI assumption)
Data source: ACIL Tasman, various sources

7/27/2019 ACIL Tasman April 2009
http://slidepdf.com/reader/full/acil-tasman-april-2009 36/104
Fuel resource, new entry and generation costs in the NEM
Existing, committed and advanced proposals 29
Table 15 Estimated thermal efficiency, auxiliaries and O&M costs for TAS stations
Generator
ThermalefficiencyHHV (%)sent-out
Thermalefficiency HHV(GJ/MWh) sent-
out Auxiliaries
(%)
Thermalefficiency HHV
(%) asgenerated
Thermalefficiency
HHV(GJ/MWh) as
generated
FOM($/MW/year)for 2009-10
VOM($/MWh
sent-out) for 2009-10
Bell Bay 32.0% 11.25 5.0% 33.7% 10.69 40,000 7.93
Bell Bay Three 29.0% 12.41 2.5% 29.7% 12.10 13,000 7.93
Tamar Valley OCGT 29.0% 12.41 2.5% 29.7% 12.10 13,000 7.93
Tamar Valley 48.0% 7.50 3.0% 49.5% 7.28 31,000 1.05
Note: FOM and VOM costs are assumed to escalate at 2.5% per annum (i.e. 100% of the CPI assumption)
Data source: ACIL Tasman, various sources
Table 16 Estimated thermal efficiency, auxiliaries and O&M costs for VIC stations
Generator
ThermalefficiencyHHV (%)sent-out
Thermalefficiency HHV(GJ/MWh) sent-
out Auxiliaries
(%)
Thermalefficiency HHV
(%) asgenerated
Thermalefficiency
HHV(GJ/MWh) as
generated
FOM($/MW/year)for 2009-10
VOM($/MWh
sent-out) for 2009-10
Anglesea 27.2% 13.24 10.0% 30.2% 11.91 81,000 1.19
Bairnsdale 34.0% 10.59 3.0% 35.1% 10.27 13,000 2.26
Energy Brix 24.0% 15.00 15.0% 28.2% 12.75 60,000 1.19
Hazelwood 22.0% 16.36 10.0% 24.4% 14.73 84,030 1.19
Jeeralang A 22.9% 15.72 3.0% 23.6% 15.25 13,000 9.05
Jeeralang B 22.9% 15.72 3.0% 23.6% 15.25 13,000 9.05
Laverton North 30.4% 11.84 2.5% 31.2% 11.55 13,000 7.93
Loy Yang A 27.2% 13.24 9.0% 29.9% 12.04 79,000 1.19
Loy Yang B 26.6% 13.53 7.5% 28.8% 12.52 51,200 1.19
Mortlake 32.0% 11.25 3.0% 33.0% 10.91 13,000 8.33
Newport 33.3% 10.81 5.0% 35.1% 10.27 40,000 2.26
Somerton 24.0% 15.00 2.5% 24.6% 14.63 13,000 9.61
Valley Power 24.0% 15.00 3.0% 24.7% 14.55 13,000 9.61
Yallourn 23.5% 15.32 8.9% 25.8% 13.96 82,400 1.19
Note: FOM and VOM costs are assumed to escalate at 2.5% per annum (i.e. 100% of the CPI assumption)
Data source: ACIL Tasman, various sources
Table 17 Estimated thermal efficiency, auxiliaries and O&M costs for advanced proposals
Generator
ThermalefficiencyHHV (%)sent-out
Thermalefficiency HHV(GJ/MWh) sent-
out Auxiliaries
(%)
Thermalefficiency HHV
(%) asgenerated
Thermalefficiency
HHV(GJ/MWh) as
generated
FOM($/MW/year)for 2009-10
VOM($/MWh
sent-out) for 2009-10
Mortlake 2 50.0% 7.20 3.0% 51.5% 6.98 31,000 1.05
Spring Gully 50.0% 7.20 2.4% 51.2% 7.03 31,000 1.05
Note: FOM and VOM costs are assumed to escalate at 2.5% per annum (i.e. 100% of the CPI assumption)
Data source: ACIL Tasman, various sources

7/27/2019 ACIL Tasman April 2009
http://slidepdf.com/reader/full/acil-tasman-april-2009 37/104
Fuel resource, new entry and generation costs in the NEM
Existing, committed and advanced proposals 30
3.3 Emission factors
Table 18 through to Table 23 provide the estimated emission factors and
emission intensity for existing, committed and advanced proposals. Emission
factors and emission intensities are provided on a carbon dioxide equivalent
(CO2-e) basis. As discussed in section 2.3.5, the emission intensity figures
include fugitive emissions (emissions from the production and transport of
fuel).
Table 18 Emission factors and intensity for existing and committed NSW stations
Generator
Combustionemission factor
(kg CO2-e/GJ of fuel)
Fugitive emissionfactor
(kg CO2-e/GJ of fuel)
Total emissionfactor
(kg CO2-e/GJ of fuel)
Total emissionintensity
(tonnes CO2-e/MWh sent-out)
Total emissionintensity
(tonnes CO2-e/MWh generated)
Bayswater 90.2 8.7 98.9 0.99 0.93
Colongra 51.3 14.2 65.5 0.74 0.71
Eraring 89.5 8.7 98.2 1.00 0.93
Hunter Valley GT 69.7 5.3 75.0 0.96 0.94
Liddell 92.8 8.7 101.5 1.08 1.03
Mt Piper 87.4 8.7 96.1 0.94 0.89
Munmorah 90.3 8.7 99.0 1.16 1.07
Redbank 90.0 8.7 98.7 1.21 1.12
Smithfield 51.3 14.2 65.5 0.58 0.55
Tallawarra 51.3 14.2 65.5 0.47 0.46
Uranquinty 51.3 14.2 65.5 0.74 0.71
Vales Point B 89.8 8.7 98.5 1.00 0.96Wallerawang C 87.4 8.7 96.1 1.05 0.97
Data source: ACIL Tasman, various sources

7/27/2019 ACIL Tasman April 2009
http://slidepdf.com/reader/full/acil-tasman-april-2009 38/104
Fuel resource, new entry and generation costs in the NEM
Existing, committed and advanced proposals 31
Table 19Emission factors and intensity for existing and committed QLD stations
Generator
Combustionemission factor (kg CO2-e/GJ of
fuel)
Fugitive emissionfactor
(kg CO2-e/GJ of fuel)
Total emissionfactor
(kg CO2-e/GJ of fuel)
Total emissionintensity
(tonnes CO2-e/MWh sent-out)
Total emissionintensity
(tonnes CO2-e/MWh generated)
Barcaldine 51.3 5.4 56.7 0.51 0.49
Braemar 51.3 5.4 56.7 0.68 0.66
Braemar 2 51.3 5.4 56.7 0.68 0.66
Callide B 93.0 2.0 95.0 0.95 0.88
Callide C 95.0 2.0 97.0 0.92 0.87
Collinsville 89.4 2.0 91.4 1.19 1.09
Condamine 51.3 2.0 53.3 0.40 0.39
Darling Downs 51.3 2.0 53.3 0.42 0.39
Gladstone 92.1 2.0 94.1 0.96 0.91Kogan Creek 94.0 2.0 96.0 0.92 0.85
Mackay GT 69.7 5.3 75.0 0.96 0.94
Millmerran 92.0 2.0 94.0 0.90 0.86
Mt Stuart GT 69.7 5.3 75.0 0.90 0.87
Oakey 51.3 5.4 56.7 0.63 0.61
Roma GT 51.3 5.4 56.7 0.68 0.66
Stanwell 90.4 2.0 92.4 0.91 0.85
Swanbank B 90.4 2.0 92.4 1.09 1.00
Swanbank E 51.3 5.4 56.7 0.43 0.42
Tarong 92.1 2.0 94.1 0.94 0.86
Tarong North 92.1 2.0 94.1 0.86 0.82
Townsville 51.3 5.4 56.7 0.44 0.43
Yarwun 51.3 5.4 56.7 0.60 0.59Data source: ACIL Tasman, various sources
Table 20 Emission factors and intensity for existing and committed SA stations
Generator
Combustionemission factor (kg CO2-e/GJ of
fuel)
Fugitive emissionfactor
(kg CO2-e/GJ of fuel)
Total emissionfactor
(kg CO2-e/GJ of fuel)
Total emissionintensity
(tonnes CO2-e/MWh sent-out)
Total emissionintensity
(tonnes CO2-e/MWh generated)
Angaston 67.9 5.3 73.2 1.01 0.99
Dry Creek GT 51.3 18.6 69.9 0.97 0.94
Hallett 51.3 18.6 69.9 1.05 1.02Ladbroke Grove 51.3 18.6 69.9 0.84 0.81
Mintaro GT 51.3 18.6 69.9 0.90 0.87
Northern 91.0 0.9 91.9 0.95 0.90
Osborne 51.3 18.6 69.9 0.60 0.57
Pelican Point 51.3 18.6 69.9 0.52 0.51
Playford B 91.0 0.9 91.9 1.51 1.39
Port Lincoln GT 67.9 5.3 73.2 1.01 0.93
Quarantine 51.3 18.6 69.9 0.79 0.75
Snuggery 67.9 5.3 73.2 1.01 0.98
Torrens Island A 51.3 18.6 69.9 0.91 0.87
Torrens Island B 51.3 18.6 69.9 0.84 0.80
Data source: ACIL Tasman, various sources

7/27/2019 ACIL Tasman April 2009
http://slidepdf.com/reader/full/acil-tasman-april-2009 39/104
Fuel resource, new entry and generation costs in the NEM
Existing, committed and advanced proposals 32
3.4 Fuel supply for existing generators
This section examines the fuel supply for existing generators for coal, gas andliquid fuelled plant.
Table 21Emission factors and intensity for existing and committed TAS stations
Generator
Combustionemission factor (kg CO2-e/GJ of
fuel)
Fugitive emissionfactor
(kg CO2-e/GJ of fuel)
Total emissionfactor
(kg CO2-e/GJ of fuel)
Total emissionintensity
(tonnes CO2-e/MWh sent-out)
Total emissionintensity
(tonnes CO2-e/MWh generated)
Bell Bay 51.3 5.8 57.1 0.64 0.61
Bell Bay Three 51.3 5.8 57.1 0.71 0.69
Tamar Valley OCGT 51.3 5.8 57.1 0.71 0.69
Tamar Valley 51.3 5.8 57.1 0.43 0.42
Data source: ACIL Tasman, various sources
Table 22 Emission factors and intensity for existing and committed VIC stations
Generator
Combustionemission factor (kg CO2-e/GJ of
fuel)
Fugitive emissionfactor
(kg CO2-e/GJ of fuel)
Total emissionfactor
(kg CO2-e/GJ of fuel)
Total emissionintensity
(tonnes CO2-e/MWh sent-out)
Total emissionintensity
(tonnes CO2-e/MWh generated)
Anglesea 91.0 0.3 91.3 1.21 1.09
Bairnsdale 51.3 5.8 57.1 0.60 0.59
Energy Brix 99.0 0.3 99.3 1.49 1.27
Hazelwood 93.0 0.3 93.3 1.53 1.37
Jeeralang A 51.3 5.8 57.1 0.90 0.87
Jeeralang B 51.3 5.8 57.1 0.90 0.87
Laverton North 51.3 5.8 57.1 0.68 0.66
Loy Yang A 91.5 0.3 91.8 1.22 1.11Loy Yang B 91.5 0.3 91.8 1.24 1.15
Mortlake 51.3 5.8 57.1 0.64 0.62
Newport 51.3 5.8 57.1 0.62 0.59
Somerton 51.3 5.8 57.1 0.86 0.84
Valley Power 51.3 5.8 57.1 0.86 0.83
Yallourn 92.5 0.3 92.8 1.42 1.30
Data source: ACIL Tasman, various sources
Table 23 Emission factors and intensity for advanced proposals
Generator
Combustionemission factor (kg CO2-e/GJ of
fuel)
Fugitive emissionfactor
(kg CO2-e/GJ of fuel)
Total emissionfactor
(kg CO2-e/GJ of fuel)
Total emissionintensity
(tonnes CO2-e/MWh sent-out)
Total emissionintensity
(tonnes CO2-e/MWh generated)
Mortlake 2 51.3 5.8 57.1 0.41 0.40
Spring Gully 51.3 1.0 52.3 0.38 0.37
Data source: ACIL Tasman, various sources

7/27/2019 ACIL Tasman April 2009
http://slidepdf.com/reader/full/acil-tasman-april-2009 40/104
Fuel resource, new entry and generation costs in the NEM
Existing, committed and advanced proposals 33
3.4.1 Coal
Coal is currently the predominant fuel used in the NEM. In 2007-08, coalfired generation produced around 84% of the NEM scheduled electricity.
The coal supply arrangements vary from power to power station:
• in NSW the coal is all supplied under a variety of contractual arrangements with third party coal producers
• in Victoria the coal mine is usually integrated with the power stationalthough there are exceptions where power Stations buy from a mineowned and operated by another party, usually another power station
• in South Australia the coal mine and rail infrastructure are owned and
operated by the power station and rail haulage of coal is provided by a thirdparty haulier.
• in Queensland there are both integrated coal mines using independentmining contractors and contractual arrangements with independent coalproducers and transport providers.
The types of coal supply arrangements have a marked impact on the marginal
cost of coal at individual power stations. Furthermore, the quality of coal and
distance between the supplying mines and power stations can have a marked
influence on coal costs/prices in terms of delivered energy costs.
Coals used in power generation in the NEM vary greatly in their characteristics
including moisture, ash, volatile matter and energy content which affect the
price of coal into power stations. Mining costs also are an important
determinant in setting the coal price in some cases.
Given the high capital content in coal supply costs, contract prices have tended
to escalate at less than inflation. ACIL Tasman is aware of escalation
provisions varying from 70% to 100% of the consumer price index (CPI). For
this study contract price escalation has been generally applied at 90% of CPI.
The marginal price/cost of coal is quoted in this report. In the case of coalsupplied by independent or third parties, it is the contract (or average) price
that is quoted as the marginal price. For the purpose of calculating the
marginal coal price, the impact of take or pay provisions in supply contracts
has been ignored. Where a power station is supplied by more than one
contract then the price is taken as the weighted average of the contract prices.
For coal supplied by an integrated mine, fixed costs are not included in the coal
price, but rather incorporated into the fixed O&M estimate.
In arriving at the coal price projections for each power station (each generation
portfolio in NSW) ACIL Tasman considered:
• existing contractual and other supply arrangements

7/27/2019 ACIL Tasman April 2009
http://slidepdf.com/reader/full/acil-tasman-april-2009 41/104
Fuel resource, new entry and generation costs in the NEM
Existing, committed and advanced proposals 34
• mine / power station ownership arrangements
• source and cost of new/replacement coal supply sources in the futuretaking into account:
− nature and ownership of nearby coal reserves and mines
− potential for development of new resources
− future export prices
− mining costs
− transport costs.
Table 24 summarises the types of coal supply arrangements currently in place
and the methodology used by ACIL Tasman in projecting coal prices for the
various types of arrangements in place.
The coal prices for new coal supply to existing or new NEM power stations
are one of the following:
• ROM coal mining costs: where 80% of the export parity value of the ROMcoal is less than the mining costs and the coal is delivered to a mine-mouthpower station – this usually applies to deposits which are of relatively inferior quality and/or some distance from export terminals but arerelatively close to major transmission links (Felton, New Acland, Ulan etc)
• ROM coal mining costs plus transport costs: to a power station site closerto transmission infrastructure where the 80% export parity value of the
Table 24 Method of projecting coal prices in the NEM
Coal supply arrangement Stations affected Price setting mechanism
Existing NSW black coal - third partycontracts
All existing stations inNSW
Existing contracts assumed to run full term at contractedprices with new contract prices at the greater of ROM miningcosts and 80% of export parity price
New NSW black coal - captive mine Any new stations in NSWPrices set at the greater of ROM mining costs and 80% of the export parity price
Existing Qld Black coal - own mineTarong, Millmerran, KoganCreek
Price set at marginal cost of production using an efficientmining contractor (currently less than $1.00/GJ)
Existing Qld Black coal - captive mineCallide, Stanwell,Collinsville
Prices set at the greater of ROM mining costs and 80% of the export parity price
Existing Qld Black coal - third partycontracts
GladstoneExisting contracts assumed to run full term at contractedprices with new contract prices at the greater of ROM miningcosts and 80% of export parity price
New Qld black coal - captive mine Any new stations in QldPrices set at the greater of ROM mining costs and 80% of the export parity price
Vic brown coal - own mineLoy Yang A, Hazelwood,Yallourn
Price set at marginal cost of production (currently less than$0.10/GJ)
Vic brown coal - third party mineEnergy Brix, Anglesea,Loy Yang B
Prices set to reflect efficient mining costs (currently less than$0.60/GJ)
New IGCC using coal from third party Any new IGCCPrices set to reflect efficient mining costs (currently less than$0.60/GJ)
SA black coal - own mineNorthern, ThomasPlayford
Marginal price including cost mining, handling and railingcoal 250km

7/27/2019 ACIL Tasman April 2009
http://slidepdf.com/reader/full/acil-tasman-april-2009 42/104
Fuel resource, new entry and generation costs in the NEM
Existing, committed and advanced proposals 35
ROM coal is again less than the mining costs but where the deposit isgreater than 100km from the transmission system (Wandoan, Alpha,Pentland)
• 80% of the export parity value of the ROM coal: where it is greater thanthe ROM coal mining cost - this generally applies to deposits which arehigh quality coal and/or are generally closer to the export terminals (mostHunter Valley and Newcastle mines).
The delivered prices may switch from one price setting method to another as
the export price is projected to fall in real terms to while mining costs are
projected to remain constant in real terms.
Projected price for export thermal coal
The FOB price for thermal coal is an important consideration in the price
formation for new coal contracts in Queensland and NSW. It is the projection
of these prices which underlies the future export parity value of the ROM coal
at each location which in most instances sets the delivered price into local
power stations.
Thermal coal spot and contract prices peaked in 2008 but the ensuing
economic turmoil caused the spot price to decline noticeably in the latter
months of the year as seen in Figure 2. ACIL Tasman anticipates that the spot
price will continue to abate in the coming years with subdued demand and as
new mines are brought into production and export infrastructure bottle necks
are eased.
Figure 2 Historic spot prices for thermal coal export
Data source: Australian Coal Report and Global Coal website
$0
$20
$40
$60
$80
$100
$120
$140
$160
$180
$200
J a n / 0 0
M a y / 0 0
S e p / 0 0
J a n / 0 1
M a y / 0 1
S e p / 0 1
J a n / 0 2
M a y / 0 2
S e p / 0 2
J a n / 0 3
M a y / 0 3
S e p / 0 3
J a n / 0 4
M a y / 0 4
S e p / 0 4
J a n / 0 5
M a y / 0 5
S e p / 0 5
J a n / 0 6
M a y / 0 6
S e p / 0 6
J a n / 0 7
M a y / 0 7
S e p / 0 7
J a n / 0 8
M a y / 0 8
S e p / 0 8
N o m i n a l A $ p e r t o n n e

7/27/2019 ACIL Tasman April 2009
http://slidepdf.com/reader/full/acil-tasman-april-2009 43/104
Fuel resource, new entry and generation costs in the NEM
Existing, committed and advanced proposals 36
Projecting thermal coal export prices, particularly in the current volatile world
economic environment is necessarily subject to a great deal of uncertainty. Thefuture price trend is dependent on many factors including inter alia :
• demand and supply balance in the coal market
• world economic growth
• cost of coal of production
• price and availability of substitutes such as oil and gas
• technology changes in coal usage
• environmental policies potentially affecting coal usage
• increasing low cost production, including that from Australia, China and
Indonesia.
ACIL Tasman expects that the past trends of gradually declining real A$ coal
prices are likely to continue. However a combination of current very high
prices, recent falls in the Australian dollar, the time required to bring on new
production, and ease of infrastructure bottlenecks imply that coal prices are
expected to remain strong for one to two years. In the longer term as supply
and demand move towards balance, ACIL Tasman projects that thermal coal
export prices will return to a trend of real price reduction. This real reduction
in export coal prices is likely to be reinforced by the widespread introduction
of limits on CO2-e production through among other things emissions trading,in which coal is disadvantaged against other fuel options including gas and
renewable sources.
In summary, an ongoing gradual decline in real coal prices can be expected on
the basis of:
• ongoing real reduction in production costs due to:
− continued technological improvements
− improving economies of scale
− ongoing development of new lower cost developments
• subdued growth in demand for thermal coal because of:
− increased use of alternative fuels including renewable
− reducing energy intensity in industry due to innovation and moreefficient use of material inputs
− technology developments in coal usage
− electricity demand management
− the widespread introduction of emissions trading.
The ACIL Tasman projection of export thermal coal prices in nominal and real
A$ is shown in Figure 3.

7/27/2019 ACIL Tasman April 2009
http://slidepdf.com/reader/full/acil-tasman-april-2009 44/104
Fuel resource, new entry and generation costs in the NEM
Existing, committed and advanced proposals 37
Coal prices into existing NSW power stations
In NSW all coal is supplied to the power stations by independently owned coal
mines under a variety of contractual arrangements with varying terms, prices
and transport arrangements. These contracts vary from relatively short term (1
to 2 years) to very long term (20 years or more). Generally these contracts
were written before the surge in export coal prices from early 2004 and carry
contract prices which are generally well below the export parity value being
experienced in today‟s export market.
New tonnage however will need to be sourced in a setting of higher export
coal prices. There are a number of strategies which local power stations will
employ to keep prices of new tonnage lower than export parity price and these
include:
• gaining access to undeveloped resources and employing a contract miner toproduce the coal. (there are many unallocated resources available in NSW for this purpose)
• offering firm contracts to potential new developments in order to achievediscounted prices by lowering the market and infrastructure risks associatednew developments
Figure 3Forecast of average annual export thermal coal prices (A$/tonne FOB)
Note: Real prices are expressed in 2009-10 dollars
Data source: ACIL Tasman analysis
$0
$20
$40
$60
$80
$100
$120
$140
$160
1 9 8 1 - 8 2
1 9 8 2 - 8 3
1 9 8 3 - 8 4
1 9 8 4 - 8 5
1 9 8 5 - 8 6
1 9 8 6 - 8 7
1 9 8 7 - 8 8
1 9 8 8 - 8 9
1 9 8 9 - 9 0
1 9 9 0 - 9 1
1 9 9 1 - 9 2
1 9 9 2 - 9 3
1 9 9 3 - 9 4
1 9 9 4 - 9 5
1 9 9 5 - 9 6
1 9 9 6 - 9 7
1 9 9 7 - 9 8
1 9 9 8 - 9 9
1 9 9 9 - 0 0
2 0 0 0 - 0 1
2 0 0 1 - 0 2
2 0 0 2 - 0 3
2 0 0 3 - 0 4
2 0 0 4 - 0 5
2 0 0 5 - 0 6
2 0 0 6 - 0 7
2 0 0 7 - 0 8
2 0 0 8 - 0 9
2 0 0 9 - 1 0
2 0 1 0 - 1 1
2 0 1 1 - 1 2
2 0 1 2 - 1 3
2 0 1 3 - 1 4
2 0 1 4 - 1 5
2 0 1 5 - 1 6
2 0 1 6 - 1 7
2 0 1 7 - 1 8
2 0 1 8 - 1 9
2 0 1 9 - 2 0
2 0 2 0 - 2 1
2 0 2 1 - 2 2
2 0 2 2 - 2 3
2 0 2 3 - 2 4
2 0 2 4 - 2 5
2 0 2 5 - 2 6
2 0 2 6 - 2 7
2 0 2 7 - 2 8
2 0 2 8 - 2 9
A $ p e r t o n n e
Nomin al actual
Nomin al forecast
Real actual
Real forecast

7/27/2019 ACIL Tasman April 2009
http://slidepdf.com/reader/full/acil-tasman-april-2009 45/104
Fuel resource, new entry and generation costs in the NEM
Existing, committed and advanced proposals 38
• entering into long term contractual arrangements with mines aimed atachieving cost related pricing
• offering to take non-exportable high ash coal, oxidised coal and washery rejects and middlings.
We expect these purchase strategies to result in reductions of around 20% on
the export parity price of coal at most locations. The resultant price forecasts
for the NSW portfolios are shown Table 25. The power stations in each of the
generation portfolios shown in Table 25 are as follows:
• Macquarie Generation (Bayswater and Liddell)
• Eraring Energy (Eraring)
• Delta Coastal (Vales Point and Munmorah)• Delta western (Mt Piper and Wallerawang)
• Redbank (Redbank).
Table 25 Projected marginal coal prices into NSW stations ($/GJ)
MacquarieGeneration
EraringEnergy
DeltaCoastal
DeltaWestern Redbank
2009-10 1.29 1.72 1.75 1.80 1.01
2010-11 1.24 1.71 1.73 1.78 1.01
2011-12 1.22 1.71 1.72 1.76 1.01
2012-13 1.31 1.70 1.71 1.75 1.00
2013-14 1.31 1.68 1.69 1.67 1.00
2014-15 1.30 1.73 1.68 1.39 1.00
2015-16 1.29 1.71 1.67 1.37 1.00
2016-17 1.29 1.70 1.65 1.35 0.99
2017-18 1.28 1.71 1.64 1.33 0.99
2018-19 1.27 1.69 1.63 1.31 0.99
2019-20 1.27 1.67 1.61 1.29 0.99
2020-21 1.26 1.65 1.65 1.27 0.98
2021-22 1.28 1.63 1.63 1.25 0.98
2022-23 1.31 1.61 1.61 1.24 0.98
2023-24 1.30 1.58 1.58 1.22 0.98
2024-25 1.28 1.56 1.56 1.20 0.97
2025-26 1.27 1.54 1.54 1.18 0.972026-27 1.41 1.52 1.52 1.16 0.97
2027-28 1.39 1.50 1.50 1.15 0.97
2028-29 1.37 1.48 1.48 1.13 0.96
Note: Real 2009-10 dollars per GJ
Data source: ACIL Tasman
Coal prices into existing VIC and SA power stations
Victorian brown coal
Extensive deposits of brown coal occur in the tertiary sedimentary basins of
Latrobe Valley coalfield which contains some of the thickest brown coal seamsin the world. The coal is up to 330 m thick and is made up of 4 main seams,

7/27/2019 ACIL Tasman April 2009
http://slidepdf.com/reader/full/acil-tasman-april-2009 46/104
Fuel resource, new entry and generation costs in the NEM
Existing, committed and advanced proposals 39
separated by thin sand and clay beds. The total brown coal resource in the
Latrobe Valley is estimated to be 394,000 million tonnes, with an estimateduseable brown coal reserve of 50,000 million tonnes.
Anglesea‟s brown coal reserves are estimated at around 120 million tonnes.
Average coal thickness is 27 metres. The coal is a high quality brown coal, with
a heat value of just over 15 MJ/kg.
Mine mouth dedicated coalmines supply all the power stations. The coalmines
are owned by the same entities that own the power stations with two
exceptions. The exceptions are: the Loy Yang B power station supplied by the
adjacent Loy Yang Mine owned and operated by Loy Yang Power (owners and
operators of the Loy Yang A power station); and Energy Brix which issupplied by the Morwell mine (owned and operated by International Power –
Hazelwood).
The marginal price of coal for the Victorian power stations is generally taken as
the incremental cash costs of mining each increment of coal. Table 26 details
the estimated total and variable costs for coal at each power station. The
variable costs for coal are based on the cost of electricity required to produce
the marginal tonne and the royalty charges.
Table 26 Estimated coal costs for Victorian generators in 2009-10
Power Station / Mine
TotalCashCost
($/tonne)
VariableCost
($/tonne)
EnergyContent
(GJ/tonne)
VariableCost
($/GJ)
Yallourn/Yallourn 3.24 0.62 6.8 0.10
Loy Yang A - directly from Loy Yang mine 3.00 0.65 8.2 0.08
Loy Yang B - purchased from Loy Yang mine 3.00 3.00 8.2 0.37
Hazelwood/Morwell 4.19 0.60 7.0 0.08
Anglesea/Anglesea 5.99 5.99 15.0 0.40
Energy Brix – purchased from Morwell 4.19 4.19 7.0 0.60
Data source: ACIL Tasman estimates
The variable cost of coal as calculated in Table 26 is used to calculate the
marginal cost for each Victorian Power station operating in the NEM. In the
cases where the coal mine is owned by the power station (Yallourn, Hazelwood
and Loy Yang A) the short run marginal costs mainly consists of the additional
electricity and royalty costs involved in mining the marginal tonne of coal. For
Anglesea the marginal cost of coal is taken to be the cost of extraction using
trucks and shovels. The marginal price of coal for the two stations that
purchase coal from nearby mines (Loy Yang B and Energy Brix) is taken to be
the estimated cost per unit of production.

7/27/2019 ACIL Tasman April 2009
http://slidepdf.com/reader/full/acil-tasman-april-2009 47/104
Fuel resource, new entry and generation costs in the NEM
Existing, committed and advanced proposals 40
South Australian black coal
The only currently producing coalfield in South Australia is near Leigh Creek based on low-grade sub-bituminous black coal. The mining operation involves
drilling, blasting and removal of overburden and coal by shovels and trucks.
After mining, the crushed coal is railed to the Port Augusta power stations.
Due to the steeply dipping seams, it is likely that economic recovery of coal
will be limited to between 70 and 100 Mt at depths of 150 – 200 m.
The Leigh Creek mine is about 250 km from the Northern power station. A
long-term freight contract is in place with Pacific National. The delivered cost
of coal is estimated at $1.40/GJ. The marginal cost of coal in South Australia is
taken as the average cash costs of production and transport. The life of theLeigh Creek mine is constantly under review and will depend on the cost of
mining and transport.
Coal price projection in Vic and SA
The projection for the next ten years is shown in Table 27. It has been
assumed that these costs would increase at about CPI so the real variable cost
over 20 year period of this study is the same as 2009-10 cost.
Table 27 Projection of marginal cost of coal into VIC and SA power stations ($/GJ)
Victoria South Australiaa
Yallourn Loy Yang A Loy Yang B Hazelwood Anglesea Energy Brix NorthernThomasPlayford
2009-10 0.10 0.08 0.37 0.08 0.40 0.60 1.52 1.52
2010-11 0.10 0.08 0.37 0.08 0.40 0.60 1.52 1.52
2011-12 0.10 0.08 0.37 0.08 0.40 0.60 1.52 1.52
2012-13 0.10 0.08 0.37 0.08 0.40 0.60 1.52 1.52
2013-14 0.10 0.08 0.37 0.08 0.40 0.60 1.52 1.52
2014-15 0.10 0.08 0.37 0.08 0.40 0.60 1.52 1.52
2015-16 0.10 0.08 0.37 0.08 0.40 0.60 1.52 1.52
2016-17 0.10 0.08 0.37 0.08 0.40 0.60 1.52 1.52
2017-18 0.10 0.08 0.37 0.08 0.40 0.60 1.52 1.52
2018-19 0.10 0.08 0.37 0.08 0.40 0.60 1.52 1.522019-20 0.10 0.08 0.37 0.08 0.40 0.60 1.52 1.52
2020-21 0.10 0.08 0.37 0.08 0.40 0.60 1.52 1.52
2021-22 0.10 0.08 0.37 0.08 0.40 0.60 1.52 1.52
2022-23 0.10 0.08 0.37 0.08 0.40 0.60 1.52 1.52
2023-24 0.10 0.08 0.37 0.08 0.40 0.60 1.52 1.52
2024-25 0.10 0.08 0.37 0.08 0.40 0.60 1.52 1.52
2025-26 0.10 0.08 0.37 0.08 0.40 0.60 1.52 1.52
2026-27 0.10 0.08 0.37 0.08 0.40 0.60 1.52 1.52
2027-28 0.10 0.08 0.37 0.08 0.40 0.60 1.52 1.52
2028-29 0.10 0.08 0.37 0.08 0.40 0.60 1.52 1.52
a There is considerable uncertainty over the life of the Leigh Creek mine beyond around 2017. Prices have been projected beyond 2017 on the basis of a
continuation of the existing mining regime for the purposes of modelling. The point at which the mine operation ceases is a decision for the modelling case in
questionNote: Real 2009-10 dollars per GJ
Data source: ACIL Tasman estimates

7/27/2019 ACIL Tasman April 2009
http://slidepdf.com/reader/full/acil-tasman-april-2009 48/104
Fuel resource, new entry and generation costs in the NEM
Existing, committed and advanced proposals 41
Coal prices into existing QLD power stations
In Qld there are four types of coal supply arrangement:
• mine mouth - own mine: Tarong, Kogan Creek, Millmerran
• mine mouth - captive independent mine: Callide B, Callide Power,Collinsville
• transported from captive independent mine: Stanwell
• transported from independent mine: Gladstone, Swanbank B.
Power stations in Queensland relying on their own mine mouth coal supply are
least likely to be affected by the high export prices and it has been assumed
that they will offer marginal fuel costs into the market which are currently less
than A$1.00/GJ. However they will be affected by mining costs which have
increased rapidly in recent years in response to strong demand and high oil and
tyre prices.
Power stations with an independently owned/operated mine mouth operation
are likely to be under pressure to accept higher prices more in line with export
parity particularly with price reviews and contract renewal. However we
understand that the existing contractual arrangements for the larger Callide
power stations have around two decades to run.
In 2004 Stanwell entered a 16 year arrangement with the Curragh mine whichis not linked to export prices. We expect that Stanwell will be actively seeking
advantageous alternative arrangements when these current arrangements
expire.
Gladstone and Swanbank which rely on transported coal from third party
mines are at greatest risk of pass through of export prices. However
Gladstone has a long term arrangement with Rolleston to take lower quality
coal. Swanbank is likely to continue on similar arrangements beyond the
current three year contract as the export infrastructure in the Brisbane region is
at capacity with limited prospect for an increase in the medium term.

7/27/2019 ACIL Tasman April 2009
http://slidepdf.com/reader/full/acil-tasman-april-2009 49/104
Fuel resource, new entry and generation costs in the NEM
Existing, committed and advanced proposals 42
3.4.2 Natural gas
Gas market prices are not directly observable, as no formal market structure
exists outside the Victorian system.8 Supply and transportation contracts for
existing gas-fired plant are generally held under long-term bilateral take-or-pay
agreements with gas suppliers or aggregators/intermediaries. The prices paid
for gas and transportation under these contracts are commercially sensitive and
therefore not publicly available.
Through examination of related data, industry knowledge and experience
ACIL Tasman has been able to estimate the gas costs to existing plant in theNEM.
The characteristics of gas supply including price for CCGT are dependent
upon a number of factors including:
• gas demand and supply balance and production costs
• pipeline capacity and cost of increasing capacity
8 Even the Victorian gas market, which is run by VENCorp, represents only a small proportionof the total gas consumed each year in the state.
Table 28Projection of marginal cost of coal into QLD power stations ($/GJ)
Gladstone Stanwell TarongSwanbank
BCallide B &
C Collinsville MillmerranKoganCreek
2009-10 1.56 1.40 1.01 2.20 1.32 2.10 0.85 0.75
2010-11 1.56 1.39 1.00 2.19 1.32 2.09 0.85 0.75
2011-12 1.56 1.39 1.00 2.18 1.31 2.09 0.85 0.75
2012-13 1.55 1.39 1.00 2.18 1.31 2.08 0.84 0.74
2013-14 1.55 1.38 1.00 2.17 1.31 2.08 0.84 0.74
2014-15 1.55 1.38 0.99 2.17 1.30 2.07 0.84 0.74
2015-16 1.54 1.38 0.99 2.16 1.30 2.07 0.84 0.74
2016-17 1.54 1.37 0.99 2.16 1.30 2.06 0.84 0.74
2017-18 1.53 1.37 0.99 2.15 1.29 2.06 0.83 0.74
2018-19 1.53 1.37 0.98 2.15 1.29 2.05 0.83 0.73
2019-20 1.53 1.36 0.98 2.14 1.29 2.05 0.83 0.732020-21 1.52 1.36 0.98 2.14 1.28 2.04 0.83 0.73
2021-22 1.52 1.36 0.98 2.13 1.28 2.04 0.83 0.73
2022-23 1.52 1.35 0.97 2.13 1.28 2.03 0.82 0.73
2023-24 1.51 1.35 0.97 2.12 1.27 2.03 0.82 0.72
2024-25 1.51 1.35 0.97 2.12 1.27 2.02 0.82 0.72
2025-26 1.50 1.34 0.97 2.11 1.27 2.02 0.82 0.72
2026-27 1.50 1.34 0.97 2.11 1.27 2.01 0.82 0.72
2027-28 1.50 1.34 0.96 2.10 1.26 2.01 0.81 0.72
2028-29 1.49 1.33 0.96 2.10 1.26 2.00 0.81 0.72
Note: Real 2009-10 dollars per GJ. Assumes long-term contracts contain price escalation of around 90% of CPI.
Data source: ACIL Tasman estimates

7/27/2019 ACIL Tasman April 2009
http://slidepdf.com/reader/full/acil-tasman-april-2009 50/104
Fuel resource, new entry and generation costs in the NEM
Existing, committed and advanced proposals 43
• physical plant location relative to gas supply sources and transmissioninfrastructure
• supply availability, pipeline transmission capacity and tariffs, availability of linepack, pipeline overrun charges
• expected plant capacity factors.
This section details the estimated fuel costs for existing and committed
generators which utilise natural gas as the primary fuel source. As discussed in
section 2.3.1, the prices to each station represent the estimated average contract
price. It therefore includes fixed components such as capacity reservations and
take-or-pay commitments, which at times, may not be strictly applicable in the
calculation of SRMC for bidding purposes.
Estimates have been made for stations which have existing gas supply
agreements in place, with these assumed to rollover to market-based rates
upon expiry. In most cases the transmission pipeline charges applied refer to
the quoted reference tariffs (where available) – even when gas transport costs
are internalised (ie the power station owner also owns the gas transmission
pipeline servicing the station).
The gas commodity price for peaking stations has generally been estimated to
be at a premium over the projected price for CCGT stations. Exceptions have
been made for peaking stations which are operated by entities which canincorporate swing volumes within a gas supply portfolio or stations which are
able to utilise the Victorian spot market.
Table 29 provides the estimated delivered gas price to each existing and
committed NEM station in real terms for the period 2009 – 10 through to
2028 – 29. As existing contracts expire it is assumed that the price to each
station is the same as that available to new entrants (discussed in section 4.2.1).

7/27/2019 ACIL Tasman April 2009
http://slidepdf.com/reader/full/acil-tasman-april-2009 51/104
44
Fue
lresource,newentryandgenerationcostsintheNEM
Exis
ting,committedandadvancedproposals
Table 29 Estimated delivered gas costs to existing, committed and advanced proposals (Real $/GJ)2009-
102010-
112011-
122012-
132013-
142014-
152015-
162016-
172017-
182018-
192019-
202020-
212021-
222022-
232023-
242024-
252025-
262026-
272027-
282028-
29
Queensland
Barcaldine 6.67 6.64 6.62 6.60 6.58 8.27 8.28 8.30 8.67 8.70 8.75 8.74 8.79 8.81 8.83 8.84 8.86 8.93 9.10 9.11
Braemar 2.67 2.67 2.67 2.67 2.67 2.67 2.67 3.33 4.14 4.17 4.20 4.21 4.35 4.86 4.93 4.95 4.98 5.04 5.19 5.21
Braemar 2 2.89 2.89 2.89 2.89 2.89 2.89 2.89 2.89 2.89 2.89 2.89 2.89 2.89 2.89 2.89 2.89 2.89 2.89 2.89 2.89
Condamine 0.95 0.95 0.95 0.95 0.95 0.95 0.95 0.95 0.95 0.95 0.95 0.95 0.95 0.95 0.95 0.95 0.95 0.95 0.95 0.95
Darling Downs 3.41 3.41 3.41 3.41 3.41 3.41 3.41 3.41 3.41 3.41 3.41 3.41 3.41 3.41 3.41 3.41 3.41 3.41 3.41 3.41
Oakey 4.24 4.23 4.22 4.21 4.20 6.02 6.05 6.08 6.46 6.51 6.57 6.57 6.64 6.67 6.70 6.72 6.76 6.84 7.02 7.05
Swanbank E 3.53 3.43 3.44 3.44 3.44 3.45 4.21 4.23 4.24 4.26 4.27 4.54 4.81 4.83 4.85 4.86 4.89 4.92 4.95 4.97
Roma 4.70 4.69 4.20 4.22 4.38 4.39 4.41 4.44 4.74 4.78 4.83 4.83 4.88 4.91 4.93 4.95 4.98 5.04 5.19 5.21
Townsville 4.05 4.04 4.03 4.02 4.02 4.01 4.00 3.99 3.98 3.97 5.59 5.60 5.63 5.64 5.64 5.66 5.71 5.71 5.90 5.90
Yarwun 3.55 3.57 3.55 3.53 3.52 3.50 3.52 3.50 3.49 3.47 3.45 3.47 3.45 3.44 3.42 3.41 3.42 3.41 3.39 3.38
New South Wales
Colongra 7.42 7.09 7.05 7.02 7.03 7.05 7.07 7.08 7.16 7.26 7.37 7.37 7.44 7.49 7.60 7.83 7.88 8.01 8.16 8.41
Smithfield 4.19 4.18 4.18 4.17 4.16 4.16 5.61 5.64 5.74 5.94 6.02 6.02 6.01 6.20 6.21 6.41 6.48 6.61 6.94 7.15
Tallawarra 3.80 3.80 3.79 3.79 3.78 3.78 3.77 3.77 3.76 3.76 3.75 3.75 6.01 6.20 6.21 6.41 6.48 6.61 6.94 7.15
Uranquinty 6.22 6.28 6.32 6.29 6.30 6.32 6.33 6.34 6.40 6.49 6.59 6.58 6.64 6.68 6.77 6.97 7.02 7.12 7.25 7.47
Victoria
Bairnsdale 4.29 4.29 4.29 4.29 4.89 4.91 5.22 5.25 5.35 5.55 5.64 5.63 5.63 5.82 5.83 6.04 6.11 6.24 6.57 6.78
Jeeralang 3.88 3.88 3.88 4.46 4.49 4.51 4.82 4.85 4.95 5.16 5.24 5.24 5.24 5.43 5.45 5.66 5.73 5.87 6.20 6.41
Laverton North 4.11 4.11 4.10 4.69 4.71 4.73 5.04 5.07 5.17 5.38 5.46 5.46 5.46 5.65 5.67 5.87 5.95 6.08 6.41 6.62
Mortlake OCGT 5.00 5.00 5.02 5.05 5.34 5.36 5.67 5.70 5.80 6.01 6.10 6.10 6.10 6.29 6.31 6.52 6.59 6.72 7.02 7.09
Newport 4.08 4.08 4.08 4.66 4.68 4.71 5.01 5.04 5.14 5.35 5.44 5.43 5.43 5.62 5.64 5.85 5.92 6.05 6.38 6.59
Somerton 4.12 4.11 4.11 4.70 4.72 4.74 5.05 5.08 5.18 5.38 5.47 5.47 5.47 5.66 5.67 5.88 5.95 6.09 6.42 6.63
Valley Power 3.87 3.87 3.87 4.46 4.48 4.50 4.81 4.84 4.94 5.15 5.24 5.24 5.24 5.43 5.45 5.65 5.73 5.86 6.19 6.40
South Australia
Torrens Island 4.04 4.03 4.02 4.01 4.01 4.00 3.99 3.98 6.19 6.39 6.47 6.47 6.46 6.65 6.66 6.86 6.93 7.06 7.35 7.41
Pelican Point 3.98 3.97 3.96 3.95 5.75 5.77 6.07 6.09 6.19 6.39 6.47 6.47 6.46 6.65 6.66 6.86 6.93 7.06 7.35 7.41
Ladbroke Grove 5.05 5.04 5.06 5.09 5.37 5.39 5.70 5.73 5.83 6.03 6.11 6.11 6.11 6.30 6.31 6.52 6.59 6.72 7.01 7.08
Osborne 4.14 4.13 4.12 4.11 4.10 5.77 6.07 6.09 6.19 6.39 6.47 6.47 6.46 6.65 6.66 6.86 6.93 7.06 7.35 7.41
Quarantine 5.98 5.97 5.99 6.02 6.33 6.34 6.68 6.70 6.81 7.03 7.12 7.11 7.11 7.31 7.33 7.55 7.62 7.77 8.08 8.16
Mintaro 6.61 6.61 6.63 6.67 7.02 7.05 7.43 7.46 7.59 7.84 7.95 7.95 7.94 8.18 8.20 8.46 8.55 8.71 9.08 9.16
Dry Creek 4.72 4.71 4.69 4.68 7.19 7.21 7.59 7.62 7.74 7.99 8.09 8.08 8.08 8.31 8.33 8.58 8.66 8.83 9.18 9.27
Hallett 6.61 6.61 6.63 6.67 7.02 7.05 7.43 7.46 7.59 7.84 7.95 7.95 7.94 8.18 8.20 8.46 8.55 8.71 9.08 9.16
Tasmania
Bell Bay 5.52 5.52 5.54 5.56 5.58 5.61 5.91 5.94 6.05 6.25 6.34 6.34 6.34 6.53 6.55 6.76 6.83 6.97 7.30 7.51
Bell Bay Three 5.52 5.52 5.54 5.56 5.58 5.61 5.91 5.94 6.05 6.25 6.34 6.34 6.34 6.53 6.55 6.76 6.83 6.97 7.30 7.51
Tamar Valley OCGT 5.52 5.52 5.54 5.56 5.58 5.61 5.91 5.94 6.05 6.25 6.34 6.34 6.34 6.53 6.55 6.76 6.83 6.97 7.30 7.51
Tamar Valley 5.52 5.52 5.54 5.56 5.58 5.61 5.91 5.94 6.05 6.25 6.34 6.34 6.34 6.53 6.55 6.76 6.83 6.97 7.30 7.51
Advanced Proposals
Mortlake 2 4.58 4.58 4.60 4.63 4.92 4.94 5.25 5.28 5.38 5.59 5.68 5.68 5.68 5.87 5.89 6.10 6.17 6.30 6.60 6.67
Spring Gully 0.80 0.80 0.80 0.80 0.80 0.80 0.80 0.80 0.80 0.80 0.80 0.80 0.80 0.80 0.80 0.80 0.80 0.80 0.80 0.80
Note: Real 2009-10 dollars
Data source: ACIL Tasman estimates

7/27/2019 ACIL Tasman April 2009
http://slidepdf.com/reader/full/acil-tasman-april-2009 52/104
Fuel resource, new entry and generation costs in the NEM
Existing, committed and advanced proposals 45
3.4.3 Liquid fuel
Liquid fuels, usually in the form of distillate, kerosene or fuel oil, are
commonly stored onsite at gas-fired peaking stations as a backup fuel when gas
supply or pipeline capacity is not available.9 However, a number of NEM
scheduled plant utilise liquid fuels as their primary fuel source. As outlined in
section 3.1, these stations are:
• Hunter Valley GT (NSW)
• Mackay GT (QLD)
• Mt Stuart (QLD)
• Angaston (SA)• Port Lincoln (SA)
• Snuggery (SA).
The very high cost of liquid fuels compared with coal or gas means that liquids
are rarely used as fuel for generation in the NEM. Aggregate liquid fuel
consumption by NEM scheduled plant is generally less than 0.5 PJ/a.
We have assumed a $30/GJ price for petroleum products (constant in real
terms) for each of the stations above which is reasonably consistent with the
assumed international oil price of US$80/bbl in the long-term (roughly $1.20/litre of product).10 This cost would include transport costs and storage
on-site.
3.5 Government schemes
There are currently two government schemes that explicitly impact the SRMC
of certain generators and therefore the way these generators offer energy into
the NEM, namely the Queensland 13% Gas Scheme11 (part of the Queensland
Clean Energy Policy) which is based on creation and surrender of Gas
Electricity Certificates (GECs) and the NSW Greenhouse Abatement Scheme
which is based on creation and surrender of NSW Greenhouse Gas Abatement
Certificates (NGACs).
With the introduction of the CPRS anticipated for 1 July 2010, ACIL Tasman
expects that both of these schemes will cease operation and transition into the
CPRS. The transition to CPRS may or may not involve some form of
9 Oil is also used in coal fired generators for start-up but this is a relatively small amount.
10 Energy content of liquid fuels (such as distillate, kerosene and fuel oil) typically ranges from
0.035 GJ/litre to 0.045 GJ/litre.11 Queensland Government announced the intention of increasing the amount of required gas-
fired generation from 13% to 18% by 2020.

7/27/2019 ACIL Tasman April 2009
http://slidepdf.com/reader/full/acil-tasman-april-2009 53/104
Fuel resource, new entry and generation costs in the NEM
Existing, committed and advanced proposals 46
compensation paid to recipients of these schemes if the benefits of CPRS are
less than the State-based schemes. Therefore within NEMMCO‟s modelling, prices for GEC and NGACs will
only be an influence for the first year (2009-10). ACIL Tasman has allowed for
a GEC benefit of $9.30/MWh for eligible gas-fired plant in Queensland and an
NGAC benefit of $4.90/MWh for eligible plant for 2009-10 only.
3.6 SRMC
The following tables detail the calculated SRMC values for each of the existing,
committed and advanced proposals. Table 30 provides SRMCs on an „as
generated basis‟ exclusive of carbon costs while Table 31 provides the SRMCson a generated basis including carbon costs.

7/27/2019 ACIL Tasman April 2009
http://slidepdf.com/reader/full/acil-tasman-april-2009 54/104
47
Fue
lresource,newentryandgenerationcostsintheNEM
Exis
ting,committedandadvancedproposals
Table 30 SRMC of existing, committed and advanced proposals excluding carbon costs ($/MWh generated)
2009-10 2010-11 2011-12 2012-13 2013-14 2014-15 2015-16 2016-17 2017-18 2018-19 2019-20 2020-21 2021-22 2022-23 2023-24 2024-25 2025-26 2026-27 2027-28 2028-29
NSW
Bayswater 13.25 12.78 12.65 13.48 13.46 13.38 13.30 13.28 13.19 13.11 13.05 12.97 13.15 13.44 13.34 13.23 13.13 14.43 14.25 14.06
Colongra 90.77 87.19 86.70 86.36 86.56 86.78 86.97 87.10 87.93 89.03 90.27 90.26 91.04 91.49 92.69 95.24 95.84 97.21 98.82 101.59
Eraring 17.50 17.42 17.35 17.25 17.13 17.57 17.41 17.24 17.38 17.18 16.98 16.78 16.58 16.38 16.18 15.98 15.79 15.59 15.40 15.21
Hunter Valley GT 383.47 383.47 383.47 383.47 383.47 383. 47 383.47 383.47 383.47 383.47 383.47 383.47 383. 47 383.47 383.47 383.47 383.47 383.47 383.4 7 383.47
Liddell 14.15 13.65 13.51 14.40 14.38 14.29 14.21 14.18 14.09 14.00 13.94 13.86 14.05 14.36 14.24 14.13 14.03 15.42 15.22 15.02
Mt Piper 17.87 17.70 17.57 17.45 16.73 14.07 13.89 13.72 13.54 13.37 13.20 13.03 12.86 12.69 12.52 12.35 12.19 12.02 11.86 11.69Munmorah 20.04 19.87 19.77 19.60 19.42 19.29 19.16 19.02 18.87 18.73 18.58 18.95 18.72 18.50 18.27 18.05 17.82 17.60 17.38 17.16
Redbank 12.51 12.49 12.46 12.43 12.40 12.37 12.35 12.32 12.29 12.27 12.24 12.21 12.18 12.16 12.13 12.10 12.08 12.05 12.02 12.00
Smithfiel d 37.22 37.16 37.11 37.05 37.00 36.94 49.10 49.31 50.12 51.81 52.50 52.46 52.41 53.97 54.08 55.78 56.34 57.44 60.13 61.88
Tallawarr a 27.58 27.54 27.51 27.47 27.44 27.40 27.37 27.34 27.30 27.27 27.24 27.20 43.00 44.30 44.39 45.82 46.28 47.21 49.46 50.92
Uranquinty 77.64 78.32 78.73 78.41 78.56 78.73 78.85 78.93 79.67 80.61 81.67 81.61 82.27 82.64 83.67 85.87 86.35 87.53 88.92 91.32
Vales Point B 18.09 17.94 17.85 17.70 17.54 17.42 17 .30 17.18 17.04 16.92 16.79 17.12 16.9 1 16.71 16.51 16.31 16.11 15.91 15.71 15. 51
Wallerawang C 19.34 19.16 19.02 18.89 18.11 15.20 15.01 14.82 14.63 14.44 14.25 14.07 13.88 13.70 13.51 13.33 13.15 12.97 12.79 12.61
QLD
Barcaldine 60.53 60.33 60.13 59.93 59.73 74.50 74.60 74.79 77.99 78.26 78.70 78.62 79.07 79.27 79.37 79.49 79.70 80.25 81.72 81.88
Braemar 38.98 38.96 38.96 38.95 38.95 38.95 38.94 46.64 56.22 56.51 56.93 56.95 58.62 64.56 65.45 65.69 66.04 66.75 68.45 68.73
Braemar 2 41.53 41.53 41.53 41.53 41.53 41.53 41.53 41.53 41.53 41.53 41.53 41.53 41.53 41.53 41.53 41.53 41.53 41.53 41.53 41.53
Callide B 13.35 13.32 13.29 13.26 13.23 13.20 13.17 13.14 13.11 13.08 13.06 13.03 13.00 12.97 12.94 12.91 12.88 12.85 12.82 12.80
Callide C 13.04 13.01 12.98 12.95 12.92 12.90 12.87 12.84 12.81 12.78 12.75 12.72 12.70 12.67 12.64 12.61 12.58 12.56 12.53 12.50
Collinsvi lle 26.33 26.27 26.21 26.14 26.08 26.02 25.96 25.90 25.84 25.78 25.72 25.66 25.60 25.54 25.48 25.42 25.37 25.31 25.25 25.19
Condamine 7.90 7.90 7.90 7.90 7.90 7.90 7.90 7.90 7.90 7.90 7.90 7.90 7.90 7.90 7.90 7.90 7.90 7.90 7.90 7.90
Darling Downs 26.11 26.11 26.11 26.11 26.11 26.11 26.11 26.11 26.11 26.11 26.11 26.11 26.11 26.11 26.11 26.11 26.11 26.11 26.11 26.11
Gladstone 16.34 16.30 16.26 16.22 16.19 16.15 16.11 16.08 16.04 16.00 15.97 15.93 15.90 15.86 15.82 15.79 15.75 15.72 15.68 15.65
Kogan Creek 7.77 7.76 7.74 7.72 7.71 7.69 7.68 7.66 7.64 7.63 7.61 7.60 7.58 7.56 7.55 7.53 7.52 7.50 7.49 7.47
Mackay GT 382.92 382.92 382.92 382.92 382.92 382.92 382.92 382.92 382.92 382.92 382.92 382.92 382.92 382.92 382.92 382.92 382.92 382.92 382.92 382.92
Millmer ran 8.93 8.91 8.89 8.87 8.86 8.84 8.82 8.80 8.78 8.76 8.74 8.72 8.71 8.69 8.67 8.65 8.63 8.61 8.60 8.58
Mt Stuart GT 357.98 357.98 357.98 357.98 357.98 357.98 357.98 357.98 357.98 357.98 357.98 357.98 357.98 357.98 357.98 357.98 357.98 357.98 357.98 357.98
Oakey 54.74 54.60 54.50 54.41 54.31 73.81 74.09 74.46 78.53 79.01 79.69 79.73 80.43 80.81 81.08 81.36 81.76 82.57 84.51 84.83
Roma GT 64.00 63.96 58.23 58.50 60.31 60.43 60.67 61.00 64.53 64.95 65.55 65.58 66.19 66.52 66.75 67.00 67.34 68.05 69.74 70.02
Stanwell 13.96 13.93 13.90 13.87 13.83 13.80 13.77 13.74 13.71 13.68 13.65 13.62 13.59 13.56 13.53 13.50 13.47 13.44 13.41 13.38
Swanbank B 24.94 24.88 24.82 24.76 24.71 24.65 24.59 24.53 24.48 24.42 24.36 24.31 24.25 24.19 24.14 24.08 24.02 23.97 23.91 23.86
Swanbank E 27.23 26.51 26.54 26.57 26.60 26.63 32.32 32.42 32.52 32.63 32.73 34.72 36.72 36.88 37.05 37.16 37.36 37.55 37.77 37.97
Tarong 10.52 10.50 10.48 10.46 10.43 10.41 10.39 10.37 10.35 10.32 10.30 10.28 10.26 10.24 10.21 10.19 10.17 10.15 10.13 10.11

7/27/2019 ACIL Tasman April 2009
http://slidepdf.com/reader/full/acil-tasman-april-2009 55/104
48
Fue
lresource,newentryandgenerationcostsintheNEM
Exis
ting,committedandadvancedproposals
2009-10 2010-11 2011-12 2012-13 2013-14 2014-15 2015-16 2016-17 2017-18 2018-19 2019-20 2020-21 2021-22 2022-23 2023-24 2024-25 2025-26 2026-27 2027-28 2028-29
Tarong North 10.14 10.12 10.10 10.08 10.05 10.03 10.01 9.99 9.97 9.95 9. 93 9.91 9.89 9. 87 9.8 4 9.82 9.80 9. 78 9.76 9.74
Townsvill e 35.68 35.61 35.55 35.49 35.42 35.36 35.29 35.23 35.17 35.11 47.40 47.48 47.69 47.73 47.71 47.92 48.26 48.27 49.69 49.70
Yarwun 36.80 37.03 36.84 36.66 36.49 36.31 36.50 36.33 36.16 36.00 35.84 36.00 35.84 35.68 35.53 35.38 35.52 35.37 35.22 35.08
SA
Angaston 414.37 414.37 414.37 414.37 414.37 414.37 414.37 414.37 414.37 414.37 414.37 414.37 414.37 414.37 414.37 414.37 414.37 414.37 414.37 414.37
Dry Creek GT 72.67 72.52 72.38 72.24 105. 86 106.16 111.21 111.63 113.25 116.63 118.01 117.91 117.81 120.95 121.14 124.56 125.66 127.88 132.68 133.79
Hallett 106.07 105.98 106.34 106.90 112.08 112.46 118.02 118.54 120.37 124.10 125.66 125.62 125.57 129.04 129.31 133.09 134.35 136.82 142.10 143.37
Ladbroke Grove 62.22 62.16 62.39 62.74 66.03 66.27 69.81 70.13 71.30 73.67 74.67 74.64 74.60 76.81 76.98 79.38 80.18 81.75 85.11 85.91
Mintaro GT 91.78 91.71 92.01 92.49 96.90 97.23 101.97 102.41 103.98 107.16 108.49 108.45 108.41 111.37 111.60 114.83 115.90 118.01 122.51 123.59
Northern 16.06 16.06 16.06 16.06 16.06 16.06 16.06 16.06 16.06 16.06 16.06 16.06 16.06 16.06 16.06 16.06 16.06 16.06 16.06 16.06
Osborne 38.52 38.44 38.36 38.29 38.21 51.80 54.25 54.45 55.24 56.88 57.55 57.50 57.45 58.97 59.07 60.73 61.26 62.34 64.66 65.20
Pelican Point 30.26 30.20 30.13 30.07 43.29 43.42 45.63 45.82 46.53 48.01 48.61 48.57 48.52 49.90 49.98 51.48 51.96 52.93 55.03 55.52
Playford B 25.80 25.80 25.80 25.80 25.80 25.80 25.80 25.80 25.80 25.80 25.80 25.80 25.80 25.80 25.80 25.80 25.80 25.80 25.80 25.80
Port Lincoln GT 391.00 391.00 391.00 391.00 391.00 391.00 391.00 391.00 391.00 391.00 391.00 391.00 391.00 391.00 391.00 391.00 391.00 391.00 391.00 391.00
Quarantine 73.04 72.94 73.13 73.45 76.73 76.94 80.48 80.77 81.91 84.27 85.24 85.17 85.10 87.30 87.44 89.83 90.60 92.15 95.51 96.29
Snuggery 412.25 412.25 412.25 412.25 412.25 412.25 412.25 412.25 412.25 412.25 412.25 412.25 412.25 412.25 412.25 412.25 412.25 412.25 412.25 412.25
Torrens Island A 52.23 52.12 52.01 51.89 51 .78 51.67 51 .56 51.45 78. 86 81.35 82. 37 82.29 82.2 2 84.53 84.6 8 87.20 88.02 89.65 93.19 9 4.02
Torrens Island B 48.22 48.12 48.02 47.92 47 .81 47.71 47 .61 47.51 72. 72 75.01 75. 95 75.88 75.8 2 77.94 78.0 8 80.40 81.15 82.65 85.91 8 6.67
TAS
Bell Bay 66.49 66.47 66.71 66.96 67.20 67.44 70.73 71.05 72.15 74.37 75.31 75.31 75.31 77.36 77.55 79.79 80.55 82.02 85.52 87.81
Bell Bay Three 74.50 74.48 74.75 7 5.03 75.30 75.58 79 .30 79.67 80.91 83 .42 84.49 84.49 84.4 9 86.81 87.02 89.56 90.42 92.09 96.05 9 8.65
Tamar Valley 41.15 41.14 41.30 41.47 41.64 41.80 44.04 44.26 45.01 46.52 47.16 47.16 47.16 48.55 48.68 50.20 50.73 51.73 54.11 55.67
Tamar Valley OCGT 74.50 74. 48 74.75 75.03 75 .30 75.58 79.30 79. 67 80.91 83.42 84. 49 84.49 84.49 86. 81 87.0 2 89.56 90.42 92. 09 96.05 98.65
VIC
Anglesea 5.73 5.73 5.73 5.73 5.73 5.73 5.73 5.73 5.73 5.73 5.73 5.73 5.73 5.73 5.73 5.73 5.73 5.73 5.73 5.73
Bairnsdale 46.30 46.27 46.24 46.21 52.45 52.66 55.78 56.07 57.09 59.19 60.07 60.04 60.01 61.96 62.11 64.23 64.93 66.32 69.66 71.83
Energy Brix 8.57 8.57 8.57 8.57 8.57 8.57 8.57 8.57 8.57 8.57 8.57 8.57 8.57 8.57 8.57 8.57 8.57 8.57 8.57 8.57
Hazelwood 2.30 2.30 2.30 2.30 2.30 2.30 2.30 2.30 2.30 2.30 2.30 2.30 2.30 2.30 2.30 2.30 2.30 2.30 2.30 2.30
Jeeralang A 67.91 67.90 67.90 76.86 77.20 77.54 82.22 82.68 84.25 87.40 88.74 88.74 88.73 91.65 91.91 95.10 96.19 98.28 103.27 106.53
Jeeralang B 67.91 67.90 67.90 76.86 77.20 77.54 82.22 82.68 84.25 87.40 88.74 88.74 88.73 91.65 91.91 95.10 96.19 98.28 103.27 106.53
Laverton North 55.16 55.14 55.12 61.90 62.14 62.39 65.92 66.26 67.43 69.80 70.80 70.79 70.77 72.97 73.16 75.56 76.37 77.94 81.71 84.17
Loy Yang A 2.08 2.08 2.08 2.08 2.08 2.08 2 .08 2.08 2.08 2 .08 2.08 2.08 2.0 8 2.08 2.08 2.08 2.08 2.08 2.08 2.08
Loy Yang B 5.70 5.70 5.70 5.70 5.70 5.70 5 .70 5.70 5.70 5 .70 5.70 5.70 5.7 0 5.70 5.70 5.70 5.70 5.70 5.70 5.70
Mortlake 62.62 62.59 62.84 63.20 66.33 66.58 69.93 70.26 71.39 73.65 74.61 74.61 74.61 76.71 76.90 79.18 79.96 81.46 84.64 85.42
Newport 44.04 44.03 44.02 50.04 50.26 50.48 53.63 53.93 54.97 57.08 57.98 57.96 57.95 59.91 60.08 62.21 62.93 64.33 67.69 69.87
Somerton 69.57 69.55 69.53 78.11 78.42 78.73 83.20 83.63 85.11 88.12 89.39 89.37 89.35 92.13 92.37 95.41 96.44 98.43 103.20 106.31
Valley Power 65.65 65.65 65.64 74.19 74.52 74.85 79.31 79.75 81.25 84.26 85.54 85.53 85.53 88.32 88.56 91.61 92.64 94.64 99.40 102.51

7/27/2019 ACIL Tasman April 2009
http://slidepdf.com/reader/full/acil-tasman-april-2009 56/104
49
Fue
lresource,newentryandgenerationcostsintheNEM
Exis
ting,committedandadvancedproposals
2009-10 2010-11 2011-12 2012-13 2013-14 2014-15 2015-16 2016-17 2017-18 2018-19 2019-20 2020-21 2021-22 2022-23 2023-24 2024-25 2025-26 2026-27 2027-28 2028-29
Yallourn 2.41 2.41 2.41 2.41 2.41 2.41 2.41 2.41 2.41 2.41 2.41 2.41 2.41 2.41 2.41 2.41 2.41 2.41 2.41 2.41
ADVANCED PROPOSALS
Mortlake 2 32.99 32.97 33.13 33.36 35.36 35.52 37.67 37.88 38.60 40.05 40.66 40.66 40.66 42.01 42.13 43.59 44.09 45.05 47.08 47.58
Spring Gully 6.65 6.65 6.65 6.65 6.65 6.65 6.65 6.65 6.65 6.65 6.65 6.65 6.65 6.65 6.65 6.65 6.65 6.65 6.65 6.65
Note: Real 2009-10 $/MWh as generated. Excludes any GEC/NGAC benefits and carbon costs
Data source: ACIL Tasman
Table 31 SRMC of existing, committed and advanced proposals including carbon costs ($/MWh generated)
2009-10 2010-11 2011-12 2012-13 2013-14 2014-15 2015-16 2016-17 2017-18 2018-19 2019-20 2020-21 2021-22 2022-23 2023-24 2024-25 2025-26 2026-27 2027-28 2028-29
NSW
Bayswater 13.25 34.59 35.20 37.85 39.65 41.39 43.12 44.81 46.22 47.63 49.18 50.60 52.49 54.38 55.98 57.59 58.88 62.10 63.73 65.58
Colongra 90.77 103.91 103.99 105.04 106.64 108.26 109.84 111.27 113.25 115.50 117.97 119.10 121.20 122.88 125.39 129.25 130.91 133.76 136.76 141.09
Eraring 17.50 39.26 39.94 41.66 43.36 45.62 47.28 48.83 50.46 51.76 53.16 54.46 55.97 57.38 58.90 60.41 61.61 63.34 64.97 66.81
Hunter Valley GT 383.47 405.35 406.10 407.92 409.74 411. 57 413.39 415.11 416.61 418.11 419.72 421.22 422. 93 424.54 426.26 427.98 429.37 431.30 433.1 2 435.16
Liddell 14.15 37.67 38.35 41.25 43.23 45.15 47.06 48.92 50.47 52.03 53.74 55.31 57.38 59.46 61.23 63.00 64.42 67.94 69.74 71.78
Mt Piper 17.87 38.47 39.06 40.67 41.69 40.75 42.31 43.76 45.01 46.27 47.62 48.88 50.34 51.70 53.16 54.62 55.78 57.45 59.01 60.78
Munmorah 20.04 44.96 45.72 47.64 49.55 51.51 53.47 55.30 56.87 58.45 60.15 62.24 63.98 65.60 67.34 69.09 70.46 72.46 74.33 76.44
Redbank 12.51 38.58 39.45 41.60 43.74 45.89 48.04 50.06 51.82 53.58 55.48 57.24 59.26 61.15 63.17 65.19 66.83 69.10 71.25 73.65
Smithfiel d 37.22 49.94 50.32 51.33 52.34 53.36 66.58 67.79 69.48 72.04 73.67 74.51 75.47 77.97 79.07 81.78 83.15 85.38 89.14 92.07
Tallawarr a 27.58 38.24 38.57 39.43 40.29 41.14 42.00 42.81 43.51 44.21 44.96 45.66 62.30 64.39 65.32 67.58 68.73 70.60 73.74 76.20
Uranquinty 77.64 95.04 96.03 97.09 98.64 100.20 101.71 103.11 104.99 107.08 109.37 110.46 112.43 114.03 116.37 119.88 121.43 124.09 126.86 130.82
Vales Point B 18.09 40.29 40.97 42.68 44.38 46.12 47 .87 49.50 50.90 52.31 53.82 55.68 57.2 3 58.67 60.23 61.78 63.00 64.78 66.44 68. 33
Wallerawang C 19.34 41.82 42.46 44.22 45.32 44.31 46.00 47.59 48.96 50.32 51.80 53.17 54.76 56.24 57.84 59.43 60.70 62.52 64.22 66.16
QLD
Barcaldine 60.53 71.91 72.10 72.87 73.63 89.36 90.44 91.53 95.52 96.60 97.89 98.60 99.96 101.01 102.02 103.04 103.99 105.57 108.00 109.23
Braemar 38.98 54.48 55.01 56.30 57.58 58.87 60.16 69.08 79.72 81.08 82.63 83.72 86.61 93.69 95.80 97.26 98.60 100.68 103.67 105.39
Braemar 2 41.53 57.05 57.58 58.87 60.17 61.46 62.75 63.97 65.03 66.10 67.24 68.30 69.52 70.66 71.88 73.10 74.09 75.45 76.75 78.19
Callide B 13.35 33.93 34.61 36.29 37.98 39.67 41.36 42.94 44.33 45.71 47.20 48.58 50.17 51.66 53.25 54.83 56.12 57.91 59.60 61.49
Callide C 13.04 33.47 34.15 35.82 37.50 39.18 40.85 42.43 43.80 45.18 46.66 48.03 49.61 51.09 52.66 54.24 55.52 57.29 58.97 60.85
Collinsvi lle 26.33 51.83 52.64 54.71 56.78 58.85 60.92 62.87 64.56 66.25 68.07 69.77 71.71 73.53 75.48 77.42 78.99 81.19 83.26 85.58
Condamine 7.90 16.97 17.28 18.03 18.79 19.55 20.30 21.01 21.64 22.26 22.92 23.55 24.26 24.93 25.64 26.35 26.93 27.73 28.48 29.33
Darling Downs 26.11 35.28 35.59 36.36 37.12 37.88 38.65 39.37 40.00 40.63 41.30 41.93 42.65 43.32 44.04 44.76 45.35 46.16 46.92 47.78
Gladstone 16.34 37.68 38.38 40.12 41.87 43.62 45.36 47.00 48.43 49.86 51.40 52.83 54.47 56.01 57.65 59.29 60.62 62.47 64.22 66.17
Kogan Creek 7.77 2 7.59 28.25 29.89 31.52 33.16 34.80 36.34 37.68 39.03 40.47 41.82 43.35 44.80 46.34 47.88 49.13 50.86 52.50 54.33

7/27/2019 ACIL Tasman April 2009
http://slidepdf.com/reader/full/acil-tasman-april-2009 57/104
50
Fue
lresource,newentryandgenerationcostsintheNEM
Exis
ting,committedandadvancedproposals
2009-10 2010-11 2011-12 2012-13 2013-14 2014-15 2015-16 2016-17 2017-18 2018-19 2019-20 2020-21 2021-22 2022-23 2023-24 2024-25 2025-26 2026-27 2027-28 2028-29
Mackay GT 382.92 404.80 405.55 407.37 409.20 411.02 412.84 414.56 416.06 417.56 419.17 420.67 422.39 424.00 425.71 427.43 428.82 430.75 432.58 434.61
Millmer ran 8.93 29.07 29.74 31.40 33.06 34.72 36.39 37.95 39.31 40.68 42.14 43.51 45.07 46.53 48.09 49.66 50.92 52.68 54.35 56.20
Mt Stuart GT 357.98 378.40 379.10 380.80 382.50 384.20 385.91 387.51 388.91 390.31 391.81 393.21 394.81 396.32 397.92 399.52 400.82 402.62 404.32 406.23
Oakey 54.74 68.81 69.20 70.29 71.37 92.05 93 .51 95.00 100.05 101.50 103.23 104.24 106.06 107.48 108.86 110.26 111.56 113.63 116.75 118.40
Roma GT 64.00 79.40 74.19 75.75 78.85 80.26 81.79 83.32 87.92 89.40 91.12 92.22 94.03 95.50 96.94 98.40 99.73 101.80 104.77 106.49
Stanwell 13.96 33.81 34.46 36.08 37.71 39.33 40.96 42.49 43.82 45.15 46.58 47.92 49.45 50.88 52.41 53.94 55.17 56.90 58.52 60.34
Swanbank B 24.94 48.35 49.10 50.99 52.89 54.79 56.69 58.47 60.03 61.58 63.25 64.80 66.59 68.25 70.04 71.82 73.26 75.28 77.18 79.31
Swanbank E 27.23 36.37 36.73 37.58 38.43 39.28 45.80 46.67 47.45 48.24 49.06 51.72 54.50 55.38 56.32 57.21 58.04 59.09 60.13 61.25
Tarong 10.52 30.64 31.31 32.96 34.62 36.27 37.93 39.49 40.85 42.21 43.67 45.03 46.58 48.04 49.60 51.16 52.42 54.17 55.83 57.69
Tarong North 10.14 29.32 29.96 31.54 33.12 34.69 36.27 37.76 39.06 40.35 41.74 43.04 44.53 45.92 47.40 48.89 50.09 51.76 53.34 55.11
Townsvill e 35.68 45.68 45.96 46.74 47.51 48.29 49.06 49.79 50.42 51.05 64.08 64.85 65.86 66.63 67.41 68.40 69.39 70.28 72.54 73.49
Yarwun 36.80 50.79 51.08 52.04 53.01 53.99 55.32 56.23 57.01 57.79 58.64 59.74 60.66 61.52 62.45 63.38 64.39 65.45 66.46 67.60
SA
Angaston 414.37 437.49 438.28 440.21 442.13 444.06 445.99 447.80 449.38 450.97 452.67 454.26 456.07 457.77 459.58 461.39 462.87 464.91 466.83 468.99
Dry Creek GT 72.67 94.48 95.09 96.78 132. 24 134.36 141.24 143.38 146.52 151.40 154.39 155.80 157.42 162.17 164.09 169.23 171.73 175.89 182.51 185.67
Hallett 106.07 129.89 131.07 133.63 140.79 143.17 150.72 153.11 156.59 161.96 165.28 166.88 168.70 173.93 176.08 181.74 184.52 189.10 196.37 199.86
Ladbroke Grove 62.22 81.19 82.07 84.01 88.89 90.71 95.84 97.65 100.12 103.81 106.20 107.47 108.93 112.54 114.20 118.10 120.11 123.36 128.30 130.88
Mintaro GT 91.78 112.10 113.10 115.28 121.39 123.42 129.86 131.90 134.86 139.45 142.28 143.64 145.19 149.65 151.49 156.31 158.68 162.58 168.78 171.77
Northern 16.06 37.13 37.85 39.60 41.36 43.11 44.87 46.52 47.97 49.41 50.96 52.41 54.06 55.61 57.26 58.91 60.25 62.11 63.87 65.83
Osborne 38.52 51.75 52.13 53.17 54.20 68.90 72.46 73.71 75.41 77.96 79.61 80.47 81.47 83.97 85.11 87.81 89.19 91.44 94.88 96.66
Pelican Point 30.26 42.22 42.56 43.50 57.73 58.86 62.07 63.19 64.73 67.03 68.52 69.30 70.20 72.46 73.49 75.93 77.17 79.21 82.31 83.91
Playford B 25.80 58.31 59.42 62.13 64.84 67.55 70.26 72.81 75.04 77.27 79.66 81.89 84.44 86.83 89.38 91.93 94.00 96.87 99.58 102.61
Port Lincoln GT 391.00 412.81 413.56 415.37 417.19 419.01 420.83 422.54 424.03 425.53 427.14 428.63 430.34 431.95 433.66 435.37 436.76 438.68 440.50 442.53
Quarantine 73.04 9 0.41 91.20 9 2.98 97 .72 99. 38 104.38 106.04 108.38 111.94 114.19 115.32 116.62 120.10 121.61 125.38 127.26 130.36 135.17 137.58
Snuggery 412.25 435.24 436.03 437.95 439.87 441.78 443.70 445.50 447.08 448.66 450.35 451.93 453.73 455.42 457.23 459.03 460.49 462.52 464.44 466.58
Torrens Island A 52.23 72.38 72.96 74.54 76.11 77.69 79.27 80.75 109.54 113.43 115.93 117.25 118.77 122.57 124.31 128.42 130.52 133.95 139.17 141.88
Torrens Island B 48.22 66.76 67.30 68.75 70.20 71.65 73.10 74.46 100.95 104.52 106.83 108.04 109.44 112.94 114.53 118.32 120.25 123.40 128.21 130.70
TAS
Bell Bay 66.49 80.75 81.48 82.91 84.34 85.77 90 .25 91.70 93.77 96.97 98.96 99.94 101.06 104.16 105.47 108.82 110.50 113.23 117.92 121.54
Bell Bay Three 74.50 90.64 91.47 93.09 94.72 96.34 101.41 103.04 105.40 109.02 111.27 112.38 113.65 117.16 118.64 122.44 124.34 127.43 132.74 136.84
Tamar Valley 41.15 50.86 51.35 52.33 53.30 54.28 57.33 58.31 59.73 61.90 63.26 63.92 64.69 66.80 67.69 69.97 71.11 72.97 76.16 78.63
Tamar Valley OCGT 74.50 90.64 91.47 93.09 94.72 96.34 101.41 103.04 105.40 109.02 111.27 112.38 113.65 117.16 118.64 122.44 124.34 127.43 132.74 136.84
VIC
Anglesea 5.73 31.17 32.04 34.16 36.28 38.40 40.52 42.52 44.26 46.01 47.88 49.63 51.62 53.49 55.49 57.48 59.10 61.35 63.47 65.84
Bairnsdale 46.30 59.99 60.43 61.54 68.93 70.27 74.54 75.90 77.87 80.91 82.80 83.71 84.76 87.71 88.93 92.13 93.71 96.31 100.79 104.24
Energy Brix 8.57 38. 18 39.20 41.67 44.14 46.60 49.07 51.39 53.43 55.46 57.64 59.67 61.99 64.17 66.49 68.81 70.70 73.31 75.78 78.54
Hazelwood 2.30 34.43 35.54 38.22 40.89 43.57 46.25 48.77 50.98 53.18 55.54 57.75 60.27 62.63 65.16 67.68 69.72 72.56 75.24 78.23

7/27/2019 ACIL Tasman April 2009
http://slidepdf.com/reader/full/acil-tasman-april-2009 58/104
51
Fue
lresource,newentryandgenerationcostsintheNEM
Exis
ting,committedandadvancedproposals
2009-10 2010-11 2011-12 2012-13 2013-14 2014-15 2015-16 2016-17 2017-18 2018-19 2019-20 2020-21 2021-22 2022-23 2023-24 2024-25 2025-26 2026-27 2027-28 2028-29
Jeeralang A 67.91 88.27 88.96 99.62 101.66 103.70 110.08 112.14 115.10 119.65 122.49 123.88 125.47 129.89 131.75 136.53 138.92 142.81 149.49 154.65
Jeeralang B 67.91 88.27 88.96 99.62 101.66 103.70 110.08 112.14 115.10 119.65 122.49 123.88 125.47 129.89 131.75 136.53 138.92 142.81 149.49 154.65
Laverton North 55.16 70. 56 71.07 79.13 80 .66 82.19 87.01 88. 55 90.78 94.22 96. 35 97.40 98.59 101.92 103.32 106.93 108.72 111.65 116.71 120.60
Loy Yang A 2.08 27.95 28.83 30.99 33.14 35.30 37.45 39.48 41.26 43.03 44.93 46.71 48.74 50.64 52.67 54.69 56.34 58.62 60.78 63.19
Loy Yang B 5.70 32.58 33.51 35.75 37.99 40.23 42.47 44.57 46.42 48.26 50.24 52.08 54.19 56.17 58.28 60.39 62.10 64.47 66.71 69.21
Mortlake 62.62 77.17 77.92 79.49 83.83 85.29 89.86 91.34 93.46 96.72 98.76 99.76 100.90 104.07 105.40 108.83 110.54 113.33 117.72 119.86
Newport 44.04 57.75 58.20 65.37 66.74 68.10 72.39 73.76 75.75 78.80 80.70 81.63 82.69 85.66 86.90 90.12 91.71 94.32 98.82 102.28
Somerton 69.57 89.08 89.73 99.94 101.88 103.82 109.92 111.88 114.70 119.05 121.75 123.07 124.58 128.81 130.57 135.14 137.42 141.13 147.53 152.46
Valley Power 65.65 85.08 85.74 95.91 97.86 99.81 105.89 107.86 110.68 115.02 117.73 119.06 120.58 124.80 126.57 131.14 133.41 137.12 143.50 148.43
Yallourn 2.41 32.70 33.74 36.27 38.79 41.31 43.84 46.21 48.29 50.37 52.60 54.68 57.05 59.28 61.66 64.03 65.96 68.64 71.16 73.98
ADVANCED PROPOSALS
Mortlake 2 32.99 42.30 42.78 43.79 46.57 47.50 50.43 51.37 52.73 54.82 56.12 56.76 57.49 59.52 60.37 62.56 63.66 65.44 68.25 69.62
Spring Gully 6.65 15. 24 15.54 16.25 16.97 17.69 18.40 19.08 19.67 20.26 20.89 21.48 22.15 22.79 23.46 24.13 24.68 25.44 26.16 26.96
Note: Real 2009-10 $/MWh as generated. Includes emission permits prices as per Table 5. Excludes any GEC/NGAC benefits for 2009-10
Data source: ACIL Tasman

7/27/2019 ACIL Tasman April 2009
http://slidepdf.com/reader/full/acil-tasman-april-2009 59/104
Fuel resource, new entry and generation costs in the NEM
New entrant technologies 52
4 New entrant technologies This chapter provides estimates of LRMC and SRMC for the following new
entrant technologies:
• Combined Cycle Gas Turbine (CCGT)
• Open Cycle Gas Turbine (OCGT)
• Supercritical coal (SC)
• Ultra-supercritical coal (USC)
• Integrated gasification combined cycle (IGCC)
• Carbon capture and storage variants (CCS)• Nuclear.
Table 32 provides some of the details of each technology including capacity,
auxiliaries, thermal efficiency and O&M costs from ACIL Tasman‟s analysis.
Some points to note from Table 32:
• Some of the new entrant technologies have been differentiated based ontheir cooling method, with air cooled stations generally attracting highercapital costs and auxiliary usage rates. This recognises that access to cooling
water for coal plant may be limited within some areas of the NEM.
• The typical new entrant size is a relatively nominal figure. In reality plantconfigurations can be quite different depending upon the individual projectcircumstances. We note the potential for larger or smaller new entrantprojects (sizing of CCGTs is somewhat flexible, while new coal projectsmay be larger than the nominal 500 MW).
• Auxiliary loads for plants which incorporate CCS technology aresignificantly higher reflecting the energy required to capture and compressCO2 from flue gas streams
• Thermal efficiencies are anticipated to improve over time as a result of technological improvements. The projected change in thermal efficiencies
over time is shown in Table 36 (on a sent-out basis) and Table 37 (on agenerated basis).
• O&M costs are somewhat higher than the previous study – particularly forFOM – as a result of cost increases seen over recent years for Australianplant.
• ACIL Tasman has taken a slightly different approach in relation to thetreatment of VOM and FOM for CCGT plant. Within the 2007 study, it
was assumed that CCGT would continue to play an intermediate role in theNEM (a result of no explicit carbon signal) and hence the estimated split of O&M between fixed and variable components was such that VOM
contained some elements of maintenance. Owing to the anticipatedintroduction of the CPRS, it is now anticipated that CCGT plant will

7/27/2019 ACIL Tasman April 2009
http://slidepdf.com/reader/full/acil-tasman-april-2009 60/104
Fuel resource, new entry and generation costs in the NEM
New entrant technologies 53
operate in a more baseload fashion, and hence the split between FOM and VOM has been adjusted to reflect this mode.
Table 33 provides the assumed economic life, earliest likely build date, lead
times and construction profiles for each of the new entrant technologies
examined. Some points to note from Table 33:
• While the economic life of some technologies extends beyond 30 years, ACIL Tasman only uses a 30 year life within its calculation of LRMC. Thisis due to the fact that in order to reach 40 years, stations typically require asignificant capital injection for refurbishment, which is not included withinthe DCF
• The earliest likely build date incorporates not only the construction and
planning lead times required, but also technological development (in thecase of geothermal or CCS equipped plant) and changes in governmentpolicy (in the case of nuclear).
• The construction profile gives an approximation of the percent of theheadline capital cost expended in each year which has the effect of explicitly incorporating interest during construction within the DCF.
The matrix in Table 34 shows ACIL Tasman‟s assessment of the potential for
construction of the different technologies within each of the 16 NEM zones.
Points to note from Table 34 are:
• The location of coal-fired technology has been limited to zones thatcontain suitable coal resources for mine mouth development (see section4.2.2). Although coal can be transported by rail to other zones, the cost of transport would generally make the uneconomic relative to transmissiondevelopment
• The development of gas-fired units has not been restricted on the basis thatgas transmission is a much smaller component of delivered costs than forcoal and a ready gas transmission network already exists throughoutEastern Australia
• Water cooled coal-fired units have been assessed to only be likely within
the NQ and LV zones as a result of the repricing and enhanced valueattached to water resources throughout the NEM. The likelihood of watercooled coal-fired units in the NQ and LV zones is based on relatively abundant water availability in the NQ zone and water likely to be availablein the LV zone following the closure of existing brown coal-fired plant
• Geothermal hot dry rock developments have been restricted to zones where geothermal exploration is particularly advanced. We note howeverthat if the technology is proven to be viable at lower insitu temperatures,this would open up the possibility of generation developments in otherNEM zones.
• Development of nuclear plants is assumed to only occur in more sparsely populated zones of the NEM.

7/27/2019 ACIL Tasman April 2009
http://slidepdf.com/reader/full/acil-tasman-april-2009 61/104
Fuel resource, new entry and generation costs in the NEM
New entrant technologies 54
Table 35 details the projection of capital costs for each of the new entrant
technologies over the period 2009-10 through to 2028-29 in real terms. Table 36 and Table 37 detail the projected thermal efficiencies for each new
entrant technology in set-out and generated terms respectively.

7/27/2019 ACIL Tasman April 2009
http://slidepdf.com/reader/full/acil-tasman-april-2009 62/104
55
Fue
lresource,newentryandgenerationcostsintheNEM
Newentranttechnologies
Table 32 New entrant technologies: capacity, auxiliaries, thermal efficiency and O&M costs
Technology
Typical newentrant size
(MW)
Minimumstable
generationlevel (%)
Averageavailability
(%) Auxiliaryload (%)
Thermalefficiency(sent-out
HHV)
Thermalefficiency HHV
(GJ/MWh)sent-out
Thermalefficiency
(generatedHHV)
Thermalefficiency HHV(GJ/MWh) as
generated
FOM($/MW/year)for 2009-10
VOM ($/MWhsent-out) for
2009-10
CCGT (WC) 400 40% 92% 1.5% 52.0% 6.92 52.8% 6.82 31,000 1.05
CCGT (AC) 400a 40% 92% 4.0% 50.0% 7.20 52.1% 6.91 31,000 1.05
OCGT 150 0% 97% 1.0% 31.0% 11.61 31.3% 11.50 13,000 7.70
SC BLACK (WC) 500 50% 93% 7.5% 42.0% 8.57 45.4% 7.93 48,000 1.25
SC BLACK (AC) 500 50% 93% 9.5% 40.0% 9.00 44.2% 8.15 48,000 1.25
SC BROWN (WC) 500 50% 93% 9.5% 34.0% 10.59 37.6% 9.58 55,000 1.25
SC BROWN (AC) 500 50% 93% 11.0% 32.0% 11.25 36.0% 10.01 55,000 1.25
USC BLACK (WC) 500 50% 93% 7.0% 45.0% 8.00 48.4% 7.44 48,000 1.25
USC BLACK (AC) 500 50% 93% 8.5% 43.0% 8.37 47.0% 7.66 48,000 1.25
USC BROWN (WC) 500 50% 93% 9.0% 37.0% 9.73 40.7% 8.85 55,000 1.25
USC BROWN (AC) 500 50% 93% 10.5% 35.0% 10.29 39.1% 9.21 55,000 1.25
Geothermal (HDR) 500 50% 90% 2.5% 70.0% 5.14 71.8% 5.01 35,000 2.05
IGCC 500 50% 92% 15.0% 41.0% 8.78 48.2% 7.46 50,000 4.10
IGCC - CCS 500 50% 90% 20.0% 33.0% 10.91 41.3% 8.73 75,000 5.15
USC CCS BLACK (WC) 500 50% 90% 25.0% 33.0% 10.91 44.0% 8.18 80,000 2.40
USC CCS BLACK (AC) 500 50% 90% 26.0% 31.0% 11.61 41.9% 8.59 80,000 2.40
USC CCS BROWN (WC) 500 50% 90% 25.0% 29.0% 12.41 38.7% 9.31 92,000 2.40
USC CCS BROWN (AC) 500 50% 90% 26.0% 28.0% 12.86 37.8% 9.51 92,000 2.40
Nuclear 1,000 50% 90% 8.0% 34.0% 10.59 37.0% 9.74 84,000 5.90
a A smaller nominal size of 200 MW would be appropriate for South Australian and Tasmanian zones.Note: WC denotes water cooled; AC denotes air cooled. CCGT = combined cycle gas turbine; OCGT = open cycle gas turbine; SC = supercritical coal; USC = ultra-supercritical coal; IGCC =
integrated gasification combined cycle; CCS = carbon capture and storage. Thermal efficiencies represent 2009-10 values assuming the technology was available. Efficiencies for existing and new
technologies are expected to improve over time as detailed in Table 36. Both FOM and VOM costs are assumed to escalate at CPI (2.5%).
Data source: ACIL Tasman
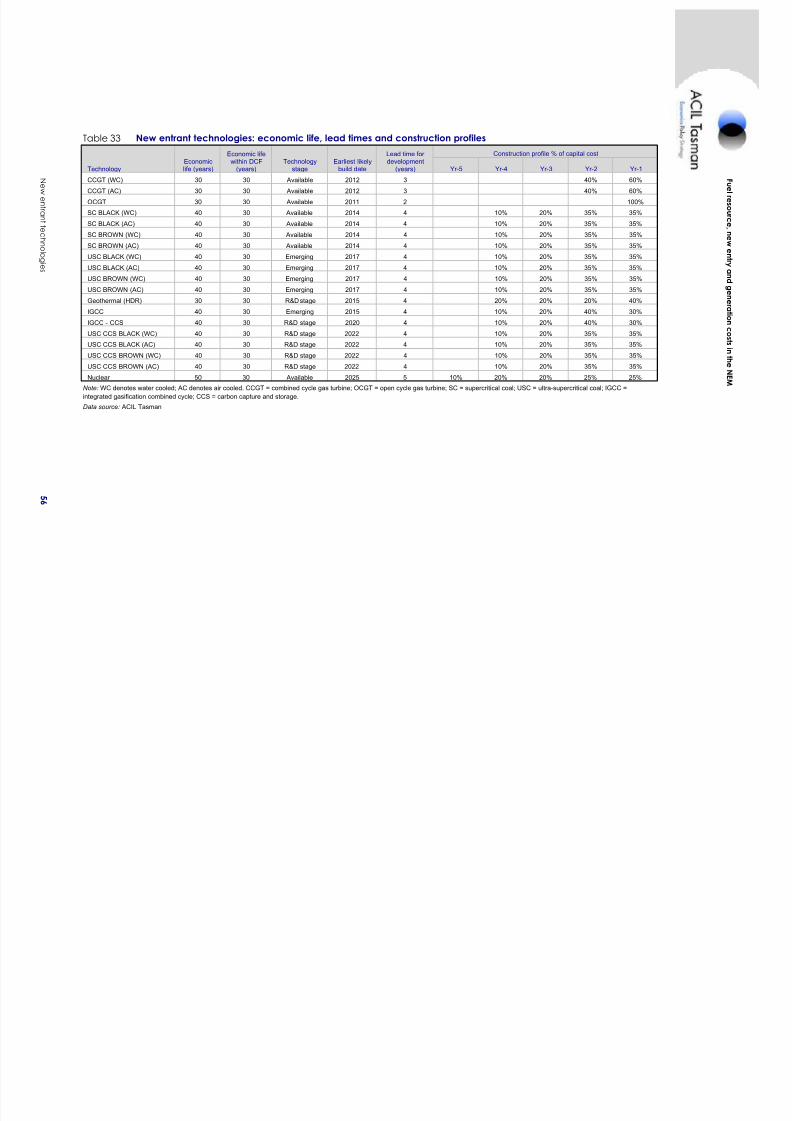
7/27/2019 ACIL Tasman April 2009
http://slidepdf.com/reader/full/acil-tasman-april-2009 63/104
56
Fue
lresource,newentryandgenerationcostsintheNEM
Newentranttechnologies
Table 33 New entrant technologies: economic life, lead times and construction profiles
TechnologyEconomiclife (years)
Economic lifewithin DCF
(years)Technology
stageEarliest likely
build date
Lead time for development
(years)
Construction profile % of capital cost
Yr-5 Yr-4 Yr-3 Yr-2 Yr-1
CCGT (WC) 30 30 Available 2012 3 40% 60%
CCGT (AC) 30 30 Available 2012 3 40% 60%
OCGT 30 30 Available 2011 2 100%
SC BLACK (WC) 40 30 Available 2014 4 10% 20% 35% 35%
SC BLACK (AC) 40 30 Available 2014 4 10% 20% 35% 35%
SC BROWN (WC) 40 30 Available 2014 4 10% 20% 35% 35%
SC BROWN (AC) 40 30 Available 2014 4 10% 20% 35% 35%
USC BLACK (WC) 40 30 Emerging 2017 4 10% 20% 35% 35%
USC BLACK (AC) 40 30 Emerging 2017 4 10% 20% 35% 35%
USC BROWN (WC) 40 30 Emerging 2017 4 10% 20% 35% 35%
USC BROWN (AC) 40 30 Emerging 2017 4 10% 20% 35% 35%
Geothermal (HDR) 30 30 R&D stage 2015 4 20% 20% 20% 40%
IGCC 40 30 Emerging 2015 4 10% 20% 40% 30%
IGCC - CCS 40 30 R&D stage 2020 4 10% 20% 40% 30%
USC CCS BLACK (WC) 40 30 R&D stage 2022 4 10% 20% 35% 35%
USC CCS BLACK (AC) 40 30 R&D stage 2022 4 10% 20% 35% 35%
USC CCS BROWN (WC) 40 30 R&D stage 2022 4 10% 20% 35% 35%
USC CCS BROWN (AC) 40 30 R&D stage 2022 4 10% 20% 35% 35%
Nuclear 50 30 Available 2025 5 10% 20% 20% 25% 25%
Note: WC denotes water cooled; AC denotes air cooled. CCGT = combined cycle gas turbine; OCGT = open cycle gas turbine; SC = supercritical coal; USC = ultra-supercritical coal; IGCC =integrated gasification combined cycle; CCS = carbon capture and storage.
Data source: ACIL Tasman

7/27/2019 ACIL Tasman April 2009
http://slidepdf.com/reader/full/acil-tasman-april-2009 64/104
57
Fue
lresource,newentryandgenerationcostsintheNEM
Newentranttechnologies
Table 34 New entrant technology availability by NEM zone
Technology NQ CQ SEQ SWQ NNSW NCEN SWNSW CAN NVIC LV MEL CVIC NSA ADE SESA TAS
CCGT (WC) Y Y Y Y Y Y Y Y Y Y Y Y Y Y Y Y
CCGT (AC) Y Y Y Y Y Y Y Y Y Y Y Y Y Y Y Y
OCGT Y Y Y Y Y Y Y Y Y Y Y Y Y Y Y YSC BLACK (WC) Y
SC BLACK (AC) Y Y Y Y Y Y
SC BROWN (WC) Y
SC BROWN (AC) Y
USC BLACK (WC) Y
USC BLACK (AC) Y Y Y Y Y Y
USC BROWN (WC) Y
USC BROWN (AC) Y
Geothermal (HDR) Y Y Y Y
IGCC Y Y Y Y Y Y Y
IGCC - CCS Y Y Y Y Y Y Y
USC CCS BLACK (WC) Y
USC CCS BLACK (AC) Y Y Y Y Y Y
USC CCS BROWN (WC) Y
USC CCS BROWN (AC) Y
Nuclear Y Y Y Y Y Y Y Y Y Y Y Y
Note: WC denotes water cooled; AC denotes air cooled. CCGT = combined cycle gas turbine; OCGT = open cycle gas turbine; SC = supercritical coal; USC = ultra-supercritical coal; IGCC =
integrated gasification combined cycle; CCS = carbon capture and storage.Data source: ACIL Tasman

7/27/2019 ACIL Tasman April 2009
http://slidepdf.com/reader/full/acil-tasman-april-2009 65/104
58
Fue
lresource,newentryandgenerationcostsintheNEM
Newentranttechnologies
Table 35 Capital cost projection by technology (Real 2009-10 $/kW)
2009-10
2010-11
2011-12
2012-13
2013-14
2014-15
2015-16
2016-17
2017-18
2018-19
2019-20
2020-21
2021-22
2022-23
2023-24
2024-25
2025-26
2026-27
2027-28
2028-29
CCGT (WC) 1,314 1,224 1,222 1,200 1,185 1,181 1,177 1,173 1,168 1,164 1,159 1,154 1,150 1,145 1,141 1,136 1,132 1,127 1,123 1,118
CCGT (AC) 1,368 1,275 1,273 1,251 1,235 1,233 1,229 1,225 1,221 1,216 1,212 1,208 1,203 1,199 1,195 1,191 1,187 1,182 1,178 1,174
OCGT 985 918 916 900 888 886 883 880 876 873 869 866 862 859 856 852 849 845 842 839
SC BLACK (WC) 2,239 2,162 2,124 2,087 2,074 2,060 2,057 2,053 2,049 2,045 2,040 2,036 2,032 2,027 2,023 2,018 2,014 2,010 2,005 2,001
SC BLACK (AC) 2,291 2,213 2,174 2,137 2,123 2,110 2,107 2,104 2,100 2,096 2,092 2,089 2,085 2,081 2,077 2,073 2,069 2,065 2,061 2,057
SC BROWN (WC) 2,463 2,379 2,336 2,296 2,281 2,266 2,263 2,259 2,254 2,249 2,244 2,240 2,235 2,230 2,225 2,220 2,215 2,211 2,206 2,201
SC BROWN (AC) 2,520 2,434 2,391 2,350 2,336 2,321 2,318 2,314 2,310 2,306 2,302 2,297 2,293 2,289 2,284 2,280 2,276 2,271 2,267 2,262
USC BLACK (WC) 2,396 2,314 2,272 2,233 2,219 2,204 2,201 2,197 2,192 2,188 2,183 2,179 2,174 2,169 2,165 2,160 2,155 2,150 2,146 2,141
USC BLACK (AC) 2,451 2,368 2,326 2,286 2,272 2,258 2,255 2,251 2,247 2,243 2,239 2,235 2,231 2,226 2,222 2,218 2,214 2,209 2,205 2,201
USC BROWN (WC) 2,635 2,545 2,500 2,456 2,441 2,425 2,421 2,417 2,412 2,407 2,402 2,396 2,391 2,386 2,381 2,376 2,371 2,365 2,360 2,355
USC BROWN (AC) 2,697 2,604 2,558 2,515 2,499 2,484 2,480 2,476 2,472 2,467 2,463 2,458 2,454 2,449 2,444 2,440 2,435 2,430 2,426 2,421
Geothermal (HDR) 5,330 5,369 5,300 5,232 5,165 5,099 5,034 4,969 4,905 4,842 4,780 4,719 4,658 4,599 4,540 4,481 4,424 4,367 4,311 4,256
IGCC 3,705 3,481 3,324 3,173 3,060 2,948 2,851 2,754 2,657 2,560 2,532 2,527 2,522 2,518 2,513 2,508 2,503 2,498 2,494 2,489
IGCC - CCS 5,001 4,699 4,487 4,283 4,130 3,979 3,849 3,718 3,587 3,455 3,418 3,399 3,380 3,361 3,342 3,323 3,304 3,285 3,267 3,248
USC CCS BLACK (WC) 3,833 3,679 3,591 3,506 3,461 3,417 3,389 3,361 3,332 3,304 3,275 3,246 3,217 3,189 3,160 3,132 3,103 3,0 75 3,047 3,019
USC CCS BLACK (AC) 3,922 3,764 3,675 3,589 3,544 3,500 3,472 3,445 3,416 3,387 3,358 3,330 3,301 3,273 3,244 3,216 3,188 3,159 3,131 3,103
USC CCS BROWN (WC) 4,314 4,114 3,948 3,853 3,762 3,714 3,667 3,637 3,607 3,576 3,545 3,514 3,484 3,453 3,422 3,391 3,361 3,3 30 3,300 3,270
USC CCS BROWN (AC) 4,415 4,209 4,040 3,944 3,852 3,803 3,756 3,727 3,697 3,666 3,635 3,604 3,573 3,543 3,512 3,482 3,451 3,4 21 3,390 3,360
Nuclear 5,207 5,182 5,156 5,131 5,106 5,081 5,056 5,032 5,007 4,983 4,959 4,934 4,910 4,886 4,862 4,839 4,579 4,454 4,333 4,263
Note: WC denotes water cooled; AC denotes air cooled. CCGT = combined cycle gas turbine; OCGT = open cycle gas turbine; SC = supercritical coal; USC = ultra-supercritical coal; IGCC =
integrated gasification combined cycle; CCS = carbon capture and storage.
Data source: ACIL Tasman analysis

7/27/2019 ACIL Tasman April 2009
http://slidepdf.com/reader/full/acil-tasman-april-2009 66/104
59
Fue
lresource,newentryandgenerationcostsintheNEM
Newentranttechnologies
Table 36 Thermal efficiency projection for new entrant technologies (sent-out HHV)
2009-10
2010-11
2011-12
2012-13
2013-14
2014-15
2015-16
2016-17
2017-18
2018-19
2019-20
2020-21
2021-22
2022-23
2023-24
2024-25
2025-26
2026-27
2027-28
2028-29
CCGT (WC) 52% 52% 53% 53% 54% 54% 54% 55% 55% 55% 55% 55% 55% 56% 56% 56% 56% 56% 56% 56%
CCGT (AC) 50% 50% 51% 51% 52% 52% 52% 53% 53% 53% 53% 53% 53% 54% 54% 54% 54% 54% 54% 54%
OCGT 31% 32% 32% 32% 32% 33% 33% 33% 33% 34% 34% 34% 34% 35% 35% 35% 35% 36% 36% 36%
SC BLACK (WC) 42% 42% 42% 43% 43% 43% 43% 43% 43% 43% 43% 43% 43% 44% 44% 44% 44% 44% 44% 44%
SC BLACK (AC) 40% 40% 40% 41% 41% 41% 41% 41% 41% 41% 41% 41% 41% 42% 42% 42% 42% 42% 42% 42%
SC BROWN (WC) 34% 34% 34% 34% 35% 35% 35% 35% 35% 35% 35% 35% 35% 35% 35% 35% 35% 36% 36% 36%
SC BROWN (AC) 32% 32% 32% 32% 33% 33% 33% 33% 33% 33% 33% 33% 33% 33% 33% 33% 33% 34% 34% 34%
USC BLACK (WC) 45% 45% 46% 46% 46% 47% 47% 47% 48% 48% 48% 49% 49% 49% 50% 50% 51% 51% 51% 51%
USC BLACK (AC) 43% 43% 44% 44% 44% 45% 45% 45% 46% 46% 46% 47% 47% 47% 48% 48% 49% 49% 49% 49%
USC BROWN (WC) 37% 37% 38% 38% 38% 39% 39% 39% 39% 39% 39% 40% 40% 40% 41% 41% 42% 42% 42% 42%
USC BROWN (AC) 35% 35% 36% 36% 36% 37% 37% 37% 37% 37% 37% 38% 38% 38% 39% 39% 40% 40% 40% 40%
Geothermal (HDR) 70% 70% 70% 70% 70% 70% 70% 70% 70% 70% 70% 70% 70% 70% 70% 70% 70% 70% 70% 70%
IGCC 41% 41% 41% 42% 42% 42% 42% 42% 43% 43% 43% 43% 43% 44% 44% 44% 44% 44% 45% 45%
IGCC - CCS 33% 33% 33% 34% 34% 34% 34% 34% 34% 34% 37% 37% 37% 37% 37% 39% 39% 39% 40% 40%
USC CCS BLACK (WC) 33% 33% 34% 34% 34% 34% 34% 37% 37% 37% 37% 37% 39% 39% 39% 39% 39% 39% 41% 41%
USC CCS BLACK (AC) 31% 31% 32% 32% 32% 32% 32% 35% 35% 35% 35% 35% 37% 37% 37% 37% 37% 37% 39% 39%
USC CCS BROWN (WC) 29% 29% 30% 30% 30% 30% 30% 33% 33% 33% 33% 33% 34% 34% 34% 34% 34% 34% 36% 36%
USC CCS BROWN (AC) 28% 28% 29% 29% 29% 29% 29% 32% 32% 32% 32% 32% 33% 33% 33% 33% 33% 33% 35% 35%
Nuclear 34% 34% 34% 34% 34% 34% 34% 34% 34% 34% 34% 34% 34% 34% 34% 34% 34% 34% 34% 34%
Note: WC denotes water cooled; AC denotes air cooled. CCGT = combined cycle gas turbine; OCGT = open cycle gas turbine; SC = supercritical coal; USC = ultra-supercritical coal; IGCC =
integrated gasification combined cycle; CCS = carbon capture and storage.
Data source: ACIL Tasman analysis

7/27/2019 ACIL Tasman April 2009
http://slidepdf.com/reader/full/acil-tasman-april-2009 67/104
60
Fue
lresource,newentryandgenerationcostsintheNEM
Newentranttechnologies
Table 37 Thermal efficiency projection for new entrant technologies (generated HHV)
2009-10
2010-11
2011-12
2012-13
2013-14
2014-15
2015-16
2016-17
2017-18
2018-19
2019-20
2020-21
2021-22
2022-23
2023-24
2024-25
2025-26
2026-27
2027-28
2028-29
CCGT (WC) 53% 53% 54% 54% 55% 55% 55% 56% 56% 56% 56% 56% 56% 57% 57% 57% 57% 57% 57% 57%
CCGT (AC) 52% 52% 53% 53% 54% 54% 54% 55% 55% 55% 55% 55% 55% 56% 56% 56% 56% 56% 56% 56%
OCGT 31% 32% 32% 32% 32% 33% 33% 33% 33% 34% 34% 34% 34% 35% 35% 35% 35% 36% 36% 36%
SC BLACK (WC) 45% 45% 45% 46% 46% 46% 46% 46% 46% 46% 46% 46% 46% 48% 48% 48% 48% 48% 48% 48%
SC BLACK (AC) 44% 44% 44% 45% 45% 45% 45% 45% 45% 45% 45% 45% 45% 46% 46% 46% 46% 46% 46% 46%
SC BROWN (WC) 38% 38% 38% 38% 39% 39% 39% 39% 39% 39% 39% 39% 39% 39% 39% 39% 39% 40% 40% 40%
SC BROWN (AC) 36% 36% 36% 36% 37% 37% 37% 37% 37% 37% 37% 37% 37% 37% 37% 37% 37% 38% 38% 38%
USC BLACK (WC) 48% 48% 49% 49% 49% 51% 51% 51% 52% 52% 52% 53% 53% 53% 54% 54% 55% 55% 55% 55%
USC BLACK (AC) 47% 47% 48% 48% 48% 49% 49% 49% 50% 50% 50% 51% 51% 51% 52% 52% 54% 54% 54% 54%
USC BROWN (WC) 41% 41% 42% 42% 42% 43% 43% 43% 43% 43% 43% 44% 44% 44% 45% 45% 46% 46% 46% 46%
USC BROWN (AC) 39% 39% 40% 40% 40% 41% 41% 41% 41% 41% 41% 42% 42% 42% 44% 44% 45% 45% 45% 45%
Geothermal (HDR) 72% 72% 72% 72% 72% 72% 72% 72% 72% 72% 72% 72% 72% 72% 72% 72% 72% 72% 72% 72%
IGCC 48% 48% 48% 49% 49% 49% 49% 49% 51% 51% 51% 51% 51% 52% 52% 52% 52% 52% 53% 53%
IGCC - CCS 41% 41% 41% 43% 43% 43% 43% 43% 43% 43% 46% 46% 46% 46% 46% 49% 49% 49% 50% 50%
USC CCS BLACK (WC) 44% 44% 45% 45% 45% 45% 45% 49% 49% 49% 49% 49% 52% 52% 52% 52% 52% 52% 55% 55%
USC CCS BLACK (AC) 42% 42% 43% 43% 43% 43% 43% 47% 47% 47% 47% 47% 50% 50% 50% 50% 50% 50% 53% 53%
USC CCS BROWN (WC) 39% 39% 40% 40% 40% 40% 40% 44% 44% 44% 44% 44% 45% 45% 45% 45% 45% 45% 48% 48%
USC CCS BROWN (AC) 38% 38% 39% 39% 39% 39% 39% 43% 43% 43% 43% 43% 45% 45% 45% 45% 45% 45% 47% 47%
Nuclear 37% 37% 37% 37% 37% 37% 37% 37% 37% 37% 37% 37% 37% 37% 37% 37% 37% 37% 37% 37%
Note: WC denotes water cooled; AC denotes air cooled. CCGT = combined cycle gas turbine; OCGT = open cycle gas turbine; SC = supercritical coal; USC = ultra-supercritical coal; IGCC =
integrated gasification combined cycle; CCS = carbon capture and storage.
Data source: ACIL Tasman analysis

7/27/2019 ACIL Tasman April 2009
http://slidepdf.com/reader/full/acil-tasman-april-2009 68/104
Fuel resource, new entry and generation costs in the NEM
New entrant technologies 61
4.1 Emission factorsEmission factors for each of the new entrant technologies are detailed for
combustion (Table 38), fugitive (Table 39) and total emissions (Table 40).
These factors are presented in kilograms of CO2-e per GJ of fuel consumed.
Combustion emissions relate to the emissions from burning of the fuel at the
power station, while fugitive emissions relate to emissions resulting from the
production and transport of fuel. The sum of these two factors gives the total
emission factor, which is used in the calculation of SRMC.
Table 38 Combustion emission factors for new entrant technologies (kg
CO2-e per GJ of fuel)
QLD NSW VIC SA TAS
CCGT (AC) 51.3 51.3 51.3 51.3 51.3
CCGT (AC) 51.3 51.3 51.3 51.3 51.3
OCGT 51.3 51.3 51.3 51.3 51.3
SC BLACK (WC) 91.1 89.3 n/a n/a n/a
SC BLACK (AC) 91.1 89.3 n/a n/a n/a
SC BROWN (WC) n/a n/a 93.2 n/a n/a
SC BROWN (AC) n/a n/a 93.2 n/a n/a
USC BLACK (WC) 91.1 89.3 n/a n/a n/a
USC BLACK (AC) 91.1 89.3 n/a n/a n/a
USC BROWN (WC) n/a n/a 93.2 n/a n/a
USC BROWN (AC) n/a n/a 93.2 n/a n/a
Geothermal (HDR) 0.0 0.0 0.0 0.0 0.0
IGCC 91.1 89.3 93.2 n/a n/a
IGCC - CCS 4.6 4.5 4.7 n/a n/a
USC CCS BLACK (WC) 4.6 4.5 n/a n/a n/a
USC CCS BLACK (AC) 4.6 4.5 n/a n/a n/a
USC CCS BROWN (WC) n/a n/a 4.7 n/a n/a
USC CCS BROWN (AC) n/a n/a 4.7 n/a n/a
Nuclear 0.0 0.0 0.0 0.0 0.0
Note: WC denotes water cooled; AC denotes air cooled. CCGT = combined cycle gas turbine; OCGT = open cycle gas
turbine; SC = supercritical coal; USC = ultra-supercritical coal; IGCC = integrated gasification combined cycle; CCS =
carbon capture and storage. Plants with CCS capability are assumed to capture 95% of combustion emissions.
Data source: ACIL Tasman analysis

7/27/2019 ACIL Tasman April 2009
http://slidepdf.com/reader/full/acil-tasman-april-2009 69/104
Fuel resource, new entry and generation costs in the NEM
New entrant technologies 62
Table 39 Fugitive emission factors for new entrant technologies (kg CO2-eper GJ of fuel)
QLD NSW VIC SA TAS
CCGT (AC) 5.4 14.2 5.8 18.6 5.8
CCGT (AC) 5.4 14.2 5.8 18.6 5.8
OCGT 5.4 14.2 5.8 18.6 5.8
SC BLACK (WC) 2.0 8.7 n/a n/a n/a
SC BLACK (AC) 2.0 8.7 n/a n/a n/a
SC BROWN (WC) n/a n/a 0.3 n/a n/a
SC BROWN (AC) n/a n/a 0.3 n/a n/a
USC BLACK (WC) 2.0 8.7 n/a n/a n/a
USC BLACK (AC) 2.0 8.7 n/a n/a n/a
USC BROWN (WC) n/a n/a 0.3 n/a n/a
USC BROWN (AC) n/a n/a 0.3 n/a n/a
Geothermal (HDR) 0.0 0.0 0.0 0.0 0.0IGCC 2.0 8.7 0.3 n/a n/a
IGCC - CCS 2.0 8.7 0.3 n/a n/a
USC CCS BLACK (WC) 2.0 8.7 n/a n/a n/a
USC CCS BLACK (AC) 2.0 8.7 n/a n/a n/a
USC CCS BROWN (WC) n/a n/a 0.3 n/a n/a
USC CCS BROWN (AC) n/a n/a 0.3 n/a n/a
Nuclear 1.5 1.5 1.5 1.5 1.5
Note: WC denotes water cooled; AC denotes air cooled. CCGT = combined cycle gas turbine; OCGT = open cycle gas
turbine; SC = supercritical coal; USC = ultra-supercritical coal; IGCC = integrated gasification combined cycle; CCS =
carbon capture and storage.
Data source: ACIL Tasman analysis
Table 40 Total emission factors for new entrant technologies (kg CO2-eper GJ of fuel)
QLD NSW VIC SA TAS
CCGT (AC) 56.7 65.5 57.1 69.9 57.1
CCGT (AC) 56.7 65.5 57.1 69.9 57.1
OCGT 56.7 65.5 57.1 69.9 57.1
SC BLACK (WC) 93.1 98.0 n/a n/a n/a
SC BLACK (AC) 93.1 98.0 n/a n/a n/a
SC BROWN (WC) n/a n/a 93.5 n/a n/a
SC BROWN (AC) n/a n/a 93.5 n/a n/a
USC BLACK (WC) 93.1 98.0 n/a n/a n/a
USC BLACK (AC) 93.1 98.0 n/a n/a n/a
USC BROWN (WC) n/a n/a 93.5 n/a n/a
USC BROWN (AC) n/a n/a 93.5 n/a n/a
Geothermal (HDR) 0.0 0.0 0.0 0.0 0.0
IGCC 93.1 98.0 93.5 n/a n/a
IGCC - CCS 6.6 13.2 5.0 n/a n/a
USC CCS BLACK (WC) 6.6 13.2 n/a n/a n/a
USC CCS BLACK (AC) 6.6 13.2 n/a n/a n/a
USC CCS BROWN (WC) n/a n/a 5.0 n/a n/a
USC CCS BROWN (AC) n/a n/a 5.0 n/a n/a
Nuclear 1.5 1.5 1.5 1.5 1.5
Note: WC denotes water cooled; AC denotes air cooled. CCGT = combined cycle gas turbine; OCGT = open cycle gas
turbine; SC = supercritical coal; USC = ultra-supercritical coal; IGCC = integrated gasification combined cycle; CCS =
carbon capture and storage. Plants with CCS capability are assumed to capture 95% of combustion emissions. Total
emission factor is the sum of combustion and fugitive emission factors.
Data source: ACIL Tasman analysis

7/27/2019 ACIL Tasman April 2009
http://slidepdf.com/reader/full/acil-tasman-april-2009 70/104
Fuel resource, new entry and generation costs in the NEM
New entrant technologies 63
Table 41 Emission intensity for new entrant technologies (tonnes CO2-eper MWh sent-out)
QLD NSW VIC SA TAS
CCGT (AC) 0.39 0.45 0.40 0.48 0.40
CCGT (AC) 0.41 0.47 0.41 0.50 0.41
OCGT 0.66 0.76 0.66 0.81 0.66
SC BLACK (WC) 0.80 0.84 n/a n/a n/a
SC BLACK (AC) 0.84 0.88 n/a n/a n/a
SC BROWN (WC) n/a n/a 0.99 n/a n/a
SC BROWN (AC) n/a n/a 1.05 n/a n/a
USC BLACK (WC) 0.74 0.78 n/a n/a n/a
USC BLACK (AC) 0.78 0.82 n/a n/a n/a
USC BROWN (WC) n/a n/a 0.91 n/a n/a
USC BROWN (AC) n/a n/a 0.96 n/a n/a
Geothermal (HDR) 0.00 0.00 0.00 0.00 0.00IGCC 0.82 0.86 0.82 n/a n/a
IGCC - CCS 0.07 0.14 0.05 n/a n/a
USC CCS BLACK (WC) 0.07 0.14 n/a n/a n/a
USC CCS BLACK (AC) 0.08 0.15 n/a n/a n/a
USC CCS BROWN (WC) n/a n/a 0.06 n/a n/a
USC CCS BROWN (AC) n/a n/a 0.06 n/a n/a
Nuclear 0.02 0.02 0.02 0.02 0.02
Note: WC denotes water cooled; AC denotes air cooled. CCGT = combined cycle gas turbine; OCGT = open cycle gas
turbine; SC = supercritical coal; USC = ultra-supercritical coal; IGCC = integrated gasification combined cycle; CCS =
carbon capture and storage. Plants with CCS capability are assumed to capture 95% of combustion emissions.
Emission intensity includes fugitive emissions. Based on thermal efficiencies for 2009-10.
Data source: ACIL Tasman analysis
4.2 Fuel supply for new entrants
4.2.1 Natural gas
Since the 2007 cost report there has been significant movement in the outlook
for gas prices, driven by a number of factors including:
• Steeply rising prices and widening specifications for internationally tradedthermal coal which has impacted upon domestic coal prices (the main
competitor for domestic gas)
• Significant increases in mining, petroleum development and constructioncost indices. This has implications for the development of new fuelresources (particularly coal and offshore gas developments)
• Policy developments relating to the imminent commencement of theCarbon Pollution Reduction Scheme (CPRS) and the announced increaseof the Renewable Energy Target to 60,000 GWh
• Announcement of a number of proposals to export LNG using Coal SeamGas (CSG) as feedstock from Gladstone.
• The entrance of a number of major international oil and gas companiessuch as Shell, ConocoPhillips, BG Group and Petronas entering into joint

7/27/2019 ACIL Tasman April 2009
http://slidepdf.com/reader/full/acil-tasman-april-2009 71/104
Fuel resource, new entry and generation costs in the NEM
New entrant technologies 64
ventures with local CSG producers in a significant vote of confidence inthe local industry.
While some of the cost pressures mentioned above have now abated as a result
of the recent downturn in economic conditions, the outlook for domestic gas
still remains significantly different than within the last generator cost report
produced in early 2007. Within the last report, ACIL Tasman‟s analysis
anticipated a highly successful CSG sector placing downward pressure on
domestic prices throughout the projection period. The analysis did not
however, anticipate the emergence of LNG export as a potential outlet for the
abundant CSG resources.
With the prospect of being able to achieve higher netback prices by directing production into LNG manufacture, Queensland CSG producers are now much
less likely than in the recent past to discount prices in order to attract domestic
customers, either locally or in southern states. Due to the importance of CSG
in Eastern Australia‟s gas supply mix, the influence of LNG export will also
flow through to conventional gas pricing in southern States.
Potential for LNG export
Until recently, Eastern Australia has not been considered a prospective
location for LNG manufacture, principally because uncommitted conventional
gas resources in the region are inadequate to support a world-scale LNG
facility. However, the surge in international energy prices through 2007 and
2008, together with the identification of large resources of CSG in southern
and central Queensland, has changed the prospects for East Coast LNG. Since
early 2007, six LNG proposals based on coal seam gas (CSG) feed from the
Bowen and Surat Basins have been announced as detailed in Table 42.
The projects range in size from 0.5 to 4 million tonnes per year, with potential
in each case for increased production with the replication of the initial
liquefaction plant. Total proposed capacity is initially 16.8 Mtpa, rising to
40.6 Mtpa if plans are fully developed to their ultimate potential.
While posing many technical and commercial challenges for the proponents,
there is a compelling logic to the attempts of the proponents to access large,
high value international markets at a time of burgeoning demand and tight
supply.
The proposed LNG developments have the potential to influence the
availability of gas for domestic use. A 4 Mtpa LNG plant would require gas
supply of between 225 and 250 PJ/a (after allowing for gas used in processing
and transportation). In order to provide a twenty year reserve backing, such a
development would therefore require dedication of up to 5,000 PJ of proven
and probable gas (2P) resources. Given the rate of reserves build up over the

7/27/2019 ACIL Tasman April 2009
http://slidepdf.com/reader/full/acil-tasman-april-2009 72/104
Fuel resource, new entry and generation costs in the NEM
New entrant technologies 65
past five years, there is every reason to believe that significantly more CSG
reserves can be established. However, it is clear that the LNG proposals havethe potential to divert to exports significant quantities of gas that might
otherwise be available to domestic markets. This does not necessarily mean
that the domestic market will be left short of supply. However it does mean
that domestic supply will have to rely on higher cost, less productive sources of
CSG supply sooner than would be the case in the absence of the LNG
projects, which in turn has implications for domestic gas prices.
Whether or not any of these LNG proposals actually proceed to development,
the fact that they offer a credible alternative market pathway for local gas
suppliers means that they are already starting to impact on domestic gas prices.

7/27/2019 ACIL Tasman April 2009
http://slidepdf.com/reader/full/acil-tasman-april-2009 73/104
66
Fue
lresource,newentryandgenerationcostsintheNEM
Newentranttechnologies
Table 42 Overview of Queensland LNG export proposals
Proponent Announced CapacitySchedule for first
cargoesGas feedrequired
LiquefactionTechnology Comments
Arrow Energy / Shell May-07 1.3 Mtpa 2011 78 PJ/a Unknown
Project located at Fisherman’s Landing Gladstone.Estimated capital costs of US$400 million. Potential for a
second train of the same size. FID originally anticipated late2008.
Santos/Petronas Jul-07 3-4 Mtpa Early 2014 170-220 PJ/aConocoPhillips
OptimisedCascade
Target Final Investment Decision by the end of 2009. Theproject will initially produce 3 to 4 Mtpa, with a maximumpotential production of 10 Mtpa. Reported capital cost of
$7.7 billion. In May 2008 Santos sold a 40% interest in theGLNG project to Petronas for US$2.008 billion plus
US$500 million upon FID of GLNG Train 2 using JV gas
Sojitz Dec-07 0.5 Mtpa Early 2012 30 PJ/a Unknown
Proposed LNG plant at Fisherman’s Landing Gladstone,previously joint ventured with Sunshine Gas. FID initiallyintended for end 2008, with first cargoes in early 2012.
Train size of 0.5 Mtpa which can be developed as modules.Takeover of Sunshine Gas by QGC and subsequently BG
may result in Sojitz looking for other feedstock gas.
BG Group Feb-08 3-4 Mtpa Early 2014 170-220 PJ/aConocoPhillips
OptimisedCascade
Final investment decision scheduled for early 2010. Initialdesign for 3-4 Mtpa, with potential expansion to up to 12
Mtpa subject to additional gas reserves. Estimated capitalcost of $8 billion including 380km pipeline. Initally a joint
venture between QGC and BG Group, BG has sinceacquired QGC.
LNG Impel May-08 0.7-1.3 Mtpa 2013 42-78 PJ/a Unknown
To be constructed in modules of between 0.7 and 1.3 Mtpa.Site at Curtis Island has been scoped for up to 3 trains.
Open-access LNG plant projects to be designed on a tollfor service basis with 15 to 20 year contracts
Origin/ConocoPhillips Sep-08 3.5 Mtpa x 2 Early 2014 195 PJ/a x 2ConocoPhillips
OptimisedCascade
ConocoPhillips to invest A$9.6 billion for a 50% share inCSG to LNG project proposed for Gladstone. Plans for
ultimately up to 4 x 3.5 Mtpa LNG trains. 50/50 joint venturealignment for whole project.
Data source: ACIL Tasman based on company announcements

7/27/2019 ACIL Tasman April 2009
http://slidepdf.com/reader/full/acil-tasman-april-2009 74/104
Fuel resource, new entry and generation costs in the NEM
New entrant technologies 67
Gas market scenario
In projecting gas prices available for generation, ACIL Tasman has utilised its
proprietary GasMark model. GasMark incorporates a complete input database
containing data and assumptions for every gas producing field, transmission
pipeline and major load/demand centre in Australia.
The scenario used for this exercise represents ACIL Tasman‟s base case view
on supply and load developments throughout Eastern Australia over the
period 2009-10 to 2028-29. It includes the development of two LNG export
facilities of 4 Mtpa each, with assumed start-up in 2014 and 2018.
On the demand-side the scenario includes assumed growth in domestic
demand, both through large industrial loads and general growth in reticulated
gas to residential and commercial premises. The total assumed growth in gas
demand – excluding NEM-scheduled power generation – is relatively modest
at around 130 PJ/a (growth rate of 2.6% per annum).
The supply assumptions include all existing and known, but undeveloped field
developments and an assessment of undiscovered conventional and yet-to-be
certified CSG resources.
For each NEM zone a network node has been selected that reflects the likely location for additional NEM scheduled generation. The gas network locations
for each NEM zone are detailed in Table 43. Where pipelines don‟t currently
exist to these zones, the costs reflect an estimate for a new build pipeline to
service power generation loads.
Table 43 NEM zones and gas price points
NEM zone Location on gas network
NQ Townsville
CQ Gladstone
SEQ SwanbankSWQ Braemar
NNSW Tamworth
NCEN Wilton
SWNSW Wagga
CAN Canberra
NVIC Chiltern
LV Latrobe
MEL Melbourne
CVIC Geelong
NSA Port Pirie
ADE Adelaide
SESA Ladbroke
TAS Bell Bay

7/27/2019 ACIL Tasman April 2009
http://slidepdf.com/reader/full/acil-tasman-april-2009 75/104
Fuel resource, new entry and generation costs in the NEM
New entrant technologies 68
Table 44 shows the projected delivered gas prices for new CCGT and OCGT
plant in each NEM zone in real 2009-10 $/GJ. For CCGT plant the deliveredcost assumes a gas load factor of 80% (for transportation costs). Prices for
OCGT plant are at a premium to CCGT costs, reflecting higher transportation
and commodity costs for low gas load factor users.
Prices in 2009-10 reflect a significant premium over historical gas prices under
existing contracts. This reflects the existing state of the market, whereby
significant upstream consolidation has occurred and those players that remain
are primarily focussed upon developing LNG export projects. Anecdotal
evidence suggests that gas producers have already begun to raise price
expectations ahead of the introduction of the CPRS and LNG export projects
being sanctioned.
Prices are projected to increase slightly in real terms, converging to what could
be considered a new long term equilibrium level with the inclusion of
significant LNG export facilities.
The following section examines existing gas resources and how gas prices
might be expected to vary as demand from power generation changes.

7/27/2019 ACIL Tasman April 2009
http://slidepdf.com/reader/full/acil-tasman-april-2009 76/104
69
Fue
lresource,newentryandgenerationcostsintheNEM
Newentranttechnologies
Table 44 Estimated delivered gas costs for new entrant CCGT and OCGT by NEM zone (Real $/GJ)2009-
102010-
112011-
122012-
132013-
142014-
152015-
162016-
172017-
182018-
192019-
202020-
212021-
222022-
232023-
242024-
252025-
262026-
272027-
282028-
29
New CCGT
New_CCGT_NQ 5.37 5.34 5.04 5.49 5.50 5.52 5.54 5.55 5.56 5.57 5.59 5.60 5.63 5.64 5.64 5.66 5.71 5.71 5.90 5.90
New_CCGT_CQ 5.44 5.41 5.00 5.04 5.47 5.45 5.45 5.50 5.78 5.79 5.82 5.84 5.87 5.88 5.88 5.91 5.96 5.96 6.15 6.16
New_CCGT_SEQ 5.17 4.58 4.60 4.62 4.65 4.67 4.69 4.71 4.73 4.75 4.76 4.79 4.81 4.83 4.85 4.86 4.89 4.92 4.95 4.97
New_CCGT_SWQ 4.70 4.69 4.20 4.22 4.38 4.39 4.41 4.44 4.74 4.78 4.83 4.83 4.88 4.91 4.93 4.95 4.98 5.04 5.19 5.21
New_CCGT_NNSW 4.00 4.14 4.16 4.18 4.21 4.23 4.25 4.27 4.29 4.31 4.32 4.34 4.36 4.39 4.41 4.42 4.45 4.47 4.50 4.53
New_CCGT_NCEN 5.81 5.54 5.50 5.48 5.49 5.51 5.52 5.53 5.60 5.68 5.78 5.78 5.84 5.87 5.96 6.16 6.20 6.31 6.43 6.64
New_CCGT_SWNSW 5.92 5.98 6.02 5.99 6.00 6.02 6.03 6.03 6.10 6.18 6.27 6.27 6.32 6.36 6.45 6.64 6.68 6.78 6.91 7.11
New_CCGT_CAN 5.46 5.31 5.23 5.25 5.27 5.29 5.30 5.31 5.38 5.47 5.56 5.56 5.62 5.74 5.75 5.96 6.03 6.16 6.49 6.70
New_CCGT_NVIC 5.32 5.35 5.41 5.43 5.45 5.48 5.78 5.81 5.92 6.12 6.21 6.21 6.21 6.40 6.42 6.63 6.70 6.84 7.17 7.38
New_CCGT_LV 4.46 4.47 4.50 4.52 4.54 4.56 4.87 4.90 5.01 5.21 5.30 5.30 5.30 5.49 5.51 5.72 5.79 5.93 6.26 6.47
New_CCGT_MEL 4.81 4.83 4.87 4.89 4.92 4.94 5.25 5.28 5.38 5.59 5.68 5.68 5.68 5.87 5.89 6.10 6.17 6.30 6.63 6.85
New_CCGT_CVIC 4.58 4.58 4.60 4.63 4.92 4.94 5.25 5.28 5.38 5.59 5.68 5.68 5.68 5.87 5.89 6.10 6.17 6.30 6.60 6.67
New_CCGT_NSA 5.65 5.64 5.66 5.68 5.96 5.98 6.28 6.30 6.40 6.60 6.68 6.67 6.67 6.85 6.86 7.07 7.13 7.26 7.55 7.61
New_CCGT_ADE 5.44 5.43 5.44 5.47 5.75 5.77 6.07 6.09 6.19 6.39 6.47 6.47 6.46 6.65 6.66 6.86 6.93 7.06 7.35 7.41
New_CCGT_SESA 5.05 5.04 5.06 5.09 5.37 5.39 5.70 5.73 5.83 6.03 6.11 6.11 6.11 6.30 6.31 6.52 6.59 6.72 7.01 7.08
New_CCGT_TAS 5.28 5.28 5.30 5.33 5.35 5.37 5.68 5.71 5.81 6.02 6.11 6.11 6.11 6.30 6.32 6.53 6.60 6.74 7.06 7.23
New OCGT
New_OCGT_NQ 6.72 6.68 6.29 6.86 6.88 6.90 6.92 6.93 6.95 6.96 6.99 7.00 7.04 7.05 7.04 7.08 7.13 7.13 7.37 7.37
New_OCGT_CQ 6.80 6.77 6.26 6.30 6.83 6.82 6.82 6.87 7.22 7.24 7.28 7.30 7.34 7.35 7.35 7.39 7.45 7.45 7.69 7.70
New_OCGT_SEQ 6.46 5.72 5.75 5.78 5.81 5.84 5.87 5.89 5.91 5.93 5.95 5.98 6.01 6.03 6.06 6.08 6.11 6.15 6.18 6.22
New_OCGT_SWQ 5.87 5.87 5.25 5.28 5.47 5.49 5.51 5.55 5.93 5.97 6.04 6.04 6.11 6.14 6.17 6.19 6.23 6.31 6.49 6.52
New_OCGT_NNSW 4.99 5.17 5.20 5.23 5.26 5.29 5.32 5.34 5.36 5.38 5.40 5.43 5.45 5.48 5.51 5.53 5.56 5.59 5.63 5.67
New_OCGT_NCEN 7.27 6.93 6.88 6.85 6.87 6.89 6.91 6.92 7.00 7.10 7.22 7.22 7.29 7.34 7.45 7.69 7.75 7.88 8.04 8.30
New_OCGT_SWNSW 7.40 7.48 7.52 7.48 7.50 7.52 7.53 7.54 7.62 7.72 7.84 7.83 7.91 7.95 8.06 8.30 8.35 8.48 8.63 8.89
New_OCGT_CAN 6.82 6.64 6.54 6.57 6.59 6.61 6.63 6.64 6.72 6.83 6.95 6.95 7.03 7.17 7.19 7.45 7.53 7.70 8.11 8.38
New_OCGT_NVIC 6.65 6.69 6.76 6.79 6.82 6.84 7.23 7.27 7.40 7.65 7.76 7.76 7.76 8.00 8.03 8.29 8.38 8.55 8.96 9.23
New_OCGT_LV 5.58 5.58 5.62 5.65 5.68 5.71 6.09 6.13 6.26 6.52 6.63 6.63 6.63 6.87 6.89 7.15 7.24 7.41 7.82 8.09
New_OCGT_MEL 6.01 6.03 6.09 6.12 6.15 6.18 6.56 6.60 6.73 6.99 7.10 7.10 7.10 7.34 7.36 7.62 7.71 7.88 8.29 8.56
New_OCGT_CVIC 5.72 5.72 5.75 5.79 6.15 6.18 6.56 6.60 6.73 6.99 7.10 7.10 7.10 7.34 7.36 7.62 7.71 7.88 8.24 8.33
New_OCGT_NSA 7.07 7.05 7.07 7.11 7.45 7.47 7.85 7.88 8.00 8.25 8.35 8.34 8.33 8.56 8.58 8.83 8.91 9.08 9.43 9.51
New_OCGT_ADE 6.79 6.78 6.80 6.84 7.19 7.21 7.59 7.62 7.74 7.99 8.09 8.08 8.08 8.31 8.33 8.58 8.66 8.83 9.18 9.27
New_OCGT_SESA 6.31 6.30 6.32 6.36 6.72 6.74 7.12 7.16 7.28 7.54 7.64 7.64 7.64 7.87 7.89 8.15 8.24 8.40 8.76 8.85
New_OCGT_TAS 6.60 6.60 6.63 6.66 6.69 6.71 7.10 7.14 7.27 7.52 7.63 7.63 7.63 7.87 7.90 8.16 8.25 8.42 8.83 9.04
Note: Real 2009-10 dollars
Data source: ACIL Tasman estimates

7/27/2019 ACIL Tasman April 2009
http://slidepdf.com/reader/full/acil-tasman-april-2009 77/104
Fuel resource, new entry and generation costs in the NEM
New entrant technologies 70
Gas resources
Table 45 details the current gas reserves for each of the NEM states for both
conventional natural gas (at the 2P level) and CSG (at 2P and 3P levels).12 The
aggregate reserves in Eastern Australia total around 27,000 PJ at the 2P level,
of which, CSG accounts for around 57%. There are also significant gas
volumes currently reported as contingent reserves – somewhere in the order of
a further 50,000 PJ in Queensland which may be proven up over time.
Table 45 Current gas reserves by NEM region (PJ)
Region Conventionalreserves (2P) CSG reserves(2P) CSG reserves(3P)
QLD 458 14,729 33,094
NSW 0 900 3,329
VIC 9,695 0 0
SA 871 0 0
TAS 430 0 0
Total 11,455 15,629 36,422
Note: 2P = proven and probable reserves; 3P = proven, probable and possible reserves. Current as at December
2008.
Data source: ACIL Tasman compilation of company reporting
Since the last iteration of this report produced in early 2007, aggregate CSG
reserves have increased by around 350% at the 2P level and by around 270% atthe 3P level. Over the same time conventional gas reserves have declined
slightly.
The majority of this CSG resource is located in Queensland, although NSW
does have access to large areas of prospective coal-bearing acreage. The
majority of conventional gas reserves are located in the offshore Gippsland
and Otway Basins of Victoria.
Based upon the above reserve numbers and the level of LNG export assumed
within this scenario, ACIL Tasman does not see gas availability to be a
constraining factor for gas-fired developments in the NEM. Given thedistribution of resources however, it is increasingly likely that CSG, primarily
from Queensland but also from NSW to a lesser extent, will be required to be
transported to southern regions.
While there is no logical limit to the amount of gas-fired capacity that can be
developed in any one NEM zone (pipeline capacity can be easily augmented in
the majority of circumstances), the sheer size of potential gas-fired generation
developments may result in changes to the overall price level for gas. The gas
prices presented in the previous section are the result of a gas scenario which
12 Conventional reserves are generally not reported at the 3P level.

7/27/2019 ACIL Tasman April 2009
http://slidepdf.com/reader/full/acil-tasman-april-2009 78/104
Fuel resource, new entry and generation costs in the NEM
New entrant technologies 71
included gas demand derived from ACIL Tasman electricity market modelling.
It should be recognised that the modelling that NEMMCO is undertaking may result in a different level of gas-fired generation than that assumed within the
ACIL Tasman GasMark scenario.
To examine whether changes in gas demand for power generation has a
material impact upon modelled price outcomes, ACIL Tasman has constructed
a gas price index for Eastern Australia based upon weighted nodal prices in
each State. A number of different demand scenarios were then constructed by
varying the level of gas demand from CCGT developments in the NEM. Gas
price indices were also constructed for these scenarios.
Table 46 details the results of the gas analysis and the resulting gas price indexunder a range of different demand points for two separate spot years: 2013-14
and 2023-24. As shown in Table 46 gas price outcomes are relatively stable for
moderate level of CCGT development, however these increase rapidly once
gas penetration becomes significant. At high levels of CCGT development, gas
consumption in other sectors such as industrial and commercial applications
becomes increasingly constrained. In the most extreme demand scenarios,
CCGT development also begins to restrict LNG exports, with resulting prices
rising accordingly.
Table 46 Gas price index as a function of gas demand
Installed CCGT (MW) 0 4,000 8,000 12,000 16,000 20,000 30,000
Implied additional gasconsumption (PJ/a)
0 200 400 600 800 1,000 1,500
Index 2013-14 0.99 1.04 1.11 1.13 1.24 1.37 2.42
Index 2023-24 0.93 1.00 1.10 1.13 1.27 1.36 1.72
Note: Implied gas consumption based on 25PJ/a per 500 MW of CCGT capacity running at approx 85% capacity factor
Data source: ACIL Tasman analysis
The index is designed to be used as a multiplier to the gas prices provided in
Table 44 for each demand tranche. Once each tranche is utilised, prices wouldrise according to the multiplier for subsequent gas-fired developments. While
Table 46 provides for seven different tranches, it may be prudent to aggregate
these into a smaller number of tranches to ease analysis. In addition, while the
indices have been provided for two spot years, the differences between them
are relatively small (aside from the extreme demand case), and hence it may
also be easier to assume that the same index applies for all years across the 20
year timeframe.
One shortcoming of this approach is that the price relativities between NEM
zones will remain constant, which in reality may not occur due to the changesin network flows.

7/27/2019 ACIL Tasman April 2009
http://slidepdf.com/reader/full/acil-tasman-april-2009 79/104
Fuel resource, new entry and generation costs in the NEM
New entrant technologies 72
The number, size and location of OCGT peaking plant should not be limited
by availability of gas as generally OCGTs will be dual fuelled using distillate when gas may not be available at critical high price times. It is not generally
economically viable for a peaking plant to reserve adequate firm pipeline
capacity for the low level of operation for the very limited times when high
price electricity events may occur. OCGT plants are more likely to be
established with lower cost interruptible pipeline capacity and distillate as a
backup fuel. The location of peaking plant will normally be determined by
consideration of access to flexible gas supplies, shape of the electricity load,
transmission constraints and access to generation sites.
4.2.2 Coal
Examination of quality and location of coal resources in each of the 16 zones
suggests that only seven zones would be suitable for locating new coal fired
capacity; three in Queensland, three in NSW and one in Victoria. This is
illustrated in Table 47.
Table 47 also identifies the potential for additional base load coal fired capacity
in each of the zones. The zones with greatest potential for additional coal fired
generation are SWQ based on the extensive low cost black coal deposits in the
Table 47 NEM zones where coal fired generation is an option
Zone Coal sourcePossible power station locations Potential
NQ
Northern Bowen Basin (LakeElphinstone, Nebo West, Bee Creek,and others)
via NeboSeveral economic coal deposits which could supportfurther new base load generation but would compete withexport market
Northern Galilee Basin (Pentland)250km west of Collinsville
Significant open cut resource with no export infrastructure
CQ
Central Bowen Basin (Minerva,Togara, Valeria, Ensham, Cullin-Ia-ringo, and others)
via Emerald A number of economic coal deposits which could supportfurther new base load generation but would compete withthe export market
Southern Galilee Basin (Alpha, KevinsCorner)
via Alpha - west of Emerald
Significant low strip-ratio resource with no coal exportinfrastructure
SWQ
Surat Basin (Felton and New Acland inthe east and around Chinchilla andWandoan in the west and others inbetween)
Many options allalong the SuratBasin west of Toowoomba
Extensive low cost coal reserves which could supportsignificant additional new base load generation and onlyvery limited export Infrastructure
NNSGunnedah Basin (Maules Creek,Boggabri)
Between Narrrabriand Gunnedah
Extensive undeveloped mainly underground thermal coaldeposits with limited export infrastructure
NCENHunter and Western (Ulan, Bylong, Anvil Hill, Saddlers Creek and others)
Ulan/MuswellbrookMany well located undeveloped coal deposits which couldsupport additional new base load generation
SWNSW OaklandsOaklands, 100kmwest of Albury
Large low strip ratio deposit suitable for large power station development
LV Latrobe Valley Latrobe ValleyEstimated useable reserve of 50,000 million tonnes whichcould support significant additional new base loadgeneration
Data source: ACIL Tasman assessment
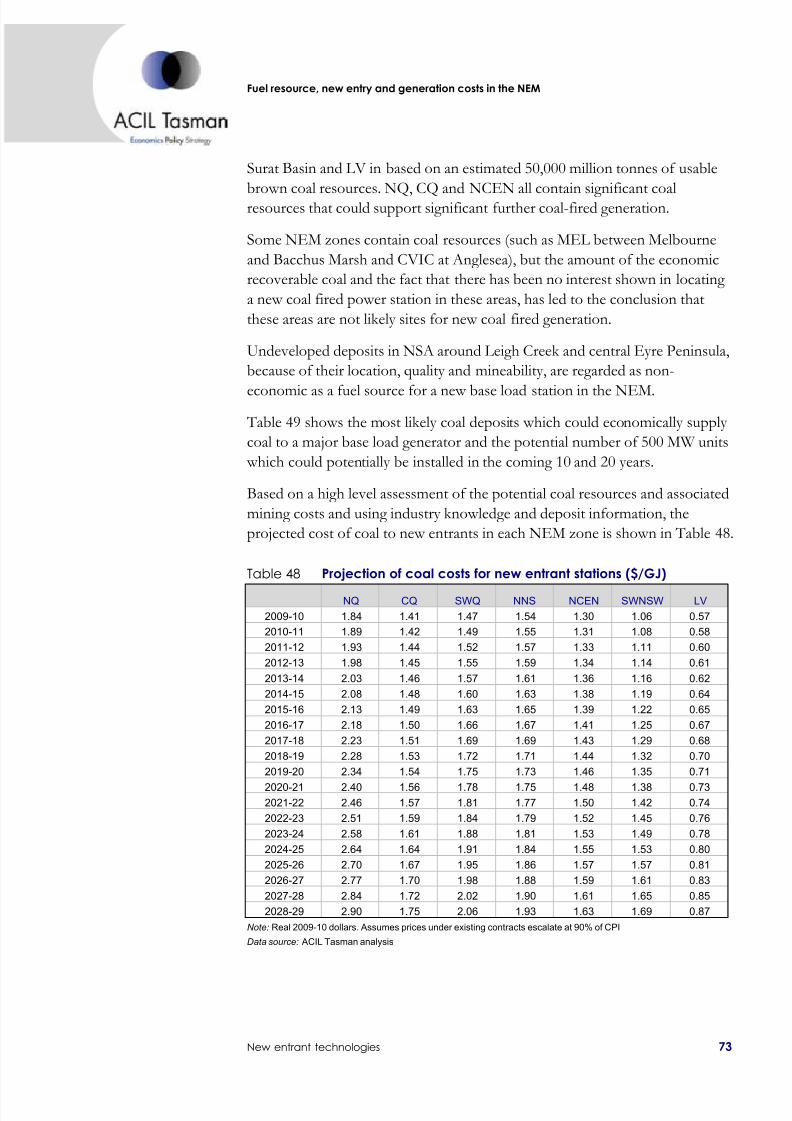
7/27/2019 ACIL Tasman April 2009
http://slidepdf.com/reader/full/acil-tasman-april-2009 80/104
Fuel resource, new entry and generation costs in the NEM
New entrant technologies 73
Surat Basin and LV in based on an estimated 50,000 million tonnes of usable
brown coal resources. NQ, CQ and NCEN all contain significant coalresources that could support significant further coal-fired generation.
Some NEM zones contain coal resources (such as MEL between Melbourne
and Bacchus Marsh and CVIC at Anglesea), but the amount of the economic
recoverable coal and the fact that there has been no interest shown in locating
a new coal fired power station in these areas, has led to the conclusion that
these areas are not likely sites for new coal fired generation.
Undeveloped deposits in NSA around Leigh Creek and central Eyre Peninsula,
because of their location, quality and mineability, are regarded as non-
economic as a fuel source for a new base load station in the NEM.
Table 49 shows the most likely coal deposits which could economically supply
coal to a major base load generator and the potential number of 500 MW units
which could potentially be installed in the coming 10 and 20 years.
Based on a high level assessment of the potential coal resources and associated
mining costs and using industry knowledge and deposit information, the
projected cost of coal to new entrants in each NEM zone is shown in Table 48.
Table 48 Projection of coal costs for new entrant stations ($/GJ)
NQ CQ SWQ NNS NCEN SWNSW LV
2009-10 1.84 1.41 1.47 1.54 1.30 1.06 0.57
2010-11 1.89 1.42 1.49 1.55 1.31 1.08 0.58
2011-12 1.93 1.44 1.52 1.57 1.33 1.11 0.60
2012-13 1.98 1.45 1.55 1.59 1.34 1.14 0.61
2013-14 2.03 1.46 1.57 1.61 1.36 1.16 0.62
2014-15 2.08 1.48 1.60 1.63 1.38 1.19 0.64
2015-16 2.13 1.49 1.63 1.65 1.39 1.22 0.65
2016-17 2.18 1.50 1.66 1.67 1.41 1.25 0.67
2017-18 2.23 1.51 1.69 1.69 1.43 1.29 0.68
2018-19 2.28 1.53 1.72 1.71 1.44 1.32 0.70
2019-20 2.34 1.54 1.75 1.73 1.46 1.35 0.71
2020-21 2.40 1.56 1.78 1.75 1.48 1.38 0.732021-22 2.46 1.57 1.81 1.77 1.50 1.42 0.74
2022-23 2.51 1.59 1.84 1.79 1.52 1.45 0.76
2023-24 2.58 1.61 1.88 1.81 1.53 1.49 0.78
2024-25 2.64 1.64 1.91 1.84 1.55 1.53 0.80
2025-26 2.70 1.67 1.95 1.86 1.57 1.57 0.81
2026-27 2.77 1.70 1.98 1.88 1.59 1.61 0.83
2027-28 2.84 1.72 2.02 1.90 1.61 1.65 0.85
2028-29 2.90 1.75 2.06 1.93 1.63 1.69 0.87
Note: Real 2009-10 dollars. Assumes prices under existing contracts escalate at 90% of CPI
Data source: ACIL Tasman analysis

7/27/2019 ACIL Tasman April 2009
http://slidepdf.com/reader/full/acil-tasman-april-2009 81/104
74
Fue
lresource,newentryandgenerationcostsintheNEM
Newentranttechnologies
Table 49 Summary of potential black coal deposits suitable for large scale base load generation
Zone Deposit Basin LocationResource
(Mt)
Specificenergy
(GJ/t as)Resource
(PJ)
Strip ratio(bcm/
ROM t)Miningmethod
EstimatedROM
mining cost(2009-10
$/GJ)MW
Supported1
Number of
potential500MW
units over next 10years
Number of
potential500MW
units over next 20years
NQ Pentland2 Galilee 220km SWTownsville 645 18.0 11,610 4.7 OC 1.50 4,102 0 3
CQ
Alpha Galilee 55km N Alpha 665 25.7 17,100 2.6 OC 0.89 6,042 2 4
KevinsCorner 2
Galilee 70km N Alpha 910 24.8 22,612 4.2 OC 1.05 7,990 2 4
SWQ
Felton2
Clarence-Moreton
40km SWToowoomba
1,090 15.5 16,910 3.4 OC 1.57 5,975 2 4
New AclandClarence-Moreton
12km N Oakey 328 20.2 6,623 2.6 OC 1.13 2,340 0 2
Horse Creek2 Surat 25km N Chinchilla 295 24.6 7,258 7.7 OC 1.34 2,565 0 2
Wandoan2,3
Surat 60km N Miles 1,893 20.5 38,713 4.1 OC 1.27 13,680 4 6
NNS
Maules Creek Gunnedah 20km NE Boggabri 520 27.9 14,508 na OC <1.30 5,127 0 2
Boggabri Gunnedah 17km NE Boggabri 576 28.3 16,301 na OC & UG ~1.30 5,760 0 2
Caroona Gunnedah 256km S Gunnedah 930 27.6 25,668 na OC & UG ~1.30 9,070 0 2
Narabri Gunnedah SW Narrabri 1,205 27.9 33,620 na UG >1.30 11,880 0 4
NCNMoorlarben Sydney 45km NE Mudgee 453 23.0 10,419 na OC & UG >1.20 3,682 2 3
Ulan Sydney 40km NE Mudgee 847 23.0 19,481 na OC & UG <1.20 6,884 2 4
SWNSW Oaklands Oaklands 100km W Albury 880 17.5 15,400 4.0 OC 1.20 5,442 2 4
Note: SE (a.s.) = specific energy (as supplied); ROM = ‘Run of mine’ (raw)
1. Based on PS life of 40 years @ 85% CF and 9.5GJ/MWh (2.83PJ/MW)
2. Resource based on "Measured" + "Indicated"
3. Austinvale, Woleebee and Summer Hill (640Mt) - additional 165Mt for Frank Creek, Wubagul and Glen Laurel
Data source: ACIL Tasman assessment based on a variety of data sources

7/27/2019 ACIL Tasman April 2009
http://slidepdf.com/reader/full/acil-tasman-april-2009 82/104
Fuel resource, new entry and generation costs in the NEM
New entrant technologies 75
4.2.3 Nuclear
In 2006 the Prime Ministerial Uranium Mining, Processing and Nuclear Energy
Review (UMPNER) Task Force engaged the Electric Power Research Institute
(EPRI) to conduct an independent review and analysis of nuclear energy in the
Australian context.
As reported by the EPRI13, estimates of nuclear fuel costs vary across a
number of previous studies examined by the report. Within this study we have
adopted the estimate from the Gittus report prepared for the Australian
Nuclear Science and Technology Organisation of $4.65/MWh, given that the
report was prepared in an Australian context. This value has been escalated to2009-10 prices, yielding a fuel cost of $4.90/MWh sent-out. This equates to
approximately $0.46/GJ based upon the sent-out thermal efficiency of 34% (as
detailed in Table 36).
4.3 SRMC for new entrant technologies
Table 50 provides the projected SRMC for each new entrant technology by
NEM zone excluding carbon costs. These costs vary across regions for the
same technology due to differences in fuel costs. The calculated SRMC is
comprised of fuel and VOM costs. Table 51 provides the projected SRMC for each new entrant technology by
NEM zone including carbon costs (using emission permit prices as set out in
Table 5).
13 Electric Power Research Institute, Review and Comparison of Recent Studies for Australian Electricity Generation Planning , October 2006

7/27/2019 ACIL Tasman April 2009
http://slidepdf.com/reader/full/acil-tasman-april-2009 83/104
76
Fue
lresource,newentryandgenerationcostsintheNEM
Newentranttechnologies
Table 50 Projected SRMC for new entrant technologies excluding carbon costs (Real 2009-10 $/MWh as generated)
Technology and Zone2009-
102010-
112011-
122012-
132013-
142014-
152015-
162016-
172017-
182018-
192019-
202020-
212021-
222022-
232023-
242024-
252025-
262026-
272027-
282028-
29
CCGT (WC)_NQ 37.67 37.48 34.72 37.74 37.17 37.29 37.39 36.79 36.86 36.94 37.10 37.16 37.35 36.73 36.72 36.88 37.18 37.18 38.36 38.38
CCGT (WC)_CQ 38.12 37.95 34.52 34.76 36.92 36.85 36.85 36.46 38.29 38.39 38.58 38.67 38.88 38.26 38.27 38.46 38.77 38.80 40.01 40.04
CCGT (WC)_SEQ 36.29 32.25 31.82 31.98 31.56 31.72 31.86 31.40 31.51 31.64 31.75 31.89 32.01 31.60 31.74 31.84 32.01 32.17 32.35 32.53
CCGT (WC)_SWQ 33.07 33.04 29.14 29.30 29.79 29.87 30.00 29.66 31.61 31.85 32.17 32.19 32.53 32.15 32.27 32.41 32.59 32.98 33.90 34.05
CCGT (WC)_NNSW 28.28 29.24 28.86 29.02 28.66 28.82 28.96 28.56 28.67 28.79 28.90 29.04 29.17 28.81 28.95 29.04 29.21 29.37 29.56 29.73
CCGT (WC)_NCEN 40.69 38.82 37.86 37.68 37.11 37.22 37.31 36.72 37.13 37.67 38.28 38.27 38.66 38.20 38.78 40.01 40.30 40.97 41.75 43.09
CCGT (WC)_SWNSW 41.41 41.82 41.29 41.10 40.44 40.54 40.61 39.93 40.35 40.88 41.47 41.44 41.81 41.29 41.86 43.07 43.34 43.99 44.76 46.09
CCGT (WC)_CAN 38.24 37.26 36.06 36.18 35.64 35.76 35.86 35.30 35.72 36.27 36.89 36.89 37.29 37.36 37.45 38.76 39.20 40.06 42.12 43.46
CCGT (WC)_NVIC 37.31 37.52 37.21 37.36 36.84 36.99 39.01 38.51 39.18 40.51 41.08 41.08 41.08 41.58 41.69 43.02 43.47 44.34 46.42 47.77
CCGT (WC)_LV 31.47 31.50 31.12 31.27 30.86 31.01 33.03 32.64 33.30 34.64 35.21 35.21 35.21 35.81 35.93 37.25 37.70 38.57 40.65 42.01CCGT (WC)_MEL 33.81 33.95 33.63 33.78 33.33 33.48 35.50 35.07 35.73 37.06 37.63 37.63 37.63 38.20 38.31 39.63 40.09 40.96 43.03 44.39
CCGT (WC)_CVIC 32.25 32.24 31.80 32.02 33.33 33.48 35.50 35.07 35.73 37.06 37.63 37.63 37.63 38.20 38.31 39.63 40.09 40.96 42.80 43.25
CCGT (WC)_NSA 39.58 39.51 38.89 39.06 40.19 40.30 42.27 41.67 42.29 43.58 44.10 44.06 44.01 44.42 44.49 45.77 46.18 47.01 48.81 49.23
CCGT (WC)_ADE 38.10 38.04 37.45 37.64 38.79 38.91 40.89 40.32 40.95 42.24 42.77 42.73 42.70 43.13 43.21 44.50 44.91 45.75 47.56 47.98
CCGT (WC)_SESA 35.44 35.40 34.89 35.09 36.32 36.45 38.45 37.95 38.59 39.91 40.46 40.44 40.42 40.92 41.01 42.32 42.75 43.61 45.44 45.87
CCGT (WC)_TAS 37.06 37.04 36.52 36.67 36.16 36.31 38.33 37.84 38.51 39.84 40.41 40.41 40.41 40.93 41.04 42.36 42.81 43.69 45.76 46.84
CCGT (AC)_NQ 38.15 37.95 35.13 38.18 37.58 37.70 37.80 37.17 37.24 37.33 37.48 37.55 37.74 37.09 37.07 37.24 37.54 37.54 38.74 38.75
CCGT (AC)_CQ 38.60 38.43 34.92 35.17 37.33 37.26 37.26 36.84 38.68 38.78 38.99 39.08 39.29 38.63 38.64 38.83 39.15 39.18 40.40 40.44
CCGT (AC)_SEQ 36.74 32.65 32.19 32.35 31.90 32.06 32.20 31.72 31.83 31.96 32.07 32.21 32.34 31.90 32.04 32.14 32.31 32.47 32.66 32.84
CCGT (AC)_SWQ 33.48 33.45 29.48 29.63 30.12 30.19 30.33 29.96 31.94 32.17 32.50 32.52 32.86 32.45 32.58 32.72 32.91 33.30 34.22 34.38
CCGT (AC)_NNSW 28.62 29.60 29.19 29.36 28.97 29.13 29.27 28.85 28.96 29.08 29.19 29.33 29.46 29.08 29.22 29.31 29.49 29.65 29.84 30.01
CCGT (AC)_NCEN 41.20 39.31 38.31 38.13 37.52 37.63 37.73 37.10 37.51 38.06 38.68 38.67 39.06 38.58 39.16 40.41 40.70 41.37 42.16 43.51
CCGT (AC)_SWNSW 41.94 42.35 41.78 41.58 40.89 40.99 41.06 40.35 40.77 41.31 41.91 41.87 42.25 41.70 42.27 43.50 43.77 44.43 45.20 46.54
CCGT (AC)_CAN 38.72 37.73 36.48 36.60 36.03 36.15 36.26 35.66 36.09 36.65 37.27 37.27 37.67 37.72 37.82 39.14 39.58 40.45 42.53 43.89
CCGT (AC)_NVIC 37.78 37.99 37.65 37.80 37.25 37.40 39.44 38.92 39.59 40.94 41.51 41.51 41.51 41.99 42.10 43.44 43.90 44.78 46.88 48.25
CCGT (AC)_LV 31.86 31.89 31.48 31.63 31.19 31.34 33.39 32.97 33.65 35.00 35.57 35.57 35.57 36.16 36.27 37.61 38.07 38.95 41.05 42.42
CCGT (AC)_MEL 34.23 34.37 34.02 34.18 33.69 33.84 35.89 35.43 36.10 37.45 38.02 38.02 38.02 38.57 38.68 40.02 40.48 41.36 43.45 44.83
CCGT (AC)_CVIC 32.65 32.63 32.17 32.39 33.69 33.84 35.89 35.43 36.10 37.45 38.02 38.02 38.02 38.57 38.68 40.02 40.48 41.36 43.22 43.68
CCGT (AC)_NSA 40.07 40.01 39.35 39.53 40.64 40.75 42.74 42.11 42.73 44.04 44.56 44.52 44.48 44.86 44.93 46.23 46.64 47.48 49.30 49.72
CCGT (AC)_ADE 38.58 38.52 37.90 38.08 39.22 39.34 41.34 40.74 41.37 42.69 43.22 43.18 43.14 43.56 43.63 44.94 45.36 46.20 48.03 48.46
CCGT (AC)_SESA 35.88 35.85 35.30 35.50 36.72 36.85 38.88 38.34 38.99 40.33 40.88 40.86 40.84 41.32 41.41 42.74 43.18 44.04 45.88 46.33
CCGT (AC)_TAS 37.52 37.51 36.95 37.10 36.56 36.71 38.75 38.24 38.91 40.26 40.84 40.84 40.84 41.33 41.44 42.78 43.24 44.12 46.21 47.30OCGT_NQ 84.84 82.03 77.73 83.99 84.23 82.15 82.35 82.50 82.64 80.61 80.92 81.05 81.43 79.38 79.35 79.69 80.27 78.26 80.58 80.60
OCGT_CQ 85.78 82.99 77.29 77.80 83.71 81.26 81.25 81.81 85.62 83.53 83.94 84.12 84.54 82.46 82.47 82.85 83.49 81.42 83.79 83.86
OCGT_SEQ 81.92 71.35 71.68 72.01 72.34 70.70 70.99 71.22 71.44 69.82 70.04 70.33 70.59 69.07 69.35 69.54 69.89 68.46 68.83 69.17
OCGT_SWQ 75.13 72.97 66.11 66.44 68.60 66.90 67.18 67.55 71.65 70.24 70.91 70.95 71.63 70.16 70.42 70.69 71.06 70.05 71.85 72.15
OCGT_NNSW 65.04 65.20 65.53 65.86 66.19 64.74 65.03 65.25 65.48 64.03 64.26 64.54 64.80 63.45 63.73 63.92 64.27 63.00 63.37 63.71
OCGT_NCEN 91.19 84.77 84.25 83.88 84.10 82.01 82.21 82.34 83.20 82.08 83.32 83.30 84.08 82.34 83.50 85.98 86.56 85.67 87.19 89.81
OCGT_SWNSW 92.72 90.88 91.38 90.98 91.17 88.84 88.98 89.08 89.94 88.60 89.81 89.74 90.50 88.54 89.68 92.13 92.67 91.58 93.07 95.67
OCGT_CAN 86.03 81.59 80.50 80.75 80.99 79.01 79.23 79.37 80.25 79.24 80.49 80.49 81.30 80.64 80.83 83.46 84.35 83.89 87.92 90.54
OCGT_NVIC 84.08 82.12 82.90 83.22 83.53 81.54 85.69 86.10 87.49 87.86 89.01 89.01 89.01 89.13 89.35 92.02 92.93 92.26 96.32 98.97
OCGT_LV 71.77 69.82 70.22 70.53 70.85 69.24 73.39 73.80 75.19 75.92 77.08 77.08 77.08 77.54 77.76 80.42 81.33 80.99 85.04 87.69
OCGT_MEL 76.69 74.82 75.45 75.77 76.09 74.32 78.47 78.88 80.27 80.85 82.01 82.01 82.01 82.32 82.55 85.21 86.12 85.64 89.70 92.35
OCGT_CVIC 73.41 71.32 71.64 72.10 76.09 74.32 78.47 78.88 80.27 80.85 82.01 82.01 82.01 82.32 82.55 85.21 86.12 85.64 89.25 90.13

7/27/2019 ACIL Tasman April 2009
http://slidepdf.com/reader/full/acil-tasman-april-2009 84/104
77
Fue
lresource,newentryandgenerationcostsintheNEM
Newentranttechnologies
Technology and Zone2009-
102010-
112011-
122012-
132013-
142014-
152015-
162016-
172017-
182018-
192019-
202020-
212021-
222022-
232023-
242024-
252025-
262026-
272027-
282028-
29
OCGT_NSA 88.85 86.18 86.39 86.76 90.63 88.34 92.39 92.71 94.00 94.09 95.15 95.06 94.97 94.84 94.97 97.55 98.38 97.48 101.00 101.81
OCGT_ADE 85.74 83.18 83.41 83.79 87.68 85.49 89.55 89.89 91.19 91.37 92.45 92.37 92.29 92.25 92.40 94.99 95.83 95.01 98.55 99.37
OCGT_SESA 80.13 77.79 78.06 78.49 82.43 80.43 84.54 84.92 86.26 86.63 87.75 87.71 87.67 87.80 87.98 90.61 91.49 90.83 94.40 95.25
OCGT_TAS 83.54 81.14 81.45 81.77 82.09 80.14 84.29 84.70 86.09 86.50 87.65 87.65 87.65 87.81 88.03 90.70 91.61 90.98 95.03 97.14
SC BLACK (WC)_NQ 15.76 15.75 15.74 15.39 15.38 15.37 15.36 15.35 15.34 15.32 15.31 15.30 15.29 14.96 14.95 14.94 14.93 14.92 14.91 14.90
SC BLACK (AC)_NQ 16.13 16.12 16.11 15.73 15.72 15.71 15.70 15.69 15.68 15.67 15.66 15.65 15.64 15.28 15.27 15.26 15.25 15.24 15.23 15.22
SC BLACK (AC)_CQ 12.63 12.45 12.28 11.83 11.67 11.50 11.33 11.16 11.00 10.85 10.70 10.56 10.41 10.05 9.98 9.91 9.84 9.78 9.71 9.64
SC BLACK (AC)_SWQ 13.10 13.00 12.91 12.54 12.46 12.37 12.29 12.21 12.13 12.05 11.98 11.91 11.84 11.51 11.44 11.38 11.31 11.24 11.18 11.14
SC BLACK (AC)_NNSW 13.64 13.48 13.33 12.88 12.73 12.58 12.43 12.29 12.14 11.99 11.85 11.72 11.59 11.21 11.09 10.96 10.84 10.72 10.60 10.48
SC BLACK (AC)_NCEN 11.69 11.56 11.43 11.05 10.93 10.81 10.68 10.56 10.44 10.32 10.19 10.08 9.98 9.66 9.56 9.45 9.35 9.25 9.15 9.05
SC BLACK (AC)_SWNSW 9.72 9.72 9.72 9.51 9.51 9.51 9.51 9.51 9.51 9.51 9.51 9.51 9.51 9.32 9.32 9.32 9.32 9.3 2 9.32 9.32
SC BROWN (WC)_LV 6.59 6.58 6.57 6.55 6.39 6.37 6.36 6.35 6.33 6.32 6.31 6.30 6.28 6.27 6.26 6.25 6.23 6.08 6.07 6.06
SC BROWN (AC)_LV 6.82 6.81 6.79 6.78 6.59 6.58 6.57 6.55 6.54 6.53 6.51 6.50 6.49 6.47 6.46 6.45 6.43 6.27 6.25 6.24USC BLACK (WC)_NQ 14.86 14.85 14.55 14.54 14.53 14.23 14.22 14.21 13.93 13.92 13.91 13.65 13.64 13.63 13.37 13.36 13.11 13.10 13.10 13.09
USC BLACK (AC)_NQ 15.25 15.24 14.91 14.90 14.89 14.58 14.57 14.56 14.25 14.25 14.24 13.95 13.94 13.93 13.65 13.64 13.38 13.37 13.36 13.35
USC BLACK (AC)_CQ 11.96 11.79 11.39 11.23 11.07 10.69 10.54 10.39 10.04 9.90 9.77 9.46 9 .33 9.21 8.97 8 .91 8.69 8.64 8. 58 8.52
USC BLACK (AC)_SWQ 12.40 12.30 11.97 11.89 11.81 11.50 11.42 11.35 11.05 10.99 10.92 10.65 10.59 10.52 10.27 10.21 9.96 9.91 9.85 9.82
USC BLACK (AC)_NNSW 12.91 12.76 12.35 12.21 12.07 11.69 11.55 11.42 11.06 10.93 10.80 10.48 10.36 10.25 9.95 9.84 9.56 9.45 9.35 9.25
USC BLACK (AC)_NCEN 11.07 10.95 10.61 10.49 10.37 10.06 9.94 9.83 9.53 9.42 9.31 9.04 8.9 4 8.85 8.60 8.51 8.27 8.1 8 8.09 8.01
USC BLACK (AC)_SWNSW 9.23 9.23 9.04 9.04 9. 04 8.87 8.87 8.87 8.70 8.70 8.70 8.54 8.54 8.54 8.38 8.38 8.24 8.24 8. 24 8.24
USC BROWN (WC)_LV 6.18 6.17 6.03 6.02 6.00 5.87 5.86 5.84 5.83 5.82 5.81 5.68 5.67 5.66 5.54 5.53 5.41 5.40 5.39 5.38
USC BROWN (AC)_LV 6.37 6.35 6.20 6.18 6.17 6.02 6.01 6.00 5.99 5.97 5.96 5.82 5.81 5.80 5.67 5.66 5.53 5.52 5.51 5.50
Geothermal (HDR)_NNSW 2.00 2.00 2.00 2.00 2.00 2.00 2.00 2.00 2.00 2.00 2.00 2.00 2.00 2.00 2.00 2.00 2.00 2.00 2.00 2.00
Geothermal (HDR)_CV IC 2.00 2.00 2.00 2.00 2.00 2.00 2.00 2.00 2.00 2.00 2.00 2.00 2.00 2.00 2.00 2.00 2.00 2.00 2.00 2.00
Geothermal (HDR)_NS A 2.00 2.00 2.00 2.00 2.00 2.00 2.00 2.00 2.00 2.00 2.00 2.00 2.00 2.00 2.00 2.00 2.00 2.00 2.00 2.00
Geothermal (HDR)_ADE 2.00 2.00 2.00 2.00 2.00 2.00 2.00 2.00 2.00 2.00 2.00 2.00 2.00 2.00 2.00 2.00 2.00 2.00 2.00 2.00
IGCC BLACK_NQ 17.23 17.22 17.21 16.87 16.86 16.85 16.84 16.83 16.51 16.50 16.50 16.49 16.48 16.17 16.16 16.15 16.14 16.14 15.85 15.84
IGCC BLACK_CQ 14.02 13.86 13.70 13.30 13.14 12.99 12.84 12.68 12.32 12.19 12.06 11.93 11.80 11.48 11.42 11.36 11.30 11.24 11.00 10.94
IGCC BLACK_SWQ 14.45 14.36 14.28 13.94 13.87 13.79 13.72 13.64 13.33 13.27 13.20 13.14 13.07 12.79 12.73 12.67 12.61 12.55 12.29 12.26
IGCC BLACK_NNSW 14.95 14.80 14.66 14.26 14.12 13.98 13.85 13.71 13.34 13.21 13.08 12.96 12.85 12.52 12.41 12.30 12.19 12.08 11.79 11.68
IGCC BLACK_NCEN 13.16 13.04 12.92 12.58 12.47 12.35 12.24 12.13 11.82 11.71 11.60 11.50 11.41 11.13 11.04 10.95 10.86 10.76 10.52 10.43
IGCC BLACK_SWNSW 11.36 11.36 11.36 11.17 11.17 11.17 11.17 11.17 10.99 10.99 10.99 10.99 10.99 10.82 10.82 10.82 10.82 10.82 10.66 10.66
IGCC BLACK CCS_NQ 20.19 20.18 20.17 19.69 19.67 19.66 19.65 19.64 19.63 19.62 18.35 18.34 18.33 18.32 18.31 17.57 17.56 17.55 17.21 17.20
IGCC BLACK CCS_CQ 16.44 16.25 16.06 15.53 15.35 15.17 14.99 14.82 14.64 14.48 13.50 13.35 13.21 13.07 13.00 12.48 12.41 12.35 12.08 12.02
IGCC BLACK CCS_SWQ 16.94 16.83 16.74 16.28 16.19 16.10 16.02 15.93 15.84 15.76 14.75 14.68 14.61 14.54 14.47 13.87 13.81 13.75 13.44 13.41IGCC BLACK CCS_NNSW 17.52 17.35 17.19 16.64 16.48 16.32 16.17 16.01 15.85 15.70 14.62 14.49 14.36 14.23 14.11 13.48 13.36 13.25 12.91 12.80
IGCC BLACK CCS_NCEN 15.43 15.29 15.16 14.70 14.56 14.43 14.30 14.17 14.04 13.91 13.00 12.89 12.78 12.68 12.57 12.04 11.95 11.85 11.56 11.47
IGCC BLACK CCS_SWNSW 13.33 13.33 13.33 13.06 13.06 13.06 13.06 13.06 13.06 13.06 12.33 12.33 12.33 12.33 12.33 11.91 11.91 11.91 11.72 11.72
IGCC BROWN_L V 7.74 7.73 7.72 7.61 7.60 7.59 7.58 7.57 7.46 7.45 7.44 7.43 7.42 7.33 7.32 7.31 7.30 7.29 7.19 7.19
IGCC BROWN CCS_LV 9.09 9.08 9.07 8.91 8.90 8.89 8.88 8.87 8.85 8.84 8.45 8.44 8.43 8.42 8.41 8.18 8.17 8.16 8.05 8.04
USC CCS BLACK (WC)_NQ 16.87 16.86 16.40 16.39 16.38 16.37 16.36 15.17 15.16 15.15 15.14 15.13 14.44 14.43 14.42 14.41 14.40 14.39 13.77 13.76
USC CCS BLACK (AC)_NQ 17.60 17.59 17.09 17.07 17.06 17.05 17.04 15.72 15.71 15.70 15.69 15.68 14.92 14.91 14.90 14.89 14.88 14.87 14.19 14.18
USC CCS BLACK (AC)_CQ 13.91 13.72 13.17 12.99 12.81 12.64 12.46 11.39 11.23 11.09 10.94 10.80 10.18 10.06 9.99 9.93 9.86 9.80 9.33 9.27
USC CCS BLACK (AC)_SWQ 14.40 14.29 13.82 13.73 13.64 13.55 13.47 12.39 12.31 12.24 12.17 12.10 11.48 11.41 11.35 11.28 11.22 11.16 10.62 10.59
USC CCS BLACK (AC)_NNSW 14.97 14.81 14.24 14.08 13.93 13.77 13.62 12.46 12.32 12.18 12.04 11.91 11.25 11.13 11.02 10.90 10.79 10.68 10.11 10.01
USC CCS BLACK (AC)_NCEN 12.92 12.78 12.30 12.17 12.04 11.91 11.78 10.81 10.69 10.57 10.46 10.35 9.79 9.69 9.60 9.50 9.41 9.31 8.84 8.75
USC CCS BLACK (AC)_SWNSW 10.84 10.84 10.56 10.56 10.56 10.56 10.56 9. 81 9.81 9.81 9.81 9.81 9.37 9.37 9.37 9.37 9.37 9.37 8.98 8.98

7/27/2019 ACIL Tasman April 2009
http://slidepdf.com/reader/full/acil-tasman-april-2009 85/104
78
Fue
lresource,newentryandgenerationcostsintheNEM
Newentranttechnologies
Technology and Zone2009-
102010-
112011-
122012-
132013-
142014-
152015-
162016-
172017-
182018-
192019-
202020-
212021-
222022-
232023-
242024-
252025-
262026-
272027-
282028-
29
USC CCS BROWN (WC)_LV 7.11 7.09 6.91 6. 89 6.88 6.87 6. 86 6.38 6.37 6.3 6 6.35 6.34 6.2 0 6.19 6.17 6.16 6.15 6.1 4 5.89 5.88
USC CCS BROWN (AC)_LV 7.20 7.19 6.99 6. 97 6.96 6.95 6. 94 6.44 6.43 6.4 2 6.41 6.40 6.2 4 6.23 6.22 6.21 6.20 6.1 9 5.93 5.92
Nuclear_NQ 9.94 9.94 9.94 9.94 9.94 9.94 9.94 9.94 9.94 9.94 9.94 9.94 9.94 9.94 9.94 9.94 9.94 9.94 9.94 9.94
Nuclear_CQ 9.94 9.94 9.94 9.94 9.94 9.94 9.94 9.94 9.94 9.94 9.94 9.94 9.94 9.94 9.94 9.94 9.94 9.94 9.94 9.94
Nuclear_SWQ 9.94 9.94 9.94 9.94 9.94 9.94 9.94 9.94 9.94 9.94 9.94 9.94 9.94 9.94 9.94 9.94 9.94 9.94 9.94 9.94
Nuclear_NNSW 9.94 9.94 9.94 9.94 9.94 9.94 9.94 9.94 9.94 9.94 9.94 9.94 9.94 9.94 9.94 9.94 9.94 9.94 9.94 9.94
Nuclear_NCEN 9.94 9.94 9.94 9.94 9.94 9.94 9.94 9.94 9.94 9.94 9.94 9.94 9.94 9.94 9.94 9.94 9.94 9.94 9.94 9.94
Nuclear_SWNSW 9.94 9.94 9.94 9.94 9.94 9.94 9.94 9.94 9.94 9.94 9.94 9.94 9.94 9.94 9.94 9.94 9.94 9.94 9.94 9.94
Nuclear_CAN 9.94 9.94 9.94 9.94 9.94 9.94 9.94 9.94 9.94 9.94 9.94 9.94 9.94 9.94 9.94 9.94 9.94 9.94 9.94 9.94
Nuclear_NVI C 9.94 9.94 9.94 9.94 9.94 9.94 9.94 9.94 9.94 9.94 9.94 9.94 9.94 9.94 9.94 9.94 9.94 9.94 9.94 9.94
Nuclear_LV 9.94 9.94 9.94 9.94 9.94 9.94 9.94 9.94 9.94 9.94 9.94 9.94 9.94 9.94 9.94 9.94 9.94 9.94 9.94 9.94
Nuclear_CVI C 9.94 9.94 9.94 9.94 9.94 9.94 9.94 9.94 9.94 9.94 9.94 9.94 9.94 9.94 9.94 9.94 9.94 9.94 9.94 9.94
Nuclear_NSA 9.94 9.94 9.94 9.94 9.94 9.94 9.94 9.94 9.94 9.94 9.94 9.94 9.94 9.94 9.94 9.94 9.94 9.94 9.94 9.94Nuclear_SESA 9.94 9.94 9.94 9.94 9.94 9.94 9.94 9.94 9.94 9.94 9.94 9.94 9.94 9.94 9.94 9.94 9.94 9.94 9.94 9.94
Note: WC denotes water cooled; AC denotes air cooled. CCGT = combined cycle gas turbine; OCGT = open cycle gas turbine; SC = supercritical coal; USC = ultra-supercritical coal; IGCC =
integrated gasification combined cycle; CCS = carbon capture and storage. SRMC includes fuel and VOM. Real 2009-10 $/MWh generated.
Data source: ACIL Tasman analysis
Table 51 Projected SRMC for new entrant technologies including carbon costs (Real 2009-10 $/MWh as generated)
Technology & Zone2009-
102010-
112011-
122012-
132013-
142014-
152015-
162016-
172017-
182018-
192019-
202020-
212021-
222022-
232023-
242024-
252025-
262026-
272027-
282028-
29
CCGT (WC)_NQ 37.67 46.53 43.90 47.65 47.63 48.47 49.30 49.16 49.81 50.48 51.27 51.92 52.77 52.50 53.14 53.97 54.79 55.54 57.42 58.22
CCGT (WC)_CQ 38.12 47.00 43.69 44.68 47.38 48.04 48.76 48.83 51.24 51.92 52.75 53.43 54.31 54.03 54.69 55.54 56.39 57.16 59.07 59.89
CCGT (WC)_SEQ 36.29 41.29 41.00 41.89 42.02 42.90 43.77 43.77 44.46 45.18 45.91 46.64 47.44 47.37 48.17 48.92 49.63 50.53 51.41 52.37
CCGT (WC)_SWQ 33.07 42.09 38.32 39.22 40.25 41.05 41.91 42.02 44.56 45.38 46.34 46.95 47.95 47.91 48.70 49.49 50.21 51.34 52.96 53.89
CCGT (WC)_NNSW 28.28 39.69 39.47 40.48 40.74 41.74 42.72 42.84 43.63 44.43 45.27 46.09 46.99 47.02 47.92 48.78 49.57 50.58 51.58 52.65
CCGT (WC)_NCEN 40.69 49.27 48.46 49.14 49.19 50.14 51.07 51.00 52.09 53.31 54.64 55.31 56.47 56.42 57.76 59.75 60.66 62.18 63.76 66.01
CCGT (WC)_SWNSW 41.41 52.26 51.89 52.55 52.52 53.46 54.37 54.22 55.31 56.52 57.84 58.48 59.63 59.50 60.83 62.81 63.69 65.20 66.78 69.01
CCGT (WC)_CAN 38.24 47.71 46.66 47.63 47.72 48.68 49.62 49.58 50.68 51.91 53.25 53.93 55.10 55.57 56.43 58.50 59.55 61.27 64.14 66.38
CCGT (WC)_NVIC 37.31 46.63 46.45 47.35 47.37 48.25 51.00 50.97 52.22 54.15 55.35 55.94 56.62 57.46 58.23 60.22 61.22 62.83 65.61 67.76
CCGT (WC)_LV 31.47 40.61 40.36 41.25 41.39 42.27 45.02 45.09 46.35 48.27 49.48 50.07 50.74 51.69 52.47 54.45 55.45 57.06 59.84 61.99
CCGT (WC)_MEL 33.81 43.05 42.87 43.77 43.86 44.74 47.49 47.52 48.77 50.70 51.90 52.49 53.17 54.07 54.85 56.84 57.83 59.45 62.22 64.37
CCGT (WC)_CVIC 32.25 41.34 41.04 42.01 43.86 44.74 47.49 47.52 48.77 50.70 51.90 52.49 53.17 54.07 54.85 56.84 57.83 59.45 61.99 63.24
CCGT (WC)_NSA 39.58 50.66 50.20 51.29 53.08 54.09 56.95 56.91 58.25 60.27 61.57 62.25 63.03 63.86 64.74 66.83 67.90 69.65 72.31 73.69
CCGT (WC)_ADE 38.10 49.19 48.77 49.86 51.69 52.70 55.57 55.56 56.91 58.93 60.24 60.92 61.71 62.57 63.46 65.56 66.63 68.38 71.06 72.44
CCGT (WC)_SESA 35.44 46.55 46.20 47.31 49.21 50.24 53.13 53.19 54.56 56.60 57.92 58.63 59.44 60.35 61.26 63.38 64.47 66.24 68.93 70.33
CCGT (WC)_TAS 37.06 46.15 45.76 46.65 46.69 47.57 50.32 50.30 51.55 53.48 54.68 55.27 55.95 56.80 57.58 59.57 60.56 62.17 64.95 66.82
CCGT (AC)_NQ 38.15 47.12 44.43 48.22 48.17 49.02 49.85 49.68 50.34 51.02 51.81 52.47 53.34 53.02 53.67 54.51 55.34 56.09 58.00 58.81
CCGT (AC)_CQ 38.60 47.59 44.21 45.21 47.92 48.58 49.31 49.35 51.78 52.48 53.31 54.00 54.89 54.57 55.24 56.10 56.96 57.73 59.66 60.49
CCGT (AC)_SEQ 36.74 41.81 41.48 42.39 42.49 43.38 44.26 44.23 44.93 45.65 46.40 47.14 47.94 47.84 48.65 49.41 50.12 51.03 51.93 52.89
CCGT (AC)_SWQ 33.48 42.62 38.77 39.68 40.70 41.51 42.38 42.46 45.03 45.86 46.83 47.44 48.46 48.39 49.18 49.98 50.71 51.85 53.49 54.43
CCGT (AC)_NNSW 28.62 40.18 39.93 40.96 41.20 42.20 43.20 43.29 44.09 44.90 45.74 46.57 47.48 47.49 48.40 49.26 50.06 51.08 52.09 53.18

7/27/2019 ACIL Tasman April 2009
http://slidepdf.com/reader/full/acil-tasman-april-2009 86/104
79
Fue
lresource,newentryandgenerationcostsintheNEM
Newentranttechnologies
Technology & Zone2009-
102010-
112011-
122012-
132013-
142014-
152015-
162016-
172017-
182018-
192019-
202020-
212021-
222022-
232023-
242024-
252025-
262026-
272027-
282028-
29
CCGT (AC)_NCEN 41.20 49.90 49.04 49.73 49.75 50.71 51.65 51.54 52.64 53.88 55.23 55.91 57.08 56.98 58.34 60.35 61.27 62.81 64.41 66.68
CCGT (AC)_SWNSW 41.94 52.94 52.52 53.19 53.12 54.07 54.99 54.80 55.90 57.12 58.46 59.11 60.27 60.10 61.45 63.45 64.34 65.86 67.45 69.71
CCGT (AC)_CAN 38.72 48.32 47.22 48.21 48.26 49.23 50.18 50.11 51.22 52.46 53.82 54.51 55.69 56.13 57.00 59.09 60.16 61.89 64.79 67.06
CCGT (AC)_NVIC 37.78 47.22 47.01 47.92 47.91 48.80 51.58 51.51 52.78 54.73 55.94 56.54 57.22 58.04 58.82 60.83 61.83 63.47 66.28 68.45
CCGT (AC)_LV 31.86 41.12 40.84 41.74 41.85 42.74 45.53 45.57 46.84 48.79 50.00 50.60 51.28 52.21 52.99 55.00 56.00 57.64 60.45 62.61
CCGT (AC)_MEL 34.23 43.60 43.39 44.29 44.35 45.24 48.03 48.02 49.29 51.24 52.45 53.05 53.73 54.62 55.40 57.41 58.41 60.05 62.85 65.02
CCGT (AC)_CVIC 32.65 41.87 41.53 42.51 44.35 45.24 48.03 48.02 49.29 51.24 52.45 53.05 53.73 54.62 55.40 57.41 58.41 60.05 62.62 63.88
CCGT (AC)_NSA 40.07 51.31 50.81 51.91 53.69 54.70 57.60 57.52 58.88 60.92 62.23 62.92 63.71 64.50 65.39 67.51 68.59 70.35 73.05 74.44
CCGT (AC)_ADE 38.58 49.82 49.35 50.46 52.27 53.30 56.20 56.16 57.52 59.57 60.88 61.58 62.38 63.20 64.10 66.22 67.31 69.08 71.78 73.18
CCGT (AC)_SESA 35.88 47.15 46.75 47.88 49.77 50.81 53.74 53.76 55.14 57.21 58.55 59.26 60.08 60.96 61.88 64.02 65.13 66.91 69.63 71.05
CCGT (AC)_TAS 37.52 46.74 46.31 47.21 47.22 48.11 50.89 50.83 52.10 54.05 55.26 55.86 56.55 57.37 58.16 60.17 61.17 62.80 65.61 67.50
OCGT_NQ 84.84 96.81 93.00 100.50 101.97 100.54 101.94 103.21 104.33 102.62 103.95 105.04 106.50 104.74 105.76 107.16 108.61 106.96 110.37 111.63
OCGT_CQ 85.78 97.76 92.57 94.30 101.45 99.66 100.84 102.52 107.32 105.54 106.97 108.10 109.62 107.81 108.88 110.33 111.82 110.13 113.59 114.88OCGT_SEQ 81.92 86.12 86.96 88.52 90.08 89.09 90.58 91.93 93.14 91.83 93.07 94.32 95.66 94.42 95.76 97.01 98.22 97.17 98.63 100.19
OCGT_SWQ 75.13 87.74 81.39 82.94 86.34 85.29 86.76 88.27 93.35 92.25 93.94 94.93 96.71 95.52 96.83 98.16 99.40 98.76 101.65 103.17
OCGT_NNSW 65.04 82.27 83.18 84.93 86.68 85.99 87.66 89.18 90.54 89.46 90.86 92.25 93.77 92.74 94.24 95.66 97.00 96.16 97.79 99.55
OCGT_NCEN 91.19 101.83 101.90 102.95 104.59 103.26 104.84 106.26 108.26 107.50 109.92 111.01 113.05 111.63 114.02 117.72 119.29 118.83 121.61 125.64
OCGT_SWNSW 92.72 107.95 109.03 110.05 111.66 110.09 111.61 113.00 115.01 114.03 116.42 117.45 119.47 117.83 120.19 123.87 125.40 124.74 127.50 131.51
OCGT_CAN 86.03 98.65 98.15 99.82 101.48 100.26 101.86 103.30 105.31 104.66 107.10 108.20 110.27 109.93 111.34 115.20 117.08 117.05 122.34 126.37
OCGT_NVI C 84.08 96.99 98.29 99.84 101.40 100.07 105.42 106.96 109.34 110.02 112.21 113.17 114.27 114.67 115.95 119.69 121.46 121.17 126.33 130.21
OCGT_LV 71.77 84.69 85.60 87.16 88.71 87.77 93.12 94.66 97.04 98.09 100.27 101.23 102.33 103.07 104.36 108.09 109.87 109.90 115.05 118.94
OCGT_MEL 76.69 89.69 90.84 92.39 93.95 92.84 98.20 99.74 102.12 103.01 105.20 106.16 107.26 107.86 109.15 112.88 114.65 114.55 119.71 123.59
OCGT_CVIC 73.41 86.20 87.02 88.72 93.95 92.84 98.20 99.74 102.12 103.01 105.20 106.16 107.26 107.86 109.15 112.88 114.65 114.55 119.26 121.37
OCGT_NSA 88.85 104.39 105.22 107.11 112.50 111.02 116.54 118.24 120.75 121.22 123.54 124.63 125.88 126.09 127.54 131.42 133.31 132.86 137.74 140.05
OCGT_ADE 85.74 101.39 102.24 104.14 109.55 108.17 113.70 115.42 117.94 118.51 120.84 121.94 123.21 123.51 124.96 128.86 130.76 130.40 135.28 137.61
OCGT_SESA 80.13 96.00 96.90 98.84 104.30 103.11 108.69 110.45 113.01 113.76 116.14 117.28 118.59 119.05 120.55 124.48 126.42 126.21 131.13 133.49
OCGT_TAS 83.54 96.01 96.84 98.39 99.95 98.66 104.01 105.56 107.94 108.66 110.85 111.81 112.91 113.34 114.63 118.36 120.14 119.88 125.04 128.38
SC BLACK (WC)_NQ 15.76 33.01 33.59 34.23 35.63 37.02 38.42 39.73 40.88 42.03 43.26 44.40 45.71 45.90 47.19 48.47 49.51 50.95 52.32 53.84
SC BLACK (AC)_NQ 16.13 33.86 34.45 35.07 36.50 37.94 39.37 40.71 41.89 43.07 44.33 45.51 46.85 47.00 48.31 49.63 50.69 52.17 53.57 55.13
SC BLACK (AC)_CQ 12.63 30.19 30.62 31.17 32.45 33.72 35.00 36.19 37.21 38.25 39.37 40.41 41.63 41.77 43.02 44.28 45.28 46.71 48.05 49.55
SC BLACK (AC)_SWQ 13.10 30.73 31.26 31.88 33.24 34.60 35.96 37.23 38.34 39.45 40.65 41.77 43.05 43.23 44.48 45.74 46.75 48.17 49.51 51.05
SC BLACK (AC)_NNSW 13.64 32.15 32.64 33.24 34.61 35.97 37.34 38.63 39.73 40.83 42.03 43.15 44.44 44.59 45.86 47.14 48.15 49.59 50.96 52.49
SC BLACK (AC)_NCEN 11.69 30.23 30.74 31.41 32.80 34.20 35.59 36.90 38.03 39.16 40.37 41.51 42.83 43.04 44.33 45.63 46.66 48.13 49.51 51.06
SC BLACK (AC)_SWNSW 9.72 2 8.39 29.04 29.87 31.39 32.91 34.43 35.85 37.10 38.35 39.69 40.94 42.37 42.70 44.09 45.49 46.62 48.19 49.67 51.33
SC BROWN (WC)_LV 6.59 27.54 28.24 29.97 30.83 32.52 34.20 35.79 37.17 38.55 40.04 41.42 43.01 44.49 46.08 47.66 48.94 49.35 50.99 52.82SC BROWN (AC)_LV 6.82 28.70 29.44 31.25 32.09 33.85 35.61 37.26 38.70 40.15 41.69 43.14 44.79 46.34 47.99 49.64 50.98 51.32 53.03 54.93
USC BLACK (WC)_NQ 14.86 31.06 30.94 32.25 33.56 34.16 35.44 36.65 36.94 37.97 39.08 39.32 40.48 41.56 41.89 43.02 43.10 44.36 45.54 46.86
USC BLACK (AC)_NQ 15.25 31.92 31.77 33.12 34.47 35.05 36.37 37.61 37.87 38.93 40.07 40.28 41.47 42.58 42.88 44.05 44.09 45.38 46.59 47.94
USC BLACK (AC)_CQ 11.96 28.47 28.25 29.45 30.65 31.16 32.34 33.44 33.66 34.59 35.60 35.79 36.86 37.86 38.20 39.31 39.41 40.64 41.80 43.11
USC BLACK (AC)_SWQ 12.40 28.98 28.83 30.11 31.39 31.97 33.22 34.40 34.67 35.68 36.76 36.98 38.12 39.18 39.50 40.61 40.68 41.91 43.07 44.41
USC BLACK (AC)_NNSW 12.91 30.32 30.10 31.39 32.68 33.24 34.50 35.68 35.93 36.92 38.00 38.20 39.34 40.41 40.72 41.84 41.89 43.14 44.32 45.66
USC BLACK (AC)_NCEN 11.07 28.51 28.36 29.67 30.98 31.60 32.89 34.09 34.39 35.41 36.51 36.76 37.92 39.01 39.36 40.51 40.60 41.87 43.07 44.42
USC BLACK (AC)_SWNSW 9.23 26.79 26.79 28.22 29.65 30.42 31.81 33.13 33.56 34.69 35.89 36.26 37.52 38.70 39.15 40.38 40.57 41.92 43.21 44.64
USC BROWN (WC)_LV 6.18 25.54 25.53 27.09 28.65 29.46 30.98 32.41 33.66 34.91 36.25 36.59 37.98 39.29 39.72 41.08 41.20 42.70 44.11 45.69
USC BROWN (AC)_LV 6.37 26.49 26.44 28.06 29.68 30.48 32.06 33.54 34.83 36.13 37.52 37.82 39.26 40.61 41.01 42.41 42.49 44.04 45.49 47.12
Geothermal (HDR)_NNSW 2.00 2.00 2.00 2.00 2.00 2.00 2.00 2.00 2.00 2.00 2.00 2.00 2.00 2.00 2.00 2.00 2.00 2.00 2.00 2.00
Geothermal (HDR)_CV IC 2.00 2.00 2.00 2.00 2.00 2.00 2.00 2.00 2.00 2.00 2.00 2.00 2.00 2.00 2.00 2.00 2.00 2.00 2.00 2.00

7/27/2019 ACIL Tasman April 2009
http://slidepdf.com/reader/full/acil-tasman-april-2009 87/104
80
Fue
lresource,newentryandgenerationcostsintheNEM
Newentranttechnologies
Technology & Zone2009-
102010-
112011-
122012-
132013-
142014-
152015-
162016-
172017-
182018-
192019-
202020-
212021-
222022-
232023-
242024-
252025-
262026-
272027-
282028-
29
Geothermal (HDR)_NS A 2.00 2.00 2.00 2.00 2.00 2.00 2.00 2.00 2.00 2.00 2.00 2.00 2.00 2.00 2.00 2.00 2.00 2.00 2.00 2.00
Geothermal (HDR)_ADE 2.00 2.00 2.00 2.00 2.00 2.00 2.00 2.00 2.00 2.00 2.00 2.00 2.00 2.00 2.00 2.00 2.00 2.00 2.00 2.00
IGCC BLACK_NQ 17.23 33.47 34.02 34.61 35.92 37.23 38.54 39.78 39.99 41.04 42.17 43.22 44.43 44.60 45.78 46.96 47.92 49.24 49.45 50.82
IGCC BLACK_CQ 14.02 30.11 30.51 31.03 32.20 33.37 34.53 35.63 35.79 36.72 37.73 38.66 39.75 39.92 41.04 42.17 43.07 44.34 44.61 45.93
IGCC BLACK_SWQ 14.45 30.61 31.09 31.68 32.92 34.17 35.42 36.58 36.81 37.80 38.88 39.88 41.03 41.22 42.35 43.48 44.38 45.66 45.90 47.25
IGCC BLACK_NNSW 14.95 31.91 32.36 32.92 34.18 35.43 36.69 37.86 38.05 39.04 40.11 41.11 42.27 42.45 43.59 44.73 45.64 46.93 47.16 48.51
IGCC BLACK_NCEN 13.16 30.15 30.62 31.25 32.53 33.80 35.08 36.28 36.53 37.54 38.63 39.65 40.83 41.06 42.22 43.38 44.30 45.62 45.89 47.26
IGCC BLACK_SWNSW 11.36 28.47 29.05 29.84 31.23 32.62 34.01 35.32 35.70 36.82 38.02 39.14 40.42 40.75 42.00 43.25 44.27 45.67 46.04 47.49
IGCC BLACK CCS_NQ 20.19 21.52 21.55 21.14 21.23 21.33 21.43 21.52 21.60 21.67 20.33 20.40 20.48 20.56 20.64 19.88 19.94 20.03 19.71 19.81
IGCC BLACK CCS_CQ 16.44 17.59 17.45 16.98 16.91 16.84 16.77 16.69 16.61 16.54 15.47 15.41 15.36 15.31 15.34 14.78 14.79 14.82 14.59 14.63
IGCC BLACK CCS_SWQ 16.94 18.17 18.12 17.73 17.75 17.77 17.79 17.81 17.81 17.82 16.73 16.74 16.76 16.78 16.80 16.18 16.18 16.22 15.95 16.02
IGCC BLACK CCS_NNSW 17.52 20.04 19.97 19.56 19.62 19.67 19.73 19.78 19.80 19.83 18.59 18.62 18.68 18.73 18.80 18.11 18.13 18.22 17.94 18.04
IGCC BLACK CCS_NCEN 15.43 17.98 17.94 17.61 17.70 17.78 17.87 17.94 17.99 18.04 16.97 17.03 17.11 17.18 17.26 16.67 16.72 16.82 16.60 16.71IGCC BLACK CCS_SWNSW 13.33 16.01 16.11 15.97 16.19 16.41 16.62 16.83 17.01 17.19 16.30 16.47 16.66 16.83 17.02 16.54 16.68 16.88 16.75 16.95
IGCC BROWN_LV 7.74 24.05 24.60 25.42 26.73 28.05 29.37 30.61 31.04 32.09 33.23 34.29 35.50 35.88 37.06 38.25 39.21 40.54 40.95 42.32
IGCC BROWN CCS_LV 9.09 10.09 10.12 10.01 10.08 10.15 10.22 10.29 10.34 10.40 9.95 10.00 10.06 10.11 10.17 9.92 9.97 10.03 9.94 10.01
USC CCS BLACK (WC)_NQ 16.87 18.11 17.66 17.75 17.84 17.94 18.03 16.79 16.86 16.92 16.99 17.06 16.35 16.42 16.50 16.57 16.63 16.71 16.06 16.15
USC CCS BLACK (AC)_NQ 17.60 18.91 18.41 18.50 18.60 18.69 18.79 17.41 17.48 17.55 17.63 17.70 16.91 16.98 17.06 17.14 17.20 17.29 16.57 16.66
USC CCS BLACK (AC)_CQ 13.91 15.04 14.49 14.42 14.35 14.28 14.21 13.07 13.00 12.93 12.88 12.82 12.18 12.13 12.15 12.17 12.18 12.21 11.71 11.74
USC CCS BLACK (AC)_SWQ 14.40 15.61 15.14 15.15 15.17 15.19 15.21 14.07 14.08 14.09 14.10 14.11 13.47 13.48 13.51 13.53 13.54 13.57 13.00 13.07
USC CCS BLACK (AC)_NNSW 14.97 17.45 16.89 16.95 17.01 17.06 17.12 15.85 15.87 15.89 15.92 15.96 15.25 15.29 15.35 15.41 15.44 15.52 14.89 14.98
USC CCS BLACK (AC)_NCEN 12.92 15.43 14.95 15.04 15.12 15.20 15.29 14.20 14.24 14.28 14.34 14.40 13.79 13.86 13.93 14.01 14.06 14.16 13.61 13.72
USC CCS BLACK (AC)_SWNSW 10.84 13.49 13.21 13.42 13.64 13.85 14.07 13.20 13.36 13.52 13.69 13.85 13.37 13.53 13.71 13.88 14.02 14.22 13.76 13.95
USC CCS BROWN (WC)_LV 7.11 8.17 7.98 8. 06 8.13 8.21 8. 28 7.76 7.81 7.8 7 7.92 7.98 7.8 6 7.91 7.98 8.04 8.09 8.1 6 7.87 7.94
USC CCS BROWN (AC)_LV 7.20 8.29 8.09 8. 17 8.24 8.32 8. 39 7.84 7.89 7.9 5 8.01 8.06 7.9 3 7.99 8.05 8.12 8.17 8.2 4 7.93 8.00
Nuclear_NQ 9.94 10.28 10.29 10.32 10.35 10.38 10.41 10.43 10.46 10.48 10.50 10.53 10.55 10.58 10.61 10.63 10.66 10.69 10.71 10.75
Nuclear_CQ 9.94 10.28 10.29 10.32 10.35 10.38 10.41 10.43 10.46 10.48 10.50 10.53 10.55 10.58 10.61 10.63 10.66 10.69 10.71 10.75
Nuclear_SWQ 9.94 10.28 10.29 10.32 10.35 10.38 10.41 10.43 10.46 10.48 10.50 10.53 10.55 10.58 10.61 10.63 10.66 10.69 10.71 10.75
Nuclear_NNSW 9.94 10.28 10.29 10.32 10.35 10.38 10.41 10.43 10.46 10.48 10.50 10.53 10.55 10.58 10.61 10.63 10.66 10.69 10.71 10.75
Nuclear_NCEN 9.94 10.28 10.29 10.32 10.35 10.38 10.41 10.43 10.46 10.48 10.50 10.53 10.55 10.58 10.61 10.63 10.66 10.69 10.71 10.75
Nuclear_SWNSW 9.94 10.28 10.29 10.32 10.35 10.38 10.41 10.43 10.46 10.48 10.50 10.53 10.55 10.58 10.61 10.63 10.66 10.69 10.71 10.75
Nuclear_CAN 9.94 10.28 10.29 10.32 10.35 10.38 10.41 10.43 10.46 10.48 10.50 10.53 10.55 10.58 10.61 10.63 10.66 10.69 10.71 10.75
Nuclear_NVI C 9.94 10.28 10.29 10.32 10.35 10.38 10.41 10.43 10.46 10.48 10.50 10.53 10.55 10.58 10.61 10.63 10.66 10.69 10.71 10.75
Nuclear_LV 9.94 10.28 10.29 10.32 10.35 10.38 10.41 10.43 10.46 10.48 10.50 10.53 10.55 10.58 10.61 10.63 10.66 10.69 10.71 10.75
Nuclear_CVI C 9.94 10.28 10.29 10.32 10.35 10.38 10.41 10.43 10.46 10.48 10.50 10.53 10.55 10.58 10.61 10.63 10.66 10.69 10.71 10.75Nuclear_NSA 9.94 10.28 10.29 10.32 10.35 10.38 10.41 10.43 10.46 10.48 10.50 10.53 10.55 10.58 10.61 10.63 10.66 10.69 10.71 10.75
Nuclear_SESA 9.94 10.28 10.29 10.32 10.35 10.38 10.41 10.43 10.46 10.48 10.50 10.53 10.55 10.58 10.61 10.63 10.66 10.69 10.71 10.75
Note: WC denotes water cooled; AC denotes air cooled. CCGT = combined cycle gas turbine; OCGT = open cycle gas turbine; SC = supercritical coal; USC = ultra-supercritical coal; IGCC =
integrated gasification combined cycle; CCS = carbon capture and storage. SRMC includes fuel, VOM and carbon costs. Real 2009-10 $/MWh generated.
Data source: ACIL Tasman analysis

7/27/2019 ACIL Tasman April 2009
http://slidepdf.com/reader/full/acil-tasman-april-2009 88/104
Fuel resource, new entry and generation costs in the NEM
New entrant technologies 81
4.4 LRMC for new entrant technologies This section provides LRMC for each technology type by NEM zone. These
LRMC are presented in real 2009-10 $/MWh and assume a capacity factor of
85% for all stations (for comparability).
The LRMC figures for plants that employ CCS technology include all costs
associated with the capture, transport and storage of CO2. Figure 4 shows the
implied costs of CCS relative to the same non-CCS equipped plant (defined as
being the difference in LRMC in the absence of carbon costs). Costs are
shown for post-combustion capture (based on ultra-supercritical technology)
and pre-combustion capture (based on IGCC technology). All up CCS costsfor IGCC technology are significantly lower than for USC plant (a result of a
much simpler capture task), however capital costs for IGCC technology itself
is significantly more expensive than a comparable ultra-supercritical unit.
Figure 4 Implied cost of capture, transport and storage of CO2
Note: Based on 85% load factor
Data source: ACIL Tasman analysis.
0
10
20
30
40
50
60
2 0 0 9 - 1 0
2 0 1 0 - 1 1
2 0 1 1 - 1 2
2 0 1 2 - 1 3
2 0 1 3 - 1 4
2 0 1 4 - 1 5
2 0 1 5 - 1 6
2 0 1 6 - 1 7
2 0 1 7 - 1 8
2 0 1 8 - 1 9
2 0 1 9 - 2 0
2 0 2 0 - 2 1
2 0 2 1 - 2 2
2 0 2 2 - 2 3
2 0 2 3 - 2 4
2 0 2 4 - 2 5
2 0 2 5 - 2 6
2 0 2 6 - 2 7
2 0 2 7 - 2 8
2 0 2 8 - 2 9
R e a l 2 0 0 9 - 1 0 $
/ M W h
Cost o f CCS (based on USC) Cost o f CCS (based on IGCC)

7/27/2019 ACIL Tasman April 2009
http://slidepdf.com/reader/full/acil-tasman-april-2009 89/104
82
Fue
lresource,newentryandgenerationcostsintheNEM
Newentranttechnologies
Table 52 LRMC for new entrant technologies by NEM zone excluding carbon costs (Real 2009-10 $/MWh as generated)
Technology & Zone2009-
102010-
112011-
122012-
132013-
142014-
152015-
162016-
172017-
182018-
192019-
202020-
212021-
222022-
232023-
242024-
252025-
262026-
272027-
282028-
29
CCGT (WC)_NQ 60.24 58.79 56.00 58.70 57.92 57.99 58.04 57.39 57.39 57.41 57.50 57.50 57.62 56.94 56.86 56.96 57.19 57.13 58.25 58.21
CCGT (WC)_CQ 60.68 59.26 55.79 55.73 57.68 57.56 57.50 57.06 58.81 58.85 58.98 59.00 59.15 58.46 58.41 58.54 58.79 58.75 59.90 59.87
CCGT (WC)_SEQ 58.85 53.56 53.09 52.94 52.31 52.42 52.51 52.00 52.04 52.10 52.14 52.22 52.28 51.80 51.88 51.91 52.02 52.12 52.24 52.36
CCGT (WC)_SWQ 55.63 54.36 50.41 50.27 50.55 50.57 50.66 50.25 52.14 52.31 52.57 52.52 52.80 52.35 52.41 52.48 52.61 52.93 53.79 53.88
CCGT (WC)_NNSW 50.84 50.55 50.14 49.99 49.41 49.52 49.61 49.15 49.19 49.25 49.30 49.37 49.43 49.01 49.09 49.12 49.23 49.32 49.45 49.56
CCGT (WC)_NCEN 63.25 60.13 59.13 58.65 57.86 57.93 57.97 57.31 57.65 58.13 58.67 58.60 58.92 58.41 58.92 60.09 60.32 60.92 61.64 62.92
CCGT (WC)_SWNSW 63.97 63.13 62.56 62.06 61.20 61.25 61.26 60.53 60.88 61.34 61.87 61.77 62.08 61.49 62.00 63.15 63.35 63.94 64.65 65.91
CCGT (WC)_CAN 60.80 58.58 57.33 57.15 56.39 56.46 56.52 55.89 56.25 56.73 57.29 57.22 57.55 57.56 57.59 58.84 59.21 60.01 62.01 63.29
CCGT (WC)_NVIC 59.88 58.83 58.48 58.33 57.59 57.70 59.66 59.11 59.71 60.98 61.48 61.41 61.35 61.79 61.83 63.10 63.49 64.29 66.31 67.60
CCGT (WC)_LV 54.03 52.81 52.39 52.23 51.61 51.72 53.68 53.23 53.83 55.10 55.61 55.54 55.48 56.02 56.06 57.33 57.72 58.53 60.54 61.83
CCGT (WC)_MEL 56.37 55.26 54.91 54.75 54.08 54.18 56.15 55.66 56.26 57.53 58.03 57.97 57.90 58.40 58.45 59.71 60.10 60.91 62.92 64.22
CCGT (WC)_CVIC 54.81 53.55 53.07 52.99 54.08 54.18 56.15 55.66 56.26 57.53 58.03 57.97 57.90 58.40 58.45 59.71 60.10 60.91 62.69 63.08
CCGT (WC)_NSA 62.14 60.82 60.16 60.03 60.94 61.00 62.92 62.26 62.82 64.04 64.50 64.39 64.28 64.62 64.63 65.85 66.19 66.96 68.70 69.06
CCGT (WC)_ADE 60.66 59.36 58.73 58.60 59.55 59.62 61.54 60.92 61.47 62.70 63.17 63.07 62.96 63.34 63.35 64.57 64.93 65.70 67.45 67.81
CCGT (WC)_SESA 58.00 56.72 56.16 56.06 57.07 57.16 59.10 58.54 59.12 60.37 60.86 60.77 60.69 61.12 61.15 62.39 62.77 63.56 65.32 65.70
CCGT (WC)_TAS 59.62 58.36 57.79 57.63 56.91 57.01 58.98 58.44 59.04 60.31 60.81 60.74 60.68 61.13 61.17 62.44 62.83 63.64 65.65 66.67
CCGT (AC)_NQ 61.47 59.98 57.12 59.86 59.05 59.12 59.18 58.49 58.50 58.53 58.62 58.63 58.75 58.05 57.97 58.08 58.32 58.26 59.40 59.36
CCGT (AC)_CQ 61.92 60.45 56.91 56.85 58.80 58.69 58.63 58.16 59.94 59.98 60.12 60.15 60.30 59.59 59.54 59.67 59.93 59.90 61.06 61.05
CCGT (AC)_SEQ 60.07 54.67 54.18 54.03 53.37 53.49 53.58 53.05 53.09 53.16 53.21 53.29 53.36 52.86 52.94 52.98 53.10 53.20 53.33 53.45
CCGT (AC)_SWQ 56.80 55.48 51.47 51.32 51.58 51.61 51.70 51.28 53.20 53.37 53.64 53.60 53.88 53.41 53.48 53.56 53.69 54.02 54.89 54.99
CCGT (AC)_NNSW 51.95 51.62 51.19 51.04 50.43 50.55 50.65 50.17 50.21 50.28 50.33 50.41 50.48 50.03 50.12 50.15 50.27 50.37 50.50 50.62
CCGT (AC)_NCEN 64.53 61.34 60.30 59.81 58.98 59.06 59.10 58.42 58.77 59.26 59.81 59.74 60.08 59.53 60.06 61.24 61.48 62.09 62.82 64.12
CCGT (AC)_SWNSW 65.26 64.37 63.77 63.26 62.36 62.42 62.44 61.67 62.03 62.50 63.05 62.95 63.27 62.65 63.17 64.34 64.55 65.15 65.87 67.15
CCGT (AC)_CAN 62.05 59.76 58.47 58.28 57.50 57.58 57.64 56.98 57.35 57.84 58.41 58.35 58.69 58.68 58.72 59.98 60.37 61.17 63.20 64.50
CCGT (AC)_NVIC 61.11 60.02 59.64 59.48 58.71 58.82 60.82 60.24 60.85 62.13 62.65 62.59 62.53 62.95 63.00 64.28 64.68 65.50 67.54 68.86
CCGT (AC)_LV 55.19 53.91 53.47 53.31 52.66 52.77 54.76 54.30 54.90 56.19 56.71 56.65 56.59 57.12 57.17 58.45 58.85 59.67 61.71 63.03
CCGT (AC)_MEL 57.56 56.39 56.02 55.86 55.16 55.27 57.26 56.75 57.36 58.65 59.16 59.10 59.04 59.52 59.58 60.86 61.26 62.08 64.12 65.44
CCGT (AC)_CVIC 55.98 54.66 54.16 54.07 55.16 55.27 57.26 56.75 57.36 58.65 59.16 59.10 59.04 59.52 59.58 60.86 61.26 62.08 63.89 64.29
CCGT (AC)_NSA 63.40 62.04 61.34 61.21 62.10 62.17 64.12 63.43 63.99 65.23 65.70 65.60 65.49 65.82 65.83 67.06 67.42 68.20 69.97 70.33
CCGT (AC)_ADE 61.91 60.55 59.89 59.76 60.69 60.77 62.72 62.06 62.63 63.88 64.36 64.26 64.16 64.52 64.53 65.78 66.14 66.93 68.70 69.07
CCGT (AC)_SESA 59.21 57.87 57.29 57.18 58.19 58.28 60.25 59.66 60.25 61.52 62.02 61.94 61.86 62.28 62.31 63.57 63.96 64.76 66.55 66.94
CCGT (AC)_TAS 60.85 59.53 58.94 58.78 58.02 58.13 60.13 59.56 60.17 61.46 61.97 61.91 61.85 62.28 62.34 63.62 64.02 64.84 66.88 67.91
OCGT_NQ 99.97 96.26 91.92 97.97 98.05 95.94 96.10 96.20 96.29 94.22 94.48 94.57 94.89 92.80 92.73 93.01 93.56 91.49 93.77 93.75
OCGT_CQ 100.91 97.22 91.49 91.78 97.53 95.05 95.00 95.52 99.28 97.14 97.49 97.63 98.00 95.88 95.85 96.18 96.77 94.65 96.98 97.01
OCGT_SEQ 97.06 85.57 85.87 85.99 86.15 84.49 84.74 84.92 85.10 83.43 83.60 83.85 84.05 82.49 82.73 82.87 83.17 81.70 82.02 82.32
OCGT_SWQ 90.26 87.20 80.30 80.41 82.41 80.68 80.92 81.26 85.31 83.85 84.47 84.46 85.09 83.58 83.80 84.01 84.35 83.28 85.04 85.30
OCGT_NNSW 80.17 79.43 79.73 79.84 80.01 78.53 78.78 78.96 79.13 77.65 77.81 78.06 78.26 76.87 77.11 77.25 77.55 76.23 76.56 76.86
OCGT_NCEN 106.32 98.99 98.44 97.86 97.91 95.80 95.96 96.04 96.85 95.69 96.87 96.82 97.55 95.76 96.88 99.31 99.84 98.90 100.38 102.96
OCGT_SWNSW 107.85 105.11 105.58 104.96 104.98 102.63 102.73 102.78 103.60 102.21 103.37 103.26 103.96 101.97 103.06 105.46 105.95 104.81 106.26 108.82
OCGT_CAN 101.16 95.81 94.70 94.73 94.81 92.80 92.97 93.08 93.90 92.85 94.05 94.01 94.76 94.06 94.21 96.79 97.63 97.12 101.11 103.69
OCGT_NVIC 99.22 96.34 97.10 97.19 97.35 95.33 99.44 99.81 101.14 101.47 102.57 102.53 102.48 102.55 102.74 105.35 106.22 105.49 109.51 112.12

7/27/2019 ACIL Tasman April 2009
http://slidepdf.com/reader/full/acil-tasman-april-2009 90/104
83
Fue
lresource,newentryandgenerationcostsintheNEM
Newentranttechnologies
Technology & Zone2009-
102010-
112011-
122012-
132013-
142014-
152015-
162016-
172017-
182018-
192019-
202020-
212021-
222022-
232023-
242024-
252025-
262026-
272027-
282028-
29
OCGT_LV 86.90 84.04 84.41 84.51 84.67 83.03 87.14 87.51 88.84 89.53 90.63 90.59 90.54 90.96 91.14 93.75 94.62 94.22 98.23 100.84
OCGT_MEL 91.83 89.04 89.65 89.75 89.90 88.11 92.22 92.59 93.92 94.46 95.56 95.52 95.47 95.75 95.93 98.54 99.41 98.87 102.89 105.50
OCGT_CVIC 88.54 85.55 85.84 86.08 89.90 88.11 92.22 92.59 93.92 94.46 95.56 95.52 95.47 95.75 95.93 98.54 99.41 98.87 102.44 103.28
OCGT_NSA 103.98 100.40 100.59 100.73 104.45 102.13 106.14 106.42 107.66 107.70 108.70 108.58 108.43 108.26 108.35 110.88 111.66 110.71 114.19 114.96
OCGT_ADE 100.87 97.40 97.60 97.76 101.49 99.28 103.30 103.59 104.85 104.98 106.00 105.89 105.76 105.67 105.78 108.32 109.11 108.24 111.74 112.52
OCGT_SESA 95.26 92.02 92.26 92.46 96.24 94.22 98.29 98.62 99.92 100.24 101.30 101.23 101.13 101.22 101.36 103.94 104.77 104.06 107.59 108.40
OCGT_TAS 98.67 95.36 95.65 95.75 95.90 93.93 98.04 98.41 99.74 100.11 101.21 101.17 101.11 101.23 101.41 104.02 104.89 104.21 108.22 110.29
SC BLACK (WC)_NQ 55.15 54.01 53.43 52.54 52.33 52.12 52.07 52.00 51.93 51.86 51.78 51.71 51.63 51.24 51.16 51.09 51.01 50.94 50.86 50.79
SC BLACK (AC)_NQ 56.29 55.12 54.54 53.62 53.41 53.20 53.15 53.09 53.03 52.96 52.89 52.82 52.76 52.34 52.27 52.21 52.14 52.07 52.00 51.93
SC BLACK (AC)_CQ 52.78 51.45 50.71 49.72 49.35 48.99 48.78 48.57 48.35 48.14 47.94 47.73 47.53 47.11 46.98 46.86 46.73 46.60 46.48 46.35
SC BLACK (AC)_SWQ 53.25 52.00 51.34 50.42 50.14 49.87 49.74 49.61 49.48 49.34 49.21 49.08 48.95 48.57 48.45 48.32 48.19 48.07 47.94 47.85SC BLACK (AC)_NNSW 53.79 52.49 51.76 50.76 50.42 50.07 49.88 49.69 49.49 49.28 49.08 48.89 48.70 48.27 48.09 47.91 47.73 47.55 47.37 47.19
SC BLACK (AC)_NCEN 51.85 50.56 49.86 48.94 48.62 48.30 48.13 47.96 47.78 47.61 47.43 47.26 47.09 46.72 46.56 46.40 46.24 46.08 45.92 45.76
SC BLACK (AC)_SWNSW 49.88 48.73 48.15 47.40 47.20 47.01 46.97 46.92 46.86 46.81 46.75 46.69 46.63 46.37 46.32 46.26 46.20 46.14 46.08 46.02
SC BROWN (WC)_LV 50.22 48.96 48.33 47.72 47.33 47.10 47.04 46.96 46.88 46.80 46.72 46.64 46.55 46.47 46.39 46.30 46.22 45.99 45.91 45.82
SC BROWN (AC)_LV 51.29 50.00 49.36 48.74 48.34 48.12 48.06 47.99 47.92 47.84 47.77 47.69 47.61 47.53 47.46 47.38 47.30 47.07 46.99 46.92
USC BLACK (WC)_NQ 56.56 55.34 54.43 53.84 53.62 53.11 53.05 52.99 52.64 52.56 52.48 52.15 52.07 51.99 51.66 51.58 51.27 51.19 51.11 51.03
USC BLACK (AC)_NQ 57.77 56.52 55.58 54.98 54.76 54.24 54.19 54.13 53.77 53.69 53.62 53.27 53.20 53.13 52.79 52.72 52.40 52.32 52.25 52.18
USC BLACK (AC)_CQ 54.47 53.07 52.06 51.31 50.94 50.36 50.16 49.96 49.55 49.35 49.16 48.78 48.59 48.41 48.12 47.99 47.71 47.59 47.47 47.35
USC BLACK (AC)_SWQ 54.91 53.58 52.64 51.97 51.69 51.17 51.05 50.92 50.56 50.44 50.31 49.98 49.85 49.73 49.41 49.28 48.98 48.86 48.74 48.65
USC BLACK (AC)_NNSW 55.42 54.04 53.02 52.29 51.94 51.36 51.18 50.99 50.57 50.38 50.19 49.81 49.63 49.45 49.09 48.92 48.57 48.41 48.24 48.07
USC BLACK (AC)_NCEN 53.59 52.23 51.28 50.58 50.25 49.72 49.56 49.40 49.04 48.87 48.70 48.37 48.21 48.05 47.74 47.58 47.28 47.13 46.98 46.84
USC BLACK (AC)_SWNSW 51.74 50.51 49.71 49.12 48.92 48.53 48.49 48.44 48.21 48.15 48.09 47.86 47.80 47.74 47.52 47.46 47.25 47.19 47.13 47.06
USC BROWN (WC)_LV 52.34 51.01 50.19 49.54 49.30 48.93 48.86 48.79 48.70 48.62 48.53 48.33 48.24 48.15 47.96 47.87 47.68 47.59 47.50 47.42
USC BROWN (AC)_LV 53.43 52.06 51.23 50.57 50.33 49.95 49.89 49.82 49.74 49.66 49.59 49.38 49.30 49.22 49.02 48.94 48.75 48.67 48.59 48.51
Geothermal (HDR)_NNSW 86.06 86.64 85.62 84.60 83.61 82.62 81.66 80.69 79.74 78.80 77.87 76.97 76.06 75.18 74.30 73.42 72.57 71.72 70.89 70.07
Geothermal (HDR)_CVIC 86.06 86.64 85.62 84.60 83.61 82.62 81.66 80.69 79.74 78.80 77.87 76.97 76.06 75.18 74.30 73.42 72.57 71.72 70.89 70.07
Geothermal (HDR)_NSA 86.06 86.64 85.62 84.60 83.61 82.62 81.66 80.69 79.74 78.80 77.87 76.97 76.06 75.18 74.30 73.42 72.57 71.72 70.89 70.07
Geothermal (HDR)_ADE 86.06 86.64 85.62 84.60 83.61 82.62 81.66 80.69 79.74 78.80 77.87 76.97 76.06 75.18 74.30 73.42 72.57 71.72 70.89 70.07
IGCC BLACK_NQ 78.64 75.33 73.00 70.43 68.75 67.09 65.66 64.21 62.46 61.01 60.59 60.51 60.43 60.06 59.98 59.90 59.82 59.74 59.38 59.30
IGCC BLACK_CQ 75.43 71.96 69.49 66.86 65.03 63.23 61.65 60.06 58.26 56.70 56.15 55.95 55.75 55.37 55.24 55.10 54.97 54.84 54.54 54.41
IGCC BLACK_SWQ 75.86 72.46 70.07 67.51 65.76 64.03 62.53 61.02 59.28 57.77 57.30 57.16 57.03 56.68 56.55 56.42 56.28 56.15 55.82 55.72
IGCC BLACK_NNSW 76.36 72.91 70.45 67.82 66.01 64.22 62.66 61.09 59.28 57.72 57.18 56.99 56.81 56.41 56.23 56.05 55.86 55.69 55.32 55.14IGCC BLACK_NCEN 74.57 71.15 68.71 66.14 64.36 62.59 61.06 59.51 57.76 56.22 55.70 55.53 55.36 55.02 54.86 54.69 54.53 54.37 54.05 53.89
IGCC BLACK_SWNSW 72.77 69.46 67.15 64.73 63.06 61.41 59.99 58.55 56.94 55.50 55.09 55.02 54.95 54.71 54.64 54.57 54.50 54.43 54.19 54.12
IGCC BLACK CCS_NQ 104.11 99.63 96.49 93.00 90.73 88.49 86.56 84.61 82.66 80.71 78.89 78.60 78.31 78.02 77.73 76.71 76.42 76.13 75.51 75.22
IGCC BLACK CCS_CQ 100.35 95.70 92.38 88.84 86.41 84.00 81.90 79.79 77.67 75.57 74.03 73.61 73.19 72.77 72.42 71.62 71.27 70.93 70.38 70.04
IGCC BLACK CCS_SWQ 100.86 96.28 93.06 89.60 87.25 84.93 82.92 80.90 78.87 76.86 75.29 74.94 74.58 74.23 73.89 73.01 72.67 72.33 71.75 71.44
IGCC BLACK CCS_NNSW 101.44 96.80 93.51 89.96 87.54 85.15 83.07 80.98 78.88 76.79 75.16 74.75 74.34 73.93 73.53 72.62 72.22 71.83 71.21 70.83
IGCC BLACK CCS_NCEN 99.35 94.74 91.48 88.01 85.62 83.26 81.21 79.14 77.07 75.00 73.54 73.15 72.76 72.38 71.99 71.18 70.81 70.43 69.87 69.50
IGCC BLACK CCS_SWNSW 97.24 92.78 89.65 86.37 84.12 81.89 79.96 78.03 76.09 74.15 72.87 72.59 72.31 72.03 71.75 71.05 70.77 70.49 70.02 69.74
IGCC BROWN_LV 69.15 65.83 63.51 61.17 59.49 57.83 56.39 54.95 53.41 51.96 51.54 51.46 51.38 51.21 51.13 51.05 50.97 50.89 50.73 50.65
IGCC BROWN CCS_LV 93.01 88.53 85.39 82.23 79.96 77.72 75.78 73.84 71.88 69.94 68.99 68.70 68.41 68.12 67.83 67.32 67.03 66.74 66.35 66.06
USC CCS BLACK (WC)_NQ 84.01 81.73 79.98 78.72 78.05 77.39 76.98 75.37 74.94 74.50 74.07 73.64 72.52 72.09 71.66 71.23 70.81 70.38 69.34 68.92
USC CCS BLACK (AC)_NQ 86.06 83.72 81.90 80.63 79.95 79.29 78.88 77.15 76.71 76.28 75.85 75.42 74.24 73.81 73.38 72.95 72.53 72.10 71.01 70.58

7/27/2019 ACIL Tasman April 2009
http://slidepdf.com/reader/full/acil-tasman-april-2009 91/104
84
Fue
lresource,newentryandgenerationcostsintheNEM
Newentranttechnologies
Technology & Zone2009-
102010-
112011-
122012-
132013-
142014-
152015-
162016-
172017-
182018-
192019-
202020-
212021-
222022-
232023-
242024-
252025-
262026-
272027-
282028-
29
USC CCS BLACK (AC)_CQ 82.36 79.85 77.98 76.54 75.70 74.87 74.30 72.81 72.23 71.66 71.10 70.54 69.50 68.95 68.47 67.99 67.51 67.03 66.14 65.67
USC CCS BLACK (AC)_SWQ 82.85 80.43 78.63 77.28 76.53 75.79 75.30 73.81 73.31 72.82 72.33 71.83 70.79 70.31 69.83 69.34 68.87 68.39 67.43 66.99
USC CCS BLACK (AC)_NNSW 83.43 80.94 79.06 77.64 76.82 76.00 75.45 73.88 73.32 72.76 72.20 71.65 70.56 70.03 69.49 68.96 68.43 67.90 66.93 66.41
USC CCS BLACK (AC)_NCEN 81.37 78.91 77.12 75.72 74.93 74.14 73.62 72.23 71.69 71.15 70.61 70.09 69.11 68.59 68.07 67.56 67.05 66.54 65.65 65.15
USC CCS BLACK (AC)_SWNSW 79.30 76.97 75.37 74.11 73.45 72.79 72.39 71.23 70.81 70.39 69.96 69.54 68.69 68.27 67.85 67.43 67.02 66.60 65.80 65.38
USC CCS BROWN (WC)_LV 82.94 79.97 77.35 75.94 74.59 73.87 73.16 72.26 71.80 71.34 70.87 70.40 69.81 69.34 68.88 68.42 67.96 67.50 66.80 66.34
USC CCS BROWN (AC)_LV 84.51 81.47 78.78 77.36 75.99 75.27 74.55 73.63 73.17 72.71 72.24 71.78 71.18 70.71 70.25 69.79 69.33 68.88 68.17 67.71
Nuclear_NQ 101.41 101.01 100.62 100.24 99.85 99.47 99.09 98.71 98.33 97.95 97.58 97.21 96.84 96.47 96.10 95.73 91.74 89.81 87.95 86.86
Nuclear_CQ 101.41 101.01 100.62 100.24 99.85 99.47 99.09 98.71 98.33 97.95 97.58 97.21 96.84 96.47 96.10 95.73 91.74 89.81 87.95 86.86
Nuclear_SWQ 101.41 101.01 100.62 100.24 99.85 99.47 99.09 98.71 98.33 97.95 97.58 97.21 96.84 96.47 96.10 95.73 91.74 89.81 87.95 86.86
Nuclear_NNSW 101.41 101.01 100.62 100.24 99.85 99.47 99.09 98.71 98.33 97.95 97.58 97.21 96.84 96.47 96.10 95.73 91.74 89.81 87.95 86.86Nuclear_NCEN 101.41 101.01 100.62 100.24 99.85 99.47 99.09 98.71 98.33 97.95 97.58 97.21 96.84 96.47 96.10 95.73 91.74 89.81 87.95 86.86
Nuclear_SWNSW 101.41 101.01 100.62 100.24 99.85 99.47 99.09 98.71 98.33 97.95 97.58 97.21 96.84 96.47 96.10 95.73 91.74 89.81 87.95 86.86
Nuclear_CAN 101.41 101.01 100.62 100.24 99.85 99.47 99.09 98.71 98.33 97.95 97.58 97.21 96.84 96.47 96.10 95.73 91.74 89.81 87.95 86.86
Nuclear_NVI C 101.41 101.01 100.62 100.24 99.85 99.47 99.09 98.71 98.33 97.95 97.58 97.21 96.84 96.47 96.10 95.73 91.74 89.81 87.95 86.86
Nuclear_LV 101.41 101.01 100.62 100.24 99.85 99.47 99.09 98.71 98.33 97.95 97.58 97.21 96.84 96.47 96.10 95.73 91.74 89.81 87.95 86.86
Nuclear_CVI C 101.41 101.01 100.62 100.24 99.85 99.47 99.09 98.71 98.33 97.95 97.58 97.21 96.84 96.47 96.10 95.73 91.74 89.81 87.95 86.86
Nuclear_NSA 101.41 101.01 100.62 100.24 99.85 99.47 99.09 98.71 98.33 97.95 97.58 97.21 96.84 96.47 96.10 95.73 91.74 89.81 87.95 86.86
Nuclear_SESA 101.41 101.01 100.62 100.24 99.85 99.47 99.09 98.71 98.33 97.95 97.58 97.21 96.84 96.47 96.10 95.73 91.74 89.81 87.95 86.86
Note: WC denotes water cooled; AC denotes air cooled. CCGT = combined cycle gas turbine; OCGT = open cycle gas turbine; SC = supercritical coal; USC = ultra-supercritical coal; IGCC =
integrated gasification combined cycle; CCS = carbon capture and storage. Life-cycle cost calculated at a constant 85% capacity factor over the stations life. LRMC is presented in $/MWh generated.
Data source: ACIL Tasman analysis

7/27/2019 ACIL Tasman April 2009
http://slidepdf.com/reader/full/acil-tasman-april-2009 92/104

7/27/2019 ACIL Tasman April 2009
http://slidepdf.com/reader/full/acil-tasman-april-2009 93/104
86
Fue
lresource,newentryandgenerationcostsintheNEM
Newentranttechnologies
Technology & Zone2009-
102010-
112011-
122012-
132013-
142014-
152015-
162016-
172017-
182018-
192019-
202020-
212021-
222022-
232023-
242024-
252025-
262026-
272027-
282028-
29
OCGT_CVI C 88.54 100.42 101.22 102.70 107.77 106.63 111.94 113.45 115.77 116.63 118.76 119.68 120.72 121.28 122.53 126.20 127.94 127.78 132.45 134.52
OCGT_NSA 103.98 118.61 119.42 121.09 126.32 124.81 130.29 131.95 134.40 134.83 137.10 138.15 139.35 139.51 140.92 144.75 146.59 146.10 150.93 153.20
OCGT_ADE 100.87 115.61 116.44 118.12 123.36 121.95 127.45 129.13 131.59 132.12 134.40 135.46 136.67 136.93 138.34 142.19 144.04 143.63 148.47 150.76
OCGT_SESA 95.26 110.23 111.09 112.82 118.11 116.90 122.44 124.16 126.66 127.38 129.70 130.80 132.05 132.47 133.93 137.81 139.70 139.44 144.32 146.64
OCGT_TAS 98.67 110.24 111.04 112.37 113.77 112.45 117.76 119.27 121.59 122.27 124.41 125.33 126.37 126.76 128.01 131.69 133.43 133.12 138.23 141.53
SC BLACK (WC)_NQ 55.15 71.28 71.29 71.39 72.58 73.78 75.13 76.39 77.47 78.56 79.72 80.81 82.05 82.18 83.40 84.61 85.59 86.97 88.27 89.73
SC BLACK (AC)_NQ 56.29 72.86 72.88 72.96 74.19 75.43 76.82 78.12 79.24 80.36 81.56 82.68 83.97 84.06 85.31 86.57 87.58 89.00 90.34 91.84
SC BLACK (AC)_CQ 52.78 69.19 69.05 69.06 70.13 71.21 72.45 73.59 74.56 75.54 76.61 77.59 78.74 78.83 80.02 81.22 82.17 83.53 84.81 86.26
SC BLACK (AC)_SWQ 53.25 69.74 69.68 69.76 70.92 72.09 73.41 74.64 75.69 76.74 77.88 78.94 80.17 80.29 81.48 82.68 83.63 85.00 86.28 87.76
SC BLACK (AC)_NNSW 53.79 71.16 71.07 71.12 72.29 73.47 74.80 76.03 77.08 78.12 79.26 80.32 81.56 81.65 82.87 84.08 85.03 86.42 87.72 89.20
SC BLACK (AC)_NCEN 51.85 69.23 69.17 69.29 70.49 71.69 73.05 74.30 75.37 76.45 77.61 78.69 79.95 80.10 81.34 82.57 83.54 84.95 86.27 87.77SC BLACK (AC)_SWNSW 49.88 67.40 67.46 67.75 69.08 70.40 71.88 73.26 74.45 75.65 76.93 78.12 79.49 79.76 81.09 82.43 83.51 85.02 86.44 88.04
SC BROWN (WC)_LV 50.22 69.92 70.00 71.14 71.78 73.25 74.88 76.40 77.72 79.03 80.45 81.76 83.28 84.69 86.20 87.71 88.93 89.26 90.83 92.59
SC BROWN (AC)_LV 51.29 71.90 72.01 73.22 73.84 75.39 77.10 78.70 80.08 81.46 82.95 84.33 85.92 87.40 88.99 90.58 91.85 92.13 93.77 95.61
USC BLACK (WC)_NQ 56.56 71.55 70.82 71.55 72.65 73.04 74.27 75.42 75.64 76.61 77.65 77.82 78.91 79.92 80.18 81.25 81.26 82.44 83.56 84.81
USC BLACK (AC)_NQ 57.77 73.20 72.44 73.20 74.34 74.71 75.99 77.18 77.38 78.38 79.46 79.61 80.73 81.78 82.02 83.12 83.11 84.33 85.48 86.77
USC BLACK (AC)_CQ 54.47 69.75 68.92 69.53 70.52 70.83 71.96 73.01 73.17 74.04 74.99 75.12 76.12 77.06 77.34 78.39 78.42 79.59 80.69 81.93
USC BLACK (AC)_SWQ 54.91 70.27 69.50 70.19 71.26 71.64 72.85 73.97 74.18 75.13 76.15 76.31 77.38 78.38 78.64 79.69 79.69 80.86 81.96 83.23
USC BLACK (AC)_NNSW 55.42 71.60 70.77 71.47 72.55 72.91 74.12 75.25 75.44 76.37 77.39 77.53 78.61 79.61 79.86 80.92 80.90 82.10 83.21 84.48
USC BLACK (AC)_NCEN 53.59 69.79 69.03 69.75 70.86 71.27 72.51 73.66 73.90 74.86 75.90 76.09 77.19 78.21 78.50 79.58 79.61 80.82 81.96 83.24
USC BLACK (AC)_SWNSW 51.74 68.07 67.46 68.30 69.52 70.08 71.44 72.70 73.07 74.14 75.28 75.58 76.78 77.90 78.29 79.46 79.58 80.88 82.10 83.47
USC BROWN (WC)_LV 52.34 70.37 69.69 70.62 71.94 72.52 73.99 75.35 76.53 77.70 78.97 79.23 80.55 81.78 82.13 83.42 83.47 84.89 86.22 87.72
USC BROWN (AC)_LV 53.43 72.19 71.47 72.45 73.83 74.41 75.94 77.36 78.59 79.82 81.14 81.37 82.75 84.03 84.36 85.69 85.71 87.18 88.57 90.13
Geothermal (HDR)_NNSW 86.06 86.64 85.62 84.60 83.61 82.62 81.66 80.69 79.74 78.80 77.87 76.97 76.06 75.18 74.30 73.42 72.57 71.72 70.89 70.07
Geothermal (HDR)_CVIC 86.06 86.64 85.62 84.60 83.61 82.62 81.66 80.69 79.74 78.80 77.87 76.97 76.06 75.18 74.30 73.42 72.57 71.72 70.89 70.07
Geothermal (HDR)_NSA 86.06 86.64 85.62 84.60 83.61 82.62 81.66 80.69 79.74 78.80 77.87 76.97 76.06 75.18 74.30 73.42 72.57 71.72 70.89 70.07
Geothermal (HDR)_ADE 86.06 86.64 85.62 84.60 83.61 82.62 81.66 80.69 79.74 78.80 77.87 76.97 76.06 75.18 74.30 73.42 72.57 71.72 70.89 70.07
IGCC BLACK_NQ 78.64 91.58 89.81 88.17 87.81 87.47 87.36 87.16 85.93 85.55 86.27 87.25 88.39 88.49 89.60 90.71 91.59 92.85 92.99 94.28
IGCC BLACK_CQ 75.43 88.22 86.30 84.59 84.09 83.60 83.35 83.01 81.74 81.23 81.83 82.69 83.71 83.80 84.86 85.91 86.74 87.95 88.14 89.39
IGCC BLACK_SWQ 75.86 88.72 86.88 85.24 84.81 84.41 84.23 83.97 82.75 82.31 82.97 83.90 84.98 85.11 86.17 87.22 88.06 89.26 89.43 90.71
IGCC BLACK_NNSW 76.36 90.02 88.14 86.48 86.07 85.67 85.50 85.24 83.99 83.55 84.21 85.14 86.23 86.34 87.41 88.47 89.31 90.54 90.69 91.97
IGCC BLACK_NCEN 74.57 88.25 86.41 84.81 84.42 84.04 83.90 83.66 82.47 82.05 82.73 83.68 84.79 84.95 86.03 87.12 87.98 89.22 89.42 90.72
IGCC BLACK_SWNSW 72.77 86.57 84.84 83.40 83.12 82.86 82.83 82.70 81.64 81.33 82.12 83.17 84.38 84.64 85.82 87.00 87.94 89.28 89.57 90.95IGCC BLACK CCS_NQ 104.11 100.97 97.87 94.45 92.29 90.16 88.33 86.49 84.63 82.77 80.87 80.66 80.46 80.26 80.06 79.01 78.80 78.61 78.02 77.83
IGCC BLACK CCS_CQ 100.35 97.04 93.77 90.30 87.97 85.67 83.67 81.66 79.64 77.63 76.01 75.67 75.34 75.01 74.75 73.92 73.65 73.41 72.89 72.65
IGCC BLACK CCS_SWQ 100.86 97.62 94.45 91.05 88.81 86.60 84.70 82.78 80.84 78.91 77.26 76.99 76.74 76.47 76.22 75.31 75.04 74.80 74.25 74.05
IGCC BLACK CCS_NNSW 101.44 99.49 96.29 92.87 90.67 88.50 86.64 84.75 82.83 80.92 79.13 78.88 78.66 78.43 78.22 77.24 76.99 76.80 76.24 76.06
IGCC BLACK CCS_NCEN 99.35 97.43 94.26 90.93 88.76 86.61 84.77 82.91 81.02 79.13 77.51 77.28 77.09 76.88 76.68 75.81 75.58 75.40 74.90 74.74
IGCC BLACK CCS_SWNSW 97.24 95.46 92.43 89.29 87.25 85.24 83.53 81.80 80.04 78.28 76.84 76.73 76.63 76.53 76.44 75.67 75.54 75.46 75.05 74.98
IGCC BROWN_LV 69.15 82.16 80.39 78.98 78.62 78.29 78.18 77.99 76.98 76.60 77.33 78.32 79.46 79.77 80.88 81.99 82.88 84.14 84.48 85.78
IGCC BROWN CCS_LV 93.01 89.54 86.44 83.33 81.14 78.98 77.13 75.26 73.37 71.49 70.49 70.26 70.04 69.81 69.59 69.06 68.82 68.61 68.25 68.04
USC CCS BLACK (WC)_NQ 84.01 82.98 81.24 80.08 79.51 78.95 78.64 76.99 76.63 76.27 75.92 75.57 74.44 74.08 73.74 73.39 73.03 72.70 71.63 71.30
USC CCS BLACK (AC)_NQ 86.06 85.04 83.22 82.05 81.49 80.92 80.62 78.83 78.48 78.13 77.78 77.43 76.23 75.88 75.54 75.20 74.84 74.51 73.38 73.06
USC CCS BLACK (AC)_CQ 82.36 81.17 79.30 77.97 77.23 76.51 76.04 74.50 74.00 73.51 73.03 72.55 71.49 71.03 70.63 70.23 69.82 69.44 68.52 68.14
USC CCS BLACK (AC)_SWQ 82.85 81.74 79.95 78.71 78.06 77.43 77.05 75.50 75.08 74.67 74.26 73.85 72.78 72.38 71.98 71.59 71.18 70.80 69.81 69.47

7/27/2019 ACIL Tasman April 2009
http://slidepdf.com/reader/full/acil-tasman-april-2009 94/104
87
Fue
lresource,newentryandgenerationcostsintheNEM
Newentranttechnologies
Technology & Zone2009-
102010-
112011-
122012-
132013-
142014-
152015-
162016-
172017-
182018-
192019-
202020-
212021-
222022-
232023-
242024-
252025-
262026-
272027-
282028-
29
USC CCS BLACK (AC)_NNSW 83.43 83.59 81.71 80.50 79.90 79.30 78.96 77.27 76.87 76.47 76.08 75.69 74.56 74.19 73.83 73.47 73.08 72.75 71.70 71.38
USC CCS BLACK (AC)_NCEN 81.37 81.56 79.77 78.59 78.01 77.44 77.12 75.62 75.24 74.86 74.50 74.13 73.10 72.75 72.41 72.07 71.70 71.39 70.43 70.12
USC CCS BLACK (AC)_SWNSW 79.30 79.62 78.02 76.98 76.53 76.09 75.90 74.62 74.36 74.10 73.85 73.59 72.69 72.43 72.19 71.94 71.67 71.45 70.57 70.35
USC CCS BROWN (WC)_LV 82.94 81.05 78.43 77.11 75.85 75.21 74.59 73.63 73.24 72.84 72.44 72.04 71.47 71.07 70.68 70.29 69.89 69.51 68.78 68.40
USC CCS BROWN (AC)_LV 84.51 82.58 79.88 78.55 77.27 76.63 76.01 75.02 74.64 74.24 73.84 73.45 72.87 72.47 72.09 71.70 71.30 70.92 70.17 69.80
Nuclear_NQ 101.41 101.36 100.98 100.62 100.26 99.91 99.55 99.20 98.85 98.49 98.14 97.80 97.45 97.11 96.77 96.43 92.46 90.56 88.72 87.67
Nuclear_CQ 101.41 101.36 100.98 100.62 100.26 99.91 99.55 99.20 98.85 98.49 98.14 97.80 97.45 97.11 96.77 96.43 92.46 90.56 88.72 87.67
Nuclear_SWQ 101.41 101.36 100.98 100.62 100.26 99.91 99.55 99.20 98.85 98.49 98.14 97.80 97.45 97.11 96.77 96.43 92.46 90.56 88.72 87.67
Nuclear_NNSW 101.41 101.36 100.98 100.62 100.26 99.91 99.55 99.20 98.85 98.49 98.14 97.80 97.45 97.11 96.77 96.43 92.46 90.56 88.72 87.67
Nuclear_NCEN 101.41 101.36 100.98 100.62 100.26 99.91 99.55 99.20 98.85 98.49 98.14 97.80 97.45 97.11 96.77 96.43 92.46 90.56 88.72 87.67
Nuclear_SWNSW 101.41 101.36 100.98 100.62 100.26 99.91 99.55 99.20 98.85 98.49 98.14 97.80 97.45 97.11 96.77 96.43 92.46 90.56 88.72 87.67Nuclear_CAN 101.41 101.36 100.98 100.62 100.26 99.91 99.55 99.20 98.85 98.49 98.14 97.80 97.45 97.11 96.77 96.43 92.46 90.56 88.72 87.67
Nuclear_NVI C 101.41 101.36 100.98 100.62 100.26 99.91 99.55 99.20 98.85 98.49 98.14 97.80 97.45 97.11 96.77 96.43 92.46 90.56 88.72 87.67
Nuclear_LV 101.41 101.36 100.98 100.62 100.26 99.91 99.55 99.20 98.85 98.49 98.14 97.80 97.45 97.11 96.77 96.43 92.46 90.56 88.72 87.67
Nuclear_CVI C 101.41 101.36 100.98 100.62 100.26 99.91 99.55 99.20 98.85 98.49 98.14 97.80 97.45 97.11 96.77 96.43 92.46 90.56 88.72 87.67
Nuclear_NSA 101.41 101.36 100.98 100.62 100.26 99.91 99.55 99.20 98.85 98.49 98.14 97.80 97.45 97.11 96.77 96.43 92.46 90.56 88.72 87.67
Nuclear_SESA 101.41 101.36 100.98 100.62 100.26 99.91 99.55 99.20 98.85 98.49 98.14 97.80 97.45 97.11 96.77 96.43 92.46 90.56 88.72 87.67
Note: WC denotes water cooled; AC denotes air cooled. CCGT = combined cycle gas turbine; OCGT = open cycle gas turbine; SC = supercritical coal; USC = ultra-supercritical coal; IGCC =
integrated gasification combined cycle; CCS = carbon capture and storage. Life-cycle cost calculated at a constant 85% capacity factor over the stations life. LRMC is presented $/MWh generated.
Data source: ACIL Tasman analysis

7/27/2019 ACIL Tasman April 2009
http://slidepdf.com/reader/full/acil-tasman-april-2009 95/104
Fuel resource, new entry and generation costs in the NEM
New entrant technologies 88
4.5 Annualised costs Table 54 provides the annualised capital, FOM and tax costs for each new
entrant technology in real 2009-10 $/kW/year for each year (as discussed in
section 2.2.3). This value represents the net revenue (spot revenue minus cash
costs) required to repay debt and the necessary returns to equity to justify the
investment.
The annualised capital, FOM and tax costs within Table 54 generally decline
over time as these cost elements are projected to decline in real terms. They are
consistent for each technology regardless of where it is located (the only costs
which vary across zones are variable costs – part of the SRMC – and hence arenot included within this figure).
Table 55 provides the annualised tax costs for each new entrant technology on
a similar basis. It should be noted that the annualised tax cost is a component
of the costs within Table 54 (as tax does not form part of the SRMC).

7/27/2019 ACIL Tasman April 2009
http://slidepdf.com/reader/full/acil-tasman-april-2009 96/104
89
Fue
lresource,newentryandgenerationcostsintheNEM
Newentranttechnologies
Table 54 Annualised capital, fixed O&M and tax costs for new entrant technologies (Real 2009-10 $/kW/year)
2009-10
2010-11
2011-12
2012-13
2013-14
2014-15
2015-16
2016-17
2017-18
2018-19
2019-20
2020-21
2021-22
2022-23
2023-24
2024-25
2025-26
2026-27
2027-28
2028-29
CCGT (WC) 168 159 158 156 155 154 154 153 153 152 152 151 151 150 150 149 149 149 148 148
CCGT (AC) 174 164 164 161 160 160 159 159 158 158 157 157 156 156 156 155 155 154 154 153
OCGT 113 106 106 104 103 103 102 102 102 101 101 101 100 100 100 99 99 99 98 98
SC BLACK (WC) 293 285 281 277 275 274 273 273 272 272 272 271 271 270 270 269 269 268 268 267
SC BLACK (AC) 299 290 286 282 281 279 279 279 278 278 277 277 276 276 276 275 275 274 274 273
SC BROWN (WC) 325 316 311 307 305 303 303 302 302 301 301 300 300 299 299 298 298 297 297 296
SC BROWN (AC) 331 322 317 312 311 309 309 309 308 308 307 307 306 306 305 305 304 304 303 303
USC BLACK (WC) 310 301 297 293 291 289 289 289 288 288 287 287 286 286 285 285 284 284 283 283
USC BLACK (AC) 317 307 303 298 297 295 295 295 294 294 293 293 292 292 291 291 291 290 290 289
USC BROWN (WC) 344 334 329 324 322 321 320 320 319 319 318 318 317 316 316 315 315 314 314 313
USC BROWN (AC) 350 340 335 331 329 327 327 326 326 325 325 324 324 323 323 322 322 321 321 320
Geothermal (HDR) 626 630 623 615 608 600 593 586 579 572 565 558 551 545 538 532 525 519 513 507
IGCC BLACK 457 433 415 399 386 374 363 353 342 331 328 328 327 327 326 326 325 325 324 324
IGCC BLACK CCS 625 592 568 546 529 513 498 484 469 455 451 449 447 445 442 440 438 436 434 432
IGCC BROWN 457 433 415 399 386 374 363 353 342 331 328 328 327 327 326 326 325 325 324 324
IGCC BROWN CCS 625 592 568 546 529 513 498 484 469 455 451 449 447 445 442 440 438 436 434 432
USC CCS BLACK (WC) 500 483 473 464 459 454 451 448 445 442 439 436 432 429 426 423 420 417 414 411
USC CCS BLACK (AC) 510 492 483 473 468 463 460 457 454 451 448 445 442 439 435 432 429 426 423 420
USC CCS BROWN (WC) 565 543 525 514 504 499 494 491 487 484 480 477 474 470 467 464 460 457 454 450
USC CCS BROWN (AC) 576 553 535 524 514 509 503 500 497 494 490 487 483 480 477 473 470 467 463 460
Nuclear 681 678 675 672 669 667 664 661 658 655 653 650 647 644 642 639 609 595 581 573
Note: WC denotes water cooled; AC denotes air cooled. CCGT = combined cycle gas turbine; OCGT = open cycle gas turbine; SC = supercritical coal; USC = ultra-supercritical coal; IGCC =
integrated gasification combined cycle; CCS = carbon capture and storage.
Data source: ACIL Tasman analysis

7/27/2019 ACIL Tasman April 2009
http://slidepdf.com/reader/full/acil-tasman-april-2009 97/104
90
Fue
lresource,newentryandgenerationcostsintheNEM
Newentranttechnologies
Table 55 Annualised tax costs for new entrant technologies (Real 2009-10 $/kW/year)
2009-10
2010-11
2011-12
2012-13
2013-14
2014-15
2015-16
2016-17
2017-18
2018-19
2019-20
2020-21
2021-22
2022-23
2023-24
2024-25
2025-26
2026-27
2027-28
2028-29
CCGT (WC) 30 28 28 28 27 27 27 27 27 27 27 27 26 26 26 26 26 26 26 26
CCGT (AC) 32 29 29 29 28 28 28 28 28 28 28 28 28 28 28 27 27 27 27 27
OCGT 22 20 20 20 20 20 20 19 19 19 19 19 19 19 19 19 19 19 19 19
SC BLACK (WC) 55 53 52 51 51 51 51 51 50 50 50 50 50 50 50 50 50 49 49 49
SC BLACK (AC) 56 54 54 53 52 52 52 52 52 52 52 51 51 51 51 51 51 51 51 51
SC BROWN (WC) 61 59 58 57 56 56 56 56 55 55 55 55 55 55 55 55 55 54 54 54
SC BROWN (AC) 62 60 59 58 58 57 57 57 57 57 57 57 56 56 56 56 56 56 56 56
USC BLACK (WC) 59 57 56 55 55 54 54 54 54 54 54 54 54 53 53 53 53 53 53 53
USC BLACK (AC) 60 58 57 56 56 56 56 55 55 55 55 55 55 55 55 55 55 54 54 54
USC BROWN (WC) 65 63 62 60 60 60 60 60 59 59 59 59 59 59 59 58 58 58 58 58
USC BROWN (AC) 66 64 63 62 62 61 61 61 61 61 61 61 60 60 60 60 60 60 60 60
Geothermal (HDR) 133 134 133 131 129 128 126 124 123 121 120 118 117 115 114 112 111 109 108 106
IGCC BLACK 92 86 82 78 76 73 71 68 66 63 63 63 62 62 62 62 62 62 62 62
IGCC BLACK CCS 124 116 111 106 102 98 95 92 89 85 85 84 84 83 83 82 82 81 81 80
IGCC BROWN 92 86 82 78 76 73 71 68 66 63 63 63 62 62 62 62 62 62 62 62
IGCC BROWN CCS 124 116 111 106 102 98 95 92 89 85 85 84 84 83 83 82 82 81 81 80
USC CCS BLACK (WC) 94 91 88 86 85 84 83 83 82 81 81 80 79 79 78 77 76 76 75 74
USC CCS BLACK (AC) 97 93 90 88 87 86 85 85 84 83 83 82 81 81 80 79 78 78 77 76
USC CCS BROWN (WC) 106 101 97 95 93 91 90 90 89 88 87 87 86 85 84 84 83 82 81 81
USC CCS BROWN (AC) 109 104 99 97 95 94 92 92 91 90 89 89 88 87 86 86 85 84 83 83
Nuclear 136 136 135 134 134 133 132 132 131 130 130 129 128 128 127 127 120 116 113 111
Note: WC denotes water cooled; AC denotes air cooled. CCGT = combined cycle gas turbine; OCGT = open cycle gas turbine; SC = supercritical coal; USC = ultra-supercritical coal; IGCC =
integrated gasification combined cycle; CCS = carbon capture and storage.
Data source: ACIL Tasman analysis

7/27/2019 ACIL Tasman April 2009
http://slidepdf.com/reader/full/acil-tasman-april-2009 98/104
Fuel resource, new entry and generation costs in the NEM
New entrant technologies 91
4.6 Brownfield expansions Almost all existing station sites provide the opportunity for some form of
brownfield development. A brownfield development could include the
construction of a new unit on an existing permitted site, through to conversion
of existing stations into a different configuration. For example, most existing
OCGT could be reconfigured as CCGT with the addition of a heat recovery
steam generator and steam turbine.
Table 56 lists a number of potential brownfield conversions and upgrade
options that have been suggested over recent years.
Table 56 Potential brownfield conversions/upgrades
Site/station Comments
Mt StuartConversion to gas-fired OCGT; CCGT conversion; potentialrelocation
Torrens Island A/BPartial or full conversion to CCGT using the existing steamturbines
Newport Conversion to CCGT using the existing steam turbine
Tallawarra Additional OCGT or CCGT developments
Braemar Additional OCGT or CCGT developments; conversion of existing OCGT to CCGT
Oakey Conversion to CCGT using existing OCGT
Swanbank Additional OCGT or CCGT developments
QuarantineConversion to CCGT using existing OCGT units, or additional OCGT or CCGT developments
Mt Piper, Eraring, Bayswater,Vales Point
Capacity upgrades of up to 750 MW per unit
Uranquinty, Colongra,Mortlake
Conversion to CCGT using existing OCGT units, or additional OCGT or CCGT developments
Data source: ACIL Tasman
Table 57 provides the capital cost projection for brownfield conversions and
upgrades. Table 58 provides the annualised capital, FOM and tax figures that
result from the capital costs (FOM for brownfield projects are assumed to be
the same as for greenfield projects). Table 59 provides the annualised tax costs
only.

7/27/2019 ACIL Tasman April 2009
http://slidepdf.com/reader/full/acil-tasman-april-2009 99/104
92
Fue
lresource,newentryandgenerationcostsintheNEM
Newentranttechnologies
Table 57 Capital cost projection for brownfield upgrades/conversions (Real 2009-10 $/kW)
2009-10
2010-11
2011-12
2012-13
2013-14
2014-15
2015-16
2016-17
2017-18
2018-19
2019-20
2020-21
2021-22
2022-23
2023-24
2024-25
2025-26
2026-27
2027-28
2028-29
Brownfield CCGT site 1,163 1,084 1,082 1,063 1,050 1,048 1,045 1,041 1,038 1,034 1,030 1,026 1,023 1,019 1,016 1,012 1,009 1,005 1,002 998
CCGT convert from OCGT 630 627 624 621 618 615 612 609 606 603 600 597 594 592 589 586 583 580 577 574
Black coal upgrade 525 523 520 518 515 513 510 508 505 503 500 498 495 493 491 488 486 483 481 479
Brownfield OCGT site 887 826 824 810 799 797 795 792 788 786 782 779 776 773 770 767 764 761 758 755
CCGT convert from ST 1,064 991 989 972 959 957 954 950 946 943 939 935 931 928 924 920 917 913 909 906
Note: CCGT = combined cycle gas turbine; OCGT = open cycle gas turbine; ST = steam turbine.Data source: ACIL Tasman analysis
Table 58 Annualised capital, fixed O&M and tax costs for brownfield upgrades/conversions (Real 2009-10 $/kW/year)
2009-10
2010-11
2011-12
2012-13
2013-14
2014-15
2015-16
2016-17
2017-18
2018-19
2019-20
2020-21
2021-22
2022-23
2023-24
2024-25
2025-26
2026-27
2027-28
2028-29
Brownfield CCGT site 152 144 144 142 141 140 140 140 139 139 138 138 138 137 137 137 136 136 135 135
CCGT convert from OCGT 95 94 94 94 94 93 93 93 92 92 92 91 91 91 91 90 90 90 89 89
Black coal upgrade 101 101 101 100 100 100 100 99 99 99 99 98 98 98 98 97 97 97 97 96
Brownfield OCGT site 103 97 96 95 94 94 93 93 93 93 92 92 92 91 91 91 90 90 90 89
CCGT convert from ST 140 133 133 131 130 129 129 129 128 128 127 127 127 126 126 126 125 125 124 124
Note: CCGT = combined cycle gas turbine; OCGT = open cycle gas turbine; ST = steam turbine.
Data source: ACIL Tasman analysis
Table 59 Annualised tax costs for brownfield upgrades/conversions (Real 2009-10 $/kW/year)
2009-
10
2010-
11
2011-
12
2012-
13
2013-
14
2014-
15
2015-
16
2016-
17
2017-
18
2018-
19
2019-
20
2020-
21
2021-
22
2022-
23
2023-
24
2024-
25
2025-
26
2026-
27
2027-
28
2028-
29Brownfield CCGT site 27 25 25 24 24 24 24 24 24 24 24 24 24 23 23 23 23 23 23 23
CCGT convert from OCGT 14 14 14 14 14 14 14 13 13 13 13 13 13 13 13 13 13 13 13 13
Black coal upgrade 12 12 12 11 11 11 11 11 11 11 11 11 11 11 11 11 11 11 11 11
Brownfield OCGT site 20 18 18 18 18 18 18 18 17 17 17 17 17 17 17 17 17 17 17 17
CCGT convert from ST 24 22 22 22 22 22 22 21 21 21 21 21 21 21 21 21 21 21 21 20
Note: CCGT = combined cycle gas turbine; OCGT = open cycle gas turbine; ST = steam turbine.
Data source: ACIL Tasman analysis

7/27/2019 ACIL Tasman April 2009
http://slidepdf.com/reader/full/acil-tasman-april-2009 100/104
Fuel resource, new entry and generation costs in the NEM
New entrant technologies 93

7/27/2019 ACIL Tasman April 2009
http://slidepdf.com/reader/full/acil-tasman-april-2009 101/104
Fuel resource, new entry and generation costs in the NEM
A-1
A Scope of work The consultancy required ACIL Tasman to provide:
• short run marginal cost (SRMC) of existing generators and committed andadvanced projects in the NEM on a station basis (including fuel,operational and maintenance (O&M) costs and the impact of governmentschemes such as GECs, NGACs, RECs, etc) over the coming 20-yeartimeframe. For the SRMC analysis the focus will be on fuel prices, taking into account the following:
− coal prices and coal contracts
− gas price versus demand− carbon price impact on gas prices
− LNG and export impacts on fuel prices and availability.
• possibility of existing generators to operate on dual fuels, and the operating costs associated with both fuels
• data and information needed for modelling the impact of the CarbonPollution Reduction Scheme (CPRS) including:
− CO2-equivalent emission factors for all existing and anticipatedgenerators to determine the carbon output as an effect of electricity
production. This body of work should reconcile with emission factorspublished by the Australian Greenhouse Office (AGO).
− SRMC of existing generators, committed and advanced projects andpotential new entrant generators (over the coming 20-year period)adjusted for the effects of a carbon tax imposed based on an assumedcarbon tax level and CO2-equivalent emissions.
− Fixed costs of existing generators.
− Information to assist with the modelling of existing plant retirements.
With this data, the consultant is also required to provide:
• information about the SRMC components (including fuel costs (bothcommodity and transport costs), heat rates (as generated), variable O&Mcosts and any other costs making up the SRMC) for all existing generatorsand committed and advanced projects
• commentary about the costs incorporated including the effect of government schemes and assumed saturations of these schemes with aseparate assessment for each scheme
• costs associated with and commentary about the CPRS; and
• a reconciliation of the information provided against that from previousreviews commissioned by the IRPC and a rationalisation of variations.

7/27/2019 ACIL Tasman April 2009
http://slidepdf.com/reader/full/acil-tasman-april-2009 102/104
Fuel resource, new entry and generation costs in the NEM
A-2
Provision should be made for costs to be varied based on a range of carbon tax
values.Data is also to be supplied for new entrant technologies including:
• Combined Cycle Gas turbine (CCGT)
• Open Cycle Gas Turbine (OCGT)
• Supercritical black coal
• Supercritical brown coal
• Ultrasupercritical (USC)
• Nuclear
• Coal gasification (IGCC)• Carbon capture and sequestration (CCS).
The following information is required for the technologies assessed likely to be
built in the next 20 year period:
• the earliest likely build date
• the weighted average cost of capital (WACC) expected by a NEMgenerator
• the physical characteristics of new entry units, including:
− maximum capacity
− minimum stable generation
− auxiliary load (fixed and variable components).
• the capital cost of new generation entry (brownfield expansion, brownfieldconversion and greenfield) (presented as a dollar amount per unit installedcapacity – ie. $/kW basis) including:
− “inside the fence” costs - total equipment cost (including cooling arrangements); and
− “outside the fence” costs – electricity network costs, fuel connectioncosts, cost of land and development, cost and availability of water, etc.
• availability and location of potentially attractive fuel resources, brokendown into brownfield expansion, brownfield conversion and greenfieldsites, within each zone (see appendix B), including the number of units of each technology that could connect at each ANTS zone at the costsreported (in capital installed tranches as discussed above)
• the variable costs (SRMC) involved in operating a generator including fuelcosts, O&M costs and the effect of the CPRS (and other relevantgovernment schemes) over the coming 20-year timeframe
• possibility of generators to operate on dual fuels, and the operating costsassociated with both fuels
• lead time required to build each new project type

7/27/2019 ACIL Tasman April 2009
http://slidepdf.com/reader/full/acil-tasman-april-2009 103/104
Fuel resource, new entry and generation costs in the NEM
A-3
• requirement for additional infrastructure to access fuel resource in eachzone (see appendix B) which have not been reflected in the variable costs
• any other fixed costs (including annual fixed O&M costs and tax costs) that would be incurred by a new entrant generator that have not been already been captured above; and
• capital costs expressed as an annualised figure for use in estimating capitaldeferral benefits.
The differences in generation capital costs should vary across the different
zones based on the generation technologies used (wet build, dry build, etc).
With this data, the consultant is also required to provide:
• details of the derivation of the WACC and a rationalisation on theappropriateness of this figure as an investment hurdle rate
• assumptions regarding exchange rates and how changes in exchange rates will impact the costs quoted.
• information about the SRMC components (including fuel costs (bothcommodity and transport costs), heat rates (as generated), variable O&Mcosts and any other costs making up the SRMC) for all potential new entrants
• costs with and without the impact of the government schemes
• a breakdown of the fixed cost components (capital costs, fixed operationaland maintenance costs, etc)
• commentary on the capital cost information, including expectations of thelong term trends of input costs and reconciliation with publicly availableinformation
• information about the availability and costs of potential brownfielddevelopments
• capital costs expressed as annualised figures (using the appropriate discountrates and economic lives) to be used as the market benefit of deferring investment
• the total fixed costs (including all costs not in the SRMC figures) expressedas a dollar figure per MW installed capacity to act as a trigger level for new entry investment; and
• a reconciliation of the information provided against that from previousreviews commissioned by the IRPC and a rationalisation of variations.
The consultant is not required to provide information on renewable new entry
technologies. Renewable generation forecasts will be generated through a
separate process.
The data supplied will cover the 20 year period starting from 2009/10.

7/27/2019 ACIL Tasman April 2009
http://slidepdf.com/reader/full/acil-tasman-april-2009 104/104
Fuel resource, new entry and generation costs in the NEM
To standardise presentation and align with the intended use in the 2009 ANTS,
forecast cost data is to be expressed on the following basis:• in real 2009/10 dollar terms (explicitly stating assumed price escalation
assumptions where relevant); and
• exclusive of GST.
Capacity, heat rates, costs, etc are to be expressed on a generator terminal basis
(as opposed to „sent out‟).