Embed Size (px)
Citation preview

Acid Sulfate Soils Research ProgramThe Potential for Contaminant Mobilisation Following Acid Sulfate Soil Rewetting : Lab Experiment
Report 4 | August 2009
For further information please contact: Email: [email protected]
Phone: 1800 226 709 (free call during normal business hours)
Post: Coorong, Lower Lakes and Murray Mouth Program Department of Environment and Natural Resources Reply paid 1047 ADELAIDE SA 5001
Website: www.environment.sa.gov.au/cllmm
Permissive licence © State of South Australia through the Department of Environment and Natural Resources.
Apart from fair dealings and other uses permitted by the Copyright Act 1968 (Cth), no part of this publication may be reproduced, published, communicated, transmitted, modified or commercialised without the prior written approval of the Department of Environment and Natural Resources.
Written requests for permission should be addressed to: Coorong, Lower Lakes and Murray Mouth Program Department of Environment and Natural Resources GPO Box 1047 Adelaide SA 5001
Disclaimer This report has been prepared by consultants for the Department of Environment and Natural Resources (DENR) and views expressed do not necessarily reflect those of the DENR. The DENR cannot guarantee the accuracy of the report, and does not accept liability for any loss or damage incurred as a result of relying on its accuracy. Printed on recycled paper August 2009 ISBN 978-1-921735-12-7
Citation This report should be cited as:
Simpson, S., Jung, R., Jarolimek, C. and Hamilton, I. 2009, The potential for contaminant mobilisation following acid sulfate soil rewetting: lab experiment. Prepared by the Commonwealth Scientific and Industrial Research Organisation (CSIRO) Land and Water for the SA Department of Environment and Natural Resources, Adelaide.
Cover image Western Lake Albert, March 2010 (DENR 2010)

i
The Potential for Contaminant Mobilisation Following Acid Sulfate Soil Rewetting: Lab Experiment S. Simpson, R. Jung, C. Jarolimek and I. Hamilton Prepared by the Commonwealth Scientific and Industrial Research Organisation (CSIRO) Land and Water for the SA Department of Environment and Natural Resources Part of the South Australian Government's $610 million Murray Futures program funded by the Australian Government's Water for the Future initiative, and the Murray-Darling Basin Authority August 2009

ii
Acknowledgements James Charlesworth, Samuel Swain and Loren Bardwell are thanked for assistance with experiments and analyses. Warren Hicks, Nathan Creeper and Mark Thomas are thanked for assisting with collection of samples. Graeme Batley, Paul Shand and Warren Hicks are thanked for review comments of this report.

Table of Contents Acknowledgements................................................................................................................................................................ ii 1 Executive Summary ..................................................................................................................................................... 1 2 Introduction................................................................................................................................................................... 3 3 Methods......................................................................................................................................................................... 4
3.1 Sampling Sites and Samples ................................................................................................................................. 4 3.1.1 Soil samples ................................................................................................................................................... 4 3.1.2 Water samples .............................................................................................................................................. 4
3.2 Corer-reactor Acid/Metal Release Tests............................................................................................................. 4 3.2.1 General analytical ....................................................................................................................................... 4 3.2.2 Corer-reactor operation ............................................................................................................................. 5
3.3 Rapid Release Tests ................................................................................................................................................ 6 3.3.1 Acid and metal mobilisation tests ............................................................................................................. 6
4 Results............................................................................................................................................................................. 7 4.1 Corer-reactor Experiments .................................................................................................................................... 7
4.1.1 Soil pH............................................................................................................................................................. 7 4.1.2 Overlying water pH and SEC...................................................................................................................... 7 4.1.3 Trace metal and metalloid concentrations............................................................................................. 8 4.1.4 Effect of surface sediment resuspension.................................................................................................. 8 4.1.5 Porewater pH and dissolved metals ....................................................................................................... 19
4.2 Short-term, Rapid Release of Acidity and Metals from Soils .......................................................................... 23 4.2.1 Effect of time on acidity and metal release.......................................................................................... 23 4.2.2 Effect of soil:water ratio on acidity and metal release........................................................................ 26 4.2.3 Effect of standard and repeated leaching on acidity and metal release...................................... 29 4.2.4 Comparison of freshwater and seawater rapid metal release for additional soils......................... 31
5 Discussion..................................................................................................................................................................... 33 5.1 Ecological Risk Assessment.................................................................................................................................. 33
5.1.1 Sediment resuspension.............................................................................................................................. 34 5.1.2 Sediment pore waters ............................................................................................................................... 34 5.1.3 Comparison of short-term and mid-term metal release...................................................................... 38
6 Conclusions ................................................................................................................................................................. 39 7 References .................................................................................................................................................................. 40 8 Appendices ................................................................................................................................................................ 41
iii

List of Tables Table 1. Corer reactors Samples and Tests........................................................................................................................ 6 Table 2. Soil Samples for Rapid Remobilisation Tests ....................................................................................................... 7 Table 3. pH of Water and Surface Sediments during Corer-reactor Experiments...................................................... 8 Table 4. Water Specific Electrical Conductivity (SEC) during Corer-reactor Experiments ........................................ 9 Table 5. Water pH and SEC during Sediment Resuspension Phase of Experiments ................................................. 10 Table 6. Alkalinity and Concentrations of Trace Metals and Metalloids Released: Point Sturt, Freshwater Core
3 ............................................................................................................................................................................... 13 Table 7. Alkalinity and Concentrations of Trace Metals and Metalloids Released: Point Sturt, Freshwater Core
4 ............................................................................................................................................................................... 14 Table 8. Alkalinity and Concentrations of Trace Metals and Metalloids Released: Point Sturt, Seawater Core 5
................................................................................................................................................................................. 15 Table 9. Alkalinity and Concentrations of Trace Metals and Metalloids Released: Boggy Creek, Freshwater
Core 1 ..................................................................................................................................................................... 16 Table 10. Alkalinity and Concentrations of Trace Metals and Metalloids Released: Boggy Creek, Seawater
Core 2 ..................................................................................................................................................................... 17 Table 11 Alkalinity and Concentrations of Trace Metals and Metalloids Released: Boggy Creek, Seawater
Core 9 ..................................................................................................................................................................... 18 Table 12. Porewater pH at the Completion of the 8-week Inundation Experiments ............................................... 19 Table 13. Trace Metals and Metalloids in Sediment Pore Waters................................................................................ 20 Table 14. Effect of Time on Acidity and Metal Release during Rapid Remobilisation Tests.................................... 23 Table 15. Effect of Time on the Rapid Remobilisation of Trace Metals and Metalloids........................................... 24 Table 16. Effect of Soil:water Ratio on pH During Rapid Remobilisation Tests........................................................... 26 Table 17. Effect of Soil:water Ratio on SEC (mS/cm) During Rapid Remobilisation Tests ........................................ 27 Table 18. Effect of Soil:water Ratio on Rapid Remobilisation of Trace Metals and Metalloids .............................. 28 Table 19. Effect of Standard and Additional Leaches on pH During Remobilisation Tests ..................................... 29 Table 20. Effect of Standard and Additional Leaches on Remobilisation of Trace Metals and Metalloids......... 30 Table 21. Standard Leaches using Freshwater and Seawater on additional Soil Samples ..................................... 32 Table 22. Water Quality Guidelines (µg/L) for Fresh water of varying Hardness and Seawater ............................. 33 Table 23. Mean Concentrations of pH, SEC, and Dissolved Metals and Metalloids during Water Exchange and
Resuspension (non-renewal) Periods and WQG Values for Fresh Water and Seawater.......................... 36 Table 24. Exceedances of WQG Values for Fresh Water and Seawater (renewal phase) (ratio of dissolved
concentration to WQG value). .......................................................................................................................... 37
iv

v
List of Figures Figure 1. Comparison of the dissolved Al, Fe, Mn, As, Cd and Co concentrations measured in the six corer-
reactors (mean ± standard deviation) for the weekly water renewal and resuspension periods: Point Sturt (2× fresh water, 1× seawater) and Boggy Creek (1× fresh water, 2× seawater) .............................. 11
Figure 2. Comparison of the dissolved Cr, Cu, Ni, Pb, V and Zn concentrations measured in the six corer-reactors (mean ± standard deviation) for the weekly water renewal and resuspension periods: Point Sturt (2× freshwater, 1× seawater) and Boggy Creek (1× fresh water, 2× seawater). .............................. 12
Figure 3. Relationship between porewater pH and porewater Al, Mn, Cr, Co, Cr and Ni concentrations: Point Sturt (2× freshwater, 1× seawater) and Boggy Creek (1× freshwater, 2× seawater) cores. .................... 21
Figure 4. Relationship between porewater pH and porewater Fe, As, V, Cd, Zn and Pb concentrations: Point Sturt (2× freshwater, 1× seawater) and Boggy Creek (1× freshwater, 2× seawater) cores. .................... 22
Figure 5. Comparison between the dissolved Al, Cu and Zn concentrations measured in the rapid-release tests undertaken for (i) Lakes Albert and Alexandrina soils () previous rapid-release data (Freshwater, Simpson et al., 2008), (ii) freshwater tests for soils from field-trail sites (), (iii) seawater tests for soils from field-trail sites (), and (iv) for mean metal release during the resuspension phase of the mid-term corer reactor experiments (weeks 3-6) (). Where shown, the lines represent the freshwater (red) and seawater (blue) water quality guidelines for 80% (solid) and 95% (dashed) species protection (Table 22). ............................................................................................................................ 31

1 Executive Summary Laboratory-based experiments have been undertaken to quantify the potential for mobilisation of acid and metals from acid sulfate soils (ASS) in the Lower Lakes following inundation with seawater or freshwater. The experiments were designed to assist in the interpretation of results from field-based inundation experiments being undertaken concurrently (Hicks et al., 2009), and also to allow better comparison with results from rapid-release tests previously undertaken by Simpson et al. (2008) on a wider range of ASS. The experiments were undertaken using sediment cores collected from the same sites as the concurrent field experiments, and inundation was using freshwater from the River Murray or seawater collected near the barrages. Undisturbed sediment cores from Boggy Creek and Point Sturt were inundated with the test water in purpose-built corer-reactors, in which the cores were collected. The water quality parameters, pH, specific electrical conductance and dissolved concentrations of alkalinity, chloride, sulfate and metal/metalloids were monitored. For the first 17 days, the water was replaced with new water on days 2, 4, 7, 10, and 17; with gentle stirring of overlying water in between. Beyond day 17, no further water exchanges were made, but the experiments were modified to investigate the effects of sediment resuspension on water quality. On days 17, 21 and 28, a short period of intense stirring of the overlying water was used to resuspended the top 3 cm layer of the sediments in each corer-reactor. From days 28 to 53, the corer-reactors were stirred, and measurements made weekly. The experiments were terminated on day 54, and 10 cm sediment cores were taken from the centre of each of the reactors and porewater extracted for the measurement of pH and porewater metal concentrations. The pH of the overlying water remained above pH 7 during the water-renewal phase of the corer reactor experiments. Upon contact of the freshwater and seawater with the Point Sturt soils, the water alkalinity generally decreased, however for the Boggy Creek soils there was a release of alkalinity. For both soil types, seawater inundation of the cores caused significantly greater release Al, Mn, Co and Pb (and Zn for Boggy Creek cores), than the freshwater inundation. This was attributed to the higher ionic strength of seawater increasing the exchange of metals from sediment particles. Following resuspension of the surface sediments, the overlying water pH dropped by 0.3 to 0.8 pH units. For the Point Sturt cores, the resuspension of surface sediments resulted in removal of alkalinity in both freshwater and seawater inundation experiments. For the Boggy Creek cores, the resuspension of surface sediments resulted in large increases of alkalinity for the freshwater inundation experiment, but small decrease or unchanged alkalinity for the seawater inundation experiments. For both freshwater and seawater inundation experiments, the resuspension of the surface sediments resulted in minor to moderate changes (increases or decreases) in the metals released from the Point Sturt cores, but generally caused large increases in metals released for the Boggy Creek cores. For Boggy Creek, the resuspension-induced release of iron was 20 to >100-fold (both waters) and manganese was ~ 2-fold for seawater and >100-fold for freshwater inundation tests. Most of the iron and manganese release was likely to have been directly from the pore waters. The resuspension of the surface sediments caused increases of the order of 2-10 fold for As, Co, Ni, Pb, and Zn, but had little affect on the concentrations of Cd and Cr, and induced moderate removal of Al, Cu, and V. Porewater metal concentrations were generally much greater in the seawater inundation tests than the freshwater inundation tests. Pore water concentrations increased with increasing sediment depth, consistent with the higher acidity (lower pH) of the deeper sediments, which were generally pH 3 from 15 cm below the sediment water interface to the base of the cores at -20 cm. The dissolved metal concentrations within the sediment pore waters were much greater than the concentrations being released to the overlying water and the increased rate of release of metals from the sediments during resuspension was likely to be in part due to porewater-derived metals. In order to provide supplementary information, rapid release tests were undertaken for each soil using the same procedures as used previously (Simpson et al., 2008). These additional tests also investigated the influence of water type, solid:water ratio, leaching duration rates and sequential leaches on water quality. In the rapid-release tests, greater concentrations of metals were generally released from the soils by mixing with seawater than with fresh water. In general, the magnitude of the metal release from the soils was similar to that observed previously by Simpson et al. (2008). Aluminium, Fe and Mn release generally increased with increasing period of resuspension, but the concentrations of other metals/metalloids metals released within 30 min was not generally significantly different to that measured after 24 h (i.e. concentrations varied within a 2-4 fold range). Increases in total suspended solids (TSS) concentration had only minor effects on the release of most of the metals/metalloids, indicating that after 24 h of resuspension the majority of the metals appear to be in pseudo-equilibrium with the solid phase. The repeated leaches of the same soil indicated that while acidity may be washed out of the soils, significant acidity carried through to the next cycle. With each successive leach of the soils, the concentrations of most metals (not V) released from the soils generally decreased 2-10 fold compared to the previous leach cycle. This is consistent with there being a finite pool of metals available for release, rather than there being an ongoing source of weakly bound metals being released from the soil particles. The potential ecological effects were considered with respect to water pH and concentrations of dissolved metals and metalloids released from the soils to the overlying water relative to the Australian water quality guidelines (WQGs) ANZECC/ARMCANZ (2000). The 80% and 95% protection concentrations were used. For metals whose toxicity is known to be influenced by hardness, and for which hardness algorithms are available (i.e. Cd, Cr(III), Cu, Ni, Zn, and Pb), the freshwater trigger values were adjusted based on a water hardness of 400 mg/L.
1
Simpson et al. (2008) previously observed that when sulfidic/sulfuric soils from the Lower Lakes region were resuspended in River Murray water, the water quality guidelines (WQGs) were exceeded only in cases where the waters became pH 5 or less. In the corer-reactor experiments the mean pH of the overlying water was greater than pH 7 throughout the first 17 days (weekly water renewal phase). During the resuspension phase, the pH dropped significantly, but generally remained above pH 5. Despite the pH remaining above pH 5, there were exceedances of WQGs, and the exceedances were much greater for the inundation with seawater than for freshwater. For seawater, the exceedances were (in order of magnitude) Al > Mn > Co > Pb > Cu > Cd ~ Zn, and for the freshwater inundation experiments there were minor exceedances for Cu, Cd and V. Overall, the study indicated that only short-term exceedances to the WQGs for metals would be expected to occur if the pH of the overlying water remained above pH 6. Moderate dilution of the waters overlying the inundated sediments with surrounding waters is expected to result in both increased water pH and attenuation of dissolved metals released from the sediments. Exceedances of WQGs would be expected to be more frequent in shallow regions of the lake where water exchange is restricted. To provide a better understanding of how the spatial variability in soil properties may affect metal-release when inundated with seawater and fresh water, it is recommended that rapid-release tests using seawater and freshwater are undertaken using soils collected from a greater range of sites in the lakes. While these tests may not provide accurate information on actual rates of metal release, they provide a useful means of determining which metals are available and contrasting the likely worst-case metal release from soils when inundated with different water types, and would thereby aid the risk assessment process.
2

2 Introduction The South Australian Environmental Protection Authority (SA EPA) has requested that both laboratory- and field-based mobilisation experiments be undertaken to quantify the potential for mobilisation of contaminants from acid sulfate soils (ASS) in the Lower Lakes following rewetting with seawater or fresh water. It is intended that the results of the experiments be used to inform the Environmental Impact Statement (EIS) being prepared for the introduction of Seawater in the Lakes system. In order to meet the tight deadline of the EIS, results from experiments were requested in a final draft report by July 31, 2009. In a recent ecological risk assessment (ERA) of the impact of acidification, acid and a number of metals (Al, Co, Cu, Fe-floc, and V) were identified as contaminants of concern in relation to their possible elevated concentrations, bioavailability, and potential effects, when compared to water quality guidelines (Stauber et al., 2008). While rapid (24-h) acid and metal mobilisation experiments provided some information on the risks posed by these contaminants mobilised by freshwaters (Simpson et al. 2008), limited information was available for seawater-induced mobilisation. The preliminary risk assessment highlighted that to provide information on likely chronic effects to aquatic and benthic organisms, greater information was required on the mid-term (e.g. 96-h) mobilisation of acid and metals/metalloids and formation of potentially toxic metal flocs caused by the inundation of sulfidic/sulfuric ASS with either fresh water or seawater (Simpson et al. 2008; Stauber et al., 2008). To provide information for an environmental impact statement (EIS), long-term field-trails were undertaken in parallel with this study at two sites in the lower Lakes system to contrast the difference in response of two soil types to inundation with freshwater and seawater. The two sites were selected on the basis of being representative of air-exposed soils that have developed considerable acidity: Point Sturt, a sandy soil; and Boggy Creek, an organic-rich clayey soil. To assist the interpretation of results from the field-trial seawater/freshwater inundation experiments being undertaken concurrently (Hicks et al., 2009), laboratory-based experiments were used to assess the release of acidity and metals/metalloids from soils. Sediment cores were collected from each of the field-trail sites and re-wetting was undertaken using both freshwater and seawater. In these corer-reactors tests, the overlying water was gently stirred and renewed weekly during the first 17 days. From day 17, resuspension of the surface sediments was induced at the start of each week to simulate the action of strong water currents. Gentle stirring was then applied and no further water changes were made. To assist in the comparison of the results of the rapid remobilisation experiments undertaken by Simpson et al (2008) with the long term field trials and the mid-term corer-reactor experiments, additional rapid remobilisation tests were undertaken on a range of soil samples collected from the two sites. These experiments investigated rapid remobilisation of metals/metalloids following rewetting with freshwater and seawater. Then influence of solid:water ratio, leaching duration rates and sequential leaches with new water was also investigated. The results of the short- to medium-term laboratory-based experiments are discussed in terms of potential environmental impacts associated with the release of metals/metalloids from the soils under scenarios of rewetting with both freshwater and seawater.
3

3 Methods
3.1 Sampling Sites and Samples
3.1.1 Soil samples
The site selection and sample collection was made at the same sites as used for the field-trails. The two sites were Boggy Creek and Point Sturt and photographs of the site at the time of collection, and the collection of the samples are shown in Appendix A. The sampling of both sites was undertaken on July 7, 2009. The soils in the area to the south of the Point Sturt mesocosms (Appendix B) was disturbed by the deployment machinery used to construct the experimental site. The reactor cores were thus collected from the northern, undisturbed side of the mesocosms, generally within 5 m of a tank. Descriptions of the coring sites are given in Appendix A, Table A1. Three cores were collected from Point Sturt. The sediment sampled at Point Sturt was a fairly uniform moist sand with no pronounced morphological stratification. Coring was achieved by pushing the corer with its attached handle firmly into the sediment, in a clockwise spiral direction, so that the lid did not unscrew from the core tube. Gradually (within a minute or two) the tube penetrated to the required depth (~16 cm) as marked by a measuring rod. To minimise disturbance of the soil within the corer, one side of the sand was dug out with a stainless steel spade to remove the core, and from this side a flexible polyethylene cutter was pushed in immediately underneath it. A 20 mm thick disk of closed cell foam was then worked in under the core, immediately above the inserted PE cutter. This was done in a manner so as to not lose wet sand from the core. The sand was firm enough for this task to be completed fairly easy. A closed cell foam disk was pushed up into the base of the core tube to retain the core contents while the outer rim was cleaned (washed and wiped with tissue). The core was secured with the PVC base and then its breather hole taped. After this, two pieces of the same closed cell foam were placed immediately above the top of the cores to better secure them for road transport. Immediately after the core was secured, additional samples (~300 g) were taken from the site (0-5 cm depth) using a plastic trowel. All 0-5 cm samples were taken within 0.5 m of the coring in non-disturbed ground. The cores from Boggy Creek were collected here using the same technique as at Point Sturt. In this case, the disturbed site was the northern side and so coring took place south of the microcosms. Descriptions of the coring sites are given in Appendix A, Table A1. Three cores were collected from Boggy Creek. The soils at this site were very non-uniform and layered. There was a black hard clayey cracked soil layer on top that after 5-10 cm depth, changed to a lighter coloured sand. There was underlain by a light-coloured clay underneath that. As well as 0-5 cm samples, 0-1 cm soil samples were taken. All 0-5 cm and 0-1 cm samples were collected within 1 m of the cores.
3.1.2 Water samples
The freshwater for the rewetting experiments was collected from the River Murray at Wellington on 30 July, 2009. The seawater for the field and laboratory rewetting experiments was collected from the Coorong at Mundoo Island Barrage on 29 July, 2009. This water was stored in 5000 L plastic tanks at each site and sub-sampled for the laboratory experiment on the 13 July 2009. Three 20-L containers of freshwater and three 20-L containers of seawater were collected into acid-washed containers and transported to CSIRO at Lucas Heights.
3.2 Corer-reactor Acid/Metal Release Tests
3.2.1 General analytical
All glass and plasticware for trace metals analyses were usually new and were cleaned by soaking in 10% (v/v) HNO3 (BDH, Analytical Reagent grade) for a minimum of 24 h, followed by repeated rinsing with deionised water (Milli-Q, 18 MΩ). New bottles, washed and rinsed with Milli-Q, were used for sampling and analyses of major elements, alkalinity and nutrients. All chemicals were analytical reagent grade or equivalent analytical purity. Measurements of pH and redox potential were made using pH and Eh probes and meters (Simpson and Batley, 2003). The specific electrical conductance (SEC: WTW LF 320 meter and TetraCon 325 probe) and dissolved oxygen (DO: WTW Oxi 196 meter and EO96 oxygen electrode) were measured according to manufacturers’ instructions. Measurements of sediment pH was made using a combination spear-tip electrode (Hanna). Water samples were filtered through 0.45 µm membrane filters immediately following collection. For major and trace element analyses, samples were preserved with 0.2% concentrated HNO3 (Tracepur, Merck). For other analytes, samples were refrigerated at 4 ºC and analysed within 7 days. Dissolved concentrations of Na, K, Ca, Mg, Al, and Fe in water samples were determined by inductively coupled plasma atomic emission spectrometry (ICP-AES, CIROS, Spectro) and all other trace elements were analysed by inductively coupled plasma mass spectrometry (ICPMS, Agilent 7500 CE). Water alkalinity was measured by automated titration with a pH 4.5 end-point for total alkalinity (APHA 2005; Method 2320 B). Dissolved concentrations of major anions and dissolved organic carbon
4

(DOC) were analysed using standard methods (USEPA, 1996; APHA, 2005); namely chloride by titration, sulfate by ICP-AES, and DOC using an automated carbon analyser. Analysis blanks and duplicate analyses comprised at least 10% of the samples, spiked recoveries analyses of certified reference materials were used to check the accuracy of the methods. Particulate metals were analysed following digestion of dried and ground samples in hot concentrated 2:1 HCl:HNO3 (aqua-regia microwave digestion) followed by dilution and filtration (<0.45 µm). Acids were high purity (Merck Suprapur). QA/QC included sample blanks and duplicates and a certified reference material (PACS-2, National Research Council, Canada). Total organic carbon (TOC) was analysed using an automated carbon analyser (APHA, 2005). The significance of data relationships was determined using t-tests and correlations (Pearson’s product moment) using NCSS statistical software (NCSS, Utah, USA).
3.2.2 Corer-reactor operation
Corer-reactors were used for assessing acid and metal fluxes from sediments (Jung et al., 2003; Simpson et al., 2002) (Appendix B). The corer-reactor chambers had a 146 mm diameter (167.4 cm2 area × 5.97 cm depth = 1 L) and allowed for control of stirring rate and dissolved oxygen concentration, the measurement of water quality parameters (e.g. pH, EC, DO), ready sampling and renewal of waters. These corer-reactors were used in paired experiments inundated with freshwater and seawater, respectively. The inundation with freshwater or seawater was undertaken by trickling in the desired amount of water using a clean plastic volumetric cylinder which had a series of holes at the bottle to allow the water to trickle out at a rate of approximately 100 mL/min. For the seawater rewetting experiments, two cores were used from Boggy Creek and one core from Point Sturt (Table 2). For the freshwater rewetting experiments, one core was from Boggy Creek and two cores were from Point Sturt (Table 1). For each freshwater/seawater pair, the two cores were chosen as those that appeared to be most similar. The Point Sturt cores all appeared quite similar (Cores 3, 4 = fresh water, Core 5 = seawater). Of the Boggy Creek cores, two were similar with surface efflorescences (Core 1 = fresh water; Core 2 = seawater), while the third did not and appeared darker in colour (Core 9 = seawater).
Water renewal mode
The rewetting schedule for the corer-reactors is given in Appendix B (Table B1). The rewetting water undertaken in stages, in which the water was initially added to a depth of 10 cm above the soil surface (~1.67 L of overlying water), the water was stirred gently (~30 rpm), and after 1 h 100 mL of water was taken for analyses. The water inundation was then continued to achieve a 15-cm water depth and stirring was commenced. After 6 h from commencement, a second 100 mL of water was taken for analyses, then replaced with new water. On days 2, 4, 7 and 10, 100 mL of water was removed for analyses in the morning, then the entire water-column was removed and replaced with new water. On each of these days, after 5-6 h, a second 100 mL of water was taken for analyses, then replaced with new water.
Resuspension mode
Wind-induced water currents (seiches) are expected to occur in the lake, and the impacts of these currents is expected to increase the movement of porewater near the soil surface and resuspend surface sediments. From day 17, the experimental program was modified to induce resuspension of the top 2-3 cm of the sediment cores (Appendix B, Table B2). This was achieved using a more powerful stirrer (~300 rpm), through three 5-second stirring periods within 30 seconds, with the stirring blade placed just above the sediment surface. These resuspension events were applied on days 17, 21 and 28, and water quality was monitored for a regular period following the resuspension events. No further water exchanges were made. Column surface water pH, conductivity and dissolved oxygen were measured on every sampling occasion. When complete renewal of the water column occurred (at the start of each sampling day), and before addition of the new water, the pH of the surface sediment was measured using a spear-tipped (penetrating) pH electrode. This electrode was pushed up to 5 cm into the sediment and the pH recorded.
Monitoring mode and deconstruction of cores
For the final four weeks (to day 53) the corer-reactors continued to be stirred, water quality monitored and the samples collected at the end of each week. On day 54, 10-cm sediment cores were taken from the centre of each of the reactors and porewater extracted for the measurement of pH and porewater metal concentrations. Sediment pore water was extracted by centrifugation (5 min, 1700 g, 18-22 ºC) under a nitrogen atmosphere. Pore water and overlying water samples were rapidly filtered through acid-washed 0.45 µm membrane filters (Minisart, Sartorius) immediately following collection and acidified with concentrated HNO3 (2% HNO3 (v/v), Tracepur, Merck). Dissolved metals in the pore waters were measured by ICP-AES calibrated with matrix-matched standards.
5

Table 1. Corer reactors Samples and Tests Release Tests
Point Sturt Water Static Resuspension Core 3 Murray River Weeks 1-3 Weeks 3-5 Core 4 Murray River Weeks 1-3 Weeks 3-5 Core 5 Seawater Weeks 1-3 Weeks 3-5
Boggy Creek Core 1 Seawater Weeks 1-3 Weeks 3-5 Core 2 Seawater Weeks 1-3 Weeks 3-5 Core 9 Murray River Weeks 1-3 Weeks 3-5
3.3 Rapid Release Tests These tests were undertaken to allow the rapid release data that had been gathered in previous research studies (e.g. Simpson et al., 2008; Fitzpatrick et al., 2009) to be better interpreted in relation to the mid-term reactor tests and long-term field tests. Rapid release tests were performed as described previously (Simpson et al., 2008a), but with additional experiments undertaken to provide information on (i) sequential leaching, the effects of solid:water ratio, and (iii) release rates.
3.3.1 Acid and metal mobilisation tests
The soils were used as collected, i.e. they were not dried further. The rapid remobilisation of acidity and metals was evaluated by resuspending the test soil in the test water (fresh water or seawater) for the required period of time. The containers were 250 mL low density polyethylene bottles (Nalgene), which were rolled at 50 rpm on a bottle roller. At the completion of the resuspension period, a 0.45 µm-filtered water sample was taken for analyses of alkalinity and major ions (Cl, SO4, Na, K, Ca, Mg), and dissolved trace metals and metalloids (Ag, Al, As, Cd, Co, Cr, Cu, Fe, Mn, Ni, Pb, Se, V, Zn). The pH and SEC of the water were measured at the start and finish of all tests. The waters stayed well-oxygenated (e.g. dissolved oxygen was >6 mg/L) throughout the experiments. The standard leach tests involved resuspending 15 g of soil in 150 mL of test water for 24 h. The samples selected for the standard rapid release tests were Point Sturt samples Core 4/0-5 cm and Core 5/0-5 cm, and Boggy Creek samples Core 9/0-1 cm, and Core 9/1-5 cm (Table 1). For each of these tests, the leaching was repeated several times to determine whether there is likely to be on-going acid and metal release, or whether the subsequent leaching of greatly diminished. The relationship between metal release and TSS was investigated for three soils using both freshwater and seawater at soil:water ratios of 0.1, 1, 10 and 100 g soil/L and a resuspension period of 24 h. The kinetics of metal mobilisation was investigated for three soils using both freshwater and seawater at a soil:water ratio of 100 g soil/L and a resuspension period of 0.5, 3. 7 and 24 h.
6

4 Results
4.1 Corer-reactor Experiments
4.1.1 Soil pH
The paste-pH values measured for surface soil samples collected close to the sediment cores are shown in Table 2. There was no distinctly different surface layer at Point Sturt and the pH measured represents an average of the top 5 cm For all the Point Sturt soils, the pH was 3. At Boggy Creek, the windy conditions that had prevailed in the days before sample collection had dried out the soil surface, and two layers were sampled for paste-pH measurements: 0-1 cm and 1-5 cm depth. The Boggy Creek soils had near neutral pH in the top 1 cm, but were acidic in the 1-5 cm depth fraction.
Table 2. Soil Samples for Rapid Remobilisation Tests Location a Depth, cm Paste pH Point Sturt b Core 3 0-5 2.9 Core 4 0-5 3.0 Core 5 0-5 2.9 Boggy Creek b Core 1 0-1 7.4 Core 1 1-5 5.6 Core 2 0-1 7.1 Core 2 1-5 3.9 Core 9 0-1 6.8 Core 9 1-5 3.3
a Soil samples were collected immediately adjacent to where the cores were collected for the corer-reactor tests b At Point Sturt, there was no major horizon in the top 0-5 cm and this depth section was collected as one. At Boggy Creek, the top 0-1 cm appear more oxidised than the deeper soil, and two sections were collected
4.1.2 Overlying water pH and SEC
The freshwater and seawater used for the experiments had pH of 7.6 and 7.8, respectively, and SEC of 1.80±0.05 and 52±1 mS/cm, respectively. The pH and specific electrical conductivity (SEC) measured following re-wetting of cores with freshwater and seawater from Boggy Creek and Point Sturt is shown in Tables 3-5. The fresh water from the River Murray was pH 7.5 and the seawater was pH 8.0. The pH of the water overlying the sediment cores remained > pH 6.5 throughout the re-wetting cycles (weeks 1-3) (Table R1). During this period, the water overlying the Boggy Creek cores had pH 7.6±0.2, 7.3±0.3, 7.6±0.1 (mean ±standard deviation) for cores 1 (freshwater), 2 and 9 (both seawater), respectively. For the Point Sturt cores, the overlying water had pH 7.5±0.3, 7.3±0.4, 7.6±0.2 (mean ±standard deviation) for cores 3, 4 (both freshwater) and 5 (seawater), respectively. The pH of the porewater in the surface sediments was measured on two occasions, on days 2 and 10. For all cores the pH in the surface sediments appeared to be less acidic than the deeper sediments (Table 1). For the Port Sturt cores, the (conductivity of the overlying water was 1.8-2.0 mS/cm for freshwater tests and 51-54 mS/cm for seawater tests. For the Boggy Creek cores, the conductivity of the overlying water was 2.0-4.1 mS/cm for freshwater tests and 52-55 mS/cm for seawater tests. The sediment resuspension experiments were undertaken to simulate a scenario of significant wind-induced high turbulence within the water column, which could be expected to resuspend the surface sediments. Following resuspension of the surface sediments the water pH dropped by 0.3 to 0.8 pH units. For the freshwater inundation of Point Sturt core 3, the weekly sediment resuspension events caused further decreases in the pH of the overlying water, but did not greatly affect the pH in the other experiments. The sediment resuspension resulted in increases in SEC for the Boggy Creek – Freshwater experiment (from ~7 to ~8 mS/cm), but did not cause large changes to the SEC for the other tests. From day 28 to day 54 the overlying water was stirred and weekly monitoring indicated that the water pH and SEC did not change significantly.
7

4.1.3 Trace metal and metalloid concentrations
The concentrations of alkalinity, chloride, sulfate and trace metals/metalloids measured following re-wetting of cores with freshwater and seawater from Boggy Creek and Point Sturt is shown in Tables 6-11. The QA/QC procedures for the analyses are provided in Appendix C. The variation between duplicate analyses was low, spiked recoveries were excellent and results for the certified reference materials within the certified range. The alkalinity of the River Murray freshwater (FW) was approximately 80 mg CaCO3/L, which is relatively high. The alkalinity of the seawater (SW) was approximately 135 mg CaCO3/L. Upon contact of the FW and SW with the Point Sturt soils, the water alkalinity generally decreased, however the Boggy Creek soils appeared to release alkalinity during the freshwater inundation experiments (Tables 6-11). For both soil types, seawater inundation caused significantly greater release Al, Mn, Co and Pb (and Zn for Boggy Creek cores), than the freshwater inundation (Figures 1 and 2). This was expected due to the higher ionic strength of seawater increasing the displacement of metals from soils particles by exchange reactions. For Cu , Fe and V, the release may have been initially greater for seawater than freshwater, but Cu and V were expected to be rapidly scavenged by iron hydroxide phases that form due to the oxidation of released Fe(II), followed by precipitation of Fe(OH)3 at the sediment-water interface (Simpson and Batley, 2003; Simpson et al., 2009).
4.1.4 Effect of surface sediment resuspension
For the Point Sturt cores, the resuspension of surface sediments resulted in a decrease in the water alkalinity in both freshwater and seawater inundation experiments. For the Boggy Creek cores, the resuspension of surface sediments resulted in large increases of alkalinity for the freshwater inundation experiment, but small decreases or unchanged alkalinity for the seawater inundation experiments. The resuspension of the surface layers of the submerged soils/sediments generally caused significant changes in the release rates of many substances compared to that occurring without disturbance (Tables 6 to 11). For the Boggy Creek freshwater laboratory inundation experiment, the resuspension of surface sediments also released significant amounts of chloride and sulfate. For both freshwater and seawater inundation experiments, the resuspension of the surface sediments resulted in minor to moderate changes (increases or decreases) in the metal released from the Point Sturt cores, but generally caused large increases in metals released from the Boggy Creek cores (Figures 1 and 2). For the Boggy Creek cores, the sediment resuspension caused large increases in release of Fe, Mn, Co, Pb, and Zn and small increases in the release of arsenic and nickel.
Table 3. pH of Water and Surface Sediments during Corer-reactor Experiments Boggy Creek Reactors Point Sturt Reactors
Core Core 1 Core 2 Core 9 Core 3 Core 4 Core 5 Water Freshwater Seawater Seawater Freshwater Freshwater Seawater
Day 1 (week 1) 9:00 AM 7.2 6.6 7.8 7.0 6.8 7.6 12:00 PM 7.5 7.2 7.6 7.3 7.4 7.8 3:00 PM 7.6 7.2 7.6 7.4 7.6 7.8 Day 2
9:00 AM 7.8 7.1 7.5 7.5 7.7 7.5 3:00 PM 7.5 7.5 7.9 7.4 7.4 7.8 Day 4
9:00 AM 7.8 7.3 7.5 7.7 7.8 7.3 3:00 PM 7.6 7.7 7.8 7.4 7.7 7.8
Day 7 (week 2) 9:00 AM 7.9 7.5 7.6 7.8 7.9 7.3 Day 10 9:00 AM 7.9 7.5 7.6 7.9 7.9 7.5
Day 17 (week 3) 9:00 AM 7.4 7.3 7.5 7.4 7.3 7.6
Day / depth in sediment Sediment pH
2 / 2 cm depth 7.3 6.8 5.8 3.5 3.7 6.2 2 / 3 cm depth 7.3 6.6 5.0 2.8 2.8 2.7 2 / 4 cm depth 7.2 6.1 3.1 2.6 2.6 2.4
10 / 2 cm depth 7.0 6.3 6.5 3.8 5.4 6.3 10 / 3 cm depth 7.2 6.3 6.2 3.1 3.7 4.8 10 / 4 cm depth 6.8 5.7 4.3 2.8 3.3 3.4 10 / 5 cm depth 6.3 4.5 4.0 2.6 3.1 3.0
8

Table 4. Water Specific Electrical Conductivity (SEC) during Corer-reactor Experiments Boggy Creek Reactors Point Sturt Reactors
Core Core 1 Core 2 Core 9 Core 3 Core 4 Core 5 Water Freshwater Seawater Seawater Freshwater Freshwater Seawater
Specific Electrical Conductivity (SEC, mS/cm) Day 1 (week 1)
9:00 AM 4.1 52.6 52.3 1.8 1.9 52.6 12:00 PM 3.3 52.6 52.3 1.8 1.8 53.0 3:00 PM 3.0 52.5 52.4 1.8 1.8 52.8 Day 2
9:00 AM 3.2 52.4 51.7 1.8 1.8 53.0 3:00 PM 2.1 52.4 52.4 1.8 1.8 52.6 Day 4
9:00 AM 2.7 51.1 52.6 1.8 1.8 52.9 3:00 PM 2.0 52.5 52.7 1.8 1.8 52.7
Day 7 (week 2) 9:00 AM 2.7 51.8 52.7 1.8 2.0 53.3
Day 17 (week 3) 9:00 AM 3.2 53.2 53 1.8 1.8 53.4
9

Table 5. Water pH and SEC during Sediment Resuspension Phase of Experiments Boggy Creek Reactors Point Sturt Reactors
Core Core 1 Core 2 Core 9 Core 3 Core 4 Core 5 Water Freshwater Seawater Seawater Freshwater Freshwater Seawater
Resuspension event 1 pH Day 17 (week 3)
3:00 PM 7.1 6.5 6.4 6.5 6.9 6.4 Day 18 9:00 AM 7.3 6.9 6.8 7.0 7.2 6.8
Resuspension event 2 Day 21 (week 4)
9:00 AM 7.5 7.3 7.4 7.2 7.5 7.3 11:30 PM 6.9 6.4 6.5 5.6 6.7 6.3 3:00 PM 7.0 6.6 6.6 5.6 6.8 6.3 Day 23 9:00 AM 7.3 6.8 6.8 6.2 7.1 7.0 Day 25 9:00 AM 7.3 6.9 7.0 6.7 7.3 7.2
Resuspension event 3 Day 28 (week 5)
9:00 AM 7.3 6.9 7.1 6.3 7.5 7.3 3:00 PM 6.8 6.5 6.6 4.7 6.9 6.5
Day 30, 9 am 7.3 6.7 6.7 4.7 7.4 7.1 Day 32, 9 am 7.5 6.9 6.9 4.8 7.5 7.3 Day 39, 9 am 7.4 7.2 7.3 4.3 7.3 7.3 Day 46, 9 am 7.6 7.3 7.4 4.4 7.3 7.5 Day 53, 9 am 7.6 7.4 7.5 4.3 7.4 7.7
Resuspension event 1 Specific Electrical Conductivity (SEC, mS/cm) Day 17 (week 3)
3:00 PM 5.1 53.9 54.5 1.9 1.8 55.2 Day 18 9:00 AM 5.3 54.6 55.1 1.9 1.9 55.3
Resuspension event 2 Day 21 (week 4)
9:00 AM 5.5 56.7 57.4 2.0 2.0 57.6 11:30 PM 6.8 26.1 57.1 2.0 1.9 57.5 3:00 PM 6.8 55.9 55.6 2.0 1.9 56.9 Day 23 9:00 AM 6.7 57.1 56.4 2 1.9 57.7 Day 25 9:00 AM 6.9 59 58.2 2.1 1.9 59.4
Resuspension event 3 Day 28 (week 5)
9:00 AM 6.9 59.7 59.3 2.1 2.0 60.1 3:00 PM 8.2 59.3 58.5 2.2 1.9 59.7
Day 30, 9 am 8.2 59.1 58.1 2.1 1.9 59.8 Day 32, 9 am 8.1 59.0 58.1 2.1 1.9 59.6 Day 39, 9 am 8.1 58.9 58.1 2.2 2.0 59.7 Day 46, 9 am 8.3 59.4 58.8 2.3 2.2 60.4 Day 53, 9 am 8.1 59.3 58.8 2.3 2.0 60.1
10

0
50
100
150
200
250
FW-1 FW-2 SW-1 FW-3 SW-2 SW-3
Point Sturt Boggy Creek
Dis
solv
ed A
lum
iniu
m,
µg
/L
Water renewal phase
Resuspension phase
0
2
4
6
8
10
12
FW-1 FW-2 SW-1 FW-3 SW-2 SW-3
Point Sturt Boggy Creek
Dis
solv
ed A
rsen
ic,
µg
/L
Water renewal phase
Resuspension phase
0
0.2
0.4
0.6
0.8
1
1.2
1.4
FW-1 FW-2 SW-1 FW-3 SW-2 SW-3
Point Sturt Boggy Creek
Dis
solv
ed C
adm
ium
, µ
g/L
Water renewal phase
Resuspension phase
0
20
40
60
80
100
120
140
FW-1 FW-2 SW-1 FW-3 SW-2 SW-3
Point Sturt Boggy Creek
Dis
solv
ed C
ob
alt,
µg
/L
Water renewal phase
Resuspension phase
1
10
100
1000
10000
100000
FW-1 FW-2 SW-1 FW-3 SW-2 SW-3
Point Sturt Boggy Creek
Dis
solv
ed I
ron
, µ
g/L
Water renewal phase
Resuspension phase
1
10
100
1000
10000
100000
FW-1 FW-2 SW-1 FW-3 SW-2 SW-3
Point Sturt Boggy Creek
Dis
solv
ed M
ang
anes
e, µ
g/L
Water renewal phase
Resuspension phase
Figure 1. Comparison of the dissolved Al, Fe, Mn, As, Cd and Co concentrations measured in the six corer-reactors (mean ± standard deviation) for the weekly water renewal and resuspension periods: Point Sturt (2× fresh water, 1× seawater) and Boggy Creek (1× fresh water, 2× seawater)
11

12
0
0.5
1
1.5
2
2.5
3
FW-1 FW-2 SW-1 FW-3 SW-2 SW-3
Point Sturt Boggy Creek
Dis
solv
ed C
hro
miu
m,
µg
/L
Water renewal phase
Resuspension phase
0
2
4
6
8
10
12
14
16
FW-1 FW-2 SW-1 FW-3 SW-2 SW-3
Point Sturt Boggy Creek
Dis
solv
ed C
op
per
, µ
g/L
Water renewal phase
Resuspension phase
0
1
2
3
4
5
6
7
8
FW-1 FW-2 SW-1 FW-3 SW-2 SW-3
Point Sturt Boggy Creek
Dis
solv
ed N
icke
l, µ
g/L
Water renewal phase
Resuspension phase
0
20
40
60
80
100
120
FW-1 FW-2 SW-1 FW-3 SW-2 SW-3
Point Sturt Boggy Creek
Dis
solv
ed L
ead
, µ
g/L
Water renewal phase
Resuspension phase
0
5
10
15
20
25
30
FW-1 FW-2 SW-1 FW-3 SW-2 SW-3
Point Sturt Boggy Creek
Dis
solv
ed V
anad
ium
, µ
g/L
Water renewal phase
Resuspension phase
0
10
20
30
40
50
60
70
80
FW-1 FW-2 SW-1 FW-3 SW-2 SW-3
Point Sturt Boggy Creek
Dis
solv
ed Z
inc,
µg
/L
Water renewal phase
Resuspension phase
Figure 2. Comparison of the dissolved Cr, Cu, Ni, Pb, V and Zn concentrations measured in the six corer-reactors (mean ± standard deviation) for the weekly water renewal and resuspension periods: Point Sturt (2× freshwater, 1× seawater) and Boggy Creek (1× fresh water, 2× seawater).

Table 6. Alkalinity and Concentrations of Trace Metals and Metalloids Released: Point Sturt, Freshwater Core 3 Alkalinity Acidity Cl SO4 Al Fe Mn As Cd Co Cr Cu Ni Pb V Zn
Sampling mg CaCO3/L mg/L mg/L µg/L µg/L µg/L µg/L µg/L µg/L µg/L µg/L µg/L µg/L µg/L µg/L Day 1, 9 am 21 1 15 0.68 0.81 0.56 <0.02 1.75 <0.03 1.65 0.66 4.42 Day 1, 12 pm 2 <1 9 0.84 0.35 0.32 <0.02 6.49 0.07 1.22 0.60 4.06 Day 1, 3 pm 4 501 2 <1 7 0.81 0.66 0.25 <0.02 8.77 0.90 1.33 0.62 7.15 Day 2, 9 am 6 513 <1 <1 11 0.72 0.29 0.35 <0.02 8.11 0.16 1.21 0.56 3.29 Water change Day 2, 3 pm 8 492 2 <1 2 0.72 0.144 0.099 0.03 1.904 0.016 0.956 0.731 9.14 Day 4, 9 am 68 516 <2 <1 11 0.81 0.11 0.27 <0.02 2.29 <0.03 1.08 0.61 4.07 Water change Day 4, 10 am 5 <1 2 0.84 0.09 <0.15 <0.02 1.59 <0.03 0.84 0.66 5.77 Day 4, 3 pm 95 495 92 <2 <1 3 0.86 0.08 <0.15 <0.02 1.34 <0.03 0.81 0.64 2.59 Day 7, 9 am 77 2 505 95 4 <1 11 0.91 0.11 0.20 <0.02 1.66 <0.03 1.34 0.68 3.73 Water change Day 10, 9 am 77 6 506 94 <2 <1 8 0.85 0.11 <0.15 <0.02 1.48 <0.03 1.41 0.65 1.75 Water change Day 17, 9 am 59 2 519 91 <2 <1 2 0.84 0.09 <0.15 <0.02 1.53 <0.03 2.06 0.69 1.58 Resuspension event 1 Day 17, 11 pm <2 4 100 0.65 0.26 2.93 <0.02 0.94 <0.03 5.58 0.17 3.38 Day 17, 3 pm 33 2 513 104 <2 1 100 0.72 0.30 2.81 <0.02 0.92 0.03 5.05 0.20 2.61 Day 18, 9 am 18 2 518 105 <2 <1 99 0.63 0.16 2.04 <0.02 0.91 <0.03 3.20 0.21 1.08 Day 21, 9 am 18 2 528 107 <2 <1 52 0.82 0.09 0.57 <0.02 1.02 <0.03 2.02 0.31 0.66 Resuspension event 2 Day 21, 11 am 70 26 140 0.58 0.41 4.26 <0.02 0.71 0.05 7.44 0.10 4.67 Day 21, 3 pm 18 4 537 117 39 12 150 0.68 0.41 4.05 <0.02 0.60 <0.03 8.03 0.10 4.45 Day 23, 9 am 7 19 538 114 <4 22 143 0.83 <0.05 <0.15 <0.02 1.06 <0.03 5.28 0.28 0.10 Day 25, 9 am <1 2 130 0.69 0.26 2.35 <0.02 0.62 <0.03 4.36 0.17 2.08 Day 28, 9 am 1 2 120 0.62 0.32 2.32 <0.02 0.62 <0.03 0.40 0.18 3.07 Resuspension event 3 Day 28, 3 pm 200 12 200 0.69 0.62 5.11 0.05 0.77 <0.03 12.7 0.10 6.81 Day 30, 9 am 230 9 210 0.65 0.70 6.18 0.12 0.86 <0.03 13.6 0.10 7.52 Day 32, 9 am 180 8 210 0.70 0.71 5.71 0.10 0.86 0.04 11.7 0.10 7.94 Day 39, 9 am 284 8 224 0.70 0.82 6.35 0.12 0.96 0.03 14.5 <2 7.75 Day 46, 9 am <1 15 560 139 386 12 242 1.01 0.90 7.41 0.16 1.33 0.13 17.1 0.73 8.79 Day 53, 9 am 308 5 234 6 <1 7 <1 <1 20 45 1 12
13

Table 7. Alkalinity and Concentrations of Trace Metals and Metalloids Released: Point Sturt, Freshwater Core 4 Alkalinity Acidity Cl SO4 Al Fe Mn As Cd Co Cr Cu Ni Pb V Zn
Sampling mg CaCO3/L mg/L mg/L µg/L µg/L µg/L µg/L µg/L µg/L µg/L µg/L µg/L µg/L µg/L µg/L Day 1, 9 am 23 1 24 0.86 1.20 0.87 <0.02 10.3 0.17 2.30 0.51 11.7 Day 1, 12 pm 6 <1 9 0.91 1.67 0.30 <0.02 18.4 0.06 1.23 0.56 6.38 Day 1, 3 pm 6 <1 <1 7 0.79 1.30 0.21 <0.02 19.0 0.03 1.06 0.38 4.14 Day 2, 9 am 3 <1 <1 9 0.70 0.98 0.28 <0.02 18.5 0.06 1.13 0.31 3.75 Water change Day 2, 3 pm 6 503 <1 <1 2 0.83 0.15 <0.15 0.30 3.34 0.14 2.12 0.50 2.52 Day 4, 9 am 72 502 5 4 1 0.74 0.16 <0.15 <0.02 4.59 <0.03 0.74 0.31 1.24 Water change Day 4, 10 am 9 <1 1 0.89 0.10 <0.15 <0.02 1.83 <0.03 0.67 0.60 2.16 Day 4, 3 pm 81 501 83 <2 <1 2 0.87 0.10 <0.15 <0.02 1.95 <0.03 0.71 0.50 2.35 Day 7, 9 am 83 2 497 84 3 <1 1 0.80 0.09 <0.15 <0.02 3.47 0.06 0.78 0.40 4.22 Water change Day 10, 9 am 85 12 496 84 4 <1 < 1 0.74 0.07 <0.15 <0.02 2.10 0.06 0.67 0.42 0.72 Water change Day 17, 9 am 82 2 502 78 <2 <1 < 1 0.94 0.26 <0.15 <0.02 2.32 <0.03 0.66 0.38 1.44 Resuspension event 1 Day 17, 11 pm <2 <1 11 0.70 0.09 0.34 <0.02 1.28 <0.03 1.28 0.18 0.82 Day 17, 3 pm 55 2 498 81 <2 <1 11 0.74 0.08 0.34 <0.02 1.25 <0.03 1.22 0.21 0.75 Day 18, 9 am 48 2 502 80 <2 <1 9 0.74 0.06 0.25 <0.02 1.20 <0.03 1.01 0.24 0.67 Day 21, 9 am 48 4 504 83 <2 <1 <1 0.91 <0.05 <0.15 <0.02 1.27 <0.03 0.59 0.32 0.30 Resuspension event 2 Day 21, 11 am <2 1 8 0.58 0.13 0.22 <0.02 1.01 0.05 0.89 0.19 0.87 Day 21, 3 pm 33 2 491 85 <2 <1 8 0.56 0.06 0.20 <0.02 1.19 0.14 0.87 0.20 2.20 Day 23, 9 am 35 8 505 82 <1 <1 2 0.83 <0.05 <0.15 <0.02 1.06 <0.03 0.54 0.28 0.10 Day 25, 9 am <1 <1 <1 0.73 <0.05 <0.15 <0.02 1.07 <0.03 0.45 0.32 0.13 Day 28, 9 am <1 <1 <1 0.96 <0.05 <0.15 <0.02 1.16 0.40 <0.14 0.34 0.18 Resuspension event 3 Day 28, 3 pm <1 <1 <1 0.61 <0.05 <0.15 <0.02 0.97 <0.03 0.43 0.24 0.12 Day 30, 9 am 1 <1 < 1 0.81 <0.05 0.04 0.03 1.11 <0.03 0.51 0.35 0.06 Day 32, 9 am <1 6 <1 0.79 <0.05 0.04 0.02 1.11 <0.03 0.43 0.39 0.08 Day 39, 9 am <2 <1 <1 1.09 0.02 <0.15 0.04 1.19 <0.03 0.51 <2 <0.59 Day 46, 9 am 33 1 515 81 19 1 <1 1.06 <0.05 0.08 0.03 1.18 <0.03 0.61 <1 <0.59 Day 53, 9 am 17 6 <0.3 6 <1 0 <1 <1 2 33 1 2
14

Table 8. Alkalinity and Concentrations of Trace Metals and Metalloids Released: Point Sturt, Seawater Core 5 Alkalinity Acidity Cl SO4 Al Fe Mn As Cd Co Cr Cu Ni Pb V Zn
Sampling mg CaCO3/L mg/L mg/L µg/L µg/L µg/L µg/L µg/L µg/L µg/L µg/L µg/L µg/L µg/L µg/L
Day 1, 9 am 86 52 300 3.04 0.85 1.93 1.67 0.67 <0.03 4.30 0.83 4.33 Day 1, 12 pm 11 <7 10 2.42 0.52 0.554 0.17 1.89 <0.03 1.24 0.95 1.94 Day 1, 3 pm 15 19900 13 <7 14 2.16 0.42 0.57 0.34 2.35 <0.03 1.20 1.02 1.31 Day 2, 9 am 17 19700 97 <7 84 2.68 0.53 3.28 0.69 2.65 1.47 7.10 1.21 5.08 Water change Day 2, 3 pm 19 19500 140 <7 39 1.37 0.13 1.45 0.45 0.76 0.45 3.16 1.17 1.42 Day 4, 9 am 81 19500 120 <7 300 2.68 0.60 11.7 0.28 2.32 5.94 25.4 0.87 10.5 Water change Day 4, 10 am 110 <7 37 2.35 0.05 1.51 0.36 0.53 0.81 3.18 1.33 0.84 Day 4, 3 pm 113 19800 3190 150 <7 50 2.64 0.11 2.09 0.48 0.71 1.03 4.16 1.33 1.12 Day 7, 9 am 81 18 19300 3190 72 <7 320 2.29 0.41 12.0 0.41 2.42 8.00 24.6 0.86 8.27 Water change Day 10, 9 am 99 19500 3080 74 <7 180 1.85 0.18 6.67 0.32 1.85 6.10 13.5 0.94 4.91 Water change Day 17, 9 am 82 8 49 <7 200 2.33 0.17 6.4 0.42 1.56 6.59 11.8 0.98 4.36 Resuspension event 1 Day 17, 11 pm <4 <7 250 2.05 0.21 8.26 0.33 0.87 2.72 14.6 0.33 9.34 Day 17, 3 pm 55 12 <4 <7 250 1.44 0.13 8.30 0.20 0.65 2.74 14.4 0.29 7.13 Day 18, 9 am 49 2 <4 <7 250 1.84 0.22 8.19 0.20 0.51 1.60 13.6 0.47 7.83 Day 21, 9 am 55 12 <4 <7 230 2.79 0.04 7.13 0.08 0.90 0.49 9.84 0.88 5.71 Resuspension event 2 Day 21, 11 am 25 <7 290 2.79 0.29 9.88 0.15 0.68 12.3 14.1 0.35 9.57 Day 21, 3 pm 29 12 12 <7 280 3.01 0.19 10.4 0.11 0.58 11.2 14.9 0.47 11.0 Day 23, 9 am 29 12 <4 <7 260 2.73 0.31 8.69 0.09 0.59 4.08 12.2 0.56 7.75 Day 25, 9 am <4 <7 240 1.91 0.25 7.69 0.10 0.62 1.87 9.97 0.59 6.79 Day 28, 9 am <4 <7 240 2.36 0.26 7.03 0.09 0.68 1.10 8.11 0.67 4.98 Resuspension event 3 Day 28, 3 pm 5 22 260 1.74 0.24 7.99 0.08 0.45 3.20 10.7 0.49 6.73 Day 30, 9 am <4 4 250 2.35 0.28 <0.15 7.41 0.55 1.08 8.86 0.45 4.28 Day 32, 9 am <4 <7 230 2.70 0.25 6.54 0.06 0.47 0.42 7.68 0.53 3.44 Day 39, 9 am <10 <10 184 1.90 0.28 4.59 0.04 0.71 0.15 6.58 <2 2.33 Day 46, 9 am 40 12 17800 2600 <10 <10 100 2.39 0.21 2.47 0.24 0.94 0.19 4.99 12 2.13 Day 53, 9 am 49 78 44 83 <11 <11 <3 <1 35 767 14 65
15

Table 9. Alkalinity and Concentrations of Trace Metals and Metalloids Released: Boggy Creek, Freshwater Core 1 Alkalinity Acidity Cl SO4 Al Fe Mn As Cd Co Cr Cu Ni Pb V Zn
Sampling mg CaCO3/L mg/L mg/L µg/L µg/L µg/L µg/L µg/L µg/L µg/L µg/L µg/L µg/L µg/L µg/L Day 1, 9 am 5 3 180 2.39 0.07 0.66 <0.02 5.09 <0.03 1.59 5.78 2.44 Day 1, 12 pm 29 9 350 4.37 0.08 1.38 0.07 11.6 0.05 2.65 12.8 3.11 Day 1, 3 pm 3 22 9 290 4.45 0.08 1.21 0.03 15.1 0.06 2.49 13.1 2.58 Day 2, 9 am 6 734 16 17 380 6.26 0.08 1.71 0.15 13.6 0.07 3.56 22.1 1.65 Water change Day 2, 3 pm 4 547 <1 3 97 2.02 0.06 0.44 <0.02 3.24 <0.03 1.40 7.42 2.25 Day 4, 9 am 104 634 3 18 280 6.42 0.03 1.37 0.18 6.36 0.18 3.35 25.8 1.80 Water change Day 4, 10 am <2 3 79 2.04 0.05 0.31 <0.02 1.98 <0.03 1.14 7.97 1.93 Day 4, 3 pm 95 542 <2 3 110 2.37 <0.05 0.38 0.05 2.20 <0.03 1.33 10.9 1.72 Day 7, 9 am 126 648 355 2 19 290 6.49 <0.05 1.29 0.23 5.29 0.05 3.61 28.0 1.75 Water change Day 10, 9 am 135 630 325 <2 18 280 6.76 <0.05 1.03 0.24 4.25 0.06 3.35 26.7 1.65 Water change Day 17, 9 am 124 4 710 413 <2 36 520 7.47 <0.05 1.23 0.32 4.31 0.08 4.42 23.7 1.89 Resuspension event 1 Day 17, 11 pm 21 2700 3700 9.93 0.11 13.9 0.54 3.98 0.59 19.9 15.3 9.80 Day 17, 3 pm 163 8 919 1180 15 1300 3700 9.12 0.10 11.9 0.52 3.79 0.58 17.4 13.5 8.60 Day 18, 9 am 150 8 922 1260 8 490 3600 9.56 0.12 6.44 0.47 3.92 0.63 13.1 15.3 5.10 Day 21, 9 am 156 12 932 1300 3 310 3400 9.54 0.05 5.09 0.50 3.61 0.45 11.0 13.6 4.90 Resuspension event 2 Day 21, 11 am 34 7600 5900 12.0 0.09 21.1 0.74 3.08 0.71 29.7 9.75 17.1 Day 21, 3 pm 146 12 1050 1910 17 5500 5800 8.43 0.08 21.4 0.69 2.91 0.52 30.5 8.71 16.9 Day 23, 9 am 126 8 1040 1790 12 5800 1300 6.15 0.11 16.7 0.48 3.92 0.57 24.0 5.70 10.3 Day 25, 9 am 9 5900 1100 6.07 0.10 13.8 0.49 4.04 0.56 20.8 6.91 9.09 Day 28, 9 am 8 6000 1100 6.17 0.10 12.2 0.48 3.53 0.63 18.7 6.68 8.25 Resuspension event 3 Day 28, 3 pm 18 10000 9500 10.6 0.08 20.8 0.72 2.46 1.04 31.5 8.06 14.9 Day 30, 9 am 16 9200 3400 6.98 0.06 22.3 0.79 3.22 1.04 30.1 6.54 10.0 Day 32, 9 am 12 8900 3400 6.99 0.09 17.8 0.61 3.22 1.01 23.2 7.05 7.87 Day 39, 9 am 14 8140 3100 7.76 0.11 12.0 0.52 4.71 0.84 22.5 <10 9.42 Day 46, 9 am 128 8 1130 2430 10 7620 2540 6.62 0.11 9.80 0.51 5.23 0.97 17.6 14 8.48 Day 53, 9 am 39 2480 7840 12 <1 6 <1 <1 14 68 10 12
16

Table 10. Alkalinity and Concentrations of Trace Metals and Metalloids Released: Boggy Creek, Seawater Core 2 Alkalinity Acidity Cl SO4 Al Fe Mn As Cd Co Cr Cu Ni Pb V Zn
Sampling mg CaCO3/L mg/L mg/L µg/L µg/L µg/L µg/L µg/L µg/L µg/L µg/L µg/L µg/L µg/L µg/L Day 1, 9 am 300 7 4600 4.16 0.63 23.0 0.45 4.22 0.64 30.9 9.00 28.1 Day 1, 12 pm 180 <7 5900 2.97 1.13 32.2 0.41 8.40 0.32 35.4 9.86 32.6 Day 1, 3 pm 23 19600 160 <7 5800 3.64 0.92 31.0 0.55 9.31 0.29 32.1 10.5 30.1 Day 2, 9 am 25 19000 145 31 9550 3.72 1.61 51.8 0.92 8.28 0.30 51.4 16.8 43.9 Water change Day 2, 3 pm 17 19700 56 <7 1700 1.80 0.33 8.35 0.57 1.76 <0.03 8.51 5.19 7.16 Day 4, 9 am 118 19600 39 55 5400 3.70 0.87 26.7 0.66 3.82 0.05 22.3 17.8 18.7 Water change Day 4, 10 am 5 <7 840 2.41 0.14 4.71 0.40 0.80 <0.03 4.07 5.15 2.89 Day 4, 3 pm 118 19800 3250 19 <7 1100 1.98 0.21 6.62 0.41 1.01 <0.03 5.61 7.17 4.45 Day 7, 9 am 143 23 19500 3560 8 110 4100 3.27 0.60 21.9 0.56 2.70 0.60 17.1 16.3 16.4 Water change Day 10, 9 am 151 18 19700 3490 <4 140 3200 2.25 0.60 19.3 0.35 1.89 0.06 13.7 13.0 12.7 Water change Day 17, 9 am 141 19 <4 350 4200 2.25 0.50 25.2 0.40 2.20 <0.03 17.1 7.89 14.5 Resuspension event 1 Day 17, 11 pm 31 19000 8400 3.74 0.72 78.3 0.59 1.99 0.40 66.3 6.45 69.4 Day 17, 3 pm 106 31 23 17000 8500 3.75 0.77 79.2 0.56 2.51 0.40 67.6 2.84 79.0 Day 18, 9 am 128 35 <4 8600 8800 3.00 0.91 82.7 0.45 1.88 <0.03 66.4 1.12 63.6 Day 21, 9 am 134 12 <4 410 8800 2.58 0.72 72.3 0.21 3.77 0.03 47.6 0.65 36.9 Resuspension event 2 Day 21, 11 am 38 26000 12000 7.61 0.66 129 1.76 2.87 0.75 88.6 5.63 84.0 Day 21, 3 pm 126 42 27 24000 13000 5.69 0.67 119 0.58 2.70 0.20 80.1 2.30 82.8 Day 23, 9 am 130 23 <4 6000 12000 4.14 0.73 108 0.358 2.61 0.04 71.4 0.63 56.3 Day 25, 9 am <4 2900 11000 3.00 0.51 101 0.16 2.38 0.03 66.1 0.40 50.3 Day 28, 9 am 4 8200 12000 3.58 0.51 97.8 0.31 2.25 <0.03 5.90 0.57 42.5 Resuspension event 3 Day 28, 3 pm 63 49000 15000 10.4 0.17 117 0.62 1.69 0.22 89.3 2.81 51.3 Day 30, 9 am 15 19000 14000 6.34 0.20 7.41 <0.053 1.27 <0.03 82.6 0.64 41.5 Day 32, 9 am <4 5100 14000 5.89 0.25 126 0.31 1.62 <0.03 91.8 0.64 37.0 Day 39, 9 am <10 514 13900 5.72 0.28 76.1 0.45 3.55 <0.03 74.8 <2 18.6 Day 46, 9 am 118 31 1650 459 <10 1290 14300 4.36 0.25 64.7 0.32 3.80 0.04 64.1 <10 17.1 Day 53, 9 am 4 214 13400 68 <11 38 <3 <1 67 686 31 46
17

18
Table 11 Alkalinity and Concentrations of Trace Metals and Metalloids Released: Boggy Creek, Seawater Core 9 Alkalinity Acidity Cl SO4 Al Fe Mn As Cd Co Cr Cu Ni Pb V Zn
Sampling mg CaCO3/L mg/L mg/L µg/L µg/L µg/L µg/L µg/L µg/L µg/L µg/L µg/L µg/L µg/L µg/L Day 1, 9 am 190 <7 6000 2.50 0.96 17.4 0.43 4.80 <0.03 27.9 3.24 14.1 Day 1, 12 pm 170 <7 4800 3.77 1.14 14.2 0.57 7.41 0.33 18.1 5.02 10.4 Day 1, 3 pm 19 19800 140 <7 4800 2.29 1.02 15.0 0.51 9.31 <0.03 16.4 5.42 8.35 Day 2, 9 am 19 20200 71 <7 7700 2.47 1.39 20.8 0.63 10.0 0.20 20.0 8.59 9.75 Water change Day 2, 3 pm 17 19800 23 <7 1400 2.76 0.25 4.16 0.38 1.75 <0.03 3.83 3.06 1.23 Day 4, 9 am 118 14 <7 7200 2.44 1.18 19.8 0.35 4.17 <0.03 16.7 9.08 6.40 Water change Day 4, 10 am <4 <7 1200 2.03 0.18 3.87 0.45 1.03 <0.03 3.23 3.14 1.64 Day 4, 3 pm 118 19700 3320 42 <7 1600 1.88 0.28 5.64 0.44 1.14 <0.03 4.41 3.95 2.38 Day 7, 9 am 143 17 19800 3750 9 57 7700 3.48 1.14 28.5 0.44 5.37 <0.03 21.5 7.73 9.86 Water change Day 10, 9 am 144 18 19400 3550 7 110 5600 2.01 0.67 28.1 0.38 1.83 <0.03 21.2 4.58 9.71 Water change Day 17, 9 am 128 15 <4 79 6000 2.09 0.55 34.1 0.18 2.01 <0.03 24.1 2.47 10.6 Resuspension event 1 Day 17, 11 pm 56 19000 11000 3.86 1.02 101.0 0.65 1.89 0.15 108 3.16 71.6 Day 17, 3 pm 18 27 31 18000 11000 3.53 1.16 107.2 0.58 2.89 <0.03 113 0.85 74.0 Day 18, 9 am 77 19 <4 8400 11000 2.27 1.02 103 0.35 2.14 <0.03 105 0.30 63.2 Day 21, 9 am 108 23 <4 100 10000 3.02 0.85 89.7 0.25 5.35 <0.03 73.1 0.23 32.9 Resuspension event 2 Day 21, 11 am 34 18000 13000 5.60 0.75 128 0.48 3.07 0.22 100 3.78 59.5 Day 21, 3 pm 95 39 15 16000 13000 5.25 0.75 127 0.42 3.14 0.09 100 1.45 62.9 Day 23, 9 am 95 23 <4 3200 12000 3.96 0.80 114 0.17 2.97 <0.03 86.1 0.27 42.8 Day 25, 9 am <4 750 12000 2.64 0.72 103 0.19 3.07 <0.03 76.0 0.20 33.4 Day 28, 9 am <4 6100 12000 3.70 0.60 103 0.23 2.86 <0.03 77.7 0.30 28.4 Resuspension event 3 Day 28, 3 pm 58 41000 14000 8.56 0.17 129 0.40 1.49 0.04 104 1.96 35.5 Day 30, 9 am 12 13000 14000 4.88 0.22 111 0.42 2.12 <0.03 91.5 0.35 26.9 Day 32, 9 am <4 2300 13000 3.79 0.15 110 0.16 2.12 <0.03 82.3 0.44 22.1 Day 39, 9 am <10 867 13400 4.55 0.25 86.7 0.21 5.80 0.10 85.7 <2 15.8 Day 46, 9 am 93 26 17880 4230 <10 527 12800 3.90 <0.05 80.7 0.19 5.66 0.03 75.0 7 12.8 Day 53, 9 am 8 90 12600 85 <11 69 0 <1 95 703 26 47

4.1.5 Porewater pH and dissolved metals
The greater density of seawater than freshwater may potentially induce greater downward transport of acidity and metals during the initial infiltration period. Although pH measurements were made on days 2 and 10, to depths of up to 5 cm below the sediment water interface (Table 3), it was unclear whether differences in water density influenced the differences in pH between treatments (insufficient data to test significance). At the completion of the 8-week reactor experiments, the sediment cores were deconstructed and the porewater pH and dissolved metals measured (Table 12). Due to the short periods of resuspension of the top 2-3 cm of the cores in the middle stages of the tests, differences in porewater pH were difficult to interpret in relation to water type. For both Boggy Creek soil cores inundated with seawater the pH was lower than the one Boggy Creek soil core inundated with freshwater, at all depths. However, due to the low number of replicates, it was not possible to determine whether these differences were significant. There was relatively high variability in the final porewater pH between the replicate cores (i.e. same site, same inundation water type). However, the trend was the same for all treatments. Although the pH of the surface sediment was similar to that measured in soils collected from nearby sites (Table 2), the pH of the pore water became increasing more acidic at greater depths. These final pH values were also similar to those measured on days 2 and 10 of the inundation experiments. Comparison of the porewater pH values measured at a depth of 4 cm on the various days (2, 10, and 54) indicated that there may have been some neutralisation of the porewater in the seawater inundation tests with both soils (Tables 3 and 12). In general, these porewater pH measurements indicated that little neutralisation of the acidity had occurred during the 8-week tests, and was consistent with the only minor changes to the overlying water pH that were observed (Tables 3 and 5). Generally the pH was 3 from 15 cm below the sediment water interface to the base of the cores at -20 cm.
Table 12. Porewater pH at the Completion of the 8-week Inundation Experiments Boggy Creek Reactors Point Sturt Reactors
Depth Core 1 Core 2 Core 9 Core 3 Core 4 Core 5 cm Freshwater Seawater Seawater Freshwater Freshwater Seawater
Paste-pH, 0-1 7.4 7.1 6.8 Paste-pH, 1-5 5.6 3.9 3.3
2.9 3.0 2.9
0-3 6.8 6.1 6.0 3.9 6.5 6.5 3-6 6.5 6.0 5.2 3.2 4.2 5.4 6-9 6.0 5.8 4.3 3.0 3.4 3.5
9-12 4.7 4.1 3.4 2.8 3.2 3.1 12-15 3.9 3.3 3.2 2.7 3.0 3.0 15-18 3.1 2.8 2.7 2.6 2.9 2.8
The metal concentrations in the pore waters of the cores at the completion of the 56-day tests are shown in Table 13. For all elements, porewater concentrations were generally much greater in the seawater inundation tests than the freshwater inundation tests (Figure 3). For the majority of the metals and metalloids, the pore water concentrations increased with increasing sediment depth. This was consistent with the higher acidity (lower pH) of the deeper sediments (Figure 3). Iron(II), the major dissolved form of iron in the pore waters, is particularly redox sensitive (i.e. readily oxidised) and appeared to have a maxima at approximate 10 cm depth for most sediment cores. The concentrations of arsenic, a metalloid and oxy-anion that readily adsorbs to iron hydroxide phases and is also redox sensitive, is likely to have been significantly influenced by the porewater iron chemistry.
19

20
Table 13. Trace Metals and Metalloids in Sediment Pore Waters Core Al Fe Mn As Cd Co Cr Cu Ni Pb V Zn
Depth, cm mg/L µg/L
BC-1, 0-3 0.013 0.97 14.9 30 1 12 4 <10 35 206 <6 10
BC-1, 3-6 0.011 20.1 19.0 <20 <1 12 2 <10 49 204 <6 5
BC-1, 6-9 0.007 65.8 21.3 <20 <1 44 <2 <10 55 216 <6 15
BC-1, 9-11 0.22 378 30.5 50 3 236 4 <10 235 272 9 326
BC-1, 11-13 4.48 600 35.8 90 15 441 10 <10 472 247 52 915
BC-1, 13-15 22.1 234 45.0 50 15 534 16 40 636 354 73 1490
BC-2, 0-3 0.012 58.5 16.4 60 <1 26 4 <10 60 663 <6 10
BC-2, 3-6 0.012 146 20.7 50 <1 43 4 <10 85 664 <6 17
BC-2, 6-9 0.043 483 24.4 60 5 122 2 <10 91 683 9 55
BC-2, 9-12 0.49 1190 30.1 90 15 319 10 <10 177 606 42 386
BC-2, 12-15 18.9 881 33.2 120 23 400 16 <10 431 513 112 1110
BC-2, 15-17 62.5 22.2 35.2 60 11 390 31 97 638 636 6 1510
BC-9, 0-3 0.015 179 20.8 50 <1 122 <2 <10 166 746 8 1330
BC-9, 3-6 0.039 469 29.4 90 5 247 5 <10 244 654 15 1470
BC-9, 6-9 3.62 809 37.6 120 16 453 7 <10 482 578 45 1800
BC-9, 9-11 23.2 765 45.3 90 21 533 16 <10 629 630 147 1330
BC-9, 11-13 38.8 604 45.4 60 17 510 19 22 677 592 229 1480
BC-9, 13-15 100 220 52.4 90 17 523 42 99 805 527 215 1800
BC-9, 15-17 119 110 52.9 70 17 514 50 95 838 654 111 1710
PS-3, 0-3 1.35 0.11 0.54 <20 5 22 2 <10 40 42 <6 55
PS-3, 3-6 4.20 1.16 1.4 <20 5 52 16 <10 92 43 <6 52
PS-3, 6-9 88.6 4.90 2.4 90 9 89 42 18 149 50 10 103
PS-3, 9-11 1.88 11.7 4.2 <20 5 156 82 34 266 71 53 175
PS-3, 11-13 28.7 14.2 5.1 20 10 181 103 38 287 51 49 264
PS-3, 13-16 45.0 9.77 6.7 30 5 239 56 36 365 54 10 161
PS-4, 0-3 0.31 0.006 0.004 40 <1 <10 <2 <10 3 30 <6 <5
PS-4, 3-6 0.38 0.072 0.049 <20 29 <10 4 <10 7 81 <6 27
PS-4, 6-9 0.83 0.30 0.25 <20 1 11 6 <10 16 36 <6 21
PS-4, 9-12 1.06 0.44 0.48 <20 1 19 7 <10 40 39 <6 <5
PS-4, 12-15 1.16 0.57 0.69 <20 1 23 11 <10 51 79 <6 6
PS-4, 15-17 1.57 0.49 0.86 <20 1 27 3 <10 66 45 <6 59
PS-5, 0-3 0.003 0.008 0.022 30 <1 <10 4 <10 26 662 <6 72
PS-5, 3-6 0.14 0.050 0.045 50 <1 <10 2 <10 29 689 11 108
PS-5, 6-9 1.75 0.37 0.13 70 1 <10 5 14 39 1350 8 222
PS-5, 9-12 2.36 0.73 0.19 50 3 <10 10 15 27 1000 7 219
PS-5, 12-14 4.53 2.57 0.37 60 2 17 11 25 39 841 9 34
PS-5, 14-16 26.3 1.70 1.20 40 <1 51 32 42 99 723 15 140
PS-5, 16-18 33.1 1.93 1.43 40 <1 61 37 41 126 709 9 759

0
20000
40000
60000
80000
100000
120000
140000
2 3 4 5 6 7 8
Porewater pH
Po
rew
ate
r Al,
mg
/L
Boggy Creek - Freshwater
Boggy Creek - Seawater
Point Sturt -Seawater
Point Sturt -Freshwater
0
20
40
60
80
100
120
2 3 4 5 6 7 8
Porewater pH
Po
rew
ate
r Cr,
µg
/L
Boggy Creek - Freshwater
Boggy Creek - Seawater
Point Sturt -Seawater
Point Sturt -Freshwater
0
50
100
150
200
250
2 3 4 5 6 7 8
Porewater pH
Por
ew
ate
r C
r, µ
g/L
Boggy Creek - Freshwater
Boggy Creek - Seawater
Point Sturt -Seawater
Point Sturt -Freshwater
0
100
200
300
400
500
600
700
800
900
2 3 4 5 6 7 8
Porewater pH
Po
rew
ate
r N
i, µ
g/L
Boggy Creek - Freshwater
Boggy Creek - Seawater
Point Sturt -Seawater
Point Sturt -Freshwater
0
100
200
300
400
500
600
2 3 4 5 6 7 8
Porewater pH
Por
ew
ate
r C
o, µ
g/L
Boggy Creek - Freshwater
Boggy Creek - Seawater
Point Sturt -Seawater
Point Sturt -Freshwater
00000
10000
20000
30000
40000
50000
60000
2 3 4 5 6 7 8
Porewater pH
Por
ew
ate
r M
n, m
g/L
Boggy Creek - Freshwater
Boggy Creek - Seawater
Point Sturt -Seawater
Point Sturt -Freshwater
Figure 3. Relationship between porewater pH and porewater Al, Mn, Cr, Co, Cr and Ni concentrations: Point Sturt (2× freshwater, 1× seawater) and Boggy Creek (1× freshwater, 2× seawater) cores.
21

22
000
200000
400000
600000
800000
1000000
1200000
1400000
2 3 4 5 6 7 8
Porewater pH
Po
rew
ate
r F
e, m
g/L
Boggy Creek - Freshwater
Boggy Creek - Seawater
Point Sturt -Seawater
Point Sturt -Freshwater
0
200
400
600
800
1000
1200
1400
1600
1800
2000
2 3 4 5 6 7 8
Porewater pH
Po
rew
ate
r Z
n, µ
g/L
Boggy Creek - Freshwater
Boggy Creek - Seawater
Point Sturt -Seawater
Point Sturt -Freshwater
0
20
40
60
80
100
120
140
2 3 4 5 6 7
Porewater pH
Po
rew
ate
r A
s, µ
g/L
8
Boggy Creek - Freshwater
Boggy Creek - Seawater
Point Sturt -Seawater
Point Sturt -Freshwater
0
200
400
600
800
1000
1200
1400
1600
2 3 4 5 6 7
Porewater pH
Po
rew
ate
r P
b, m
g/L
8
Boggy Creek - Freshwater
Boggy Creek - Seawater
Point Sturt -Seawater
Point Sturt -Freshwater
0
50
100
150
200
250
2 3 4 5 6 7 8
Porewater pH
Po
rew
ate
r V
, mg
/L
Boggy Creek - Freshwater
Boggy Creek - Seawater
Point Sturt -Seawater
Point Sturt -Freshwater
0
5
10
15
20
25
30
35
2 3 4 5 6 7 8
Porewater pH
Po
rew
ate
r C
d, m
g/L
Boggy Creek - Freshwater
Boggy Creek - Seawater
Point Sturt -Seawater
Point Sturt -Freshwater
Figure 4. Relationship between porewater pH and porewater Fe, As, V, Cd, Zn and Pb concentrations: Point Sturt (2× freshwater, 1× seawater) and Boggy Creek (1× freshwater, 2× seawater) cores.

23
4.2 Short-term, Rapid Release of Acidity and Metals from Soils To enable better comparisons between the results of the field trials, the mid-term acidity and metal release in the corer-reactors, and the rapid remobilisation experiments undertaken previously, the short-term, rapid release of acidity and metals from a number of the soils was also investigated. To provide information of mechanisms of acid and metal release, experiments were undertaken to determine: (i) the kinetics of metal release over 24 h; (ii) the influence of soil:water ratio on the amount of substance released; and (iii) acid and metal release in 2nd and 3rd cycles.
4.2.1 Effect of time on acidity and metal release
The kinetics of metal mobilisation, along with changes in pH, was investigated for three soils using both freshwater and seawater at a soil:water ratio of 100 g soil/L and a mixing (remobilisation) period of 0.5, 3. 7 and 24 h (Tables 14-16). The dissolved oxygen concentrations were 8-9 mg/L during these tests. For both freshwater and seawater experiments, the mixing of the soil and waters caused the pH to decrease (Table 14). The decrease in water pH was greater for freshwater than for seawater. The pH change caused by mixing of the soil and water tended to stabilise within a few hours of mixing, after which the pH remained relatively constant. The soils collected from greater depth was more acidic and caused a larger decrease in water pH. The metal release measured after 0.5 h was within an order of magnitude of the metal release measured after 24 h. All metal concentrations measured during the resuspension period were within a factor of two of the mean concentration measured. For Al, Fe and Mn, the metal release generally increased with increasing period of resuspension. For the other metals/metalloids, the concentration of metals released with 30 minutes was not generally significantly different to that measured after 24 h (i.e. concentrations varied within a 2-4 fold range) (Table 15). For the majority of cases (for all time periods), greater concentrations of metals were released from the soils by mixing with seawater than for the soils mixed with freshwater. Greater concentrations of iron were measured in the freshwater rapid release tests than in the seawater tests and was attributed not to greater release of iron, but greater removal of iron which rapidly flocculates in the higher ionic strength seawater.
Table 14. Effect of Time on Acidity and Metal Release during Rapid Remobilisation Tests Time, h
Sample site 0.5 3 7 24 Remobilisation pH in freshwater
Murray River Water Control (Blank) 7.6 7.6 7.6 7.6 Boggy Creek Core 9, 0-1 cm 7.2 6.9 7.0 7.2 Core 9, 0-5 cm 4.6 4.4 4.1 4.2 Core 9, 0-5 cm (dup.) 5.1 4.2 4.1 4.3 Pt. Sturt Core 4, 0-5cm 6.7 6.5 6.4 6.5
Remobilisation pH in seawater Seawater Control (Blank) 7.7 7.7 7.7 7.7 Boggy Creek Core 9, 0-1 cm 7.0 6.7 6.7 6.9 Core 9, 0-5 cm 5.4 4.3 4.2 4.3 Core 9, 0-5 cm (dup.) 5.4 4.3 4.7 4.1 Pt. Sturt Core 4, 0-5cm 6.8 6.6 6.5 6.6

Table 15. Effect of Time on the Rapid Remobilisation of Trace Metals and Metalloids Time Al Fe Mn As Cd Co Cr Cu Ni Pb V Zn
Sampling h µg/L µg/L µg/L µg/L µg/L µg/L µg/L µg/L µg/L µg/L µg/L µg/L Boggy Creek in freshwater Core 9, 0-1 cm 0.5 2 10 3700 2.24 0.09 3.20 0.17 4.10 0.06 5.7 12.1 9.83 Core 9, 0-1 cm 3 <1 11 5700 2.68 0.12 10.3 0.12 5.87 <0.03 11.5 6.86 5.94 Core 9, 0-1 cm 7 <1 14 6000 2.87 0.14 6.11 0.15 6.86 0.02 8.1 6.87 3.95 Core 9, 0-1 cm 24 3400 130 4000 3.31 0.10 4.32 0.17 8.54 <0.03 6.23 16.7 3.31 Boggy Creek in seawater Core 9, 0-1 cm 0.5 7 8 9600 2.07 1.13 26.2 0.68 3.45 0.13 22.7 5.62 14.1 Core 9, 0-1 cm 3 <4 12 14000 3.23 1.79 16.6 0.74 5.84 <0.03 15.5 8.72 12.4 Core 9, 0-1 cm 7 <4 <7 12000 5.68 1.55 17.2 0.45 5.87 0.07 14.5 7.35 10.3 Core 9, 0-1 cm 24 <4 <7 18000 4.82 1.54 9.79 0.34 8.14 <0.03 8.9 11.1 10.4 Boggy Creek in freshwater Core 9, 0-5 cm 0.5 2400 50 2400 4.63 0.93 41.8 0.60 2.54 0.09 96 0.31 55.7 Core 9, 0-5 cm 3 3000 110 3100 6.68 1.25 51.5 0.87 3.82 0.29 116 0.55 73.5 Core 9, 0-5 cm 7 3200 110 4200 6.63 2.03 90.5 0.92 1.96 2.81 173 0.48 106 Core 9, 0-5 cm 24 3500 120 5100 5.75 1.67 95.0 0.83 4.00 0.46 177 0.53 114 Boggy Creek in seawater Core 9, 0-5 cm 0.5 650 7 2500 6.24 1.16 47.3 0.71 1.71 0.74 111 0.56 54.4 Core 9, 0-5 cm 3 6200 94 4500 12.6 2.49 98.7 1.48 5.01 7.10 225 0.49 129 Core 9, 0-5 cm 7 6200 150 4000 4.01 1.21 57.1 0.82 3.87 0.42 123 0.48 76.1 Core 9, 0-5 cm 24 6200 200 3900 12.0 1.68 74.6 1.55 6.19 12.3 171 1.15 114
24

25
Table 15. Effect of Time on the Rapid Remobilisation of Trace Metals and Metalloids (Continued) Time Al Fe Mn As Cd Co Cr Cu Ni Pb V Zn
Sampling h µg/L µg/L µg/L µg/L µg/L µg/L µg/L µg/L µg/L µg/L µg/L µg/L Point Sturt in freshwater Core 4, 0-5 cm 0.5 1 <1 79 0.56 0.12 1.96 <0.02 0.75 <0.03 3.69 0.17 12.1 Core 4, 0-5 cm 3 <1 <1 82 0.41 0.23 1.77 <0.02 0.69 <0.03 2.35 0.22 3.29 Core 4, 0-5 cm 7 2 2 80 0.53 0.11 1.63 <0.02 0.77 0.08 2.06 0.23 7.18 Core 4, 0-5 cm 24 <1 17 73 0.58 0.08 1.44 <0.02 0.54 <0.03 1.80 0.23 1.42 Point Sturt in seawater Core 4, 0-5 cm 0.5 7 <7 100 2.07 0.47 3.48 0.36 0.60 <0.03 6.98 0.21 3.44 Core 4, 0-5 cm 3 <4 <7 92 2.38 0.50 2.97 0.60 0.55 <0.03 4.48 0.32 1.40 Core 4, 0-5 cm 7 <4 <7 94 2.40 0.22 3.03 0.43 0.61 <0.03 5.09 0.28 1.33 Core 4, 0-5 cm 24 <4 <7 100 2.73 0.37 3.49 0.40 0.43 <0.03 5.10 0.27 1.74 Boggy Creek in freshwater Core 9, 0-5 cm (dup.) 0.5 780 27 2500 3.43 0.76 35.2 0.35 1.73 0.07 81.1 0.33 48.6 Core 9, 0-5 cm (dup.) 3 1700 71 3300 4.00 1.07 49.8 0.62 2.33 0.24 105 0.38 62.7 Core 9, 0-5 cm (dup.) 7 5100 170 3700 7.78 1.54 57.3 1.00 4.77 0.42 136 0.55 78.5 Core 9, 0-5 cm (dup.) 24 3400 130 4000 4.28 1.70 89.6 0.91 3.35 0.44 157 0.47 112 Boggy Creek in seawater Core 9, 0-5 cm (dup.) 0.5 980 25 3300 9.97 1.53 56.4 0.54 1.84 0.93 139 0.64 66.8 Core 9, 0-5 cm (dup.) 3 5800 92 3800 15.8 16.3 69.8 1.18 5.19 4.92 183 0.65 98.6 Core 9, 0-5 cm (dup.) 7 6200 97 3800 14.9 2.51 74.8 1.20 5.14 7.05 190 0.30 103 Core 9, 0-5 cm (dup.) 24 4500 79 3700 9.16 1.56 67.1 1.05 3.70 3.31 148 0.32 101

4.2.2 Effect of soil:water ratio on acidity and metal release
The amount of solute released from soils shaken in water may increase with increasing total suspended solids (TSS) concentration, and for metals present as soluble salts (e.g. MgSO4), this release may continue with increasing TSS concentration, until saturation (relative to maximum solubility) is reached. The relationship between TSS and metal release, pH and conductivity was investigated for three soils using both fresh water and seawater at soil:water ratios of 0.1, 1, 10 and 100 g soil/L and a resuspension period of 24 h (Tables 16-18). The dissolved oxygen concentrations were 8-9 mg/L during these tests. At higher TSS concentration, the soil-water suspension pH decreased by a greater extent. The changes in pH were slightly greater for freshwater than seawater experiments, consistent with the greater pH-buffering capacity of seawater. Increasing the ratio of soil:water resulted in increased SEC of the waters for the Boggy Creek soils, but not for the Point Sturt soil (particularly evident from the freshwater tests). This indicates that the Boggy Creek soils have higher somewhat higher labile ‘salt’ concentrations (major anions and cations) than the Point Sturt soils. The differences in TSS resulted in a wide variety of changes in the concentrations of dissolved metals/metalloids being released. For the Boggy Creek soils, the amount of iron released increased in freshwater tests with increasing TSS concentration and the amount of manganese released in seawater tests increased with increasing TSS concentration. However, increases in TSS concentration had only minor effects on the release of most of the metals/metalloids (i.e. the concentrations varied without clear trend by a factor of 2-4) (Table 18). These results indicate that, beyond the initial release of relatively large amounts of Fe and Mn, the majority of the metals appear to be in pseudo-equilibrium with the solid phase, i.e. the dissolved concentrations become relatively independent of concentration of soil phase material (as predicted for thermodynamic equilibrium). The kinetics of mineral solubilisation and the formation of new mineral phases are likely to control concentrations of dissolved metals over longer time periods.
Table 16. Effect of Soil:water Ratio on pH During Rapid Remobilisation Tests Soil:water ratio
Sample site 0.1 1 10 100 Remobilisation pH in freshwater
Murray River Water Control (Blank) 7.3 Boggy Creek in freshwater Core 9, 0-1 cm 7.3 7.7 7.7 7.3 Core 9, 0-5 cm 7.6 7.5 6.8 4.4 Point Sturt in freshwater Core 4, 0-5cm 7.3 7.6 7.6 6.9 Core 4, 0-5 cm (dup.) 7.7 7.6 7.5 7.1
Remobilisation pH in seawater Seawater Control (Blank) 7.7 Boggy Creek in seawater Core 9, 0-1 cm 7.8 7.8 7.6 7.3 Core 9, 0-5 cm 7.9 7.7 6.9 4.6 Point Sturt in seawater Core 4, 0-5cm 7.7 7.9 7.8 7.0 Core 4, 0-5 cm (dup.) 7.8 7.9 7.7 7.0
26

27
Table 17. Effect of Soil:water Ratio on SEC (mS/cm) During Rapid Remobilisation Tests Soil:water ratio
Sample site 0.1 1 10 100 Remobilisation SEC (mS/cm) in freshwater
Murray River Water Control (Blank) 1.8 Boggy Creek in freshwater Core 9, 0-1 cm 1.8 1.9 2.5 6.7 Core 9, 0-5 cm 1.8 1.9 2.2 4.6 Point Sturt in freshwater Core 4, 0-5cm 1.8 1.8 1.8 1.8 Core 4, 0-5 cm (dup.) 1.8 1.8 1.8 1.8
Remobilisation SEC (mS/cm) in seawater Seawater Control (Blank) 54.2 Boggy Creek in seawater Core 9, 0-1 cm 54.4 54.6 54.7 55.6 Core 9, 0-5 cm 54.1 54.3 54.5 54.2 Point Sturt in seawater Core 4, 0-5cm 54.6 54.2 54.7 53.8 Core 4, 0-5 cm (dup.) 54.9 54.1 54.4 53.7

Table 18. Effect of Soil:water Ratio on Rapid Remobilisation of Trace Metals and Metalloids TSS Al Fe Mn As Cd Co Cr Cu Ni Pb V Zn
Sampling g/L µg/L µg/L µg/L µg/L µg/L µg/L µg/L µg/L µg/L µg/L µg/L µg/L Boggy Creek in fresh water Core 9, 0-1 cm 0.01 <1 <1 <7 0.79 0.06 <0.15 <0.02 1.01 <0.03 0.73 0.72 1.69 Core 9, 0-1 cm 0.1 3 3 160 0.87 0.60 0.20 <0.02 1.03 0.04 0.76 2.19 2.25 Core 9, 0-1 cm 1 4 5 830 1.46 <0.05 0.91 <0.02 2.22 <0.03 1.84 6.75 0.77 Core 9, 0-1 cm 10 2 17 4900 2.80 0.093 5.57 0.280 7.90 <0.03 8.4 16.7 3.37 Core 9, 0-5 cm 0.01 4 16 17 0.85 0.05 <0.15 <0.02 2.78 0.04 0.68 1.30 8.63 Core 9, 0-5 cm 0.1 <1 3 54 0.79 <0.05 0.41 <0.02 1.10 <0.03 1.19 1.20 1.83 Core 9, 0-5 cm 1 3 7 360 0.71 <0.05 3.36 0.02 9.14 <0.03 3.85 0.59 3.38 Core 9, 0-5 cm 10 2100 100 4400 2.93 1.29 79 0.75 2.38 0.37 144 0.43 110 Boggy Creek in seawater Core 9, 0-1 cm 0.01 <4 <7 31 2.84 0.12 0.369 0.17 0.88 <0.03 0.64 1.95 1.77 Core 9, 0-1 cm 0.1 5 <7 220 3.05 0.11 1.01 0.21 3.09 <0.03 1.20 4.08 5.51 Core 9, 0-1 cm 1 <4 <7 1900 2.67 0.23 2.39 0.40 2.00 <0.03 2.62 5.71 2.61 Core 9, 0-1 cm 10 <4 13 13000 4.21 1.17 11.3 0.49 7.27 <0.03 10.5 11.2 6.96 Core 9, 0-5 cm 0.01 7 <7 8 2.76 <0.05 0.181 0.35 1.13 <0.03 0.51 1.15 14.1 Core 9, 0-5 cm 0.1 180 <7 47 2.84 <0.05 0.78 0.36 0.99 <0.03 1.41 1.13 5.20 Core 9, 0-5 cm 1 7 <7 410 2.63 0.19 7.38 0.30 1.15 0.15 13.0 0.66 5.83 Core 9, 0-5 cm 10 5800 100 4100 10.8 2.15 89 1.14 4.22 5.19 202 0.29 129 Point Sturt in fresh water Core 4, 0-5cm 0.01 <1 <1 <1 0.85 0.07 0.02 0.04 0.93 <0.03 0.72 0.69 2.06 Core 4, 0-5cm 0.1 2 <1 <1 0.91 0.09 <0.15 <0.02 1.02 <0.03 0.72 0.70 2.57 Core 4, 0-5cm 1 5 7 <7 0.89 <0.05 0.16 <0.02 0.87 <0.03 0.91 0.40 3.60 Core 4, 0-5cm 10 7 3 70 0.54 0.07 1.39 <0.02 0.50 <0.03 1.89 0.20 0.85 Point Sturt in seawater Core 4, 0-5cm 0.01 <4 <7 31 3.07 <0.05 0.08 0.22 1.24 <0.03 0.31 1.07 0.92 Core 4, 0-5cm 0.1 <4 <7 220 2.70 <0.05 0.09 0.30 1.11 <0.03 0.27 1.00 1.17 Core 4, 0-5cm 1 5 <7 1900 2.59 0.08 0.40 0.33 0.65 <0.03 0.60 0.56 <0.59 Core 4, 0-5cm 10 <4 <7 13000 1.85 0.27 3.44 0.34 0.48 <0.03 5.31 0.38 2.74
28

4.2.3 Effect of standard and repeated leaching on acidity and metal release
Several of the soil samples were repeatedly leached (three times), with the original water removed by centrifugation and replaced with new water, using 24-h leaching periods. The metal mobilisation and changes in pH and SEC were investigated for three soils using both freshwater and seawater at a soil:water ratio of 100 g soil/L and a resuspension period of 24 h. The dissolved oxygen concentrations were 8-9 mg/L during these tests. Standard rapid remobilisation tests (100 g soil/L, 24-h leach) were undertaken using both freshwater and seawater on five soils samples. The pH and SEC data from these tests are shown in Tables 19. The repeated leaches were undertaken using both freshwater and seawater on the two more acidic soil samples: Core 9, 0-5 cm and Core 4, 0-5 cm. For successive leaches the pH increased but remained much lower than the pH of the leach water (Table 17). This indicates that while acidity may be being washed out of the soils, significant acidity remained and was carried through to the next cycle. For successive freshwater leaches, for soil ‘Core 9, 0-5 cm’ the SEC decreased from 4.9 to 1.9 mS/cm, which was the same SEC as the leach water (Table 19). For the other soils, the SEC was more similar to that of the original leach water, but varied a little erratically. For successive seawater leaches, the SEC became more similar to the SEC of the first leach water (Tables 19). With each successive leach of the soils, the concentrations of most metals (not vanadium) released from the soils generally decreased 2-10 fold compared to the previous leach cycle (Table 20). This is consistent with there being a finite pool of metals available for rapid release, rather than there being an ongoing source of easily available metals being released from the soil particles.
Table 19. Effect of Standard and Additional Leaches on pH During Remobilisation Tests Freshwater: 24-h leach cycles
pH SEC (mS/cm)
1st 2nd 3rd 1st 2nd 3rd
Murray River Water (Blank) 7.5 7.5 7.5 1.9 1.9 1.9
Boggy Creek
Core 9, 0-1 cm 7.2 NAL NAL 6.8 NAL NAL
Core 9, 0-5 cm 4.2 4.6 4.9 4.9 2.5 1.9
Pt. Sturt NAL NAL
Core 4, 0-5 cm 6.8 7.3 7.5 1.9 2.7 2.0
Core 4, 0-5 cm (dup.) 6.9 NAL NAL 1.9 NAL NAL
Core 5, 0-5 cm (dup.) 7.0 NAL NAL 1.9 NAL NAL
Seawater: 24-h leach cycles
1st 2nd 3rd 1st 2nd 3rd
Seawater Control (Blank) 7.9 7.9 7.9 56.7 56.7 56.7
Boggy Creek
Core 9, 0-1 cm 7.1 NAL NAL 58.4 NAL NAL
Core 9, 0-5 cm 4.8 5.4 6.1 57.3 57.2 55.6
Pt. Sturt
Core 4, 0-5 cm 7.1 7.5 7.7 56.2 57.0 56.9
Core 4, 0-5 cm (dup.) 7.0 NAL NAL 55.7 NAL NAL
Core 5, 0-5 cm (dup.) 7.1 NAL NAL 55.9 NAL NAL
NAL = no additional leach
29

Table 20. Effect of Standard and Additional Leaches on Remobilisation of Trace Metals and Metalloids Sampling Al Fe Mn As Cd Co Cr Cu Ni Pb V Zn
24-h leach
cycle µg/L µg/L µg/L µg/L µg/L µg/L µg/L µg/L µg/L µg/L µg/L µg/L Boggy Creek in Freshwater Core 9, 0-1 cm 1st 7000 320 7100 4.24 2.80 149 1.00 5.20 1.11 283 0.68 174 Core 9, 0-1 cm 2nd 820 67 1000 1.24 0.28 19.7 0.29 1.72 <0.03 48.9 0.45 26.5 Core 9, 0-1 cm 3rd 100 16 356 0.61 0.08 6.65 0.14 1.04 0.05 15.6 0.39 9.47 Boggy Creek in seawater Core 9, 0-5 cm 1st 4100 52 5800 7.09 2.34 92.2 1.04 3.17 4.18 208 0.49 119 Core 9, 0-5 cm 2nd 330 13 1200 2.70 0.70 34.5 0.42 1.45 1.48 60.3 0.65 43.9 Core 9, 0-5 cm 3rd 46 <7 330 3.38 0.32 14.8 0.16 1.18 0.26 22.9 0.72 17.0 Point Sturt in Freshwater Core 4, 0-5 cm 1st 16 1 75 0.59 <0.05 1.55 <0.02 0.78 <0.03 2.06 0.35 1.33 Core 4, 0-5 cm 2nd 4 1 9 0.96 <0.05 0.21 <0.02 0.95 <0.03 0.81 0.45 0.06 Core 4, 0-5 cm 3rd <4 <1 12 0.82 <0.05 <0.15 <0.02 0.98 <0.03 0.62 0.59 0.02 Point Sturt in seawater Core 4, 0-5 cm 1st <4 <7 99 2.06 0.28 3.60 0.16 0.55 <0.03 4.81 0.51 1.05 Core 4, 0-5 cm 2nd <4 <7 1 2.79 0.10 0.516 0.13 0.85 <0.03 0.55 1.19 <0.59 Core 4, 0-5 cm 3rd <4 <7 <1 1.79 0.11 0.352 0.08 0.50 <0.03 0.48 1.48 0.79
30

4.2.4 Comparison of freshwater and seawater rapid metal release for additional soils
For eight additional soils collected from the lower lakes during the 2008 study by Simpson et al. (2008), rapid release tests using both freshwater and seawater were undertaken (Table 21). For a given soil, the release of Al and Fe was often greater in freshwater than in seawater. However, the magnitude of the release of the other metals appeared less dependent on water type. This additional data allowed the differences between freshwater and seawater rewetting to the pH-metal release relationships previously observed (Figure 5). The data for both the freshwater and seawater rapid release tests of soils from field-trail sites are compared with the previous rapid-release tests undertaken using freshwater on Lakes Albert and Alexandrina soils (Simpson et al., 2008) in Figure 5. In general, the magnitude of the metal release from the soils was similar to that observed in the previous work. As shown for Al, Zn, Cu and Cr, for which strong pH-metal release relationships were observed by Simpson et al. (2008), at a similar pH the metal release was generally greater in seawater than in freshwater, the water pH had the strongest influence on the magnitude of the metal release.
0
10
20
30
40
50
60
2.5 3.5 4.5 5.5 6.5 7.5
Water pH
Dis
solv
ed C
r, µ
g/L
2008 Lake rapid-release data
Freshwater rapid-release
Seawater rapid-release
Corer reactor
0
50
100
150
200
250
300
350
400
450
500
2.5 3.5 4.5 5.5 6.5 7.5
Water pH
Dis
solv
ed Z
n,
µg
/L
2008 Lake soil rapid-release data
Freshwater rapid-release
Seawater rapid-release
Corer reactors
0
5000
10000
15000
20000
25000
2.5 3.5 4.5 5.5 6.5 7.5
Water pH
Dis
solv
ed A
l, µ
g/L
2008 Lake soil rapid-release data
Freshwater rapid-release
Seawater rapid-release
Corer reactors
0
20
40
60
80
100
120
140
160
180
2.5 3.5 4.5 5.5 6.5 7.5
Water pH
Dis
solv
ed C
u,
µg
/L
2008 Lake soil rapid-release data
Freshwater rapid-release
Seawater rapid-release
Corer reactors
Figure 5. Comparison between the dissolved Al, Cu and Zn concentrations measured in the rapid-release tests undertaken for (i) Lakes Albert and Alexandrina soils () previous rapid-release data (Freshwater, Simpson et al., 2008), (ii) freshwater tests for soils from field-trail sites (), (iii) seawater tests for soils from field-trail sites (), and (iv) for mean metal release during the resuspension phase of the mid-term corer reactor experiments (weeks 3-6) (). Where shown, the lines represent the freshwater (red) and seawater (blue) water quality guidelines for 80% (solid) and 95% (dashed) species protection (Table 22).
31

Table 21. Standard Leaches using Freshwater and Seawater on additional Soil Samples Sampling SEC Al Fe Mn Cd Co Cr Cu Ni V Zn
pH mS/cm µg/L µg/L µg/L µg/L µg/L µg/L µg/L µg/L µg/L µg/L Freshwater inundation River Murray water 7.6 2.1 <60 <60 < 2 <5 <10 <2 5 <10 <2 33 AT 19.3 (18-28 cm) (4.1) 4.2 2.4 2235 2900 1200 <5 140 3 8 160 2 150 AT 21.1 (0-1 cm) (6.2) 7.0 6.9 <60 <60 760 <5 <10 <2 7 10 3 6 AA 29.5 (0-3 cm) (3.9) 4.2 3.8 6900 5400 7500 <5 110 <2 9 330 20 260 AA 29.6 (3-10 cm) (4.4) 4.6 2.1 1600 5700 780 <5 20 <2 6 45 4 63 AA 33.2 (0-10 cm) (2.9) 3.7 2.4 26000 29000 2700 <5 180 54 35 250 940 650 AA 33.3 (10-25 cm) (2.8) 3.3 4.4 32000 18000 2600 <5 200 15 42 320 160 680 AA 13.2 (5-15 cm) (3.8) 4.2 2.5 1300 2500 2200 <5 320 2 3 260 < 2 110 AA 10.2* (10-30 cm) (5.7) 6.2 2.0 <60 <60 4600 <5 50 <2 <2 20 10 10 Seawater inundation Seawater 7.5 57.9 <60 <60 < 2 <5 <10 <2 13 10 5 23 AT 19.3 (18-28 cm) (4.1) 4.8 58.1 1600 1500 1000 <5 110 <2 14 140 10 140 AT 21.1 (0-1 cm) (6.2) 6.6 61.4 <60 <60 2800 <5 <10 <2 9 10 6 23 AA 29.5 (0-3 cm) (3.9) 4.8 59.3 3600 4300 6200 <5 90 <2 3 280 10 220 AA 29.6 (3-10 cm) (4.4) 5.6 58.0 300 2700 580 <5 10 <2 8 52 8 47 AA 33.2 (0-10 cm) (2.9) ND ND ND ND ND ND ND ND ND ND ND ND AA 33.3 (10-25 cm) (2.8) 3.3 58.8 69000 19000 2500 <5 190 19 43 350 110 700 AA 13.2 (5-15 cm) (3.8) 4.3 58.2 4000 3300 2600 <5 370 <2 10 320 4 170 AA 10.2* (10-30 cm) (5.7) 6.0 58.1 <60 <60 9100 <5 120 <2 6 78 4 40
32

5 Discussion
5.1 Ecological Risk Assessment Ecotoxicological effects due to released metals may occur when the dissolved metal concentrations in the water column, or sediment pore water in the case of some plants or benthic organisms, exceed the water quality guideline values (WQGs) (Table 22). For the purpose of this discussion, the mean dissolved metal concentrations measured during the tests are compared with the ANZECC/ARMCANZ (2000) water quality guidelines 80% and 95% protection concentrations.
Table 22. Water Quality Guidelines (µg/L) for Fresh water of varying Hardness and Seawater Fresh water Seawater
Metal Hardness correction † Acute § Chronic Acute § Chronic
Level of protection 95% 95% 80% 95% 95% 80%
Al a NA 6.6 55 150 5 0.5 NV
As (V) b NA 13 13 140 45 4.5 NV
Cd * 10× 20 2 8 55 5.5 36
Co * 9× 126 e 12.6 e NV 10 1 150
Cr(VI) c NA 10 1 40 44 4.4 85
Cu * 9× 126 12.6 22.5 13 1.3 8
Mn d NA 17000 1900 3600 230 230 NA
Ni * 9× 990 99 153 70 70 560
Pb * 26.7× 908 91 251 44 4.4 12
V NA 60 e 6 e NV 1000 100 280
Zn * 9× 720 72 248 150 15 43
NV = no value due to inadequate data for undertaking species sensitivity distribution
* = Hardness correction applied at 400 mg CaCO3/L level for this element
NA = Hardness correction not applicable for this element § The acute values were calculated from by multiplying the chronic guideline values by 10 (Stauber et al., 2008) † The freshwater guidelines for Cd, Cr(III), Cu, Ni, Zn, and Pb have been adjusted using the ANZECC/ARMCANZ (2000)
algorithms based on a water hardness of 400 mg CaCO3/L a The WQG for Al in freshwaters is the pH>6.5 value as during most tests that waters were pH >6.5. For WQG for Al in
seawater is an ‘environmental concern level (very low reliability) b The freshwater WQG for As assumes all is as As(V), which is more toxic than As(III) (WGQ = 24 µg/L). c The WQGs for Cr assumes all is as Cr(VI), which is more toxic that Cr(III), however it is expected that there would be a mixture
of both Cr(III) and Cr(VI) d A WQG value of 230 µg/L is used for Mn, which may be considered as a moderate reliability value (Stauber et al., unpublished
results). eLow reliability WQG values. For Co, the 99% PL level WQG is used due to low reliability of 95% PL value.
For the freshwater WQGs, hardness corrections were applied. The water hardness was quite variable, being approximately 100 mg CaCO3/L for River Murray water and greater than 400 mg/L for the Lake Alexandrina water and reactor waters. For metals whose toxicity is known to be influenced by hardness, and for which hardness algorithms are available (i.e. Cd, Cr(III), Cu, Ni, Zn, and Pb), the freshwater trigger values were adjusted based on a water hardness of 400 mg/L. The hardness algorithms (ANZECC/ARMCANZ, 2000) were derived using effects data for fish using toxicity data spanning water hardness from 25-400 mg CaCO3/L. Their applicability at higher hardness is unknown. The toxicity of other metals such as manganese, is known to be reduced as water hardness increases, however, no algorithms were available for hardness corrections. It is also important to note that recent studies with algae and cladocerans have found that copper toxicity to these sensitive species is not ameliorated in high hardness waters, suggesting that hardness-corrected trigger values for copper at least, may be under-protective for some species (Markich et al. 2005). For seawater, the WQG for manganese (PC95% = 70 µg/L) is a low reliability value. It is recommended that a value of 230 µg Mn/L be used, which may be considered as a moderate reliability value (Stauber et al., unpublished results).
33

Overlying water pH and dissolved Al, Fe and Mn In the corer-reactor experiments the mean pH of the overlying water was greater than pH 7 throughout the first 17 days (weekly water renewal phase). Following inundation of the soils with fresh water, the mean dissolved aluminium concentration remained below the WQG value for freshwaters of 55 µg/L (Table 20). Following inundation of the soils with seawater, the mean dissolved aluminium concentration greatly exceeded the WQG value for seawaters of 0.5 µg/L, however it should be noted that this is a low reliability, WQG value. Dissolved iron concentrations were lower in the Point Sturt tests than the Boggy Creek tests. Greater release of iron occurred during inundation using seawater. The mean dissolved manganese concentration remained well below the WQG value of 1900 µg/L for fresh waters. For seawater, the WQG is 70 µg/L and is a low reliability value. It is recommended that a value of 230 µg Mn/L be used, which may be considered as a moderate reliability value (Stauber et al., unpublished results). For the Boggy Creek soils following seawater inundation, the mean dissolved manganese concentration exceeded 230 µg/L (Table 20). Trace metals and metalloids The mean concentrations of dissolved cadmium were greatest in the seawater inundation tests, but did not exceed the WQG values for any of the tests. The mean concentrations of dissolved cobalt were higher in inundation tests with seawater than those with freshwater and exceeded the WQG value for seawater inundation but not for freshwater inundation (hardness corrected WQG). For Boggy Creek, the dissolved cobalt concentrations were greater than 10× WQG during the seawater renewal phase. While dissolved copper concentrations were greater in the freshwater inundation experiments than in the seawater inundation experiments, the hardness corrected WQG for freshwater was not exceeded. The mean dissolved copper concentrations exceeded the WQGs for seawater in all tests, but were less than 10× WQG seawater. Dissolved lead concentrations were greater in the seawater inundation experiments than in the freshwater inundation experiments. The mean dissolved lead concentrations exceeded the WQGs for seawater, but not for freshwater inundation tests (hardness corrected WQG). The mean dissolved zinc concentrations did not exceed the WQG for freshwater (hardness corrected WQG) and only exceeded the WQG for seawater in one of the Boggy Creek soil tests. The mean concentrations of dissolved As, Cr, Ni, and V did not exceed their respective WQGs during either the water-renewal phases of the corer-reactor tests.
5.1.1 Sediment resuspension
For the overlying water (discussed above), significant dilution of released acidity and metals is expected to occur through mixing with the surrounding waters. Removal of released metal through precipitation or increased adsorption to suspended solids is also likely to occur (Simpson et al., 2008). A comparison between the mean water pH, SEC and dissolved metals concentrations during the water-renewal and resuspension periods is made in Table 23. During the resuspension phase, the pH dropped significantly, but remained above pH 5. For Boggy Creek, resuspension of the surface sediments caused large increases in the release of iron (20 to >100-fold increase) and manganese (~ 2-fold for seawater and >100-fold for freshwater inundation tests). These metals would have been expected to be present in the pore waters as Fe(II) and Mn(II). The resuspension of the surface sediments caused increases of the order of 2-10 fold for As, Co, Ni, Pb, and Zn, but had little affect on the concentrations of Cd and Cr, and induced moderate removal of Al, Cu, and V. These results indicate that disturbances to the deeper pore waters are likely to have the greatest influence of dissolved metal release to the overlying water. The dissolved concentrations of metals released to the overlying water during the water-renewal and resuspension phases of the corer-reactor tests are compared with the WQGs for freshwater and seawater in Tables 23 and 24. Following sediment resuspension the dissolved aluminium concentrations generally decreased, but remained above the WQG for seawater. Dissolved manganese concentrations increased significantly and greatly exceeded 230 µg/L in both freshwater and seawater tests for all Boggy Creek samples, and exceeded the WQG for Point Sturt in the seawater test. For Boggy Creek, the dissolved cobalt concentrations were near 100× WQG during the seawater resuspension phases of the experiments. The dissolved copper concentrations decreased during the resuspension phase. The dissolved lead concentrations were significantly greater during the resuspension phase, exceeding >10× WQG for Boggy Creek in seawater. For the Boggy Creek soils, the dissolved zinc concentrations were 2-4 times greater during the resuspension phase of the experiments and exceeded the WQGs during all Boggy Creek resuspension tests. Arsenic, but not Cr or Ni exceeded the WQGs for seawater during the resuspension phase, but only in one test.
5.1.2 Sediment pore waters
The dissolved metal concentrations in the sediment pore waters were much greater than the concentrations being released to the overlying water and the increased rate of release of metals from the sediments during resuspension was likely to be in part due to porewater derived metals. Metals in the sediment pore waters, along with direct effects due to the decreased sediment pH may have significant detrimental effects to both
34

35
plants that have roots extending into the deeper sediments and also to benthic invertebrates that inhabit the sediments (Simpson and Batley, 2007). Analyses of the sediment pore waters indicated that only minor neutralisation of the pore waters occurred during the 8-week tests, and this only occurred for the seawater inundation experiments. In all tests, regardless of whether seawater or freshwater was used for the inundation experiments, at a depth of greater than 20 cm below the sediment water interface the pore waters pH values were low: pH ~3. Porewater metal concentrations were generally much greater in the seawater inundation tests than the freshwater inundation tests. Pore water concentrations increased with increasing sediment depth, which was consistent with the higher acidity (lower pH) of the deeper sediments.

Table 23. Mean Concentrations of pH, SEC, and Dissolved Metals and Metalloids during Water Exchange and Resuspension (non-renewal) Periods and WQG Values for Fresh Water and Seawater.
SEC Al Fe Mn As Cd Co Cr Cu Ni Pb V Zn Sampling
pH mS/cm µg/L µg/L µg/L µg/L µg/L µg/L µg/L µg/L µg/L µg/L µg/L µg/L
Point Sturt, Freshwater Core 3 Mean 7.5 1.8 6.0 1 8 0.8 0.26 0.3 <0.02 3.8 0.3 1.3 1 4.2 Water renewal period SD 0.3 0.0 7.5 NV 4 0.1 0.24 0.1 NV 3.1 0.4 0.3 0.1 2.2 Mean 5.9 2.0 120 39 126 0.7 0.45 4.0 0.6 0.8 0.1 7.9 0 4.5 Resuspension period SD 0.9 0.1 95 71 73 0.1 0.26 2.0 1.2 0.2 0.0 5.1 0.1 2.8
Point Sturt, Freshwater Core 4 Mean 7.5 1.8 8.3 1.0 6.8 0.8 0.59 0.4 0.3 8.7 0.1 1.1 0 3.7 Water renewal period SD 0.3 0.1 7.5 0.0 6.9 0.1 0.59 0.3 NV 7.7 0.0 0.6 0.1 3.0 Mean 7.1 1.9 1.0 3.5 7.1 0.8 0.07 0.2 0.03 1.1 0.2 0.7 0 0.6 Resuspension period SD 0.3 0.1 NV 3.5 4.1 0.2 0.04 0.1 0.01 0.1 0.2 0.3 0.1 0.7
Boggy Creek, Freshwater Core 1 Mean 7.6 2.9 13 13 269 4.8 0.07 1.1 0.2 7.2 0.1 2.7 17 2.0 Water renewal period SD 0.2 0.6 11 10 132 2.1 0.01 0.5 0.1 4.8 0.0 1.1 8.3 0.5 Mean 7.2 6.8 15 3450 5900 8.3 0.09 14.7 0.6 3.7 0.7 22.1 10 10.1 Resuspension period SD 0.2 1.1 8.3 3040 2310 1.9 0.02 5.6 0.1 0.7 0.2 6.5 3.6 3.8
Freshwater WQG (95% PC) a, b NV NV 55 NV 1900 13 2 12.6 1 12.6 99 91 6.0 72 Point Sturt, Seawater Core 5
Mean 7.6 53 84 ~10 114 2.4 0.38 4.3 0.5 1.7 3.5 8.9 1 4.1 Water renewal period SD 0.2 0.7 46 NV 110 0.4 0.25 4.1 0.4 0.8 3.0 8.4 0.2 3.0 Mean 6.9 57 14 103 241 2.3 0.23 7.5 0.7 0.7 3.1 10.8 1 6.4 Resuspension period SD 0.4 1.7 10 115 46 0.5 0.07 2.1 1.9 0.2 3.9 3.3 0.2 2.7
Boggy Creek, Seawater Core 2 Mean 7.3 53 101 80 4660 3.0 0.76 25 0.6 4.4 0.3 24 11 21.3 Water renewal period SD 0.3 0.7 101 111 2860 0.8 0.49 15 0.2 3.2 0.2 16 4.7 14.3 Mean 6.8 58 29 14300 10900 5.0 0.52 90 0.5 2.5 0.2 69 2 52.2 Resuspension period SD 0.3 1.8 19 13000 3790 2.1 0.25 32 0.4 0.8 0.2 22 2.1 21.7
Boggy Creek, Seawater Core 9 Mean 7.3 53 74 81 5150 2.5 0.85 18 0.4 4.9 0.2 16 5.4 7.8 Water renewal period SD 0.3 0.7 73 26 2480 0.6 0.44 9.8 0.1 3.5 0.1 8.2 2.5 4.1 Mean 6.8 58 34 11440 11400 4.3 0.65 107 0.3 3.2 0.1 91 1.1 42 Resuspension period SD 0.3 1.8 20 11000 3240 1.6 0.35 15 0.2 1.4 0.1 14 1.2 21
Seawater WQG (95% PC) a NV NV 0.5 NV 230 4.5 5.5 1 4.4 1.3 70 4.4 100 15 a Water quality guideline, 95% level of ecosystem protection in ANZECC/ARMCANZ (2000). b The WQGs for freshwaters are the 95% PL for chronic effects and have been adjusted for the effects of hardness at 400 mg/L level. The freshwater WQG for As assumes all is as As(V), which is less toxic than As(III) (WGQ = 24 µg/L). The WQGs for Cr assumes all is as Cr(VI).
36

37
Table 24. Exceedances of WQG Values for Fresh Water and Seawater (renewal phase) (ratio of dissolved concentration to WQG value). Quotient = Dissolved concentration / WQG value Al Mn Fe As Cd Co Cr Cu Ni Pb V Zn Point Sturt, Freshwater Core 3 0.11 NV 0.00 0.06 0.13 0.02 0.03 0.27 0.00 0.01 0.10 0.06 Point Sturt, Freshwater Core 4 0.15 NV 0.00 0.06 0.28 0.03 0.03 0.62 0.00 0.01 0.07 0.05 Boggy Creek, Freshwater Core 1 0.24 NV 0.01 0.35 0.03 0.08 0.16 0.52 0.00 0.03 2.8 0.03
WQG (95% PC) for freshwater a, b 55 1900 NV 13 2 12.6 1 12.6 99 91 6 72 Point Sturt, Seawater Core 5 168 NV 0.51 0.51 0.51 4.4 0.12 1.2 0.05 2.1 0.01 0.27 Boggy Creek, Seawater Core 2 202 NV 18 0.64 0.99 23 0.12 3.1 0.00 5.0 0.11 1.3 Boggy Creek, Seawater Core 9 148 NV 21 0.56 1.1 17 0.10 3.4 0.00 3.6 0.05 0.51
WQG (95% PC) for seawater a, b 0.5 230 NV 4.5 5.5 1 4.4 1.3 70 4.4 100 15 a Water quality guideline, 95% level of ecosystem protection in ANZECC/ARMCANZ (2000). b The WQGs for freshwaters are the 95% PL for chronic effects and have been adjusted for the effects of hardness at 400 mg/L level. The freshwater WQG for As assumes all is as As(V), which is less toxic than As(III) (WGQ = 24 µg/L). The WQGs for Cr assumes all is as Cr(VI). For Mn in seawater, the value of 230 µg/L has been used based on the research by Stauber et al (unpublished results, 2008), in place of the low reliability value of 80 µg/L.

5.1.3 Comparison of short-term and mid-term metal release
The rapid 24-h release tests, involving shaking of soils with test water as described in detail in Simpson et al. (2008), were designed as potential worst-case scenarios for short-term acidity and metal release from soils. For the 47 sulfidic/sulfuric acid sulfate soils studied by Simpson et al. (2008), the metal release was rapid and dissolved concentrations of Al, Cd, Co, Cu, Cr, Mn, Ni, V and Zn greatly exceeded the Australian WQGs for protection of ecosystem health. In that study, the concentrations of Al, Cd, Co, Cu, Cr, Ni and Zn were often greater than 100×WQGs values for freshwaters. For most of these metals there were significant relationships between the pH of the sulfidic/sulfuric soils and the concentrations of dissolved metals released. The corer-reactor experiments were designed to provide information on the potential metal release due to inundation of soils with fresh water or seawater over periods of 1-4 weeks. Despite the moderate to high acidity of the soil cores collected from Point Sturt and Boggy Creek, during the corer-reactor tests the overlying water pH did not decrease below pH 5.5. Based on the rapid remobilisation study undertaken by Simpson et al (2008), only for waters with pH 5 or less, would dissolved metal concentrations likely to exceed the WQGs to the extent that significant impacts on organisms within the water column be likely. Direct comparison with the results from the rapid release tests with the results of the mid-term corer-reactor tests is not simple (see Figure 5). However, as expected, the rapid release tests undertaken on soils from Point Sturt and Boggy Creek generally resulted in a greater decrease in water pH and greater metal concentrations than that measured in waters overlying the corer-reactors, indicating that hydrological controls may be critical in determining the transport of acidity and metals from and within these soils. Comparison of the rapid-release test results for the Point Sturt and Boggy Creek soils with the past results indicates, however, that these two soils may not represent the worse case scenario for metal release for soils in Lake Alexandrina or Lake Albert. Because of the time required to undertake the mid-term tests, and the need to match these soils with those being used for the field-trials (Hicks et al., 2009), only two soil types were studied. With respect to undertaking a risk assessment, a significant limitation of this detailed approach is the small sample size (i.e. two soil types, two inundation water types). It is apparent from the pH values shown in Figure 5 that soils exist in lakes Albert and Alexandrina that have significantly greater acidity than the Boggy Creek and Point Sturt soils. It is likely therefore, that there may be a number of areas of the lake where the alkalinity of the inundation water (freshwater or seawater) and may be exhausted more rapidly. This would be expected to result in lower pH of the overlying water, higher metal release rates, and a greater likelihood of the water quality guidelines being exceeded; to a greater degree and for a longer duration.
38

6 Conclusions To provide a better understanding of how the spatial variability in soil properties may affect metal-release when inundated with seawater and fresh water, it is recommended that rapid-release tests using seawater and fresh water are undertaken using soils collected from a greater range of sites in the lakes. While these tests may not provide accurate information on actual rates of metal release, they provide a useful means of contrasting the likely worst-case metal release from soils when inundated with different water types and would thereby aid the risk assessment process. Greater release of metals and metalloids from the lake soils occurred during inundation with seawater than with fresh water. This was expected and can be attributed to the greater ionic strength of seawater causing greater exchange of metals from sediment particles. Pore water concentrations increased with increasing sediment depth, which was consistent with the higher acidity of the deeper sediments, which were generally pH 3 from 15 cm below the sediment water interface to the base of the cores at -20 cm. The dissolved metal concentrations within the sediment pore waters were much greater than the concentrations being released to the overlying water, and the increased rate of release of metals from the sediments during resuspension was likely to be in part due to release of porewater metals. The tests indicated that only short-term exceedances to the WQGs for metals would be expected to occur if the pH of the overlying water remained above pH 6. Moderate dilution of the waters overlying the inundated sediments with surrounding waters is expected to result in both increased water pH and attenuation of the concentrations of dissolved metals released from the sediments. Exceedances of WQGs would be expected to be more frequent in shallow regions of the lake where water exchange is restricted. The impact of elevated porewater metal concentrations was not addressed in this study, but may have ecological impacts of both plants and benthic organisms. To provide a better understanding of how the spatial variability in soil properties may affect metal-release when inundated with seawater and freshwater, it is recommended that rapid-release tests with seawater and freshwater are undertaken using soils collected from a greater range of sites in Lower Lakes region. While these tests may not provide accurate information on actual rates of metal release, they provide a rapid and relatively cheap means of contrasting the worst-case metal release from soils when inundated with different water types and would thereby aid the risk assessment process.
39

40
7 References Hicks, W.S., Creeper, N., Hutson, J., Fitzpatrick, R.W., Grocke, S. and Shand. P. (2009) The potential for
contaminant mobilisation following acid sulfate soil rewetting: field experiment. Prepared by the Commonwealth Scientific and Industrial Research Organisation (CSIRO) Land and Water for the SA Department of Environment and Natural Resources, Adelaide.
Jung, R.F., Jones, D.R. and Batley, G.E. (2003). Corer–reactors for contaminant flux measurement in sediments. Journal of Environmental Quality. 32, 1905-1910.
Markich, S.J., Batley, G.E., Stauber, J.L., Rogers, N.J., Apte, S.C., Hyne, R.V., Bowles, K.C. (2005) Hardness corrections for copper are inappropriate for protecting sensitive freshwater biota. Chemosphere 60:1-8.
Simpson, S.L., Pryor, I.D., Mewburn, B., Batley, G.E., and Jolley, D.F. (2002). Considerations for capping metal-contaminated sediments in dynamic estuarine environments. Environmental Science and Technology, 36, 3772-3778.
Stauber, J.L., Chariton, A.A., Binet, M.T., Adams, M.S, Simpson, S.L., Batley, G.E., Durr, M., Bentley, K., Fitzpatrick, R.W., Shand, P. (2008) Water Quality Screening Risk Assessment of Acid Sulfate Soil Impacts in the Lower Murray, SA. CSIRO Land and Water Science Report 35/08, 133 pages.
Simpson, S.L., Angel, B.A. Spadaro, D.A., Fitzpatrick, R.W., Shand, P., Merry R.H., and Thomas, M. (2008). Acid, Metal and Nutrient Mobilisation Following Rewetting of Acid Sulfate Soils in the Lower Murray. CSIRO Land and Water Science Report CLW27/08, 189 pages.
Simpson, S.L. and Batley, G.E. (2003). Disturbances to metal partitioning during toxicity testing of iron(II)-rich porewaters and whole sediments. Environmental Toxicology and Chemistry, 22, 424-432.
Simpson, S.L., Fitzpatrick, R.W., Shand, P., Angel, B.M., Spadaro, D.A. and Mosley, L. (2009). Climate-driven mobilisation of acid and metals from acid sulfate soils. Marine and Freshwater Research, (accepted).
Simpson, S.L. and Batley, G.E. (2007). Predicting metal toxicity in sediments: A critique of current approaches. Integrated Environmental Assessment and Management, 3, 18-31.

8 Appendices
41

APPENDIX A. SAMPLING USING CORER-REACTORS A1.1 Boggy Creek Sampling


Table A1. Cores and Additional Samples Taken at Point Sturt
Time Corer No.
Microcosm 0-5 cm sample
Description
0925 4 Western most tank
2 samples Moist sand. Some rusty streaks in beige sand.
0940 3 Second from western end
1 sample Beige sand - rusty streaks not so visible. Wetter sand than core 4, with water accumulating slowly at base of core.
1000 5 Eastern-most tank
1 sample Beige sand - rusty streaks, but not as visible as core 4. Wetter sand than core 4, with water accumulating slowly at base of core. Perhaps wettest of these 3 cores?

A1.2 Point Sturt Sampling

Table A2. Cores and Additional Samples Taken at Boggy Creek
Time Corer No.
Microcosm 0-5 cm sample
0-1 cm sample Description
1230 9 SW end tank 1 sample 1 sample 3.5 m S of tank
1250 1 Second tank from SW end
2 sample 1 sample
-sampled white effloresce on hardened “soil-rocks”
4 m S of tank. Sandy layer did not start until about 5 cm deep. This layer was approx. 5 cm deep.
1320 2 Second tank from NE end
1 sample 1 sample - sampled white effloresce as above
3 m S of tank. Sandy layer did not start until about 10 cm deep.

APPENDIX B. CORER-REACTOR LABORATORY EXPERIMENTSB1.1. Corer-reactor rewetting scheme Table B1. Initial Rewetting, Sampling and Water Renewal Scheme used for the Corer-reactors
Task # Day Time, h Task 0 0 0 Corer-reactors sealed, dry and at 20ºC Cycle 1 (Week 1) ~12 L (12 L)
1 1 0.1 – 1 (Tues, 9 am)
Test water added slowly until 10 cm depth of overlying water achieved (~1.67 L) Determine total amount of water added
2 1 2 Sample 100 mL of overlying water for analyses
3 1 2.1 – 3 Continue adding test water until 15 cm depth of overlying water achieved
4 1 3 – 6 Stirring
5 1 6(3 pm) Sample 100 mL of overlying water for analyses
6 (4 L) 1 6.1 Add 100 mL to test water to return to 15 cm depth
Cycle 2 (Week 1) ~10 L (22 L) 7 1 Wed, 9 am Sample 100 mL of overlying water for analyses 8 1-2 9 am Remove 3 L, then slowly replace with new 3.1 L 9 2 1 pm Sample 100 mL of overlying water for analyses 10 (4 L) 2 4 pm Add 100 mL to test water to return to 15 cm depth Cycle 3 (Week 1) ~10 L (32 L) 11 4 Fri, 9 am Sample 100 mL of overlying water for analyses 12 4 9 am Remove 3 L, then slowly replace with new 3.1 L 13 4 1 pm Sample 100 mL of overlying water for analyses 14 (4 L) 4 4 pm Add 100 mL to test water to return to 15 cm depth Cycle 3 (Week 2) ~10 L (42 L)
15 7 Monday ~9 am Sample 100 mL of overlying water for analyses
16 7 ~10 am Remove 3 L, then slowly replace with new 3.1 L Cycle 4 (Week 2) ~10 L (52 L)
17 10 Thursday ~9 am Sample 100 mL of overlying water for analyses
18 10 ~10 am Remove 3 L, then slowly replace with new 3.1 L Phase 1 = gradual water inundation (Core diameter = 146 mm, 167.4 cm2 area × 5.97 cm depth = 1 L) Analyses: 1. Centrifuge. 2. Filter 20 mL for analyses of trace metals. 3. Subsample 60 mL to Green ALS bottle for analyses of alkalinity/acidity, SO4, Cl. 4. Subsample 10 mL to measure pH

B1.2 Temperature-controlled laboratory (15ºC)

B1.3 Slow addition of water

B1.4 Seawater-rewetting reactors

B1.5 Freshwater-rewetting reactors

B1.6 Corer-reactor resuspension scheme Table B2. Surface-resuspension and Sampling Scheme used for the Corer-reactors
Task # Day Time, h Task Reactors continuing on from re-wetting scheme (Table B1.1) Cycle 4R1.1 (Week 3)
19 17 Thursday ~9 am
Sample 100 mL of overlying water for analyses, replace with 100 mL new water
20 17 ~10 am The stirring rate of the water within the reactors was increase to a rate that caused resuspension of the top 2-3 cm of the sediment in each reactor.
20 17 ~11 am Sample 10 mL of overlying water for dissolved metals analyses
21 17 ~3 pm Sample 100 mL of overlying water for analyses, replace with 100 mL new water
Cycle 4R1.2 (Week 3)
22 18 Friday Sample 100 mL of overlying water for analyses, replace with 100 mL new water
Cycle 4R2.1 (Week 4)
23 21 Monday ~9 am
Sample 100 mL of overlying water for analyses, replace with 100 mL new water
24 21 ~10 am The stirring rate of the water within the reactors was increase to a rate that caused resuspension of the top 2-3 cm of the sediment in each reactor.
25 21 ~3 pm Sample 100 mL of overlying water for analyses, replace with 100 mL new water
Cycle 4R1.2 (Week 4)
26 23 Wednesday Sample 100 mL of overlying water for analyses, replace with 100 mL new water
Cycle 4R1.3 (Week 4)
27 25 Friday Sample 100 mL of overlying water for analyses, replace with 100 mL new water
Cycle 4R3.1 (Week 5)
28 28 Monday ~9 am
Sample 100 mL of overlying water for analyses, replace with 100 mL new water
29 28 ~10 am The stirring rate of the water within the reactors was increase to a rate that caused resuspension of the top 2-3 cm of the sediment in each reactor.
30 28 ~3 pm Sample 100 mL of overlying water for analyses, replace with 100 mL new water
Cycle 4R3.2 (Week 5)
31 30 Wednesday Sample 100 mL of overlying water for analyses, replace with 100 mL new water
Cycle 4R3.3 (Week 5)
32 32 Friday Sample 100 mL of overlying water for analyses, replace with 100 mL new water
Cycle 4R3.4 (Week 6)
33 39 Friday Sample 100 mL of overlying water for analyses, replace with 100 mL new water
Cycle 4R3.5 (Week 7)
34 46 Friday Sample 100 mL of overlying water for analyses, replace with 100 mL new water
Cycle 4R3.6 (Week 8)
35 53 Friday Sample 100 mL of overlying water for analyses, replace with 100 mL new water

B1.7 Resuspension (Day 18, day-after 1st resuspension) Freshwater
Seawater Seawater

Freshwater Freshwater
Seawater

APPENDIX C. QUALITY ASSURANCE FOR DATA ANALYSES

Centre for Environmental Contaminants Research LaboratoryCSIRO Land and WaterNew Illawarra Road, Lucas Heights NSW 2234Private Mailbag 7, Bangor NSW 2234 AustraliaTelephone: +61 2 9710 6777 Facsimile: +61 2 9710 6800www.csiro.auABN 41 687 119 230
Quality Control
Replicates (Method C-229)
LABORATORY I.D. CLIENT I.D. Aluminium (μg/L) Manganese (µg/L) Iron (μg/L)CE90-4 FW Core 9 (0-5) - 0.5hr 800 2500 27CE90-4 Duplicate FW Core 9 (0-5) - 0.5hr Duplicate 770 2500 26CE90-4 Average FW Core 9 (0-5) - 0.5hr Average 780 2500 27CE90-14 FW Blank - 24hr <1 <1 0.7CE90-14 Duplicate FW Blank - 24hr Duplicate <1 <1 1.1CE90-14 Average FW Blank - 24hr Average <1 <1 0.9CE90-59 FW Core 4 (1g) 0.1 6 6CE90-59 Duplicate FW Core 4 (1g) Duplicate 0.3 6 7CE90-59 Average FW Core 4 (1g) Average 0.2 6 6CE90-69 FW Core 9 (0-5) 1g 3 360 7CE90-69 Duplicate FW Core 9 (0-5) 1g Duplicate 3 360 7CE90-69 Average FW Core 9 (0-5) 1g Average 3 360 7CE90-89 FW 4-1-1 6 9 <1CE90-89 Duplicate FW 4-1-1 Duplicate 6 9 <1CE90-89 Average FW 4-1-1 Average 6 9 <1CE90-95 FW 3-2-1 A 0.2 11 <1CE90-95 Duplicate FW 3-2-1 A Duplicate 0.4 11 <1CE90-95 Average FW 3-2-1 A Average 0.3 11 <1CE90-113 FW 4-7-1 3 1 <1CE90-113 Duplicate FW 4-7-1 Duplicate 3 1 <1CE90-113 Average FW 4-7-1 Average 3 1 <1CE90-178 FW 1-17-3 15 3700 1300CE90-178 Duplicate FW 1-17-3 Duplicate 14 3700 1300CE90-178 Average FW 1-17-3 Average 15 3700 1300CE90-191 FW 3-21-3 38 150 4CE90-191 Duplicate FW 3-21-3 Duplicate 40 150 4CE90-191 Average FW 3-21-3 Average 39 150 4CE90-238 FW 3.39.1 281 224 8CE90-238 Duplicate FW 3.39.1 Duplicate 287 225 8CE90-238 Average FW 3.39.1 Average 284 224 8
Spike Recoveries (Method C-229)
LABORATORY I.D. CLIENT I.D. Aluminium (μg/L) Iron (μg/L) Manganese (µg/L)CE90-3 % Recovery FW Core 9 (0-1) - 0.5hr 95 87 ---CE90-31 % Recovery SW Core 9A (0-5) - 7hr 102 77 ---CE90-58 % Recovery FW Core 90.1g) Duplicate 106 93 91CE90-68 % Recovery FW Core 9 (0-5) 0.1g 100 94 89CE90-88 % Recovery FW 3-1-1 99 88 87CE90-94 % Recovery FW 1-2-1 B 92 89 ---CE90-102 % Recovery FW 1-4-1 96 98 72CE90-112 % Recovery FW 3-7-1 101 105 89CE90-177 % Recovery FW 4-17-2 101 102 87CE90-192 % Recovery FW 4-21-3 95 101 87
Reference Material (Method C-229)
Reference Material Aluminium (μg/L) Iron (μg/L) Manganese (µg/L)TM-28.3 Measured Value-1 57.1 6.93 18.3TM-28.3 Measured Value-2 53.9 7.08 15.7TM-28.3 Measured Value-3 55.9 7.45 17.8TM-28.3 Measured Value-4 54.3 7.57 18.4
TM28.3 Average (n=4) 55.3 7.26 17.6% Recovery 110 110 110
TM-28.3 (Certified Value) 51.3 ± 5.57 6.90 ± 0.521 16.5 ± 3.71
Dissolved Metals
1 of 3

Replicates (Method C-209)
LABORATORY I.D. CLIENT I.D. Arsenic (µg/L) Cadmium (µg/L) Cobalt (µg/L) Chromium (µg/L) Copper (µg/L) Lead (µg/L) Nickel (µg/L) Vanadium (µg/L) Zinc (µg/L)CE90-2 FW Core 4 (0-5) - 0.5hr 0.66 0.13 1.97 <0.02 0.70 <0.03 3.60 0.18 11.6
CE90-2 Duplicate FW Core 4 (0-5) - 0.5hr Duplicate 0.46 0.11 1.96 <0.02 0.80 <0.03 3.79 0.17 12.6CE90-2 Average FW Core 4 (0-5) - 0.5hr Average 0.56 0.12 1.96 <0.02 0.75 <0.03 3.69 0.17 12.1
CE90-12 FW Core 9 (0-5) - 7hr 7.77 1.59 56.8 0.99 4.83 0.42 137 0.53 78.8CE90-12 Duplicate FW Core 9 (0-5) - 7hr Duplicate 7.79 1.50 57.8 1.01 4.72 0.41 136 0.56 78.1CE90-12 Average FW Core 9 (0-5) - 7hr Average 7.78 1.54 57.3 1.00 4.77 0.42 136 0.55 78.5
CE90-20 SW Core 4 (0-5) -0.5hr 1.64 0.49 0.33 3.45 0.61 <0.03 6.88 0.24 3.41CE90-20 dup SW Core 4 (0-5) -0.5hr 2.49 0.45 0.38 3.50 0.59 <0.03 7.07 0.18 3.47
CE90-20 Average SW Core 4 (0-5) -0.5hr 2.07 0.47 0.36 3.48 0.60 <0.03 6.98 0.21 3.44CE90-30 SW Core 9 (0-5) - 7hr 14.6 2.78 1.19 76.1 5.09 7.63 193 0.44 105
CE90-30 dup SW Core 9 (0-5) - 7hr 15.1 2.23 1.22 73.4 5.19 6.48 187 0.16 100CE90-30 Average SW Core 9 (0-5) - 7hr 14.9 2.51 1.20 74.8 5.14 7.05 190 0.30 103
CE90-40 SW Core 9 (0-1) - 1g 3.11 0.26 0.38 2.37 2.03 <0.03 2.80 5.63 2.97CE90-40 dup SW Core 9 (0-1) - 1g 2.23 0.20 0.42 2.40 1.98 <0.03 2.44 5.79 2.26
CE90-40 Average SW Core 9 (0-1) - 1g 2.67 0.23 0.40 2.39 2.00 <0.03 2.62 5.71 2.61CE90-49 SW Core 4 (0.1g) Duplicate 2.41 0.09 0.28 0.13 1.36 <0.03 0.30 1.11 1.37
CE90-49 dup SW Core 4 (0.1g) Duplicate 3.34 0.01 0.31 0.13 1.32 <0.03 0.29 0.84 0.99CE90-49 Average SW Core 4 (0.1g) Duplicate 2.88 0.05 0.29 0.13 1.34 <0.03 0.30 0.98 1.18
CE90-57 FW Core 4 (0.1g) 0.81 0.09 0.04 <0.02 1.04 <0.03 0.72 0.73 2.70CE90-57 Duplicate FW Core 4 (0.1g) Duplicate 1.01 0.09 0.05 <0.02 1.00 <0.03 0.72 0.68 2.44CE90-57 Average FW Core 4 (0.1g) Average 0.91 0.09 0.04 <0.02 1.02 <0.03 0.72 0.70 2.57
CE90-67 FW Core 9 (0-5) 0.01g 0.86 0.05 0.09 <0.02 2.75 0.04 0.68 1.31 8.73CE90-67 Duplicate FW Core 9 (0-5) 0.01g Duplicate 0.83 0.05 0.09 <0.02 2.80 0.04 0.68 1.29 8.54CE90-67 Average FW Core 9 (0-5) 0.01g Average 0.85 0.05 0.09 <0.02 2.78 0.04 0.68 1.30 8.63
CE90-82 SW Core 9 (0-5) 7.54 2.35 1.10 92.6 3.16 4.20 207 0.44 121CE90-82 dup SW Core 9 (0-5) 6.64 2.33 0.98 91.7 3.17 4.16 208 0.54 117
CE90-82 Average SW Core 9 (0-5) 7.09 2.34 1.04 92.2 3.17 4.18 208 0.49 119CE90-87 FW 1-1-1 4.43 0.09 1.34 0.06 11.5 0.06 2.64 12.4 3.20
CE90-87 Duplicate FW 1-1-1 Duplicate 4.31 0.07 1.41 0.07 11.6 0.05 2.67 13.2 3.03CE90-87 Average FW 1-1-1 Average 4.37 0.08 1.38 0.07 11.6 0.05 2.65 12.8 3.11
CE90-93 FW 1-2-1 A 6.65 0.03 1.66 0.14 13.5 0.07 3.62 21.8 1.59CE90-93 Duplicate FW 1-2-1 A Duplicate 6.34 0.03 1.72 0.15 13.7 0.08 3.54 22.0 1.48CE90-93 Average FW 1-2-1 A Average 6.50 0.03 1.69 0.14 13.6 0.07 3.58 21.9 1.53
LABORATORY I.D. CLIENT I.D. Arsenic (µg/L) Cadmium (µg/L) Cobalt (µg/L) Chromium (µg/L) Copper (µg/L) Lead (µg/L) Nickel (µg/L) Vanadium (µg/L) Zinc (µg/L)CE90-101 FW 4-2-2 0.82 0.16 0.12 0.27 3.38 0.14 2.14 0.48 2.57
CE90-101 Duplicate FW 4-2-2 Duplicate 0.84 0.15 0.10 0.34 3.31 0.13 2.09 0.51 2.47CE90-101 Average FW 4-2-2 Average 0.83 0.15 0.11 0.30 3.34 0.14 2.12 0.50 2.52
CE90-111 FW 1-7-1 6.46 0.02 1.29 0.23 5.32 0.05 3.62 27.9 1.83CE90-111 Duplicate FW 1-7-1 Duplicate 6.52 0.02 1.29 0.23 5.25 0.05 3.59 28.2 1.66CE90-111 Average FW 1-7-1 Average 6.49 0.02 1.29 0.23 5.29 0.05 3.61 28.0 1.75
CE90-176 FW 3-17-2 0.64 0.27 2.91 <0.04 0.95 <0.03 5.66 0.16 3.29CE90-176 Duplicate FW 3-17-2 Duplicate 0.66 0.26 2.96 <0.04 0.93 <0.03 5.49 0.17 3.48CE90-176 Average FW 3-17-2 Average 0.65 0.26 2.93 <0.04 0.94 <0.03 5.58 0.17 3.38
CE90-186 FW 4-21-1 0.88 0.04 0.05 <0.04 1.28 <0.03 0.58 0.34 0.43CE90-186 Duplicate FW 4-21-1 Duplicate 0.93 0.02 0.04 <0.04 1.27 <0.03 0.59 0.31 0.17CE90-186 Average FW 4-21-1 Average 0.91 0.03 0.04 <0.04 1.27 <0.03 0.59 0.32 0.30
CE90-200 FE Core 4 - 72 hr leach 0.87 <0.01 0.08 <0.04 1.02 <0.03 0.63 0.59 0.02CE90-200 Duplicate FE Core 4 - 72 hr leach Duplicate 0.77 <0.01 0.08 <0.04 0.95 <0.03 0.61 0.59 0.03CE90-200 Average FE Core 4 - 72 hr leach Average 0.82 <0.01 0.08 <0.04 0.98 <0.03 0.62 0.59 0.02
CE90-219 FW 1.28.2 10.5 0.08 20.9 0.72 2.47 1.02 31.6 8.12 14.8CE90-219 Duplicate FW 1.28.2 Duplicate 10.7 0.08 20.7 0.72 2.44 1.05 31.4 8.01 14.9CE90-219 Average FW 1.28.2 Average 10.6 0.08 20.8 0.72 2.46 1.04 31.5 8.06 14.9
Dissolved Metals
Dissolved Metals
2 of 3

Spike Recoveries (Method C-209)
LABORATORY I.D. CLIENT I.D. Arsenic (µg/L) Cadmium (µg/L) Cobalt (µg/L) Chromium (µg/L) Copper (µg/L) Lead (µg/L) Nickel (µg/L) Vanadium (µg/L) Zinc (µg/L)CE90-1 % Recovery FW Blank - 0.5hr % Recovery 105 91 97 102 101 87 101 101 101CE90-11 % Recovery FW Core 9 (0-1) - 7hr % Recovery 122 91 103 109 99 89 102 109 98CE90-19 % Recovery SW Blank - 0.5hr 114 87 107 99 103 88 105 112 100CE90-29 % Recovery SW Core 9 (0-1) - 7hr 114 91 110 103 101 89 104 112 98CE90-39% Recovery SW Core 9 (0-1) - 0.1g 113 92 111 105 103 90 106 118 99CE90-48 % Recovery SW Core 4 (0.1g) 109 88 106 100 97 85 100 112 94CE90-81 % Recovery SW Core 9 (0-1) 118 95 109 104 100 90 103 114 97CE90-56 % Recovery FW Core 4 (0.01g) Duplicate % Recovery 116 99 112 115 107 99 110 119 108CE90-66 % Recovery FW Core 9 (0-1) 10g % Recovery 120 92 105 110 100 89 104 114 101CE90-76 % Recovery FW Core 9 (0-5) % Recovery 122 89 123 110 99 74 --- 119 72CE90-92 % Recovery FW 4-1-2 % Recovery 108 96 103 108 98 98 103 111 97CE90-100 % Recovery FW 3-2-2 % Recovery 100 97 101 107 100 96 102 107 76CE90-110 % Recovery FW 4-4-3 % Recovery 103 99 101 106 98 98 101 108 96CE90-175 % Recovery FW 1-17-2 % Recovery 111 94 106 112 100 96 106 114 96CE90-185 % Recovery FW 3-21-1 % Recovery 103 97 107 109 99 98 102 112 97CE90-199 % Recovery FW Core 9 (0-5) - 72 hr leach % Recovery 105 96 101 104 94 96 94 109 92CE90-216 % Recovery FW 4.28.1 % Recovery 105 96 109 111 100 97 105 112 99
Certified Reference Mateial (Method C-209)
Sample: Arsenic (µg/L) Cadmium (µg/L) Cobalt (µg/L) Chromium (µg/L) Copper (µg/L) Lead (µg/L) Nickel (µg/L) Vanadium (µg/L) Zinc (µg/L)TM-28.3 Measured Value-1 6.05 1.74 3.11 4.89 5.92 3.66 8.91 3.12 24.8TM-28.3 Measured Value-2 5.86 1.81 3.22 4.99 6.44 3.73 9.35 3.20 25.4TM-28.3 Measured Value-3 5.93 1.69 4.71 3.02 6.08 3.53 9.15 2.96 28.9
TM-28.3 (Certified) 6.22±0.848 1.91±0.23 3.53±0.519 4.83±0.768 6.15±0.863 3.97±0.567 9.8±1.16 3.07±0.394 27.5±3.37TM-28.3 (Average n=3) 5.95 1.75 3.68 4.30 6.15 3.64 9.14 3.09 26.37
% Recovery 96 91 100 89 100 92 100 100 96
Miscellaneous Information
Method Codes:C-209 Inductively Coupled Plasma-Mass Spectrometry C-229 Inductively Coupled Plasma-Atomic Emission Spectrometry
3 of 3

False
QUALITY CONTROL REPORT
Work Order : EB0912220 Page : 1 of 6
:: LaboratoryClient Environmental Division BrisbaneC S I R O AUSTRALIA
: :ContactContact DR STUART SIMPSON Tim Kilmister
:: AddressAddress CENTRE FOR ENVIRONMENTAL CONTAMINANTS RESEARCH
CSIRO ENERGY TECHNOLOGY
NEW ILLAWARRA ROAD
LUCAS HEIGHTS NSW, AUSTRALIA 2234
32 Shand Street Stafford QLD Australia 4053
:: E-mailE-mail [email protected] [email protected]
:: TelephoneTelephone +61 02 97106807 +61-7-3243 7222
:: FacsimileFacsimile +61 02 97106837 +61-7-3243 7218
:Project CSIRO Land and Water CECR (Sydney) QC Level : NEPM 1999 Schedule B(3) and ALS QCS3 requirement
Site : ----
:C-O-C number ---- Date Samples Received : 04-AUG-2009
Sampler : ---- Issue Date : 10-AUG-2009
:Order number ----
42:No. of samples received
Quote number : BN/032/09 42:No. of samples analysed
This report supersedes any previous report(s) with this reference. Results apply to the sample(s) as submitted. All pages of this report have been checked and approved for
release.
This Quality Control Report contains the following information:
l Laboratory Duplicate (DUP) Report; Relative Percentage Difference (RPD) and Acceptance Limits
l Method Blank (MB) and Laboratory Control Spike (LCS) Report ; Recovery and Acceptance Limits
l Matrix Spike (MS) Report; Recovery and Acceptance Limits
NATA Accredited Laboratory 825
This document is issued in
accordance with NATA
accreditation requirements.
Accredited for compliance with
ISO/IEC 17025.
SignatoriesThis document has been electronically signed by the authorized signatories indicated below. Electronic signing has been
carried out in compliance with procedures specified in 21 CFR Part 11.
Signatories Accreditation CategoryPosition
Kim McCabe Senior Inorganic Chemist Inorganics

2 of 6:Page
Work Order :
:Client
EB0912220
C S I R O AUSTRALIA
CSIRO Land and Water CECR (Sydney):Project
General Comments
The analytical procedures used by the Environmental Division have been developed from established internationally recognized procedures such as those published by the USEPA, APHA, AS and NEPM. In house
developed procedures are employed in the absence of documented standards or by client request.
Where moisture determination has been performed, results are reported on a dry weight basis.
Where a reported less than (<) result is higher than the LOR, this may be due to primary sample extract/digestate dilution and/or insuffient sample for analysis.
Where the LOR of a reported result differs from standard LOR, this may be due to high moisture content, insufficient sample (reduced weight employed) or matrix interference.
Anonymous = Refers to samples which are not specifically part of this work order but formed part of the QC process lot
CAS Number = CAS registry number from database maintained by Chemical Abstracts Services. The Chemical Abstracts Service is a division of the American Chemical Society.
LOR = Limit of reporting
RPD = Relative Percentage Difference
# = Indicates failed QC
Key :

3 of 6:Page
Work Order :
:Client
EB0912220
C S I R O AUSTRALIA
CSIRO Land and Water CECR (Sydney):Project
Laboratory Duplicate (DUP) Report
The quality control term Laboratory Duplicate refers to a randomly selected intralaboratory split. Laboratory duplicates provide information regarding method precision and sample heterogeneity. The permitted ranges
for the Relative Percent Deviation (RPD) of Laboratory Duplicates are specified in ALS Method QWI -EN/38 and are dependent on the magnitude of results in comparison to the level of reporting: Result < 10 times LOR:-
No Limit; Result between 10 and 20 times LOR:- 0% - 50%; Result > 20 times LOR:- 0% - 20%.
Sub-Matrix: WATER Laboratory Duplicate (DUP) Report
Original Result RPD (%)Laboratory sample ID Client sample ID Method: Compound CAS Number LOR Unit Duplicate Result Recovery Limits (%)
ED037P: Alkalinity by PC Titrator (QC Lot: 1059446)
ED037-P: Hydroxide Alkalinity as CaCO3 DMO-210-001 1 mg/L <1 <1 0.0 No LimitAnonymousEB0912201-001
ED037-P: Carbonate Alkalinity as CaCO3 3812-32-6 1 mg/L <1 <1 0.0 No Limit
ED037-P: Bicarbonate Alkalinity as CaCO3 71-52-3 1 mg/L 92 92 0.0 0% - 20%
ED037-P: Total Alkalinity as CaCO3 ---- 1 mg/L 92 92 0.0 0% - 20%
ED037-P: Hydroxide Alkalinity as CaCO3 DMO-210-001 1 mg/L <1 <1 0.0 No LimitCore 9 4.1EB0912220-024
ED037-P: Carbonate Alkalinity as CaCO3 3812-32-6 1 mg/L <1 <1 0.0 No Limit
ED037-P: Bicarbonate Alkalinity as CaCO3 71-52-3 1 mg/L 118 118 0.0 0% - 20%
ED037-P: Total Alkalinity as CaCO3 ---- 1 mg/L 118 118 0.0 0% - 20%
ED037P: Alkalinity by PC Titrator (QC Lot: 1060557)
ED037-P: Hydroxide Alkalinity as CaCO3 DMO-210-001 1 mg/L <1 <1 0.0 No LimitCore 1 7.1EB0912220-031
ED037-P: Carbonate Alkalinity as CaCO3 3812-32-6 1 mg/L <1 <1 0.0 No Limit
ED037-P: Bicarbonate Alkalinity as CaCO3 71-52-3 1 mg/L 126 122 2.7 0% - 20%
ED037-P: Total Alkalinity as CaCO3 ---- 1 mg/L 126 122 2.7 0% - 20%
ED037-P: Hydroxide Alkalinity as CaCO3 DMO-210-001 1 mg/L <1 <1 0.0 No LimitCore 4 10.1EB0912220-040
ED037-P: Carbonate Alkalinity as CaCO3 3812-32-6 1 mg/L <1 <1 0.0 No Limit
ED037-P: Bicarbonate Alkalinity as CaCO3 71-52-3 1 mg/L 85 82 2.8 0% - 20%
ED037-P: Total Alkalinity as CaCO3 ---- 1 mg/L 85 82 2.8 0% - 20%
ED038A: Acidity (QC Lot: 1059449)
ED038: Acidity as CaCO3 ---- 1 mg/L 3 3 0.0 No LimitCore 1 1.2EB0912220-001
ED038: Acidity as CaCO3 ---- 1 mg/L 3 3 0.0 No LimitCore 4 2.1EB0912220-010
ED038A: Acidity (QC Lot: 1060997)
ED038: Acidity as CaCO3 ---- 1 mg/L 129 129 0.0 0% - 20%AnonymousEB0912305-001
ED040F: Dissolved Major Anions (QC Lot: 1061192)
ED040F: Sulfate as SO4 2- 14808-79-8 1 mg/L 3320 3280 1.2 0% - 20%Core 9 4.3EB0912220-030
ED040F: Dissolved Major Anions (QC Lot: 1061207)
ED040F: Sulfate as SO4 2- 14808-79-8 1 mg/L <1 <1 0.0 No LimitAnonymousEB0912198-001
ED040F: Sulfate as SO4 2- 14808-79-8 1 mg/L 208 210 0.9 0% - 20%AnonymousEB0912290-001
ED045G: Chloride Discrete analyser (QC Lot: 1061191)
ED045G: Chloride 16887-00-6 1 mg/L 19600 19200 2.1 0% - 20%Core 2 1.2EB0912220-002
ED045G: Chloride 16887-00-6 1 mg/L 19700 19600 0.5 0% - 20%Core 5 2.1EB0912220-011
ED045G: Chloride Discrete analyser (QC Lot: 1061193)
ED045G: Chloride 16887-00-6 1 mg/L 516 509 1.4 0% - 20%Core 3 4.1EB0912220-021
ED045G: Chloride 16887-00-6 1 mg/L 19700 19100 3.1 0% - 20%Core 9 4.3EB0912220-030
ED045G: Chloride Discrete analyser (QC Lot: 1061209)
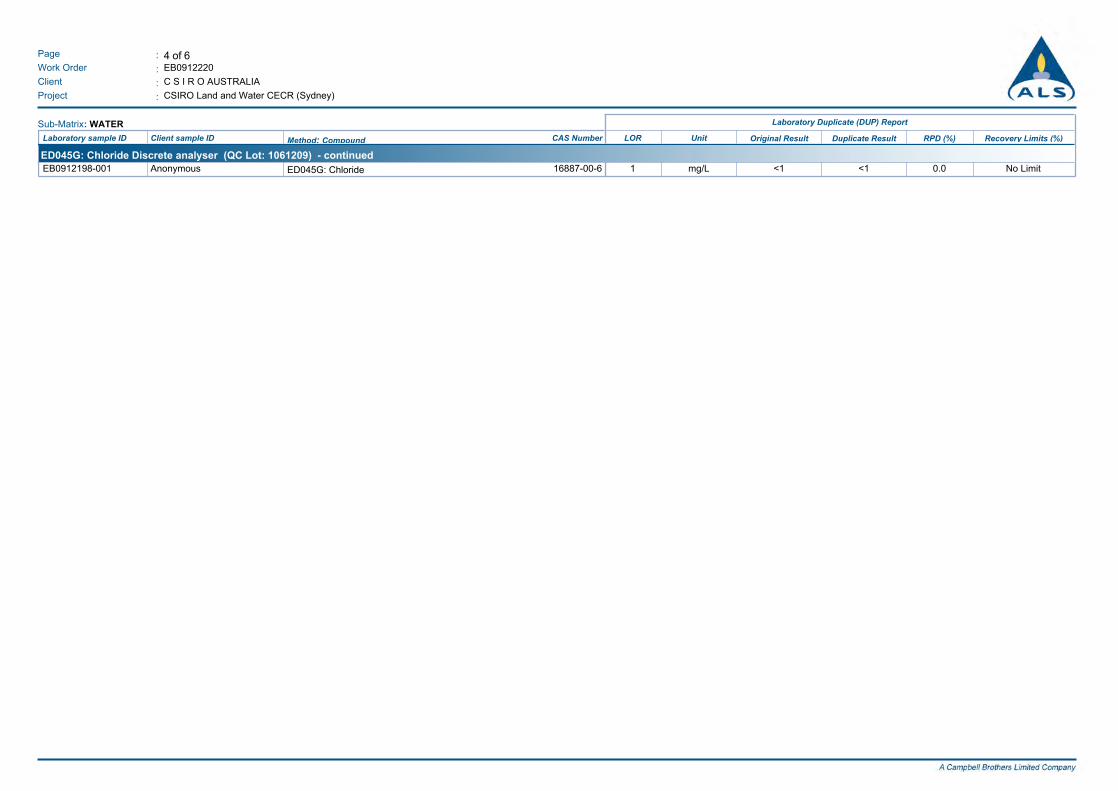
4 of 6:Page
Work Order :
:Client
EB0912220
C S I R O AUSTRALIA
CSIRO Land and Water CECR (Sydney):Project
Sub-Matrix: WATER Laboratory Duplicate (DUP) Report
Original Result RPD (%)Laboratory sample ID Client sample ID Method: Compound CAS Number LOR Unit Duplicate Result Recovery Limits (%)
ED045G: Chloride Discrete analyser (QC Lot: 1061209) - continued
ED045G: Chloride 16887-00-6 1 mg/L <1 <1 0.0 No LimitAnonymousEB0912198-001
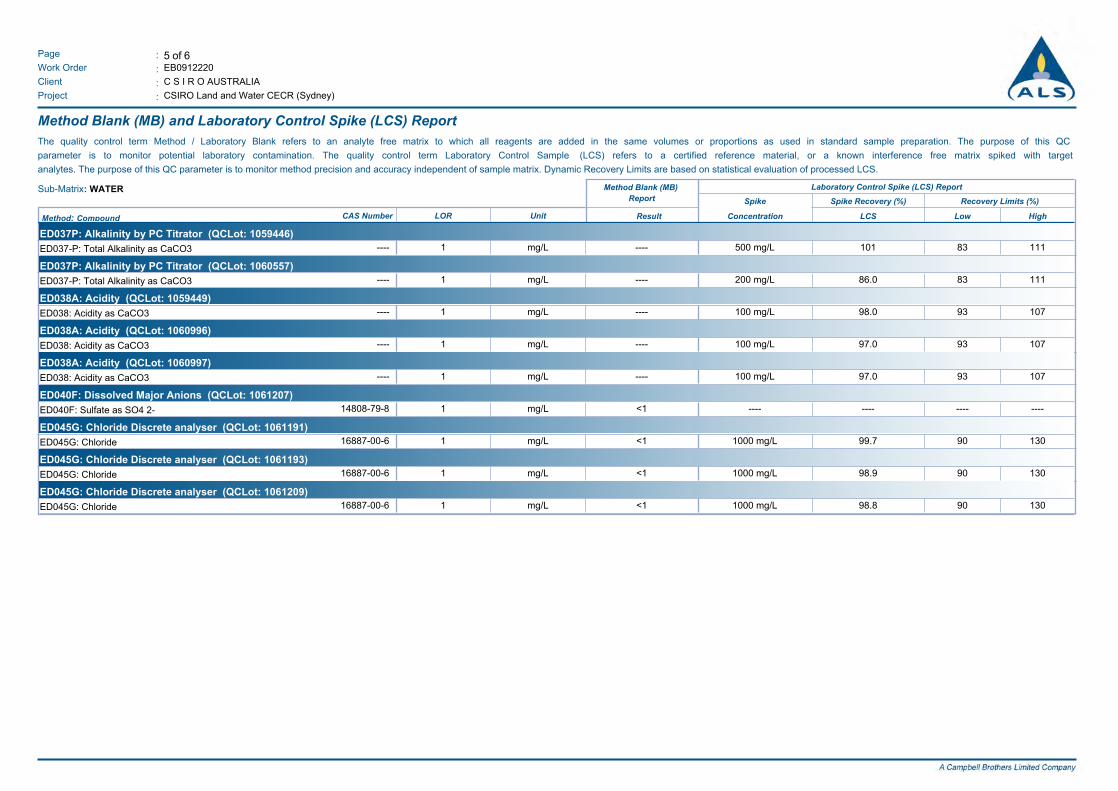
5 of 6:Page
Work Order :
:Client
EB0912220
C S I R O AUSTRALIA
CSIRO Land and Water CECR (Sydney):Project
Method Blank (MB) and Laboratory Control Spike (LCS) Report
The quality control term Method / Laboratory Blank refers to an analyte free matrix to which all reagents are added in the same volumes or proportions as used in standard sample preparation. The purpose of this QC
parameter is to monitor potential laboratory contamination. The quality control term Laboratory Control Sample (LCS) refers to a certified reference material, or a known interference free matrix spiked with target
analytes. The purpose of this QC parameter is to monitor method precision and accuracy independent of sample matrix. Dynamic Recovery Limits are based on statistical evaluation of processed LCS.
Sub-Matrix: WATER Method Blank (MB)
Report
Laboratory Control Spike (LCS) Report
Spike Spike Recovery (%) Recovery Limits (%)
Result Concentration HighLowLCSMethod: Compound CAS Number LOR Unit
ED037P: Alkalinity by PC Titrator (QCLot: 1059446)
ED037-P: Total Alkalinity as CaCO3 ---- 1 mg/L ---- 101500 mg/L 11183
ED037P: Alkalinity by PC Titrator (QCLot: 1060557)
ED037-P: Total Alkalinity as CaCO3 ---- 1 mg/L ---- 86.0200 mg/L 11183
ED038A: Acidity (QCLot: 1059449)
ED038: Acidity as CaCO3 ---- 1 mg/L ---- 98.0100 mg/L 10793
ED038A: Acidity (QCLot: 1060996)
ED038: Acidity as CaCO3 ---- 1 mg/L ---- 97.0100 mg/L 10793
ED038A: Acidity (QCLot: 1060997)
ED038: Acidity as CaCO3 ---- 1 mg/L ---- 97.0100 mg/L 10793
ED040F: Dissolved Major Anions (QCLot: 1061207)
ED040F: Sulfate as SO4 2- 14808-79-8 1 mg/L <1 -------- --------
ED045G: Chloride Discrete analyser (QCLot: 1061191)
ED045G: Chloride 16887-00-6 1 mg/L <1 99.71000 mg/L 13090
ED045G: Chloride Discrete analyser (QCLot: 1061193)
ED045G: Chloride 16887-00-6 1 mg/L <1 98.91000 mg/L 13090
ED045G: Chloride Discrete analyser (QCLot: 1061209)
ED045G: Chloride 16887-00-6 1 mg/L <1 98.81000 mg/L 13090

6 of 6:Page
Work Order :
:Client
EB0912220
C S I R O AUSTRALIA
CSIRO Land and Water CECR (Sydney):Project
Matrix Spike (MS) Report
The quality control term Matrix Spike (MS) refers to an intralaboratory split sample spiked with a representative set of target analytes. The purpose of this QC parameter is to monitor potential matrix effects on analyte
recoveries. Static Recovery Limits as per laboratory Data Quality Objectives (DQOs). Ideal recovery ranges stated may be waived in the event of sample matrix interference.
Sub-Matrix: WATER Matrix Spike (MS) Report
Spike Recovery (%) Recovery Limits (%)Spike
HighLowMSConcentrationLaboratory sample ID Client sample ID Method: Compound CAS Number
ED045G: Chloride Discrete analyser (QCLot: 1061191)
Core 2 1.2EB0912220-002 16887-00-6ED045G: Chloride # Not Determined400 mg/L 13070
ED045G: Chloride Discrete analyser (QCLot: 1061193)
Core 4 4.1EB0912220-022 16887-00-6ED045G: Chloride 83.2400 mg/L 13070
ED045G: Chloride Discrete analyser (QCLot: 1061209)
AnonymousEB0912198-007 16887-00-6ED045G: Chloride 101400 mg/L 13070

False
QUALITY CONTROL REPORT
Work Order : EB0914086 Page : 1 of 5
:: LaboratoryClient Environmental Division BrisbaneC S I R O AUSTRALIA
: :ContactContact DR STUART SIMPSON Tim Kilmister
:: AddressAddress CENTRE FOR ENVIRONMENTAL CONTAMINANTS RESEARCH
CSIRO ENERGY TECHNOLOGY
NEW ILLAWARRA ROAD
LUCAS HEIGHTS NSW, AUSTRALIA 2234
32 Shand Street Stafford QLD Australia 4053
:: E-mailE-mail [email protected] [email protected]
:: TelephoneTelephone +61 02 97106807 +61-7-3243 7222
:: FacsimileFacsimile +61 02 97106837 +61-7-3243 7218
:Project ---- QC Level : NEPM 1999 Schedule B(3) and ALS QCS3 requirement
Site : ----
:C-O-C number ---- Date Samples Received : 07-SEP-2009
Sampler : ---- Issue Date : 14-SEP-2009
:Order number ----
6:No. of samples received
Quote number : BN/032/09 6:No. of samples analysed
This report supersedes any previous report(s) with this reference. Results apply to the sample(s) as submitted. All pages of this report have been checked and approved for
release.
This Quality Control Report contains the following information:
l Laboratory Duplicate (DUP) Report; Relative Percentage Difference (RPD) and Acceptance Limits
l Method Blank (MB) and Laboratory Control Spike (LCS) Report ; Recovery and Acceptance Limits
l Matrix Spike (MS) Report; Recovery and Acceptance Limits
NATA Accredited Laboratory 825
This document is issued in
accordance with NATA
accreditation requirements.
Accredited for compliance with
ISO/IEC 17025.
SignatoriesThis document has been electronically signed by the authorized signatories indicated below. Electronic signing has been
carried out in compliance with procedures specified in 21 CFR Part 11.
Signatories Accreditation CategoryPosition
Stephen Hislop Senior Inorganic Chemist Inorganics

2 of 5:Page
Work Order :
:Client
EB0914086
C S I R O AUSTRALIA
----:Project
General Comments
The analytical procedures used by the Environmental Division have been developed from established internationally recognized procedures such as those published by the USEPA, APHA, AS and NEPM. In house
developed procedures are employed in the absence of documented standards or by client request.
Where moisture determination has been performed, results are reported on a dry weight basis.
Where a reported less than (<) result is higher than the LOR, this may be due to primary sample extract/digestate dilution and/or insuffient sample for analysis.
Where the LOR of a reported result differs from standard LOR, this may be due to high moisture content, insufficient sample (reduced weight employed) or matrix interference.
Anonymous = Refers to samples which are not specifically part of this work order but formed part of the QC process lot
CAS Number = CAS registry number from database maintained by Chemical Abstracts Services. The Chemical Abstracts Service is a division of the American Chemical Society.
LOR = Limit of reporting
RPD = Relative Percentage Difference
# = Indicates failed QC
Key :

3 of 5:Page
Work Order :
:Client
EB0914086
C S I R O AUSTRALIA
----:Project
Laboratory Duplicate (DUP) Report
The quality control term Laboratory Duplicate refers to a randomly selected intralaboratory split. Laboratory duplicates provide information regarding method precision and sample heterogeneity. The permitted ranges
for the Relative Percent Deviation (RPD) of Laboratory Duplicates are specified in ALS Method QWI -EN/38 and are dependent on the magnitude of results in comparison to the level of reporting: Result < 10 times LOR:-
No Limit; Result between 10 and 20 times LOR:- 0% - 50%; Result > 20 times LOR:- 0% - 20%.
Sub-Matrix: WATER Laboratory Duplicate (DUP) Report
Original Result RPD (%)Laboratory sample ID Client sample ID Method: Compound CAS Number LOR Unit Duplicate Result Recovery Limits (%)
ED037P: Alkalinity by PC Titrator (QC Lot: 1092859)
ED037-P: Hydroxide Alkalinity as CaCO3 DMO-210-001 1 mg/L <1 <1 0.0 No LimitAnonymousEB0914021-004
ED037-P: Carbonate Alkalinity as CaCO3 3812-32-6 1 mg/L <1 <1 0.0 No Limit
ED037-P: Bicarbonate Alkalinity as CaCO3 71-52-3 1 mg/L 106 106 0.0 0% - 20%
ED037-P: Total Alkalinity as CaCO3 ---- 1 mg/L 106 106 0.0 0% - 20%
ED038A: Acidity (QC Lot: 1092873)
ED038: Acidity as CaCO3 ---- 1 mg/L 31 31 0.0 0% - 20%Core 2.46.1EB0914086-002
ED040F: Dissolved Major Anions (QC Lot: 1094305)
ED040F: Sulfate as SO4 2- 14808-79-8 1 mg/L 920 930 1.0 0% - 20%AnonymousEB0914058-001
ED040F: Sulfate as SO4 2- 14808-79-8 1 mg/L 146 149 2.2 0% - 20%AnonymousEB0914078-001
ED045G: Chloride Discrete analyser (QC Lot: 1094304)
ED045G: Chloride 16887-00-6 1 mg/L 4820 4800 0.4 0% - 20%AnonymousEB0914058-001
ED045G: Chloride 16887-00-6 1 mg/L 44 43 2.3 0% - 20%AnonymousEB0914078-001

4 of 5:Page
Work Order :
:Client
EB0914086
C S I R O AUSTRALIA
----:Project
Method Blank (MB) and Laboratory Control Spike (LCS) Report
The quality control term Method / Laboratory Blank refers to an analyte free matrix to which all reagents are added in the same volumes or proportions as used in standard sample preparation. The purpose of this QC
parameter is to monitor potential laboratory contamination. The quality control term Laboratory Control Sample (LCS) refers to a certified reference material, or a known interference free matrix spiked with target
analytes. The purpose of this QC parameter is to monitor method precision and accuracy independent of sample matrix. Dynamic Recovery Limits are based on statistical evaluation of processed LCS.
Sub-Matrix: WATER Method Blank (MB)
Report
Laboratory Control Spike (LCS) Report
Spike Spike Recovery (%) Recovery Limits (%)
Result Concentration HighLowLCSMethod: Compound CAS Number LOR Unit
ED037P: Alkalinity by PC Titrator (QCLot: 1092859)
ED037-P: Total Alkalinity as CaCO3 ---- 1 mg/L ---- 98.5200 mg/L 11183
ED038A: Acidity (QCLot: 1092873)
ED038: Acidity as CaCO3 ---- 1 mg/L ---- 100100 mg/L 10793
ED040F: Dissolved Major Anions (QCLot: 1094305)
ED040F: Sulfate as SO4 2- 14808-79-8 1 mg/L <1 -------- --------
ED045G: Chloride Discrete analyser (QCLot: 1094304)
ED045G: Chloride 16887-00-6 1 mg/L <1 94.41000 mg/L 13090

5 of 5:Page
Work Order :
:Client
EB0914086
C S I R O AUSTRALIA
----:Project
Matrix Spike (MS) Report
The quality control term Matrix Spike (MS) refers to an intralaboratory split sample spiked with a representative set of target analytes. The purpose of this QC parameter is to monitor potential matrix effects on analyte
recoveries. Static Recovery Limits as per laboratory Data Quality Objectives (DQOs). Ideal recovery ranges stated may be waived in the event of sample matrix interference.
Sub-Matrix: WATER Matrix Spike (MS) Report
Spike Recovery (%) Recovery Limits (%)Spike
HighLowMSConcentrationLaboratory sample ID Client sample ID Method: Compound CAS Number
ED045G: Chloride Discrete analyser (QCLot: 1094304)
AnonymousEB0913886-002 16887-00-6ED045G: Chloride 85.6400 mg/L 13070