Embed Size (px)
Citation preview
6915000mN
6935000mN
20
25
30
6915000mN
6935000mN
20
25
30
520000mE 535000mE25 30
520000mE 535000mE25 30
27 54
27 48
27 42
153 12 153 18 153 24
153 12 153 18 153 24
27 54
27 48
27 42
CITY OF GOLD COAST
LOGAN CITY
REDLAND SHIRE
C The State of Queensland (Department of Natural Resources and Mines) 2002.
ISLANDS NOT SURVEYED
Logan
River
PimpamaRiver
Coomera
Riv
er
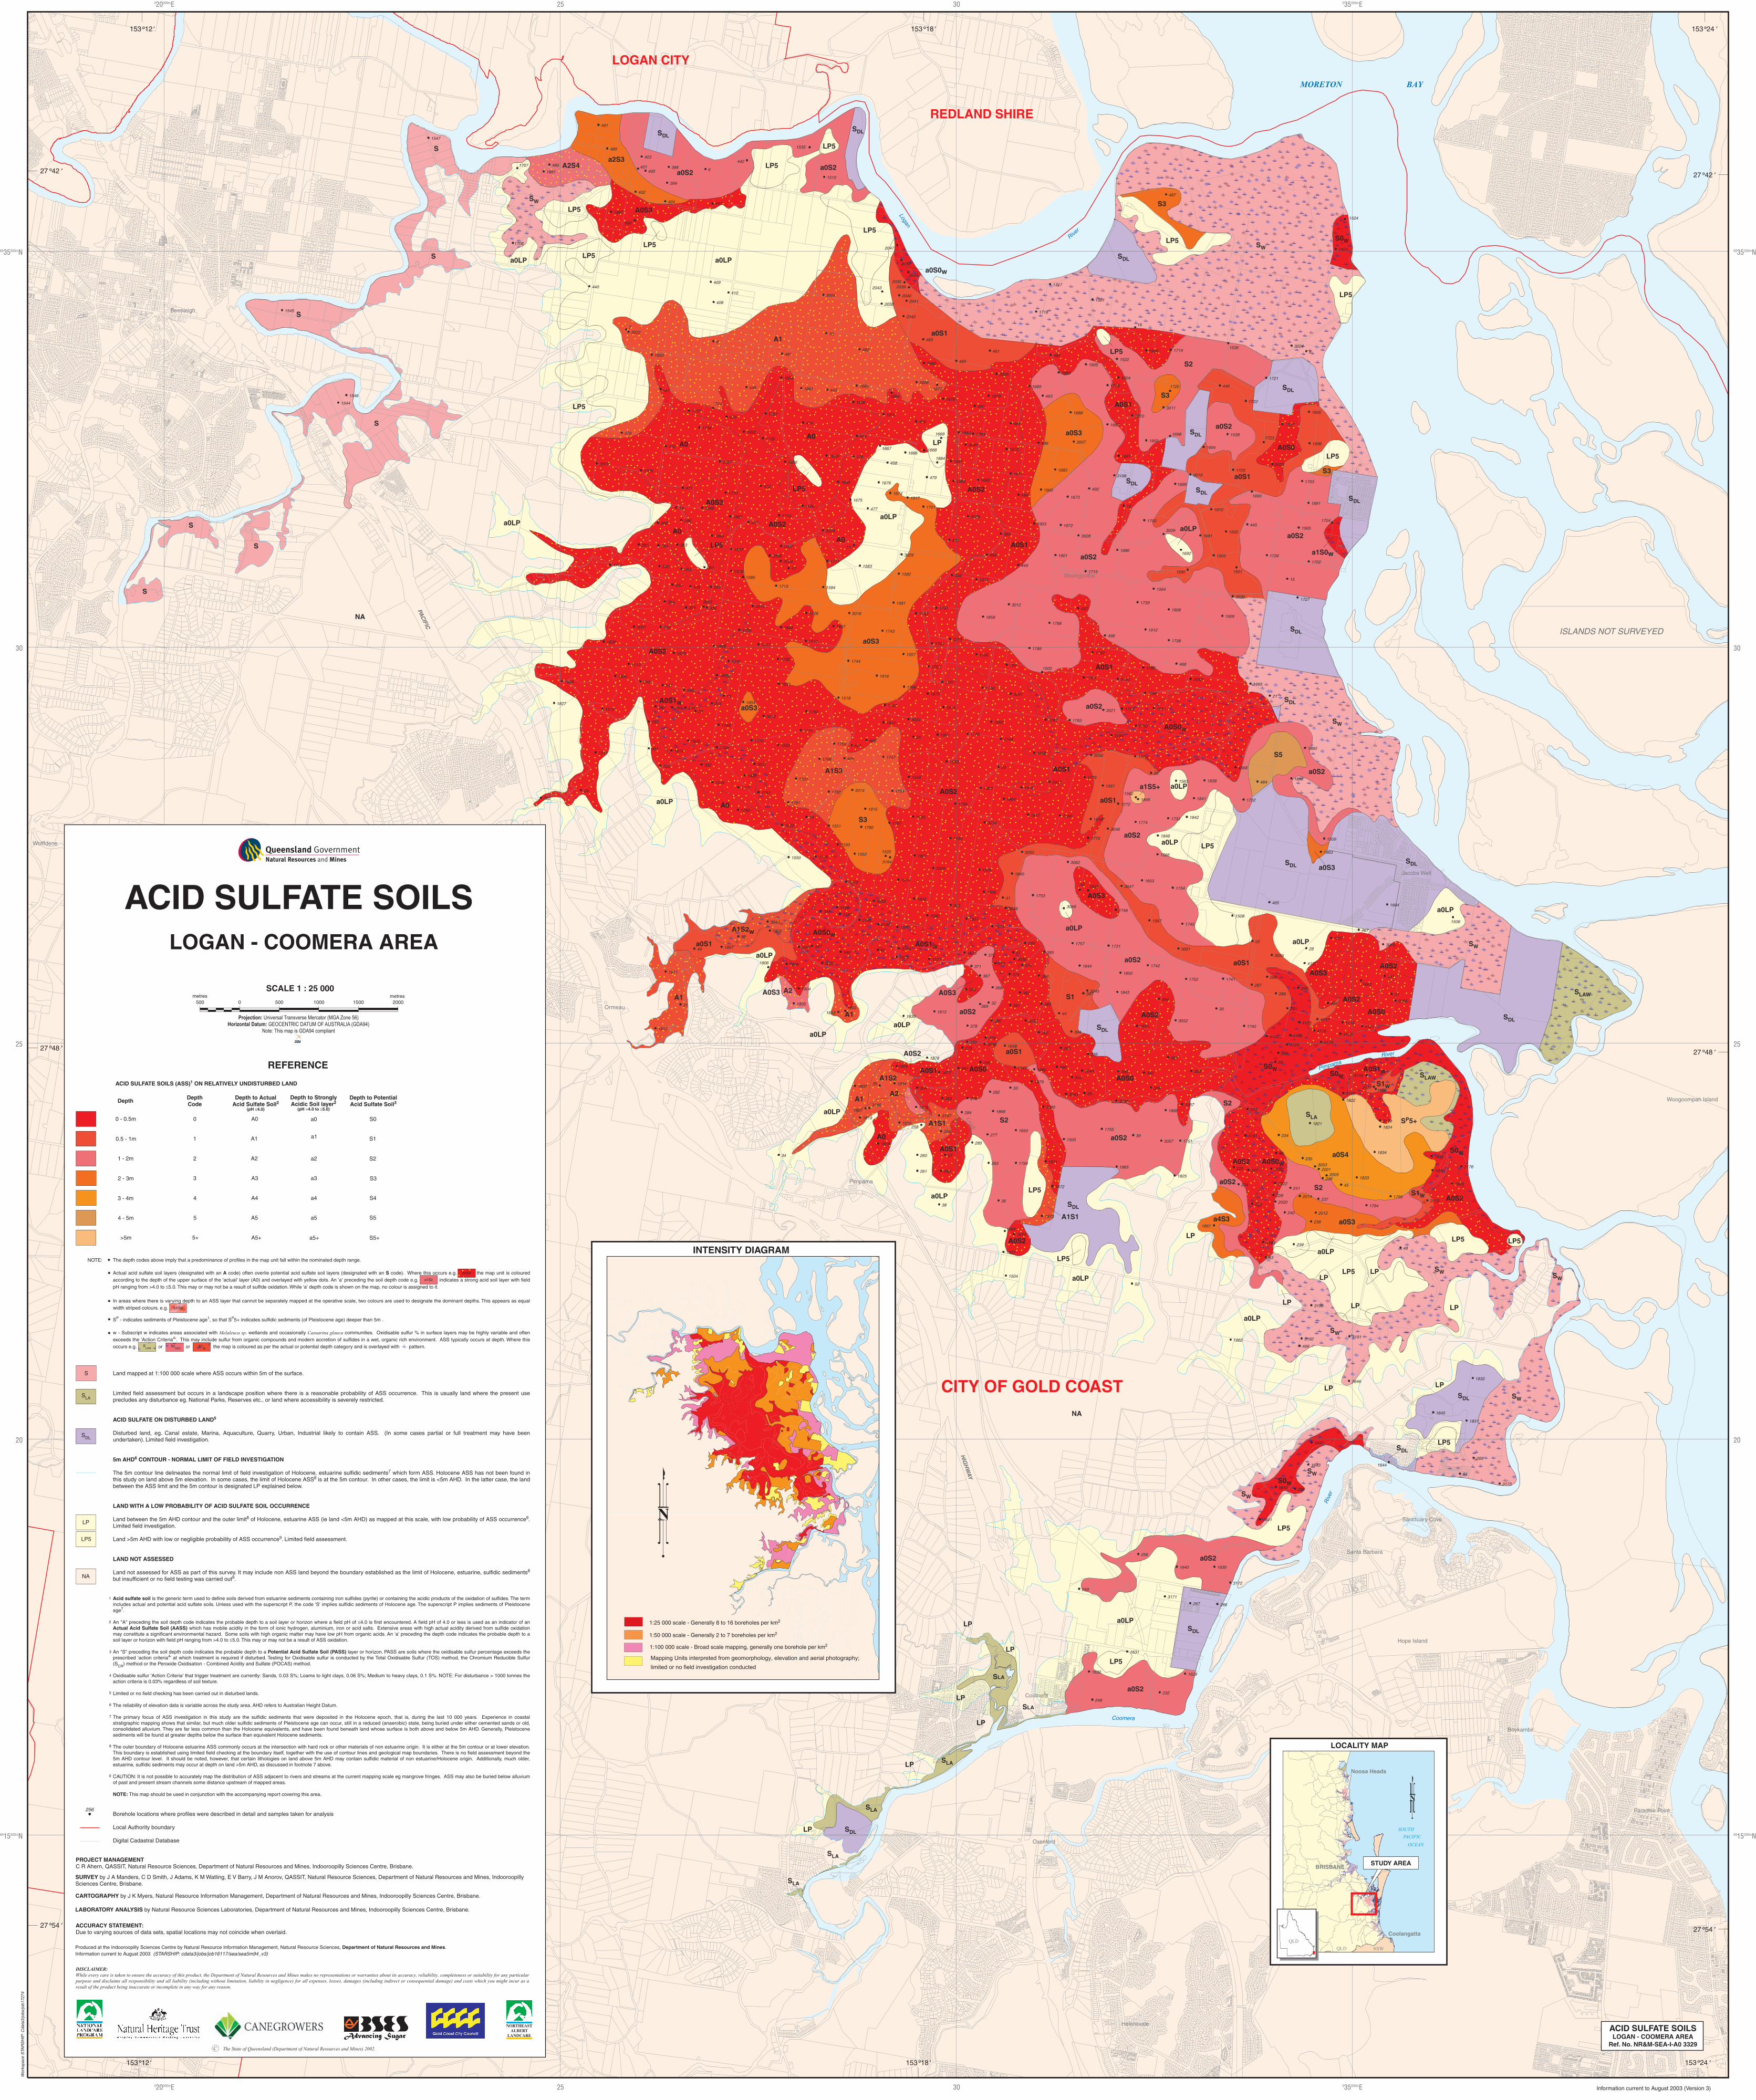
ACID SULFATE SOILSLOGAN - COOMERA AREA
Ref. No. NR&M-SEA-I-A0 3329
PAC
IFIC
HIG
HW
AY
MORETON BAY
Hotham
Creek
ACID SULFATE SOILSLOGAN - COOMERA AREA
0 - 0.5m
0.5 - 1m
1 - 2m
2 - 3m
3 - 4m
4 - 5m
>5m
0
1
2
3
4
5
5+
A0
A1
A2
A3
A4
A5
A5+
S0
S1
S2
S3
S4
S5
S5+
REFERENCE
Depth DepthCode
Depth to ActualAcid Sulfate Soil2
(pH ≤4.0)
Depth to PotentialAcid Sulfate Soil3
ACID SULFATE SOILS (ASS)1 ON RELATIVELY UNDISTURBED LAND
Depth to StronglyAcidic Soil layer2
(pH >4.0 to ≤5.0)
a0
a1
a2
a3
a4
a5
a5+
0 500500 1000 1500 2000metres metres
SCALE 1 : 25 000
Projection: Universal Transverse Mercator (MGA Zone 56)
Horizontal Datum: GEOCENTRIC DATUM OF AUSTRALIA (GDA94)
Note: This map is GDA94 compliant
S
SLA
SDL
LP
NA
LP5
A0S2
a1S2
S1/S2
SLAW
S2W
A1W
The depth codes above imply that a predominance of profiles in the map unit fall within the nominated depth range.
Actual acid sulfate soil layers (designated with an A code) often overlie potential acid sulfate soil layers (designated with an S code). Where this occurs e.g. the map unit is coloured according to the depth of the upper surface of the 'actual' layer (A0) and overlayed with yellow dots. An 'a' preceding the soil depth code e.g. indicates a strong acid soil layer with field pH ranging from >4.0 to ≤5.0. This may or may not be a result of sulfide oxidation. While 'a' depth code is shown on the map, no colour is assigned to it.
In areas where there is varying depth to an ASS layer that cannot be separately mapped at the operative scale, two colours are used to designate the dominant depths. This appears as equal width striped colours. e.g.
SP - indicates sediments of Pleistocene age1, so that SP5+ indicates sulfidic sediments (of Pleistocene age) deeper than 5m .
w - Subscript w indicates areas associated with Melaleuca sp. wetlands and occasionally Casuarina glauca communities. Oxidisable sulfur % in surface layers may be highly variable and often exceeds the 'Action Criteria4'. This may include sulfur from organic compounds and modern accretion of sulfides in a wet, organic rich environment. ASS typically occurs at depth. Where this occurs e.g. or or the map is coloured as per the actual or potential depth category and is overlayed with pattern.
Land mapped at 1:100 000 scale where ASS occurs within 5m of the surface.
Limited field assessment but occurs in a landscape position where there is a reasonable probability of ASS occurrence. This is usually land where the present use precludes any disturbance eg. National Parks, Reserves etc., or land where accessibility is severely restricted.
ACID SULFATE ON DISTURBED LAND5
Disturbed land, eg. Canal estate, Marina, Aquaculture, Quarry, Urban, Industrial likely to contain ASS. (In some cases partial or full treatment may have been undertaken). Limited field investigation.
5m AHD6 CONTOUR - NORMAL LIMIT OF FIELD INVESTIGATION
The 5m contour line delineates the normal limit of field investigation of Holocene, estuarine sulfidic sediments7 which form ASS. Holocene ASS has not been found in this study on land above 5m elevation. In some cases, the limit of Holocene ASS8 is at the 5m contour. In other cases, the limit is <5m AHD. In the latter case, the land between the ASS limit and the 5m contour is designated LP explained below.
LAND WITH A LOW PROBABILITY OF ACID SULFATE SOIL OCCURRENCE
Land between the 5m AHD contour and the outer limit8 of Holocene, estuarine ASS (ie land <5m AHD) as mapped at this scale, with low probability of ASS occurrence9. Limited field investigation.
Land >5m AHD with low or negligible probability of ASS occurrence9. Limited field assessment.
LAND NOT ASSESSED
Land not assessed for ASS as part of this survey. It may include non ASS land beyond the boundary established as the limit of Holocene, estuarine, sulfidic sediments8 but insufficient or no field testing was carried out9.
Acid sulfate soil is the generic term used to define soils derived from estuarine sediments containing iron sulfides (pyrite) or containing the acidic products of the oxidation of sulfides. The term includes actual and potential acid sulfate soils. Unless used with the superscript P, the code 'S' implies sulfidic sediments of Holocene age. The superscript P implies sediments of Pleistocene age7.
An "A" preceding the soil depth code indicates the probable depth to a soil layer or horizon where a field pH of ≤4.0 is first encountered. A field pH of 4.0 or less is used as an indicator of an Actual Acid Sulfate Soil (AASS) which has mobile acidity in the form of ionic hydrogen, aluminium, iron or acid salts. Extensive areas with high actual acidity derived from sulfide oxidation may constitute a significant environmental hazard. Some soils with high organic matter may have low pH from organic acids. An 'a' preceding the depth code indicates the probable depth to a soil layer or horizon with field pH ranging from >4.0 to ≤5.0. This may or may not be a result of ASS oxidation.
An "S" preceding the soil depth code indicates the probable depth to a Potential Acid Sulfate Soil (PASS) layer or horizon. PASS are soils where the oxidisable sulfur percentage exceeds the prescribed 'action criteria4' at which treatment is required if disturbed. Testing for Oxidisable sulfur is conducted by the Total Oxidisable Sulfur (TOS) method, the Chromium Reducible Sulfur (SCR) method or the Peroxide Oxidisation - Combined Acidity and Sulfate (POCAS) method.
Oxidisable sulfur 'Action Criteria' that trigger treatment are currently: Sands, 0.03 S%; Loams to light clays, 0.06 S%; Medium to heavy clays, 0.1 S%. NOTE: For disturbance > 1000 tonnes the action criteria is 0.03% regardless of soil texture.
Limited or no field checking has been carried out in disturbed lands.
The reliability of elevation data is variable across the study area. AHD refers to Australian Height Datum.
The primary focus of ASS investigation in this study are the sulfidic sediments that were deposited in the Holocene epoch, that is, during the last 10 000 years. Experience in coastal stratigraphic mapping shows that similar, but much older sulfidic sediments of Pleistocene age can occur, still in a reduced (anaerobic) state, being buried under either cemented sands or old, consolidated alluvium. They are far less common than the Holocene equivalents, and have been found beneath land whose surface is both above and below 5m AHD. Generally, Pleistocene sediments will be found at greater depths below the surface than equivalent Holocene sediments.
The outer boundary of Holocene estuarine ASS commonly occurs at the intersection with hard rock or other materials of non estuarine origin. It is either at the 5m contour or at lower elevation. This boundary is established using limited field checking at the boundary itself, together with the use of contour lines and geological map boundaries. There is no field assessment beyond the 5m AHD contour level. It should be noted, however, that certain lithologies on land above 5m AHD may contain sulfidic material of non estuarine/Holocene origin. Additionally, much older, estuarine, sulfidic sediments may occur at depth on land >5m AHD, as discussed in footnote 7 above.
CAUTION: It is not possible to accurately map the distribution of ASS adjacent to rivers and streams at the current mapping scale eg mangrove fringes. ASS may also be buried below alluvium of past and present stream channels some distance upstream of mapped areas.
NOTE: This map should be used in conjunction with the accompanying report covering this area.
Borehole locations where profiles were described in detail and samples taken for analysis
Local Authority boundary
Digital Cadastral Database
NOTE:
1
2
3
4
5
6
7
8
ACCURACY STATEMENT:Due to varying sources of data sets, spatial locations may not coincide when overlaid.
Produced at the Indooroopilly Sciences Centre by Natural Resource Information Management, Natural Resource Sciences, Department of Natural Resources and Mines.
DISCLAIMER:While every care is taken to ensure the accuracy of this product, the Department of Natural Resources and Mines makes no representations or warranties about its accuracy, reliability, completeness or suitability for any particular purpose and disclaims all responsibility and all liability (including without limitation, liability in negligence) for all expenses, losses, damages (including indirect or consequential damage) and costs which you might incur as a result of the product being inaccurate or incomplete in any way for any reason.
CARTOGRAPHY by J K Myers, Natural Resource Information Management, Department of Natural Resources and Mines, Indooroopilly Sciences Centre, Brisbane.
PROJECT MANAGEMENTC R Ahern, QASSIT, Natural Resource Sciences, Department of Natural Resources and Mines, Indooroopilly Sciences Centre, Brisbane.
SURVEY by J A Manders, C D Smith, J Adams, K M Watling, E V Barry, J M Anorov, QASSIT, Natural Resource Sciences, Department of Natural Resources and Mines, Indooroopilly Sciences Centre, Brisbane.
LABORATORY ANALYSIS by Natural Resource Sciences Laboratories, Department of Natural Resources and Mines, Indooroopilly Sciences Centre, Brisbane.
NORTHEASTALBERT
LANDCARE
256
Wor
kspa
ce S
TAR
SH
IP: C
data
3/jo
bs/jo
b172
74
Information current to August 2003 (Version 3)
Information current to August 2003 (STARSHIP: cdata3/jobs/job16117/sea/sea5m94_v3)
9
6
7
8
9
10
11
1214
15
16
17
18
19
20
21
22
23
24
25
26
27
28
29
3031 32
33
34
35
36
37
38
39
40
41
42
44
45
46
48
49
50
51
52
53
54
220
224
225
226
227
228
232
233
234
235
236
237
238
239
240
241
242 243 244245
246247
248
249
256
257
258259
260
261 262
263
264
265
266267
268
269
277
278
279
280281
282
283
284
285
287
288
289290
291
296
341
342343
344
345
346
347
348
349
350
351
352
353
354355 356
357358359
360 361362
363364365
366
367
368
369
370
371
372
373
374
375
376
378
379
380
381
382
383
384
385
386
387
388
389
390
391
392
393
394
395
396
397
398
399
400401
402
403
404
405
406407
408
409
410
440
441
442
443
444
445
446447
448
449
458
459
460
461462
463
464
465
466
467
468
469
470
471 472
473
474475
476
477
478
479
480
481482
483
484
485
486
487
488
489
490
491
492
493
494
495
496
497
498
4991500
1501
1502
1503
1504
1505
1506
1507
1508
1509
1510
1511
1512
1513
1517
1518
1519
1520
1521
1522
1523
1524
1526
1527
1531
1532
1533
1534
1535
1536
1537
1538
1539
1540
1541
1544
1545
1546
1547
1550
1551
1552
1553
1557
1558
1559
1560
1561
1562
1563
1564
1565
1566
1567
1568
1574
1575
1576
15771578
1579
1580
1581
1582
1583
1584
15851586
1587
1588
16291630
1631
16391640
1641
1642
1643 1644
1645
1646
1647
1648
1649
1650
1653
1654
1655
1656
1657
1658
1659
1660
1661
1662
1663
1664
1665
16661667 1668
1669
1670
1671
1672
16731674
1675
1676
1677
16781679
1680
1681
1682
1683
1684
1685
1686
1687
1688
1689
1690
1691
1692
1693
1694
1695
1696
1697
1698
1699
1700
1701
1702
1703
1704
1707
1708
1709
1710
17111712
1713
1714
1715
1716
1717
1718
1719
1720
1721
1722
1723
1724
1725
1726
1727
1728
1729
1730
1731
1732
1733
1734
1735
1736
1737
1738
1739
1740
1741
1742
1743
1744
1745
1746
1747
17481749
1750
1751
1752
1753
1754
1755
1756
1757
1758
1759
1760
1761
1762
1763
1764
1765
1766
1767
1768
1769
1770
1771
1772
1773
1774
1775
1776
1777
1778
1779
1780
1781
1782
1783
1784
1785
1786
1787
1788
1789
1790
1791
1792
1793
1794
1795
1796
1797
1798
1799
1800
1801
1802
1803
1804
1805
1806
1807
1808
1809
1810
1811
1812
1813
1814
1815
1816
1817
1818
1819
1820
1821
1822
1823
1824
1825
1826
1827
1828
1829
1830
1831
1832
1833
18341835
1836
1837
1838
1839
1840
1841
1842
1843
1844
1845
1846
18471848
1849
1850
1851
18521853
1854
1855
1856
1857
1858
1859
1860
1861
1862
1863
1864
1865
18661867
1868
18691870
1871
1872
1873
1874
1875
1876
1877
1878
1879
1880
1881
1882 1883
1884
1885
1886
1887
1888
1889
1890
1891
1892
1894
1895
1896
1897
1898
1899
1900
1901
1902
1903
1904
1905
1906
1907
1908
1909
1910
1911
1912
1913
1914
1915
1916
1917
1918
20012005
2012
20142020
2022
2033
2035
2038
2039
20402041
2042
2043
2045
2047
2054
2057
2058
3001
3002
3003
3004
3005
3006
30073008
3009
3010
3011
3012
3013
3014
3015
3016
3017
3018
3019
3020
3021
3022
3023
3024
3025
3026
3027
3028
3029
3030
3031
3032
3033
3034
3035
3036
3037
3038
3039
3040
3041
3042
3043
3044
3045
3046
3047
3048 3049
3050
3051
3052
3053
3055
3056
3057
3058
3059
3060
3061
3062
3171
3172
3173
3175
3176
3177
3178
3179
3180
3181
3182
3183
3184
31853186
3187
3188
3189
3190
31913192
3193
3194
3195
3196
3197
3198
4116
41174118
4119
4120
4121
4122
4123
4124
4125
4126
SDL
a0S2
a2S3
SDL
S
LP5
SW
LP5A2S4
a0LP
SW
A0S3
LP5
LP5S3
LP5
a0S1
SDL
LP5
A1
LP5
LP5
S
A0S1
LP5
S2
A0S2
A0S1
SDL
a0S2
A0
a0S1
S3
Sa0S3
A0 A0S0
a0S2
LP
LP5
a0LP
A0S3
LP5
S3
a0S2S
a0S3
A0
S a0LP
LP5
S
SDL
SWA0S0W
a0S2a0S3SDL
a0S2
A1S3
S5
a0S1
A0S1
a0LP
A0
SDL
S3
a0LP LP5
a1S5+
SDLa0S3
a0S2
A0S3
a0LP
A1S2W A0S0Wa0LP
a0LP
SWa0S1
SDL
A0S3
A0S0
A0S0
A1
A0S2
SLAW
a0S2
a0LP
S1A0S3 A0S3
S0W
a0LP
A2
A1 A0S2
A0S2
a0LP SDL
a0S1
S0W
a0LP
A0S1 A0S1WA1S2
A1
SLAW
A0S2
a0S2
S1W
SP5+S2
a0S4
A2
SLA
S2
A1S1
A0S0W
A0
A0S1
a0LP
a0S2LP5
A1S1
A0S2
S2
a0S3
SDL
S1W
a4S3
LPA0S2 LP5
LP5
LP5
SW
LP5
LPLP
LP
LP
a0LP
LP
LP
SDL
SW
LP5
S0W
SDL
a0LP
LP5
a0S2
SDL
LP
LP
SLA
LP
LP5
a0S2
SLA
LP
LP
LP SDL
SLA
SLA
SDL
SDLSDL
SDL
NA
NA
SLA
a0S0w
a1S0w
A0S1W
A0S2
S
a0S2
A0S1
A0S2
A0S2
A0S2A0
a0LP
a0LP
a0LP
a0S2
a0S1
A0S1W
A0S0
a0LP
a0LP
S0W
SW
SW
LP
SW
SW
SLA
LP5
S0W
Beenleigh
Woongoolba
Wolffdene
Jacobs Well
Ormeau
Woogoompah Island
Pimpama
Sanctuary Cove
Santa Barbara
Hope Island
Coomera
Boykambil
Paradise Point
Oxenford
Helensvale
INTENSITY DIAGRAM
1:50 000 scale - Generally 2 to 7 boreholes per km2
1:100 000 scale - Broad scale mapping, generally one borehole per km2
1:25 000 scale - Generally 8 to 16 boreholes per km2
Mapping Units interpreted from geomorphology, elevation and aerial photography;
limited or no field investigation conducted
LOCALITY MAP
BRISBANE
Noosa Heads
Coolangatta
SOUTH
PACIFIC
OCEAN
NSWQLD
QLD
STUDY AREA